financial crisis and brazil’s economic...
TRANSCRIPT

Otaviano CanutoVice President & Head of Network
Poverty Reduction and Economic ManagementThe World Bank
The 11th International Academic Conference on Economic and Social Development
April 6-8, 2010
Moscow

Main Messages Aggressive counter-cyclical policies minimized the
impact of the crisis on the Brazilian economy
The use of foreign reserves, monetary, fiscal and quasi-fiscal policies was made possible because of policy space previously acquired
Looking forward, a main challenge will be to increase the role of knowledge in competitiveness
Poverty reduction may help growth by strenghteningdomestic demand as a growth driver
2

Brazil: From Decoupling to Derailing… to Decoupling again?
Mechanisms of Transmission of the Crisis
Weak global demand and lower prices of exports
The Systemic Sudden Stop and foreign capital flows
Effects on exchange rates
Lines of Defense
Uses of international reserves
Easing of monetary policy
Uses of fiscal and para-fiscal policies
3

The Brazilian Economy seemed to be decoupling at high speed… until it came to a sudden stop
Source: IBGE
Domestic Demand and Supply GDP growth – IIIQ08
Source: Itau (presentation by Tomas Malaga)
4

5Source: IBGE, Secex e Funcex.
Trade, Credit Sudden Stop and Inventory Adjustments were the main channels of transmission
104.4
96.8 92.4
80.682.5
69.6
100
65
70
75
80
85
90
95
100
105
110
Jan-0
8
Feb-08
Mar-0
8
Apr-08
May-
08
Jun-0
8
Jul-0
8
Aug-08
Sep-08
Oct-0
8
Nov-08
Dec-08
Jan-0
9
Feb-09
Mar-0
9
Apr-09
May-
09
Jun-0
9
Jul-0
9
Aug-09
Sep-09
Exports of Manufactured goods
Industrial Production
Retail Sales
Industrial Production, Retail Sales and Exports(index: September 2008=100)

Back to the long-term growth path
6
Real GDP
Source: JPMorgan,GDW 03/12/10

7
9.32007
8.0 20082009
6.8
2010
Jan Feb Mar Apr May Jun Jul Aug Sep Oct Nov Dec
Average unemployment rate (%) - IBGE
8.2
7.2
Unemployment Rate Dropped—despite the initial shock— from 9.3% in Jan ’07 to 7.2% in Jan ’10… and Wages Increased
Source: IBGE
REAL WAGES - Average for the last 12 months
R$ Billion
29.56
29.36
28.66
26.68
25.13
23.61
21.93
21
22
23
24
25
26
27
28
29
30
Aug
-04
Dec
-04
Apr
-05
Aug
-05
Dec
-05
Apr
-06
Aug
-06
Dec
-06
Apr
-07
Aug
-07
Dec
-07
Apr
-08
Aug
-08
Dec
-08
Apr
-09
Aug
-09
Dec
-09
Source: IBGE

8
Sectors
US$ billion
Growth
2005-2008 2010-2013
Oil and Gas 112 171 8.8
Mining 29 25 (3.1)
Steel 15 20 5.7
Petrochemical 5 17 28.9
Vehicles 12 17 7.3
Electronics 8 12 6.7
Pulp & Paper 10 10 0.5
Industry 191 271 7.3
Source: BNDES
Investments strongly rebounding
16.4
17.6
19.0
21.2
20.2
18.6
16.9
15.0
16.0
17.0
18.0
19.0
20.0
21.0
22.0
2006 2007 2008 2009 2010 2011 2012
Forecast
Domestic-led Sectors Have Already Recovered Investment in Industry
Forecast of Investment Ratio 2009-2012 (% of GDP)

Crisis Response (1):Injection of Liquidity in Foreign Currency Market
9
o Sales of USD in spot market;
o Sales of USD in repurchase agreement auctions;
o Reduction of reserve requirements for banks acquiring USD with repurchase agreement;
o Sales of USD swap contracts;
o Export financing;
o Authorization for BCB to engage in currency swap transactions with other central banks (US$ 30 billion swap line with Federal Reserve);
o Loans to rollover external debt of Brazilian companies.
Crisis Response (2) Injection of Liquidity in Domestic Credit Market
o Reduction in reserve requirements
o Incentives for banks (including public banks) and the deposit insurance fund (FGC) to acquire portfolios of small and medium size banks
o Increase of funding to BNDES (Development Bank) and rural credit;
o Guarantees for Certificates of Bank Deposits issues by small and medium size banks
10

Interventions by the Central Bank in the FX Market and International Reserves
11

12
Credit/GDP Ratio Grew Even After the Shock
Evolution of Credit/GPD ratio (%)
22.0
24.0 24.5
28.1
30.2
34.2
41.3
45.0 44.6
20
25
30
35
40
45
50
2002 2003 2004 2005 2006 2007 2008 2009 2010*
Source: Brazilian Central Bank
*Up to January

13
State-owned Banks Sustained Credit after the Crisis
BNDES alone was responsible for 37% of the increase in credit from Sept ’08 to Jan ’10
Source: Bacen
Contribution to Credit Growth (Sept. ’08-Jan ’10)
Credit Growth(Index: Sept. 2008 = 100)
Private
Banks
27%
BNDES
37%
Other State-
owned Banks 36%
100
109.0113.9
118.3121.2
100
106.9
132.9
150.1
144.6
141.2
138.8
109.5
105.6
103.2
103.3
102.4
102.9102.6
90
100
110
120
130
140
150
Sep
-08
Nov
-08
Jan-
09
Mar
-09
May
-09
Jul-0
9
Sep
-09
Nov
-09
Jan-
10
Public Banks
Private Banks

Crisis Response (3): Fiscal Policy (with low impact on public debt)
14
54.1
72.9 France
56.9
76.2 Germany
101.3
117.0 Italy
80.4
115.0 Japan
38.3
75.1 UK
42.3
66.8 US
43.4
38.8
43.9
42.0 Brazil
30.0
40.0
50.0
60.0
70.0
80.0
90.0
100.0
110.0
120.0
2003 2004 2005 2006 2007 2008 2009 2010
Forecast
Public Sector Net Debt (%GDP)
Source: IMF and Brazilian Central Bank.

Brazil’s Growth Drivers
15
Brazil as a natural resource-rich economy
Role of knowledge in economic competitiveness and the structure of global trade
Business environment, renewable energy, and modern agriculture as Brazil’s economic strengths
Domestic demand as an important growth driver
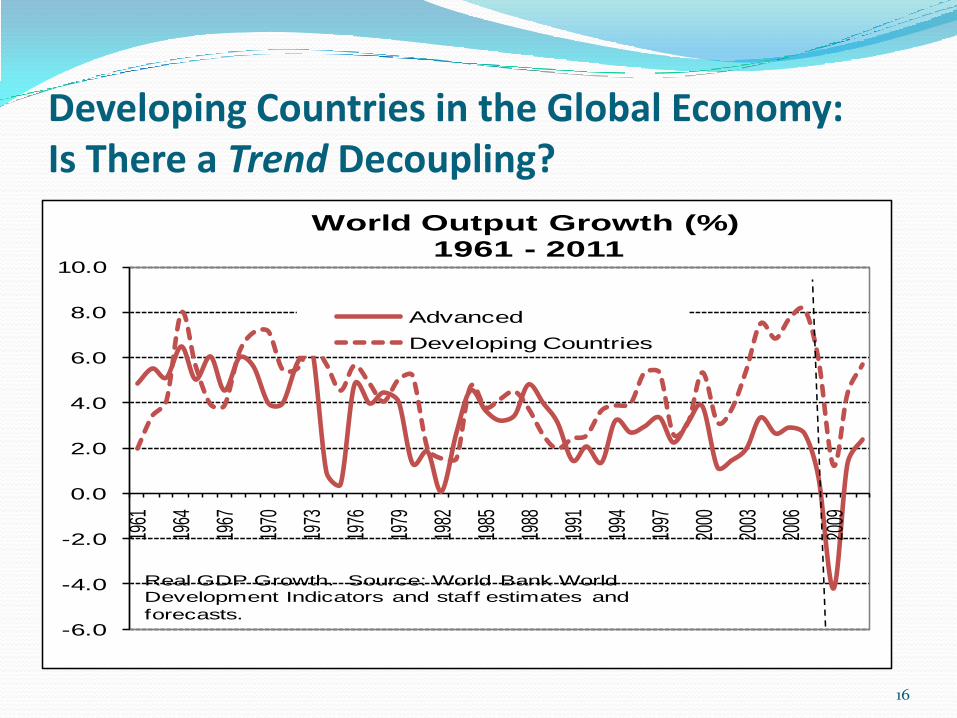
Developing Countries in the Global Economy: Is There a Trend Decoupling?
-6.0
-4.0
-2.0
0.0
2.0
4.0
6.0
8.0
10.0
1961
1964
1967
1970
1973
1976
1979
1982
1985
1988
1991
1994
1997
2000
2003
2006
2009
World Output Growth (%)
1961 - 2011
Advanced
Developing Countries
Real GDP Growth. Source: World Bank World Development Indicators and staff estimates and
forecasts.
16

Unexpected Growth Resilience in Developing Countries … not just China and India
-5.0%
0.0%
5.0%
10.0%
15.0%
20.0%
25.0%
30.0%
35.0%
40.0%
< -6% -6 to -4 -4 to -2 -2 to 0 0 to 2 2 to 4 4 to 6 > 6%
Freq
uenc
y
Frequency Distribution of GDP Growth
in 2009 - Developed and Developing
GDP Growth in 2009 (%)
Developing
countries (113). Median growth: 1.3%.
High Income
countries (38). Median growth: -3%.
Source: World Bank DEC Prospects Group 17

Brazil and Russia’s Export Structure, 2008
18
Primary products
37%
Manufactured products
47%
Semimanufactured
products14%
Special operations
2%
Iron ore and
concentrates 8%
Petroleum oils, crude
7%
Soybeans6%
Airplanes 3%
Meat 3%
Brazil’s exports -main products(26% of total exports)
Brazil’s Exports by aggregated factor
Source: MDIC/Secex
Source: Federal State Statistics Service, Russia
Russia’s principal exports (share of total)
Mineral products
70%
Chemicals 6%
Metals, precious stones
13%
Machinery, equipment and
transport means
5%
Other6%

Global Trends in Commodity Prices
19
0
20
40
60
80
100
120
1900 1910 1920 1930 1940 1950 1960 1970 1980 1990 2000 2010
Crude Oil Price: 1900-2011
(constant 2008 $/bbl)Forecasts
Source: Through 1900-2009: BP Statistical Review of World Energy and through 2010-2011: World Bank estimates

20
Knowledge-based economies grow faster
Differences between Brazil and the Republic of Korea, 1956–90
Product diversification, adding value to commodities, and improving competitiveness in manufacturing and service exports are pivotal for Brazil’s global competitiveness and long-term growth
Increasing Role of Knowledge in Competitiveness and the Structure of Global Trade

Brazil: Current-account Balance
21

Competitiveness in Business Environment
22
Global Competitiveness Index of 134 countries: Innovation and sophistication factors 2008–2009: Brazil and selected comparators
Brazil’s competitive advantage in business environment, incl. sophistication of firms’ production processes, capacity for innovation, and marketing and consumer orientation

23
Brazil’s potential to create opportunities for energy- and water-intensive industries
Competitiveness in Renewable Energy

Successful application of innovation by investing in agricultural R&D (increase in wheat and soy productivity that helped boost exports) and personnel education
Genetic improvement and more efficient production systems contributed to a revolution in the production of meat in Brazil
Strong performance in agro-energy
24
Competitiveness in Modern Agriculture
Annual growth rate of productivity
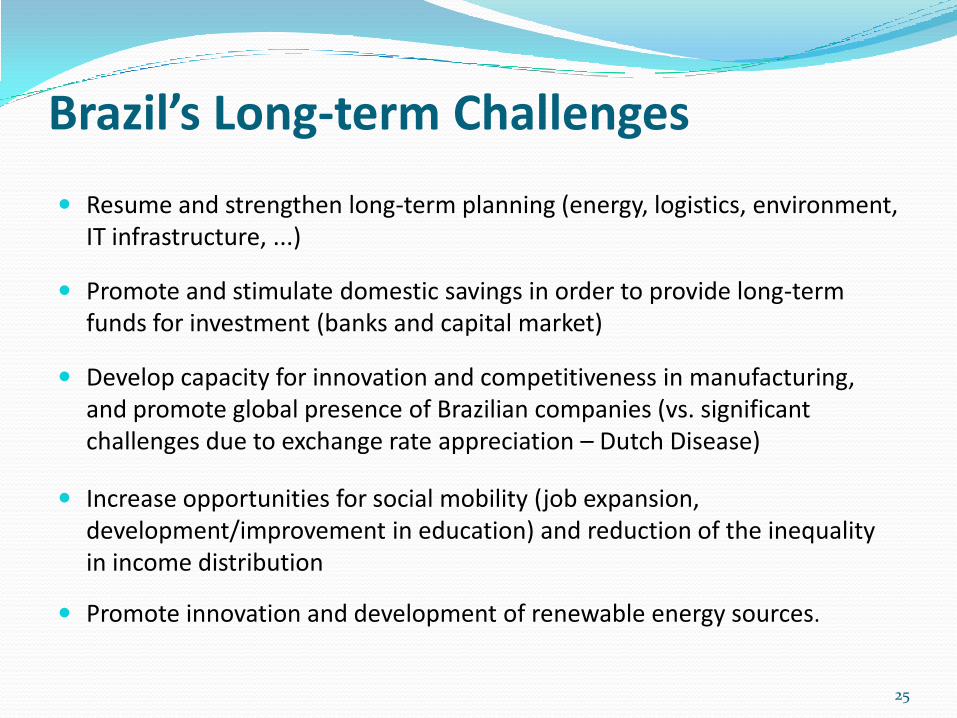
Brazil’s Long-term Challenges
Resume and strengthen long-term planning (energy, logistics, environment, IT infrastructure, ...)
Promote and stimulate domestic savings in order to provide long-term funds for investment (banks and capital market)
Develop capacity for innovation and competitiveness in manufacturing, and promote global presence of Brazilian companies (vs. significant challenges due to exchange rate appreciation – Dutch Disease)
Increase opportunities for social mobility (job expansion, development/improvement in education) and reduction of the inequality in income distribution
Promote innovation and development of renewable energy sources.
25

Concluding Remarks this crisis has returned fiscal policy to center stage as a macroeconomic
stabilization tool.
most of the pre-crisis consensus on macroeconomic policy still holds, but the crisis has shown that policy makers should adopt a broader macro-prudential view of the financial sector.
the social impact of a sharp slowdown in GDP during the crisis in emerging countries was transmitted mainly through lower employment and wages, hence the importance of targeted social safety nets and automatic stabilizers.
the post-crisis world will likely require countries to do more to improve their investment climates.
in Russia, as elsewhere the crisis has provided an opportunity for reform and impetus to rethink and accelerate public sector, financial sector, and diversification reforms; it is important to see to it that the opportunity is not wasted in the complacency and return to business-as-usual after the crisis
26