financial conference conference … · continue profitability improvement activities ... reduce...
TRANSCRIPT

Cautionary Statements with Respect to Forward-Looking StatementsStatements made in this report with respect to plans, strategies and future performance that are not historical fact are forward-looking statements. NSK cautions that a number of factors could cause actual results to differ materially from those discussed in the forward-looking statements.Note : This document is an English translation of material written initially in Japanese. The Japanese original should be considered the primary version.
November 5, 2009NSK Ltd.
FINANCFINANCIAL IAL CONFERENCECONFERENCE Consolidated Business Results and ForecastConsolidated Business Results and Forecast
and and MidMid--termterm PlanPlan(FY(FY’’09~FY09~FY’’12)12)
1
1
Consolidated BusinessConsolidated Business ResultsResults for the Six Months Ended September 30, 2009for the Six Months Ended September 30, 2009
Consolidated BusinessConsolidated Business ForecastForecast for the Year Ending March 31, 2010for the Year Ending March 31, 2010
MidMid--term Plan(FYterm Plan(FY’’09~FY09~FY’’12)12)
ContentsContents
3
2
((SupplementarySupplementary MaterialMaterial))

2
111 Consolidated BusinessConsolidated Business ResultsResults for the Six Months Ended September 30, 2009for the Six Months Ended September 30, 2009
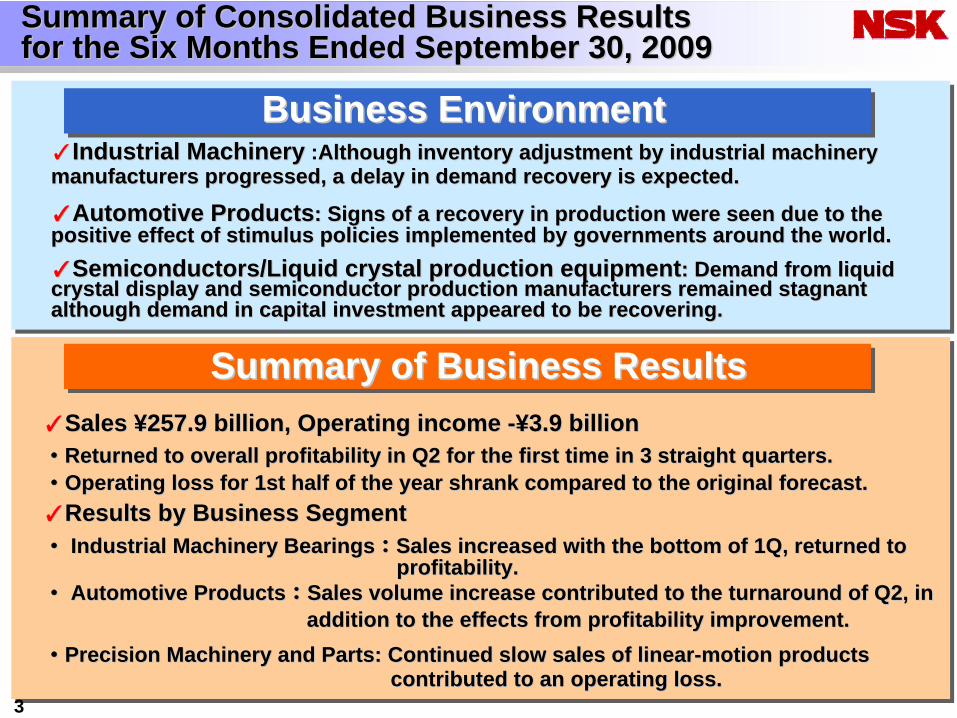
✓✓Industrial MachineryIndustrial Machinery :Although inventory adjustment by industrial machinery Although inventory adjustment by industrial machinery manufacturers progressed, a delay in demand recovery is expectedmanufacturers progressed, a delay in demand recovery is expected..
✓✓Automotive Automotive PProductsroducts: : Signs of a recovery in production were seen due to the Signs of a recovery in production were seen due to the positive effect of stimulus policies implemented by governmentpositive effect of stimulus policies implemented by governmentss around the world.around the world.✓✓Semiconductors/Liquid crystal production equipmentSemiconductors/Liquid crystal production equipment:: Demand from liquid Demand from liquid crystal display and semiconductor production manufacturers remaicrystal display and semiconductor production manufacturers remained stagnant ned stagnant although demand in capital investment appeared to be recovering.although demand in capital investment appeared to be recovering.
3
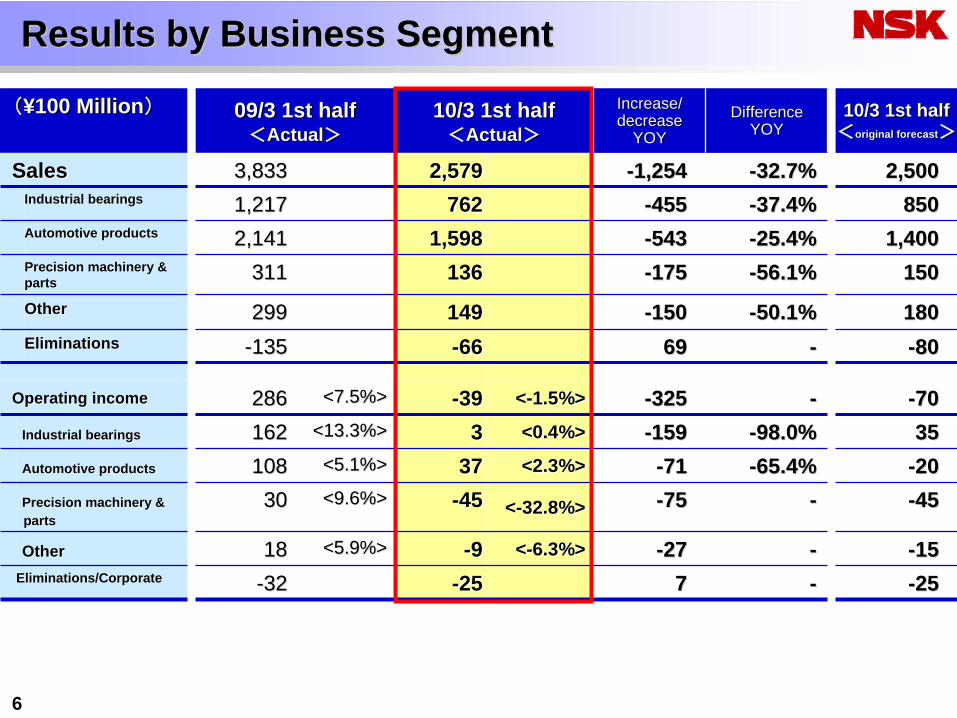
✓✓Sales Sales ¥¥257.9 billion, Operating income 257.9 billion, Operating income --¥¥3.9 billion3.9 billion・・Returned to overall profitability in Q2 for the first time in 3 Returned to overall profitability in Q2 for the first time in 3 straight quarters. straight quarters. ・・Operating loss for 1st half of the year shrank compared to the oOperating loss for 1st half of the year shrank compared to the original forecast. riginal forecast. ✓✓Results by Business SegmentResults by Business Segment・・
Industrial MachineryIndustrial Machinery BearingsBearings::Sales increased with the bottom of 1Q, returned toSales increased with the bottom of 1Q, returned toprofiprofitability.tability.
・・
Automotive Automotive PProductsroducts::Sales volume increase contributed to the turnaround of Q2, in Sales volume increase contributed to the turnaround of Q2, in addition to the effeaddition to the effects from profitability improvement.cts from profitability improvement.
・・Precision Machinery and Parts: Continued slow sales of linearPrecision Machinery and Parts: Continued slow sales of linear--motion productsmotion productscontricontributed to an operating loss. buted to an operating loss.
Summary of Consolidated Business Results Summary of Consolidated Business Results for the Six Months Ended September 30, 2009for the Six Months Ended September 30, 2009
Business EnvironmentBusiness Environment
Summary of Business ResultsSummary of Business Results
4
((100 Million100 Million)) 09/3 1st half 09/3 1st half <<ActualActual>>
10/3 1st half10/3 1st half<<ActualActual>>
Increase/Increase/decreasedecrease
YOYYOYDifferenceDifference
YOYYOY10/3 1st half10/3 1st half
<<Original forecastOriginal forecast>>
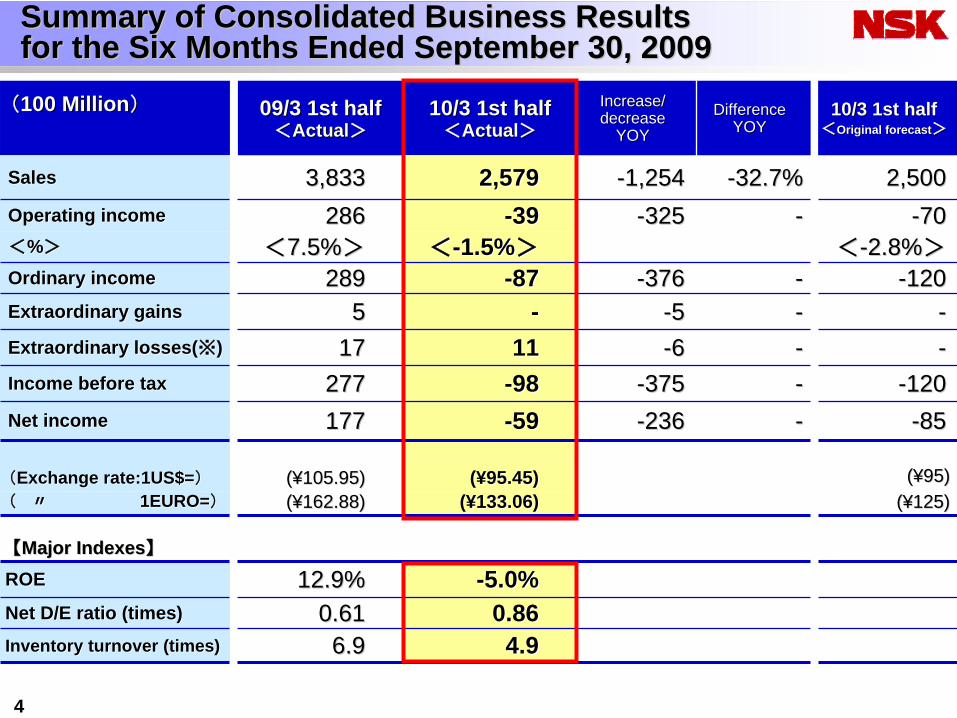
SalesSales 33,,833833 2,5792,579 --1,2541,254 --32.7%32.7% 2,5002,500Operating incomeOperating income 286286 --3939 --325325 -- --7070<<%%>> <<7.5%7.5%>> <<--1.5%1.5%>> <<--2.8%2.8%>>Ordinary incomeOrdinary income 289289 --8787 --376376 -- --120120Extraordinary gains Extraordinary gains 55 -- --55 -- --Extraordinary losses(Extraordinary losses(※※)) 1717 1111 --66 -- --Income before taxIncome before tax 277277 --9898 --375375 -- --120120Net incomeNet income 177177 --5959 --236236 -- --8585
((Exchange rate:1US$=Exchange rate:1US$=)) ((¥¥105.95)105.95) ((¥¥95.45)95.45) ((¥¥95)95)((
〃〃
1EURO=1EURO=)) ((¥¥162.88)162.88) ((¥¥133.06)133.06) ((¥¥125)125)
【【Major IndexesMajor Indexes】】
ROEROE 12.9%12.9% --5.0%5.0%NetNet D/E ratio (times)D/E ratio (times) 0.610.61 0.860.86Inventory turnover (times)Inventory turnover (times) 6.96.9 4.94.9
Summary of Consolidated Business Results Summary of Consolidated Business Results for the Six Months Ended September 30, 2009 for the Six Months Ended September 30, 2009
5
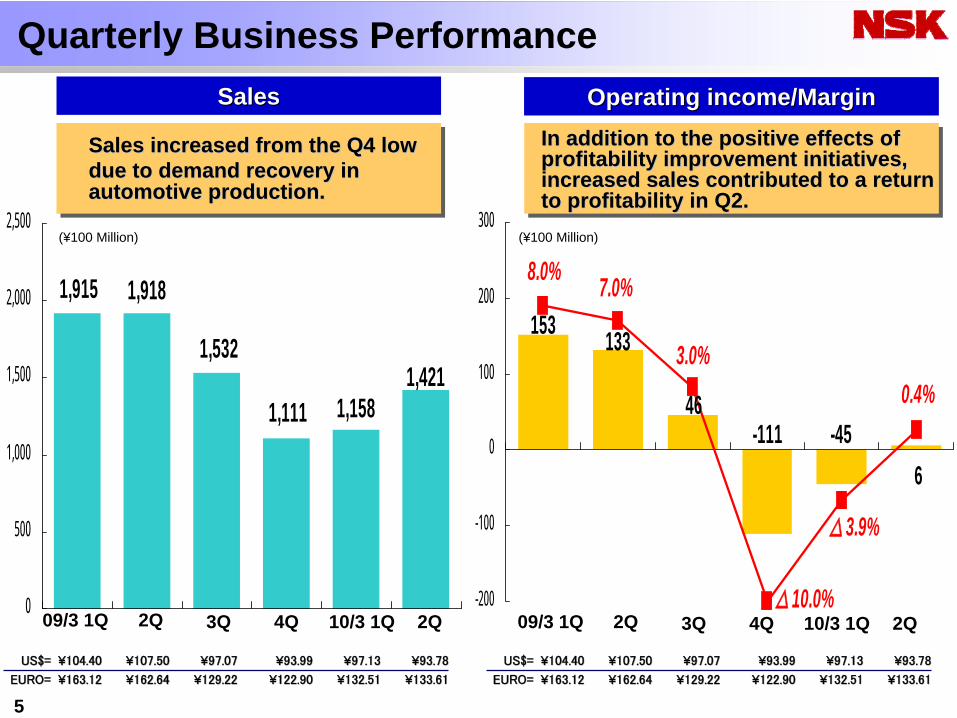
1,4211,111
1,915 1,918
1,532
1,158
0
500
1,000
1,500
2,000
2,500(¥100 Million) (¥100 Million)
09/3 1Q
Operating income/MarginOperating income/MarginSalesSales
2Q 3Q 4Q 10/3 1Q 2Q 09/3 1Q 2Q 3Q 4Q 10/3 1Q 2Q
US$=US$= ¥¥104.40104.40 ¥¥107.50107.50 ¥¥97.0797.07 ¥¥93.9993.99 ¥¥97.1397.13 ¥¥93.7893.78
EURO=EURO= ¥¥163.12163.12 ¥¥162.64162.64 ¥¥129.22129.22 ¥¥122.90122.90 ¥¥132.51132.51 ¥¥133.61133.61
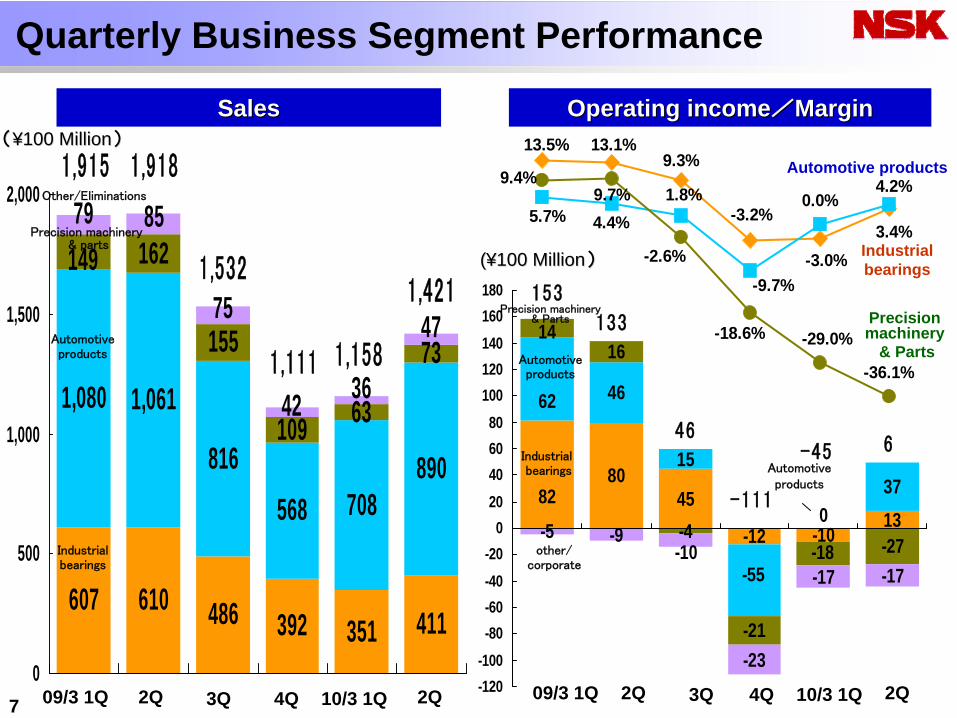
Sales increased from the Q4 low Sales increased from the Q4 low due to demand recovery indue to demand recovery inautomotive production.automotive production.
US$=US$= ¥¥104.40104.40 ¥¥107.50107.50 ¥¥97.0797.07 ¥¥93.9993.99 ¥¥97.1397.13 ¥¥93.7893.78
EURO=EURO= ¥¥163.12163.12 ¥¥162.64162.64 ¥¥129.22129.22 ¥¥122.90122.90 ¥¥132.51132.51 ¥¥133.61133.61
Quarterly Business Performance
-4546
133153
6-111
0.4%
△ 3.9%
△ 10.0%
3.0%
7.0%8.0%
-200
-100
0
100
200
300
In addition to the positive effects of In addition to the positive effects of profitability improvement initiatives, profitability improvement initiatives, increased sales contributed to a return increased sales contributed to a return to profitability in Q2. to profitability in Q2.
6
((¥¥100 Million100 Million)) 09/3 1st half09/3 1st half<<ActualActual>>
10/3 1st half10/3 1st half<<ActualActual>>
Increase/Increase/decreasedecrease
YOYYOYDifferenceDifference
YOYYOY10/3 1st half10/3 1st half
<<original forecastoriginal forecast>>
SalesSales 3,8333,833 2,5792,579 --1,2541,254 --32.7%32.7% 2,5002,500Industrial bearingsIndustrial bearings 1,2171,217 762762 --455455 --37.4%37.4% 850850Automotive productsAutomotive products 2,1412,141 1,5981,598 --543543 --25.4%25.4% 1,4001,400Precision machinery & Precision machinery & partsparts 311311 136136 --175175 --56.1%56.1% 150150OtherOther 299299 149149 --150150 --50.1%50.1% 180180EliminationsEliminations --135135 --6666 6969 -- --8080
Operating incomeOperating income 286286 <7.5%><7.5%> --3939 <<--1.5%>1.5%> --325325 -- --7070Industrial bearingsIndustrial bearings 162162 <13.3%><13.3%> 33 <0.4%><0.4%> --159159 --98.0%98.0% 3535Automotive productsAutomotive products 108108 <5.1%><5.1%> 3737 <2.3%><2.3%> --7171 --65.4%65.4% --2020Precision machinery & Precision machinery & partsparts
3030 <9.6%><9.6%> --4545 <<--32.8%>32.8%> --7575 -- --4545
OtherOther 1818 <5.9%><5.9%> --99 <<--6.3%>6.3%> --2727 -- --1515Eliminations/CorporateEliminations/Corporate --3232 --2525 77 -- --2525
Results by Business SegmentResults by Business Segment
4513
1537
-4-27
-5 -9
-17 -17
8280
-10-12
62 46
0
-55
16
-18
-21
14
-23
-10
-120-100-80-60-40-20
020406080
100120140160180 153
133
46
-111
-45 6
7
607 486 411
1,080 1,061
816568 708
890
162
155
63
73
610351392
149
109
79 85
75 47
42 36
0
500
1,000
1,500
2,0001,915 1,918
1,532
1,111 1,158
1,421
3.4%-3.0%
-3.2%
9.3%13.1%13.5%
0.0%
-9.7%
1.8%4.4%5.7%
4.2%
-29.0%-18.6%
-2.6%
9.7%9.4%
-36.1%
((¥¥100 Million100 Million))
Industrialbearings
Automotive products
Precision machinery& parts
Other/Eliminations
SalesSales Operating incomeOperating income//MarginMargin
Quarterly Business Segment Performance
((¥¥100 Million100 Million)) Industrial bearings
Automotive products
Precision machinery
& Parts
Industrialbearings
Automotive products
Precision machinery & Parts
other/corporate
Automotive products
09/3 1Q 2Q 3Q 4Q 10/3 1Q 2Q 09/3 1Q 2Q 3Q 4Q 10/3 1Q 2Q
8
(¥100 Million )
10/3 1st half10/3 1st half
09/3 1st half
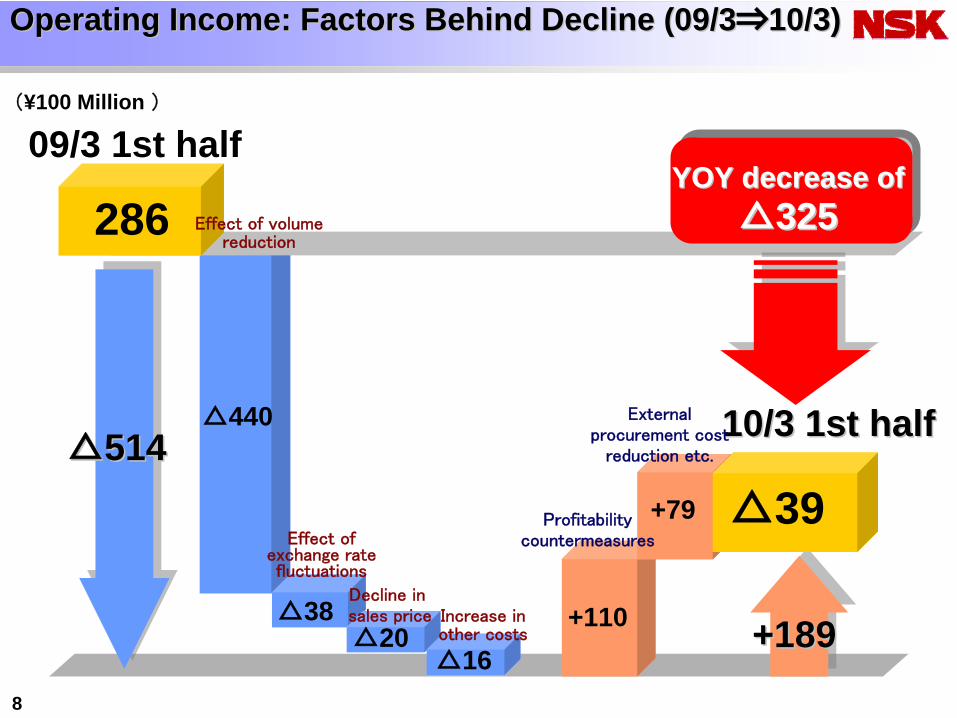
△△514514
YOY decrease ofYOY decrease of△△323255286
OpeOperarating Income: ting Income: Factors Behind Decline (09/3Factors Behind Decline (09/3⇒⇒10/3)10/3)
△440
Effect of volume reduction
+110△38
Effect of exchange rate fluctuations
△16△20
+79 △39
++189189Decline insales price Increase in
other costs
Profitability countermeasures
External procurement cost
reduction etc.

9
222Consolidated BusinessConsolidated Business ForecastForecast for the Year Ending March 31, 2010for the Year Ending March 31, 2010

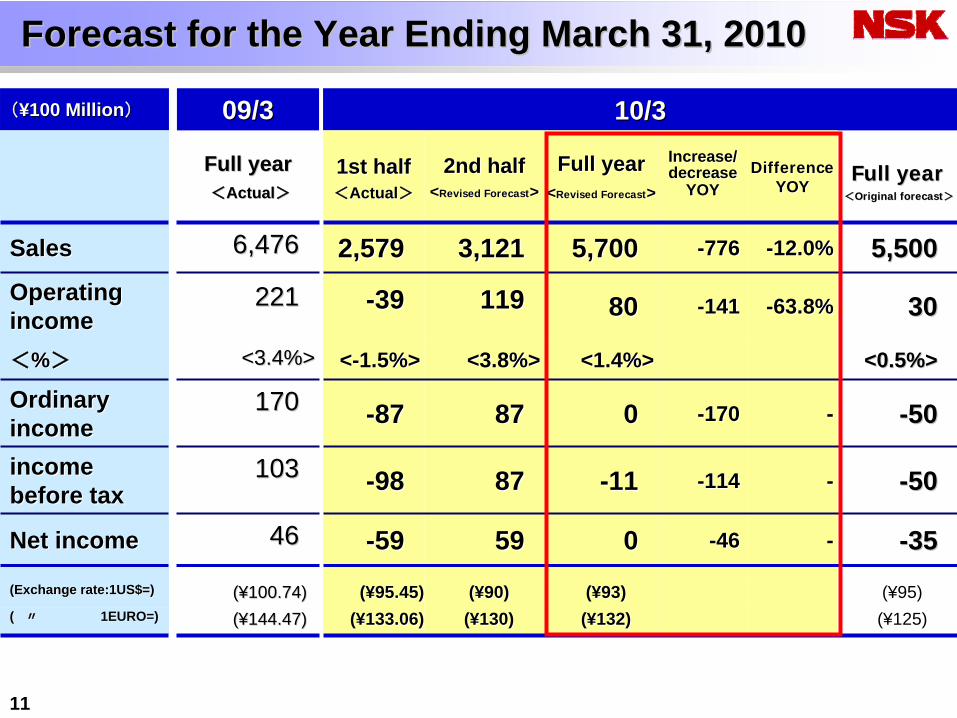
✓✓Upward revisions were made to both sales and profit forecasts anUpward revisions were made to both sales and profit forecasts announcednouncedin May 12, 2009.in May 12, 2009.・・Recovery in the automotive products business will support overalRecovery in the automotive products business will support overall l
results of 2nd half of the year continuously.results of 2nd half of the year continuously.✓✓
Exchange rate forecastExchange rate forecast::US$=US$=¥¥90.0, EURO=90.0, EURO=¥¥130.0130.0
((
Original Forecast US$=Original Forecast US$=¥¥95.0 EURO=95.0 EURO=¥¥125.0125.0))
※※Production appears to be gradually heading towards recovery despProduction appears to be gradually heading towards recovery despite uncertainty over future. ite uncertainty over future. ※※Negative effects expected from end of government fiscal stimulusNegative effects expected from end of government fiscal stimulus programs for automobile sales.programs for automobile sales.✓✓JapanJapan::
・・General/Industrial machineryGeneral/Industrial machinery--
Overall demand will remain stagnant despite Overall demand will remain stagnant despite cocompletion of inventory adjustment by manufacturers.mpletion of inventory adjustment by manufacturers.
・・Automotive ProductionAutomotive ProductionーーProduction will continue to recover.Production will continue to recover.・・Semiconductors and Liquid crystal Production EquipmentSemiconductors and Liquid crystal Production Equipment
ーー
Sales level will remain low, althoughSales level will remain low, although capital investment demand appears to head for recovery. capital investment demand appears to head for recovery. ✓✓AmericasAmericas::The economy in Americas is still uncertain. Sales of automobilesThe economy in Americas is still uncertain. Sales of automobiles in North America in North America
will remain stagnant. will remain stagnant. ✓✓EuropeEurope::Economy will continue to adjust. Automobile sales appears to be Economy will continue to adjust. Automobile sales appears to be decreasing from 4Q. decreasing from 4Q. ✓✓Asia : The recovery trend will continue in China. Asia : The recovery trend will continue in China.
10
Revised Business ForecastRevised Business Forecast
Forecasted Business Environment for the 2nd HalfForecasted Business Environment for the 2nd Half
Forecast for the Year Ending March 31, 2010Forecast for the Year Ending March 31, 2010
11
((¥¥100 Million100 Million)) 09/309/3 10/310/3
Full yearFull year<<ActualActual>>
1st half1st half<<ActualActual>>
2nd half2nd half<<Revised ForecastRevised Forecast>>
Full yearFull year<<Revised ForecastRevised Forecast>>
Increase/Increase/decreasedecrease
YOYYOYDifferenceDifference
YOYYOYFull yearFull year
<<Original forecastOriginal forecast>>
SalesSales 6,4766,476 2,5792,579 3,1213,121 5,7005,700 --776776 --12.0%12.0% 5,5005,500Operating Operating incomeincome
221221 --3939 119119 8080 --141141 --63.8%63.8% 3030
<<%%>> <3.4%><3.4%> <<--1.5%>1.5%> <3.8%><3.8%> <1.4%><1.4%> <0.5%><0.5%>
Ordinary Ordinary incomeincome
170170 --8787 8787 00 --170170 -- --5050
income income before taxbefore tax
103103 --9898 8787 --1111 --114114 -- --5050
Net incomeNet income 4646 --5959 5959 00 --4646 -- --3535(Exchange rate:1US$=)(Exchange rate:1US$=) ((¥¥100.74)100.74) ((¥¥95.45)95.45) ((¥¥90)90) ((¥¥93)93) (¥95)( ( 〃〃
1EURO=)1EURO=) ((¥¥144.47)144.47) ((¥¥133.06)133.06) ((¥¥130)130) ((¥¥132)132) (¥125)
Forecast for the Year Ending March 31, 2010Forecast for the Year Ending March 31, 2010
12
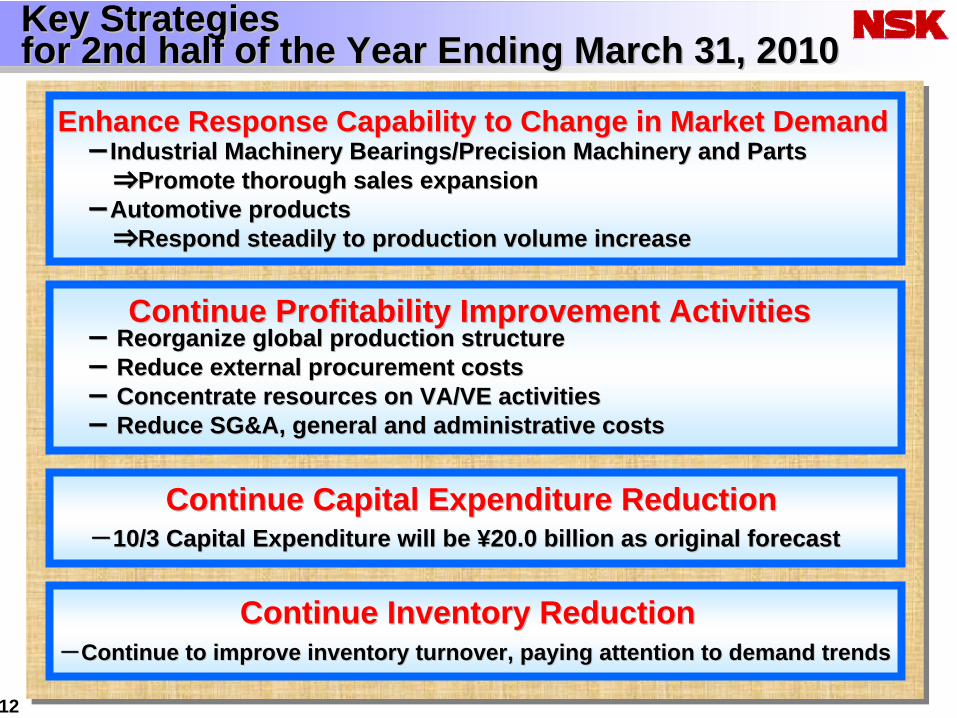
Key StrategiesKey Strategies for 2nd half of the Year Ending March 31, 2010for 2nd half of the Year Ending March 31, 2010
--10/3 Capital Expenditure will be 10/3 Capital Expenditure will be ¥¥20.0 billion as original forecast 20.0 billion as original forecast
Continue Inventory ReductionContinue Inventory Reduction--Continue to iContinue to improve mprove inventory turnover, paying attention to demand trends inventory turnover, paying attention to demand trends
Continue Capital Expenditure ReductionContinue Capital Expenditure Reduction
Enhance Response Capability to Change in Market DemandEnhance Response Capability to Change in Market Demand--Industrial Machinery Bearings/Precision Machinery and PartsIndustrial Machinery Bearings/Precision Machinery and Parts
⇒⇒Promote thorough sales expansion Promote thorough sales expansion --Automotive productsAutomotive products
⇒⇒Respond steadily to production volume increaseRespond steadily to production volume increase
Continue Profitability Improvement Activities Continue Profitability Improvement Activities --
Reorganize global production structureReorganize global production structure
--
Reduce external procurement costsReduce external procurement costs
--
Concentrate resources on VA/VE activitiesConcentrate resources on VA/VE activities
--
Reduce SG&A, general and administrative costsReduce SG&A, general and administrative costs
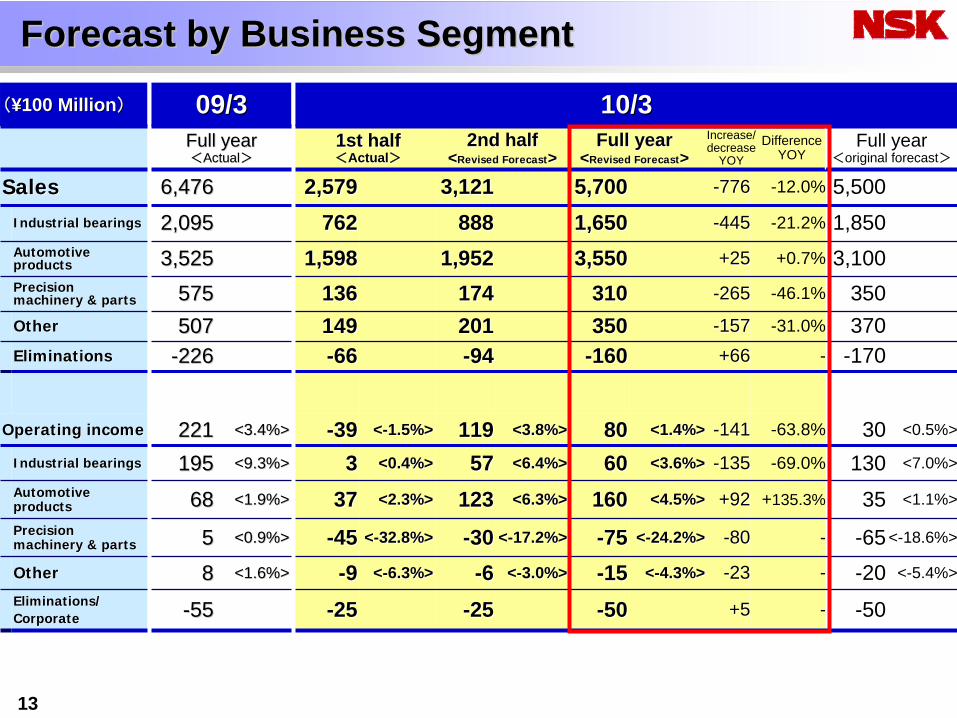
((¥¥100 Million100 Million)) 09/309/3 10/310/3Full yearFull year<<ActualActual>>
1st half1st half<<ActualActual>>
2nd half2nd half<<Revised ForecastRevised Forecast>>
Full yearFull year<<Revised ForecastRevised Forecast>>
Increase/ decrease
YOYDifference
YOYFull year
<original forecast>
SalesSales 6,4766,476 2,5792,579 3,1213,121 5,7005,700 --776776 -12.0% 5,500Industrial bearingsIndustrial bearings 2,0952,095 762762 888888 1,6501,650 --445445 -21.2% 1,850Automotive Automotive productsproducts 3,5253,525 1,5981,598 1,9521,952 3,5503,550 +25+25 +0.7% 3,100Precision Precision machinery & partsmachinery & parts 575575 136136 174174 310310 --265265 -46.1% 350OtherOther 507507 149149 201201 350350 --157157 -31.0% 370EliminationsEliminations --226226 --6666 --9494 --160160 +66+66 - -170
Operating incomeOperating income 221221 <3.4%><3.4%> --3939 <<--1.5%>1.5%> 119119 <3.8%><3.8%> 8080 <1.4%><1.4%> --141141 -63.8% 30 <0.5%>
Industrial bearingsIndustrial bearings 195195 <9.3%><9.3%> 33 <0.4%><0.4%> 5757 <6.4%><6.4%> 6060 <3.6%><3.6%> --135135 -69.0% 130 <7.0%>
Automotive Automotive productsproducts 6868 <1.9%><1.9%> 3737 <2.3%><2.3%> 123123 <6.3%><6.3%> 160160 <4.5%><4.5%> +92+92 +135.3% 35 <1.1%>
Precision Precision machinery & partsmachinery & parts 55 <0.9%><0.9%> --4545 <<--32.8%>32.8%> --3030 <<--17.2%>17.2%> --7575 <<--24.2%>24.2%> --8080 - -65<-18.6%>
OtherOther 88 <1.6%><1.6%> --99 <<--6.3%>6.3%> --66 <<--3.0%>3.0%> --1515 <<--4.3%>4.3%> --2323 - -20 <-5.4%>
Eliminations/Eliminations/CorporateCorporate --5555 --2525 --2525 --5050 +5+5 - -50
13
Forecast by Business SegmentForecast by Business Segment
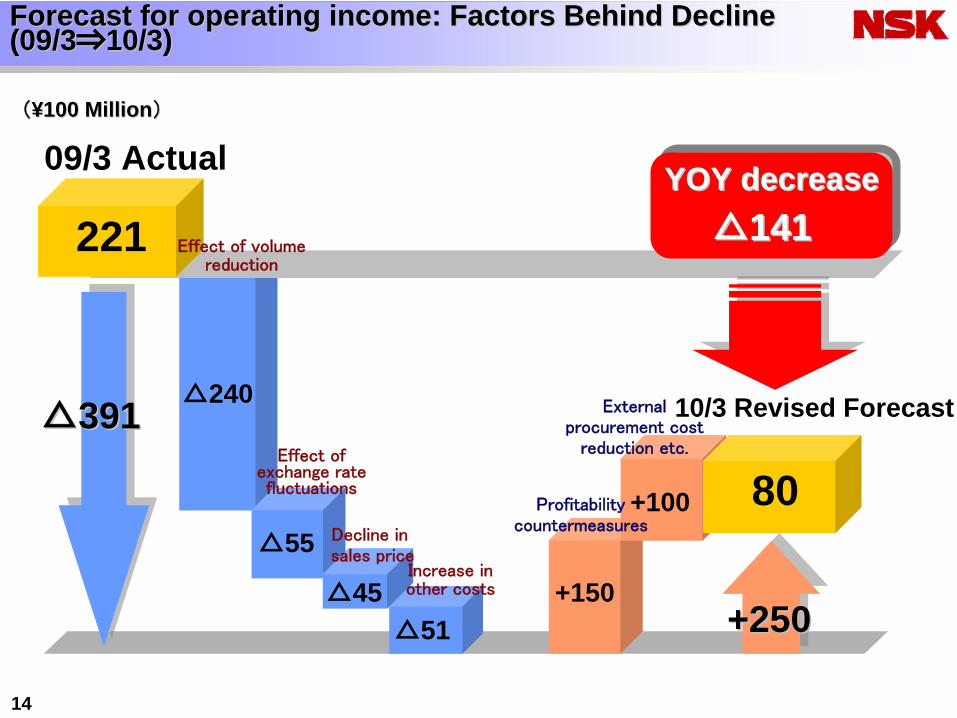
14
((¥¥100 Million100 Million))
09/3 Actual
△△391391
++250250
△△141141YOY decreaseYOY decrease
△51
221
Forecast for operating income: Factors Behind DeclineForecast for operating income: Factors Behind Decline (09/3(09/3⇒⇒10/3)10/3)
△240
△55
+150
+100 80
△45
Effect of volume reduction
Effect of exchange rate fluctuations
Decline insales price
Increase in other costs
Profitability countermeasures
External procurement cost
reduction etc.
10/3 Revised Forecast

15
333 MidMid--term Plan(FYterm Plan(FY’’09~FY09~FY’’12)12)
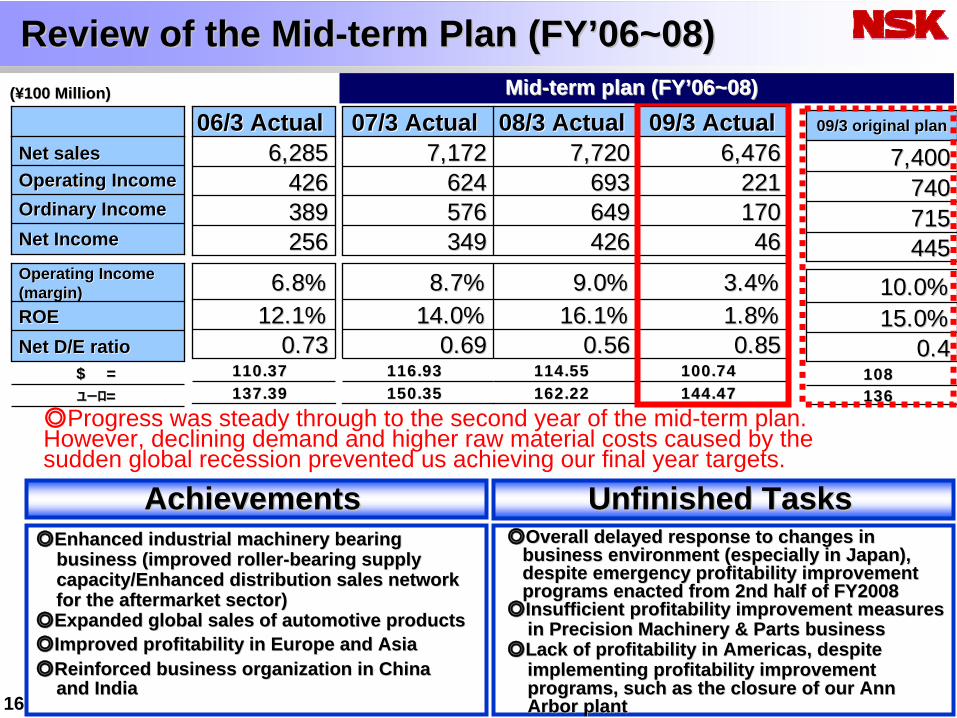
Review of the MidReview of the Mid--term Plan (FYterm Plan (FY’’06~08)06~08)
06/3 Actual06/3 Actual 07/3 Actual07/3 Actual 08/3 Actual08/3 Actual 09/3 Actual09/3 Actual6,2856,285 7,1727,172 7,7207,720 6,4766,476
426426 624624 693693 221221389389 576576 649649 170170256256 349349 426426 4646
6.8%6.8% 8.7%8.7% 9.0%9.0% 3.4%3.4%12.1%12.1% 14.0%14.0% 16.1%16.1% 1.8%1.8%
0.730.73 0.690.69 0.560.56 0.850.85110.37110.37 116.93116.93 114.55114.55 100.74100.74137.39137.39 150.35150.35 162.22162.22 144.47144.47
09/3 original plan09/3 original plan
7,4007,400740740715715445445
10.0%10.0%15.0%15.0%
0.40.4108108136136
◎Progress was steady through to the second year of the mid-term plan. However, declining demand and higher raw material costs caused by the sudden global recession prevented us achieving our final year targets.
Net salesNet salesOperating IncomeOperating IncomeOrdinary IncomeOrdinary IncomeNet IncomeNet Income
Operating Income Operating Income (margin)(margin)ROEROENet D/E ratioNet D/E ratio
$$ ==ユーロユーロ==
AchievementsAchievements UnfinishedUnfinished TasksTasks◎◎Enhanced industrial machinery bearing Enhanced industrial machinery bearing
business (improved rollerbusiness (improved roller--bearing supplybearing supplycapacity/Enhanced distribution sales networkcapacity/Enhanced distribution sales networkfor the aftermarket sector) for the aftermarket sector)
◎◎Expanded global sales of automotive productsExpanded global sales of automotive products◎◎Improved profitability in Europe and Asia Improved profitability in Europe and Asia ◎◎Reinforced business organization in ChinaReinforced business organization in China
and India and India
◎◎Overall delayed response to changes in Overall delayed response to changes in business environment (especially in Japan),business environment (especially in Japan),despite emergency profitability improvement despite emergency profitability improvement programs enacted from 2nd half of FY2008 programs enacted from 2nd half of FY2008
◎◎Insufficient profitability improvement measuresInsufficient profitability improvement measuresin Precision Machinery & Parts businessin Precision Machinery & Parts business
◎◎Lack of profitability in Americas, despite Lack of profitability in Americas, despite implementing profitability improvementimplementing profitability improvementprograms, such as the closure of our Ann programs, such as the closure of our Ann Arbor plantArbor plant
MidMid--term plan (FYterm plan (FY’’06~08)06~08)
16
((¥¥100 Million)100 Million)
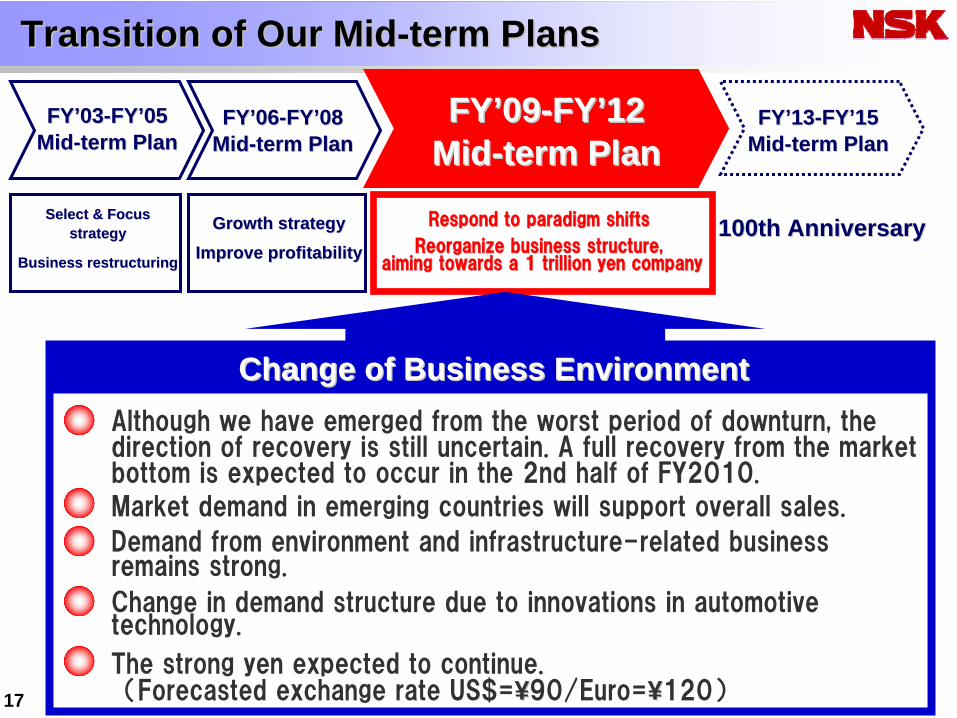
Transition of Our MidTransition of Our Mid--term Plansterm Plans
Although we have emerged from the worst period of downturn, the direction of recovery is still uncertain. A full recovery from the market bottom is expected to occur in the 2nd half of FY2010.
Market demand in emerging countries will support overall sales.
Demand from environment and infrastructure-related businessremains strong.
Change in demand structure due to innovations in automotive technology.
The strong yen expected to continue.(Forecasted exchange rate US$=¥¥90/Euro=¥¥120)
Change of Change of BBusiness usiness EnvironmentEnvironment
Select & Focus Select & Focus strategystrategy
Business restructuringBusiness restructuring
FYFY’’0303--FYFY’’0505MidMid--term Planterm Plan
FYFY’’0606--FYFY’’0808MidMid--term Planterm Plan
FYFY’’0909--FYFY’’1212MidMid--term Planterm Plan
Growth strategyGrowth strategy
Improve profitabilityImprove profitability
Respond to paradigm shiftsRespond to paradigm shifts
Reorganize business structure,Reorganize business structure,aiming towards a 1 trillion yen companyaiming towards a 1 trillion yen company
FYFY’’1313--FYFY’’1515MidMid--term Planterm Plan
100th Anniversary100th Anniversary
17
18
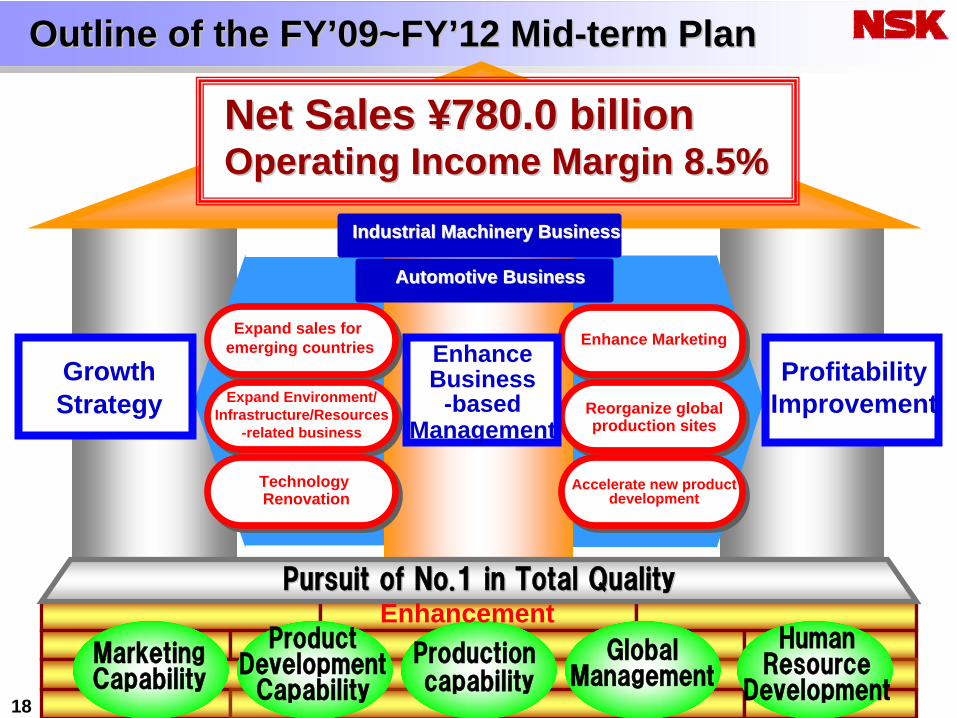
Outline of the FYOutline of the FY’’09~FY09~FY’’12 Mid12 Mid--term Planterm Plan
Marketing Capability
Product Development Capability
Production capability
Global Management
Human Resource
Development
Net Sales Net Sales ¥¥7780.0 billion80.0 billionOperating Income Margin 8.5Operating Income Margin 8.5%%
Industrial Machinery BusinessIndustrial Machinery Business
Automotive BusinessAutomotive Business
Expand sales foremerging countries
Expand Environment/Infrastructure/Resources
-related businessReorganize global production sites
Enhance Marketing
Accelerate new product development
Pursuit of No.1 in Total QualityPursuit of No.1 in Total QualityEnhancement
GrowthStrategy
ProfitabilityImprovement
TechnologyRenovation
EnhanceBusiness
-based Management
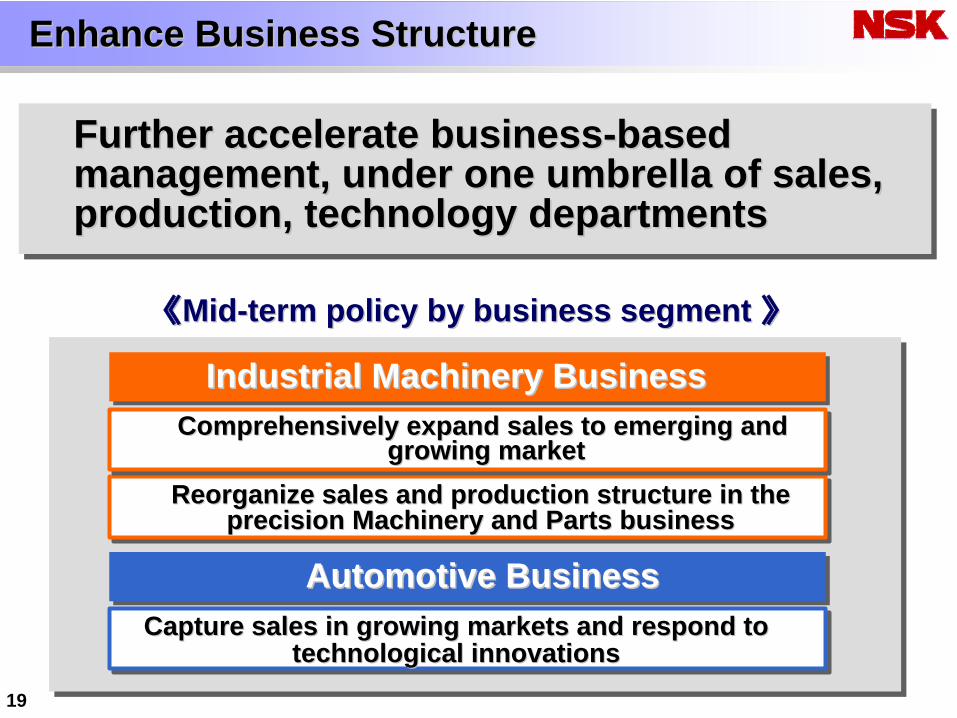
Enhance Business StructureEnhance Business Structure
19
Capture sales in growing markets and respond to Capture sales in growing markets and respond to technological innovations technological innovations
Reorganize sales and production structure in the Reorganize sales and production structure in the precision Machinery and Parts businessprecision Machinery and Parts business
Comprehensively expand sales to emerging andComprehensively expand sales to emerging andgrowing marketgrowing market
Further accelerate businessFurther accelerate business--based based management, under one umbrella of sales, management, under one umbrella of sales, production, technology departments production, technology departments
Industrial Machinery BusinessIndustrial Machinery Business
Automotive BusinessAutomotive Business
《《MidMid--term policy by business segment term policy by business segment 》》

<<Strategy by business segmentStrategy by business segment>> Industrial Machinery Business Industrial Machinery Business ①①
■■Continue and expand channel Continue and expand channel development development
**Expand sales distribution networks in Expand sales distribution networks in emerging countriesemerging countries
■■Enhance total service capabilityEnhance total service capability((Technology/Supply/TrainingTechnology/Supply/Training))
■■Enhance sales through full lineEnhance sales through full line--upupof productsof products((Bearings + Precision Machinery and Parts)Bearings + Precision Machinery and Parts)
Enhance sales in emerging countriesEnhance sales in emerging countriesand Technology structureand Technology structure
Expand sales for the aftermarket sectorExpand sales for the aftermarket sector
Expand sales for emerging Countries
Demand forecast of industrial bearings(NSK Estimate)
Demand forecast of linear motion products (NSK Estimate)
Estimated Demand EnvironmentEstimated Demand Environment
20
Growth in emerging markets expected to support overall demand
(08/3=100)
(08/3=100)
94
958780
75
73706868
97
100 98
128118108
99
0
40
80
120
160
200
'08/3 '09/3 '10/3 '11/3 '12/3 '13/3
Global Developed coutries
Emerging coutries
90
70
54
80
42 6248
38
8079
100
6686
107
145
76
0
40
80
120
160
200
'08/3 '09/3 '10/3 '11/3 '12/3 '13/3
Global Developed CountriesEmerging Countries
■■Adjust and enhance sales structure inAdjust and enhance sales structure inemerging countries (emerging countries (BRICsBRICs, Latin , Latin America, Middle East)America, Middle East)**Expand sales sites and workforceExpand sales sites and workforce((Particularly in China/IndiaParticularly in China/India))**Enhance frontline (field) technologyEnhance frontline (field) technology
support structuresupport structure((Enhance overseas technology centersEnhance overseas technology centers))
**Increase application engineersIncrease application engineers
**Utilize as a global productionUtilize as a global productionsite as well as supplier forsite as well as supplier forlocal demand in Chinalocal demand in China
**Cost reduction through integrationCost reduction through integrationof production sites in Japanof production sites in Japan
Reorganize global Reorganize global production Sitesproduction Sites
21
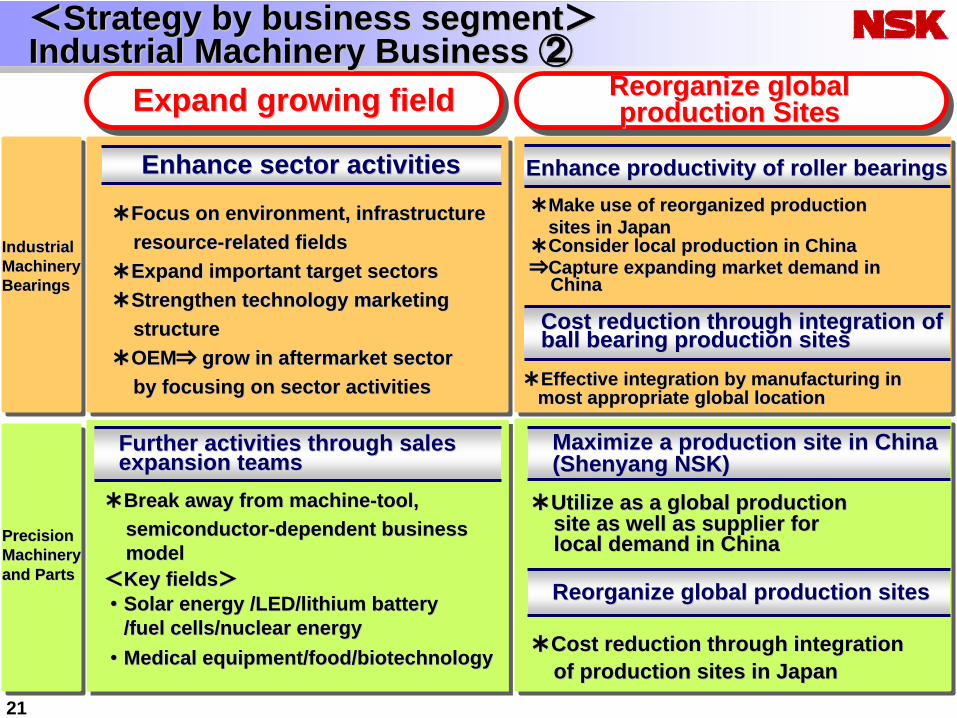
**Make use of reorganized productionMake use of reorganized productionsites in Japan sites in Japan
**Consider local production in China Consider local production in China ⇒⇒Capture expanding market demand inCapture expanding market demand in
China China
Enhance productivity of roller bearingsEnhance productivity of roller bearings
Cost reduction Cost reduction through integration ofthrough integration ofball bearing production sitesball bearing production sites
Maximize a production site in China Maximize a production site in China (Shenyang NSK) (Shenyang NSK)
Enhance sector activitiesEnhance sector activities
Expand growing field Expand growing field
**Break away from machineBreak away from machine--tool, tool, semiconductorsemiconductor--dependent businessdependent businessmodelmodel
<<Key fieldsKey fields>>
・・Solar energy /LED/lithium batterySolar energy /LED/lithium battery/fuel cells/nuclear energy/fuel cells/nuclear energy
・・Medical equipment/food/biotechnologyMedical equipment/food/biotechnology
Reorganize global production sitesReorganize global production sites
Further activities through sales Further activities through sales expansion teamsexpansion teams
**Focus on environment, infrastructureFocus on environment, infrastructureresourceresource--related fieldsrelated fields
**Expand important target sectors Expand important target sectors **Strengthen technology marketingStrengthen technology marketing
structure structure **OEMOEM⇒⇒ grow in aftermarket sectorgrow in aftermarket sector
by focusing on sector activitiesby focusing on sector activities **Effective integration by manufacturing in Effective integration by manufacturing in most appropriate global locationmost appropriate global location
<<Strategy by business segmentStrategy by business segment>> Industrial Machinery Business Industrial Machinery Business ②②
Industrial Industrial Machinery Machinery BearingsBearings
Precision Precision MachineryMachineryand Parts and Parts
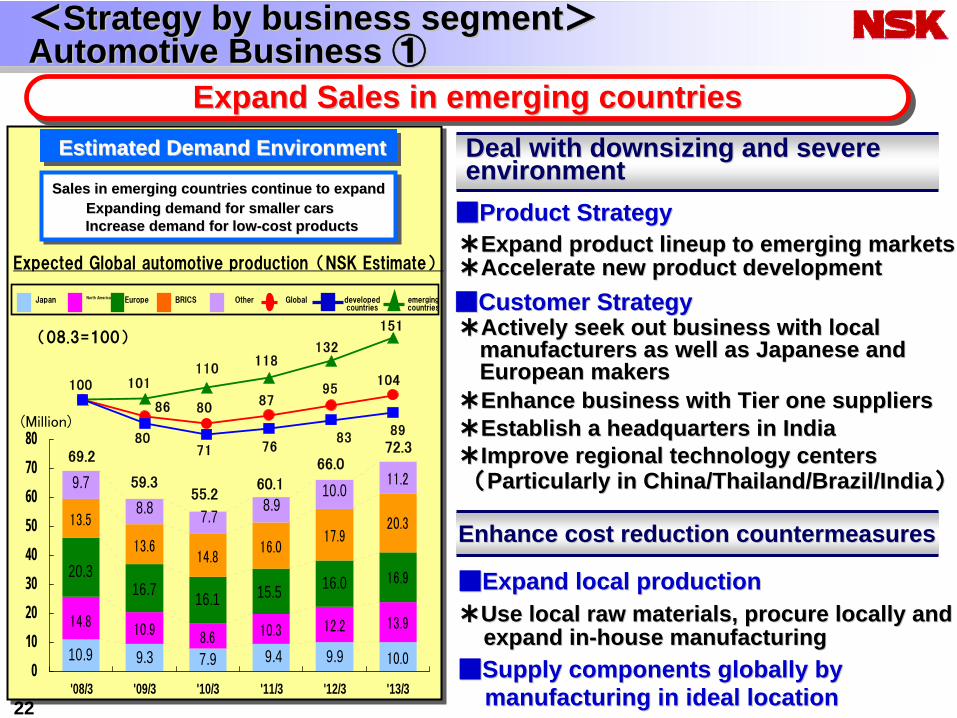
Deal with downsizing and severe Deal with downsizing and severe environment environment
Increase demand for lowIncrease demand for low--cost productscost products
Enhance cost reduction countermeasuresEnhance cost reduction countermeasures
Expected Global automotive production(NSK Estimate)
Expand Sales in emerging countries Expand Sales in emerging countries
Expanding demand for smaller carsExpanding demand for smaller cars
Estimated Demand EnvironmentEstimated Demand Environment
69.2
59.355.2
60.1
66.072.3
(Million)
■■Product StrategyProduct Strategy**Expand product lineup to emerging marketsExpand product lineup to emerging markets**Accelerate new product developmentAccelerate new product development■■Customer StrategyCustomer Strategy**Actively seek out business with local Actively seek out business with local
manufacturers as well as Japanese andmanufacturers as well as Japanese andEuropean makersEuropean makers
**Enhance business with Tier one suppliers Enhance business with Tier one suppliers **Establish a headquarters in India Establish a headquarters in India **Improve regional technology centersImprove regional technology centers((Particularly in China/Thailand/Brazil/IndiaParticularly in China/Thailand/Brazil/India))
■■Expand local productionExpand local production**Use local raw materials, procure locally andUse local raw materials, procure locally and
expand inexpand in--house manufacturinghouse manufacturing■■Supply components globally by Supply components globally by
manufacturing in ideal locationmanufacturing in ideal location22
9587
8086
104
151
132118
110101100
8071 76
8389
(08.3=100)
10.9 8.6 10.3 12.2 13.9
16.116.0
10.09.410.9 9.3 7.9 9.9
14.8
16.915.516.7
20.314.8
13.517.9
20.3
16.013.6
10.08.8
9.7 11.2
8.97.7
01020304050607080
'08/3 '09/3 '10/3 '11/3 '12/3 '13/3
Global emerging countries
Japan North Americas Europe BRICS Other developed countries
Sales in emerging countries continue to expandSales in emerging countries continue to expand
<<Strategy by business segmentStrategy by business segment>> AutomotiveAutomotive Business Business ①①
23
事 業 基 盤 拡 大
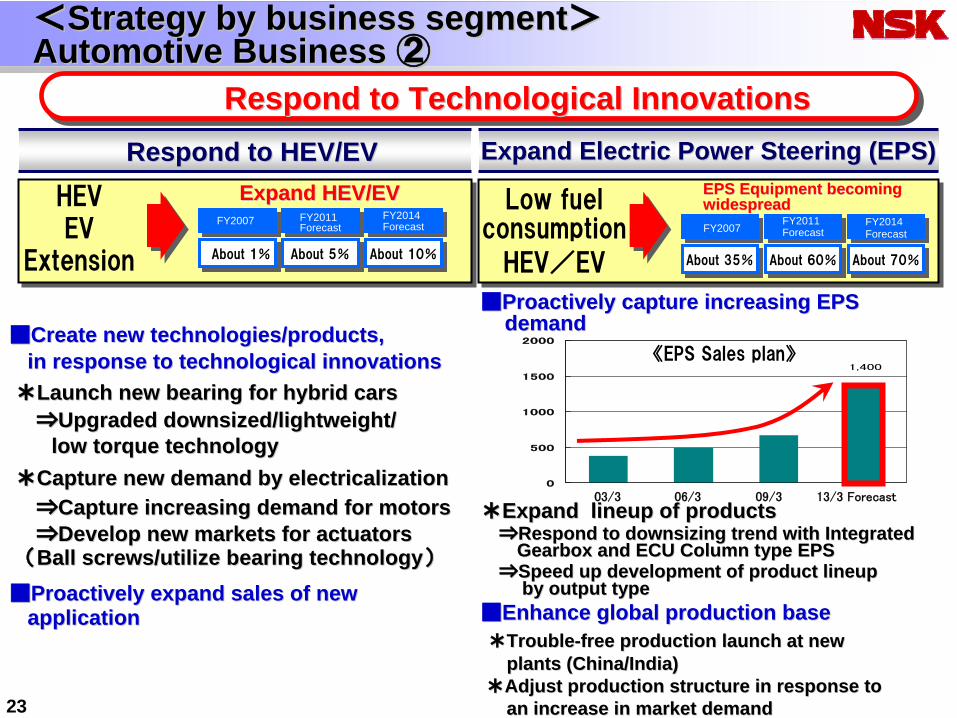
Respond to HEV/EVRespond to HEV/EV Expand Electric Power Steering (EPS)Expand Electric Power Steering (EPS)
■■Proactively capture increasing EPS Proactively capture increasing EPS demanddemand
Low fuel consumption
HEV/EV
EPS Equipment becoming EPS Equipment becoming widespreadwidespread
About 35% About 60% About 70%
0
500
1000
1500
2000
1,400《EPS Sales plan》
03/3
06/3 09/3 13/3 Forecast
HEVEV
Extension About 1%
FY2007
About 5%
FY2011 Forecast
About 10%
Expand HEV/EVExpand HEV/EV
**Expand lineup of productsExpand lineup of products⇒⇒Respond to downsizing trend with Integrated Respond to downsizing trend with Integrated
Gearbox and ECU Column type EPSGearbox and ECU Column type EPS⇒⇒Speed up development of product lineupSpeed up development of product lineup
by output type by output type ■■Enhance global production baseEnhance global production base**TroubleTrouble--free production launch at newfree production launch at new
plants (China/India)plants (China/India)**Adjust production structure in response toAdjust production structure in response to
an increase in market demandan increase in market demand
■■Create new technologies/products,Create new technologies/products,in response to technological innovations in response to technological innovations
**Launch new bearing for hybrid carsLaunch new bearing for hybrid cars⇒⇒Upgraded downsized/lightweight/Upgraded downsized/lightweight/
low torque technologylow torque technology**Capture new demand by Capture new demand by electricalizationelectricalization
⇒⇒Capture increasing demand for motorsCapture increasing demand for motors⇒⇒Develop new markets for actuatorsDevelop new markets for actuators
((Ball screws/utilize bearing technologyBall screws/utilize bearing technology))
■■Proactively expand sales of new Proactively expand sales of new applicationapplication
<<Strategy by business segmentStrategy by business segment>> AutomotiveAutomotive Business Business ②②
FY2014Forecast FY2007
FY2011 Forecast
FY2014Forecast
Respond to Technological InnovationsRespond to Technological Innovations

24
<<Regional StrategyRegional Strategy>>
ChinaChinaFurther expand business, strengthen business structure in ChinaFurther expand business, strengthen business structure in China
Start practical operations at new site, NSK ChinaStart practical operations at new site, NSK ChinaTechnology Center Technology Center ⇒⇒Build autonomous structure in China (Spanning R&DBuild autonomous structure in China (Spanning R&D
to technological support for customers)to technological support for customers)
TechnologyTechnology
Further enhance management capability byFurther enhance management capability bymoving headquarter office for Chinese business tomoving headquarter office for Chinese business totechnology development centertechnology development center⇒⇒ Develop throughout growth strategy, managingDevelop throughout growth strategy, managing
overall China business and cooperating with eachoverall China business and cooperating with eachdepartment department
Increase number of sales people, sales sitesIncrease number of sales people, sales sites⇒⇒Strengthen marketing by increasing sales forceStrengthen marketing by increasing sales force
and number of sites in Northand number of sites in North--East and inland regions East and inland regions
April, 2010:, start production of Precision MachineryApril, 2010:, start production of Precision Machineryand Partsand Parts⇒⇒Consider production of largeConsider production of large--type bearingstype bearings
Build supply structure for local demandBuild supply structure for local demandin all business segments in all business segments
ProductionProduction
06/3 09/3 13/3 Forecast
Sales Forecast in ChinaSales Forecast in China
<<Industrial MachineryIndustrial Machinery>>
・・
Key FieldKey Field::Wind turbine/railways/infrastructureWind turbine/railways/infrastructure--related/machine tool/aftermarket sector etc.related/machine tool/aftermarket sector etc.
・・Key Region: Inland /NorthKey Region: Inland /North--East regionEast region<<AutomobilesAutomobiles>>
・・
OrderOrder--winning activities from Japanesewinning activities from Japanesemanufacturersmanufacturers
・・Expand sales to local and EuropeanExpand sales to local and Europeanmanufacturersmanufacturers
0
200
400
600
800
1000
1200
1,000
ManagementManagement
SalesSales
((¥¥100 Million)100 Million)
25
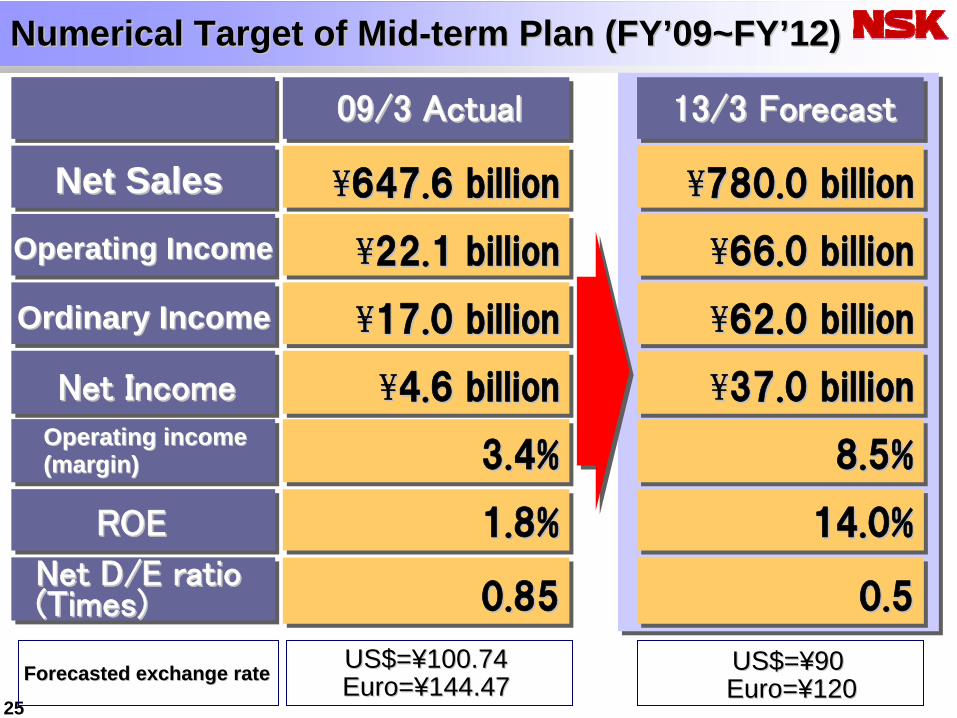
Net Sales Net Sales
Operating IncomeOperating Income
Ordinary IncomeOrdinary Income
Net IncomeNet IncomeOperating income Operating income (margin)(margin)
ROEROE
¥¥647.6 billion647.6 billion
09/3 Actual09/3 Actual 13/3 Forecast13/3 Forecast
Net D/E ratio Net D/E ratio (Times)(Times)
Forecasted exchange rateForecasted exchange rate US$=US$=¥¥100.74100.74EuroEuro==¥¥144.47144.47
US$=US$=¥¥9090EuroEuro==¥¥120120
¥¥22.1 billion22.1 billion
¥¥780.0 billion780.0 billion
¥¥17.0 billion17.0 billion
¥¥4.6 billion4.6 billion
3.4%3.4%
0.850.85
1.8%1.8%
¥¥66.0 billion66.0 billion
¥¥62.0 billion62.0 billion
0.50.5
14.0%14.0%
8.5%8.5%
¥¥37.0 billion37.0 billion
Numerical Target of MidNumerical Target of Mid--term Plan (FYterm Plan (FY’’09~FY09~FY’’12)12)
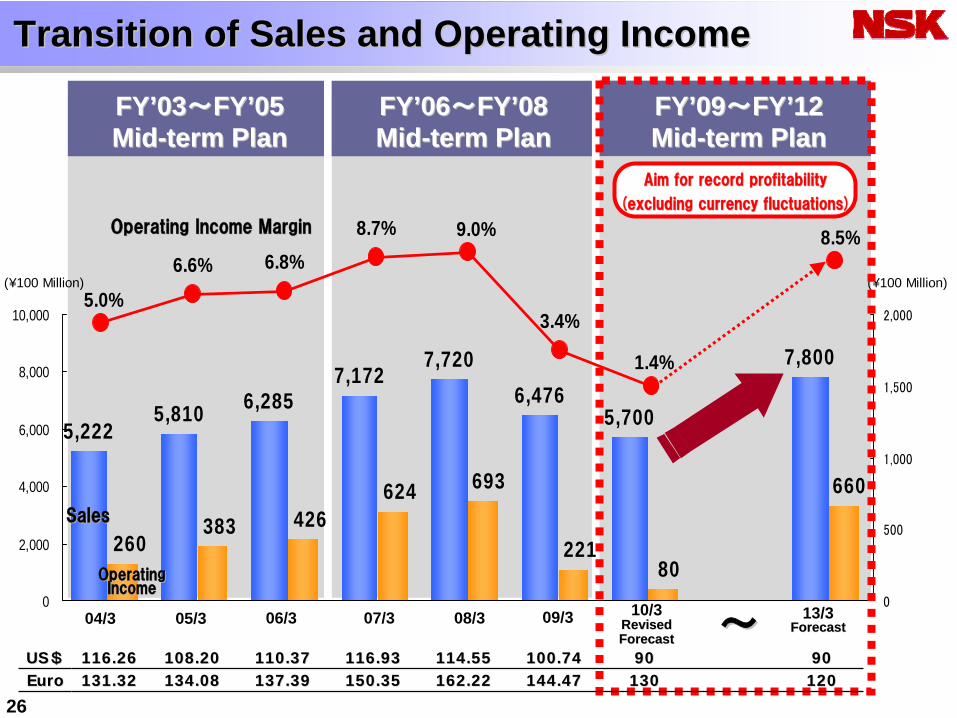
6.6% 6.8%8.7%
3.4%5.0%
9.0%
1.4%
8.5%
5,2225,810 6,285
7,1727,720
6,4765,700
7,800
660
80221
693624426383
260
0
2,000
4,000
6,000
8,000
10,000
0
500
1,000
1,500
2,000
26
FYFY’’0606~~FYFY’’0808MidMid--term Planterm Plan
(¥100 Million)
FYFY’’0303~~FYFY’’0505MidMid--term Planterm Plan
06/3 07/304/3 05/3 08/3 09/3 10/3Revised Revised ForecastForecast
13/3ForecastForecast
FYFY’’0909~~FYFY’’1212MidMid--term Planterm Plan
~~USUS$$ 116.26116.26 108.20108.20 110.37110.37 116.93116.93 114.55114.55 100.74100.74 9090 9090EuroEuro 131.32131.32 134.08134.08 137.39137.39 150.35150.35 162.22162.22 144.47144.47 130130 120120
Transition of Sales and Operating Income Transition of Sales and Operating Income
SalesSales
Operating Operating IncomeIncome
Operating Income MarginOperating Income Margin
Aim for record profitabilityAim for record profitability
(excluding currency fluctuations)(excluding currency fluctuations)
(¥100 Million)
4,5003,525
3,5254,500
27
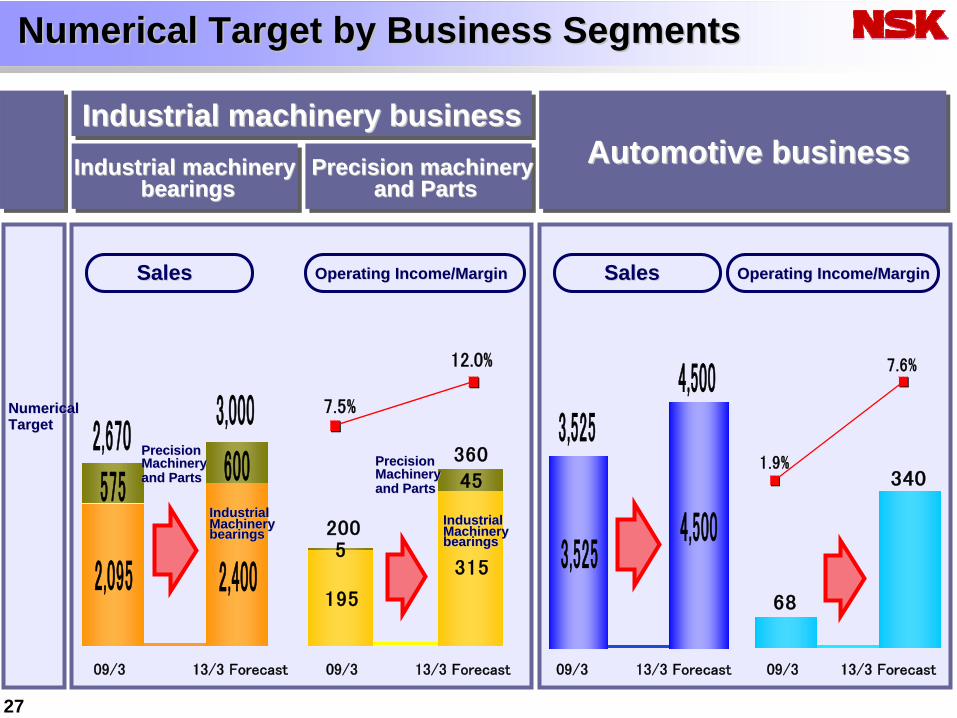
Numerical Target by Business SegmentsNumerical Target by Business Segments
575 600
2,4002,095
2,6703,000
09/3
13/3 Forecast
SalesSales
7.5%
12.0%
09/3
13/3 Forecast
Operating Income/MarginOperating Income/Margin
09/3
13/3 Forecast
1.9%
7.6%
68
340
09/3
13/3 Forecast
Industrial machinery businessIndustrial machinery businessPrecision machineryPrecision machinery
and Partsand PartsIndustrial machineryIndustrial machinery
bearingsbearings
SalesSales Operating Income/MarginOperating Income/Margin
NumericalNumericalTargetTarget
Precision Precision MachineryMachineryand Partsand Parts
Industrial Industrial MachineryMachinerybearingsbearings
Automotive businessAutomotive business
5
195
315
45
360
200
Precision Precision MachineryMachineryand Partsand Parts
Industrial Industrial MachineryMachinerybearingsbearings
28
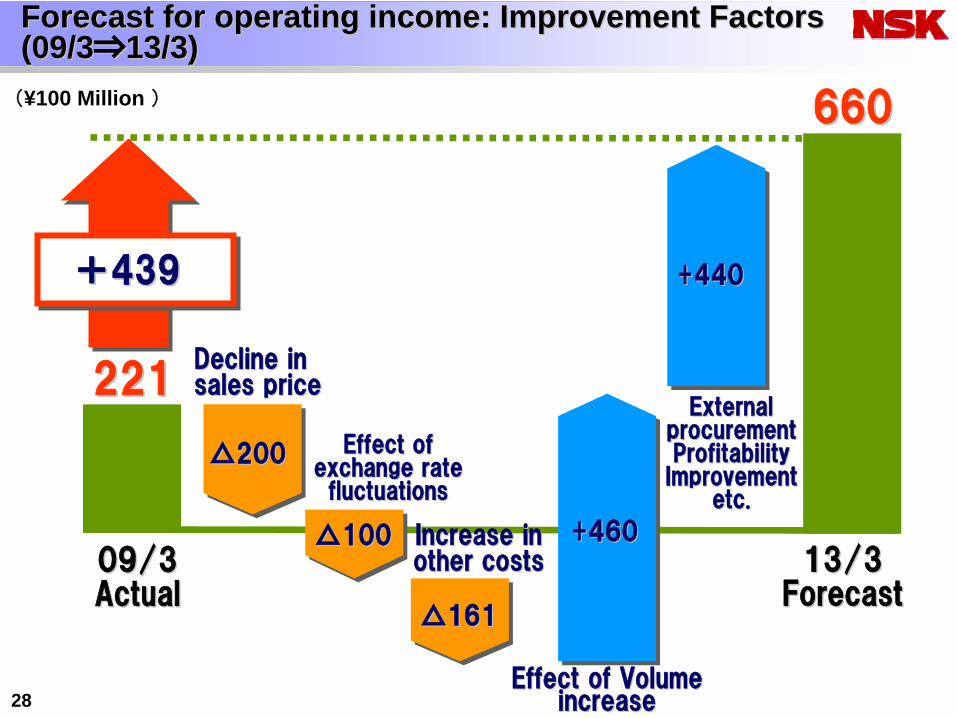
660660
221221
09/309/3ActualActual
13/313/3ForecastForecast
△△200200
+460+460
+440+440++443939
△△100100
△△161161
Forecast for operating income: Improvement Factors Forecast for operating income: Improvement Factors (09/3(09/3⇒⇒1313/3)/3)
Effect of Volume Effect of Volume increaseincrease
External External procurement procurement Profitability Profitability ImprovementImprovement
etc.etc.
Decline in Decline in sales pricesales price
Increase in Increase in other costsother costs
Effect of Effect of exchange rate exchange rate fluctuationsfluctuations
(¥100 Million )
29
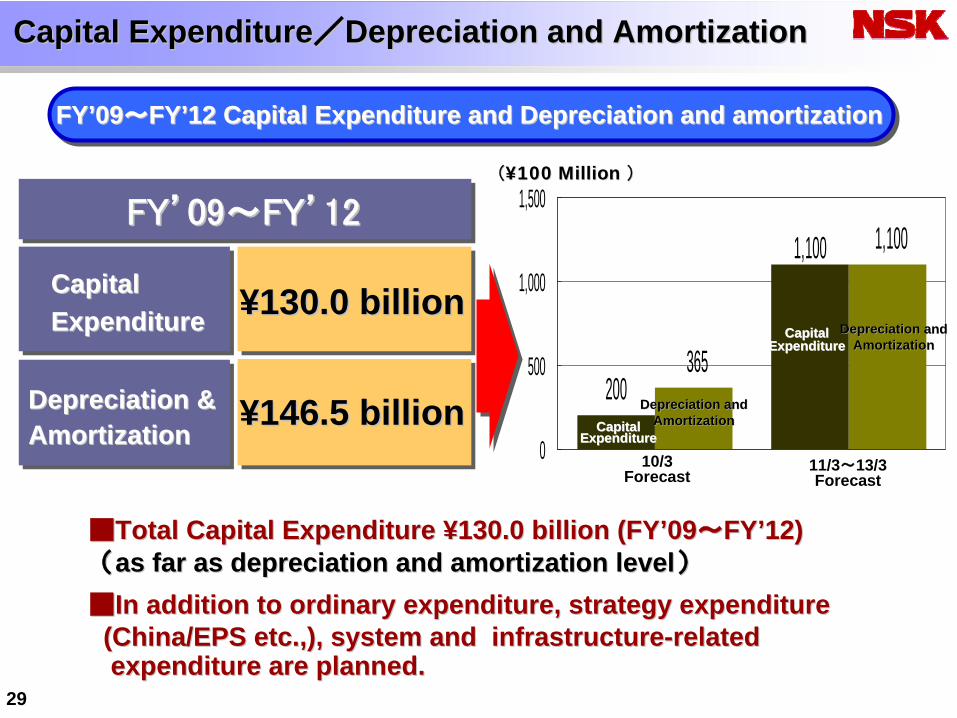
Capital ExpenditureCapital Expenditure//Depreciation and AmortizationDepreciation and Amortization
200
1,100
365
1,100
0
500
1,000
1,500
10/3Forecast
11/3~13/3Forecast
((¥¥100 Million 100 Million ))
Capital Capital ExpenditureExpenditure
Depreciation andDepreciation andAmortizationAmortization
FYFY’’0909~~FYFY’’12 Capital Expenditure and Depreciation and amortization12 Capital Expenditure and Depreciation and amortization
CapitalCapitalExpenditureExpenditure
Depreciation & Depreciation & AmortizationAmortization
¥¥130.0 billion130.0 billion
¥¥146.5 billion146.5 billion
FYFY’’0909~~FYFY’’1212
■■Total Capital Expenditure Total Capital Expenditure ¥¥130.0 billion (FY130.0 billion (FY’’0909~~FYFY’’12)12)((as far as depreciation and amortization levelas far as depreciation and amortization level))■■In addition to ordinary expenditure, strategy expenditureIn addition to ordinary expenditure, strategy expenditure(China/EPS etc.,), system and infrastructure(China/EPS etc.,), system and infrastructure--relatedrelatedexpenditure are planned.expenditure are planned.
Capital Capital ExpenditureExpenditure
Depreciation andDepreciation andAmortizationAmortization
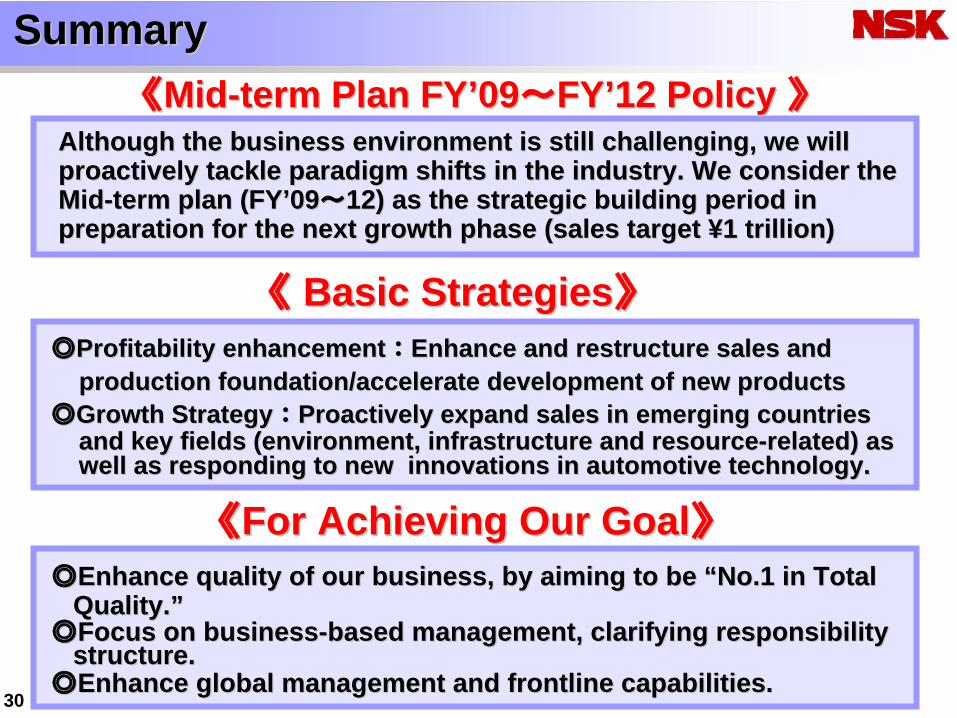
SummarySummary
Although the business environment is still challenging, we will Although the business environment is still challenging, we will proactively tackle paradigm shifts in the industry. We consider proactively tackle paradigm shifts in the industry. We consider the the MidMid--term plan (FYterm plan (FY’’0909~~1212)) as the strategic building period in as the strategic building period in preparation for the next growth phase (sales target preparation for the next growth phase (sales target ¥¥1 trillion) 1 trillion)
《《MidMid--term Planterm Plan FYFY’’0909~~FYFY’’1212 Policy Policy 》》
《《
Basic StrategiesBasic Strategies》》
◎◎Profitability enhancementProfitability enhancement::Enhance and restructure sales and Enhance and restructure sales and production foundation/accelerate development of new productsproduction foundation/accelerate development of new products
◎◎Growth StrategyGrowth Strategy::Proactively expand sales in emerging countriesProactively expand sales in emerging countriesand key fields (environment, infrastructure and resourceand key fields (environment, infrastructure and resource--related) asrelated) aswell as responding to new innovations in automotive technolwell as responding to new innovations in automotive technology.ogy.
《《For Achieving Our GoalFor Achieving Our Goal》》
30
◎◎Enhance quality of our business, by aiming to be Enhance quality of our business, by aiming to be ““No.1 in TotalNo.1 in TotalQuality.Quality.””
◎◎Focus on businessFocus on business--based management, clarifying responsibilitybased management, clarifying responsibilitystructure. structure.
◎◎Enhance global management and frontline capabilities.Enhance global management and frontline capabilities.

31
((SupplementarySupplementary MaterialMaterial))
(¥100 million) 09/309/3 10/310/31st half1st half<<ActualActual>>
2nd half2nd half<<ActualActual>>
Full yearFull year<<ActualActual>>
1st half1st half<<ActualActual>>
2nd half2nd half<<Revised ForecastRevised Forecast>>
Full yearFull year<<Revised ForecastRevised Forecast>>
Increase/decrease
YOY
Difference Difference YOYYOY
Full year<original forecast>
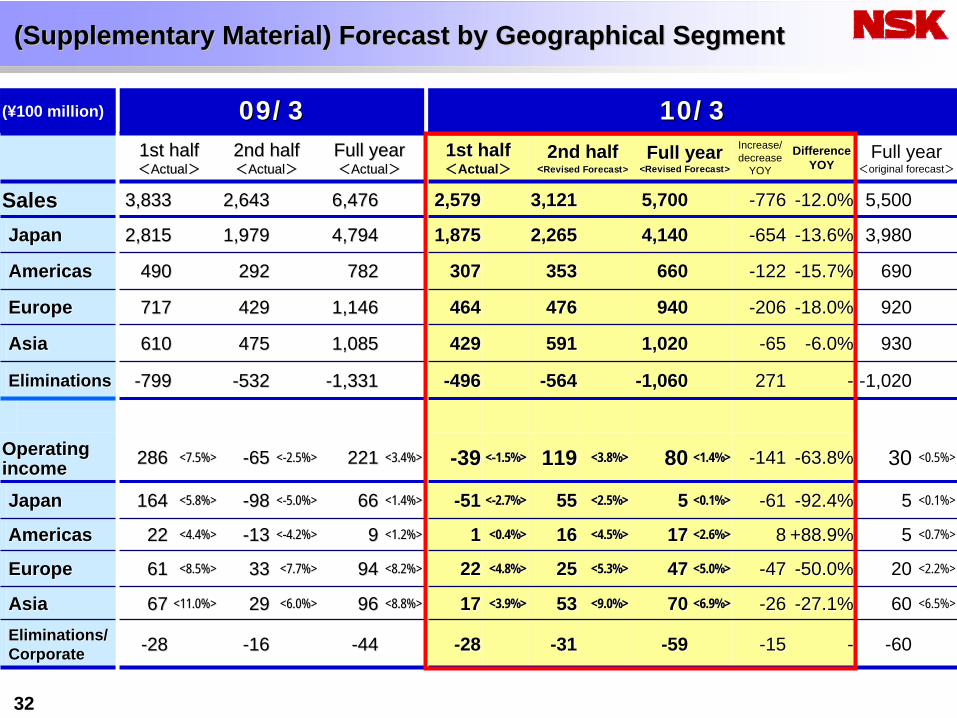
SalesSales 3,8333,833 2,6432,643 6,4766,476 2,5792,579 3,3,121121 5,7005,700 --776776 --12.0%12.0% 5,500
JapanJapan 2,8152,815 1,9791,979 4,7944,794 1,8751,875 2,2652,265 4,1404,140 --654654 --13.6%13.6% 3,980
AmericasAmericas 490490 292292 782782 307307 353353 660660 --122122 --15.7%15.7% 690
EuropeEurope 717717 429429 1,1461,146 464464 476476 940940 --206206 --18.0%18.0% 920
AsiaAsia 610610 475475 1,0851,085 429429 591591 1,0201,020 --6565 --6.0%6.0% 930
EliminationsEliminations --799799 --532532 --1,3311,331 --496496 --564564 --1,0601,060 271271 -- -1,020
OperatingOperatingincomeincome 286286 <7.5%><7.5%> --6565 <<--2.5%>2.5%> 221221 <3.4%><3.4%> --3939 <<--1.5%>1.5%> 119119 <3.8%><3.8%> 8080 <1.4%><1.4%> --141141 --63.8%63.8% 30 <0.5%>
JapanJapan 164164 <5.8%><5.8%> --9898 <<--5.0%>5.0%> 6666 <1.4%><1.4%> --5151 <<--2.7%>2.7%> 5555 <2.5%><2.5%> 55 <0.1%><0.1%> --6161 --92.4%92.4% 5 <0.1%>
AmericasAmericas 2222 <4.4%><4.4%> --1313 <<--4.2%>4.2%> 99 <1.2%><1.2%> 11 <0.4%><0.4%> 1616 <4.5%><4.5%> 1717 <2.6%><2.6%> 88 +88.9%+88.9% 5 <0.7%>
EuropeEurope 6161 <8.5%><8.5%> 3333 <7.7%><7.7%> 9494 <8.2%><8.2%> 2222 <4.8%><4.8%> 2525 <5.3%><5.3%> 4747 <5.0%><5.0%> --4747 --50.0%50.0% 20 <2.2%>
AsiaAsia 6767 <11.0%><11.0%> 2929 <6.0%><6.0%> 9696 <8.8%><8.8%> 1717 <3.9%><3.9%> 5353 <9.0%><9.0%> 7070 <6.9%><6.9%> --2626 --27.1%27.1% 60 <6.5%>
Eliminations/Eliminations/ CorporateCorporate --2828 --1616 --4444 --2828 --3131 --5959 --1515 -- -60
32
(Supplementary Material) Forecast by Geographical Segment(Supplementary Material) Forecast by Geographical Segment
((¥¥100 Million100 Million)) 09/309/3 10/310/3
1st half1st half<<ActualActual>>
2nd half2nd half<<ActualActual>>
Full yearFull year<<ActualActual>>
1st half1st half<<ActualActual>>
2nd half2nd half<<Revised Forecast>Revised Forecast>
Full yearFull year<<Revised Forecast>Revised Forecast>
Increase/decrease
YOY
Difference Difference YOYYOY
Full year<original forecast>
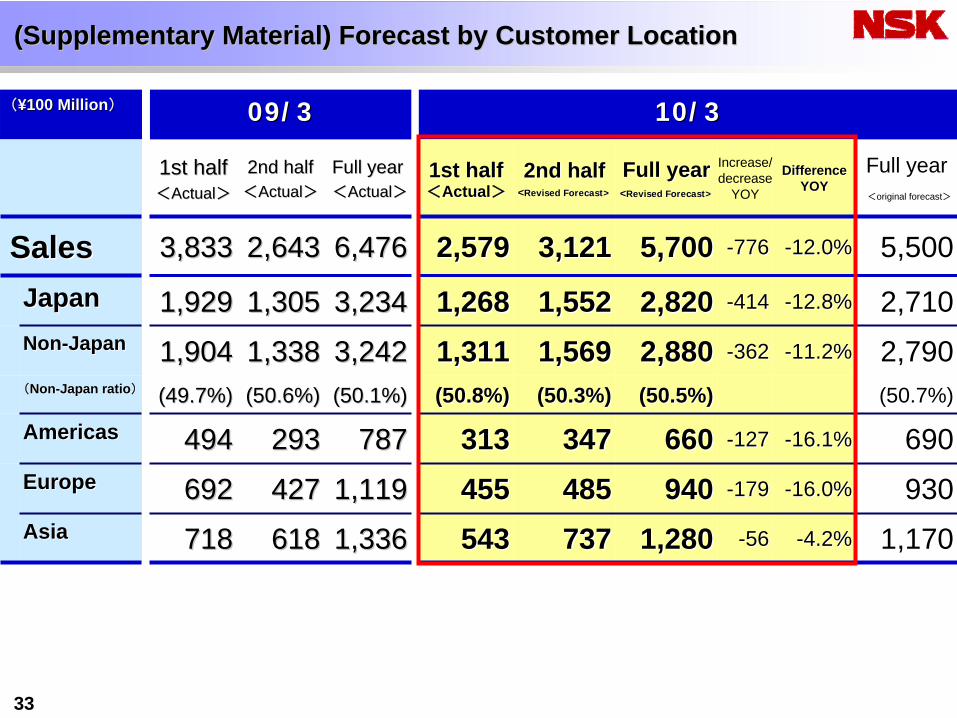
SalesSales 3,8333,833 2,6432,643 6,4766,476 2,5792,579 3,1213,121 5,7005,700 --776776 --12.0%12.0% 5,500
JapanJapan 1,9291,929 1,3051,305 3,2343,234 1,2681,268 1,5521,552 2,8202,820 --414414 --12.8%12.8% 2,710NonNon--JapanJapan 1,9041,904 1,3381,338 3,2423,242 1,3111,311 1,5691,569 2,8802,880 --362362 --11.2%11.2% 2,790((NonNon--Japan ratioJapan ratio)) (49.7%)(49.7%) (50.6%)(50.6%) (50.1%)(50.1%) (50.8%)(50.8%) (50.3%)(50.3%) (50.5%)(50.5%) (50.7%)
AmericasAmericas 494494 293293 787787 313313 347347 660660 --127127 --16.1%16.1% 690EuropeEurope 692692 427427 1,1191,119 455455 485485 940940 --179179 --16.0%16.0% 930AsiaAsia 718718 618618 1,3361,336 543543 737737 1,2801,280 --5656 --4.2%4.2% 1,170
33
(Supplementary Material) Forecast by Customer Location(Supplementary Material) Forecast by Customer Location
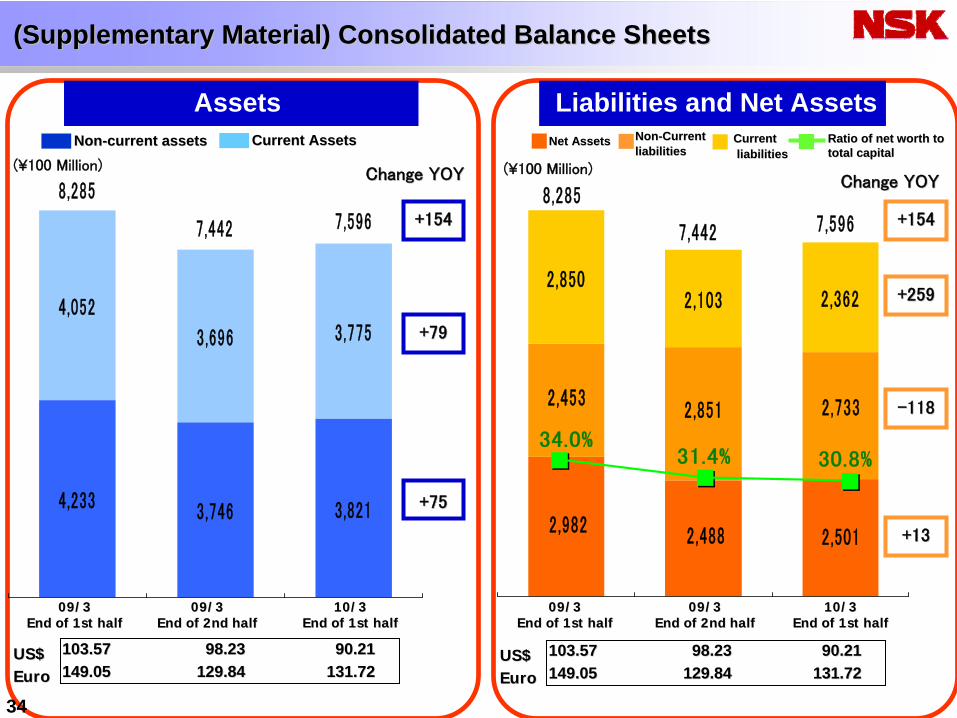
3,746 3,821
4,052
3,696 3,775
4,233
8,285
7,5967,442
2,8502,103 2,362
2,5012,982 2,488
2,7332,8512,453
8,2857,5967,442
30.8%31.4%34.0%
(Supplementary Material) Consolidated Balance Sheets(Supplementary Material) Consolidated Balance Sheets
34
+79+79
+75+75
+259+259
--118118
+13+13
+154+154 +154+154
103.57 103.57 98.2398.23 90.2190.21149.05149.05 129.84129.84 131.72131.72
Liabilities and Net AssetsAssets
Change YOYChange YOY Change YOYChange YOY
NonNon--current assetscurrent assets Current AssetsCurrent Assets Net AssetsNet Assets NonNon--Current Current liabilitiesliabilities
CurrentCurrentliabilitiesliabilities
Ratio of net worth to Ratio of net worth to total capitaltotal capital
(¥100 Million) (¥100 Million)
09/3 09/3 End of 1st halfEnd of 1st half
09/3 09/3 End of 2nd halfEnd of 2nd half
10/3 10/3 End of 1st halfEnd of 1st half
09/3 09/3 End of 1st halfEnd of 1st half
09/3 09/3 End of 2nd halfEnd of 2nd half
10/3 10/3 End of 1st halfEnd of 1st half
US$US$EuroEuro
103.57 103.57 98.2398.23 90.2190.21149.05149.05 129.84129.84 131.72131.72
US$US$EuroEuro
棚卸資産
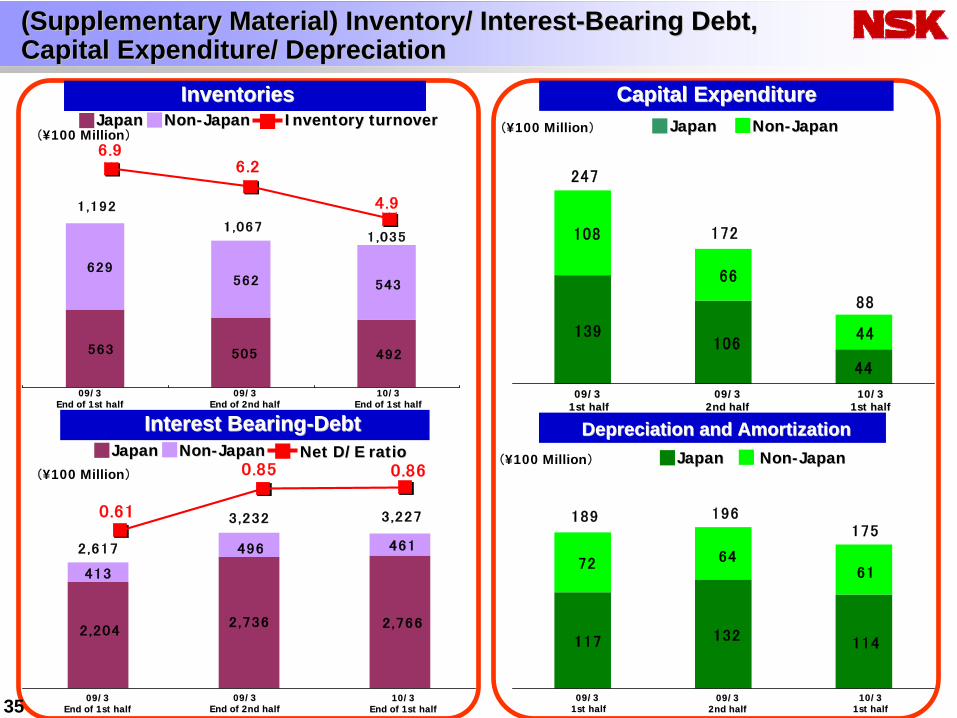
492505563
543562629
1,0351,067
1,192
6.96.2
4.9
2,7662,7362,204
461496
413
3,2273,232
2,617
0.61
0.85 0.86
44
106139 44
66
108
88
172
247
設備投資
114132117
616472
175196189
InventoriesInventories Capital ExpenditureCapital Expenditure
Depreciation and AmortizationDepreciation and Amortization
35
09/3 09/3 End of 1st halfEnd of 1st half
09/3 09/3 End of 2nd halfEnd of 2nd half
10/3 10/3 End of 1st halfEnd of 1st half
09/3 09/3 End of 1st halfEnd of 1st half
09/3 09/3 End of 2nd halfEnd of 2nd half
10/3 10/3 End of 1st halfEnd of 1st half
09/3 09/3 1st half1st half
09/3 09/3 2nd half2nd half
10/3 10/3 1st half1st half
09/3 09/3 1st half1st half
09/3 09/3 2nd half2nd half
10/3 10/3 1st half1st half
Interest BearingInterest Bearing--DebtDebt
(¥100 Million)(¥100 Million)
(¥100 Million)(¥100 Million)
JapanJapan NonNon--JapanJapan Inventory turnoverInventory turnover JapanJapan NonNon--JapanJapan
NonNon--JapanJapanJapanJapan Net D/E ratioNet D/E ratio NonNon--JapanJapanJapanJapan
(Supplementary Material) Inventory/ Interest(Supplementary Material) Inventory/ Interest--Bearing Debt, Bearing Debt, Capital Expenditure/ DepreciationCapital Expenditure/ Depreciation
36
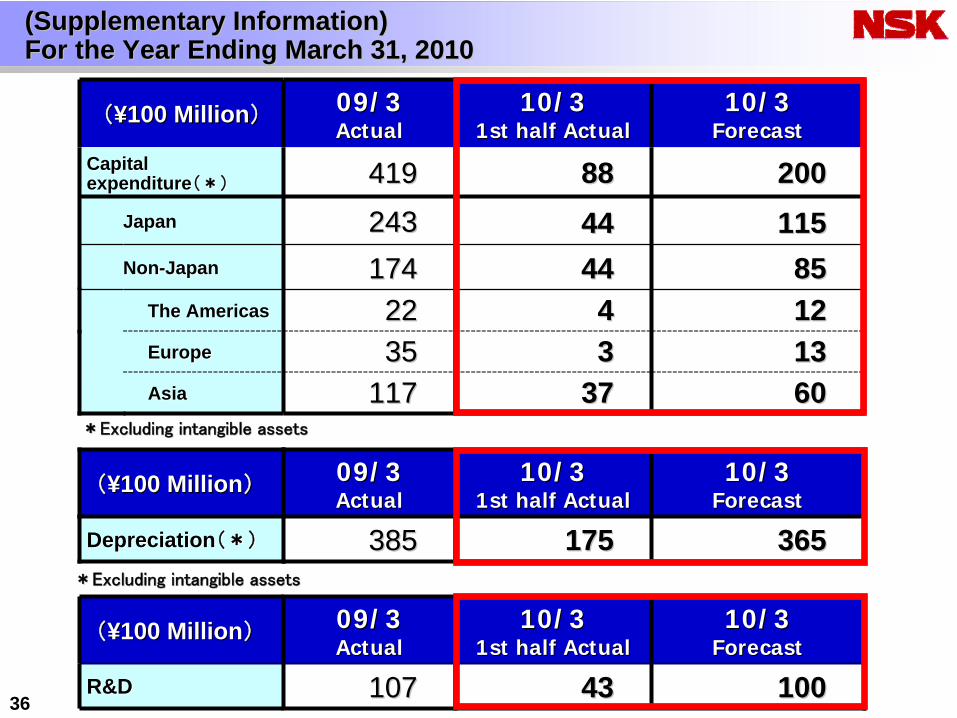
((¥¥100 Million100 Million)) 09/309/3ActualActual
10/310/31st half Actual1st half Actual
10/310/3ForecastForecast
CapitalCapitalexpenditureexpenditure(*)(*) 419419 8888 200200
JapanJapan 243243 4444 115115NonNon--JapanJapan 174174 4444 8585
The AmericasThe Americas 2222 44 1212EuropeEurope 3535 33 1313AsiaAsia 117117 3737 6060
((¥¥100 Million100 Million)) 09/309/3ActualActual
10/310/31st half Actual1st half Actual
10/310/3ForecastForecast
DepreciationDepreciation(*)(*) 385385 175175 365365
((¥¥100 Million100 Million)) 09/309/3ActualActual
10/310/31st half Actual1st half Actual
10/310/3ForecastForecast
R&DR&D 107107 4343 100100
(Supplementary Information)(Supplementary Information) For the Year Ending March 31, 20For the Year Ending March 31, 201010
**Excluding intangible assetsExcluding intangible assets
**Excluding intangible assetsExcluding intangible assets
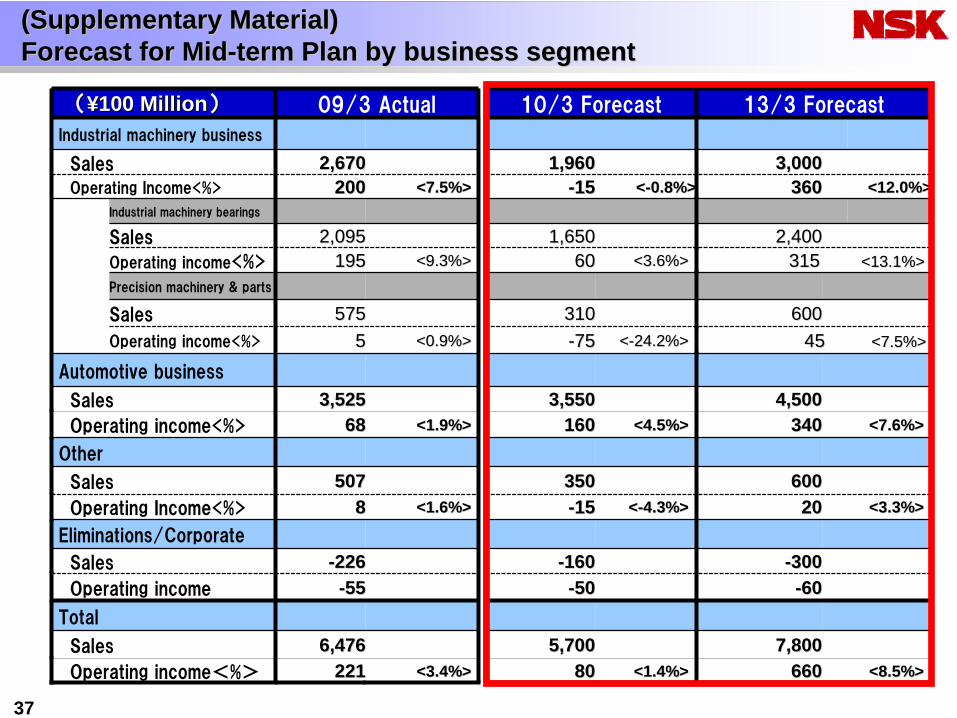
(Supplementary Material)(Supplementary Material) Forecast for MidForecast for Mid--term Plan by business segment term Plan by business segment
37
((¥¥100 Million100 Million)) 09/3 Actual 10/3 Forecast 13/3 Forecast
Industrial machinery business
Sales 2,6702,670 1,9601,960 3,0003,000Operating Income<%> 200200 <7.5%><7.5%> --1515 <<--0.8%>0.8%> 360360 <12.0%><12.0%>
Industrial machinery bearings
Sales 2,0952,095 1,6501,650 2,4002,400Operating income<%> 195195 <9.3%><9.3%> 6060 <3.6%><3.6%> 315 315 <13.1%><13.1%>Precision machinery & parts
Sales 575575 310310 600600Operating income<%> 55 <0.9%><0.9%> --7575 <<--24.2%>24.2%> 45 45 <7.5%><7.5%>
Automotive business
Sales 3,5253,525 3,5503,550 4,5004,500Operating income<%> 6868 <1.9%><1.9%> 160160 <4.5%><4.5%> 340340 <7.6%><7.6%>
Other
Sales 507507 350350 600600Operating Income<%> 88 <1.6%><1.6%> --1515 <<--4.3%>4.3%> 2020 <3.3%><3.3%>
Eliminations/Corporate
Sales --226226 --160160 --300300Operating income --5555 --5050 --6060
Total
Sales 6,4766,476 5,7005,700 7,8007,800Operating income<%> 221221 <3.4%><3.4%> 8080 <1.4%><1.4%> 660660 <8.5%><8.5%>