financial condition and financial reporting of the
TRANSCRIPT

Philippine Management Review 2017, Vol. 24, 17-32.
Financial Condition and Financial Reporting of the Philippine Health Insurance Corporation
Dani Rose Cresencia C. Salazar*
University of the Philippines, Cesar E.A. Virata School of Business, Diliman, Quezon City 1101, Philippines
1 Introduction As of December 31, 2015, 93.45 million Filipinos were covered beneficiaries of the National Health
Insurance Program (NHIP) administered by the Philippine Health Insurance Corporation (PHIC). Coverage was estimated at 92% of the Philippine population1. The number of beneficiaries, composed of the registered members and their qualified dependents, grew at a compounded annual growth rate (CAGR) of 5% per annum from 2007 to 2015 (Figure 1). Moreover, while the beneficiaries of the paying category had been decreasing at CAGR of 4%, those of the nonpaying category had risen significantly at 19% CAGR. Figure 1. Number of Beneficiaries (In Millions), 2007 – 2015
Source: Author’s calculations based on data from PhilHealth Statistics and Charts 2007 – 2015
The number of registered members reached 40.5 million (Figure 2) in 2015. The membership in
PHIC is classified into six sectors, namely the employed members in the formal economy, members in the informal economy, indigents, sponsored, senior citizens, and lifetime members. Pantig (2013) broadly categorized these sectors into “Paying” and “Nonpaying”. Prior to 2014, the paying category, composed of the members in the formal and informal economy, was greater than the nonpaying category (Figure 2). At its peak, the paying members were 80% of total PHIC membership. This changed in 2014 when the nonpaying category overtook the paying category at 55% of total membership. The category “Non-paying” refers to those members who do not pay their own premiums. Rather, premium contributions of indigents, sponsored, and senior citizens are shouldered by the government and various private institutions. Also clustered in the nonpaying category are lifetime members who, upon reaching the age of retirement, are not charged premium contributions while continuing to receive benefits from PHIC.
* Correspondence: Tel: +63 2 928 4571; Fax: +63 2 929 7991. Email: [email protected] 1 2015 Stats and Charts. www.philhealth.gov.ph

18 Financial Condition and Financial Reporting of the Philippine Health Insurance Corporation
Figure 2. Distribution of PHIC Membership by Sector (% of total membership), 2007 and 2015
Source: Author’s calculations based on data from PhilHealth Statistics and Charts 2007 – 2015.
From 2007 to 2015, the number of registered members expanded at a rate of 12%. This was fueled
by the 29% growth in the nonpaying category that resulted from the aggressive government campaign to enroll poor families listed in the National Household Targeting System (NHTS) and the inclusion of senior citizens in the NHIP beginning in 2014 (Figure 3). Figure 3. Number of Registered Members (In Millions), 2007 - 2015
Source: Author’s calculations based on data from PhilHealth Statistics and Charts 2007 – 2015.
The number of benefit claims also increased significantly from the years 2009 to 2015 at a rate of
16% annually (Table 1). The 33% CAGR increase in benefit claims of the nonpaying category is mirrored by the large growth in registered members from these sectors. Table 1. Number of Benefit Claims per Category (in ₱ Thousands), 2009 – 2015
Source: Author’s calculations based on data from PhilHealth Statistics and Charts 2009 – 2015 and PhilHealth Annual Report 2009-2015.

Dani Rose Cresencia C. Salazar 19
PHIC is the government owned and controlled corporation (GOCC) that was mandated to provide universal health care financing to Filipinos. It collects insurance premium from its members, the national government, local government units (LGU) and various private sponsors. In turn, it pays benefits for medical treatments of its beneficiaries. It is, therefore, important for PHIC to remain financially healthy in order to assure the general public of the corporation’s ability to pay for its members’ health care benefits. In this regard, this paper aims to address the following objectives: (1) to assess the financial condition of PHIC amidst upsurge in membership, increasing claims and rising cost of medical treatments using publicly available financial statement data, and (2) to determine whether PHIC’s financial reporting practices comply with the Philippine Financial Reporting Standards (PFRS).
The rest of the paper is organized as follows: Section 2 introduces a review of literature and highlights the significance of the study. Section 3 gives a background of the PHIC including its mandate and administration. Section 4 describes the financial reporting practices of PHIC, and reports the assessment of the compliance of these practices with PFRS. Section 5 evaluates the financial condition of the PHIC using financial statement data. Section 6 concludes.
2 Review of Related Literature
Hsiao and Shaw (2007) described Social Health Insurance (SHI) as a financing approach for mobilizing funds and pooling risks. The insured pay a designated premium and receive a set of benefits. The compulsory premium is usually assessed as a percentage of workers’ salaries. SHI is a financing instrument that can reduce financial barriers for people to access health care. It pools low- and high-risk people, avoids adverse selection and people’s failure to address risks, and allows enrollees to contribute based on their ability to pay. The nature of the financial operations of SHI requires the system to be transparent and accountable in terms of how much people pay and what they are paying for. Savedoff (2005) refers to SHI governance as the structure and processes of the control mechanisms used to hold the SHI agency accountable to beneficiaries and funders of the scheme.
In the case of the Philippines, the mandated SHI agency is PHIC. Its functions include enrollment of people, collection of premiums, and payment of claims. Hsiao and Shaw (2007) noted that PHIC’s fee schedule, on average, only covers for 30% to 40% of hospital bills which leaves the remainder of health care costs for the personal account of the patients. Gertler and Solon (2002) found that 86% of the increased funding for health from PHIC went to health care providers as profits or higher salaries.
A case study on PHIC (Jowett & Hsiao, 2007) revealed those in regular employment subsidized the less well-off. An increasing trend in the membership in the non-paying category such as senior citizen groups was also observed. Moreover, the average claim value by indigent members is also increasing rapidly. The study concludes that at the current level of premiums and the underpayment of contributions by other government departments, the National Health Insurance Scheme (NHIP) is not sustainable in the medium to long term.
3 History and Mandate of PHIC
The PHIC was created by the National Health Insurance Act of 1995 (Republic Act No. 7875). This act, as amended in 2013 by RA 9241 and RA 10606, instituted a National Health Insurance Program (NHIP) that aims to provide comprehensive health care services to all Filipinos through a socialized health insurance program that will prioritize the health care needs of the underprivileged, sick, elderly, persons with disabilities, women and children and provide free health care services to indigents. PHIC is attached to the Department of Health (DOH) for policy coordination and guidance.
PHIC is a state owned entity more commonly referred to in the Philippines as government owned and controlled corporations (GOCC). These refer to majority owned-corporations of the Republic of the Philippines or government instrumentalities with corporate powers and vested functions relating to public needs. The eleven-member Board of Directors of PHIC is composed of ex-officio government officials and appointees of the President of the Philippines. The Secretary of the Department of Health is the Chairman of the Board of PHIC. The other members are the President of the Corporation, the

20 Financial Condition and Financial Reporting of the Philippine Health Insurance Corporation
Secretary of the Department of Labor and Employment, the Secretary of the Department of Interior and Local Government, the Secretary of the Department of Social Welfare and Development, a representative of the labor sector, a representative of employers, the Social Security System (SSS) Administrator, the Government Service Insurance System (GSIS) General Manager, a representative of the Self-employed Sector, and a representative of health care providers.
PHIC members are grouped into six sectors, namely, members in the formal economy, members in the informal economy, indigents, sponsored, senior citizens, and lifetime members. The members in the formal economy is composed of workers employed by private companies and the government, owners of micro, small and medium enterprises, household help, and family drivers. Insurance premium, which may reach 3% of monthly compensation, are shared by the members and their employers. The premium contribution of the employed sector is capped at ₱10,500 annually for those with monthly salary of ₱35,000 and above. The members in the informal sector include self-earning individuals and migrant workers. Annual premiums that ranged from ₱2,400 to ₱3,600, based on monthly average income, are paid quarterly, semi-annually or annually. Indigents, members who have no means of support, are identified through the NHTS database of the Department of Social Welfare and Development (DSWD). Sponsored members are those members whose insurance premiums are paid for by sponsoring Local Government Units (LGUs) or private institutions. Senior citizens were mandatorily included in the NHIP through Republic Act 10645. Annual premium of ₱2,400 (₱1,200 prior to December 31, 2013) of indigents, sponsored, and senior citizen members are fully subsidized by the national and local governments and private sponsors. In the case of senior citizens, funding is specifically sourced from the proceeds of excise taxes on alcohol and tobacco as provided by Republic Act 10351. The last sector, the lifetime members, are composed of retirees who have already paid premiums for 120 months of membership during their working lives. These members, from age of retirement until death, continue to receive benefits from PHIC without corresponding premium contributions. Ideally, the premiums of lifetime members should be financed by earnings from investments of unused contributions during their working years.
PHIC medical benefits are the same for all members such as inpatient care, catastrophic coverage, ambulatory surgeries, deliveries, and outpatient treatment for malaria and tuberculosis. Those identified as indigent and OFW are also entitled to outpatient primary care through public providers. Members have free choice of health care providers, both public and private. Providers are allowed to charge the patient the difference between the total cost of care and what PHIC pays (i.e., balance billing). PHIC also instituted programs that are exclusive for indigents and sponsored members such as No Balance Billing (NBB) which provides that no other fees or expenses shall be charged or be paid for by the indigent member2.
4 Financial Reporting Practices of PHIC
4.1 Criteria for Evaluation As disclosed by the PHIC in Note 2.1 (Notes to financial statements), its financial statements were
prepared in accordance with Philippine Financial Reporting Standards (PFRS) beginning in 2015. PFRS is consistent with International Financial Reporting Standards (IFRS). Prior to 2015, the financial statements were prepared based on a combination of PFRS and government accounting principles.
The financial reporting practices of PHIC will be evaluated as to the fair presentation of its financial statements. According to Philippine Accounting Standard (PAS) 1 Presentation of Financial Statements, fair presentation requires faithful representation of the effects of transactions, other events and conditions in accordance with the definitions and recognition criteria for assets, liabilities, income and expenses. The application of PFRSs, with additional disclosure when necessary, is presumed to result in fair representation of financial statements.
Accordingly, the quality of the financial reporting practices of the PHIC depends on its compliance with relevant PFRS. We evaluated the financial reporting practices of the PHIC using both audited financial statements and the notes to the financial statements. Only the latest set of financial
2 PhilHealth Circular 3 series of 2014.

Dani Rose Cresencia C. Salazar 21
statements (i.e., 2015) was reviewed as to its compliance with accounting standards. The review focused on accounting standards that affect the reporting of a large number of PHIC activities.
From the common-size balance sheet in Table 2, 81% of total assets as of December 31, 2015 are financial assets composed of premium receivables, available for sale investments and held to maturity investments. These assets are covered by PAS 39 Financial Instruments: Recognition and Measurement, and PFRS 7 Financial Instruments Disclosures.
On the liabilities side, benefit claims payable is 15% of total assets as of December 31, 2015 (Table 2). This represents PHIC’s recognition of its obligation in the performance of its mandate as a provider of universal health insurance financing. Because the commitment of participants to contribute to PHIC is not established by a contract but rather by statute of law, PHIC’s obligations do not meet the definition of insurance contract in PFRS 7. Rather, its benefit obligations as regards settling benefit claims are within the scope of PAS 37 Provisions, Contingent Liabilities and Contingent Assets3. Table 2: Balance Sheet as of December 31, 2015
ASSETS In ₱ billions
Cash 25.60 16%
Premium Receivables 20.27 13%
Other Current Assets 1.69 1%
Available for Sale Investments 0.96 1%
Held to Maturity Investments 106.72 67%
Property & Equipment - Net 1.78 1%
Intangible Assets – Net 0.15 0%
Other Assets – Net 1.60 1%
TOTAL ASSETS 158.77 100%
LIABILITIES AND EQUITY Liabilities Current Liabilities Benefit Claims Payables 24.19 15%
Other Payables 1.44 1%
Other Deferred Credits 1.25 1%
Total Liabilities 26.88 17%
Equity Members' Equity 131.89 83%
TOTAL LIABILITIES AND EQUITY 158.77 100%
Source: Author’s calculations based on data from PhilHealth 2015 Audited Financial Statements.
4.2 Evaluation of financial reporting practices The review and evaluation of the presentation and valuation of financial statement elements and
the disclosure in the accompanying notes revealed an understatement of reported liabilities, inadequate disclosures on the relevant risks regarding financial instruments, and misclassification of deposit accounts.
PAS 37 requires that a liability, referred to as a provision, should be recognized when the following requirements are met: (1) the entity has a present obligation as a result of a past event; (2) it is probable that the company’s resources will be used for settlement; and (3) a reliable estimate can be made of the amount of the obligation. The recognition of a provision results in a decrease in net worth
3 PFRS 4 Insurance Contract, IG 2 (1.14)

22 Financial Condition and Financial Reporting of the Philippine Health Insurance Corporation
(expense), unless otherwise it meets the requirement for asset capitalization, as well as a corresponding increase in liability.
Members in the formal and informal economy, according to PHIC’s policy, must have paid at least three months’ premium contributions within the immediate six-month period prior to the first day of confinement in order to avail themselves of their benefits from PHIC4. Assuming confinement day is always on the first day of the month to simplify the example, this policy means that benefit claims on January is attributed to premium contributions made in any three months from July to December of the prior year. Benefit claims on February is attributed to premium contributions made in any three months from August to December of the previous year and January of the current year, and so on. PAS 37 requires that PHIC records a liability provision on the same year that the corresponding premium contributions are received. PHIC’s current policy5 on estimating accrued benefit expense excludes this provision and is therefore not fully compliant with PAS 37.
Using the data from the audited financial statements for a simple computation, unrecorded liability is estimated at ₱16.2 billion and ₱12.9 billion as of December 31, 2015 and 2014, respectively. This is based on the following assumptions: (1) premium contribution and benefit claims are made evenly during the year; (2) monthly benefit claims is attributable to premium contribution made in the immediate prior three months; and (3) confinement day is on the first day of the month. These estimates imply that liability as of 2015 and 2014 are understated by about 60%. Moreover, the adjustment for the provision will result in a net income of ₱0.6 billion (from net income of ₱3.9 billion) and will bring down PHIC’s capital to ₱115.7 billion. This will worsen the company’s debt ratio from 17% to 27%.
As regards financial assets, review of the notes to financial statements indicated that PHIC’s valuation policies are consistent with PAS 39, which is a function of the classification of financial asset. PHIC classifies financial assets into fair value through profit or loss, available for sale investments, held to maturity investments, and loans and receivable. However, a closer inspection of PHIC’s notes to financial statements revealed that it did not satisfy the disclosure requirements of PFRS 7 Financial Instruments: Disclosures. The PHIC’s disclosures can be improved by the inclusion of qualitative and quantitative information about exposure to risks arising from financial instruments, including specified minimum disclosures about credit risk, liquidity risk and market risk as required in PFRS 7. The maturity profile of its financial assets is a required disclosure that was not presented in the notes to financial statements.
Further review of the notes to financial statements uncovered ₱23.5 billion of the reported 2015 Cash6 balance pertains to special savings deposits with maturities of one day to one year which do not fully meet the definition of cash in PAS 77. This means that cash is overstated by 92% of the reported amount. While term deposits with maturities of three months or less from date of acquisition are reportable as cash equivalents, those with maturities beyond three months should be classified as loans and receivable based on PAS 39. However, it is impossible to make such determinations because PHIC did not disclose the maturity profile of its outstanding financial instruments as required by PFRS 7. In the extreme case that the maturities of these term deposits are all beyond three months, PHIC’s quick ratio and cash ratio will drop from 1.79 to 0.87 and 1.00 to 0.08, respectively. The cash ratio is a conservative metric of the company’s liquidity which measures funds that a company can access immediately for emergency needs.
5 Financial Condition of PHIC
5.1 Financial highlights The profitability ratios were observed to be on a downward trend (Panel A - Table 3). Curiously,
gross profit margin were consistently less than net profit margin, which implies that other income was providing additional push to bring up net income. Profitability ratios recovered in 2014, which was an exceptional year, but took a slump again in 2015.
4 PhilHealth Circular 32, series of 2014. 5 Note 13, 2015 PHIC Audited Financial Statements 6 Note 5.5, 2015 PHIC Audited Financial Statements 7 Philippine Accounting Standards 7 paragraph 7.
Dani Rose Cresencia C. Salazar 23
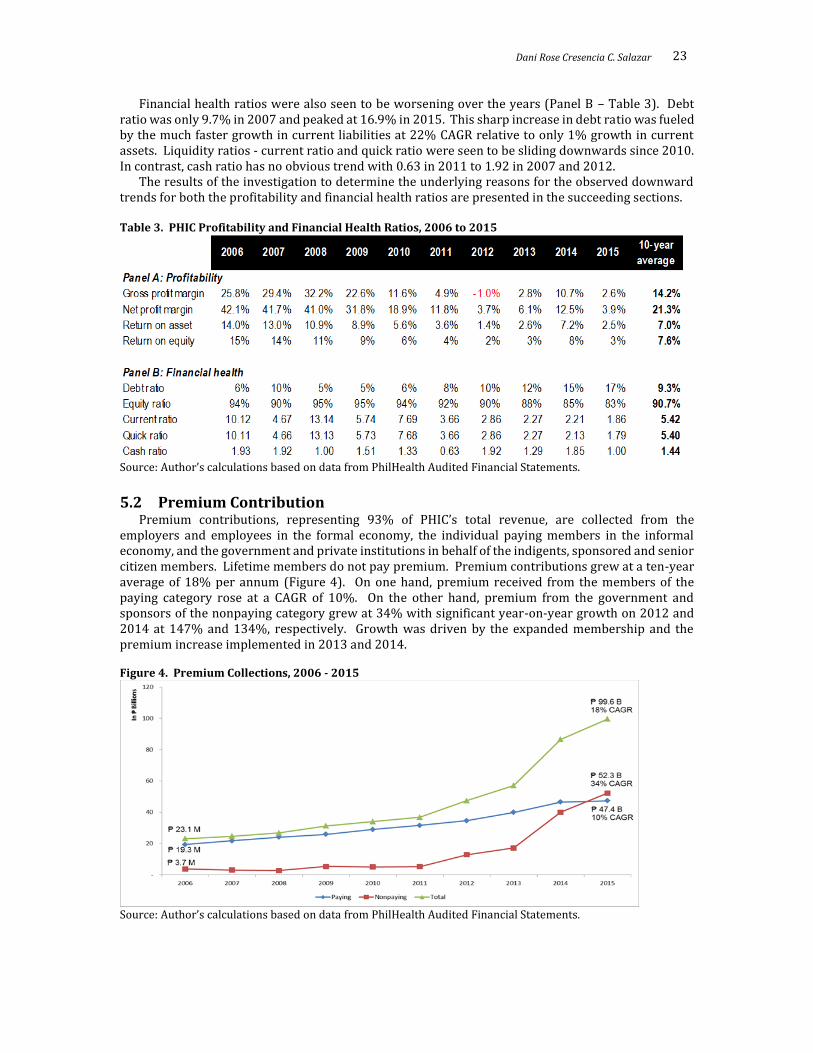
Financial health ratios were also seen to be worsening over the years (Panel B – Table 3). Debt ratio was only 9.7% in 2007 and peaked at 16.9% in 2015. This sharp increase in debt ratio was fueled by the much faster growth in current liabilities at 22% CAGR relative to only 1% growth in current assets. Liquidity ratios - current ratio and quick ratio were seen to be sliding downwards since 2010. In contrast, cash ratio has no obvious trend with 0.63 in 2011 to 1.92 in 2007 and 2012.
The results of the investigation to determine the underlying reasons for the observed downward trends for both the profitability and financial health ratios are presented in the succeeding sections. Table 3. PHIC Profitability and Financial Health Ratios, 2006 to 2015
Source: Author’s calculations based on data from PhilHealth Audited Financial Statements.
5.2 Premium Contribution Premium contributions, representing 93% of PHIC’s total revenue, are collected from the
employers and employees in the formal economy, the individual paying members in the informal economy, and the government and private institutions in behalf of the indigents, sponsored and senior citizen members. Lifetime members do not pay premium. Premium contributions grew at a ten-year average of 18% per annum (Figure 4). On one hand, premium received from the members of the paying category rose at a CAGR of 10%. On the other hand, premium from the government and sponsors of the nonpaying category grew at 34% with significant year-on-year growth on 2012 and 2014 at 147% and 134%, respectively. Growth was driven by the expanded membership and the premium increase implemented in 2013 and 2014. Figure 4. Premium Collections, 2006 - 2015
Source: Author’s calculations based on data from PhilHealth Audited Financial Statements.

24 Financial Condition and Financial Reporting of the Philippine Health Insurance Corporation
Premium contributions are largely from the members in the paying category (Figure 5). However, collections from the government and private institutions became the largest source of premium in 2015. Figure 5. Distribution of Premium Income (% of Premium Income), 2006 - 2015
Source: Author’s calculations based on data from PhilHealth Audited Financial Statements.
Average contribution per registered member (ACRM) provided partial explanation to the
movement of premium contribution. Revealed in Table 4 are the low ACRMs of the members in the informal economy as well as the indigents and sponsored members. In the case of the members in the informal economy, this is peculiar because the computed ACRMs were below the minimum premium contribution of ₱1,200 (prior to 2013) and ₱2,400 (2013 onwards). A plausible explanation is an overstated list of registered members which may include members who are inactive or delinquent in their premium contributions. In this case, it is necessary for PHIC to clean up and update its database of registered members, specifically for that of the informal economy.
Another observation from Table 4 is the volatile contribution payments from the sponsors of the indigents and sponsored members. Prior to 2012, the sponsors (i.e. government and private institutions) did not pay the full annual premium due of ₱1,200 for each of their sponsored members. This is evident from the ACRMs that ranged from ₱1,096 in 2007 to ₱542 in 2012, all of which are below the annual premium due. A full turn-around occurred in 2012 when sponsors paid the premium commitments for its sponsored members in full, including the premium adjustments in 2014.
Table 4. Average Contribution (₱) per Registered Member, 2007 to 2015
Source: Author’s calculations based on data from PhilHealth Audited Financial Statements and PhilHealth Statistics and Charts 2007-2015.
5.3 Benefit claims The peso value of benefit claims had reached ₱97.03 billion in 2015 from only ₱17.10 billion in
2006, representing a CAGR of 21% (Figure 6). Benefit claims of members in the nonpaying category grew by 37% to ₱51.91 billion in 2015. This mirrored the 33% rise in the number of benefit claims of

Dani Rose Cresencia C. Salazar 25
the nonpaying members (Table 1). Moreover, 53% of benefit claims in 2015 is attributable to nonpaying members (Figure 7). Figure 6. Benefit Claims Expense, 2006 - 2015
Source: Author’s calculations based on data from PhilHealth Audited Financial Statements.
Figure 7. Distribution of Benefit Claims (% of Total Benefit Claims Expense), 2006 - 2015
Source: Author’s calculations based on data from PhilHealth Audited Financial Statements.
The average value per claim (AVPC), computed as the ratio of benefit claims expense to number of claims, ranged from ₱7,180 to ₱11,570 in 2009 and 2015, respectively (Table 5). This translates to a compounded annual growth rate of 8.3%. The AVPC of the paying sector on 2015 is ₱10,745, 15% lower than the nonpaying AVPC of ₱12,398. The higher AVPC and number of claims of the nonpaying sector can be the result of the programs implemented by PHIC targeted to the indigents and sponsored members such as NBB. Table 5. Average Value (₱) per Claim, by Category, 2009 – 2015
Source: Author’s calculations based on data from PhilHealth Audited Financial Statements.

26 Financial Condition and Financial Reporting of the Philippine Health Insurance Corporation
5.4 Utilization Over the ten year period (2006 to 2015), it was observed that premium contributions generally
exceeded benefit claims (Table 6). It was only in 2012 when a ₱0.5 billion deficiency occurred. On a closer inspection, it was observed that the nonpaying category exhibited negative net contributions except in the years 2006, 2014 and 2015. Therefore, the positive net contribution posted by PHIC means that the members in the paying category were able to fund their own benefit claims as well as cover the deficiencies of the nonpaying category. This observation on cross-subsidizing is consistent with the findings of Jowett and Hsiao (2007). Table 6. Net Contribution = Premium Contribution - Benefit Claims (In ₱ billions), by Category, 2006-2015.
Source: Author’s calculations based on data from PhilHealth Audited Financial Statements.
The paying category is composed of the members in the formal and informal economy. Analysis of
the paying category (Table 7) revealed that the members in the formal economy consistently have a positive net contribution. In contrast, the members in the informal economy had a negative net contribution in all the years covered in the study. Table 7. Net contribution of Paying Category (In ₱ billions), 2006 – 2015.
Source: Author’s calculations based on data from PhilHealth Audited Financial Statements.
Analysis of the nonpaying category in Table 8 is necessary in order to determine whether the subsidy for the non-paying sector is sufficient. It was observed that there are years when subsidies for the indigents and sponsored were not sufficient (2007, 2010, 2011 and 2013). Specifically, deficiencies mostly occurred during the years when the government did not pay the full premium dues for each sponsored member. On the other hand, the data provided by PHIC aggregates the benefit claims of the senior citizens and lifetime members. While senior citizen premium contributions are subsidized by proceeds of sin taxes, there is no contribution for premiums of lifetime members. It is, therefore, difficult to determine whether the government subsidies for senior citizens are sufficient to cover their benefit claims because their benefits are combined with the lifetime members. Table 8. Net contribution of Nonpaying Category (In ₱ billions), 2006 – 2015
Source: Author’s calculations based on data from PhilHealth Audited Financial Statements.
Medical cost ratio (MCR) is also known as medical loss ratio or benefit cost ratio. It is a common metric used in the health insurance industry that measures the benefit claims as a percentage of premiums, similar to a cost (of goods sold) ratio for a manufacturing company. This implies the proportion of the premium contributions used to pay out claims. For 2015, MCR is 97.4% (Table 9). The MCR of the members in the informal economy is consistently beyond 100%. More specifically, the 2015 benefit claims of the members in the informal economy used up almost three times its premium contributions. In contrast, the indigents and sponsored members had MCRs that ranged from 65% to 143%. MCR is computed for senior citizens and lifetime members only for the years 2014 and 2015 when PHIC commenced collection of premium for senior citizens from excise tax.

Dani Rose Cresencia C. Salazar 27
Table 9. Medical Cost Ratio (%), 2006 – 2015
Source: Author’s calculations based on data from PhilHealth Audited Financial Statements.
Members’ utilization of benefits is analyzed in Table 10. Assuming members do not make more
than one claim each year, utilization is estimated by getting the ratio of the claims to the number of registered members. Table 10 shows that on average, only 17% of PHIC members utilized their PHIC benefits. The utilization of the members in the formal economy ranged from 16% to 21% with an average of 19%. At this utilization rate, the net contribution (Table 7) of the formal economy was always positive. In contrast, the utilization rates of the indigents and sponsored members are lower at a range of 9% to 17% with a seven-year average of 12%. It is worth noting that despite this low utilization rate, the net contribution (Table 8) of the indigents and sponsored members was already volatile resulting from the uncertainty of premium collection from the sponsors which for some periods did not pay the full contributions of their sponsored members. The informal economy had higher utilization at 13% to 57% with an average of 27%. The lifetime and senior citizens sectors understandably have the highest utilization of 42%. Table 10. Members’ Utilization (Number of claims as a percentage (%) of registered members), 2009-2015.
Source: Author’s calculations based on data from PhilHealth Statistics and Charts 2009-2015.
The compounded annual growth rates of premium contributions and benefit claims were
compared side by side in Table 11. Total benefit claims grew 21% per annum, which exceeded the 18% increase in premium contributions. Except in the case of the members in the formal economy, benefit claims grew at a faster rate than premium contributions in other sectors.
The growth rate of contributions for senior citizens and lifetime members was not considered in the analysis for two reasons. The benefits of lifetime members have no corresponding revenue source because they do not pay premium. Therefore, contributions are solely for the premiums of senior citizens which began only in 2014. It is not appropriate to compare the one-year growth in revenue of 516% with the nine-year growth rate in benefit of 54%. Moreover, the one-year (2015-2015) growth rate in benefits of 100% is also not comparable because this include the benefits for both senior citizens and lifetime members. As indicated in previous paragraphs, there were no available data to analyze the benefits of senior citizens separately from those of the lifetime members because PHIC aggregates the benefits of these two sectors in its disclosures. Table 11. Compounded Annual Growth Rate, 2006 – 2015
Contributions Benefit
Formal 10% 8% Informal 18% 31% Indigents and sponsored 30% 32% Senior citizens and lifetime members 54% Total 18% 21%
Source: Author’s calculations based on data from PhilHealth Audited Financial Statements.
2006 2007 2008 2009 2010 2011 2012 2013 2014 201510-year
average
All Categories 74.16 70.59 67.80 77.42 88.41 95.11 101.03 97.21 89.30 97.40 85.84
Formal 68.32 53.20 50.63 58.61 61.11 63.43 68.54 60.12 68.33 61.54 61.38
Informal 122.08 165.77 157.27 209.34 213.44 243.68 314.07 275.33 271.25 296.54 226.88
Indigents and Sponsored Members 72.29 103.53 99.66 75.32 130.97 142.87 91.68 104.38 64.69 83.05 96.84
Senior Citizens and Lifetime Members #DIV/0! #DIV/0! #DIV/0! #DIV/0! #DIV/0! #DIV/0! #DIV/0! #DIV/0! 265.05 148.16 206.61
2009 2010 2011 2012 2013 2014 20157-year
average
All Categories 17 16 14 17 19 18 21 17
Formal 21 18 18 19 19 18 16 19
Informal 14 13 14 17 17 57 57 27
Indigents and Sponsored 9 12 8 11 17 12 17 12
Senior Citizens and Lifetime Members 53 44 52 56 56 10 21 42

28 Financial Condition and Financial Reporting of the Philippine Health Insurance Corporation
5.5 Interest Income The effect of expanding membership and increasing utilization is evident from the 2015 Income
Statement of PHIC (Table 12). From the ₱99.62 billion premium contributions in 2015, ₱97.03 billion was used for benefit claims of members. This translates to MCR of 97%. Net contributions cannot cover the ₱5.76 billion operating expenses that resulted in an operating loss of ₱3.17 billion. Interest income of ₱7.08 billion allowed PHIC to cover the operating loss and report net income of ₱3.90 billion in 2015. Table 12. Statement of Profit or Loss for the year-ended December 31, 2015
₱ billions
Premium Contributions 99.62 100% Benefit Claims Expenses 97.03 97% Net Contributions 2.59 3% Operating Expenses 5.76 6% Operating Income -3.17 -3% Interest and Other Income 7.08 7% Net Income 3.90 4%
Source: Author’s calculations based on data from PhilHealth 2015 Audited Financial Statements.
From 2007 to 2015, PHIC had successfully generated net income despite expanding membership base and utilization. Figure 8 revealed that operating income, computed as net contribution less operating expenses, is consistently much lower than reported net income. Over the years, interest and other income provided the push to bring up net income that allowed PHIC to build its equity and finance benefits of lifetime members. The ten-year average return on investments (ROI) (i.e., cash, short term investments, available for sale investments and held to maturity investments) had been computed at 6.22% per annum (Table 13). ROI had been gradually decreasing to end at 5.23% in 2015. This ROI level may not be sustainable in the long term given the limitations on the allowable investment vehicles (i.e., government securities) and the current level of market interest rates. Figure 8. Net Contribution, Operating Income, Interest Income and Net Income, 2006 to 2015
Source: Author’s CAGR calculations based on data from PhilHealth Audited Financial Statements.

Dani Rose Cresencia C. Salazar 29
Table 13. Return on Investments, 2006- 2015
Sources: Author’s calculations based on data from PhilHealth Audited Financial Statements.
5.6 Results of scenario analysis Scenario analysis was conducted in order to stress test the resilience of PHIC’s net worth to
different variables. In forecasting the income statement, premium contribution revenue was determined as the product of number of registered members and ACRM. Registered member by sector was estimated by applying the Philippine population growth rate of the relevant age groupings (i.e., working age of 20 to 59 and retirement age of 60 to 80+) to the number of registered members of the previous period. The population growth rate was used instead of the historical CAGR of the membership, because the past years were characterized by unsustainable growth as the government endeavored to increase the enrollment in the indigents and sponsored programs as well as the inclusion of the senior citizens in the NHIP. The forecasted membership, if the historical CAGR will be employed, will be greater than the projected Philippine population at the end of the forecast period of 2025. Hence, the population growth rate was used to forecast the increase in registered members per sector. As regards ACRM, it is assumed that members of the informal economy, the government and the various sponsors will pay the full amount of minimum annual contribution due of ₱2,400 per member. The average contribution of the members in the formal economy was forecasted by applying the sector’s historical compounded annual growth rate to the ACRM of the prior period.
Two general scenarios were formed (Table 14) based on the assumptions on utilization rate and operating expense ratio. In Scenario 1, it is assumed that the 2015 utilization rates and operating expense ratio were indicative of PHIC’s long run spending pattern. Alternatively in Scenario 2, the 2015 spending rates were deemed temporary and the long-term historical average utilization rates and operating expense ratio were instead used in forecasting PHIC’s expenses. In both scenarios, the AVPC was anchored on the 2015 costs and escalated based on historical compounded annual growth rates. The scenario analysis revealed that the net worth of PHIC will be depleted in the years 2018 and 2020 for Scenarios 1 and 2, respectively (Table 15). In both cases, deficits were found after equity was fully exhausted revealing unfunded expenses on the final year.
To add dimension to the scenario analysis, Scenario 1.1 and 2.1 (Table 14) utilized the BSP target long-term inflation rate of 3% instead of the historical CAGR per sector (i.e., 2.15% to 10.94%) to forecast benefit claims expense. The lower overall expense levels extended the life of PHIC’s net worth relative to the previous scenarios (Table 15). In Scenario 1.1, PHIC’s equity will be fully exhausted by 2019. On the other hand, forecast for Scenario 2.1 revealed that equity will be depleted by 2023. Deficits were also found after equity was fully exhausted in both scenarios.
The last facet included in the scenario analysis is interest income. The 2015 ROI of 5.23% and the historical ten-year average ROI of 6.22% are not sustainable in the long run because of the limited allowable investment vehicles for PHIC and the current low market interest rates. In Scenarios 1.2 and 2.2, ROI was anchored on the 1-year PDST8-R1 benchmark rate on 29 December 2015 of 3.8301% (Table 14). Equity is forecasted to be fully depleted in 2018 and 2019 in Scenarios 1.2 and 2.2, respectively (Table 15). These scenarios reveal that the effect of interest income to augment income requirements of PHIC decreases as utilization rate and operating expense ratio increases. With the higher expense ratios, forecasted interest income was unable to cover the large deficits in net contributions and operating expense resulting in the need to tap investment asset to provide additional funding. This will further push down interest income for the next period that creates a cycle of rapid erosion of PHIC’s investment base.
8 Philippine Dealing System Treasury (PDST) Referenced Rates. www.pds.com

30 Financial Condition and Financial Reporting of the Philippine Health Insurance Corporation
Table 14. Table of Assumptions of Scenario Analysis
Premium contributions
Number of registered members
Registered members as of 2015 with annual increases based on the following population CAGR9
Formal Ages 20 - 59: 1.99% (2016-2020) and 1.71% (2020-2025) Informal
Indigents and sponsored
Lifetime and senior citizens Ages 60 - 80+: 4.43% (2016-2020) and 4.12% (2020-2025)
Contribution per member
Formal 2015 Average Contribution inflated by 8-Year CAGR of 3.12%
Informal ₱ 2,400 Indigents and sponsored
Senior citizens
Scenario 1 Scenario 2
Benefit claims expense
Claim per member (Utilization Ratio) 2015 Ratio 7-Year Average Ratio
Formal 16.3% 18.5%
Informal 56.6% 26.8%
Indigents and sponsored 16.8% 12.3%
Lifetime and senior citizens 21.0% 41.8%
Average value per claim - Base (in ₱) 2015 Rate 7-Year Average Rate
Formal 11,034 9,555
Informal 10,408 8,319
Indigents and sponsored 9,128 9,821
Lifetime and senior citizens 13,401 9,897
Average value per claim - Growth rate 6-Year CAGR
Formal 6.92%
Informal 9.38%
Indigents and sponsored 2.15%
Lifetime and senior citizens 10.94%
Operating expense ratio (% of total premium contributions) 2015 Rate of 5.79% 10-Year Average Rate of 9.34%
Return on Investments 2015 ROI of 5.23% 10-Year ROI of 6.22%
Scenario 1.1 Scenario 2.1
Average value per claim - Growth rate Actual inflation rate of 1.8% (2016), BSP Inflation target of 3%
(2017-onwards)10
Scenario 1.2 Scenario 2.2
Return on Investments PDST-R1 1 Year Benchmark Rates11 - 3.8301%
9 Population Projection Statistics, Philippine Statistics Authority. www.psa.gov.ph 10 The Inflation Target. www.bsp.gov.ph 11 Philippine Dealing System Treasury (PDST) Referenced Rates. www.pds.com

Dani Rose Cresencia C. Salazar 31
Table 15. Results of Scenario Analysis
Scenario 1 Scenario 2
Calendar year that equity will run out 2018 2020
with deficit (in ₱ billions) of 40.9 69.8
Scenario 1.1 Scenario 2.1
Calendar year that equity will run out 2019 2023
with deficit (in ₱ billions) of 40.7 39.7
Scenario 1.2 Scenario 2.2
Calendar year that equity will run out 2018 2019
with deficit (in ₱ billions) of 51.6 13.6
6 Conclusion
A credible financial statement is a necessary ingredient in order to perform high quality financial analysis (Valderrama, 2016). This study found that the financial statements of PHIC are not fully compliant with generally accepted accounting principles in the Philippines. Its financial statements are not directly comparable with the PFRS-compliant financial statements of other financial institutions without adjustments to provisions, expenses and capital. Given this observation, it is recommended that PHIC should seek to make its financial reporting compliant with PFRS in order to improve PHIC’s reporting transparency and accountability to its stakeholders.
As of 2015, PHIC had reported a healthy balance sheet. Its current ratio stands at 1.9. It has a steady monthly cash flow stream from premium contribution. It has a low debt ratio of 16%. Even after the adjustment for the benefit provision, there remain sufficient current assets to settle its short term obligations and debt ratio remains low at 27%. However, PHIC’s future ability to perform its mandate is threatened by the increasing medical cost ratio, rising utilization, benefit claims that grow at a faster rate than premium contribution and decreasing interest rates on its investments.
Cross-subsidy is part of the nature of social insurance. Over the ten years covered in this study, it was observed that the members in the formal economy sector had subsidized the benefits of the other sectors, specifically the members in the informal economy, and lifetime members. On the other hand, the indigents and sponsored members are sometimes the receiver of the subsidy (negative net contributions) while giver of the subsidy (positive net contribution) on certain periods.
The informal economy is consistently at the receiving end of cross-subsidy. The medical cost ratios of the sector were above 100% in all the periods covered in the study. The challenge for PHIC is to formulate an approach that will establish a fair premium contribution for self-earning individuals of different income levels. Moreover, the ACRM was found to be significantly below the minimum premium due. This may suggest that members in the informal economy are not up to date in their premium contributions or the list of members is overstated. Given that the computed utilization rate of this sector is high, the clean-up is necessary in order to ensure that only the eligible members are granted their benefits.
The government had a history of underpaying the premium dues of its sponsored members as evidenced by the instances when ACRM is below the annual premium due. Given that majority of the members of PHIC is sponsored by the government and that these sectors continue to expand, it is critical for PHIC’s financial health for the government to keep its commitment to fully pay the premium dues of its members. Furthermore, the government’s inability or unwillingness to settle its full obligation for the health insurance of its sponsored members should not be burdened by the members in the formal economy continuously on a long term basis.
Based on the analysis performed, it was projected that if the 2015 utilization rate and operating expense ratio continue to persist, PHIC’s net worth may last only until 2018. On the other hand, if the utilization rate and operating expense ratio is more consistent with the historical average, PHIC’s net worth may last longer up to 2023. In either case, PHIC’s prognosis is not optimistic. This means that it urgently needs to come up with corrective actions to halt the projected depletion of its capital.

32 Financial Condition and Financial Reporting of the Philippine Health Insurance Corporation
Upward premium adjustments may be inevitable unless government funnel in subsidy not just for those who qualify as indigents but also for the members in the lower income bracket in the formal and informal economy. The premium increase may take different forms. There could be direct price adjustments for those sectors with high utilization rates or AVPC. Increasing the cap on the contributions of the members in the formal sector by adding salary brackets beyond the current highest monthly salary bracket of ₱35,000 is also an option. PHIC can also consider charging additional premium for insuring dependents beyond a specified limit. The different price mechanism alternatives, however, are beyond the scope of this study and may be subjects of future research.
In summary, this study found that while PHIC’s financial statements reveal a historically financially healthy institution, its future prospects point to a different direction. The conclusion in this study is consistent with that of Jowett and Hsiao (2007). Projections reveal that without immediate corrective adjustments, the National Health Insurance Program (NHIP) is not sustainable in the medium to long term.
References Accounting Standards Council (ASC), PAS 7 Statement of Cash Flows, PAS 37 Provisions, Contingent
Liabilities and Contingent Assets, PAS 39 Financial Instruments: Recognition and Measurement, PFRS 4 Insurance Contracts, and PFRS 7 Financial Instruments: Disclosures.
Gertler, P., & Solon, O. (2000). Who benefits from social health insurance in developing countries? Working Paper - University of California Berkeley. Retrieved from http://citeseerx.ist.psu.edu/ viewdoc/download?doi=10.1.1.202.3658&rep=rep1&type=pdf
Hsiao, W. C., & Shaw, R. P. (2007). Social health insurance for developing nations. World Bank Institute Development Studies, 16, 26. doi: http://dx.doi.org/10.1596/978-0-8213-6949-4
Jowett, M., & Hsiao, W. (2007). The Philippines: extending coverage beyond the formal sector. In W.C. Hsiao & R.P. Shaw (Eds.), Social health insurance for developing nations (pp. 81-104). The International Bank for Reconstruction and Development/The World Bank.
Pantig, I. (2013). Sustainability of the national government premium subsidy for indigents. Philippine Journal of Development, 40(1-2b). Retrieved from http://dirp3.pids.gov.ph/webportal/CDN /PUBLICATIONS/pidspjd13-subsidy.pdf
PhilHealth 2015 Audited Financial Statements. Retrieved from http://www.coa.gov.ph PhilHealth Annual Reports 2006-2014. PhilHealth Statistics and Charts 2007 – 2015. Retrieved from http://www.philhealth.gov.ph/
about_us/ statsncharts/ Valderrama, H. (2016). Financial condition and reporting practices of the GSIS. Philippine Management
Review, 23, 27-42