financial and operating ratios of public power utilities
TRANSCRIPT

FINANCIAL AND OPERATING RATIOSof Public Power Utilities

Contact [email protected] or 202.467.2900.
The American Public Power Association is the voice of not-for-profit, community-owned
utilities that power 2,000 towns and cities nationwide. We represent public power before the
federal government to protect the interests of the more than 49 million people that public
power utilities serve, and the 93,000 people they employ. Our association advocates and
advises on electricity policy, technology, trends, training, and operations. Our members
strengthen their communities by providing superior service, engaging citizens, and instilling
pride in community-owned power.
PUBLISHED DECEMBER 2018
© 2018 American Public Power Association
www.PublicPower.org
FINANCIAL AND OPERATING RATIOSof Public Power Utilities

4 FINANCIAL AND OPERATING RATIOS OF PUBLIC POWER UTILITIES
ABOUT THIS REPORT
This is the latest in the annual report series prepared by the American Public Power
Association on financial and operating ratios. Many of the ratios in this report were suggested
by the Association’s Performance Management Committee and its predecessor, the Task
Force on Performance Indicators.
The report was prepared by the Regulatory Affairs Department.
COMMENTS OR QUESTIONS ABOUT THIS REPORT
Members are encouraged to comment on the content and format of this report. Comments
or questions should be directed to: Paul Zummo, Director, Policy Research and Analysis
([email protected]), or at:
American Public Power Association
2451 Crystal Dr.
Suite 1000
Arlington, VA 22202
202-467-2969
FINANCIAL AND OPERATING RATIOS OF PUBLIC POWER UTILITIES 5
CONTENTS
INTRODUCTION ...................................................................................................................................................................................... 6
A. Report Format ................................................................................................................................................................................ 6
B. Utilities in the Report ...................................................................................................................................................................... 7
C. Definitions, Data Sources and Computations ................................................................................................................................. 9
D. Factors Influencing Ratios .............................................................................................................................................................. 9
SUMMARY TABLES ............................................................................................................................................................................... 10
A. Financial and Operating Ratios, by Customer Size Class .............................................................................................................. 11
B. Financial and Operating Ratios, by Region ................................................................................................................................... 12
C. Financial and Operating Ratios, by Generation Class ................................................................................................................... 13
DETAILED TABLES ................................................................................................................................................................................ 14
1. Revenue per KWH ........................................................................................................................................................................ 14
2. Debt to Total Assets ..................................................................................................................................................................... 17
3. Operating Ratio ............................................................................................................................................................................ 18
4. Current Ratio ................................................................................................................................................................................ 19
5a. Times Interest Earned ................................................................................................................................................................. 19
5b. Debt Service Coverage ............................................................................................................................................................... 20
6. Net Income per Revenue Dollar .................................................................................................................................................... 20
7. Uncollectible Accounts per Revenue Dollar ................................................................................................................................... 21
8. Retail Customers per Non-power-generation Employee ............................................................................................................... 22
9. Total O&M Expense per KWH Sold ............................................................................................................................................... 23
10. Total O&M Expense (Excluding Power Supply Expense) per Retail Customer ............................................................................. 24
11. Total Power Supply Expense per KWH Sold ............................................................................................................................... 25
12. Purchased Power Cost per KWH ............................................................................................................................................... 26
13. Retail Customers per Meter Reader ............................................................................................................................................ 27
14. Distribution O&M Expenses per Retail Customer ........................................................................................................................ 28
15. Distribution O&M Expenses per Circuit Mile ................................................................................................................................ 29
16. Customer Accounting, Customer Service and Sales Expense per Retail Customer .................................................................... 30
17. Administrative and General Expenses per Retail Customer ......................................................................................................... 31
18. Labor Expense per Worker-hour ................................................................................................................................................. 32
19. Energy Loss Percentage ............................................................................................................................................................. 33
20. System Load Factor ................................................................................................................................................................... 34
21. Capital Expenditures to Depreciation Expenses .......................................................................................................................... 35
APPENDIX A: 2017 PERFORMANCE INDICATORS SURVEY ............................................................................................................ 36
APPENDIX B: DATA SOURCES AND COMPUTATIONAL PROCEDURES ......................................................................................... 38
APPENDIX C: MAP OF NERC REGIONS ............................................................................................................................................. 40
APPENDIX D: UTILITIES INCLUDED IN THE REPORT ...................................................................................................................... 41

6 FINANCIAL AND OPERATING RATIOS OF PUBLIC POWER UTILITIES
This report presents data for 21 categories of financial and operating ratios for 138 of the largest publicly-owned electric utilities in the United States. The ratios can be a useful tool in assessing electric utility performance. However, they do not provide definitive information, nor should the level of any indicator be taken as the “correct” level of performance.
It is important that users be familiar with definitions of ratios and the variables that can affect them. Although the groupings of the ratios by customer size class, region and net power generation adjust for major variables, other factors might also influence the ratios. The financial and operating ratios provide a useful starting point for analyses and may be used to pinpoint areas in need of further investigation. The ratios should be analyzed in conjunction with other information and should not be the sole basis for broad conclusions.
A new ratio has been added to this report: Capital Expenditures to Depreciation Expenditure. This ratio was added on a pilot basis and is subject to modification based on feedback from participants.
A. Report FormatSummary tables listing median values of the ratios are presented in Section II by customer size class, region and net power generation. Section III presents detailed breakdowns for each ratio with the number of utilities, means, medians and first and third quartile values. The information is provided by customer size, region and generation groupings. Definitions and descriptive information precede each set of tables. A copy of the American Public Power Association’s 2017 Performance Indicators Survey, as well as formulas, data sources, definitions of regions, and the utilities included in the report can be found in Appendices A, B, C and D.
Medians and number of responses for each ratio are presented in the following table for all customer size classes, regions and generation classes.
INTRODUCTION

FINANCIAL AND OPERATING RATIOS OF PUBLIC POWER UTILITIES 7
B. Utilities in the ReportThe utilities included in this report are those that responded to the Association’s 2017 Performance Indicator Survey. The survey was sent to all public power utilities with sales to consumers that account for approximately 50 percent or more of total sales, and that also have retail sales or sales for resale of 100,000 megawatt-hours or more.
Direct comparisons with the 2016 ratio report should not be made because the composition of utilities included for each ratio might have changed. Although 138 utilities are included in this report, not all of the utilities were incorporated into each of the ratios. Many utilities did not have, or did not provide information necessary for,
particular ratios. Also, data were excluded from calculations if there was reason to believe the information is incorrect (e.g., extreme values).
The respondents are grouped into six customer size classes. Mean, median, and first and third quartile values are calculated for each of these classes. Means are weighted means - calculated by summing the values for all utilities, and then computing the ratio from these totals. Since large utilities heavily influence the mean value (particularly when there are only a small number of utilities in the sample), median values provide a better measure of the typical utility.
FINANCIAL RATIOS NO. of UTILITIES MEDIAN
1. Revenue per KWH
a. All Retail Customers 138 $0.097
b. Residential Customers 138 $0.109
c. Commercial Customers 138 $0.101
d. Industrial Customers 124 $0.074
2. Debt to Total Assets 132 0.321
3. Operating Ratio 135 0.850
4. Current Ratio 135 2.66
5a. Times Interest Earned 112 3.74
5b. Debt Service Coverage 112 2.78
6. Net Income per Revenue Dollar 137 $0.055
7. Uncollectible Accounts per Revenue Dollar 133 $0.0015
OPERATING RATIOS
8. Retail Customer per Non-Power Generation Employee 138 313
9. Total O&M Expense per KWH Sold 138 $0.080
10. Total O&M Expense (Excluding Power Supply Exp.) per Retail Customer 136 $540
11. Total Power Supply Expense per KWH Sold 138 $0.061
12. Purchased Power Cost per KWH 137 $0.059
13. Retail Customers per Meter Reader* 109 6,609
14. Distribution O&M Expense per Retail Customer 128 $184
15. Distribution O&M Expense per Circuit Mile 127 $7,637
16. Customer Accounting, Service, and Sales Expense per Retail Customer 128 $62
17. Administrative and General Expense per Retail Customer 127 $194 OTHER RATIOS
18. Labor Expense per Worker-Hour 131 $41.04
19. Energy Loss Percentage 132 3.39%
20. System Load Factor 133 57.4%
21. Capital Expenditures to Depreciation Expense 134 1.14
*Only includes utilities with at least one meter reader. For changes to the methodology of this ratio, see the detailed breakdown in Section III.

8 FINANCIAL AND OPERATING RATIOS OF PUBLIC POWER UTILITIES
The number of responses in each class size are shown in the chart below. Two wholesale entities with no retail customers were excluded.
Utilities are grouped and ratios calculated based on geographic location. The five regions are based on combined NERC regions (see Appendix C). The regions and number of utilities in each are shown in the following chart.
20 7
23
33
19
36
More than 100,000 Customers 2,000 to 5,000 Customers
5,000 to 10,000Customers
10,000 to 20,000 Customers
50,000 to 100,000Customers
20,000 to 50,000 Customers
Number of Responses, by Customer Size
31
9
40
37
21
West
Northeast
Southeast
North/Central Plains
Southwest
Number of Responses, by Region
FINANCIAL AND OPERATING RATIOS OF PUBLIC POWER UTILITIES 9
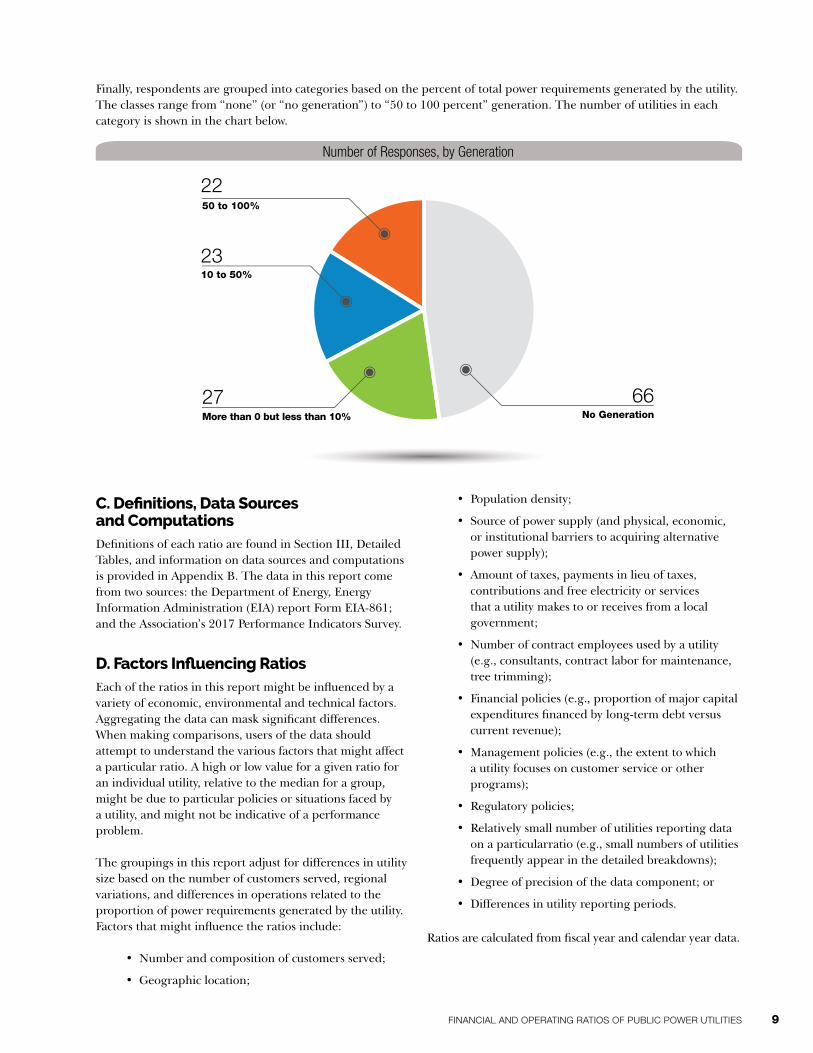
Finally, respondents are grouped into categories based on the percent of total power requirements generated by the utility. The classes range from “none” (or “no generation”) to “50 to 100 percent” generation. The number of utilities in each category is shown in the chart below.
22
66
23
27
50 to 100%
No Generation
10 to 50%
More than 0 but less than 10%
Number of Responses, by Generation
C. Definitions, Data Sources and ComputationsDefinitions of each ratio are found in Section III, Detailed Tables, and information on data sources and computations is provided in Appendix B. The data in this report come from two sources: the Department of Energy, Energy Information Administration (EIA) report Form EIA-861; and the Association’s 2017 Performance Indicators Survey.
D. Factors Influencing RatiosEach of the ratios in this report might be influenced by a variety of economic, environmental and technical factors. Aggregating the data can mask significant differences. When making comparisons, users of the data should attempt to understand the various factors that might affect a particular ratio. A high or low value for a given ratio for an individual utility, relative to the median for a group, might be due to particular policies or situations faced by a utility, and might not be indicative of a performance problem.
The groupings in this report adjust for differences in utility size based on the number of customers served, regional variations, and differences in operations related to the proportion of power requirements generated by the utility. Factors that might influence the ratios include:
• Number and composition of customers served;
• Geographic location;
• Population density;
• Source of power supply (and physical, economic, or institutional barriers to acquiring alternative power supply);
• Amount of taxes, payments in lieu of taxes, contributions and free electricity or services that a utility makes to or receives from a local government;
• Number of contract employees used by a utility (e.g., consultants, contract labor for maintenance, tree trimming);
• Financial policies (e.g., proportion of major capital expenditures financed by long-term debt versus current revenue);
• Management policies (e.g., the extent to which a utility focuses on customer service or other programs);
• Regulatory policies;
• Relatively small number of utilities reporting data on a particularratio (e.g., small numbers of utilities frequently appear in the detailed breakdowns);
• Degree of precision of the data component; or
• Differences in utility reporting periods.
Ratios are calculated from fiscal year and calendar year data.

10 FINANCIAL AND OPERATING RATIOS OF PUBLIC POWER UTILITIES
The following tables present summary data on the 21 financial and operating ratios by customer size class (Table A), by region (Table B), and by generation class (Table C). These tables present median values for each of the ratios. Definitions and detailed data including means, medians and quartile values appear in Section III. Data sources and calculation procedures are found in Appendix B.
The average number of retail customers reported by each utility on the Performance Indicators Survey determines customer size class. Responding utilities are grouped into five geographic regions: Northeast, Southeast, North Central/Plains, Southwest, and West. The regions correspond to combined regions of the North American Electric Reliability Council (NERC). See Appendix C for a detailed description of the regions.
Generation refers to the power a utility produces and is based upon the utility’s net generation as a percent of total sources of energy as reported on the Performance Indicators Survey.
SUMMARY TABLES

FINANCIAL AND OPERATING RATIOS OF PUBLIC POWER UTILITIES 11
TABLE A. FINANCIAL & OPERATING RATIOS: MEDIAN VALUES BY CUSTOMER SIZE CLASS
5,000 to 10,000 to 20,000 to 50,000 to More than 2,000 to 5,000 10,000 20,000 50,000 100,000 100,000Ratio Customers Customers Customers Customers Customers Customers
1. Revenue per KWH
a. All Retail Customers $0.086 $0.097 $0.096 $0.096 $0.103 $0.096
b. Residential Customers $0.101 $0.105 $0.111 $0.106 $0.115 $0.113
c. Commercial Customers $0.092 $0.101 $0.101 $0.103 $0.106 $0.094
d. Industrial Customers $0.071 $0.077 $0.070 $0.072 $0.076 $0.073
2. Debt to Total Assets 0.140 0.204 0.196 0.308 0.512 0.563
3. Operating Ratio 0.936 0.901 0.862 0.860 0.776 0.681
4. Current Ratio 5.68 2.58 2.77 3.08 4.10 1.77
5a. Times Interest Earned a 13.07 6.52 5.76 1.66 2.02
5b. Debt Service Coverage a 2.24 3.80 4.36 1.88 1.94
6. Net Income per Revenue Dollar $0.030 $0.075 $0.079 $0.122 $0.078 $0.106
7. Uncollectible Accounts per Revenue Dollar $0.0005 $0.0019 $0.0027 $0.0041 $0.0031 $0.0037
8. Retail Customer per Non-PowerGeneration Employee 196 258 343 318 293 315
9. Total O&M Expense per KWH Sold $0.074 $0.090 $0.084 $0.083 $0.088 $0.062
10. Total O&M Expense (Excluding Power Supply Exp.) per Retail Customer $497 $484 $501 $573 $584 $503
11. Total Power Supply Expense per KWH Sold $0.065 $0.071 $0.066 $0.062 $0.059 $0.044
12. Purchased Power Cost per KWH $0.062 $0.067 $0.068 $0.059 $0.051 $0.047
13. Retail Customers per Meter Reader 3,072 4,549 6,252 7,145 7,974 12,771
14. Distribution O&M Expense per Retail Customer $246 $159 $181 $200 $190 $159
15. Distribution O&M Expense per Circuit Mile $5,266 $5,108 $7,508 $6,650 $10,284 $11,106
16. Customer Accounting, Service, and Sales Expense per Retail Customer $71 $61 $54 $58 $73 $82
17. Administrative and General Expense per Retail Customer $219 $168 $198 $182 $243 $190
18. Labor Expense per Worker-Hour $38.02 $34.59 $39.70 $37.22 $45.27 $48.56
19. Energy Loss Percentage 2.86% 3.44% 2.59% 3.48% 3.29% 3.73%
20. System Load Factor 57.2% 57.8% 57.6% 56.5% 61.0% 59.0%
21. Capital Expenditures to Depreciation Expense $0.64 $1.11 $1.12 $1.32 $1.48 $1.07
a: Medians are not calculated for fewer than 5 responses

12 FINANCIAL AND OPERATING RATIOS OF PUBLIC POWER UTILITIES
TABLE B. FINANCIAL & OPERATING RATIOS: MEDIAN VALUES BY REGION
NorthRatio Northeast Southeast Central/Plains Southwest West
1. Revenue per KWH
a. All Retail Customers $0.135 $0.099 $0.094 $0.091 $0.090
b. Residential Customers $0.138 $0.111 $0.111 $0.105 $0.105
c. Commercial Customers $0.144 $0.104 $0.103 $0.092 $0.090
d. Industrial Customers $0.123 $0.069 $0.081 $0.074 $0.064
2. Debt to Total Assets 0.156 0.303 0.237 0.393 0.385
3. Operating Ratio 0.909 0.891 0.854 0.807 0.791
4. Current Ratio 2.01 2.20 2.78 4.01 3.02
5a. Times Interest Earned 3.91 5.76 4.90 2.89 3.70
5b. Debt Service Coverage 3.32 2.58 2.67 2.16 3.01
6. Net Income per Revenue Dollar $0.055 $0.034 $0.065 $0.048 $0.081
7. Uncollectible Accounts per Revenue Dollar $0.0032 $0.0016 $0.0006 $0.0026 $0.0016
8. Retail Customer per Non-Power Generation Employee 322 308 343 290 301
9. Total O&M Expense per KWH Sold $0.116 $0.091 $0.079 $0.073 $0.063
10. Total O&M Expense (Excluding Power
Supply Exp.) per Retail Customer $956 $434 $524 $574 $567
11. Total Power Supply Expense per KWH Sold $0.071 $0.075 $0.062 $0.054 $0.044
12. Purchased Power Cost per KWH $0.065 $0.072 $0.063 $0.051 $0.040
13. Retail Customers per Meter Reader 7,277 6,399 6,608 5,423 6,605
14. Distribution O&M Expense per Retail Customer $197 $171 $167 $122 $200
15. Distribution O&M Expense per Circuit Mile $23,016 $6,687 $7,036 $6,149 $7,551
16. Customer Accounting, Service, and Sales
Expense per Retail Customer $96 $58 $56 $64 $112
17. Administrative and General Expense per Retail Customer $285 $163 $204 $234 $234
18. Labor Expense per Worker-Hour $51.53 $32.83 $41.03 $34.84 $52.08
19. Energy Loss Percentage 2.44% 3.67% 3.02% 4.12% 3.28%
20. System Load Factor 55.0% 55.1% 60.4% 58.5% 57.4%
21. Capital Expenditures to Depreciation Expense $1.28 $1.29 $1.11 $1.10 $1.15

FINANCIAL AND OPERATING RATIOS OF PUBLIC POWER UTILITIES 13
TABLE C. FINANCIAL & OPERATING RATIOS: MEDIAN VALUES BY POWER GENERATION CLASS*
More than 0 No but less thanRatio Generation 10% 10 to 50% 50 to 100%
1. Revenue per KWH
a. All Retail Customers $0.098 $0.091 $0.095 $0.135
b. Residential Customers $0.106 $0.105 $0.112 $0.114
c. Commercial Customers $0.093 $0.112 $0.097 $0.095
d. Industrial Customers $0.071 $0.074 $0.080 $0.071
2. Debt to Total Assets 0.230 0.366 0.439 0.489
3. Operating Ratio 0.888 0.851 0.817 0.688
9. Total O&M Expense per KWH Sold $0.088 $0.078 $0.076 $0.063
11. Total Power Supply Expense per KWH Sold $0.074 $0.060 $0.056 $0.046
12. Purchased Power Cost per KWH $0.069 $0.054 $0.042 $0.047
17. Administrative and General Expense per Retail Customer $162 $202 $284 $227
18. Labor Expense per Worker-Hour $37.48 $38.56 $44.66 $44.79
19. Energy Loss Percentage 3.67% 3.08% 2.41% 3.40%
21. Capital Expenditures to Depreciation Expense $1.32 $1.04 $1.28 $0.92
* Only those ratios affected by power generation are included in this table.

14 FINANCIAL AND OPERATING RATIOS OF PUBLIC POWER UTILITIES
The following tables present a detailed breakdown of each of the 21 ratios. Each table includes a breakdown of the ratio by customer size class, region, and generation class. The numbers of responses are presented along with the mean, median and first and third quartile values of the ratio for each class.
1. Revenue per Kilowatt-houra. All retail customers – The ratio of total electric operating revenues from sales to ultimate customers to total kilowatt-hour sales. This ratio measures the amount of revenue received for each kilowatt-hour of electricity sold to all classes of customers, including residential, commercial, industrial, public street and highway lighting and other customers.
b. Residential customers – The ratio of residential revenues to residential sales. This ratio measures the amount of revenue received for each kilowatt-hour of electricity sold to residential customers.
c. Commercial customers – The ratio of commercial revenues to commercial sales. This ratio measures the amount of revenue received for each kilowatt-hour of electricity sold to commercial customers.
d. Industrial customers – The ratio of industrial revenues to industrial sales. This ratio measures the amount of revenues received for each kilowatt-hour of electricity sold to industrial customers.
The definitions of commercial and industrial customers can vary between utilities, with the resulting classification based on specific load characteristics or demand rather than on a popular definition of “commercial” or “industrial.” Revenue and sales data include only full-service (bundled sales), thus data for customers who purchase power from an alternative supplier are excluded.
More detailed revenue per kilowatt-hour data, including data for all retail electric utilities in the United States, can be found on the statistics page of the Association’s website at www.PublicPower.org/public-power/stats-and-facts/industry-statistics-and-reports.
DETAILED TABLES

FINANCIAL AND OPERATING RATIOS OF PUBLIC POWER UTILITIES 15
TABLE 1a. REVENUE PER KWH: ALL RETAIL CUSTOMERS
TABLE 1b. REVENUE PER KWH: RESIDENTIAL CUSTOMERS
Mean Utilities (weighted) 1st Quartile Median 3rd Quartile
Total 138 $0.098 $0.084 $0.097 $0.112
Mean Utilities (weighted) 1st Quartile Median 3rd Quartile
Total 138 $0.113 $0.099 $0.109 $0.123
1. Customer Size Class
2,000 to 5,000 Customers 7 $0.069 a $0.086 a
5,000 to 10,000 Customers 23 0.087 0.081 0.097 0.104
10,000 to 20,000 Customers 33 0.090 0.079 0.096 0.117
20,000 to 50,000 Customers 36 0.098 0.087 0.096 0.116
50,000 to 100,000 Customers 19 0.102 0.093 0.103 0.125
More than 100,000 Customers 20 0.098 0.092 0.096 0.102
2. Region
Northeast 9 0.117 0.126 0.135 0.146
Southeast 40 0.096 0.094 0.099 0.107
North Central/Plains 37 0.094 0.084 0.094 0.109
Southwest 21 0.095 0.083 0.091 0.099
West 31 0.102 0.071 0.090 0.125
3. Generation
No generation 66 0.096 0.085 0.098 0.105
More than 0 but less than 10% 27 0.095 0.079 0.091 0.117
10 to 50% 23 0.098 0.083 0.095 0.113
50 to 100% 22 0.100 0.090 0.099 0.126
1. Customer Size Class
2,000 to 5,000 Customers 7 $0.094 a $0.101 a
5,000 to 10,000 Customers 23 0.106 0.097 0.105 0.114
10,000 to 20,000 Customers 33 0.105 0.098 0.111 0.133
20,000 to 50,000 Customers 36 0.109 0.099 0.106 0.121
50,000 to 100,000 Customers 19 0.116 0.104 0.115 0.136
More than 100,000 Customers 20 0.114 0.105 0.113 0.117
2. Region
Northeast 9 0.119 0.122 0.138 0.155
Southeast 40 0.110 0.101 0.111 0.117
North Central/Plains 37 0.115 0.100 0.111 0.126
Southwest 21 0.109 0.094 0.105 0.112
West 31 0.118 0.088 0.105 0.128
3. Generation
No generation 66 0.106 0.098 0.106 0.118
More than 0 but less than 10% 27 0.118 0.094 0.105 0.136
10 to 50% 23 0.113 0.101 0.112 0.126
50 to 100% 22 0.116 0.105 0.114 0.136
a: Quartiles are not calculated for fewer than 9 responses
a: Quartiles are not calculated for fewer than 9 responses

16 FINANCIAL AND OPERATING RATIOS OF PUBLIC POWER UTILITIES
TABLE 1c. REVENUE PER KWH: COMMERCIAL CUSTOMERS
TABLE 1d. REVENUE PER KWH: INDUSTRIAL CUSTOMERS
Mean Utilities (weighted) 1st Quartile Median 3rd Quartile
Total 138 $0.100 $0.089 $0.101 $0.115
Mean Utilities (weighted) 1st Quartile Median 3rd Quartile
Total 124 $0.073 $0.063 $0.074 $0.091
1. Customer Size Class
2,000 to 5,000 Customers 7 $0.087 a $0.092 a
5,000 to 10,000 Customers 23 0.102 0.095 0.101 0.111
10,000 to 20,000 Customers 33 0.106 0.086 0.101 0.128
20,000 to 50,000 Customers 36 0.107 0.092 0.103 0.116
50,000 to 100,000 Customers 19 0.110 0.091 0.106 0.128
More than 100,000 Customers 20 0.097 0.088 0.094 0.102
2. Region
Northeast 9 0.134 0.126 0.144 0.156
Southeast 40 0.102 0.099 0.104 0.112
North Central/Plains 37 0.098 0.091 0.103 0.114
Southwest 21 0.093 0.085 0.092 0.095
West 31 0.104 0.081 0.090 0.136
3. Generation
No generation 66 0.102 0.095 0.103 0.112
More than 0 but less than 10% 27 0.109 0.085 0.093 0.124
10 to 50% 23 0.098 0.086 0.097 0.119
50 to 100% 22 0.098 0.089 0.095 0.133
1. Customer Size Class
2,000 to 5,000 Customers 7 $0.059 a $0.071 a
5,000 to 10,000 Customers 22 0.070 0.070 0.077 0.089
10,000 to 20,000 Customers 31 0.069 0.065 0.070 0.089
20,000 to 50,000 Customers 30 0.072 0.061 0.072 0.084
50,000 to 100,000 Customers 16 0.076 0.060 0.076 0.095
More than 100,000 Customers 18 0.074 0.064 0.073 0.079
2. Region
Northeast 9 0.093 0.073 0.123 0.128
Southeast 34 0.071 0.063 0.069 0.079
North Central/Plains 35 0.074 0.069 0.081 0.095
Southwest 18 0.066 0.063 0.074 0.079
West 28 0.076 0.056 0.064 0.102
3. Generation
No generation 59 0.069 0.062 0.071 0.084
More than 0 but less than 10% 25 0.065 0.067 0.074 0.101
10 to 50% 22 0.082 0.068 0.080 0.099
50 to 100% 18 0.075 0.063 0.071 0.099
a: Quartiles are not calculated for fewer than 9 responses
a: Quartiles are not calculated for fewer than 9 responses

FINANCIAL AND OPERATING RATIOS OF PUBLIC POWER UTILITIES 17
TABLE 2. DEBT TO TOTAL ASSETS
Mean Utilities (weighted) 1st Quartile Median 3rd Quartile
Total 132 0.512 0.176 0.321 0.517
1. Customer Size Class
2,000 to 5,000 Customers 6 0.193 a 0.140 a
5,000 to 10,000 Customers 22 0.360 0.143 0.204 0.345
10,000 to 20,000 Customers 31 0.303 0.165 0.196 0.357
20,000 to 50,000 Customers 34 0.349 0.168 0.308 0.477
50,000 to 100,000 Customers 19 0.479 0.361 0.512 0.575
More than 100,000 Customers 20 0.549 0.459 0.563 0.720
2. Region
Northeast 9 0.412 0.124 0.156 0.334
Southeast 39 0.508 0.194 0.303 0.511
North Central/Plains 34 0.454 0.164 0.237 0.473
Southwest 20 0.514 0.181 0.393 0.608
West 30 0.533 0.239 0.385 0.528
3. Generation
No generation 61 0.384 0.154 0.230 0.372
More than 0 but less than 10% 27 0.466 0.173 0.366 0.550
10 to 50% 22 0.604 0.249 0.439 0.580
50 to 100% 22 0.519 0.311 0.489 0.580
a: Quartiles are not calculated for fewer than 9 responses
2. Debt to Total AssetsDefinition: The ratio of long-term debt, plus current and accrued liabilities, to total assets and other debits. This ratio measures a utility’s ability to meet its current and long-term liabilities based on the availability of assets.
Long-term debt includes bonds, advances from the municipality, other long-term debt, any unamortized premium on long-term debt and any unamortized discount on long-term debt. Current and accrued liabilities include warrants, notes and accounts payable, payables
to the municipality, customer deposits, taxes accrued, interest accrued, and miscellaneous current and accrued liabilities. Total assets and other debits include utility plant, investments, current and accrued assets and deferred debits.
This ratio might be influenced by the extent to which its components include information applicable to the non-electric portion of the utility, if any (e.g., gas, water). In addition, the ratio might be influenced by a utility’s financial policies.
18 FINANCIAL AND OPERATING RATIOS OF PUBLIC POWER UTILITIES
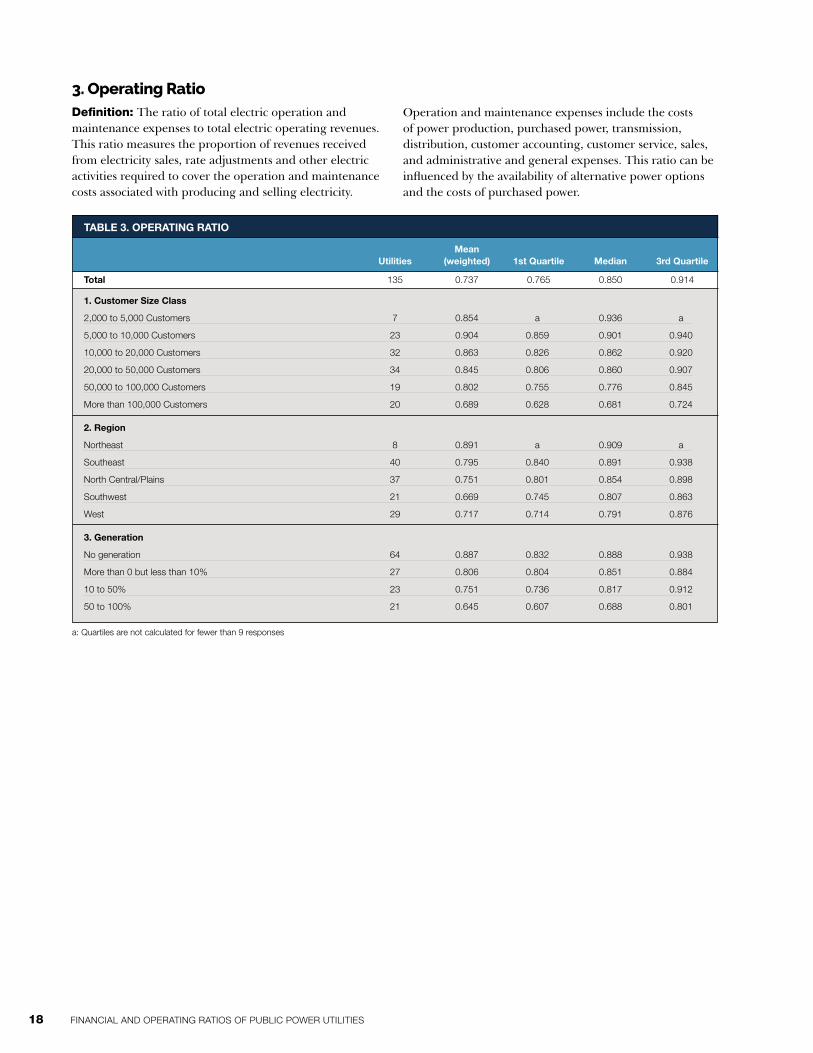
TABLE 3. OPERATING RATIO
Mean Utilities (weighted) 1st Quartile Median 3rd Quartile
Total 135 0.737 0.765 0.850 0.914
1. Customer Size Class
2,000 to 5,000 Customers 7 0.854 a 0.936 a
5,000 to 10,000 Customers 23 0.904 0.859 0.901 0.940
10,000 to 20,000 Customers 32 0.863 0.826 0.862 0.920
20,000 to 50,000 Customers 34 0.845 0.806 0.860 0.907
50,000 to 100,000 Customers 19 0.802 0.755 0.776 0.845
More than 100,000 Customers 20 0.689 0.628 0.681 0.724
2. Region
Northeast 8 0.891 a 0.909 a
Southeast 40 0.795 0.840 0.891 0.938
North Central/Plains 37 0.751 0.801 0.854 0.898
Southwest 21 0.669 0.745 0.807 0.863
West 29 0.717 0.714 0.791 0.876
3. Generation
No generation 64 0.887 0.832 0.888 0.938
More than 0 but less than 10% 27 0.806 0.804 0.851 0.884
10 to 50% 23 0.751 0.736 0.817 0.912
50 to 100% 21 0.645 0.607 0.688 0.801
a: Quartiles are not calculated for fewer than 9 responses
3. Operating RatioDefinition: The ratio of total electric operation and maintenance expenses to total electric operating revenues. This ratio measures the proportion of revenues received from electricity sales, rate adjustments and other electric activities required to cover the operation and maintenance costs associated with producing and selling electricity.
Operation and maintenance expenses include the costs of power production, purchased power, transmission, distribution, customer accounting, customer service, sales, and administrative and general expenses. This ratio can be influenced by the availability of alternative power options and the costs of purchased power.

FINANCIAL AND OPERATING RATIOS OF PUBLIC POWER UTILITIES 19
TABLE 4. CURRENT RATIO
TABLE 5a. TIMES INTEREST EARNED
Mean Utilities (weighted) 1st Quartile Median 3rd Quartile
Total 135 1.50 1.54 2.66 4.37
Mean Utilities (weighted) 1st Quartile Median 3rd Quartile
Total 112 2.15 1.67 3.74 8.55
1. Customer Size Class
2,000 to 5,000 Customers 6 5.77 a 5.68 a
5,000 to 10,000 Customers 22 1.90 1.56 2.58 4.09
10,000 to 20,000 Customers 32 1.93 1.76 2.77 4.24
20,000 to 50,000 Customers 36 2.47 1.63 3.08 4.67
50,000 to 100,000 Customers 19 3.62 1.86 4.10 5.87
More than 100,000 Customers 20 1.16 0.94 1.77 2.72
2. Region
Northeast 9 0.89 0.82 2.01 4.53
Southeast 40 1.76 1.56 2.20 3.94
North Central/Plains 35 2.10 1.74 2.78 4.06
Southwest 20 2.15 1.95 4.01 5.38
West 31 1.10 1.40 3.02 5.02
1. Customer Size Class
2,000 to 5,000 Customers 3 b a b a
5,000 to 10,000 Customers 14 6.86 3.19 13.07 19.89
10,000 to 20,000 Customers 27 5.08 3.65 6.52 9.20
20,000 to 50,000 Customers 29 4.24 2.71 5.76 9.70
50,000 to 100,000 Customers 19 2.13 1.10 1.66 4.08
More than 100,000 Customers 20 1.97 1.39 2.02 2.55
2. Region
Northeast 8 3.86 a 3.91 a
Southeast 35 2.23 1.48 5.76 9.49
North Central/Plains 24 2.16 2.09 4.90 7.91
Southwest 18 1.59 1.33 2.89 16.97
West 27 2.46 2.25 3.70 5.92
a: Quartiles are not calculated for fewer than 9 responses
a: Quartiles are not calculated for fewer than 9 responsesb: Means and Medians are not calculated for fewer than 5 responses
4. Current RatioDefinition: The ratio of total current and accrued assets to total current and accrued liabilities. This is a measure of the utility’s short-term liquidity (the ability to pay bills). The current ratio takes a snapshot of the utility’s liquidity at a point in time and thus might vary considerably at other times of the year.
5a. Times Interest EarnedDefinition: The ratio of net electric utility income, plus interest paid on long-term debt, to interest on long-term debt. This ratio measures the ability of a utility to cover
Total current and accrued assets include cash and working funds, temporary cash investments, notes and accounts receivable, receivables from the municipality, materials and supplies, prepayments and miscellaneous current and accrued assets. Total current and accrued liabilities include warrants, notes and accounts payable, payables to the municipality, customer deposits, taxes accrued, interest accrued and miscellaneous current and accrued liabilities.
interest charges and is indicative of the safety margin to lenders. Utilities that do not report any long-term debt are excluded from this ratio.
This ratio might be influenced by a utility’s financial policies.

20 FINANCIAL AND OPERATING RATIOS OF PUBLIC POWER UTILITIES
TABLE 5b. DEBT SERVICE COVERAGE
TABLE 6. NET INCOME PER REVENUE DOLLAR
Mean Utilities (weighted) 1st Quartile Median 3rd Quartile
Total 112 1.88 1.64 2.78 5.68
Mean Utilities (weighted) 1st Quartile Median 3rd Quartile
Total 137 $0.062 $0.019 $0.055 $0.097
1. Customer Size Class
2,000 to 5,000 Customers 3 b a b a
5,000 to 10,000 Customers 14 2.12 1.44 2.24 4.05
10,000 to 20,000 Customers 27 2.30 2.02 3.80 5.46
20,000 to 50,000 Customers 30 1.47 2.18 4.36 7.82
50,000 to 100,000 Customers 18 1.84 1.26 1.88 3.52
More than 100,000 Customers 20 1.92 1.67 1.94 3.15
2. Region
Northeast 8 1.99 a 3.32 a
Southeast 34 2.34 1.38 2.58 5.28
North Central/Plains 25 1.79 2.00 2.67 4.43
Southwest 18 0.54 1.24 2.16 6.18
West 27 4.58 1.87 3.01 5.99
1. Customer Size Class
2,000 to 5,000 Customers 7 $0.062 a $0.030 a
5,000 to 10,000 Customers 23 0.045 0.019 0.034 0.075
10,000 to 20,000 Customers 32 0.058 0.039 0.066 0.079
20,000 to 50,000 Customers 36 0.088 0.032 0.070 0.122
50,000 to 100,000 Customers 19 0.044 0.007 0.034 0.078
More than 100,000 Customers 20 0.063 0.019 0.050 0.106
2. Region
Northeast 9 0.065 -0.009 0.055 0.122
Southeast 40 0.042 0.011 0.034 0.064
North Central/Plains 36 0.051 0.016 0.065 0.089
Southwest 21 0.041 0.020 0.048 0.094
West 31 0.096 0.057 0.081 0.143
a: Quartiles are not calculated for fewer than 9 responsesb: Means and Medians are not calculated for fewer than 5 responses
a: Quartiles are not calculated for fewer than 9 responses
5b. Debt Service CoverageDefinition: The ratio of net revenues available for debt service to total long-term debt service for the year. This ratio measures the utility’s ability to meet its annual long-term debt obligation.
6. Net Income per Revenue DollarDefinition: The ratio of net electric utility income to total electric operating revenues. This ratio measures the amount of income remaining after accounting for operation and maintenance expenses, depreciation, taxes and tax equivalents for every dollar received from sales of electricity.
Net revenues available for debt service equal net electric utility operating income (operating revenues minus operating expenses) plus net electric utility non-operating income, plus depreciation. Debt service includes principle and interest payments on long-term debt.
This ratio might be influenced by a utility’s financial policies.
The ratio might be influenced by the type and availability of power supply options and by the amount of taxes and tax equivalents that a utility transfers to the municipality or other governmental body. Financial policies and the amount of debt can also affect this ratio (e.g., how a utility finances capital investments).

FINANCIAL AND OPERATING RATIOS OF PUBLIC POWER UTILITIES 21
TABLE 7. UNCOLLECTIBLE ACCOUNTS PER REVENUE DOLLAR
Mean Utilities (weighted) 1st Quartile Median 3rd Quartile
Total 133 $0.0031 $0.0007 $0.0015 $0.0031
1. Customer Size Class
2,000 to 5,000 Customers 7 $0.0031 a $0.0005 a
5,000 to 10,000 Customers 23 0.0020 0.0005 0.0015 0.0019
10,000 to 20,000 Customers 29 0.0017 0.0005 0.0009 0.0027
20,000 to 50,000 Customers 35 0.0040 0.0010 0.0021 0.0041
50,000 to 100,000 Customers 19 0.0020 0.0010 0.0014 0.0031
More than 100,000 Customers 20 0.0033 0.0015 0.0027 0.0037
2. Region
Northeast 8 0.0115 a 0.0032 a
Southeast 40 0.0019 0.0009 0.0016 0.0026
North Central/Plains 34 0.0018 0.0003 0.0006 0.0014
Southwest 21 0.0034 0.0014 0.0026 0.0036
West 30 0.0039 0.0008 0.0016 0.0041
a: Quartiles are not calculated for fewer than 9 responses
7. Uncollectible Accounts per Revenue DollarDefinition: The ratio of total uncollectible accounts to total electric utility operating revenues. This ratio measures the portion of each revenue dollar that will not be collected by the utility.
This ratio will be influenced by the financial and customer service policies of the utility.

22 FINANCIAL AND OPERATING RATIOS OF PUBLIC POWER UTILITIES
TABLE 8. RETAIL CUSTOMERS PER NON-POWER-GENERATION EMPLOYEE
Mean Utilities (weighted) 1st Quartile Median 3rd Quartile
Total 138 320 256 313 399
1. Customer Size Class
2,000 to 5,000 Customers 7 189 a 196 a
5,000 to 10,000 Customers 23 274 223 258 381
10,000 to 20,000 Customers 33 326 285 343 425
20,000 to 50,000 Customers 36 306 258 318 408
50,000 to 100,000 Customers 19 328 281 293 348
More than 100,000 Customers 20 323 271 315 387
2. Region
Northeast 9 331 277 322 414
Southeast 40 322 243 308 372
North Central/Plains 37 300 255 343 431
Southwest 21 380 256 290 393
West 31 297 267 301 395
a: Quartiles are not calculated for fewer than 9 responses
8. Retail Customers per Non-power-generation EmployeeDefinition: The ratio of the average number of retail customers from all classes to the total number of full-time, part-time and contract employees not involved in the generation of power. This ratio measures the average number of customers served by each non-generation employee.
The ratio might be influenced by the mix of customers and by population density. It will be influenced by the extent that employees shared with other (non-electric) departments are not properly prorated, or that employees involved in resale transactions are included. Part-time employees are assumed to work half-time (i.e., two part-time employees are counted as one full-time employee). To the extent that this assumption is violated, the ratio will be biased. Contract employees include only those individuals performing regular utility work on an ongoing basis.

FINANCIAL AND OPERATING RATIOS OF PUBLIC POWER UTILITIES 23
9. Total Operation and Maintenance Expense per Kilowatt-hour SoldDefinition: The ratio of total electric utility operation and maintenance expenses, including the cost of generated and purchased power, to total kilowatt-hour sales. This ratio measures average total operation and maintenance expenses associated with each kilowatt-hour of electricity sold, either for resale or to ultimate customers.
Included in operation and maintenance costs are the expenses associated with power supply (generation and purchased power), transmission, distribution, customer accounting, customer services, sales, and administrative
and general functions of the electric utility. Because power supply expenses typically comprise the largest component of total operation and maintenance expenses, this ratio might be influenced by the proportion of power generated by a utility and the availability of alternative power supplies. Kilowatt-hours of electricity produced but not sold (i.e., energy furnished without charge), energy used internally, and energy losses are not included in the denominator.
TABLE 9. TOTAL O&M EXPENSE PER KWH SOLD
Mean Utilities (weighted) 1st Quartile Median 3rd Quartile
Total 138 $0.067 $0.063 $0.080 $0.097
1. Customer Size Class
2,000 to 5,000 Customers 7 $0.053 a $0.074 a
5,000 to 10,000 Customers 23 0.082 0.075 0.090 0.102
10,000 to 20,000 Customers 33 0.075 0.063 0.084 0.098
20,000 to 50,000 Customers 36 0.076 0.072 0.083 0.098
50,000 to 100,000 Customers 19 0.072 0.058 0.088 0.098
More than 100,000 Customers 20 0.062 0.052 0.062 0.079
2. Region
Northeast 9 0.109 0.106 0.116 0.143
Southeast 40 0.080 0.076 0.091 0.098
North Central/Plains 37 0.060 0.067 0.079 0.096
Southwest 21 0.059 0.055 0.073 0.086
West 31 0.063 0.050 0.063 0.092
3. Generation
No generation 66 0.085 0.075 0.088 0.098
More than 0 but less than 10% 27 0.073 0.063 0.078 0.102
10 to 50% 23 0.059 0.051 0.076 0.096
50 to 100% 22 0.059 0.057 0.063 0.076
a: Quartiles are not calculated for fewer than 9 responses

24 FINANCIAL AND OPERATING RATIOS OF PUBLIC POWER UTILITIES
TABLE 10. TOTAL O&M EXPENSE (EXCLUDING POWER SUPPLY EXPENSE) PER RETAIL CUSTOMER
Mean Utilities (weighted) 1st Quartile Median 3rd Quartile
Total 136 574 410 540 705
1. Customer Size Class
2,000 to 5,000 Customers 7 881 a 497 a
5,000 to 10,000 Customers 23 655 410 484 744
10,000 to 20,000 Customers 32 601 381 501 694
20,000 to 50,000 Customers 35 582 394 573 689
50,000 to 100,000 Customers 19 665 457 584 778
More than 100,000 Customers 20 550 450 503 650
2. Region
Northeast 9 905 795 956 1008
Southeast 40 441 364 434 555
North Central/Plains 36 617 435 524 676
Southwest 20 595 398 574 699
West 31 640 485 567 739
a: Quartiles are not calculated for fewer than 9 responses
10. Total Operation and Maintenance Expense (Excluding Power Supply Expense) Per Retail CustomerDefinition: The ratio of total electric utility operation and maintenance expenses, excluding all costs of power supply, to the total number of ultimate customers.
Operation and maintenance expenses include the costs of transmission, distribution, customer accounting, customer services, sales, and administrative and general expenses. The costs of power supply (generation and purchased power) are excluded from the ratio. This ratio can be affected by population density and the mix of customers between various classes (residential, commercial, industrial or other). Also, the extent to which a utility services resale customers will influence the ratio.

FINANCIAL AND OPERATING RATIOS OF PUBLIC POWER UTILITIES 25
11. Total Power Supply Expense per Kilowatt-hour SoldDefinition: The ratio of the total costs of power supply to total sales to both ultimate and resale customers. This ratio measures all power supply costs, including generation and purchased power, associated with the sale of each kilowatt-hour of electricity.
The ratio includes operation and maintenance costs arising from all generation types, including steam, nuclear, and hydraulic generation. Operation and maintenance
expenses include the costs of fuel, labor, supervision, engineering, materials and supplies, and purchased power. The ratio might be influenced by the geographic location of the utility, the availability of alternative power supplies, the degree to which the utility can generate its own power, and access to transmission. The ratio does not include kilowatt-hours produced but not sold (i.e., energy used internally, energy furnished without charge, or energy losses).
TABLE 11. TOTAL POWER SUPPLY EXPENSE PER KWH SOLD
Mean Utilities (weighted) 1st Quartile Median 3rd Quartile
Total 138 $0.049 $0.045 $0.061 $0.076
1. Customer Size Class
2,000 to 5,000 Customers 7 $0.043 a $0.065 a
5,000 to 10,000 Customers 23 0.066 0.060 0.071 0.082
10,000 to 20,000 Customers 33 0.059 0.053 0.066 0.080
20,000 to 50,000 Customers 36 0.055 0.045 0.062 0.077
50,000 to 100,000 Customers 19 0.054 0.045 0.059 0.073
More than 100,000 Customers 20 0.045 0.036 0.044 0.057
2. Region
Northeast 9 0.064 0.054 0.071 0.089
Southeast 40 0.065 0.068 0.075 0.081
North Central/Plains 37 0.043 0.052 0.062 0.076
Southwest 21 0.041 0.039 0.054 0.061
West 31 0.043 0.038 0.044 0.060
3. Generation
No generation 66 0.069 0.059 0.074 0.080
More than 0 but less than 10% 27 0.054 0.051 0.060 0.074
10 to 50% 23 0.039 0.037 0.056 0.067
50 to 100% 22 0.041 0.040 0.046 0.053
a: Quartiles are not calculated for fewer than 9 responses

26 FINANCIAL AND OPERATING RATIOS OF PUBLIC POWER UTILITIES
12. Purchased Power Cost per Kilowatt-hourDefinition: The ratio of the cost of purchased power to the number of kilowatt-hours purchased. This ratio measures the purchased power component of power supply costs.
Purchased power includes purchases from investor-owned utilities, municipalities, cooperatives or other public authorities for subsequent distribution and sale to ultimate customers. It does not include power exchanges.
Adjustments to the cost data were made in a small number of cases to eliminate power exchanges. The cost reflects the amount billed, including adjustments and other charges.
The ratio might be influenced by the geographic location of the utility, availability of alternative power supplies, access to transmission, and the type of purchase agreement, such as firm power, economy power, or surplus sales.
TABLE 12. PURCHASED POWER COST PER KWH
Mean Utilities (weighted) 1st Quartile Median 3rd Quartile
Total 137 $0.053 $0.042 $0.059 $0.072
1. Customer Size Class
2,000 to 5,000 Customers 7 $0.043 a $0.062 a
5,000 to 10,000 Customers 23 0.061 0.056 0.067 0.077
10,000 to 20,000 Customers 33 0.058 0.039 0.068 0.077
20,000 to 50,000 Customers 36 0.054 0.041 0.059 0.075
50,000 to 100,000 Customers 19 0.049 0.041 0.051 0.070
More than 100,000 Customers 19 0.053 0.035 0.047 0.055
2. Region
Northeast 9 0.057 0.050 0.065 0.076
Southeast 39 0.071 0.066 0.072 0.078
North Central/Plains 37 0.048 0.049 0.063 0.073
Southwest 21 0.049 0.047 0.051 0.061
West 31 0.040 0.035 0.040 0.051
3. Generation
No generation 66 0.066 0.056 0.069 0.077
More than 0 but less than 10% 27 0.050 0.047 0.054 0.061
10 to 50% 23 0.038 0.030 0.042 0.067
50 to 100% 21 0.045 0.028 0.047 0.049
a: Quartiles are not calculated for fewer than 9 responses

FINANCIAL AND OPERATING RATIOS OF PUBLIC POWER UTILITIES 27
13. Retail Customers per Meter ReaderDefinition: The ratio of retail customers to the number of meter readers employed by the utility. This measures the average number of retail customers served by each meter reader.
The number of meter readers includes the total number of full-time meter readers plus half of all part-time meter readers. It is assumed that all part-time employees work half-time (i.e., one full-time employee is equivalent to two part-time employees). Population density, frequency of meter readings, and the technology or methods used to read meters will influence the ratio.
As more utilities implement advanced meters that can read customer data without having to send a meter reader to the customer’s residence or business, utilities require
fewer meter readers to cover their service territories. Some utilities have installed advanced meters in all of their service territory and no longer employ meter readers. These utilities have been excluded from the customer size and region summaries of this ratio. We added a category for this ratio that shows the percentage of a utility’s customers that have advanced meters installed, and utilities with no meter readers are captured in this ratio.
The first and third quartile and median figures in this final category still reflect only those utilities with at least one meter reader. The weighted mean in this category does include all utilities with or without meter readers. Overall, 27 utilities reported zero meter readers, and all of them were in the “80% or more” class for advanced meter percent.
TABLE 13. RETAIL CUSTOMERS PER METER READER
Mean Utilities (weighted) 1st Quartile Median 3rd Quartile
Total 109* 9,637 4,628 6,609 10,475
1. Customer Size Class
2,000 to 5,000 Customers 7 2,741 a 3,072 a
5,000 to 10,000 Customers 17 4,084 3,148 4,549 6,168
10,000 to 20,000 Customers 23 6,058 5,116 6,252 8,749
20,000 to 50,000 Customers 32 5,748 4,860 7,145 9,577
50,000 to 100,000 Customers 13 7,104 5,845 7,974 9,552
More than 100,000 Customers 17 13,870 10,572 12,771 46,161
2. Region
Northeast 6 6,886 a 7,277 a
Southeast 30 9,408 4,656 6,399 13,212
North Central/Plains 32 11,368 4,608 6,608 10,597
Southwest 19 11,174 3,147 5,423 8,772
West 22 7,958 4,981 6,605 10,639
3. Advanced Meter Percent**
No advanced meters 13 4,731 3,312 4,765 5,915
More than 0 but less than 40% 26 6,822 4,389 6,074 7,901
40 to 80% 10 8,319 3,331 4,712 9,507
80% or more 88 19,158 5,684 8,047 12,687
a: Quartiles are not calculated for fewer than 9 responses* Total figure includes only utilities with at least one meter reader** Weighted mean and utility count includes utilities with zero meter readers

28 FINANCIAL AND OPERATING RATIOS OF PUBLIC POWER UTILITIES
TABLE 14. DISTRIBUTION O&M EXPENSES PER RETAIL CUSTOMER
Mean Utilities (weighted) 1st Quartile Median 3rd Quartile
Total 128 $168 $133 $184 $229
1. Customer Size Class
2,000 to 5,000 Customers 7 $282 a $246 a
5,000 to 10,000 Customers 18 170 113 159 220
10,000 to 20,000 Customers 30 218 141 181 244
20,000 to 50,000 Customers 35 198 131 200 243
50,000 to 100,000 Customers 18 218 172 190 250
More than 100,000 Customers 20 150 132 159 189
2. Region
Northeast 9 212 169 197 250
Southeast 37 154 134 171 223
North Central/Plains 34 169 132 167 217
Southwest 19 143 105 122 198
West 29 193 174 200 255
a: Quartiles are not calculated for fewer than 9 responses
14. Distribution Operation and Maintenance Expenses Per Retail CustomerDefinition: The ratio of total distribution operation and maintenance expenses to the total number of retail customers. This ratio measures the average distribution expense associated with delivering power to each retail customer.
Distribution costs include expenses associated with labor, supervision, engineering, materials and supplies used in the operation and maintenance of the distribution system.
Population density and the mix of customer classes served by the utility will influence the ratio.
Those utilities that do not allocate expenses to all three categories of (1) distribution expense (2) customer accounting, customer service, and sales expense and (3) administrative and general expense are excluded from ratios 14 through 17.

FINANCIAL AND OPERATING RATIOS OF PUBLIC POWER UTILITIES 29
TABLE 15. DISTRIBUTION O&M EXPENSES PER CIRCUIT MILE
Mean Utilities (weighted) 1st Quartile Median 3rd Quartile
Total 127 $7,586 $4,227 $7,637 $13,6633
1. Customer Size Class
2,000 to 5,000 Customers 7 $4,578 a $5,266 a
5,000 to 10,000 Customers 18 6,137 3,707 5,108 9,359
10,000 to 20,000 Customers 30 7,785 4,893 7,508 17,107
20,000 to 50,000 Customers 35 4,535 3,596 6,650 12,332
50,000 to 100,000 Customers 17 9,263 6,844 10,284 16,334
More than 100,000 Customers 20 8,607 6,204 11,106 12,451
2. Region
Northeast 9 14,804 13,614 23,016 24,656
Southeast 37 7,902 3,681 6,687 11,610
North Central/Plains 34 8,572 4,783 7,036 9,704
Southwest 19 6,446 3,388 6,149 12,480
West 28 7,548 5,232 7,551 12,926
a: Quartiles are not calculated for fewer than 9 responses
15. Distribution Operation and Maintenance Expenses per Circuit MileDefinition: The ratio of total distribution operation and maintenance expenses to the total number of circuit miles of distribution line. This measures the total distribution costs associated with each circuit mile of distribution line used to deliver power to customers.
Distribution costs include expenses associated with labor, supervision, engineering, materials and supplies used in the operation and maintenance of the distribution system.
The ratio will be affected by population density, the mix of customer classes served by the utility, the dispersion of customers within the utility’s service territory, and the proportion of underground and overhead distribution lines.
Utilities that do not allocate expenses to all three categories of (1) distribution expense (2) customer accounting, customer service, and sales expense and (3) administrative and general expense are excluded from ratios 14 through 17.

30 FINANCIAL AND OPERATING RATIOS OF PUBLIC POWER UTILITIES
TABLE 16. CUSTOMER ACCOUNTING, CUSTOMER SERVICE AND SALES EXPENSE PER RETAIL CUSTOMER
Mean Utilities (weighted) 1st Quartile Median 3rd Quartile
Total 128 $112 $44 $62 $93
1. Customer Size Class
2,000 to 5,000 Customers 7 $95 a $71 a
5,000 to 10,000 Customers 18 70 45 61 82
10,000 to 20,000 Customers 30 59 37 54 67
20,000 to 50,000 Customers 35 82 43 58 90
50,000 to 100,000 Customers 18 98 54 73 107
More than 100,000 Customers 20 125 61 82 109
2. Region
Northeast 9 133 69 96 186
Southeast 37 69 42 58 66
North Central/Plains 34 76 42 56 82
Southwest 19 68 48 64 80
West 29 185 63 112 163
a: Quartiles are not calculated for fewer than 9 responses
16. Customer Accounting, Customer Service and Sales Expenses per Retail CustomerDefinition: The ratio of total customer accounting, service, and sales expenses to the total number of retail customers. This ratio measures the average expenses incurred by the utility in handling each customer’s account. This includes the costs of obtaining and servicing all retail customers. Uncollectible accounts and meter reading expenses are included in this ratio.
The ratio includes the costs of labor, materials and other expenses associated with advertising, billing, collections, records, and handling inquiries and complaints. It also
includes the costs of promoting and providing customer service programs such as energy services or conservation programs. The ratio will be influenced by the degree to which the utility provides various energy services and other types of customer programs and by the mix of customer classes it serves.
Utilities that do not allocate expenses to all three categories of (1) distribution expense (2) customer accounting, customer service, and sales expense and (3) administrative and general expense are excluded from ratios 14 through 17.

FINANCIAL AND OPERATING RATIOS OF PUBLIC POWER UTILITIES 31
17. Administrative and General Expenses per Retail CustomerDefinition: The ratio of total electric utility administrative and general expenses to the total number of retail customers. This ratio measures the average administrative and general expenses incurred by the utility on behalf of each retail customer.
Administrative and general expenses are those electric operation and maintenance expenses not allocable to the costs of power production (generation and power purchases), transmission, distribution, or customer accounting, service and sales. Items which might be
included are compensation of officers and executives, office supplies, professional fees, property insurance and claims, pensions and benefits, and other expenses not provided for elsewhere.
Those utilities that do not allocate expenses to all three categories of (1) distribution expense (2) customer accounting, customer service, and sales expense and (3) administrative and general expense are excluded from ratios 14 through 17.
The amount and type of the utility’s generation might affect the ratio.
TABLE 17. ADMINISTRATIVE AND GENERAL EXPENSES PER RETAIL CUSTOMER
Mean Utilities (weighted) 1st Quartile Median 3rd Quartile
Total 127 $209 $135 $194 $290
1. Customer Size Class
2,000 to 5,000 Customers 7 $317 a $219 a
5,000 to 10,000 Customers 18 205 150 168 240
10,000 to 20,000 Customers 30 260 100 198 321
20,000 to 50,000 Customers 34 249 105 182 277
50,000 to 100,000 Customers 18 256 167 243 312
More than 100,000 Customers 20 190 142 190 258
2. Region
Northeast 9 335 105 285 419
Southeast 37 182 128 163 219
North Central/Plains 34 273 133 204 300
Southwest 18 271 175 234 327
West 29 167 135 234 291
3. Generation
No generation 60 187 102 162 231
More than 0 but less than 10% 24 232 173 202 296
10 to 50% 22 257 170 284 325
50 to 100% 21 201 163 227 373
a: Quartiles are not calculated for fewer than 9 responses

32 FINANCIAL AND OPERATING RATIOS OF PUBLIC POWER UTILITIES
18. Labor Expense per Worker-HourDefinition: The ratio of total annual earnings of full-time, part-time and contract labor employees to the total number of hours worked during the year by these employees. This ratio measures the actual cost of labor to the utility.
Total annual earnings include all payroll compensation received by full-time, part-time or contract employees, including straight-time pay, overtime pay, and payment for time not worked such as sick pay, vacation pay, holiday
pay, or other payments. Fringe benefits, such as health care premiums paid by the employer, are excluded. Hours worked includes total productive hours spent at work, including both straight time and overtime hours worked. Hours paid but not worked, such as on holidays or other paid leave time, are not included. This is not the same as a wage rate, which is simply the earnings per hour. A wage rate generally includes hours not worked (such as vacation or sick pay).
TABLE 18. LABOR EXPENSE PER WORKER-HOUR
Mean Utilities (weighted) 1st Quartile Median 3rd Quartile
Total 131 $48.23 $33.00 $41.04 $49.07
1. Customer Size Class
2,000 to 5,000 Customers 7 $39.22 a $38.02 a
5,000 to 10,000 Customers 23 36.47 29.82 34.59 42.61
10,000 to 20,000 Customers 30 40.34 34.07 39.70 43.65
20,000 to 50,000 Customers 34 39.60 32.37 37.22 48.96
50,000 to 100,000 Customers 17 46.44 40.93 45.27 49.72
More than 100,000 Customers 20 50.86 43.04 48.56 58.67
2. Region
Northeast 7 54.92 a 51.53 a
Southeast 39 40.90 29.05 32.83 41.24
North Central/Plains 36 49.66 36.75 41.03 44.45
Southwest 21 47.92 28.71 34.84 46.05
West 28 52.95 43.62 52.08 56.53
3. Generation
No generation 64 39.90 29.44 37.48 43.56
More than 0 but less than 10% 25 44.09 33.28 38.56 49.72
10 to 50% 21 52.14 41.06 44.66 55.72
50 to 100% 21 51.08 40.02 44.79 50.33
a: Quartiles are not calculated for fewer than 9 responses

FINANCIAL AND OPERATING RATIOS OF PUBLIC POWER UTILITIES 33
19. Energy Loss PercentageDefinition: The ratio of total energy losses to total sources of energy. This ratio measures how much energy is lost in the utility’s electrical system and is an indicator of efficiency. It represents the percentage of electrical energy that is bought or generated by the utility but is not available to be sold to customers or for the utility’s own use.
Losses include both physical losses that occur in the distribution system and metering and billing losses. Generation, purchases, net exchanges and net wheeling are all included in total sources of energy.
TABLE 19. ENERGY LOSS PERCENTAGE
Mean Utilities (weighted) 1st Quartile Median 3rd Quartile
Total 132 3.67 2.47 3.39 4.62
1. Customer Size Class
2,000 to 5,000 Customers 7 2.07 a 2.86 a
5,000 to 10,000 Customers 21 3.39 2.52 3.44 5.12
10,000 to 20,000 Customers 32 2.82 2.07 2.59 3.94
20,000 to 50,000 Customers 35 4.45 2.98 3.48 5.37
50,000 to 100,000 Customers 18 2.74 2.28 3.29 3.86
More than 100,000 Customers 19 3.83 3.19 3.73 4.80
2. Region
Northeast 9 2.80 2.03 2.44 3.13
Southeast 40 3.77 2.97 3.67 4.73
North Central/Plains 35 2.97 2.04 3.02 4.29
Southwest 20 4.38 3.24 4.12 5.21
West 28 3.40 2.29 3.28 3.78
3. Generation
No generation 64 3.88 2.83 3.67 5.12
More than 0 but less than 10% 26 2.93 2.14 3.08 4.40
10 to 50% 20 3.09 1.99 2.41 3.56
50 to 100% 22 3.90 2.98 3.40 4.44
a: Quartiles are not calculated for fewer than 9 responses

34 FINANCIAL AND OPERATING RATIOS OF PUBLIC POWER UTILITIES
TABLE 20. SYSTEM LOAD FACTOR
Mean Utilities (weighted) 1st Quartile Median 3rd Quartile
Total 133 61.4% 51.7 57.4 63.4
1. Customer Size Class
2,000 to 5,000 Customers 6 55.1% a 57.2 a
5,000 to 10,000 Customers 23 61.4 54.0 57.8 62.8
10,000 to 20,000 Customers 32 59.1 53.7 57.6 62.6
20,000 to 50,000 Customers 35 57.3 49.8 56.5 61.6
50,000 to 100,000 Customers 18 67.4 51.1 61.0 77.1
More than 100,000 Customers 19 61.2 54.1 59.0 65.2
2. Region
Northeast 9 54.5 50.0 55.0 59.7
Southeast 39 56.9 50.9 55.1 58.6
North Central/Plains 36 69.6 57.1 60.4 68.0
Southwest 20 64.4 53.6 58.5 66.5
West 29 61.0 50.5 57.4 65.8
a: Quartiles are not calculated for fewer than 9 responses
20. System Load FactorDefinition: The ratio of the system average load, total sales plus losses (MWh) divided by 8,760 (hours per year), to system peak demand (typically a summer or winter peak measured during a particular hour at all delivery points and generator busses on a totalized basis).
System load factor is descriptive of the total system load characteristics. It tells system planners how much the overall system load varies diurnally and seasonally. It is a very broad indicator. It also provides financial planners with information about how to spread fixed costs across energy sales. This metric gives financial planners and rate designers information to support greater unbundling of fixed and variable costs—a goal of competitive rate design.

FINANCIAL AND OPERATING RATIOS OF PUBLIC POWER UTILITIES 35
21. Capital Expenditures to Depreciation ExpenseDefinition: The ratio of the of amount of capital expenditures in a year divided by depreciation expenses.
TABLE 21. CAPITAL EXPENDITURES TO DEPRECIATION EXPENSE
Mean Utilities (weighted) 1st Quartile Median 3rd Quartile
Total 134 $1.38 $0.81 $1.14 $1.76
1. Customer Size Class
2,000 to 5,000 Customers 7 $0.71 a $0.64 a
5,000 to 10,000 Customers 20 1.07 0.87 1.11 1.39
10,000 to 20,000 Customers 32 1.56 0.68 1.12 2.07
20,000 to 50,000 Customers 36 1.62 0.86 1.32 2.05
50,000 to 100,000 Customers 19 2.31 1.05 1.48 2.52
More than 100,000 Customers 20 1.23 0.88 1.07 1.57
2. Region
Northeast 9 1.22 0.81 1.28 1.33
Southeast 38 1.12 0.76 1.29 1.88
North Central/Plains 35 1.19 0.69 1.11 1.73
Southwest 21 1.48 0.90 1.10 1.92
West 31 1.52 0.92 1.15 1.85
3. Generation
No generation 62 2.01 0.96 1.32 2.13
More than 0 but less than 10% 27 1.79 0.68 1.04 1.61
10 to 50% 23 2.38 0.94 1.28 2.10
50 to 100% 22 1.03 0.71 0.92 1.07
a: Quartiles are not calculated for fewer than 9 responses

36 FINANCIAL AND OPERATING RATIOS OF PUBLIC POWER UTILITIES
APPENDIX A:American Public Power Association 2017 Performance Indicators Survey
PART I. EMPLOYMENT, HOURS AND EARNINGS (Calendar Year Ending in 2017)
ELECTRIC UTILITY EMPLOYEES FULL-TIME PART-TIME
1. Total Average No. of Employees ____________________________ ____________________________
2. Total Annual Hours Worked ____________________________ ____________________________
3. Total Annual Earnings ____________________________ ____________________________
CONTRACT LABOR EMPLOYEES SUPERVISED EMPLOYEES SUPERVISED (BY THE UTILITY) (BY THE SUPERVISING COMPANY)
Company
1. Total Average No. of Employees ____________________________ ____________________________
2. Total Annual Hours Worked ____________________________ ____________________________
3. Total Annual Earnings ____________________________ ____________________________
NUMBER OF EMPLOYEES, FULL-TIME PART-TIME CONTRACTSELECTED ELECTRIC UTILITY DEPARTMENTS
1. No. of Power Production Employees (Include all employees involved in operation and maintenance of power generating facilities.) _________________ _________________ _________________
2. No. of Meter Readers (If responsible for meters other than electric, prorate employees allocated to electric only.) _________________ _________________ _________________
PART II. SELECTED ELECTRIC UTILITY STATISTICS (Calendar Year Ending in 2017)
DISTRIBUTION LINES (UP TO 69 kV)
Total Distribution Line Circuit Miles (Circuit miles include the total length in miles of separate circuits regardless of the number of conductors used per circuit.) _________________
TOTAL ELECTRIC UTILITY
Uncollectible Accounts (FERC 904) $_________________
Debt Service Payments on Long-Term Debt $_________________
CAPITAL EXPENDITURES
Current Calendar Year $_________________

FINANCIAL AND OPERATING RATIOS OF PUBLIC POWER UTILITIES 37
PART III. FINANCIAL DATA
BALANCE SHEET REPORT FULL NUMBERS (NOT in 000’s)
ASSET SIDE:
1. Total Current and Accrued Assets _______________________________________
2. Total Assets and Other Debits _______________________________________
LIABILITY SIDE:
3. Long-Term Debt: Total Long-Term Debt _______________________________________
4. Total Current and Accrued Liabilities _______________________________________
SELECTED INCOME STATEMENT ITEMS:
5. Electric Operating Revenue (Must include only revenue from sales to ultimate consumers and sales for resale) _______________________________________
6. Depreciation Expenses _______________________________________
7. Electric Income (Electric operating income and other electric income) _______________________________________
8. Interest payment on Long-Term Debt paid during fiscal year (Include the amount of interest on outstanding long-term debt issued or assumed by the utility) _______________________________________
9. Net Income (Electric Income minus Deductions) _______________________________________
OPERATION AND MAINTENANCE EXPENSES
10. Purchased Power Expenses _______________________________________
11. Total Production Expenses (including purchased power) _______________________________________
12. Transmission Expenses _______________________________________
13. Distribution Expenses _______________________________________
14. Customer Accounts Expenses; Customer Service and Information Expenses; and Sales Expenses _______________________________________
15. Administrative and General Expenses
16. Total Electric Operation and Maintenance Expenses (Sum of lines 11-15) _______________________________________

38 FINANCIAL AND OPERATING RATIOS OF PUBLIC POWER UTILITIES
APPENDIX B: Data Sources and Computational Procedures
The financial and operating ratios in this report are calculated using data from the Association’s 2017 Performance Indicators Survey. The survey includes data on employees, hours worked, earnings, distribution lines, reliability, lost workdays, and uncollectible accounts. It also includes financial data formerly reported on Form EIA-412, including balance sheet, income statement and operation and maintenance expense information, as well as data on revenues, kilowatt-hour sales and customers as reported on the U.S. Department of Energy, Energy Information Administration (EIA) Form EIA-861.
The list below contains data sources and computational procedures for each of the ratios in the report. Definitions are found within the body of the report. All data are for 2017.
1. Revenue per kWh (Dollars) a. All Retail Customers EIA Form 861, Schedule 4, Part A, Total Revenue, (column e) EIA Form 861, Schedule 4, Part A, Total Megawatt-hours (column e) b. Residential Customers EIA Form 861, Schedule 4, Part A, Residential Revenue (column a) EIA Form 861, Schedule 4, Part A, Residential Megawatt-hours (column a) c. Commercial Customers EIA Form 861, Schedule 4, Part A, Commercial Revenue (column b) EIA Form 861, Schedule 4, Part A, Commercial Megawatt-hours (column b) d. Industrial Customers EIA Form 861, Schedule 4, Part A, Industrial Revenue (column c) EIA Form 861, Schedule 4, Part A, Industrial Megawatt-hours (column c)
2. Debt to Total Assets (Long Term Debt + Current and Accrued Liabilities to Total Assets) (Performance Indicators Survey, part III, line 3) + (Performance Indicators Survey, part III, line 4)
Performance Indicators Survey, part III, line 2
3. Operating Ratio (Total Electric O&M Expense to Total Electric Revenue) Performance Indicators Survey, part III, line 16
Performance Indicators Survey, part III, line 5
4. Current Ratio (Current & Accrued Assets to Current & Accrued Liabilities) Performance Indicators Survey, Part III, line 1 Performance Indicators Survey, Part III, line 4
5a. Times Interest Earned (Net Electric Utility Income + Interest on Long-Term Debt to Interest on Long-Term Debt) (Performance Indicators Survey, part III, line 9) + (Performance Indicators Survey, part III, line 8)
Performance Indicators Survey, part III, line 8
5b. Debt Service Coverage (Electric Utility Income + Depreciation to Total Electric Utility Debt Service Payments on Long-term Debt) (Performance Indicators Survey, part III, line 7) + (Performance Indicators Survey, part III, line 6)
Performance Indicators Survey, Part II, Section C
6. Net Income per Revenue Dollar Performance Indicators Survey, part III, line 9
Performance Indicators Survey, part III, line 5
7. Uncollectible accounts per Revenue Dollar Performance Indicators Survey, Part II, Section B, Uncollectible Accounts
Performance Indicators Survey, part III, line 5

FINANCIAL AND OPERATING RATIOS OF PUBLIC POWER UTILITIES 39
8. Retail Customers per Non-power-generation Employee EIA Form 861, Schedule 4, Part A Total Number of Customers (column e) Employees – Power Production Employees (Performance Indicators Survey, Part I)
Employees = Full Time + Part Time/2 + all contract employees (supervised by utility and supervised by contractor)
9. Total O&M Expense per kWh Sold Performance Indicators Survey, Part III, line 16 (EIA Form 861, Schedule 2, Part B, line 11 + line 12) *1000
10. Total O&M Expense (Excluding Power Supply Expense) per Retail Customer (Performance Indicators Survey, Part III, line 16) - (Performance Indicators Survey, part III, line 11) EIA Form 861, Schedule 4, Part A, Total Number of Customers (column e)
11. Total Power Supply Expense per kWh Sold Performance Indicators Survey, Part III, line 11 (EIA Form 861, Schedule 2, Part B, line 11 + line 12) *1000
12. Purchased Power Cost per kWh Performance Indicators Survey, part III, line 10 (EIA Form 861, Schedule 2, Part B, line 2 ) * 1000
13. Retail Customers per Meter Reader EIA Form 861, Schedule 4, Part A, Total Number of Customers (column e) Meter Readers (from Performance Indicators Survey, Part I, Section C
(Number of Meter Readers = Full Time + Part Time/2 + Contract)
14. Distribution O&M Expenses per Retail Customer Performance Indicators Survey, Part III, line 13 EIA Form 861, Schedule 4, Part A, Total Number of Customers (column e)
15. Distribution O&M Expenses per Circuit Mile Performance Indicators Survey, Part III, line 13 Performance Indicators Survey, Part II, Section A, Total Distribution Line Circuit Miles
16. Customer Accounting, Customer Service and Sales Expense per Retail Customer Performance Indicators Survey, Part III, line 14 EIA Form 861, Schedule 4, Part A, Total Number of Customers (column e)
17. Administrative and General Expenses per Retail Customer Performance Indicators Survey, Part III, line 15 EIA Form 861, Schedule 4, Part A, Total Number of Customers (column e)
18. Labor Expense per Worker-hour Total Labor Expense (Performance Indicators Survey, Part I) Total Hours Worked (Performance Indicators Survey, Part I)
Labor Expense = Full-Time Earnings + Part-time Earnings + Contractor Earnings Hours Worked = Full-Time Hours + Part-Time Hours + Contractor Hours (supervised by utility and supervised by contractor)
19. Energy Loss Percentage - Total Energy Losses to Total Sources of Energy EIA Form 861, Schedule 2, Part B, line 15 EIA Form 861, Schedule 2, Part B, line 10
To express as a percent, multiply the result by 100.
20. System Load Factor ((Total Sales + Total Energy Losses) / 8,760 hours per year) / Highest Hourly Peak Demand EIA Form 861, Schedule 2, Part B (line 11 + line 12 + line 15) / 8760 (EIA Form 861, Schedule 2, Part A, line 6)
To express as a percent, multiply the result by 100.
21. Capital Expenditures to Depreciation Expanse Capital Expenditures / Depreciation Expenses Performance Indicators Survey, Part II, Section D Performance Indicators Survey, Part III, line 6

40 FINANCIAL AND OPERATING RATIOS OF PUBLIC POWER UTILITIES
APPENDIX C: Regional Definitions
The regions used for this report correspond to regions of the North American Electric Reliability Corp. (NERC) as specified below.
REGION CORRESPONDING NERC REGION(S)
Northeast NPCC - Northeast Power Coordinating Council
Southeast SERC - Southeastern Electric Reliability Council FRCC – Florida Reliability Coordinating Council
North Central/Plains* MRO – Midwest Reliability Organization RFC – Reliability First Corporation
Southwest SPP – Southwest Power Pool TRE – Texas Reliability Entity
West WECC - Western Electricity Coordinating Council ASCC - Alaska Systems Coordinating Council
*: MAIN, ECAR, and MAAC joined to become the “Reliability First” NERC region, effective January 2006. However, the Energy Information Administration continues to identify utilities by their former NERC regions. The Association uses the former regions in establishing regional breakdowns to be consistent with prior reports.

FINANCIAL AND OPERATING RATIOS OF PUBLIC POWER UTILITIES 41
APPENDIX D: Utilities Included in the 2017 Report
ALABAMADecatur UtilitiesHuntsville UtilitiesRiviera UtilitiesScottsboro Electric Power Board Troy, City of
ARIZONAElectrical District No. 3 Pinal CountyNavajo Tribal Utility AuthoritySalt River Project
ARKANSAS Clarksville Light & Water Co.Hope Water & Light Commission Jonesboro City Water & Light Paragould City Light, Water & Cable CALIFORNIAAzusa Light & WaterGlendale Water & PowerModesto Irrigation DistrictPasadena Water and Power Department Redding, City ofRiverside Public Utilities Sacramento Municipal Utility DistrictSilicon Valley PowerTurlock Irrigation District COLORADOLoveland Water & Power
CONNECTICUTNorwich Public Utilities
FLORIDABeaches Energy ServiceJEAKeys Energy ServicesKissimmee Utility AuthorityLakeland ElectricOrlando Utilities CommissionTallahassee Electric Utility
GEORGIAMarietta Board of Lights & Water
ILLINOISSpringfield City Water, Light & PowerSt. Charles, City of
INDIANALawrenceburg Municipal UtilitiesRichmond Power and Light IOWAAmes, City ofCedar Falls UtilitiesDenison Municipal UtilitiesMuscatine Power & Water
KANSASKansas City Board of Public UtilitiesMcPherson Board of Public Utilities
KENTUCKYHenderson City Utility CommissionOwensboro Municipal Utilities LOUISIANALafayette Utilities System MASSACHUSETTSBraintree Electric Light DepartmentHolyoke Gas & ElectricMansfield Municipal Electric DepartmentTaunton Municipal Lighting PlantWestfield Gas & Electric Light Department MICHIGANBay City, City ofGrand Haven Board of Light & PowerLansing Board of Water & LightMarquette Board of Light & PowerTraverse City Light & PowerZeeland Board of Public Works
MINNESOTAALP Utilities Austin Utilities Brainerd Public UtilitiesElk River Municipal Utilities Grand Rapids Public Utilities Commission Marshall Municipal Utilities Owatonna Public Utilities Rochester Public Utilities Willmar Municipal Utilities MISSOURICarthage Water and Electric PlantChillicothe, City ofIndependence Power & Light Poplar Bluff Municipal Utilities & City Cable City Utilities of Springfield
MISSISSIPPIGreenwood Utilities Commission NEBRASKAGrand Island, City ofHastings, City of Lincoln Electric System Loup Power District Omaha Public Power DistrictSouthern Public Power District NEW MEXICOFarmington, City of
NEW YORKFairport, Village ofPlattsburgh Municipal Lighting Department NORTH CAROLINAFayetteville Public Works CommissionGreenville Utilities CommissionLexington, City ofMonroe, City ofRocky Mount, City of Shelby, City of OHIOBryan Municipal UtilitiesHudson Public Power Orrville, City ofWesterville Electric Division
OREGONCentral Lincoln People’s Utility District Clatskanie People’s Utility District Eugene Water & Electric BoardMcMinnville Water & LightNorthern Wasco County People’s Utility District Springfield Utility Board SOUTH CAROLINAOrangeburg, City of
SOUTH DAKOTAWatertown Municipal Utilities

42 FINANCIAL AND OPERATING RATIOS OF PUBLIC POWER UTILITIES
TENNESSEE Benton County Electric System Bristol Tennessee Essential Services Brownsville Utility Department Columbia Power & Water Systems Cookeville, City of Covington Electric System Jackson Energy Authority Lewisburg Electric System McMinnville Electric System Memphis Light, Gas and Water DivisionNashville Electric ServiceParis Board of Public UtilitiesPulaski Electric SystemRipley Power & Light Company Sevier County Electric System Tullahoma Utilities Authority TEXAS Austin EnergyBrownsville Public Utilities BoardBryan Texas Utilities College Station, City ofCPS Energy Denton Municipal ElectricGarland, City ofKerrville Public Utility Board Lubbock Power & Light
UTAHHeber Light & Power Co.Lehi CityProvo City Power
VERMONTBurlington Electric Department WASHINGTONBenton PUD Clallam County, Public Utility District No. 1 of Clark Public UtilitiesCowlitz County, Public Utility District No. 1 ofGrays Harbor County, Public Utility District No. 1 ofLewis County, Public Utility District No. 1 ofMason County, Public Utility District No. 3 ofSeattle City Light Tacoma Public Utilities WISCONSINManitowoc Public Utilities Marshfield Utilities Rice Lake Utilities Wisconsin Rapids Water Works & Lighting Commission

2451 Crystal DriveSuite 1000
Arlington, VA 22202-4804PublicPower.org