financial analysis report - · pdf file · 2016-10-17sa sa int’l (00178.hk)...
TRANSCRIPT
Sa Sa Int’l (00178.HK) &
Bonjour Hold (00653.HK)
Financial Analysis Report
2012-2014
Irene SONG Yinjin 14252309 Hong Kong Baptist University
JOUR 2006 Finance for Business Journalists Instructor: Mr. Clemence Poon
2015/11/29

Content
Summary ............................................................. 1
Common-Size Income Statement ......................... 3
Income Statement-YTY Comparison .................... 5
Common-Size Balance Sheet ................................ 7
Balance Sheet-YTY Comparison ......................... 10
Ratio Analysis .................................................... 13
Appendix ........................................................... 17
Irene SONG Yingjin
1
Summary
Sa Sa International Holdings (Chinese: 莎莎國際) (SEHK: 178) is a Hong Kong-based chain store company selling cosmetics, personal care, skin care and baby care products.
For the year ended 31 December 2014, Sasa’s turnover amounted to HK$8,756 million, representing an increase of 14.2% over the HK$7,670 million recorded last year. The Group’s profit for the year 2014 was HK$4,073 million, a decrease of 14.5% over the HK$3,558 million recorded last fiscal year. Basic earnings per share were HK33.0 cents, as compared to HK29.3 cents in the previous fiscal year. The overall gross profit margin of the Group for the full fiscal year increased to 46.52% from 46.39% last year.
The principal activity of Bonjour Holdings (Chinese:卓悅控股) (SEHK:653) is principally engaged in the retail and wholesale of beauty and health-care products and the operation of beauty and health salons in Hong Kong, Macau and the PRC.
For the year ended 31 December 2014, Bonjour’s turnover amounted to HK$3,144 million, representing an increase of 3.5% over the HK$3,039 million recorded last year. The Group’s profit for the year 2014 was HK$226 million, a decrease of 17.2% over the HK$273 million recorded last fiscal year. Basic earnings per share were HK6.6 cents, as compared to HK8.3 cents in the previous fiscal year. The overall gross profit margin of the Group for the full fiscal year increased to 47.68% from 47.35% last year.
Sasa has a great name and good brand so it attracts big cosmetic names and customers trust it for the brands it sells, especially tourists from mainland China. Also it has advantages in going overseas market. Compared with Bonjour, Sasa is a larger enterprise and performs better than Bonjour generally, statistically speaking. But Bonjour also is a company with good development, and its gross profit margins were even a little bit higher than Sasa’s. And for stock investors, Bonjour’s price was much cheaper and the return of investment was considerable.
In recent years, the overall retail market in Hong Kong was challenging. The retail industry sailed through ups and downs throughout the year as a result of the instabilities of the external environment and the change of Mainland tourists’ consumption pattern. According to the statistics in 2014 released by the Census and Statistics Department, the total retail sales value edged down 0.2% to HK$493.3 billion compare to 2013. Hong Kong’s annual retail sales figures fell for the first time since the SARS outbreak in 2003.Given the current social unrest expelling the PRC tourist inflow to Hong Kong and the change in tourist mix with less spending pattern, Sasa and Bonjour are inevitably facing a challenging environment. As the two cosmetics retail giants in Hong Kong even Asia, their financial performance can be used as a benchmark of this industry.
Irene SONG Yingjin
2
This report consists the Common-Size Income Statement, Income Statement- YTY comparison, Common-Size Balance Sheets, Balance Sheets-YTY Comparison and Ratio Analysis of Sasa and Bonjour in 2014,2013 and 2012, and comments followed.
Irene SONG Yingjin
3
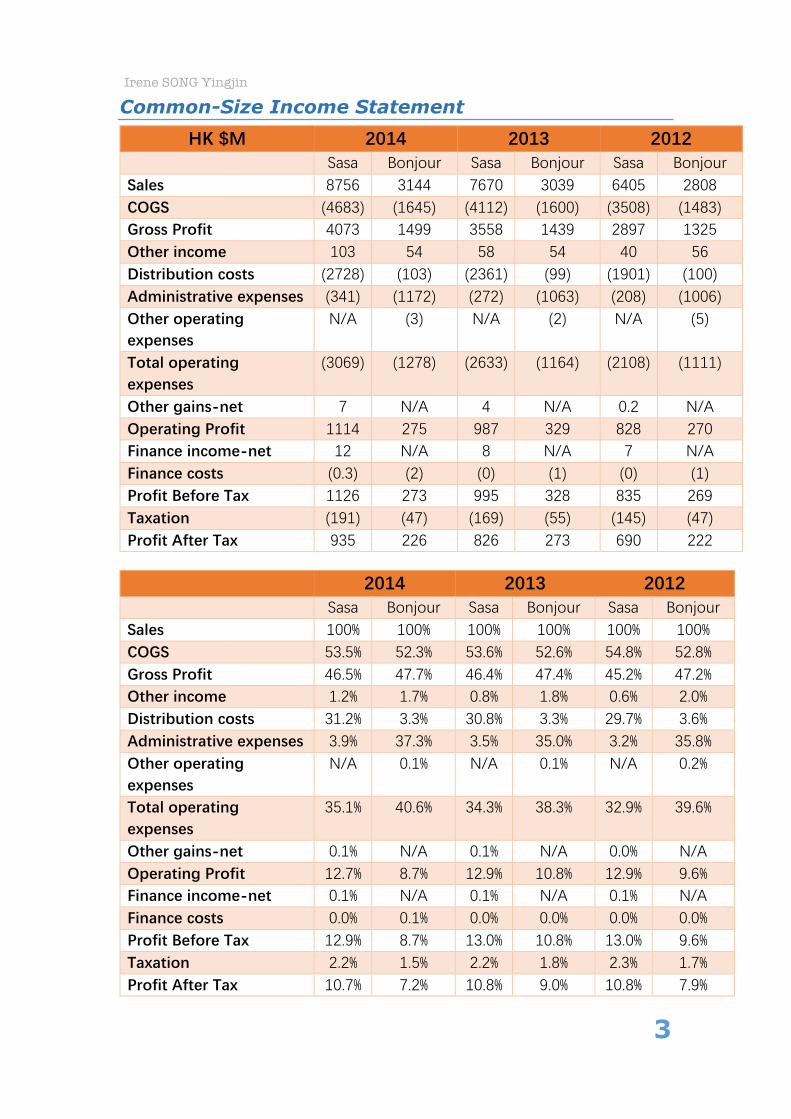
Common-Size Income Statement HK $M 2014 2013 2012
Sasa Bonjour Sasa Bonjour Sasa Bonjour Sales 8756 3144 7670 3039 6405 2808 COGS (4683) (1645) (4112) (1600) (3508) (1483) Gross Profit 4073 1499 3558 1439 2897 1325 Other income 103 54 58 54 40 56 Distribution costs (2728) (103) (2361) (99) (1901) (100) Administrative expenses (341) (1172) (272) (1063) (208) (1006) Other operating expenses
N/A (3) N/A (2) N/A (5)
Total operating expenses
(3069) (1278) (2633) (1164) (2108) (1111)
Other gains-‐net 7 N/A 4 N/A 0.2 N/A Operating Profit 1114 275 987 329 828 270 Finance income-‐net 12 N/A 8 N/A 7 N/A Finance costs (0.3) (2) (0) (1) (0) (1) Profit Before Tax 1126 273 995 328 835 269 Taxation (191) (47) (169) (55) (145) (47) Profit After Tax 935 226 826 273 690 222
2014 2013 2012
Sasa Bonjour Sasa Bonjour Sasa Bonjour Sales 100% 100% 100% 100% 100% 100% COGS 53.5% 52.3% 53.6% 52.6% 54.8% 52.8% Gross Profit 46.5% 47.7% 46.4% 47.4% 45.2% 47.2% Other income 1.2% 1.7% 0.8% 1.8% 0.6% 2.0% Distribution costs 31.2% 3.3% 30.8% 3.3% 29.7% 3.6% Administrative expenses 3.9% 37.3% 3.5% 35.0% 3.2% 35.8% Other operating expenses
N/A 0.1% N/A 0.1% N/A 0.2%
Total operating expenses
35.1% 40.6% 34.3% 38.3% 32.9% 39.6%
Other gains-‐net 0.1% N/A 0.1% N/A 0.0% N/A Operating Profit 12.7% 8.7% 12.9% 10.8% 12.9% 9.6% Finance income-‐net 0.1% N/A 0.1% N/A 0.1% N/A Finance costs 0.0% 0.1% 0.0% 0.0% 0.0% 0.0% Profit Before Tax 12.9% 8.7% 13.0% 10.8% 13.0% 9.6% Taxation 2.2% 1.5% 2.2% 1.8% 2.3% 1.7% Profit After Tax 10.7% 7.2% 10.8% 9.0% 10.8% 7.9%
Irene SONG Yingjin
4
Comments [1]. In 2014, 2013 and 2012, Sa Sa’s revenue was about three times as much
as that of Bonjour, so the business scale of Sasa was larger. Main reasons are as follows: Firstly, Sasa established 280 retail stores in Hong Kong, Macau, Mainland China, Singapore, Malaysia and Taiwan, but Bonjour only had 47 stores in Hong Kong, Macau and Mainland China. Secondly, the performance of Sasa’s e-commerce was strong as turnover for sasa.com amounted to HK$394.0 million in 2014, a rise of 2.6% over the previous fiscal year. And turnover from Bonjour’s e-commerce amounted to HK$44.8 million, a decrease of 13.8% over the previous fiscal year. Thirdly, Sasa continued to implement the its diversification strategy in the product categories as well as to broaden its appeal to segments such as the young people segment and home DIY sector, so Sasa had a more various types of brands for different kinds of customers to choose.
[2]. Bonjour’s cost of goods sold accounted for about 1% or 2% lower than that
of Sasa in total sales, which made the proportion of Bonjour’s gross profit higher. Because medium and low level products constituted a larger part of Bonjour’s structure of products. Bonjour introduced a series of Korean skincare and cosmetic products as Korean products have been increasingly popular and its overall average selling price is in general lower than that of European and Japanese brands.
[3]. The proportions of total operating expenses of Sasa and Bonjour are
around 34% and 39% relatively, so Bonjour paid more for operating expenses. Mainly due to Bonjour spent more on promotion. In order to raise the visibility of exclusive brands, Bonjour has invited well-known artists to participate in its brand ambassadors from Hong Kong and Korea, including Miss Ada Choi, Miss Cecilia Wang, Miss Tracy Ip, Miss Queenie Chu and Miss Sherman Chung for the retail sectors spokeswomen.
[4]. Due to much higher operating overheads, Bonjour’s operating profit and
profit after tax were lower than that of Sasa even though the former had higher gross profit, so Sasa got a better result of its ordinary activities than Bonjour.

Irene SONG Yingjin
5
Income Statement-YTY Comparison Sasa
HK $M 2014 2013 △% 2013 2012 △% Sales 8756 7670 14.2% 7670 6405 19.8% COGS 4683 4112 13.9% 4112 3508 17.2% Gross Profit 4073 3558 14.5% 3558 2897 22.8% Other income 103 58 77.6% 58 40 45.0% Distribution costs 2728 2361 15.5% 2361 1901 24.2% Administrative expenses
341 272 25.4% 272 208 30.8%
Total operating expenses
3069 2633 16.6% 2633 2108 24.9%
Other gains-‐net 7 4 75.0% 4 0.2 1900.0% Operating Profit 1114 987 12.9% 987 828 19.2% Finance income-‐net 12 8 50.0% 8 7 14.3% Profit Before Tax 1126 995 13.2% 995 835 19.2% Taxation 191 169 13.0% 169 145 16.6% Profit After Tax 935 826 13.2% 826 690 19.7%
Comments [1]. In 2014, retail and wholesale turnover of the Group recorded an increase
of 14.2% year-to-year yet, the growth of sales slowed down compared to 2013 when the increase is 19.8% from 2012. Similarly, the expansion rate of gross profit also fell from 22.8% to 14.5%. In 2014, the overall retail market in Hong Kong was challenging. The retail industry sailed through ups and downs throughout the year as a result of the instabilities of the external economic environment and the change of Mainland tourists’ consumption pattern. In addition, in the second half of 2014, the unstable political environment and social movement “Occupy Protest” which began in late September also struck a blow to Hong Kong retail market. The sales and gross profit growth, as a result, were impacted.
[2]. The change rate of other income increased significantly from 45.0% to 77.6%, because the Group increased the sub-lease income in 2014 as stated in Notes to Consolidated Financial Statements 2 of Sasa Annual Report 2013/14.
[3]. The expansion of operating expenses and its segments all slowed down, which indicates the volume of business was going down and the Group also tried to limit the supporting costs of the sales in the challenging retail market situation.
[4]. The growth rate of operating profit declined from 19.2% to 12.9% and the profit after tax dropped from 19.7% to 13.2%, which means the Group’s ordinary activity is going down.

Irene SONG Yingjin
6
Bonjour HK $M 2014 2013 △% 2013 2012 △%
Sales 3144 3039 3.5% 3039 2808 8.2% COGS 1645 1600 2.8% 1600 1483 7.9% Gross Profit 1499 1439 4.2% 1439 1325 8.6% Other income 54 54 0.0% 54 56 -‐3.6% Distribution costs 103 99 4.0% 99 100 -‐1.0% Administrative expenses
1172 1063 10.3% 1063 1006 5.7%
Other operating expenses
3 2 50.0% 2 5 -‐60.0%
Total operating expenses
1278 1164 9.8% 1164 1111 4.8%
Operating profit 275 329 -‐16.4% 329 270 21.9% Finance cost 2 1 100.0% 1 1 0.0% Profit before tax 273 328 -‐16.8% 328 269 21.9% Taxation 47 55 -‐14.5% 55 47 17.0% Profit After Tax 226 273 -‐17.2% 273 222 23.0%
Comments [1]. During the three years, sales and gross profit of the Group showed a
continuous growth, but the rate of growth slowed down in 2014 compared with 2013. Both sales and gross profit margin of retail business slowdown were mainly due to lesser consumer spending in the second half of the year. This weakening reflected the change of consumers’ appetite and the change of the tourist consumption pattern.
[2]. The growth rate of operating expenses increased from 4.8% to 9.8%, mainly due to more expenses on brand promotion to appeal customers.
[3]. For the group, the finance costs are mainly from interest expense on bank
borrowings and finance leases charges as stated in Notes to the Financial Statements 9 of Bonjour 2014 Annual Report. And in 2014, the interest expense on bank borrowings doubled in the not wholly repayable part as the Group borrowed more from bank.
[4]. The profit before tax and the profit after tax both decreased and showed a
negative growth, which indicated the Group performed quite poorly and weak resistance in difficult market environment.
Irene SONG Yingjin
7
Common-Size Balance Sheet
HK $M 2014 2013 2012 Sasa Bonjour Sasa Bonjour Sasa Bonjour
Property, plant and equipment 405 749 343 79 333 93 Rental deposits, prepayments
and other assets 215 87 215 83 133 113
Deferred tax assets 4 3 5 4 5 2 Total non-‐current assets 624 839 563 166 471 207
Inventories 1373 261 1235 271 1191 248 Trade receivables 52 43 93 66 70 61
Other receivables, deposits and prepayments
198 92 154 125 136 81
Time deposits 571 19 209 19 36 19 cash and cash equivalents 419 189 543 368 563 299
Assets classified as held for sale 106 Total current assets 2613 710 2234 849 1996 708
Total Assets 3237 1549 2797 1015 2467 915 Trade payables 392 170 411 201 451 160
Other payables and accruals 302 89 317 334 289 345 Income tax payable 84 14 63 31 68 35
Borrowings and loans 80 193 N/A 45 N/A 39 Liabilities directly associated with assets classified
as held for sale N/A 240 N/A N/A N/A N/A
Total current liabilities 858 706 791 611 808 579 Retirement benefit obligations 6 4 3 3 3 6
Bank borrowings N/A 232 N/A N/A N/A N/A Deferred tax liabilities 0.3 N/A 2 1 4 N/A
Other payables 49 29 25 2 21 6 Total non-‐current Liabilities 55 265 30 6 28 12
Total Liabilities 913 971 821 617 836 591 Share Capital 284 34 283 30 281 30
Reserves 2041 543 1692 369 1349 295 Total Equity 2325 577 1975 399 1630 325
Total Liabilities and Equity 3238 1548 2796 1016 2466 916

Irene SONG Yingjin
8
2014 2013 2012 Sasa Bonjour Sasa Bonjour Sasa Bonjour
Property, plant and equipment
12.5% 48.4% 12.3% 7.8% 13.5% 10.2%
Rental deposits, prepayments and other assets
6.6% 5.6% 7.7% 8.2% 5.4% 12.3%
Deferred tax assets 0.1% 0.2% 0.2% 0.4% 0.2% 0.2% Total non-‐current assets 19.3% 54.2% 20.1% 16.4% 19.1% 22.6%
Inventories 42.4% 16.8% 44.2% 26.7% 48.3% 27.1% Trade receivables 1.6% 2.8% 3.3% 6.5% 2.8% 6.7%
Other receivables, deposits and prepayments
6.1% 5.9% 5.5% 12.3% 5.5% 8.9%
Time deposits 17.6% 1.2% 7.5% 1.9% 1.5% 2.1% cash and cash equivalents 12.9% 12.2% 19.4% 36.3% 22.8% 32.7%
Total current assets 80.7% 45.8% 79.9% 83.6% 80.9% 77.4% Total Assets 100.0% 100% 100% 100% 100% 100%
Trade payables 12.1% 11.0% 14.7% 19.8% 18.3% 17.5% Other payables and accruals 9.3% 5.7% 11.3% 32.9% 11.7% 37.7%
Income tax payable 2.6% 0.9% 2.3% 3.1% 2.8% 3.8% Borrowings and loans 2.5% 12.5% N/A 4.4% N/A 4.3%
Total current liabilities 26.5% 45.6% 28.3% 60.1% 32.8% 63.2% Retirement benefit
obligations 0.2% 0.3% 0.1% 0.3% 0.1% 0.7%
Bank borrowings N/A 15.0% N/A N/A N/A N/A Deferred tax liabilities 0.0% N/A 0.1% 0.1% 0.2% N/A
Other payables 1.5% 1.9% 0.9% 0.2% 0.9% 0.7% Total non-‐current Liabilities 1.7% 17.1% 1.1% 0.6% 1.1% 1.3%
Total Liabilities 28.2% 62.7% 29.4% 60.7% 33.9% 64.5% Share Capital 8.8% 2.2% 10.1% 3.0% 11.4% 3.3%
Reserves 63.0% 35.1% 60.5% 36.3% 54.7% 32.2% Total Equity 71.8% 37.3% 70.6% 39.3% 66.1% 35.5%
Total Liabilities and Equity 100.0% 100% 100% 100% 100% 100%
Irene SONG Yingjin
9
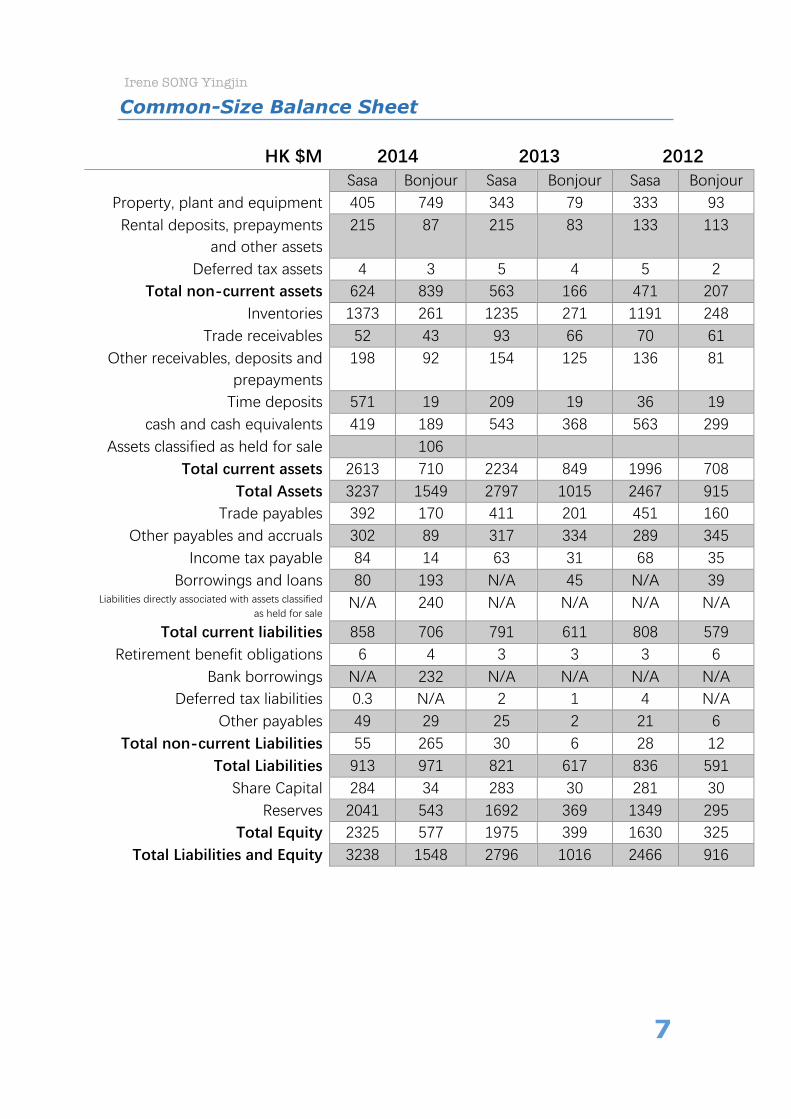
Comments [1]. In 2014, the percentage of Bonjour’s non-current assets was as much as
54.2%, because at 31 December 2014 the carrying amount of land and buildings pledged as security for the Group’s bank borrowings amounted to HK$693,851,000, adding its medium-term leases in Hong Kong (stated in Notes to the Financial Statements 17 of Bonjour 2014 Annual Report). Besides, in other fiscal years, the current assets of Sasa and Bonjour commanded a bigger slice at about 80% in total assets. This indicates the two companies had enough liquidity.
[2]. In the three years, the amount of Sasa’s total current assets and non-current assets was much more than that of Bonjour, which means Sasa is a larger-scale enterprise as it processes more assets.
[3]. The percentages of Bonjour’s current liabilities in total liabilities and equity were quite high at about 61% in 2012 and 2013, mainly due to the large amount of other payables and accruals.
[4]. The two companies performed quite differently in borrowings and loans. For Sasa, the only borrowings it got at 31 March 2014, which was short term bank borrowings of a subsidiary of the Company are secured by a corporate guarantee given by the Company as stated in Notes to Consolidated Financial Statements 23 of Sa Sa Annual Report 2013/14. But Bonjour got bank borrowings on demand or within one year repayable every year, and in 2014, the percentage of bank borrowings making up total liabilities and equities was as much as 12.5%, which means Bonjour was under a relatively high leverage risk. Besides, Bonjour also got a large amount of long-term bank borrowings at 15.0%, this indicates its bad management situation.
[5]. During the three years, the proportions of total liabilities to total equity were about 3:7 for Sasa, but these were around 6:4 for Bonjour. These mean that Sasa relied more on shareholders’ equity, but Bonjour depended more on debt.
Irene SONG Yingjin
10
Balance Sheet-YTY Comparison Sasa
HK $M 2014 2013 △% 2013 2012 △% Property ,plant and equipment 405 343 18.1% 343 333 3.0%
Rental deposits, prepayments and other assets
215 215 0.0% 215 133 61.7%
Deferred tax assets 4 5 -‐20.0% 5 5 0.0% Total non-‐current assets 624 563 10.8% 563 471 19.5%
Inventories 1373 1235 11.2% 1235 1191 3.7% Trade receivables 52 93 -‐44.1% 93 70 32.9%
Other receivables, deposits and prepayments
198 154 28.6% 154 136 13.2%
Time deposits 571 209 173.2% 209 36 480.6% cash and cash equivalents 419 543 -‐22.8% 543 563 -‐3.6%
Total current assets 2613 2234 17.0% 2234 1996 11.9% Total Assets 3237 2797 15.7% 2797 2467 13.4%
Trade payables 392 411 -‐4.6% 411 451 -‐8.9% Other payables and accruals 302 317 -‐4.7% 317 289 9.7%
Income tax payable 84 63 33.3% 63 68 -‐7.4% Borrowings and loans 80 N/A N/A N/A N/A N/A
Total current liabilities 858 791 8.5% 791 808 -‐2.1% Retirement benefit obligations 6 3 100.0% 3 3 0.0%
Deferred tax liabilities 0.3 2 -‐85.0% 2 4 -‐50.0% Other payables 49 25 96.0% 25 21 19.0%
Total non-‐current Liabilities 55 30 83.3% 30 28 7.1% Total Liabilities 913 821 11.2% 821 836 -‐1.8%
Share Capital 284 283 0.4% 283 281 0.7% Reserves 2041 1692 20.6% 1692 1349 25.4%
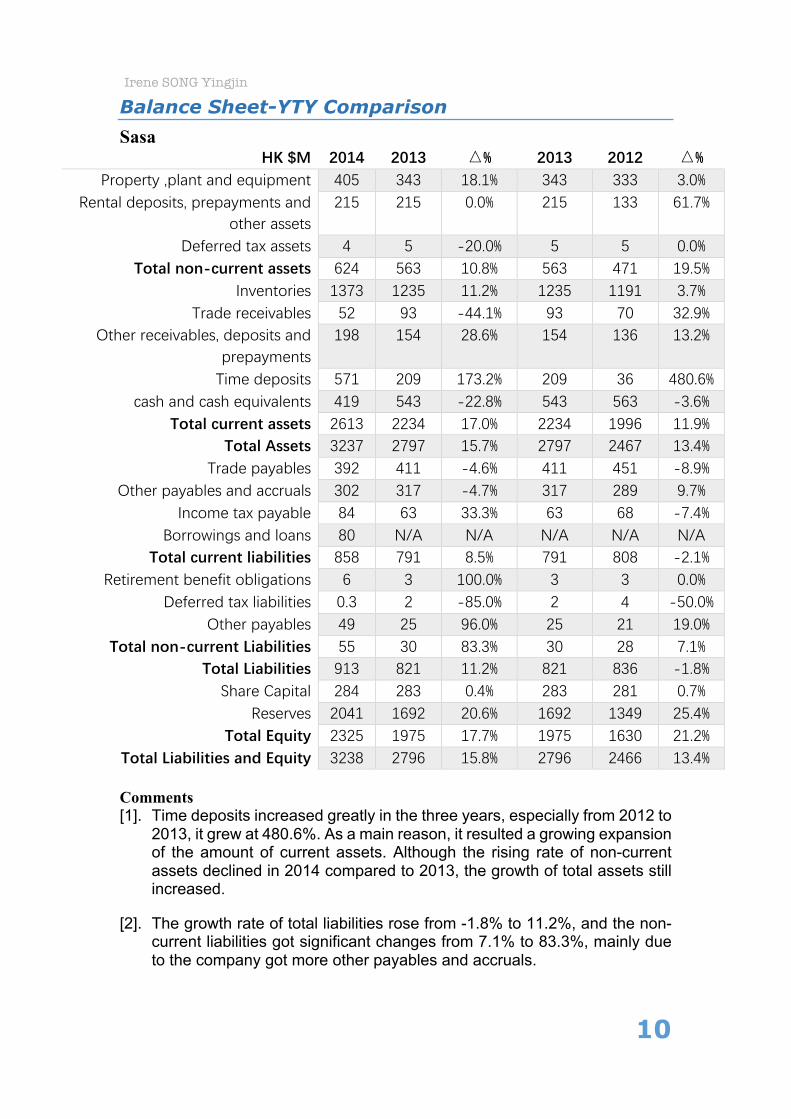
Total Equity 2325 1975 17.7% 1975 1630 21.2% Total Liabilities and Equity 3238 2796 15.8% 2796 2466 13.4% Comments [1]. Time deposits increased greatly in the three years, especially from 2012 to
2013, it grew at 480.6%. As a main reason, it resulted a growing expansion of the amount of current assets. Although the rising rate of non-current assets declined in 2014 compared to 2013, the growth of total assets still increased.
[2]. The growth rate of total liabilities rose from -1.8% to 11.2%, and the non-current liabilities got significant changes from 7.1% to 83.3%, mainly due to the company got more other payables and accruals.
Irene SONG Yingjin
11
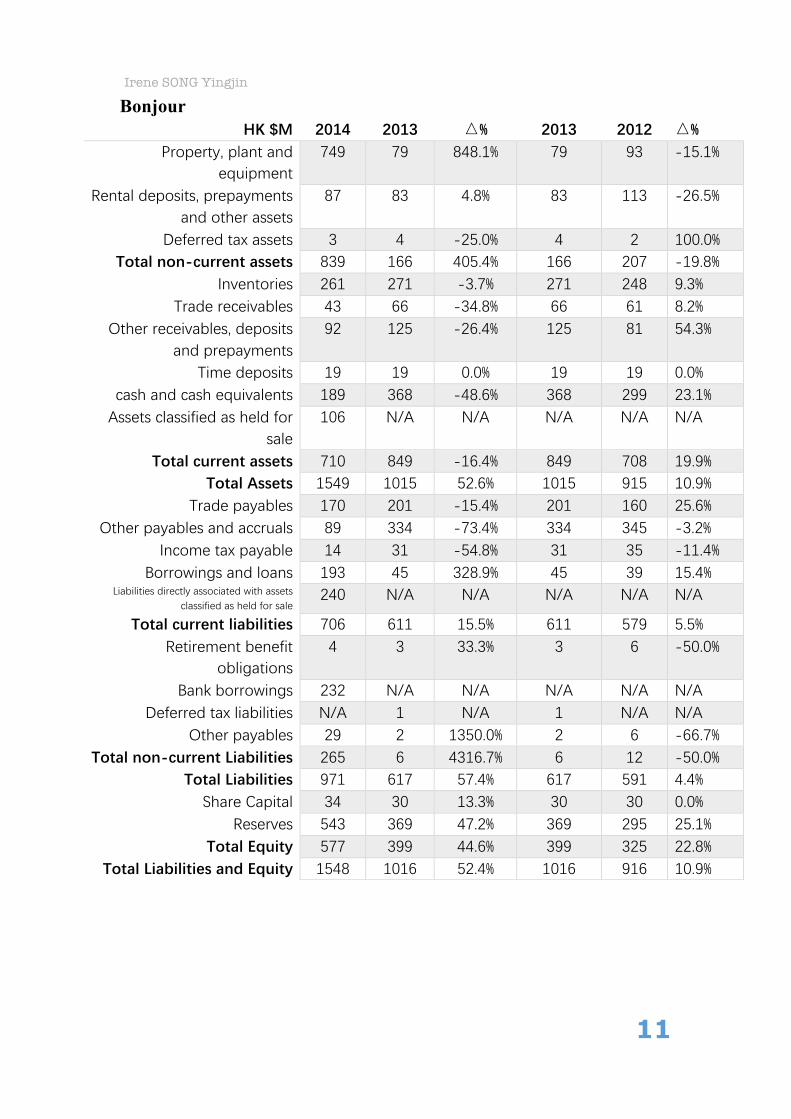
Bonjour
HK $M 2014 2013 △% 2013 2012 △% Property, plant and
equipment 749 79 848.1% 79 93 -‐15.1%
Rental deposits, prepayments and other assets
87 83 4.8% 83 113 -‐26.5%
Deferred tax assets 3 4 -‐25.0% 4 2 100.0% Total non-‐current assets 839 166 405.4% 166 207 -‐19.8%
Inventories 261 271 -‐3.7% 271 248 9.3% Trade receivables 43 66 -‐34.8% 66 61 8.2%
Other receivables, deposits and prepayments
92 125 -‐26.4% 125 81 54.3%
Time deposits 19 19 0.0% 19 19 0.0% cash and cash equivalents 189 368 -‐48.6% 368 299 23.1%
Assets classified as held for sale
106 N/A N/A N/A N/A N/A
Total current assets 710 849 -‐16.4% 849 708 19.9% Total Assets 1549 1015 52.6% 1015 915 10.9%
Trade payables 170 201 -‐15.4% 201 160 25.6% Other payables and accruals 89 334 -‐73.4% 334 345 -‐3.2%
Income tax payable 14 31 -‐54.8% 31 35 -‐11.4% Borrowings and loans 193 45 328.9% 45 39 15.4%
Liabilities directly associated with assets classified as held for sale
240 N/A N/A N/A N/A N/A
Total current liabilities 706 611 15.5% 611 579 5.5% Retirement benefit
obligations 4 3 33.3% 3 6 -‐50.0%
Bank borrowings 232 N/A N/A N/A N/A N/A Deferred tax liabilities N/A 1 N/A 1 N/A N/A
Other payables 29 2 1350.0% 2 6 -‐66.7% Total non-‐current Liabilities 265 6 4316.7% 6 12 -‐50.0%
Total Liabilities 971 617 57.4% 617 591 4.4% Share Capital 34 30 13.3% 30 30 0.0%
Reserves 543 369 47.2% 369 295 25.1% Total Equity 577 399 44.6% 399 325 22.8%
Total Liabilities and Equity 1548 1016 52.4% 1016 916 10.9%
Irene SONG Yingjin
12
Comments [1]. The expansion rate of non-current assets increased amazingly from -
19.8% to 405.4%, because the change rate of property, plant and equipment soared from -15.1% to 848.1%. The current assets increased at 19.9% from 2012 to 2013, but decreased at 16.4% in 2014. That is the amount of non-current assets rose quite a lot, but the number of current assets dropped slightly. Offsetting each other, the increasing rate of total assets rose from 10.9% to 52.6%.
[2]. The change rate of current liabilities climbed from 5.5% to 15.5%, and the increase of borrowings and loans was the greatest, as it lifted 328.9% from 2013 to 2014. And the change rate of non-current liabilities went up from -50.0% to 4316.7%, as the significant rise in bank borrowings and other payables. So the rising rate of total liabilities also went up from 4.4% to 57.4% greatly. To sum up, from 2012 to 2014, the company was increasingly depending on liabilities, which showed a bad situation of operation and financing, so the Group had the increasing level of risks.
[3]. The growth rate of equity increased from 22.8% to 44.6%, and the reserves increased from 25.1% to 47.2%, mainly because of great increases of share premium and retained profit stated in Notes to the Financial Statements 31 of Bonjour 2014 Annual Report.
Irene SONG Yingjin
13
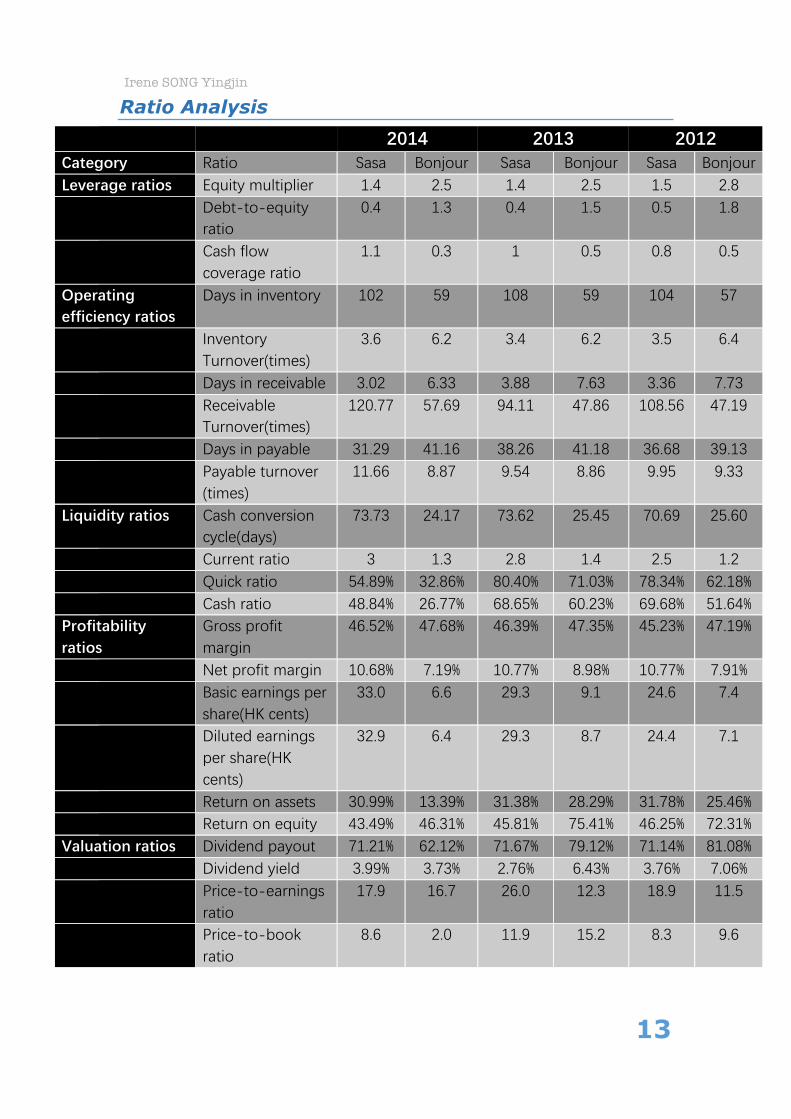
Ratio Analysis 2014 2013 2012 Category Ratio Sasa Bonjour Sasa Bonjour Sasa Bonjour Leverage ratios Equity multiplier 1.4 2.5 1.4 2.5 1.5 2.8 Debt-‐to-‐equity
ratio 0.4 1.3 0.4 1.5 0.5 1.8
Cash flow coverage ratio
1.1 0.3 1 0.5 0.8 0.5
Operating efficiency ratios
Days in inventory 102 59 108 59 104 57
Inventory Turnover(times)
3.6 6.2 3.4 6.2 3.5 6.4
Days in receivable 3.02 6.33 3.88 7.63 3.36 7.73 Receivable
Turnover(times) 120.77 57.69 94.11 47.86 108.56 47.19
Days in payable 31.29 41.16 38.26 41.18 36.68 39.13 Payable turnover
(times) 11.66 8.87 9.54 8.86 9.95 9.33
Liquidity ratios Cash conversion cycle(days)
73.73 24.17 73.62 25.45 70.69 25.60
Current ratio 3 1.3 2.8 1.4 2.5 1.2 Quick ratio 54.89% 32.86% 80.40% 71.03% 78.34% 62.18% Cash ratio 48.84% 26.77% 68.65% 60.23% 69.68% 51.64% Profitability ratios
Gross profit margin
46.52% 47.68% 46.39% 47.35% 45.23% 47.19%
Net profit margin 10.68% 7.19% 10.77% 8.98% 10.77% 7.91% Basic earnings per
share(HK cents) 33.0 6.6 29.3 9.1 24.6 7.4
Diluted earnings per share(HK cents)
32.9 6.4 29.3 8.7 24.4 7.1
Return on assets 30.99% 13.39% 31.38% 28.29% 31.78% 25.46% Return on equity 43.49% 46.31% 45.81% 75.41% 46.25% 72.31% Valuation ratios Dividend payout 71.21% 62.12% 71.67% 79.12% 71.14% 81.08% Dividend yield 3.99% 3.73% 2.76% 6.43% 3.76% 7.06% Price-‐to-‐earnings
ratio 17.9 16.7 26.0 12.3 18.9 11.5
Price-‐to-‐book ratio
8.6 2.0 11.9 15.2 8.3 9.6

Irene SONG Yingjin
14
Comments
Leverage
[1]. As Bonjour’s equity multiplier and debt-to-equity ratio both are higher than Sasa’s, Bonjour relied more on debt to finance its assets, so it had a higher financial risk.
[2]. Sasa’s cash flow coverage ratios were higher, which means Sasa had more amount of debts covered by cash flow generated from operating activities, so Sasa was under lower leverage risk.
Operating efficiency
[1]. Sasa held the inventory for a longer time, which was almost doubled as long as Bonjour’s days in inventory. So Sasa performed less efficiently in selling inventories due to it had more retail stores and larger volume. The slower a company can sell its inventories, the slower a company can begin to settle the account receivables and solve its own debts. And the inventory turnover of Sasa was much less than that of Bonjour because the proportion of inventories to total assets of Sasa was higher.
[2]. Bonjour’s days in receivables were almost Sasa’s twice, contrarily, Sasa’s receivable turnover was Bonjour’s two times. This indicated that Sasa had a better account management than Bonjour.
[3]. Bonjour took more days to pay its creditor than Sasa, and Sasa’s payable turnover was a bit of higher than Bonjour’s. So for suppliers, Bonjour had longer payment days.
Liquidity
[1]. Sasa had a really high liquidity, as its short-term assets had covered its immediate liabilities at about 2.8:1 in the three years. As for Bonjour, it still had enough short-term assets to cover its current liabilities, but it was not so liquid as Sasa. That could be risky for Bonjour, if there is an urgent crisis situation.
[2]. Sasa had higher quick ratios, which means it had more current assets that were more easily and quickly converted into cash compared with current liabilities. For both of the two companies, the quick ratios decreased significantly in 2014, which indicates potential liquidity risk.
[3]. Sasa’s cash ratios were higher than those of Bonjour in the three years, which indicates that Sasa had a higher and more reliable liquidity in a crisis situation. So for creditors, lending money to Sasa was more reliable. But from 2012 to 2014, the cash ratios of the two companies had a decreasing trend, which means the two companies tried to improve their asset utilization to hold less amounts of cash and they need to decrease the cash held to put into other uses to resist the economic downturn. But they should take care to make sure that companies had enough liquidity.

Irene SONG Yingjin
15
Profitability
[1]. The gross profit margins of Bonjour were a bit higher than these of Sasa, mainly because Bonjour sold diversified products and for the same products, Bonjour’s prices were always lower than Sasa’s. As Sasa and Bonjour are two of the most influential cosmetic retailers, their figures indicated the gross profit of the whole cosmetics retailing industry is around 46%.
[2]. Sasa’s net profit margins were higher than Bonjour’s, which means Sasa had higher operating efficiency and profitability from 2012 to 2014.
[3]. As for Basic EPS and Diluted EPS, Sasa’s EPS was almost as five times
much as than of bonjour, which means Sasa generated much more profit by per dollar of assets.
[4]. Return on assets of Sasa remained at around 31% for three years and was
higher than that of Bonjour, which means Sasa generated more profit by per dollar assets. But the return on assets of Bonjour decreased greatly in 2014 mainly because its total assets increased greatly at 52.6% from 2013 to 2014 as stated in Balance Sheet- YTY comparison.
[5]. Return on equity of Bonjour was higher than that of Sasa, which means
Bonjour generated more profit by per dollar of shareholder’s equity. And Sasa’s return on equity kept at 45% in the three years, but Bonjour’s ratio had fallen from 72.31% and 75.41% to 46.31% due to its total equity increased hugely at 44.6% from 2013 to 2014 compared with the growth rate was 22.8% from 2012 to 2013 as stated in Balance Sheet- YTY comparison.
Valuation
[1]. In 2013 and 2012, Bonjour’s dividend payout ratios were higher than Sasa’s, but in 2014, Bonjour’s dividend payout was around 10 percent lower than Sasa’s. This means the percentage of earnings the Bonjour pays out as dividends to shareholders decreased. In the past, investors who sought for higher current income may prefer to buy Bonjour’s stocks, but Sasa’s stocks seems more attractive for them now.
[2]. In 2013 and 2012, Bonjour’s dividend yield was much higher than that of Sasa, which indicates Bonjour pays out more in dividends each year relative to its share price. However, in 2014, Sasa’s dividend yield was approximately equal to Bonjour’s, this means the two stocks had similar return on investment in the absence of any capital gains. With the overall consideration of Basic EPS, Diluted EPS, dividend payout and dividend yield, Sasa seemed to be a better choice than Bonjour for investors.

Irene SONG Yingjin
16
[3]. From fiscal 2012 to 2014, Sasa’s price-to-earnings ratios were higher than Bonjour’s, which means an investor pays more for Sasa’s per dollar earnings. And Sasa’ P/E ratio decreased significantly in 2014. Because the share price dropped at 22.6% and Basic EPS increased at 12.63. This indicated a faster investment recovery time, less investment risks and higher investment value of stock.
Sasa 2014 2013 △% 2013 2012 △% share prices 5.89 7.61 -‐22.60% 7.61 4.66 63.30%
Basic EPS 33 29.3 12.63% 29.3 24.6 19.11%
Bonjour 2014 2013 △% 2013 2012 △% share prices 1.1 1.12 -‐1.79% 1.12 0.85 31.76%
Basic EPS 6.6 9.1 -‐27.47% 9.1 7.4 22.97%
[4]. In 2013 and 2012, Bonjour had higher price-to-book ratios than Sasa, which means investors paid more for per dollar of Bonjour’s net asset, so Bonjour’s stock had higher investment risks. However, in 2014, Bonjour’s P/B ratio slumped from 15.2 to 2.0, as its share price dropped at 1.79% but net asset value soared at 45.23%.
Sasa 2014 2013 △% 2013 2012 △% share prices 5.89 7.61 -‐22.60% 7.61 4.66 63.30%
net asset value 2324 1976 17.61% 1976 1631 21.15%
Bonjour 2014 2013 △% 2013 2012 △% share prices 1.1 1.12 -‐1.79% 1.12 0.85 31.76%
net asset value 578 398 45.23% 398 324 22.84%

Irene SONG Yingjin
17
Appendix 2014 2013 2012
Sasa Bonjour Sasa Bonjour Sasa Bonjour *Average share prices(HK dollars)
5.89 1.1 7.61 1.12 4.66 0.85
Dividend per share(HK cents)
23.5 4.1 21 7.2 17.5 6
Net cash generated from operating activities (HK millions)
1021 252 846 292 640 282
*The share prices are calculated from the average numbers of every trading day’s closing prices of the whole year.
-------------------------------------------- End -------------------------------------------------