financial analysis - prysmian sp¨a develops, designs, produces, supplies a…
DESCRIPTION
TRANSCRIPT

21.02.2013
Ticker: Prysmian SpA Benchmark:
Currency: BrsaItaliana: PRY, Currency: EUR FTSE MIB INDEX (FTSEMIB)
Sector: Industrials Industry: Electrical Equipment Year:
Telephone 39-02-64491 Revenue (M) Business Segments in EUR Sales (M) Geographic Segments in EUR Sales (M)
Website www.prysmian.com No of Employees Electrical Wire Contractor 6268 Europe & Africa 4851
Address Viale Sarca 222 Milano, 20126 Italy Communications Lines Contractor 1315 Asia & Oceania 1130
Share Price Performance in EUR North America 920
Price 15.57 1M Return -1.6% South America 682
52 Week High 16.42 6M Return 13.7%
52 Week Low 10.55 52 Wk Return 18.7%
52 Wk Beta 0.86 YTD Return 3.7%
Credit Ratings
Bloomberg IG8
S&P - Date - Outlook -
Moody's - Date - Outlook -
Fitch - Date - Outlook -
Valuation Ratios
12/08 12/09 12/10 12/11 12/12E 12/13E 12/14E
P/E 8.4x 8.7x 15.5x - 12.8x 10.6x 9.3x
EV/EBIT 6.4x 6.3x 8.7x 8.6x - - -
EV/EBITDA 5.5x 5.4x 6.9x 5.8x 7.8x 7.1x 6.5x
P/S 0.4x 0.6x 0.5x 0.3x 0.4x 0.4x 0.4x
P/B 4.4x 3.2x 3.0x 1.9x 2.7x 2.3x 1.9x
Div Yield 3.8% 3.4% 1.3% 2.2% 1.6% 2.1% 2.5%
Profitability Ratios %
12/08 12/09 12/10 12/11 12/12E 12/13E 12/14E
Gross Margin 39.2 44.8 35.2 35.2 - - -
EBITDA Margin 9.3 13.3 9.4 7.2 7.8 8.4 8.7
Operating Margin 8.0 11.4 7.4 4.8 5.5 6.2 6.7
Profit Margin 4.6 6.6 3.2 -1.8 3.1 3.7 4.2
Return on Assets 7.8 8.1 4.3 -2.8 - - -
Return on Equity 53.9 44.1 20.7 -15.1 19.4 21.5 21.3
Leverage and Coverage Ratios
12/08 12/09 12/10 12/11
Current Ratio 1.5 1.7 1.7 1.0 Current Capitalization in EUR
Quick Ratio 0.9 1.0 0.9 0.6 Common Shares Outstanding (M) 211.4
EBIT/Interest 5.8 10.6 8.6 4.7 Market Capitalization (M) 3339.9
Tot Debt/Capital 0.7 0.6 0.6 0.6 Cash and ST Investments (M) 456.0
Tot Debt/Equity 2.5 1.5 1.6 1.7 Total Debt (M) 1884.0
Eff Tax Rate % 18.1 25.2 29.6 - Preferred Equity (M) 0.0
LT Investments in Affiliate Companies (M) 0.0
Investments (M) 55.0
Enterprise Value (M) 4822.9
21'764
Prysmian SpA develops, designs, produces, supplies and installs a wide range of cables
for applications in the energy and telecommunications industries.
PRY IM
7'583
Company Analysis - Overview
83%
17%
BibWqofWUi Tfob 8lkqoUWqlo
8ljjrkfWUqflkp Ifkbp 8lkqoUWqlo
64%
15%
12%
9%
Brolmb 5cofWU 5pfU LWbUkfU
Kloqe 5jbofWU Olrqe 5jbofWU
Q.M.S Advisors | tel: +41 (0)78 922 08 77 | e-mail: [email protected] |

Prysmian SpA
Target price in EUR
Date Buy Hold Sell Date Price Target Price Broker Analyst Recommendation Target Date
0.%GWk%.0 53% .1% -% /.%CbX%.0 .2(24 .4(46 7hmeWSWhrb IFLKBI MBIIF9BO Xrv /-(/- /.%CbX%.00.%AbY%./ 53% .1% -% /-%CbX%.0 .3(-1 .4(46 JbaflXWkYW Pm7 7IBPP7KAOL QLOQLO7 kbrqoWh .3(/- /-%CbX%.00-%Kls%./ 53% .1% -% .6%CbX%.0 .3(-3 .4(46 8WkYW FJF JLKF97 8LPFL Waa .4(44 /-%CbX%.00.%LYq%./ 6.% 2% 2% .5%CbX%.0 .2(41 .4(46 9obafq Prfppb J7U V7QBP lrqmbocloi .6(-- ./%CbX%.0/5%Pbm%./ 54% 6% 1% .2%CbX%.0 .2(41 .4(46 BuWkb 8KM MWofXWp 7OK7RA 8OLPP7OA lrqmbocloi .6(-- 1%CbX%.00.%7rd%./ 54% 6% 1% .1%CbX%.0 .2(43 .4(46 KWqfufp 7OK7RA P9EJFQ kbrqoWh .3(-- /1%GWk%.00.%Grh%./ 54% 6% 1% .0%CbX%.0 .2(52 .4(46 DlhaiWk PWYep A7KFBI7 9LPQ7 8rv)KbrqoWh /.(3- .4%GWk%.0/6%Grk%./ 6.% 2% 2% ./%CbX%.0 .2(2/ .4(4/ BS7 Afibkpflkp 9O7FD PQBOIFKD elha .2%GWk%.00.%JWv%./ 55% 5% 1% ..%CbX%.0 .2(05 .4(26 GMJlodWk 7KAOB7P TFIIF lsbotbfdeq .5(-- .1%GWk%.00-%7mo%./ 54% 6% 1% 5%CbX%.0 .2(1. .4(00 8bobkXbod 8Wkg J7DDFB M7UQLK Xrv .3(0- 5%GWk%.00-%JWo%./ 54% 6% 1% 4%CbX%.0 .2(/1 .4(/2 Bpmfofql PWkql Fksbpqibkq 8Wkg ObpbWoYe OL8 SFOABB Xrv .6(-- 5%GWk%.0/6%CbX%./ 53% 2% 6% 3%CbX%.0 .2(.1 .4(/2 8WoYhWvp A7SFA SLP lsbotbfdeq .3(-- /.%AbY%./
2%CbX%.0 .2(/- .4(/2 97 9ebrsobru DFLODFL F7KKBII7 lrqmbocloi .3(-- ..%AbY%./1%CbX%.0 .2(.- .4(/2 8WkYW 7golp BPK! CO7K9BP9L MOBSFQBO7 WYYrirhWqb .3(-- 0%AbY%./.%CbX%.0 .2(42 .4(0- BnrfqW PFJ Pm7 IRFDF AB 8BIIFP Xrv .4(-- ./%Kls%./
0.%GWk%.0 .2(43 .4(0- EP89 9EOFPQLMEB NR7O7KQB lsbotbfdeq .5(-- 6%Kls%./0-%GWk%.0 .2(5. .4(0- Hbmhbo 9WmfqWh JWogbqp BKOF9L 9L9L Xrv .3(-- 6%Kls%.//6%GWk%.0 .3(-2 .4(0- EWiibo MWoqkbop P7 7I8BOQL OLII7 Xrv ..%JWv%.//5%GWk%.0 .3(./ .4(0- 9bkqolXWkYW J7O9L 9OFPQLCLOF Xrv .1(6- .1%CbX%.//2%GWk%.0 .3(/2 .4(0-/1%GWk%.0 .3(.- .4(0-/0%GWk%.0 .3(-4 .4(/-//%GWk%.0 .3(02 .4(/-/.%GWk%.0 .2(5/ .4(/-.5%GWk%.0 .2(2/ .4(.-.4%GWk%.0 .2(13 .4(.-.3%GWk%.0 .2(.5 .3(50.2%GWk%.0 .2(// .3(50.1%GWk%.0 .2(00 .3(50..%GWk%.0 .2(3/ .3(6-
Company Analysis - Analysts Ratings
7rt RkT Bagg 9aSliiakTRodlkn sn 8mdSa RkT PRmcao 8mdSa
51% 54% 54% 55% 6%% 54% 54% 54% 6%% 51% 51% 51%
0% 6% 6% 5% 0% 6% 6% 6% 0% %'% %'% %'%6% '% '% '% 0% '% '% '% 0% !% !% !%
(%
.(%
1(%
3(%
4(%
)((%
cwso&). jUop&). Uso&). jUf&). grfk&). grfi&). Ulxq&). pbmq&). lWq&). kls&). awW&). gUks&)0
6ol
hbo N
bWlj
jbk
aUqfl
k
(
.
1
3
4
)(
).
)1
)3
)4
.( MofW
b
6rv Elia Obii MofWb PUodbq MofWb
7mleamn PRmcao 8mdSa
(
2
)(
)2
.(
.2
5im
eUS
Uirb
Jba
flVU
kWU
Om5
6Uk
WU FJ
F
8ob
afq O
rfpp
b
BuU
kb 6
KM
MUo
fVUp
KUq
fufp
Dli
ajUk
OUW
ep
BS
5 A
fjbk
pflk
p
GMJ
lodU
k
6bo
bkVb
od 6
Ukh
Bpm
fofql
OUk
ql Fk
sbpq
jbk
q 6Uk
hN
bpbU
oWe
6Uo
WiUv
p
85
8eb
rsob
ru
6Uk
WU 5
holp
!BO
K%
Bnr
fqU O
FJ O
m5
EO
68
Hbm
ibo 8
UmfqU
i JUo
hbqp
EUj
jbo
MUo
qkbo
p O
5
8bk
qolVU
kWU
Q.M.S Advisors | tel: +41 (0)78 922 08 77 | e-mail: [email protected] |

21.02.2013
Prysmian SpA
Ownership Statistics Geographic Ownership Distribution
Shares Outstanding (M) 211.4 United States 34.67%
Float 93.8% Italy 18.67%
Short Interest (M) Luxembourg 11.07%
Short Interest as % of Float Britain 10.00%
Days to Cover Shorts Norway 7.70%
Institutional Ownership 49.89% Ireland 5.34%
Retail Ownership 50.11% Germany 3.39%
Insider Ownership 0.00% Others 9.17%
Institutional Ownership Distribution
Investment Advisor 63.47%
Mutual Fund Manager 17.26%
Other 12.43%
Government 6.52%
Pricing data is in EUR Others 0.33%
Top 20 Owners:
Holder Name Position Position Change Market Value % of Ownership Report Date Source Country
CLUBTRE SRL 13'297'401 0 207'040'534 6.20% 30.11.2012 EXCH ITALY
FRANKLIN RESOURCES 8'115'891 154'461 126'364'423 3.78% 31.12.2012 ULT-AGG UNITED STATES
FMR LLC 7'990'218 -481'287 124'407'694 3.72% 30.11.2012 ULT-AGG UNITED STATES
NORGES BANK 6'977'971 0 108'647'008 3.25% 30.11.2012 EXCH NORWAY
VANGUARD GROUP INC 4'680'544 -178'183 72'876'070 2.18% 31.12.2012 MF-AGG UNITED STATES
JP MORGAN SECURITIES 4'620'520 0 71'941'496 2.15% 30.11.2012 EXCH BRITAIN
STATE STREET 4'597'300 0 71'579'961 2.14% 20.02.2013 ULT-AGG UNITED STATES
SCHRODER INVESTMENT 4'309'482 0 67'098'635 2.01% 30.11.2012 EXCH BRITAIN
OPPENHEIMERFUNDS INC 4'292'321 0 66'831'438 2.00% 30.11.2012 EXCH UNITED STATES
T ROWE PRICE ASSOCIA 4'292'321 0 66'831'438 2.00% 20.11.2012 EXCH UNITED STATES
BLACKROCK 2'838'636 10'249 44'197'563 1.32% 19.02.2013 ULT-AGG UNITED STATES
MANNING & NAPIER ADV 2'656'220 -1'221'890 41'357'345 1.24% 31.12.2012 MF-AGG UNITED STATES
GENERALI ASSET MANAG 2'328'432 -5'280 36'253'686 1.09% 31.01.2013 MF-AGG ITALY
UBI PRAMERICA SGR SP 1'984'776 30'760 30'902'962 0.93% 30.11.2012 MF-AGG ITALY
CAPITAL GROUP COMPAN 1'961'622 0 30'542'455 0.91% 31.12.2012 ULT-AGG UNITED STATES
HARRIS ASSOCIATES LP 1'546'300 -49'500 24'075'891 0.72% 31.12.2012 MF-AGG UNITED STATES
DEKA INVESTMENT GMBH 1'500'234 -63'166 23'358'643 0.70% 30.11.2012 MF-AGG GERMANY
ACTIVEST MUNICH 1'219'934 0 18'994'372 0.57% 30.11.2012 MF-AGG LUXEMBOURG
ALLIANZ ASSET MANAGE 1'193'976 -6'800 18'590'206 0.56% 31.12.2012 ULT-AGG GERMANY
ODIN FORVALTNING AS 926'038 1'038 14'418'412 0.43% 31.01.2013 MF-AGG NORWAY
Top 5 Insiders:
Holder Name Position Position Change Market Value % of Ownership Report Date Source
Company Analysis - Ownership
Ownership Type
50%50%
0%
FkpqfqrqflkUi Ltkbopefm NbqUfi Ltkbopefm Fkpfabo Ltkbopefm
Geographic Ownership
35%
9%
11%
8%
10%
5%
3%
19%
Rkfqba OqUqbp FqUiv IrubjVlrod 6ofqUfkKlotUv FobiUka DbojUkv Lqebop
Institutional Ownership
64%
12%
0%7%
17%
Fksbpqjbkq 5asfplo JrqrUi Crka JUkUdbo LqeboDlsbokjbkq Lqebop
TOP 20 ALL
Q.M.S Advisors | tel: +41 (0)78 922 08 77 | e-mail: [email protected] |

Prysmian SpA
Financial information is in EUR (M)
Periodicity: 12/01 12/02 12/03 12/04 12/05 12/06 12/07 12/08 12/09 12/10 12/11 12/12E 12/13E 12/14E
Income Statement
Revenue 1'642 5'007 5'118 5'144 3'731 4'571 7'583 8'005 8'171 8'454
- Cost of Goods Sold 993 3'393 3'198 3'127 2'060 2'963 4'917
Gross Income 649 1'614 1'920 2'017 1'671 1'608 2'666
- Selling, General & Admin Expenses 643 1'335 1'506 1'644 1'278 1'301 2'346
(Research & Dev Costs) 42 46 45 43 46 68
Operating Income 34 330 464 409 425 337 364 437 510 570
- Interest Expense 33 97 80 70 40 39 77
- Foreign Exchange Losses (Gains) 4 -12 -2 29 1 -7 22
- Net Non-Operating Losses (Gains) 8 98 -0 29 47 92 366
Pretax Income -12 147 387 281 337 213 -101 311 415 485
- Income Tax Expense 17 56 85 51 85 63 44
Income Before XO Items -28 91 302 230 252 150 -145
- Extraordinary Loss Net of Tax 0 0 0 0 0 0 0
- Minority Interests 1 2 2 -2 4 2 -9
Diluted EPS Before XO Items 0.49 1.65 1.31 1.39 0.82 (0.65)
Net Income Adjusted* -27 89 257 256 248 168 123 250 305 356
EPS Adjusted 1.43 1.43 1.40 0.93 0.59 1.22 1.47 1.68
Dividends Per Share 0.42 0.42 0.42 0.17 0.21 0.25 0.32 0.39
Payout Ratio % 25.0 31.9 29.8 23.6 0.20 0.22 0.23
Total Shares Outstanding 180 180 180 178 178 179 211
Diluted Shares Outstanding 180 182 181 179 179 210
EBITDA 80 443 529 479 496 428 544 622 684 738
*Net income excludes extraordinary gains and losses and one-time charges.
Equivalent Estimates
Company Analysis - Financials I/IV
Fiscal Year
Q.M.S Advisors | tel: +41 (0)78 922 08 77 | e-mail: [email protected] |
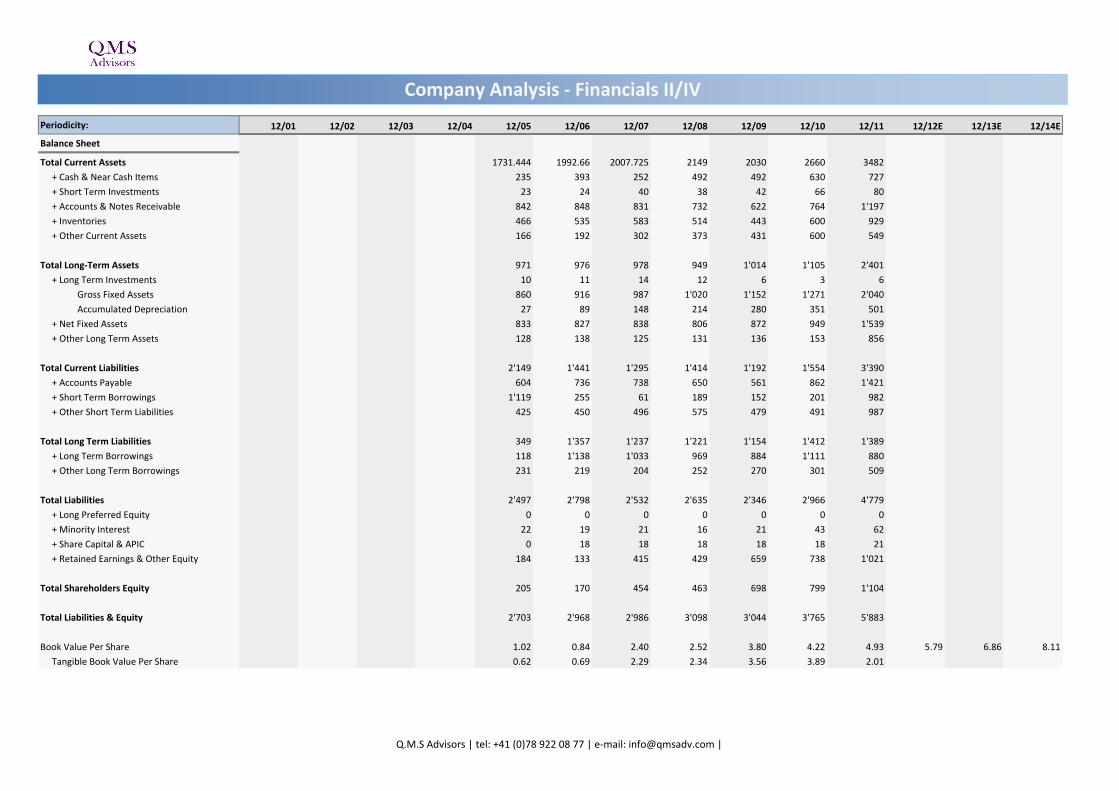
Periodicity: 12/01 12/02 12/03 12/04 12/05 12/06 12/07 12/08 12/09 12/10 12/11 12/12E 12/13E 12/14E
Balance Sheet
Total Current Assets 1731.444 1992.66 2007.725 2149 2030 2660 3482
+ Cash & Near Cash Items 235 393 252 492 492 630 727
+ Short Term Investments 23 24 40 38 42 66 80
+ Accounts & Notes Receivable 842 848 831 732 622 764 1'197
+ Inventories 466 535 583 514 443 600 929
+ Other Current Assets 166 192 302 373 431 600 549
Total Long-Term Assets 971 976 978 949 1'014 1'105 2'401
+ Long Term Investments 10 11 14 12 6 3 6
Gross Fixed Assets 860 916 987 1'020 1'152 1'271 2'040
Accumulated Depreciation 27 89 148 214 280 351 501
+ Net Fixed Assets 833 827 838 806 872 949 1'539
+ Other Long Term Assets 128 138 125 131 136 153 856
Total Current Liabilities 2'149 1'441 1'295 1'414 1'192 1'554 3'390
+ Accounts Payable 604 736 738 650 561 862 1'421
+ Short Term Borrowings 1'119 255 61 189 152 201 982
+ Other Short Term Liabilities 425 450 496 575 479 491 987
Total Long Term Liabilities 349 1'357 1'237 1'221 1'154 1'412 1'389
+ Long Term Borrowings 118 1'138 1'033 969 884 1'111 880
+ Other Long Term Borrowings 231 219 204 252 270 301 509
Total Liabilities 2'497 2'798 2'532 2'635 2'346 2'966 4'779
+ Long Preferred Equity 0 0 0 0 0 0 0
+ Minority Interest 22 19 21 16 21 43 62
+ Share Capital & APIC 0 18 18 18 18 18 21
+ Retained Earnings & Other Equity 184 133 415 429 659 738 1'021
Total Shareholders Equity 205 170 454 463 698 799 1'104
Total Liabilities & Equity 2'703 2'968 2'986 3'098 3'044 3'765 5'883
Book Value Per Share 1.02 0.84 2.40 2.52 3.80 4.22 4.93 5.79 6.86 8.11
Tangible Book Value Per Share 0.62 0.69 2.29 2.34 3.56 3.89 2.01
Company Analysis - Financials II/IV
Q.M.S Advisors | tel: +41 (0)78 922 08 77 | e-mail: [email protected] |

Periodicity: 12/01 12/02 12/03 12/04 12/05 12/06 12/07 12/08 12/09 12/10 12/11 12/12E 12/13E 12/14E
Cash Flows
Net Income -29 89 300 237 248 148 -136 207 284 337
+ Depreciation & Amortization 47 113 65 70 71 91 180
+ Other Non-Cash Adjustments 131 98 30 44 -69 0 196
+ Changes in Non-Cash Capital 86 47 -26 66 36 -6 197
Cash From Operating Activities 234 347 370 417 286 233 437
+ Disposal of Fixed Assets 9 16 5 1 1 7 36
+ Capital Expenditures -29 -79 -87 -103 -91 -83 -135 -150 -145 -146
+ Increase in Investments 0 0 0 0 -152
+ Decrease in Investments 0 0 3 6
+ Other Investing Activities -1'221 -6 26 -4 -14 -46 -338
Cash From Investing Activities -1'240 -69 -56 -103 -98 -274 -437
+ Dividends Paid 0 0 -76 -75 -75 -37
+ Change in Short Term Borrowings 0 0 0 0 0
+ Increase in Long Term Borrowings 1'137 88 0 41 0 233 128
+ Decrease in Long Term Borrowings -337 0 -124 0 0
+ Increase in Capital Stocks 0 0 0 0 0 0
+ Decrease in Capital Stocks 0 0 -30 0 0 0
+ Other Financing Activities 104 -208 -117 -9 11 21 6
Cash From Financing Activities 1'241 -120 -455 -74 -188 179 97
Net Changes in Cash 235 158 -141 240 0 138 97
Free Cash Flow (CFO-CAPEX) 206 268 283 314 195 150 302 177 266 318
Free Cash Flow To Firm 328 345 371 225 177
Free Cash Flow To Equity 372 -50 356 72 390 466
Free Cash Flow per Share 1.14 1.49 1.57 1.75 1.10 0.84 1.45
Company Analysis - Financials III/IV
Q.M.S Advisors | tel: +41 (0)78 922 08 77 | e-mail: [email protected] |

Periodicity: 12/01 12/02 12/03 12/04 12/05 12/06 12/07 12/08 12/09 12/10 12/11 12/12E 12/13E 12/14E
Ratio Analysis
Valuation Ratios
Price Earnings 10.1x 8.4x 8.7x 15.5x 12.8x 10.6x 9.3x
EV to EBIT 8.3x 6.4x 6.3x 8.7x 8.6x
EV to EBITDA 7.3x 5.5x 5.4x 6.9x 5.8x 7.8x 7.1x 6.5x
Price to Sales 0.6x 0.4x 0.6x 0.5x 0.3x 0.4x 0.4x 0.4x
Price to Book 7.0x 4.4x 3.2x 3.0x 1.9x 2.7x 2.3x 1.9x
Dividend Yield 2.5% 3.8% 3.4% 1.3% 2.2% 1.6% 2.1% 2.5%
Profitability Ratios
Gross Margin 39.5% 32.2% 37.5% 39.2% 44.8% 35.2% 35.2%
EBITDA Margin 4.9% 8.8% 10.3% 9.3% 13.3% 9.4% 7.2% 7.8% 8.4% 8.7%
Operating Margin 2.0% 6.6% 9.1% 8.0% 11.4% 7.4% 4.8% 5.5% 6.2% 6.7%
Profit Margin -1.8% 1.8% 5.9% 4.6% 6.6% 3.2% -1.8% 3.1% 3.7% 4.2%
Return on Assets 3.1% 10.1% 7.8% 8.1% 4.3% -2.8%
Return on Equity 53.2% 102.8% 53.9% 44.1% 20.7% -15.1% 19.4% 21.5% 21.3%
Leverage & Coverage Ratios
Current Ratio 0.81 1.38 1.55 1.52 1.70 1.71 1.03
Quick Ratio 0.51 0.88 0.87 0.89 0.97 0.94 0.59
Interest Coverage Ratio (EBIT/I) 1.01 3.40 5.82 5.84 10.63 8.64 4.73
Tot Debt/Capital 0.86 0.89 0.71 0.71 0.60 0.62 0.63
Tot Debt/Equity 6.03 8.17 2.41 2.50 1.48 1.64 1.69
Others
Asset Turnover 1.77 1.72 1.69 1.21 1.34 1.57
Accounts Receivable Turnover 5.93 6.10 6.58 5.51 6.60 7.73
Accounts Payable Turnover 5.17 4.40 4.41 3.28 4.39 4.60
Inventory Turnover 6.78 5.72 5.70 4.31 5.68 6.43
Effective Tax Rate 38.2% 21.9% 18.1% 25.2% 29.6%
Company Analysis - Financials IV/IV
Q.M.S Advisors | tel: +41 (0)78 922 08 77 | e-mail: [email protected] |
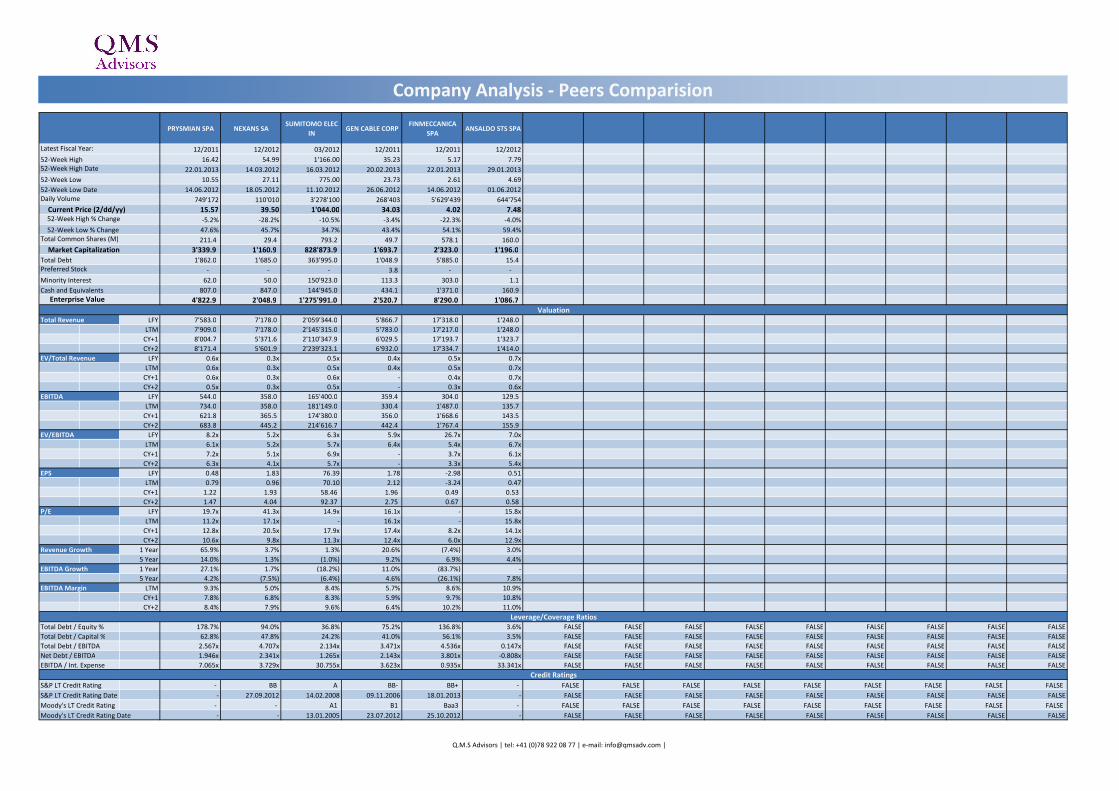
PRYSMIAN SPA NEXANS SASUMITOMO ELEC
INGEN CABLE CORP
FINMECCANICA
SPAANSALDO STS SPA
12/2011 12/2012 03/2012 12/2011 12/2011 12/2012
16.42 54.99 1'166.00 35.23 5.17 7.79
22.01.2013 14.03.2012 16.03.2012 20.02.2013 22.01.2013 29.01.2013
10.55 27.11 775.00 23.73 2.61 4.69
14.06.2012 18.05.2012 11.10.2012 26.06.2012 14.06.2012 01.06.2012
749'172 110'010 3'278'100 268'403 5'629'439 644'754
15.57 39.50 1'044.00 34.03 4.02 7.48
-5.2% -28.2% -10.5% -3.4% -22.3% -4.0%
47.6% 45.7% 34.7% 43.4% 54.1% 59.4%
211.4 29.4 793.2 49.7 578.1 160.0
3'339.9 1'160.9 828'873.9 1'693.7 2'323.0 1'196.0
1'862.0 1'685.0 363'995.0 1'048.9 5'885.0 15.4
- - - 3.8 - -
62.0 50.0 150'923.0 113.3 303.0 1.1
807.0 847.0 144'945.0 434.1 1'371.0 160.9
4'822.9 2'048.9 1'275'991.0 2'520.7 8'290.0 1'086.7
LFY 7'583.0 7'178.0 2'059'344.0 5'866.7 17'318.0 1'248.0
LTM 7'909.0 7'178.0 2'145'315.0 5'783.0 17'217.0 1'248.0
CY+1 8'004.7 5'371.6 2'110'347.9 6'029.5 17'193.7 1'323.7
CY+2 8'171.4 5'601.9 2'239'323.1 6'932.0 17'334.7 1'414.0
LFY 0.6x 0.3x 0.5x 0.4x 0.5x 0.7x
LTM 0.6x 0.3x 0.5x 0.4x 0.5x 0.7x
CY+1 0.6x 0.3x 0.6x - 0.4x 0.7x
CY+2 0.5x 0.3x 0.5x - 0.3x 0.6x
LFY 544.0 358.0 165'400.0 359.4 304.0 129.5
LTM 734.0 358.0 181'149.0 330.4 1'487.0 135.7
CY+1 621.8 365.5 174'380.0 356.0 1'668.6 143.5
CY+2 683.8 445.2 214'616.7 442.4 1'767.4 155.9
LFY 8.2x 5.2x 6.3x 5.9x 26.7x 7.0x
LTM 6.1x 5.2x 5.7x 6.4x 5.4x 6.7x
CY+1 7.2x 5.1x 6.9x - 3.7x 6.1x
CY+2 6.3x 4.1x 5.7x - 3.3x 5.4x
LFY 0.48 1.83 76.39 1.78 -2.98 0.51
LTM 0.79 0.96 70.10 2.12 -3.24 0.47
CY+1 1.22 1.93 58.46 1.96 0.49 0.53
CY+2 1.47 4.04 92.37 2.75 0.67 0.58
LFY 19.7x 41.3x 14.9x 16.1x - 15.8x
LTM 11.2x 17.1x - 16.1x - 15.8x
CY+1 12.8x 20.5x 17.9x 17.4x 8.2x 14.1x
CY+2 10.6x 9.8x 11.3x 12.4x 6.0x 12.9x
1 Year 65.9% 3.7% 1.3% 20.6% (7.4%) 3.0%
5 Year 14.0% 1.3% (1.0%) 9.2% 6.9% 4.4%
1 Year 27.1% 1.7% (18.2%) 11.0% (83.7%) -
5 Year 4.2% (7.5%) (6.4%) 4.6% (26.1%) 7.8%
LTM 9.3% 5.0% 8.4% 5.7% 8.6% 10.9%
CY+1 7.8% 6.8% 8.3% 5.9% 9.7% 10.8%
CY+2 8.4% 7.9% 9.6% 6.4% 10.2% 11.0%
Total Debt / Equity % 178.7% 94.0% 36.8% 75.2% 136.8% 3.6% FALSE FALSE FALSE FALSE FALSE FALSE FALSE FALSE FALSE
Total Debt / Capital % 62.8% 47.8% 24.2% 41.0% 56.1% 3.5% FALSE FALSE FALSE FALSE FALSE FALSE FALSE FALSE FALSE
Total Debt / EBITDA 2.567x 4.707x 2.134x 3.471x 4.536x 0.147x FALSE FALSE FALSE FALSE FALSE FALSE FALSE FALSE FALSE
Net Debt / EBITDA 1.946x 2.341x 1.265x 2.143x 3.801x -0.808x FALSE FALSE FALSE FALSE FALSE FALSE FALSE FALSE FALSE
EBITDA / Int. Expense 7.065x 3.729x 30.755x 3.623x 0.935x 33.341x FALSE FALSE FALSE FALSE FALSE FALSE FALSE FALSE FALSE
S&P LT Credit Rating - BB A BB- BB+ - FALSE FALSE FALSE FALSE FALSE FALSE FALSE FALSE FALSE
S&P LT Credit Rating Date - 27.09.2012 14.02.2008 09.11.2006 18.01.2013 - FALSE FALSE FALSE FALSE FALSE FALSE FALSE FALSE FALSE
Moody's LT Credit Rating - - A1 B1 Baa3 - FALSE FALSE FALSE FALSE FALSE FALSE FALSE FALSE FALSE
Moody's LT Credit Rating Date - - 13.01.2005 23.07.2012 25.10.2012 - FALSE FALSE FALSE FALSE FALSE FALSE FALSE FALSE FALSE
EBITDA Growth
EBITDA Margin
Credit Ratings
Leverage/Coverage Ratios
P/E
Revenue Growth
Total Revenue
EV/Total Revenue
EPS
Cash and Equivalents
EBITDA
EV/EBITDA
Enterprise Value
Valuation
Preferred Stock
52-Week Low Date
Minority Interest
Total Common Shares (M)
Total Debt
Market Capitalization
Daily Volume
52-Week Low % Change
Current Price (2/dd/yy)
52-Week High % Change
52-Week High Date
52-Week Low
Latest Fiscal Year:
52-Week High
Company Analysis - Peers Comparision
Q.M.S Advisors | tel: +41 (0)78 922 08 77 | e-mail: [email protected] |