final write up
TRANSCRIPT

1
Profiling the cell wall-linked changes in Shiraz
grape berries harvested from four different
maturation stages using a combination of analytical tools
Terri Selles
Institute for Wine Biotechnology/Department of Viticulture and Oenology, Stellenbosch University, Private Bag X1,
Matieland 7602
South Africa
Abstract
A novel research was performed on Shiraz grape berries in order to assess the compositional changes of
the cell walls in late-harvested berries (23, 25, 26 and 28 Brix˚). It was aimed to discover and investigate
the changes which occurred during the maturation stages using a collection of analyses. Samples were
separated into whole berry, skin and pulp tissues and analyzed. AIR was prepared in order to be analyzed
and determine the sugar and organic acid concentration, monosaccharide composition, spectral information
inferring the polysaccharide composition as well as antibody probes were used to obtain the polysaccharide
abundance in the samples using the epitope binding. Results displayed a number of trends between the analyses
as well as between tissue types. The monosaccharide composition showed a consistent trend, when excluding
the final harvest date as an error, galacturonic acid had the highest concentrations, followed by glucose and
arabinose. The spectral results showed the presence of the main polysaccharides, pectin, protein, cellulose and
xyloglucan with varying influences. Depectination as well as deprotienation was observed in all tissue types over
the maturation stages. The epitope abundance showed similar results to the spectral data, however de-
esterification was also seen mainly in the whole berry and skin tissues interesting results when comparing the
tissue types. This study provides first insights into Shiraz cell wall changes of late-harvested berries and
separated tissue types, which opens new frames for further investigations.
Key words: Cell wall profiling, berry ripening, cell wall polysaccharides, Vitis vinifera, Shiraz.
Introduction
Vitis vinifera, commonly known as grapevine, is a dicotyledonous species, which is described by the
Britannica Encyclopedia as any flowering plant which has a pair of leaves, or cotyledons in the embryo of
the seed. The general development and ripening in fleshy fruit is a complex and unique process in the life cycle
of higher plants (Bapat et al. 2010). The process entails various stages such as fruit development, maturation,
ripening and senescence (Bapat et al. 2010). During the developmental stages, several physiological and
biochemical changes occur via differential expression of various genes which are regulated by various

2 developmental hormones (Bapat et al. 2010). The development stages are governed by certain hormones, such
as ethylene, gibberellin, auxin and abscisic acid. They are actively involved, through interactions with mobile
signals, in the regulation of grape berry ripening (Ziliotto et al., 2012). The berry development consists of two
successive sigmoidal growth periods separated by a lag phase as shown in Figure 1 (Coombe 1976). The initial
growth phase is due to cell division and subsequently cell enlargement (Nunan et al., 1998). Véraison is the term
used to describe the transcriptomic shift in metabolism and oxidative burst which occurs approximately 60 days
after berry formation (Deluc et al., 2009). It signifies the onset of ripening and is accompanied by significant
physical and chemical changes in the berries. The physical changes include an increase in pulp firmness as well
as a colour change from green to red in red cultivars (Davies, Robinson, Box, & Osmond, 2000). An accumulation
of sugars and flavour compounds, the synthesis of anthocyanins and a reduction in organic acids concentration
are chemical (Conde et al. 2007). Senescence occurs naturally following ripening and is known as a biological
aging process. It is characterized by a gradual deterioration of function, which increases mortality after
maturation (Campisi et al. 2007).
Shiraz, known as Syrah in France, is a dark-skinned red grape variety grown throughout the world. Shiraz
is found to be a combination of two grape varieties, Dureza and Mondeuse blanche (Robinson. 2006). The style
and flavour profile of wines produced from Shiraz grapes is influenced by the climate which they are planted. In
South Africa, Shiraz is planted mainly in three regions, Stellenbosch, Paarl and Robertson, which varies from
hot to extremely hot climates respectively (Hunter & Bonnardot, 2011).
Shiraz berries are slightly oval in shape and develop a dark red skin once mature. Shiraz presumably
follow the same ripening process as other red grape varieties until véraison, where a phenomenon involving
Fig. 1: Typical grape berry ripening curve (Coombe 1976).
3 cell viability degeneration occurs, where only approximately 50% of the cells remain viable (Smith, Benz, Weber,
& Shackel, 2010). The loss in cell viability has an influence on the metabolic processes occurring after véraison,
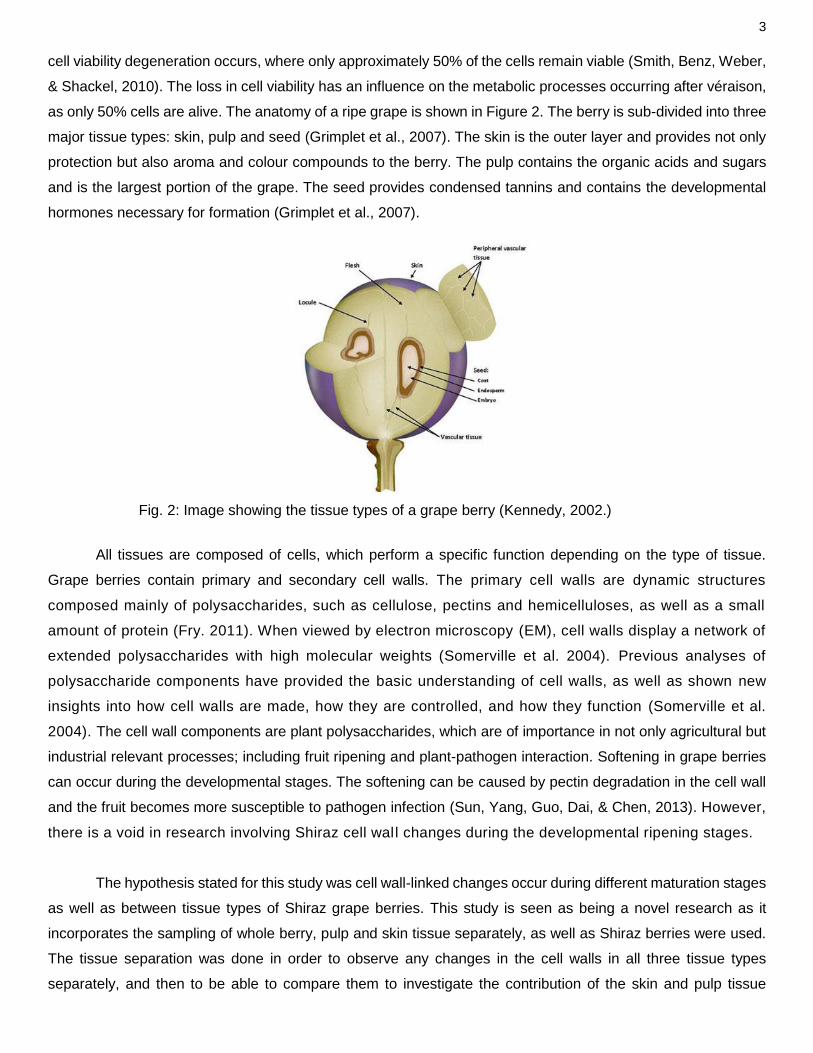
as only 50% cells are alive. The anatomy of a ripe grape is shown in Figure 2. The berry is sub-divided into three
major tissue types: skin, pulp and seed (Grimplet et al., 2007). The skin is the outer layer and provides not only
protection but also aroma and colour compounds to the berry. The pulp contains the organic acids and sugars
and is the largest portion of the grape. The seed provides condensed tannins and contains the developmental
hormones necessary for formation (Grimplet et al., 2007).
All tissues are composed of cells, which perform a specific function depending on the type of tissue.
Grape berries contain primary and secondary cell walls. The primary cell walls are dynamic structures
composed mainly of polysaccharides, such as cellulose, pectins and hemicelluloses, as well as a small
amount of protein (Fry. 2011). When viewed by electron microscopy (EM), cell walls display a network of
extended polysaccharides with high molecular weights (Somerville et al. 2004). Previous analyses of
polysaccharide components have provided the basic understanding of cell walls, as well as shown new
insights into how cell walls are made, how they are controlled, and how they function (Somerville et al.
2004). The cell wall components are plant polysaccharides, which are of importance in not only agricultural but
industrial relevant processes; including fruit ripening and plant-pathogen interaction. Softening in grape berries
can occur during the developmental stages. The softening can be caused by pectin degradation in the cell wall
and the fruit becomes more susceptible to pathogen infection (Sun, Yang, Guo, Dai, & Chen, 2013). However,
there is a void in research involving Shiraz cell wall changes during the developmental ripening stages.
The hypothesis stated for this study was cell wall-linked changes occur during different maturation stages
as well as between tissue types of Shiraz grape berries. This study is seen as being a novel research as it
incorporates the sampling of whole berry, pulp and skin tissue separately, as well as Shiraz berries were used.
The tissue separation was done in order to observe any changes in the cell walls in all three tissue types
separately, and then to be able to compare them to investigate the contribution of the skin and pulp tissue
Fig. 2: Image showing the tissue types of a grape berry (Kennedy, 2002.)

4 towards the whole berry, as well as to observe whether certain changes only occur in certain tissues. Changes
over the harvest dates were also recorded and analyzed. The different samples were analysed using various
techniques to get a large amount of information indicating the causes of the cell wall changes during
development. High-performance liquid chromatography (HPLC) was performed to cross-correlate the Brix˚
values measured by the refractometer. Gas chromatography (GC) was performed to obtain the monosaccharide
composition of the samples. Fourier transform infra-red (FTIR) was performed to gain information of the cell wall
structure, as well as comprehensive microarray polymer profiling (CoMPP) to examine the epitope abundance
in the cell wall.
Methods and materials
Sample collection
The grapes were harvested from the Shiraz cultivar in
Roberson vineyard (S33° 51' 24.32" E20° 00' 26.31").
The block indicated in Figure 3 shows the block chosen
where the berries were harvested. Grapes were picked
from 2 rows over four harvest dates, 3 March, 13
March, 17 March and 31 March 2014. A 20kg crate of
grapes roughly containing 6 or 7 different plant clusters
was used and 6 biological replicates were
prepared per harvest date. Grapes per
biological replicate were taken from the same
cluster.
Fig. 3: Block selected from Robertson vineyard (Google maps)

5 Alcohol insoluble residue preparation
Shiraz berries were processed as soon as possible after harvest.
The ball milling equipment was cleaned, using hot water and
ethanol, to ensure no contamination of samples with residues. Both
ball mill chambers (with roughly equal weight of material) were
placed in the machine to ensure correct operation, as imbalances
can damage the instrument. Chambers and tubes were kept in liquid
nitrogen to minimize ice condensation in the screw threads of the
chambers. Seeded berries were de-seeded and the seeds were
discarded. Whole berries (de-seeded), skin and pulp tissue was
prepared using a scalpel blade and immersed in liquid nitrogen,
minimizing thawing during the procedure. 10-20 berries were used
per skin and pulp tissue sample tube, and 12-15 berries used for
the whole berry sample tubes. Two bunches of grapes were used
per sample tube, labelled as a biological replicate. 6 sample tubes
were collected for each tissue type, therefore 6 biological replicates
overall, shown in Table 1.
Table 1 showing biological sample sets prepared
Biological replicate
Sample tubes
Skin Pulp Whole berry
1 Samples from 2 bunches of grapes
2 Samples from 2 bunches of grapes
3 Samples from 2 bunches of grapes
4 Samples from 2 bunches of grapes
5 Samples from 2 bunches of grapes
6 Samples from 2 bunches of grapes
Total: 12 bunches of grapes used
Samples were milled for 30 seconds to ensure a fine powder was obtained. In parallel, 10 berries for
each batch of skin, pulp and whole berry sample set was collected for sugar and organic acid analysis, stored at
-20C. Ground powdered samples were kept at liquid nitrogen temperatures, and then 80% absolute ethanol was
added to the samples and mixed until the volume of the slurry was approximately 40 mℓs. Sample tubes were
sealed and immediately placed in a 95˚ Celsius water bath to boil for 20 minutes to deactivate endogenous
Fig. 4: Grinding and boiling method

6 enzyme activity, as seen in Figure 4. After boiling, the tubes were cooled and centrifuged at 3000 rpm for 2-3
minutes, the supernatant was discarded and only the compact pellet retained.
The samples were re-suspended in a fresh volume of 100% absolute ethanol to the 40 mℓ level and the
tubes were mixed on a rotating wheel for 2 hours at room temperature. Again samples are centrifuged at 3000
rpm for 2-3 minutes, the supernatant discarded and compact pellet retained. The supernatant was replaced with
a methanol:chloroform (1:1) (v/v) solution which was added to the 40 mℓ level and the tubes mixed on a rotating
wheel for 2 hours at room temperature. The methanol:chloroform wash was repeated, rotated for another 2
hours, then centrifuged again as before. The supernatant was replaced with a methanol:acetone (1:1) (v/v)
solution which was added to the 40 mℓ level and the tubes mixed on a rotating wheel for 2 hours, the
centrifugation step was the repeated. This was repeated twice like before. The supernatant was then replaced
with 100% acetone solution which was added to the 40 mℓ level and the tubes mixed on a rotating wheel for
another 2 hours. The acetone was dried off as much as possible without loosening the pellet. Tissue paper was
used and working was done in the fumehood. The samples did not dry out completely. The sample pellet was
re-suspended in a minimum volume of distilled water (Millipore Q), the caps were replaced with tissue paper
(positioned with elastic bands) and placed immediately at -80˚ Celsius to freeze. The samples were Freeze-dried
(lyophilised) to produce a fine dry powder of AIR (alcohol insoluble residue), which was stored in falcon tubes at
room temperature.
Sugar and organic acid analyses
The grapes used for the sugar and organic acid analysis were selected when separating the samples into
biological replicates. 10 whole berries were chosen per biological replicate and kept at -20˚ until further analysis.
The samples were prepared for high-performance liquid chromatography (HPLC) analyses following an adapted
protocol explained in Standard operating procedures for the quantification of sugars and organic acids in grape
berries, must and wine samples using HPLC by Eyéghé-Bickong Hans A. An internal standard (IS) was prepared
by dissolving 0.050g adipic acid and 0.050g ribitol in 25mℓ dH20. The berries were de-seeded, separated into
the whole berry, skin and pulp tissues, then ground to a fine powder at liquid nitrogen temperatures. Two
biological replicates were used per sample, therefore there were 3 replicates taken per tissue type per harvest
date. Approximately 100mg of powdered samples were weighed out under liquid nitrogen temperatures into 2mℓ
eppendorfs. 600µℓ of IS was added to each Eppendorf, followed by adding Polyvinylpolypyrrolidone (PVPP). The
samples were vortexed for 30 seconds, 600µℓ chloroform was added then vortexed a second time for 30
seconds. The samples were placed at 50˚C on a shaking incubator and left for 30 minutes. Once incubated, they
were centrifuged at 12500rpm for 10 minutes, followed by removing 300µℓ of the supernatant and transferring it
into new eppendorfs. The supernatant was centrifuged at 12500rpm for a further 10 minutes, then 100-200µℓ
was transferred into a GC vial containing a mini vial inside. A blank solution vial containing 200µℓ dH20 was
prepared as well as an internal standard vial containing 200µℓ of the IS solution and a mock solution vial prepared
like the samples, but not containing any sample. The vials were clamped closed and sent for HPLC analyses.

7 Monosaccharide composition analysis preparation
The AIR material were prepared for gas chromatography (GC) analysis according to the method originally
described in York et al. (1985). The protocol followed was the TMS-methyl glycosides preparation for
monosaccharide composition determination (York et al. 1985). 90µℓ of 1mg/mℓ myoinositol was added to 80µℓ
dH2O and 250µℓ 4M TFA to each sugar mix tube. Then 5mg AIR sample material was measured into test tubes,
there were 6 biological replicates and 3 technical repeats. 90µℓ of 1mg/mℓ myoinositol was added to 500µℓ dH2O
and 500µℓ 4M TFA to each sample tube. All tubes were closed and incubated at 110˚C for 2 hours. Once
incubated, 500µℓ dH2O was added to the AIR sample tubes and centrifuged at 3000rpm for 5 minutes. 750-
1000µℓ supernatant was collected and placed in fresh test tubes, which were dried under nitrogen flow at 60˚C
with the sugar mix tubes. 1 volume Methanol/HCL 3M kit was diluted with 2 volumes of dry methanol solution to
set up the derivatization procedure. 500 µℓ of the resulting solution was added to each test tube containing
standard or sample dried supernatant. The lids were closed and incubated at 80˚C for 16 hours (overnight).
Once incubated, the tubes were dried under nitrogen flow at 40˚C, then washed with 250µℓ of dried methanol.
The previous two steps of drying and washing was repeated twice more and finished with drying dried under
nitrogen flow at 40˚C. 150µℓ of TMS kit was added to each tube, then incubated with closed lids for 20 minutes
at 80˚C. The tubes were dried once more under nitrogen flow at 40˚C, then 1200 µℓ of cyclohexane was added
to each tube. 1000µℓ supernatant was transferred to GC microvials and sealed.
Structural information on cell walls
AIR was used directly for Fourier transform infra-red (FTIR) technology by following the protocol described
originally by Kačuráková et al. (2000). The AIR samples were directly placed on the instrument and clamped in
position to record absorbance spectra. The infrared spectra were measured on a NEXUS 670 (Thermo, USA)
spectrometer with a Golden Gate Diamond attenuated total reflectance (ATR) accessory to record spectra.
OMNIC software was used to record the spectra, with 128 scans at a resolution of 4cmˉ¹ were averaged. The
spectra was recorded between 4000 and 650cmˉ¹, but for this study only the 1800 to 650cmˉ¹ was concentrated
on using a Geon-KBr beam splitter and DTGS/Csl detector. Multivariate analysis was performed on the
spectral data received.
Comprehensive microarray polymer profiling analysis of cell wall fractions
The AIR samples were used for comprehensive microarray polymer profiling (CoMPP) analysis according to the
protocol described by Moller et al. (2007). Each analysis used approximately 10mg of AIR material, which was
extracted sequentially with CDTA then NaOH solutions in order to obtain pectin-rich and hemicellulose-rich
extracts (Moore et al., 2014). This analysis was performed by Dr Jonatan Ulrik Fangel and Prof. William Willetts
in Copenhagen, Denmark. Once sequentially extracted, the extracts were spotted onto membranes and then

8 probed with monoclonal antibodies (mAbs) and carbohydrate-binding modules (CBMs) (Knox, 1997; Hervé et
al, 2011 cited in Moore et al., 2014) that recognize specific cell wall epitopes (explained in Moller et al., 2007).
Data were reported as a heatmap, in which mean spot signals were displayed and the range was normalized to
the highest signal (set as 100) in the dataset, as well as multivariate analysis was performed on the raw data
received.
Multivariate analysis
The spectral and CoMPP data were processed using the software Unscrambler™ (Camo® Inc., USA) and
SIMCA v13.03 (Umetrics., Umeå). Microsoft Excel was used in all analyses.
Results
The HPLC analyses were performed in order to examine the sugar and organic acid values in the maturing grape
berries. The data showed that as the berry proceeded from ripe to over ripe, the levels of sugars (glucose and
fructose) increased in a linear fashion, whereas the organic acid levels showed various patterns depending on
the acid, as seen in Figure 5A-F.

9
The most important thing to note is the glucose-fructose ratio, which should remain relatively constant
throughout the ripening. As seen in the analyses of all three tissues, the first harvest date shows very low
amounts of glucose, as well as the second harvest date for whole berry and skin tissues. This does not correlate
to the Brix˚ values which were measured at harvest. This discrepancy is most likely due to technical error, where
the samples were not prepared correctly, or not sampled correctly by the machine which skewed the results.
The refractometer measures the Brix˚ values by squeezing the berries and measuring the juice for sugar
concentration. The HPLC technique is said to be more specific, and the results for all tissue types for the sugars
should have displayed the stairway pattern seen in 5D. As ground samples were used for the HPLC technique,
this could have altered the sugar concentration originally in the grape. The samples were also kept at -20˚C for
4 months, which could have altered the sample quality. The organic acid levels tend to show a variation during
the development. The citric acid levels seem to display a similar pattern between the three different tissue types,
remaining relatively constant and very low levels compared to the other acids. Tartaric acid between the whole
berry and pulp tissue show a closer similarity than that of the skin, however overall the general trend remains
the same. The tartaric acid was seen to show higher levels in the pulp tissue which is to be expected as pulp is
the fleshy part of the grape. The concentration of malic acid is known to peak at véraison and then remain
relatively constant, whereas the data shows a scattered pattern amongst the harvest dates, which is peculiar. In
warmer climates, the malic acid levels are usually known to decrease slightly, which may be due to aerobic
respiration. Here, the whole berry and skin show a closer similarity than that of the whole berry and pulp and
also skin and pulp. The levels of succinic acid vary between the tissues with the whole berry and pulp tissue
sharing the similar results in comparison to the skin.
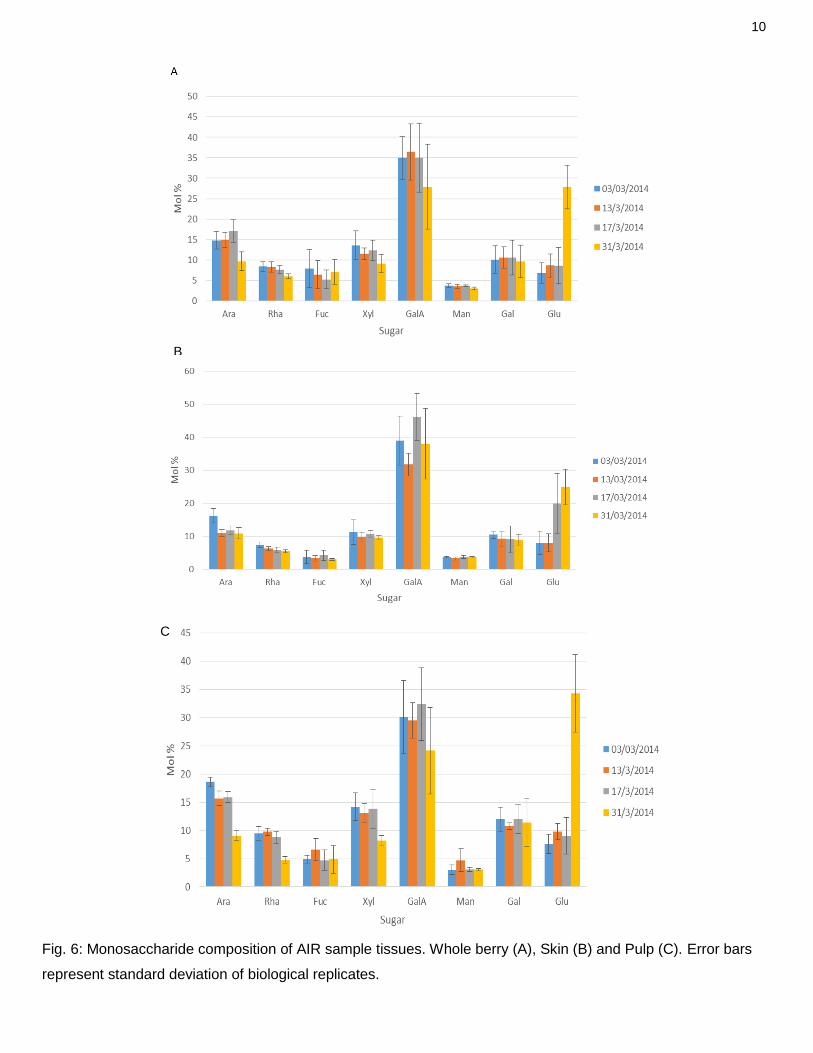
Monosaccharide compositional analysis was performed to ascertain the main cell wall polymers present shown
in Figure 6A-C.
Fig. 5: Graphs showing the Organic acid and sugar concentrations over the harvest dates per tissue type. The
organic acid concentration for the whole berry, skin and pulp tissue (A,C,E), and sugar concentrations for the
same tissues respectively (B,D,F) error bars represent standard deviation between the biological replicates
10
B
C
Fig. 6: Monosaccharide composition of AIR sample tissues. Whole berry (A), Skin (B) and Pulp (C). Error bars
represent standard deviation of biological replicates.

11
The monosaccharide composition analyses were shown as mol %, not absolute values, which could
make the perceived values slightly altered as they are show a % value of all the sugars in the samples. The
arabinose concentrations showed a decline in all three tissues for the final harvest date, which can perhaps be
explained by a degradation of the cell viability with ripening. However, the concentrations seems to stay relatively
constant which is to be expected from literature. The rhamnose concentrations show a slight decline in all three
tissues which is to be expected, as rhamnose is present in grape berries at much lower levels than the sugar
concentration. The fucose levels between the whole berry and pulp seem to show more similarities than the skin
and whole berry. The xylose levels are meant to decrease during ripening, according to literature, and all three
tissue types shows a slight decrease relative to the levels. The galacturonic acid levels are naturally higher than
the other organic acid levels, however the general trend declines over ripening stages declines slightly over the
developmental stages, as they have been observed to in previous studies. The mannose levels remain pretty
equivalent over the ripening stages, which could be due to the age and nature of the samples chosen for this
study. The levels of Galactose remain rather constant, with the whole berry and skin showing a closer similarity
than the whole berry and pulp. The glucose levels were expected to increase with the ripening, however the last
harvest date, there is a massive increase in glucose, with minimal shift occurring in the other sugars. This is
most likely due to integration error while working on the results. Another possible cause could be that the raise
in glucose level for the latest harvest date is caused by glucans, as the TFA hydrolyses the non-cellulosic
polysaccharides of the cell wall (Moore et al. 2014).
The FTIR analysis is applied extensively in the cell wall analysis as it allows monitoring the developmental
and compositional changes in the cell walls. According to Kačuráková et al. (2000), the 2D FTIR studies the
mechanical properties and biopolymer interactions in the cell wall, which allows for a comparison between the
tissue types as well as developmental stages. The AIR material was directly placed onto the machine to record
the absorbance spectrum and determine the particular polysaccharides present in the samples. The analysis
results are displayed in Figure 7 A-C.

12
A

13
B

14
The assignment of bands were based on the literature, specifically Moore et al. (2014). Bands at 1740 cmˉ¹
and 1600- 1550 cmˉ¹ suggest the presence of carbonyls, amides and carboxyl groups which are associated with
pectin polymers and protein. Various sharp peaks were associated with pectin, including 1400 cmˉ¹ for carboxyls
and 1260 cmˉ¹ for carbonyls. Bands located at 1310 cmˉ¹ correlate to cellulose and the bands at 1206 cmˉ¹ to
xyloglucan and/or cellulose. All the tissue types show a broader peak between 1100 – 1000cmˉ¹, which
correspondes to a number of cell wall components, including cellulose, xyloglucan and homogalacturonan,
making interpretation difficult. According to the literature, the band at approximately 1064 cmˉ¹ tends to relate
with xyloglucan and cellulose, whereas the peak around 1025 cmˉ¹ corresponds with xyloglucan and
homogalacturonan resonances.
Fig. 7: Principal component analysis (PCA) score plot, loading plot and spectral images of whole berry,
skin and pulp tissue respectively (A,B,C).
C

15
When comparing the different tissue types visually using the FTIR spectrum, a few variations are clear,
however the variations occur mainly with peak sharpness and the relative differences in the absorbance maxima
in comparison to the other peaks in the different tissue types. Another approach that was used was PCA and
loading plot construction which allows for pattern recognition and shows variation amongst the tissue samples
and tissue types. The loading plot aids in the identification of variables which contribute to the separation seen
in the PCA. However, the spectral data shows more of a variation in the baseline values which may be due to
biological drift or the nature of the samples. The whole berry tissue shows clear variation between the latest
harvest date and the rest of the samples according to the PCA, the separation was due to the cellulose
polysaccharides mainly, as shown in the loading plot. Depectination and deproteination was clear in the latest
harvest date as the variables for pectin and protein are more concentrated on the right hand side of the plot,
where the rest of the harvest date samples congregate.
The skin tissue showed variation between the different maturation stages. The earliest and latest harvest
date are separated with the exception of one sample from the first harvest date which could skew the variation
in the data as it is amongst the latest harvest date samples. However, looking at the loading plot along with the
spectral data, the separation seems to be from left to right, with cellulose being more predominant on the left,
and protein on the right. The pulp tissue shows a clear variation between the earliest and latest harvest dates,
whereas there is less variation between the two middle harvest dates. The separation is driven by the protein
and pectin polymers mainly, as the right side of the PCA displays the protein rich samples identified from the
loading plot and spectral information, and the left side shows the protein poor samples. The earliest harvest date
shows the most protein and pectin rich samples, whereas the latest harvest date shows more cellulose and some
pectin than protein. This is another indication of deprotienation and depectination which occurs during ripening.
Comprehensive microarray polymer profiling (CoMPP) analysis was performed in order to determine
information on the polysaccharide occurrence. This technique differs from other techniques which are commonly
based on monosaccharide ratios obtained by acidic hydrolyses of AIR, performed by the GC analysis. CoMPP
involves sets of selected mAbs and CBMs used to detect characterized glycan epitopes which are known to be
found on one or more cell wall protein or polymer. This technique has a high sensitivity for subtle variations in
epitope abundance compared to the other techniques performed in this study. The AIR samples were
sequentially treated with CDTA and NaOH, resulting in a solubilized material which was applied to microarray
slides and probed with the preselected sets of mAbs and CDMs. The results are shown in Figure 8 A-D.

16
A
B

17
C
Fig. 8: CoMPP analysis data. Heatmap of average values (A), Whole berry, skin and pulp tissue CDTA
and NaOH PCA analysis respectively (B,C,D)
D

18
The CDTA extraction effectively solubilizes pectin-rich material from the AIR samples, whereas NaOH
extraction liberates hemicellulose polymers which have strong associative linkages to cellulose microfibrils.
Inspection of the PCA analysis, the score plot and loading plot, as well as the associated heatmap confirmed the
pectin-rich and hemicellulose nature of the samples. The preselected probes are as follows according to the
classification of probes by Paul Knox. The CDTA extraction for all sample tissues showed higher signal intensities
for the homogalacturonan in various esterification states (JIM5, JIM7, LM18, LM19 and LM20), the
rhamnogalacturonan-1 (RG-1) related probes, (INRA- RU1 and RU2) pectic-β-(1,4)-galactan (LM5), arabinans
(LM6) and several AGP epitopes (JIM8, JIM13 and LM2). Surprisingly, pulp tissue showed high signal intensities
for the extensins (LM1, JIM11 and JIM20), whereas this was not expressed in the whole berry or skin tissue. A
PCA was performed on each of the different tissue type datasets in order to provide an overview of the separation
and variation based on developmental stage as well as to link the results with a loading plot to identify variables,
which are the probe IDs that correlate with the separation. The NaOH extraction for all the tissue types shows
higher signal intensities for the rhamnogalacturonan-1 related probes (INRA- RU1 and RU2) as well as for
xyloglucan (LM25).
The whole berry tissue showed variation between the samples according to the harvest dates. According
to the loading plot of the CDTA extraction, the separation was driven by the depectination and de-esterification.
The earliest harvest dates correlated with the protein and pectin rich polymers, whereas the latest harvest date
correlates to the xylogalacturonan polymers. Which describes depectination and deprotienation as the pectins
and proteins had less of an influence than the xyloglucans and xylogalaturonan. With the skin tissue, there was
already evidence of depectination and deprotienation in the data as shown in the loading plot. There was
evidence of more exposure of xyloglucan and cellulose in the later harvest dates, and JIM13 was a driving force
showing de-esterification in the later harvest dates. The skin tissue showed the most similarity to the whole berry,
since the same pattern occurs in the whole berry, as it does the skin tissue. There is an increase in xyloglucan,
glucan, xylan as well as cellulose. The pulp tissue shows clear separation between the harvest dates. There
appears to be an abundance of xylans and galactamannan in the later harvest dates. The loading plot correlates
with the heatmap as the pulp tissue shows slight de-esterification with decreasing values of JIM7 and LM20 over
the harvest dates.
Discussion
This study was a novel research as work has not been done on Shiraz tissues separately and over the maturation
which was chosen for this study, the late ripe stage. This study has shown that some of the observations that
have been previously reported relating to grape berry ripening, especially the cell wall changes, can be
confirmed. This research can be used to decrease the gap in knowledge which currently exists. The Shiraz
cultivar was specifically chosen as Shiraz berries are known to undergo a <50% loss in cell viability after véraison
(Krasnow et al. 2007). This phenomenon would be assumed to have an influence on the berry composition and

19 metabolism. Therefore, selecting Shiraz for this study lead to interesting results which can be amplified with
further research, in order to get more of an understanding of the cell viability phenomenon.
The HPLC technique was specifically aimed at determining the sugar and organic acid concentrations of
the samples over the developmental stages which they were selected. Sugar and organic acids are essential
primary metabolites which contribute to the grapevine growth and berry development (Eyéghé-Bickong et al.
2012). The organic acids focused on were Citric, Malic, Tartaric and Succinic acid, and the sugar levels recorded
were that of glucose and fructose. The results were meant to correlate to the Brix˚ values measured by a
refractometer during harvest, however, since the grapes were harvested and supplied by an external source,
there could be differences in the apparent Brix˚ values measured. The glucose-fructose ratio for wine varieties
range from 0.74 to 1.05, with the average for late harvested fruits being 0.85 (Kliewer, 1967). The results showed
a very low glucose value for some harvest dates and an unbalanced glucose-fructose ratio.
According to Dokoozlian, (n.d) tartaric and malic acids are the key organic acids of the grape berry.
Combined, they make up approximately 90% of the total acidity of the berry. The acids are produced within the
berry during early ripening stages, and accumulate until véraison (Conde et al. 2007). A small amount of citric
acid is produced along with the two acids, as well as succinic acid. The organic acids, specifically tartaric and
malic acid, progressively increase in the berry from anthesis until the initiation of fruit ripening. The acids reach
their maximum peak near véraison, and then decline throughout the other ripening stages. The citrate levels
showed very minimal amounts in all the tissue types, which is to be expected as it is only produced in small
amounts compared to the other organic acids (Dokoozlian, n.d). The levels remained relatively constant for all
of the tissue, with no significant increases over the developmental stages. Tartaric acid is said to be stable as
no enzyme has been identified which is capable of degrading the acid within the berry. The slight decrease which
occurs around véraison and later on during ripening is said to be due to a dilution effect as the berry volume is
increasing and the amount of tartaric acid remains stable. The results obtained in this study show relatively
standard tartaric acid levels between the three tissues. The values vary over the harvest dates and, however no
pattern could be identified, which could be due to differences between the biological replicates interfering with
the technical repeats. In contrast to tartaric acid, there have been enzymes identified and found to be capable
of metabolizing malic acid. These enzymes are capable of degrading the acid to form CO2 and H2O, however
the reduction in malic acid is cause by not only the enzyme degradation, but also respiration and dilution due to
increased berry size. The succinic acid is found mainly in wine, however is produced within the grape berries.
The concentration recorded in this study seemed rather high, however it was found to vary between grape
varieties, and usually found to be higher in red wine grapes, such as Shiraz (Robinson, 2006).
The sugars, glucose and fructose, were expected to increase over the ripening stages as it is known in
literature. The accumulation of sugars within the vacuole is a major feature of berry ripening, and only
commences around véraison (Davies & Robinson, 1996). The results obtained in this study showed the
progressive increase of both glucose and fructose over the developmental stages. The initial glucose level for

20 the first harvest date was very low compared to the other dates in all the tissue types. This could be due to
experimental error, or the nature of the sample. However, the general increasing trend is shown in the data, and
is supported by literature (Davies & Robinson, 1996). The grape berries used in the HPLC analysis were kept at
-4˚ for approximately 4 months before sample analysis was performed. This could limit the quality of the samples
as many external changes could have occurred and the metabolism of the berry could have shifted. For future
research, it should be suggested to run the HPLC analysis as soon as the grape berries are harvested, to get
an accurate result of the sugar and organic acid levels during ripening stages.
The GC analysis was performed to determine the monosaccharide composition of the grape berry tissues
over the developmental stages. The samples were hydrolyzed with acid in order to break down the polymers
into monomers to analyze the monosaccharide concentrations (Moore et al. 2014). Comparing the results
obtained in this study to previous studies shows that the general trend of all the monosaccharides is the same
(Moore et al. 2014). The monosaccharide composition of total AIR showed that the cell walls from all three tissue
types were marked by a large proportion of galacturonic acid (30-45 mol%). The glucose levels showed an
increase in all tissue types, especially the latest harvest day showed a large peak, this could be due to the nature
of the AIR sample, or could show the differences between biological repeats, having certain samples overpower
the other samples. The arabinose levels remain relatively constant over the ripening stages. The rhamnose
slightly decreases with maturation, and the xylose and fucose levels remain relatively stable, showing a slight
decrease. The mannose and galactose levels remain pretty steady during the ripening stages. The mannose
levels usually increase slightly with maturation, therefore there could have been an outlier in the biological
replicate which skewed the data.
It is important to note that analyzing the monosaccharide composition is suggested in future studies as it
aids in building a model of understanding the cell wall changes in Shiraz berries. The results can also be
compared to previous studies, such as Moore et al. (2014), to get the general idea of the trend which is to be
expected. Very few, if any, studies have utilized GC analysis in order to measure the monosaccharide
composition and changes which occur in the cell wall during ripening. It would be suggested for future work, GC
analysis is included in studies, especially involving the Shiraz cultivar, which has not been studied extensively,
and is a very interesting cultivar to study. The results of the GC analysis could have been affected by the loss in
cell viability in Shiraz (Krasnow et al. 2009), and could be investigated in future studies.
The FTIR analysis was applied to get further insight of the different cell wall polymers present in the
different fractions (Moore et al. 2014). The FTIR spectra provides information about the main polysaccharides
present in the polysaccharide sample mixtures (Kačuráková et al. 2000). The general shape of the
polysaccharide spectrum is determined by the backbone polysaccharide composition, however it can also be
affected by the side chain components.

21
Defining absorption band maxima in the mid-infrared region at 1800 – 600 cmˉ¹ proved to be a worthy
tool for the identification of polysaccharides with various structures and compositions (Kačuráková et al. 2000).
As mentioned in the results, pectin polymers are quite prevalent in the tissue type samples as quite an amount
of the cell wall is composed of pectin (Keegstra. 2010). Keegstra (2010) explains the composition of the cell wall
as containing cellulose consisting of a collection of β-1-4-linked glucan chains which are identified between 1310
– 1000 cmˉ¹. In addition to cellulose, the pectin polysaccharides include homogalacturonan and
rhamnogalacturonan I and II (Harholt et al., 2010). The hemicellulose polysaccharides include xyoglucans,
glucomannans, xylans and mixed-linkage glucans (Scheller and Ulvskov, 2010). According to the results of this
study, all the polysaccharides were detected in the samples, just with varying amplitudes and peak sharpness.
Pectin is described to have a unique spectral shape due to the high homogalacturonan content, and the main
maxima was seen at 1600- 1550 cmˉ¹ (Kačuráková et al. 2000). The rhamnogalacturonan maxima, as explained
in Kačuráková et al. (2000) I sgenerally seen at 1070 cmˉ¹, which could correlate with the peak seen between
1100-1000 cmˉ¹ for all tissue type samples.
The results found in this study correlate to literature, specifically Moore et al (2014), where the FTIR along
with PCA of the AIR material is a promising method to evaluate the developmental stages, even using berries
that were ripe to begin with. There was evidence of depectination, deprotienation as well as de-esterification as
the berries ripened further on the vine. The later harvest stages seemed to have less protein and pectin rich
variables causing the separation visible on the score plot, instead there was more evidence of xylans and
cellulose. However, it was previously discovered that this analysis does not provide significant information about
the slight cell wall re-modelling events which are associated with the grape ripening stages (Moore et al. 2014).
Further research could be done using the FTIR analysis with the separate tissue types and various
developmental stages, as a database can be built and used to create comparative studies between more
cultivars. This type of study highlighted the major polysaccharides present in the cell wall and compared the
tissue types to one another, however they all seemed to follow a similar trend. The analysis could be improved
by running more technical repeats with the biological repeats in order to identify variation and to ensure the data
can be trusted. Care needs to be taken when directly placing the AIR material onto the machine, as the clamp
should be fully surrounded by the AIR material to ensure the machine is picking up the actual sample and not
background noise. However, the data showed strong peaks for each particular polysaccharide structural moiety,
which suggests that although there may have been background noise, the data can be trusted (Kačuráková et
al. 2000).
CoMPP analysis of the grape whole berry, skin and pulp tissue AIR was performed. This technique is
relatively modern and correlated with the other techniques performed in this study. The results strongly related
to the spectral information as similar polysaccharides were shown to be more prevalent in both techniques, ie
pectin, RG-I and AGPs. CoMPP utilises immunological probes, detected by fluorescent labelling (Moore et al.
2014). This technique and the results obtained offers a strong platform for comparison with the other techniques
22 as the analysis is extremely sensitive, and therefore the results displayed in the heatmap specifically, should be
very accurate.
The different extractions help separate the samples into pectin-rich fractions and hemicellulose-rich
fractions with CDTA and NaOH respectively. The pectin-β(1,4)-galactan components were shown to associate
with pectin, ie RG-I, as should be expected (Moore et al. 2014). According to Moore et al. (2014), the grape cell
walls are primarily composed of pectin and xyloglucan. In the Golgi body, the synthesis of pectin and xyloglucan
exists, as mentioned in Moore et al (2014), this relationship between the two networks in ripening requires further
research in order to fully understand the impact the two components have on each other and in general. The
xyloglucan components were previously observed to depolymerize, which was also apparent in this study.
Depectination and deprotienation was observed along with de-esterification as the pectins and proteins had less
of an influence than the xyloglucans and xylogalaturonan over the maturation stages. This study could be further
enhanced by comparing these results to other Vitis vinifera cultivars, in order to differentiate between the cultivars
which could aid in winemakers knowledge of the crop.
In conclusion, the data collected in this study provides insight into the changes occurring in the Shiraz
berry cell walls of the whole berry, pulp and skin tissues. As this is a novel research, certain similarities could be
observed from previous literature on various cultivars, however techniques such as CoMPP displayed fresh
information about the polysaccharide occurrence and differences between the tissue types. The results showed
the influence of ripeness degree, specifically using ripe to over ripe berries, compared to previous literature on
the main ripening stages, green, véraison and ripe. The monosaccharide composition gave an overview of the
metabolic processes which deplete with ripening as the berry enters the ripe to over ripe stage, bordering on
shrivel. The FTIR and CoMPP analyses correlated with the main structural moieties showing prevalence in both
techniques. The hypothesis stated for this study was cell wall-linked changes occur during different maturation
stages as well as between tissue types of Shiraz grape berries, and the results support that statement.
Acknowledgments
This work was supported by The Institute of Wine Biotechnology (IWBT) and Stellenbosch University, as well as
funding provided by Thripp and WineTech. The support and guidance was much appreciated by my supervisors
and academics in the IWBT.
References
Bapat, V., Trivedi, P., Ghosh, A., Sane, V., Ganapathi, T., Nath, P. (2010). Ripening of fleshy fruit: molecular
insight and the role of ethylene. Biotechnol. adv. 28(1):94-107. doi: 10.1016/j.biotechadv.2009.10.002.
Campisi, J., d’Adda di Fagagna, F. (2007). Cellular senescence: when bad things happen to good cells.
Nat Rev Cell Bio 8, 729-740

23 Conde, C., Silva, P., Fontes, N., Dias, A., Tavares, R., Sousa, M., Agasse, A., Delrot, S. & Gerós, H. (2007).
Biochemical Changes throughout Grape Berry Development and Fruit and Wine Quality. Food: Global
science books.
Coombe, B.G. (1976) The development of fleshy fruits. Annu Rev Plant Physiol. 27:507–528.
Coombe, B.G & Dry, P.R. (2001). The Science of the Grapevines by Markus Keller. Viticulture, Volume 2. Used
by permission of Winetitles Pty Ltd. Available online: http://webcom7.grtxle.com/MSUtext.cfm
Davies, C. & Robinson, S. (1996). Sugar accumulation in grape berries. Cloning of two putative vacuolar
invertase cDNAs and their expression in grapevine tissues. Plant physiol. 111:275-283.
Davies, C., Robinson, S. P., Box, P. O., & Osmond, G. (2000). Differential Screening Indicates a Dramatic
Change in mRNA Profiles during Grape Berry Ripening . Cloning and Characterization of cDNAs Encoding
Putative Cell Wall and Stress Response Proteins, 122(March), 803–812.
Deluc, L. G., Quilici, D. R., Decendit, A., Grimplet, J., Wheatley, M. D., Schlauch, K. a, … Cramer, G. R. (2009).
Water deficit alters differentially metabolic pathways affecting important flavor and quality traits in grape
berries of Cabernet Sauvignon and Chardonnay. BMC Genomics, 10, 212. doi:10.1186/1471-2164-10-212
Dokoozilian, N.(n.d) Grape berry growth and development. [Online] http://iv.ucdavis.edu/files/24467.pdf (5
November 2014).
Eyéghé-Bickong, H., Alexandersson, E., Gouws, L., Young, P. & Vivier, M. (2012). Optimisation of an HPLC
method for the simultaneous quantification of the major sugars and organic acids in grapevine berries. J
CHROMATOGR B, 885-886 (43-49).
Fry, S. (2011). Cell wall polysaccharide composition and covalent crosslinking. Annual plant reviews 41, 1-42.
Goulao, L. F., Fernandes, J. C., Lopes, P., & Amâncio, S. (2012). Tackling the cell wall of the grape berry. In H.
Gerós, M. M. Chaves, & S. Derot (Eds.), The biochemistry of the grape berry (pp. 172–193). Sharjah, UAE:
Bentham Science Publishers. ISBN978-1-60805-360-5Hervé, C., Marcus, S. E., & Knox
Grimplet, J., Deluc, L. G., Tillett, R. L., Wheatley, M. D., Schlauch, K. a, Cramer, G. R., & Cushman, J. C. (2007).
Tissue-specific mRNA expression profiling in grape berry tissues. BMC Genomics, 8, 187.
doi:10.1186/1471-2164-8-187
Harholt, J., Suttangkakul, A., Scheller, H. (2010). Biosynthesis of pectins. Plant physiol. 153: 384-395.
Hunter, J., Bonnardot, V. (2011). Suitability of some climatic parameters for grapevine cultivation in South Africa,
with focus on key physiological processes. S. AFR. J. ENOL. VITIC. Vol. 32, No. 1.
Kačuráková, M., Capek, P., Sasinková, V., Wellner, N. & Ebringerová, A. (2000). FT-IR study of plant cell wall
model compounds: pectin polysaccharides and hemicelluloses. Carbohydrate polymers 45: 195-203.
Kennedy, J. (2002). Understanding grape berry development. Department of food science & technology. Oregon
state university, Corvallis.
Kliewer, W. (1967). The glucose-fructose ration of Vitis vinifera grapes. Am. J. Enol. Vitic. Vol 18 No.1 33-41.
Krasnow. M., Matthews, M. & Shackel. K. (2007). Evidence for substantial maintenance of membrane integrity
and cell viability in normal developing grape (Vitis vinifera L.) berries throughout development. J EXP BOT.
Vol 59 (4) 849-859.

24 Krasnow, M., Weis, N., Smith, R., Benz, M., Matthews, M. & Shackel, K. (2009). Inception, progression and
compositional consequences of a berry shrivel disorder. AM SOC Enol. Vitic. 60:1
Moller, I., Sørensen, I., Bernal, A. J., Blaukopf, C., Lee, K., Øbro, J., … Willats, W. G. T. (2007). High-throughput
mapping of cell-wall polymers within and between plants using novel microarrays. The Plant J. Cell Mol
Biol. 50(6), 1118–28. doi:10.1111/j.1365-313X.2007.03114.x
Moore, J. P., Nguema-Ona, E., Fangel, J. U., Willats, W. G. T., Hugo, A., & Vivier, M. a. (2014). Profiling the
main cell wall polysaccharides of grapevine leaves using high-throughput and fractionation methods.
Carbohydrate Polymers, 99, 190–8. doi:10.1016/j.carbpol.2013.08.013
Moore, J., Fangel, J., Willats, W., & Vivier. M. (2014) Pectic-β(1,4)-galactan, extensin and arabinogalactan–
protein epitopes differentiate ripening stages in wine and table grape cell walls. Ann Bot. (1-16).
Nguema-Ona, E., Moore, J. P., Fagerström, A., Fangel, J. U., Willats, W. G. T., Hugo, A., & Vivier, M. a. (2012).
Profiling the main cell wall polysaccharides of tobacco leaves using high-throughput and fractionation
techniques. Carbohydrate Polymers, 88(3), 939–949. doi:10.1016/j.carbpol.2012.01.044
Nunan, K. J., Sims, I. M., Bacic, A., Robinson, S. P., Fincher, G. B., Science, P., … Grove, H. (1998). Changes
in Cell Wall Composition during Ripening of Grape Berries 1, 783–792.
Robinson, J., (ed) (2006). “The Oxford Companion to Wine” Third Edition (297-298, 333-334, 665) Oxford
University Press.
Rogiers SY, Greer DH, Hatfield JM, Orchard BA, Keller M (2006) Solute Transport into Shiraz Berries during
Development and Late-Ripening Shrinkage. 1:73–80.
Scheller, H., Ulvskov, P. (2010). Hemicelluloses. Annual Review of Plant biology 61: 263-289.
Services, F. P., & Officer, E. (2006). SAVII Shiraz Clonal Selection, (November), 6–7.
Seymour GB, Chapman NH, Chew BL, Rose JKC. 2013a. Regulation of ripening and opportunities for control in
tomato and other fruits. Plant Biotechnol J. 11, 269–278.
Smith, R. J., Benz, J., Weber, E., & Shackel, K. A. (2010). types of berry shrivel disorder in grape, (September),
155–159.
Somerville, C., Bauer, S., Brinistool, G., Facette, M., Hamann, T., Milne, J., Osborne, E., Paredez, A., Persson,
S., Raab, T., Vorwerk, S. and Youngs, H. (2004). Toward a systems approach to understanding plant cell
walls. Science 306, 2206-2211
Sun, X., Yang, Q., Guo, W., Dai, L., & Chen, W. (2013). Modification of cell wall polysaccharide during ripening
of Chinese bayberry fruit. Scientia Horticulturae, 160, 155–162. doi:10.1016/j.scienta.2013.05.048
Ziliotto, F., Corso, M., Rizzini, F. M., Rasori, A., Botton, A., & Bonghi, C. (2012). Grape berry ripening delay
induced by a pre-véraison NAA treatment is paralleled by a shift in the expression pattern of auxin- and
ethylene-related genes. BMC Plant Biol. 12(1), 185. doi:10.1186/1471-2229-12-185