final travis air force base environmental restoration
TRANSCRIPT

as of April 2010 Page 1 of 9
Final
Travis Air Force Base Environmental Restoration Program
Remedial Program Manager’s Meeting Minutes
22 April 2010, 1300 Hours
Mr. Mark Smith, Travis Air Force Base (AFB), conducted the Remedial Program Manager’s (RPM) meeting on 22 April 2010 at 1300 in the Main Conference Room, Building 570, Travis AFB, California. Attendees included:
• Glenn Anderson Travis AFB • Lonnie Duke Travis AFB • Mark Smith Travis AFB • Gregory Parrott Travis AFB • Dezso Linbrunner United States Army Corp of Engineers (USACE), Omaha
District • James Chang U.S. Environmental Protection Agency (USEPA) • Alan Friedman California Regional Water Quality Control Board (Water
Board) • Mary Snow Tech Law, Inc. • Rachel Hess ITSI • Gavan Heinrich CH2M HILL • Mike Wray CH2M HILL
Handouts distributed at the meeting and presentations included:
• Attachment 1 Meeting Agenda • Attachment 2 Master Meeting and Document Schedules • Attachment 3 SBBGWTP Monthly Data Sheet (March 2010) • Attachment 4 CGWTP Monthly Data Sheet (March 2010) • Attachment 5 Presentation 2010 Field Installations Update • Attachment 6 Presentation: Program Update: Activities Completed, In Progress and
Upcoming and Drilling schedule • Attachment 7 Presentation: Union Creek Sites Completion Report • Attachment 8 FT005 Field Work Planning Update • Attachment 9 Presentation: ST027B Site Characterization Report • Attachment 10 Presentation: NAAP Background

as of April 2010 Page 2 of 9
1. ADMINISTRATIVE
A. Previous Meeting Minutes
The 27 March 2010 RPM meeting minutes were approved and finalized as written.
B. Action Item Review
Action items from March were reviewed.
Action item one has a new date of 19 May 2010.
Action item two is to be mentioned in RAB meeting held on 22 April 2010. When date is determined, an invitation to the RAB members will be extended.
Action item three is tentatively scheduled for 28 April 2010.
C. Master Meeting and Document Schedule Review (attachment 2)
The Travis AFB Master Meeting and Document Schedule was discussed during this meeting (see Attachment 2).
Travis AFB Annual Meeting and Teleconference Schedule
⎯ The next RPM meeting will be 19 May 2010.
Travis AFB Master Document Schedule
⎯ Focused Feasibility Study (FFS): No change.
⎯ Proposed Plan (PP): No change in dates. Annotation; public meeting to coincide with RAB meeting.
⎯ Groundwater Record of Decision (ROD): No change.
⎯ Potrero Hills Annex: (FFS, PP, and ROD): No change.
⎯ Union Creek Sites SD001 and SD033 Remedial Action Report: No Change.
⎯ Vapor Intrusion Assessment Report: Moved to historical.
⎯ Natural Attenuation Assessment Report (NAAR): The due date for the final is TBD status pending Travis AFB and EPA teleconference call.
⎯ DP039 RPO Work Plan: Travis recently sent out response to comments to the agencies.
⎯ FT005 Data Gap Work Plan: Travis is working on responses to comments.

as of April 2010 Page 3 of 9
⎯ SD036/SD037 RPO Work Plan: Travis is working on responses to comments.
⎯ ST027B Site Characterization Report: No changes.
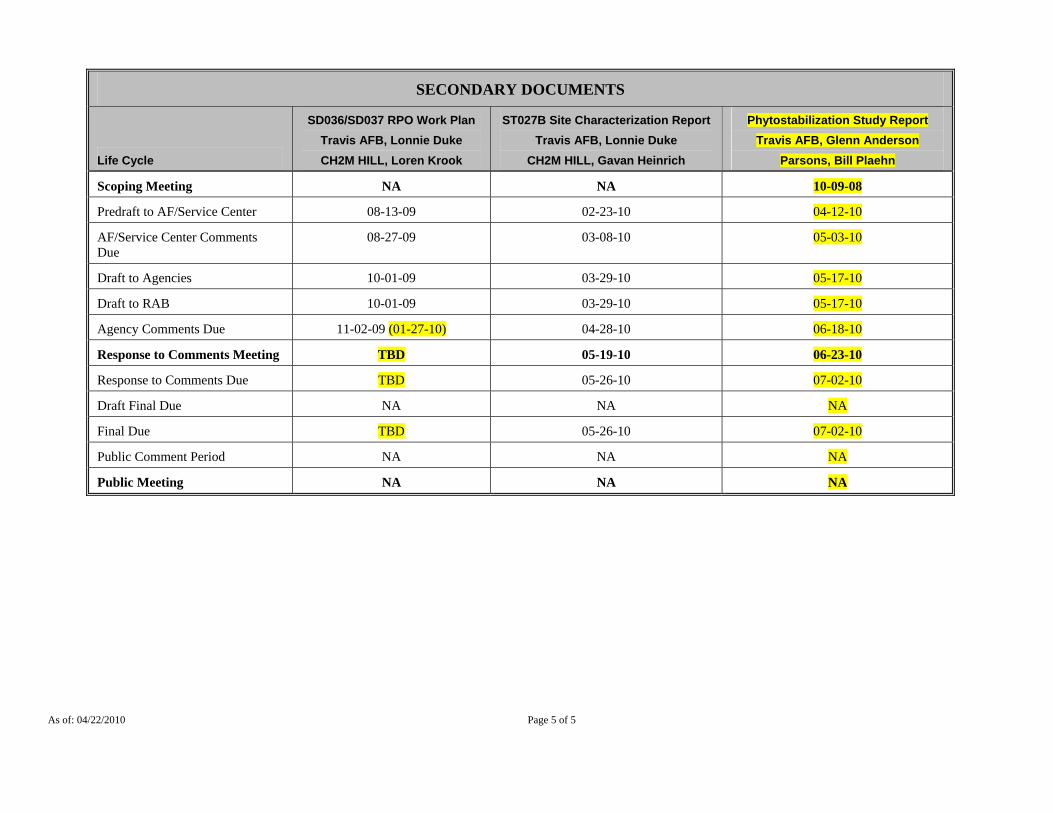
⎯ Phytostabilization Study Report: New addition. This document is one of many that will be a support document in the FFS.
⎯ Quarterly Newsletter (April 2010): Dates changed to reflect urgency in getting Newsletter out before RAB meeting.
⎯ 2008/2009 Annual GSAP report: Move to historical.
⎯ 2009 GWTP RPO Annual Report: Draft scheduled to be issued next week.
2. CURRENT PROJECTS
A. Treatment Plant Operation and Maintenance Update
Mr. Duke reported on the water treatment plant status.
South Base Boundary Groundwater Treatment Plant (see Attachment 3) The South Base Boundary Groundwater Treatment Plant (SBBGWTP) performed at 63% uptime, (downtime was due to power outages and a faulty flowmeter), and 3.2 million gallons of groundwater were extracted and treated during the month of March 2010. All of the treated water was discharged to Union Creek. The average flow rate for the SBBGWTP was 107 gallons per minute (gpm) and electrical power usage was 12,300 kWh; 16,851 pounds of CO2 was created (based on DOE calculation). Approximately 1.0 pound of volatile organic compounds (VOCs) were removed in March. The total mass of VOCs removed since the startup of the system is 378 pounds (see Attachment 3).
Central Groundwater Treatment Plant (see Attachment 4) The Central Groundwater Treatment Plant (CGWTP) performed at 96.3% uptime with approximately 1.77 million gallons of groundwater extracted and treated during the month of March 2010. All treated water was diverted to the storm drain. The average flow rate for the CGWTP, while operating, was 38.8 gpm and electrical power usage was 12,616 kWh for all equipment connected to the Central plant; approximately 17,284 pounds of CO2 was created. Natural gas usage for the ThOx was 1,593 therms. Approximately 5.53 pounds of VOCs were removed from groundwater, and 5.88 pounds from vapor, in March. The total mass of VOCs removed since the startup of the system is 11,166 pounds (see Attachment 4).
North Groundwater Treatment Plant is off line waiting for the Vernal Pools at Site LF007C to dry up.
as of April 2010 Page 4 of 9
3. Presentations
A. 2010 Field Installations Update (see Attachment 5)
Mr. Wray reported on the 2010 Field Installations Update.
The key points made in the presentation include:
Site DP039
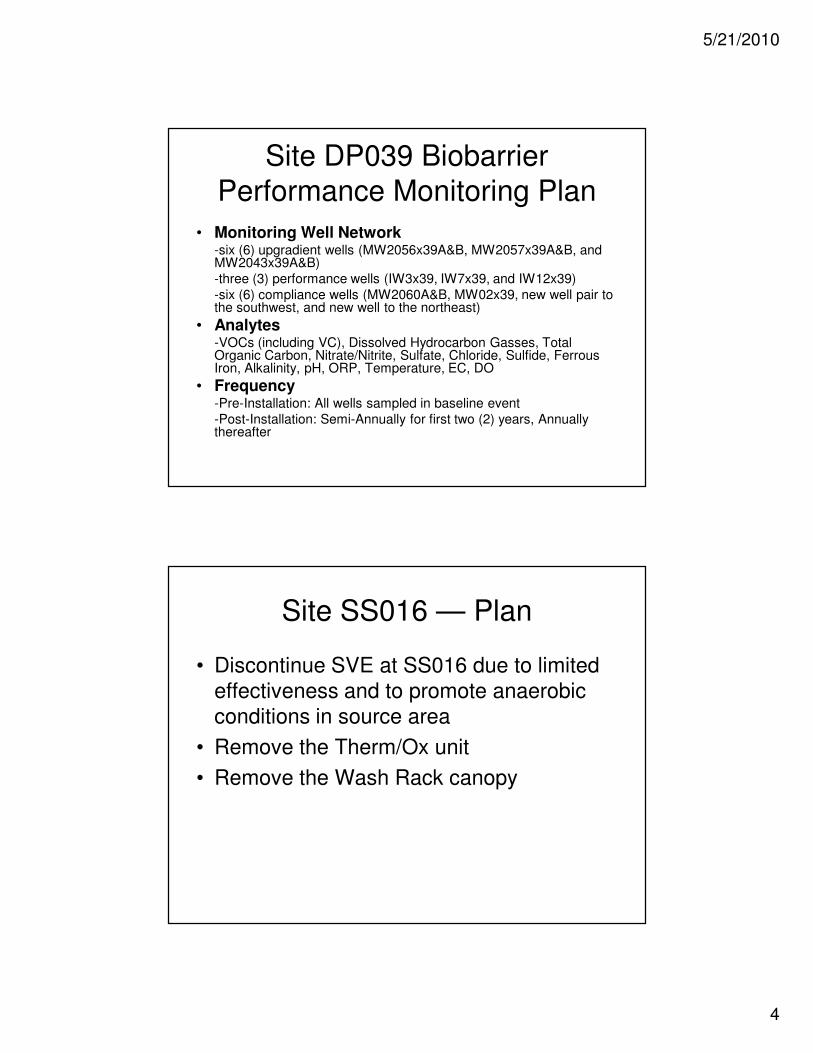
• The 500 µg/L TCE plume is defined laterally and vertically. • Bedrock encountered between about 50 to 60 feet below ground surface
(bgs). • 3 new monitoring wells will be installed to complete the performance-
monitoring network, for a total of 15 monitoring wells (6 monitoring well pairs and 3 injection wells). Need to install 2 more MWs when ground dries out (planning for mid- to late-May).
• 13 EVO injection wells to be installed across the plume, downgradient of the 500 µg/L TCE plume. 9 injection wells have been installed. The additional 4 injection wells will be installed when the ground dries out.
• Approximately 25,000 lbs of EVO will be injected to form the biobarrier, followed by performance monitoring.
Mr. Anderson added that a significant difference between remedial optimization for DP039 verses the SS015 vegetable oil pilot study is the amount of EVO that was injected. SS015 only had 162 gallons (<1,000 lbs) injected (vs 25,000 lbs planned at Site DP039).
Mr. Wray indicated that well development is scheduled for May and the EVO injections are scheduled for June.
Site SS016
• Soil vapor extraction will be discontinued due to limited effectiveness and to promote anaerobic conditions in the source area.
• The Therm/Ox unit is in the process of being removed today. One monitoring well is planned to be installed when the Therm/Ox has been removed.
• A bioreactor will be installed in the Wash Rack area which will remove a large mass of VOCs down to below the bedrock surface – the excavation will be approximately 20ft by 20ft by 20ft (and more likely 25ft deep).
• The existing horizontal extraction well (EW03x16) will be tied into the bioreactor for recirculation.
• A cutoff wall was discussed previously to be located downgradient from the bioreactor – but due to all the dry borings encountered, the cutoff wall will not be installed initially.

as of April 2010 Page 5 of 9
• Installed and sampled five new monitoring wells to add to the performance-monitoring network of 6 wells.
Site SS030
• Maximize groundwater extraction. Restart EW03x30 (complete). • Monitor groundwater levels and TCE concentrations. • Determine if additional monitoring and/or extraction wells are needed to
capture TCE plume.
Site SD036
• Installed 3 triple-completion wells. • Define the 1,000 and 10,000 µg/L TCE plume. Completed the detailed
investigation of the source area. • Refine the site conceptual model in the contaminant source area to include
a section of the broken sanitary sewer line, or a historic surface spill area as potential sources of the contamination.
Mr. Duke pointed out that the sewer lines have since been repaired.
Site SD037
• Installed 2 triple-completion monitoring wells (in separate borings) at two downgradient locations, to complete the performance monitoring network of 11 wells.
• Installed all 7 EVO injection wells in hot spot area. • Injection of 36,000 lbs of EVO is scheduled for June.
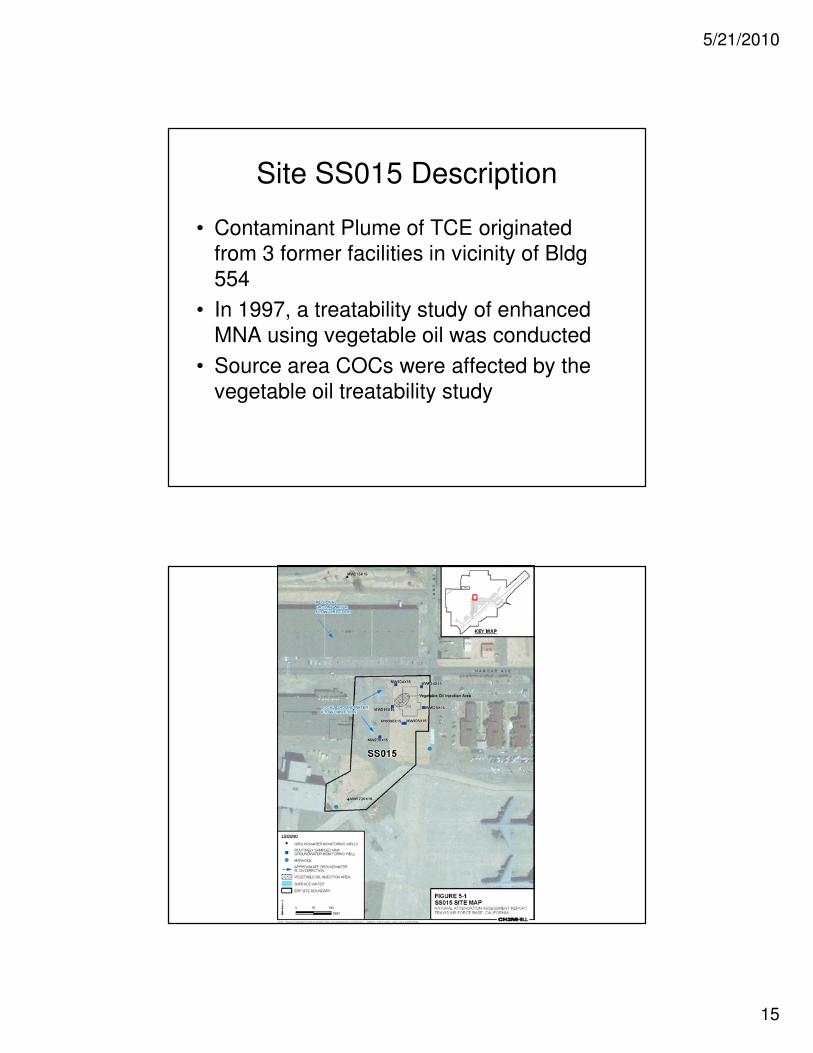
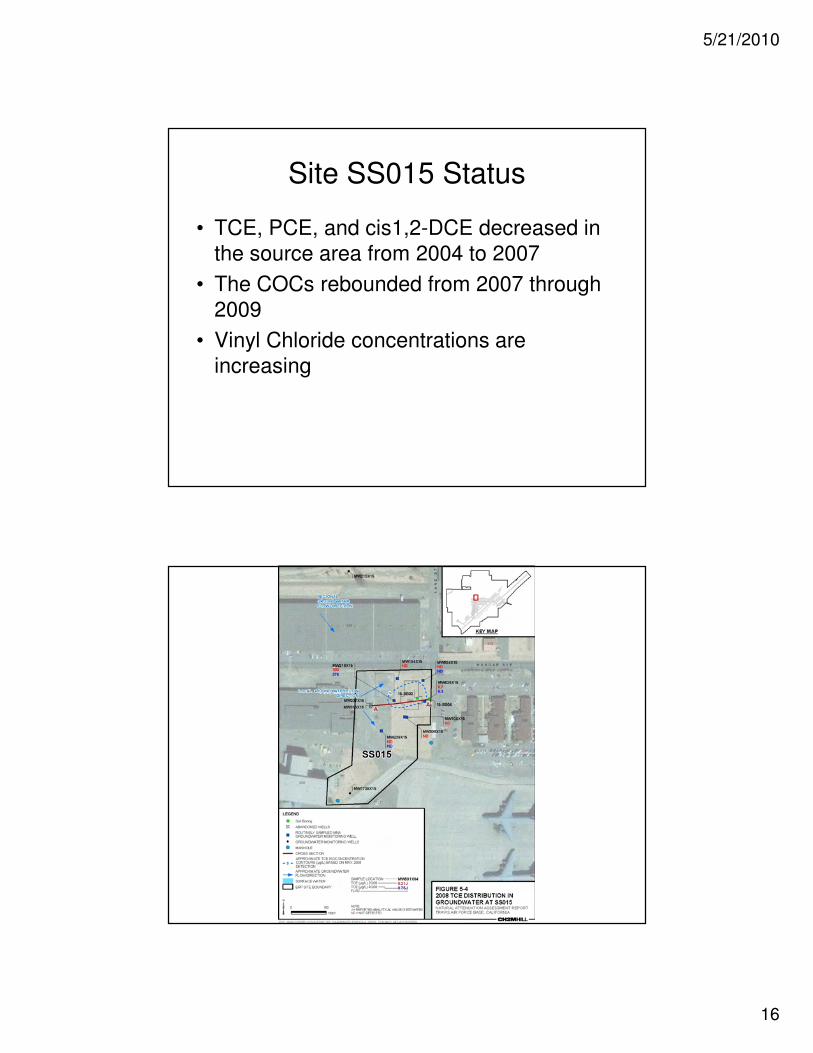
Site SS015
• The GSAP recently detected increasing VOC concentrations at Site SS015.
• Installed two monitoring wells; one upgradient of the source-area well, and one downgradient. Sample results were ND for TCE and daughter products in the new upgradient well. The new down-gradient monitoring well sample results showed elevated TCE, cis1,2-DCE, and VC. A small amount of MTBE was also detected in the new upgradient well, and the source is unknown.
• Based on the data from the two new monitoring wells, three more down-gradient monitoring wells were installed (in April). Well development and sampling of those monitoring wells is in progress.
Mr. Wray added that a total of 45 wells have been installed since the drilling began in March 2010. Ms. Snow asked where the MTBE is coming from. Mr. Heinrich pointed to a map showing that it is not likely that the MTBE is coming from site ST018 where there are two gas stations. Mr. Friedman asked if it was the first time

as of April 2010 Page 6 of 9
MTBE has been detected in this area. Mr. Wray said yes. Mr. Heinrich added the MTBE levels were very low. Mr. Anderson said it could have been from a lawn mower used for base landscaping or a fuel leak from a vehicle.
B. Program Update: Activities Completed, In Progress and Upcoming (see attachment 6)
Mr. Wray reported on the Program Update. Please see attachment 6 for details.
C. Union Creek Sites Completion Report (see attachment 7)
Ms. Hess reported on the Union Creek Sites Remedial Action Completion Report.
Ms. Hess handed out a report that documents the SD001 and SD033 sediment cleanup results. Ms. Hess said the cleanup was performed in September 2009, and involved the removal of contaminated sediments. The sediment cleanup project achieved the ECO risk and the residential cancer risk thresholds. The sediment cleanup level achieved was less than 1 mg/kg for Polycyclic Aromatic Hydrocarbons (PAH). Since the cleanup levels were met, there is no requirement for the implementation of land use controls. Mr. Duke added that is very important because land use controls are very costly over time. The Air Force position now is to clean up to residential levels where possible to avoid land use controls. Mr. Anderson added that Travis AFB has always wanted to clean up to residential levels, even though the cleanup requirements for the Air Force are typically industrial levels. Mr. Chang said that he is glad to see that Travis AFB is cleaning up to residential levels.
D. FT005 Field Work Planning Update (see map attachment 8)
Mr. Hess reported on the FT005 Field Work Planning Update.
Ms. Hess handed out a map of the proposed potholing locations for the Site FT005 soil cleanup project. This investigative work is being conducted to define the amount of debris that was discovered in 2007 when the RA project was initially started. The map shows the sampling grid and pothole locations. Ms. Hess pointed out, on the map, area A which was originally identified in the ROD, and two smaller areas B and C. Area A is divided into 50 ft. grids, and one pothole is located in the center of each grid. A backhoe or excavator will be used to dig down to native soil and to collect three samples from each pothole at 2, 4, and 6 ft depths. The investigation results will be used to carry out the excavation and disposal activities. The analysis for the primary sampling effort is: 100% PAHs and TPH-D Motor oil, 50% TCE, and 10% Dioxins, metals and VOCs. ITSI biologists will be on site Monday to ensure that protected species will not be harmed.
Mr. Smith asked Ms. Hess how flexible they are on the sample locations. Ms. Hess said there was some flexibility, depending on the footprint of the waste debris.

as of April 2010 Page 7 of 9
E. ST027B Site Characterization Report (see attachment 9)
Mr. Heinrich gave a presentation on ST027B Site Characterization Report. No questions were asked during this presentation.
Site ST027 used to be a POCO site until chlorinated solvents were discovered in the southern portion of the site. This location is right in the middle of the flight line, which historically was a fuel storage and engine testing facility. There is no historical use of chlorinated solvent in this area; it was unusual to find VOCs in this location.
The site characterization project was initiated by conducting a Gore Sorber Site Assessment survey, which was completed in December 2008. The GORE results found TCE and cis-1,2-DCE between the Aircraft Test Pad and Taxiway November, the presumed source area. The GORE results appear to correlate with the actual groundwater concentrations, as later with sample results. Attachment includes a map of GORE Sorber locations.
The source area investigation was completed in April 2009. Three soil borings in the source area were located based on the results of the GORE Survey. The soil, soil gas, and the groundwater samples were analyzed for VOCs. Attachment includes the analytical results and a map of the boring locations.
Monitoring wells MW791x27 (source area well) and MW794x27 are approximately 300 ft. apart from each other. There is no evidence of plume migration between these two wells since 2007, apparently staying stable. Based on the presence of daughter products, and the limited extent and concentrations of the VOC plume, it appears that natural attenuation may be keeping the plume from growing or migrating. The next steps include assessment of the potential risks to human and ecological receptors from chlorinated VOCs, and an evaluation of remedial alternatives for chlorinated VOCs at ST027B in the FFS.
F. NAAP Background
Mr. Wray gave a presentation on the background of the Natural Attenuation Assessment Plan.
Portions of the groundwater on Travis AFB are contaminated with chlorinated and petroleum hydrocarbons. To address the contamination, the Air Force, USEPA, and Cal EPA agreed that certain sites should be assessed for natural attenuation.
In 1997 and 1999 the NEWIOU and WABOU IRODs were signed. These IRODs specified the interim remedial actions, including MNA assessment, to be taken to address groundwater contamination. The NAAP was published in 1998. A list of sites (see Attachment) was identified to be assessed for MNA. Mr. Wray expressed this is in no way the only remedy component; it is often combined with other active remedies, such as source control, soil vapor extraction, and pump and treat. This is not a “no action or walk away” alternative.

as of April 2010 Page 8 of 9
Site characterization, which includes field monitoring and laboratory analysis, must be conducted to determine the viability of MNA as a remedy. MNA can also be used to complete remediation after other actions have reduced contaminant concentrations to specified levels. Once MNA is in place, continued monitoring will be conducted to verify decreasing contaminant levels, and to verify protectiveness. There was agreement by Travis AFB and the Agencies that reductive dechlorination was unlikely under site-specific conditions, as documented in the Natural Attenuation Assessment Workplans (NAAWs). Success would hinge on whether physical processes prevented plume migration.
Mr. Smith reiterated that Travis AFB and the Agencies all agreed we were going to conduct MNA assessments in accordance with the IRODs – then asked how it was decided Travis AFB needed to come up with a natural attenuation assessment plan. Mr. Wray said once it was identified in the IROD, the NAAP was generated from there, and it was a primary document.
In accordance with the NAAP, a site-specific NAAW was prepared for each site. Mr. Wray summed it up by stating; the natural attenuation assessment program is fully compatible with the IRODs and the upcoming Basewide Groundwater ROD. It is a cost effective, risk-base approach to groundwater remediation. It is protective of human health and the environment. It complies with all regulatory requirements, including anti-degradation policy for clean aquifers and AFCEE natural attenuation guidance. The upcoming Groundwater ROD will describe contingency actions to address any future plume migration.
Mr. Smith asked when the GSAP first began to collect data that could be used to assess whether natural attenuation was occurring. Mr. Wray indicated that the first GSAP data collected for natural attenuation assessment started in 2001.
Mr. Chang expressed his appreciation for the background/history on the NAA plan.
4. New Action Item Review
There were no new action items.
5. PROGRAM/ISSUES/UPDATE
Mr. Smith indicated that he has requested funding for the carbon change-outs at the South Plant. Travis AFB is considering converting the air stripping system to granular activated carbon at the South Base Plant. This conversion was prompted by the lack of 1,2-DCA in the system influent. Once the plant is converted, the GAC will be a more sustainable solution than air stripping.

as of April 2010 Page 9 of 9
6. Potential Response To Comments Meetings
Mr. Anderson said he just recently sent one last response to the EPA comments (from Mr. Chang) on the DP039 Workplan.
General Discussion
Mr. Chang asked about the 2012 date for RIP; is that date still a Travis AFB goal? He explained that the problem is all the Bases across the region want to achieve RIP by 2012. Mr. Smith said that 2012 is the desired date to achieve RIP and still the Travis AFB goal. He said that the Air Force is willing to work with the agencies and trying to provide the data needed to achieve that date, but understands the workload that an Air Force wide goal places on the environmental regulatory agencies. Mr. Anderson added that the presentations, documents, and responses to comments that the Base is providing are written to assist the Agencies with the remedy selection process.
7. Action Items
Item #
Responsible Action Item Description Due Date Status
1. Travis AFB Review CAMU design to determine if lysimeter is a regulatory requirement.
19 May 2010
Next RPM meeting
2. Travis AFB Schedule a RAB tour at site SS016 for when the bioreactor is being installed.
Open Provide 30 days notice to RAB members for tour.
3. Travis AFB Schedule a teleconference on MNA with EPA.
28 April 2010 at 1:00 pm
Tentative date and time.

TRAVIS AIR FORCE BASE ENVIRONMENTAL RESTORATION PROGRAM REMEDIAL PROGRAM MANAGER’S MEETING
BLDG 570, Main Conference Room 22 April 2010, 1:00 P.M.
AGENDA
1. ADMINISTRATIVE
A. PREVIOUS MEETING MINUTES B. ACTION ITEM REVIEW C. MASTER MEETING AND DOCUMENT SCHEDULE REVIEW
2. CURRENT PROJECTS
A. TREATMENT PLANT OPERATION AND MAINTENANCE UPDATE (LONNIE)
3. PRESENTATIONS
A. 2010 FIELD INSTALLATIONS UPDATE B. PROGRAM UPDATE: ACTIVITIES COMPLETED, IN PROGRESS AND UPCOMING C. UNION CREEK SITES COMPLETION REPORT D. FT005 FIELD WORK PLANNING UPDATE E. ST027B SITE CHARACTERIZATION REPORT F. NAAP BACKGROUND
4. NEW ACTION ITEM REVIEW 5. PROGRAM/ISSUES/UPDATE 6. POTENTIAL RESPONSE TO COMMENTS MEETINGS

Travis AFB Master Document Schedule
As of: 04/22/2010
Annual Meeting and Teleconference Schedule
Monthly RPM Meeting (Begins at 9:30 a.m.)
RPM Teleconference (Begins at 9:30 a.m.)
Restoration Advisory Board Meeting
(Begins at 7:00 p.m.) (Poster Session at 6:30 p.m.)
01-27-10 — —
— — —
03-30-10 — —
04-22-10 *(1:00 PM) — 04-22-10
05-19-10 — —
06-23-10 — —
07-21-10 — —
08-25-10 — —
09-22-10 — —
10-20-10 — 10-21-10
— 11-17-10 —
12-08-10 — —
* RPM meeting moved to coincide with the RAB meeting.

Travis AFB Master Document Schedule
As of: 04/22/2010 Page 1 of 1
PRIMARY DOCUMENTS Basewide Groundwater
Life Cycle Focused Feasibility Study Travis, Glenn Anderson CH2M Hill, Loren Krook
Proposed Plan Travis, Glenn Anderson
CH2M HILL, Loren Krook
Record of Decision Travis, Glenn Anderson CH2M HILL, Tony Jaegel
Scoping Meeting (03-30-10) NA 01-24-07
Predraft to AF/Service Center 06-18-10 12-08-10 06-08-11
AF/Service Center Comments Due 07-02-10 01-03-11 06-22-11
Draft to Agencies 07-16-10 01-10-11 07-06-11
Draft to RAB 07-16-10 01-10-11 07-06-11
Agency Comments Due 09-17-10 03-09-11 08-31-11
Response to Comments Meeting 10-21-10 03-23-11 09-22-11
Agency Concurrence with Remedy NA NA 09-29-11
Public Comment Period NA 03-31-11 to 04-27-11 NA
Public Meeting NA *04-21-11 NA
Response to Comments Due 11-18-10 06-14-11 10-27-11
Draft Final Due 11-18-10 06-14-11 10-27-11
Final Due 12-20-10 07-14-11 11-24-11
*Public meeting to coincide with RAB meeting.

As of: 04/22/2010 Page 2 of 2
PRIMARY DOCUMENTS
Potrero Hills Annex Travis, Glenn Anderson
Union Creek Sites SD001 &SD033 Remedial Action
Travis, Lonnie Duke ITSI, Rachel Hess
Life Cycle FFS Proposed Plan ROD Completion Report
Scoping Meeting 180 days after Water Board Order Rescinded
+470 days +735 days NA
Predraft to AF/Service Center + 270 days +530 days + 915 days 01/06/10
AF/Service Center Comments Due + 300 days +560 days + 975 days 02/05/10
Draft to Agencies +330 days +590 days + 1035 days 03/30/10
Draft to RAB + 330 days +590 days + 1035 days 03/30/10
Agency Comments Due +390 days +650 days + 1095 days 06/01/10
Response to Comments Meeting + 405 days +665 days + 1110 days 06/23/10
Agency Concurrence with Remedy NA NA + 1130 days NA
Public Comment Period NA +735 to 765 days NA NA
Public Meeting NA +745 days NA NA
Response to Comments Due +430 days +695days + 1190 days 07/21/10
Draft Final Due +430 days +695 days + 1190 days 07/21/10
Final Due +460 days +725 days + 1250 days 08/20/10

As of: 04/22/2010 Page 3 of 3
SECONDARY DOCUMENTS
Life Cycle
Phases 1 and 2 Vapor Intrusion Report Travis, Glenn Anderson CH2M HILL, Leslie Royer
Vapor Intrusion Assessment Report** Travis, Glenn Anderson CH2M HILL, Leslie Royer
Scoping Meeting NA NA
Predraft to AF/Service Center
12-08-08 01-04-10
AF/Service Center Comments Due
12-15-08 01-14-10
Draft to Agencies 01-12-09 01-22-10
Draft to RAB 01-12-09 01-22-10
Agency Comments Due 02-17-09 02-26-10
Response to Comments Meeting
02-25-09 03-03-10
Response to Comments Due
TBD* 03-25-10
Draft Final Due NA NA
Final Due TBD* 03-25-10
Public Comment Period NA NA
Public Meeting NA NA
*The Vapor Intrusion report will be rescheduled to incorporate the Phase 3 data and evaluation per discussion with EPA on 30 March 2009.
**The Vapor Intrusion Assessment Report contains the results of Phases 1, 2, and 3 of the Vapor Intrusion Assessment and a data evaluation. This report complies with the decisions made during the 30 March 2009 EPA-Travis AFB meeting.

As of: 04/22/2010 Page 4 of 4
SECONDARY DOCUMENTS
Life Cycle
Natural Attenuation Assessment Report Travis AFB, Glenn Anderson
CH2M HILL, Leslie Royer
DP039 RPO Work Plan Travis AFB, Glenn Anderson
CH2M HILL, Loren Krook
FT005 Data Gap Work Plan
Travis, Lonnie Duke ITSI, Rachel Hess
Scoping Meeting NA NA NA
Predraft to AF/Service Center
07-07-09 09-17-09 10/22/09
AF/Service Center Comments Due
07-21-09 10-01-09 11/20/09
Draft to Agencies 08-26-09 10-11-09 02/05/10
Draft to RAB 08-26-09 10-11-09 02/05/10
Agency Comments Due 10-15-09 11-13-09 (01-27-10) 03/08/10
Response to Comments Meeting
TBD 04-22-10 03/30/10
Response to Comments Due 02-02-10 (TBD) 04-19-10 04/22/10
Draft Final Due NA NA NA
Final Due TBD 04-29-10 04/22/10
Public Comment Period NA NA NA
Public Meeting NA NA NA
As of: 04/22/2010 Page 5 of 5
SECONDARY DOCUMENTS
Life Cycle
SD036/SD037 RPO Work Plan Travis AFB, Lonnie Duke CH2M HILL, Loren Krook
ST027B Site Characterization Report Travis AFB, Lonnie Duke
CH2M HILL, Gavan Heinrich
Phytostabilization Study Report Travis AFB, Glenn Anderson
Parsons, Bill Plaehn
Scoping Meeting NA NA 10-09-08
Predraft to AF/Service Center 08-13-09 02-23-10 04-12-10
AF/Service Center Comments Due
08-27-09 03-08-10 05-03-10
Draft to Agencies 10-01-09 03-29-10 05-17-10
Draft to RAB 10-01-09 03-29-10 05-17-10
Agency Comments Due 11-02-09 (01-27-10) 04-28-10 06-18-10
Response to Comments Meeting TBD 05-19-10 06-23-10
Response to Comments Due TBD 05-26-10 07-02-10
Draft Final Due NA NA NA
Final Due TBD 05-26-10 07-02-10
Public Comment Period NA NA NA
Public Meeting NA NA NA

As of: 04/22/2010 Page 6 of 6
INFORMATIONAL DOCUMENTS
Life Cycle
Quarterly Newsletters (April 2010)
Travis, Glenn Anderson
2008/2009 GSAP
Travis AFB, Lonnie Duke
CH2M HILL, Leslie Royer
2009 GWTP RPO Annual Report
Travis AFB, Lonnie Duke
CH2M HILL, Doug Berwick
Scoping Meeting NA NA NA
Predraft to AF/Service Center NA 10-26-09 03-09-10
AF/Service Center Comments Due NA 11-09-09 03-30-10
Draft to Agencies 04-12-10 12-07-09 04-28-10
Draft to RAB NA 12-07-09 04-28-10
Agency Comments Due 04-15-10 01-15-10 05-28-10
Response to Comments Meeting TBD 01-27-10 06-23-10
Response to Comments Due 04-15-10 (04-15-10) 07-14-10
Draft Final Due NA NA NA
Final Due 04-16-10 (04-15-10) 07-14-10
Public Comment Period NA NA NA
Public Meeting NA NA NA

South Base Boundary Groundwater Treatment Plant Monthly Data Sheet Report Number: 116 Reporting Period: 27 February – 31 March 2010 Date Submitted: 19 April 2010
This data sheet includes the following: results for the operation of the South Base Boundary Groundwater Treatment Plant (SBBGWTP), a summary of flow rates for the individual extraction wells, a brief description of any shutdowns or significant events related to the system, and a summary of analytical results for selected samples collected.
Operations Summary – March 2010
Operating Time: 499 hours Percent Uptime: 63%
Electrical Power Usage: 12,300 kWh
Gallons Treated: 3.2 million gallons Gallons Treated Since July 1998: 682 million gallons
Volume Discharged to Union Creek: 3.2 million gallons
VOC Mass Removed: 1.0 poundsa VOC Mass Removed Since July 1998: 378pounds
Rolling 12-Month Cost per Pound of Mass Removedc: $4,716
Monthly Cost per Pound of Mass Removedc: $7,148
a Calculated using March 2010 EPA Method SW8260B analytical results. b Costs include operations and maintenance, reporting, analytical laboratory, project management, and utility costs related to operation of the system. c Increased costs are due to annual reporting expenses
Flow Rates Average Groundwater Total Flow Rate: 107 gpma
Average Flow Rate (gpm)b
FT005c SS029 SS030
EW01x05 Off line EW736x05 Off line EW01x29 1.0 EW01x30 6.5
EW02x05 Off line EW737x05 Off line EW02x29 5.6 EW02x30 1.9
EW03x05 Off line EW742x05 Off line EW03x29 Off lined EW03x30 1.2
EW731x05 Off line EW743x05 Off line EW04x29 5.2 EW04x30 21.2
EW732x05 Off line EW744x05 Off line EW05x29 Off Linee EW05x30 10.8
EW733x05 Off line EW745x05 Off line EW06x29 22.9 EW06x30 Dry
EW734x05 Off line EW746x05 Off line EW07x29 17.7 EW711x30 10.0f
EW735x05 Off line FT005 Total: Off line SS029 Total: 52.4 SS030 Total: 51.6
a The average groundwater flow rate was calculated using the Union Creek Discharge Totalizer and dividing it by the operating time of the plant. b Extraction well flow rates are based on the average of the weekly readings. c Extraction wells at FT005 were taken off line in accordance with the 2008 Annual Remedial Process Optimization Report for the Central Groundwater Treatment Plant, North Groundwater Treatment Plant, and South Base Boundary Groundwater Treatment Plant. d Extraction well is off line due to low VOC concentrations. e Extraction well offline due to faulty Variable Frequency Drive (VFD) at the well head. f Extraction well online, but has a faulty flow meter. Average flow rate is from previous month’s readings. gpm—gallons per minute
South Base Boundary Groundwater Treatment Plant 1 of 3 March 2010Monthly Data Sheet SBBGWTP_March10.doc

Shutdown/Restart Summary
Shutdown Restart Location
Date Time Date Time
Cause
SBBGWTP 26 February 2010 1500 9 March 2010 1600 Faulty VFD drive, replaced and returned to service
SBBGWTP 14 March 2010 0600 15 March 2010 0945 Scheduled Base wide power outage
SBBGWTP = South Base Boundary Groundwater Treatment Plant
Summary of O&M Activities Monthly groundwater samples at the SBBGWTP were collected on 10 March 2010. Sample results are presented in Table 1. The total VOC concentration (37.6 µg/L) in the influent sample has decreased since the February 2010 sample (43.4 µg/L) was collected. TCE and cis-1,2-DCE were the only VOCs detected in the influent sample. VOCs were not detected in the effluent sample, indicating good treatment efficiency.
A sample result of 67 J µg/L (estimated) for TPH-diesel was detected in the effluent sample at the SBBGWTP. A confirmation sample will be collected in April 2010. The results of this confirmation sample will be presented in the April 2010 data sheet.
On 26 February 2010, the variable frequency drive on the outlet of the SBBGWTP air stripper malfunctioned. This resulted in a system shutdown since water was no longer being pumped out of the air stripper. A replacement VFD was ordered and installed on 9 March 2010. After installation, the SBBGWTP was brought back on line.
Optimization Activities No optimization activities were performed in March 2010.
South Base Boundary Groundwater Treatment Plant 2 of 3 March 2010Monthly Data Sheet SBBGWTP_March10.doc

Table 1 Summary of Groundwater Analytical Data for March 2010 – South Base Boundary Groundwater Treatment Plant
10 March 2010 (μg/L)
Constituent
Instantaneous Maximuma
(μg/L)
Detection Limit (μg/L) N/C Influent Effluent
Halogenated Volatile Organics Bromodichloromethane 5.0 0.15 0 ND ND Carbon Tetrachloride 0.5 0.14 0 ND ND Chloroform 5.0 0.16 0 ND ND Dibromochloromethane 5.0 0.13 0 ND ND 1,1-Dichloroethane 5.0 0.19 0 ND ND 1,2-Dichloroethane 0.5 0.15 0 ND ND 1,1-Dichloroethene 5.0 0.19 0 ND ND cis-1,2-Dichloroethene 5.0 0.19 0 2.3 ND trans-1,2-Dichloroethene 5.0 0.33 0 ND ND Methylene Chloride 5.0 0.66 0 ND ND Tetrachloroethene 5.0 0.21 0 ND ND 1,1,1-Trichloroethane 5.0 0.14 0 ND ND 1,1,2-Trichloroethane 5.0 0.20 0 ND ND Trichloroethene 5.0 0.19 0 35.3 ND Vinyl Chloride 0.5 0.18 0 ND ND Non-Halogenated Volatile Organics Benzene 1.0 0.17 0 ND ND Ethylbenzene 5.0 0.22 0 ND ND Toluene 5.0 0.14 0 ND ND Xylenes 5.0 0.23 – 0.5 0 ND ND Other Total Petroleum Hydrocarbons – Gasoline 50 8.5 0 NM ND Total Petroleum Hydrocarbons – Diesel 50 50 0 NM 67 J Total Suspended Solids (mg/L) NE 1.0 0 19 J NM a In accordance with Appendix B of the Travis AFB South Base Boundary Groundwater Treatment Plant Operations and Maintenance Manual (CH2M HILL, 2004). J = analyte concentration is considered an estimated value mg/L = milligrams per liter N/C = number of samples out of compliance with discharge limits ND = not detected NE = not established NM = not measured μg/L = micrograms per liter
South Base Boundary Groundwater Treatment Plant 3 of 3 March 2010Monthly Data Sheet SBBGWTP_March10.doc

Central Groundwater Treatment Plant 1 of 6 March 2010
Central Groundwater Treatment Plant Monthly Data Sheet Report Number: 128 Reporting Period: 27 February 2010 – 31 March 2010 Date Submitted: 19 April 2010
This data sheet includes the following: results for the operation of the Central Groundwater Treatment Plant (CGWTP), West Treatment and Transfer Plant (WTTP), and thermal oxidation (ThOx) system (previously referred to as the two-phase extraction [TPE] system). A summary of flow rates for the CGWTP, WTTP, ThOx, and extraction wells EW01x16, EW02x16, EW03x16, EW605x16, and EW610x16; a brief description of any shutdowns or significant events related to the systems, and a summary of analytical results for selected samples collected are also included on this data sheet.
Operations Summary – March 2010 Operating Time: Percent Uptime: Electrical Power Usage:
CGWTP: 760 hours CGWTP: 96.3% CGWTP: 68 kWh WTTP: Water: 387 hours WTTP: Water: 48.9% WTTP: 7,171 kWh Vapor: 0 hours Vapor: 0% ThOx: 365 hours ThOx: 46.2% ThOx: 5,377 kWh
ThOx: Natural Gas Usage: 1,593 therms Gallons Treated: 1.77 million gallons Gallons Treated Since January 1996: 427 million gallons VOC Mass Removed: VOC Mass Removed Since January 1996:
5.53 lbs (groundwater only)a 2,484 lbs from groundwater 5.88 lbs (vapor only)b 8,682 lbs from vapor ThOx DRE: 100%
Rolling 12-Month Cost per Pound of Mass Removed: $1,524c
Monthly Cost per Pound of Mass Removed: $1,099 c
a Calculated using March 2010 EPA Method SW8260B analytical results. b Total VOC vapor mass removed was calculated using EPA Method TO-14 analytical results for the ThOx system. c Costs include operations and maintenance, reporting, analytical laboratory, project management, and electric and natural gas costs related to operation of the system.
DRE = destruction removal efficiency
Flow Rates Average Groundwater Flow Rate: 38.8 gpma
Average Flow Rate Location
Groundwater (gpm)b Soil Vapor (scfm) EW01x16 23.2 NA EW02x16 6.6 NA EW03x16 0.35 NAc
EW605x16 7.6 NAc
EW610x16 2.6 NAc
WTTP 4.5d Off line
ThOx 0.11 d 51.7
a as measured by the effluent discharge to the storm drain divided by the operating time during the month. b as measured by extraction well totalizer divided by the operating time. c soil vapor was extracted from this well; however, the flow rates are not measured at individual wells at SS016. d as measured by the effluent groundwater pumped to the CGWTP divided by the operating time of the WTTP or ThOx.
gpm = gallons per minute NA = not applicable/not available scfm = standard cubic feet per minute
Monthly Data Sheet CGWTP_March10.doc

Flow Rates from Wells Sites that Feed into the WTTP
Average Flow Rate from the WIOU, DP039, and LF008 Extraction Wells (gpm)a
SD037/ SD043 SD033/SD034/ DP039 LF008/SD036
EW599x37 NA EW705x37 1.1 EW501x33 0.2 EW719x08 Off linec EW700x37 3.9 EW706x37 1.9 EW503x33 0.1 EW720x08 Off linec EW701x37 NA EW707x37 1.1 EW01x34 1.5 EW721x08 Off linec EW702x37 NA EW510x37 NA EW03x34 0.3 EW593x36 1.3 EW703x37 NA EW511x37 1.6 EW563x39 Off lineb EW594x36 0.5 EW704x37 0.5 EW555x43 0.2 EW782x39 Off lineb EW595x36 1.2
gpm—gallons per minute NA – not available / not recorded
Flow rates for EW599x37, EW701x37 – EW703x37, and EW510x37 were not recorded due to the discovery of leaks within each of these well vaults. a Extraction well flow rates are based on instantaneous readings during March 2010. These rates are not consistent with the overall effluent flow rate from the WTTP to the CGWTP. b Extraction wells were shut off to facilitate the Bioreactor Sustainability Study at Site DP039. c Extraction wells shut off to support a rebound study at Site LF008.
Central Groundwater Treatment Plant 2 of 6 March 2010Monthly Data Sheet CGWTP_March10.doc

Shutdown/Restart Summary
Shutdown Restart
Location Date Time Date Time Cause
CGWTP (Groundwater):
CGWTP 14 March 2010 0600 15 March 2010 1115 Scheduled base-wide power outage
WTTP (Groundwater):
WTTP 9 March 2010 0030 28 March 2010 1700 Leak in transmission vault, flooded vault, system sporadically operated during troubleshooting activities
WTTP 14 March 2010 0600 15 March 2010 1130 Scheduled base-wide power outage
WTTP (Vapor):
WTTP 24 August 2009 SVE system shut down for rebound study
ThOx (Vapor):
ThOx 1 March 2010 0800 12 March 2010 1200 Knock out pot flooded. Faulty switch on transfer pump caused system to shut off.
ThOx 14 March 2010 0600 15 March 2010 1130 Scheduled base-wide power outage
ThOx Various in February 2010
Various in February 2010
Shutdown due to frequent burner flame out alarms, likely due to high winds and low natural gas pressures.
CGWTP = Central Groundwater Treatment Plant WTTP = West Treatment and Transfer Plant ThOx = Thermal Oxidation System
Summary of O&M Activities Monthly groundwater and vapor sampling at the CGWTP was performed on 10 March 2010. Groundwater sample results are summarized in Table 1. Vapor sample results are presented in Table 2. The total VOC concentration (375.06 µg/L) in the March 2010 CGWTP influent groundwater sample has decreased since the February 2010 (420.7 µg/L) sample was taken. No VOCs were detected in the effluent sample.
Vapor analytical results from samples collected at the ThOx unit on 11 March 2010 have remained consistent with concentrations seen in the previous samples collected at the same locations in November 2009.
During February and March 2010, the flow rates seen at each extraction well throughout the WTTP did not appear to be consistent with the flow rate of groundwater being sent from the WTTP to the CGWTP. The cause of this discrepancy was investigated during March 2010. During this investigation, a significant leak was detected in one of the service vault boxed located south of the WTTP. The eductor supply pipeline located within this vault had ruptured and was leaking within the vault, shutting the WTTP down in the process. This leak was repaired, but further investigations at other well vaults associated with the WTTP identified other system leaks. As a result, flow rates from wells EW599x37, EW701x37,
Central Groundwater Treatment Plant 3 of 6 March 2010Monthly Data Sheet CGWTP_March10.doc

Central Groundwater Treatment Plant 4 of 6 March 2010Monthly Data Sheet CGWTP_March10.doc
EW702x37, EW703x37, and EW510x37 were not recorded. Pending repair of the leaks found within these well vaults, these wells were taken off line. Details on the status of these repairs will be presented in the April 2010 data sheet.
The ThOx unit has continued its recent trend of inconsistent operation. In addition to several flame out alarms due to inadequate natural gas pressure or stormy weather conditions, the switch operating the transfer pump malfunctioned. The faulty switch did not activate the knock out pot transfer pump, and as a result, the ThOx was flooded, and was unable to operate. The switch was repaired, and the ThOx was returned to service on 12 March 2010.
Optimization Activities No optimization activities were performed in March 2010.

Central Groundwater Treatment Plant 5 of 6 March 2010Monthly Data Sheet CGWTP_March10.doc
Table 1 Summary of Groundwater Analytical Data for March 2010 – Central Groundwater Treatment Plant
10 March 2010
(μg/L)
Constituent
Instantaneous Maximuma
(μg/L)
Detection Limit (μg/L) N/C Influent
After Carbon 1 Effluent
After Carbon 2 Effluent
System Effluent
Halogenated Volatile Organics Bromodichloromethane 5.0 0.15 0 ND ND ND ND Carbon Tetrachloride 0.5 0.14 0 ND ND ND ND Chloroform 5.0 0.16 0 ND ND ND ND 1,2-Dichlorobenzene 5.0 0.08 0 ND ND ND ND 1.3-Dichlorobenzene 5.0 0.15 0 ND ND ND ND 1,4-Dichlorobenzene 5.0 0.15 0 ND ND ND ND 1,1-Dichloroethane 5.0 0.15 0 ND ND ND ND 1,2-Dichloroethane 0.5 0.15 0 ND ND ND ND 1,1-Dichloroethene 5.0 0.19 0 0.88 ND ND ND cis-1,2-Dichloroethene 5.0 0.19 0 90.6 ND ND ND trans-1,2-Dichloroethene 5.0 0.33 0 4.9 ND ND ND Methylene Chloride 5.0 0.66 0 ND ND ND ND Tetrachloroethene 5.0 0.21 0 0.73 ND ND ND 1,1,1-Trichloroethane 5.0 0.14 0 ND ND ND ND 1,1,2-Trichloroethane 5.0 0.2 0 ND ND ND ND Trichloroethene 5.0 1.9 0 274 ND ND ND Vinyl Chloride 0.5 0.18 0 ND ND ND ND Non-Halogenated Volatile Organics Benzene 1.0 0.17 0 ND ND ND ND Ethylbenzene 5.0 0.22 0 ND ND ND ND Toluene 5.0 0.14 0 ND ND ND ND Total Xylenes 5.0 0.5 – 0.23 0 ND ND ND ND a In accordance with Appendix G of the Travis AFB Central Groundwater Treatment Plant Operations and
Maintenance Manual (URS Group, Inc., 2002). J = analyte concentration is considered an estimated value N/C = number of samples out of compliance with discharge limits ND = not detected μg/L = micrograms per liter

Central Groundwater Treatment Plant 6 of 6 March 2010Monthly Data Sheet CGWTP_March10.doc
Table 2 Soil Vapor Analytical Data for March 2010
11 March 2010 (ppbv)
Constituent THOXVINF THOXVEFF Volatile Organics Acetone 195 J 9.24 Chloroform ND (46.8) ND (0.151) Chloromethane ND (88.8) ND (0.286) cis-1,2-Dichloroethene 1,550 ND (0.135) 1,1-Dichloroethene ND (61.4) ND (0.198) Ethylbenzene ND (59.2) ND (0.191) Hexane ND (40.8) ND (0.131) Methyl Ethyl Ketone (2-Butanone) ND (126) 0.48 J Tetrachloroethene ND (59.2) 0.89 trans-1,2-Dichloroethene ND (59.3) ND (0.191) Trichloroethene 16,400 ND (0.28) Toluene ND (48.2) ND (0.16) Xylenes, m,p- ND (152) ND (0.498) Vinyl Chloride ND (72.1) ND (0.233) Total VOCs 18,145 10.61
J = analyte concentration is considered an estimated value ND = not detected ppbv = parts per billion by volume ( ) = detection limit

5/21/2010
1
2010 Field Installations
Update
Travis Air Force Base, California
April 22, 2010
Installations in Progress
• Site DP039 Mid-Plume
• Site SS016 OSA Source Area
• Site SS030 Eastern Edge of Plume
• Site SD036 Hot Spot
• Site SD037 Hot Spot
• Site ST027B Plume Characterization
• Site SS015 Plume

5/21/2010
2
Site DP039 — Plan
• Install 3 new monitoring wells to complement the existing well pairs (for total of 15 wells in the EVO performance monitoring network)
• Install 13 EVO injection wells across the plume, downgradient of the 500 µg/L contour (change well radius from 40 ft to 30 ft
• Inject about 25,000 lbs of EVO to form the biobarrier
• Initiate performance monitoring of the remedy optimization
• Prepare a completion report after EVO injection is finished
• Evaluate ongoing progress in GSAP reports

5/21/2010
3
Site DP039 – Field Work Status
• Installed 9 injection wells (IW2083x39 through IW2091x39)
• Installed 1 monitoring well (MW2093x39)
• Soggy ground is preventing installation of 4 remaining injection wells and 2 remaining monitoring wells
• Well development & sampling scheduled for May
• EVO injection planned for June
5/21/2010
4
Site DP039 Biobarrier
Performance Monitoring Plan
• Monitoring Well Network-six (6) upgradient wells (MW2056x39A&B, MW2057x39A&B, and MW2043x39A&B)
-three (3) performance wells (IW3x39, IW7x39, and IW12x39)
-six (6) compliance wells (MW2060A&B, MW02x39, new well pair to the southwest, and new well to the northeast)
• Analytes-VOCs (including VC), Dissolved Hydrocarbon Gasses, Total Organic Carbon, Nitrate/Nitrite, Sulfate, Chloride, Sulfide, Ferrous Iron, Alkalinity, pH, ORP, Temperature, EC, DO
• Frequency-Pre-Installation: All wells sampled in baseline event
-Post-Installation: Semi-Annually for first two (2) years, Annually thereafter
Site SS016 — Plan
• Discontinue SVE at SS016 due to limited
effectiveness and to promote anaerobic
conditions in source area
• Remove the Therm/Ox unit
• Remove the Wash Rack canopy

5/21/2010
5
Site SS016 — Plan
• Excavate the highly contaminated soil in
Wash Rack area (at least 20’x20’x20’)
down to below bedrock interface –
Remove large mass of TCE in soil
• Create a gravel/mulch bioreactor in the
excavation
• Tie the existing EW03x16 (horizontal well)
into the bioreactor for recirculation
Site SS016 — Plan
• Install five new wells to complement
existing monitoring of the effectiveness of
the bioreactor)
• Prepare completion report after
optimization is accomplished
• Evaluate ongoing progress in GSAP
reports

5/21/2010
6
Site SS016 – Field Work Status
• Installed 5 monitoring wells (MW2109x16, MW 2110x16, MW2111x16 (dual completion), and MW2022x16
• Developed & sampled each of the 5 monitoring wells
• Found two moist zones in boring for MW2111x16, so installed a dual-completion well (3-13ft bgs & 18-28ft bgs)
• Therm/Ox system to be dismantled in April
• Well MW2112x16 to be installed after the Therm/Ox system is removed
• Canopy removal and bioreactor Installation is scheduled for June/July

5/21/2010
7
Site SS016 Performance
Monitoring Plan• Monitoring Well Network
-two (2) downgradient from bioreactor, (MW2112x16 and MW2109x16)-three (3) further downgradient from bioreactor (MW2026x16, MW2111x16, and MW2110x16)-one (1) upgradient from the bioreactor (new well:MW2022x16)
Analytes-VOCs (including VC), Dissolved Hydrocarbon Gasses, Total Organic Carbon, Nitrate/Nitrite, Sulfate, Chloride, Sulfide, Ferrous Iron, Alkalinity, pH, ORP, Temperature, EC, DO
• Frequency-Pre-Installation: All wells sampled in baseline event-Post-Installation: Semi-Annually for first two (2) years, Annually thereafter
Site SS030 - Plan
• Maximize groundwater extraction at the site – restart EW03x30 (in progress)
• Monitor groundwater levels and TCE concentrations across the site during annual GSAP event in May/June 2010
• Determine if additional monitoring wells and extraction wells are needed to obtain capture of the SS030 TCE plume following the GSAP event

5/21/2010
8
Site SD036 and SD037
• Located in the WIOU in the western
portion of the base
• Hot spot (>1,000 µg/L) of trichloroethene
(TCE) concentrated in one small area near
sanitary sewer line at each site
• Existing remedial process in the area
includes groundwater extraction and
treatment

5/21/2010
9
Site SD036 — Plan
• Need to step out to the southwest, north, & northeast (in progress)
• After hot spot is defined, optimize the EVO injection design
• Prepare summary of the investigation data, and identify locations of EVO injection points and monitoring network
• Conduct remedy optimization followed by implementation of performance monitoring
• Prepare completion report after EVO injection is accomplished
• Evaluate ongoing progress in GSAP reports

5/21/2010
10
Site SD036 – Field Work Status
• Installed 3 triple-completion wells
• Defined the 1,000 and 10,000 ppb TCE plume
• Completed the detailed investigation of the Site SD036 source area
• Refined the site model for contaminant source – to a section of the sanitary sewer line (western line) or to a historic surface spill in the area

5/21/2010
11

5/21/2010
12
Site SD037 — Plan
• Install triple-completion well at two downgradient locations
• Install 7 EVO injection wells in hot spot
• Inject 36,000 lbs of EVO and monitor effectiveness
• Initiate performance monitoring of the remedy optimization
• Prepare completion report after EVO injection is accomplished
• Evaluate ongoing progress in GSAP reports

5/21/2010
13

5/21/2010
14
Site SD037 – Field Work Status
• Installed 6 downgradient monitoring wells
(2 triple-completion wells)
• Installed all 7 EVO injection wells
• Well development and sampling is in
progress
• EVO injection planned for June
Site SD037 Performance
Monitoring Plan• Monitoring Well Network
-two (2) upgradient wells (EW599x37 and MW532x37)
-three (3) performance wells (MW2039x37A, MW2039x37B, and MW524x37)
-four (4) compliance wells (two (2) new well pairs to the south and southeast of the treatment zone)
• Analytes-VOCs (including VC), Dissolved Hydrocarbon Gasses, Total Organic Carbon, Nitrate/Nitrite, Sulfate, Chloride, Sulfide, Ferrous Iron, Alkalinity, pH, ORP, Temperature, EC, DO
• Frequency-Pre-Installation: All wells sampled in baseline event
-Post-Installation: Semi-Annually for first two (2) years, Annually thereafter
5/21/2010
15
Site SS015 Description
• Contaminant Plume of TCE originated
from 3 former facilities in vicinity of Bldg
554
• In 1997, a treatability study of enhanced
MNA using vegetable oil was conducted
• Source area COCs were affected by the
vegetable oil treatability study
5/21/2010
16
Site SS015 Status
• TCE, PCE, and cis1,2-DCE decreased in
the source area from 2004 to 2007
• The COCs rebounded from 2007 through
2009
• Vinyl Chloride concentrations are
increasing

5/21/2010
17
Site SS015 Status (cont’d)
• Elevated cis1,2-DCE and VC confirm that ERD was working and that the biological component of natural attenuation can be effectively enhanced at the site
• Rebound of TCE & PCE indicate that insufficient vegetable oil remains to complete the degradation process
• The plume appears to be slowly migrating eastward
Site SS015 Hydrogeology
• ~ 20 ft of unconsolidated alluvium overlies
sedimentary bedrock
• The bedrock consists of shale and
sandstone
• The alluvium is composed of
discontinuous lenses of sand, silt, and clay
• The water table is ~10 ft bgs, and the
saturated zone is ~10 ft thick

5/21/2010
18
Site SS015 Hydrogeology (cont’d)
• TCE extends laterally from source area ~ 120 ft to the east
• Monitoring well screened intervals at the site range from 5 to 58 ft bgs and are adequate to monitor vertical extent of contamination
• A submerged ridge of sandstone traverses the site from the northwest to the southeast, and influences groundwater flow
5/21/2010
19
Site SS015 - Plan
• Investigate extent of VOCs in the source area and downgradient
• Install alluvium-screened shallow well adjacent to MW624x15
• Install monitoring well west of source-area well MW216x15
• Install 2nd round of monitoring wells based on results of 1st round wells
• Evaluate investigation results and report back to the RPM in April or May meeting
Site SS015 – Field Work Status
• Installed round 1 monitoring wells
(MW2103x15 and MW2104x15)
• Sample results from new upgradient well
MW2104x15 indicate ND for TCE and
daughter products
• Sample results from new downgradient
well MW2103x15 indicated elevated TCE,
cis1,2-DCE, and VC

5/21/2010
20
Site SS015 – Plan Status (cont’d)
• Installed round 2 monitoring wells
(MW2105x15, MW2106x15, and
MW2118x15)
• Well development and sampling for round
2 monitoring wells is in progress

5/21/2010
21
Questions/Comments?

5/21/2010
1
Travis AFBGroundwater Program
Management Overview Briefing
RPM Meeting
April 22, 2010
Completed Documents
Documents
• Basewide Health & Safety Plan (HSP)
• Action Plan
• 2007/2008 GSAP Annual Report
• LF007C RPO Work Plan
• LF008 Rebound Study Work Plan
• SS014 Tier 1 POCO Evaluation WP
• ST027B Site Characterization WP
• SS030 RPO Work Plan
• ST032 POCO Technical Memo
• DP039 Bioreactor Work Plan
• 2008 Annual GWTP RPO Report
• Passive Diffusion Bag (PDB) Technical Memo
• RD/RA QAPP Update
• ST032 Tier 1 POCO Evaluation WP
• Phytostabilization Demonstration Tech Memo
• Model QAPP
• LF008 Rebound Test Tech Memo
Documents
• Comprehensive Site Evaluation Phase II Work Plan
• Field Sampling Plan (FSP)
• SS016 RPO Work Plan
• ST018 POCO RA Work Plan
• Vapor Intrusion Assessment Report
• 2008/2009 GSAP Annual Report

5/21/2010
2
Completed Field Work
Field Work
• ST027B Gore Sorber Survey – Ph 1• ST027B Field Sampling – Phase 2• GSAP 2008 Semi-annual Event• ST027B Installation of Wells – Phase 3• SS014 Site Characterization• LF008 Rebound Study• GSAP Annual Sampling Event - 2009• SS030 Site Characterization – Ph 1• ST027 Site Characterization -Ph 3• ST014 Monitor Well Install - Subsite 3• SD001/SD033 Sediment RA• SS016 Site Characterization (OSA
source area)
Field Work
• ST018 Site Characterization• SS030 Site Characterization (Off-base
VOC Plume)• DP039 Site Characterization (for
Biobarrier Placement)• SS014 & ST032 Q1 2010 MNA
Sampling (2nd of 4 quarterly events)
In-Progress Documents & Field Work
Documents
• Natural Attenuation Assessment Report (NAAR) (Draft)
• SD036/SD037 RPO Work Plan (Draft)
• DP039 RPO Work Plan (Draft)
• FT005 Data Gap Work Plan (Draft)
• Union Creek Sites SD001 & SD033 Remedial Action Report(Draft)
• ST027B Site Characterization Report (Draft)
• First (final) and Second (draft) Site DP039 Sustainable Bioreactor Demonstration Progress Reports
Field Work
• SD036 Additional Site Characterization (north & east)
• DP039 Monitoring Well & Biobarrier Injection Well Installation
• SD037 Monitoring Well & EVO Injection Well Installation
• SS016 Monitoring Well Installation
• SS015 Site Characterization (Round 2)
• 2010 GSAP Annual Sampling Event - 2010

5/21/2010
3
Upcoming Documents & Field Work
Documents
• 2009 GWTP RPO Annual Report April
• Quarterly Newsletter (April 2010) April
• Focused Feasibility Study (FFS) July
Field Work
• LF007C Site Characterization (Wetlands) TBD
• ST018 GETS Installation TBD
• SS016 Bioreactor Installation TBD
• Therm/Ox System Removal May
• EVO Injection – Sites SD037 & DP039 May
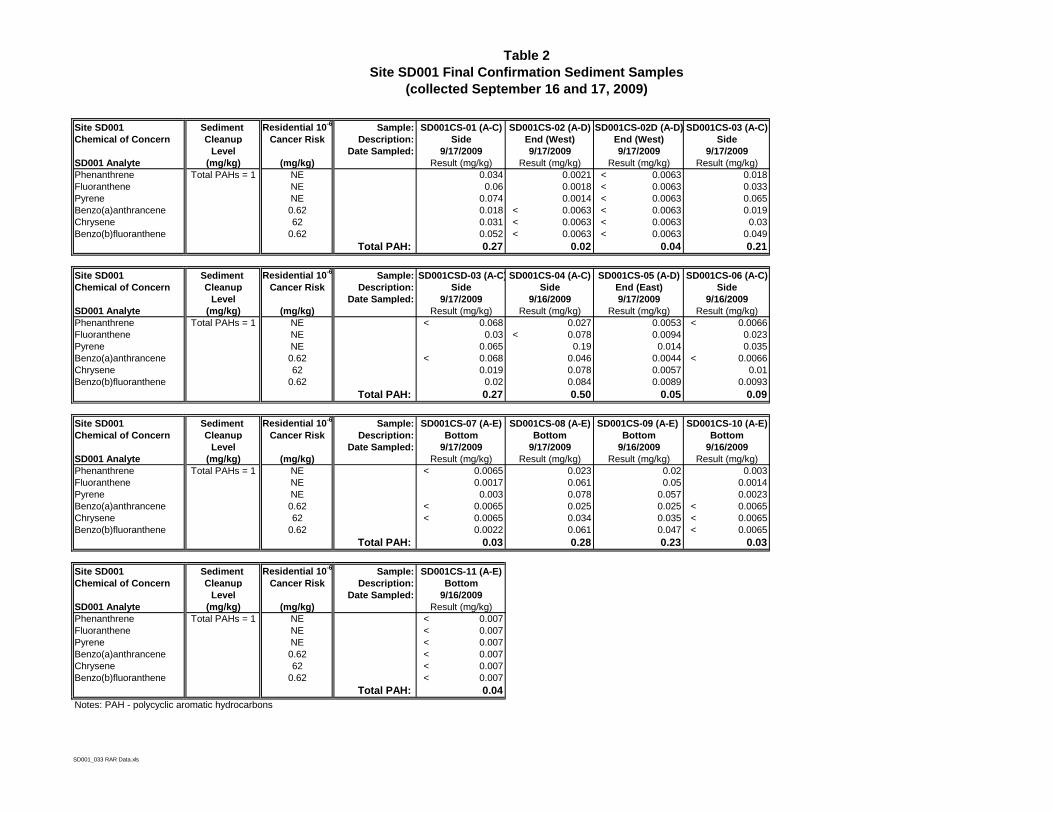
Table 2
Site SD001 Final Confirmation Sediment Samples
(collected September 16 and 17, 2009)
Site SD001 Sediment Residential 10-6
Sample:
Chemical of Concern Cleanup Cancer Risk Description:
Level Date Sampled:
SD001 Analyte (mg/kg) (mg/kg)
Phenanthrene Total PAHs = 1 NE 0.034 0.0021 < 0.0063 0.018
Fluoranthene NE 0.06 0.0018 < 0.0063 0.033
Pyrene NE 0.074 0.0014 < 0.0063 0.065
Benzo(a)anthrancene 0.62 0.018 < 0.0063 < 0.0063 0.019
Chrysene 62 0.031 < 0.0063 < 0.0063 0.03
Benzo(b)fluoranthene 0.62 0.052 < 0.0063 < 0.0063 0.049
Total PAH: 0.27 0.02 0.04 0.21
Site SD001 Sediment Residential 10-6
Sample:
Chemical of Concern Cleanup Cancer Risk Description:
Level Date Sampled:
SD001 Analyte (mg/kg) (mg/kg)
Phenanthrene Total PAHs = 1 NE < 0.068 0.027 0.0053 < 0.0066
Fluoranthene NE 0.03 < 0.078 0.0094 0.023
Pyrene NE 0.065 0.19 0.014 0.035
Benzo(a)anthrancene 0.62 < 0.068 0.046 0.0044 < 0.0066
Chrysene 62 0.019 0.078 0.0057 0.01
Benzo(b)fluoranthene 0.62 0.02 0.084 0.0089 0.0093
Total PAH: 0.27 0.50 0.05 0.09
Site SD001 Sediment Residential 10-6
Sample:
Chemical of Concern Cleanup Cancer Risk Description:
Level Date Sampled:
SD001 Analyte (mg/kg) (mg/kg)
Phenanthrene Total PAHs = 1 NE < 0.0065 0.023 0.02 0.003
Fluoranthene NE 0.0017 0.061 0.05 0.0014
Pyrene NE 0.003 0.078 0.057 0.0023
Benzo(a)anthrancene 0.62 < 0.0065 0.025 0.025 < 0.0065
Chrysene 62 < 0.0065 0.034 0.035 < 0.0065
Benzo(b)fluoranthene 0.62 0.0022 0.061 0.047 < 0.0065
Total PAH: 0.03 0.28 0.23 0.03
Site SD001 Sediment Residential 10-6
Sample:
Chemical of Concern Cleanup Cancer Risk Description:
Level Date Sampled:
SD001 Analyte (mg/kg) (mg/kg)
Phenanthrene Total PAHs = 1 NE < 0.007
Fluoranthene NE < 0.007
Pyrene NE < 0.007
Benzo(a)anthrancene 0.62 < 0.007
Chrysene 62 < 0.007
Benzo(b)fluoranthene 0.62 < 0.007
Total PAH: 0.04
Notes: PAH - polycyclic aromatic hydrocarbons
9/17/2009
Result (mg/kg)
SD001CSD-03 (A-C)
Side
9/17/2009
Result (mg/kg)
SD001CS-02 (A-D)
End (West)
9/17/2009
Result (mg/kg)
SD001CS-01 (A-C)
Side
Result (mg/kg)
SD001CS-11 (A-E)
Bottom
9/16/2009
Result (mg/kg)
SD001CS-07 (A-E)
Bottom
9/17/2009
Result (mg/kg)
Result (mg/kg)
9/16/2009
Side
SD001CS-04 (A-C)
SD001CS-08 (A-E)
Bottom
Result (mg/kg)
9/17/2009
Side
SD001CS-03 (A-C)SD001CS-02D (A-D)
End (West)
9/17/2009
Result (mg/kg)
Result (mg/kg)
9/16/2009
Side
SD001CS-06 (A-C)SD001CS-05 (A-D)
End (East)
9/17/2009
Result (mg/kg)
Result (mg/kg)
9/16/2009
Bottom
SD001CS-10 (A-E)SD001CS-09 (A-E)
Bottom
9/16/2009
Result (mg/kg)
9/17/2009
SD001_033 RAR Data.xls
Table 2
Site SD001 Final Confirmation Sediment Samples
(collected September 16 and 17, 2009)
mg/kg - milligrams per kilogram
NE - Not Established
SD001_033 RAR Data.xls

Table 3
Site SD033 Final Confirmation Sediment Samples
(collected September 22 and 28, 2009)
Site SD033 Sediment Residential 10-6
Sample:
Chemical of Concern Cleanup Cancer Risk Description:
Level Date Sampled:
SD033 Analyte (mg/kg) (mg/kg)
Phenanthrene Total PAHs = 1 NE 0.04 0.039 0.065 0.038
Fluoranthene NE 0.13 0.048 0.092 0.087
Pyrene NE 0.13 0.05 0.11 0.096
Benzo(a)anthrancene 0.62 0.065 0.015 0.039 0.042
Chrysene 62 0.099 0.018 0.05 0.049
Benzo(b)fluoranthene 0.62 0.17 0.027 0.073 0.053
Benzo(a)pyrene 0.062 0.08 0.016 0.054 0.038
Indeno(1,2,3-cd)pyrene 0.62 0.052 0.008 0.029 0.019
Benzo(g,h,i)perylene NE 0.056 0.0081 0.025 0.021
Total PAH: 0.82 0.23 0.54 0.44
Site SD033 Sediment Residential 10-6
Sample:
Chemical of Concern Cleanup Cancer Risk Description:
Level Date Sampled:
SD033 Analyte (mg/kg) (mg/kg)
Phenanthrene Total PAHs = 1 NE 0.076 0.032 < 0.0063 0.0016
Fluoranthene NE 0.084 0.039 < 0.0063 0.0014
Pyrene NE 0.099 0.041 < 0.0063 0.0015
Benzo(a)anthrancene 0.62 0.031 0.021 < 0.0063 < 0.0064
Chrysene 62 0.043 0.023 < 0.0063 < 0.0064
Benzo(b)fluoranthene 0.62 0.055 0.031 < 0.0063 < 0.0064
Benzo(a)pyrene 0.062 0.036 0.024 < 0.0063 < 0.0064
Indeno(1,2,3-cd)pyrene 0.62 0.022 0.016 < 0.0063 < 0.0064
Benzo(g,h,i)perylene NE 0.025 0.018 < 0.0063 < 0.0064
Total PAH: 0.47 0.25 0.06 0.04
Site SD033 Sediment Residential 10-6
Sample:
Chemical of Concern Cleanup Cancer Risk Description:
Level Date Sampled:
SD033 Analyte (mg/kg) (mg/kg)
Phenanthrene Total PAHs = 1 NE < 0.0063 < 0.0066 0.0074
Fluoranthene NE < 0.0063 < 0.0066 0.022
Pyrene NE < 0.0063 < 0.0066 0.018
Benzo(a)anthrancene 0.62 < 0.0063 < 0.0066 0.013
Chrysene 62 < 0.0063 < 0.0066 0.014
Benzo(b)fluoranthene 0.62 < 0.0063 < 0.0066 0.027
Benzo(a)pyrene 0.062 < 0.0063 < 0.0066 0.013
Indeno(1,2,3-cd)pyrene 0.62 < 0.0063 < 0.0066 0.015
Benzo(g,h,i)perylene NE < 0.0063 < 0.0066 0.015
Total PAH: 0.06 0.06 0.14
Notes: PAH - polycyclic aromatic hydrocarbons
mg/kg - milligrams per kilogram
Result (mg/kg)
9/22/2009
End
SD033CS-14 (A-D)SD033CS-12 (A-D)
End
9/22/2009
Result (mg/kg)
Bottom
SD033CS-17 (A-E) SD033CS-15 (A-C)
Side
9/22/2009
Result (mg/kg)
SD033CS-21 (A-E)
Bottom
9/22/2009
Result (mg/kg)
Result (mg/kg)
9/22/2009
SD33CS-18 (A-E) SD033CS-19 (A-E)
Bottom
9/22/2009
Result (mg/kg) Result (mg/kg)
9/22/2009
Bottom
SD033CS-20 (A-E)
Bottom
9/22/2009
Result (mg/kg)
Result (mg/kg)
9/22/2009
Bottom
NE - Not Established
SD033CS-24 (A-C)
Side
9/28/2009
Result (mg/kg)Result (mg/kg)
9/28/2009
Side
SD033CS-23 (A-C)SD033CS-22 (A-E)
SD001_033 RAR Data.xls

Site Access Route
Test Pit 2: Asphalt to 3 ft BGS
Test Pit 1: Asphalt to 3 ft BGS
Former AST Location
Exploratory Trench 1
Area C
Area B
Area A
Carson Road
Union
Cree
k
BackSeasonal Wetland
Site FT005
FT005 Proposed Sampling LocationsTravis Air Force Base, California
FIGURE 3
Legend
Proposed Sample Locations
PAH
TPH
Areas previously identified forexcavation (to a depth of 12 inches unless otherwise identified)
Subareas within previously identifiedexcavation with a greater specified target depth
Test pits dug during previous remedial action
Exploratory trench dug during previous remedial action
50-FT Grid
100-FT Grid
Site Access Route
Project Site Boundary
Main Branch of Union Creek
100 1000
Feet
G:\ArcGIS\USACE\Travis\PROJECTS\T070300009_DK08\DataGap\FT005 Sample Locations.mxd 12/14/2009 ITSI-WC Eloise Anderson

5/21/2010
1
ST027 Area B Site Characterization Results
Travis Air Force Base
California

5/21/2010
2
ST027B Site Characterization
• Gore Site Assessment Survey - Completed in December, 2008
• Source Area Investigation – Completed in April, 2009– Three soil borings in source area based on results of GORE
Survey
– Soil, soil gas, and groundwater samples analyzed for VOCs
• Downgradient Groundwater Investigation – Completed in October 2009– Six soil borings downgradient of source area
– HydroPunch groundwater samples analyzed for VOCs
– Three new downgradient monitoring wells installed based on HydroPunch results

5/21/2010
3
ST027B Site Characterization
• GORE Site Assessment Survey Results
– TCE and cis-1,2-DCE detected in area between aircraft test pad and Taxiway November
– Results confirm that releases probably occurred between test pad and taxiway
– GORE results appear to correlate with groundwater concentrations.

5/21/2010
4
ST027B Site Characterization
• Source Area Investigation
– Three soil borings advanced at three of four GORE locations with the highest TCE and cis-1,2-DCE concentrations (SB800x27, SB801x27, SB802x27)
– Soil: All VOC concentrations were below reporting limits, except one detection of TCE (32 µg/Kg) near top of saturated zone (Location SB800x27)
– Soil gas: Low concentrations of 20 VOCs detected in soil gas. Highest concentration of TCE was 4.47 ppbv.
5/21/2010
5
ST027B Site Characterization
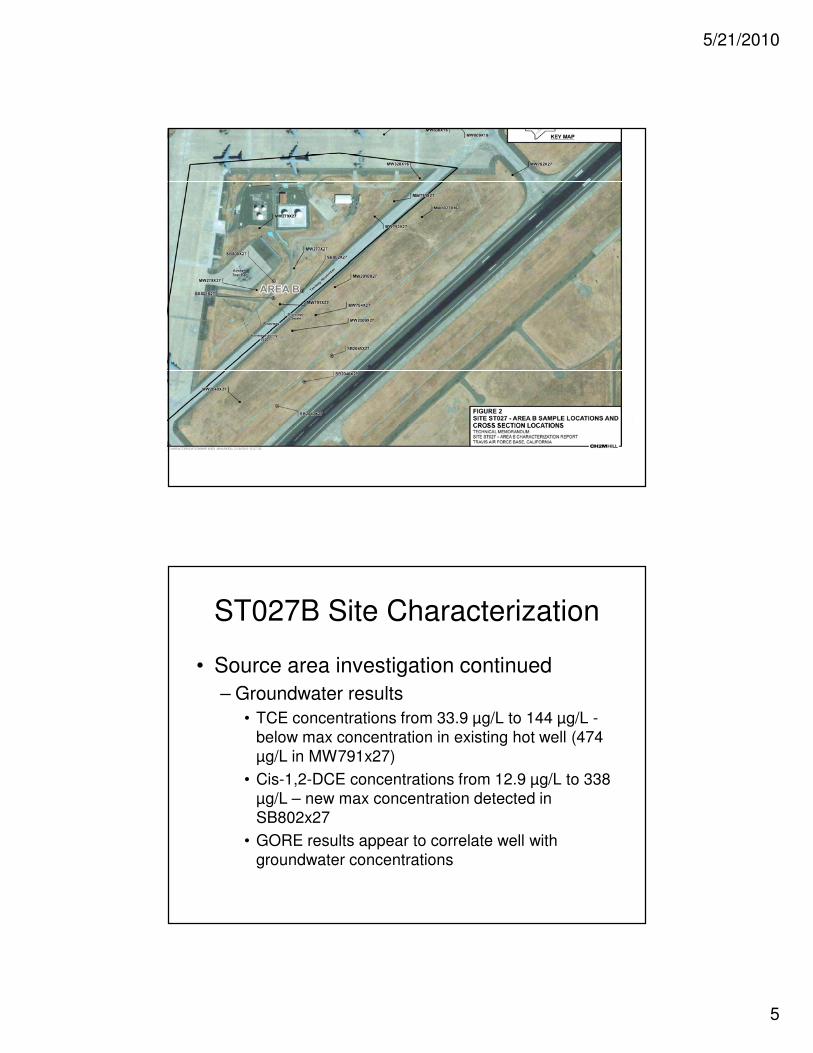
• Source area investigation continued
– Groundwater results
• TCE concentrations from 33.9 µg/L to 144 µg/L -below max concentration in existing hot well (474 µg/L in MW791x27)
• Cis-1,2-DCE concentrations from 12.9 µg/L to 338 µg/L – new max concentration detected in SB802x27
• GORE results appear to correlate well with groundwater concentrations
5/21/2010
6
ST027B Site Characterization
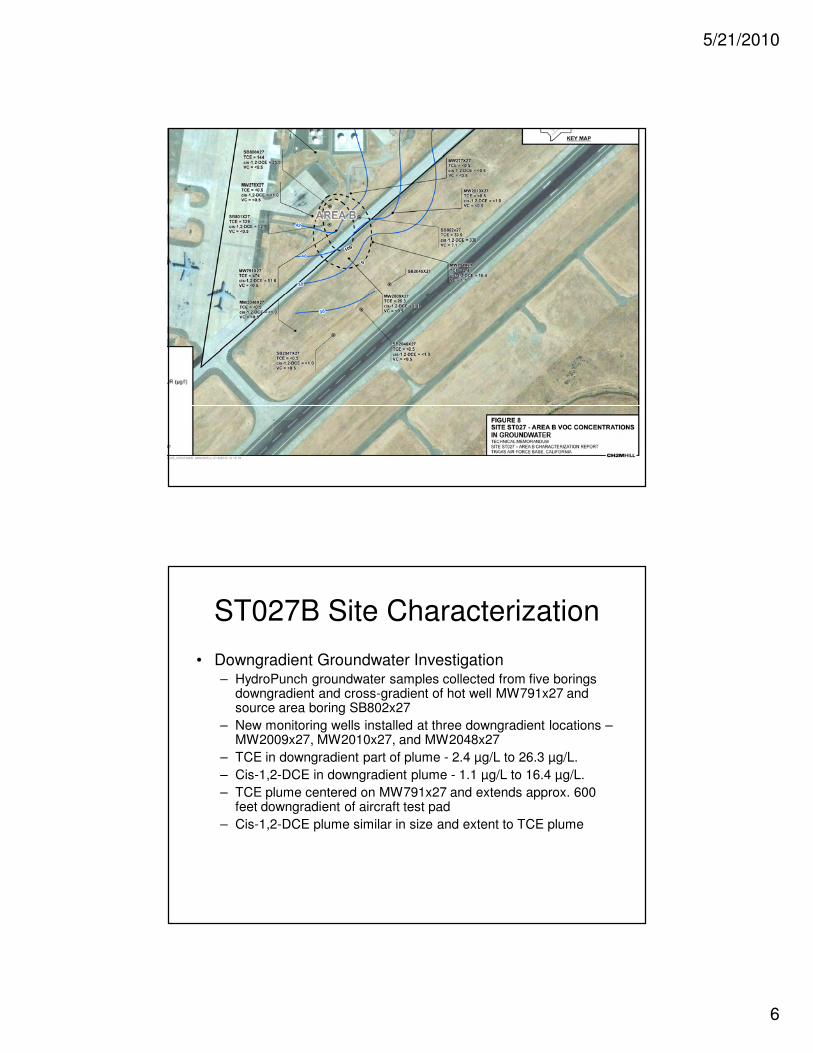
• Downgradient Groundwater Investigation– HydroPunch groundwater samples collected from five borings
downgradient and cross-gradient of hot well MW791x27 and source area boring SB802x27
– New monitoring wells installed at three downgradient locations –MW2009x27, MW2010x27, and MW2048x27
– TCE in downgradient part of plume - 2.4 µg/L to 26.3 µg/L.
– Cis-1,2-DCE in downgradient plume - 1.1 µg/L to 16.4 µg/L.
– TCE plume centered on MW791x27 and extends approx. 600 feet downgradient of aircraft test pad
– Cis-1,2-DCE plume similar in size and extent to TCE plume

5/21/2010
7
ST027B Site Characterization
• Natural Attenuation Assessment– Two Mechansims
• Physical process – diffusion, dilution, adsorption, dispersion, volatilization
• Biological processes – biodegredation by microorganisms
– Two lines of evidence considered• Historical contaminant concentration data – used to evalute plume
stability/attenuation• Hydrogeologic and Geochemical parameter data
– Used to determine whether physical or biological process are dominant– Data used to score the Site for biodegredation potential using
procedure in Wiedemeier et. al, 1996)» 0-5 points – inadequate evidence» 5-14 points – limited evidence» 15-20 points – adequate evidence» >20 points – strong evidence

5/21/2010
8
ST027B Site Characterization• Natural attenuation assessment – Results
– Contaminant concentration trends• MW791x27 and MW794x27 monitored since 2007
• MW791x27 (hot well)– TCE = 472 µg/L in 3Q07 and 474 µg/L in 4Q09– Cis-1,2-DCE = 71 µg/L in 3Q07 and 51.6 µg/L in 4Q09
• MW794x27 (distal well)– TCE = 2.52 µg/L in 4Q07 and 2.4 µg/L in 4Q09– Cis-1,2-DCE = 16.3 µg/L in 3Q07 and 16.4 µg/L in 4Q09
– Migration potential• Assuming a retardation factor of 0.8, and no attenuation of
the VOCs, the TCE plume should have migrated approximately 290 feet since 2009
• However, no evidence of migration between MW791x27 and MW794x27 since 2007

5/21/2010
9
ST027B Site Investigation
• Natural Attenuation Assessment – Results Continued
– Evaluation of geochemical parameter data
• Six wells sampled/analyzed for geochemical parameters in
Q409 – including one source well, one plume well, one
background well, and three distal wells
• MW791x27 (source) and MW794x27 (distal) received score
of 6 indicating limited evidence of biodegradation
• Other wells received scores of <5 indicating inadequate
evidence of biodegradation.

5/21/2010
10
ST027B Site Characterization
• CONCLUSIONS– No significant contamination remaining in the vadose
zone– GORE survey results correlate well with
concentrations in groundwater– TCE and cis-1,2-DCE plumes extend less than 600
feet downgradient (south) of the aircraft test pad– Concentrations trends in wells monitored since 2007
indicate the plume is stable and is not migrating– There is limited evidence of biodegredation in
MW791x27 (hot well) and MW794x27 (distal well)– Physical process are probably the dominant
attenuation mechanisms in other parts of the plume
ST027B Characterization
• Next Steps
– Assess potential risks to human and ecological receptors from chlorinated VOCs at ST027B
– Evaluate remedial alternatives for chlorinated VOCs at ST027B in the FSS

5/21/2010
11

5/21/2010
1
Natural Attenuation
Assessment Plan (NAAP)
Travis AFB
Remedial Program Manager’s Meeting
April 22, 2010
2
Background
• Groundwater in portions of the Base are contaminated with chlorinated and petroleum hydrocarbons
• To address the contamination, the Air Force, USEPA, and Cal EPA agreed that certain sites should be assessed for natural attenuation
• In 1997 and 1999, the NEWIOU and WABOU IRODs were signed. These IRODs specified the interim remedial actions, including MNA assessment, to be taken to address groundwater contamination
3
IRODs Identified Sites to be Assessed for MNA
– LF006 (Selected for MNA)
– LF007
– SS015
– SS016
– ST032
– SD033
– SS035
– SS037
Downgradient portions of SD031 and FT004 were later added by the Air Force to address contamination outside of the GET target (of 100 µg/L). Site SS016 was later dropped due to plume migration and its flightline location.
4
What it’s “Not”
• MNA is not a “no action” or “walk away”
alternative
• MNA does not have to be the only remedy
component at a site – it is often combined with other types of remedies (i.e., source
control, soil vapor extraction)
5
What it “Is”• Site characterization, monitoring, and analysis
must be conducted to determine the viability of MNA as a remedy
• MNA may be used to complete remediation after other actions have reduced contaminant levels
• Once MNA is in place, continued monitoring conducted to verify decreasing contaminant levels, and to verify protectiveness
• Agreement by Travis & Agencies that reductive dechlorination unlikely, as documented in the NAAWs. Success would hinge on whether physical processes prevented plume migration
6
What if it Doesn’t Work?
• If natural attenuation proves ineffective, contingency actions will be initiated:1.Increased monitoring frequency
2.Additional monitoring wells
3.Additional remedial action (starting with enhanced MNA, up to GET if needed)
Note: Current remedy optimization involves enhanced MNA through GET shutdown and in-situ treatment in residual hot spots

5/21/2010
2
7
The Natural Attenuation Assessment Plan (NAAP)
• The guiding document for evaluation of natural attenuation at Travis AFB
• Describes the overall approach to be followed at each site being considered for MNA
• In accordance with the NAAP, a site-specific Natural Attenuation Assessment Workplan (NAAW) was prepared for each site
8
Key Documents (NAAP to NAAR)
• NAAP - Guiding document for evaluation of NA at Travis AFB (includes data, location of key wells, develops contingency plan, decision matrix)
• Pre-Design Investigation TM -Presents additional data to fill gaps such as wells, sampling, etc (if necessary)
• NAAW - Prepared for each site to describe how the NAAP will be applied (results of initial screening, additional site characterization, monitoring/reporting, modeling, key monitoring wells)
• Annual Summary Report –GSAP (well sampling data, trend analysis, recommendations)
• NAAR Summarizes results of assessment after sufficient data are available to determine MNA effectiveness
9
Benchmark Features of the NAAP
• It is fully compatible with the IRODs and subsequent ROD dealing with contaminated groundwater at Travis AFB
• It is a cost-effective risk-based approach to groundwater remediation
• It is protective of human health & the environment
• It is cognizant of all regulatory requirements, including anti-degradation policy for clean aquifers
• It is compliant with AFCEE natural attenuation guidance
• The upcoming Groundwater ROD will describe contingency actions to address any future plume migration
10
Natural Attenuation Approach in the NAAP
• Assimilate existing data
• Perform pre-design phase of field investigation
• Conduct data gaps investigation to complete NA evaluation
• Conduct initial screening for natural attenuation potential
• Prepare a NAAW (primary document) for each site which presents results and proposes a long-term monitoring program
• Conduct long-term monitoring as part of GSAP
• Prepare the NAAR to determine if MNA is an effective remedy at each site