final survey report on the status of rice production, processing and marketing in uganda
TRANSCRIPT

JAPAN INTERNATIONAL COOPERATION AGENCY, (JICA) IN COLLABORATION WITH SASAKAWA AFRICA ASSOCIATION UGANDA
FINAL SURVEY REPORT ON THE STATUS OF RICE PRODUCTION, PROCESSING AND MARKETING IN UGANDA
BY
ODOGOLA R. WILFRED, LEAD CONSULTANT
SUBMITED TO THE EMBASSY OF JAPAN IN UGANDA THROUGH JICA AND SASAKAWA AFRICA ASSOCIATION-UGANDA
31st March, 2006

ii
TABLE OF CONTENTS ACKNOWLEDGEMENTS ....................................................................................................... v LIST OF TABLES .....................................................................................................................vi LIST OF FIGURES ..................................................................................................................vii LIST OF ABBREVIATIONS....................................................................................................viii EXECUTIVE SUMMARY.........................................................................................................ix 1. INTRODUCTION ............................................................................................................ 1
1.1 Rice as a World Crop....................................................................................... 1 1.2 Rice Production: Africa Perspective ............................................................. 2
1.2.1 Africa’s rice origin............................................................................................. 2 1.3 Uganda’s Agricultural Policy Framework and Rice Development.......... 3
1.3.1 Agriculture in Uganda’s economy ................................................................ 3 1.3.2 Agricultural policy frame work ....................................................................... 3 1.3.3 The rice industry in Uganda: origin and development .............................. 4 1.3.4 The NERICA rice development initiatives in Uganda ................................. 6
1.4 Justification of the study.................................................................................. 7 1.5 Study Objectives............................................................................................... 8
1.5.1 Main objective.................................................................................................. 8 1.5.2 Specific objectives ........................................................................................... 8
1.6 Expected Outputs ............................................................................................ 8 1.7 Study Scope and Coverage .......................................................................... 9
2 STUDY METHODOLOGY.............................................................................................. 10 2.1 Survey Design .................................................................................................. 10 2.2 Sampling Frame.............................................................................................. 13 2.3 Measuring Adoption of Rice Among Farming Enterprises....................... 13 2.4 Data collection procedure........................................................................... 14 2.5 Data analysis of constraints .......................................................................... 14 2.6 Data analysis to determine the factors influencing the level of rice
adoption .......................................................................................................... 15 2.7 Data analysis of the other factors in the study.......................................... 16 2.8 Profiles of the study districts .......................................................................... 16
2.8.1 Kamwenge district ......................................................................................... 16 2.8.2 Kibaale district................................................................................................. 16 2.8.3 Kiboga district ................................................................................................. 17 2.8.4 Lira District ........................................................................................................ 17 2.8.5 Luwero district ................................................................................................. 17 2.8.6 Iganga district ................................................................................................. 18
3 SURVEY FINDINGS ...................................................................................................... 19 3.1 Socio-demographic Characteristics of Farmer Respondents ................ 19 3.2 Farm Characteristics ...................................................................................... 21 3.3 Rice Production Practices including Mechanization ............................... 22
3.3.1 Land preparation ........................................................................................... 22 3.3.2 Ploughing ......................................................................................................... 22 3.3.3 Planting............................................................................................................. 23 3.3.4 Weed management...................................................................................... 24 3.3.5 Soil fertility management .............................................................................. 27

iii
3.3.6 Rice pests and their management ............................................................. 27 3.3.7 Rice diseases and their management ....................................................... 29 3.3.8 Droughts and floods in rice farming............................................................ 29 3.3.9 Position of rice in crop rotation .................................................................... 30
3.4 Rice Processing Practices including ph/machines and equipment ..... 30 3.4.2 Harvesting ........................................................................................................ 31 3.4.3 Threshing and cleaning................................................................................. 31 3.4.4 Drying................................................................................................................ 32 3.4.5 Rice milling....................................................................................................... 34
3.5 Status and Trends in Rice Marketing ........................................................... 38 3.6 Factors, influencing adoption of rice production..................................... 40 3.7 Gender in rice production ............................................................................ 42 3.8 Rice Effects on Livelihoods and Farming Systems..................................... 44
3.8.1 Rice effects on livelihoods of farmers ......................................................... 44 3.8.2 Rice effects on livelihoods of processors.................................................... 45 3.8.3 Rice effects on livelihoods of input dealers ............................................... 45 3.8.4 Rice effects on farming systems................................................................... 45
4 CONSTRAINTS AND CHALLENGES IN RICE PRODUCTION, PROCESSING AND MARKETING ................................................................................................................ 47
4.1 Constraints of rice farmers ............................................................................ 47 4.1.1 Inadequate knowledge on rice farming ................................................... 47 4.1.2 Labour intensity in rice farming .................................................................... 48 4.1.3 Lack of capital for rice farming ................................................................... 48 4.1.4 High crop losses due to pests and diseases............................................... 48 4.1.5 Lack of appropriate implements and equipment for rice farming....... 49 4.1.6 Effects of drought on rice production and productivity ......................... 49 4.1.7 Farmers’ poor market systems of rice ......................................................... 49 4.1.8 Poor quality and expensive seed ................................................................ 50
4.2 Constraints of rice processors....................................................................... 52 4.2.1 Technical performance of rice mills ............................................................ 52 4.2.2 Access to repair facilities and services....................................................... 52 4.2.3 Quantity and quality of paddy received at rice mills.............................. 52 4.2.4 Quality and marketing of milled rice .......................................................... 53
4.3 Constraints of rice input dealers .................................................................. 54 4.3.1 Input acquisition: ............................................................................................ 55 4.3.2 Input distribution and marketing:................................................................. 55
4.4 Challenges to rice production as presented by farmers ........................ 57 4.5 Challenges presented by rice millers to improve rice processing......... 58 4.6 Challenges presented by rice input dealers ............................................. 58
4 CONCLUSIONS AND WAY FORWARD....................................................................... 59 4.1 Conclusion....................................................................................................... 59 4.2 Way forward.................................................................................................... 59
4.2.1 Preamble.......................................................................................................... 59 4.2.2 Promotion and delivery of rice knowledge and services....................... 60 4.2.3 Policy Issues...................................................................................................... 62

iv
4.2.4 Research issues ............................................................................................... 62 4.2.4 Environmental concerns ............................................................................... 63 4.2.5 Gender concerns ........................................................................................... 63
REFERENCES....................................................................................................................... 64 ANNEXES............................................................................................................................ 66
Annex 1: Study Team...................................................................................................... 66 Annex 2: Suitability Map for Rice Production ............................................................. 67 Annex 3: Constraints in Rice Production, Processing & Marketing by District....... 68
Constraints faced by farmers in rice farming enterprise Kiboga district .............. 68 Constraints faced by farmers in rice enterprise Kibaale district ............................ 69 Constraints faced by farmers in rice enterprise Kamwenge district ..................... 70 Constraints faced by farmers in rice enterprise Luwero district ............................. 71 Constraints faced by farmers in rice enterprise Lira district .................................... 72 Constraints faced by farmers in rice enterprise Iganga district ............................. 73
Annex 4: Constraints generated through individual rice farmer interviews by districts surveyed............................................................................................. 74
Annex 5a: Labour contribution in rice farming operations by gender as viewed by the men............................................................................................................ 76
Annex 5b: Labour contribution in rice farming operations by gender as viewed by the women ...................................................................................................... 77

v
ACKNOWLEDGEMENTS As Team Leader of the research group, I would like to convey my special gratitude to the co-authors of this report, drawn from partner institutions in NARO, Makerere University and SAA- Uganda. The co-authors were: Candia A. and Okurut S. from NARO-AEATRI; Kikafunda J., Onaga G., Alibu S., and Ochola D. from NARO-NAARI; Nalukenge I from Faculty of Agriculture Makerere University; Sembatya C. from SAA-Uganda and Akulo D. from MEPU-NARO. The team was instrumental in the study design, selection of survey tools and preparing questionnaires. The team also collected, analyzed the data and prepared this report with dedication to enable its timely presentation to the sponsors. I thank all farmers, rice processors, input dealers, district leaders and extension service providers at various levels, who very actively participated in this study. These stakeholders positively cooperated in giving information that went into this report. The leadership of the districts visited, as well as the extension service providers that were assigned to work with the research team, mobilized farmers, rice millers and input dealers prior to the survey and actively participated in the field data collection. I am equally grateful for the technical input and back-up provided by a number of rice managers and experts who included Forster M. and Kayayo B. from SG-2000, Tsuboi T. and Tomitaka M. from JICA and Bigirwa G from NAARO-NAARI. Finally, I thank the Embassy of Japan in Uganda for their unflinching support without which the study would not have been possible. We look forward to your continued assistance in rice development initiatives in Uganda.

vi
LIST OF TABLES Table 1: The surveyed districts and the corresponding sub-counties .......................... 10 Table 2: Category and number of respondents interviewed ....................................... 13 Table 3: Time of weeding initiation .................................................................................... 25 Table 4: Fertilizers used by farmers ..................................................................................... 27 Table 5: Constraints faced by RICE farmers in the surveyed districts in Uganda and
farmers’ proposed solutions ................................................................................. 51 Table 6: Summarized constraints by rice millers in the surveyed districts .................... 54 Table 7: Constraints facing rice input dealers in the surveyed districts ....................... 56

vii
LIST OF FIGURES Figure 1: Rice production levels in Uganda: 1998 - 2004 ................................................. 5 Figure 2: The hierarchal structure of the survey area ..................................................... 11 Figure 3: Map of Uganda showing the surveyed areas................................................. 12 Figure 4: Age distribution of farmer respondents ............................................................ 19 Figure 5: Household size distribution ................................................................................. 20 Figure 6: Membership of farmer respondents in farmer associations by districts ...... 20 Figure 7: Mean percentage of land allocated to rice by rice farmers....................... 21 Figure 8: Ploughing power sources in rice farming ......................................................... 22 Figure 9: Planters available for planting rice.................................................................... 24 Figure 10: Example of typical weeds in rice farming...................................................... 25 Figure 11: Traditional and improved rice weeding technologies ................................ 26 Figure 12: Faulty and recommended herbicide application ....................................... 26 Figure 13: Common pests in rice fields .............................................................................. 28 Figure 14: Other important pests in rice ............................................................................ 28 Figure 15: A schematic diagram of the postharvest system for rice in Uganda........ 31 Figure 16: Field testing of rice thresher &rice equipment fabrication at NVTI ............ 32 Figure 17: Typical improved rice drying on tarpaulin sheeting..................................... 33 Figure 18: Traditional rice moisture testing methods....................................................... 33 Figure 19a: Typical locally fabricated rice mills used in Uganda ................................. 35 Figure 19b: Typical imported medium and large size rice mills used in Uganda....... 35 Figure 20: Rice transportation by head loading, bicycle and donkey ....................... 38 Figure 21: Share of farmer-marketed rice by district....................................................... 39 Figure 22: Labour contribution in rice farming operations by gender......................... 43 Figure 23: Benefits from rice farming as reported by farmers ....................................... 44 Figure 24: Farmers in focus group discussions .................................................................. 47 Figure 25: Proportion of farmers who have poor marketing ......................................... 50 Figure 26: Proportion of farmers using poor quality seed............................................... 50 Figure 27: Duration of rice mill operation in a year ......................................................... 53 Figure 28: Farmer cited challenges in addressing identified rice constraints............. 57 Figure 29: Challenges presented by rice processors ...................................................... 58

viii
LIST OF ABBREVIATIONS AEATRI - Agricultural Engineering and Appropriate Technology Research Institute APEP - Agricultural Productivity Enhancement Program FA - Faculty of Agriculture FAO - Food and Agricultural Organization of the United Nations FICA - Farm Input Care GDP - Gross Domestic Product GIS - Geographical Information System GoU - Government of Uganda JICA - Japan International Cooperation Agency LG - Local Government MAAIF - Ministry of Agriculture, Animal Industry and Fisheries MAK - Makerere University MFPED - Ministry of Finance, Planning and Economic Development MEPU - Monitoring, Evaluation and Planning Unit NAADS - National Agricultural Advisory Services NAARI - Namulonge Agricultural and Animal Production Research Institute NARO - National Agricultural Research Organization NASECO - Nalweyo Seed Company NERICA - New Rice for Africa NGOs - Non Governmental Organizations PEAP - Poverty Eradication Action Plan PMA - Plan for Modernization of Agriculture PRA - Participatory Rural Appraisal SAA - Sasakawa Africa Association SAA-U - Sasakawa Africa Association, Uganda UBOS - Uganda Bureau of Statistics WARDA - West African Rice Development Association

ix
EXECUTIVE SUMMARY Background Though rice production was introduced into Uganda way back in 1904, (Bigirwa et al, 2005), its role in the country’s economy only became noticed in the late 1940s as part of the then government efforts to incorporate rice-based rations in the feeding of soldiers during and after the second world war. With the establishment of the Kibimba Rice Scheme in 1966 and Doho Rice Scheme in 1976, smallholder rice production mainly in the Eastern and Northern parts of the country, was also spontaneously twigged but with emphasis on low-land rice varieties. It is only in the late 1980s’ that production rapidly increased to the current figure of nearly 95,000ha. The country’s total annual rice production now stands at 140,000 metric tons of milled rice, representing about 70% of the current national rice demand estimated at 190,000 – 200,000 metric tons. Oryokot et. al (2004), reports that by 2004, Uganda’s rice imports stood at about 45,000 metric tons. The very rapid increase in rice production in the country is mainly attributed to the release of improved rice varieties (especially the NERICA rice), conducive government policy, increase in demand and consumption of rice particularly among the urban and peri-urban populations, and to the current higher rate of returns on investment in rice production of 1.8 compared to such cereals as maize with a rate of returns on investment of only 1.2 (NAADS, 2003). Though, Uganda has tremendous potentials (given its good soils, favorable climate, two growing seasons, political support and farmers’ enthusiasm) for increasing its rice production to self-sufficiency, the crop is still relatively new in the country’s farming systems. This poses a number of important challenges in terms of knowledge and information-gaps in the entire rice production continuum. These gaps require urgent definition and redress. The purpose of this study was therefore to generate basic information on the status of rice production, processing and marketing in Uganda with a view to guiding decision making in future development initiatives for the rice industry. The study will in particular serve to support current initiatives by multiple stakeholders involved in the promotion of rice production. Among these the collaborative effort of Sasakawa Africa Association Uganda Project and JICA in support of GoU’s initiative, particularly on upland rice production, has been given special attention. The study involved a survey in 6 major rice growing districts of Uganda covering 2 sub-counties per district and a total 1,463 respondents, of which 1,375 were farmers both female and male. The survey also sought information from rice processors (27), agro-input dealers (27) and key informants (34). The study was conducted by a multi-disciplinary team of 10 scientists drawn from several NARO institutes, Makerere University, JICA and SAA-Uganda. The research team also solicited the support and active involvement of field extension and other service providers in the respective districts. These administered the questionnaires especially to individual farmer households.

x
The data obtained from the study was analyzed using the SPSS statistical package and was accordingly documented into this technical survey report. The draft report, together with recommendations was discussed at a one-day stakeholders’ workshop before finalization and presentation to JICA by the Research Team. Summaries of the findings and way forward on the work accomplished as per TORs are as follows:
Main findings a) The production of the new upland rice varieties (NERICA) is steadily increasing in
Uganda. The districts where rice production was a dream are now growing rice b) Rice is one of the potential crops that can improve farmers’ incomes and
livelihoods. Farmers who have adopted upland rice farming as an enterprise have started seeing positive changes in their livelihoods. It was noted that 22% of the farmers surveyed are able to send their children to school, 12 - 17% of the farmers reported using proceeds from rice farming for enhancing household food security and for acquiring essentials household items like clothing, utensils
c) Rice farmers are encountering several constraints that inhibit their ability to increase rice production, the main ones being:
Inadequate knowledge in rice farming especially for upland rice, Strenuous and time consuming rice farm operations, Lack of appropriate farm implements for rice farming, postharvest processing,
value-addition, and for rural transportation, High crop damage/loss caused by rice diseases and pests (including weeds),,
and by poor crop handling and processing, High cost and often scarcity of farm inputs (improved seed, farm implements
and equipment, fertilizers, herbicides and pesticides, etc), Generally poor and often unreliable quality of rice seed in the market, with no
clear policy on rice seed production, quality assurance and marketing, Inadequate options of rice varieties that meet biological attributes of early
maturing, high yielding, resistance to drought, diseases and pests, yet also with good milling and cooking qualities, taste and aroma,
Absence of viable options to mitigate drought and floods in rice production; Inefficient marketing system as reflected by low farm-gate and fluctuating
commodity prices. Narrow utilization base of rice with inadequate exploitation of rice by-products Poor mechanisms for rice information access and sharing. Inadequate sensitivity to gender and environmental concerns in rice
production, processing and marketing. Way forward Because of a number of its glaringly positive benefits and effects on the lives of farm households and processors in Uganda, it is recommended that rice be regarded as a strategic crop for food security and income generation in line with the Poverty Eradication Strategy.

xi
1. Training and skills development: Farmers, processor, service providers and rural artisans be trained on specific rice related aspects to improve their knowledge and skills;
2. Intermediate technology: It is recommended that promising intermediate technology options for rice production, processing and value addition be carefully selected for adaptation to local conditions, and new ones developed,
3. Effect of drought on rice production: a) In view the information gap on the geographical environment for rice growing
in Uganda, there is need to collect & collate rice-ecology data country wide; b) As a measure to mitigating the ill effects of drought, farmers be sensitized and
trained on appropriate water harvesting practices and supplementary irrigation both for upland and low-land rice farming systems.
4. Rice pests and diseases: a) In view of the pressure on rice production by various pests and diseases, there
is need, as a starting point, to quantify actual rice-crop losses attributed to these agents;
b) Farmers be encouraged to employ environmentally friendly methods for disease and pest management;
c) As a long term strategy, research should accelerate generation of varieties with biological attributes of early maturing, high yielding, tolerance to drought, diseases and pests; as well as having good milling and cooking qualities, taste and aroma.
5. Rice inputs: a) Re-enforce the promotion of rural micro-finance to address availability of
capital for agricultural production in general; and for the acquisition of rice farm inputs in particular;
b) Rigorously train farmers on access and management of loans, and to mobilize funding both within and outside their communities;
c) Farmers should be trained on the importance of quality seed, and as groups, be keen on seed quality at the receiving end.
6. Rice processing and marketing a) Building farmers’ institutional capacity to form vibrant rice cooperatives and
associations that will enhance collective marketing and minimize exploitative middle-men;
b) There is need to sensitize private entrepreneurs and create a conducive environment for them to invest in rice processing at locations well known for producing large volumes of rice.
7. Policy Issues There are a number of policy issues that come into play as rice increasingly becomes an important crop in Uganda. Some of the salient policy issues include: a) The need for Uganda to formalize her membership of the African rice research
initiative under WARDA, where it will stand numerous benefits, e.g. accessing rice germplasm, financial grants, training, and information;
b) Uganda requires a clear policy on credit to farmers, since it is becoming increasingly vital that without capital farmers may not be expected to move

xii
from subsistence to commercial agriculture as envisaged in the agricultural modernization strategy;
c) Need for a strategy on rice seed production and marketing, and for more rigors in the enforcement of existing laws on seed. This situation also applies to pesticides and herbicides sold in the market;
d) There is urgent need to establish a vibrant mechanism for rice information sharing and access by stakeholders in rice.
8. Research issues a) In light of the concern by farmers on labour intensive and time consuming
operations associated with rice production, it is crucial to continued selection and adaptation of promising intermediary rice technologies to ease labour in production and enhance quality in rice processing;
b) Due to increasing pressure on rice production by diseases and pests, there is need to intensify participatory research on disease and pest tolerant/resistant varieties with good yielding, milling and taste/aroma attributes;
c) Since rice is still relatively new crop in the country, there is need to study the socio-economic environment in which rice production is taking place.
9. Environmental concerns The main environmental challenges in rice production and processing include: a) How to fit rice into farming systems b) Need for caution in the use of chemicals to control weeds, diseases and pests in
rice as this may harm the user, or have negatively impact on the environment c) Need to have sensitivity in the disposal of rice mill wastes which may result in
pollution and may also be a major habitat for rodents, snakes and weevils; d) As rice demand for new land is increasing, caution be made against
indiscriminate clearing of forest lands for rice.
10. Gender concerns ♦ Need to improve gender equity in sharing of proceeds from rice, ♦ Ensure equal access to rice lands and to rice inputs by both men and women ♦ Ensure gender sensitivity in development of rice technologies, especially labour
saving and processing technologies

1
1. INTRODUCTION 1.1 Rice as a World Crop Rice has been gathered, consumed, and cultivated by women and men world wide for more than 10,000 years (Kenmore, 2003), longer than any other crop. Except of course for Antarctica, every continent of the planet produces rice, with over 122 countries currently growing the crop. Rice grows from the equator to latitudes of 53 degrees north (in China) and 35 to 40 degrees and to elevations (in tropical regions) as high as 2400 meters above sea level (Kenmore, 2003). The total area under rice cultivation is globally estimated to be 150,000,000 ha with annual production averaging 500,000,000 metric tons (Tsuboi 2004). This represents 29 % of the total output of grain crops worldwide, (Xu et al., 2003). By 2004, more than half of the world’s population depended on rice as its major daily source of calories and protein, each consuming from 100 to 200 kg of rice per year. On the other hand, the Green Revolution of the 1960/70s, saved the world from a catastrophe of eminent food shortage, it was the drastic increase in rice production that answered the then desperate food demands of the world’s growing populations. Today, more than two billion people in Asia alone derive 80% of their calorie intake from rice. According to projected population growth (Jian Song, 2003), the number of people living on rice worldwide is expected to reach 3.5 billion in 2025. The importance of the crop in food security and socioeconomic stability is therefore self-evident. In high-income countries in the Near East, Europe, and North America, rice is considered to be a healthy and tasty food and its consumption is growing. Rice is also becoming increasingly popular in Africa, the Americas, and elsewhere. Its importance is also progressively being recognized for its nutritional value and because it is an integral part of religious and social ceremonies. Rice production activities provide employment for several hundred million people who work either directly in rice production or in related support services. In all major rice-growing countries, the rice-land farming systems, involving crops, livestock and fish continue to sustain agricultural infrastructure and many associate value-adding rural enterprises and services. Indeed, agriculture, including rice-based agriculture, still provides much of the raw materials needed by today’s manufacturing industry. Thus, poor rice harvests can have adverse effects on many nation’ economies. With the harvest of the rice crop, activities shift to postproduction operations: threshing, drying, cleaning, milling, storage, product processing, distribution and marketing, which together provide employment for millions more people. Since 1990, however, rice production has increased at a lower rate than the population (Dat van, 2000). This deceleration in the growth of rice production is a cause for concern in terms of world food security. It has been the topic of numerous reviews and several rice scientists have alerted those concerned of the risk of a pending food crisis. Yield gaps can still be observed in several countries, while evidence of productivity decline in intensive rice production has been increasingly noticed both on research stations and in farmers' fields. Yield differences can be explained by socio-economic and technical constraints. Poor harvests are largely associated with adverse soil and weather conditions, pests and diseases, labour shortages especially with the current scourge of HIV/AIDS and other chronic ailments.

2
1.2 Rice Production: Africa Perspective
1.2.1 Africa’s rice origin Currently, rice is grown in over 75% of the African countries, with a total population close to 800 million people. Rice is the main staple food of the populations in Cape Verde, Comoros, Gambia, Guinea, Guinea-Bissau, Liberia, Madagascar, Egypt, Reunion, Senegal and Sierra Leone. It is also an important food of the populations in Côte d'Ivoire, Mali, Mauritania, Niger, Nigeria, and Tanzania. In addition, rice has become an important food security factor in Angola, Benin, Burkina Faso, Chad, Ghana and Uganda. Although majority of rice varieties cultivated on the continent today belong to O. Sativa, with China as its origin, over 10,000 years ago. The African continent is the home of Oryza. glaberrima where it has been domesticated for about 3,500 years. This variety has mainly been confined to West Africa where it had been the most commonly grown rice. The white Asian type, O. sativa, was introduced on the continent towards the end of the first millennium via Madagascar (WARDA, 2004) http//www.warda.org. “The Rice Challenge in Africa))”. Its rapid spread in most African countries has however been due to the rigorous efforts of the international Rice breeding centers, namely International Rice Research Institute (IRRI) in the Philippines and later from the West African Rice Development Authority (WARDA) in Ivory Coast. 1.2.2 Evolution and spread of NERICA rice
WARDA found it highly necessary to combine the toughness of O. glaberrima due to its rich reservoir of genes for resistance to local stresses (although low yielding), with the productivity of O. sativa in spite of its low adaptability to rain-fed uplands. This was a formidable scientific challenge which had resulted in the failure of previous attempts to develop a reliable variety since the two species have evolved separately over millennia and are so different. However, by the use of inter-specific hybridization, O. sativa was crossed with O. glaberrima giving rise to a progeny the New Rice for Africa (NERICA). NERICA has unique combined assets (WARDA, 2004) such as: • Higher yields (by 50% without fertilizer and by more than 200% with fertilizer). • Earlier maturity (by 30–50 days). • Resistance to local stresses. • Higher protein content (by 2%)
Since its creation in the mid 1990s, NERICA has evolved and carved for itself a special niche to the extent that it is now not just a variety, but a technology from Africa for Africa (WARDA, 2004) http//www.warda.org), perfectly adapted to the harsh growing environment and low-input conditions, and are therefore targeted to upland rice ecologies. NERICA varieties for irrigated and lowland systems, which hold a high potential for Africa’s food security, are in the pipeline. Because of this unique technology package, NERICAs have a huge potential economic impact in Africa for feeding subsistence farmers’ households, generating surplus harvests, boosting income and consumption, reducing rice imports and saving foreign exchange.

3
There are so far over 3,000 family lines that have been developed, opening up a new world of rice biodiversity. In 2002, NERICA 1, 2, 3 and 4 were the top varieties selected by farmers in Participatory Varietal Selection (PVS) trials in Benin, Burkina Faso, Côte d’Ivoire, the Gambia, Ghana, Mali, Sierra Leone, and Togo. Almost simultaneously, Côte d’Ivoire released two NERICA varieties in 2000, and Nigeria released one in 2003. Farmers in The Gambia, Guinea, and Sierra Leone are growing several NERICA varieties. In Benin, Gabon, Mali, and Togo, several NERICA varieties are under extension. Uganda released a NERICA variety as "NARIC–3" in 2003. Ethiopia, Madagascar, Malawi, Mozambique, and Tanzania are evaluating several NERICA varieties. Today, NERICA is a symbol of hope for food security in SSA - the most impoverished region in the world, where a staggering one-third of the people are undernourished, and half the population struggle to survive on US$1 a day or less.
1.3 Uganda’s Agricultural Policy Framework and Rice Development
1.3.1 Agriculture in Uganda’s economy Agriculture is still the main stay of Uganda’s economy, contributing 42% of GDP, over 85% of export earnings, and providing employment for over 80% of the population, 90% of who live in the rural areas (Anon, 2004). Food crop production is predominant in the sector, contributing approximately 50% of agricultural GDP in 2002/03, while cash crops, livestock, fisheries and forestry provided 17, 16, 12 and 14 % respectively. The bulk of agricultural output comes from about 4.5 million small-scale subsistence households, 80% of whom, in average, each owns about 2 ha of land and produces a number of different food and cash crops besides herding some livestock (UBOS 2004). Agricultural production is also still predominantly rain-fed, non-market oriented, and based on rudimentary technologies and environmentally unsound practices. Resultantly, the country’s agricultural products are often of low volumes, poor quality and are costly to assemble for sustainable market supply. In addition, the farmers are not organized in accessing inputs and marketing their produce efficiently, thereby incurring high production and marketing costs that affect the profitability of their enterprises.
1.3.2 Agricultural policy frame work Since agricultural sector embraces such a large proportion of the country’s population, the Government of Uganda (GoU) recognized the role of the sector in poverty eradication and is therefore implementing a Poverty Eradication Action Plan (PEAP), as the key national development agenda for a few decades to come (MFPED, 2000). The poverty focus envisages modern farming as the lead strategy to enable the poor raise their incomes and improve livelihoods. In order to meet this challenge, the Government has developed the Plan for the Modernisation of Agriculture (PMA) as a strategic framework within PEAP that provides for the transformation of the predominantly subsistence agriculture into a market-oriented sector of the national economy (MAAIF and MFPED, 2000). The strategy is designed to create an environment for promoting investments in profitable arable agriculture, livestock farming, and utilization of fisheries, forestry and other natural resources, while generating gainful employment in all sectors of the economy.

4
Among the pivotal pillars in this strategy is the National Agricultural Research Organisation (NARO), responsible for generating proven technologies, information and methodologies for the country’s agricultural sector. Of recent NARO underwent a major restructuring that saw it open up research mandates to wider partners, including Universities, NGOs, and the private sector. The reform was also intended to improve service delivery, bringing them nearer to end-users. NARO has also commissioned a competitive grant system through which those seeking research funding must compete so as to enhance efficiency and competitiveness and to promote scientific integrity and professional excellence. The other important pillar under PMA is the National Agricultural Advisory Services (NAADS) which spearheads disseminations of new technologies and approaches through a decentralized, private extension service delivery system. Crucial among its strategies is empowering farmers to make decisions on agricultural matters that impinge on them most. By September 2004, NAADS’s activities had rolled into 21 districts and 153 sub-counties (NAADS, 2004) across the country. The Ministry of Agriculture Animal Industry and Fisheries also recently demarcated the country into Agricultural Zones, each with specific production features that differ from the other. The intension, through this arrangement, is for each zone to undertake a set of agricultural enterprises where if has the best comparative advantage, and thus cause rapid economic growth that diminishes household poverty. Analysis of the ranking of enterprises by zones, as conducted by NAADS (NAADS, 2004), shows that rice growing as an enterprise now ranks high in many of these zones.
1.3.3 The rice industry in Uganda: origin and development Historical accounts of farming in Uganda indicate that rice was introduced into the country by Indian traders as early as 1904 (Bigirwa et al, 2005), although it did not gain popularity until the late 1940s. By then rice as well as wheat used to be imported mainly as paddy and were milled in-house using Indian traditional stone mills. Within indigenous communities rice-based dishes were largely considered exotic and only afforded by the affluent in society, and only in small amounts. After the 1940s, rice cultivation was gradually taken up at subsistence level by a few farmers who grew varieties such as Cakala, Matama, Kawemba, Kigaire and Seena introduced into Uganda through Mwanza, Tanzania. Apparently, rice growing in Tanzania (then called Tanganyika) was then relatively more advanced than in Uganda. During the 1950s, Uganda developed more interest in rice, apparently to feed its growing population that included returnees from the Second World War as well as institutions such as schools, prisons and hospitals. Surveys were consequently commissioned to establish actual potentials for growing low-land rice at a large scale in Uganda. These surveys focused several large wetlands including Doho, Olweny, Omunyal, and Kibimba some of which were finally recommended as sites for large scale rice production. By 1966 large scale production of irrigated swamp rice was initiated at Kibimba through a partnership between the Uganda government and the Peoples Republic of China. This was aimed at reducing

5
0
20000
40000
60000
80000
100000
120000
140000
160000
1998 1999 2000 2001 2002 2003 2004Years of production
Prod
uctio
n le
vels
(Mt)
Area harvested (Ha)
Production (Mt)
expenses on food imports and diversifying export earnings with emphasis on non-traditional agricultural export crops and import substitution crops, the class under which rice fell. The above development also led to the simultaneous pick up in smallholder rice production mainly in the Eastern and Northern parts of the country but with emphasis on low-land rice varieties. Later commercial rice growing was also initiated at Doho (1976) and lately at Olweny Irrigated Rice Scheme. These are now nuclear farms that bring together smallholder farmers in rice production with strong support from government. Today rice is considered among the food security crops in the country and in particular, for alleviating poverty among the rural poor. Further more, the coming in of the rice milling sub-sector (which also involves transportation, drying, storage, processing and marketing) was an important agro-processing development that contributed employment, hence alleviating poverty among the rural poor. In 1981 - 83 average annual rice production in Uganda was 14,667 ha, rising to a mean of 78,667 ha in 2001-2003 and to 93,000 equivalent to 140,000 metric tons of milled rice (UBOS, 2004). This represents about 70% of the current national rice demand estimated at 190,000 – 200,000 metric tons. Oryokot et. al (2004), reports that by 2004, Uganda’s rice imports stood at about 45,000 metric tons. The production levels in terms of both area and quantity of paddy from 1998 – 2004 is shown in Figure 1.
Figure 1: Rice production levels in Uganda: 1998 - 2004

6
The sharp increase in rice production in Uganda can be attributed to the following: a) Release of improved (high yielding, disease tolerant, early maturing) upland
rain fed varieties in 2001/02. Particular mention in this respect, must be made on promotion of the New Rice for Africa (NERICA), whose production is very rapidly spreading in Uganda under support by multiple stakeholders including SAA-UGANDA, JICA and APEP;
b) Rigorous GoU policy, promoting upland rice production in an effort to reducing destruction of wetlands caused by lowland rice production. Farmers in the districts surveyed were particularly appreciative of the personal efforts by His Excellency the Vice President of Uganda, in spearheading the above initiative.
c) Rapid increase in demand and consumption of rice as a staple especially by the urban and peri-urban populations and institutions. The country’s annual per capita consumption of rice is currently put at 10 kg;
d) A shift in consumption patterns of people both urban and rural in favor of rice; e) As women enter into the labour market, the opportunity cost of their time
increases. Rice provides a quick-to-cook alternative; f) Rice prices are relatively stable compared to those of other cereal staples; g) Rice has a higher rate of returns on investment (output : input ration of 1.83)
compared to other cereals crops (maize-hybrid 1.2, and sorghum 1.6) (NAADS March 2003).
h) Discussions with farming communities during the survey also cited the sharp decline in the production of what used to be important cash-crops such as cotton in eastern Uganda, and coffee and bananas in the central region to have contributed to the rapid increase of rice production, since rice has the potential of taking over as a sustainable cash crop in most parts of Uganda.
1.3.4 The NERICA rice development initiatives in Uganda NERICA (New Rice for Africa) that was developed through the West African initiative (WARDA, 2004) is now being regarded by the Uganda Government as a major thrust venture towards the realization of national objective spelt out in the Plan for Modernization of Agriculture and Poverty alleviation Programs. According to data compiled by APEP in conjunction with SG2000, close to thirty four districts in Uganda, previously not traditional rice growing districts, have embraced upland rice production. Cultivated areas under lowland and upland rice are rapidly increasing. However, rice yields under low land conditions in Uganda are still merely around 0.9-1.1mt per hectare, which is great challenge to the research sector in the country. The efforts to promote rice production and marketing are jointly pursued by the Office of the Vice President (OVP), National Agricultural Advisory Services (NAADS), Partner NGOs such as Sasakawa Global 2000, Agricultural Productivity Enhancement Project (APEP) and the private sector. Under NARO, rice is now among priority research activities of the National Cereals Program at NAARI. So far three (3) upland rice varieties (NARIC 1, 2 and 3), are already on commercial seed production by NASECO and FICA seed companies and by selected farmers. The

7
Government of Japan through the Japan International Cooperation Agency (JICA) placed a rice expert to join efforts in intensification of research and promotion of NERICA in the East and Central African Region. Sasakawa Africa Association (SAA) in conjunction with JICA, SG2000 Uganda and the Private sector have initiated local manufacturer training in the fabrication of appropriate rice technologies including planters and weeders to address drudgery and labour problems in rice farming. The training also covers skills on fabrication of rice threshing, milling and cleaning machines to improve rice quality and marketing among farming communities, particularly those organized under the “One-stop-Center” arrangements (SAA, 2004). SAA has also embarked on distribution of tarpaulin sheets to rice producer groups committed to improving rice postharvest handling practices for quality rice supply on the domestic and export market. Though the rest of the other inputs like fertilizers such as DAP, SSP, UREA and MOP have been in significant supply, their high price, largely attributed to high transaction costs incurred by the importers, has made fertilizer unaffordable to the majority resource poor farmers. 1.4 Justification of the study As hinted above, Uganda has tremendous potentials [given its good soils, favorable climate, two growing seasons (see Appendix 2), political support and farmers’ enthusiasm] for increasing its rice production and rapidly moving to self-sufficiency in rice. This would save the country the huge foreign exchange currently worth US $90 million annually spent on importing rice. Besides, rice has ready markets locally, regionally and internationally. It is worth noting however, that the crop is still relatively new in the country’s farming system and the industry is therefore still hampered by a number of knowledge and information gaps both at the production, post-production and marketing levels. There are also still a number of policy issues which require redress as a way of accelerating rice expansion. The main gap areas upon which the current study tools (questionnaire) were developed are: a) Agronomy: soil fertility and nutrient requirement issues, weed management and
general husbandry; b) Water management in lowland and moisture management in upland systems; c) Diseases and pests especially in lowland rice farming systems: e.g. rice-blast,
yellow-mottle, rodents and birds at near-maturity and beyond; d) Inadequate availability and high cost of labour especially for seed-bed
preparation, nursery management, transplanting (for low land rice), weeding, bird scaring and harvesting;
e) Closely related to labour is the high level of drudgery at different stages in the production and post-production chain;
f) Inappropriate/unavailable and high cost of technology (tools and equipment) for rice production and processing, as well as of inputs: pesticides and fertilizer;

8
g) Quality issues normally associated with poor handling, storage and processing practices: compromising wholesomeness and nutritional and market value of the crop;
h) Environmental and gender issues throughout the production chain; i) Inadequate knowledge on the effects of rice production on livelihoods of rice
farming households in Uganda. The study has thoroughly discussed and offered clear indications of priority among these challenges, as well as pointers to their solution. 1.5 Study Objectives
1.5.1 Main objective The purpose of the study was to generate basic information on the status of rice production, processing and marketing in Uganda with a view to contributing to guiding future development initiatives for rice in the country.
1.5.2 Specific objectives Specific objectives of the study were to: 1. Analyze rice production, processing and marketing practices and their trends; 2. Document the status of rice mechanization and processing tools, equipment
and other inputs and their accessibility by farmers and processors; 3. Identify major constraints in the rice industry; 4. Analyze factors that influence adoption of rice; 5. Determine the effects of rice production on farming systems and livelihoods of
farmers in Uganda. 1.6 Expected Outputs The output of this study is a Survey Report comprising information on: a) rice production, processing and marketing practices and their trends; b) status of rice mechanization and processing tools, equipment and their
accessibility by farmers and processors; c) major constraints in the rice industry; d) factors that influence adoption of rice in the country; e) effects of rice production on farming systems and livelihoods of farmers; f) recommendations on way forward to improving rice production processing
and marketing in Uganda.

9
1.7 Study Scope and Coverage This study covered a total of six districts in Uganda, strategically selected to represent the entire country. The Eastern and Northern regions of the country were respectively represented by Iganga and Lira districts, while the Central and Western regions were represented by Lwero and Kiboga, and Kibaale and Kamwenge respectively. The selected districts are among the major rice growing areas in the country. In the six districts a total of 852 individual households were interviewed. At the same time, the research team interviewed 27 rice processors, 27 agro-input dealers, and 34 key-informants. Through focus group discussions, the research team also interacted with a total of 523 rice farmers in the above districts. Details on the study methodology and scope are covered in the next chapter to this report.

10
2 STUDY METHODOLOGY 2.1 Survey Design In each of the six districts in which the survey was conducted, two (2) main rice growing sub-counties from two (2) different counties were covered. District selection was based on criteria developed at a pre-survey planning meeting attended by representatives of several NARO research institutes, Sasakawa Africa Association Uganda (SAA-U), experts on rice based at MAAIF, and the Department of Agricultural Economics, Makerere University. The selection was also guided by the GIS-suitability map (Annex 2) that indicated rice production potential by various districts in Uganda. The criteria used included: a) Districts with good rice potentials as guided by the “suitability map” for rice in
Uganda, Annex 2; b) Adequate coverage of all the four regions of the country, while operating
within the existing budget ceiling; c) Districts that grow considerable quantities of rice in the country; d) Target was to obtain information both for upland and lowland rice production; e) Districts in which JICA and SAA-Uganda are operating so as to build on the
experiences already gathered. Based on the above criteria a multi-stage, purposive sampling method was used to select the districts. The final districts selected were Lira in the north, Iganga in the east, Luwero and Kiboga in the central and Kamwenge and Kibale in the west. A similar approach was used to select the counties and sub-counties in collaboration with the District Production and Agricultural Officers in the respective districts. Selection of the final areas to be surveyed was further guided by ease of accessibility, areas with existing organized rice-based farmer groups with evidence of good response during similar studies. Table 1 shows the names of area selected. The hierarchal arrangement of the surveyed districts is shown in Figure 2, while physical locations of the districts are shown in Figure 3. The study was conducted using Participatory Rural Appraisal (PRA) principles, but the PRA-tools were appropriately selected and questionnaires/check lists prepared to focus on the study objectives. Table 1: The surveyed districts and the corresponding sub-counties
District Counties Sub-counties Dokolo Agwata Lira Erute Barr Bugweri Buyanga
Iganga Busiki Nsiinze Nakaseke Semuto Luwero Bamunanika Zirobwe Kiboga West Wattuba Kiboga Kiboga East Bukomero Kitagwenda Mahyoro Kamwenge Kibale Kahunge Buyaga Mabaale Kibaale Bugangayizi Nalweyo

11
Kibale County
Kahunge S/County
Kiboga District
Kiboga East
County
Kiboga West
County
Bukomero S/County
Wattuba S/County
UGANDA
Central region
Western region
Northern region
Eastern region
Kamwenge District
Kibale District
Luwero District
Iganga District
Lira District
Kitagwenda County
Nakaseke County
Bamunanika County
Bugangaizi County
Dokolo County
Busiki County
Buyaga County
Agwata S/County
Zirobwe S/county
Nalweyo S/County
Mabaale S/County
Semuto S/County
Mahyoro S/County
Nsinze S/County
Erute County
Bugweri County
Barr S/County
Buyanga S/County
Figure 2: The hierarchal structure of the survey area

12
LAKE VICTORIA
GULU
KOTIDO
LIRA
MUKONO
KITGUM
APAC
MASINDI
MBARARA
PADERARUA
MOROTO
HOIMA
BUGIRI
RAKAI
KALANGALA
MPIGI
MUBENDE
KAMULI
KUMI
MASAKA
LUW EERO
KATAKWI
MAYUGE
KIBOGA
KIBAALE
NEBBI
SOROTI
KASESE
BUSHENYI
NAKAPIRIP IRIT
KYENJOJO
WAKISO
YUMBE
IGANGA
ADJUMANI
PALLISA
NAKASONGOLA
KABALE
TORORO
MBALE
KAMWENGE
SEMBABULE
NTUNGAMO
KAYUNGA
KABAROLE
BUNDIBUGYO
RUKUNGIRI
JINJA
KAPCHORWA
BUSIA
SIRONKO
KABERAMAIDO
KISORO
KAMPALA
KANUNGU
LAKE KYOGA
LAKE ALBERT
MOYO
BU KOMERO
KAH UNGE
BAR R
NARWEYO
AGWATTA
MABAALE
ZIR OBW E
MAHYORO
WATTU BA
SEMUTOBU YANGA
NSINZE
Figure 3: Map of Uganda showing the surveyed areas

13
2.2 Sampling Frame There were five categories of respondents considered for the study: individual farm households, farmers’ focus group discussions, key informants, rice-related farm input dealers and distributors and rice millers/processors. The method used for selecting respondents in the individual farm household category depended on the concentration of rice growing farmers in that sub-county. Random sampling method was employed to select respondents in the sub-counties that had at least 50% farm households growing rice. Where the proportion of farm households growing rice was less than 50%, purposive sampling was used. Purposive sampling method was also used to select respondents for the focus group discussions. During selection of respondents, it was ensured that parishes within a targeted sub-county were each represented. Key informants were purposively selected. They consisted of technocrats at district and sub-county levels, political and civic leadership at sub-county and parish levels, leadership of farmers’ associations at various levels and opinion leaders. Purposive sampling was similarly used for selecting respondents in the farm-input marketiers and distributors, and rice millers’ categories both at the surveyed districts and Kampala city. The number of respondents interviewed per district in each of the respondent category is shown in Table 2. Respondents in the individual farm households and focus group categories consisted of male, female, elderly, youth and a few disabled farmers. A total of 851 farm households were interviewed individually and focus group discussions were held with 524 farm households. In total 1,375 farmers were interviewed during the survey of which 25.8% were women. There were 34 key informants, 27 input marketiers and distributors and 27 rice millers interviewed. Following the survey, a one-day rice stakeholder workshop was held to receive feed back on this report in its draft final form. The workshop input was included in the final technical report. Table 2: Category and number of respondents interviewed
Number of respondents by category and district District name Farmers Rice millers Input
dealers Key
informants Total
respondents Lira 223 6 4 6 239 Iganga 218 6 7 5 236 Luwero 250 5 5 5 265 Kamwenge 254 3 3 7 267 Kibaale 235 4 4 5 248 Kiboga 195 3 4 6 208 Total 1375 27 27 34 1463
2.3 Measuring Adoption of Rice Among Farming Enterprises Although still at a slow pace, raising adoption of agricultural technologies is on Uganda’s long- term agenda. Research has used a number of factors to measure adoption of agricultural technologies. Among the schools of thought, this study selected the following as key to understanding the technology adoption process and the underlying factors.
14
Feder et al. (1985) defined adoption as the “degree of use of a technology in the long run equilibrium when a farmer/user has full information about the technology and its full potential”. Adoption at farm level therefore describes the realization of a farmer’s decision to apply a new technology in the production process. Given this characteristic of the adoption process, identification and selection of an appropriate technology should occur participatorily in the process of ranking a community’s main problems. Technology selection should be on the basis that the package is initially sustainable and can be expected to continue for several years, as the most adopted technologies are those that provide short-term benefits at low cost and create enthusiasm among the users. A new agricultural technology may reflect high yield, low cost, or other desirable traits but the changes in the production process involved in the adoption of a new technology may bring risks resulting from imperfect information and possibility of committing errors (Lin, 1991). According to this school of thought, for effective diffusion of a technology, there must be compatibility between the technology and the target group. In addition, the technology should be user friendly and must be acceptable to the most vulnerable part of the community. These remarks lead us to conclude that it is important to understand the adoption of agricultural technologies in relation to the user’s socio-economic characteristics. To this end, this study set out at understanding the degree of adoption of the different varieties of rice by establishing the socio-economic factors that can potentially affect the adoption of the rice varieties. The factors considered included the farmer’s age, education levels, income levels and sources, access to required resources (labor, information and seed supply), land area committed to the rice crop, land ownership, farm size, availability of support systems such as credit services and infrastructure. This list of factors was limited to assessing farmer’s adoption of rice in production activities. 2.4 Data collection procedure A non-formal participatory research technique based on interactive focus group discussions was used for obtaining relevant information during group discussions. A similar method was used in the collection of information from individual farm household respondents. This was supplemented by on-site observations. In each sub-county, the selected respondents for individual interviews and key informants were conducted in their respective homes and offices respectively. The respondents for focus group discussions were gathered at a central meeting place for the discussions. To ensure high accuracy and adequate data collection during focus group interviews, discussions were often times held separately with the male and female respondents. The required information was collected using selected survey tools, questionnaires and check lists for the various respondents. The district and grass root agricultural extension system including NAADS in some of the districts were heavily involved during data collection. They were first trained on the study tools, questionnaires and check list prior to the data collection exercise. 2.5 Data analysis of constraints Constraints faced by farmers in rice farming enterprise were obtained from focus group discussions and individual households in each of the surveyed sub-counties.

15
The constraints from focus group discussions were analyzed using weighted scoring. The constraints were first analyzed at individual district level. Each sub-county had a maximum of nine ranked priorities. The ranked constraints from all the sub-counties were aggregated into 18 constraints. A constraint in a sub-county, which ranked first was scored 10 points, in the same sub-county, sub-sequent constraints (in descending order) were scored 9, 8, 7 …, etc. A constraint which did not appear in that sub-county was given a score of zero. The scores were first added at individual district level to give priority constraints in each district. Frequency was used to obtain priority constraints from individual households for each district. Constraint that had highest frequency was given a rank of 1, then sub-sequent constraints were given a rank of 2, 3, …, etc. Weighted scoring process was repeated for constraints from individual households and focus group discussions to determine the overall priority constraints for every district and across districts. The sums of scores for every constraint from each district were then added to give the total sum of scores, which were used to obtain overall priority constraints across the districts. The constraint which had the highest sum of scores was the most severe and was consequently ranked priority 1. The constraint that had the second highest sum of scores was ranked second, etc. The results were then presented in tabular. SPSS and MS-Excel computers soft wares were used to aid the data analysis.
2.6 Data analysis to determine the factors influencing the level of rice adoption A combination of analytical tools used included descriptive statistics, measures of adoption and logistic regression analysis. The logistic regression analysis was used to identify determinants of adoption of existing rice varieties. This study set out to assess the level of adoption of rice and establish constraints at the farmer, trader and consumer levels. The conceptual considerations of the analysis of adoption is based on the fact that the decision of an individual farmer, i.e. to adopt or not to adopt the rice varieties depends on a qualitative index, Zi, that is determined by a set of explanatory variables (mainly socio-economic) in such a way that the larger the index is, the greater is the probability of the farmer adopting the rice technology. This index of adoption is expressed as follows:
Zi = α + βiXi + μi Where: Zi = qualitative dependent variable (defined by adoption or non-adoption of the
rice varieties) Zi = 1 if respondent adopted the variety (farmer got information about the variety
and expanded acreage under rice over a two-year period: 2004-2005) Z = 0 if respondent is non-adopter (farmer got information but did not use the
variety or used it but has declining acreage under rice over the same period) Xi = a vector defining the independent variables (mainly socio-economic
characteristics of farmer i ) α = the value of the regression coefficient βI = the regression parameters μI = Error term The logistic regression analysis was conducted to identify the determinants of farmer adoption of the rice varieties in the six study districts.

16
2.7 Data analysis of the other factors in the study Means and frequencies were then used to analyze the remaining data. SPSS, and MS-Excel computer soft wares were used to aid the data analysis and presentation. 2.8 Profiles of the study districts
2.8.1 Kamwenge district Kamwenge is one of the districts in western Uganda. The district has a total area of about 2,439.3 km2 of which 2,045.5 km2 is agricultural land and forests, open water and swamps cover about 393.8km2. Due to rift valley effect, the land is generally hilly with rugged areas. Kamwenge district has a population of 267,364. The rainfall pattern is bimodal with two seasons. The average annual rainfall for the last ten years has been between, 1,200 – 1,500mm. The first season is usually affected by sporadic droughts. The major crops grown are maize, banana, cassava, solanum potatoes, coffee, sweet potatoes, beans, and groundnuts. Upland rice is one of the new crop enterprises introduced by NARO as on-farm trials of NERICA varieties in 2000. The on-farm trials did very well, and Sasakawa Africa Association Uganda has started promoting the crop. The total area under rice production has risen from 0 to 103ha in 2004. Over 90% of the rural population is engaged in the subsistence agriculture. The average annual income earning is far below the national average income per capita of 370 U$. The district is among the poorest in Uganda, with average monthly household income from both agricultural production and non-agricultural activities at Ushs.140,000/=. The district has many NGOs, with a total of 203 registered primary societies between the current Kamwenge, Kyenjojo and Kabarole that used to be one district, (Anon 2005 and Kamwenge district local government, 2005).
2.8.2 Kibaale district Kibaale district is located in mid western Uganda and it is about 215 km from the capital city of Kampala by road. The district has a total area of about 4,400 km2 of which 319sq.kms is covered by water bodies. Kibaale district has a population of 405,882. The district lies at an altitude ranging between 700 to 1250 meters above sea level. The land is generally hilly and rocky which presents a lot of challenges that hinder agricultural production. The district has rich and fertile soils which provide good opportunity to grow a variety of crops including upland rice. The rainfall pattern is bimodal with two seasons. The annual rainfall varies between 1,000– 1,500 mm. The temperatures are relatively high, varying between 150C and 300C with the hottest areas in the rift valley. The main crops grown are cassava, sweet potatoes, coffee, maize, bananas, beans, finger millet, upland rice, vegetables, tobacco and tea. Upland rice, vanilla and cocoa are increasingly gaining economic importance in the district. Over 90% of the rural populations derive their livelihoods from subsistence agriculture. There is wide spread poverty in the district because of poor and low yields coupled with limited markets of the farmers’ produce, aggravated by poor road network. The district has a total of 124 registered primary societies with only a few NGOs, (Anon 2005 and Kibale district local government, production office, 2005).

17
2.8.3 Kiboga district Kiboga district is located in the central region of Uganda about 120 kms from the capital city of Kampala by road. The district has a total area of about 4,046 km2 of which 3,903.3sq.kms is land. Open water and swamps cover about 142 km2. The district has a population of 229,472 with 58.9 persons per square kilometer. Kiboga district lies at an altitude ranging between 1,400 to 1,800 meters above sea level. The land is generally hilly with rugged areas (occupied by cultivators and a few herders). The rainfall pattern is bimodal with two seasons. The annual rainfall varies between 560 to 1272 mm in the last 7 years with rainy days averaging between 90 and 130 per year. The leading crops are coffee, maize, bananas, sweet potatoes, Irish potatoes, beans, cassava and vegetables plus tobacco and ginger. Upland rice was introduced in the district in 2003 by Buganda Cultural Development Center (BUCADEF) and further promoted by HE the Vice President and JICA in 2004. There are still few farmers growing the crop and very good yields were obtained in second season of 2004. About 90% of the rural population is engaged in subsistence agriculture with 5% engaged in private commerce and 5% government institutions. The average annual income earning is far below the national average income per capita of 370 U$. The average monthly household income from both agricultural production and non-agricultural activities was Ushs.195, 433/=. The district is among the poorest districts with 64.4% of individuals below the poverty line, (Anon 2005 and Kiboga district local government, 2005).
2.8.4 Lira District Lira district is located in the northern region of Uganda, 352 km from the capital city, Kampala by road. The district has a total area of about 7,251 km2 of which 6,151sq.kms is land. Open water and swamps cover about 1,100 km2. Lira district has a population of 757,763 with 104 persons per square kilometer. The district lies at an altitude ranging between 975 to 1,146 meters above sea level. The annual rainfall varies between 1,000 mm to 1,500 mm with temperatures ranging between 15 -35oC. The leading crops grown are, maize, sorghum, lowland rice, beans, sesame, groundnuts, pigeon pea, cassava, sunflower and coffee. Upland rice is a new crop that is currently gaining importance in the economy of the district. Over 90% of the rural population is engaged in traditional subsistence agriculture. Though the district is well known for its use of work animals to aid farm labour, the civil strife and cattle rustling that have persisted for newly two decades have left the population highly impoverished, and without its cattle population. Otherwise the district has a well distributed feeder road network, linking all the counties. The district is also connected by a railway line running from Soroti to Gulu, however this facility is currently defanged, and not benefiting marketing of farmers’ produce. There are 103 registered primary cooperative societies in the district, (Anon 2005 and Lira district local government, 2005).
2.8.5 Luwero district Luwero district is located in the central region of Uganda, with its administrative head quarter just 60 kms by road, from the capital city of Kampala. The district has a total area of about 5,572 km2 of which 5,112 km2 is land, and the rest is water and

18
swamps. The district has a population of 474,627. It lies at an altitude of between 1,082 – 1,372m above sea level. The rainfall pattern is bimodal with two seasons. The rainfall is well distributed and the average annual rainfall is 1,300 mm. The temperatures are relatively high, varying between 180C and 350C. The soils are generally red sandy loams in the north, and clay loams in the southern part. The clay loams are relatively fertile and support all kinds of crops. The main crops grown are coffee, maize, bananas, sweet potatoes, beans, cassava, vegetables, upland rice and pineapples. Upland rice is increasingly gaining economic importance in the district. Over 90% of the rural populations derive their livelihoods from the subsistence agriculture. There is still wide spread poverty in the district because of poor and low yields coupled with limited markets of farmers’ produce. The major tarmac road to the northern parts of Uganda passes through the district, and most of the feeder road network connects to this main road, enabling transportation of farmers’ produce to markets within and outside the district. The district also has a large number of NGOs with 191 registered primary societies in both Luwero and Nakasongola combined, (Anon 2005 and Luwero district state of environment report, 2004).
2.8.6 Iganga district Iganga district is located in the eastern region of Uganda. The district has a total area of about 6,434.78km2, with a population of 691,973. The district lies at an altitude ranging between 1,070 to 1,161 meters above sea level. The annual rainfall varies between 1250 to 2,200 mm, with uniform temperatures of 25 - 350C. The main crops grown are coffee, maize, finger millet, sorghum, rice, groundnuts, beans, cassava, sweet potatoes, banana and cotton. Rice is one of the crops that is considered as a poverty reduction enterprise in the district. Over 90% of the rural population is engaged in the traditional subsistence agriculture. There is still wide spread poverty in the district because of poor and low yields coupled with limited markets of farmers’ produce. The district is accessible by rail and road, that link Kampala to the eastern parts of the country, and also to the coastal port of Mombasa. It also has a feeder road system that links it well to Lake Victoria in the south. The district hosts a large number of NGOs with 255 registered primary societies with Busoga Union as their apex, (Anon 2005 and Iganga district local government, 2005).

19
45.243.2
10.2
1.4
0
5
10
15
20
25
30
35
40
45
50
Perc
enta
ge o
f res
pond
ent a
ge g
roup
20-39 40-59 60-79 Other
Respondent age group (years)
3 SURVEY FINDINGS 3.1 Socio-demographic Characteristics of Farmer Respondents The sample population of farmer respondents handled during the survey was 1375 of whom 25.4% were female. Of the total 92% were male household heads and only 8% female-headed. A total of 57.1% had primary education, 30.6% secondary, 4.1% tertiary level education and 0.2% vocational and university education, and 8% did not attend school at all. The majority of respondent household heads (88.4%) were in the age range of 20 to 59 years with a mode of 40; while none of the respondents was older than 79 years. The age distribution among the sample is shown in Figure 4 below.
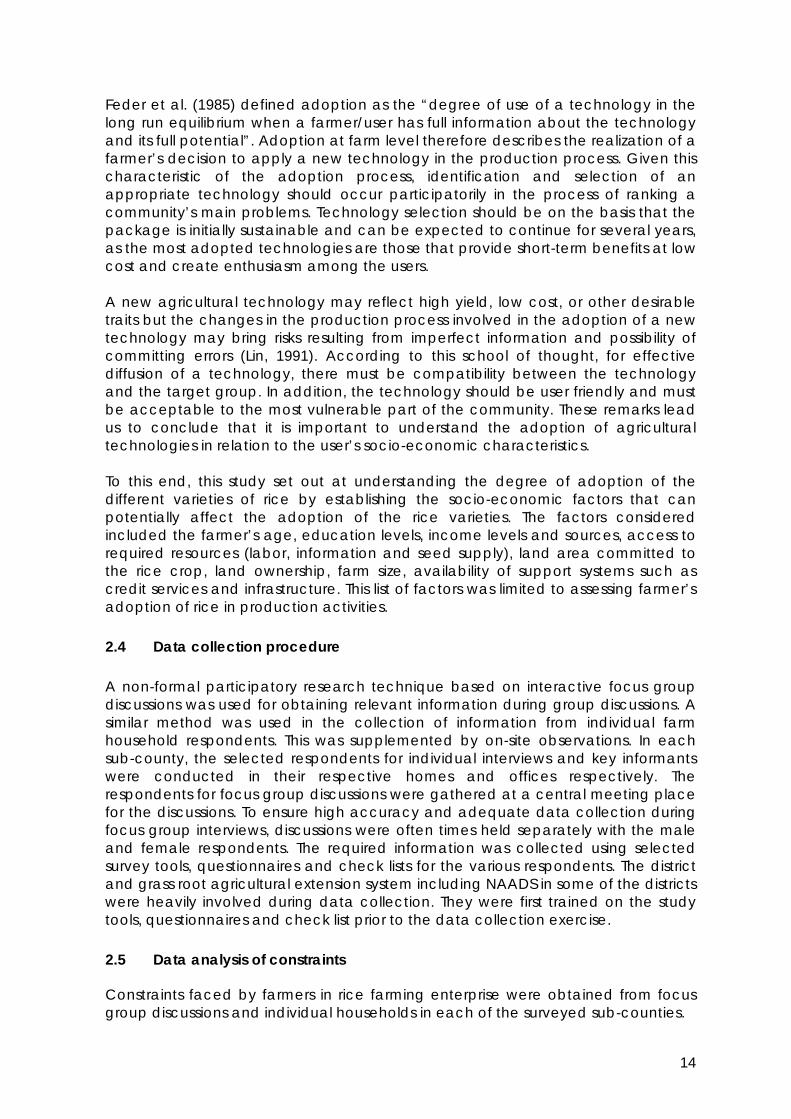
Figure 4: Age distribution of farmer respondents The survey also showed that the majority of respondents were married (83%), with 6% being single and 11% were either widowed or separated (divorced). This result indicated that the sample population of rice farmers was relatively stable. The family size of the respondent households varied from a minimum of 2 to a maximum of over 30 members with a mode of 6 members. Additionally, the sampled households had a relatively high numbers of dependants, the majority being within the lower age group up to 20 years and the rather elderly, over 60 years. These research findings indicate that households must ensure that enough food is available to feed the members of the household and the generally large number of dependants. It must also have enough income to be able to educate the children, majority of which was at the school-going age. It must also have the capacity to meet health care and other basic costs. Household size distribution of respondents is as shown in Figure 5.
20
85.581.5
79.179.7
55.949.6
72.4
20.920.318.514.5
44.1
54.6
27.6
0
10
20
30
40
50
60
70
80
90
Iganga
Kibaale Lira
Luwero
Kamwenge
Kiboga
Overall t
otal
Districts
Perc
enta
ge o
f mem
bers
hip
Yes No
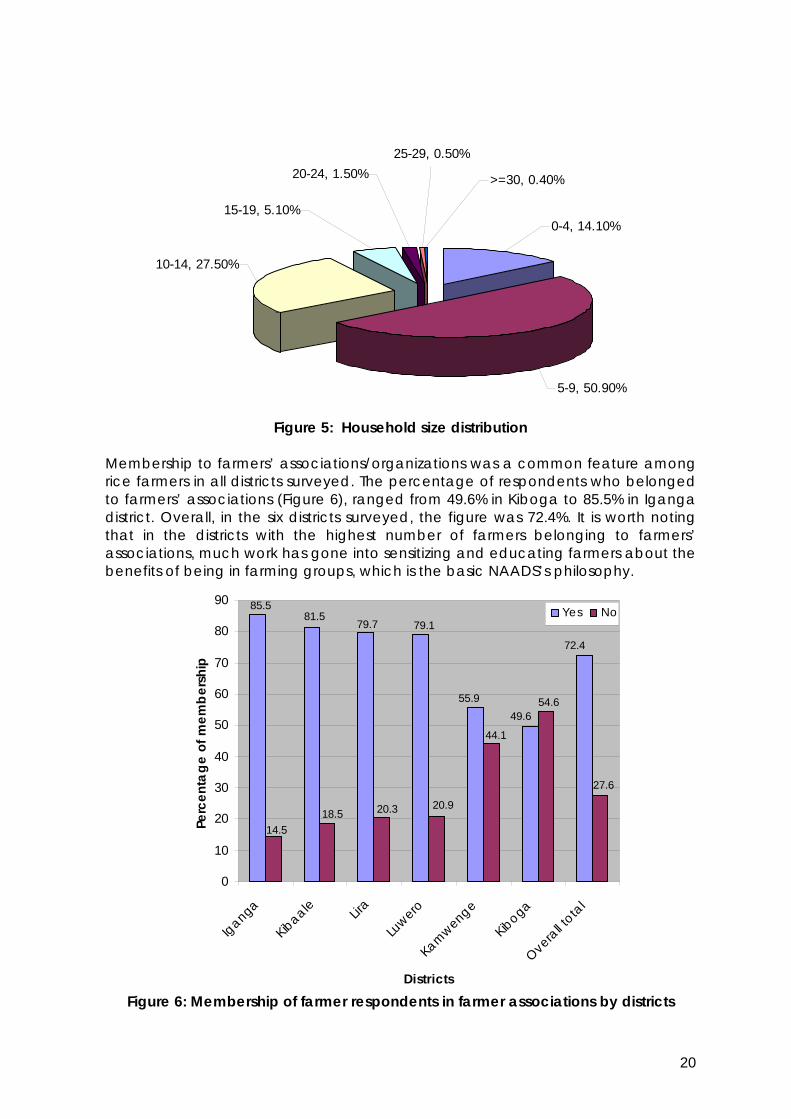
10-14, 27.50%
5-9, 50.90%
0-4, 14.10%15-19, 5.10%
20-24, 1.50%25-29, 0.50%
>=30, 0.40%
Figure 5: Household size distribution Membership to farmers’ associations/organizations was a common feature among rice farmers in all districts surveyed. The percentage of respondents who belonged to farmers’ associations (Figure 6), ranged from 49.6% in Kiboga to 85.5% in Iganga district. Overall, in the six districts surveyed, the figure was 72.4%. It is worth noting that in the districts with the highest number of farmers belonging to farmers’ associations, much work has gone into sensitizing and educating farmers about the benefits of being in farming groups, which is the basic NAADS’s philosophy.
Figure 6: Membership of farmer respondents in farmer associations by districts

21
Lira, 28%
Luwero, 10.60%
Iganga, 29.10%
Kiboga, 14.60%
Kibaale, 17.60%
Kamwenge, 12.20%
It was also reported that those who were members of the associations benefited from training courses, and that the groups, to some extent, helped with processing and marketing of rice. Respondents who never belonged to any associations indicated that they were no associations available to join. Sixty-five percent of the rice growers surveyed had had some form of training about rice aspects including planting, field management, and harvesting. A number of public and private institutions have sponsored and participated in the training of rice farmers, examples being NAADS, District Local Government, and NGOs. 3.2 Farm Characteristics Land use in the surveyed districts varied among different uses dominantly being crop farming, livestock farming, residential and idle land. The survey did capture information on total landholding by households and of this the amount, the land allocated to rice. The average household landholding sizes for Luwero, Kamwenge, Kibaale, Kiboga, Lira and Iganga were respectively, 6.1, 4.6, 4.3, 3.9, 3.6 and 1.95 hectares. The mean percentage of land allocated to rice varied from 12.2% in Kamwenge (a district that has newly taken on to rice farming), to 28.0% and 29.1% in Lira and Iganga respectively with details for the rest of the surveyed districts as shown in Figure 7. It is worth noting that Lira and Iganga districts have grown rice longest compared to the other districts surveyed. They also currently grow both lowland and upland rice varieties. This explains the relatively high proportions of land their households allocate to rice growing. This may also be an indication of benefits that their communities have gained from rice farming.
Figure 7: Mean percentage of land allocated to rice by rice farmers Kibaale and Kamwenge had substantial tracks of idle land. Leaving land under fallow and keeping it as a form of long-term investment were the two main reasons given for having unused land. Regarding land ownership, 91% of the sampled households indicated that land was owned by men (either household heads or relatives), about 2% was co-ownership between husband and wife while the remaining 7% was land owned either by a woman, particularly female household heads.

22
Manual power, 82.50%
Tractor power, 5.10%
Animal traction, 12.40%
3.3 Rice Production Practices including Mechanization
3.3.1 Land preparation In upland rice cultivation, land clearing is done in January and July for the first and second seasons respectively whereas in lowland rain-fed rice, this activity is done in January and late August. In the case of Iganga where lowland rain-fed rice is grown only for one season, land clearing is often done in January through to February. The major reported source of power used for land clearing was manual (89.9%) with the majority of the farmers using rudimentary farming implements such as axes, cutlasses, slashers and hoes. Animal traction contributed to only 0.8%, while motorized power contributed 0.7%. The remaining power source combinations of manual and animal traction and manual and motorized took up 0.6% and 0.1% respectively. Analysis of labor distribution showed family labor being predominantly employed in land clearing contributing 59.8%, whereas contracted labor and exchanged labor contributed 16.2% and 1.7% respectively. In some circumstances a combination of family labor and contracted labor was utilized; this contributed 14.1% of the rice farm labour.
3.3.2 Ploughing In Upland rice first plowing was done shortly after land clearing from late January through to mid February, and in late July through to August for the first and second seasons respectively. For lowland rain-fed rice however, first plowing was done from between late February and March, and August for those areas with two growing seasons. It was noted that 82.5% of rice farmers used solely manual power, 12.4% used animal traction (mainly in Lira and Iganga), normally in combination with manual power; and 5.1% used motorized power (hire tractor services) for both first and second ploughing. The hand hoe was the most predominant farm implement used in plowing through a cross section of rice growing communities within the survey areas. This confirms why farmers reckoned ploughing as the most labour intensive and time consuming operation with urgent need for intervention. Figure 8 gives the share pattern for the various farm power sources in ploughing.
Figure 8: Ploughing power sources in rice farming

23
During first plowing, family labour contributed 46% of the labor requirements followed by a combination of both family and hired labor, which contributed 20% of the labor requirements. Hired labor and labor exchange each contributed 30.8% and 1.8% respectively. Labour exchange was common practice in Lira district and parts of Kamwenge districts. The very limited use of animal traction or motorized power sources during plowing was a result of the low income base of most subsistence farming households, hindering capacity to hire these equipment. The results of the number of times a rice farmer plowed his/her rice field before planting, showed that only 6.9% plowed once, 61.3% plowed twice, 27.9% plowed thrice and 3.9% plowed four times before planting The essential difference in numbers of times the rice field was plowed before planting is largely dictated by the environment in which the rice was to be grown. Over 68% of the farmers who plowed their fields once or twice grew upland rice while 31.8% that plowed thrice or even four times, grew lowland rice. Most respondents who had experience on both low- and upland rice management, reported a lot more strain, labour and time required in low-land compared to upland rice cultivation.
3.3.3 Planting Plant spacing and method of planting significantly influence the seeding rate, optimum plant population and eventual crop yield. In the districts surveyed, 62.1% of the farmers interviewed used drill; 11.6% dibbled, 18.6% broadcasted, and 7.2% transplanted rice. Broadcast, drill and dibble methods were widely employed in upland rice fields while transplanting was solely used in low-land rice farming. The preference for drill as a planting method was attributed to the following:
• Better growth due to proper spacing thus reducing congestion, • Higher yields due to assured optimum plant population, • Less labour compared to dibbling, though more compared to broadcasting • Subsequent farming operations (weeding, harvesting, and pest/disease and
water management) are made easy, • Better moisture conservation ensuring in the field.
Drilling Dibbliing Broadcasting In all districts surveyed, farmers were being sensitized and trained on the use of the “drill method” especially for upland rice production. Many have been taught how to use the simple hand-pulled forked-rake technology (Figure 9a) to open small furrows where seeds are drilled at inter-row widths of 20 to 30cm.
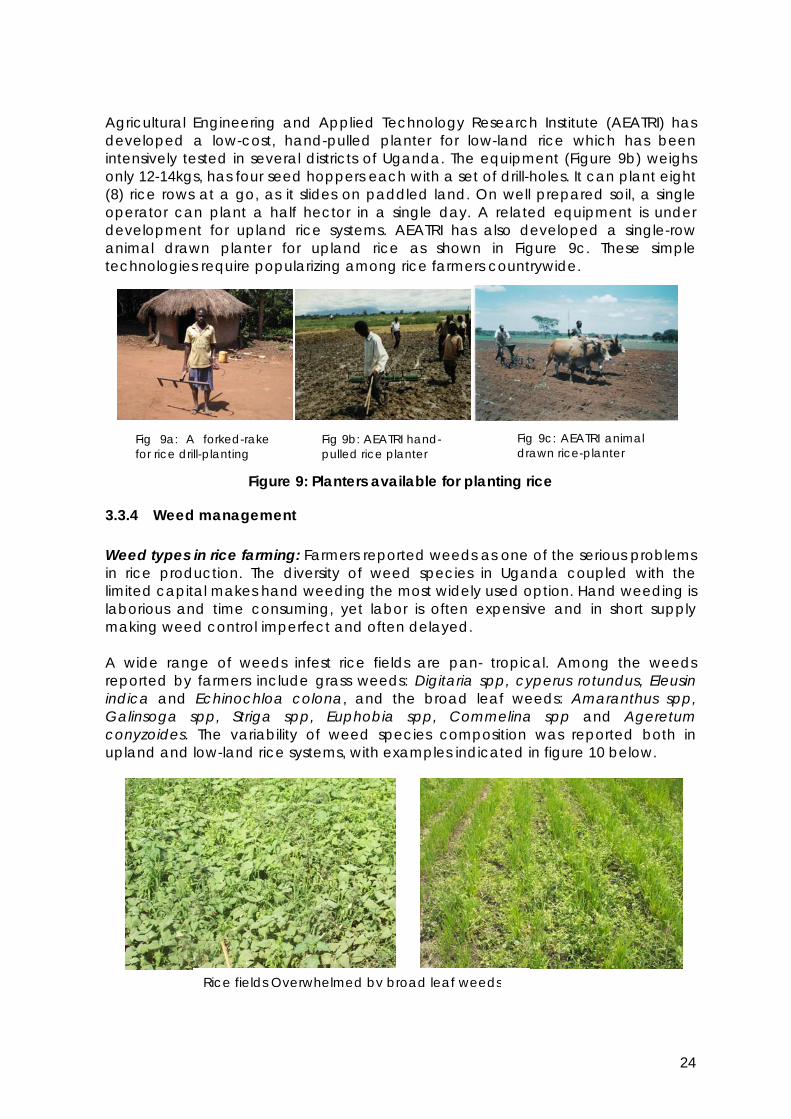
24
Fig 9a: A forked-rake for rice drill-planting
Fig 9b: AEATRI hand-pulled rice planter
Fig 9c: AEATRI animal drawn rice-planter
Agricultural Engineering and Applied Technology Research Institute (AEATRI) has developed a low-cost, hand-pulled planter for low-land rice which has been intensively tested in several districts of Uganda. The equipment (Figure 9b) weighs only 12-14kgs, has four seed hoppers each with a set of drill-holes. It can plant eight (8) rice rows at a go, as it slides on paddled land. On well prepared soil, a single operator can plant a half hector in a single day. A related equipment is under development for upland rice systems. AEATRI has also developed a single-row animal drawn planter for upland rice as shown in Figure 9c. These simple technologies require popularizing among rice farmers countrywide.
Figure 9: Planters available for planting rice
3.3.4 Weed management Weed types in rice farming: Farmers reported weeds as one of the serious problems in rice production. The diversity of weed species in Uganda coupled with the limited capital makes hand weeding the most widely used option. Hand weeding is laborious and time consuming, yet labor is often expensive and in short supply making weed control imperfect and often delayed. A wide range of weeds infest rice fields are pan- tropical. Among the weeds reported by farmers include grass weeds: Digitaria spp, cyperus rotundus, Eleusin indica and Echinochloa colona, and the broad leaf weeds: Amaranthus spp, Galinsoga spp, Striga spp, Euphobia spp, Commelina spp and Ageretum conyzoides. The variability of weed species composition was reported both in upland and low-land rice systems, with examples indicated in figure 10 below. Rice fields Overwhelmed by broad leaf weeds

25
. Eleusine indica Striga spp Cyperus rotundus Echinochloa colona
Figure 10: Example of typical weeds in rice farming Weeding frequency and timing: Regarding the time of weeding initiation (Table 3), only 4.9% of the respondents start weeding their rice before 2 weeks after germination, 26% start weeding 2-3 weeks after germination, and 30.6% after 5-6 weeks. A few farmers (29.4%) however, start weeding after 6-7 weeks, and (2.8%) never weed rice fields at all. Farmers who wed their rice late said that they experienced a great reduction in their yields. Most farmers wed their rice fields twice. Very few farmers (8.5%) reported weeding rice three or more times. Farmers claimed that weeding is labor and time-demanding operation which is also very expensive, hence the cause for weeding ones and at most twice. Rice weeding is a female domain. Table 3: Time of weeding initiation
Weeding initiation time after germination
Frequency Percentage (%)
<2 weeks 42 4.9 2-3 weeks 226 26 4-5 weeks 261 30.6 6-7 weeks 251 29.4 > 7 weeks 51 5.9 No weeding 24 2.8 Total 851 100

26
Manual and mechanical weeding: Manual weeding is the most practiced method of weed control in all the districts surveyed. This is labour intensive and time-consuming activity predominantly done by women. From the survey findings, 80% of the weeding is done by women using a variety of hand tools ranging from hand-held knives to hoes with different shapes and sizes. AEATRI has however, developed a hand-pushed weeder that can weed one or two rows of rice at a go and suitable for use in lowland rice. The productivity of the tool is double that for hand weeding, though it still calls for manual removal of the weeds that remain around the crop after the implement has passed through. The institute has also developed an animal-drawn weeder that can handle row-widths ranging from 20 to 75 cm. Using well trained animals, the implement can weed an hector of rice in four hours, though still calls for manual fine-tuning weeding around the crop after the implement has passed through. This implement can increase the productivity of labour nearly twenty times compared to traditional manual weeding. The benefits of the new weeding technologies (Fig 11) have still to be widely demonstrated to farmers, with active private sector involvement in their scaling-up.
Figure 11: Traditional and improved rice weeding technologies Herbicide use in weed management: Although herbicides are thought to be one of the labour saving technologies, the importance of herbicides in weed control was insignificant, as reported by only 10.7% of the farmers. The costs and unavailability of herbicides was reported the major limitation to its wide adoption in the districts surveyed. Farmers also cited limited knowledge on the correct herbicides for rice, as well as their efficacy and safe use.
Figure 12: Faulty and recommended herbicide application
Figure 12a: Unprotected herbicide application
Figure 12b: Protected herbicide application
27
Most farmers are aware that herbicides can be dangerous to life if incorrectly used, however minimum measures are often taken to ensure human safety during use. Herbicide mixing and handling are often uphazardly done and without protective gear during spraying as seen Fig 12a. Similarly, the operator often walks on freshly sprayed area bear footed. Figure 12b shows typical protective attire recommended in pesticide and herbicide applications.
3.3.5 Soil fertility management Cultivation of rice in Uganda is influenced by site-specific factors like the available nutrients in the soil. Most farmers claimed that intensification of rice cultivation reduces soil fertility over time. Indeed, 51.8% of the farmers in the districts surveyed, reported decline in fertility of their soils. The declining yields obtained by farmers strongly attest to this claim. The survey also showed that most farmers started rice cultivation of recent; hence only 12.6% apply inorganic fertilizer, with the most common explanation being that fertilizers are not worthwhile because their soils are still fertile, (40%). In addition, low fertilizer use was also linked to their high cost, inaccessibility and to farmers’s ignorance about fertilizer role and its application. Among the fertilizers (i.e DAP, SSP, UREA and MOP) commonly used, Diammonium phosphate (DAP) and Urea are the most frequently used. A significant number of farmers (56.5%) however, carry out soil enrichment using organic residues such as chicken refuse, rice straw, and cow dung, and 11.8% apply both organic and inorganic sources. Regarding the time of fertilizer application, responses widely varied; with the majority applying DAP at planting time and urea 30 - 40 days after planting. Farmers had different application rates but the majority (62.9%), are applying insignificant quantities ranging from 10-20 kgs/ha indicating that the majority have little knowledge about fertilizer use. The time and rate of application are critical in exploiting the yield potential of rice. Most of the respondents expressed need for training on rice input use. Besides, the importance of fertilizers in increasing rice yields needs to be demonstrated. Table 4: Fertilizers used by farmers
Fertilizer type applied Frequency Percentage Inorganic 106 12.6 Organic 481 56.5 Organic + Inorganic 101 11.8 None 163 19.1 Total 851 100
3.3.6 Rice pests and their management Pests are among the most serious constraints to both law-land and upland rice production. They are very difficult and costly to control, and if not effectively controlled, can cause considerable loss in crop yield, quality, and market and nutritional value. Out of the 1375 individual farmers interviewed, 97.3% acknowledged that they were experiencing problems with rice pests and diseases attacking their crop, particularly birds and rodents as shown in Figure 13.

28
Birds chew, squeeze and feed on the grains in the milky stage of the crop. The damage shows milky white substance covering the grains. At grain maturation, birds remove entire grains. Birds also perch panicles resulting in crop lodging.
Figure 13: Common pests in rice fields The study identified several bird control techniques that were being used by farmers, amongst which were:
• Physical chasing, shouting and scaring off, (83.5%); • Beating sonorous bodies like tins and jericans to scare off birds, (5.8%); • Poisoning and trapping (1.2%); • Use of scare crows (1.3%); • Use of tapes that make whistling sounds around rice fields, (0.6%).
Despite all the above attempts by a majority of farmers, 7.7% of the farmers surveyed said they completely did nothing about the problem of birds in rice.
In rice fields, rats directly feed on rice and other seed. They pull up germinating seeds and cut or pull up transplanted seedlings. Tillers are also usually cut and chewed. Other serious rice pests cited by farmers included termites, stem borers, cut worms, grasshoppers and caterpillars. These too cause serious loss and damage to rice crop. Their prevalence varies from district to district. Losses on rice crop due to pests have yet to be quantified in Uganda. Stalk eyed fly larvae Stem borer Leaf folder
Figure 14: Other important pests in rice

29
3.3.7 Rice diseases and their management Besides pests, rice diseases were also reported among the priority constraints. The effect of rice diseases varies from district to district. Kamwenge, Kibaale and Lira districts reported the lowest rice disease prevalence. The common diseases, in order of importance, include: rice blast, brown spot and sheath rot in upland rice, and rice yellow mottle virus in lowland rice. Field findings indicate urgent need to sensitize and train farmers on rice diseases common in the various regions of Uganda, on their effects on crop and on methods for their management.
3.3.8 Droughts and floods in rice farming Droughts and floods are among the major constraints to rice production. A large portion of the Uganda’s poor farmers depend on rainfed agriculture where the water supply is unpredictable and droughts common. Flooding is a problem to a larger extent in lowland rainfed rice, grown in valley bottoms and flood-plains with varying degrees of water control, whereas drought may affect both upland and lowland rainfed rice. Farmers interviewed expressed several approaches with which they coped with the two problems of drought and floods. Regarding drought, a majority of the farmers (51.5 %) said they had remedy for drought, this being a natural occurrence beyond their control. Another 17.1% said the problem did not apply in their case. This leaves the productivity of 68.6% of our rice farmers prone to drought which may result in total crop loss depending on the stage of the crop the drought occurs. However, 22.9% of the farmers ensured that they strictly followed the seasonal calendar and planted early to take advantage of the early rains. In the lowland rainfed rice, 3.6% of the farmers made bunds and dug up channels to direct water from other sources to their rice fields, whereas 1.9% pumped water from other sources into their rice gardens. This strategy was observed mainly at Olweny Rice Scheme in Lira District. Some farmers especially those engaged in upland rice growing had other ways with which they coped with drought. 0.5% shifted the rice fields to the lowlands to take advantage of better moisture regimes in the valleys and another 0.2% mulched their rice gardens to conserve available moisture. Regarding floods, 46% of the farmers interviewed said the problem of floods did not apply in their rice farming because the majority of them were upland rice growers. Another 28.8% were helpless and had no copying strategy for floods. In the rainfed lowlands however, three flood copying strategies were put forward:
Construction of drainage channels and cleaning of the main drains (21%); Pumping out of excess water (2.6%); mainly at Olweny; Blocking off water entry points (1.1%); Timely farm operations (0.6%), e.g early or late planting escape windows of
severe floods

30
3.3.9 Position of rice in crop rotation Crop rotation is a system in which different crops are grown in succession and in definite sequence on the same land. Evidence indicates that crop rotation influences plant production by affecting soil fertility and survival of plant pathogens, physical properties of soil, soil erosion, soil microbiological composition and prevalence of nematodes, insects, weeds, earthworms and phytotoxins (Summer, 1982). From the survey, 40.9% of the respondents rotated rice with other crops, 35.7% cultivated rice after fallowing their land and the remaining 23.4% did not practice any rotation or fallow. The findings showed that of the rice farmers who practiced rotation, rice came after leguminous crops (44.7%), after cereal crops (41.3%), after root crops (12.4%), after oil crops, sesame or sunflower (0.98%) and after vegetables (0.24%). Amongst the reasons presented by the farmers for practicing rotation were:
• Improving soil fertility through soil-nitrogen fixing capacity of some crops, • Effective utilization of residue as compost fertilizers in the rice fields, • Conserving soil moisture and maintaining low soil temperatures, • Reduction on seasonal pressure exerted by inadequate farm land, • Control pests, diseases and weeds, • Increasing yields due to improved fertility and lower pest/disease pressure, • Food security since a diversity of food crops are grown, • Reduction in time and labor costs that would be incurred in opening unused
land, preparation of good seedbeds that are easy to manage. More detailed discussions indicated inadequate knowledge among farmers and even some extension service providers regarding the best rotation both for upland and for low-land rice systems. Similarly, crop associations and intercropping options in rice systems were also not very clear especially for upland rice. These areas calls for research guidance. 3.4 Rice Processing Practices including ph/machines and equipment 3.4.1 Postharvest loss-levels Based on the survey findings, the normal sequence in the handling of rice crop after it matures is harvesting and threshing, preliminary cleaning, transporting home or to a drying yard, drying, cleaning of the dried crop, storage, milling, and/or distribution to the market or retention for farm family consumption (Figure 15). Severe loss can occur when traditional methods of rice handling are used. Studies conducted in several South and Southeast Asian countries (Chandler R. F, Jr 1979) reveal that 13 to 34 percent of the crop is lost during harvest and postharvest operations: during harvesting and threshing, 5 to 15 percent; in processing (parboiling and milling), 3 to 7 percent; and during handling and transportation 1 to 3 percent. Other important losses are grain quality deterioration, under-utilization of by-products, and financial losses due to inefficient postharvest operations. In Uganda, these losses have yet to be studied. However below is a non-quantified analysis of the nature of such losses as reported by the farmers met during the

31
Harvested crop from farmers
Threshing and Cleaning
Drying and cleaning
Milling and Polishing
Rice storage as paddy
Distribution and Marketing
By-products of rice: Husks Bran Flour Starch Beverages Oil Glue Paper
survey, with proposals on the means by which farmers, millers and government agencies can increase the efficiency of all phases of rice handling from harvesting to final delivery to consumers.
Figure 15: A schematic diagram of the postharvest system for rice in Uganda
3.4.2 Harvesting The chief consideration in harvesting is the degree of maturity of the grain, normally determined by measuring its moisture content using an appropriate moisture meter, the optimum harvest moisture for rice being 21 – 24% wet basis. Under tropical conditions this point is generally reached 28 - 32 days after flowering. If the crop is allowed to stand in the field after optimum maturity, severe losses occur both in the field and during milling. As recorded during the survey, considerable amount of grain simply shatters and falls to the ground before it is harvested and particularly during rains or hot weather. Birds and rodents (the most notorious loss agents in rice farming in the country) take their share of the ripened grain, while domestic and wild animals may stray into the fields causing further damage. Additional losses come about during the harvesting process itself, because the grain is so loosely held on the panicles. The problem is aggravated by the poor traditional harvest method based on the rudimentary hand-held sickle, a tool used in rice harvesting by 55.7% of the farmers interviewed, with 33.8% of the farmers report using hand-held knives. Harvesting itself is done by cutting the rice at stem base or middle 54.1%, and head cutting at 43.3%. The survey also established that rice harvesting is dominated by women (over 85%) while children play a disproportionate role in bird scaring (over 90%), to the extent that in some districts they are “detained” in bird-scaring tasks at the expense of participating in the current “universal primary education” program by government.
3.4.3 Threshing and cleaning After harvest, rice is immediately threshed in the field. This is currently done by beating the harvested crop on tarpaulin or plastic sheeting (63.1%), beating the crop on bare ground (8.9%), against a log, drum or special wooden frame/rack
32
(4.7%), or by some conventional threshing machine (2.5%). The poor traditional threshing and later drying methods are responsible for the heavy contamination that the crop usually suffers: from soil, sand and small stones, snail shells, weed seed, straw, and immature and unfilled grains. This extraneous material has to be removed to raise the final grain quality and market value. Of recent, farmers or farmer groups have started accessing the services of mechanical rice threshers either imported or locally manufactured. The Agricultural Engineering and Appropriate Technology Research Institute (AEATRI) in partnership with several private sector workshops and Sasakawa Africa Association (Uganda), have developed several portable rice thresher prototypes currently being fabricated by several local private workshops in the country. The advanced ones of these models employ a vibrating screen with large openings to remove any particles bigger than the rice grain, a second screen with small openings to separate out particles smaller than the rice grain, and a blower that forces air through the falling paddy to remove chaff and other lightweight materials. Such equipment (Fig 16), significantly reduce the drudgery from the process, save time and reduce losses and contamination from foreign materials.
Figure 16: Field testing of rice thresher &rice equipment fabrication at NVTI Although the developed rice threshers (Fig 16) require significant capital investment, their operation cost is rather low. Small portable threshers powered by 5 -7 horse power petrol engines may use 1 liter of fuel per hour, handling 550 - 650 kgs of threshed fresh paddy. SG-2000 Uganda in partnership with the Japan-aided Nakawa Vocational Training Institute (NVTI), in Uganda have also embarked on the training of artisans in the fabrication of a range of postharvest equipment including those for rice. Linking this initiative to the private sector could effectively contribute to the growing demand for rice equipment in Uganda.
3.4.4 Drying The moisture content of paddy is important from the time it is harvested (at between 20 – 24% w.b) until it is milled. Open sun drying was the only traditional rice drying method encountered during the survey, with drying mechanisms ranging from spreading the crop thin-layer (2 – 3 cm) on firmed ground (13.3%), on plastic sheeting (mainly tarpaulin) or bed-sheet, woven mat etc (61.1%). In large scale rice production units such as those at Olweny, Doho and Kibimba rice schemes, formal

33
58
16 14.89.6
2.4
0
10
20
30
40
50
60
Perc
enta
ge o
f far
mer
s
Bitingbetween
teeth
Changes inpaddycolour
Number ofdrying days
Rubbing between
hands
Other
Farmers' moisture test methods
drying concrete floors were encountered. At Olweny and Doho farmers around the scheme who are members of a rice farming group, accessed the drying facility free of charge. Although the open-sun drying method increases the percentage of broken grains during milling, it is inexpensive and will therefore continue to be a major drying procedure in Uganda for sometime to come. Using open sun drying, the crop is manually raked several times a day to ensure uniform drying. It is however vital that farmers’ use of tarpaulin (Figure 17), or equivalent sheeting for drying be intensively promoted if rice quality in Uganda is to improve. Paddy should be dried soon to prevent deterioration, however not too fast to result in the development of internal cracks which would cause serious breakage of the grain during milling.
Figure 17: Typical improved rice drying on tarpaulin sheeting Optimum milling moisture levels for paddy is 13 – 14%. Most of the farmers clearly reported their ability to estimate the correct moisture level in rice (Figure 18), through biting the grain between their teeth (58%), using changes in grain texture and colour to brown-yellow (16%); counting number of drying days (depending on intensity of the sun) (14.8%), and rubbing the grain between hands or mere walking on the grain (9.6%). However, discussions with rice millers raised a concern on paddy coming from farmers normally being of high moisture content, up to 16 – 17%. This calls for simple moisture meters to be availed at farm level as part of the general drive to improving rice quality.
Figure 18: Traditional rice moisture testing methods

34
Several literatures (Chandler R. F., 1979) caution of some otherwise desirable features of modern rice varieties that make their drying process more complicated. The new varieties often have shorter growth durations than traditional varieties, so ripen in the rainy season when sun drying is difficult. Furthermore, a number of modern varieties do not have seed dormancy and sprout soon after harvest if allowed to remain wet. To surmount these problems and others, as Uganda moves into rapid adoption of rice growing, millers or farmers in groups will have to consider initiating use of simple and yet effective mechanical dryers that incorporate a blower to force supplemental heated air through the perforated batch floor and up through the paddy lying on it. The heat can be supplied from rice straw, rice hulls which are often in abundance at rice growing and milling sites; or from wood, charcoal, or solar energy collectors. The decision as to what fuel to use will depend upon availability and costs in the area where the rice is being dried. These dryers may consist of a wooden, brick, concrete, or metal box with a perforated floor. They can be simple to construct easy to operate and relatively trouble free. While there are other factors to be considered than those pointed out here, nevertheless it generally is to the farmer’s advantage to do the best job he can in drying and cleaning his paddy before s/he delivers it to the buyer.
3.4.5 Rice milling The basic objective of a rice milling system is to remove the husk and the bran layers, and produce an edible, white rice kernel that appeals to the customer: is sufficiently milled with maximum total milled rice recovery out of paddy, with a minimum of broken kernels and free of husks, stones, and other non-grain materials. Literature on rice milling (Chandler R. F., 1979, WARDA 2004) report most rice varieties as consisting of roughly 20% rice hull, 11% bran layers and 69% starchy endosperm also referred to as total milled rice, containing whole and broken grains. The by-products in rice milling consist of fine-broken grain, rice hull, rice germ and bran layers. Traditional rice milling in Uganda involves pounding paddy in a wooden mortar to remove the husks followed by cleaning the grain using a winnowing basket. Studies in the six districts have shown the method’s application only in some remote areas inaccessible to modern rice mills and only for small quantities of rice consumed within the household. Though simple, the method is tedious, has very low out-turn, and results in high breakages of rice kernels and in incomplete removal of the husks. Where available, rice farmers have rapidly moved into using motorized commercial mills for their better operations and efficiency. In such mills, husk and bran are removed separately and brown rice is produced as an intermediate product. This is further polished to obtain white rice with bye products discharged through separate outlets of the machine. Figures 19a/b, show examples of common rice mills used in Uganda, simplest to the most sophisticated. Though some of these are locally fabricated, majority of them (diesel or electrically operated) are now imported. As can easily be seen in the figures, hygiene levels and general management of some of these facilities call for serious improvements.

35
Figure 19a: Typical locally fabricated rice mills used in Uganda
Figure 19b: Typical imported medium and large size rice mills used in Uganda 3.4.6 Rice milling products and bye products Edible products of rice milling
Rough rice: This is paddy rice as it comes from the field. Rice kernels are still encased in their inedible, protective hull which has to be rubbed off (husked) and separated through an air blast to obtain brown rice.

36
Brown rice or husked rice: This is the least processed form of rice. It has the outer hull removed, but still retains the bran layers that give it a characteristic tan colour and nut-like flavor. Brown rice is edible and actually has higher nutritive value than polished rice, but possesses a chewier texture. Its cooking time is also longer than that of milled rice.
Milled rice: white rice is obtained after rubbing off the bran layer and germ from brown rice and blowing off the bran by air ventilation. This process usually takes 2 to 3 cycles within a milling machine, depending on the required milling degree. To improve on quality, milled rice (a mixture of different sizes of whole and broken rice grain) are separated into grades using appropriate sieves ready for storage or marketing and consumption.
Bye products of rice milling and their uses Besides consuming with main courses, rice and its parts have various other uses. The edible and non edible parts that go through the milling process could be transformed into some of the following suggested products:
Rice husks: Over 90% of the rice husks in the major rice growing countries of Asia are utilized as fuel (either directly or in briquette form), for commercial rice mill steam generators. In Uganda no use is presently made of rice husks. In a contrary, it is just left as waste which could be an environmental hazard around the mill. The immediate option at smallholder level is to use the husks as a source of fuel using simple cooking stoves now available in open market.

37
Rice bran and rice oil: The bran is the most nutritious part of rice and provides a good natural source of vitamin B. Approximately 30-40% of the rice bran in the major rice producing countries of Asia is used to extract high quality cooking oil that is known to decreasing blood cholesterol levels in humans. The remaining 60-70% of the bran is utilized in animal feed production, a practice that Uganda is gradually adapting.
Broken rice Of the total milled rice that Uganda currently imports annually, 45% may be classified as “broken rice”, coming in due to its low cost. Though such broken rice grain is (in Asian countries) normally turned into instant noodles and snacks, in Uganda it is used as direct human food. In highly efficient milling machine, 26% of the yield will be broken rice, with the remaining 39% whole head rice, 11% bran, and 24% husks. Rice flour and rice starch Uganda has started processing some of its mainly broken rice into rice flour and rice starch. In developed countries such by-products are used to produce rice pasta, chips, and other snacks, as well as breakfast cereals. It could also be a substitute for wheat flour products. Rice starch is also used as a thickener in making sauces, desserts, and sweet syrup. It contains the endosperm of grain, which makes up approximately 92% of milled rice weight (dry weight). Rice straw According to the recent survey, rice straw in Uganda is generally left in the fields. Elsewhere the product is popular as a medium to grow mushrooms and as a raw material for animal feed. A considerable percentage is also used in paper making, and the rest is burnt away in other food production processes. Rice used in beverage making Many alcoholic beverages include (rice) wine and beer may be made from rice (i.e. broken rice). Rice paper The pith of rice stems is used to make rice paper. This type of rice product is particularly used in cigarette wrapping and some used in wrapping candies. Rice glue Rice glue is made by dissolving a proportional ratio of rice in boiling water. 3.4.7 Handling, transportation and storage Rice handling follows immediately after harvesting the crop. The survey in the six districts of the country, cited handling and transportation among the most labour intensive and time consuming operations in rice production. The operation is usually done by women, carrying head loads of some 30-50kg of the harvest per trip. Where men’s participation comes in (Figure 20), bicycles are used. These carry

38
loads of some 70 – 100 kgs per trip, which is still rather low considering the bulky nature of the crop especially at harvest. Both head and bicycle loading can particularly be taxing in swampy and wetland situations associated with low-land rice production. More energy enhancement options include using work animals. Donkeys can, in average carry loads 50-75kg, and up to 100kg on good terrain. A pair of trained oxen using a cart can carry 500kgs on ragged terrain and up to 1000kgs on flat terrain.
Figure 20: Rice transportation by head loading, bicycle and donkey After threshing, the fresh paddy, preliminarily cleaned, has to be transported to the drying yard either at the farmer’s homestead or else where. This is equally difficult. During the drying phase that may last anything up to 5-7 days depending on weather conditions, the crop has to be carried several times between the drying yard and shelter till it is safely dry. This is almost totally the role of women and children. It was strange to note that even in Agwata and Barr sub-counties (Lira district), and Buyanga sub-county (Iganga district) both of which predominantly use work animals, use of sledges or ox-carts or were not encountered, reportedly due to the high cost of carts. Transport to rice mills and eventually to market places may be by head carrying, bicycle or hired motorized vehicle depending on the crop volume. Rice storage, at different stages of handling is either in small household containers or using nylon bags. 3.5 Status and Trends in Rice Marketing The bulk of rice grown in Uganda is typically produced by smallholder farmers. However, unlike most of the food crops grown to satisfy household consumption and food security requirements, rice is consumed more in urban areas, where it is one of the major foodstuffs in homes, schools, hospitals and the army. Rice is also increasingly traded in the region to Kenya, Rwanda and the Eastern part of the Democratic Republic of Congo (DRC). Unlike low-land rice, the costs of production for upland rice are much lower due to extremely high labor costs in low-land rice cultivation. This implies that increased upland rice through improved acreage and/or yields will result in much lower cost of production and better profit margins to farmers. Nearly three quarters of the rice produced on the farm is marketed. The share of marketed output was in the range of 62.9% in Kiboga, to 76.9% in Luwero districts. Rice is regarded as a food security crop so it is a vital supplement to families where family size is relatively large. Figure 21 shows the details of proportions of market rice by households in the districts surveyed.

39
Lira, 74.30%
Luwero, 76.90%
Iganga, 73.30%
Kibaale, 74.60%
Kiboga, 62.90%
Kamwenge, 76.40%
Figure 21: Share of farmer-marketed rice by district Given various characteristics and constraints in rice marketing, markets do not function in the best interests of all the participants resulting into market segmentations with very restricted active participants. Apparently, a small volume of rice produce is marketed together with other crop commodities. Respondents reported poor access to markets, which are also, characterized by long distances, limited information flows and inadequate transportation means. The rice marketing outlets can be categorized into three main stages namely primary, secondary and tertiary. The primary stage involves farmers, rural traders/processor agents as the key players. The secondary stage consists of processors and urban traders, while the tertiary stage consists of urban traders and importers. Different market outlets charge a variety of prices, which differ a lot depending on processing, quantities offered, distances, and other factors. These factors tend to constrain efficient market exchanges among rice market participants. Farmers are compelled to pursue diversified production strategies to spread risks, thus resulting in small trading crop volumes. The primary stage of marketing involves transactions and negotiations between the farmers with either rural traders or processor agents. Most often, farmers with small acreages (usually less than 0.5 hectares) sell paddy rice to either rural traders or processors’ agents who collect it from their farm stead, while farmers with landholdings of more than 0.5 hectares transport the paddy to the mills and mill the paddy prior to actual sale. It should be pointed out that while the incidences of rice farmers selling processed rice was more common in Eastern Uganda, in the case of Northern Uganda the farmers typically sold paddy at farm gates. The rice farmers in Northern Uganda attribute the sale at the farm gates due to insecurity fears, inaccessible road networks and high transport costs to the nearest milling centers. This stage is characterized by very minimal competition and the price paid to the farmers is often very low. The main constraints observed include the following: • Limited competition, thus weak bargaining position for farmers. • Inadequate market information • Inadequate post harvest knowledge and handling • Inadequate storage facilities • Lack of grading systems. • Poor road networks, which are inaccessible during rainy seasons.

40
At the secondary stage of marketing, processing takes place. Rice mills are most often located in trading centers of the main rice growing districts. The mills are also marketing centers where negotiations and deals are concluded between rural, traders’ processors and urban traders. This stage involves mainly assembling of milled rice and storage as well as selling of processors to the urban traders. Large scale farmers often prefer to absorb transport costs to milling centers and pay for milling charges prior to selling their rice. Also, rural traders who collect threshed rice from farmers typically mill it prior to actual sale to urban traders. A decision by these farmers to incur transport and milling expenses is weighed against the additional benefits accruing from final sale of the milled rice. Otherwise, it could be uneconomic for farmers to engage in such activities, especially where transport costs and milling charges are relatively high. This stage reflects relatively minimum level of competition amongst the urban traders, although entry is limited due to high capital requirements. The main constraints noted at this stage include: • Inadequate storage facilities. • Limited entry due to high capital requirements • Unreliability and seasonality of milled rice supply • Price fluctuations • Lack of grading equipment • High collection costs The tertiary stage involves large-scale urban traders who are mainly wholesalers and importers who either purchase the milled rice from the processors and farmers on one hand, or import it. These traders are mainly based in Kampala while a few are from other urban enters. Apart from actual purchase of the milled rice these urban traders often engage in rice cleaning, consolidation and bulking. It is after this process that milled rice is passed to retailers for sale to consumers. Due to large capital requirement these are traders at this level. The main constraints found at this stage include:- • Limited entry that affects the level of competition • Unreliability and seasonality of milled rice supplies • Limited storage facilities • The large operators deem it have adequate storage capacity. • Price fluctuations. Unlike at the major rice schemes found at Olweny, Doho and Kibimba that have milling plants, other rice growing areas including in the Northern Uganda have rice mills located in the main trading centers, with varying distances from the rice farmers. 3.6 Factors, influencing adoption of rice production The study shows that the adoption of rice was influenced by a number of factors, the main ones of which are: access to farm credit,

41
Access to credit by the rice farmer positively influences the probability of adoption of rice, implying that credit in all forms is an important contributor to success in technology adoption. There are attributes of rural credit that currently make access to financial resources especially in the rural areas. First, the high cost of borrowing and unavailability of long term finance are perennial complaints among Ugandan rural farmers and businessmen. Respondents indicated that in recent times nominal shilling interest rates have been as high as 24% making it very expensive for the poor farmers to access the loans. Generally, lending to small rural farmers in Uganda is seen as a risky lending business due to the fact that farmers are more likely to default on loans as a result of non-performance of the agricultural enterprises. The second problem is associated with lack of adequate availability of rural loan sources thus discouraging access to loans by the rural farmers. Thirdly, the loan schemes that are available to rice growers are short-term and maturing in the range of one week to three months. The higher amount of loan maturities averaged less than three months. Since rice matures and is harvested in a period greater than three months, rice growers were reluctant to take up the loans since they would not have earned any income before the loans mature. Consequently, the rural farmers lack adequate financing which negatively affect the viability of their rice farming businesses and competitiveness. Level of organization by farmers. The study shows that members to farmers’ organizations and frequency of extension visits are two factors that positively influence the probability of adoption of rice in the study districts. This is perhaps due to the advice and expertise that farmers obtain regarding what rice varieties to plant, when to plant, method of planting or other agronomic information such as spacing requirements, from these media. Membership to organizations is also critical to extending information more cheaply to farmers since information sharing is the norm adapted by these organizations. Membership to farmers’ organizations was very significant as 72.4% of the farmers interviewed belonged to one or more farmer organizations. Timely access to rice seed and other inputs: is very critical in influencing the probability of adoption by farmers. Since specific varieties such as NARICA 3 and SUPERICA 2 had a number of competitors, it is the case that whenever RICE seed in unavailable, farmers grew other crops mainly maize to avoid late planting. Despite the high demand for rice seed among farmers, there is currently an alarming problem of inadequate supply of rice seed in rural areas. This shortage is partly attributed to poor infrastructural development in rural areas. A well functioning infrastructural system is vital for efficient trade in agricultural inputs because where good infrastructure exists in form of roads or railway systems, movement of products from initial production to consumption centers is faster and smoother thus reducing transaction costs. The poorer the infrastructure, the more likely the wide variations between purchase and selling price for the same commodity. Although Uganda has had much progress in improving main roads, feeder roads, maintenance and administrative efficiency, further action is required in construction of community access roads to ensure smooth flow of inputs within rural areas remotely located outside the city. Household size matters in the determination of the probability of adoption of rice or not among the respondents. Rice is a non-traditional annual crop grown almost exclusively by small-scale farmers, and is used for both home food consumption

42
and income generation. It is an important part of the country’s farming system being grown in pure stand, inter cropped, and in association with other crops. Iganga and Lira districts usually accumulate surpluses of rice and are able to trade in rice in deficit areas within and outside Uganda. Locally, rice ranks high as a food security crop among the districts that have taken up the upland rice growing enterprise. About 75% 0f the households surveyed keep over 25% of the total harvested rice at home for future home consumption. Moreover, those households that over 8 members kept an average of 41% of the harvested rice for future consumption. Size and quality of cultivatable land positively influenced the adoption of rice, implying that land availability is critical in adoption of rice. This is perhaps because land availability increases the flexibility of the farmers’ allocation decisions when new technologies arrive. Labor availability is also another factor that influenced the adoption of rice. This is because crop technologies require ample supply of labor to become more productive, thus labor availability is critical in adoption of rice. Apparently, all the respondents interviewed indicated that rice field management practices are very laborious. The most critical needs of labor are in land preparation (since two-three times are required for ploughing), planting (since making furrows with local materials such as sticks is very tedious), weeding (about two-three times are required for weeding), and bird scaring (if birds are not scared, total loss is experienced, and so far no effective alternative control methods are available). The region dummies are location-specific variables that have potential for influencing adoption. The results show that the regional variables are positive although the Eastern and Northern region (Iganga and Lira) dummy variables are significant and positively related to the adoption of rice. However, the probability of adoption significantly decreased if a farmer was located in the Central and Western region districts. Such results explain a number of possible reasons largely associated with access to services required for successful rice farming. Such services may include infrastructure, extension services, credit availability, and input supply. Other reasons are could be associated with availability of equally profitable enterprises whereby farmers can quickly resort to those other enterprises. Other important factors that influence adoption of technologies include, farmer’s education level, intensity and effectiveness of extension service provision, availability of labour, proximity to markets, etc. 3.7 Gender in rice production Women have customarily played a major role in rice farming systems, particularly in Asia and Africa where prevailing cultivation practices demand heavy manual labour input (Jennie D., 1984). However, research programs and development projects have often inadequately taken these roles into account. The consequences have often been detrimental not only to the economic security and social status of the women themselves and their families, but also to the success of these programs and projects in meeting national or regional development objectives. The survey did examine the different aspects of women’s role in rice production, processing and marketing in Uganda and their implications for expanding production and raising productivity and incomes. The main issues included:
43
0
10
20
30
40
50
60
70
80
90
100
Clearing
Ploughing
Planting
Weeding
Fertil
izer a
pplicatio
n
Spra
ying/p
est management
Bird sc
aring
Rodent contro
l
Harvestin
g
Thresh
ing
Transp
ortatio
n farm
to home
Drying paddy
Stora
ge
Transp
ortatio
n to m
arkets
Hulling/m
illing
Marketin
g
Farming operations
Labo
ur c
ontri
butio
n by
gen
der (
%)
Women's v iew on women Women's v iew on men Men v iew on women Men v iew on men
Gender labour division in rice production, processing and marketing, Intra-house distribution of resources for rice production and sharing of proceeds
from the rice enterprise, Appropriateness of rice technologies being developed to the needs of both
men and women, Gender access to extension services including training and information sharing.
The survey found a clear sexual division of labour between rice farming operations as shown in Figure 22. Men were mainly responsible for land preparation, ploughing (in the case of low-land rice), raising nursery beds, fertilizer and pesticide application, milling and marketing. Women on the other hand, were mainly responsible for weeding, bird scaring (where children go to school), harvesting, transporting the crop home and drying it. Activities almost equally performed by both women and men included tilling the land (incase of upland rice), storage of the dried crop. Information obtained through women’s and men’s perceptions as regards division of labour in rice production is shown in Figure 22 and details by districts are shown in Annexes 5a and 5b. It was noted in most of the districts that men’s close presence strikes in with their keen oversight on most of the postharvest processes. After the crop has dried, men almost exclusively take over the responsibilities of milling and eventual marketing of the crop. Whereas, overall the women may have greater input on rice production in terms of labour, the sharing of proceeds from the crop usually disproportionally goes to the men. Quite often, the woman may not even know how much money was earned from the sales of rice, neither will she know the utilization avenues for such proceeds. Of course, the best of the husbands may explain in general terms, how some of the proceeds are to be allocated to school fees, food, household items and to procuring the wife a dress especially during big days, e.g. Easter, Xmass.
Figure 22: Labour contribution in rice farming operations by gender

44
22
17
12
10
8 87
5 5
21 1 1
0
5
10
15
20
25
Payin
g fees
H/hold ite
ms & esse
ntials
Food se
curity
Build
ing house
Clothing & beddings
Buying
livesto
ck
Buying
food
Buying
land
Medical bills
Buying
bicyc
le/moto
rcycle
Recrea
tion &
enterta
inmen
t
Hire la
bour
Boostin
g busin
ess
Benefits
Perc
enta
ges
(%)
3.8 Rice Effects on Livelihoods and Farming Systems
3.8.1 Rice effects on livelihoods of farmers Rice farmers’, processors’ agro-input dealers’ livelihoods depend on their capacities and assets (natural, physical, financial, social, and human) rationally applied through activities required for their means of living, including off-farm employment. These include activities to improving household incomes, health, education and nutrition particularly for children and breast-feeding mothers. They also include access to land, capital, and shelter and to means of transport. According to 22% of the rice farmers in the six districts surveyed, rice farming has first and foremost, helped in the education of their children through being able to pay school fees and provide basic educational requirements to the children. This is vital contribution in the shaping of a life-long future for the next generation. Seventeen and twelve percent of the farmers respectively reported using proceeds from rice farming to acquire household items and essentials and for enhancing household food security. The other benefits (Figure 23) included improvements in shelter (10%), clothing and bedding (8%), as well as buying food (7%), expanding farmland (5%), paying medical bills (5%), acquiring improved means of transportation, recreation and entertainment, hiring farm labour and boosting income generating businesses.
Figure 23: Benefits from rice farming as reported by farmers

45
3.8.2 Rice effects on livelihoods of processors Majority of rice processors interviewed were operating rice mills which were either locally made or imported and sold in Uganda. The capacities of these mills ranged from about 10 to over 50hp in average. The mills mostly used electric power for their operation with a few using diesel. The major complaints by millers included high cost of power, very unreliable electric power supply, expensive mill spares and difficult to access; high taxes, and low milling capacities. Despite these problems, 91.7% of the millers interviewed indicated they were benefiting from the milling enterprise and that their future plan is to expand rice processing. Asked in which way they benefited from the enterprise, majority cited the following benefits:
• Being able to pay school fees for their children at different education levels, • Build a new permanent house or/and buy more land; • Expand storage facility at the mill and also buy a new and bigger mill; • Procure large quantities of paddy from farmers and mill and market the
milled rice themselves • Buy a vehicle to ease transport of paddy and of the milled product; • Able to meet medical bills, buy clothing and bedding for the family;
From the above, it was evident that, like farmers, rice processors had positive benefits from rice milling as an enterprise.
3.8.3 Rice effects on livelihoods of input dealers The survey in the six districts did reveal that there were no input dealers specifically handling rice inputs alone. Most of the input dealers handled general agricultural inputs such as seeds, herbicides, pesticides, fertilizer, knapsack sprayers, etc. It was therefore difficult to assess the benefits input dealers accrued through selling rice inputs. However the results indicate that 100% of those input dealers interviewed want to expand their business including the input specifically for rice. One can therefore infer that majority of the input dealers should have got some benefits from selling rice related inputs.
3.8.4 Rice effects on farming systems The survey found both positive and negative effects of rice farming on farming systems. The positive aspects include: ♦ Rice residue and by-products providing feed for livestock, ♦ Rice residue contributing to soil fertility enhancements, ♦ Land and livestock acquisition through rice proceeds, ♦ Increase in production of other crop through proceeds from rice, (inputs, labour,
land, etc) ♦ Crop/enterprise specialization trends spearheaded by rice Negative aspects include:

46
♦ Labour competition: rice and other crop enterprises, ♦ Labour competition: rice and livestock enterprises, ♦ Reduction in land for other crops in favour of rice, ♦ Reduction in grazing land in favour of that for rice, ♦ Reduction in number of other crop enterprises in the farm. Regarding the environmental effects, rice production was noted to have had the following effects: ♦ Indiscriminate clearing of farmlands to give way for rice, ♦ Improper use of rice chemicals impacting on the natural environment through
water and soil pollution, ♦ Indiscriminate disposal of rice mill wastes resulting in pollution, hazard to health,
and is a major habitat for rodents, snakes and weevils.

47
Women group in Kahunge S/c Men group in Mahyoro S/c
4 CONSTRAINTS AND CHALLENGES IN RICE PRODUCTION, PROCESSING AND MARKETING
4.1 Constraints of rice farmers Most of the rice farming constraints in the six surveyed districts were rather similar, and were mainly in rice production, processing and marketing. The constraints were obtained during individual household interviews and focus group discussions in each of the six surveyed districts. Farmers in each of the focus groups (e.g. Figure 24), discussed each of their constraints in detail and prioritized them in a participatory manner. The aggregated priority constraints for all the six surveyed districts are shown in Table 5, while the priority constraints in rice farming by districts are shown in Annex 3. Likewise, farmers’ constraints through individual household interviews were separately processed (Annex 4), and found to tally very closely with those obtained from focus group discussions.
Figure 24: Farmers in focus group discussions
4.1.1 Inadequate knowledge on rice farming Since rice is a new crop in the farming system of the surveyed districts, inadequate knowledge in activities pertaining to rice farming enterprise was reported as the most severe constraint facing rice farmers. This situation is worse in the districts of Kiboga, Kibaale, Lira and Iganga. Although rice is also a new crop in Kamwenge and Luwero districts this problem had been relatively less severe. This may be attributed to the significant amount of rice trainings that the two districts have attained through the efforts of various government agencies and NGOs. Herbicides and pesticide use; post harvest handling, processing and marketing; pests, diseases and soil fertility management; irrigation and water harvesting skills were the main training needs raised by farmers. The inadequate knowledge in post harvest handling and processing is directly affecting rice processing at the mills. All the rice processors interviewed reported that one of their biggest problems is the supply of low quality paddy by farmers: either wet, over dried or contaminated with foreign matter especially stones. The poor quality paddy results into low quality milled rice thus difficult to market.

48
4.1.2 Labour intensity in rice farming Strenuous and laborious rice farming operations was reported by all the surveyed sub-counties. It was the second most severe constraint inhibiting expansion of rice production. Ploughing, planting, weeding, harvesting, threshing and transportation were cited as the most strenuous and laborious operations. Women, who are the main labour providers in farming, reported planting, weeding and harvesting as their biggest labour constraint areas in rice farming. According to farmers the situation is aggravated by lack of appropriate rice farming tools, implements and equipment. Besides, the equipment available are often too expensive for the average farmer. Most farmers depend on rudimentary, labour and time consuming hand tools such as hoes, slashers, sickles, axe, etc for various farm operations. As a coping strategy, farmers in districts like Lira and Kamwenge pool labour among themselves and work in members’ fields in turns. In a number of districts children are forced to miss classes to contribute to household labour. Most farmers are however forced to open small size rice plots (1 -2 acres) that are within their family labour capacity. Most farmers reported “working extra hours” as the main copying strategy towards the labour problem, however at the expense of their health.
4.1.3 Lack of capital for rice farming Farmers in all the surveyed districts cited lack of capital among the priority constraints in rice farming. Although micro-finance institutions were reported as operating in all the surveyed districts, very little opportunities existed for farmers access farm-credits through these institutions, hence the unfelt impact of credit in rice farming in all districts surveyed. Most farmers reported that the policies, interest rates and other terms that most financial institutions attach to agricultural loans do not favor farmers. The survey noted that though some of the farmers were very anxious in getting agricultural loans, majority neither had had a demonstrated saving culture nor training on the management of loans. In a number of cases farmers actually feared getting any loans, citing the normally serious consequences incase of failure to repay the loan. It must however, be appreciated that lending institutions are in the business of making money through “lending and recovery”. In cases where a significant degree of uncertainty exists on possibilities of failure to recover such loans, the lending institution has course to fear. Experiences with micro-finances strongly indicate that recipients need to be thoroughly trained on business planning and loan management prior to getting a loan. Uganda also requires a clear policy framework on credit to farmers, since it is becoming increasingly vital that without capital, farmers may not be expected to move commercial as envisaged in the agricultural modernization strategy. Capital is badly needed to purchase improved farm inputs (seed; farm tools, implements and equipment; pesticides and herbicides; and to hire labour and skilled trainers, etc).
4.1.4 High crop losses due to pests and diseases High crop damage and loss caused by rice pests was reported as one of the constraints affecting rice farming. The most dangerous pest identified was birds and if not attended to, they can cause up to 100% loss in yield. The bird problem was cited in all districts surveyed. Farmers coping strategies include physical scaring off of birds or using scare craws. School children are often stopped from going to

49
school and sent to scare birds in rice fields, all until the crop is harvested. This is a long term negative social effect of these communities. Other pests reported include: rodents, grasshoppers, cut worms, stem bores and termites. These pests have relatively low impact as compared to damage caused by birds. Their prevalence varies from district to district. Crop loss caused by rice diseases was also reported among the priority constraints. The effect of rice diseases varies from district to district. Kamwenge, Kibaale and Lira districts reported the lowest rice disease prevalence. The common diseases, in order of importance, include: rice blast, brown spot and sheath rot in upland rice, and rice yellow mottle virus in lowland rice.
4.1.5 Lack of appropriate implements and equipment for rice farming The study results indicate that lack of appropriate implements and equipment for rice farming, post harvest handling and processing was among the priority constraints faced by rice farmers in all the surveyed districts. The constraint directly affects the quantity and quality of the rice produced by farmers. Although a range of rice farming equipment now exist in a number of institutions in Uganda (AEATRI, SG2000, and with a number of private workshops and input dealers), these technologies have not effectively diffused among farmers. Farmers lack the funds to acquire proven rice implements and equipments as these are rather expensive. They are forced to depend on rudimentary, inefficient and labour intensive tools like hand hoes, slashers, sickles, axe, etc for various rice farming operations.
4.1.6 Effects of drought on rice production and productivity Rice is traditionally a wetland crop, requiring reliable amount of moisture especially during critical periods of growth. Despite good endowment in the amount of rainfall the country receives (in average 1000mm/anually), Uganda’s rainfall is unevenly distributed both in space and time. During the survey drought was consequently cited among the main constraints hindering rice production and directly impacting on the quantity and quality of rice harvest. This problem affects both low and upland varieties though more severe on the latter. Inadequacy in rainfall/moisture can result in total crop failure, as observed by many of the surveyed districts during the second season of 2005. Farmers also lack the skills for water harvesting and moisture management. Irrigation technologies are still very expensive and suitable ones not readily available.
4.1.7 Farmers’ poor market systems of rice The study identified farmers’ poor rice marketing systems as some of the factors that significantly impinge on farmers’ rice proceeds. Districts of Kamwenge and Lira had the poorest rice marketing systems. Results of constraints from individual households indicated that 70.5% and 66.4% of farmers in Kamwenge and Lira districts respectively have inefficient rice marketing systems. The proportion of farmers in other districts who have inefficient marketing system is shown in Figure 25. The inefficient marketing system has manifested itself in low-farm gate and fluctuating prices of rice and its products. In Barr sub-county Lira district, farmers reported that they sometimes sell paddy only at 200/= per kilogram and yet milled rice costs 800 – 900/=/kg in Lira town. It should be noted that efficient marketing system is one of the key factors influencing adoption of any agricultural enterprise
50
Kamwenge, 70.50%
Kibaale, 17.60%
Lira, 66%
Luwero, 25.00%
Iganga, 47.90%
Kiboga, 60.20%
83.1
71.4
61.1 59.6
51.745.1
60.9
0
10
20
30
40
50
60
70
80
90
Perc
enta
ge o
f res
pond
ents
Lira
Kamwenge
Iganga
Kiboga
Luwero
KibaaleMean
Districts surveyed
as it directly affects level of proceeds. To increase rice adoption, the marketing issues should be among those factors that need addressing in future.
Figure 25: Proportion of farmers who have poor marketing
4.1.8 Poor quality and expensive seed Farmers cited the issue of poor quality and expensive seed among the priority constraints. During the study 60.9% of farmers from individual interviews reported that some seed companies sell seed: of mixed varieties, whose manufacturing date is not shown, whose variety name is not indicated on the package and that has low germination percentage. Analysis of constraints from individual farm household interviews indicated that 60.9% of the farmers in the 6 surveyed districts obtain rice seed which is expensive and yet of poor quality. The situation was worst observed in Lira and Kamwenge districts as shown in Figure 26
Figure 26: Proportion of farmers using poor quality seed

51
Table 5: Constraints faced by RICE farmers in the surveyed districts in Uganda and farmers’ proposed solutions Farmers’ main constraints in rice farming enterprise Rank Farmers’ proposed solutions to the constraints
Inadequate knowledge in activities pertaining to rice farming enterprise
1 Train farmers on rice production, processing and marketing techniques Provide rice farming and processing manuals
Strenuous and laborious rice farming operations especially ploughing, planting, weeding, harvesting, threshing and transportation.
2 Introduce appropriate farm implements and equipment and train farmers on their use
Actively promote use of herbicides in weed management Introduce/intensify use of animal traction in rice growing Provide affordable loans for rice farming
Lack of capital to pay for the usually high labour costs and expensive inputs (farm implements, fertilizer, herbicides and pesticides) and transportation.
3 Provide affordable loans for rice farming Improve farmers’ capacity to access and manage loans Form effective farmer groups to mobilize funds internally and externally
High crop damage and loss caused by rice pests (birds, rodents, grasshoppers, termites, stem bores, cut worms, etc)
4 Urgently introduce and promote technologies/methods to manage birds and rodents in rice farming
Develop varieties that resist bird and rodent damage Introduce rat poisoning
High crop losses caused by rice diseases especially blast, yellow mottle virus, grain rot, sheath rot, brown spot, sheath blight, etc.
5 Train farmers on the value and safe use of agro-chemicals Devise ways and means to mitigate adulteration of agro- chemicals
Lack of appropriate implements for rice farming, post harvest handling and processing and for rural transportation
6 Urgently introduce a range of appropriate implements and equipment for rice farming and processing
Need for soft loans to buy the necessary equipment
Frequent and prolonged droughts affecting rice output and quality, and eventually proceeds from rice enterprise
7 Promote appropriate irrigation & water harvesting Timely avail seed to farmers ensure early planting
Poor marketing system: (fluctuating and low market prices of both paddy and milled rice, distant markets hence exploitation by middlemen)
8 Advocate for central rice processors operating with rice out growers to stabilize prizes
Promote farmer cooperative marketing
Poor quality (low germination percentage, mixed seed, etc) & expensive seeds
9 Government should enforce laws against seed companies that sell poor quality seed.
Farmers should be trained to be sensitive to using good quality seed
Land shortage 10 Provide soft loans to buy more land
Declining soil fertility due to continuous cultivation of the same piece of land without formal nutrient replacement
11 Train on crop rotation Buy more land

52
4.2 Constraints of rice processors Rice processors in the six surveyed districts experienced similar constraints in the areas of technical performance of rice mills, access to repair facilities and services, quantity and quality of paddy from farmers, and marketing and quality of milled rice and bran. There were also few constraints in husk utilization and disposal. The aggregated constraints are shown in Table 6. The ranking percentage in the table has been done within the sub-headings which are shaded.
4.2.1 Technical performance of rice mills Unreliable and high costs of electricity and diesel were reported as one of the major current obstacles in rice milling. The current electrical power rationing introduced by the “Umeme” power company has negatively affected rice milling. In some cases like in Zirobwe sub-county, Luwero district, the millers reported at times staying up to two weeks without electrical power. Irregular power cause unnecessary delays in milling resulting in millers failing to meet demands of their customers. Most surveyed districts like Kibaale, Kamwenge, Lira and Kiboga don’t have electrical power in the main rice growing areas. As a coping strategy, rice millers use diesel engines to run the rice mills. These have much higher operation costs compared to electrically powered mills, thus contributing to higher milling charges as indeed reported by farmers. Frequent breakdown of rice mills was among the constraints reported. The situation is worse for the millers that use old diesel engines as a power source. Some (12.5%) of the rice millers cited high breakages in milled rice as some of their problems. This was attributed to: inadequate knowledge of mill operators, improperly dried paddy by farmers and low quality rice mills.
4.2.2 Access to repair facilities and services Of all the rice millers interviewed, 90.5% reported that spare parts and repair kits for rice mills are not readily available. Some of the spares especially those for rubber roller mills, quickly wear off belts. Majority of the millers have to travel long distances to their respective district headquarters and sometimes up to Kampala to obtain mill spares and repair services. In some of the districts like Kamwenge, Kibaale and Kiboga, the millers lack trained technicians to repair the mills.
4.2.3 Quantity and quality of paddy received at rice mills Improperly dried paddy by farmers (either wet or over-dried), was cited among priority issues that need immediate attention. Majority of the farmers don’t know when to harvest and how to properly and effectively dry paddy. Some farmers harvest rice when it is premature. The premature rice has poor quality when milled, it looks like white chalk. Other farmers after harvest cover the wet paddy before drying thus causing it to partial mould. The wet or over dried paddy causes high breakages during milling. Twenty nine percent (29%) of rice millers reported that

53
2-3 months, 25%
10-12 months, 25.00%
4-6 months, 33.30%
7-9 months, 16.70%
some farmers bring paddy which is contaminated with foreign matter especially stones. The stones and other foreign matter increase the rate of ware on the rollers and often destroy mill-sieves. Lack of paddy all year round was reported as some of the constraints rice millers are experiencing. Due to inadequate paddy, 75% of millers do not operate their mills all year round as shown in Figure27. Majority of the mills are therefore under utilized, which represents uneconomical use.
Figure 27: Duration of rice mill operation in a year
4.2.4 Quality and marketing of milled rice Rice millers reported that rice with a lot of broken grain is challenge to market, due to its poor demand. At some of the mills like in Zirobwe, the millers are forced to reduce the price of the milled rice that has high percentage of broken grain from 800/= to 700/= per kilogram. In some cases farmers and millers don’t know the use of the bran due to its very low demand and markets. They therefore end up throwing it away. Millers also reported unstable prices especially during harvesting. They further cited inadequate options for packaging milled rice. This inability reduces their capacity to effectively compete with rice importers. The millers also reported that disposal of rice husks is difficult and very expensive. They indicated need for technologies that can utilize rice husks.

54
Table 6: Summarized constraints by rice millers in the surveyed districts Constraints facing rice millers % of
rank Rice millers’ proposed solutions
Technical performance of rice mills Unreliable and high cost of electricity
37.5 Acquire generators as a fall-back solution, though expensive;
Government should provide regular, stable and cheaper power;
Government should subsidize fuel costs Frequent breakdown of rice mills
33.3 Introduce durable and more reliable rice mills in the market;
High milling breakages 12.5 Train farmers on proper drying of paddy; and rice millers to be sensitive on quality paddy;
Inadequate knowledge in rice milling
8.4 Employ trained rice mill operators, Train the current rice mill operators.
Access to repair facilities and services Spare parts and repair kits are not readily accessible.
90.5 Encourage traders/stockists to bring in rice equipment and spare parts closer to farmers;
Lack of trained technicians 4.8
Train technicians to operate rice mills
Quantity and quality of incoming paddy Paddy either wet or over dried
41.7 Train farmers proper rice drying methods & encourage use of simple moisture meters at farm-level;
Paddy contaminated with a lot of foreign matter especially stones
29.2 Train farmers proper post harvest handling methods,
Employ de-stoner in rice processing. Inadequate supply of paddy all year round
16.7 Encourage farmers to expand rice production;
Sensitize millers to invest on bulk paddy procurement for all-year-round milling
Marketing and quality of milled rice and bran Broken grain and rice bran have low demand & markets
57.1 Open better utilization avenues for broken rice and bran.
Poor marketing systems 35.7 Store, process and package for better markets during scarcity
Lack of transport to take rice to markets
7.2 Provide credit support to rice millers to buy vehicles.
4.3 Constraints of rice input dealers The constraints experienced by rice input dealers in the six surveyed districts are in the areas of input acquisition and marketing. The constraints identified were similar and are aggregated into 4 constraints in the area of rice farming input acquisition and 6 constraints in marketing and distribution. Table 7 shows the aggregated constraints together with their ranking percentage. The ranking percentage is been done within main areas of farm input acquisition and marketing.

55
4.3.1 Input acquisition: The input dealers reported expensive transportation as the most serious constraint they encounter in input acquisition. All the input dealers at the districts acquire their merchandise mainly from Kampala and those at sub-counties source theirs from their respective district headquarters. The country’s under developed road transport system is a major contributing factor to the expensive transport costs. Many input dealers from a particular place collect money and send one of them to carry out the purchases as a coping strategy. Inadequate capital for doing meaningful business was cited among the priority constraints in input acquisition. Lack of adequate capital forces the input dealers to have low volumes of business and in most cases they are unable to deal in some of the important inputs like fertilizers, hoes, etc. The low volume of business increases the transport costs thus making the inputs more expensive to farmers. This situation is made worse by the erratic flow of inputs from importers and distributors and seed companies. Low quality seed was cited among the constraints in input acquisition. The dealers reported that some seed companies sell to them seed(s) whose variety name(s) are not indicated, seeds that are adulterated and have poor germination. They also reported that some seed companies avail seeds late to them. The same problem was reported by farmers in all the surveyed districts. This clearly indicates that the laws governing seed production and marketing are not followed by majority seed companies. Further these seed companies are properly monitored.
4.3.2 Input distribution and marketing: Low market for inputs was reported by input dealers as an important constraint in marketing of rice inputs. Input dealers have attributed this issue mainly to: lack of capital for rice farmers, rice growing is seasonal, farmers are not aware of the availability of the inputs and unreliable rains. Since farmers do not have adequate capital for rice farming, they grow small plots (1-2 acres) and therefore those few farmers who use some of the inputs buy only small quantities. The input dealers have also reported that NGOs which offer free seeds and other inputs to farmers affect their market. Majority of the input dealers have currently adopted targeting certain inputs for particular seasons and keeping small stocks as the main coping mechanisms. The input dealers reported that many of the inputs especially fertilizers, pesticides and herbicides are packaged in quantities which are not desired by farmers. They cope by dividing and selling these inputs into small quantities against the safety regulations of these chemicals. They complain that this practice exposes them to health hazards of these chemicals. Farmers’ inadequate knowledge on value of improved seed, and use and management of most inputs especially the agro-chemicals and knapsack sprayers was cited as one of the main constraints in marketing inputs. Due to the

56
inadequate knowledge, farmers don’t use the agro-chemicals properly. Often times the chemical, for example if it is a herbicide either kills the rice or fails to work. The same situation has been observed with knapsack sprayers which usually fail before their lifespan. The failure of these inputs due to mismanagement by farmers makes the farmers believe that the input dealers are selling them fake inputs. Table 7: Constraints facing rice input dealers in the surveyed districts Constraint facing rice input dealers
% of Rank
Input dealers’ dealers proposed solutions
Importation/acquisition Transportation of inputs is expensive 35.7% Arrangements be made to
deliver inputs direct at stockists’ premises
Stockists to acquire own transport
Stockists to buy inputs in bulk Inadequate capital to carry out large scale business
32.1 Provide low cost loans Reduce taxes on agricultural
inputs Erratic flow of input supplies due to their scarcity
25.0 Encourage suppliers to have adequate stock all the time
Low quality seeds: (some companies sell fake seed, with poor viability, un-graded, unlabeled, etc)
7.2 Government to enforce laws to punish seed companies that sell low quality seeds
Farmer groups to be zero-tolerant on poor quality seed.
Marketing/distribution Low markets for the products since farmers can afford only small quantities due to inadequate finance.
27.6 Provide low cost loans to farmers to buy agric inputs
Improve marketing system for farmers’ rice
Most inputs are unaffordable to majority of smallholder farmers
27.6 Provide loans to farmers Reduce taxes on inputs
Many of the inputs are packaged in quantities which are not desired or afforded by farmers
17.2 Manufacturers should focus packaging as per most-farmer demand (small quantities)
Farmers have inadequate knowledge on importance and management of most inputs
13.8 Sensitization and training on the value of agricultural inputs & on their correct application
Many farmers are not aware of the availability of the inputs
10.3 Invest in advertising Promotion by manufacturers
Some retailers adulterate agro-chemicals, seed and fertilizers
3.5 Government to enforce laws to punish agro-input stockists, companies that sell low quality/adulterated inputs

57
27.2
16.8
9.68.8
7.9 7.26.5
5.6 4.8
3.2
1.6
0
5
10
15
20
25
30
Capital fo
r rice p
roduction
Labor re
lated p
roblem
Acquisition of im
plements
Improved ric
e seeds
Mitigatin
g drought
Technical k
nowledge acquisit
ion
Land
shorta
ge
Accessing o
ther inputs
Post harve
st & m
arketin
g
Improving tra
nsporta
tion
Bird and ro
dent contro
l
Challenges
Perc
enta
ge (%
)
4.4 Challenges to rice production as presented by farmers During the individual household surveys, farmers were asked to highlight the challenges they would face in trying to resolve the constraints they faced in rice production. The responses given were aggregated to eleven (11) major challenges as summarized below. Figure 28 shows these challenges prioritized.
a) How to obtain capital for rice farming,
b) How to resolve labor problems in rice farming
c) How to access farm inputs (farm implements, pesticides, improved seed, herbicide and fertilizers) at affordable prices and in places close to farmers,
d) How to improve knowledge in rice farming enterprise
e) How to resolve the problem of recurrent droughts
f) Other challenges in descending order were: how to acquire additional land for rice farming, how to improve post harvest handling and marketing, how to improve transportation and how to control rice pests including diseases. All these challenges need resolving before rice production can be expanded.
Figure 28: Farmer cited challenges in addressing identified rice constraints

58
18.20%
13.60%15.90%
25.00%27.30%
0.00%
5.00%
10.00%
15.00%
20.00%
25.00%
30.00%
How to pro
cess quality
rice
Ensu
ring a
dequate paddy s
upply
Ensu
ring consta
nt power su
pply
How to im
prove rice m
arketin
g
How to access
soft l
oans
Challenges
Perc
enta
ge o
f res
pond
ents
4.5 Challenges presented by rice millers to improve rice processing Like with farmers, rice millers were similarly requested to identify the challenges they faced so as resolved problems in rice processing and marketing. The millers identified 5 main challenges below that needed immediate attention. Figure 29 shows these challenges prioritized. a) How to build capacity to process quality rice to meet markets requirements, b) How to ensure adequate quantity of paddy so as to extend their milling
operations throughout the year, c) How to ensure constant supply of cheap power to enhance profitability in
milling, d) How to improve the rice marketing system, e) How to access farming loans at affordable terms.
Figure 29: Challenges presented by rice processors 4.6 Challenges presented by rice input dealers The interviewed rice input dealers were also requested to identify the challenges that needed redress so as to improve rice related input marketing in their areas. The two main challenges cited were, how to improve marketing of inputs and how access low cost loans.

59
4 CONCLUSIONS AND WAY FORWARD 4.1 Conclusion This study on rice production processing and marketing in Uganda was conducted by a multi-disciplinary team of researchers drawn from several NARO institutes, Makerere University and SG-2000, Uganda. It covered six predominantly rice growing districts of Uganda selected based on clearly defined criteria to serve as representation of the rice industry in the country. The study objective is to generate basic information on the status of rice production, processing and marketing in Uganda with a view to contributing to future rice development initiatives in the country. The study analyzed socio-demographic characteristics of farmer respondents and the environment under which rice is grown in the areas covered. It particularly focused on rice production practices from land preparation, through to processing and marketing of the crop. It came out with a focused summary of constraints and challenges faced by farmers, processors and agro-input dealers in the rice industry. Based on these, the study proposed a way forward to improving the rice industry in the country. 4.2 Way forward
4.2.1 Preamble Although rice is still a relatively new crop enterprise in Uganda, the survey did observe a number of glaringly positive benefits and effects that the crop has had on the lives of farm households and of processors and agro-input dealers. It is therefore recommended that rice be regarded as a strategic crop for food security and income generation in line with the Poverty Eradication Strategy in Uganda. Several constraints and challenges pertaining to rice production, processing and marketing were reported by farmers, processors and input dealers in the six districts surveyed. These constraints and challenges were discussed at a stakeholders’ workshop that received this report in its final-draft form and were summarized as follows:
Inadequate knowledge in rice farming especially for upland rice, Strenuous and time consuming rice farm operations, Lack of appropriate farm implements for rice farming, postharvest processing,
value-addition, and for rural transportation, High crop damage/loss caused by rice diseases and pests (including weeds),,
and by poor crop handling and processing, High cost and often scarcity of farm inputs (improved seed, farm implements
and equipment, fertilizers, herbicides and pesticides, etc), Generally poor and often unreliable quality of rice seed in the market, with no
clear policy on rice seed production, quality assurance and marketing, Inadequate options of rice varieties that meet biological attributes of early
maturing, high yielding, resistance to drought, diseases and pests, yet also with good milling and cooking qualities, taste and aroma,
Absence of viable options to mitigate drought and floods in rice production;

60
Inefficient marketing system as reflected by low farm-gate and fluctuating commodity prices.
Narrow utilization base of rice with inadequate exploitation of rice by-products Poor mechanisms for rice information access and sharing. Inadequate sensitivity to gender and environmental concerns in rice
production, processing and marketing.
4.2.2 Promotion and delivery of rice knowledge and services a) Training and skills development: Train farmers on all the aspects of rice
production, processing and marketing. The training should aim at improving knowledge and skills on: rice agronomy including appropriate herbicides, pesticides use, seed selection and home-saved seed production, post harvest handling and quality assurance, intermediate technology on upland rice irrigation and sustainable water and soil fertility management in rice farming. The training should also address the technical in competencies of the current field extension service providers in rice production and processing aspects. Farmers’ training should utilize participatory training methods e.g “Farmer Field Schools”, the “SG-2000 One-Stop-Centre” model, etc. The training of extension service providers should be a home-grown initiative based on hands-on, onsite focal training centers where rice production is prevalent. The same focal training centers could also be utilized to train rural artisans and mechanics in proper skills for utilization, management and repairs of a variety of rice equipment at farm and postharvest levels. Partners in the training initiative should include Rice Subject Mater Specialists at district level, researchers, relevant NGOs, university and colleges..
b) Intermediate technology for rice production, processing and value addition:
The survey clearly identified the following rice activities as being the most strenuous and time consuming: land preparation, planting, weeding, harvesting, threshing and transportation of rice from rice fields up to markets. Experiences from the rice producing countries in South Asia show that deployment of appropriate farm implements and equipment for rice operations above could significantly enhance labour productivity and quality, and improve the profitability of rice farming. Initiatives in this area should include selection and where applicable introduction of the technologies, building of capacity for local manufacture and repair of the technologies with emphasis on research and private sector partnerships. There should also be massive on-farm demonstrations on application and actual benefits of such technologies. The role of animal traction was particularly cited by farmers in most of the districts surveyed, as being pivotal to reduction in farm energy/power and is a realistic solution to the current problem of rural transportation.
c) Effect of drought on rice production: The effect of drought was reported as a
serious threat to expansions in rice production in the country as it closely relates to the quantity of crop that may be harvested. This constraint is both for low-land but particularly severe in up-land rice farming. Interventions in this area should start with collection and collation of rice-ecology data country wide. This will determine the most suitable rice growing areas in the country in light of recurrent droughts and water stress. Farmers should be sensitized and trained on

61
appropriate water harvesting practices. Where such mitigation measures still fall short of ensuring enough moisture, supplementary irrigation should be introduced both for upland and low-land rice farming systems. Irrigation development should be coupled with strong government effort as farmers may have limited capacity to draw water to often distant sources, to their farms.
d) Rice diseases and pests including weeds: Destruction of rice crop by birds and
rodents was sited as a severe problem hindering rice production in the districts surveyed. Bird damage is viewed as particularly severe during the first season at times resulting in farmers reducing rice acreage during this period. Mitigation measures should start with quantification of actual rice-crop damage/loss attributed to birds. This would be a good reflection of the magnitude of the problem. Farmers should be encouraged to employ environmentally friendly methods for bird control including use of scare crows, specialized bird-scaring tapes, explosives, etc. As a long term strategy, research should embark on development of rice varieties that resist bird and diseases damage and with good cooking and milling qualities.
As regards rice disease problems, farmers generally had little knowledge on disease types, effects and control methods. Disease awareness was also scanty among rice extension service providers. As part and parcel of farmers training, disease types, affects and control should be incorporated. Similarly, problems of notorious weeds of rice, e.g striga, should be given urgent research attention.
e) Rice inputs including seed: The main constraint regarding rice inputs was on their high cost and inadequate availability. The intervention in this area should incorporate promotion of rural micro-finance to address availability of capital for agricultural production in general; and for the acquisition of farm inputs in particular. Rigorous farmer training should also be undertaken to enhance farmers’ capacity to access and manage loans, as well as mobilize funding both from within and outside their communities. Special reference was made on the generally poor and often unreliable quality of rice seed in the market. There are common cases of seed not properly sorted, graded and labeled and with low viability, at times the seed may germinate but die off only days after germination. There were also cases of adulterated seed or of seed of different rice varieties mixed together. Farmers should be trained on quality seed and should, as a group, be stringent on quality at the receiving end with possibilities of blacklisting and reprimanding companies/stockists that sell poor seed.
f) Inefficient marketing system: During the survey, inefficient marketing system was reflected by low farm-gate and fluctuating commodity prices, and was severe in areas where rice milling facilities were poorly distributed. Proposed lnterventions in this include:
1. Building farmers’ capacity to form vibrant rice cooperatives/associations, that will enhance collective marketing with better bargaining power, and minimize exploitative middle-men. Such initiatives will also enable farmers process quality rice for the export markets;

62
2. In a number of areas surveyed, mills were far away from locations of rice production. This was particularly the case in Agwata and Barr sub-counties in Lira district, Kahunge sub-county in Kamwenge district, and Mabaale and Nalweyo sub-counties in Kibaale district. As a result farmers were forced to market their crop either un-milled (with prices as low as 200-250/= per kilogram of paddy), or endure the high cost of transporting paddy to distant mills at a cost of 2,000 – 3,000/= per bag. There is need to sensitize private entrepreneurs and create a conducive environment for them to invest in rice processing at locations well known for producing large volumes of rice. Farmer cooperatives should also be sensitized to gradually develop capacity for such investment.
3. Use of the rice by-products (bran, husks and straw) was inadequate, and some of the by-products (husks) were actually becoming an environment problem and costly to dispose off. There is need to sensitize and train processors on the wide range of possible rice by-products and create opportunities for their utilization.
4.2.3 Policy Issues There are a number of policy issues that come into play as rice increasingly becomes an important crop in Uganda. Some of the salient policy issues include: 1. Uganda requires formalization of her membership of the African rice research
initiative under WARDA, where it will stand numerous benefits, e.g. accessing rice germplasm, financial grants, training, and information;
2. Uganda requires a clear policy on credit to farmers, since it is becoming increasingly vital that without capital farmers may not be expected to move from subsistence to commercial agriculture as envisaged in the agricultural modernization strategy;
3. Need for a strategy on rice seed production and marketing, and for more rigors in the enforcement of existing laws on seed. This situation also applies to pesticides and herbicides sold in the market
4. There is urgent need to establish a vibrant mechanism for rice information sharing and access by stakeholders in rice.
4.2.4 Research issues a) Due to increasing pressure on rice production by diseases, pests (including a
range of notorious weeds), and drought, there is need to intensify participatory research to generate varieties with biological attributes of early maturing, high yielding, resistance to drought, diseases and pests, as well as having good milling and cooking qualities, taste and aroma,
b) In light of the grave concern by farmers on labour intensive and time consuming operations associated with rice production, there is need for continued selection and adaptation of promising intermediary rice technologies (tools, implements and equipment) to ease labour in production and enhance quality in rice processing;
63
c) Since rice is still a relatively new crop in the country, there is need to study the socio-economic environment in which rice production is taking place
4.2.4 Environmental concerns The main environmental challenges in rice production and processing include: e) Fitting rice into farming systems f) Need for caution in the use of chemicals to control weeds, diseases and pests in
rice as this may be associated with non-prudent; poor handling, wrong protective attire, over application of the chemical, all of which may harm the user, other persons and may negatively impact on the environment through water and soil pollution.
g) Indiscriminate disposal of rice mill wastes (and in particular rice husks) near the neighborhoods of the mills may results in pollution since rice husks are high in silcon which is hazardous to health. Rice husks poorly disposed off may also be a major habitat for rodents, snakes and weevils that may be harmful to humans.
h) Indiscriminate clearing of forest lands for rice
4.2.5 Gender concerns b) The survey established that Improved equity in production and sharing of rice
proceeds ♦ Improved equity and sharing of proceeds from rice ♦ Ensure equal access to rice lands and to rice inputs by both men and women ♦ Ensure gender sensitivity in development of rice technologies, especially labour
saving and processing technologies
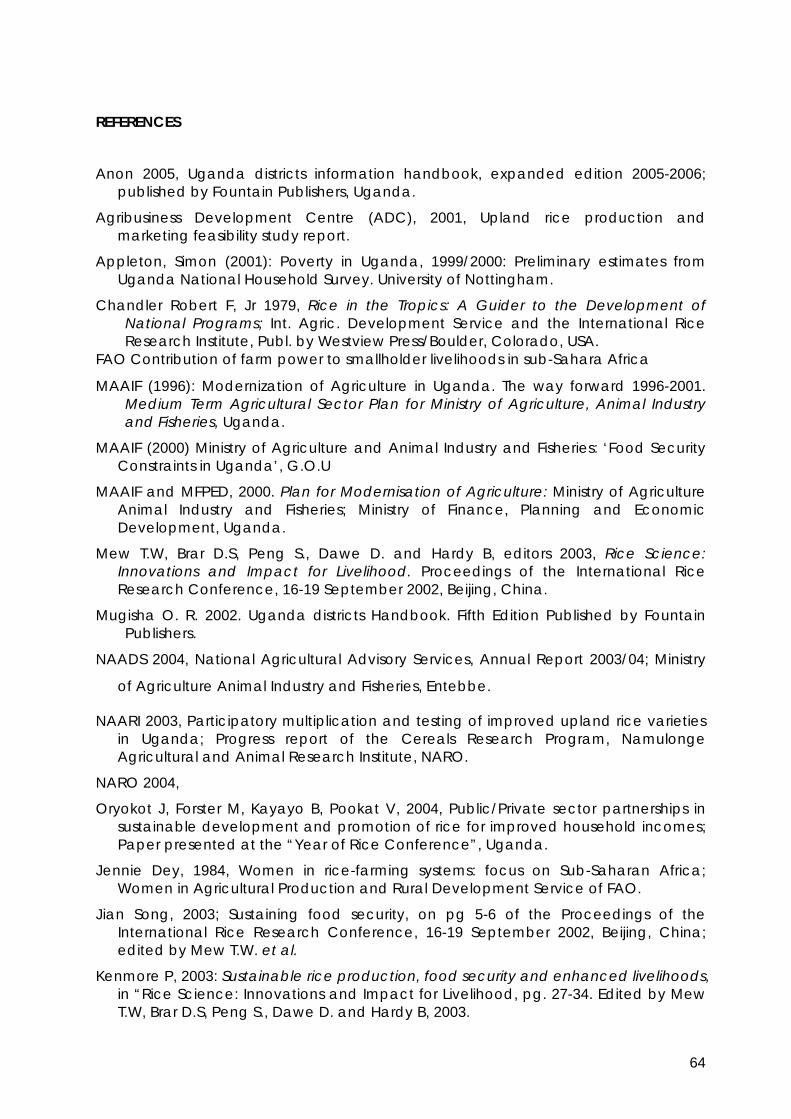
64
REFERENCES
Anon 2005, Uganda districts information handbook, expanded edition 2005-2006; published by Fountain Publishers, Uganda.
Agribusiness Development Centre (ADC), 2001, Upland rice production and marketing feasibility study report.
Appleton, Simon (2001): Poverty in Uganda, 1999/2000: Preliminary estimates from Uganda National Household Survey. University of Nottingham.
Chandler Robert F, Jr 1979, Rice in the Tropics: A Guider to the Development of National Programs; Int. Agric. Development Service and the International Rice Research Institute, Publ. by Westview Press/Boulder, Colorado, USA.
FAO Contribution of farm power to smallholder livelihoods in sub-Sahara Africa
MAAIF (1996): Modernization of Agriculture in Uganda. The way forward 1996-2001. Medium Term Agricultural Sector Plan for Ministry of Agriculture, Animal Industry and Fisheries, Uganda.
MAAIF (2000) Ministry of Agriculture and Animal Industry and Fisheries: ‘Food Security Constraints in Uganda’, G.O.U
MAAIF and MFPED, 2000. Plan for Modernisation of Agriculture: Ministry of Agriculture Animal Industry and Fisheries; Ministry of Finance, Planning and Economic Development, Uganda.
Mew T.W, Brar D.S, Peng S., Dawe D. and Hardy B, editors 2003, Rice Science: Innovations and Impact for Livelihood. Proceedings of the International Rice Research Conference, 16-19 September 2002, Beijing, China.
Mugisha O. R. 2002. Uganda districts Handbook. Fifth Edition Published by Fountain Publishers.
NAADS 2004, National Agricultural Advisory Services, Annual Report 2003/04; Ministry
of Agriculture Animal Industry and Fisheries, Entebbe.
NAARI 2003, Participatory multiplication and testing of improved upland rice varieties in Uganda; Progress report of the Cereals Research Program, Namulonge Agricultural and Animal Research Institute, NARO.
NARO 2004,
Oryokot J, Forster M, Kayayo B, Pookat V, 2004, Public/Private sector partnerships in sustainable development and promotion of rice for improved household incomes; Paper presented at the “Year of Rice Conference”, Uganda.
Jennie Dey, 1984, Women in rice-farming systems: focus on Sub-Saharan Africa; Women in Agricultural Production and Rural Development Service of FAO.
Jian Song, 2003; Sustaining food security, on pg 5-6 of the Proceedings of the International Rice Research Conference, 16-19 September 2002, Beijing, China; edited by Mew T.W. et al.
Kenmore P, 2003: Sustainable rice production, food security and enhanced livelihoods, in “Rice Science: Innovations and Impact for Livelihood, pg. 27-34. Edited by Mew T.W, Brar D.S, Peng S., Dawe D. and Hardy B, 2003.

65
Tatsushi Tsuboi, 2005; Paper presented at the WARDA – NERICA rice Workshop, Ivory Coast, 8th October, 2005.
Tatsushi Tsuboi, 2006; Guide for upland rice experiments, Rice Training Workshop, 23 – 25th Feb, 2006.
(WARDA, 2004) http//www.warda.org. “The Rice Challenge in Africa))”.
World Bank (2001): PRSP Progress Report 2001. Washington DC: World Bank.
SAA 2005, One Stop Centre; Newsletter of the Sasakawa Africa Association, Issue 20.
SAA 2005, Feeding the future: New Rice for Africa; Newsletter of the Sasakawa Africa Association; Issue No 21.
Xu Kuangdi and Shen Guofang, 2003; Promoting Chinese rice production through innovative science and technology, pg 11-18 of the Proceedings of the International Rice Research Conference, 16-19 September 2002, Beijing, China, edited by Mew T.W. et al.

66
ANNEXES Annex 1: Study Team Name of staff Organisation Role in the study
Eng. Odogola R. Wilfred AEATRI-NARO Lead Consultant
Dr. Kikafunda Joseph NAARI-NARO Core team member
Dr. Nalukenge Imelda (Ms) FA-MAK Core team member
Eng. Candia Alphonse AEATRI-NARO Core team member
Ms Akulo Dina Oyena MEPU-NARO Core team member
Mr. Onega Geoffrey NAARI-NARO Core team member
Mr. Tsuboi Tashushi JICA Technical Advisor on rice
Mr. Tomitaka Motonori JICA Technical Advisor, MAAIF
Dr. Foster A Michael SAA-Uganda Technical Advisor
Mr. Kayaayo Battson SAA-Uganda Collaborators
Mr. Alibu Simon JICA-NARO Collaborators
Mr. Ochola Denis JICA-NARO Collaborators
Mr. Sembatya Charles SAA-Uganda Collaborators
Eng. Okurut Samuel AEATRI-NARO Collaborators
District agricultural officers MAAIF/LG Research assistants

67
Annex 2: Suitability Map for Rice Production Key: The area suitability for rice growing increases with the intensity of the green color

68
Annex 3: Constraints in Rice Production, Processing & Marketing by District
Constraints faced by farmers in rice farming enterprise Kiboga district Main constraints in rice farming enterprise Rank Farmers’ proposed solutions to the problems
Inadequate knowledge in the activities of the entire rice farming enterprise
1 Organize training Study tours
Strenuous and laborious rice farming operations especially ploughing, planting, weeding, harvesting and transportation.
2 Provide affordable loans Introduce tractors and motorized planters Introduce animal traction
Drought resulting to frequent crop failures
2 Introduce irrigation Carry out forestation Introduce water harvesting and irrigation technology
Diseases especially blast, grain rot, sheath rot 4 Devise ways and means to mitigate adulteration of farm chemicals
Introduce agro-chemicals & sprayers
Pests (birds, rodents, grasshoppers, termites, stem bores, cut worms, etc)
5 Introduce rat poisoning Develop varieties that cannot be eaten by birds
Poor quality & expensive seeds 6 By laws be introduce to punish those who sell fake seeds Government should take back the responsibility of seed
production and distribution.
Lack of capital to pay for labour, farm implements and equipment, transport, etc.
7 Form groups and mobilize internal/External funding Government to provide loans to farmers
Some pastoralists maliciously graze their cattle in well established rice gardens
8 By laws be introduce to punish those who graze cattle in rice gardens
Lack of rice farming implements and processing equipment 9 Introduce all the relevant rice farming implements and processing equipment
Shortage of land 9 Provide soft loans to buy more land
Low quality milled rice with a lot of feign matter, paddy and poorly polished rice
10 Introduce good rice mills in their communities
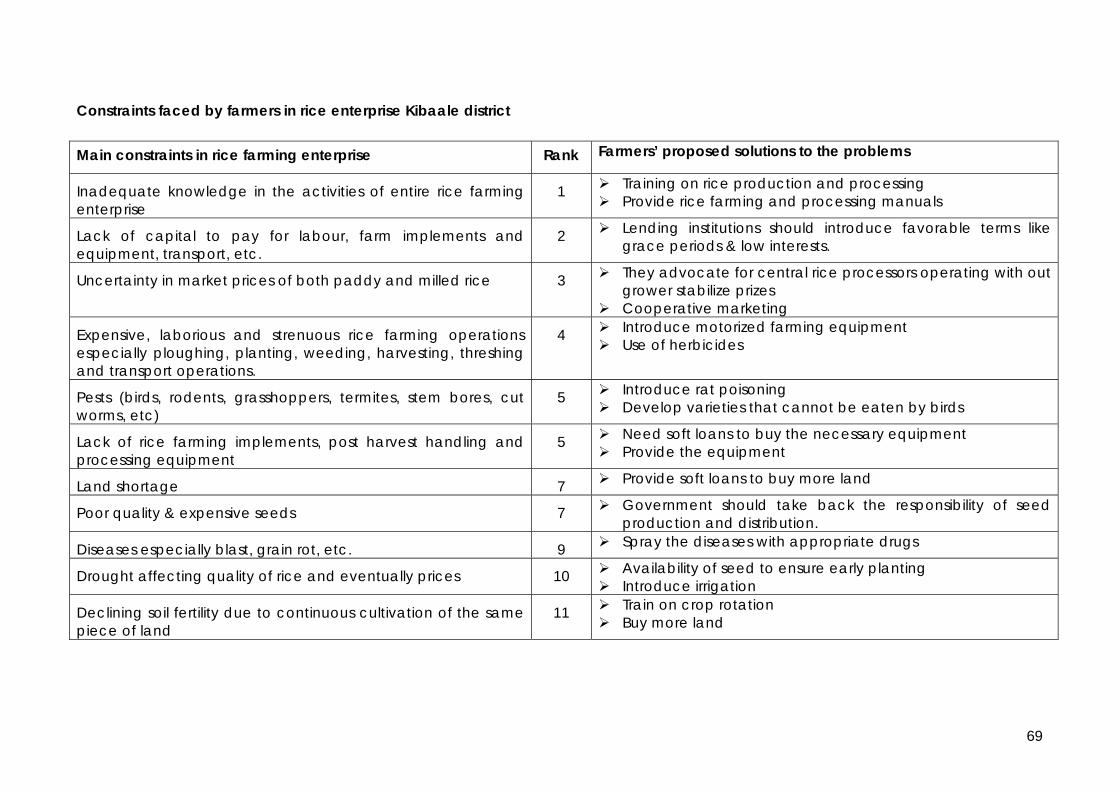
69
Constraints faced by farmers in rice enterprise Kibaale district Main constraints in rice farming enterprise Rank Farmers’ proposed solutions to the problems
Inadequate knowledge in the activities of entire rice farming enterprise
1 Training on rice production and processing Provide rice farming and processing manuals
Lack of capital to pay for labour, farm implements and equipment, transport, etc.
2 Lending institutions should introduce favorable terms like grace periods & low interests.
Uncertainty in market prices of both paddy and milled rice 3 They advocate for central rice processors operating with out grower stabilize prizes
Cooperative marketing
Expensive, laborious and strenuous rice farming operations especially ploughing, planting, weeding, harvesting, threshing and transport operations.
4 Introduce motorized farming equipment Use of herbicides
Pests (birds, rodents, grasshoppers, termites, stem bores, cut worms, etc)
5 Introduce rat poisoning Develop varieties that cannot be eaten by birds
Lack of rice farming implements, post harvest handling and processing equipment
5 Need soft loans to buy the necessary equipment Provide the equipment
Land shortage 7 Provide soft loans to buy more land
Poor quality & expensive seeds 7 Government should take back the responsibility of seed production and distribution.
Diseases especially blast, grain rot, etc. 9 Spray the diseases with appropriate drugs
Drought affecting quality of rice and eventually prices 10 Availability of seed to ensure early planting Introduce irrigation
Declining soil fertility due to continuous cultivation of the same piece of land
11 Train on crop rotation Buy more land

70
Constraints faced by farmers in rice enterprise Kamwenge district
Main constraints in rice farming enterprise Rank Farmers’ proposed solutions to the problems
Lack of capital to pay for labour, farm implements and equipment, seeds, transport, etc.
1 Financial institutions should charge lower interest rates for agriculture loans
Government assistance Expensive, laborious and strenuous rice farming operations especially ploughing, weeding and transport operations.
2 Introduce animal traction Introduce tractors Use of herbicides
Uncertainty in market prices of both paddy and milled rice 3 Group marketing Increase production which will encourage more
traders come to buy from their community Pests (birds, rodents, grasshoppers, termites, stem bores, cut worms, etc)
3 Introduce rat poisoning Develop varieties that cannot be eaten by birds
Lack of appropriate farming implements, post harvest handling and processing equipment especially rice mills and threshers
5 Avail the necessary equipment
Inadequate knowledge in the activities of entire rice farming enterprise
6 Need to visit rice-growing areas to learn. Need for demonstrations gardens
Diseases especially blast, grain rot, sheath rot 7 Spray using drugs – Pests Use good seed
Poor quality & expensive seeds 8 Government to provide seeds Drought affecting quality of rice and eventually prices
9 Introduce irrigation

71
Constraints faced by farmers in rice enterprise Luwero district
Main constraints in rice farming enterprise Rank Farmers’ proposed solutions to the problems
Inadequate water for crop and home use due to frequent droughts
1 Introduce water harvesting and irrigation technologies
Pests (birds, rodents, grasshoppers, termites, stem bores, cut worms, etc)
1 Use of bird repellants Poison the rodents
Expensive, laborious and strenuous rice farming operations especially ploughing, weeding and transport.
3 Farmers should be supported with herbicides
Diseases especially blast, grain rot, sheath rot 4 Spray using drugs Use good seed
Inadequate knowledge in post harvest handling and processing of rice
5 Training on post harvest handling and other rice farming operations
Lack of capital to pay for labour, farm implements and equipment, seeds, transport, etc.
6 Financial institutions should charge lower interest rates for agriculture loans
Government assistance
Uncertainty in market prices of both paddy and milled rice 6 Group marketing
Poor quality & expensive seeds 8 Government to provide seeds
Lack of appropriate farming implements, post harvest handling and processing equipment especially rice mills and threshes
9 Avail the necessary equipment
Renting land costly 10 Provide loans to buy land

72
Constraints faced by farmers in rice enterprise Lira district Main constraints in rice farming enterprise Rank Farmers’ proposed solutions to the problems
Inadequate knowledge in the activities of entire rice farming enterprise
1 Government intervention to sensitize and train. Increased contact with extension services
Expensive, laborious and strenuous rice farming operations especially ploughing, weeding and transport.
2 Farmers should be supported with herbicides Need equipment for farm various operations
Fluctuating prices of paddy and milled rice 3 Need for government support in establish of coo pate and marketing societies.
Government should establish fixed prices
Lack of appropriate farm tools and implements for rice farming
4 Loans schemes Co-operative societies Promote animal traction with provision of oxen and implements
Lack of capital to pay for labour, farm implements and equipment, transport, etc.
5 Government and NGOs support Improve farmers’ access to credit institutions.
Diseases especially blast, grain rot, sheath rot
6 Use drugs
Inadequate water for crop production and household use
6 Introduce water harvesting and irrigation
Pests (birds, rodents, grasshoppers, termites, stem bores, cut worms, etc)
8 Use of bird repellants Poison the rodents
Lack of improved high yielding varieties 9 Government and NGO support to avail farmers with high yielding seeds.
Lack storage facilities and rice mills 10 Government infrastructure development by building stores at sub counties.
Lack of equipment for transportation of harvest from farm to home.
11 Government assistance.

73
Constraints faced by farmers in rice enterprise Iganga district Main constraints in rice farming enterprise Rank Farmers’ proposed solutions to the problems Lack of capital to pay for labour, farm implements and equipment, transport, etc.
1 Government and NGOs support Improve farmers’ access to credit facilities.
Lack of appropriate farming implements, post harvest handling and processing equipment especially rice mills and threshers
1 Avail the necessary equipment
Inadequate knowledge in the activities of entire rice farming enterprise
3 Training
Diseases 4 Spray using appropriate drugs
Poor quality & expensive seeds 5 Government to enforce by-laws to punish seed companies that sell fake seeds
Expensive, laborious and strenuous rice farming operations especially ploughing and weeding.
6 Provide affordable loans to pay for labour Use appropriate tools and equipment
Pests (birds, rodents, grasshoppers, termites, stem bores, cut worms, etc)
7 Kill them
Declining soil fertility 8 Avail fertilizers Crop rotation
Inadequate water for crop production and household use 8 Avail irrigation facilities

74
Annex 4: Constraints generated through individual rice farmer interviews by districts surveyed
Districts surveyed (% within district) Main problem area
Type of problems Lira Luwero Iganga Kibaale Kiboga Kamwenge
Average ranking (%)
Low quality and expensive seed 83.1 51.7 61.1 45.1 59.6 71.4 60.9 Untimely provision of Seed 2.3 18.3 8.3 40.5 21.9 8.6 18.3 Lack of capital for buying seed 7.7 2.5 6.5 4.6 1.8 8.6 5.0 Rice seed Lack of knowledge to preserve &choose right seed
3.1 4.2 13.0 - 0.9 2.9 3.7
Strenuous & labour intensive operations 41.4 37.8 48.8 20.9 32.7 48.1 37.6 Expensive farm operations 23.3 31.5 17.1 54.7 43.4 45.3 35.9 Lack of capital to finance operations 18.8 11.9 6.5 14.2 8.8 - 10.6 Lack of farm implements and equipment 14.3 6.3 23.6 3.4 4.4 - 8.7 Herbicides are not readily available - 9.1 2.4 2.7 1.8 1.9 3.1
Farm operations
Inadequate knowledge on use of herbicides 2.3 2.8 1.6 1.4 - 0.9 1.6 Inadequate knowledge on disease management
36.5 28.6 42.7 20.3 - 3.7 23.6
Disease reduce yields 39.1 23.5 45.3 8.0 4.4 4.9 21.8 Chemical are expensive & scarce 9.6 14.3 10.3 21.7 4.4 2.4 11.4 Diseases: (rice blast, brown spot, sheath rot in upland rice & yellow mottle virus in lowland rice)
8.7 - - 18.8 20.9 52.4 15.3 Rice diseases
Lack of money to buy chemicals 2.6 8.2 1.7 - - - 2.0 Problematic pests: (birds, rodents, grasshoppers, termites, caterpillars)
28.3 43.7 17.1 48.7 74.8 64.1 45.7
Pests reduce crops yields and quality 26.7 16.9 26.0 13.8 6.5 30.5 20.1 Pesticides are expensive and scarce 12.5 20.4 32.5 15.1 4.7 1.6 14.8 Inadequate knowledge on pest management
Pests: (birds, rodents, grasshoppers, termites, cut worms, stem borer)
1.7 - - 3.9 1.9 2.3 1.7
Rice pests
Lack of money to buy pesticides - 5.6 1.6 - - - 1.3 Low soil fertility 48.5 46.3 82.4 36.1 54.2 49.2 51.8 High cost of fertilizers 4.1 22.2 8.8 0.7 - 6.6 6.9 Soil fertility Inadequate knowledge on soil fertility management
3.1 2.8 - 1.4 - - 1.3
Note: The percentages generated are within the main problem area

75
Annex 4: Constraints obtained from individual farm households by district cont…
Districts surveyed (% within district) Main problem area
Type of problems Lira Luwero Iganga Kibaale Kiboga Kamwenge
Average ranking (%)
Unreliable rainfall & prolonged drought 71.8 84.2 86.9 77.0 64.0 88.7 78.6 Inadequate skills in water harvesting and irrigation
21.0 4.2 12.1 4.6 - - 6.9 Water/moisture in rice production
Low soil moisture retention capacity 4.0 1.1 - 9.9 15.3 6.8 6.6 Lack of p/harvest equipment & facilities 28.3 34.3 57.4 28.1 28.6 26.3 33.2 Lack of rice mills in the area 26.4 14.8 5.9 19.2 17.0 26.3 18.5 High postharvest losses 10.4 0.9 14.9 17.8 18.8 1.8 11.1 Inadequate knowledge on p/harvest management
3.8 2.8 5.0 6.8 0.9 36.0 9.3
Labour intensive p/harvest operations 7.5 13.9 5.9 2.7 4.5 - 5.5 High milling costs 1.9 23.1 - 2.7 - 4.4 5.2 High transport costs from field to home 6.6 0.9 5.0 1.4 4.5 - 2.9 Storage pests/vermins (rodents) 10.4 1.9 2.0 2.7 - - 2.8
Postharvest and value addition
Lack of capital to buy mills 0.9 0.9 - 5.5 -. - 1.5 High transport costs to mills and market 43.0 70.7 50.9 31.9 39.6 18.6 43.8 Lack of appropriate transport means 47.1 14.6 25.9 22.4 4.0 48.5 26.1 Hand carrying is strenuous 4.1 0.9 15.2 13.0 3.0 2.9 7.0 Long distances to fields, markets and mills 0.8 6.0 7.1 3.6 15.8 5.7 6.2
Transportation & handling of rice
Poor road network 5.0 - - 10.9 - 1.4 3.3 Poor marketing system 66.4 25.0 47.9 51.1 60.2 70.5 55.1 Unstable/fluctuating market prices 3.2 37.0 29.1 2.0 12.0 3.8 13.5 Distant markets and exploitation by middlemen
18.4 1.0 18.8 16.1 10.2 10.5 13.1
Poorly organized markets 5.6 - - - 0.9 - 1.3
Marketing of rice
Low productivity 0.8 1.0 - 1.3 0.9 1.9 1.0 Note: The percentages generated are within the main problem area
76
Annex 5a: Labour contribution in rice farming operations by gender as viewed by the men Farm operations Kamwenge Kiboga Kibaale Iganga Luwero Lira Mean
1. Land preparation women men women men women men women men women men women men women men Clearing 0 100 15 83 5 90 6 94 0 100 26 51 9 86Ploughing 35 65 20 75 31 60 38 50 0 100 29 65 25 692) Crop establishment Planting 45 40 35 45 45 45 31 50 33 35 31 38 37 42Weeding 30 60 50 45 60 35 38 38 40 37 49 29 44 41Fertilizer application 0 50 10 75 0 0 38 63 6 100 0 0 9 48Spraying/pest management 0 0 5 40 0 50 0 0 0 0 0 100 1 32Bird scaring 0 5 10 20 15 5 63 25 38 38 9 44 22 23Rodent control 0 0 0 10 0 0 0 0 0 0 0 0 0 23) Postharvest operations Harvesting 25 25 40 35 63 33 44 44 34 36 54 37 43 35Threshing 50 50 39 42 45 45 44 44 36 36 44 28 43 41Transportation farm to home 0 100 37 42 13 80 13 81 19 53 4 74 14 72Drying paddy 25 75 30 60 75 10 38 50 38 43 50 37 43 46Storage 0 100 8 90 20 75 38 50 0 84 10 90 13 82Transportation to markets 0 100 0 50 0 50 38 50 37 59 9 91 14 67Hulling/milling 50 100 3 90 0 50 25 75 0 100 0 77 13 82Marketing 0 100 10 90 10 90 25 75 6 94 23 77 12 88

77
Annex 5b: Labour contribution in rice farming operations by gender as viewed by the women Farm operations Kamwenge Kiboga Kibaale Iganga Luwero Lira Mean
1. Land preparation women men women men women men women men women men women men women men Clearing 26 64 28 65 60 35 30 70 33 47 40 40 36 54Ploughing 60 28 43 50 80 15 35 50 41 41 50 50 52 392) Crop establishment Planting 50 48 45 25 45 40 30 40 50 43 33 33 42 38Weeding 75 23 75 13 75 10 65 65 58 25 40 10 65 24Fertilizer application 0 0 75 10 0 0 50 50 0 100 0 0 21 27Spraying/pest management 0 0 0 0 0 0 0 0 0 100 10 40 2 23Bird scaring 33 8 43 18 35 60 60 30 46 15 33 33 2 27Rodent control 0 0 0 0 0 0 0 0 0 0 0 0 0 03) Postharvest operations Harvesting 63 23 50 20 55 45 30 50 44 31 40 10 47 30Threshing 0 30 60 5 40 45 30 50 25 58 33 33 31 37Transportation farm to home 40 45 20 5 30 50 30 60 78 0 0 67 33 38Drying paddy 23 23 60 20 75 0 30 50 0 100 33 33 37 38Storage 0 0 20 20 48 43 30 60 100 0 33 67 39 32Transportation to markets 0 0 40 50 0 0 0 100 0 100 50 50 15 50Hulling/milling 0 0 40 50 0 0 0 100 0 100 0 0 7 42Marketing 0 100 0 100 10 40 0 100 13 88 50 50 12 80

78