final results presentation - invicta holdings presentation/final results... · final results...
TRANSCRIPT

FINAL RESULTS PRESENTATIONfor the year ended 31 March 2017
Presented by Arnold Goldstone (Chief Executive Officer)

2Invicta Holdings Limited | Results Presentation 2017
Agenda
THE YEAR IN PERSPECTIVE01DIVISIONAL REVIEW02
GROUP FINANCIAL OVERVIEW03PROSPECTS AND STRATEGY04APPENDIX05
Capital Equipment Group
Engineering Solutions Group
Building Supply Group

3Invicta Holdings Limited | Results Presentation 2017
THE YEAR IN PERSPECTIVE

4Invicta Holdings Limited | Results Presentation 2017
Highlights
REVENUE
8%TO R11.5 BILLION
OPERATING PROFIT BEFORE FOREIGN EXCHANGE MOVEMENTS
36%R1.16 BILLION
EARNINGS PER SHARE
26%499 CENTS
CASH GENERATED BY OPERATIONS
130%R1.35 BILLION

5Invicta Holdings Limited | Results Presentation 2017
Highlights (continued)
PROFIT BEFORE TAX
58%R981 MILLION
NAV PER SHARE
5%4 715 CENTS
TOTAL DIVIDEND PER SHARE
18%167 CENTS
ATTRIBUTABLE EARNINGS
26%R533 MILLION
4 000 CENTS
TNAV PER SHARE
8%
6Invicta Holdings Limited | Results Presentation 2017
The year in perspective
Excellent results on the back of difficult trading conditions
• The markets in which Invicta operates:
o Mining & construction: Still weak in Africa and South East Asia
o Agriculture: Severely impacted by worst El Niño drought on record
o Industrial & manufacturing: Deterioration in activity in South Africa
• Political upheaval in SA
• Q3 and Q4 – recession in SA
• Relocation of BMG head office from Durban to Johannesburg (now complete)
• Sale of BSG
• Loss of New Holland Agricultural machinery agency
• Loss of 2 key executives
• Volatile ZAR
• Mettle of group tested – came through with flying colours!

7Invicta Holdings Limited | Results Presentation 2017
DIVISIONAL REVIEW

8Invicta Holdings Limited | Results Presentation 2017
Divisional structure
CAPITAL EQUIPMENT
GROUP
• Northmec
• New Holland*
• CSE
• Doosan
• HPE
• ESP
• Criterion
• Kian Ann Group
• BMG
o Hansen
o OST
• Mandirk
o SA Tool
o Sibuyile
• Autobax
• Hyflo
• MacNeil
o Distribution
o Manufacturing
• Brands 4 Africa
• Tiletoria
Importer & distributor of agricultural equipment,
construction equipment, forklifts and aftermarket
replacement parts
Manufacturer, wholesaler and distributor of building
supplies worldwide
Leading distributor of engineering consumables
and provider of engineering solutions
BUILDING SUPPLY
GROUP (Discontinued)
ENGINEERING SOLUTIONS
GROUP
*Equipment sales discontinued. Aftermarket support continues (spare parts).

9Invicta Holdings Limited | Results Presentation 2017
Revenue contribution by operating segment(excluding Head Office)
3,5035,122 4,607 4,484 4,955
3,425
3,955 4,209 4,299 4,665 630
1,388 1,639 1,837 1,893
0
2 000
4 000
6 000
8 000
10 000
12 000
14 000
MAR 2013 MAR 2014 MAR 2015 MAR 2016 MAR 2017
43%
41%
16%(17%)
10,46511,513
10,62010,455
7,558
R’million
(43%)
(40%)Engineering Solutions Group
Building Supply Group
Capital Equipment Group
2017 (2016)
10Invicta Holdings Limited | Results Presentation 2017
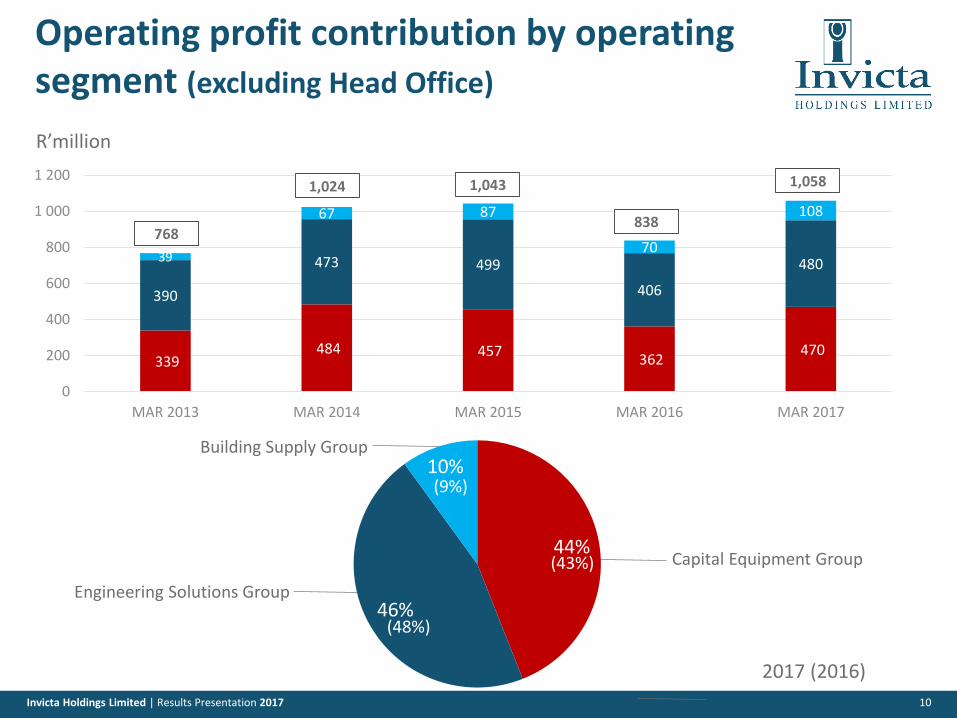
Operating profit contribution by operating segment (excluding Head Office)
339 484 457
362 470
390
473 499
406
48039
67 87
70
108
0
200
400
600
800
1 000
1 200
MAR 2013 MAR 2014 MAR 2015 MAR 2016 MAR 2017
44%
46%
10%
2017 (2016)
R’million
768
1,024 1,043
838
1,058
(48%)
(43%)
Building Supply Group
Engineering Solutions Group
Capital Equipment Group
(9%)

11Invicta Holdings Limited | Results Presentation 2017
Revenue contribution by region(includes discontinued operations)
74%
7%
14%
5%
South Africa*
Asia
Other
Africa
2017 (2016)
(77%)
(9%)
(11%)
(3%)
*Target: 50% by 2020

12Invicta Holdings Limited | Results Presentation 2017
Revenue contribution by sector(includes discontinued operations)
27%
25%24%
12%
12%Mining
Manufacturing & Industry
Agriculture & Forestry
Construction
(29%)
General Trading (23%)(19%)
(15%)
(14%)
2017 (2016)

13Invicta Holdings Limited | Results Presentation 2017
Return on Net Operating Assets (RONA)
(based on average net operating assets)
25
.8%
17
.5%
20
.6%
29
.8%
21
.8%
24
.1%
30
.9%
19
.4%
27
.3%
24
.8%
17
.6%
22
.5%
0%
5%
10%
15%
20%
25%
30%
35%
FY 2015 FY 2016 FY 2017
CEG ESG BSG IVT Group

Capital Equipment Group
DIVISIONAL REVIEW

15Invicta Holdings Limited | Results Presentation 2017
Review of 2017
• Difficult trading conditions overcome by increased market share, better sales mix
• Activity in gold and coal mining is driving construction unit sales
• Reduced level of investment in infrastructure by both private and public sectors
• Strength of the South African Rand against the US Dollar contributing to more competitive prices
• Extreme drought in H1, but lots of rain in late H2 (La Niña had a significant impact on the business
in the last four months of the financial year)
• Operating margin increased from 8.1% in 2016 to 9.5% in 2017
Revenue 11%
Operating profit before foreign exchange movements 30%

16Invicta Holdings Limited | Results Presentation 2017
Final results summary31 March 2017
2,404 2,285 2,380
2,203 2,199 2,575
0
1 000
2 000
3 000
4 000
5 000
6 000
MAR 2015 MAR 2016 MAR 2017
7.5% 7.9% 9.2%
12.6%8.2%
9.7%
MAR 2015 MAR 2016 MAR 2017
1,892
2,255 2,306
1,000
1,250
1,500
1,750
2,000
2,250
2,500
MAR 2015 MAR 2016 MAR 2017
180 181 219
208 181251
0
100
200
300
400
500
600
MAR 2015 MAR 2016 MAR 2017
REVENUE (R’m)
OPERATING PROFIT MARGIN (R’m)NET OPERATING ASSETS (R’m)
OPERATING PROFIT BEFORE FOREIGN EXCHANGE MOVEMENTS (R’m)
**The margin is 8.4% if the once-off Kian Ann profit is excluded
4,6074,955
4,484 470
362
457*
9.5%8.1%
9.9%**
* Including R69 million once-off Kian Ann profit
69
First Half Second Half Once-off

17Invicta Holdings Limited | Results Presentation 2017
Market volumes
• Agriculture equipment volumes
o Tractors 10%
o Combines 4%
o Sprayers 50%
• Construction equipment volumes
o Segments serviced by Invicta 14%
FY 2017

18Invicta Holdings Limited | Results Presentation 2017
Yellow/White Maize prices/ZAR
Maize Safex Prices – January 2010 to May 2017
1 000
1 500
2 000
2 500
3 000
3 500
4 000
4 500
5 000
5 500
18
-Jan
-10
11
-Mar
-10
4-M
ay-1
0
25
-Ju
n-1
0
18
-Au
g-1
0
11
-Oct
-10
2-D
ec-1
0
25
-Jan
-11
18
-Mar
-11
11
-May
-11
4-J
ul-
11
25
-Au
g-1
1
18
-Oct
-11
9-D
ec-1
1
6-F
eb
-12
29
-Mar
-12
24
-May
-12
17
-Ju
l-1
2
7-S
ep
-12
31
-Oct
-12
26
-De
c-1
2
19
-Fe
b-1
3
12
-Ap
r-1
3
5-J
un
-13
29
-Ju
l-1
3
19
-Se
p-1
3
12
-No
v-1
3
6-J
an-1
4
27
-Fe
b-1
4
22
-Ap
r-1
4
13
-Ju
n-1
4
6-A
ug-
14
29
-Se
p-1
4
20
-No
v-1
4
14
-Jan
-15
11
-Mar
-15
4-M
ay-1
5
25
-Ju
n-1
5
18
-Au
g-1
5
9-O
ct-1
5
2-D
ec-1
5
5-F
eb
-16
30
-Mar
-16
23
-May
-16
14
-Ju
l-1
6
06
-Se
p-1
6
28
-Oct
-16
21
-De
c-1
6
13
-Fe
b-1
7
06
-Ap
r-1
7
30
-May
-17
Yellow Maize
White Maize
Pri
ce in
ZA
R

19Invicta Holdings Limited | Results Presentation 2017
Sales analysis (includes New Holland)
31 March 2017
63%
32%
5%
Manufacturing & Industry
Agriculture & Forestry
Construction
2017

20Invicta Holdings Limited | Results Presentation 2017
New Assembly Plant –
Camperdown, Kwazulu Natal
140 000m² site5 500m² buildingOccupation date 03 July 2017

Engineering Solutions Group
DIVISIONAL REVIEW

22Invicta Holdings Limited | Results Presentation 2017
Review of 2017
Revenue 9%
Operating profit before foreign exchange movements 18%
• Encouraging results considering relocations of facilities (BMG World, regional service centres, financial head office)
• Focussed on tight cost management
• Simplify for success remained a high priority
• No acquisitions were made
• Strategic disposal of Wegezi
• Trading conditions:
o Mining: positive changes in mineral commodity prices eased spending in certain
parts of the mining industry. Major project work remained stagnant.
o Agriculture: much needed rain resulted in an increase in maintenance spend.
o Heavy industry: this continued to be a challenging market.

23Invicta Holdings Limited | Results Presentation 2017
Final results summary31 March 2017
2,028 2,085 2,346
2,181 2,214 2,319
0
1 000
2 000
3 000
4 000
5 000
6 000
MAR 2015 MAR 2016 MAR 2017
10.3% 9.3% 10.3%
13.3%9.6%
10.3%
MAR 2015 MAR 2016 MAR 2017
1,796 1,936
2,039
1 400
1 500
1 600
1 700
1 800
1 900
2 000
MAR 2015 MAR 2016 MAR 2017
209 194 241
290212
239
0
100
200
300
400
500
600
MAR 2015 MAR 2016 MAR 2017
REVENUE (R’m)
OPERATING PROFIT MARGIN (R’m)NET OPERATING ASSETS (R’m)
OPERATING PROFIT BEFORE FOREIGN EXCHANGE MOVEMENTS (R’m)
First Half Second Half
4,2094,665
4,299480
406
499
10.3%9.4%
11.9%

24Invicta Holdings Limited | Results Presentation 2017
• Divisional performances:
o BMG: robust performance
o Autobax: excellent performance
o Mandirk: met expectations
o Hyflo: met expectations; project work lumpy, muted
• African operations:
o Good performance of African branches (weakened local currencies)
o Establishment of BMG Ghana in process
• Working capital:
o Stock in line with targeted levels
o Debtors book well managed; Debtors >R250,000 insured
Review of 2017

25Invicta Holdings Limited | Results Presentation 2017
Revenue analysis31 March 2017
• Strategy of market differentiation by:o complementing product distribution with
technical expertise
• African revenue growing as a % of ESG revenues
• Last year’s acquisitions have mainly SA-based revenues
65%
35%
Consumables Engineering
88.0%
11.4%
0.6%
South Africa Africa Other
(35%)
(65%)
(89%)
(11%)
2017 (2016)

26Invicta Holdings Limited | Results Presentation 2017
24%
20%
20%
8%
7%
5%
4%
6%4%
1% Parastatals
Sales by industry sector31 March 2017
2017
Mining
Industry
Other
Cash Sales
Automotive & Transport
Food & Beverage
Projects / Consultants
Agriculture
Construction 1% Oil & Gas

27Invicta Holdings Limited | Results Presentation 2017
BMG World upgrade – Droste Park,
Jeppestown
Additional land
Acquired10 467m2
Engineering
Assembly Building9 330m2
Parking Deck6 000m2
BMG Park Original36 891m2
Land acquired for
CDC9 206m2
Fluid Technology
Building9 208m2
Additional Land
rented for parking6 000m2
Additional Land
Acquired3 773m2

28Invicta Holdings Limited | Results Presentation 2017
BMG World upgrade (continued)

Building Supply Group (Discontinued)
DIVISIONAL REVIEW

30Invicta Holdings Limited | Results Presentation 2017
• Marginal sales growth in a challenging market
• Substantial growth in operating profit due to increased gross margin (13% up on PY) and expenses up only 5%
• Increased penetration of Gauteng market
• Export sales grew from 23% (2016) to 26% (2017) of revenue
• MacNeil’s new 20 000m2 (R160m) distribution facility in Midrand:
o Commenced construction in October 2016
o Expected completion in March/April 2018
o Enhance supply chain efficiency to support growth in Gauteng & Africa
• Sold to Steinbuild 31 March 2017 – all conditions met; awaiting Competition Commission approval
Revenue 3%
Operating profit before foreign exchange movements 54%
Review of 2017

31Invicta Holdings Limited | Results Presentation 2017
Final results summary31 March 2017
837 954 1 023
802 883 870
0
500
1 000
1 500
2 000
MAR 2015 MAR 2016 MAR 2017
5.7% 4.8% 4.4%
4.9%
2.7%
7.2%
MAR 2015 MAR 2016 MAR 2017
328 392 401
-
100
200
300
400
500
MAR 2015 MAR 2016 MAR 2017
48 46 45
3924
63
0
20
40
60
80
100
MAR 2015 MAR 2016 MAR 2017
REVENUE (R’m)
OPERATING PROFIT MARGIN (R’m)NET OPERATING ASSETS (R’m)
OPERATING PROFIT BEFORE FOREIGN EXCHANGE MOVEMENTS (R’m)
1,6391,8931,837
108
70
87
5.7%
3.8%
5.3%
First Half Second Half

32Invicta Holdings Limited | Results Presentation 2017
MacNeil – Midrand property development
38 000m² site20 000m² warehouse & officesCompletion date Mar/Apr 2018New leases signed – DCLSA , B4A & MacNeil JHB

33Invicta Holdings Limited | Results Presentation 2017
Tiletoria – Malibongwe Drive property development
Completion date Feb 201813 000m² site

34Invicta Holdings Limited | Results Presentation 2017
Revenue analysis31 March 2017
BSG Revenue Contribution by Sector
85%
15%
Construction Manufacturing
74%
24%
South Africa Africa Other
(35%)
BSG Revenue Contribution by Region
2%

35Invicta Holdings Limited | Results Presentation 2017
GROUP FINANCIAL OVERVIEW

36Invicta Holdings Limited | Results Presentation 2017
Revenue
3 514
5 129 5 2704 389 4 727
9541 023
4 044
5 336 5 1904 410
4 905
883
870
0
2000
4000
6000
8000
10000
12000
14000
MAR 2013 MAR 2014 MAR 2015 MAR 2016 MAR 2017
First Half Continuing First Half Discontinued Second Half Continuing Second Half Discontinued
10,465 10,460 10,636
11,525
7,558
37Invicta Holdings Limited | Results Presentation 2017
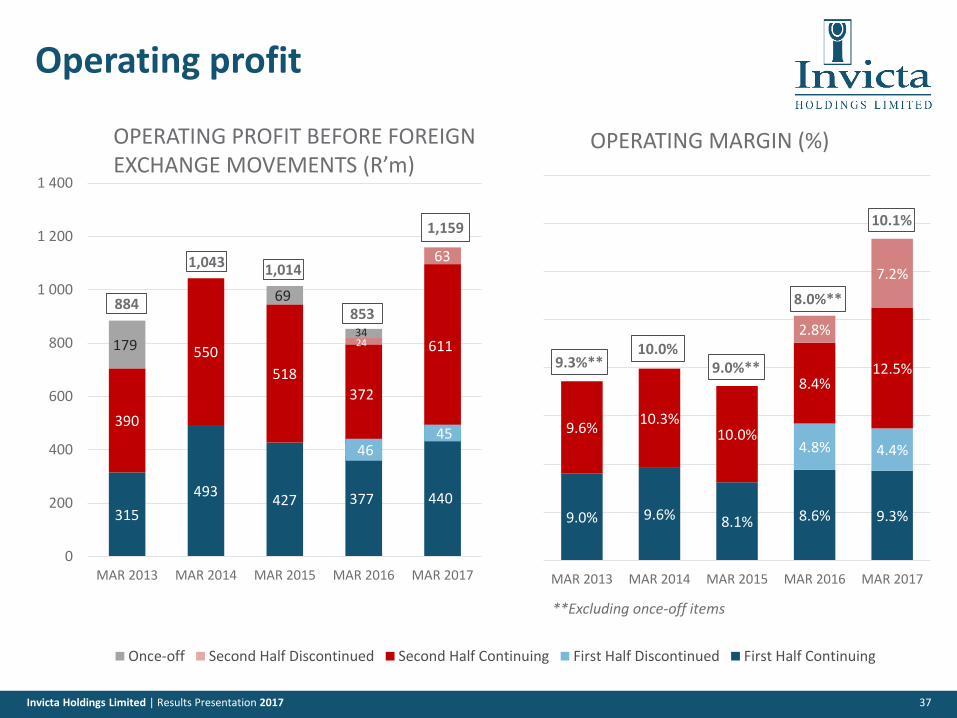
Operating profit
OPERATING PROFIT BEFORE FOREIGN EXCHANGE MOVEMENTS (R’m)
9.0% 9.6% 8.1% 8.6% 9.3%
4.8% 4.4%
9.6%10.3%
10.0%
8.4%12.5%
2.8%
7.2%
MAR 2013 MAR 2014 MAR 2015 MAR 2016 MAR 2017
9.3%**
**Excluding once-off items
315
493 427 377 440
46 45
390
550
518
372
61124
63
179
69
34
0
200
400
600
800
1 000
1 200
1 400
MAR 2013 MAR 2014 MAR 2015 MAR 2016 MAR 2017
884
1,159
853
1,043
OPERATING MARGIN (%)
10.1%
9.0%**10.0%
Once-off Second Half Discontinued Second Half Continuing First Half Discontinued First Half Continuing
1,014
8.0%**

38Invicta Holdings Limited | Results Presentation 2017
EBITDA %
12%
13%
11% 11%
10%
13%
0%
2%
4%
6%
8%
10%
12%
14%
2012 2013 2014 2015 2016* 2017*
EBITDA (R’m)
652
977
1,125 1,144
1,103
1,483
*Based on continuing operations

39Invicta Holdings Limited | Results Presentation 2017
535580
510
393
533
28
64
42
-2 -3
22
66
70
74
82
158 69
31
-100
0
100
200
300
400
500
600
700
800
MAR 2013 MAR 2014 MAR 2015 MAR 2016 MAR 2017
Ordinary s/h Minority s/h Pref s/h Once-off
R’m
illio
n
743
612
496
691710
Attributable Earnings

40Invicta Holdings Limited | Results Presentation 2017
312358
293
207253
425
430
361
160
246
218
88
29
0
100
200
300
400
500
600
700
800
900
1 000
MAR 2013 MAR 2014 MAR 2015 MAR 2016 MAR 2017
1st Half 2nd Half Once-off
107m weighted average nr of ordinary shares
Cen
ts
955
Earnings per share
78m weighted average nr of ordinary shares
Rights issue
788
742
396
499

41Invicta Holdings Limited | Results Presentation 2017
Headline earnings
31 March 2017
31 March 2016
R'000 Audited Restated % Change
Attributable Earnings 533,304 424,219 26
Adjustments
Headline EPS adjustments on discontinued operations (578) (366)
Impairment of intangible assets – 12,935
Gain from bargain purchase price recognised (235) –
Impairment of PPE 3,517 (2,663)
Loss/(profit) on disposal of investments 5,286 (35)
Profit on disposal of other assets (231) –
Net profit on disposal of PPE (11,355) (62,043)
Impairment of loans 3,089 –
Total adjustments before taxation and NCI (507) (52,172)
Taxation 1,456 16,974
NCI 307 142
Total adjustments 1,256 (35,056)
Headline Earnings 534,560 389,163 37

42Invicta Holdings Limited | Results Presentation 2017
Dividend per share
84 67 72
112
7595
-
50
100
150
200
250
300
350
2015 2016 2017
Cen
ts p
er s
har
e
Interim Final
196
Feb 2015: Special dividend of 2 024 cps was paid
142167
Salient dates for the 2017 Final Dividend
Last day to trade to be eligible for the dividend Tuesday 1 August 2017
Shares commence trading “ex” the dividend Wednesday 2 August 2017
Record date in respect of dividend Friday 4 August 2017
Dividend payments Monday 7 August 2017
18%

43Invicta Holdings Limited | Results Presentation 2017
Cash flow movement - 2017
556
1,250 98 (143)(245)
(190)
(356)*
(133)**(65)
(25) (46) 701 145 846
-
200
400
600
800
1,000
1,200
1,400
1,600
1,800
2,000
R’m
illio
n
* Capex of R452m less proceeds on sale of PPE R96m** Acquisitions of R142m less disposals of R9m

44Invicta Holdings Limited | Results Presentation 2017
PROSPECTS AND STRATEGY

45Invicta Holdings Limited | Results Presentation 2017
Prospects
• Signs of improvement in South East Asia at start of new year
• Recession in SA likely to continue
• Benefits of relocations, restructurings and expansions to start coming through
• Focus of the Group will remain on:
o margin management and cost control
o working capital optimisation
o cash generation
• Proceeds from sale of BSG likely to flow in next month or two
• R1bn + available for acquisitions. Stay focused on industrial consumables and capital equipment
• Local and international investments
• Regulatory approval obtained for secondary listing (only if it makes sense to do so to raise hard currency)

46Invicta Holdings Limited | Results Presentation 2017
Strategy
Invicta’s strategy is to:
• Generate healthy cash from existing businesses
• Build on the strength of the current businesses
• Focus on customer service, value-added distribution and supply chain efficiencies
• Diversify the Group’s revenue stream geographically
• Acquire businesses that are a strategic fit for the Group
• Maintain RONA >20% for each of the underlying businesses

47Invicta Holdings Limited | Results Presentation 2017
Q & AThank you for your attendance and participation
www.invictaholdings.co.za
For any further Investor Relations questions please contact:
Arnold Goldstone (CEO) [email protected]
Craig Barnard (CFO) [email protected]
Marlize Keyter (Keyter Rech Investor Solutions) [email protected]
087 351 3810

48Invicta Holdings Limited | Results Presentation 2017
APPENDIX

49Invicta Holdings Limited | Results Presentation 2017
Statement of Profit or Loss and other Comprehensive Income
● FY 2016 has been restated because Share Appreciation Rights have been changed from equity-settled to cash-settled.
31 March 2017 31 March 2016
R'million Audited Restated % Change
Continuing operations
Revenue 9,632 8,799 9
Operating profit before foreign exchange movements 1,051 783 34
Net foreign exchange cost (41) (102) (60)
Operating profit 1,010 681 48
Interest paid (889) (797) 12
Dividends received from financial investments 303 328 (8)
Share of profits of associates 4 5 (20)
Interest received 469 347 35
Profit before taxation from continuing operations 897 564 59
Income tax expense (322) (92) 250
Profit for the year from continuing operations 575 472 22
Discontinued operations
Profit for the year from discontinued operations 37 24 54
Profit for the year 612 496 23

50Invicta Holdings Limited | Results Presentation 2017
Statement of Profit or Loss and other Comprehensive Income
31 March 2017 31 March 2016
R'million Audited Restated % Change
Profit attributable to:
Owners of the company 533 424 26
Non-controlling interest (3) (2) 50
Preference shareholders 82 74 11
612 496 23
Basic EPS from continuing operations (cents) 465 374 24
Basic earnings and normalised EPS (cents) 499 396 26
Headline EPS from continuing operations (cents) 466 341 37
Normalised HEPS (cents) 500 380 32
Weighted average shares in issue (‘000) 106,953 107,013 (0.06)

51Invicta Holdings Limited | Results Presentation 2017
Statement of Financial Position
31 March 2017 31 March 2016
R'million Audited Restated % Change
ASSETS
Non-current assets
Property, plant and equipment 1,641 1,495 10
Financial investments 1,982 1,790 11
Goodwill 615 663 (7)
Other intangible assets 161 169 (5)
Financial assets 64 103 (38)
Finance lease receivables 46 28 64
Long-term receivables 3,374 2,945 15
Investment in associates 103 18 472
Deferred taxation 181 187 (3)
Non-current assets 8,167 7,398 10

52Invicta Holdings Limited | Results Presentation 2017
Statement of Financial Position
31 March 2017 31 March 2016
R'million Audited Restated % Change
Current assets 8,098 7,496 8
Inventories 3,663 4,093 (11)
Trade and other receivables 1,542 1,971 (22)
Current portion of finance lease receivables 41 37 11
Current portion of financial investments 709 569 25
Current portion of long-term receivables 2 5 (60)
Taxation prepaid 16 27 (41)
Bank and cash balances 1,052 782 35
7,025 7,484 (6)
Assets classified as held for sale (includes BSG) 1,073 12 8,842
TOTAL ASSETS 16,265 14,894 9

53Invicta Holdings Limited | Results Presentation 2017
Statement of Financial Position
31 March 2017 31 March 2016
R'million Audited Restated % Change
EQUITY
Equity attributable to the equity holders 5,116 4,857 5
Non-controlling interest 152 183 (17)
SHAREHOLDERS' EQUITY 5,268 5,040 5
Shares in issue (‘000) 108,495 108,495 -
Net asset value per share (cents) 4,715 4,486 5
Net tangible asset value per share (cents) 4,000 3,719 8

54Invicta Holdings Limited | Results Presentation 2017
Statement of Financial Position
31 March 2017 31 March 2016
R'million Audited Restated % Change
Non-current liabilities
Long-term borrowings 6,793 6,064 12
Financial liabilities 64 100 (36)
Deferred taxation 35 29 21
Non-current liabilities 6,892 6,193 11

55Invicta Holdings Limited | Results Presentation 2017
Statement of Financial Position
31 March 2017 31 March 2016
R'million Audited Restated % Change
Current liabilities 4,105 3,661 12
Trade and other payables 1,939 2,210 (12)
Provisions 198 197 1
Share appreciation rights liability 6 9 (33)
Taxation liabilities 170 32 431
Shareholders for dividends 50 48 4
Current portion of long-term borrowings 864 939 (8)
Current portion of financial liabilities – – –
Bank overdrafts 206 226 (9)
3,433 3,661 (6)
Liabilities associated with assets held for sale (includes BSG) 672 – –
TOTAL LIABILITIES 10,997 9,854 12
TOTAL EQUITY AND LIABILITIES 16,265 14,894 9

56Invicta Holdings Limited | Results Presentation 2017
Group structure
BBEE & Staff
Trusts
Invicta
Holdings
SANon -
SA
Invicta SAInvicta
Properties
Invicta
Treasury
Invicta
Finance
Invicta Offshore
Holdings
ESG CEG BSG(Discontinued)
Invicta African
Holdings
Invicta Asian
Holdings
BMG
Mandirk
Autobax
OST
SA Tool
Hansen
Hyflo
Sibuyile
Northmec
New Holland*
CSE
Doosan
HPE
ESP
Criterion
Kian Ann &
subsidiaries in
South East
Asia
Mozambique
Zambia
Tanzania
MacNeil
Tiletoria
B4A
25% 75% 100% 100% 100% 100%
100% 100% 60% 100% 100%
*Equipment sales discontinued. Aftermarket support continues (spare parts)

57Invicta Holdings Limited | Results Presentation 2017
Capital Equipment (SA))
• Northmec (Agricultural Machinery)
• New Holland* (Agricultural Machinery)
• CSE (Earthmoving Machinery)
• Doosan (Earthmoving Machinery)
• HPE (Hyundai Earthmoving)
• Criterion (Forklifts)
• ESP (Parts)
• 201 dedicated outlets
*Equipment sales discontinued. Aftermarket support continues (spare parts)

58Invicta Holdings Limited | Results Presentation 2017
Capital Equipment (Kian Ann Group)
Kian Ann Engineering
• One of the world's largest independent distributors of heavy machinery and diesel engine parts
• HQ in Singapore
• Subsidiaries in Singapore, Indonesia, China, Canada, United Kingdom and Myanmar
• Joint venture in India
• Associate in China
Kian Chue Hwa Industries
• One of Asia’s largest independent distributors of commercial and industrial vehicle parts
• HQ in Singapore
• Subsidiaries in Indonesia, Thailand and Malaysia
• Associate in Myanmar

59Invicta Holdings Limited | Results Presentation 2017
Engineering Solutions
• BMG (Bearing Man Group)
o Engineering components & technical services
o 135 branches
o Bearings, Seals, PT, Tools, Fasteners
o Drives, Motors, Belting, Field Services
o Filtration, Hydraulics, Lubrication, Pneumatics
• Hansen
• Mandirk Group (incl SA Tool)
o Tools & equipment
o 19 branches & subsidiaries
• Autobax
o Automotive
o 3 branch network
• OST
• Hyflo
Engineering Solutions

60Invicta Holdings Limited | Results Presentation 2017
Building Supply Group (Discontinued)
• Tiletoria
• MacNeil Distributors
• Brands 4 Africa
• 15 outlets in SA

61Invicta Holdings Limited | Results Presentation 2017
Group profit drivers
• Mining and industrial activity (ESG)
• Agricultural activity (Northmec and aftermarket parts)
• Construction activity (CSE, Doosan SA & HPE)
• Warehousing (Criterion Equipment)
• Building and renovations (BSG) (Discontinued)
• Global replacement spares market (Kian Ann)

62Invicta Holdings Limited | Results Presentation 2017
ARNOLD GOLDSTONE
Executive Management Team
BOARD OF DIRECTORS
Dr Christo Wiese (Non-Executive Chairman)
ENTITY
Invicta Holdings
Capital Equipment Group
Engineering Solutions Group
Building Supply Group
(Discontinued)
CHIEF FINANCIAL OFFICERCHIEF EXECUTIVE OFFICER
CRAIG BARNARD
TONY SINCLAIR GEOFF BALSHAW
GAVIN PELSER BENNIE GROENEWALD
KEVIN DIABNEIL MALHERBE

63Invicta Holdings Limited | Results Presentation 2017
Shareholding as at 31 March 2017
47%
38%
7%
4%
Public
Directors’ Total % 53%
Public % 47%
Wiese Family
Sherrell Family
Goldstone Family
2% Samuels Family 1% Exec Directors
1% Treasury