final report: vtra 2010
TRANSCRIPT


FINAL REPORT: VTRA 2010 2014
ii Prepared for Puget Sound Partnership - 3/31/2014
THIS PAGE IS LEFT INTENTIONALLY BLANK

FINAL REPORT: VTRA 2010 2014
iii Prepared for Puget Sound Partnership - 3/31/2014
Prepared by Author(s): Dr. Johan Rene Van Dorp Professor Engineering Management and Systems Engineering George Washington University (GW) (202) 994-6638 [email protected] Dr. Jason Merrick Professor Statistical Sciences and Operations Research Virginia Commonwealth University (VCU) (804) 828 5865 [email protected] Prepared for: Washington State Puget Sound Partnership

FINAL REPORT: VTRA 2010 2014
iv Prepared for Puget Sound Partnership - 3/31/2014
THIS PAGE IS LEFT INTENTIONALLY BLANK

FINAL REPORT: VTRA 2010 2014
v Prepared for Puget Sound Partnership - 3/31/2014
Final Report
Vessel Traffic Risk Assessment (VTRA):
Preventing Oil Spills from Large Ships and Barges
In Northern Puget Sound & Strait of Juan de Fuca
March 31, 2014
Approved by: Signature: Date Johan Rene Van Dorp, George Washington University Signature: Date Jason Merrick, Virginia Commonwealth University Signature: Date Todd Hass, Contract Manager, Puget Sound Partnership

FINAL REPORT: VTRA 2010 2014
vi Prepared for Puget Sound Partnership - 3/31/2014
THIS PAGE IS LEFT INTENTIONALLY BLANK

FINAL REPORT: VTRA 2010 2014
vii Prepared for Puget Sound Partnership - 3/31/2014
Publication Information This project has been funded wholly or in part by the United States Environmental Protection Agency under assistance agreement PC 00J29801 to Washington Department of Fish and Wildlife. The contents of this document do not necessarily reflect the views and policies of the Environmental Protection Agency, nor does mention of trade names or commercial products constitute endorsement or recommendation for use. This study was guided by a VTRA 2010 steering committee formed primarily of members from the PSP Oil Spill Workgroup and the Puget Sound Harbor Safety Committee. The contents of this document do not necessarily reflect the views of the PSP Oil Spill Workgroup, the Puget Sound Harbor Safety Committee or the VTRA 2010 Steering Committee in particular. Contact Information Dr. Johan Rene Van Dorp Professor Engineering Management and Systems Engineering George Washington University (GW) (202) 994-6638 [email protected] Dr. Jason Merrick Professor Statistical Sciences and Operations Research Virginia Commonwealth University (VCU) (804) 828 5865 [email protected] Dr. Todd Hass VTRA Contract Manager Washington State Puget Sound Partnership (PSP) (360)280-1588 [email protected]

FINAL REPORT: VTRA 2010 2014
viii Prepared for Puget Sound Partnership - 3/31/2014
THIS PAGE IS LEFT INTENTIONALLY BLANK

FINAL REPORT: VTRA 2010 2014
1 Prepared for Puget Sound Partnership - 3/31/2014
PREFACE This report is submitted by Johan Rene van Dorp (George Washington University) and Jason R.W. Merrick (Virginia Commonwealth University), GW/VCU hereafter. The content of the report describes a vessel traffic risk assessment (VTRA) conducted 2012-2014. To distinguish the study described herein from the previous VTRA study conducted 2006-2008 utilizing 2005 VTOSS data, it will be labeled VTRA 2010. The starting point for the VTRA 2010 analysis is the updated VTRA 2005 model with 2010 VTOSS data, as agreed upon in the scope of work between GW and the PSP. The update of the VTRA 2005 model to using VTOSS 2010 data was separately funded by the Makah Tribal Council [19]. The VTRA study area covers US/Canadian trans-boundary waters including: portions of the Washington outer coast, the Strait of Juan de Fuca and the approaches to and passages through the San Juan Islands, Puget Sound and Haro-Strait/Boundary Pass. The VTRA area is divided in 15 separate waterway zones outlined in Figure 1. This study has been funded in part by the United States Environmental Protection Agency (EPA) through their National Estuary Program, via a grant agreement (#2013-028) with the PSP. The waterway zone analysis results presented in this report was also funded by the Makah Tribal Council. Both the Puget Sound Partnership (PSP) and the Makah studies utilized the extensive technical work already completed by the George Washington (GW) University and Virginia Commonwealth University (VCU) under previously funded maritime risk assessment (MRA) projects. Specifically, the Prince William Sound Risk Assessment (1996), The Washington State Ferry Risk Assessment (1998), The San Francisco Bay Exposure Assessment (2004) and the 2005 Vessel Traffic Risk Assessment (VTRA 2005). The VTRA 2010 analysis tool evaluates the duration that vessels travel through the VTRA study area, referred to as vessel time exposure (VTE), by vessel type and the potential accident frequency and oil losses from a class of focus vessels. The inclusion of the time on the water element in the evaluation of exposure sets the VTRA 2010 methodology apart from count based approaches that focus on, for example, number of annual/monthly vessel transits, visits or calls. The value of a duration based approach versus a count based approach is that the former appropriately distinguishes between short and long transits in the evaluation of vessel traffic risk as well as differing vessel speeds. The VTRA 2010 methodology has been well documented and peer-reviewed in the academic literature and continuously improved over the course of the above maritime risk assessment projects. A reference list is provided at the end of this document. From the outset of this project the support from the United States Coast Guard (USCG) District 13, including Sector Puget Sound, and the Puget Sound Harbor Safety Committee (PSHSC) have been unwavering. In particular, Mark Ashley’s (USCG), John Veentjer’s (Chair of the PSHSC), Del Mackenzie’s (Puget Sound Pilots), Mike Moore (Pacific Merchant Shipping Association) and Norm Davis’ (Department of Ecology) support have been instrumental in providing the necessary data for this work. The PSHSC generously extended their hospitality to allow GW/VCU to present their progress over the course of this project during their meetings every other month from October 2012 through February 2014. The PSHSC provided GW/VCU a public platform to obtain feedback from and access to the maritime/regulatory/stakeholder community during the VTRA 2005 update and the VTRA 2010. The VTRA 2010 study was guided by a steering committee formed primarily of members from the Puget Sound Partnership Oil Spill Workgroup and the Puget Sound Harbor Safety Committee.
FINAL REPORT: VTRA 2010 2014
2 Prepared for Puget Sound Partnership - 3/31/2014
THIS PAGE IS LEFT INTENTIONALLY BLANK

FINAL REPORT: VTRA 2010 2014
3 Prepared for Puget Sound Partnership - 3/31/2014
EXECUTIVE SUMMARY Vessels transiting the Salish Sea traverse waters bordering numerous communities en route to ports in both the US and Canada. The Salish Sea is a large (over 1000 square miles) and diverse water body physically characterized by passages that are broad and deep, as well as narrow ones that are navigationally challenging with swift currents. In addition, it is a biologically rich ecosystem with significant natural resources these communities depend upon. The Strait of Juan de Fuca serves as the entrance to these U.S. and Canadian ports and facilities and is transited by approximately 10,000 deep draft vessels annually including arrivals and departures. Additional transits occur internally as vessels shift locations. There are also tug and barge movements, ferry operations, fishing and recreational vessels throughout. For example, the U.S. Coast Guard Vessel Traffic Service (VTS) alone handles approximately 230,000 transits annually with about 170,000 of those being Washington State Ferries meaning there are more than 50,000 transits other than ferries. The Puget Sound Pilots report nearly 8,000 assignments annually which provide a good metric for how many deep draft vessel movements there are on the U.S. side. The area includes an International Maritime Organization (IMO) approved Traffic Separation Scheme (TSS) that governs vessel traffic in the system and its approaches. It is actively managed by a joint U.S. - Canadian Cooperative Vessel Traffic Service (CVTS). At the western entrance to the Strait of Juan de Fuca, it includes the extent of Tofino Traffic's radar coverage; approximately 60 miles out to sea, and extends throughout the Puget Sound region north to Vancouver, British Columbia, and south to Tacoma, Washington and Olympia, Washington. Radar is supplemented by Automatic Identification System (AIS) transponders, radio communications and advance notices for arriving vessels. In terms of major oil spills, defined as over 10,000 gallons in the study area, State of Washington and U.S. Coast Guard records indicate one accident involving a single hull tanker that grounded while anchoring in Port Angeles in 1985 spilling 239,000 gallons of crude oil and two oil barge accidents; one involving a capsizing in the Guemes Channel in January 1988 spilling 70,000 gallons of heavy fuel and an oil barge grounding on December 30,1994 near Anacortes on a transit from Vancouver, British Columbia resulting in an estimated 26,936 gallons of diesel spilled (spills outside of the study area not included). Even though this area has not experienced major oil spills in the past 20 years or so, the presence of tankers in an ever changing vessel traffic mix places the area at risk for large oil spills. While a previous GW/VCU analysis [2] of this area demonstrated significant risk reduction of oil transportation risk due to existing risk mitigation measures1, the 1 In [2] a 91.6% reduction in POTENTIAL oil loss was evaluated utilizing the VTRA 2005 model from all Tankers, Articulated Tug Barges (ATB’s) and Integrated Tug Barges (ITB’s) as a result of the implementation of the one-way zone regime in Rosario Strait, implementation of double hull tankers and the 2005 Escorting Regime.
FINAL REPORT: VTRA 2010 2014
4 Prepared for Puget Sound Partnership - 3/31/2014
potential for large oil spills continues to be a prominent public concern heightened by proposed maritime terminal developments. In this study we focus on the following three (although other ones are under consideration) since these three are in advanced stages of a permitting process: (1) The proposed Gateway bulk carrier terminal at Cherry Point, Washington. (2) The Trans-Mountain/Kinder Morgan pipeline expansion in Vancouver, BC. (3) The coal, grain and container terminal expansions at Delta Port, BC. The purpose of this vessel traffic risk assessment (VTRA) is to evaluate potential changes in risk in light of above three maritime terminal developments and to inform the State of Washington, the United States Coast Guard and the Puget Sound Harbor Safety Committee on what actions could be taken to mitigate potential increases in oil spill risk from large commercial vessel in the VTRA study area. This study was not designed to measure the effectiveness of risk mitigation measures already in place. This study is also intended to inform tribes, local governments, industry and non-profit groups in Washington State and British Columbia on potential risk management options. Summarizing, this study was conducted because study sponsors and involved stakeholders want to ensure potential risks of maritime development projects above are better understood so informed decisions could be made about additional risk mitigation measures that would add to the continuous improvement efforts of the past. Description of Methodology The VTRA analysis is predominantly based on Vessel Traffic Operational Support System (VTOSS) 2010 data and will therefore be referred to as VTRA 2010 hereafter. Vessel traffic collision and grounding risks are evaluated for tank focus vessels (oil tankers, chemical carriers, oil barges and articulated tug barges) and cargo focus vessels (bulk carriers, container ships and other cargo vessels). The VTRA analysis based on the 2010 VTOSS dataset shall serve as a base case year to compare potential changes in risk as a result of above maritime terminal developments against. For context it is important to recognize that the base case 2010 VTRA analysis includes a series of risk mitigation measures. In addition to the previously mentioned IMO Traffic Separation Scheme and CVTS, vessels are subject to Port State Control and other vessel inspections regimes in both Canada and the United States to enforce international and federal standards. Pilotage is required in both the U.S. and Canada and pilotage areas are comparable. Tug escorts for laden tankers are required and tugs are used to assist vessels into and out of the berths. Moreover, there are a number of risk mitigation measures that have been put in place internationally, federally and locally over the last several decades including double hulls for tankers, protectively located fuel tanks for non-tank vessels (still being phased in), a Puget Sound Harbor Safety Plan with Standards of Care, the implementation of AIS, a traffic procedure governing vessels transiting Turn Point at the boundary between Haro Strait and Boundary Pass northeast of Victoria, Canada and a one-way zone regime in Rosario Strait. This list is not exhaustive.


FINAL REPORT: VTRA 2010 2014
9 Prepared for Puget Sound Partnership - 3/31/2014
Figure 5 shows that 41.3% of the non focus vessels VTE are accounted for by fishing vessels, about 18.1% by ferries, about 6.8% by bulk cargo barges, etc. Approximately nine cargo focus vessels enter and leave Juan de Fuca Strait daily totaling about 6400 transits annually. Similarly, approximately 1400 tank focus vessels travel east and west annually (i.e. about 2 tank focus vessel per day enter and leave in Juan de Fuca Strait 2010). Totaling the VTE for tank focus vessels (Oil barges – 18.7%, Oil Tanker – 8.4%, Chemical Carrier – 3.9%, ATB – 3.4%) we arrive at 34.3% in Figure 4. Hence, about 18.7%/34.3% = 54.5% of the total tank focus vessel VTE is accounted for by oil barges that primarily travel within the VTRA study area in a north south direction (see Figure 36 and Figure 37) and therefore many would not be captured as entrance counts to the Strait of Juan de Fuca. Totaling the VTE for cargo focus vessels in Figure 4 we arrive at 65.7%. Therefore: Finding 1: Within the VTRA 2010 study area about 34.3% of the total time that focus vessels are underway is accounted for by vessels that carry oil products as cargo. The remainder 65.7% is attributed to focus vessels that carry other cargo. Informed by vessel time exposure, the VTRA 2010 analysis tool evaluates POTENTIAL accident frequency and POTENTIAL oil losses for tank focus vessels and cargo focus vessels. The Base Case Scenario (Case P) analysis, based on Vessel Traffic Operational Support System (VTOSS) 2010 data, serves as a reference point to evaluate relative risk changes due to selected potential maritime terminal developments. The Steering Committee chose to model traffic level impacts of maritime terminal development projects that were in advanced stages of a permitting process. Each planned project forms a What-If scenario and associated What-If vessels are added to the 2010 Base Case year, while keeping other traffic levels constant. Specifically, the following What-If Scenario’s were suggested for further analysis:
Case Q - GW 487: The Gateway bulk carrier terminal: 487 bulk carriers (318 Panama class and 169 Cape class). Case R - KM 348: The Trans-Mountain/Kinder Morgan pipeline expansion: 348 crude oil tankers (each 100,000 DWT). Case S - DP 415: The combination of proposed changes at Delta Port: 348 bulk carriers and 67 container vessels. Case T - GW-KM-DP: All three of the above scenarios operating at the same time. Moreover, the Steering Committee recommended that bunkering operations supporting these potential development projects be represented as well in the analysis. Figure 6 and Figure 7 visualize graphically one of the VTRA 2010 analysis output formats in a manner that hopefully waterway users, regulators and the public can understand. Figure 6 and Figure 7 are 3D visualizations of POTENTIAL oil losses within this study area and their


FINAL REPORT: VTRA 2010 2014
11 Prepared for Puget Sound Partnership - 3/31/2014
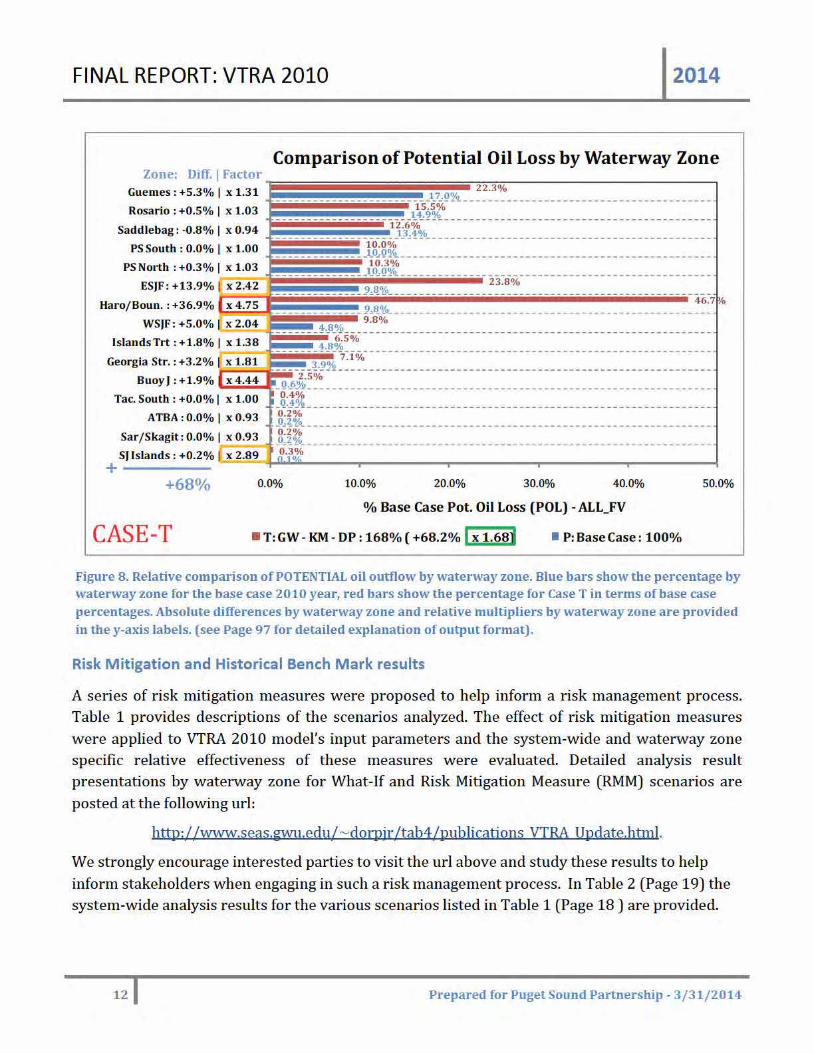
geographic distribution. Figure 6 depicts POTENTIAL oil losses for the 2010 Base Case Year (Case P), whereas Figure 7 depicts POTENTIAL oil losses when all three What-If scenarios are assumed operational at the same time (Case T). Figure 7 illustrates a 1.68 factor increase in overall POTENTIAL oil losses compared to the Base Case 2010 year without additional risk mitigation. This too demonstrates that throughout the VTRA 2010 we concentrate more on relative comparisons across accident types, oil outflow categories, What-If scenarios and waterway zones and less on the absolute values of the analysis results in our scenario analyses. For each what-if scenario and each waterway zone we evaluate the total annual focus vessel time of exposure (VTE) for each focus vessel type and compare it to their vessel time of exposure observed in the Base Case 2010 year. Similarly, we evaluate the total oil time exposure (i.e. the total amount of time a cubic meter of oil is moving through the area) for each what-if scenario, taking into account focus vessel fuel and oil cargo, and compare it to the oil time exposure (OTE) observed for the 2010 Base Case year. The VTE tends to be a driver in the analysis of POTENTIAL accident frequency, whereas the OTE tends to be a driver in the analysis of POTENTIAL oil losses. Figure 8 demonstrates a comparison by waterway zone of the POTENTIAL oil losses for the combined what-if scenario (Case T) to those in the Base Case 2010 year (Case P). A detailed explanation of the output format in Figure 8 is provided in the body of this report on Page 97. Figure 8 shows that while system-wide POTENTIAL oil losses increase by about +68% (1.68) in Case T (green highlight), larger percentages are observed for the following specific waterway zones (Orange and Red highlights): • Haro Strait/Boundary pass (+375%), • Buoy J (+344%) • San Juan Islands (+189%) • East Strait of Juan de Fuca (+142%), • West Strait of Juan de Fuca (+104%), • Georgia Strait (+81%), Most notably:
Finding 2: The Haro Strait/ Boundary pass and the Buoy J waterway zone specific relative increases in POTENTIAL oil loss are larger than 300% (Red highlights) when all three maritime terminal developments are assumed operational simultaneously. Despite Haro Strait/ Boundary pass and the Buoy J absolute contributions to system-wide POTENTIAL oil losses differing substantially in magnitude, relative changes in both waterway zones deserve further consideration. Be mindful that of the three maritime terminal development projects only the Trans-Mountain/Kinder Morgan expansion involves tankers.

FINAL REPORT: VTRA 2010 2014
13 Prepared for Puget Sound Partnership - 3/31/2014
Historical arrival data of tank and cargo focus vessels was obtained from the Marine Exchange of Puget Sound (MXPS). Tank focus vessel arrival data spanned 1998-2012. Cargo vessel Automatic Independent System (AIS) crossing line count data spanned 2008 – 2012 for crossing lines at the entrance to the West Strait of Juan de Fuca, Puget Sound and Georgia-Strait (see Figure 104 on page 137 for a depiction and general location of these crossing lines). Prior to 2008, AIS was either not available or not considered reliable for use herein. An analysis was conducted on both datasets (described in more detail in Chapter 9) and high and low years were selected from both data sets for benchmarking/ sensitivity analysis. High/Low years were used to define High/Low traffic scenarios by adding/canceling vessel transits to/from the 2010 Base Case (P) and the combined What-If Scenario (T). The purpose of benchmarking/sensitivity analysis is three-fold. First, to evaluate robustness of the 2010 Base Case (P) and Combined What-If (T) Scenario analyses in light of historical increases or decreases in traffic. Second, the high-low scenario analyses conducted on the Base Case (P) serve as a benchmark to compare (1) changes in risk levels evaluated for the various What-If and RMM Scenarios against (2) changes in risk levels evaluated at historical high/low traffic levels. Third, it provides context regarding changes occurring in the background that in conjunction with What-If Scenarios further inform the potential need for risk management actions. Analysis results for the Bench Marking/Sensitivity Scenarios are included in Table 2 as well. Table 2 shows (orange highlights) that from a tank focus vessel perspective, the high year adds about 2% of tank focus vessel VTE, whereas the low year removes about 2% of tank focus vessel VTE. Moreover, the blue highlights in Table 2 depict that in a high year for cargo focus vessels about 7%-2% = 5% of focus vessel VTE is added, whereas in the low year only 3%-2% = 1% of focus vessel time VTE is removed. Therefore: Finding 3: The VTRA 2010 Base Case (Case P) is from a historical perspective an average year in terms of tank focus vessel exposure and a rather low year in terms of cargo focus vessel exposure. Table 2 also lists POTENTIAL changes in risk from the Base Case 2010 year for the three individual What-If and High/Low Scenarios. By and large changes in risk evaluated for the What-If Scenarios exceed those for the high-year bench mark/sensitivity scenario. With the exception of the Delta Port What-If Scenario this observation applies to vessel time exposure, POTENTIAL accident frequency and POTENTIAL oil loss. For the Delta Port What-If Scenario this observation only applies to POTENTIAL accident frequency. Therefore: Finding 4: Were any of the three individual maritime terminal developments to come into effect, or any combination thereof, POTENTIAL changes in risk may be deemed significant changes from the Base Case 2010 year risk levels. It would thus only be prudent to consider

FINAL REPORT: VTRA 2010 2014
14 Prepared for Puget Sound Partnership - 3/31/2014
the implementation of one or more risk mitigation measures to counter those POTENTIAL risk increases. Eleven Risk Mitigation Measure (RMM) scenarios were evaluated for their potential effectiveness. For 9 out of the 11 RMM scenario’s, evaluated risk reductions were larger than the risk reductions evaluated for the low year Bench Mark/Sensitivity scenarios enacted on the Base Case 2010 year. Therefore: Finding 5: For 9 out of the 11 RMM scenarios evaluated, their risk reductions may be deemed significant reductions. Hence it is suggested that their associated risk mitigation measures be considered for implementation, should any of three individual maritime terminal projects, or any combination thereof, to come into effect. One of the challenges of exercising risk management over a large and complex waterway is being cognizant of both waterway zone specific and system-wide effects. One approach could be to evenly distribute potential risk increases across the affected area, i.e. to allow for risk increases in locations that currently have low risk levels compared to those that are already higher. On the other hand, one could aim for an equitable distribution of future risk allowing for each location to have a similar relative percentage increase in risk. Following either approach, we believe that the question “which risk mitigation measure should one implement?” is not the right question to ask, but rather one should ask oneself “which portfolio of risk mitigation measures should one implement”. A trial 6 RMM portfolio scenario analysis was conducted which resulted in a by enlarge across the board risk reduction across the various waterway zones considered in the VTRA study area (see Figure 9 and Figure 10). Most notably, evaluated overall risk reduction in POTENTIAL accident frequency (-29%) for the trial 6 RMM portfolio applied to the Combined What-If Scenario (T) resulted in lower POTENTIAL accident frequency (89%) than evaluated for the 2010 Base Case (P) POTENTIAL (green high lights in Figure 9 and Table 2). Evaluated POTENTIAL oil losses for the trial 6 RMM portfolio applied to the Combined What-If Scenario (T), on the other hand, were still higher (+24%) than the Base Case 2010 year (red high lights in Figure 10 and Table 2). Some caution is needed in interpreting the -29% risk reduction in POTENTIAL accident frequency in the green high light in Figure 9 and the -44% risk reduction in the red high light from Case T in Figure 10, as some of the risk mitigation measures efficiency in the 6 RMM trial portfolio are evaluated as maximum potential benefit analyses. Regardless, we arrive at the following conclusion: Finding 6: While evaluated POTENTIAL risk increases as a result of the three maritime developments may be deemed significant, the VTRA 2010 analysis supports that most of those system-wide risk increases may be mitigated utilizing a well designed RMM portfolio. In testament to the Puget Sound Harbor Safety Committee stated objective of instilling a safety culture within the Puget Sound maritime community, 4 out of the 11 suggested RMM scenario’s


FINAL REPORT: VTRA 2010 2014
16 Prepared for Puget Sound Partnership - 3/31/2014
involved risk mitigation measures that are currently under consideration or have been partially implemented. The evaluation of these RMM Scenarios was applied to the 2010 Base Case year. Subsequent analyses evaluated risk reductions for these RMM scenarios that exceed risk reduction in risk evaluated for the historical low year scenario. Hence: Finding 7: Even if none of the three individual maritime terminal developments were to come into effect, it is recommended that the risk mitigation measures applied to the 2010 Base Case Scenario be considered for system-wide implementation in the VTRA study area.
Closing Comments By providing analyses by waterway zone similar to the one depicted in Figure 8 for the various RMM scenario analyses, an information source is provided to help answer difficult and location specific risk management questions. In our opinion, given the number of communities involved in these waterway zones, these risk management questions can only be answered utilizing the collaborative analysis approach. No doubt, these risk management questions are equally important in other ongoing studies considering the potential risk increases as a result of traffic increases linked to proposed maritime terminal development projects. We close with the observation that there is a serious need for an electronic data source that is cross-boundary (US and Canadian waters) where the vessel type is consistently defined and verified beyond cargo focus vessel or tank focus vessel classifications. VTOSS and AIS are such cross-boundary data sources and could serve this purpose. However without currently possessing a common and consistently recorded vessel identifier or vessel type classification, VTOSS and AIS unfortunately still required vetting at the individual vessel level for the purpose of the analysis presented in this report. Moreover, with the same eye towards risk management analysis it would be equally beneficial if such datasets records capture cargo or at a minimum cargo levels (laden, unladen, 50% laden, etc.) and a cargo type. In particular, we would like to specifically call out the need for the electronic recording at a much greater consistency of the barge type and cargo content of tug-tows. Not only would studies like these benefit from the availability of such a data source, but the immediacy of having such information available could also benefit first responders responding to a spill scenario both from a response and a safety to the first responder perspective. Summarizing, we advocate a collaborative systems approach towards answering risk management questions, not one that is just locally targeted missing potential side effects or points of view. Ultimately, we believe that the strength of the VTRA 2010 analysis lies in this systems view, but equally important is the evaluation of relative POTENTIAL risk changes of What-If and RMM scenarios within in a single common framework. No doubt, the risk communication process amongst stakeholders that took place following the collaborative analysis approach in conducting these analyses during the VTRA 2010 and made possible by the Puget Sound Harbor Safety Committee is at least as important.

FINAL REPORT: VTRA 2010 2014
17 Prepared for Puget Sound Partnership - 3/31/2014
THIS PAGE IS LEFT INTENTIONALLY BLANK

FINAL REPORT: VTRA 2010 2014
18 Prepared for Puget Sound Partnership - 3/31/2014
Table 1. Short description of scenario analyses conducted utilizing the VTRA 2010 model
P - Base Case: 2010
Q - GW - 487 : Gateway
R - KM - 348: Kinder Morgan
S - DP - 415: Delta Port
T - GW - KM - DP: All Three
P - Base Case & DH100
P - Base Case & HE00
P - Base Case & HE50
P - Base Case & CONT17KNTS
Q - GW 487 & NBQ - GW 487 & NB & OH
T - GW - KM - DP & OW ATB
T - GW - KM - DP & EC
T - GW - KM - DP & EH
T - GW - KM - DP & ER
T - GW - KM - DP & 6RMM
P - Base Case & LOW TAN + CFV
P - Base Case & LOW TAN
P - Base Case & HIGH TAN
P - Base Case & HIGH TAN + CFV
T - GW - KM - DP & LOW TAN + CFV
T - GW - KM - DP & LOW TAN FV
T - GW - KM - DP & VAR
T - GW - KM - DP & HIGH TAN FV
T - GW - KM - DP & HIGH TAN + CFV
WHAT IF SCENARIO ANALYSIS
P - Base Case: 2010 - RISK MITIGATION MEASURE (RMM) ANALYSIS
Q - GW - 487 : Gateway - RISK MITIGATION MEASURE (RMM) ANALYSIS
T - GW - KM - DP: All Three - RISK MITIGATION MEASURE (RMM) ANALYSIS
P - Base Case: 2010 - BENCHMARK (BM) & SENSITIVITY ANALYSIS
Modeled Base Case 2010 year informed by VTOSS 2010 data amongst other sources.Gateway expansion scenario with 487 additional bulk carriers and bunkering supportTransmountain pipeline expansion with additional 348 tankers and bunkering support Delta Port Expansion with additional 348 bulk carriers and 67 container vessels
Case T with benefit OW ATB, EH, ER, P-HE50, Q-NB and P-CONT17 KNTS
Combined expnasion scenario of above three expansion scenariosBase Case year with 100% double hull fuel tank protection for Cargo Focus VesselsBase Case Year with 100% human error reduction on Oil Barges Base Case Year with 50% human error reduction on Oil Barges Base Case Year with max speed of 17 knots for container shipsGateway expansion scenario and no bunkering supportGateway expansion scenario and no bunkering support and traversing only Haro routesCase T with ATB's adhering to one way Rosario traffic regimeCase T with Cape Class bulk carrier given benefit of+ 1 escort on Haro and Rosario routesCase T with all Focus Vessels given benefit of +1 escort vessel on Haro routesCase T with Cape bulkers, laden Tankers, ATB's given benefit of +1 esc. on Rosario routes
Case T with additional variability in timing of What-If Focus Vessel arrivalsCase T with Tankers set at a high historical yearCase T with Tankers and Cargo Focus Vessels set at a high historical year
Base Case with Tankers and Cargo Focus Vessels set at a low historical yearBase Case with Tankers set at a low historical yearBase Case with Tankers set at a high historical yearBase Case with Tankers and Cargo Focus Vessels set at a high historical yearCase T with Tankers and Cargo Focus Vessels set at a low historical yearCase T with Tankers set at a low historical year
T - GW - KM - DP: All Three - BENCHMARK (BM) & SENSITIVITY ANALYSIS

FINAL REPORT: VTRA 2010 2014
19 Prepared for Puget Sound Partnership - 3/31/2014
Table 2. Summary of VTRA 2010 system-wide scenario analyses results. Detailed analyses results by waterway zone are dispersed throughout this report and available at: http://www.seas.gwu.edu/~dorpjr/tab4/publications_VTRA_Update.html
Vessel Time Exposure (VTE)
Oil Time Exposure (OTE)
Pot. Accident Frequency (PAF)
Pot. Oil Loss (POL)
P - Base Case: 2010 100% 100% 100% 100%
Q - GW - 487 : Gateway +13% | 113% +5% | 105% +12% | 112% +12% | 112%R - KM - 348: Kinder Morgan +7% | 107% +51% | 151% +5% | 105% +36% | 136%S - DP - 415: Delta Port +5% | 105% +3% | 103% +6% | 106% +4% | 104%T - GW - KM - DP: All Three +25% | 125% +59% | 159% +18% | 118% +68% | 168%
Vessel Time Exposure (VTE)
Oil Time Exposure (OTE)
Pot. Accident Frequency (PAF)
Pot. Oil Loss (POL)
P - Base Case: 2010 100% 100% 100% 100%P - Base Case & DH100 0% | 100% 0% | 100% 0% | 100% -8% | 92%P - Base Case & HE00 0% | 100% 0% | 100% -16% | 84% -4% | 96%P - Base Case & HE50 0% | 100% 0% | 100% -8% | 92% -2% | 98%P - Base Case & CONT17KNTS +4% | 104% +3% | 103% -4% | 96% -6% | 94%
Vessel Time Exposure (VTE)
Oil Time Exposure (OTE)
Pot. Accident Frequency (PAF)
Pot. Oil Loss (POL)
Q - GW - 487 : Gateway +13% | 113% +5% | 105% +12% | 112% +12% | 112%Q - GW 487 & NB -5% | 108% -1% | 104% -1% | 111% -10% | 103%Q - GW 487 & NB & OH -4% | 109% -2% | 104% -2% | 110% -7% | 105%
Vessel Time Exposure (VTE)
Oil Time Exposure (OTE)
Pot. Accident Frequency (PAF)
Pot. Oil Loss (POL)
T - GW-KM-DP: All Three +25% | 125% +59% | 159% +18% | 118% +68% | 168%T - GW - KM - DP & OW ATB +4% | 128% +4% | 163% -29% | 89% -44% | 123%T - GW - KM - DP & EC +1% | 126% +2% | 161% 0% | 118% 0% | 168%T - GW - KM - DP & EH 0% | 125% +0% | 159% -2% | 116% -4% | 164%T - GW - KM - DP & ER 0% | 125% +0% | 159% -7% | 111% -24% | 143%T - GW - KM - DP & 6RMM 0% | 125% +0% | 159% -8% | 111% -12% | 156%
Vessel Time Exposure (VTE)
Oil Time Exposure (OTE)
Pot. Accident Frequency (PAF)
Pot. Oil Loss (POL)
P - Base Case: 2010 100% 100% 100% 100%P - Base Case & LOW TAN + CFV -3% | 97% -14% | 86% -5% | 95% -20% | 80%P - Base Case & LOW TAN -2% | 98% -13% | 87% -4% | 96% -22% | 78%P - Base Case & HIGH TAN +2% | 102% +14% | 114% +3% | 103% +9% | 109%P - Base Case & HIGH TAN + CFV +7% | 107% +15% | 115% +4% | 104% +8% | 108%
Vessel Time Exposure (VTE)
Oil Time Exposure (OTE)
Pot. Accident Frequency (PAF)
Pot. Oil Loss (POL)
T - GW-KM-DP: All Three +25% | 125% +59% | 159% +18% | 118% +68% | 168%T - GW - KM - DP & LOW TAN + CFV -3% | 121% -15% | 144% -2% | 116% -27% | 141%T - GW - KM - DP & LOW TAN FV -2% | 123% -13% | 146% -3% | 116% -23% | 145%T - GW - KM - DP & VAR -1% | 124% -7% | 152% -3% | 116% -11% | 157%T - GW - KM - DP & HIGH TAN FV +3% | 128% +15% | 174% +6% | 125% +8% | 175%T - GW - KM - DP & HIGH TAN + CFV +6% | 131% +16% | 174% +8% | 127% +17% | 184%
T - GW - KM - DP: All Three - BENCHMARK (BM) & SENSITIVITY ANALYSIS
WHAT IF SCENARIO ANALYSIS
P - Base Case: 2010 - RISK MITIGATION MEASURE (RMM) ANALYSIS
Q - GW - 487 : Gateway - RISK MITIGATION MEASURE (RMM) ANALYSIS
T - GW - KM - DP: All Three - RISK MITIGATION MEASURE (RMM) ANALYSIS
P - Base Case: 2010 - BENCHMARK (BM) & SENSITIVITY ANALYSIS

FINAL REPORT: VTRA 2010 2014
20 Prepared for Puget Sound Partnership - 3/31/2014
THIS PAGE IS LEFT INTENTIONALLY BLANK

FINAL REPORT: VTRA 2010 2014
21 Prepared for Puget Sound Partnership - 3/31/2014
Table Contents Publication Information ..................................................................................................................................................................... vii Contact Information ............................................................................................................................................................................. vii PREFACE ..................................................................................................................................................................................................... 1 EXECUTIVE SUMMARY ......................................................................................................................................................................... 3 Description of Methodology .................................................................................................................................................................................... 4 Base Case and What-If Results ............................................................................................................................................................................... 7 Risk Mitigation and Historical Bench Mark results ................................................................................................................................... 12 Closing Comments .................................................................................................................................................................................................... 16 Table of Tables ........................................................................................................................................................................................ 23 Table of Figures ...................................................................................................................................................................................... 25 1. INTRODUCTION ................................................................................................................................................................................ 30 2. SUMMARY 2005 VTRA MODEL METHODOLOGY ................................................................................................................ 36 Situations (see Figure 3): ...................................................................................................................................................................................... 38 Incidents & Accidents (see Figure 3): .............................................................................................................................................................. 41 Oil Spill (see Figure 3): ........................................................................................................................................................................................... 41 Format of Scenario Analysis Results and Comparisons (See Figure 18) ......................................................................................... 44 Sensitivity and Uncertainty of Analysis Results .......................................................................................................................................... 45 3. UPDATING THE 2005 VTRA GW/VCU Model USING VTOSS 2010 DATA ................................................................. 47 Algorithmic cleaning of VTOSS 2010 data ..................................................................................................................................................... 49 Manual cleaning of VTOSS 2010 data .............................................................................................................................................................. 51 Vessel master type definition .............................................................................................................................................................................. 55 Comparing representative routes approach to the route segment approach ............................................................................... 57 Moving from Sampled Speeds to Calculated Speeds ................................................................................................................................. 59 Extending VTRA 2005 incident and accident probability models ...................................................................................................... 61 Oil carrying assumptions for focus vessels ................................................................................................................................................... 63 4. VALIDATION OF 2010 VTOSS AND AIS 2010 CROSSING LINE DATA ........................................................................ 67 Crossing line analysis of AIS 2010 data. ......................................................................................................................................................... 68 Matching VTOSS 2010 Vessel Types to AIS 2010 Vessel Types. .......................................................................................................... 69 Comparing VTOSS 2010 crossing line counts to AIS 2010 crossing line counts. ......................................................................... 70 5. TRAFFIC PATTERNS AND OIL MOVEMENTS INVTRA 2010 BASE CASE .................................................................. 73 Vessel Time of Exposure (VTE) .......................................................................................................................................................................... 76 Oil Time of Exposure (OTE) ................................................................................................................................................................................. 76 Traffic Densities Profiles ....................................................................................................................................................................................... 78 Oil Movement Density ............................................................................................................................................................................................ 78 6. ACCIDENT FREQUENCY AND OIL OUTFLOW RESULTS FOR VTRA 2010 BASE CASE ........................................ 81 Overall Accident and Oil Outflow Results ...................................................................................................................................................... 81 Accident and Oil Outflow Results by Focus Vessel Type ......................................................................................................................... 82 Geographic Profiles of Accident and Oil Outflow Results ....................................................................................................................... 84

FINAL REPORT: VTRA 2010 2014
22 Prepared for Puget Sound Partnership - 3/31/2014
7. WHAT-IF SCENARIOS ..................................................................................................................................................................... 89 Modeling the What-If Scenarios ......................................................................................................................................................................... 89 Summary of System-Wide What-If Scenarios Results .............................................................................................................................. 92 By waterway zone analysis results of What-If scenarios ........................................................................................................................ 97 Explanation format of by Waterway Zone analysis results ........................................................................................ 97 Gateway Terminal waterway zone results ..................................................................................................................... 100 Trans Mountain Pipeline waterway zone results ........................................................................................................ 100 Delta Port geographic waterway zone results .............................................................................................................. 101 Combined What-If scenario waterway zone results .................................................................................................. 101 8. RMM SCENARIOS ........................................................................................................................................................................... 113 Modeling the Risk Management Scenarios.................................................................................................................................................. 113 Summary of RMM Scenarios Results enacted on Base Case P ............................................................................................................ 117 By waterway zone analysis results of RMM measures enacted on base case (P) .......................................... 118 Summary of RMM Scenarios Results enacted on Gateway Terminal Case ................................................................................... 119 By waterway zone analysis results of RMM measures enacted on Gateway What-If Scenario (Q) ....... 124 Summary of RMM Scenarios Results enacted on Combined Case T ................................................................................................ 127 By waterway zone analysis results of RMM measures enacted on Combined What-If Scenario (T) ..... 130 9. BENCH MARK/SENSITIVITY SCENARIOS ........................................................................................................................... 137 Modeling the High-Low levels for Tank Focus Vessels .......................................................................................................................... 138 Modeling the High-Low Levels for Cargo Focus Vessels ....................................................................................................................... 138 Modeling added variability in arrivals of what-if focus vessels ......................................................................................................... 144 Bench marking the What-If Scenarios and the BM/Sensitivity Scenarios .................................................................................... 146 Bench marking at vessel time exposure level ............................................................................................................... 146 Bench marking at POTENTIAL accident frequency level ......................................................................................... 148 Bench marking at POTENTIAL oil loss level .................................................................................................................. 148 Bench marking the RMM Scenarios and the BM/Sensitivity Scenarios ......................................................................................... 149 Bench marking at vessel time exposure level ............................................................................................................... 149 Bench marking at POTENTIAL accident frequency level ......................................................................................... 150 Bench marking at POTENTIAL oil loss level .................................................................................................................. 150 By waterway zone analysis results of BM/Sensitivity scenarios enacted on base case (P) .................................................. 151 Summary of BM/Sensitivity Scenarios Results enacted on combined What-If scenario (T) ................................................ 154 By waterway zone analysis results of BM/Sensitivity scenarios enacted on combined case (T) ....................................... 155 10. CONCLUSIONS AND RECOMMENDATIONS ..................................................................................................................... 159 References ............................................................................................................................................................................................. 163 Appendix: Glossary and List of Acronyms ............................................................................................................................... 165 List of other VTRA meeting attendees ....................................................................................................................................... 166

FINAL REPORT: VTRA 2010 2014
163 Prepared for Puget Sound Partnership - 3/31/2014
References [1] George J. Busenberg (1999). “Collaborative and adversarial analysis in environmental policy”, Policy Sciences, Vol. 32, pp. 1-11. [2] J. R. van Dorp and J. R.W. Merrick (2009). “On a risk management analysis of oil spill risk using maritime transportation system simulation”, Annals of Operations Research, published online before print December 12, 2010, DOI: 10.1007/s10479-009-0678-1. (http://www.springerlink.com/content/w168111018754401/) [3] G. van de Wiel and J. R. van Dorp (2009). “An oil outflow model for tanker collisions and groundings”, Annals of Operations Research, published online before print November 25, 2010, DOI: 10.1007/s10479-009-0674-5. (http://www.springerlink.com/content/d7432xmg431v42q7/) [4] National Research Council (1998), Review of Prince William Sound Risk Assessment. Review of the Prince William Sound, Alaska, Risk Assessment Study Committee on Risk Assessment and Management of Marine Systems, Marine Board, ISBN: 0-309-55835-2, 78 pages. [5] J.R.W. Merrick, J. R. van Dorp, T. Mazzuchi, J. Harrald, J. Spahn and M. Grabowski (2002). “The Prince William Sound Risk Assessment”. Interfaces, Vol. 32 (6): pp.25-40. [6] J.R. van Dorp J.R.W. Merrick , J.R. Harrald, T.A. Mazzuchi, M. Grabowski, and J.E Spahn (2000). “A Systems approach to managing oil transportation risk in Prince William Sound”, Systems Engineering, Vol 3: pp. 128-142. [7] M. Grabowski, J.R.W. Merrick , J.R. Harrald, T.A. Mazzuchi, and J.R. van Dorp (2000). “Risk Modeling in Distributed, Large Scale Systems”, IEEE Transactions on Systems, Man, Cybernetics – PART A: Systems and Humans, Vol. 30 (6): pp. 651-660. [8] J.R. Harrald, T.A. Mazzuchi, J. E. Spahn, J.R. van Dorp J.R.W. Merrick, S. Shrestha, M. Grabowski (1998). “Using System Simulation to Model the Impact of Human Error in a Maritime Risk Assessment”. Safety Science, Vol. 30, pp. 235-247. [9] J.R. van Dorp J.R.W. Merrick , J.R. Harrald, T.A. Mazzuchi, and M. Grabowski (2001). “A Risk Management procedure for the Washington State Ferries”, Journal of Risk Analysis, Vol. 21 (1): pp. 127-142. [10] J.R.W. Merrick, J.R. van Dorp, J.P. Blackford, G.L. Shaw, T.A. Mazzuchi and J.R. Harrald (2003). “A Traffic Density Analysis of Proposed Ferry Service Expansion in San Francisco Bay Using a Maritime Simulation Model”, Reliability Engineering and System Safety, Vol. 81 (2): pp. 119-132.

FINAL REPORT: VTRA 2010 2014
164 Prepared for Puget Sound Partnership - 3/31/2014
[11] J.R. van Dorp, J.R.W. Merrick, J.R. Harrald, M. Gabowksi (2008) "Assessment of Oil Spill Risk due to Potential Increased Vessel Traffic at Cherry Point, Washington " Final Report – Completed August 2008. http://www.seas.gwu.edu/~dorpjr/tab4/publications technical.html [12] J.R. van Dorp, J.R.W. Merrick, J.R. Harrald, M. Gabowksi (2009), "VTRA Final Report Addendum: A response to 23 comments from the Corps", completed January 2009. http://www.seas.gwu.edu/~dorpjr/tab4/publications technical.html [13] J.R. van Dorp, J.R.W. Merrick (2009), "A Response to Seven Additional Questions Related to the VTRA Project", completed May, 2009. http://www.seas.gwu.edu/~dorpjr/tab4/publications technical.html [14] P. Szwed, J. Rene van Dorp, J.R.W.Merrick, T.A. Mazzuchi and A. Singh (2006). “A Bayesian Paired Comparison Approach for Relative Accident Probability Assessment with Covariate Information”, European Journal of Operations Research, Vol. 169 (1), pp. 157-177. [15] National Research Council (2001). Environmental Performance of Tanker Designs in Collision and Grounding, Special Report 259, Marine Board, Transportation Research Board, The National Academies. [16] Merrick, J. R. W. and J. R. van Dorp (2006). “Speaking the Truth in Maritime Risk Assessment”. Risk Analysis, Vol. 26 (1), pp. 223 - 237. [17] J.R.W.Merrick, J. Rene van Dorp, V. Dinesh (2004). “Assessing Uncertainty in Simulation Based Maritime Risk Assessment". Risk Analysis, Vo. 25 (3), pp. 731-743. [18] J.R van Dorp and S. Kotz (2003). “Generalized Trapezoidal Distributions”. Metrika, Vol 58, Issue 1, pp. 85-97. [19] J.R. van Dorp and J.R.W. Merrick (2013). Vessel Traffic Risk Assessment(VTRA): Updating the 2005 VTRA GW/VCU MTS Simulation Model from VTOSS 2005 to VTOSS 2010 data, Final report submitted to the Makah Tribal Council, April 2013, http://www.seas.gwu.edu/~dorpjr/VTRA/Makah/Final Report/MAKAH Final Report 20041013.pdf

FINAL REPORT: VTRA 2010 2014
165 Prepared for Puget Sound Partnership - 3/31/2014
Appendix: Glossary and List of Acronyms
• Allision–The collision of a vessel with its intended docking berth. • AIS – Automatic Identification System • ATB – Articulated Tug Barge • Ecology – The Washington Department of Ecology’s Spill Prevention, Preparedness and Response Program which is the primary state organization with authority and accountability for managing oil and hazardous material spill risk state-wide. Ecology is assisting PSP in conducting the VTRA with its expertise and experience. • EPA – Environmental Protection Agency. • MTS – Maritime Transportation System. • FV – Focus Vessel. • ITB – Integrated Tug Barge. • IV – Interacting Vessel. • MXPS – Marine Exchange Puget Sound. • NGO – Non-Governmental Organization. • NPO – Non-Persistent Oil • Study Area – The Washington waters of Puget Sound east of Cape Flattery, north of Admiralty Inlet and west of Deception Pass, and their approaches. • GW – George Washington University is the prime subgrant awardee. • VCU – Virginia Commonwealth University is a sub-awardee to GW. • GW/VCU – The technical team composed of GW and VCU. • PO – Persistent Oil. • PSP – The Puget Sound Partnership is the Washington state agency responsible for developing a Puget Sound Action Agenda, convening a Cross Partnership Oil Spill Work Group and for coordinating work to restore and protect Puget Sound. • PSHSC – The Puget Sound Harbor Safety Committee. • VTRA 2010 Steering Committee – A steering committee of stakeholders advising the Puget Sound Partnership and GW/VCU over the course of this study. • QAPP – Quality Assurance Project Plan • USCG – US Coast Guard Sector Seattle, District 13. • VTOSS – Vessel Traffic Operational Support System • VTRA – Vessel Traffic Risk Assessment • VTS – Vessel Traffic Service is the real-time marine traffic monitoring system used by the USCG, similar to air traffic control for aircraft.

FINAL REPORT: VTRA 2010 2014
166 Prepared for Puget Sound Partnership - 3/31/2014
List of other VTRA meeting attendees Individuals who attended one or more meetings (alphabetized by organization) 1. Scott McCreery (BP) 2. John Robinson (Cardno-Entrix) 3. Tom Ehrlichman, Barbara Dykes (Center for Salish Community Strategies) 4. Kevin Campion (Deep Green Wilderness) 5. John Kaltenstein (Friends of the Earth) 6. Sam Olson (Friends of the San Juans) 7. David Gray, Eleanor K. N. Kirtley (Glosten Associates) 8. Michael Davies, Bikramjit Kanjilal and Kris Faucett (Kinder Morgan) 9. Gordon Maclean (Marine Exchange) 10. Michael O’Leary (National Wildlife Federation) 11. George Galasso (Olympic Coast National Marine Sanctuary) 12. Dave and Karen Anderson (Orca Network) 13. Arif Ghouse (Port of Seattle) 14. Andreas Udbye (Portland State University) 15. Daryl Williams, Preston Hardison (Tulalip Tribe) 16. JD Ross Leahy (University of Washington -SMEA) 17. Justin Willig (University of New Hampshire graduate) 18. Marc Ashley (USCG Sector Seattle) 19. Todd Malloy