final report -- vr -- br - bren school of environmental ... · pdf filesignature page as...
TRANSCRIPT
MICROFIBER POLLUTIONand the apparel industry
Nicholas Bruce | Niko Hartline | Steph Karba | Bess Ruff | Shreya Sonar
Faculty AdvisorDr. Patricia Holden

THIS PAGE IS INTENTIONALLY LEFT BLANK

Signature Page As authors of this Group Project report, we are proud to publish this report on the Bren School’s website such that the results of our research are available for all to be read. Our signatures on the document signify our joint responsibility to fulfill the archiving standards set by the Bren School of Environmental Science & Management. _____________________________________ _____________________________________
Nicholas Bruce Niko Hartline
_____________________________________ _____________________________________ Stephanie Karba Bess Ruff
_____________________________________ Shreya Sonar
The mission of the Bren School of Environmental Science & Management is to produce professional with unrivaled training in environmental science and management who will devote their unique skills to the diagnosis, assessment, mitigation, prevention, and remedy of the environmental problems of today and the future. A guiding principal of the School is that the analysis of environmental problems requires quantitative training in more than one discipline and an awareness of the physical, biological, social, political, and economic consequences that arise from scientific or technological decisions. The Group Project is required of all students in the Master of Environmental Science and Management (MESM) Program. The project is a three-quarter activity in which small groups of students conduct focused, interdisciplinary research on the scientific, management, and policy dimensions of a specific environmental issue. This Group Project Final Report is authored by MESM students and has been reviewed and approved by: __________________________________________ ________________________ Patricia Holden Date

THIS PAGE IS INTENTIONALLY LEFT BLANK
Acknowledgements
Client: Patagonia
Elissa Loughman, Manager of Product Responsibility
Jill Dumain, Director of Environmental Strategy
Elena Egorova, Environmental Metrics Associate
Faculty Advisor:
Patricia Holden, UCSB Bren School
External Advisors:
Nicholas Mallos, Ocean Conservancy
Roland Geyer, UCSB Bren School
External Assistance/Research:
Chelsea Rochman, UC Davis
John Kester III, The Sustainability Consortium
Sherri Mason, State University of New York
Rebecca Sutton, San Francisco Estuary Institute
Blake Kopcho, 5 Gyres
Anna-Marie Cook, Environmental Protection Agency, District 9
Andria Ventura, Clean Water Action

TABLE OF CONTENTS Abstract…………………………………………………………………………….i Acronyms………………………………………………………………………….ii Definitions………………………………………………………………………...iii Executive Summary………………………………………………………………iv List of Figures…………………………………………………………………….vi List of Tables……………………………………………………………………..vii 1. Project Objectives……………………………………………………………...1 2. Significance…………………………………………………………………….2 3. Background…………………………………………………………………….3 4. Literature Review……………………………………………………………...4
4.1. Chemical Substance on Finished Garments………………………………..4 4.2. Wastewater Treatment Plants………………………………………………7 4.3 Distribution………………………………………………………………...11 4.4 Ecological Impacts………………………………………………………....17
5. Methods……………………………………………………………………….21 5.1 Washing Methodology……………………………………………………..21 5.2 Massing Methodology……………………………………………………...24 5.3 Data Methodology………………………………………………………….25 5.4 Model Methodology………………………………………………………..26
6. Results…………………………………………………………………………27 6.1 Treatment Effects…………………………………………………………...27 6.2 Jacket Comparisons………………………………………………………...30 6.3 Filter Size Capture………………………………………………………….35 6.4 Model Results………………………………………………………………44
7. Discussion……………………………………………………………………..46 7.1 Literature Review…………………………………………………………...46 7.2 Wash Experiments………………………………………………………......47 7.3 WWTP Model…………………………………………………………....... 49
8. Conclusion…………………………………………………………………….50 References………………………………………………………………………..56 Appendix…………………………………………………………………………57 A1. Wash Protocol…………………………………………………………………………..57 A2. Literature Review……………………………………………………………………….61 A3. Data Methodology………………………………………………………………………98

i
Abstract Microfibers, a subcategory of microplastics, are an emerging pollutant with widespread distribution in the environment and negative ecological impacts. While regulations have been implemented recently to prohibit some forms of microplastic pollution, such as cosmetic microbeads, microfibers have yet to be addressed. Regulatory action is likely deterred by knowledge gaps regarding sources of microfibers and their potential impacts. As such, this project seeks to analyze and contextualize microfiber pollution from synthetic clothing. The scientific literature review provides a background on the distribution and impacts of microfiber pollution while also identifying key deficiencies in scientific knowledge to develop a better understanding of the magnitude of microfiber impacts. Along with the literature review, the experimental analysis of shedding from synthetic jackets supports the growing body of evidence that synthetic apparel is a substantial contributor to microplastic pollution. Much of this contribution is through the release of microfibers in washing machine effluent. The results confirm the loss of microfibers via washing and indicate that clothing age, washing machine type, and clothing construction significantly alter shedding characteristics. Further testing with the shedding protocol that we developed would clarify factors influencing shedding dynamics, such as water temperature and detergent type, and provide clear recommendations for policy-makers and organizations to address microfiber pollution from synthetic clothing at its source.

ii
Acronyms WWTP - Wastewater Treatment Plant PBT - Persistent, bioaccumulative, and toxic substance PCB - Polychlorinated Biphenyl PP - Polypropylene PE - Polyethylene PS - Polystyrene PA - Polyamide PET - Polyethylene Terephthalate EPS - Expanded Polystyrene PVC - Polyvinyl Chloride EVA - Ethylene-vinyl Acetate EPDM Rubber - Ethylene Propylene Diene Monomer Rubber PUF - Polyurethane Foam
iii
Definitions Microplastics - Plastic particles less than 5 millimeters in diameter unless stated otherwise. Microsynthetic fibers - Small plastic particles within the category of microplastics that are fibrous in shape (< 5 millimeters long); commonly referred to as microfibers Nanoparticles - particles between 1 and 100 nanometers (10 -9 meters) in size Sorb - To take up and hold by either adsorption or absorption Plasticizers - Additives that enhance the plasticity or fluidity of a material Effluent - Final liquid discharged by a WWTP into a waterbody Influent - Pretreatment water entering a WWTP Biofouling - The accumulation of microorganisms, algae, or other organic pollutants onto a surface. Such accumulation can occur on a microfiber surface. Pilling - The formation of small balls of fibers on the surface of a jacket Linear Density - Mass per unit length

iv
Executive Summary The prevalence of microfiber pollution in the environment is of increasing concern to researchers, apparel manufacturers, and the general public. However, the knowledge of pollution from microfibers, a subcategory of microplastics consisting of small fibers shed from clothing or other textiles, is limited. For the purpose of this report, we will focus on microfibers from synthetic clothing and textiles, the most prominent of these being polyester, acrylic, nylon, and rayon. As an outdoor clothing company that relies heavily on synthetic materials, Patagonia, Inc. is increasingly concerned about their contributions to microfiber pollution. However, because the vast majority of the public wears and washes synthetic clothing, this is not an isolated problem. Through the experimental research and the qualitative analysis of current literature, this project seeks to better understand how microfibers are distributed in the environment and the potential impacts associated with the presence of microfibers. We also develop a protocol that can be used by Patagonia and the apparel industry to better understand the quantity of microfibers shed by their garments. To better understand the emerging issue of microfiber pollution, we compiled an extensive literature review of previous studies. The literature review revealed: ● Finished apparel products contain large quantities of chemical substances from
processing and finishing steps in garment manufacturing, many of which are released from garments during consumer washing. This indicates that microfibers are of particular concern regarding their potential to transport hazardous chemicals into the environment.
● Wastewater treatment plants (WWTPs) receive large amounts of microfibers daily. While most of these microfibers are removed, a significant amount is still released into the local environment. Due to the high capital costs of WWTPS, upgrading WWTPs is not a feasible solution to microfiber pollution.
● Analysis of global water and sediment sampling data indicates that microfibers are ubiquitous in aquatic environments. Recent evidence supports microfiber pollution pervading terrestrial environments and the atmosphere as well. Although soil systems may be the primary receptors of microfibers, microfiber distribution in aquatic systems is currently the best understood.
● Aquatic organisms throughout the food chain consume microplastics and microfibers both directly and indirectly. Within the food chain, these particles have been found to cause physical and chemical impacts, resulting in starvation and reproductive consequences in species. Microplastics and microfibers have also been found in marine species directly consumed by humans, the effects of which are unknown. They have also been found in abiotic ocean products like sea salt.

v
To quantify microfiber shedding from washing synthetic jackets, we conducted a series of wash experiments with four different types of synthetic Patagonia jackets and one budget fleece jacket for comparison. The budget jacket is comparable in material composition and function to one of the Patagonia jackets. To better understand what factors significantly impact shedding, we evaluated the effects of washing machine type and the age of the garment on the mass of microfibers released. The analyses showed that the top-load washing machine trials had more than twice the microfiber shedding of the front-load machine trials and that aging of jackets significantly increased the mass of fibers shed. Additionally, we found that the budget synthetic fleece jacket shed more than the Patagonia-equivalent jacket, indicating that jacket construction could influence microfiber shedding. The investigation revealed that microfibers are a pervasive pollutant and could be affecting ecosystems and human health. The study demonstrates a need for further research on shedding characteristics of apparel and the development of mitigation measures by producers, consumers, waste managers, and policymakers towards addressing the issue of microfiber pollution. Furthermore, the study was specific to four Patagonia jackets and one budget jacket; individual manufacturers would need to conduct their own analyses of their product line in order to assess their contributions to microsynthetic fiber pollution. They can do so using the experimental design developed for this project. Moving forward, we recommend the following areas of research be pursued: ● Apparel industry:
○ Effects of garment construction, washing machine type and fabric composition ○ Use of recycled polyester and bio-based synthetic textiles ○ Possibility of re-incorporating fibers shed in consumer washing phase in garment
manufacturing ● Appliance industry:
○ Practicality and economic feasibility of attaching a filter on the output pipe of washing machines
○ Effects of water temperature, cycle length, and other washing characteristics ● Commercial and household laundry:
○ Factors influencing consumers to wash garments less frequently, switch to front-load washing machines, and take other precautionary measures to reduce microsynthetic fiber shedding
○ Detergent additives that reduce fiber breakage ○ Ways for consumers to dispose of fibers responsibly
vi
List of Figures Figure 3.1. World Fibre Production 1980-2025 ......................................................................... 3
Figure 4.1. Textile supply chain ................................................................................................... 5
Figure 4.2. Pathways of chemical release from textiles ............................................................. 6
Figure 4.3. Microfiber distribution conceptual box model ..................................................... 12
Figure 4.4. Microfiber marine transport conceptual model ................................................... 14
Figure 4.5. Seawater microfiber concentration and global synthetic fiber production ....... 15
Figure 4.6. Modeled surface distribution of plastics ................................................................ 16
Figure 5.1. Conceptual graphic of experimental design .......................................................... 23
Figure 5.2. Photo of filtration column ....................................................................................... 24
Figure 6.1. Washing machine load mass comparison .............................................................. 27
Figure 6.2. New and Aged mass comparison ............................................................................ 28
Figure 6.3. Aging and washing machine load mass comparison ............................................ 29
Figure 6.4. Jacket type mass comparison ................................................................................. 31
Figure 6.5. Jacket type and washing machine load mass comparison ................................... 32
Figure 6.6. Jacket type and aging mass comparison ................................................................ 33
Figure 6.7. Filter size mass comparison .................................................................................... 35
Figure 6.8. Filter size and washing machine load mass comparison ...................................... 37
Figure 6.9. Front-load washing machine aging and filter size mass comparison ................. 38
Figure 6.10. Top-load washing machine jacket type and filter size mass comparison ......... 39
Figure 6.11. Front-load washing machine jacket type and filter size mass comparison ...... 40
Figure 6.12. Jacket type across all treatments mass comparison ........................................... 42
Figure 6.13. Jacket type across all treatments size percent comparison ............................... 43
Appendix Figure A.1. Decrease in compound concentration after washing ........................................... 66
Figure A.2. Global surface concentration of plastics ............................................................... 76
Figure A.3. Claessens et al. sampling locations along Belgian Coast ..................................... 80
vii
List of Tables Table 4.1. Microfiber and microplastic concentrations in WWTP influent ............................ 8
Table 4.2. Microfiber and microplastic concentrations in WWTP effluent ............................ 9
Table 5.1. Body fabric composition of tested jackets ............................................................... 21
Table 6.1. Jacket type across all treatments mass comparison ............................................... 34
Table 6.2. Jacket type across all treatments normalized mass comparison .......................... 34
Table 6.3. Modeled microfiber mass to WWTP: 100,000 Patagonia jackets ........................ 44
Table 6.3. Modeled microfiber mass to WWTP: 100,000 people ........................................... 45
Appendix Table A.1. Reviewed papers on microplastic river distribution ............................................. 63
Table A.2. Reviewed papers on microplastic lake and reservoir distribution ...................... 83
Table A.3. Reviewed papers on microplastic beach distribution ........................................... 83
Table A.4. Multiple regression of washing machine load interaction with filter size ........... 84

1
1. Project Objectives This project seeks to explore the potential impacts on the environment, to quantify microsynthetic fibers released from synthetic jackets during washing, and to identify opportunities for further research. Specific objectives and deliverables include: 1) Understand the Impacts Literature Review We conducted a comprehensive review of the current literature on microplastic and microsynthetic fiber pollution. It forms an up-to-date understanding of the substances that microfibers are coated with as well as the release, distribution, and ecological impacts of microfibers in the environment. 2) Quantify the Release of Fibers from Jackets Experimental Design We designed an innovative, replicable, and controlled experiment that can be used by various companies, research institutions, and other organizations interested in exploring microfiber shedding. Our easily replicable protocol will allow product designers and sustainability managers to assess the mass of microfibers that are released by their product lines; therefore, pin pointing high and low shedders. Model of Fiber Release We created a model based on the literature review and experimental results to estimate the amount of microfibers entering and exiting a wastewater treatment plant. 3) Make Recommendations for Further Research We provide suggestions for innovative opportunities and outline further research questions. Key Questions This project focuses on answering four key questions:
1. What factors significantly impact shedding?
2. Where are the fibers present in the environment?
3. What are the ecological impacts?
4. What must be further researched?
2
2. Significance Microplastic pollution in the environment is a prominent yet poorly defined issue. Microplastic particles have been found on beaches and agricultural land as well as in lakes and oceans across the globe, making this an international problem. While much research has been done to identify microplastics in lakes and oceans, little is known about their impacts on the ecosystems in which they are found. Among the various types of microplastics that have been found in aquatic systems, microfibers have been found to be the most prominent form in some habitats, specifically near dense human populations. Patagonia, Inc. is part of an apparel industry that contributes to microfiber pollution through their production facilities as well as from consumers washing their products. Information is lacking for Patagonia and the apparel industry as a whole in terms of the extent of their role in microfiber pollution and, again, the impacts this pollution has on the ecosystems in which it is found. As such, the Patagonia Plastics Project is assisting Patagonia in assessing the quantity of microfibers shed by their products and the potential ecological impacts of those fibers as well as develop recommendations to inform future steps to mitigate this pollution.

3
3. Background The contributors to and impacts of microplastic pollution are of increasing public concern, as evidenced by recent state and federal legislation banning microbeads from cosmetic products (California AB-888; H.R. 1321). These actions have forced changes in how the cosmetic industry makes its products and have led to increasing concerns surrounding other categories of microplastics, such as microsynthetic fibers, hereafter referred to as microfibers. Microfibers are released by synthetic clothing through regular wear and washing. Although no current legislation related to microfiber pollution exists, the growing evidence that they are a hazardous issue could lead to future regulatory efforts. Just as the cosmetic industry had to adapt to the microbead bans, the apparel industry will likely bear the responsibility for new microfiber regulations. The cosmetic industry was able to replace microbeads with natural alternatives such as sand and nut shells that provided the same function as their plastic counterparts. However, the apparel industry faces a more difficult situation as alternatives to synthetic textiles are limited and struggle to mimic the performance capabilities of materials like polyester. Since its invention in 1979, the use and demand for polyester-based clothing has grown exponentially (See Figure 3.1). According to Technon OrbiChem’s 2014 technical report of the textile industry, the growth of polyester was two to three times that of all other fibers over the course of the last five years. Polyester also makes up over 95% of the future global synthetic fiber production growth. By 2025, production is expected to reach 84 million metric tons. As demand for this textile rises, environmentalists are becoming increasingly concerned about the life cycle effects of this fiber.
Figure 3.1
Polyester fiber production is increasing exponentially.
Historical and projected global fiber production (in million metric tons) from 1980 to 2025.
Source: Yang, 2014.
4
4. Literature Review Microfiber pollution is an emerging issue in environmental management, yet very little has been done in terms of synthesizing the available information on them. As such, much of our review is in the scope of microplastics with the understanding that microfibers have been found to be the most prevalent form of synthetic particles in some aquatic environments (Browne et al., 2011).We found that much of the current research on microfibers is disseminated across four major categories: chemical substance coatings, fate in wastewater treatment plants (WWTPs), distribution of microfibers in the environment, and potential ecological impacts. An in-depth compilation of each category's articles can be found in the literature review section (Appendix A2). 4.1 Chemical Substances on Finished Garments 4.1.1 Textiles industry Technical garments coated with substances like nanoparticles, anti-bacterials, and UV absorbents shed microfibers during consumer washing and these substances are potentially transported to the marine environment via microfibers. No literature was found to confirm that microfibers transport these substances from finished garments during consumer washing; however, “wash-out” effect of chemicals was studied and reported. This section provides an overview of the size of the apparel industry, chemical management in garment manufacturing, types of coatings applied to garments, and “wash-out” effects. The textile industry is considered one of the most polluting in the world (Muthu, 2014). Harmful chemicals and high-energy use in addition to water consumption, waste generation, transportation, and non-biodegradable packaging materials are responsible for the resource heavy life cycle of textiles and clothing. Figure 4.1 shows the business environment of the textiles industry in which textile producers process fabric created from yarn, and then, cut and sew the fabric to make final products. The majority of the chemical use in textile production occurs during “wet processing”, which includes dyeing, washing, printing, and fabric finishing. These chemicals also persist in finished garments. While not all chemicals have been tested, a small portion of them like lead, flame retardants and certain colorants have been identified as hazardous at high concentrations (Muthu, 2014). Despite the small number of these chemicals, the global nature of the complex supply chain poses a challenge to transparency for substances used in textile processing due to lack of record keeping and data sharing.

5
In most cases, brand owners trigger the product development process, including research and design and, therefore, are in the best place to control the chemicals used in production processes and the final product.
Figure 4.1
Textile supply chain.
Business ecosystem of textile supply chain.
Source: Muthu, 2014
4.1.2 Chemical Coatings Synthetic dyes provide many functions other than color. Dyes belonging to classes such as azo, cyanine, coumarin, xanthene, naphthalimide, perylene, thioxanthone, quinonoid, and naphtholactam are being used to provide functions like water repellency as well as antimicrobial and UV-absorbent properties to technical textiles (Sekar, 2013). Nanotechnology is widely being used in the finishing of technical textiles and is improving existing functions and providing new complex functions. Nanoparticles like titanium dioxide, silver, copper, zinc oxide, and carbon nanotubes are used to provide functions like stain resistance, antibacterial, flame-retardancy, UV-blocking, anti-static etc. (Gulrajani, 2013). Enzymes are used in the textile processing phase to improve the “wettability” of synthetic fibers to allow for better coating of dyes. However, they are currently not being used on an industrial scale and are unlikely to be found in finished garments (Paul et al., 2013).

6
4.1.3 Release pathways and potential risks The presence of synthetic dyes and nanoparticles in high concentrations in finished garments poses a potential risk to human health and ecotoxicity via direct contact or chemical release from washing a garment. Possible release pathways and sinks are shown below (Figure 4.2).
Figure 4.2
Pathways of chemical release from textiles.
Chemical release pattern from textiles.
Source: Luongo, 2015
A study conducted in Sweden tested for the presence of quinoline and its derivatives in finished garments manufactured in at least 17 countries. Quinoline was found in all garments made from 100% polyester, and the highest levels were found in the polyester samples. Quinolone is a class of compounds used in dyes and certain classes of quinoline compounds are skin irritants and/or probable human carcinogens (Luongo et al., 2014). Researchers at Stockholm University conducted experiments to quantify the “wash out” effect of chemicals from garments in the laundry wash phase. Concentrations of quinoline, benzothiazole, benzotriazole and derivative compounds were quantified in the garment after 5 and 10 washes. Results showed that different chemicals had different washout effects with the loss range being 20% to more than 50% after 10 washings. The demonstrated that significant amounts of the chemicals remain in the clothes for a long time and thus have the potential of a chronic impact on human health while the released chemicals enter household wastewater (Luongo, 2015). Another study tested the presence of per- and polyfluorinated chemicals (PFCs) in 36 of the 40 outdoor products sampled including jackets, trousers, footwear, backpacks, tents, sleeping bags and ropes. The highest concentrations of total volatile PFCs were 1,000 µg/m2 in footwear (Santen, Brigden, & Cobbing, 2016). PFCs are persistent in the environment, detected in the environment, plants, animal, fish, and birds as well as human blood and breast milk (Santen,

7
Brigden, & Cobbing, 2016; Whitacre, 2008). There is evidence of liver toxicity in animals and reduced fertility and birth weight in humans (Webster, 2010). These studies indicate that chemicals found in finished garments could pose a serious threat to human health and the environment if their concentrations are not monitored. While monitoring does not prevent harm, it is the first step toward managing this issue. 4.1.4 Apparel Industry’s Restricted Substance List While global oversight is lacking, there is stringent legislation on chemical substance regulation for American and European brands. Occasionally, apparel companies make internal decisions to restrict the use of substances identified as hazardous to the workers, consumers or the environment. The American Apparel and Footwear Association (AAFA) created a list of such substances in 2007 and companies like Nike, Levi Strauss, VF Corporation, Puma, Patagonia, and others have modified versions of this list applicable to each products ranging from footwear and apparel for infants to sports and electronic equipment. Lists include the maximum allowed concentration, test methods, and reasons for ban or restricted use (American Apparel & Footwear Association, 2013). These lists are communicated to suppliers with an expectation to comply over a set time period (VF Corporation, 2015). In 2007, the European Commission implemented Registration, Evaluation, Authorization and Restriction of Chemicals (REACH), a regulation that stemmed from its commitment to protect human and environmental health from hazardous substances. The regulation shifts responsibility from public authorities to industry, with regards to assessing and managing the risks posed by chemicals and providing appropriate safety information for their users(European Commission). Microfibers are likely responsible for transporting chemical substances from apparel products into the environment. It is therefore important for further research be developed in this area.
4.2 Wastewater Treatment Plants Wastewater Treatment Plants (WWTPs) play a critical role in the fate and transport of microfibers into the environment. In countries with sewage infrastructure, the greywater generated by washing machines is discharged into the local sewer system. This influent is treated by the WWTP and then discharged as treated effluent, which is released into water bodies such as rivers, streams, and oceans. Numerous studies have found evidence of microplastic and microfiber contamination in WWTP influent, with varying levels of incoming microfiber concentration (Table 4.1). These variations are likely due to differences in sampling methods; for example, the study of the Lysekil, Sweden WWTP only analyzed fibers 300 µm and larger while other studies analyzed fibers 20 µm and

8
larger (Talvitie et al., 2015). Variations can also be attributed to the time of day and season of the sampling. (Talvitie et al., 2015). Apart from the Viikinmaki, Finland WWTP, all of the WWTPs studied had higher concentrations of microfibers than microplastics. As such, it is likely that microfiber pollution accounts for the majority of the microplastic contamination reaching WWTPs.
Table 4.1
Microfiber and microplastic concentrations in WWTP influent.
Wastewater Treatment Plant
Microfiber Concentration (fibers/m3)
Microplastic Concentration (particles/m3)
Treatment Volume (m3/day)
Paris, France 290,000 0 240,000
Viikinmaki, Finland
180,000 430,000 270,000
Lysekil, Sweden
10,700 4,400 5,160
St. Petersburg, Russia
467,000 160,000 950,000
Reported average microfiber concentrations (fibers/m3) and microplastic
concentrations (particles/m3) in influent and volume of wastewater treated per day (m3/day).
Sources: Talvitie & Heinonen, 2014; Gasperi et al., 2015; Magnusson & Norén, 2014; Talvitie et al., 2015
Using the daily treatment volume, the quantity of microfibers entering WWTPs ranged from 550 million fibers/day to 440 billion fibers/day. Since the ability of WWTPs to remove microfibers determines how many microfibers are released into the aquatic environment, WWTP removal is a critical component in the fate and transport of micro fibers. The mass of microfibers released by synthetic clothing into the environment will strongly depend on whether wastewater from washing machines is treated and the effectiveness of treatment. Once influent wastewater is treated, it is released as effluent into a water body such as a stream, river, or ocean. The area of influence of this discharge depends on the location and design of the WWTP outfall. Effluent discharge often contains suspended solids, such as microfibers, which are not removed during the treatment processes. The concentrations of microfibers in effluent
9
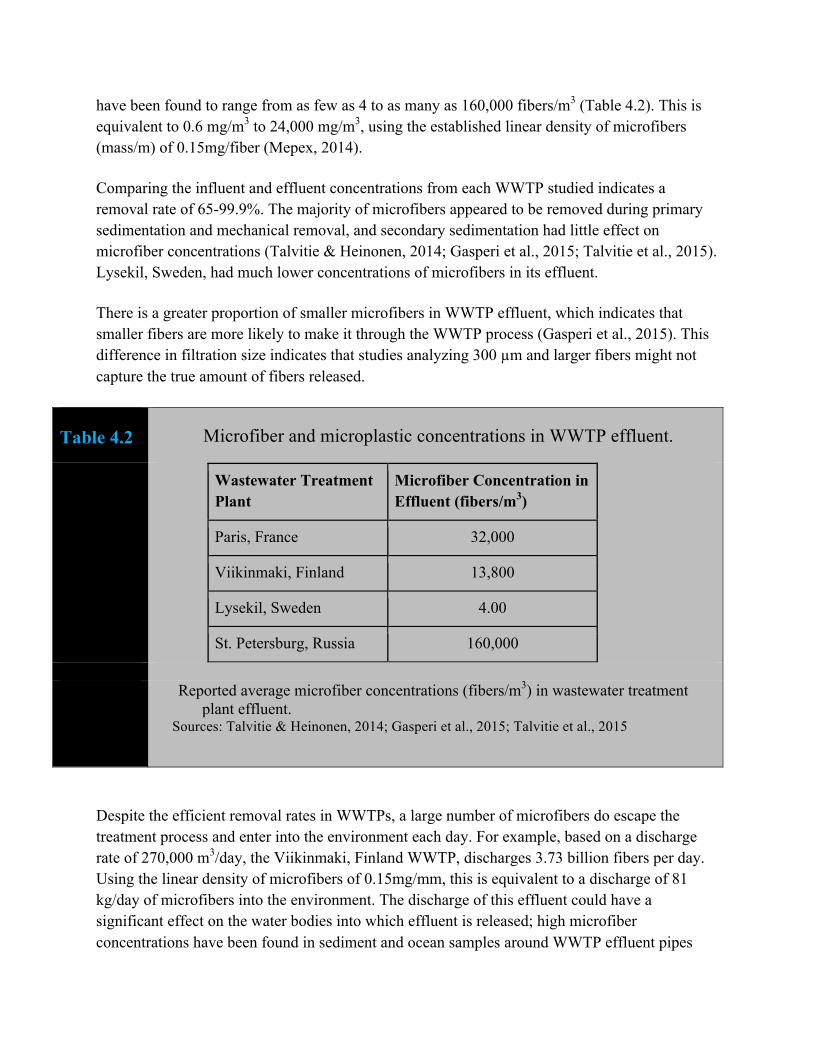
have been found to range from as few as 4 to as many as 160,000 fibers/m3 (Table 4.2). This is equivalent to 0.6 mg/m3 to 24,000 mg/m3, using the established linear density of microfibers (mass/m) of 0.15mg/fiber (Mepex, 2014). Comparing the influent and effluent concentrations from each WWTP studied indicates a removal rate of 65-99.9%. The majority of microfibers appeared to be removed during primary sedimentation and mechanical removal, and secondary sedimentation had little effect on microfiber concentrations (Talvitie & Heinonen, 2014; Gasperi et al., 2015; Talvitie et al., 2015). Lysekil, Sweden, had much lower concentrations of microfibers in its effluent. There is a greater proportion of smaller microfibers in WWTP effluent, which indicates that smaller fibers are more likely to make it through the WWTP process (Gasperi et al., 2015). This difference in filtration size indicates that studies analyzing 300 µm and larger fibers might not capture the true amount of fibers released.
Table 4.2
Microfiber and microplastic concentrations in WWTP effluent.
Wastewater Treatment Plant
Microfiber Concentration in Effluent (fibers/m3)
Paris, France 32,000
Viikinmaki, Finland 13,800
Lysekil, Sweden 4.00
St. Petersburg, Russia 160,000
Reported average microfiber concentrations (fibers/m3) in wastewater treatment
plant effluent. Sources: Talvitie & Heinonen, 2014; Gasperi et al., 2015; Talvitie et al., 2015
Despite the efficient removal rates in WWTPs, a large number of microfibers do escape the treatment process and enter into the environment each day. For example, based on a discharge rate of 270,000 m3/day, the Viikinmaki, Finland WWTP, discharges 3.73 billion fibers per day. Using the linear density of microfibers of 0.15mg/mm, this is equivalent to a discharge of 81 kg/day of microfibers into the environment. The discharge of this effluent could have a significant effect on the water bodies into which effluent is released; high microfiber concentrations have been found in sediment and ocean samples around WWTP effluent pipes

10
(Magnusson & Norén, 2014; Talvitie et al., 2015). Additionally, microfibers discharged in effluent are more mobile in the environment than other microplastics. At the Lysekil WWTP, an equal portion of microfibers and other microplastics were discharged from the effluent pipe into the ocean; however, only microfibers were found in the seawater samples around the effluent pipe (Magnusson & Norén, 2014). 4.2.1 Microfibers in Sewage Sludge Even if WWTPs were 100% effective in the removal of microfibers, they can still enter the environment in the form of sewage sludge, a byproduct of the wastewater treatment process. Due to its nutritional and organic content, sludge is increasingly being applied to farmland as fertilizer (Habib, Locke, & Cannone, 1998; Zubris, 2005). This application has generated concern regarding the transfer of pollutants found in this sludge, including those attached to microfibers, to the environment ( Zubris, 2005). The majority of the microfibers retained in the wastewater treatment processes are retained in sewage sludge (Gasperi et al., 2015; Talvitie et al., 2015). Additionally, the presence of microfibers has been used as an indicator of the application of fertilizer products containing sewage sludge (Habib, Locke & Cannone, 1998; Zubris, 2005). Microfibers have been found to persist throughout numerous methods of repurposing wastewater sludge, including biosolid pellets and fertilizers (Habib, Locke & Cannone, 1998). These fibers were present up to 15 years after the application of products containing sewage sludge (Zubris, 2005). This persistence indicates that microfibers from sewage sludge are being retained in the terrestrial environment. The presence of microfibers in sewage sludge products indicates that the benefits of a high removal rate in treatment plants may be misunderstood: according to the principle of mass balance, removing conserved mass from one compartment results in its relocation into another compartment. This is the case with the WWTP removal of microfibers, which then are destined for soils wherein they may accumulate or become mobile. The current WWTP removal rates only account for microfiber removal from the influent and do not take into account microfibers in sewage sludge, the application of which presents a pathway for microfibers to be introduced into the environment. WWTPs are a large source of aquatic microfiber contamination. Despite the efficiency of removal from the aqueous phase, large quantities of microfibers are still released both directly and indirectly into aquatic habitats via WWTPs. To better understand the role of WWTPs in marine microplastic pollution, further research needs to be done on how microfibers are transported into the marine environment from sewage sludge and effluent.
11
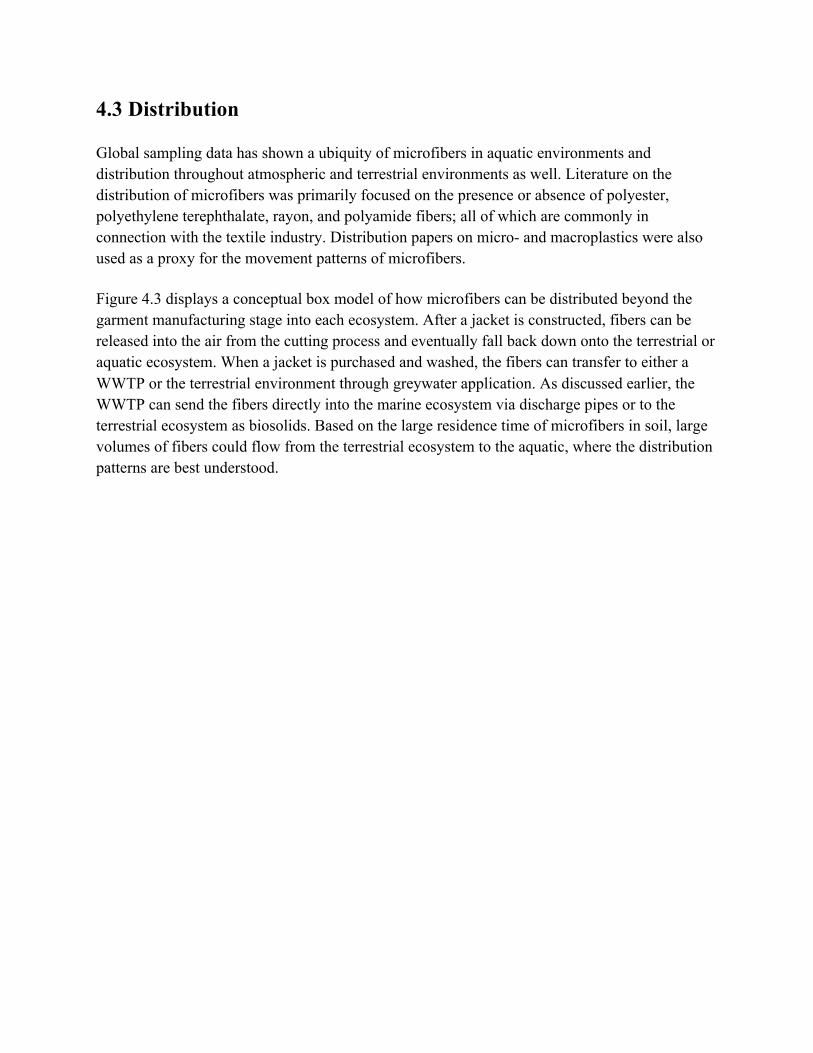
4.3 Distribution Global sampling data has shown a ubiquity of microfibers in aquatic environments and distribution throughout atmospheric and terrestrial environments as well. Literature on the distribution of microfibers was primarily focused on the presence or absence of polyester, polyethylene terephthalate, rayon, and polyamide fibers; all of which are commonly in connection with the textile industry. Distribution papers on micro- and macroplastics were also used as a proxy for the movement patterns of microfibers. Figure 4.3 displays a conceptual box model of how microfibers can be distributed beyond the garment manufacturing stage into each ecosystem. After a jacket is constructed, fibers can be released into the air from the cutting process and eventually fall back down onto the terrestrial or aquatic ecosystem. When a jacket is purchased and washed, the fibers can transfer to either a WWTP or the terrestrial environment through greywater application. As discussed earlier, the WWTP can send the fibers directly into the marine ecosystem via discharge pipes or to the terrestrial ecosystem as biosolids. Based on the large residence time of microfibers in soil, large volumes of fibers could flow from the terrestrial ecosystem to the aquatic, where the distribution patterns are best understood.

12
Figure 4.3
Microfibers are distributed through atm
ospheric, terrestrial, and aquatic ecosystem
s.
Microfiber D
istribution Conceptual B
ox Model.
Displayed are observed and theorized pathw
ays of microfiber transfer throughout the environm
ent and biom
e.
13
4.3.1 Aquatic Ecosystems After release from WWTPs, microfibers are distributed throughout the local water bodies into which effluent is discharged. The aquatic distribution can be broken down into four distinct sections: rivers, lakes and reservoirs, marine surface waters, and deep-sea sediments. These environments are potential sinks of microfiber pollution and pathways of transportation. Studies have examined the presence and concentrations of microfibers in these environments, with a particular focus on surface waters and sediments as two primary accumulation zones. Given that polyester is denser than seawater but also hydrophobic, it is unclear what proportion of microfibers would float on the surface as opposed to settle into sediments. Additionally, hydrophobic coatings may further alter the buoyancy of synthetic fibers. 4.3.1.1 Rivers Effluent from industrial processes and WWTPs is commonly discharged into local river systems, providing a pathway for microfibers to enter freshwater environments. Several studies have found polyester or PET particles and other synthetic fibers in river systems located near urban centers (Appendix Table A.1). As the particles and fibers travel downstream, a portion of them accumulate in sediments along the river bank and at the river mouth while the rest travel further downstream to be released into the ocean (Klein et al., 2015; Browne et al., 2010). Some of the fibers may remain close to the river mouth while others would be transported from the river mouth by currents into deeper ocean sediments (Zalasiewicz et al., 2016). Floating fibers would be carried further offshore into ocean gyres while sinking fibers would accumulate near the river mouth and be transported along the ocean floor. Measurements of microplastic concentrations near river mouths have supported the idea of river outlets as a major sources of microplastic pollutants in both surface waters and sediments (Zhao et al., 2015; Browne et al., 2010). 4.3.1.2 Lakes and Reservoirs Another destination for microfiber pollution is in the waters and sediments of lakes and reservoirs. In these slower moving water bodies, plastic particles settle out from the water column, accumulating in sediments along the shoreline and throughout the water body. Several studies of lake sediments and surface waters have found an abundance of microplastics, although PET and polyester have not been found in high concentration among these samples (Zbyszewski & Corcoran, 2011; Appendix Table A.2). Furthermore, methods for surface sampling of microplastics have failed to capture small textile fibers because of the common use of the manta trawl, a net that collects microplastic samples from the water’s surface with a 330 µm mesh. A study by Kang et al. (2015) conducted sampling with both a 330µm manta trawl and a 50µm hand net off the southeastern coast of Korea, finding that the manta trawl did not capture a
14
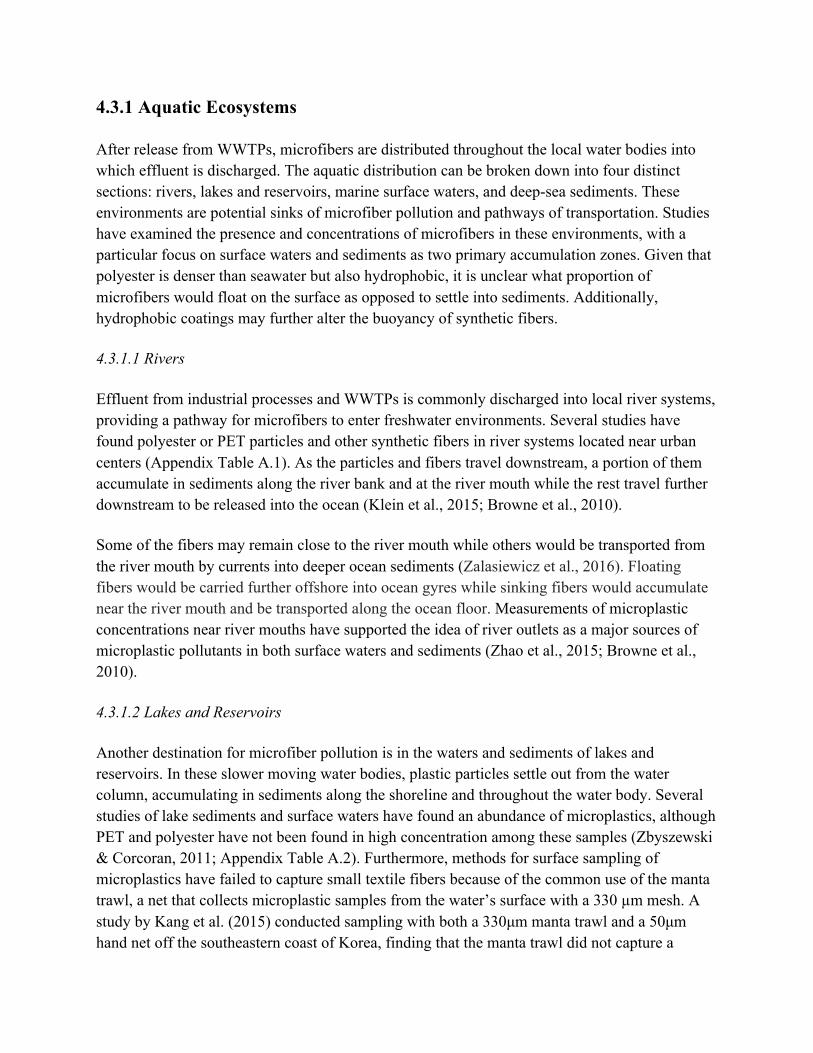
significant proportion of microfibers and other microplastics. This suggests that studies using manta trawl sampling may be unable to detect the full extent of microfiber pollution. The concentration of microplastics around lakes is highly variable, with acute accumulation zones along narrow stretches of shoreline and small areas of surface water in most lakes of study (Eriksen et al., 2013; Zbyszewski & Corcoran, 2011; Zhang et al., 2015; Free et al., 2014). These shoreline accumulation zones were often directly correlated with human populations, indicating that ecosystems near populous areas would be most impacted by microfiber pollution. 4.3.1.3 Beaches Initial research on the distribution of microplastics by Thompson et al. (2004) found microfiber pollution on all 17 beaches studied around the world. Analysis of these fibers showed that they contained nylon and polyester, establishing a possible linkage between the apparel industry and microfiber pollution. A later study by Browne et al. (2011) strengthened this connection by finding that microfibers from 18 different beaches across the world were predominantly polyester (56%) and acrylic (23%). However further research on beach sediments has not found similarly high concentrations of synthetic textile fibers in beach sediments, which may be an indication of the heterogeneous distribution of microfibers (Table A.3). In the coastal zone, negatively buoyant microfibers (denser than 1.03 g/cm3) tends to travel along the seafloor into deeper sea sediments, which may explain the presence of polyester fibers (density of g/cm3) in deep ocean sediments (Figure 4.4; Zalasiewiczet al., 2016).
Figure 4.4
Microfibers are dispersed throughout the entire water column.
Conceptual model of microplastic transport through the marine environment.
Source: Zalasiewicz et al., 2016
15
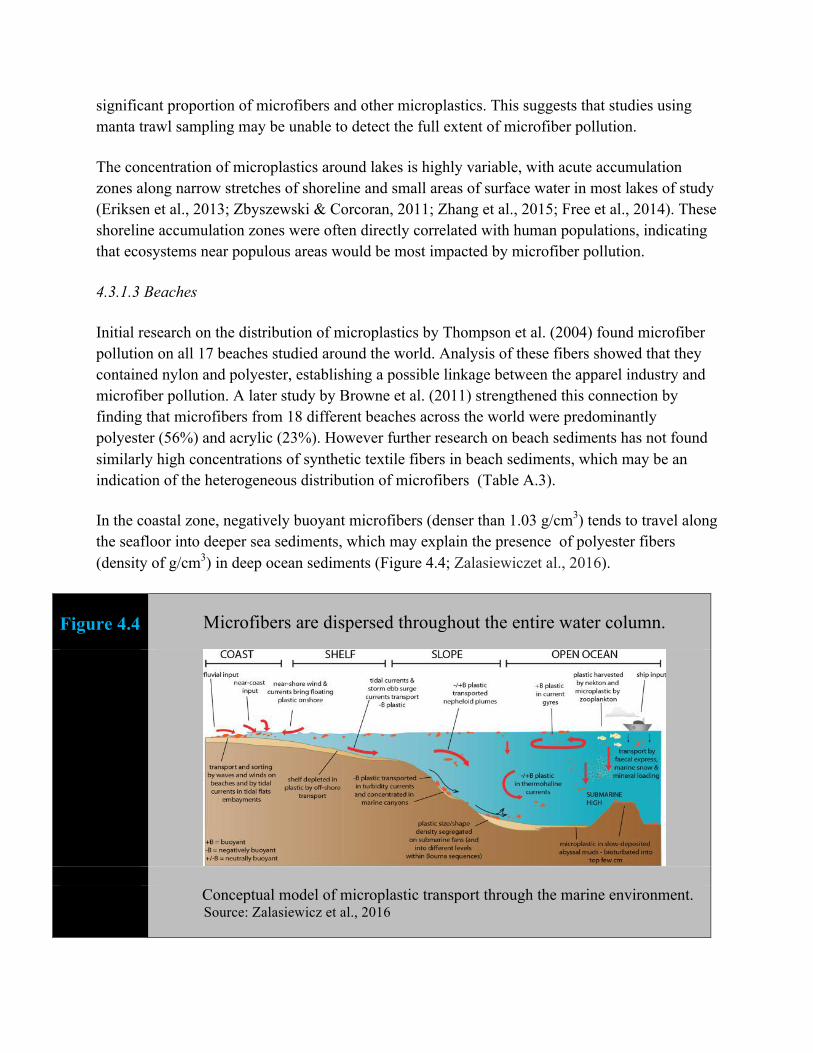
4.3.1.4 Surface Water Distribution In an early study on microplastics, Thompson et al. (20) found that microfiber concentrations in historical surface water samples correlated with the production volume of synthetic fibers in manufacturing (Figure 4.5). This study also provided one of the first links between the chemical composition of microfibers in the environment and materials used by the textile industry.
Figure 4.5
Microfiber pollution has kept pace with plastic production.
There is a distinct relationship between microfibers in historical seawater
samples and the volume of synthetic fiber production. Source: Thompson et al., 2004
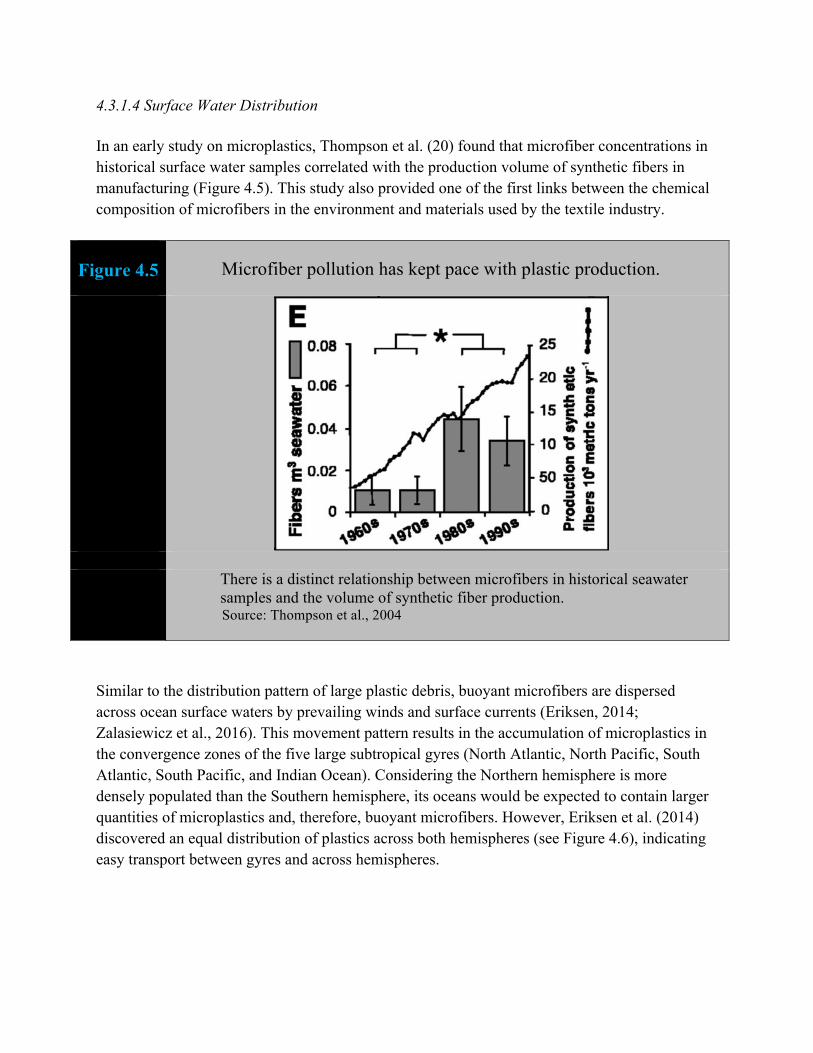
Similar to the distribution pattern of large plastic debris, buoyant microfibers are dispersed across ocean surface waters by prevailing winds and surface currents (Eriksen, 2014; Zalasiewicz et al., 2016). This movement pattern results in the accumulation of microplastics in the convergence zones of the five large subtropical gyres (North Atlantic, North Pacific, South Atlantic, South Pacific, and Indian Ocean). Considering the Northern hemisphere is more densely populated than the Southern hemisphere, its oceans would be expected to contain larger quantities of microplastics and, therefore, buoyant microfibers. However, Eriksen et al. (2014) discovered an equal distribution of plastics across both hemispheres (see Figure 4.6), indicating easy transport between gyres and across hemispheres.

16
Figure 4.6
Surface water microfiber pollution is spread equally across both hemispheres.
Global count density for plastics in four size classes. Model prediction of
global count density (pieces per km2; see colorbar) for two microplastic size ranges (0.33 – 1.00 mm, 1.01 – 4.75 mm) and two macroplastic size ranges (4.76 – 200 mm, and > 200 mm).
Source: Eriksen et al., 2014
4.3.1.5 Deep Sea Sediments Deep-sea sediment sampling has revealed that a large quantity of fibers are sinking through the water column and settling in deep-sea sediments. Woodall et al. (2014) reported an abundance of 1.4 to 40 microplastics per 50 mL of sediment in varying locations throughout the North Atlantic Ocean, Mediterranean Sea, and Southwest Indian Ocean. In this study, plastic microfibers were found in all samples, including sediment cores and coral colonies. Their qualitative comparison also indicated that microfibers in deep-sea sediments were four orders of magnitude greater in abundance (per unit volume) compared with heavily contaminated surface water gyres. Cozar et al. (2014) analyzed 3,070 global samples and further reinforced this hypothesis of the gap in microfiber abundance, suggesting that tens of thousands of tons of microfibers are “missing” from the surface. The authors ascribe the sinking to multiple possible factors including (1) ingestion of fibers and subsequent sinking via fecal pellets, (2) biofouling by microorganisms or pollutants, (3) nano-fragmentation, and (4) shore deposition. All of these would have tremendous impacts on ecosystems and food chains, further demonstrating the pervasiveness of plastic’s presence in the marine environment.

17
4.3.2 Terrestrial Ecosystem While fibers can transfer onto the terrestrial ecosystem from the atmosphere, the primary pathway is through greywater or biosolid application. Currently in the WWTP process, most microfibers settle out and are retained in sewage sludge (Gasperi et al., 2015; Talvitie et al., 2015). Considering that biosolids are increasingly being applied to land as fertilizers, the terrestrial environment could act as a significant sink for microfibers. However, based on the residence time of synthetic textiles and the lack of biodegradability, it can be assumed that a large volume of fibers will ultimately enter aquatic environments via runoff. 4.3.3 Atmospheric Ecosystem To date, very few studies have investigated microfibers in the atmosphere. Nascent research by Dris et al. (2016) in Paris indicated that atmospheric fallout can range between 2 and 355 particles/m2/day. Fluxes were also significantly higher in more urbanized areas. Surprisingly, only 29% of sampled fibers were synthetic (made with petrochemicals) whereas the rest were natural (cotton or wool) or a mixture of natural and synthetic material. The lack of currently available studies indicates that the fate and transport of microfibers in the atmosphere needs to be studied further.
4.4 Ecological Impacts 4.4.1 Consumption Given that in many environments synthetic fibers are the predominant form of microplastic (up to 85% in intertidal zones), it is likely that many of the microplastics being consumed by freshwater and marine organisms are microfibers shed from clothing during washing (Mathalon & Hill, 2014; Browne et al., 2011). From the lowest trophic levels to the apex of the food chain, microplastics have been recovered from the gastrointestinal tracts and tissues of zooplankton, shrimp, mussels, pelagic fish, and whales (Cole et al., 2013; Devriese et al., 2015; Mathalon & Hill, 2014; Neves et al., 2015; Besseling et al., 2015; Lusher et al., 2015). The consumption of these microplastics is not always directly from the surrounding ocean waters, however, as natural trophic transfer between organisms in a marine food web have been observed (Farrell & Nelson, 2013). The ingestion of microfibers by zooplankton, benthic organisms, and mussels can be more harmful than the consumption of microbeads, another common microplastic found in aquatic ecosystems. Given their spherical shape, microbeads can be passed relatively easily through the gastrointestinal systems of these smaller organisms. However, the characteristic shape of microfibers lends itself to becoming entangled with other fibers in the intestinal tract, which can

18
result in a non-biodegradable gut blockage. This can give the organism a false sense of satiety and affects their ability to process real food, potentially leading to starvation (Cole et al., 2013). This is less of an issue in larger organisms such as fish and whales as their gastrointestinal tracts are large enough to pass fibers, though some might still become embedded in the lining of the organism’s intestines (Besseling et al., 2015). Filter-feeding species such as mussels and oysters are particularly susceptible to microplastic consumption because they filter large volumes of water, thereby ingesting suspended plastics. Sussarellu et al. (2015) found that oysters that consumed microplastics produced fewer and smaller egg cells, slower sperm, and, as a result, fewer larvae. In addition to the inadvertent consumption of microplastics by marine species, smaller organisms can actually be attracted to eating microplastics instead of just accidentally consuming them. Cole et al. (2013) found that microplastics can develop biofilms while in the marine environment, which can elicit a “chemosensory response” and lead to increased consumption among some copepods. Copepods are a foundation species in the marine food web and their ingestion of microfibers could have a two-fold effect: 1) intestinal blockages from microfiber consumption could lead to population declines as a result of starvation and 2) the consumption of copepods by countless marine species could introduce microfibers into the food chain which could lead to the bioaccumulation of fibers. As shown by these two examples, microfibers can have a diverse impact on marine organisms. While the presence and physical impacts of microfibers have been documented in multiple species, little is known about potential chemical effects of ingestion. As mentioned previously in the chemical substances section, many synthetic fibers are coated with toxic chemicals to enhance garment performance. This is especially true for outdoor and adventure gear such as that produced by Patagonia (Internal communication, April 2015). Shed fibers not only transfer surface-associated toxic compounds into wastewater effluent during washing but also sorb other chemicals that they encounter both during the wastewater treatment process and in the marine environment (Mato et al., 2001; Teuten et al., 2009). When aquatic organisms ingest coated microfibers, they are also consuming the toxic compounds that have attached themselves to the fibers, which can lead to the transfer of these chemicals to organisms’ tissue (Tanaka et al., 2013; Ryan et al., 1988). Despite the potential circumstances of pollutants sorbed to microfibers, little research has been done to assess the direct effects these toxic compounds might have on organism physiology. Rochman et al. (2013) performed one of the few studies to directly evaluate the health effects and potential bioaccumulation of toxic chemicals from microplastic pollution, which it assessed in the Japanese medaka fish. After two months of exposure, the fish in the marine plastics treatment group (those that had been exposed to plastic particles from a marine source) exhibited higher concentrations of PBTs than the control group. The marine plastics group also showed signs of liver stress not found in the control group. Other studies on general consumption of
19
plastic compounds, not specifically those associated with microplastics or -fibers, have found that the most widely used plasticizers, such as phthalates and BPA, can affect reproduction and development in mollusks, crustaceans, and fish (Oehlmann et al., 2009). As consumers of vast quantities of seafood, humans are also susceptible to microplastic ingestion. Cauwenberghe & Janssen (2014) estimated that regular consumers of European shellfish can ingest up to 11,000 microplastic particles, many of which are fibers, per year. A study by Romeo et al. (2015) found microplastics in the stomachs of swordfish as well as bluefin and albacore tuna, species that are consumed widely by people. It is important to note that microfibers are primarily found in the gastrointestinal tracts of these species, which are not commonly consumed. However, bivalve and shellfish species that are ingested whole could potentially introduce an unknown quantity of toxic compounds into human bodies.While the presence of microfibers in commonly-consumed species indicates the likelihood of human contamination, a large knowledge gap existsin terms of the effects of ingesting microfibers and the potentialrisks associated with human health. Studies have indicated that high concentrations of chemical compounds often found on microfibers are associated with alterations in the normal function of the human endocrine system, impaired brain development, learning disabilities, and increased incidents of cancers (Talsness et al., 2009; OHI, 2013). As such, the U.S. Environmental Protection Agency is currently studying the human health impacts of microfiber consumption. 4.4.2 Ecosystem-wide Aside from consumptive impacts on individual organisms, microfiber pollution can have ecosystem-wide impacts. Goldstein et al. (2012) found a positive correlation between the abundance of microplastic particles and a pelagic insect population size in the North Pacific Subtropical Gyre. The increase in the insect’s abundance was attributed to the increase in surface “substrate”, i.e. microplastic. Usually a limiting resource, the increased availability of substrate provided more area for the insects to lay their eggs. While the increase in these insects is beneficial for its predators, they prey on zooplankton, a cornerstone of the marine food web, whose populations could be negatively affected by increased insect abundance. Though this study was not specifically looking at microfibers, the findings are an example of the ecological shifts that are possible as a result of microplastic pollution, of which microfibers are a substantial proportion. Microfibers could also contribute to the alteration of the physical properties of beaches and, consequently, a variety of shoreline taxa. Carson et al. (2011) investigated shoreline sediment profiles contaminated by microplastics and discovered that sediments with plastics were more permeable and warmed more slowly (16% maximum decrease in thermal diffusivity) than control samples. The authors hypothesize that the change in thermal properties could have significant consequences on sea turtles, whose sex determination is dependent on sediment

20
temperature. Eggs buried underneath plastic would need longer incubation periods due to the temperature decrease and could result in a greater number of male hatchlings. The large surface-area-to-mass ratio of microfibers allows them to sorb concentrated amounts of toxic compounds, and, because fibers are highly mobile in aquatic systems, they can serve as vehicles for transporting pollutants from one area to another (De Tender et al., 2015). Bacterial assemblages have also been found on the surface of microplastic fragments and fibers; oftentimes, these communities are substantially different from those normally found in the water column of that ecosystem (McCormick et al., 2014; De Tender et al., 2015; Zettler et al., 2013). The high mobility of microfibers combined with their sorbing characteristics could lead to widespread contamination of connected aquatic habitats as well as the introduction of non-native bacteria, which may have negative impacts on native organisms and ecosystem dynamics. Furthermore, these characteristics could have detrimental impacts on human health. In a study of aquatic habitats both upstream and downstream of a WWTP, McCormick et al. (2014) found that one of the most prominent bacterial assemblages found on the microplastic particles in their study was from the family Campylobacteraceae, which includes multiple taxa associated with human gastrointestinal infections.
21
5. Methods
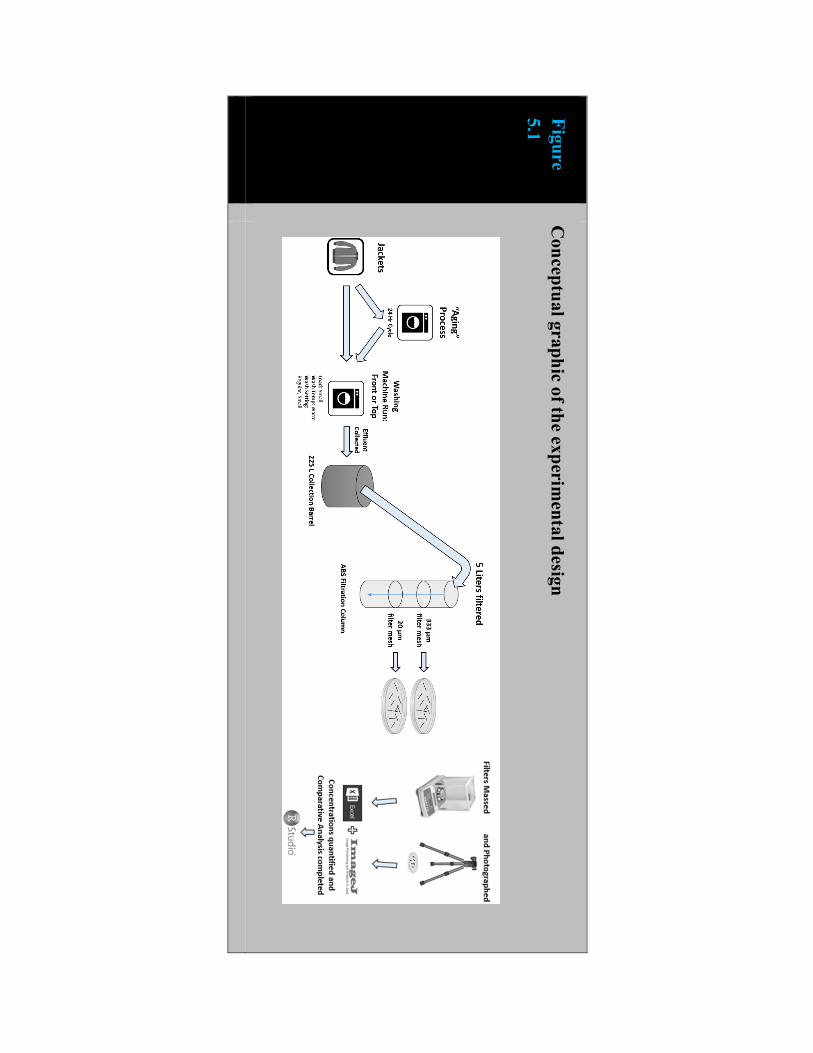
5.1 Washing Methodology 5.1.1 Garment Selection Wash trials were conducted in Patagonia’s testing facility at their headquarters in Ventura, California (see Figure 5.1 for conceptual graphic). Synthetic jackets used in the experiment were chosen based on their expected shedding potential and their representativeness of Patagonia’s product line. In total, the sample consisted of four Patagonia jacket types produced in 2015 and one budget jacket. The body of Patagonia B, C, D was composed of polyester blends, while the Patagonia A’s body was composed of 100% nylon fibers (Table 5.1). The insulation for Patagonia A however, was made of polyester. In addition to the four Patagonia jackets, a synthetic fleece jacket (Budget D) composed of 100% polyester was selected as the budget version of Patagonia D for comparison purposes. The study was done in triplicates for front-load washing and quadruplets for top-load washing.
Table 5.1
Body fabric compositions of the five jacket types tested.
Jacket Body Fabric Composition Description
Patagonia A 100% nylon Technical non-fleece synthetic jacket
Patagonia B 85% recycled polyester, 15% polyester
Synthetic fleece pullover
Patagonia C 63% recycled polyester, 33% polyester, 3% spandex
Synthetic fleece midlayer jacket
Patagonia D 100% polyester Synthetic sweater fleece jacket
Budget D 100% polyester Budget synthetic sweater fleece jacket
5.1.2 Garment Age and Washing Machine Type For each jacket type, brand new garments were individually washed in a top-load washing machine (model: Whirlpool WET3300XQ1). The machine settings were set to extra small
22
capacity (43 liters capacity) for a regular warm wash cycle for 30 minutes. Regular tap water provided by Ventura municipal water supply was used for the trials and throughout the washing process. The output water (~140 liters) was collected in a large rain barrel. After stirring the barrel, 5 liters was filtered through a custom-designed filtration column (Figure 5.2, height = 82 inches, diameter = 4 inches). Inside the column was a sequence of 333 µm and 20 µm sized mesh filters through which the wash water was filtered, and onto which microfibers were collected. Filters were replaced for each replication and preserved in petri dishes at room temperature for fiber massing. After being washed for the first time, jackets were then subjected to an aging treatment. To do so, the jackets were placed in a 24-hour “killer wash” with cold water and no spin cycle (Whirlpool). Patagonia’s research & development team uses the “killer wash” to simulate the aging of a garment after a lifetime of laundering. After this simulated “aging” process, the same individual washing cycle outlined above was repeated for the aged jackets. This process of washing brand new jackets and aged jackets was repeated for all five jacket types in a top-load machine and the shed fibers were collected each time by removing the filters, which were then stored in petri dishes purchased from Thermo Fisher to prevent contamination. This process of washing new and aged jackets and storing the filters was then repeated in a front-load washing machine (Whirlpool). The output water was approximately 35 liters. A detailed description of the procedure can be found in Appendix A.1. 5.1.3 Specifications The wash settings throughout the experiment and for both washing machines were extra small (load size), warm (water temperature), and regular wash (cycle) without detergent. Detergent use was avoided given its potential to clog the filters (Browne et al., 2011). Between each garment washing step, an empty wash (extra small capacity, extra small load, regular cycle, 10 minutes) with hot water was run to remove any fibers remaining in the machine. The complete removal was not verified, but the fibers captured during this cleaning cycle were massed on filters similarly to the garment aging cycles. The filters were purchased from Aquatic Research Instruments, Idaho and were made of Nitex® mesh. The filter column was made from a 3 inch diameter ABS pipe and PVC couplers purchased at Home Depot. The filters were stored at room temperature in petri dishes (138.9 mm diameter, triple vent, 21.2 mm height, aseptic) purchased from Thermo Fisher, Portland after they were removed from the filter column to prevent contamination.
23
Figure 5.1
Conceptual graphic of the experim
ental design

24
Figure 5.2. Filtration column with height specifications
5.2 Massing Methodology After the washing machine trials were completed, the samples were transported to the laboratory facilities of the Bren School of Environmental Science & Management for further processing and analysis. To obtain dry weights of the samples, the petri dishes were placed on a metal rack in a sealed plastic box containing Damp-Rid Moisture Absorbers, a desiccant produced by WM Barr & Co., Inc. to facilitate complete drying. The Damp-Rid Moisture Absorbers contain calcium chloride, sodium chloride, and potassium chloride for desiccation. The samples were placed in the desiccator to remove excess moisture that would cause fluctuations in measurements during massing. Three days later, the samples were re-massed to confirm that the mass fluctuations were no longer occurring and then prepared for photographing and massing. The filters were removed from the petri dishes and placed on natural fiber colored paper made by Creatology and purchased at Michaels Stores, Inc. in order to minimize contamination while providing enough contrast for clear photographs. Fibers were handled carefully to avoid loss and cross contamination. Precautionary steps included the use of natural fiber lab coats by all individuals involved in processing and the implementation of natural fiber brushes to ensure all fibers from the petri dish were transferred onto the corresponding filter. The filters were placed next to a ruler on the paper and photographed using a tripod mounted digital SLR camera (Nikon D3200). The filters were then transferred to a precleaned lab table to be folded. The filters were folded
22 inches
22 inches
30 inches
4 inches
333 micron mesh
20 micron mesh
25
twice horizontally using gloves and clean forceps. The folded filters were transferred with forceps into pre-massed and pre-labelled Celltreat polypropylene 50 mL centrifuge tubes. Each tube was capped and massed on a Mettler Toledo AB104-S balance, located at the Bren School of Environmental Science & Management, readable to 0.1mg.Each sample was massed twice. If the recorded masses were not within 0.5 mg of each other, then the samples were placed aside to let static discharge and re-massed at a later time. ImageJ (Image Processing and Analysis in Java version 1.49) was used to determine the mass of the filters. Images captured during the massing stage were input into ImageJ, and the threshold color tool was used to isolate the filters from the colored paper background. ImageJ calculated the area of the filters using the ruler placed into the images as a scale reference. A reference mass-to-area ratio was established with ImageJ for each of the control filters (Front Load 20µm, Front Load 333µm, Top-load 20µm, and Top Load 333µm). These mass-to-area ratios were multiplied by the filter area for each sample, obtaining the filter mass for each sample. (1) !"##!!"!!"#$%&! = !"##!!"#$!!"#$% ∗ !"#$!!"!!"#$%&! The calculated filter mass was then subtracted from the total sample mass, resulting in the fiber mass shedding on each of the filters (Equation 2). (2) !"##!!"!!"#$%&!!"!!!!"#$%&! = !"#$%&!!"##! −!"##!!"!!"#$%&! In order to account for the differences in volume of the two washing machine types, this mass was multiplied by the ratio of total volume (136 L for top-load machines and 36 L for front-load machines) to filtered volume (5 L) to obtain the total fiber mass on each filter. The total fiber mass per wash from each apparel item was found by adding the 20µm and 333µm samples for each trial (Equation 3). (3) !"#$%!!"#$%!!"## = !"!!"!!"#$%!!"##+ !!!!!"!!"#$%!!"##
5.3 Data Methodology Data were analyzed using R 3.2.3 and Excel 2013 software. Statistical comparisons of fiber mass shedding were conducted to determine whether the two treatment types (washing machine load and aging) had any significant impacts on the shedding of the tested apparel items. Variations across jacket types were also tested, providing insight on the significance of jacket construction and material on the shedding of synthetic fibers. For a further description of the statistical tests used and assumptions, see the data analysis appendix (Appendix A3).
26
5.4 Model Methodology Using data from our literature review, a model was created to calculate the count and mass of microfibers entering the environment after the WWTP process. Considering the diverse range of wastewater treatment quality around the world, high and low-polluting plants were selected to identify a range of pollution scenarios. Plants in Viikinmaki, Finland, and St. Petersburg, Russia, were specifically used to model the transport of microfibers through the wastewater treatment process (Talvitie & Heinonen, 2014; Talvitie et al., 2015). The Viiknmaki WWTP, with a filtration rate of 92%, was treated as a low-polluting WWTP, (Talvitie et al., 2015), and the St. Petersburg WWTP, with a filtration rate of 65%, was treated as a high-polluting WWTP (Talvitie & Heinonen, 2014). Then, to convert the count data (number of fibers/m3) into mass based concentrations (mg/m3), a decitex (a measure of linear density) of 0.03 mg/mm was used (Mepex, 2014). An average fiber size of 0.7mm was chosen based on the lower bound of 0.02 mm (the smallest size filtered) and the upper bound of 5 mm (the largest microfiber). This process was also used to convert mass data into number of fibers shed (Equation 4). 4) Microfiber Concentrations (mg/m3) = decitex (mg/mm)* length of fiber (mm/fiber)*fibers/m3 The data outlined above was used to calculate the concentrations of microfibers in a model WWTP’s influent, effluent, and sewage sludge after synthetic jackets are washed. It was assumed that 92.5% of fibers removed in the WWTP processes were retained in sewage sludge (Talvitie et al., 2015).
27
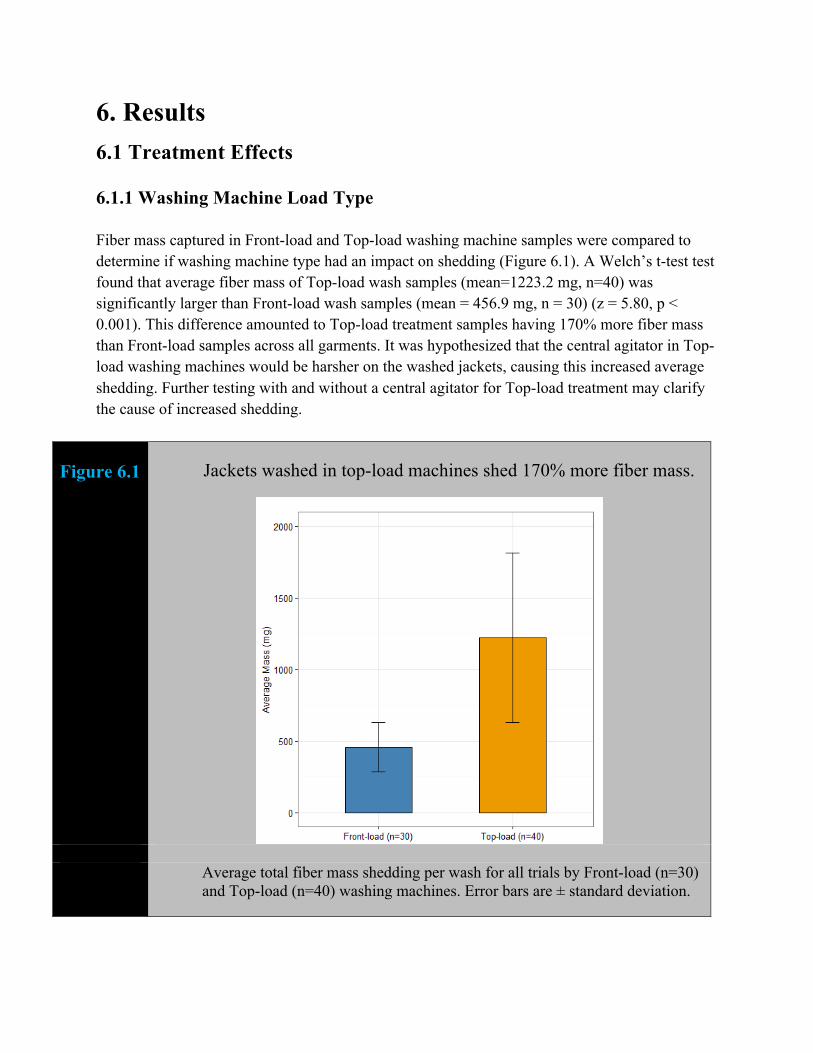
6. Results 6.1 Treatment Effects 6.1.1 Washing Machine Load Type Fiber mass captured in Front-load and Top-load washing machine samples were compared to determine if washing machine type had an impact on shedding (Figure 6.1). A Welch’s t-test test found that average fiber mass of Top-load wash samples (mean=1223.2 mg, n=40) was significantly larger than Front-load wash samples (mean = 456.9 mg, n = 30) (z = 5.80, p < 0.001). This difference amounted to Top-load treatment samples having 170% more fiber mass than Front-load samples across all garments. It was hypothesized that the central agitator in Top-load washing machines would be harsher on the washed jackets, causing this increased average shedding. Further testing with and without a central agitator for Top-load treatment may clarify the cause of increased shedding.
Figure 6.1
Jackets washed in top-load machines shed 170% more fiber mass.
Average total fiber mass shedding per wash for all trials by Front-load (n=30)
and Top-load (n=40) washing machines. Error bars are ± standard deviation.

28
6.1.2 Jacket Aging New and Aged treatment trials were compared to determine the effect of aging on jacket shedding (Figure 6.2). On average, jackets shed 60% more fibers after the aging treatment. A Wilcoxon-Signed Rank test was performed to test the median fiber release of the jackets before and after simulated aging. The median fiber mass release of Aged jackets (median = 685.9 mg, n = 35) was significantly larger than New jackets (median = 583.0 mg, n = 35; Z = 1.90, p = 0.029). Visual inspection of the jackets after the simulated aging process identified fraying, which may be related to the increased jacket shedding after aging treatment.
Figure 6.2
Aged jackets shed 60% more fiber mass.
Total fiber mass shedding per wash for all trials by new treatment (n=35) and
aged treatment (n=35). Medians are indicated by black lines and means are shown as red lines.
29
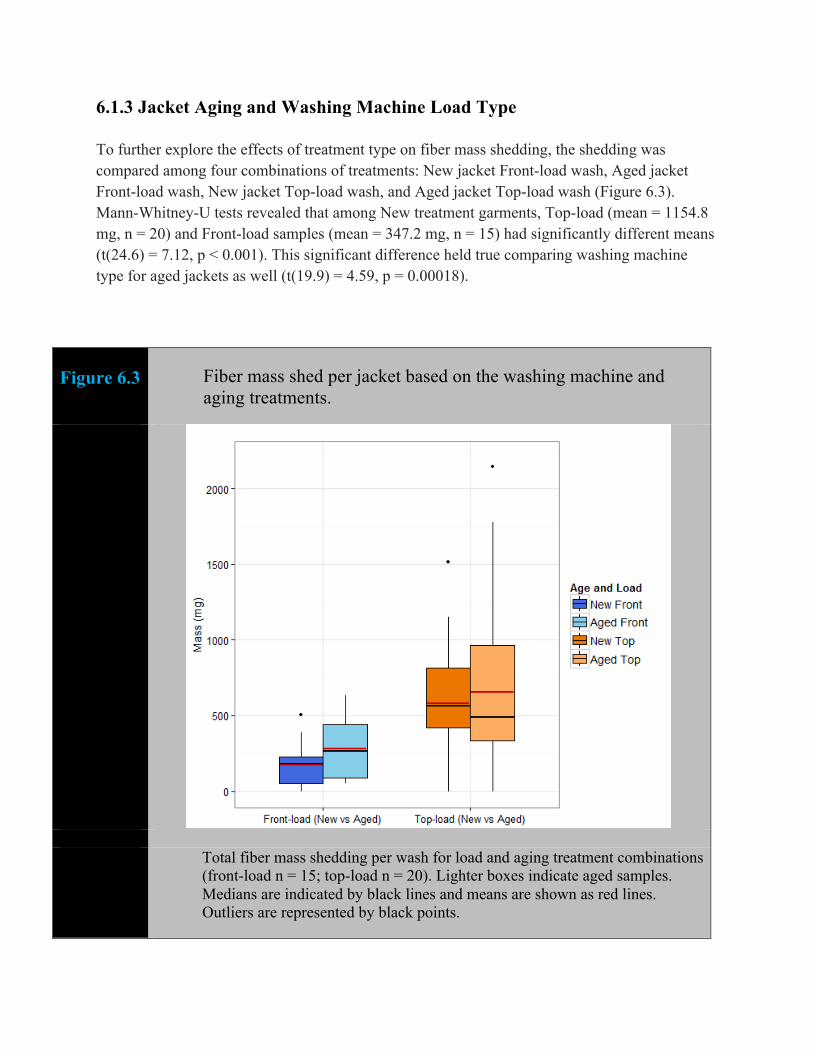
6.1.3 Jacket Aging and Washing Machine Load Type To further explore the effects of treatment type on fiber mass shedding, the shedding was compared among four combinations of treatments: New jacket Front-load wash, Aged jacket Front-load wash, New jacket Top-load wash, and Aged jacket Top-load wash (Figure 6.3). Mann-Whitney-U tests revealed that among New treatment garments, Top-load (mean = 1154.8 mg, n = 20) and Front-load samples (mean = 347.2 mg, n = 15) had significantly different means (t(24.6) = 7.12, p < 0.001). This significant difference held true comparing washing machine type for aged jackets as well (t(19.9) = 4.59, p = 0.00018).
Figure 6.3 Fiber mass shed per jacket based on the washing machine and aging treatments.
Total fiber mass shedding per wash for load and aging treatment combinations
(front-load n = 15; top-load n = 20). Lighter boxes indicate aged samples. Medians are indicated by black lines and means are shown as red lines. Outliers are represented by black points.
30
In regards to aging between the two washing machine types, a Wilcoxon-Signed Rank test found no significant difference in median fiber mass shed per garment in Top-load machines between New (median = 1213.4 mg, n = 20) and Aged jackets (median = 1325.0 mg n = 20; z = 0.063, p = 0.47). In Front-load washing machines, however, there was a significant difference in median fiber mass shed per garment for New (median = 325.0 mg, n = 15) and Aged (median = 532.3 mg, n = 15; z = 3.56). This seems to indicate that the aging process has more of an influence on shedding in Front-load washing machines than Top-load washing machines. To further test this effect of load and aging treatment types on fiber mass shed, a Two-way ANOVA was conducted on the interaction of age and washing machine type, but no significant interaction between the two treatment types was found (F(1) = 0.0002, p = 0.971).
6.2 Jacket Comparisons 6.2.1 Average Shedding Average shedding for each jacket type was compared by averaging the masses from all trials (Figure 6.4). A Multi-way ANOVA with post-hoc analysis was performed to compare the effect of jacket type on fiber shedding across the five jacket types while controlling for age and load treatments. Average fiber mass between jacket types differed significantly (F(4,63) = 4.20; p = 0.0044) with Budget D shedding 74% more mass than that from the average of all other jackets across all treatment types. Post-hoc testing found that the Budget D jacket had significantly different shedding than Patagonia B (p = 0.012) and Patagonia C (p = 0.0044) when compared individually. None of the other jackets were found to have significantly different average levels of shedding (post-hoc Tukey HSD, p < 0.05).

31
Figure 6.4
Average jacket shedding for all 14 trials.
Average total fiber shedding per wash for all 14 trials of each tested jacket.
From left to right jacket averages displayed are Patagonia A, B, C, and D, as well as Budget D. Error bars are ± one standard deviation. Letters above errors bars represent significant differences between jacket types from Multi-way ANOVA analysis with load treatment, age treatment, and jacket type (post-hoc Tukey HSD, p < 0.05).
A,B A,B
A
B
A

32
6.2.2 Average Shedding with Washing Machine Treatment Average Front- and Top-load shedding was compared across all experimental jackets to further distill differences in shedding between jacket types with respect to washing machine load treatment (Figure 6.5). Interactive effects of washing machine load treatment between jacket types was tested with a Multi-way ANOVA controlling for age treatment, but no significant interaction was found (F(4,59) = 1.11, p = 0.36).
Figure 6.5 Average fiber mass shed from each jacket in Front-load washing machines compared to Top-load machines.
Comparison of average Front- and Top-load shedding across jacket types. In
each panel from left to right are jacket averages displayed as Patagonia A, B, C, and D, as well as Budget D. Error bars are ± one standard deviation.

33
6.2.3 Average Shedding with Aging Treatment Average new and aged treatment shedding was compared across all experimental jackets (Figure 6.6). To test interactive effects of aging and jacket type shedding, a Two-way ANOVA was conducted but no significant interaction was found (F(4,59) = 2.36, p = 0.064). This statistic was in contrast to a heteroskedasticity-adjusted regression, which found an interactive effect of jacket type with aging on fiber shedding. Further research could clarify this relationship.
Figure 6.6 Average fiber mass shed from New jackets compared to Aged jackets.
Comparison of New and Aged jacket shedding across jacket types. In each panel
from left to right are jacket averages displayed as Patagonia A, B, C, and D, as well as Budget D. Error bars are ± one standard deviation.
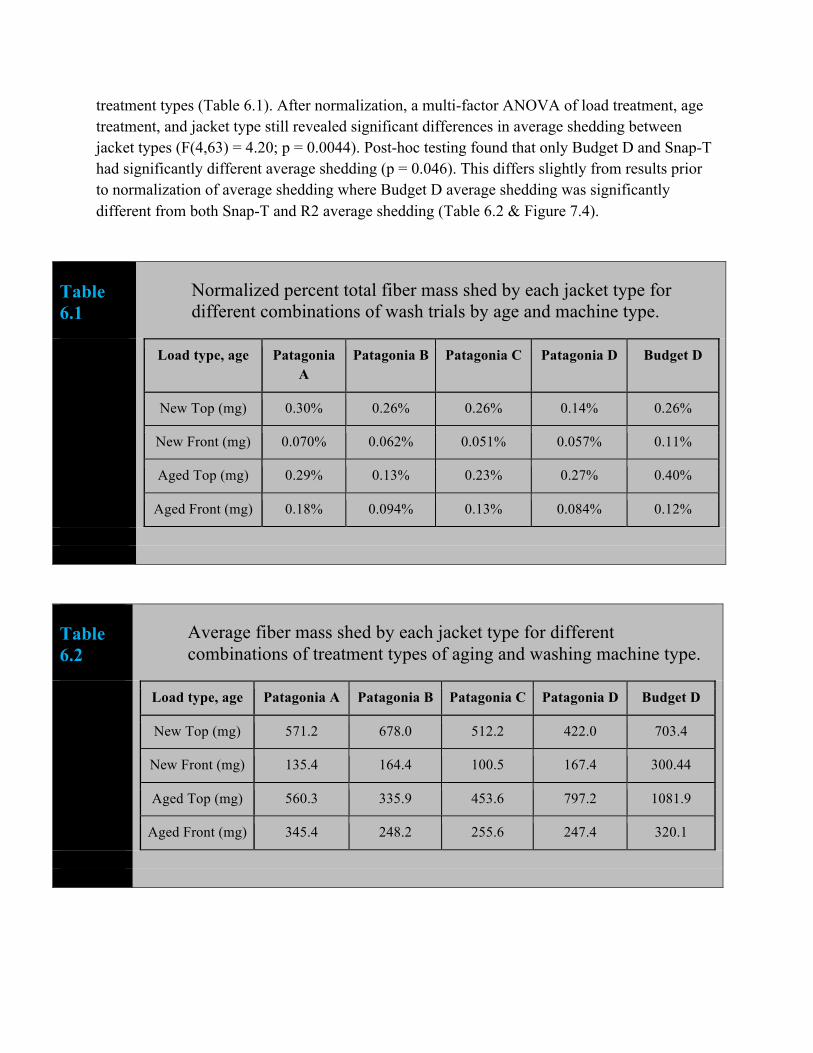
7.2.4 Normalized Jacket Averages Jacket fiber mass shed was normalized by the original mass of the garment to obtain the percent of jacket mass shed as microfibers. This normalization may provide further understanding of how the material and construction of each jacket specifically contributes to fiber shedding across
34
treatment types (Table 6.1). After normalization, a multi-factor ANOVA of load treatment, age treatment, and jacket type still revealed significant differences in average shedding between jacket types (F(4,63) = 4.20; p = 0.0044). Post-hoc testing found that only Budget D and Snap-T had significantly different average shedding (p = 0.046). This differs slightly from results prior to normalization of average shedding where Budget D average shedding was significantly different from both Snap-T and R2 average shedding (Table 6.2 & Figure 7.4).
Table 6.1
Normalized percent total fiber mass shed by each jacket type for different combinations of wash trials by age and machine type.
Load type, age Patagonia A
Patagonia B Patagonia C Patagonia D Budget D
New Top (mg) 0.30% 0.26% 0.26% 0.14% 0.26%
New Front (mg) 0.070% 0.062% 0.051% 0.057% 0.11%
Aged Top (mg) 0.29% 0.13% 0.23% 0.27% 0.40%
Aged Front (mg) 0.18% 0.094% 0.13% 0.084% 0.12%
Table 6.2
Average fiber mass shed by each jacket type for different combinations of treatment types of aging and washing machine type.
Load type, age Patagonia A Patagonia B Patagonia C Patagonia D Budget D
New Top (mg) 571.2 678.0 512.2 422.0 703.4
New Front (mg) 135.4 164.4 100.5 167.4 300.44
Aged Top (mg) 560.3 335.9 453.6 797.2 1081.9
Aged Front (mg) 345.4 248.2 255.6 247.4 320.1
35
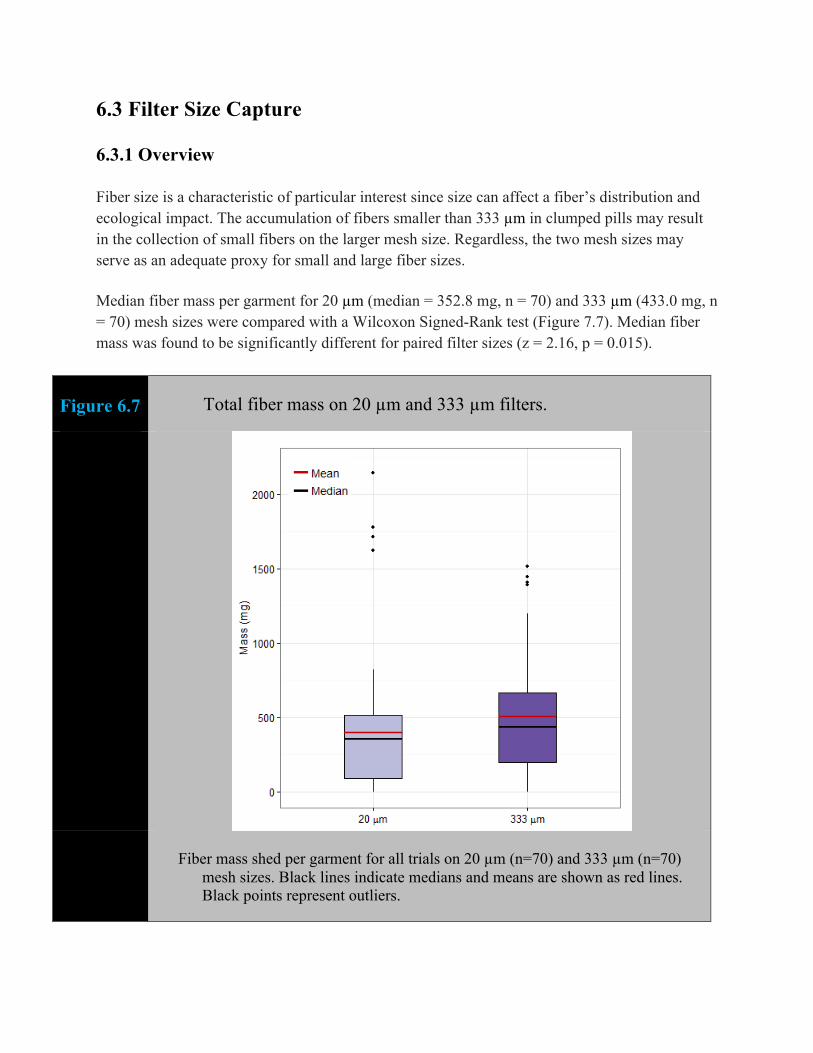
6.3 Filter Size Capture 6.3.1 Overview Fiber size is a characteristic of particular interest since size can affect a fiber’s distribution and ecological impact. The accumulation of fibers smaller than 333 µm in clumped pills may result in the collection of small fibers on the larger mesh size. Regardless, the two mesh sizes may serve as an adequate proxy for small and large fiber sizes. Median fiber mass per garment for 20 µm (median = 352.8 mg, n = 70) and 333 µm (433.0 mg, n = 70) mesh sizes were compared with a Wilcoxon Signed-Rank test (Figure 7.7). Median fiber mass was found to be significantly different for paired filter sizes (z = 2.16, p = 0.015).
Figure 6.7 Total fiber mass on 20 µm and 333 µm filters.
Fiber mass shed per garment for all trials on 20 µm (n=70) and 333 µm (n=70)
mesh sizes. Black lines indicate medians and means are shown as red lines. Black points represent outliers.

36
6.3.2 Treatment Effects on Fiber Sizes 6.3.2.1 Washing Machine Type and Fiber Size Due to the differing characteristics in top-load and front-load washing machines, including agitation and cycle length, there may also be differences in the characteristics of fibers the two machines remove from the jackets (Figure 6.8). To test if aging and load treatment had significant interactions on the characteristics of fiber shedding, a Multi-way ANOVA was conducted on the interaction of washing machine load type and filter size with age treatment included as a covariate. The interaction term between these two variables was significant (n=140, F(1,131) = 7.37, p = 0.0075). We hypothesized that the central agitator may alter the size distribution of fibers shed from the jackets tested. Further testing would help clarify this relationship. We hypothesized that the central agitator that may be causing increased shedding in top-load washing machines may also be altering the size of fibers shed from the jackets tested. Further testing could clarify this relationship.

37
Figure 6.8 Fiber mass shed per jacket based on washing machine type and filter size.
Fiber mass shedding per garment for both load treatments compared to filter size
(front-load boxes n = 30; top-load boxes n = 40). Green boxes indicate 333 µm samples while salmon boxes indicate 20 µm samples. Black lines indicate medians and means are shown as red lines. Black points represent outliers.
6.3.2.2 Age Treatment and Fiber Size A visual inspection of the filters indicated that the aging process resulted in higher fiber mass on the 333 µm filters. To test the interaction of aging treatment on fiber size, a Multi-way ANOVA was conducted on filter size and age treatment with load treatment included as a covariate. The two variables had no significant interaction overall (F(1,136) = 0.30, p = 0.58), but when examining only Front-load trials (Figure 6.9), a significant interaction was found between filter size and age treatment (n = 60, F(1,52) = 35.4, p < 0.0001).

38
Figure 6.9
Front-load washing machine fiber mass shed for jackets based on aging treatment and filter size.
Fiber mass shedding per garment for aging treatments compared to filter size for
front-load machines (n = 15 each box). Lighter boxes indicate 333 µm samples while darker boxes indicate 20 µm samples. Black lines indicate medians and means are shown as red lines. Black points represent outliers.
6.3.2.3 Jacket Types and Fiber Size Fiber size differences between jackets provide another interesting avenue of analysis. We compared the two most similar jacket types tested: the Better Sweater and Budget D (Figure 6.10 & 6.11). A Two-way ANOVA test revealed a significant interaction between these two jacket types and filter sizes on fiber mass shed (F(1,50) = 7.32, p = 0.0093). Further testing of this effect for Top-load and Front-load treatments found that the interaction between filter size and jacket type was no longer significant for Front-load trials, but still significant for Top-load trials (F(1,38) = 22.1, p < 0.0001).

39
Figure 6.10
Top-load washing machine fiber mass shed for Patagonia D and Budget D jackets based on filter size.
Fiber mass shedding per wash for better sweater and Budget D for compared to
filter size for top-load machines (n = 8 each box). Black lines indicate medians and means are shown as red lines.

40
Figure 6.11
Front-load washing machine fiber mass shed for Patagonia D and Budget D jackets based on filter size.
Fiber mass shedding per wash for better sweater and Budget D for compared to
filter size for front-load machines (n = 6 each box). Black lines indicate medians and means are shown as red lines. Black points represent outliers.
41
Comparing average fiber mass and fiber size shed between jackets provides further insight into the effect of studied treatments (Figure 6.12 & 6.13). Notable differences include washing machine top-load treatment effect on percent of fiber sizes. Top-load washing machines consistently increase the average fiber mass shed and the relative proportion of mass found on the 20 µm filter size. ● Patagonia A (100% nylon technical non-fleece synthetic jacket) had the largest aging %
change in fiber mass shed in Front-load washing machines from New to Aged with a 156% increase in average shedding. This could be due to a compromised solid outer shell through the aging process, allowing its insulation to shed.
● Patagonia B (85% recycled polyester, 15% polyester synthetic fleece pullover) was the only tested jacket that had an average decrease in fiber mass shed after aging treatment, or a 35% decrease in fiber mass shed. This may be due to residual microfibers on the jacket from the manufacturing process that are washed off in the new trial. Multiple aging levels across the full lifecycle of the jackets tested would elaborate on the opposite effects that age treatment has on fiber mass shed.
● Patagonia C (63% recycled polyester, 33% polyester, 3 % spandex synthetic fleece midlayer jacket) had the largest % change in fiber mass shed between Front-load washing machines and Top-load washing machines for new garments of 412%.
● Patagonia D (100% polyester synthetic sweater fleece jacket) had the highest average fiber mass shed among the Patagonia jackets tested, shedding ranged from 3% to 24% more on average across all treatments.
● Budget D (100% polyester budget synthetic sweater fleece jacket) had the highest had the largest mass % of fibers on the 20 µm Filter Size for Aged Top-load treatment or approximately 420% of fiber mass.

42
6.3.2.4 Jacket age and wash type combinations
Figure 6.12
Effects of all treatments on microfiber shedding.
Effect of load type and age on average fiber mass shed per garment for all
jacket types. Yellow circles represent Patagonia A, Green squares Patagonia B, blue diamonds Patagonia C, purple triangles Patagonia D, and red triangles Budget D.
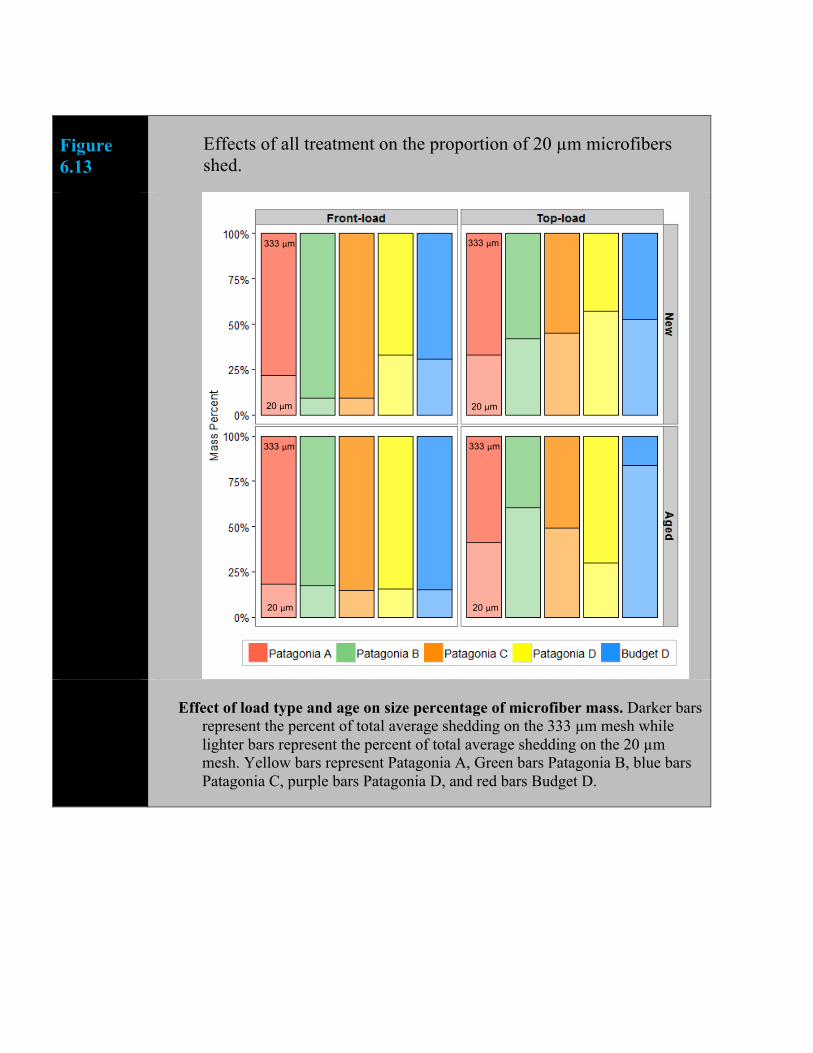
43
Figure 6.13
Effects of all treatment on the proportion of 20 µm microfibers shed.
Effect of load type and age on size percentage of microfiber mass. Darker bars
represent the percent of total average shedding on the 333 µm mesh while lighter bars represent the percent of total average shedding on the 20 µm mesh. Yellow bars represent Patagonia A, Green bars Patagonia B, blue bars Patagonia C, purple bars Patagonia D, and red bars Budget D.
20 µm
333 µm
20 µm
333 µm
20 µm
333 µm
20 µm
333 µm

44
6.4 Model Results A model was created in order to contextualize the fate of microfibers shed from Patagonia jackets. This model was based on data from four WWTP studies. A high-polluting plant with a microfiber filtration rate of 65% and a low-polluting plant with a microfiber filtration rate of 92% were modeled. We modeled the resulting mass of microfibers from washing 100,000 Patagonia jackets one time, which would result in the release of 100 kg of microfibers into the sewage system (Table 6.3). Depending on the effectiveness of filtration, between 8 kg and 35 kg of microfibers are released in WWTP effluent into aquatic environments. Assuming an average fiber size of 0.7 mm, this is approximately 11,000,000 to 50,000,000 microfibers entering rivers, streams, and oceans.
Table 6.3
Resulting mass of microfibers (kg) in the WWTP system from washing Patagonia jackets.
Jackets Washed Microfiber Mass Entering (kg)
Microfiber mass in Effluent (kg)
High-polluting 100,000 100 35
Low-polluting 100,000 100 8
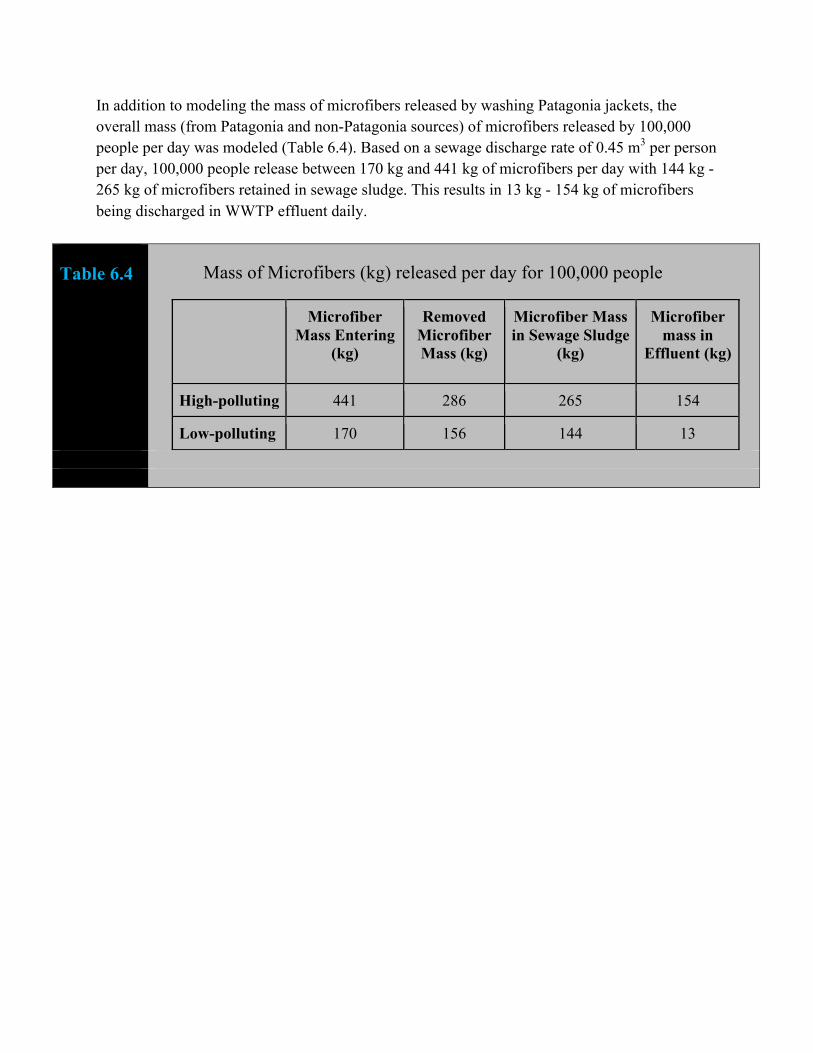
45
In addition to modeling the mass of microfibers released by washing Patagonia jackets, the overall mass (from Patagonia and non-Patagonia sources) of microfibers released by 100,000 people per day was modeled (Table 6.4). Based on a sewage discharge rate of 0.45 m3 per person per day, 100,000 people release between 170 kg and 441 kg of microfibers per day with 144 kg - 265 kg of microfibers retained in sewage sludge. This results in 13 kg - 154 kg of microfibers being discharged in WWTP effluent daily.
Table 6.4
Mass of Microfibers (kg) released per day for 100,000 people
Microfiber Mass Entering
(kg)
Removed Microfiber Mass (kg)
Microfiber Mass in Sewage Sludge
(kg)
Microfiber mass in
Effluent (kg)
High-polluting 441 286 265 154
Low-polluting 170 156 144 13

46
7. Discussion 7.1 Literature Review The review of current research on microplastics and microfibers indicated multiple ways in which these synthetic particles can pervade aquatic habitats and pose potential risks to organisms and humans. There is also evidence of terrestrial and atmospheric contamination. With the vast majority of clothes containing some form of synthetic material, it is important to understand the release of microfibers and the potential human and ecological impacts from this pollutant. Textiles used in the manufacturing of garments are often processed with hazardous chemicals throughout production and finishing. This is especially true for Patagonia products, which are designed to withstand extreme outdoor conditions. When the fibers from these garments are shed, so too are these coatings, and they both enter WWTPs in large volumes. However, it is not known whether these hazardous substances enter WWTPs attached to the fibers or whether they are washed off during the shedding process. While current research has not been able to clarify this process, we hypothesize that microfibers serve as a mode of transport for these chemicals into the marine environment. Further research should focus on the fate and transport of these chemicals and their potential impacts on humans. The literature review also found that massive quantities of fibers are entering WWTPs on a daily basis. Even though WWTPs are generally very effective at removing these microfibers, the sheer volume found in influent indicates that the small percentage getting through filtration is still substantial. Furthermore, even those fibers that are removed through the treatment process can persist in sewage sludge that is often applied to agriculture. Many of these sewage-sludge fibers will ultimately end up in lakes, rivers, and oceans via runoff. Given their current capacity to remove fibers from influent, improved WWTP technology would likely be a costly and ineffective approach to mitigating the volume of microfibers entering the environment. Additionally, updating technology is not a reasonable recommendation for countries without WWTP infrastructure. Review of microfiber distributions indicated the pervasiveness of microfibers throughout freshwater and marine environments. Rivers are often the entry point for microfibers via WWTP effluent and, from there, microfibers are then distributed to lakes, reservoirs, and the ocean. Because of their tendency to be negatively buoyant, most fibers are found in sediments, especially along coastal zones and shorelines near human populations. The omnipresence of microfibers in the environment indicates the severity of microfiber pollution and the potential for widespread impacts. Fibers not trapped in sediments are often distributed throughout the water column and across the water surface via currents and wind. This characteristic is of particular concern as microfibers

47
become a vehicle for introducing bacteria and sorbed compounds into new environments. Additionally, the size and characteristics of microfibers results in their consumption by a variety of aquatic organisms, including species that are consumed by humans. Trophic transfer of microfibers has been confirmed, indicating a pathway to humans from contaminated food sources, the impacts of which are not well-known. The comprehensive review of the current literature indicates that while we do know that microfiber pollution is widespread in the environment, the ultimate impacts of this pollutant are unclear. Evidence of consumption by humans indicates the need for further research on microfibers as a potentially hazardous substance.
7.2 Wash Experiments Previous studies have found that 40 mg or more of microfibers are shed from washing jackets (Browne et al., 2011). This study found between 705 mg to 1,286 mg of microfibers are shed per wash depending on wash treatment, garment age, and jacket type. 7.2.1 Top vs. Front-load We have demonstrated how washing machine type and garment age can impact microfiber shedding. The experiment showed that the top-load washing machine produced greater masses of shed microfibers than the front-load machine. These differences in shedding between the top-load and front-load are informative but not conclusive. The top-load washer we used has a central agitator, the mechanical action of which could have caused the increased concentrations of fibers found. Additionally, top-load machines typically use more water than front-load machines, which could also affect shedding. For the experiments, the run time on the top-load (30 minutes) machine was longer than for front-load (20 minutes). In comparing top-load washers to front-load washers, future research should focus on comparisons of top-load machines with and without a central agitator, the effect of wash/dry spin cycle time, and the impact of the volume of water used in the wash cycle. The impacts of water temperature, detergent type, and rate of drum spin should also be assessed in future wash experiments. The volume of clothes being washed is another variable that should be considered as larger loads could reduce the amount of contact with the central agitator in the top load and the drum in the front load. 7.2.2 New vs. Aged jackets Since Patagonia jackets are often purchased for rigorous outdoor activity, the impact of wear on shedding is a relevant metric. The wash experiments showed that aging jackets increases

48
microfiber shedding, a logical outcome considering fibers get damaged and weakened through regular use. For the aged tests, we assumed that the 24-hour “killer wash” was an appropriate simulation; however, other forms of simulated aging should be explored. Another informative next step would be to analyze the types of fibers coming off of the jackets, i.e. nylon, polyester, rayon, or others, to assess how different materials age. It would also help identify whether jackets with a composition like the Nano Air are shedding fibers from the jacket shell or from insulation. The effects of stitch type and jacket construction could also provide insight into how to best structure jackets. 7.2.3 Fiber size We assessed the distribution of fiber size in the washing machine effluent. The literature review indicated that larger fibers are more likely to be captured by the wastewater treatment process. These findings indicate larger fibers would be more likely to end up in sewage sludge while smaller fibers would likely be discharged in WWTP effluent. The size distribution of fibers could inform garment construction by indicating which garment compositions tend to shed a particular fiber size. Conceivably, if issues in applying sewage sludge as fertilizer were reconciled, materials that shed larger fibers would be preferable. Further wash experiments should test material compositions for patterns in fiber size. 7.2.4 Jacket type We have shown there are differences in microfiber shedding among the four Patagonia jackets and the Budget D jacket. Shedding from the Budget D jacket was consistently higher than its Patagonia style and performance counterpart, which could indicate the importance of textile composition and garment construction in microfiber shedding. An interesting result was the relatively high shedding from Patagonia’s Nano Air jacket. We expected fleece-type jackets such as the Snap-T and R2 to have higher rates of shedding based on their loose fibers, which are more readily exposed to causes of friction such as the central agitator of a top-load washing machine. Conversely, we assumed a tightly woven material such as that used in the Nano Air’s construction would produce lesser quantities of microfibers. However, our results demonstrated that the Nano Air’s total mass of shed fibers was greater than both the Snap-T and R2. As discussed previously, shedding of insulation could occur with the Nano Air and account for this counterintuitive outcome. Further testing should be conducted with larger sample sizes and different jacket styles and compositions to better understand shedding differences. 7.2.5 Interactions As discussed previously, jackets washed in the top-load washing machine shed more microfibers than the jackets washed in the front-load washing machine. In addition, the size of fibers shed

49
was different between washing machine types. In the front load, larger fibers were more predominantly shed, while there were a greater proportion of small fibers shed in the top load. This is a notable result given smaller fibers are more likely to escape WWTP filtration and enter aquatic habitats. Furthermore, the high surface-area to mass ratio of these smaller fibers makes them more dangerous to the environment in terms of soring toxic pollutants. The change in fiber size distribution could potentially result from the central agitator in the top-load washing machine we used. This interaction should be an area of further research. Interestingly, the Budget D jacket shed a greater proportion of smaller fibers when compared to the Patagonia jackets and showed to be more affected by aging. When looking at the shedding characteristics of the jackets, the pilling on the Budget D jacket appeared to be less compact than the Patagonia pilling. This could lead to easier dispersal and a greater proportion of small fibers shedding. This further emphasizes the need for research regarding the effect of jacket construction on the quantity and type of fibers shed. 7.2.5 Moving Forward The results are informative regarding the impacts of washing machine type and age on shedding. Future research should study the effect of different textile compositions, garment construction, and washing characteristics (such as water temperature, detergent, and wash cycle) on microfiber shedding.
7.3 WWTP Model The filtration rate of a wastewater treatment plant has a significant effect on the quantity of microfibers released into the local aquatic or terrestrial environment. Depending on the quality of filtration, if 100,000 jackets are washed, between 8 and 35 kg of microfibers could be released into the environment. This is the mass equivalent of 1,600 – 7,000 plastic grocery bags. 60 to 85 kg of what is not directly released into the environment is retained in sewage sludge. Considering that biosolids from sewage are now commonly being applied to agricultural fields, the terrestrial environment could be a significantly large sink for microplastics. There, they may be ingested by small organisms such as worms, affect microbial communities, or transfer into local aquatic environments via runoff. Based on Patagonia’s 2013 revenue of approximately $575 million (Bloomberg Business, 2013), if 50% of that revenue comes from outdoor jackets and 35% of those are made of polyester, then approximately 503,125 Patagonia polyester jackets were sold in 2013 alone.1
1Based on an average price tag of $200 per jacket.

50
Using these estimates, we believe that 100,000 is a very conservative fraction of the Patagonia jackets washed per year. Therefore, to better understand the scale of microfiber release, we also modeled the mass of fibers released by 100,000 individuals. Here we found that between 13 and 154 kg of microfibers are released in effluent per day. From a global perspective, this is a concerning issue. A significantly larger portion of the population resides on the coastlines of northern hemisphere countries. Considering that many of these nations are wealthier and mildly colder, sales of synthetic fleece jackets would presumably be higher in these regions. As these jackets are washed and aged over time, shedding will release microfibers through northern wastewater treatment plants. From there, they will be dispersed into local aquatic environments where they sink through the water column and settle on deep-sea beds or intertidal shorelines. Heavy concentrations of microfibers (sometimes up to 40 fibers per 50 mL of sediment) have already been discovered in sediment profiles in the Northern Pacific and Atlantic, and we can expect to find more as synthetic textile production increases globally.
8. Conclusion This study highlights current research regarding microfiber pollution and analyzes the impacts of two variables on microfiber shedding: garment age and washing machine type. Results show that aged jackets and those washed in the top-load washing machine shed higher masses of fibers than new jackets and jackets washed in the front-load machine. Higher shedding in aged jackets is most likely due to the weakening of fibers as a result of wear, and higher shedding from the top-load washing machine is likely influenced by the central agitator found in these appliances. These results were significant; however, several other variables were identified that could affect shedding and should be evaluated further including water temperature, cycle length, and detergent type. Future work should also evaluate differences in shedding between traditional top-load machines with a central agitator (like the one used in this study) and high-efficiency top-load washers that do not have a central agitator. The review of current research revealed several knowledge gaps in regards to the potential environmental and human health impacts of microfibers. While many studies have found microfibers present in a variety of ecosystems and organisms, only a handful of studies have attempted to assess the ecological or physiological consequences. Those that have explored the health impacts of microfibers have found both physical and chemical impacts in the form of altered habitat characteristics and reproductive disturbances in some organisms. The impacts of microfibers are, based on the literature, similar to microbeads in terms of potential harm. However, the regulatory strategies being implemented to eliminate the use of plastic microbeads are not viable solutions to the microfiber problem. Eliminating microbeads from cosmetic products is possible given viable natural alternatives that provide the same

51
function. Unfortunately, there are no current alternatives to synthetic materials that provide the same performance qualities so mitigation of microfiber pollution is a more reasonable approach than outright bans. Studies like this one provide valuable insight to the apparel industry regarding their contributions to microfiber pollution, which can lead to more informed decisions to reduce microfiber shedding from their products.

52
References American Apparel and Footwear Association. Restricted Substances List. Rep. 12th ed. 2013. VF Corporation. Restricted Substances List (2015).
Besseling, E., E.M. Foekema, J.A. Van Franeker, M.F. Leopold, S. Kühn, E.L. Bravo Rebolledo, E. Hebe, L. Mielke, J. Ijzer, P. Kamminga, and A.A. Koelmans. "Microplastic in a Macro Filter Feeder: Humpback Whale Megaptera Novaeangliae." Marine Pollution Bulletin (2015): 248-52. Browne, M.A., P. Crump, S. J. Niven, E. Teuten, A. Tonkin, T. Galloway, and R. Thompson. "Accumulation of Microplastic on Shorelines Woldwide: Sources and Sinks." Environmental Science & Technology (2011): 9175-179. Browne, Mark A., T. Galloway, and R. Thompson. "Spatial Patterns of Plastic Debris along Estuarine Shorelines." Environmental Science & Technology (2010): 3404-409. Carson, H. S., S. L. Colbert, M. J. Kaylor, and K. J. Mcdermid. "Small Plastic Debris Changes Water Movement and Heat Transfer through Beach Sediments." Marine Pollution Bulletin (2011): 1708-713. Cole, Matthew, P. Lindeque, E. Fileman, C. Halsband, R. Goodhead, J. Moger, and T. Galloway. "Microplastic Ingestion by Zooplankton." Environmental Science & Technology Environ. Sci. Technol. (2013): 6646-655. Cozar, A., F. Echevarria, J. I. Gonzalez-Gordillo, X. Irigoien, B. Ubeda, S. Hernandez-Leon, A. T. Palma, S. Navarro, J. Garcia-De-Lomas, A. Ruiz, M. L. Fernandez-De-Puelles, and C. M. Duarte. "Plastic Debris in the Open Ocean." Proceedings of the National Academy of Sciences (2014): 10239-244. De Tender, C. A., L.I. Devriese, A. Haegeman, S. Maes, T. Ruttink, and P. Dawyndt. "Bacterial Community Profiling of Plastic Litter in the Belgian Part of the North Sea." Environmental Science & Technology (2015): 9629-638. Devriese, L.I., M.D. Van Der Meulen, T. Maes, K. Bekaert, I. Paul-Pont, L. Frère, J. Robbens, and A.D. Vethaak. "Microplastic Contamination in Brown Shrimp (Crangon Crangon, Linnaeus 1758) from Coastal Waters of the Southern North Sea and Channel Area." Marine Pollution Bulletin (2015): 179-87. Dris, R., J. Gasperi, M. Saad, C. Mirande, and B. Tassin. "Synthetic Fibers in Atmospheric Fallout: A Source of Microplastics in the Environment?" Marine Pollution Bulletin (2016).

53
Eriksen, M., L.C.M. Lebreton, H.S. Carson, M. Thiel, C.J. Moore, J.C. Borerro, F. Galgani, P.G. Ryan, and J. Reisser. "Plastic Pollution in the World's Oceans: More than 5 Trillion Plastic Pieces Weighing over 250,000 Tons Afloat at Sea." PLoS ONE (2014). Farrell, P., and K. Nelson. "Trophic Level Transfer of Microplastic: Mytilus Edulis (L.) to Carcinus Maenas (L.)." Environmental Pollution (2013): 1-3. Free, C. M., O. P. Jensen, S. A. Mason, M. Eriksen, N. J. Williamson, and B. Boldgiv. "High-levels of Microplastic Pollution in a Large, Remote, Mountain Lake." Marine Pollution Bulletin (2014): 156-63. Gasperi, J., R. Dris, V. Rocher, and B. Tassin. “Microplastics in the Continental Area: An Emerging Challenge”. Norman Bulletin, 2015. Goldstein, M. C., M. Rosenberg, and L. Cheng. "Increased Oceanic Microplastic Debris Enhances Oviposition in an Endemic Pelagic Insect."Biology Letters 8.5 (2012): 817-20. Gulrajani, M L. Advances in the Dyeing and Finishing of Technical Textiles. Cambridge, UK: Woodhead Publishing Ltd, 2013. Habib, D., D.C. Locke, and L.J. Cannone. "Synthetic Fibers as Indicators of Municipal Sewage Sludge, Sludge Products, and Sewage Treatment Plant Effluents." Water, Air, and Soil Pollution (1998): 1-8. Klein, S., E. Worch, and T.P. Knepper. "Occurrence and Spatial Distribution of Microplastics in River Shore Sediments of the Rhine-Main Area in Germany." Environmental Science & Technology (2015): 6070-076. Luongo, G., G. Thorsén, and C. Östman. "Quinolines in Clothing Textiles—a Source of Human Exposure and Wastewater Pollution?" Analytical and Bioanalytical Chemistry (2014): 2747-756. Luongo, G. Chemicals in Textiles: A Potential Source for Human Exposure and Environmental Pollution. Thesis. Stockholm University (2015). Lusher, A., M. Mchugh, and R. Thompson. "Occurrence of Microplastics in the Gastrointestinal Tract of Pelagic and Demersal Fish from the English Channel." Marine Pollution Bulletin (2013): 94-99. Magnusson, K., and F. Norén. Screening of Microplastic Particles in and Down-stream a Wastewater Treatment Plant. IVL Swedish Environmental Research Institute, 2014.

54
Mathalon, A. and P. Hill. "Microplastic Fibers in the Intertidal Ecosystem Surrounding Halifax Harbor, Nova Scotia." Marine Pollution Bulletin (2014): 69-79. Mato, Y., T. Isobe., H. Takada, H. Kanehiro, C. Ohtake., T. Kaminuma. Plastic resin pellets as a transport medium for toxic chemicals in the marine environment. Environmental Science & Technology (2001): 318–324. McCormick, A., T.J. Hoellein, S.A. Mason, J. Schluep, and J.J. Kelly. "Microplastic Is an Abundant and Distinct Microbial Habitat in an Urban River." Environmental Science & Technology (2014): 11863-1871. Mepex Consult AS. Sources of Microplastic-pollution to the Marine Environment, 2014. Microbead-Free Waters Act (H.R. 1321), 2015. 114th Congress. Muthu, S. S. Roadmap to Sustainable Textiles and Clothing: Eco-friendly Raw Materials, Technologies, and Processing Methods, 2014. Neves, Diogo, P. Sobral, J.L. Ferreira, and T. Pereira. "Ingestion of Microplastics by Commercial Fish off the Portuguese Coast." Marine Pollution Bulletin (2015): 119-26. Oehlmann, J., U. Schulte-Oehlmann, W. Kloas, O. Jagnytsch, I. Lutz, K. O. Kusk, L. Wollenberger, E. M. Santos, G. C. Paull, K. J. W. Van Look, and C. R. Tyler. "A Critical Analysis of the Biological Impacts of Plasticizers on Wildlife." Philosophical Transactions of the Royal Society B: Biological Sciences (2009): 2047-062. Paul, R., and E. Genescà. "The Use of Enzymatic Techniques in the Finishing of Technical Textiles." Advances in the Dyeing and Finishing of Technical Textiles (2013): 177-98. Plastic Microbeads Nuisance Prevention Law (No. 888), 2015. California (State). Legislature. Assembly. Qin, Y. Global Fibres Overview. Synthetic Fibres Raw Materials Committee Meeting at APIC (2014). "REACH." European Commission (2016). Rochman, C.M., E. Hoh, T. Kurobe, and S.J. Teh. "Ingested Plastic Transfers Hazardous Chemicals to Fish and Induces Hepatic Stress." Scientific Reports (2013).

55
Romeo, T., B. Pietro, C. Pedà, P. Consoli, F. Andaloro, and M.C. Fossi. "First Evidence of Presence of Plastic Debris in Stomach of Large Pelagic Fish in the Mediterranean Sea." Marine Pollution Bulletin (2015): 358-61. Ryan, P.G., A.D. Connell, and B.D. Gardner. "Plastic Ingestion and PCBs in Seabirds: Is There a Relationship?" Marine Pollution Bulletin (1988): 174-76. Sekar, N. "UV-absorbent, Antimicrobial, Water-repellent and Other Types of Functional Dye for Technical Textile Applications." Advances in the Dyeing and Finishing of Technical Textiles (2013): 47-77. Santen, M., K. Brigden, and M. Cobbing. Leaving Traces: The Hidden Hazardous Chemicals in Outdoor Gear. Greenpeace (2016). Sussarellu, R., M. Suquet, Y. Thomas, C. Lambert, C. Fabioux, M. .. Pernet, N. Goïc, V. Quillien, C. Mingant, Y. Epelboin, C. Corporeau, J. Guyomarch, J. Robbens, I. Paul-Pont, P. Soudant, and A. Huvet. "Oyster Reproduction Is Affected by Exposure to Polystyrene Microplastics." Proceedings of the National Academy of Sciences (2016): 2430-435. Takada, H. "Microplastics and the Threat to Our Seafood." Ocean Health Index. Talsness, C. E., A. J. M. Andrade, S. N. Kuriyama, J. A. Taylor, and F. S. Vom Saal. "Components of Plastic: Experimental Studies in Animals and Relevance for Human Health." Philosophical Transactions of the Royal Society B: Biological Sciences (2009): 2079-096. Talvitie, J., M. Heinonen, J.-P. Paakkonen, E. Vahtera, A. Mikola, O. Setala, and R. Vahala. "Do Wastewater Treatment Plants Act as a Potential Point Source of Microplastics? Preliminary Study in the Coastal Gulf of Finland, Baltic Sea." Water Science and Technology (2015): 1495-504. Talvitie, J., and M. Heinonen. Helcom, 2014, BASE Project 2012-2014: Preliminary Study on Synthetic Microfibers and Particles at a Municipal Waste Water Treatment Plant. Baltic Marine Environment Protection Commission, 2014. Tanaka, K., H. Takada, R. Yamashita, K. Mizukawa, M. Fukuwaka, and Y. Watanuki. "Accumulation of Plastic-derived Chemicals in Tissues of Seabirds Ingesting Marine Plastics." Marine Pollution Bulletin (2013): 219-22.

56
Teuten, E. L., J. M. Saquing, D. R. U. Knappe, M. A. Barlaz, S. Jonsson, A. Bjorn, S. J. Rowland, R. C. Thompson, T. S. Galloway, R. Yamashita, D. Ochi, Y. Watanuki, C. Moore, P. H. Viet, T. S. Tana, M. Prudente, R. Boonyatumanond, M. P. Zakaria, K. Akkhavong, Y. Ogata, H. Hirai, S. Iwasa, K. Mizukawa, Y. Hagino, A. Imamura, M. Saha, and H. Takada. "Transport and Release of Chemicals from Plastics to the Environment and to Wildlife." Philosophical Transactions of the Royal Society B: Biological Sciences (2009): 2027-045. Thompson, R. C., Y. Olsen, R. P. Mitchell, A. Davis, S.J. Rowland, A. W. G John, D. McGonigle, A.E. Russell. “Lost at Sea: Where Is All the Plastic?” Science (2004): 838. Van Cauwenberghe, L., and C.R. Janssen. "Microplastics in Bivalves Cultured for Human Consumption." Environmental Pollution (2014): 65-70. Webster, G. "Potential Human Health Effects of Perfluorinated Chemicals." National Collaborating Center for Human Health (2016). Whitacre, David M. Reviews of Environmental Contamination and Toxicology: Vol. 198. New York: Springer, 2008. Woodall, L. C., A. Sanchez-Vidal, M. Canals, G. L. J. Paterson, R. Coppock, V. Sleight, A. Calafat, A. D. Rogers, B. E. Narayanaswamy, and R. C. Thompson. "The Deep Sea Is a Major Sink for Microplastic Debris."Royal Society Open Science (2014): 1403-1417. Zalasiewicz, J., C. N. Waters, J. A. Ivar Do Sul, P. L. Corcoran, A. D. Barnosky, A. Cearreta, M. Edgeworth, A. Gałuszka, C. Jeandel, R. Leinfelder, J.R. Mcneill, W. Steffen, C. Summerhayes, M. Wagreich, M. Williams, A. P. Wolfe, and Y. Yonan. "The Geological Cycle of Plastics and Their Use as a Stratigraphic Indicator of the Anthropocene." Anthropocene (2016). Zbyszewski, M., and P. L. Corcoran. "Distribution and Degradation of Fresh Water Plastic Particles Along the Beaches of Lake Huron, Canada." Water, Air, and Soil Pollution 220.1-4 (2011): 365-72. Zettler, E. R., T. J. Mincer, and L. A. Amaral-Zettler. "Life in the “Plastisphere”: Microbial Communities on Plastic Marine Debris."Environmental Science & Technology (2013): 7137-146. Zhao, S., L. Zhu, and D. Li. "Microplastic in Three Urban Estuaries, China." Environmental Pollution (2015): 597-604. Zubris, K.A.V., and B.K. Richards. "Synthetic Fibers as an Indicator of Land Application of Sludge." Environmental Pollution (2005): 201-11.

57
Appendix A1. Wash Protocol Aim: To quantify number of fibers shed from four types of Patagonia jackets when they are brand new and after a lifetime of laundering. Materials and equipment required: 333 µm mesh, 20 µm mesh, four of each jacket type, washing machine outlet connecting pipe, 60 gallon rain barrel, filtration column, petri plates, large beaker, washing machine (WET3300XQ1), laundering machine (washing machine with continuous agitation), weighing scale Calculations and settings:
1. Each jacket is washed separately and the effluent is filtered through two mesh sizes. Number of jacket types = X Number of each jacket type = Y Number of 333 µm filters = 2*X*Y Number of 20 µm filters = 2*X*Y Number of petri plates = 4*X*Y
2. Empty wash settings:
Load: Small Wash Temperature: hot Wash setting: Regular, small
3. Jacket wash setting:
Load: Small Wash Temperature: warm Wash setting: Regular, small

58
Procedure:
1. Start with jacket type A: label the four jackets as A1, A2, A3 and A4.
2. Calculate the number of filters and petri plates needed for jacket type A, Place the filter cut outs in the petri plates, label the plates. Note the weight of the petri plates (with the filters) and brand new jackets.
3. Rinse the column and the rain barrel with distilled water and load the filters in the
column.
4. Run the washing machine on the ‘empty wash setting’ (no jacket). This is done to avoid fiber contamination from the previous wash. This water does not need to be collected.
5. Next, unbutton/unzip all pockets and compartments jacket A 1 and wash it in the ‘jacket
wash settings’. Collect the water from the jacket washing, stir it 20 times in the clockwise direction and pass 5L of it through the filtration column.
6. Carefully collect the filters and place them in their respective petri plates. Leave these to
dry.
7. Repeat steps 1 to 6 for A2, A3 and A4.
8. Put all four jackets in the same killer wash for 24 hours (lifetime of laundering), update the labelling to A1’, A2’, A3’ and A4’ and repeat steps 1 through 6.
9. Repeat steps 1 to 8 for Jacket B, C and D.
10. Let all the petri plates dry then, note their weight.
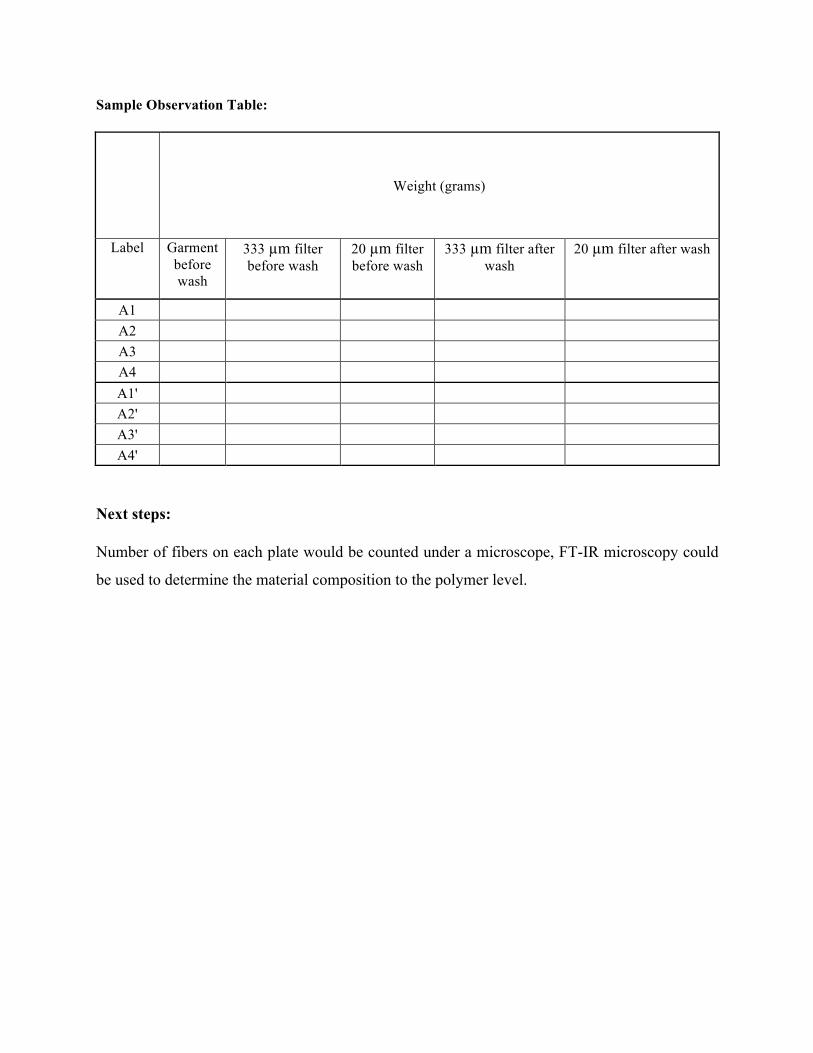
59
Sample Observation Table:
Weight (grams)
Label Garment before wash
333 µm filter before wash
20 µm filter before wash
333 µm filter after wash
20 µm filter after wash
A1 A2 A3 A4 A1' A2' A3' A4'
Next steps:
Number of fibers on each plate would be counted under a microscope, FT-IR microscopy could
be used to determine the material composition to the polymer level.

60
333#microns
Pictures:
20#microns

61
A2. Literature Review
A2.1 Chemical Substances Sekar, N. "UV-absorbent, Antimicrobial, Water-repellent and Other Types of Functional Dye for Technical Textile Applications." Advances in the Dyeing and Finishing of Technical Textiles (2013): 47-77. Purpose The purpose of this paper was to describe the chemistry of synthetic dyes having functions other than color, such as better light-fastness, antimicrobial activity, water repellency, biodegradability, fluorescence and phosphorescence. Dyes belonging to the azo, cyanine, coumarin, xanthene, naphthalimide, perylene, thioxanthone, quinonoid, and naphtholactam classes were discussed. This paper summarized the kinds of substances used in garment finishing to impart UV-absorbent, antimicrobial, water-repellent and other functions to apparel and possibly enter the environment during the wash phase. Methods This is a review paper. Findings ● Dyes with inbuilt UV-absorbing units: High-energy radiation from the sun is absorbed by
the colorant and transferred to the textile substrate, causing loss of color strength of the polymeric substrate. UV-absorbers are added as additives during fiber manufacture or textile finishing. The majority of these are benzophenone, hindered amine, or benzotriazole derivatives.
● Antimicrobial dyes: Cyanines, hemicyanines and other cationic dyes. Curcumin is a natural dye found in turmeric and is also used as a food colourant.
● Water-repellent dyes and other fluorine-containing functional dyes: A layer of finishing on the surface of the material without filling up the interstices, thereby making the fabric sufficiently porous to allow moist air to circulate. Azo acid dyes containing fluorinated alkly groups are obtained by using perfluorobutamido acid derivatives of H-acid, gamma acid, J-acid, and M-acid as couplers and p-alkyl anilines and trifluoromethyl aniline as diazo components. Disperse dyes containing perfluoroalkyl chains and mono azo disperse dyes containing trifluoromethyl sulfonyl groups are also used as water repellents.
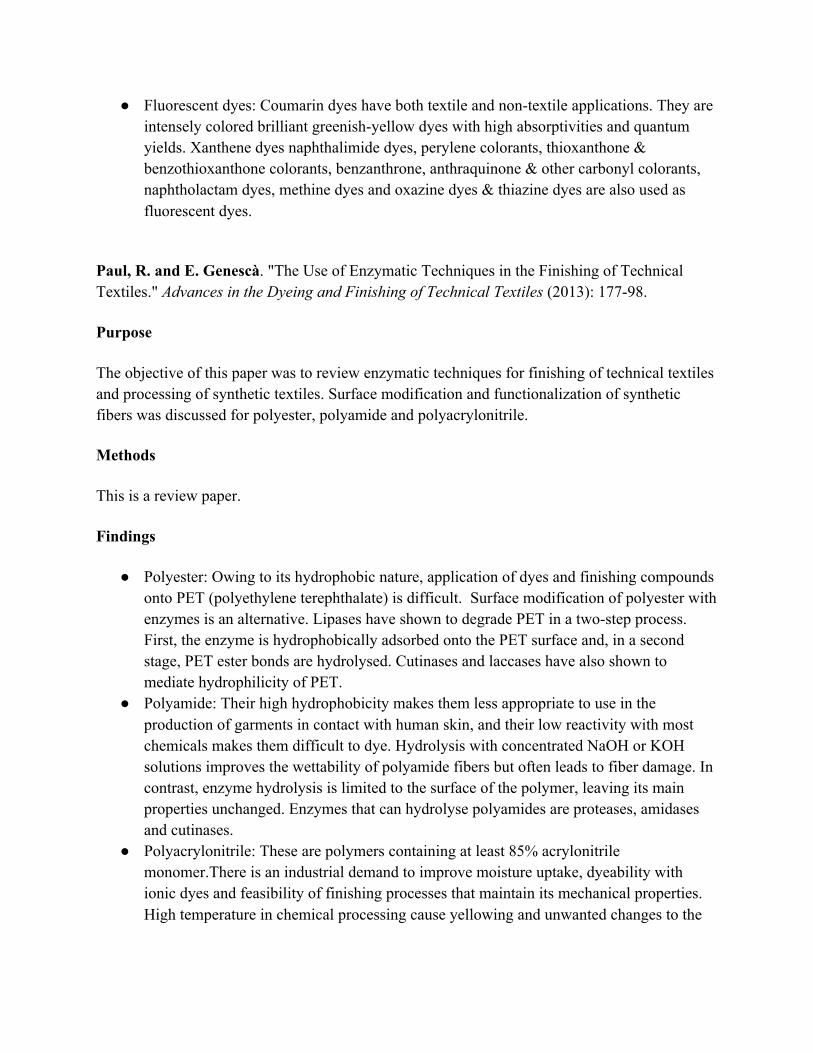
62
● Fluorescent dyes: Coumarin dyes have both textile and non-textile applications. They are intensely colored brilliant greenish-yellow dyes with high absorptivities and quantum yields. Xanthene dyes naphthalimide dyes, perylene colorants, thioxanthone & benzothioxanthone colorants, benzanthrone, anthraquinone & other carbonyl colorants, naphtholactam dyes, methine dyes and oxazine dyes & thiazine dyes are also used as fluorescent dyes.
Paul, R. and E. Genescà. "The Use of Enzymatic Techniques in the Finishing of Technical Textiles." Advances in the Dyeing and Finishing of Technical Textiles (2013): 177-98. Purpose The objective of this paper was to review enzymatic techniques for finishing of technical textiles and processing of synthetic textiles. Surface modification and functionalization of synthetic fibers was discussed for polyester, polyamide and polyacrylonitrile. Methods This is a review paper. Findings ● Polyester: Owing to its hydrophobic nature, application of dyes and finishing compounds
onto PET (polyethylene terephthalate) is difficult. Surface modification of polyester with enzymes is an alternative. Lipases have shown to degrade PET in a two-step process. First, the enzyme is hydrophobically adsorbed onto the PET surface and, in a second stage, PET ester bonds are hydrolysed. Cutinases and laccases have also shown to mediate hydrophilicity of PET.
● Polyamide: Their high hydrophobicity makes them less appropriate to use in the production of garments in contact with human skin, and their low reactivity with most chemicals makes them difficult to dye. Hydrolysis with concentrated NaOH or KOH solutions improves the wettability of polyamide fibers but often leads to fiber damage. In contrast, enzyme hydrolysis is limited to the surface of the polymer, leaving its main properties unchanged. Enzymes that can hydrolyse polyamides are proteases, amidases and cutinases.
● Polyacrylonitrile: These are polymers containing at least 85% acrylonitrile monomer.There is an industrial demand to improve moisture uptake, dyeability with ionic dyes and feasibility of finishing processes that maintain its mechanical properties. High temperature in chemical processing cause yellowing and unwanted changes to the

63
fabric. Nitrilases, esterases and cutinases have shown positive results in modifying polyacrylonitrile fibers.
Enzymes have however not reached industrial application status as the require new infrastructure and have limited efficiency. Bulrajani, M. L. "The Use of Nanotechnology in the Finishing of Technical Textiles." Advances in the Dyeing and Finishing of Technical Textiles (2013): 280-308. Purpose The application of nanotechnology in finishing of technical textiles has led to both new complex functions and improved existing ones. This paper discussed some of the commercially successful nano-finishes that impart hydrophobic, super-hydrophobic, self-cleaning and antimicrobial properties. Methods This is a review paper Findings Table A.1. Due to the environmental concerns many researchers have exploited a wide range of environmentally friendly solvents, reducing agents and stabilizing agents for the synthesis of nanoparticles. However, since nanoparticles are an emerging pollutant, this technology may be short-lived.
64
Santen, M., K. Brigden, and M. Cobbing. Leaving Traces: The Hidden Hazardous Chemicals in Outdoor Gear. Greenpeace (2016). Purpose This paper tested a range of outdoor gear for hazardous per- and polyfluorinated chemicals (PFCs). The results were categorized by items produced and sold by various outdoor brands. PFCs were classified by ionic vs. volatile and short chain vs. long chain compounds.1µg/m2 EU regulatory limit set for PFOS. PFOA has also been restricted in Norway, at the same limit, since 2014 and currently PFOA is undergoing the restriction process according to the EU’s-REACH regulation. Methods ● 40 products-- 11 jackets and 8 trousers, 7 pairs of shoes/footwear, 8 backpacks, 2 tents, 2
sleeping bags and 1 rope and 1 pair of gloves were bought in-store or purchased online ○ packed, sealed in clean polythene bags ○ sent to an independent accredited laboratory for analysis
● Samples were tested for a wide range of per- and poly-fluorinated compounds, among them perfluorinated carboxylic acids such as PFOA and perfluorinated sulfonic acids such as PFOS and, among other compounds, fluorotelomer alcohols (FTOHs)
● Testing covered a range of PFCs that could be extracted using solvents ● Sample was cut from each article where there was no printing or labelling ● Two separate analyses were carried out on each sample. One portion was extracted with
methanol using Soxhlet extraction, the extract purified using solid phase extraction (SPE), and a range of ionic PFCs were quantified using high performance liquid chromatography (HPLC) combined with tandem mass spectrometry (HPLC-MS/MS).
● A second portion was extracted with methyl tertiary butyl ether (MTBE) using ultrasonic extraction and a range of volatile neutral PFCs were quantified using gas chromatography-mass spectrometry (GC-MS)
● For a number of articles, a separate section of the same material from the article was subsequently analysed to gain an understanding of the variability in PFC concentrations for different parts of a fabric.
Findings Out of the 40 products that were tested, only four were found to be free from the per- and polyfluorinated chemicals that were investigated, to the detection levels used. The four products that did not contain PFCs were: two jackets – one by Vaude and one by Jack Wolfskin, which was the only item labelled as “PFC free”; one backpack by Haglöfs and the one sample of gloves by the North Face. PFCs were detected in all of the shoes, trousers, tents and sleeping bags, in 9
65
of the 11 jackets and in 7 of the 8 backpacks. Volatile PFCs dominated the samples by concentration in jackets, trousers, footwear and sleeping bags and in a rope. Ionic PFCs were detected in all of the footwear, sleeping bags, tents and rope samples, 9 out of the 11 jackets, 7 out of 8 trousers and 7 of the 8 tested backpacks. Jackets: PFCs were detected in 9 of the 11 jackets tested. The jacket by Norrona had by far the highest concentration of short chain volatile PFC and a total volatile PFCs (630 µg/m2). Trousers: PFCs were detected in all 8 trousers tested. The highest total volatile PFCs concentrations were found in the Jack Wolfskin trousers (540 µg/m2 ) followed by the Arc'teryx trousers (270 µg/m2 ). Footwear: PFCs were detected in all 7 shoes tested. In most shoe samples volatile PFCs were found in higher concentration than in other product types. The highest volatile PFC concentrations above 1,000 µg/m2 were found in the Columbia footwear and from Haglöfs followed by shoes from Jack Wolfskin, The North Face, and Salewa. Volatile PFCs were detected in all of the shoes/boots apart from the Patagonia sample. Backpacks: PFCs were detected in 7 out of 8 backpacks tested. The highest total ionic PFC concentrations were found in backpacks from Mammut (PFOA: 4.24 µg/m2 and PFDA 2.4 µg/m2 )and Patagonia (PFBS:9.42 µg/m2). Sleeping bags: Volatile PFCs found in both bags tested by Mammut and North Face. Tent: PFCs were detected in both tents tested – Jack Wolfskin and The North Face. Concentrations of volatile PFCs dominated over those of ionic PFCs, but generally at lower concentrations compared with volatile PFCs in other product categories. The study showed that chemicals that are known to be hazardous, among them substances of very high concern such as PFOA and other long chain ionic PFCs, are still being widely used for products sold by outdoor brands. At the same time the tests showed a shift in the type of PFCs being used towards short chain PFCs – chemicals that are also persistent but less well researched in some aspects. Luongo, G. Chemicals in Textiles: A Potential Source for Human Exposure and Environmental Pollution. Thesis. Stockholm University, 2015. Purpose The purpose of this paper was to conduct analysis on samples before and after five and ten times washing to quantify emissions.The study hypothesized that quinoline, benzothiazole, benzotriazole, and derivative compounds are sparingly soluble in water but more easily soluble in hot water. Laundry can, thus, be a route of emission into the environment of contaminants present in textiles.
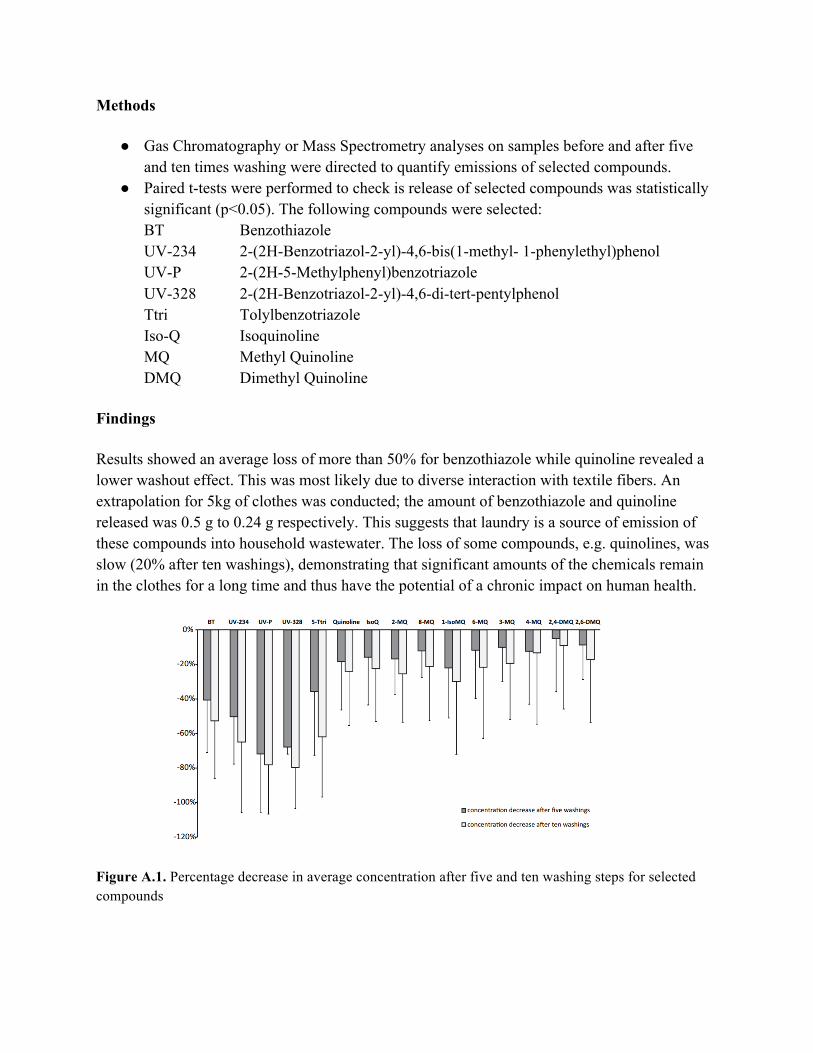
66
Methods ● Gas Chromatography or Mass Spectrometry analyses on samples before and after five
and ten times washing were directed to quantify emissions of selected compounds. ● Paired t-tests were performed to check is release of selected compounds was statistically
significant (p<0.05). The following compounds were selected: BT Benzothiazole UV-234 2-(2H-Benzotriazol-2-yl)-4,6-bis(1-methyl- 1-phenylethyl)phenol UV-P 2-(2H-5-Methylphenyl)benzotriazole UV-328 2-(2H-Benzotriazol-2-yl)-4,6-di-tert-pentylphenol Ttri Tolylbenzotriazole Iso-Q Isoquinoline MQ Methyl Quinoline DMQ Dimethyl Quinoline
Findings Results showed an average loss of more than 50% for benzothiazole while quinoline revealed a lower washout effect. This was most likely due to diverse interaction with textile fibers. An extrapolation for 5kg of clothes was conducted; the amount of benzothiazole and quinoline released was 0.5 g to 0.24 g respectively. This suggests that laundry is a source of emission of these compounds into household wastewater. The loss of some compounds, e.g. quinolines, was slow (20% after ten washings), demonstrating that significant amounts of the chemicals remain in the clothes for a long time and thus have the potential of a chronic impact on human health.
Figure A.1. Percentage decrease in average concentration after five and ten washing steps for selected compounds

67
Luongo, G., G. Thorsén, and C. Östman. "Quinolines in Clothing Textiles—a Source of Human Exposure and Wastewater Pollution?" Anal Bioanal Chem Analytical and Bioanalytical Chemistry 406.12 (2014): 2747-756. Purpose This study focused on quinolines, a class of compounds involved in manufacturing dyes, some of which are skin irritants and/or classified as probable human carcinogens. Clothing samples were diverse in color, material, brand, country of manufacture, and price, and were purchased from different shops in Stockholm, Sweden. Methods ● Quinoline and ten quinoline derivatives were quantified from 31 textile samples by
ultrasound assisted solvent extraction, solid phase extraction cleanup, and final analysis by gas chromatography/mass spectrometry
● Garments included a number of different types, from baby clothes, T-shirts, jeans and dresses; ○ 17 blue clothes, 3 made from organic cotton and labelled with EU and Nordic
Ecolabels ○ 10 clothes with > 85% polyester. ○ Manufactured in at least 17 countries for 17 global fashion brands
Findings Quinoline was found to be the most abundant compound present in 29 of the 31 samples investigated. Being the dominating compound, it constituted up to ~50% of the total amount of quinolines; the highest concentration of quinoline detected in a garment was 35,600 ng/g. The second most abundant compound was isoquinoline, reaching concentrations up to 4,400 ng/g. Quinoline was detected in all garments made from 100 % polyester, and the highest levels were found in these samples. The mean concentration in these garments was found to be 4,700 ng/g. This mean concentration was more than 100 times higher than the average quinoline concentration in blended cotton garments and around 600 times higher than in the 100 % cotton garments. The study did not reveal specific brand concentrations.
68
Wastewater Treatment Plants Zubris, K.A.V., and B.K. Richards. "Synthetic Fibers as an Indicator of Land Application of Sludge." Environmental Pollution 138.2 (2005): 201-11. Purpose The purpose of this study was to examine whether synthetic fabric fibers could be used as indicators of the application of Wastewater Treatment Plant (WWTP) sewage sludge. This study was a follow up from the Habib et al. (1998l) study. The Habib et al. study found that microfibers indicated the presence of sewage sludge or biosolid pellets; in addition, they concluded that microfiber pollution was likely the result of washing clothes. Methods ● Fibers were isolated bywater extraction
○ Based on Habib et al. (1998) study ○ Efficient method at recovering synthetic fibers from soil samples
● Natural and synthetic fibers were differentiated through polarized light microscopy ○ Used snaking tracking pattern for finding fibers on slides
Findings This study found that synthetic fibers persist through the sludge formation processes. As a result, synthetic fibers are transported into the environment; for example, fibers were found after 5 years in long-term greenhouse soil columns. This soil was subjected to regular tillage, watering, and cropping. Fibers were also found in field sites up to 15 years after the application of sludge products. The study concluded that the presence of synthetic fibers are a significant indicator of the application of wastewater treatment plant sludge products. Gasperi, J., R. Dris, V. Rocher, and B. Tassin. “Microplastics in the Continental Area: An Emerging Challenge”. Norman Bulletin, 2015. Purpose The purpose of this paper was to examine the abundance of microplastics in continental aquatic environments. This paper focused on microplastic contamination in atmospheric fallout, WWTP effluent, and surface water.
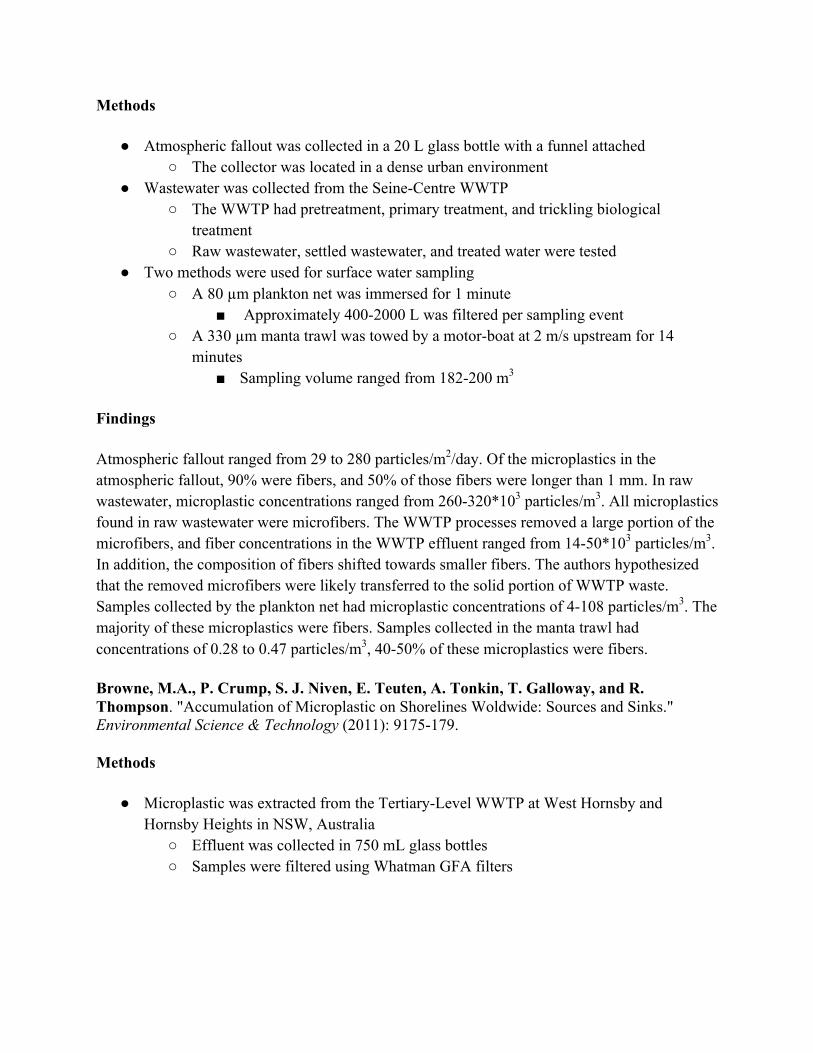
69
Methods ● Atmospheric fallout was collected in a 20 L glass bottle with a funnel attached
○ The collector was located in a dense urban environment ● Wastewater was collected from the Seine-Centre WWTP
○ The WWTP had pretreatment, primary treatment, and trickling biological treatment
○ Raw wastewater, settled wastewater, and treated water were tested ● Two methods were used for surface water sampling
○ A 80 µm plankton net was immersed for 1 minute ■ Approximately 400-2000 L was filtered per sampling event
○ A 330 µm manta trawl was towed by a motor-boat at 2 m/s upstream for 14 minutes ■ Sampling volume ranged from 182-200 m3
Findings Atmospheric fallout ranged from 29 to 280 particles/m2/day. Of the microplastics in the atmospheric fallout, 90% were fibers, and 50% of those fibers were longer than 1 mm. In raw wastewater, microplastic concentrations ranged from 260-320*103 particles/m3. All microplastics found in raw wastewater were microfibers. The WWTP processes removed a large portion of the microfibers, and fiber concentrations in the WWTP effluent ranged from 14-50*103 particles/m3. In addition, the composition of fibers shifted towards smaller fibers. The authors hypothesized that the removed microfibers were likely transferred to the solid portion of WWTP waste. Samples collected by the plankton net had microplastic concentrations of 4-108 particles/m3. The majority of these microplastics were fibers. Samples collected in the manta trawl had concentrations of 0.28 to 0.47 particles/m3, 40-50% of these microplastics were fibers. Browne, M.A., P. Crump, S. J. Niven, E. Teuten, A. Tonkin, T. Galloway, and R. Thompson. "Accumulation of Microplastic on Shorelines Woldwide: Sources and Sinks." Environmental Science & Technology (2011): 9175-179. Methods ● Microplastic was extracted from the Tertiary-Level WWTP at West Hornsby and
Hornsby Heights in NSW, Australia ○ Effluent was collected in 750 mL glass bottles ○ Samples were filtered using Whatman GFA filters

70
Findings Wastewater treatment plant effluent was found to contain one particle of microplastic per liter. Polyester and acrylic fibers accounted for 67% and 17% of these particles respectively. Analysis of the shape and composition of these fibers indicated they were derived from clothes washing and not macroplastic degradation. Talvitie, J., M. Heinonen, J.P. Paakkonen, E. Vahtera, A. Mikola, O. Setala, and R. Vahala. "Do Wastewater Treatment Plants Act as a Potential Point Source of Microplastics? Preliminary Study in the Coastal Gulf of Finland, Baltic Sea." Water Science and Technology (2015): 1495-504. Purpose The purpose of this study was to investigate the role WWTPs play as a source of marine microplastics pollution. In addition, this study tested previously developed protocols for analyzing microplastic concentrations in WWTP effluent. Methods ● This study was carried out at the Viikinmaki wastewater treatment plant
○ This WWTP services 800,000 inhabitants and filters 270,000 cubic meters per day
○ Effluent is discharged 8 km from shore at a depth of 20 m ● The WWTP had the following treatment processes:
○ Bar screening ○ Grit removal ○ Preaeration ○ Primary sedimentation ○ Activated sludge treatment ○ Secondary sedimentation ○ Tertiary biological filtration
● Samples were collected at 4 points: ○ Before screening ○ After primary sedimentation ○ After secondary sedimentation ○ After tertiary biological filtration
● Samples were filtered in a filter column similar to the column used in the Patagonia wash trials ○ 200 µm, 100 µm, and 20 µm plankton net mesh filters were used

71
● Sediment and seawater samples were collected from the WWTP discharge points and a reference site
● Microplastics were counted using a stereomicroscope Findings Influent entering the WWTP had 430 synthetic particles per liter and 189 textile fibers per liter. During the treatment processes a significant amount of microplastics were removed. After primary sedimentation, microplastic concentrations were 14.2 fibers per liter and 290.7 particles per liter of wastewater. This indicates fibers were removed primarily in primary sedimentation. After secondary filtration microplastic concentrations were 13.8 fibers per liter and 68.6 particles per liter, indicating that synthetic particles are removed primarily in secondary sedimentation. After treatment WWTP effluent contained 4.9 fibers per liter and 8.6 synthetic particles per liter. Samples collected at the WWTP discharge sites had concentrations of 1.7 to 4.7 fibers per kilogram of sediment and 7.2 to 10 synthetic particles per kilogram of sediment, respectively. These concentrations were higher than the reference site concentrations of 1.7 fibers per kilogram of sediment. The authors concluded that WWTPs are a source of marine microplastic pollution. Magnusson, K., and F. Norén. Screening of Microplastic Particles in and Down-stream a Wastewater Treatment Plant. IVL Swedish Environmental Research Institute, 2014. Purpose The purpose of this study was to investigate the role of WWTPs as a source for microplastic pollution and to analyze how effectively WWTP filter microplastics. Methods ● The study sampled at the Lysekil WWTP
○ The WWTP services 14,000 people ○ Effluent is discharged into the ocean at a depth of 22 meters
● Incoming influent, WWTP effluent, WWTP sludge, and seawater around the discharge pipe were sampled ○ Influent and effluent waters were sampled with a Ruttner sampler with a 300 µm
plankton net filter ○ Slightly dewatered sludge was used for sludge samples ○ Ocean water was sampled 20, 50, 200, and 3500 meters downstream of the
effluent tube ■ A 300 µm plankton net was towed to take the samples

72
● Microplastics were counted under a stereomicroscope ○ Fiber samples were heated to distinguish between organic and synthetic fibers
Findings The Lysekil WWTP had 3.25 million microplastics, microfibers, microfragments and flakes entering per hour and discharged 2000 microplastics, microfibers, microfragments and flakes per hour. Microfibers had a concentration of 10.7*103 fibers/m3 in the influent water and 4.00 fibers/m3 in effluent water, a 99.96% retention rate. Synthetic fibers made up 70% of total microplastics in sewage sludge and influent water versus 49% in effluent waters. This indicates fibers are more efficiently retained in sewage sludge than other microplastics. Based on this, the authors stressed the importance of studying the fate of microfibers in sewage sludge. Even though an equal portion of microplastics were output in the effluent, only microfibers were found in seawater samples around the effluent pipe. Concentrations of microplastics 20 meters from the effluent tube were 4 times higher than the reference sample. Based on comparisons with other WWTP studies it appears the construction of WWTPs has a significant effect on microplastic loadings. Talvitie, J., and M. Heinonen. Helcom, 2014, BASE Project 2012-2014: Preliminary Study on Synthetic Microfibers and Particles at a Municipal Waste Water Treatment Plant. Baltic Marine Environment Protection Commission, 2014. Purpose This project focused on quantifying microplastics pollution in WWTP influent and effluent and analyzing the effects the filtering process had on total microplastic loadings. Methods ● This study took place at the Central Wastewater Treatment Plant of St. Petersburg, Russia
○ 350 million cubic meter of wastewater are purified per year ● Water samples were sampled using a device similar to the filter column used during the
Patagonia wash trials ○ 300 µm, 100 µm, and 20 µm plankton net mesh filters were used
● Samples were analyzed under a light microscope ○ Microplastics were counted and classified by particles and fibers
73
Findings Microplastic concentrations were found to be 467 fibers per liter and 160 synthetic particles per liter. Wastewater was sampled after the mechanical filtration processes. The concentrations of microplastics were 33 fibers per liter and 21 synthetic fibers per liter. Water sampled after the purification process had microplastic concentrations of 16 fibers per liter and 7 synthetic fibers per liter. Based on these results, mechanical filtration was the most effective at removing microfibers. Overall, the wastewater treatment plant had a 96.57% removal rate for fibers.

74
Distribution Marine System Woodall, L. C., A. Sanchez-Vidal, M. Canals, G. L. J. Paterson, R. Coppock, V. Sleight, A. Calafat, A. D. Rogers, B. E. Narayanaswamy, and R. C. Thompson. "The Deep Sea Is a Major Sink for Microplastic Debris."Royal Society Open Science (2014): 140317. Purpose The purpose of this study was to quantify the abundance and extent of microplastic contamination at a range of depths and locations in the deep sea. Methods ● Sampling depth ranged down to 3500%m, but most sites were at around 1000%m and were
at least 9%km horizontal and 200%m vertical distance from each other. Extraction was done using a concentrated NaCl solution and filtering with three sequential extractions. The PU method employs supernatant filtering through a Whatman GF/A filter.
● Using an entomological pin, microplastic fibers were removed under a binocular microscope and placed into clean vials containing Millipore water.
● Samples were examined under a binocular microscope, and any objects that were of unnatural appearance based on shape and colour (potential microplastics) were transferred to sealed containers and subsequently identified by spectrometry. ○ A Bruker IFS66 FTIR was used for object identification. ○ We found that our approach and our recording of microfibers yielded
substantially greater abundance of microplastic particles, whereas the other method underestimated the microplastic concentration (electronic supplementary material).
Findings Deep-sea sediments are a likely sink for microfibers. Microfibers were four orders of magnitude more abundant (per unit volume) in deep-sea sediments than in sea-surface waters. Interestingly, among the fibers, the synthetic polymer rayon was twice as abundant as polyester, contributing to roughly 56.9% of the total number of fibers. The authors primarily attribute the sinking to the negative buoyancy of the polymers; however, they also predict that colonization by organisms and sorption with organic debris (marine snow) enhances settling. Furthermore, oceanographic processes such as dense shelf water, cascading, severe coastal storms, offshore convection, and saline subduction could all contribute to the transfer of microfibers from the surface to depths.

75
Cozar, A., F. Echevarria, J. I. Gonzalez-Gordillo, X. Irigoien, B. Ubeda, S. Hernandez-Leon, A. T. Palma, S. Navarro, J. Garcia-De-Lomas, A. Ruiz, M. L. Fernandez-De-Puelles, and C. M. Duarte. "Plastic Debris in the Open Ocean." Proceedings of the National Academy of Sciences (2014): 10239-0244. Purpose This paper seeks to quantify the abundance and distribution of plastic debris in the open oceans through a synthesis of global data. Methods ● Samples were collected on a circumnavigation cruise (Malaspina 2010 expedition), on
five regional cruises. ○ Samples were collected with a neuston net (200 µm mesh) ○ Raman spectroscopy was only applied to a random subset of particles (n=67) ○ Due to possible contamination from the crew’s clothing during sampling and
processing, any textile fibers found were excluded from the analysis. ● Data from recent studies came from a dataset including 3,070 total samples collected
around the world. Findings Due to ocean surface circulation, the distribution pattern of micro- and macroplastics is seen in convergence zones of large subtropical gyres. The authors predict that, within these zones, there are approximately 7,000 to 35,000 tons of plastic debris (both micro and macro). They also observe a gap in the size distribution of floating plastic debris, pointing to the sinking of microplastics through the water column.
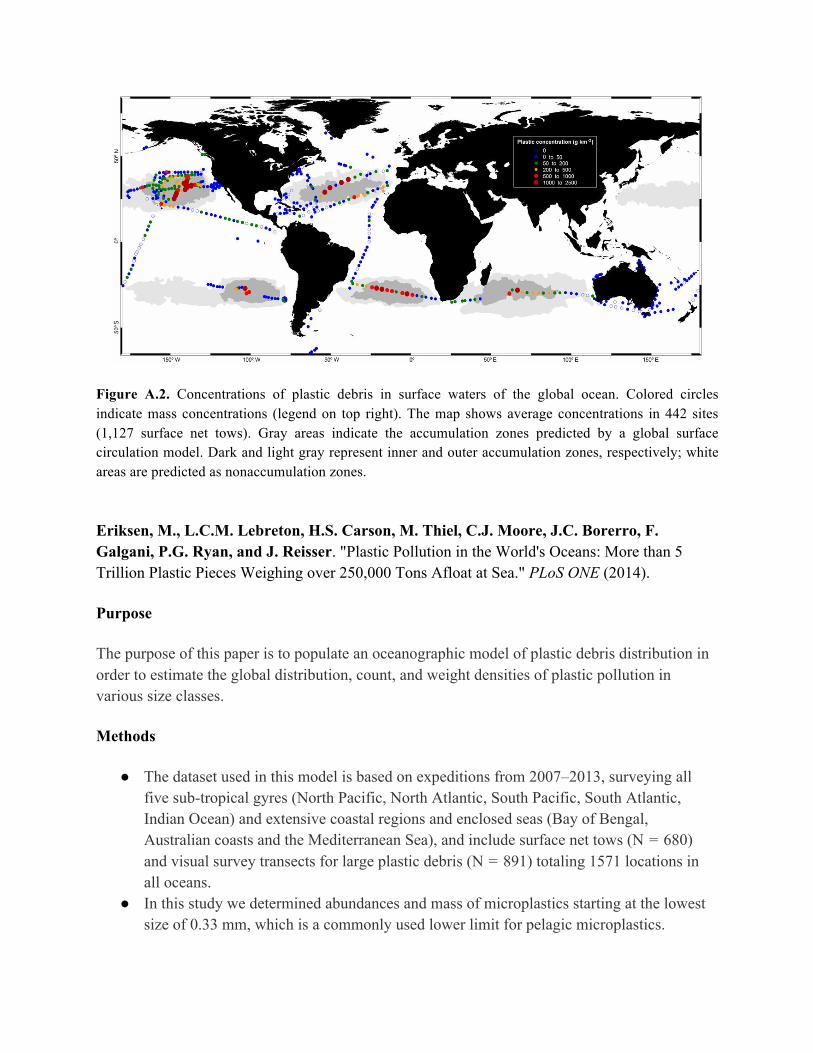
76
Figure A.2. Concentrations of plastic debris in surface waters of the global ocean. Colored circles indicate mass concentrations (legend on top right). The map shows average concentrations in 442 sites (1,127 surface net tows). Gray areas indicate the accumulation zones predicted by a global surface circulation model. Dark and light gray represent inner and outer accumulation zones, respectively; white areas are predicted as nonaccumulation zones. Eriksen, M., L.C.M. Lebreton, H.S. Carson, M. Thiel, C.J. Moore, J.C. Borerro, F. Galgani, P.G. Ryan, and J. Reisser. "Plastic Pollution in the World's Oceans: More than 5 Trillion Plastic Pieces Weighing over 250,000 Tons Afloat at Sea." PLoS ONE (2014). Purpose The purpose of this paper is to populate an oceanographic model of plastic debris distribution in order to estimate the global distribution, count, and weight densities of plastic pollution in various size classes. Methods ● The dataset used in this model is based on expeditions from 2007–2013, surveying all
five sub-tropical gyres (North Pacific, North Atlantic, South Pacific, South Atlantic, Indian Ocean) and extensive coastal regions and enclosed seas (Bay of Bengal, Australian coasts and the Mediterranean Sea), and include surface net tows (N = 680) and visual survey transects for large plastic debris (N = 891) totaling 1571 locations in all oceans.
● In this study we determined abundances and mass of microplastics starting at the lowest size of 0.33 mm, which is a commonly used lower limit for pelagic microplastics.

77
Findings This study found that microplastics account for approximately 3% of the global weight of plastic pollution (35,540 tons). They are distributed throughout the world’s oceans by prevailing winds and surface currents. Interestingly, the total amount of plastics in the southern hemisphere is within the same range as the northern hemisphere’s oceans. Considering that the population density and inputs for plastic debris are significantly higher in the northern hemisphere, the authors suggests that plastic debris moves easier between oceanic gyres and hemispheres. Furthermore, the authors link potential losses of microfibers from the surface due to sinking from hydrodynamic processes like downwelling. Dris, Rachid, J. Gasperi, M. Saad, C. Mirande, and B. Tassin. "Synthetic Fibers in Atmospheric Fallout: A Source of Microplastics in the Environment?" Marine Pollution Bulletin (2016). Purpose This paper focuses on quantifying microfibers in the atmosphere of Paris, France, and investigates the contribution of their fallout as a potential vector of plastic pollution. Methods ● Atmospheric fallout (dry and wet deposition) was collected through a stainless steel
funnel in a 20 L glass bottle. ● All samples were filtered on 1.6 µm GF/A Whatman filters and observed with a
stereomicroscope. The observation size limit was defined to 50 um. ● FTIR was used for a subsample of n = 24 fibers
Findings The results indicated that large amounts of fibers are transported in the atmospheric fallout, ranging from 2 to 355 particles/m2/day. The authors indicate that rainfall and population density are important influencing factors in the fallout flux. During rainfall periods, fallout went up to 355 particles/m2/day. Statistical tests also showed a significant difference between the atmospheric fallout on the urban and sub-urban sites. Interestingly, the FTIR showed that 50% of the analyzed fibers are natural fibers made of cotton or wool. Only 29% of the remaining fibers from atmospheric fallout were petrochemicals like polyester or polyurethane.
78
Shorelines and Freshwater Systems Browne, M. A., P. Crump, S. J. Niven, E. Teuten, A. Tonkin, T. Galloway, and R. Thompson. "Accumulation of Microplastic on Shorelines Woldwide: Sources and Sinks." Environmental Science & Technology (2011): 9175-179. Purpose The purpose of this study was to quantify and describe contamination of shorelines by microplastic particles. The study also aimed to explore the role of textile industry in microplastic pollution through the release of fibers in washing machine effluent Methods ● Shoreline sediment samples were taken from 18 different beach sites across the world
(Australia, Oman, Japan, United Arab Emirates, Chile, Philippines, Portugal, United States of America, Mozambique, and the United Kingdom.
● Additional samples were collected from sediment near sewage-sludge disposal sites and from washing machine effluent.
● Washing machine trials were carried out with front-load machines (Bosch WAE24468GB, John Lewis JLWM1203, and Siemens Extra Lasse XL 1000) on three types of polyester items, blankets, fleece.
● Sediment samples were processed according to methods developed and utilized by Thompson et al. 2004 while effluent samples were processed by filtration and visual count.
● Samples were analyzed using FTIR spectroscopy to determine the chemical composition of collected microplastics.
Findings All 18 shorelines were found to be contaminated with microplastic pollution ranging from 2 to 31 particles per 250 mL of sediment. Roughly approximating this to a per kg basis would mean about 2.67 to 82.7 particles per kg of sediment. A majority of these particles were found to be polyester (56%), then acrylic (23%), polypropylene (7%), polyethylene (6%), and polyamide (3%). Among the sewage-sludge disposal sites measured, it was found they contained 250% higher concentrations of microplastics than reference sites, indicating wastewater as a significant point source of microplastics. In the washing machine effluent trials, the study found that blankets, shirts, and fleeces made from synthetic material would discharge between 100 and 300 fibers per liter of washing

79
machine effluent. The composition of fibers in the washing machine samples resembled those found in the global sediment samples, linking the textile industry and microplastic pollution. Claessens, M., S. De Meester, L. Van Landuyt, K. De Clerck, and C.R. Janssen. "Occurrence and Distribution of Microplastics in Marine Sediments along the Belgian Coast." Marine Pollution Bulletin (2011): 2199-204. Purpose This paper attempted to quantify the occurrence and distribution of microplastics along the Belgian coast. Methods ● Sampling was conducted in three distinct coastal zones: harbors, beaches, and near the
coastal shelf in Belgium (Figure A.3). ● In beach sediment cores, the relative year of each sample was calculated based on the
sedimentation rate along the Belgian coast. ● All samples were poured through a 38µm mesh sieve and had a correction factor applied
based on particle loss observed from a controlled extraction method. ● FT-IR analysis was used to obtain the composition fractions of the sampled
microplastics. Findings The paper’s overall findings across samples were that microplastic was composed of 59% fibers, 25% granules, 12% spherules, and 4% plastic films. When dissected further, the researchers found extreme spatial variation in quantity and composition of microplastics in the various sampling locations. They found that fibers composed 88% microplastics in beach sediments, 67% in continental shelf sediments, and 40% in harbor sediments. In terms of absolute count, there was no significant variation between any of the three coastal zones, but harbor sediments contained significantly higher concentrations of total microplastics compared to the continental shelf and beaches (p<0.05). This provides further evidence of linkages between proximity to human activity and increasing microplastic concentrations. Interestingly, however, FT-IR analysis found that the chemical composition of the fibers they found were entirely polypropylene, nylon, and polyvinyl alcohol. This seems to indicate that polyester textiles were not the dominant source of the fibers in the sediment. These findings are odd, particularly due to the distribution of the sampling sites near freshwater outlets with wastewater treatment plants located upstream (Figure A.3).
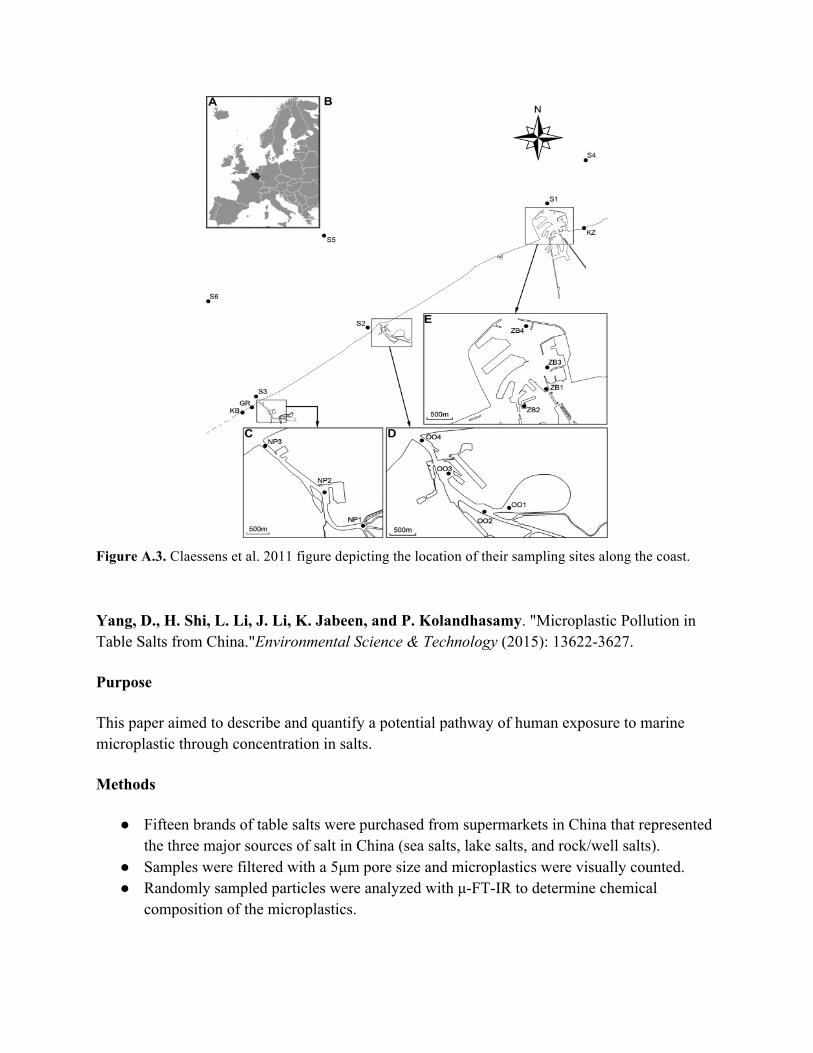
80
Figure A.3. Claessens et al. 2011 figure depicting the location of their sampling sites along the coast.
Yang, D., H. Shi, L. Li, J. Li, K. Jabeen, and P. Kolandhasamy. "Microplastic Pollution in Table Salts from China."Environmental Science & Technology (2015): 13622-3627. Purpose This paper aimed to describe and quantify a potential pathway of human exposure to marine microplastic through concentration in salts. Methods ● Fifteen brands of table salts were purchased from supermarkets in China that represented
the three major sources of salt in China (sea salts, lake salts, and rock/well salts). ● Samples were filtered with a 5µm pore size and microplastics were visually counted. ● Randomly sampled particles were analyzed with µ-FT-IR to determine chemical
composition of the microplastics.
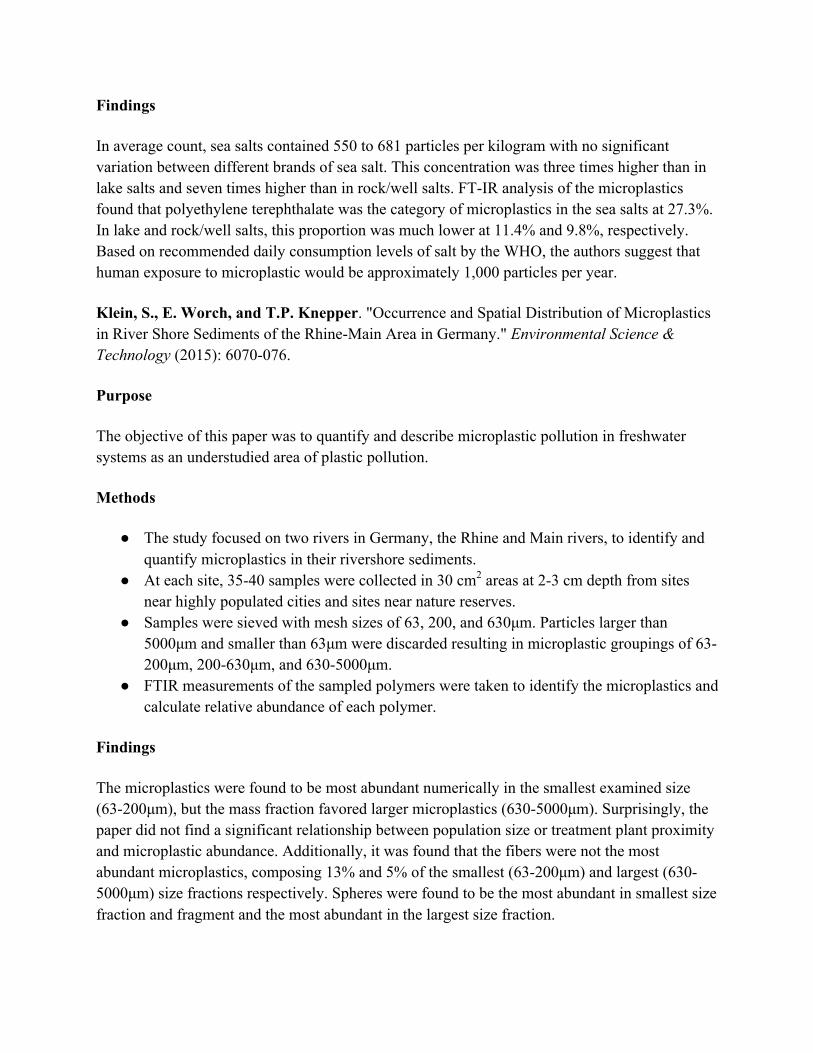
81
Findings In average count, sea salts contained 550 to 681 particles per kilogram with no significant variation between different brands of sea salt. This concentration was three times higher than in lake salts and seven times higher than in rock/well salts. FT-IR analysis of the microplastics found that polyethylene terephthalate was the category of microplastics in the sea salts at 27.3%. In lake and rock/well salts, this proportion was much lower at 11.4% and 9.8%, respectively. Based on recommended daily consumption levels of salt by the WHO, the authors suggest that human exposure to microplastic would be approximately 1,000 particles per year. Klein, S., E. Worch, and T.P. Knepper. "Occurrence and Spatial Distribution of Microplastics in River Shore Sediments of the Rhine-Main Area in Germany." Environmental Science & Technology (2015): 6070-076. Purpose The objective of this paper was to quantify and describe microplastic pollution in freshwater systems as an understudied area of plastic pollution. Methods ● The study focused on two rivers in Germany, the Rhine and Main rivers, to identify and
quantify microplastics in their rivershore sediments. ● At each site, 35-40 samples were collected in 30 cm2 areas at 2-3 cm depth from sites
near highly populated cities and sites near nature reserves. ● Samples were sieved with mesh sizes of 63, 200, and 630µm. Particles larger than
5000µm and smaller than 63µm were discarded resulting in microplastic groupings of 63-200µm, 200-630µm, and 630-5000µm.
● FTIR measurements of the sampled polymers were taken to identify the microplastics and calculate relative abundance of each polymer.
Findings The microplastics were found to be most abundant numerically in the smallest examined size (63-200µm), but the mass fraction favored larger microplastics (630-5000µm). Surprisingly, the paper did not find a significant relationship between population size or treatment plant proximity and microplastic abundance. Additionally, it was found that the fibers were not the most abundant microplastics, composing 13% and 5% of the smallest (63-200µm) and largest (630-5000µm) size fractions respectively. Spheres were found to be the most abundant in smallest size fraction and fragment and the most abundant in the largest size fraction.

82
Eriksen, M., S. Mason, S. Wilson, C. Box, A. Zellers, W. Edwards, H. Farley, and S. Amato. "Microplastic Pollution in the Surface Waters of the Laurentian Great Lakes." Marine Pollution Bulletin (2013): 177-82.
Purpose The motivation for this research was to address a gap in knowledge about the occurrence and distribution of microplastics on the Great Lakes of the United States as previous research had only described the presence of microplastics on the shoreline. Methods ● Twenty-one neuston samples were collected with a 333µm manta trawl and analyzed
with scanning electron microscopy. ● Plastics were characterized into five categories: fragment, foamed polystyrene, line,
pellet, and film. ● Samples were filtered through a Tyler sieve into three size classes, 355-999µm, 1000-
4749µm, and >4750µm. ● Composition analysis was conducted with an Oxford INCA Energy Dispersive X-ray
Spectroscopy system. Findings The paper found that microplastics (<4750µm) were by far the most abundant plastic pollutant on the lakes, composing 98% of total plastics sampled. Of these microplastics, pellets and fragments accounted for about 50% and 42% respectively. Additionally, the paper found a strong visual and compositional indication that the pellet pollution originated from microbeads found in cosmetics, drawing a direct linkage between microbead product use and microplastic pollution. Another interesting finding of the paper was in the examination of the spatial distribution of plastic pollution on the lake surfaces. Plastics were found to be in highest concentration on Lake Erie (accounting for 90% of plastic sampled) and particularly when downstream of major cities. In just two of the 21 stations, 85% of the plastic (~750,000 particles per km2) was found while another station had 0 particles, demonstrating the extreme variability in microplastic distribution based on human activity.
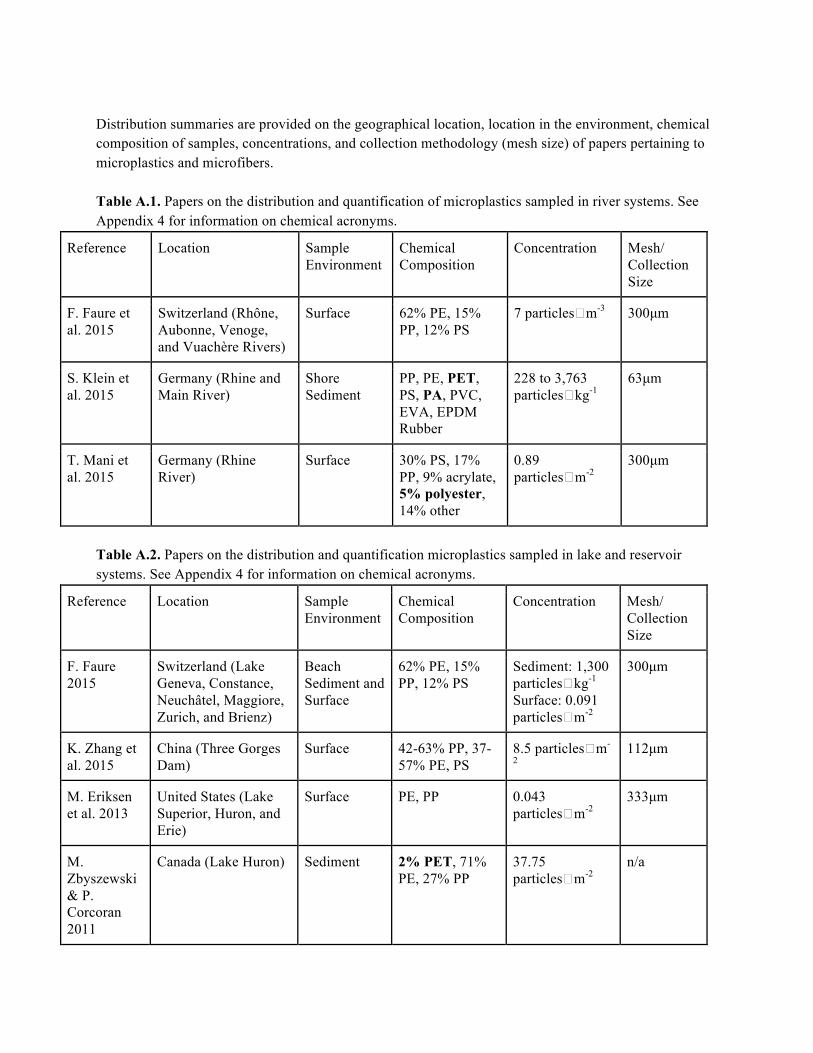
83
Distribution summaries are provided on the geographical location, location in the environment, chemical composition of samples, concentrations, and collection methodology (mesh size) of papers pertaining to microplastics and microfibers. Table A.1. Papers on the distribution and quantification of microplastics sampled in river systems. See Appendix 4 for information on chemical acronyms.
Reference Location Sample Environment
Chemical Composition
Concentration Mesh/ Collection Size
F. Faure et al. 2015
Switzerland (Rhône, Aubonne, Venoge, and Vuachère Rivers)
Surface 62% PE, 15% PP, 12% PS
7 particles�m-3 300µm
S. Klein et al. 2015
Germany (Rhine and Main River)
Shore Sediment
PP, PE, PET, PS, PA, PVC, EVA, EPDM Rubber
228 to 3,763 particles�kg-1
63µm
T. Mani et al. 2015
Germany (Rhine River)
Surface 30% PS, 17% PP, 9% acrylate, 5% polyester, 14% other
0.89 particles�m-2
300µm
Table A.2. Papers on the distribution and quantification microplastics sampled in lake and reservoir systems. See Appendix 4 for information on chemical acronyms.
Reference Location Sample Environment
Chemical Composition
Concentration Mesh/ Collection Size
F. Faure 2015
Switzerland (Lake Geneva, Constance, Neuchâtel, Maggiore, Zurich, and Brienz)
Beach Sediment and Surface
62% PE, 15% PP, 12% PS
Sediment: 1,300 particles�kg-1 Surface: 0.091 particles�m-2
300µm
K. Zhang et al. 2015
China (Three Gorges Dam)
Surface 42-63% PP, 37-57% PE, PS
8.5 particles�m-
2 112µm
M. Eriksen et al. 2013
United States (Lake Superior, Huron, and Erie)
Surface PE, PP 0.043 particles�m-2
333µm
M. Zbyszewski & P. Corcoran 2011
Canada (Lake Huron) Sediment 2% PET, 71% PE, 27% PP
37.75 particles�m-2
n/a
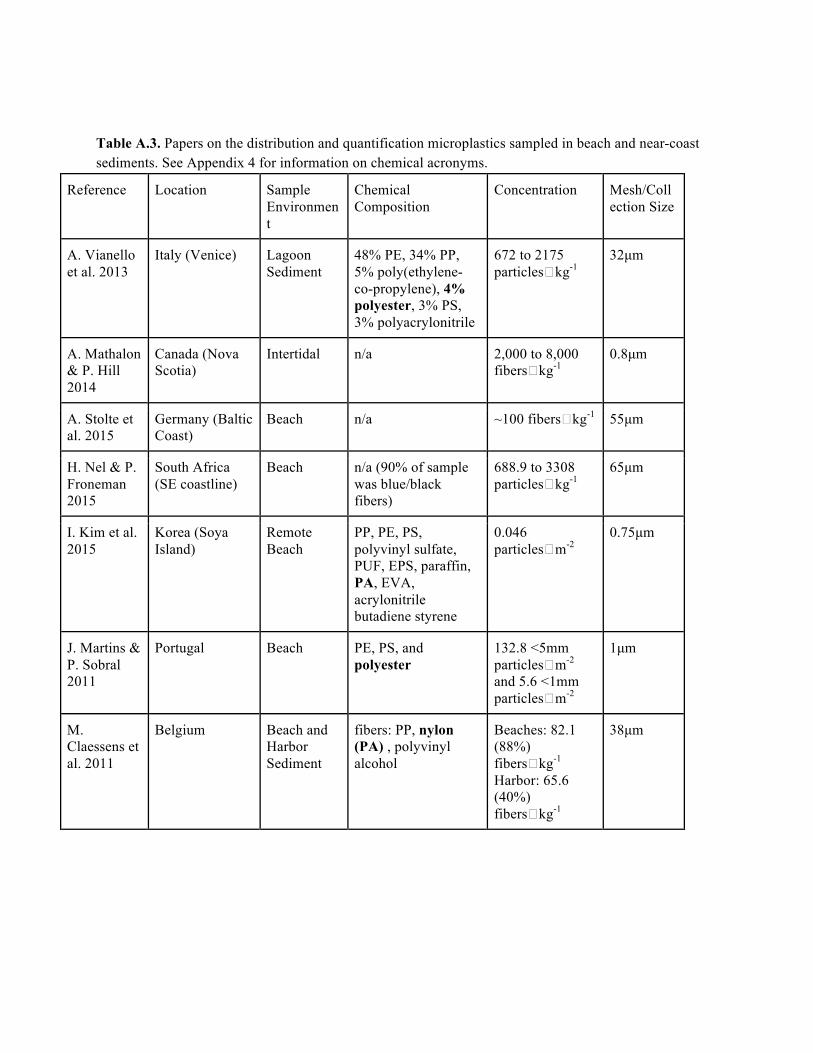
84
Table A.3. Papers on the distribution and quantification microplastics sampled in beach and near-coast sediments. See Appendix 4 for information on chemical acronyms.
Reference Location Sample Environment
Chemical Composition
Concentration Mesh/Collection Size
A. Vianello et al. 2013
Italy (Venice) Lagoon Sediment
48% PE, 34% PP, 5% poly(ethylene-co-propylene), 4% polyester, 3% PS, 3% polyacrylonitrile
672 to 2175 particles�kg-1
32µm
A. Mathalon & P. Hill 2014
Canada (Nova Scotia)
Intertidal n/a 2,000 to 8,000 fibers�kg-1
0.8µm
A. Stolte et al. 2015
Germany (Baltic Coast)
Beach n/a ~100 fibers�kg-1 55µm
H. Nel & P. Froneman 2015
South Africa (SE coastline)
Beach n/a (90% of sample was blue/black fibers)
688.9 to 3308 particles�kg-1
65µm
I. Kim et al. 2015
Korea (Soya Island)
Remote Beach
PP, PE, PS, polyvinyl sulfate, PUF, EPS, paraffin, PA, EVA, acrylonitrile butadiene styrene
0.046 particles�m-2
0.75µm
J. Martins & P. Sobral 2011
Portugal Beach PE, PS, and polyester
132.8 <5mm particles�m-2 and 5.6 <1mm particles�m-2
1µm
M. Claessens et al. 2011
Belgium Beach and Harbor Sediment
fibers: PP, nylon (PA) , polyvinyl alcohol
Beaches: 82.1 (88%) fibers�kg-1 Harbor: 65.6 (40%) fibers�kg-1
38µm
85
Ecological Impacts Goldstein, M. C., M. Rosenberg, and L. Cheng. "Increased Oceanic Microplastic Debris Enhances Oviposition in an Endemic Pelagic Insect."Biology Letters (2012): 817-20. Purpose This study assessed the potential ecological impacts of microplastic pollution by exploring the relationship between an increase in microplastic debris in the North Pacific Subtropical Gyre (NPSG) and changes in abundance for Halobates sericeus, a pelagic insect. H. sericeus reproduction is limited by available hard substrate for oviposition (laying of eggs), but increases in microplastic in NPSG have provided solid materials for the insects to lay their eggs. Methods ● Used data of both numerical and mass concentrations in the NPSG between 1972-1987
and 1999-2010 ○ Data were sourced from peer-reviewed literature and other publicly available
sources ● H. sericeus data were collected via surface samples using neuston nets between 1972-
1973 and 2009-2010 Findings The results indicated a positive correlation found between the two abundances for 2009-2010, but not for 1972-1973, leading the paper to conclude that the increase in microplastic concentrations in the NPSG could be responsible for the increases in H. sericeus. While H. sericeus is a food source for many marine animals such as seabirds, marine turtles, and surface-feeding fishes, they prey on zooplankton and their increased abundances could have detrimental impacts on the food chain in the NPSG. McCormick, A., T.J. Hoellein, S.A. Mason, J. Schluep, and J.J. Kelly. "Microplastic Is an Abundant and Distinct Microbial Habitat in an Urban River." Environmental Science & Technology (2014): 11863-1871. Purpose The objective of this paper was to measure the microplastic concentration in a freshwater system, in this case an urban river, and assess the potential of wastewater treatment plants as point sources.

86
Methods ● Study site: the North Shore Channel (NSC) in Chicago, Illinois
○ 12-km man-made channel that receives water from Lake Michigan and joins the North Branch of the Chicago River
○ Treated wastewater effluent from the Terrence J. O’Brien Water Reclamation Plant flows into the NSC, but effluent is not disinfected prior to release
○ The average flow of the O’Brien Plant is 927 million liters of effluent per day ● Microplastic was collected using neuston nets with a mesh size of 333 µm
○ Additional net samples were collected for bacterial measurements ○ Samples from net collections were filtered through 2 mm and 330 µm sieves
● Scanning Electron Microscope (SEM) imaging was used to quantify microbial cell densities
● DNA extraction and sequencing was used to profile bacterial assemblages Findings Microplastic concentration was found to be higher downstream of WWTP than upstream and concentrations of microplastic fragments and fibers were higher than for foam and pellets. Fibers had the highest concentration levels. Bacterial assemblages on microplastic particles were distinct from and less diverse than the bacteria in the water column and suspended organic matter. The higher abundance of microplastic downstream indicates WWTP as a point source for microplastic input in this river. One of the most prominent bacterial assemblages found on the microplastic in this study (4 times more abundant than in the downstream water column) was the family Campylobacteraceae which includes multiple taxa associated with human gastrointestinal infections. De Tender, C.A., L.I. Devriese, A. Haegeman, S. Maes, T. Ruttink, and P. Dawyndt. "Bacterial Community Profiling of Plastic Litter in the Belgian Part of the North Sea." Environmental Science & Technology (2015): 9629-638. Purpose The purpose of this paper was to explore bacterial colonization of marine plastic litter (MPL) and the possible role of microplastic as a form of transport for bacteria through the aquatic environment.
87
Methods ● Study site: Belgian part of the North Sea
○ All samples collected in 2014 ○ Plastic, sediment, and seawater samples were collected in March and again in
August near the mouths of the Belgian coastal harbors ● Water samples were taken 1 meter below the water surface and on the seafloor ● Resin pellets on the beach were collected to compare to microplastic collected in the sea ● A Raman spectrometer was used for polymer identification and measurements were
performed using a red diode laser ● DNA extraction was used to identify the taxonomic profiles of the bacterial communities
Findings Bacterial richness and diversity were significantly different across all sample types (beach pellets, MPL, seawater, and sediment). Furthermore, bacterial communities found on microplastics were substantially different from those in seawater and sediment. The bacterial communities on microplastics were natural to the marine environment, but not in the same high concentrations as on the MPL, indicating microplastics role as a vehicle for bacterial movement through the aquatic environment leading to populations of bacteria in areas where they are not naturally found. Zettler, E. R., T. J. Mincer, and L. A. Amaral-Zettler. "Life in the “Plastisphere”: Microbial Communities on Plastic Marine Debris."Environmental Science & Technology (2013): 7137-146. Purpose The objective of this study was to characterize the microbial communities attached to plastic marine debris (PMD), specifically on pieces of polyethylene and polypropylene from the North Atlantic Subtropical Gyre. These microbial communities are often referred to as the “Plastisphere”. Most of the plastic pieces in the study were fragments of less than 5mm, i.e. microplastics.
88
Methods ● Microplastic was collected in the North Atlantic using neuston nets with a mesh size of
333 µm ● Scanning electron microscopy for bacterial cell measurements ● Raman spectroscopy was used to identify the resin composition of plastic pieces, and
each sample was compared to reference images from plastics of known compositions ● DNA extraction was used to identify bacterial taxonomies
Findings DNA sequence analyses confirmed the bacterial communities found on PMD were distinct from those found in the surrounding seawater. Communities found on PMD included heterotrophs, autotrophs, predators, and symbionts. SEM images of microbial cells embedded in pits and cracks in the plastic surface could indicate that microbes may be taking part in the degradation of plastic. Consumption Mathalon, A. and P. Hill. "Microplastic Fibers in the Intertidal Ecosystem Surrounding Halifax Harbor, Nova Scotia." Marine Pollution Bulletin (2014): 69-79. Purpose This paper quantified microplastic fibers found in sediments from the intertidal zones which inherently are at higher risk of microplastic contamination given their proximity to microplastic sources. Polychaete worm fecal casts (deposit feeders) and live blue mussels (suspension feeders) were the focus for analyzing microplastic content. Methods ● Samples collected on July 16, 2012, at McCormack’s Beach, Rainbow Haven Beach
(exposed side), and Rainbow Haven Beach (back lagoon). ○ All three sites are located within 10 km of one another ○ Samples were taken at high, mid, and low tide lines
● Wild mussels were collected and others were purchased at the local grocery store (from an aquaculture site 800 km away from the wild sites) for comparison purposes
● Microfibers were enumerated from filters using a Motic Dissection Microscope ● Count data was used for statistical analyses

89
Findings Microplastic fibers were found to be the predominant form of microplastic in the intertidal samples. Abundances of microfibers were distinctively higher than in the wild mussels, possibly because the aquaculture mussels are grown on polypropylene long lines. It was also found that smaller microplastics (~3 µm) have higher accumulation rates in mussel tissues compared to larger fragments. This indicates that accumulation rates increases as microplastics degrade. Ultimately, even if mussels are able to expel microplastics from their systems, they are constantly taking them up from the natural environment so their tissues will always be contaminated. Polychaete worm fecal casts indicated that deposit feeders are indiscriminately feeding on microplastics, though they are expelling most of those consumed. However, they still might be affected by pollutants attached to the microplastics when they are ingested. Neves, D., P. Sobral, J.L. Ferreira, and T. Pereira. "Ingestion of Microplastics by Commercial Fish off the Portuguese Coast." Marine Pollution Bulletin (2015): 119-26. Purpose The objective of this paper was to analyze the presence of microplastics in the digestive tract of commercial fish species. Methods ● Fish samples were collected off the coast of Portugal
○ 230 individual samples obtained ○ 33 stomachs from local fisheries were also gathered to investigate species that
were not already present in the sample ● A stereoscopic microscope was used to examine the stomach contents of each fish ● FTIR analyses was used to identify common fibers
Findings Microplastics were found in 52 of the fish (19.8%), with 17 of those having ingested more than one microplastic. Fibers made up 65.8% of the observed microplastics with 34.2% being fragments. FTIR analysis of the fibers identified rayon, polyester, acrylic, nylon 6, and polyethylene.

90
Van Cauwenberghe, L., and C.R. Janssen. "Microplastics in Bivalves Cultured for Human Consumption." Environmental Pollution (2014): 65-70. Purpose This paper investigated the presence of microplastics in species of commercially produced bivalves in order to identify the potential for human consumption. Methods ● Two species were studied
○ Mytilus edulis (blue mussel) ○ Crassostrea giga (Pacific oyster)
● The blue mussels were acquired from a mussel farm in Germany while the oysters originated in France and were purchased at a supermarket
● Half of the sample was depurated for a three day period to create a control group while the other half were processed immediately
● Extensive measures were adopted to prevent contamination from airborne sources Findings Microplastics were found in both species, with the higher abundances being found in the samples that did not undergo depuration, though only slightly. The most abundant microplastic size found after gut depuration for the mussel and oyster were 5 to 10µm (50%) and 16-20µm (29.6%), respectively. The authors note that the use of concentrated HNO3 could have resulted in an underestimation of microplastic concentrations as it has a detrimental effect on nylon fibers.
91
Foekema, E.M., C. De Gruijter, M.T. Mergia, J.A. Van Franeker, A.J. Murk, and A.A. Koelmans. "Plastic in North Sea Fish." Environmental Science & Technology (2013). Purpose The objective of this paper was to quantify the abundance of ingested plastic in North Sea fish species and assess if fish condition is affected by the ingestion of plastics. Methods ● Seven common North Sea species were investigated (n = 1203)
○ herring ○ gray gurnard ○ whiting ○ horse mackerel ○ haddock ○ atlantic mackerel ○ cod
● Samples collected from the southern region of the North Sea between 49 and 56 degrees N
● The entire digestive tract (esophagus, stomach, and intestines) of each sample was investigated for microplastics
Findings Five of the seven samples species were found to contain plastic particles (none in gray gurnard or mackerel). Cod samples contained the most plastics (13% of sample), then whiting and haddock (both at 6%), and herring and horse mackerel had the lowest (2% and 1%, respectively). Only 2.6% of the sample (33 individual fish) contained plastic. Only 6 individuals contained more than one particle of plastic, all of which were less than 5mm in size, i.e. microplastic. FTIR identified six plastic particles in the collected sample: polyethylene, polypropylene, polyethylene terephthalate, and stryene-acrylate.
92
Besseling, E., E.M. Foekema, J.A. Van Franeker, M.F. Leopold, S. Kühn, E.L. Bravo Rebolledo, E. Hebe, L. Mielke, J. Ijzer, P. Kamminga, and A.A. Koelmans. "Microplastic in a Macro Filter Feeder: Humpback Whale Megaptera Novaeangliae." Marine Pollution Bulletin (2015): 248-52. Purpose This paper explored the presence of microplastics in marine filter feeders, specifically baleen whales, which take in large volumes of water to feed. Methods ● Study sample was a 16 thousand kilogram juvenile female humpback whale that died of
stranding itself on a Dutch sandbank ● Only a tenth to a fifth of the total length of the gastrointestinal tract was sampled ● Samples were sieved and dried and assessed using FTIR analyses and photos of known
plastic composition for comparison Findings The sample contained 45 particles of possible synthetic origin of which 77.7% were large enough for analysis using FTIR, which showed 45.7% of these were of synthetic origin. The identified polymers were PE, PP, PVC, PET, and PA. Of these synthetic particles, 37.5% were identified as microplastics, most of which was comprised of PE and PA polymers. Extrapolating these results to the entire intestine length would result in an estimate of 160 small plastic particles with a volume of 137 mm^3. The paper also notes that humpback whales are more selective filter feeders than other species, which may result in lower plastic uptake compared to other baleen whales. Cole, M., P. Lindeque, E. Fileman, C. Halsband, R. Goodhead, J. Moger, and T. Galloway. "Microplastic Ingestion by Zooplankton." Environmental Science & Technology (2013): 6646-655. Purpose This paper assessed the ingestion of microplastics by zooplankton species and the potential impacts of consumption on the organisms’ function and health, an important issue given their vital ecological role in marine food webs.

93
Methods ● Zooplankton samples were collected from a coastal site in the wester English Channel,
12km south of Plymouth, United Kingdom ○ Taxonomies included: copepods, bivalve larvae, and decapod larvae, among
others ● 200µm mesh was used to collect zooplankton ● 14 total mesozooplankton taxa were included, representing the most commonly occurring
species in the western English Channel ● a cultured heterotrophic dinoflagellate species was selected for microplastic ingestion
studies ● Polystyrene spheres ranging from 0.4 - 30.6µm were chosen to be comparable with the
prey size range of the zooplankton ● CARS microscopy was used to visualize uptake of the spheres ● The samples were exposed to natural assemblages of algae with and without
microplastics to asses microplastic impact on their ability to ingest natural prey Findings Of the sample, 13 of 15 of the zooplankton species exposed to the polystyrene beads exhibited ingestion activity, though some of those species showed size-based selectivity in their consumption. CARS microscopy indicated that microplastics clumping in the posterior midgut were internalized as well as adhering to external appendages. Ingestion rates were found to decrease significantly when exposed to certain levels of microplastics. These tipping points varied across species in the sample. The study also found some species of zooplankton to be more responsive to and more likely to consume the plastic beads that had developed biofilms while in the marine environment. A follow-up experiment found that some species retained microplastics for up to 7 days before egestion. The study concedes that the smooth spheres they used would make it easier for the organisms to pass them, while microplastic fibers could become entangled with the intestinal tract and result in a nonbiodegradable gut blockage, affecting their ability to process food and posing a toxic risk.
94
Devriese, L.I., M.D. Van Der Meulen, T. Maes, K. Bekaert, I. Paul-Pont, L. Frère, J. Robbens, and A.D. Vethaak. "Microplastic Contamination in Brown Shrimp (Crangon Crangon, Linnaeus 1758) from Coastal Waters of the Southern North Sea and Channel Area." Marine Pollution Bulletin (2015): 179-87. Purpose This study examined microplastic consumption within the context of an ecologically and commercially important species, the brown shrimp (Crangon crangon). The brown shrimp is considered an ideal case study because it can be found in areas where studies have shown large concentrations of microplastics. Additionally, since they are exposed to microplastics with different concentrations throughout their lifecycle, they allow for both temporal analysis as well as spatial. Methods ● Samples were collected across the English Channel area and southern region of the
North sea ○ Five different institutes collected data by towing a shrimp trawl at receding tide ○ Samples were collected off the coasts of Belgium, the Netherlands, the United
Kingdom, and France ○ 165 shrimp were collected from 8 different sites
● Length-weight relationships were used to evaluate the overall health of the shrimp samples
Findings Of the microplastic content found in 104 of the 165 (63%) assessed shrimp, 95.5% was categorized as synthetic fiber. For some of the sampled shrimp, fibers were the only microplastics observed. It was also concluded that microplastics do not accumulate in the gastrointestinal tract but rather get expelled with sand particles. No significant difference was observed in the spatial analysis, but there was a significant temporal difference in microplastic ingestion, with significantly more microplastics consumed in October compared to March. The study indicates that higher fishing activity during October rather than March could be responsible for this variation. Additionally, shrimp tend to take up more food before winter in order to build their fat reserves. Ultimately, no negative effect of microplastics on nutritional condition could be observed.

95
Desforges, J.W., M. Galbraith, and P.S. Ross. "Ingestion of Microplastics by Zooplankton in the Northeast Pacific Ocean." Archives of Environmental Contamination and Toxicology (2015): 320-30. Purpose The objective of this paper was to assess the potential impacts of microplastic ingestion on marine biota, specifically foundation species near the base of marine food webs. The study examines two foundation species (a copepod and a euphausiid) from the North Pacific, and, from those results, estimate the potential microplastic consumption of higher trophic level species. Methods ● Samples collected in the Northeast Pacific Ocean via vertical net tows from a depth of
250 m (about 10 m of the seafloor) ● “Clean” zooplankton individuals collected from identical sites were used for comparison
Findings Microplastics were detected at a rate of one particle per every 34 copepods and one particle per every 17 euphausiids tested. A significant difference in ingestion between the two zooplankton species was found, indicating that euphausiids either ingest more plastics or are less capable of eliminating them after ingestion. Of the microplastics observed, 68% in euphausiids and 50% in copepods were identified as fibers. However, extraction efficiencies for smaller nylon fibers (30 × 200 µm^2) were low, which could have resulted in an underestimation of fiber concentrations. The study also includes estimates of microplastic ingestion by Pacific salmon species based on their consumption rates of the two zooplankton they examined. Rochman, C.M., E. Hoh, T. Kurobe, and S.J. Teh. "Ingested Plastic Transfers Hazardous Chemicals to Fish and Induces Hepatic Stress."Scientific Reports (2013). Purpose This paper examined the chemical impacts of microplastic consumption by fish. Specifically, the paper focuses on the chemical pollutants from the marine environment that sorb onto these microscopic plastic particles. This is one of few papers to examine the potential bioaccumulation of pollutants introduced into organisms by microplastics.
96
Methods ● Used the Japanese medaka for ingestion studies as it is a widely accepted model fish
species ● Three treatments assessed
○ negative control (no LPDE) ○ virgin plastic (LDPE virgin pre-production plastic) ○ marine plastic (LDPE deployed in an urban bay)
● Fish were exposed to 10% plastic (by weight) per treatment ● Treatments were distributed at the surface and dissociated throughout the water column,
similar to how the fish would be exposed in the wild ● Concentration of 8ng/mL whereas maximum concentrations recorded in the North Pacific
Subtropical Gyre are 300 ng/mL ● Chemical analyses targeted polycyclic aromatic hydrocarbons (PAHs), PCBs, and
PBDEs Findings After prolonged exposure (two months) to the treatments, fish exposed to the marine-plastic treatment showed to contain greater concentrations of PBTs. Additionally, total concentrations of PBDEs were found to be significantly greater in fish exposed to the marine-plastic treatment. Greater concentrations of PBTs were also observed in the marine-plastic treated fish, but this was only apparent after the full 2-month exposure, suggesting that short-term exposures may not be a significant source of PBTs. Fish exposed to either of the plastic treatments exhibited signs of liver stress, which included glycogen depletion and single cell necrosis. The study concludes that the physiological effects of consuming microfibers are a result of both the physical presence of the microplastic as well as the contaminants that sorb onto them. Besseling, E., A. Wegner, E.M. Foekema, M.J. Van Den Heuvel-Greve, and A.A. Koelmans. "Effects of Microplastic on Fitness and PCB Bioaccumulation by the Lugworm Arenicola Marina (L.)." Environmental Science & Technology (2013): 593-600. Purpose The objective of this paper was to assess the biological impacts of ingested plastic on the lugworm, a cornerstone benthic species. Although much has been speculated as to the negative effects of marine microplastics on benthic marine species and the potential threat of bioaccumulation, this study is the first controlled experiment designed to address these hypotheses.
97
Methods ● Lugworms (Arenicola marina) were exposed for 28 days to PCB-contaminated sediment
○ The test organisms were given time to clear their gut prior to exposure ○ Tests for healthy specimens were run and only the most robust organisms were
used in the experiment ● After the 28 day exposure, the lugworm tissue was collected and analyzed for PCBs ● Plastic concentrations in the sediment were as high as 7.4%, three orders of magnitude
higher that reported concentrations in marine sediments. Findings Particles were found in the guts or organisms that were removed from the treatment, because of escape or mortality, but not in organisms that survived the 28 day exposure after which they were allowed to clear their guts.

98
Appendix 3: Data Methodology Some of the masses (n = 8) were estimated as slightly negative from the massing methodology, which was likely due to some residual contamination in the washing machines that washed onto the blanks. To account for this measurement error, statistical tests were run with these masses set to zero as they were only slightly negative (< 200 mg). Normality assumptions were examined and tested for treatment type groups with Shapiro-Wilk tests and diagnostic plots. Due to low sample size, failure to reject Shapiro-Wilk was followed with visual examination of normality assumptions with plotted residuals. Filter size and age treatment groups violated normality assumptions with bimodal distributions (due to stark differences in top-load and front-load shedding). Between load treatment types, however, normality assumptions were met. The Wilcoxon Signed Rank Test was used for filter size and age treatment groups while Welch’s t-test was used for comparisons of load treatment. For comparisons of jacket types, ANOVA assumptions were examined with Levene’s test for equality of variance and diagnostic plots. Although normality assumptions were slightly violated and small sample sizes lowered the power of variance testing, we proceeded with ANOVA testing as the treatments were balanced. A Kruskal-Wallis test was also run and compared with the ANOVA, but few differences were observed between the two tests so we only report ANOVA results. Interaction terms were tested with Multi-way ANOVAs and confirmed by a linear model with heteroscedasticity-adjusted standard errors (See Appendix Table A.4 for an example comparison). The conclusions of these two methods converged unless stated otherwise. Table A.4. Heteroscedasticity-adjusted regression results of fiber mass shed (in mg) for all jackets (n = 140). The model includes two predictor variables and their interaction term: load (top or front) and filter size (20 µm and 333 µm). The interaction between washing machine treatment and mass of fibers on the two filter sizes was significant (t = -2.95, p < 0.0038). A Two-Way ANOVA on the same interaction had the same conclusion of significance (n = 140, F(1) = 6.86, p = 0.0098).
Coefficient Standard Error
t p Overall Adjusted R2
Intercept 86.39 10.67 8.07 < 0.0001 0.266
Load: Top 544.17 69.13 7.87 < 0.0001
Filter Size: 333 µm 285.40 27.73 10.29 < 0.0001
Load Top * Filter Size 333 µm -310.34 105.37 -2.95 0.0038
Washing machine load codes: 0, front; 1, top | Filter size codes: 0, filter 20 µm; 1, filter 333 µm