final report - university transportation center for mobility … · 2011-09-02 · executive...
TRANSCRIPT

Laura Higgins, Jeff Warner, Curtis Morgan, and Philip Dunham
DOT Grant No. DTRT06-G-0044
Examining Long-Distance Express Buses as an Extension of and Feeder to Passenger Rail Systems
Final Report
Performing OrganizationUniversity Transportation Center for Mobility™Texas Transportation InstituteThe Texas A&M University SystemCollege Station, TX
Sponsoring AgencyDepartment of TransportationResearch and Innovative Technology AdministrationWashington, DC
“Improving the Quality of Life by Enhancing Mobility”
University Transportation Center for Mobility
UTCM Project # 10-44-53March 2011

Technical Report Documentation Page 1. Project No. UTCM 10-44-53
2. Government Accession No.
3. Recipient's Catalog No.
4. Title and Subtitle Examining Long-Distance Express Buses as an Extension of and Feeder to Passenger Rail Systems
5. Report Date March 2011
6. Performing Organization Code Texas Transportation Institute
7. Author(s) Laura Higgins, Jeff Warner, Curtis Morgan, and Philip Dunham
8. Performing Organization Report No. UTCM 10-44-53
9. Performing Organization Name and Address University Transportation Center for Mobility™ Texas Transportation Institute The Texas A&M University System 3135 TAMU College Station, TX 77843-3135
10. Work Unit No. (TRAIS) 11. Contract or Grant No. DTRT06-G-0044
12. Sponsoring Agency Name and Address Department of Transportation Research and Innovative Technology Administration 400 7th Street, SW Washington, DC 20590
13. Type of Report and Period Covered Final Report April 2010–January 2011 14. Sponsoring Agency Code
15. Supplementary Notes Supported by a grant from the US Department of Transportation, University Transportation Centers Program 16. Abstract One of the mobility challenges facing Texas and other high-population states in the coming years is the rising travel demand along major intercity travel corridors. Increased passenger rail service may help to absorb some of the travel demand from crowded highway and air travel corridors, but service is cost-prohibitive to develop over very long distances. This project explored the potential of using express intercity bus service as an alternative to and an extension of passenger rail service, thus providing a similar type of higher-speed, limited-stop service over long distances with lower development costs than rail.
17. Key Word Transit, Intercity, Rail, Bus
18. Distribution Statement Public distribution
19. Security Classif. (of this report) Unclassified
20. Security Classif. (of this page) Unclassified
21. No. of Pages 82
22. Price n/a
Form DOT F 1700.7 (8-72) Reproduction of completed page authorized

Examining LongDistance Express Buses as an Extension of and Feeder to Passenger Rail Systems
Laura Higgins Associate Research Scientist Texas Transportation Institute
Jeff Warner
Associate Transportation Researcher Texas Transportation Institute
Curtis Morgan
Program Manager, Multimodal Freight Program Texas Transportation Institute
Philip Dunham
Graduate Research Assistant Texas Transportation Institute
Final Technical Report Project #104453
University Transportation Center for Mobility™
April 2011

2
Disclaimer The contents of this report reflect the views of the authors, who are responsible for the facts and the accuracy of the information presented herein. This document is disseminated under the sponsorship of the Department of Transportation, University Transportation Centers Program in the interest of information exchange. The U.S. Government assumes no liability for the contents or use thereof.
Acknowledgment
Support for this research was provided by a grant from the U.S. Department of Transportation, University Transportation Centers Program to the University Transportation for Mobility (DTRT06‐G‐0044).
The research team would like to thank Kelly Kirkland of the Texas Department of Transportation (TxDOT), Public Transit Division, for his advice and assistance during this project. Thanks also go to the representatives of TxDOT, local government and transit agencies, and private‐sector transit companies who contributed their time, information, and insights to this study.

3
Table of Contents
List of Figures ...................................................................................................................... 5
List of Tables ....................................................................................................................... 5
Executive Summary ............................................................................................................. 7
Chapter 1—Problem and Approach .................................................................................... 9
Chapter 2—Methodology ................................................................................................... 9
Literature Review ............................................................................................................ 9
Interviews with Transit Providers and Stakeholders .................................................... 10
Cost Analysis ................................................................................................................. 10
Case Study—Conceptual Corridor Analysis .................................................................. 10
Report Organization ...................................................................................................... 11
Chapter 3—Background Information on Intercity Transit ................................................ 11
Evolution of Intercity Bus Travel ................................................................................... 11
Rise of “Curbside” Bus Services .................................................................................... 12
Chapter 4—Intercity Transit Providers ............................................................................. 13
Intercity Passenger Rail Service .................................................................................... 13
Intercity Bus Providers .................................................................................................. 18
Feeder/Local Transit Examples ..................................................................................... 25
Lessons Learned—Providing and Connecting to Intercity Bus/Rail .............................. 29
Chapter 5—Intercity Travel Corridors in Texas................................................................. 31
Passenger Rail Study: Travel Corridors ........................................................................ 31
Travel Demand and Transit Service—Selected Texas Regions ..................................... 33
Chapter 6—System Cost Considerations .......................................................................... 41
Previous Research Projects’ Cost Information ............................................................. 41
Additional Cost Information ......................................................................................... 49
Summary of Cost Components and Considerations ..................................................... 54
Chapter 7—Case Study of Dallas‐Abilene‐El Paso Corridor .............................................. 55
Corridor Description ..................................................................................................... 55
Existing Intercity Service and Infrastructure ................................................................. 64
Expanded Intercity Transit: Three Scenarios ................................................................ 69

4
Chapter 8—Conclusions and Recommendations ............................................................. 76
References ........................................................................................................................ 78

5
List of Figures
Figure 1. Map of Amtrak Service in Texas. ....................................................................... 15
Figure 2. Relative Size and Distance of Texas Population Centers along Study Corridors. .............................................................................................................. 33
Figure 3. Dallas/Fort Worth to El Paso via Abilene (DFWABI) Corridor Map. ................. 56
Figure 4. CBSA Map Showing Transportation Infrastructure. ......................................... 57
Figure 5. Distribution of CBSAs along Case Study Corridor. ............................................ 59
Figure 6. Ports to Plains Corridor—Texas Portion. .......................................................... 61
Figure 7. La Entrada al Pacifico Corridor. ......................................................................... 62
Figure 8. Map of Intercity Bus Services on and near Dallas‐Abilene‐El Paso Corridor. ................................................................................................................ 65
Figure 9. Caprock Express Route and Stations. ................................................................ 75
List of Tables
Table 1. Current Amtrak Routes and Connecting Bus Service in Texas. .......................... 15
Table 2. Intercity Bus Providers: Summary of Service Characteristics. .......................... 25
Table 3. Travel Corridors Identified in TxDOT‐Sponsored Rail Study. ............................. 32
Table 4. Sample Development Costs for Recent Passenger/Commuter Rail Projects. ................................................................................................................ 42
Table 5. Sample Development Costs for Express Bus, Enhanced Bus, and BRT Services. ................................................................................................................ 43
Table 6. Example Costs for Stations, Terminals, Park‐and‐Rides, and Bus Stops. ........... 44
Table 7. Example Costs for Vehicles/Rolling Stock (Bus and Rail). .................................. 46
Table 8. Sample Cost‐per‐Mile Indices by Project Type for California Intercity Capital Program. ................................................................................................... 47
Table 9. Sample Station Construction and Rehabilitation Costs. .................................... 48
Table 10. Texas Section 5311 Performance Measures. ................................................... 49
Table 11. Summary of Idaho Intercity Bus Financial Measures. ...................................... 51
Table 12. Representative Costs of a BRT System. ............................................................ 52
Table 13. Typical Intercity Bus Carrier Cost Composition. ............................................... 53
Table 14. Selected Major Intercity Bus Carrier Costs and Operating Data (1982 Dollars). ................................................................................................................. 54

6
Table 15. Summary of Operating Data. ........................................................................... 54
Table 16. Populations, Distances, and Travel Times along Dallas‐Abilene‐El Paso Corridor. ................................................................................................................ 58
Table 17. Intercity Transit Demographics and In‐Demand Destinations (from TxDOT PTC Interviews). ......................................................................................... 64
Table 18. Intermodal Facilities along Dallas‐Abilene‐El Paso Corridor. ........................... 66
Table 19. Intercity Transit Service, Abilene‐Lubbock‐Midland‐Odessa‐San Angelo. ....... 68
Table 20. Operating Cost Ranges, Scenario 1 Routes. ..................................................... 71
Table 21. Operating Cost Ranges, Scenario 2 Routes. ..................................................... 73
Table 22. Operating Cost Ranges, Scenario 3 Routes. ..................................................... 76

7
Executive Summary
One of the mobility challenges that Texas and other high‐population states will face in the coming years is the prospect of reaching or exceeding the capacity of some major ground and air travel corridors and needing to find more efficient ways of moving both goods and people between cities and across regions. A recent study performed by the Texas Transportation Institute (TTI) for the Texas Department of Transportation (TxDOT) examined the potential for an intercity passenger rail system connecting the state’s major population centers. That study analyzed 18 of the state’s major travel corridors and recommended a subset of those corridors that should be prioritized for passenger rail development. Several of the remaining corridors ranked high in potential travel demand, but are less likely candidates for passenger rail development due to factors such as their length (over 500 miles in some cases) and the low population density between their end points. For some of these corridors, express intercity bus could provide a viable alternative to passenger rail.
Intercity bus is a growing transit market for the first time in decades, due in large part to the emergence of express intercity bus services like Megabus and BoltBus. These companies, modeled in part after the curbside “Chinatown” bus companies, provide nonstop or limited‐stop service between city pairs at low prices. Buses include high‐end amenities such as comfortable seats, power outlets, and Wi‐Fi service, designed to appeal to professionals and leisure travelers. Operating costs tend to be lower than traditional intercity bus service; ticket sales are nearly exclusively online (eliminating the costs associated with on‐site ticket agents), and these companies do not own their own facilities (though in some cases they share facilities with other transit providers). The success of the curbside bus industry is influencing the more traditional intercity carriers, several of whom are upgrading their vehicles and streamlining routes to provide faster, more upscale service.
Other transit modes, from passenger rail to local rail and bus services, are also exploring ways to make transit more accessible and appealing to a wider market. Intermodal connections, fare and schedule coordination, frequent and on‐time service, targeted marketing, and onboard amenities are some of the strategies being employed to attract travelers who might otherwise select other modes. Some rural providers are beginning to add fixed routes to connect population centers within a region, both to attract commuters to transit service and to accommodate larger numbers of elderly and disabled riders needing transportation to medical appointments.
The travel corridor from Dallas through Abilene, Midland, and Odessa to El Paso is 645 miles long and connects nine cities and towns of 10,000 people or more. In addition, the cities of Lubbock and San Angelo are just over 100 miles north and south of the corridor and are close to Abilene, Midland, and Odessa. The rural transit providers in this region of West Texas have a long history of coordinating transportation services with each other and with intercity providers. Intermodal terminals intended to serve

8
local and intercity bus providers are under construction or renovation in Midland, Lubbock, and San Angelo, and another is proposed for construction in Abilene.
In 2010, TxDOT developed the Texas Rail Plan, which inventoried existing passenger and freight rail service in Texas and proposed short‐range and long‐range investment options for freight and passenger rail infrastructure. Depending on the future of the passenger rail network in Texas, several different potential scenarios emerge for intercity bus services along this corridor:
1. Expansion of existing Amtrak service along its current Sunset Limited route in south Texas will likely mean that intercity bus services will continue as the principal transit option along the Dallas‐Abilene‐El Paso corridor. Expansion of intercity transit service in this case might involve increased frequencies on currently served segments between Dallas and Abilene, Abilene and Midland‐Odessa, and Midland‐Odessa and El Paso, as well as increased service from Lubbock and San Angelo into the corridor. A bus connection might also be made from this corridor to the Amtrak station in Alpine.
2. Rerouting of Amtrak’s Texas Eagle/Sunset Limited route to the Dallas‐Abilene‐El Paso corridor, proposed as an option in the Texas Rail Plan, would mean an altered role for intercity bus along this corridor. Bus service could still operate along the corridor, coordinating with rail service to provide greater trip frequencies than rail could provide alone. Additionally, intercity bus could provide connecting service to the corridor from Lubbock and San Angelo.
3. Another option presented in the Texas Rail Plan is the addition of rail service from Fort Worth through Abilene and Amarillo into Colorado, a proposed route called the Caprock Express. Intercity bus service to and from Abilene would become more important, and intercity bus would still be the primary mode between Abilene and El Paso. If Amtrak’s Sunset Limited were to be rerouted in addition to the development of the Caprock Express route, the role of intercity bus would likely diminish between Abilene and Dallas‐Fort Worth.
Capital and operating costs for increased intercity and feeder bus services vary greatly depending on location, service models, and amenities provided. Per‐mile operating costs for intercity bus services on this corridor are estimated at $3.50 to $3.67. Capital costs for transit terminals could range from $4 million to $12 million, and capital costs for vehicles range from $200,000 to 325,000.
Transit providers identified several ways for federal, state, and local government agencies to facilitate improved intercity transit service, many of them involving technical assistance and funding dedicated to intermodal and regional transit planning.
9
Chapter 1—Problem and Approach
One of the mobility challenges that Texas and other high‐population states will face in the coming years is the prospect of reaching or exceeding the capacity of some major ground and air travel corridors and needing to find more efficient ways of moving both goods and people between cities and across regions. A recent study performed by the Texas Transportation Institute (TTI) for the Texas Department of Transportation (TxDOT) examined the potential for an intercity passenger rail system connecting the state’s major population centers. That study analyzed 18 of the state’s major travel corridors to estimate both current and projected demand for ground and air travel between selected city pairs, and recommended a subset of those corridors that should be prioritized for passenger rail development.
Several of the remaining corridors, such as the corridor between Dallas and El Paso, ranked high in potential travel demand, but due to their length and the relatively low population densities between their end points, they are less likely candidates for passenger rail development, at least in the near future. Some of these corridors are currently served by intercity bus, but travel times by this mode as it is typically operated are too slow to compete with personal vehicles or air travel. As part of a coordinated system with passenger rail, long‐distance “express bus” service may be a way to provide intercity travel that is less expensive than air travel, faster than traditional bus service, and more efficient (in persons per vehicle mile) than personal vehicles. Express bus service, usually associated with urban or regional transit, makes fewer stops than typical fixed‐route service and tends to be marketed to commuters who want a faster, more predictable travel time and are willing to pay higher fares to get it. For some of the longer travel corridors in Texas, express intercity bus could provide a viable alternative to passenger rail. For either intercity bus or rail, coordinated services by local transit providers that “feed” the larger city‐to‐city links might be a partial solution to mobility demands in Texas’ rural counties.
The research team collected and analyzed data from urban/regional express bus, intercity bus, and intercity and commuter rail services. Information of interest included capital and operating cost factors, passenger fare structures, factors affecting ridership, and operating/logistical considerations associated with each of these categories of passenger transit. Data came from previous research, interviews with transit providers, and other available documentation. The researchers used this information to develop a case study for express intercity bus service along a selected travel corridor.
Chapter 2—Methodology
Literature Review
The team reviewed previous studies, articles, presentations, and other published material pertaining to intercity, regional, and express or rapid passenger transit services. A previous review, performed as part of TxDOT Project 0‐5930 in 2007, served as a starting point. Topics
10
of interest included ridership numbers and demographics associated with intercity and express transit services, factors affecting ridership, and recent developments in regional and intercity transportation.
Interviews with Transit Providers and Stakeholders
Interviews were conducted with representatives of intercity transit providers including Greyhound, Bolt Bus, the Kerrville Bus Company, and Megabus; the New Mexico Rail Runner and Virginia Railway Express; rural, urban, and regional transit providers; TxDOT public transportation coordinators; and a metropolitan planning organization (MPO). The interviews collected information about the ridership markets served, fare structures, operating and capital costs, marketing strategies, experiences with service development, and plans for future expansion. Where applicable, the research team also requested available documentation pertaining to transit development and operation. Interviews were conducted primarily by telephone, with e‐mail used as a supplement and occasional substitute.
Cost Analysis
The team developed cost estimates for various aspects of an express intercity bus system, based upon available data from other express bus, bus rapid transit (BRT), passenger rail, and intercity bus projects implemented in the United States. As with the literature review, some of this information was collected for Project 0‐5930 for both rail and bus projects. This current project expanded on the data already collected, focusing on capital and operating costs for express bus, bus rapid transit, and intercity bus services.
Case Study—Conceptual Corridor Analysis
One of the intercity travel corridors that had been identified by Project 0‐5930 was developed as a case study to illustrate a potential express intercity bus route. Information on population, demographics, travel demand, and existing transit services that was collected during Project 0‐5930 was used as the basis for selecting a corridor that could potentially benefit from express intercity transit service. The research team identified existing and planned or proposed intercity bus routes and passenger rail service, express bus/BRT services operated in the corridor’s urban areas, and rural and feeder transit services that connect or could potentially connect to a limited‐stop intercity route. Existing and planned coordination among any of these services, including intermodal stations, schedule and/or fare coordination, and interlining agreements (in which two transit providers jointly issue tickets and divide revenues for trips that connect from one provider to the other), was also documented. The team identified the basic elements (infrastructure, interagency coordination, equipment, and personnel) that would be needed to develop one or more express intercity routes along the corridor, including connections between that service and intercity passenger rail and recommended locations of stops and transfer points. Where possible, cost ranges to develop and begin operation of those routes were estimated.

11
Report Organization
This study’s findings are summarized in Chapters 3 through 6 of this report. Chapter 7 is a case study illustrating how express intercity bus might be implemented on one of the state’s major travel corridors. Conclusions and recommendations are summarized in Chapter 8.
Chapter 3—Background Information on Intercity Transit
This chapter summarizes some of the existing literature on intercity transit services, with a particular focus on intercity bus and the connections between bus and rail.
Evolution of Intercity Bus Travel
Travel by bus in the United States predates the invention of the automobile. Early “jitney” service (operated with individually owned sedans) was operating by the early 20th century, and by the 1920s had grown into longer, interconnected transit service networks. (1) Bus travel in the United States grew rapidly in its early years; however, growth within the transit industry was inhibited by both government regulation and by the economic downturn of the Great Depression. Initial legislation regarding transit service was changed many times, but long‐lasting legislation was passed under the Motor Carrier Act of 1935 that regulated both intercity bus and interstate trucking. The Motor Carrier Act of 1935 placed some limitations on market competition within the transit industry, many of which remained until the Motor Carrier Act of 1980 and the Bus Regulatory Reform Act of 1982, which eliminated most of the regulations on intercity bus travel. All regulation on the intercity transit industry was then abolished with the Interstate Commerce Commission Termination Act of 1995. (2)
While the bus industry saw increased ridership following the Great Depression and leading into World War II, it soon began to falter. The intercity travel market share of bus travel was 30 percent in 1963 and fell to just 12 percent in 1981, prior to the Bus Regulatory Reform Act. This was largely as a result of competition from both rail and air travel. Intercity travel by bus on Class 1 bus providers (providers with annual revenue of $5 million or larger) fell from 160 million in 1960 to about 105 million in 1980 and to 40 million in 1990. In 1988, amid financial troubles, the Trailways intercity bus company was absorbed by Greyhound, making Greyhound the only nationwide intercity bus company. The decline in ridership following the Bus Regulatory Reform Act seems to owe more to reductions in intercity bus service than to traveler preference for other modes; 11,820 locations were served by intercity bus carriers in 1982, but by 1991, only 5,690 locations were served by intercity bus routes. The majority of this reduction in intercity bus service was to communities with small populations that bus lines found to be unprofitable. (3)
Studies of intercity bus ridership over the last several decades found relatively consistent trends in ridership demographics. Data from the Bureau of Transportation Statistics American Travel Survey of 1995 showed that regular‐route intercity bus riders were more likely to be

12
under 24 years old or over 60 years old than travelers on other modes, and more likely to have lower household incomes; about 30 percent of intercity bus riders identified in the study did not own a vehicle. (4) College students, recent immigrants, military personnel, and recently released prisoners were among the largest intercity bus markets; people with the means to choose other modes of intercity travel generally did not ride a bus. (5, 6)
Bus service also has a long‐standing history as a connecting and feeder service for passenger rail. Amtrak’s Thruway bus service shuttles passengers between rail stations and to selected cities that are not on the rail line. In Texas, Thruway service (operated by Greyhound) provides connections on several city‐to‐city links within the state as well as from Texas to cities in adjacent states: Longview to Houston/Galveston and Shreveport; San Antonio to Laredo and McAllen; Temple to Killeen/Fort Hood; and Houston to Galveston. (7)
The Rail Passenger Service Act of 1970 permits states to contract with Amtrak to provide bus connections to the passenger rail network. In California, both Amtrak rail and Amtrak Thruway buses are supported by the California Department of Transportation (Caltrans), in a partnership that has been named Amtrak California. Caltrans‐funded bus service began feeding passengers to Amtrak stations in 1980, linking the city of Sacramento to Amtrak’s then‐struggling San Joaquin route. Through the 1980s, Caltrans established more routes that connected the San Joaquin route with the state’s population centers, including San Jose, Los Angeles, Long Beach, Van Nuys, and San Diego. These bus connections significantly increased ridership on the San Joaquin route, from 13,000 per month in 1981 to 24,000 per month in 1986. Amtrak’s farebox recovery likewise increased as well, from 32 percent in 1981 to 64 percent in 1988. The costs per passenger on the feeder buses tended to be relatively high compared to other bus transit service; however, the revenues from a combined bus‐rail trip more than paid for the feeder bus operating costs. Initially, Caltrans‐operated bus routes serving Amtrak stations were exclusively for the use of Amtrak passengers. However, the feeder route from Barstow, begun in 1987, was an existing intercity bus route that began providing service for Amtrak passengers while continuing to carry other intercity passengers. (8, 9)
Rise of “Curbside” Bus Services
Following the deregulation of the passenger bus industry in 1995, many new firms entered the transit market, providing service in areas that were previously underserved and/or providing specialized transit services in order to attract a broader customer base. Curbside bus service in the northeast started as a way for Chinese immigrant workers to travel at a low cost. The Fung Wah Transportation Company, the earliest known Chinatown bus, began in the mid‐ to late 1990s as a jitney service for immigrant workers traveling from Brooklyn into Manhattan’s Chinatown. In 1998, the business developed further, offering rides between Boston and Manhattan; recent immigrants traveling between the cities for part‐time work were still a significant market segment, as well as college students and their parents traveling to and from school. Fung Wah’s service soon expanded further to serve Philadelphia and Washington, D.C. (10, 11)

13
Other intercity bus companies realized that this “bare bones” curbside service was profitable, and expanded the market for curbside transit to other demographic groups by providing a more comfortable ride with more amenities. The reduction of cost due to the elimination of ticket agents and dedicated bus terminals allows these curbside services to offer rates much lower than traditional carriers such as Greyhound. (12) The newer curbside bus providers in the northeast, such as Megabus and Bolt Bus, have seen wide success because of their perceived cleanliness and safety (compared to the original Chinatown buses), amenities such as wireless Internet, and fares as low as a single dollar.
Both new and established intercity transit providers have started purchasing over‐the‐road coaches that emulate the look and feel of commuter rail coaches, and are exploring other ways to provide service that may attract travelers from other modes. In the summer of 2010, Greyhound added 70 new buses to its fleet; each new bus has 50 leather seats and offers free wireless Internet and power outlets. (13)
From 2007 through 2010, intercity bus has been the fastest‐growing mode of intercity travel, fueled almost entirely by the expansion of curbside services. (14) Scheduled intercity bus service in the United States increased by 8 percent from 2006 to 2007 and by nearly 10 percent from 2007 to 2008. This is a stark contrast from the 4 percent annual decrease in service from 1980 through 2002 and the 10 percent annual decrease from 2002 to 2006. (15) Megabus alone has transported over 6 million riders since it began service in April of 2006, with 1 million customers served between March and July of 2010.
Chapter 4—Intercity Transit Providers
Information on intercity rail and bus systems was collected from published journal and news articles, the transit systems’ own websites, and interviews with company/agency representatives where possible. Interviews and literature/web searches focused on ridership markets, route lengths, onboard amenities, and connections to other transit services.
Intercity Passenger Rail Service
Amtrak is the largest passenger rail service operating in the United States. While no Amtrak official could be reached for an interview, extensive information about Amtrak’s services, amenities, and intermodal connections was available in published reports and on the Amtrak website. Interviews were conducted with representatives of the Trinity Railway Express in Dallas‐Fort Worth, the New Mexico Rail Runner, and the Virginia Railway Express, three commuter rail systems providing intercity service.
Amtrak
Amtrak currently operates three routes through Texas—the Heartland Flyer, the Sunset Limited, and the Texas Eagle (see Figure 1)—and provides through ticketing and coordinated schedules for rail passengers to additional destinations via connecting bus service, known as

14
Thruway Motorcoach service. Thruway service providers in Texas include Greyhound, Lone Star Coaches, and Southwestern Coaches/Arrow Trailways. Table 1 summarizes the Texas cities served by Amtrak and its Thruway Motorcoaches.
Amtrak’s ridership has increased 37 percent during the past decade (16); boardings in Texas totaled 382,754 in 2010, up from 323,210 in 2008. (17, 18) While this represents a small fraction of the total intercity travel in the state, recent federal and state‐level support of passenger rail is expected to lead to improvements in speed and reliability that are likely to attract higher ridership in coming years.
Improvements funded in 2010 include a second track along the Trinity Railway Express commuter rail line in Dallas‐Fort Worth that will allow Amtrak to share this corridor, thus avoiding a section of the crowded Union Pacific freight line that is currently part of its route through the Metroplex. Upgrades to railroad signals on the Heartland Flyer route, also funded in 2010, will reduce travel times by increasing the maximum speed between Oklahoma City and Fort Worth to 79 mph. At the local level, a number of Texas cities have renovated their Amtrak stations in anticipation of improved service in coming years. Proposed future improvements include an increase in service along the Sunset Limited line, increasing frequencies both east and west from three to seven days per week; and extension of the Heartland Flyer route to Wichita and Kansas City. Amtrak used a federal grant in 2008 to begin replacing its aged fleet of rail cars and hopes to replace the entire fleet by 2040. (19)
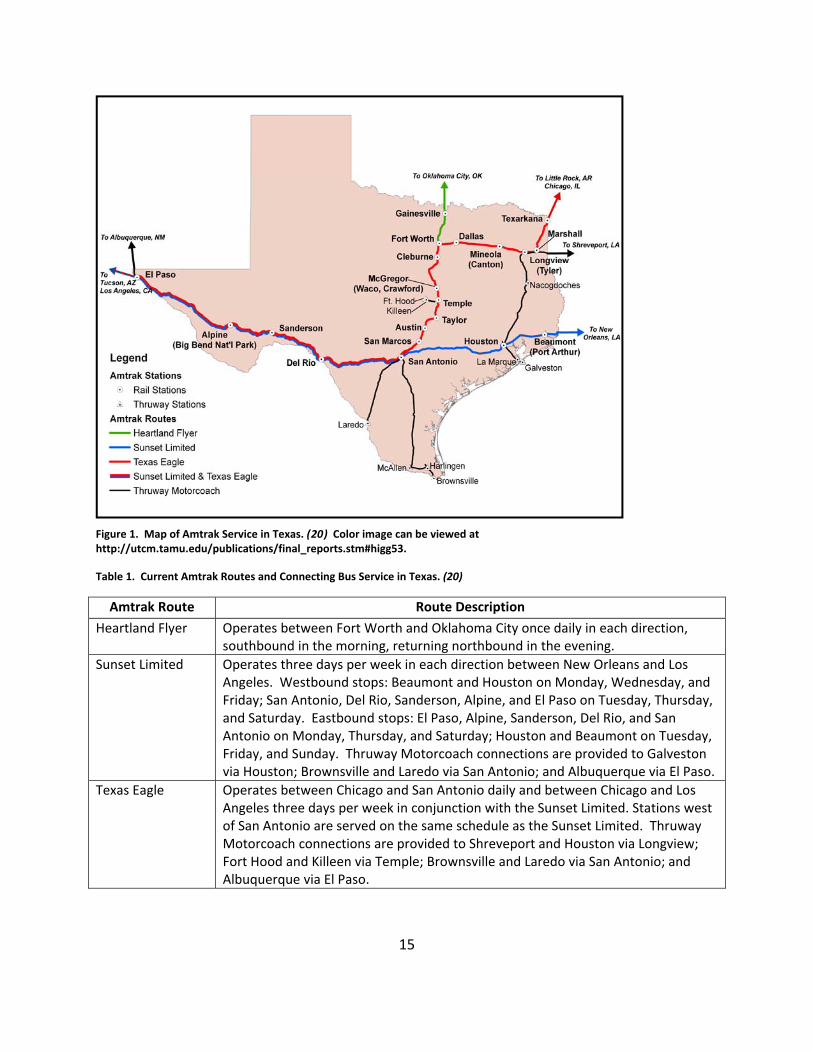
Figure 1. Map of Amtrak Service in Texas. (20) Color image can be viewed at http://utcm.tamu.edu/publications/final_reports.stm#higg53.
Table 1. Current Amtrak Routes and Connecting Bus Service in Texas. (20)
Amtrak Route Route Description
Heartland Flyer Operates between Fort Worth and Oklahoma City once daily in each direction, southbound in the morning, returning northbound in the evening.
Sunset Limited Operates three days per week in each direction between New Orleans and Los Angeles. Westbound stops: Beaumont and Houston on Monday, Wednesday, and Friday; San Antonio, Del Rio, Sanderson, Alpine, and El Paso on Tuesday, Thursday, and Saturday. Eastbound stops: El Paso, Alpine, Sanderson, Del Rio, and San Antonio on Monday, Thursday, and Saturday; Houston and Beaumont on Tuesday, Friday, and Sunday. Thruway Motorcoach connections are provided to Galveston via Houston; Brownsville and Laredo via San Antonio; and Albuquerque via El Paso.
Texas Eagle Operates between Chicago and San Antonio daily and between Chicago and Los Angeles three days per week in conjunction with the Sunset Limited. Stations west of San Antonio are served on the same schedule as the Sunset Limited. Thruway Motorcoach connections are provided to Shreveport and Houston via Longview; Fort Hood and Killeen via Temple; Brownsville and Laredo via San Antonio; and Albuquerque via El Paso.
15

16
Trinity Railway Express (TRE)
This commuter rail line connecting Dallas and Fort Worth is the product of an interlocal agreement between Dallas Area Rapid Transit (DART) and the Fort Worth Transportation Authority (The T), operated by Herzog Transit Services. The line opened in December of 1996 with three stations and has since expanded to 10 stations. Annual TRE ridership has risen fairly steadily since the line’s opening, from 175,969 in 1997 to 2.7 million in 2009 (approximately 9,800 riders per day). The trip time from one end of the line to the other is approximately one hour.
TRE shares intermodal stations with both DART and The T, as well as with Amtrak at Union Station in Dallas. Shuttle buses between the TRE Centre Port/Dallas‐Fort Worth (DFW) Airport station link TRE passengers to the airport terminals.
TRE rail cars are equipped with restrooms, power outlets, luggage racks, and comfortable seats, and Wi‐Fi service is available free of charge to passengers.
New Mexico Rail Runner
The New Mexico Rail Runner is an example of a passenger/commuter rail system developed using existing freight rail infrastructure, as well as a commuter rail system that has integrated with existing public bus transportation. Interviews were conducted with a representative of the Rail Runner and with representatives of the public transportation systems in Albuquerque and Santa Fe, New Mexico, which coordinate with the rail line. Connections to local bus service can be made at almost all stops on the Rail Runner free of charge.
Coordination has been of great importance between the Rail Runner and each connected city’s public bus transportation. A survey of Rail Runner riders found that between 30 and 35 percent of all passengers make a connection to a public transit bus at one end of their trip. Several cities along the 100‐mile rail line base their routes off of the Rail Runner, and the bus systems are notified in advance when changes are made to the rail schedule. Transit providers in Albuquerque and Santa Fe noted, however, that these changes have been more frequent and with less advance warning than initially expected, making it difficult at times for the local providers to make their own adjustments to keep up. Many of the markets served are small enough that the train schedule dictates local transit service. Some of the connecting bus service was achieved through modifications to existing routes, while other routes are new and even partially funded by Rail Runner. All of the coordination has been accomplished through informal agreements; there are no written contracts between Rail Runner and any transit providers. Rail stations were designed to accommodate bus service, even in locations where current service did not exist. Plans to expand bus service to stations will continue to be implemented as needed, with some expansion occurring this year.
Rail Runner ridership appears to be one factor contributing to a recent rise in overall transit ridership in New Mexico. Ridership on Albuquerque’s ABQ Ride has experienced a 30 percent

17
rise in ridership during the last four years. During the 2010 fiscal year, 280,213 riders on ABQ Ride connected their trip with the Rail Runner. The transit providers expect to continue to see increases in ridership as a result of the Rail Runner in the future.
Rail Runner also provides onboard amenities to help attract more ridership. Just like many of the major intercity bus vehicles, the train provides free Wi‐Fi, electrical outlets, and restrooms. In addition, there are tables at many of the seating areas, and plans are underway to add television monitors in the passenger cars. The bus services serving the Rail Runner are extremely varied. Various vehicles from articulated buses to vans are used to transport riders to and from stations. Some of these buses also provide amenities, such as the Wi‐Fi offered on Albuquerque’s Rapid Ride buses.
Prior to the Rail Runner service, the New Mexico Department of Transportation ran an intercity bus service between Albuquerque and Santa Fe. Rides on the bus cost $3, and service consisted of four or five buses during peak periods. Ridership was estimated at about 300 per day, which is just a fraction of the 4,500 per day riding Rail Runner. Rail Runner does experience some seasonality in ridership, with summer ridership averaging about 5,000 per day compared to 4,000 per day the rest of the year. These ridership levels are on eight trips into Albuquerque and eight trips back out to Santa Fe. At one point the New Mexico Rail Runner provided service on game days for the University of New Mexico football team; this service has since been discontinued due to low cost‐effectiveness.
Several methods were used to determine the routes and frequency of trains needed along the corridor, including market analysis, demographic analysis, rider/customer requests, and trial periods using bus service. Since the majority of the line is on a former freight line, route choice was relatively simple; additionally, the section that was built had to accommodate a large elevation change, which again narrowed the economically feasible right‐of‐way options. Once service began, adjustments to route schedules were made based on ridership levels and requests from riders. Capacity can be increased within the current schedule by adding cars to each train, but due to limited funding and high dependence on subsidies, the frequency of trains is at capacity. Demographics on the Rail Runner are similar to that of the intercity buses, but there are some striking differences. The Rail Runner sees nearly 80 percent commuters during weekdays and mostly leisure travel to Santa Fe on weekends. The leisure travel can be accounted for by the fact that Santa Fe, a city built nearly 400 years ago, was not designed for vehicle travel and has very limited parking.
The ridership levels on the Rail Runner are likely to increase out of a need for overall travel capacity through this part of the state if service is able to continue and to expand as needed. The I‐25 corridor has limited room to expand due to its proximity to Native American lands, and both Albuquerque and Santa Fe have limited downtown parking for travelers arriving by personal vehicle. However, future operating funds for the rail line at the state level are in doubt, and the Rail Runner will likely need to find other funding mechanisms to continue operations.

18
Virginia Railway Express
Virginia Railway Express (VRE) is the commuter rail service serving Washington, D.C., from northern Virginia. Planning for the system began in 1984 following the completion of a regional feasibility study performed by R.L. Banks and Associates, Inc. The two lines of the system opened for service in June and July of 1992 and terminate in Manassas and Fredericksburg, Virginia, respectively. (21) Both of these lines also serve Union Station in Washington, D.C., where they link up with other public transportation including Amtrak, the Washington, D.C., Metrorail, and several bus systems that service the city and surrounding areas. The track that VRE runs on is owned by CSX Transportation, Norfolk Southern, and Amtrak.
An interview was conducted with a representative of VRE to give the research team an inside look on the operations and planning of the rail system. In addition to the connections at Union Station, connections to VRE are made by the Washington, D.C., Metrorail at L’Enfant Plaza, Crystal City, Alexandria, and Franconia‐Springfield, as well as some local transit operators in some of the outlying stations, such as FRED Transit and the Greater Richmond Transit Company in Fredericksburg. These connections to other transit providers have helped increase ridership along the VRE corridor. Approximately one‐third of all VRE riders make a connection to another form of transit, with a quarter of those being on the Washington, D.C., Metrorail and the remainder on various bus services.
VRE offers some onboard amenities for passengers, but they are fairly limited. All trains have at least one restroom, and some of the older cars have electrical outlets that can be used by passengers. VRE is currently outfitting trains with Wi‐Fi and anticipates it being ready for use in 2011. VRE has not expanded service since operation began; however, two expansion projects are in the planning stages and will extend the VRE beyond the current service area. Both were identified through a strategic planning process in 2004, based primarily on demographic/regional forecasts and travel demand modeling. A survey of VRE riders indicated that 70 percent are commuting to government or military jobs, and 23 percent are commuting to jobs at private firms. The remaining riders are other commuters, students, and tourists.
Demand for riding the VRE is very high, with an average daily passenger load of over 17,000. The frequency of trains is largely based on potential demand; however, additional trains have to be agreed upon by the freight rail companies that own the lines. Currently VRE is unable to increase service because of budget shortfalls. VRE receives federal and state funding but also has to rely on local subsidy to stay operational. Nearly all trains are experiencing standing room only, so it is clear that the demand is there to expand if possible.
Intercity Bus Providers
Representatives from five intercity providers were interviewed. Greyhound Lines, Inc., is the largest, oldest, and most widespread intercity bus provider in the United States, and during the last six years has made some significant changes to its service model, fleet, and marketing strategies. Megabus was founded in 2006 as a hub‐and‐spoke express service modeled on the
19
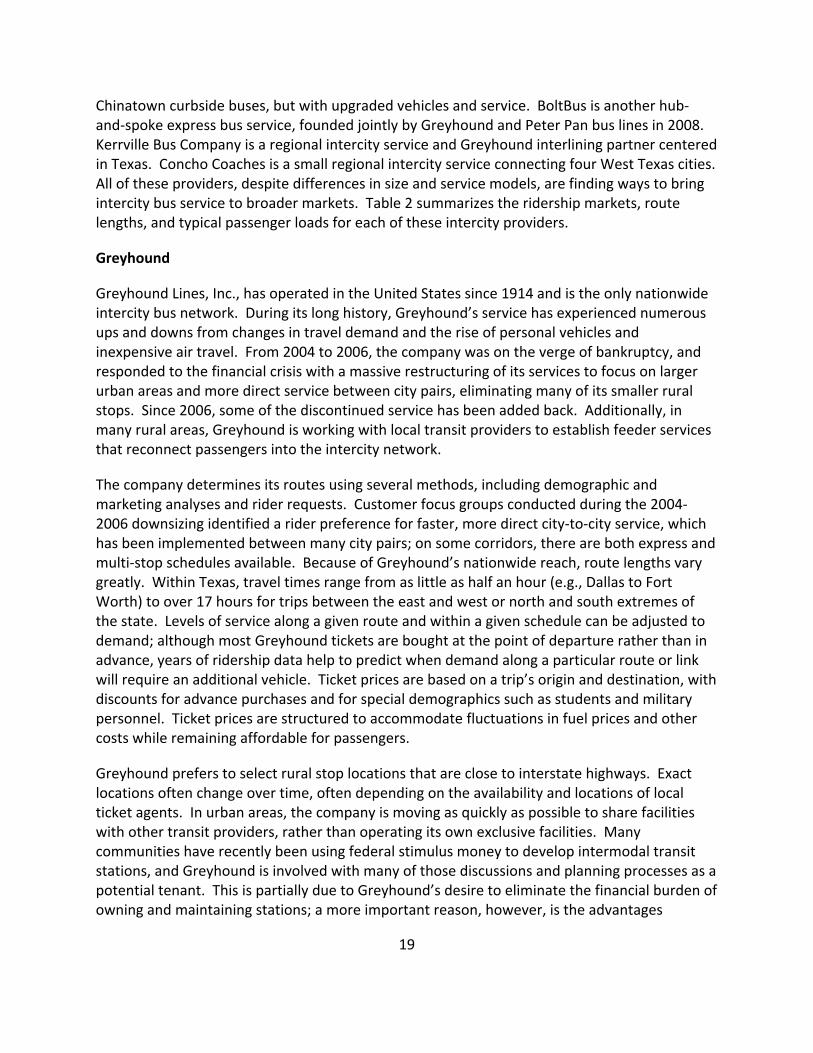
Chinatown curbside buses, but with upgraded vehicles and service. BoltBus is another hub‐and‐spoke express bus service, founded jointly by Greyhound and Peter Pan bus lines in 2008. Kerrville Bus Company is a regional intercity service and Greyhound interlining partner centered in Texas. Concho Coaches is a small regional intercity service connecting four West Texas cities. All of these providers, despite differences in size and service models, are finding ways to bring intercity bus service to broader markets. Table 2 summarizes the ridership markets, route lengths, and typical passenger loads for each of these intercity providers.
Greyhound
Greyhound Lines, Inc., has operated in the United States since 1914 and is the only nationwide intercity bus network. During its long history, Greyhound’s service has experienced numerous ups and downs from changes in travel demand and the rise of personal vehicles and inexpensive air travel. From 2004 to 2006, the company was on the verge of bankruptcy, and responded to the financial crisis with a massive restructuring of its services to focus on larger urban areas and more direct service between city pairs, eliminating many of its smaller rural stops. Since 2006, some of the discontinued service has been added back. Additionally, in many rural areas, Greyhound is working with local transit providers to establish feeder services that reconnect passengers into the intercity network.
The company determines its routes using several methods, including demographic and marketing analyses and rider requests. Customer focus groups conducted during the 2004‐2006 downsizing identified a rider preference for faster, more direct city‐to‐city service, which has been implemented between many city pairs; on some corridors, there are both express and multi‐stop schedules available. Because of Greyhound’s nationwide reach, route lengths vary greatly. Within Texas, travel times range from as little as half an hour (e.g., Dallas to Fort Worth) to over 17 hours for trips between the east and west or north and south extremes of the state. Levels of service along a given route and within a given schedule can be adjusted to demand; although most Greyhound tickets are bought at the point of departure rather than in advance, years of ridership data help to predict when demand along a particular route or link will require an additional vehicle. Ticket prices are based on a trip’s origin and destination, with discounts for advance purchases and for special demographics such as students and military personnel. Ticket prices are structured to accommodate fluctuations in fuel prices and other costs while remaining affordable for passengers.
Greyhound prefers to select rural stop locations that are close to interstate highways. Exact locations often change over time, often depending on the availability and locations of local ticket agents. In urban areas, the company is moving as quickly as possible to share facilities with other transit providers, rather than operating its own exclusive facilities. Many communities have recently been using federal stimulus money to develop intermodal transit stations, and Greyhound is involved with many of those discussions and planning processes as a potential tenant. This is partially due to Greyhound’s desire to eliminate the financial burden of owning and maintaining stations; a more important reason, however, is the advantages

20
intermodal connections bring to intercity providers and their customers. Expanded passenger rail business in Texas and elsewhere will represent competition for the intercity bus industry; however, having rail, intercity bus, and local transit in the same facilities helps to level the playing field among the various providers and provides opportunities for coordinated or complementary services. This in turn offers passengers more travel options.
Greyhound has taken cues from the passenger rail and airline industries to better serve an evolving travel market. As mentioned above, most tickets for Greyhound buses are purchased by passengers from local ticket agents at the point of departure. However, online sales now account for 30 percent of all ticket sales, and Greyhound’s website is becoming an increasingly important marketing tool. In addition, the company is testing on‐site ticketing kiosks at some of its stops. The recent fleet upgrades, the shift to urban‐to‐urban limited‐stop routes, and new intermodal terminals are helping to fuel an increase in Greyhound’s ridership after years of decline. The increased difficulty and inconvenience of air travel is also contributing to a mode shift for intercity travel.
Greyhound receives some amount of 5311(f) funding (Federal Transit Administration funding dedicated to provision of rural intercity bus service), as well as other subsidies for capital and operating costs for particular routes; lower‐density rural routes will see a continued need for intercity subsidies and for connections with rural transit operators.
Megabus
Megabus is an express bus service owned by Coach USA and founded in 2006. Its service is modeled on the curbside Chinatown buses, but is designed to appeal to a wider demographic with more comfortable vehicles, onboard amenities, and online ticketing. The company’s 120 vehicles are 80‐passenger double‐decker buses with reclining seats, seatbelts, power outlets, and Wi‐Fi. Megabus runs express line‐haul service from hubs in New York City, Philadelphia, Chicago, Toronto, and Washington, D.C., to over 40 cities. Routes range in length from two to eight hours. The most popular routes tend to be between four and eight hours long, including New York to Boston, New York to Washington, D.C., Chicago to Detroit, and Chicago to Indianapolis. Surprisingly, some of the highest‐ridership routes are also the longest, such as New York to Toronto, Philadelphia to Toronto, and Chicago to Minneapolis. Megabus attributes the popularity of these four‐to‐eight‐hour bus routes to a combination of onboard comfort and amenities, convenience and price compared to driving or flying between these cities, and an increasing interest in environmentally friendly transportation options.
Shorter routes have no stops between the end‐point cities, to minimize travel time. Some of the longer routes incorporate an intermediate stop between the endpoint cities, which is strategically located on the route to incorporate a rest stop for the driver and an additional boarding/disembarking point. Examples of intermediate stops include Toledo on the Chicago‐to‐Cleveland route, and Syracuse or Buffalo (depending on the schedule) on the Philadelphia‐to‐Toronto route.

21
Route selection is accomplished using a variety of information, including city sizes and populations, distances between city pairs, locations of large colleges or universities, and existing transportation alternatives in the area. The company also monitors its website, Facebook, and Twitter for comments and recommendations from current and potential riders for new route locations, and has received requests from city officials for service. Hub cities for Megabus routes are all large “destination” cities with heavy tourist/leisure traffic; 60 to 70 percent of Megabus business is into these cities and back out. Fifty percent of riders are college students and young professionals between 18 and 30 years old, with the majority of their trips for leisure rather than business. The second‐highest demographic is women between 30 and 55 years old traveling into cities on weekends, and the third‐highest is senior citizens looking for low‐price leisure trips on weekdays.
Megabus selects its stop locations within cities carefully, knowing that passengers prefer to arrive and depart from city centers with easy access to other public transit services and/or within walking distance of hotels, restaurants, shopping, and other attractions. Stops are located in safe, highly visible locations that are close to intermodal connections. Stop locations have moved occasionally to respond to travel demand or in response to a change in surroundings (e.g., the stop in New York has moved from Madison Square Garden while construction is underway there) but have largely remained stable. Although Megabus locates its stops close to other transit services and sometimes shares facilities, it does not interline or coordinate schedules with other providers.
Initial bus frequencies between each city pair are determined using statistical analysis of population, demographics, and distance; trip frequencies at start‐up have varied from twice daily to hourly. On 90 percent of routes, schedule frequencies have increased from their start‐up levels to handle demand. Based on sales demand, which can be tracked in real time due to the almost exclusively online ticket sales, additional buses can also be added to any given schedule to handle short‐term fluctuations. To maximize this ability to adjust schedules and bus numbers as needed, Megabus generally sells tickets no more than 60 days in advance. Exceptions include ticket sales for the Thanksgiving, Christmas, and New Year holidays, which are offered earlier.
Ticket prices are yield managed, with early‐purchase pricing beginning at $1 and progressing through tiers of $5, $8, and $12 seats depending on the particular route and schedule. As the day of departure approaches and/or a bus fills, ticket prices increase. To spread out passenger loads, more discounted seats are available on off‐peak trips and days. Trips on Tuesdays through Thursdays tend to be lower priced than weekend schedules. Megabus’ larger buses (80 passenger versus 55 to 60 for most other carriers) also lower the per‐passenger operating costs. Passenger loads average 50 to 60 percent on Tuesdays through Thursdays and nearly 100 percent Fridays through Mondays, for an overall average of 85 percent. Currently, Megabus is not funded through any state or federal program.

22
Megabus continues to expand. Washington, D.C., is Megabus’ newest hub, with services initiated to several new East Coast cities in December 2010. The company initiated a hub in California in 2007 but discontinued services soon afterward in order to concentrate resources on the high‐demand travel market in the Northeast. Even during the brief service period in California, ridership was rising, and the state is still considered a potential future market, along with Texas, Florida, and Georgia.
BoltBus
BoltBus was founded in 2008 as a joint venture between Greyhound and Peter Pan bus lines. Like Megabus, its hub‐and‐spoke express intercity service is modeled on the curbside bus industry. The company operates 80 buses on line‐haul routes from a hub in New York City running to Washington, D.C.; Cherry Hill, New Jersey; Philadelphia, Pennsylvania; Boston, Massachusetts; and Baltimore and Greenbelt, Maryland. Most of the routes are non‐stop to the major destination cities; the shortest route, between New York and Philadelphia, is approximately 100 miles long, and the longest, from New York to Washington, D.C., is 230 miles. Travel times on the routes vary from two hours to seven or eight, depending on traffic. Route selection has been based on marketing and demographic analyses, including data from Greyhound’s ridership numbers along certain corridors, but also on requests from riders in various cities. The route from Greenbelt, Maryland, to New York was begun as a way to put paying riders on an otherwise “deadhead” trip but soon attracted ridership heavy enough to warrant additional service between the two cities.
About one‐third of BoltBus’ service operates out of transit terminals (South Station in Boston and Union Station in Washington, D.C.); the rest is curbside. Unlike many of the earlier Chinatown curbside bus companies, however, BoltBus partners with the cities in its network to select stop locations. Additionally, the company has provided amenities at several of those stops, such as compacting, solar trash cans at stop locations in Philadelphia, and is now beginning to build bus shelters at some stops. Because approximately 50 percent of BoltBus’ riders connect to or from other transit modes, intermodal connections are important to the company’s business. For that reason, stop locations are selected with those connections in mind. In Washington, D.C., BoltBus led a pilot effort to introduce intercity bus service at Union Station. Even at curbside locations, BoltBus often shares space with Megabus and other intercity competitors. Currently, BoltBus does not interline with other providers, nor does it formally coordinate schedules.
Several of BoltBus’ ticketing procedures are copied from Southwest Airlines. Among these is the concept of boarding groups—each ticket sold has a unique boarding number that determines the order in which passengers board at a given stop. These boarding numbers result in an orderly queue at the bus stop (unlike the “mad rush” that often characterizes curbside bus boarding), assists the company in tracking ridership numbers, prevents a rider from accidentally boarding the wrong bus, and helps to prevent ticket fraud. Ticket pricing also resembles the budget‐airline industry, with tickets priced to demand; the lowest prices are

23
available to the earliest purchasers, up to a maximum fare that is capped at a level that is still value priced compared with other travel modes in the area. Finally, BoltBus’ rider loyalty plan is based on a similar program at Southwest Airlines; riders who sign up for the program can earn a free trip for every eight trips purchased.
Passenger load factors on BoltBus routes average 60 to 70 percent during the week, and 95 to 100 percent on weekends and holidays, for an average load of 85 percent. The break‐even load is 27 to 28 riders per bus, which is about a 50 percent load; so far, none of the routes that have been introduced have failed to meet this minimum ridership level. While business travel is a significant market, leisure travel accounts for a large share of ridership, as evidenced by the large number of riders on BoltBus’ weekend routes. Twice as many buses run on Fridays compared to Wednesdays. Most routes are launched with buses running on two‐hour headways; in BoltBus’ largest markets, ridership levels on weekends reduce headways to every 30 or even every 15 minutes. Because nearly all BoltBus tickets are sold online, the company receives real‐time information about tickets sold along a given route or at a particular stop, allowing schedules to be adjusted to demand. To the extent possible, buses are added to routes as needed to accommodate ridership; the buses cannot run more frequently than every 15 minutes due to operational constraints and the total number of available buses.
Exact cost information was not available from BoltBus, but its overall cost platform is low (about 65 percent of Greyhound’s operating costs), largely due to the cost savings from online ticketing, which eliminates the need for on‐site ticket agents while allowing tickets to be purchased any time of day. Recent new routes reached the break‐even point within two months, and most of the existing schedules are currently running at capacity. The company does not use 5311(f) funding for any of its routes because of its largely urban market base, but has received federal grant money for the purpose of outfitting its buses with wheelchair lifts and other equipment for American with Disabilities Act (ADA) accessibility; all of BoltBus’ vehicles are equipped to handle wheelchairs.
The company’s business has expanded rapidly during its first 2.5 years, with 400 to 500 percent growth from 2008 to 2009, and another 40 percent from 2009 to 2010. Market analysis has shown that many of the trips on BoltBus are optional trips that riders would not otherwise have taken. BoltBus has successfully positioned itself within a competitive travel market that includes passenger rail and regional air carriers as well as other transit providers. Convenience, onboard amenities, and pricing appear to be driving that success. If BoltBus comes to Texas in the future, it would likely begin operations along many of the same corridors that are likely high‐speed rail candidates, providing intercity transit service at a different price point than comparable rail trips.
Kerrville Bus Company
The Kerrville Bus Company (KBC) is an intercity bus service operating in Texas, Arkansas, and Louisiana. In addition to line‐haul bus service, KBC provides feeder service to Amtrak stations in

24
Del Rio and Houston. Routes range from just over an hour to 9.5 hours in length, and some routes have both multi‐stop and express schedules. KBC interlines with Greyhound and coordinates schedules informally with other bus carriers. Buses are equipped with DVD players and restrooms, and the company is considering adding onboard Wi‐Fi service.
Passenger load factors average 56 percent. Ridership has been decreasing on many routes; the current economy seems to be driving some travelers to use intercity bus as a travel mode but also decreasing overall travel.
KBC uses marketing and demographic analyses, rider requests, and trial periods to plan its routes. Stop locations have not changed much over the years; an occasional relocation may be needed to ensure that there is an appropriate ticket agency available. Routes that are not cost‐effective are discontinued fairly quickly. Some of KBC’s routes receive operating assistance from federal grant programs; examples include grants that helped to support a computerized ticketing system and transit marketing.
Concho Coaches
Concho Coaches is a small, privately owned bus company operating intercity passenger and package/freight service out of San Angelo to Odessa, Midland, and Abilene. Concho Coaches is also a local agent for Greyhound Lines and informally coordinates schedules with the Kerrville Bus Company, which operates out of the same transit terminal. All service is currently fixed route: a morning trip each weekday to Odessa and Midland and an evening trip to Odessa and Abilene. No weekend service is currently offered. The routes to Odessa/Midland are approximately 2.5 hours each way, while the Abilene route is approximately 1.5 hours.
Service is provided using 15‐passenger vans. A grant application has recently been submitted for new vans, with the possibility that at least one of the new vehicles may be wheelchair equipped; if this occurs, Concho Coaches may add demand‐response service to supplement the fixed routes. In the past, the company offered weekend service as well as an additional daily trip to Abilene, but those routes were not profitable and were discontinued. Another past service was regular trips to the Midland‐Odessa airport; these were discontinued soon after the 9‐11 terrorist attacks when airline service from this airport decreased sharply.
The largest portion of revenues comes from freight service. Concho Coaches has a number of regular customers who ship from $10 to $1,000 in freight each month. Passenger loads have recently increased from an average of one to an average of three passengers per trip due to interlining with Greyhound. Grant money has also helped to stabilize revenues and to sustain the existing routes.

25
Table 2. Intercity Bus Providers: Summary of Service Characteristics.
Provider Cities Served Route/ Segment Lengths
Passenger Loads Major Ridership Markets
Greyhound Lines, Inc.
Nationwide Varies by route
Varies by route
Megabus 40+ cities from 5 hubs:• New York • Philadelphia • Chicago • Toronto • Washington, D.C.
2 to 8 hours Average weekday: 50‐60% Average weekend: nearly 100%
Young professionals College students Women 30‐55 Elderly Leisure trips more than business trips
BoltBus • New York • Washington, D.C. • Philadelphia • Boston • Baltimore • Greenbelt, MD • Cherry Hill, NJ
2 to 8 hours Min. needed: 50% Avg. weekday: 60% Avg. weekend: 95‐100%
Commuters Leisure trips
Kerrville Bus Company
• Cities in Texas, Arkansas, Louisiana
• Interlines with Greyhound
1 to 9.5 hours Average 56%
Concho Coaches
• San Angelo • Midland • Odessa • Abilene
1.5 to 2.5 hours
1‐3 passengers per trip (in 15‐passenger vans)
Feeder/Local Transit Examples
Interviews were conducted with a few local transit providers in Texas, as well as one of the transit systems in New Mexico that connects with the state’s passenger rail line. Interviews focused on any feeder service or informal connections that these local systems currently provide to intercity modes, existing intermodal facilities, and additional service elements and/or considerations involved with connecting local or regional transit systems to an expanded statewide passenger rail network.
Dallas Area Rapid Transit (DART)
DART provides urban transit service to the Dallas metropolitan area, including 48 miles (39 stations) of light rail, local and express/commuter bus routes, demand‐response shuttles for the

26
general public, and paratransit service for riders with disabilities. DART also jointly operates the Trinity Railway Express commuter rail system in partnership with Fort Worth’s The T and provides feeder service to its light rail and commuter rail stations and transit centers, including a connection to Amtrak at Union Station.
DART provides bus feeder service to its own transit centers and light rail stations, and also to TRE stations. The light rail service and bus service provide feeder service to Union Station, which is an intercity (Amtrak) rail station, as well as a station for TRE. The Greyhound bus depot is also in close proximity to Union Station and to the DART Dallas Central Business District (CBD) West Bus Transfer Center. DART participates in the North Central Texas Council of Governments (NCTCOG) Regional Public Transportation Plan, which includes measures to share facilities and service coordination. Besides sharing facilities with other local and intercity providers, DART shares fare media with TRE and The T.
Corridor characteristics, including current and forecasted rider markets, existing transportation infrastructure, and long‐range transportation plans, are all considered when developing new routes and services. Express bus services are gradually being replaced by light rail service as the rail network expands. Major corridors for future rail service are identified during major updates to the long‐range Transit System Plan every five to ten years. DART often follows Federal Transit Administration (FTA) guidelines for alternatives analysis to select a preferred mode and alignment. Bus feeder plans are developed as rail extensions are planned, and services are restructured to coordinate with the rail openings.
Land use, physical features, route patterns, and DART’s established standards for stop spacing are key factors in selecting bus stop locations. DART also considers the ability to provide amenities, facilitate transfers, or accommodate existing ridership at a potential stop or station location. Potential rail stations may also be evaluated for their likely impacts on surrounding properties; accessibility to drivers, bicyclists and pedestrians, and feeder buses; and potential for economic and transit‐oriented development.
If high‐speed rail or other expanded/enhanced passenger rail service were proposed for the area, DART would review the specifics of the planned service and plan for coordination measures; these could include adding transit capacity and/or adjusting schedules to feed passengers to the new service. Union Station already serves as an intermodal station for bus and rail and would be a logical place for high‐speed rail to connect with the local network.
Capital Area Rural Transportation System (CARTS)
The Capital Area Rural Transportation System provides rural public transit services in the area surrounding Austin (Bastrop, Burnet, Blanco, Caldwell, Fayette, Hays, and Lee Counties, plus the non‐urbanized areas of Travis and Williamson Counties). CARTS’ array of services has been growing and evolving since its beginnings in the 1970s, when it was an aggregation of human‐services transportation providers. CARTS is designated as a rural transit district, and provides fixed‐route city bus service in Bastrop and San Marcos; scheduled and demand‐response

27
community transit services in nine counties; commuter routes from Smithville and Bastrop into Austin; and feeder service to intercity services including Greyhound, Arrow Trailways, Kerrville Bus Company, and Amtrak. It launched two new Metro Connector routes this year that provide direct connections throughout the day to several Capital Metro service locations with frequent train or bus service schedules. There is formal schedule coordination between CARTS’ connector routes and Capital Metro at these stations, with work underway to coordinate fare media between the two providers. CARTS intends to develop similar routes jointly with Capital Metro as funding permits.
Another new service being launched in 2011 is the CARTS Interurban Coach, which will provide scheduled passenger and freight/package service, and ultimately connect all of the region’s urban, rural, and intercity transit services. The Interurban Coach was conceived as a way to provide more effective service both to the general public and to the area’s Medicaid patients. When CARTS was designated as the area’s Medicaid transportation provider, its existing community routes (some of which run only a few times a week) did not provide sufficient flexibility for Medicaid patients needing to get to medical appointments; curb‐to‐curb demand‐response service filled this service need but quickly strained resources. The Interurban Coach will employ frequent schedules connecting large transportation hubs, a model adapted from intercity services as provided by Greyhound Lines, Kerrville Bus Company, and other intercity carriers. This service, though it may prove less convenient for passengers than curb‐to‐curb paratransit service, will provide more frequent and reliable service to larger numbers of people. The paratransit will be available at each end of the trip as needed for customers to complete their trip if it is not made by connecting to other transportation providers. Another goal of the Interurban Coach service is to attract more “choice riders” in the area to transit—people who are looking for alternatives to driving for business or leisure trips and who may wish to connect to other transportation providers in the metropolitan area, including Capital Metro. The routes will provide direct connections to Greyhound and other intercity carriers, and as an interlined service, there will be through ticketing from CARTS to any destination served nationwide. Package and freight service will be incorporated into the service for both regional and national delivery.
CARTS provides most of its service using 25‐ft “cutaway” buses and compares its standardized fleet to the model developed by Southwest Airlines for its 737 fleet. The capital cost for each 25‐ft bus is approximately $100,000. For the new Interurban Coach routes, CARTS has purchased both 25‐ft cutaways that are also equipped to carry packages/freight and 32‐ft low‐floor buses at a cost of $200,000 apiece designed particularly for intercity service. All Interurban Coach buses have a distinctive look that sets them apart from the other CARTS buses; the look is part of the branding for this new transit service, and the low floor enhances accessibility for all passengers.
Service planning is an ongoing challenge because of rapid growth in population and transit demand in the area over the past decade and because of funding limitations. Formula funds for rural transit, set most recently after the 2000 census, have not kept pace with the Austin area’s

28
48‐percent population growth over the last decade, and many other grants and funding programs provide only project‐specific, short‐term funds. CARTS uses demographic and market analysis, origin‐destination studies, and other analyses whenever possible to help plan service; planning studies conducted by the TxDOT Austin District and the Texas Transportation Institute have also contributed to the process. CARTS also maintains communication with city councils and local agencies to determine potential locations for stops and stations.
CARTS has a long history of coordinating with other transportation services throughout the Austin area; over the past five years, CARTS has led the development of intermodal transit facilities in Austin, Round Rock, San Marcos, Bastrop, Smithville, and most recently Georgetown. A seventh station is under construction in Taylor. The Georgetown and Taylor stations were both designed with environmentally friendly features including rooftop solar panels and a wind turbine to generate electricity, a rainwater collection system (collected water will be used to wash buses), and plug‐in stations for electric cars in the customer parking lot. Plans are underway to add some smaller park‐and‐ride stations (about 10 parking spaces each, plus a small shelter) along the Interurban Coach routes to act as additional collection points.
If high‐speed rail comes to the area, connectivity between rail and other modes will be a primary factor for its success. Planning would need to include capital and operating expenses for a bus feeder service that connects a network of strategically placed park‐and‐rides and other passenger collection points to the rail system.
Texoma Area Paratransit System (TAPS)
Researchers were unable to interview a representative from TAPS, but several recently published articles provided information about this provider’s service developments over the past few years. TAPS is a rural transit provider serving six counties in North Texas (Fannin, Grayson, Cooke, Clay, Montague, and Wise). Financial difficulties in 2006 and 2007 threatened the continuation, much less expansion, of the service, but a restructuring of the service and an array of cost‐cutting procedures restored the system’s fiscal stability. TAPS saw increases in ridership in 2009 and acquired 25 new buses (16 procured with federal stimulus funds and nine donated by TxDOT from surplus vehicles in Collin County) to expand transit service in the region. In 2009, TAPS began its first intra‐urban fixed routes, supplementing the 15,000 to 16,000 monthly trips it provides in demand‐response service. The two fixed routes, named the Roo Route and the Viking Route after mascots of the two local colleges, operate as general‐public shuttles in their respective cities (Sherman and Denison) and provide free transit for college students and accessible service for elderly and disabled passengers. TAPS’ Tex Express commuter bus provides feeder service from Grayson County to the Plano DART station five days a week. (22, 23)
Santa Fe Trails
Santa Fe Trails is among the urban and rural bus services that provide connecting service to the New Mexico Rail Runner along its route.

29
Three of the routes operated by Santa Fe Trails connect to the Rail Runner at Santa Fe’s South Capitol transit station. The routes’ arriving and departing schedules all coordinate with the Rail Runner’s arrival at the station, and Rail Runner passes also act as a day pass on Santa Fe Trails. This coordination has resulted in some significant crossover ridership between the two systems (nearly 6,000 riders transferred from Rail Runner to Santa Fe Trails in September 2010) and an overall increase in Santa Fe Trails ridership during the last two or three years, even as service levels had to be reduced because of funding cuts. A city‐operated park‐and‐ride shuttle also serves the Rail Runner station; in September of 2010 that shuttle provided 6,728 trips, most of them taking riders to board the Rail Runner.
Santa Fe Trails also connects with the North Central Regional Transit District (rural system) at two stops in the city, and with the Northern New Mexico Park‐and‐Ride intercity bus system at the Rail Runner station and at another station downtown. The Northern New Mexico Park‐and‐Ride, operated by the state department of transportation (DOT), provides commuter service from Santa Fe to Las Vegas (New Mexico), Los Alamos, and Espanola; a similar park‐and‐ride route once operated along the Albuquerque‐Santa Fe corridor, before it was replaced with Rail Runner service.
Coordinating with passenger rail has been a mostly positive experience for Santa Fe Trails. Challenges have included accommodating Rail Runner’s schedule changes, sometimes on short notice, and finding funds to provide connecting service. When Santa Fe Trails first started, there was an expectation that the local communities would provide funding for the service; the council of governments provided bridge funds for start‐up until a local referendum was passed to provide ongoing funding for transit in the city.
Lessons Learned—Providing and Connecting to Intercity Bus/Rail
Despite the wide range of transit system sizes and modes that were represented in the interviews, many of the concerns and experiences discussed were similar. Attracting ridership and managing services cost‐effectively are key issues for both publicly funded and private‐sector providers. Concerns about competition from other modes and providers are common to all the respondents, yet all recognize the importance of connectivity among modes and providers. This section summarizes some of the challenges and lessons learned that emerged from the transit provider interviews.
Connectivity
To be viable, the future transportation network needs to be convenient, easy to use, and relatively inexpensive to ride (and therefore relatively inexpensive to operate). For transit, intermodal cooperation and connections are a large part of making passenger convenience a reality. While coordination with other transit services, both formal and informal, is an ongoing activity for most of the providers interviewed, true intermodal connectivity requires infrastructure and ongoing planning, both of which can be expensive.

30
Providers emphasized the importance of safe, convenient intermodal connections in attracting riders to transit, regardless of mode. Intermodal facilities should be able to accommodate passenger transfer movements and ticket vending/payment. If high‐speed rail comes to Texas, it will be important for rail service to serve existing intermodal hubs, such as Dallas’ Union Station, that already have well‐established and well‐equipped intermodal connections; a network of intermodal stations and park‐and‐rides will also be needed to bring riders from outlying areas to the rail line.
Connectivity also relies on coordinated schedules between providers (unless service is of such high frequency that wait times for transfers are generally short). The burden of coordinating schedules often falls on the transit system that is providing feeder service to a larger, higher‐capacity system; e.g., a local provider connecting to intercity bus or passenger rail generally is the one to match its schedules to the needs of the larger provider. However, for this coordination to work well, the intercity provider needs to provide its feeder service(s) with adequate advance notice (weeks or months ahead if possible) of schedule changes. Where two providers serve similar routes and markets, coordination between the providers may provide an opportunity to provide higher frequencies and more options for riders, rather than to compete for ridership.
Attracting Ridership
As discussed above, good connections tend to boost ridership both on intercity and local transit. Other selling points that attract choice riders to transit (i.e., away from personal vehicles or air travel) include onboard comfort and amenities and frequent, on‐time service. The “luxury coach” style of transit vehicle adopted by Megabus and BoltBus (followed by Greyhound and several of the local and regional providers) is modeled after upscale commuter rail cars, which studies have found are more positively regarded by potential riders than traditional buses. (24) High‐frequency, city‐to‐city schedules, another hallmark of Megabus/BoltBus intercity service, is also being adopted by Greyhound on many of its routes; CARTS’ new Interurban Coach service is a similar concept at the local level.
There is mixed information about the effect of trip length on transit mode share. Data from the Government Accountability Office in 2003 demonstrated a clear link between Amtrak mode share and trip length, with the mode share for rail (as compared to air travel) dropping off sharply for trips of four or more hours’ duration. (25) However, both Megabus and BoltBus report their highest ridership on routes that are four to eight hours long. Part of this may be due to lower prices in comparison to Amtrak; part may be due to the increasing inconvenience of air travel (since Amtrak’s ridership is also rising).
Marketing and ticket sales are another crucial element for building ridership. Online sales and advertising are the backbone of Megabus’ and BoltBus’ marketing, a medium that has helped these providers attract riders ranging from students and young professionals to senior citizens. Greyhound, which has traditionally sold tickets through on‐site agents, is expanding its online

31
presence. Public transit branding—with targeted public outreach, (sometimes) distinctive‐looking vehicles, and bus stop amenities—is being explored by several public transit providers in Texas and elsewhere to promote transit as an attractive mode for travelers who have other transportation options available to them.
Costs and Revenues
In addition to being a marketing tool, online ticketing is one of the biggest cost savers for Megabus and BoltBus. Greyhound is expanding its own online ticket sales and is exploring the option of automated kiosks for ticket sales at terminals.
Building and maintaining transit terminals are another set of costs that the “curbside” buses have avoided from the beginning (though BoltBus, for instance, has provided smaller‐scale amenities at some of its bus stops); Greyhound and its subsidiaries have become more interested in leasing space in a terminal owned by someone else rather than owning a facility.
Adding routes or increasing frequency of service is limited by cost for most of the public transit and smaller private providers, especially for providers with relatively small fleets of vehicles. In fact, for many small urban and rural transit providers, too much success in building ridership can easily mean more demand than they are equipped to handle. This limitation applies to feeder service as well; adding service to intercity hubs is costly for many local areas.
Besides passenger service, several of the intercity and local/regional transit services interviewed provide package/freight service. This generates additional revenue (in at least one provider’s case, the revenues from freight generally exceed passenger ticket revenues).
Chapter 5—Intercity Travel Corridors in Texas
Eighteen travel corridors were identified and analyzed for the TxDOT‐sponsored passenger rail study, to identify those that may need added intercity transit capacity in the future. Analysis and ranking of the corridors were based upon several factors:
• current and future population and demographic projections along 18 intercity corridors in the state;
• projected future travel demand based on forecasts by the Texas State Demographer and other state agencies; and
• current transportation network capacity and routes for intercity highway, bus, air, and rail travel.
Passenger Rail Study: Travel Corridors
Table 3 lists the corridors evaluated in the passenger rail study. The map in Figure 2 is a graphical representation of the relative sizes and distances of the population centers, or Core Based Statistical Areas (CBSAs), along each corridor. CBSAs are designated by the federal Office

32
of Management and Budget; each consists of a city of 10,000 or more people, plus nearby smaller towns and unincorporated areas whose populations regularly travel to the larger cities. CBSAs were used as the basis for the population and demographic information used in the corridor analysis.
Table 3. Travel Corridors Identified in TxDOT‐Sponsored Rail Study. (Error! Bookmark not defined.)
Corridor Reference Number
Name
Corridor Description
Roadway(s)
Length
1 AMALBB Amarillo to Midland‐Odessa via Lubbock I‐27, US 87, TX 349 2452 DFWABI Dallas/Fort Worth to El Paso via Abilene I‐20, I‐10 6213 DFWAMA Dallas/Fort Worth to Amarillo via Wichita Falls US 287 3624 DFWHOU Dallas/Fort Worth to Houston I‐45 2525 DFWLBB Dallas/Fort Worth to Lubbock via Abilene I‐20, US 84 3316 DFWLOU Dallas/Fort Worth to Louisiana Border I‐20 1837 DFWSAT Dallas/Fort Worth to San Antonio I‐35 2678 DFWSNA Dallas/Fort Worth to El Paso via San Angelo US 377, US 67,
I‐10 648
9 DFWTXK Dallas/Fort Worth to Texarkana I‐30 19010 HOUAUS Houston to Austin US 290 16311 HOUBMT Houston to Beaumont I‐10 8712 HOUBVN Houston to Brownsville via Corpus Christi US 59, US 77 36413 HOUSAT Houston to San Antonio I‐10 19914 HOUTXK Houston to Texarkana US 59 30715 HOUWAC Houston to Waco via Bryan/College Station US 290, TX 6 18416 SATBVN San Antonio to Brownsville via Corpus Christi I‐37, US 77 28017 SATELP San Antonio to El Paso I‐10 63618 SATLRD San Antonio to Brownsville via Laredo I‐35, US 83 349

Figure 2. Relative Size and Distance of Texas Population Centers along Study Corridors. (20) Color image can be viewed at http://utcm.tamu.edu/publications/final_reports.stm#higg53.
Travel Demand and Transit Service—Selected Texas Regions
To collect information about the current intercity, regional, and local transit services, intermodal facilities, and transit coordination efforts in selected regions of the state, interviews were conducted with public transportation coordinators (PTCs) at several of TxDOT’s district offices, with MPO staff, and with local and regional transit providers serving the areas. Additional information was collected from planning documents, feasibility studies, news articles, and agency websites.
Regions of particular interest included major population areas along the travel corridors identified in the preceding section. Interviews were conducted with PTCs from the Midland‐Odessa, San Angelo, and Lubbock Districts in West Texas; Amarillo and the Panhandle; and Pharr‐Brownsville in the southern end of the state. PTCs from TxDOT districts serving some of the urban areas likely to be hubs in a future statewide passenger rail system (Dallas‐Fort Worth, Waco, and Houston) were also interviewed.
33

34
Midland‐Odessa
The Midland‐Odessa area has seen an increase in transit demand since the economic boom in the local oil and gas industry began in 2007. Commuter travel between the cities of Midland and Odessa accounts for 10,000 trips per day, and a feasibility study conducted in the region in 2009 found that there is a demand for intercity transportation connecting the outlying rural areas into the two cities as well. The public perception about transit services in the region is beginning to change; traditionally, the rural and intercity transit services in this area were regarded as being for the use of elderly, disabled, and disadvantaged passengers only. Now, there is a growing awareness that there are available and expanding transit services that provide travel options for the general public.
Transit providers throughout the West Texas region have a long history of coordinating their operations and services on an informal basis, and coordination has expanded significantly in recent years. Within the Midland‐Odessa area, the MPO and the local transit provider EZ Rider (which up to now have operated as two separate, non‐connecting urban systems within Midland and Odessa, respectively) recently initiated a partnership with the intercity provider All Aboard America (AAA) to provide a transit connection between the two cities.
Intermodal facilities. Several intermodal facilities are planned and/or under construction or renovation for the area. Locations include the Midland Airport (halfway between Midland and Odessa), Fort Stockton, Marfa, and Presidio.
Intercity services. All Aboard America, Greyhound, and the Kerrville Bus Company provide intercity bus services to and from the Midland‐Odessa area. Potential also exists for passenger rail service to this area; the MPO has been approached by the Union Pacific Railroad regarding both passenger and freight service, and light rail is being considered as part of the MPO’s long‐range transportation plan.
Regional/feeder services. In addition to the EZ Rider urban systems in Midland and Odessa, the West Texas Opportunities Permian Basin Regional Transit District provides rural transit service within this region. The various rural transit providers in West Texas are expanding coordination of services and marketing transit to the general public. Part of this marketing/outreach effort is branding the various transit services throughout the West Texas region under the common name “TRAX.” Coordinated scheduling and a planned one‐stop information website are key elements of the region‐wide effort to expand transit service and mobility in West Texas.
Primary rider demographics. Elderly/disabled riders making trips for medical appointments have been a long‐standing transit demographic in this area. With the recent developments in transit facilities and coordination, commuters and students are two new demographics that could become significant markets for transit services.
In‐demand destinations. In addition to the anticipated link between Midland and Odessa, in‐demand destinations in this area will likely include Big Bend, Presidio, Marfa, Fort Stockton,

35
Pecos, Van Horn, Sierra Blanca, and El Paso. Anticipated transit hubs in the area include Lubbock, San Angelo, and Abilene.
San Angelo
Demand for intercity transit has declined slightly in recent years, but coordination continues to increase among the urban, rural, and intercity providers. A multimodal terminal is being built that will be served by Concho Valley Transit (urban and rural services), City and Rural Rides (CARR), Concho Coaches, and the Kerrville Bus Company, as well as taxi services. It is hoped that the terminal will help to increase demand for intercity and other transit services by increasing convenience and public awareness of the services.
Intermodal facilities. In September 2010, contractor bids were being solicited for the planned multimodal terminal in San Angelo, which will serve rural, urban, and intercity transit as well as taxi services.
Intercity services. Concho Coaches provides passenger and package service to Abilene and to the Midland‐Odessa airport. The Kerrville Bus Company travels north to Lubbock and south to Kerrville and San Antonio.
Regional/feeder services. Concho Valley Transit serves the city of San Angelo and the surrounding rural areas.
Primary rider demographics. Military personnel traveling to and from Goodfellow Air Force Base, students at Angelo State University, and elderly riders make up the three primary intercity transit demographics for this area. Most of the elderly intercity riders are making general trips (errands, etc.) rather than medical trips.
In‐demand destinations. The Dallas‐Fort Worth Metroplex is likely to see increased demand as a travel destination from San Angelo.
Lubbock
Lubbock is one of the larger cities in West Texas, with a population of over 220,000 people. Because of its size, Lubbock is a destination for people coming from surrounding rural areas and from nearby cities including Midland and Odessa. The demand for intercity transit has been increasing slightly in recent years, particularly when Texas Tech University (in Lubbock) and South Plains College (in Levelland) are in session. Lubbock’s urban and rural transit providers have a history of informal coordination with other transit operators in the western half of the state, including transit providers based in Amarillo, El Paso, Brownwood, and Childress. An effort is underway to implement scheduling software for each of the local providers and to make sure the various scheduling systems will be compatible, to facilitate passenger transfers from one system to another. One challenge for public transit in West Texas is the lack of public awareness about the availability of transit services; urban ridership on Lubbock’s Citibus has

36
begun to increase, but many people still do not know how to travel out of Lubbock on transit. Citibus and South Plains Area Rural Transportation (SPARTAN) rural public transportation are part of the region‐wide TRAX transit branding and rider‐training program and, among other outreach efforts, are promoting Google Transit as a transportation information source.
Intermodal facilities. Greyhound and Citibus share a facility in Lubbock. Lubbock’s downtown transit plaza is under renovation; when finished, the plaza will accommodate Greyhound passenger and package service as well as SPARTAN, and will include bus driver break areas, bus maintenance facilities, and restaurants for passengers. Railroad tracks are close to the downtown plaza as well. South Plains Community Action has a rural transit facility that has been renovated and has room for further expansion if needed to accommodate additional transit providers.
Intercity services. Greyhound serves downtown Lubbock, as well as the cities of Brownfield, Denver City, Levelland, and Plainview.
Regional/feeder services. South Plains Community Action provides service from surrounding rural areas into Lubbock. Lubbock is also a destination for rural providers from elsewhere in West Texas, including CapTrans, West Texas Opportunities, and Panhandle Community Services, Inc.
Primary rider demographics. Currently, most transit trips in the Lubbock area are taken for medical appointments or by students traveling to and from Texas Tech and college campuses in Levelland and South Plains. With increased coordination among transit providers and expanded public outreach, intercity transit trips will become a more viable option for area residents.
In‐demand destinations. From the Lubbock area, the highest‐demand destinations are likely to include Dallas‐Fort Worth, Austin, El Paso, Albuquerque, Santa Fe, Oklahoma City, and Tulsa.
Amarillo/Panhandle
Amarillo is seeing a growth in intercity transit ridership since the national economic downturn, particularly along the Amarillo‐Lubbock corridor. The urban and rural providers in the area both serve the general public and coordinate with each other within the region; at this time Greyhound is the only intercity provider.
Intermodal facilities. There is a Greyhound station in Amarillo, but it is too old and too small to effectively serve as an intermodal terminal.
Intercity services. Greyhound provides service to Albuquerque and Oklahoma City, as well as to Lubbock and to Dallas‐Fort Worth via Wichita Falls.
37
Regional/feeder services. Panhandle Community Services provides rural transit service throughout the Panhandle but currently has no formal coordination with the Greyhound intercity service.
Primary rider demographics. Elderly riders are the biggest transit market for local services; demographics are unknown for intercity services.
In‐demand destinations. Lubbock and Dallas are in highest demand, especially for medical trips.
Pharr/Brownsville
Intercity and international transit demand has increased in recent years. Coordination among providers has been somewhat lacking, with gaps in service between McAllen, Brownsville, and South Padre Island. Getting different services to work together is a challenge, but progress is being made, and coordinated efforts would go a long way toward addressing mobility in this part of the state. Valley Transit, which provides intercity service as part of the Greyhound network, has reduced its intercity service in the area, so the need for intercity links has become even greater.
Intermodal facilities. An intermodal transit center is under construction in Brownsville and is expected to fuel demand for transit service on both sides of the border.
Intercity services. Valley Transit/Greyhound and some Mexico‐based bus companies are the main intercity providers for the area.
Regional/feeder services. Rio Metro (Lower Rio Grande Development Council) operates five intercity routes in partnership with Valley Transit and McAllen Express Transit. The Harlingen Express, the Brownsville Urban System (BUS), and McAllen Express Transit provide services within their respective cities.
Primary rider demographics. Elderly/medical, students, and low‐income workers are the primary markets for public transit in general. Veterans need transportation to San Antonio.
In‐demand destinations. High‐demand corridors include McAllen to Edinburgh and Mission, Cameron County to Harlingen, Harlingen to South Padre Island, McAllen to Rio Grande City, and McAllen to Laredo.
El Paso
Demand for intercity transit has increased in recent years, due largely to the struggling economy and rises in fuel prices. However, outside of the city of El Paso and El Paso County, transit service is limited throughout this large six‐county region. No local transit service currently operates in Brewster, Culberson, Hudspeth, Jefferson Davis, or Presidio Counties. El Paso is closer to the Mexican city of Juarez and to several cities in New Mexico than it is to most cities in Texas, and likewise many of its intercity transportation needs cross state and national
38
borders. Transit coordination in the area has increased over the past few years, both within El Paso County and between El Paso and New Mexico. Currently TxDOT has a contract agreement with El Paso County and the New Mexico DOT to provide park‐and‐ride bus service from El Paso and Anthony, Texas, to Las Cruces, New Mexico. The New Mexico DOT contracted with All Aboard America to provide this service.
Within the city of El Paso, Sun Metro provides fixed‐route transit service and shares an intermodal station with Greyhound.
Intermodal facilities. The Union Plaza Transit Terminal, the Oregon Street Transit Mall, and the San Antonio Transit Plaza currently serve local bus routes and will become part of Sun Metro’s proposed bus rapid transit network. Sun Metro buses also stop close to Amtrak’s Union Depot in El Paso, though there is no shared facility.
Intercity services. Amtrak’s Sunset Limited route serves Alpine and El Paso. El Paso is also a stop for Amtrak’s Thruway bus service heading north to Albuquerque, New Mexico. Greyhound operates along the I‐10 corridor with stops in Alpine, El Paso, Marfa, Presidio, and Van Horn. All Aboard America/Industrial Bus Lines, Inc., provides limited intercity service from Midland‐Odessa to Fort Stockton, Marfa, Presidio, and Alpine.
Regional/feeder services. Sun Metro provides service within the city limits of El Paso. El Paso County Transit operates rural public transportation for the cities, towns, and colonias in El Paso County, including five fixed routes connecting non‐urbanized areas of El Paso County to the city of El Paso.
Primary rider demographics. Commuters into and out of El Paso are a primary market for intercity transit services. Residents of Brewster, Jefferson Davis, and Presidio Counties must travel to the Midland‐Odessa area for many medical services.
In‐demand destinations. There is current and likely will continue to be demand to link rural areas in Brewster, Culberson, Hudspeth, Jefferson Davis, and Presidio Counties into El Paso. Las Cruces and other areas of New Mexico are also likely destinations.
Dallas‐Fort Worth
Transit demand from outlying cities and counties into Dallas‐Fort Worth has been increasing in recent years, and transit providers and transportation coordinators in the region predict that demand will continue to increase in the near future. Major transit markets in this region include commuters and people traveling to medical appointments; students and recreational or other non‐commute travelers are smaller but still significant market segments. Coordination among the various transit providers in north central Texas (the Dallas‐Fort Worth Metroplex and surrounding counties) has remained static or increased somewhat in the past five years, depending on the particular agencies involved in each coordination arrangement. Several of the small urban, rural, and elderly/medical transportation providers in the region (e.g.,

39
Arlington Transit, the Texoma Area Paratransit Service, the Denton County Transportation Authority [DCTA], Cletran, Mental Health/Mental Retardation Services (MHMR) of Tarrant County, the Northeast Transportation Service, and others) provide connections to DART in Dallas, The T in Fort Worth, and/or TRE; DART’s bus and light rail services also make connections to Amtrak at Union Station, and a Greyhound bus depot is nearby.
Intermodal facilities. DART light rail transit (LRT) shares Union Station with the TRE and Amtrak services as mentioned above. The T, TRE, and Amtrak share the Fort Worth Intermodal Terminal. Victory Station is shared by DART LRT and TRE. DART will share the Trinity Mills Station with the DCTA A‐Train in 2011, as well as the rail corridor (on a separate track, due to differences in DART and DCTA vehicles). Express commuter bus service provided by TAPS provides service from Sherman‐Dennison to the DART Parker Road LRT Station. Intercity services. Trinity Railway Express provides commuter rail service connecting Dallas, Arlington, and Fort Worth. Amtrak and Greyhound, along with several Mexico‐based intercity bus companies, provide intercity service connecting the region to other parts of the state as well as to Oklahoma, Arkansas, and Louisiana.
Regional/feeder services. DART, The T, Cletran, Arlington Transit, TAPS, DCTA, Handitran, and Collin County Area Regional Transit are regional/feeder services.
Primary rider demographics. Primary riders are commuters, elderly/medical, students, and recreational travelers.
In‐demand destinations. In‐demand travel is between Dallas and Fort Worth; travel to Dallas‐Fort Worth from surrounding cities/counties including Grand Prairie, Mesquite, Richardson, Plano, Arlington, Flower Mound, Burleson, Cleburne, and Joshua; and longer trips to and from Abilene, Stephenville, Tyler, and Longview.
Waco
Transit ridership in general has stayed relatively steady during the past two years. Waco Transit and the Workforce Commission partnered to provide a Job Access and Reverse Commute (JARC) route that provides transportation to several employers in the Waco area; this route struggled to gain ridership at first, and then grew and has recently leveled off. Waco Transit (the urban transit system) and the Heart of Texas Rural Transit District (HOTRTD) are well coordinated, and are currently working on implementing a centralized scheduling and dispatching office, which will almost merge the two systems; when this is complete, passengers will experience a nearly seamless system. Another goal is a common fare medium for both systems, though because of the multiple contractors operating the rural service (each with a slightly different cost structure), this may be several years off. Marketing transit services is a primary challenge here, similar to the experience in other areas of Texas; the general public in small urban and rural areas tends to view transit services as being primarily or exclusively for elderly and disabled populations.

40
Intermodal facilities. The Waco intermodal facility serves Waco Transit, HOTRTD, and Greyhound.
Intercity services. Greyhound serves Waco at the downtown intermodal station; Amtrak has a stop in MacGregor, approximately 10‐15 miles west of Waco.
Regional/feeder services. Waco Transit does not coordinate its route schedules with Greyhound, but most Waco Transit routes arrive hourly at the downtown intermodal station. HOTRTD similarly does not formally coordinate scheduling with intercity services but will schedule a demand‐response trip for a rider who needs to board Greyhound at the station.
Primary rider demographics. The largest local transit demographic is still elderly riders needing transportation for medical appointments. High school students are one of the new local rider demographics, specifically high school seniors who are also commuting to the local junior college for dual‐credit courses.
In‐demand destinations. The most in‐demand destinations are north and south on I‐35, including locations in Dallas and the Scott and White medical center in Temple.
Houston
Demand for transit is increasing throughout the Houston area, both within the city and from the surrounding cities and counties. The Houston Medical Center and sports events are two draws for transit ridership at the local‐regional level. The TxDOT‐wide emphasis on transit coordination has helped to expand coordination among various rural providers operating in the Houston area, which has helped to fill some gaps in rural service areas and hours. Harris County RIDES coordinates numerous subcontractors that provide medical transportation and has similarly helped to fill gaps in service that the Metropolitan Transit Authority of Harris County (METRO) cannot cover. There is currently no formal coordination between the various rural services and either METRO or Greyhound; several METRO buses have stops that are close to Greyhound stations, but the city and intercity providers do not share facilities or coordinate schedules at this time.
Intermodal facilities. The Houston Amtrak station is also served by Greyhound Lines, and the Kerrville Bus Company operates out of the Houston Greyhound Station on Main Street. The proposed Houston Intermodal Transit Center is intended to eventually replace the downtown Amtrak station and to be served by intercity and local bus services as well as commuter and passenger rail.
Intercity services. Greyhound, the Kerrville Bus Company, and Amtrak provide intercity service in and out of Houston.
Regional/feeder services. Brazos Transit and Fort Bend County Transit bring commuters and others into Houston from outlying counties.

41
Primary rider demographics. Commuters, elderly/disabled passengers, and students all are significant transit demographics.
In‐demand destinations. In‐demand areas are surrounding cities and counties, especially for commuters. With expanded transit options, particularly better regional/intercity transit service, employment boundaries between Houston‐Galveston, Conroe, Sealy, and other Gulf Coast area cities could all but disappear.
Chapter 6—System Cost Considerations
This chapter summarizes cost considerations related to the implementation and operation of an intercity bus service. Cost information is always a difficult endeavor because of the sensitive nature of the information for private carriers. Where possible, the information comes from documented data located in the literature reviewed for this project. Additionally, a limited amount of cost information was collected through the interviews with carriers and local officials.
Previous Research Projects’ Cost Information
Two previous projects performed by research team members provide some cost‐related data pertinent to this project. The following sections discuss these previous efforts.
TxDOT Project 0‐5930
TxDOT Project 0‐5930 examined costs of intercity or regional passenger transit systems. It was not an exhaustive list of project costs but was meant to show the wide range of costs between similar project types. The following tables from Project 0‐5930 show some example costs that relate to the objectives of this study. Table 4 shows example total costs of recently developed or proposed passenger rail projects.
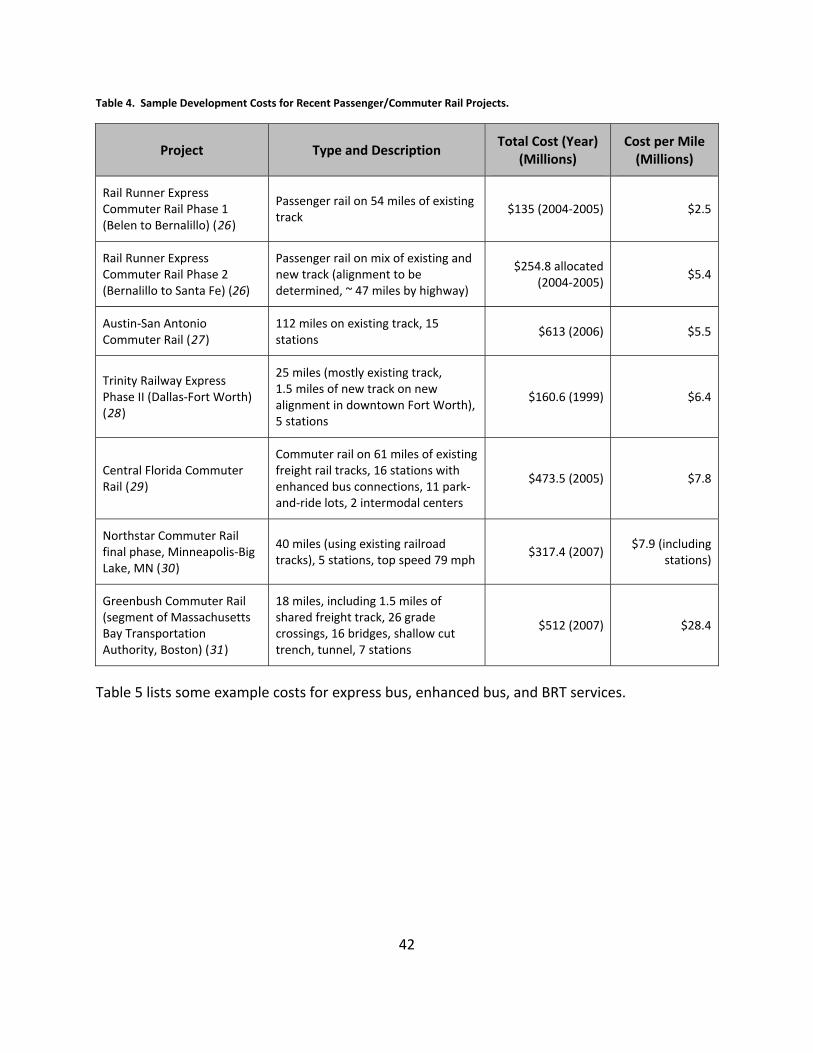
42
Table 4. Sample Development Costs for Recent Passenger/Commuter Rail Projects.
Project Type and Description Total Cost (Year) (Millions)
Cost per Mile (Millions)
Rail Runner Express Commuter Rail Phase 1 (Belen to Bernalillo) (26)
Passenger rail on 54 miles of existing track
$135 (2004‐2005) $2.5
Rail Runner Express Commuter Rail Phase 2 (Bernalillo to Santa Fe) (26)
Passenger rail on mix of existing and new track (alignment to be determined, ~ 47 miles by highway)
$254.8 allocated (2004‐2005)
$5.4
Austin‐San Antonio Commuter Rail (27)
112 miles on existing track, 15 stations
$613 (2006) $5.5
Trinity Railway Express Phase II (Dallas‐Fort Worth) (28)
25 miles (mostly existing track, 1.5 miles of new track on new alignment in downtown Fort Worth), 5 stations
$160.6 (1999) $6.4
Central Florida Commuter Rail (29)
Commuter rail on 61 miles of existing freight rail tracks, 16 stations with enhanced bus connections, 11 park‐and‐ride lots, 2 intermodal centers
$473.5 (2005) $7.8
Northstar Commuter Rail final phase, Minneapolis‐Big Lake, MN (30)
40 miles (using existing railroad tracks), 5 stations, top speed 79 mph
$317.4 (2007) $7.9 (including
stations)
Greenbush Commuter Rail (segment of Massachusetts Bay Transportation Authority, Boston) (31)
18 miles, including 1.5 miles of shared freight track, 26 grade crossings, 16 bridges, shallow cut trench, tunnel, 7 stations
$512 (2007) $28.4
Table 5 lists some example costs for express bus, enhanced bus, and BRT services.

43
Table 5. Sample Development Costs for Express Bus, Enhanced Bus, and BRT Services.
Project Type and Description Total Cost (Year) (Millions)
Cost per Mile (Millions)
Rapid 522 service, Santa Clara County (32)
Express bus, precursor to BRT service, 26 miles, transit signal priority, queue jump lanes, low‐floor buses
$3.5 (2005) $0.13 total
Kansas City Metcalf/ Shawnee Mission Pkwy. (33)
Express bus on Metcalf Avenue in Kansas City, 15 route miles, mixed traffic operation with signal priority
$21 to build
$2/year to operate $1.4
Georgia Regional Transportation Authority Regional Transit Action Plan, regional express bus (34)
Regional express bus expansion for 13 counties (37 routes) by 2010 in Atlanta area. Buses operate on existing HOV lanes. Total daily revenue miles for all routes: 24,000.
$325 (2003)
(estimated development costs)
n/a
GRTA Regional Transit Action Plan, BRT system (34)
BRT: 139 route miles of high‐speed busways, 261 miles of arterial bus priority projects, unspecified number of stations/stops
$5000 (2003) $12.5
East Bay BRT, San Francisco (35)
BRT: 17 miles, 85% on dedicated bus lanes; signal priority; 49 stations—total cost estimates as of Sept. 2008
$199 (2008)
$234.6 (Year of Expenditure (YOE)) 2009‐2015)
$11.7 (2008)
$13.8 (YOE)
Table 6 lists some sample costs for construction of new rail and bus transit centers and improvements to existing transit centers, park‐and‐ride facilities, and bus stops. Table 7 shows some typical costs for vehicles for rail and bus transit services.

44
Table 6. Example Costs for Stations, Terminals, Park‐and‐Rides, and Bus Stops.
Project Type and Description Total Cost (Year)
(Millions)
Cost per Stop/Station, Unless Otherwise Noted
(Millions)
Parking Facilities
U.S. 90A Corridor Rail Feasibility Study (36)
Estimated cost for park‐and‐ride spaces (surface lot)
n/a $0.004/space
U.S. 90A Corridor Rail Feasibility Study (36)
Estimated cost for park‐and‐ride spaces (parking structure)
n/a $0.01/space
Express Bus capital costs (estimated), Contra Costa County (33)
Estimated cost for addition of 3,000 park‐and‐ride spaces over four corridors (surface or garage to be determined)
$63‐123 (2002) $0.021‐$0.041/space
California Intercity Rail Capital Program (2004) (36)
Construction of three parking structures along rail line, total of 1,587 spaces
$30.7 (2004) $8.8‐11.5 per structure
~$0.02/space
Station/Stop Improvements
Express Bus capital costs (estimated), Contra Costa County (33)
Improvements to 16 bus stops $0.32‐0.48 $0.02‐$0.03
Central and Southern Marin Transit Study (Marin County, CA) (34)
Facilities for 16 express bus stops $1.008 $0.045
California Intercity Rail Capital Program (2004) (36)
Construct access facilities for new station
$0.8 (2004) $0.8
Amtrak Station renovations (36)
Rehabilitate 3 historic stations in Kansas, New Mexico, Oklahoma
$3.54 (2004) $1.18
Amtrak Station renovations (36)
Rehabilitate historic station, ticket office, waiting room
$1.6 (2004) $1.6
California Intercity Rail Capital Program (2004) (36)
Station improvement including 300‐space parking structure, passenger shelters, benches, lighting
$4.4 (2004) $4.4
California Intercity Rail Capital Program (2004) (36)
Track and platform improvements at existing station
$4.9 (2004) $4.9

45
Table 6. Example Costs for Stations, Terminals, Park‐and‐Rides, and Bus Stops (Continued).
Project Type and Description Total Cost (Year)
(Millions)
Cost per Stop/Station, Unless Otherwise Noted
(Millions)
Station/Terminal Construction
East Bay BRT, San Francisco (37)
Construction of 49 BRT stations $38.1
$45.3 $0.78‐$0.92
U.S. 90A Corridor Rail Feasibility Study (36)
Estimated cost of new at‐grade transit center
$0.9 (2004) $0.9
Harris County Freight Rail Grade Crossing Study (36)
Construction of new station (estimate)
n/a $1.1 (2004)
U.S. 90A Corridor Rail Feasibility Study (36)
Estimated cost of new at‐grade transit center with pedestrian overpass
$1.9 (2004) $1.9
Rail Runner Express Commuter Rail Phase 1 (Belen to Bernalillo) (26)
Construction of 7 stations $18 (2004‐
2005) $2.6
Rail Runner Express Commuter Rail Phase 2 (Bernalillo to Santa Fe) (26)
Construction of 3 new stations plus improvements to existing station (additional parking, pedestrian facility)
$16.5 (2004‐2005)
n/a
North Carolina Railroad Station in Kannapolis (36)
Construction of new station $2.67 (2004) $2.67
Austin‐San Antonio Commuter Rail (27)
Construction of 14 stations $42 (2004) $3.0
U.S. 90A Corridor Rail Feasibility Study (36)
Estimated cost of new elevated transit center
$3.44 (2004) $3.44
California Intercity Rail Capital Program (2004) (36)
Construction of new rail station (including parking)
$4.6 (2004) $4.6
California Intercity Rail Capital Program (2004) (36)
Construction of new rail station (including parking and realignment of existing track)
$6.0 (2004) $6.0
North Carolina Railroad multimodal terminal in Durham (36)
Construction of multimodal terminal (rail, intercity and local bus, taxi) in existing warehouse building along existing tracks
$10‐12 (2004) $10‐12
North Carolina Railroad multimodal terminal in Charlotte (36)
Acquire 27 acres, construct multimodal terminal (conventional rail, high‐speed rail, local and regional bus, bicycle/pedestrian traffic), realign existing tracks
$110‐207 (2004)
$110‐207

46
Table 7. Example Costs for Vehicles/Rolling Stock (Bus and Rail).
Project Type and Description Total Cost (Year) (Millions)
Cost per Vehicle (Millions)
No project named: summary information (32)
Typical prices for 40‐45‐ft conventional or stylized standard bus
$0.30‐$0.40 (2005)
Typical prices for 60‐ft conventional or stylized articulated bus
$0.50‐$0.95 (2005)
Typical prices for 60‐80‐ft specialized BRT bus
$0.95‐$1.6 (2005)
Express Bus capital costs (estimated), Contra Costa County (33)
Purchase of 103 buses $36.7‐$44.8 (2002) $0.36‐$0.43
California Intercity Rail Capital Program (2004) (36)
16 bi‐level cars (5 coach‐baggage cabs, 7 coaches, 3 coach‐cafés, 1 custom‐class car)
$20.4 (2004) $1.3
California Intercity Rail Capital Program (2004) (36)
6 locomotives $12.1 (2004) $2.0
Rail Runner Express Commuter Rail Phase 1 (Belen to Bernalillo) (26)
10 rail cars $22
(+ $0.9 option for spare parts)
$2.2
5 locomotives $11.5
(+$0.6 option for spare parts)
$2.3
Rail Runner Express Commuter Rail Phase 2 (Bernalillo to Santa Fe) (26)
12 rail cars, 4 locomotives $36.1 $2.3
Altamont Commuter Express (new vehicle purchase) (34)
4 bi‐level trailer cars $8.4 (2007) $2.1
Austin‐San Antonio Commuter Rail (27)
Initial service: 6 trains, each with (a) 2 coaches and 1 locomotive or (b) 2 bi‐level self‐powered vehicles (diesel multiple units)
$102 (initial service)$122 (full service)
(both 2004)
$10.2/train$3.4‐$5.1/vehicle, depending on type
selected Harris County Freight Rail Grade Crossing Study (36)
Estimated cost of commuter passenger car
$2.0 (2004) $2.0
U.S. 90A Corridor Rail Feasibility Study (36)
Estimated cost of cab car for commuter rail
$1.9 (2004) $1.9
U.S. 90A Corridor Rail Feasibility Study (36)
Estimated cost of coach car for commuter rail
$1.5 (2004) $1.5
U.S. 90A Corridor Rail Feasibility Study (36)
Estimated cost of DMU double‐deck trailer with cab
$2.9 (2004) $2.9

TxDOT Project 0‐4723
TxDOT Project 0‐4723 examined state‐supported intercity passenger rail programs around the United States. Most of the cost information contained within this report focuses on intercity passenger rail. As with the findings in Project 0‐5930, the costs vary greatly over a wide array of project types, which makes it difficult to estimate general unit costs.
In the study it was found that California has a long history of funding intercity passenger rail projects. Table 8 provides some sample cost‐per‐mile indices found in the literature focused on California’s efforts.
Table 8. Sample Cost‐per‐Mile Indices by Project Type for California Intercity Capital Program. (38)
47

48
Among the other costs, the Project 0‐4723 report includes costs for construction or rehabilitation of stations. These values are considered very pertinent for this project. Table 9 provides a sample of those costs.
Table 9. Sample Station Construction and Rehabilitation Costs.
Project State Elements and Notes Cost
Station rehabilitation—High Point
North Carolina
Rehabilitate 1907 station $6.82 million
Station rehabilitation—Salisbury
North Carolina
Rehabilitate 1908 station $4.0 million
Station rehabilitation—Selma
North Carolina
Rehabilitate 1924 station $3.42 million
Construct new multimodal terminal—Charlotte
North Carolina
Acquire 27 acres; construct terminal to accommodate conventional and high‐speed rail, local and regional bus, bicycle, and pedestrian traffic; realign existing tracks
$110‐207 million (estimated)
Construct new multimodal terminal—Durham
North Carolina
Build station in existing historic warehouse as part of commercial redevelopment project; provide for intercity bus, local bus, and taxi connections along existing tracks
$10‐12 million (estimated)
Construct new station—Kannapolis
North Carolina
Build new station near the Kannapolis CBD
$2.67 million
New station construction
Texas Estimate cost of new commuter rail station construction
$1.1 million
Transit center—at‐grade
Texas Estimate cost of new at‐grade transit center (commuter rail project)
$900,000
Construct new station—Hercules
California Construct 600‐ft‐by‐15‐ft‐wide center platform, build parking structure, realign existing track, install passenger shelters for new station
$6.0 million
Construct new station—Oakland Coliseum
California Construct new station, including shelters, lighting, landscaping, parking, etc. and needed signal changes
$4.6 million

49
Additional Cost Information
This project looked thoroughly for additional information to enhance the previous findings. The TxDOT Public Transportation Division provides annual costs related to programs administered. Additionally, an extensive literature review of documents related to intercity bus services examined operating and capital costs.
TxDOT Public Transportation Division Numbers
The TxDOT Public Transportation Division (PTN) released the 2009 Texas Transit Statistics in September 2010. This annual document provides statistics for programs administered by the division, which include rural transit programs funded under the Federal Transit Administration’s Section 5311 program. The Section 5311 grant program “provides capital, planning, operating, and administrative grants for public transportation projects in nonurbanized areas.” (39) Intercity bus operations fall under the Federal Transit Administration’s (FTA) Section 5311(f) program, which is a segment of Section 5311 funding specifically dedicated to rural intercity bus service; however, the TxDOT report only presents overall Section 5311 statistics. The statistics most valuable for this project are presented in Table 10.
Table 10. Texas Section 5311 Performance Measures.
Measure 2008 2009
Service Efficiency
Operating expenses per vehicle revenue mile
$2.85 $2.67
Operating expenses per vehicle revenue hour
$51.00 $50.59
Service Effectiveness
Unlinked passenger trips per vehicle revenue mile
0.21 0.21
Unlinked passenger trips per vehicle revenue hour
3.82 3.73
Cost‐Effectiveness
Operating expenses per unlinked passenger trip
$18.93 $14.48
Farebox recovery ratio 5% 6%
Safety Indicator
Vehicle incidents per 100,000 miles
0.086 0.034
Avg. miles between revenue vehicle system failures
24,230 30,083

50
Interviews
As previously indicated and described, several entities were interviewed for this project. Understandably, private carriers were not forthcoming in provide operating costs of their services. This is generally considered proprietary information. However, in the discussion with Megabus representatives, they indicated their operating costs average $1.89 per passenger mile. Megabus generally uses larger‐capacity buses, which makes their operating cost per passenger slightly lower. Additional cost information from interviews includes the Midland‐Odessa intermodal facility, which is expected to cost $8‐10 million. In the Midland‐Odessa study provided by the Midland‐Odessa MPO as a result of the interviews that investigated intercity transit, the estimated operating expenses equal $50 per hour per bus (40). CARTS recently purchased two different types of buses at a cost of $100,000 per bus for the 25‐ft cutaway buses used in its rural transit services and $200,000 per bus for the 32‐ft low‐floor buses that will be used on the Interurban Coach routes.
Literature Review
Largely, the most beneficial documents identified during this research project were reports done specifically by states that examined intercity bus operations within their boundaries. The major purpose of these reports is to examine the allocation and uses of the federal Section 5311(f) funds. Additional reports were collected for several Texas‐specific projects or research efforts.
An examination of the documents indicates that no specific industry unit cost values are used universally. In calculating operating costs and revenues, most states utilized annual reports or specific values reported through interviews as part of the report process.
A 2002 Transit Cooperative Research Program report (TCRP Report 79) includes an extensive review of bus data from throughout the United States. In a section related to planning, an example presents a carrier’s fully allocated cost per mile as $2.90 per mile. In discussing revenue determination, it says that “if data is not available, one option is to assume that the revenue per passenger will be the same as the national average ticket price, which is currently $36.00 according to Greyhound’s website.” (41) TCRP Report 79 also states that over‐the‐road buses (the legislative technical name for intercity buses) cost between $350,000 and $400,000. Other cost information as reported within the state‐specific reports reviewed includes the following:
• Indiana Intercity Bus Study (42): o The Greyhound‐reported current approximate operating cost equals $3.25 per
vehicle mile. • Minnesota Intercity Bus Network Study (43):
o Jefferson Lines’ cost per mile from May 2008 data, as reported in the Section 5311(f) invoice to the Minnesota DOT, equals $3.44 per bus mile.
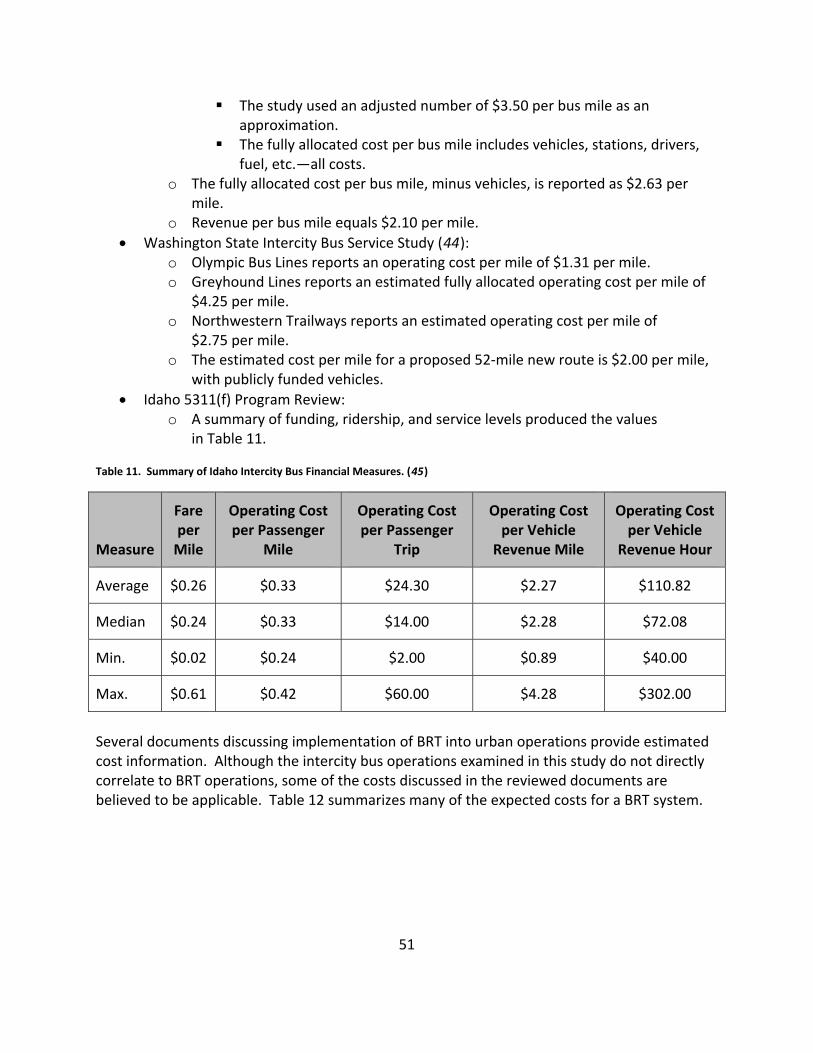
51
The study used an adjusted number of $3.50 per bus mile as an approximation.
The fully allocated cost per bus mile includes vehicles, stations, drivers, fuel, etc.—all costs.
o The fully allocated cost per bus mile, minus vehicles, is reported as $2.63 per mile.
o Revenue per bus mile equals $2.10 per mile. • Washington State Intercity Bus Service Study (44):
o Olympic Bus Lines reports an operating cost per mile of $1.31 per mile. o Greyhound Lines reports an estimated fully allocated operating cost per mile of
$4.25 per mile. o Northwestern Trailways reports an estimated operating cost per mile of
$2.75 per mile. o The estimated cost per mile for a proposed 52‐mile new route is $2.00 per mile,
with publicly funded vehicles. • Idaho 5311(f) Program Review:
o A summary of funding, ridership, and service levels produced the values in Table 11.
Table 11. Summary of Idaho Intercity Bus Financial Measures. (45)
Measure
Fare per Mile
Operating Cost per Passenger
Mile
Operating Cost per Passenger
Trip
Operating Cost per Vehicle
Revenue Mile
Operating Cost per Vehicle
Revenue Hour
Average $0.26 $0.33 $24.30 $2.27 $110.82
Median $0.24 $0.33 $14.00 $2.28 $72.08
Min. $0.02 $0.24 $2.00 $0.89 $40.00
Max. $0.61 $0.42 $60.00 $4.28 $302.00
Several documents discussing implementation of BRT into urban operations provide estimated cost information. Although the intercity bus operations examined in this study do not directly correlate to BRT operations, some of the costs discussed in the reviewed documents are believed to be applicable. Table 12 summarizes many of the expected costs for a BRT system.
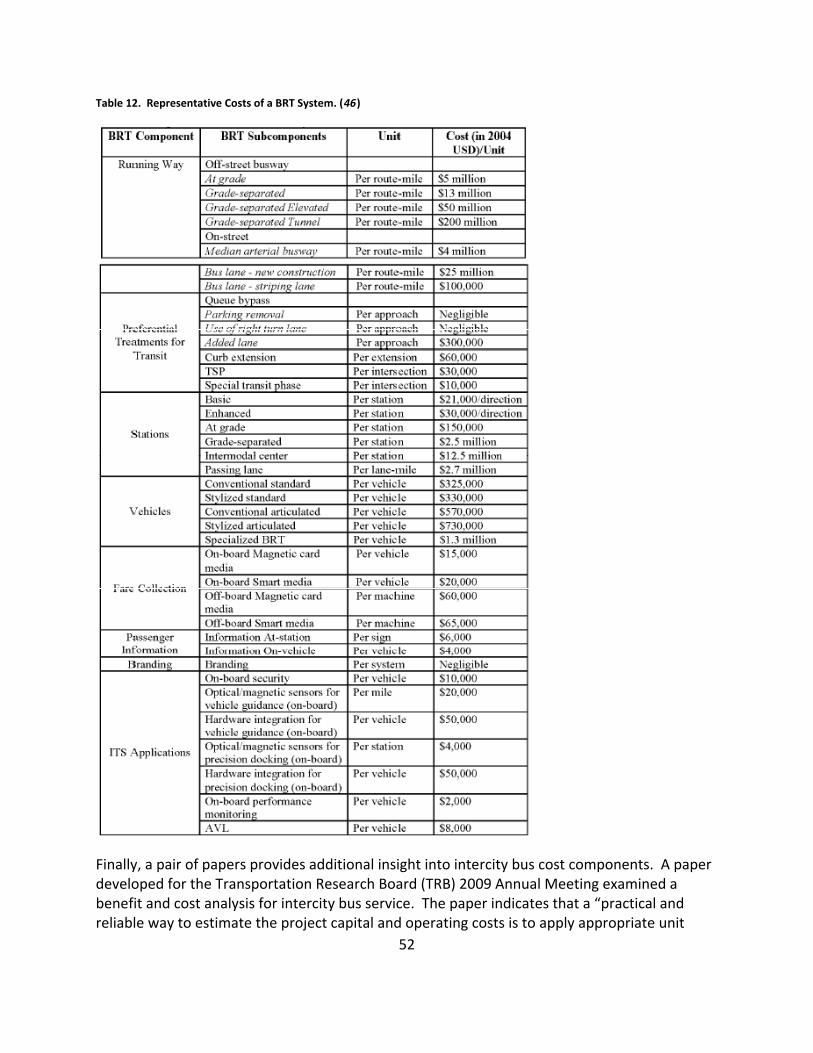
Table 12. Representative Costs of a BRT System. (46)
Finally, a pair of papers provides additional insight into intercity bus cost components. A paper developed for the Transportation Research Board (TRB) 2009 Annual Meeting examined a benefit and cost analysis for intercity bus service. The paper indicates that a “practical and reliable way to estimate the project capital and operating costs is to apply appropriate unit
52

53
costs ($/VMT) to bus vehicle miles traveled (VMT) along the proposed corridor.” (47) The unit cost values are provided as:
• Unit capital cost = $0.5992 per mile. • Unit operating cost = $3.6654 per mile.
A 1987 paper presents an examination of intercity bus technology innovations for services in Canada, and provides several beneficial cost and operating data for intercity bus operations. Table 13 shows the percent breakdown of five cost categories. It shows that the driver makes up over 43 percent of the total operational costs.
Table 13. Typical Intercity Bus Carrier Cost Composition. (48)
Cost Item Percentage of Total CostBus unit leasing 11.3 Driver Wages and benefits Expenses Subtotal
41.4 2.1 43.5
Bus operation Tires Fuel Insurance Licensing Miscellaneous Subtotal
2.1 11.9 1.5 1.2 0.8 17.5
Bus maintenance Wages and benefits Parts Cleaning Exterior repair Other Subtotal
10.2 5.4 1.3 2.0 1.4 20.3
Administrative overhead 7.4 An additional table contained in the paper provides detailed cost and operating data. Table 14 contains the data presented in the paper but also converts the values from metric to English.

54
Table 14. Selected Major Intercity Bus Carrier Costs and Operating Data (1982 Dollars). (48)
Item Value Metric Conversion Capital cost 180,000‐200,000 ($) ‐ Driver cost 0.5‐0.6 ($/km) 0.80‐0.97 ($/mile) Interest 14‐16 (%) ‐ Utilization 160,000‐240,000 (km/year) 257,480‐386,220 (miles/year) Fuel 0.36‐0.43 (L/km) 0.15‐0.18 (gallons/mile) Fuel cost 0.31‐0.44 ($/L) 1.17‐1.67 ($/gallons) Maintenance cost 0.15‐0.20 ($/km) 0.24‐0.32 ($/mile) Fuel consumption 2.31‐2.74 (km/L) 5.43‐6.44 (miles/gallons) Overhead cost 0.12‐0.20 ($/km) 0.19‐0.32 ($/mile) Table 15 develops average operating data values from the values presented in Table 14 and summarizes for the categories of bus operations, driver costs, and overhead costs. The total calculated operating cost in 1982 dollars is $1.95 per mile. Utilizing the Consumer Price Index (CPI), that value translates to a $4.29‐per‐mile value for January 2011.
Table 15. Summary of Operating Data. (48)
Item Value Metric Conversion
Total bus cost 0.50 ($/km) 0.80 ($/mile) (1982 dollars) 1.76 ($/mile) (January 2011 dollars)
Driver cost 0.55 ($/km) 0.89 ($/mile) (1982 dollars) 1.96 ($/mile) (January 2011 dollars)
Overhead cost 0.16 ($/km) 0.26 ($/mile) (1982 dollars) 0.57 ($/mile) (January 2011 dollars)
Total operating cost 1.21 ($/km) 1.95 ($/mile) (1982 dollars) 4.29 ($/mile) (January 2011 dollars)
Note: 1982‐1984 CPI = 100; January 2011 CPI = 220.223.
Summary of Cost Components and Considerations
This chapter presented several sources of data pertinent to this project related to intercity bus services. The data were not meant to be exhaustive but are useful in determining general numbers for use in the presented case study following this chapter.
Capital costs for intercity bus operations consist mainly of the bus and station costs. Based on the findings, the cost of purchasing a bus for intercity service can be as high as $430,000. A comparative value is that of a conventional BRT bus, which is estimated to cost $325,000. One paper indicates that leasing a bus for service is expected to account for approximately 11 percent of the total operating costs. Another paper offers a value of $0.5992 per mile as a way to determine the capital cost of a service.
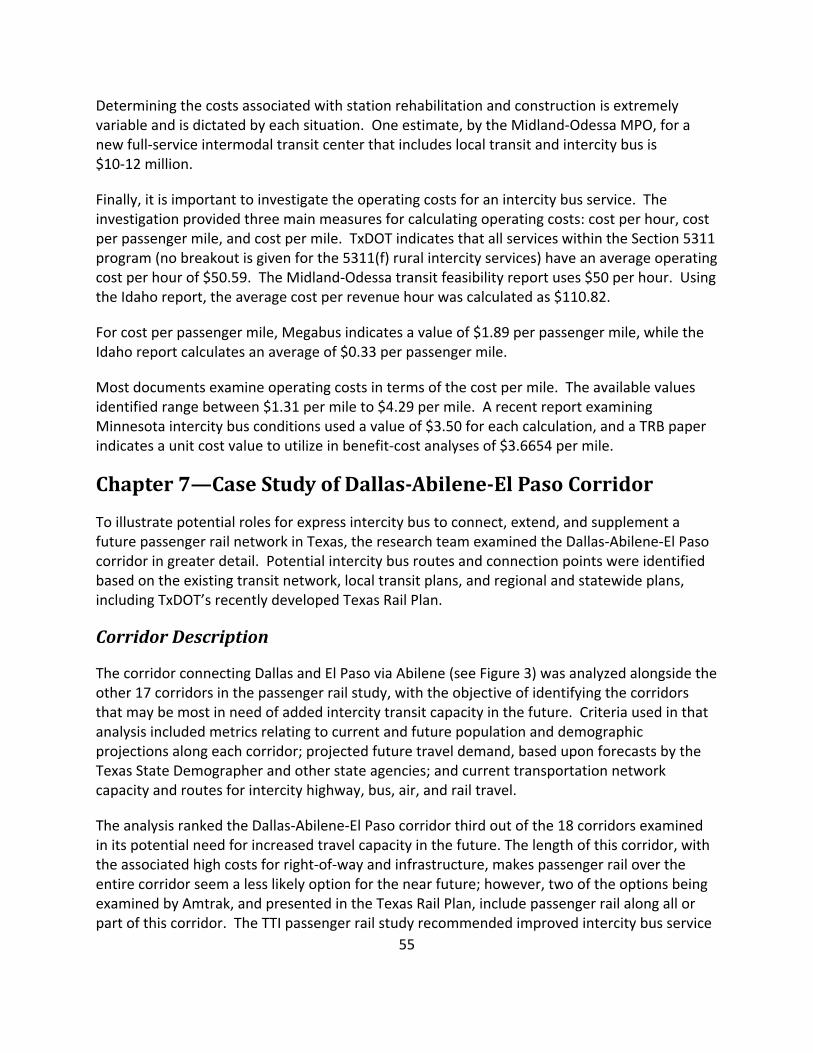
55
Determining the costs associated with station rehabilitation and construction is extremely variable and is dictated by each situation. One estimate, by the Midland‐Odessa MPO, for a new full‐service intermodal transit center that includes local transit and intercity bus is $10‐12 million.
Finally, it is important to investigate the operating costs for an intercity bus service. The investigation provided three main measures for calculating operating costs: cost per hour, cost per passenger mile, and cost per mile. TxDOT indicates that all services within the Section 5311 program (no breakout is given for the 5311(f) rural intercity services) have an average operating cost per hour of $50.59. The Midland‐Odessa transit feasibility report uses $50 per hour. Using the Idaho report, the average cost per revenue hour was calculated as $110.82.
For cost per passenger mile, Megabus indicates a value of $1.89 per passenger mile, while the Idaho report calculates an average of $0.33 per passenger mile.
Most documents examine operating costs in terms of the cost per mile. The available values identified range between $1.31 per mile to $4.29 per mile. A recent report examining Minnesota intercity bus conditions used a value of $3.50 for each calculation, and a TRB paper indicates a unit cost value to utilize in benefit‐cost analyses of $3.6654 per mile.
Chapter 7—Case Study of DallasAbileneEl Paso Corridor
To illustrate potential roles for express intercity bus to connect, extend, and supplement a future passenger rail network in Texas, the research team examined the Dallas‐Abilene‐El Paso corridor in greater detail. Potential intercity bus routes and connection points were identified based on the existing transit network, local transit plans, and regional and statewide plans, including TxDOT’s recently developed Texas Rail Plan.
Corridor Description
The corridor connecting Dallas and El Paso via Abilene (see Figure 3) was analyzed alongside the other 17 corridors in the passenger rail study, with the objective of identifying the corridors that may be most in need of added intercity transit capacity in the future. Criteria used in that analysis included metrics relating to current and future population and demographic projections along each corridor; projected future travel demand, based upon forecasts by the Texas State Demographer and other state agencies; and current transportation network capacity and routes for intercity highway, bus, air, and rail travel.
The analysis ranked the Dallas‐Abilene‐El Paso corridor third out of the 18 corridors examined in its potential need for increased travel capacity in the future. The length of this corridor, with the associated high costs for right‐of‐way and infrastructure, makes passenger rail over the entire corridor seem a less likely option for the near future; however, two of the options being examined by Amtrak, and presented in the Texas Rail Plan, include passenger rail along all or part of this corridor. The TTI passenger rail study recommended improved intercity bus service

for this corridor, until ridership grows to a sufficient level to support rail along all or part of the route.
Figure 3. Dallas/Fort Worth to El Paso via Abilene (DFWABI) Corridor Map. (20) Color image can be viewed at http://utcm.tamu.edu/publications/final_reports.stm#higg53.
The corridor follows I‐20 west from Dallas and Fort Worth until it meets I‐10 approximately 30 miles west of Pecos, continuing west to El Paso. The corridor connects nine CBSAs. Figure 4 shows the CBSAs along the corridor, along with the transportation infrastructure along this corridor, including transit‐related infrastructure such as highways, bus stations, and existing rail corridors that could become part of a future passenger rail or express bus transit system. Commercial airports are located in Dallas‐Fort Worth, Abilene, Midland‐Odessa (halfway between these two cities), El Paso, Lubbock, and San Angelo. Freight rail lines parallel the corridor, and intercity bus stations are located in every CBSA; a few of these stations are being upgraded to or replaced by intermodal facilities.
56

Figure 4. CBSA Map Showing Transportation Infrastructure. (49) Color image can be viewed at http://utcm.tamu.edu/publications/final_reports.stm#higg53
After Abilene (population 160,200 in 2000), the largest CBSAs between Dallas‐Fort Worth and El Paso that are directly on this corridor include Midland (population 116,000) and Odessa (population 121,100). Smaller CBSAs on the corridor include Mineral Wells, Sweetwater, Big Spring, and Pecos. Distances and travel times between these population centers are listed in Table 16 and illustrated in Figure 5. In addition to the CBSAs directly along the corridor, the cities of Lubbock (population 249,700) and San Angelo (population 105,800) are about 100 miles north and south of the corridor, respectively, and each are around 115 miles from the Midland‐Odessa area.
57

58
Table 16. Populations, Distances, and Travel Times along Dallas‐Abilene‐El Paso Corridor. (20)
Dallas‐Fort Worth to El Paso, via Abilene Population
Distance (Miles)
Travel Time (Hours:Minutes)
CBSA 2000 2040
Total%
Growth Segment Cumulative40 mph
60 mph
80 mph
110 mph
Dallas‐Fort Worth 5,161,500 10,106,800 96 ‐ ‐ ‐ ‐ ‐ ‐
Mineral Wells 27,000 36,700 36 70 70 1:45 1:10 0:52 0:38
Abilene 160,200 181,600 13 115 185 4:37 3:05 2:18 1:40
Sweetwater 15,800 17,700 12 40 225 5:37 3:45 2:48 2:02
Big Spring 33,600 35,500 6 70 295 7:22 4:55 3:41 2:40
Midland 116,000 145,200 25 45 340 8:30 5:40 4:15 3:05
Odessa 121,100 163,100 35 25 365 9:07 6:05 4:33 3:19
Pecos 13,100 15,100 15 75 440 11:00 7:20 5:30 4:00
El Paso 679,600 1,153,100 70 205 645 16:07 10:45 8:03 5:51

59
5,162
Legend
Figure 5. Distribution of CBSAs along Case Study Corridor. (20) Color image can be viewed at http://utcm.tamu.edu/publications/final_reports.stm#higg53.
27 160 16 34 116 121 13680
‐100 ‐50 0 50 100 150 200 250 300 350 400 450 500 550 600 650 700
Distance (Miles)
Mineral Wells Sweetwater Midland PecosDallas‐FortWorth Abilene Big Spring Odessa El Paso
750225
City BCity A
CBSA Population (in thousands)
CBSA Population (graphic representation)CBSA Principal City Name
Distance BetweenCities (in miles)

Intersecting Corridors
Two federally designated high‐priority corridors intersect the case study area: Ports to Plains (Figure 6) and La Entrada al Pacifico (Figure 7). Both designated corridors are largely conceived as major trade routes between Mexico and interior points within the United States. The Ports to Plains trade corridor is envisioned to travel from the border crossing at Laredo, through Del Rio, San Angelo, the Midland‐Odessa area, Lubbock, and Amarillo, en route to Denver, Colorado. The La Entrada al Pacifico trade corridor is envisioned to travel from the border crossing at Presidio, through Alpine and Fort Stockton, to Midland‐Odessa.
Both corridors would involve, at a minimum, the development of highways designed as four‐lane divided limited‐access facilities. The La Entrada al Pacifico is also investigating the incorporation of a rail line to move freight from Mexico ports into the United States. Another aspect of the corridors is the expected economic development along the corridors as a result of the increased corridor traffic and development of support industries, such as warehousing and distribution businesses.
Implementation of these corridors could improve the connectivity to the I‐20 corridor between the Odessa‐Midland area communities from the south, such as San Angelo and Fort Stockton, and communities from the north, such as Lubbock and Amarillo.
60

Figure 6. Ports to Plains Corridor—Texas Portion. (50) Color image can be viewed at http://utcm.tamu.edu/publications/final_reports.stm#higg53.
61

Figure 7. La Entrada al Pacifico Corridor. (51) Color image can be viewed at http://utcm.tamu.edu/publications/final_reports.stm#higg53.
Current and Projected Intercity Transit Needs
To further analyze intercity transit needs and potential along the Dallas‐Abilene‐El Paso corridor, information was obtained from interviews, local transit studies, and long‐range local transportation plans regarding current and potential transit demand and rider demographics in regions along the corridor. Transit coordination plans developed by the TxDOT‐designated public transportation regions in 2006 also provided information regarding transit needs and services on and near segments of the corridor.
Information on transit demographics, in‐demand destinations, and existing transit services for several of the CBSAs along this corridor and elsewhere in the state was acquired from interviews with TxDOT PTCs and MPO staff (described in Chapter 5 of this report), as well as from regional transit coordination plans. Table 17 summarizes the intercity transit demographics and in‐demand destinations for most of the larger CBSAs along the Dallas‐Abilene‐El Paso corridor.
The Dallas‐Fort Worth Metroplex is a destination for thousands of commuters daily from the surrounding cities and counties of north central Texas, and transit providers including DCTA, TAPS, and Collin County Area Regional Transit (CCART) provide transit services into the Metroplex that connect with DART, TRE, and/or The T. The area’s medical and human services transportation providers noted a recent increase in the number of people traveling to Dallas and Fort Worth from as far away as Abilene for medical appointments. The Fort Worth Intermodal Transportation Center provides a Greyhound connection on the west side of the Metroplex.
62

Midland‐Odessa, Abilene, Lubbock, and San Angelo are becoming the primary hubs for coordinated transit services that span the entire West Texas region. Coordination in this part of the state is a long‐standing tradition; rural providers have worked together informally for years to meet the challenges of providing service over a large geographical region with a widely scattered population. Recently, the various transit providers have directed efforts toward expanding both their coordination efforts and their customer base. Coordinated scheduling software, increased efforts to educate the general public about the availability of transit services, and a focus on establishing shared facilities are among the strategies for increasing transit use and improving mobility throughout the region.
Aside from El Paso County, the far western region of the state (and of this corridor) has no urban or rural transit service, other than some extremely limited medical and/or social services transportation in a few communities. Vamonos, the public transit coordination plan developed by the West Texas/El Paso Regional Coordinated Transportation Planning Coalition in 2006, recommended a deviated fixed‐route intercity transit system to link the cities and towns in Brewster, Culberson, Hudspeth, Jeff Davis, and Presidio Counties. This proposed system is part of the Priority Group II recommendations in the coordination plan, for which additional research, planning, and/or technical assistance would be required prior to implementation. (52) The City of El Paso and El Paso County have intercity transit connections across the state line to New Mexico, and may be pursuing further intercity connections via a proposed commuter rail line between El Paso and Las Cruces. (53)
63

Table 17. Intercity Transit Demographics and In‐Demand Destinations.
Urban Area Major Transit Demographics/ Market Segments
In‐Demand Destinations
Dallas‐Fort Worth
• Commuters • Elderly (medical appointments) • Students • Recreational travelers
Grand Prairie, Mesquite, Richardson, Plano, Arlington, Flower Mound, Burleson, Cleburne, Joshua, Abilene, Stephenville, Tyler, Longview
Abilene • Medical appointments • Some commuters (potential for
more)
Dallas, Midland‐Odessa, Big Spring, Lubbock, rural areas of West Central Texas
Midland‐Odessa • Elderly and disabled • Potential for commuters and
students
Destinations: Big Bend, Presidio, Marfa, Fort Stockton, Pecos, Van Horn, Sierra Blanca, El Paso
Lubbock • Medical appointments • Students (Texas Tech, Levelland,
South Plains)
Dallas‐Fort Worth, Austin, El Paso, Albuquerque, Santa Fe, Oklahoma City, Tulsa
San Angelo • Military personnel (Goodfellow Air Force Base)
• Students (Angelo State University) • Elderly (general trips)
Dallas‐Fort Worth, Midland‐Odessa, Abilene
El Paso • Commuters • Students (University of Texas at El
Paso) • Military personnel (Fort Bliss)
Brewster, Culberson, Hudspeth, Jefferson Davis, Presidio Counties; Las Cruces, NM
The travel needs and patterns identified by the TxDOT PTCs and other local agencies seem to indicate that the bulk of current and projected travel demand on this corridor is not from one end to the other (i.e., Dallas to El Paso), but rather branches east and west along the corridor to and from the Midland‐Odessa area, as well as north of the corridor toward Lubbock and Amarillo and south toward San Angelo.
Existing Intercity Service and Infrastructure
The intercity transit services operating on or near this corridor (Amtrak, Greyhound and its subsidiaries/partners, and Concho Coaches) are described in more detail in Chapter 4.
There is currently no passenger rail service along this corridor west of the Dallas‐Fort Worth area. The Texas Eagle/Sunset Limited line continues south from Fort Worth, following the I‐35 corridor to San Antonio, and then continues along the I‐10 corridor to El Paso. Greyhound provides intercity bus service along the entire east‐west length of the corridor, Greyhound subsidiaries including the Kerrville Bus Company and Texas, New Mexico and Oklahoma (TNM&O) Coaches branch north and south from the corridor, and independent providers including All Aboard America and Concho Coaches serve smaller regions on and near the
64

corridor in the western half of the state. Figure 8 illustrates intercity bus routes currently serving this corridor and the surrounding area. Table 18 summarizes the intermodal facilities in use, under construction, or planned along the corridor.
Figure 8. Map of Intercity Bus Services on and near Dallas‐Abilene‐El Paso Corridor. (20) Color image can be viewed at http://utcm.tamu.edu/publications/final_reports.stm#higg53.
65

Table 18. Intermodal Facilities along Dallas‐Abilene‐El Paso Corridor.
Station/Location Owned/Managed by
Transit Providers Comments
Dallas Union Station City of Dallas DART, TRE, Amtrak
Fort Worth Intermodal Transportation Center
DART, The T TRE, Amtrak, The T, Greyhound
Planned multimodal terminal, Abilene
City of Abilene CityLink (urban), Greyhound, Central Texas Rural Transit District (CARR), SPARTAN, Double Mountain Coach
Proposed in Abilene metropolitan area
Metropolitan Transportation Plan
2010‐2035 but not yet funded in TIP, estimated cost $9 million
Intermodal facility, Midland International Airport
EZ Rider EZ Rider, Greyhound, All Aboard America
Land purchased adjacent to Midland Intl. Airport, at bid stage for construction, $8‐10 million project
El Paso Union Depot/Union Plaza
Sun Metro Sun Metro, Greyhound, Amtrak
Amtrak’s Union Station is not in same facility but reachable with a pedestrian connection from Union Plaza
Concho Valley Multi‐modal Terminal, San Angelo
Concho Valley Council of Governments
Concho Valley Transit District, Concho Coaches, Kerrville Bus Company
Groundbreaking took place January 13, 2011.
$3 million, 10,500 sq. ft
Downtown transit plaza (under renovation), Lubbock
Citibus Citibus, Greyhound, SPARTAN, West Texas Opportunities, Inc., Panhandle Community Services
Under renovation; will include driver break areas, maintenance facility, restaurant
66

Dallas‐Fort Worth to Abilene Intercity Service and Infrastructure
Passenger rail. Amtrak serves Dallas and Fort Worth but does not continue west along this corridor. The Texas Eagle/Sunset Limited line continues south from Dallas‐Fort Worth, following the I‐35 corridor to San Antonio, and then continues along the I‐10 corridor to El Paso.
Intercity bus. Greyhound provides service between Dallas‐Fort Worth and Abilene; as of 2011, there are six departures per day from Dallas‐Fort Worth to Abilene and five per day from Abilene to Dallas‐Fort Worth.
Intermodal connections/local service. Union Station in Dallas is shared by DART’s light rail and bus services, the Trinity Railway Express, and Amtrak. Fort Worth’s urban transit service The T and the Trinity Railway Express provide connecting service to Greyhound at the Fort Worth Intermodal Transportation Center. DART passengers can access a Greyhound station close to DART’s Union Station in Dallas. Local transit services in and around Abilene include the CityLink urban transit system within the city limits and Double Mountain Coach demand‐response rural transit in the surrounding counties (Fisher, Haskell, Jones, Kent, Knox, Stonewall, and Throckmorton). Both of these providers provide connecting service to Greyhound at its Abilene station.
Abilene to Midland‐Odessa Intercity Service and Infrastructure
Passenger rail. There is no current passenger rail service on or close to this part of the corridor. The planned intermodal center at the Midland Airport is close to freight rail tracks, as is the transit center in Lubbock; these centers could potentially serve passenger rail as well as bus service if passenger rail is established along this corridor in future years.
Intercity bus. Greyhound operates east and west along the corridor, with four schedules per day between Abilene and Odessa. Greyhound does not stop in the city of Midland. TNM&O Coaches, a Greyhound partner, provides service from Odessa to Lubbock and Amarillo, north of the corridor itself. KBC, also partnered with Greyhound, travels southeast from the corridor (at Big Spring) to San Angelo. Concho Coaches links passengers from San Angelo to Midland, Odessa, and Abilene. EZ Rider’s planned collaboration with AAA will establish a link between Odessa and Midland. Table 19 summarizes the intercity providers, routes, and frequencies for this region.
67
Table 19. Intercity Transit Service, Abilene‐Lubbock‐Midland‐Odessa‐San Angelo.
Abilene Lubbock* Midland Odessa San Angelo*
Abilene Greyhound 3/day
‐‐ Greyhound 4/day
Concho Coaches 1/day
Lubbock* Greyhound 3/day
‐‐ Greyhound 1/day
‐‐
Midland ‐‐ ‐‐ EZ Rider/AAA (planned)
Concho Coaches 2/day
Odessa Greyhound 4/day
Greyhound 1/day
EZ Rider/AAA (planned)
‐‐
San Angelo* Concho Coaches 1/day
‐‐ Concho Coaches 2/day
‐‐
*Not directly on the Dallas‐Abilene‐El Paso corridor.
Intermodal connections/local service. All Aboard America has been contracted to provide intercity service between Midland and Odessa; an intermodal terminal to be constructed at the Midland International Airport will provide a hub for this service as well as for the EZ Rider urban transit service and Greyhound. Other rural transit services operating across this region of the state include West Texas Opportunities/Permian Basin Rural Transit District, serving the counties around Midland and Odessa; CARR; SPARTAN; and Double Mountain Coach.
Midland‐Odessa to El Paso Intercity Service and Infrastructure
Passenger rail. There is no passenger rail service connecting the Midland‐Odessa area with El Paso; Amtrak’s Sunset Limited line travels southeast from El Paso without intersecting this corridor.
Intercity bus. Greyhound runs five schedules per day from Odessa to El Paso and three schedules per day from El Paso to Odessa.
Intermodal connections/local service. Greyhound and El Paso’s Sun Metro urban transit system connect at Union Plaza in El Paso. Amtrak’s Union Station is within walking distance. El Paso County Transit operates demand‐response rural transit as well as five fixed routes connecting the rural areas of El Paso County to the city.
68

Expanded Intercity Transit: Three Scenarios
The Texas Rail Plan, developed by TxDOT’s Rail Division in November 2010, outlines a number of possible changes to the existing Amtrak passenger rail service in Texas, all designed to increase passenger rail ridership in the state. (54) This case study utilizes the Texas Rail Plan existing and potential passenger rail as the most likely rail services to occur in the near future. The following three scenarios for expanding intercity transit services along the Dallas‐Abilene‐El Paso corridor are based on three of the plan’s proposed changes to Amtrak.
Rail Service Scenario 1: Expansion of Existing Amtrak Services
The first passenger rail option described by the Texas Rail Plan is for increased service and improved infrastructure along Amtrak’s Texas Eagle/Sunset Limited route, keeping that route on its current right‐of‐way through the southern part of the state. This would maintain the status quo on the Dallas‐Abilene‐El Paso corridor, with intercity bus service remaining the sole long‐distance transit mode. Potential improvements to intercity bus service along the corridor could include the addition of new routes connecting locations both on and off the corridor, as well as increased frequencies on existing routes.
Based on the in‐demand destinations and travel markets identified by the TxDOT PTCs and local agencies, suggested new routes, modified routes, or increased service on existing transit routes include the following:
• Abilene to the DFW Airport (new route). This route could supplement or replace some air travel between Abilene and Dallas‐Fort Worth.
• Abilene to selected medical centers in Dallas‐Fort Worth (new route). A single route serving multiple medical facilities could provide a direct link for the elderly/disabled, veterans, and the general public to medical services in the Metroplex. The planned intermodal facility in Abilene would provide a collection point for riders living in surrounding counties, as well as those living within the Abilene city limits.
• Fort Worth Intermodal Transportation Center to Abilene (existing). This route is already served by Greyhound. Depending on future demand, additional frequencies could eventually be warranted.
• Abilene to Midland Intermodal Terminal/International Airport (modified route). This would be a modification of Greyhound’s current route from Abilene to Odessa, shifting the endpoint to the new intermodal terminal to be built at Midland International Airport. The planned EZ Rider/AAA intercity link would then bridge the corridor between Midland and Odessa.
• Midland Intermodal Terminal/International Airport to Alpine Amtrak station (new route). This route would travel via La Entrada al Pacifico trade corridor and would link the I‐20 corridor to Amtrak’s Sunset Limited/Texas Eagle route in Alpine.
69

• Midland to El Paso Union Plaza (increased frequency). This more direct route to El Paso, already served by Greyhound, might benefit from increased service frequency but would otherwise remain largely unchanged.
• Midland to Lubbock (modified route). This could be a modification of Greyhound’s existing Odessa‐to‐Lubbock route; moving the endpoint to the Midland Intermodal Terminal would allow connections to other intercity and local transit. Frequencies between Midland‐Odessa and Lubbock might need to increase to more than once per day (the current frequency on the Odessa‐Lubbock Greyhound route) to attract commuters and other general‐public markets.
• San Angelo to Midland‐Odessa (modified route). This route, operated by Concho Coaches, currently operates twice per day. As with the Lubbock to Midland‐Odessa route, moving the Midland stop to the Midland Intermodal Terminal (or consolidating both the Midland and Odessa stops at the terminal) would allow easier connections to other intercity and local transit.
• Midland to Odessa (new route already planned, possible increased frequency). The intercity connector already planned by the Midland‐Odessa Metropolitan Planning Organization will serve the multimodal terminal at the Midland Airport as well as both cities. If the longer intercity routes serve the Midland Airport transit terminal as the sole stop for this area, frequent service on this route will provide needed connections for riders in both cities and can also act as an airport shuttle.
Capital expenditures for Scenario 1 would likely include the following at a minimum:
• completion of the multimodal terminal (in planning/bid stages as of 2011) at the Midland International Airport—$8‐10 million;
• construction of an already‐proposed multimodal terminal in Abilene—$9 million; • construction of an intermodal terminal in Alpine—$4‐12 million, depending on size,
location, and amenities; and • additional accessible buses for each of the new routes—$200,000 to $325,000 per bus,
depending on size and amenities.
Table 20 lists approximate operating cost ranges for the routes described above, assuming per‐mile costs of $3.50 to $3.6654. These two values, calculated by the Minnesota Intercity Bus Network Study and the 2009 TRB paper, represent a mid‐range of the per‐mile costs cited by the various sources described in Chapter 6. An exception is the Midland‐Odessa connecting route, whose per‐trip operating cost has been estimated in the Midland Odessa Transportation Organization (MOTOR) Transit Plan.
70

Table 20. Operating Cost Ranges, Scenario 1 Routes.
Route One‐Way Distance (Miles)
Operating Cost per Scheduleat $3.50 to $3.6654 per Mile
Abilene—DFW Airport (new) 174 $609‐$638
Abilene—DFW medical centers (new) 167.5* $586‐$614
Abilene—Fort Worth Amtrak station (increased frequency)
150 $525‐$550
Abilene—Midland International Airport (modified)
161 $564‐$590
Midland—Alpine Amtrak (new) 185 $648‐$678
Midland—El Paso (increased frequency) 306 $1,071‐$1,122
Midland—Lubbock (modified) 118 $413‐$433
Midland—San Angelo (modified) 112 $392‐$411
Midland‐Odessa (new, planned) 23‐33, depending on route
$50**
*Abilene to midpoint of DFW Metroplex. **Projected cost per bus per hour; each one‐way trip estimated at 50 minutes.
Rail Service Scenario 2: Reroute of Amtrak’s Sunset Limited Route
Amtrak has considered rerouting the Sunset Limited line, which currently runs from Houston through San Antonio before continuing west to El Paso. The altered route would instead run from Houston to Dallas, continuing west along the Dallas‐Abilene‐El Paso corridor. This would bring rail service to Abilene, Midland, and Odessa. Intercity bus service could then act both as feeder service to the Amtrak line, and on complementary schedules along the corridor to increase the frequency of intercity service.
New and modified intercity bus routes to coordinate with Amtrak rail service on this corridor could include many that are similar to those described under Scenario 1; even with rail service on this corridor, intercity bus service can provide additional trip frequencies along the major segments, and feeder service to the corridor from Lubbock, Amarillo, and San Angelo. New routes, modified routes, or increased service on existing transit routes include the following:
71

• Abilene to Midland Intermodal Terminal/International Airport (modified route). The Midland Intermodal Terminal would be modified to accommodate the passenger rail line as well as intercity bus service; intercity bus routes along the same corridor as the Amtrak line would provide opportunities for greater trip frequencies than either service alone if schedules are coordinated.
• Midland to El Paso Union Plaza. Similar to the Abilene to Midland route, intercity bus routes between these two cities would provide opportunities for greater service frequency if coordinated with rail service. The two modes would arrive in facilities close to each other in El Paso.
• Midland to Lubbock (modified route). Bus service can connect Lubbock with either Amtrak or intercity bus at the Midland Intermodal Terminal. In addition to increasing service frequency between these two cities, coordinating schedules with Amtrak and/or intercity bus service on I‐20 will improve the convenience of the connection and should help to boost ridership. Continued service from Lubbock to Amarillo would tie the Panhandle into this corridor.
• San Angelo to Midland‐Odessa (modified route). Similar to the Midland‐to‐Lubbock route, this route could connect either to intercity bus or to Amtrak at the intermodal terminal in Midland.
• Midland to Odessa (new route already planned, possible increased frequency). As described in Scenario 1, this short‐distance intercity connector will serve the multimodal terminal at the Midland Airport as well as both cities. Schedule coordination with Amtrak and with line‐haul intercity bus at the intermodal terminal (and potentially with airline schedules) may be key to maximizing ridership on this route and to encouraging intercity bus/train ridership from this part of the state.
Capital expenditures for Scenario 2 would likely include the following at a minimum:
• construction of an already‐proposed multimodal terminal in Abilene including accommodation for rail—$9.0 million or more,
• completion of a planned intermodal terminal at Midland International Airport, plus expansion to accommodate rail service—$8‐10 million or more, and
• additional accessible buses for each of the new routes—$200,000 to $325,000 per bus.
Table 21 lists approximate operating cost ranges for the routes described above, assuming per‐mile costs of $3.50 to $3.6654, with the exception of the Midland‐Odessa route.
72

Table 21. Operating Cost Ranges, Scenario 2 Routes.
Route One‐Way Distance (Miles)
Operating Cost per Scheduleat $3.50 to $3.6654 per Mile
Abilene‐Fort Worth Amtrak station 150 $525‐$550
Abilene‐Midland International Airport (modified)
161 $564‐$590
Midland‐El Paso (increased frequency) 306 $1,071‐$1,122
Midland‐Lubbock (modified) 118 $413‐$433
Midland‐San Angelo (modified) 112 $392‐$411
Midland‐Odessa (new, planned) 23‐33, depending on route
$50*
*Projected cost per bus per hour; each one‐way trip estimated at 50 minutes.
Rail Service Scenario 3: Development of New Amtrak Caprock Express Route
Among the potential new Amtrak routes discussed in the Texas Rail Plan is the 840‐mile Caprock Express, which would provide service from Fort Worth through Abilene, Lubbock, and Amarillo to Denver, Colorado (see Figure 9). (54, 55) The Caprock Express would be an addition to the existing Amtrak system in Texas; if the Texas Eagle‐Sunset Limited route remains on its current right‐of‐way (as described in Scenario 1), the addition of the Caprock Express would extend rail service on the I‐20 corridor from Fort Worth to Abilene, and would tie in Lubbock and Amarillo to the north. Intercity bus would act as an extension of the rail line west of Abilene, and could also provide increased service frequencies between Abilene and Dallas‐Fort Worth and between Abilene and Lubbock. New and modified intercity bus routes within this scenario could include the following:
• Abilene to Midland Intermodal Terminal/International Airport (modified route). The existing intercity bus along this segment of the corridor would become a direct extension of the Amtrak line west of Abilene, with the other endpoint shifted to the Midland International Airport intermodal terminal.
• Midland Intermodal Terminal/International Airport to Alpine Amtrak station (new route). This route would travel via La Entrada al Pacifico trade corridor and would link the I‐20 corridor to Amtrak’s Sunset Limited/Texas Eagle route in Alpine.
• Abilene‐San Angelo‐Alpine (extended route). As an alternative or addition to the Midland‐to‐Alpine route, existing service between Abilene and San Angelo could be extended to provide a link between the Abilene and Alpine Amtrak stations, connecting the Caprock Express to the Texas Eagle/Sunset Limited.
73

• Midland to El Paso Union Plaza (increased frequency). This more direct route to El Paso, already served by Greyhound, might benefit from increased service frequency but would otherwise remain largely unchanged.
• Midland to Odessa (new route already planned, possible increased frequency). This would provide service to the multimodal terminal at the Midland Airport as well as the cities of Midland and Odessa.
If the Caprock Express is developed in addition to a rerouted Amtrak Sunset Limited service between El Paso and Fort Worth (as described in Scenario 2), then the Caprock Express would expand rail service along the corridor between Sweetwater and Fort Worth. This might reduce the need for parallel intercity bus services along this portion of the corridor, with the exception of bus routes to provide increased service frequencies. The two Amtrak routes would likely connect in Abilene.
74

Colorado Stations Texas Stations
Start: Denver
1. Littleton 2. Colorado Springs 3. Pueblo 4. La Junta
6. Amarillo 7. Plainview 8. Lubbock 9. Sweetwater 10. Abilene 11. Eastland 12. Weatherford End: Fort Worth
Oklahoma Stations
5. Boise City Figure 9. Caprock Express Route and Stations. (55) Color image can be viewed at http://utcm.tamu.edu/publications/final_reports.stm#higg53.
Capital expenditures for Scenario 3 would likely include the following:
• construction of an already‐proposed multimodal terminal in Abilene, including accommodation for rail—$9.0 million or more;
• expansion of a multimodal station in Lubbock to accommodate rail—$2‐4 million; • construction of a multimodal station in Amarillo—$4‐12 million, depending on size,
location, and amenities; • completion of the multimodal terminal at the Midland International Airport—
$8‐10 million; and • additional accessible buses for each of the new routes—$200,000 to $325,000 per bus.
75

Table 22 lists approximate operating cost ranges for the routes described above, assuming per‐mile costs of $3.50 to $3.6654, with the exception of the Midland‐Odessa route.
Table 22. Operating Cost Ranges, Scenario 3 Routes.
Route One‐Way Distance (Miles)
Operating Cost per Scheduleat $3.50 to $3.6654 per Mile
Abilene‐Midland International Airport (modified)
161 $564‐$590
Abilene‐San Angelo‐Alpine 320 $1,120‐$1,173
Midland‐San Angelo (modified) 112 $392‐$411
Midland‐El Paso (increased frequency) 306 $1071‐$1122
Midland‐Odessa (new, planned) 23‐33, depending on route
$50*
*Projected cost per bus per hour; each one‐way trip estimated at 50 minutes.
Chapter 8—Conclusions and Recommendations
Both passenger rail and express bus service have the potential to shift some travel demand from highway and air travel corridors that are projected to reach or exceed capacity during the next 40 years. In addition, they may help to satisfy what is likely to be a growing need for transportation service in Texas’ less‐populated counties to the west of I‐35.
Nationally, intercity bus and rail service and ridership have been declining since the 1960s, as highways and commercial airlines became the primary intercity travel modes. Available intercity service has undergone another significant reduction since 2005, as Greyhound and other major intercity carriers have streamlined routes and cut service to smaller cities and towns in an effort to reduce costs. Between 2005 and 2010, 3.5 million Americans living in rural area lost access to scheduled intercity service of any type; another 3.7 million lost access to at least one intercity transit mode (bus, rail, ferry, or air). In Texas, just over 97 percent of rural residents had access to at least one mode of intercity transit in 2005 (defined as living within 25 miles of a bus station, rail station, or airport); by 2010 that percentage had dropped to just over 92 percent. (56) Rural and small urban transit providers in many parts of the state have been working to fill the gaps in intercity service through formal or informal feeder service, but they also are faced with the challenges of increased demand and finite resources. Providers like CARTS and TAPS are beginning to balance their traditional demand‐response services with fixed routes, either on a local level such as TAPS’ two urban shuttles or at a regional level such as CARTS’ upcoming Interurban Coach; these services are designed to attract “choice riders” to
76

transit, thereby increasing revenues, and also to transport larger numbers of transit‐dependent riders than would be possible on a strict demand‐response service model.
In the intercity transit market, it is notable that limited‐stop, city‐to‐city service is proving to be a highly marketable service model. The only intercity bus services that have seen significant ridership growth during the last five years have been the curbside bus companies such as Megabus and BoltBus. Traditional intercity providers like Greyhound have been taking cues from these express intercity providers, not only streamlining their own routes but also exploring other ways to cut operating costs while attracting more riders, such as expanding online marketing and ticket sales, seeking to share terminal/station space with other transit providers rather than constructing their own exclusive facilities, and investing funds in upgraded buses and onboard amenities that attract commuters and leisure travelers.
The trend toward express routes in intercity transit is likely to produce more frequent and on‐time service between major cities, and to increase the number of people choosing to ride transit for intercity trips. The trade‐off will be an increased need for intermodal and park‐and‐ride facilities at intercity transit stops, as well as for local transit to provide connecting service to the intercity system, whether that system is express bus or passenger rail.
Local, State, and Federal Roles in Expanding Intercity Transit Availability
Intercity and local transit providers who were interviewed in this study suggested several ways that expanded intercity transit options and connectivity can be fostered at the local, state, and federal government levels:
• Providers expressed a need for formula allocation funding at the federal level for transit planning, intermodal facilities, and other infrastructure that support transit connectivity. Currently, these activities tend to be funded piecemeal with short‐term, competitive grants or similar “one‐shot,” unpredictable funding sources, which impedes the ongoing work needed to continue building and adapting a connected transit network.
• Another need expressed was for stronger leadership at the state level toward a high‐capacity intercity transit network; transit providers developing regional services and connections often need technical and funding assistance, as well as a commitment to high‐capacity transit in state plans.
• Many of the providers interviewed expressed a desire to operate on a level playing field that does not give an unfair advantage to one carrier over another within the same market. Examples of unfair advantages included corridor‐specific operating subsidies provided by another state government to one carrier but not to its competitors, and management practices at a shared terminal that had the effect of directing potential passengers consistently to the larger of two providers serving the terminal. Local and state involvement has the potential, on the other hand, to foster equal opportunity and more effective coordination even among competing providers. This can be accomplished through funding/subsidy practices and policies governing shared use of
77
78
facilities/infrastructure; a state or local governing body can also lead a formal or informal coordination effort.
Recommendations for Future Research
One of the interviewed transit providers suggested a research project or case study to determine what needs to be done at the federal level (funding formulas, legislation, guidance, and/or other assistance) to make interconnectivity in transit work across all modes and jurisdictions.
Specific related topics could include barriers or constraints to consolidating fare collection/media and potential federal funding changes to enable greater connectivity between transit modes.
References
1. Walsh, Margaret. “The Bus Industry in the United States.” EH.Net Encyclopedia (online), edited by Robert Whaples, 2003. [Cited: July 6, 2010.] http://eh.net/encyclopedia/article/walsh.bus.industry.us.
2. Edles, Gary J. “Major Acts of Congress, Motor Carrier Act (1935).” [Cited: July 6, 2010.] http://www.enotes.com/major‐acts‐congress/motor‐carrier‐act/print.
3. U.S. General Accounting Office. Surface Transportation: Availability of Intercity Bus Service Continues to Decline. GAO/RCED 92‐126, Washington, D.C., 1992.
4. Fravel, Frederic D. “Intercity Bus Links Moving into New Territory.” Transportation Research News, 2003, pp. 24‐29.
5. Taylor, William, Robert Kaufmari, John Browder, et al. An Analysis of the Intercity Bus Industry and the Michigan Bus Subsidy Program. National Transportation Policy Study Commission, 1978, pp. 7‐9.
6. Clarkston, Greg, and Marcia J Simon. Impact of Declining Intercity Bus Service in Missouri. Missouri Department of Transportation, Jefferson City, Missouri, 2005.
7. Amtrak Texas Eagle. “Thruway Connections.” [Cited: January 3, 2011.] http://www.texaseagle.com/thruway.htm.
8. Franks, Lynn. “Role of Feeder Buses in Supporting Amtrak Services in California.” Transportation Research Record 1177, Transportation Research Board, Washington, D.C., 1988, pp. 40‐46.
9. Amtrak. “About Amtrak California.” [Cited: November 19, 2010.] http://www.amtrakcalifornia.com/index.cfm/about‐amtrak‐california.

79
10. Rutkoff, Aaron. “The Secret History of the Chinatown Bus.” The Wall‐Street Journal, September 8, 2010. [Cited July 6, 2010.] http://blogs.wsj.com/metropolis/2010/06/14/the‐secret‐history‐of‐the‐chinatown‐bus.
11. Sorenson, Violet. “ ‘Chinatown’ Bus Lines Are a Budget Traveler’s Dream.” 2006. [Cited: September 8, 2010.] http://www.savingadvice.com/forums/travel‐vacations/16326‐chinatown‐bus‐lines‐budget‐travelers‐dream.html.
12. Klein, Nicholas J. “Emergent Curbside Intercity Bus Industry.” Transportation Research Record 2111, Transportation Research Board, Washington, D.C., 2009, pp. 83‐89.
13. Hilkevitch, Jon. “Greyhound Buses in Chicago to Have Wi‐Fi, More Comfort.” Chicago Tribune, October 11, 2010. [Cited: July 12, 2010.] http://articles.chicagotribune.com/2010‐10‐11/classified/ct‐met‐getting‐around‐1011‐20101010_1_chicago‐greyhound‐new‐buses‐intercity‐bus‐service.
14. Schwieterman, Joseph. The Intercity Bus: America’s Fastest Growing Transportation Mode. 2010 Update on Scheduled Bus Service. Chaddick Institute for Metropolitan Development, DePaul University, December 12, 2010.
15. Schwieterman, Joseph. 2008 Update on Intercity Bus Service: Summary of Annual Change. Chaddick Institute for Metropolitan Development, DePaul University, November 24, 2008.
16. Gillie, John. “All Aboard! Amtrak Ridership Increases.” The News Tribune, October 19, 2010.
17. Amtrak Government Affairs. Amtrak Fact Sheet, Fiscal Year 2008: State of Texas. November 2008. [Cited: January 3, 2011.] http://www.amtrak.com/pdf/factsheets/TEXAS08.pdf.
18. Amtrak Government Affairs. Amtrak Fact Sheet, Fiscal Year 2010: State of Texas. November 2010. [Cited: January 3, 2001.] http://www.amtrak.com/pdf/factsheets/TEXAS10.pdf.
19. Dickson, Gordon. “Amtrak Making a Comeback in Texas.” Fort Worth Star‐Telegram, April 24, 2010.
20. Morgan, Curtis, et al. Potential Development of an Intercity Passenger Transit System in Texas—Final Project Report. Report 0‐5930‐2, Texas Transportation Institute, College Station, Texas, May 2010.
21. Taube, Richard K. Chronology of the Virginia Railway Express, 1964‐Present. August 11, 2008. [Cited November 5, 2010.] http://www.vre.org/about/company/VRE‐Chronology.pdf

80
22. Sisk, Kay Layton. “TAP‐ping into the System.” North Texas E‐news, August 17, 2009. [Cited: September 17, 2010.] http://ntxe‐news.com.
23. Southerland, Edward. “The Right Person in the Right Seat.” Texoma Living, December 20, 2009. [Cited: November 19, 2010.] http://www.texomaliving.com/brad‐underwood.
24. Transportation Research Board. Elements Needed to Create High Ridership Transit Systems. TCRP Report 111, Washington, D.C., 2007.
25. Government Accountability Office. Intercity Passenger Rail: Issues for Consideration in Developing an Intercity Passenger Rail Policy. Testimony before the Subcommittee on Railroads, Committee on Transportation and Infrastructure, House of Representatives, April 30, 2003. [Cited: January 5, 2011.] http://www.gao.gov/new.items/d03712t.pdf.
26. New Mexico Railrunner. “Belen to Santa Fe Commuter Rail Project Overview and Status of Project Elements.” October 8, 2008. [Cited: August 21, 2009.] http://www.nmrailrunner.com/project_phases.asp.
27. ASARail. “Austin‐San Antonio Rail Project Status.” January 2009. [Cited: August 21, 2009.] http://asarail.org/Project.Status.2009.January.pdf.
28. FTA Publications. “Dallas‐Ft. Worth, Texas/RAILTRAN Phase II (Trinity Express Phase II).” 1999. [Cited: August 24, 2009.] http://www.fta.dot.gov/publications/reports/planning_environment_2906.html.
29. U.S. House of Representatives. “Central Florida Commuter Rail: Questions and Answers.” 2005. [Cited: August 21, 2009; no longer available online.] http://www.house.gov/mica/commrailquestions.pdf.
30. Minnesota Department of Transportation. Northstar Project Summary. 2007. [Cited: March 7, 2009.] No longer available online.
31. DMJM Harris. “Greenbush Commuter Rail.” 2007. [Cited: March 7, 2009.] http://www.dmjmharris.com/MarketsAndServices/49/71/index.html.
32. Santa Clara Valley Transportation Authority. “VTA Rapid 522 Line 22 Corridor Service Improvements.” January 11, 2005. [Cited: August 21, 2009.] http://www.vta.org/projects/line22brt.html.
33. Cooper, B. “Study Details Costs of Express Bus Line.” Kansas City Star, August 7, 2009.
34. Georgia Regional Transportation Authority. “GRTA Regional Transit Action Plan (Draft Concept Plan), Chapter 5.” 2003. [Cited: January 22, 2009.] http://www.grta.org/rtap/pdf_files/chapter_five.pdf.
35. AC Transit East Bay Bus Rapid Transit Project; Request to Initiate Project Development, Chapter 9. 2008.

81
36. Morgan, C.A., J.E. Warner, C.E. Roco, and S.S. Roop. Funding Strategies and Project Costs for State‐Supported Intercity Passenger Rail: Selected Case Studies and Cost Data. Report 0‐4723‐1, Texas Transportation Institute, College Station, Texas, 2005.
37. Franke, M.W., R.P. Hoffman, and B.E. Hillblom. Executive Summary: Feasibility Report on Proposed Amtrak Service Quad Cities—Chicago. Amtrak Illinois, Chicago, 2008.
38. California Department of Transportation. “California Intercity Rail Capital Program.” Sacramento, California, March 2004. [Cited: July 14, 2004.] http://www.dot.ca.gov/hq/rail/pubs/circp/2004circp.pdf.
39. Texas Department of Transportation, Public Transportation Division. 2009 Texas Transit Statistics. September 2010.
40. Midland‐Odessa Transportation Organization. Midland‐Odessa Intercity Transit Feasibility Study. August 31, 2009.
41. KFH Group, Inc. TCRP Report 79: Effective Approaches to Meeting Rural Intercity Bus Transportation Needs. Transit Cooperative Research Program, Transportation Research Board, Washington, D.C., 2002.
42. Indiana Department of Transportation. Indiana Intercity Bus Study. Prepared by RLS & Associates, Inc., January 16, 2009.
43. Minnesota Department of Transportation. Minnesota Intercity Bus Network Study. Prepared by KFH Group, Inc., March 2010.
44. Washington State Department of Transportation. Washington State Intercity Bus Service Study. 2008.
45. Ballard, Lisa. Idaho 5311(f) Program Review. Final report, Idaho Transportation Department Public Transportation Division, June 30, 2010.
46. Machemehl, Randy, R.L. Kelvin Cheu, and Hongchao Liu. Guidelines for Incorporating a Bus Rapid Transit Scenario into the Analysis of Texas Highway Corridors. Report 0‐5668‐1, Center for Transportation Research at The University of Texas at Austin, July 2009.
47. Guo, Jessica, et al. “Benefit and Cost Analysis of Intercity Bus Service.” TRB 2009 Annual Meeting CD‐ROM, Washington, D.C., January 2009.
48. Nookala, Marthand, and Ata M. Khan. “Cost‐Efficiency of Intercity Bus Technology Innovations.” Transportation Research Record 1125, Transportation Research Board, Washington, D.C., 1987, pp. 57‐63.
49. Morgan, Curtis, et al. TxDOT Project 5930: Potential Development of an Intercity Passenger Transit System in Texas, Technical Memo, Tasks 2 and 3 (unpublished). June 5, 2008.

82
50. Colorado Department of Transportation, Ports to Plains. “Corridor Map.” July 14, 2004.
[Cited: February 9, 2011.] http://www.coloradodot.info/library/studies/ports2plains/ corridormap7142004.jpg/view.
51. TxDOT, La Entrada al Pacifico. “Project Map.” [Cited: February 9, 2011.] ftp://ftp.dot.state.tx.us/pub/txdot‐info/library/projects/la_entrada/project_map.pdf.
52. El Paso County Transit. Vamonos: The Road Map for Regional Coordinated Public Transportation, West Texas/El Paso Region. El Paso, Texas, December 1, 2006.
53. El Paso Metropolitan Planning Organization. Mission 2035: Metropolitan Transportation Plan. El Paso, Texas, August 6, 2010.
54. Texas Department of Transportation. Texas Rail Plan. Austin, Texas, November 2010. [Cited: January 27, 2011.] http://www.txdot.gov/public_involvement/rail_plan/trp.htm.
55. Caprock Express Passenger Rail. “Caprock Express Proposal.” [Cited February 8, 2011.] http://0048534.netsolhost.com/caprock_express.htm.
56. Bureau of Transportation Statistics. The U.S. Rural Population and Scheduled Intercity Transportation in 2010: A Five‐Year Decline in Transportation Access. U.S. Department of Transportation Research and Innovative Technology Division, Washington, D.C., February 2011.

University Transportation Center for Mobility™
Texas Transportation Institute
The Texas A&M University System
College Station, TX 77843-3135
Tel: 979.845.2538 Fax: 979.845.9761
utcm.tamu.edu
TexasTransportationInstitute