final report: recommended guidelines for the selection of
TRANSCRIPT

Final Report:
Recommended Guidelines for the Selection of Test Levels 2
through 5 Bridge Railings
NCHRP 22-12(03) February 10, 2014
Malcolm H. Ray, P.E., Ph.D.
Christine E. Carrigan, P.E., Ph.D.
P.O. Box 312
12 Main Street
Canton, Maine 04221
Limited Use Document
This Final Report is furnished only for review by members of the NCHRP
project panel and is regarded as fully privileged. Dissemination of information
included herein must be approved by NCHRP.


i
TABLE OF CONTENTS
List of Tables ...................................................................................................................... v List of Figures ................................................................................................................... vii
Introduction ......................................................................................................................... 1 Literature Review................................................................................................................ 3
Exemplar Crashes ........................................................................................................... 4
Crashes in the Media ................................................................................................... 4
Crashes Investigated by the National Transportation Safety Board ......................... 23
Crash Testing ................................................................................................................ 31
NCHRP Report 230 .................................................................................................. 33
1989 AASHTO Guide Specification for Bridge Railings ........................................ 33
NCHRP Report 350 .................................................................................................. 35
Manual for Assessing Safety Hardware (MASH) .................................................... 36
High Containment Barriers ....................................................................................... 37
Guidelines and Specifications ....................................................................................... 41
FHWA and AASHTO ............................................................................................... 41
The States .................................................................................................................. 49
International Specifications ...................................................................................... 58
Summary ................................................................................................................... 67
Crash Data Studies ........................................................................................................ 70
FHWA Narrow Bridge Study ................................................................................... 70
NCHRP 22-08 ........................................................................................................... 72
Kansas Bridge Rail Study ......................................................................................... 73
Analysis Methods for Bridge Railing Selection ........................................................... 74
BCAP ........................................................................................................................ 75
RSAP......................................................................................................................... 78
RRRAP ..................................................................................................................... 80
Risk Analysis ............................................................................................................ 81
Conclusions ................................................................................................................... 82
Results Of Survey Of Practice .......................................................................................... 85 Introduction ................................................................................................................... 85
Survey Questions .......................................................................................................... 85
Summary ....................................................................................................................... 95
Development of Bridge Rail Selection Guidelines ........................................................... 97
Crash Data ..................................................................................................................... 97
New Jersey Median Barrier ...................................................................................... 98

ii
Massachusetts Median Barrier .................................................................................. 99
Washington State Median Barrier ........................................................................... 101
Pennsylvania Bridge Railing................................................................................... 102
Ohio Bridge Railing ................................................................................................ 104
Nebraska Bridge Rails ............................................................................................ 107
After Penetration Hazards ....................................................................................... 109
Summary of Crash Data .......................................................................................... 110
Encroachment ............................................................................................................. 110
Encroachment models for roads over capacity ....................................................... 111
Low-Volume Encroachments ................................................................................. 112
Annual Traffic Growth ........................................................................................... 112
Traffic Mix Considerations ..................................................................................... 112
Truck Trajectories ................................................................................................... 116
Encroachment Adjustments for Site-Specific Characteristics ................................ 128
Crash ........................................................................................................................... 130
Predicted Penetration, Rollovers and Vaults .......................................................... 130
Severity ....................................................................................................................... 135
Bridge Railing Crash Severity ................................................................................ 136
Bridge Railing Penetration Severity ....................................................................... 137
Costs ............................................................................................................................ 139
Project Life.............................................................................................................. 140
Regional Cost Variations ........................................................................................ 140
Temporal Cost Variations ....................................................................................... 146
Bridge Railing Agency Costs.................................................................................. 149
Bridge Railing Crash Costs ..................................................................................... 150
Sight Distance Considerations .................................................................................... 154
Analysis Methods........................................................................................................ 157
Benefit-Cost versus Risk Approach ........................................................................ 158
Developing the Selection Guidelines ...................................................................... 159
Selection Guidelines ....................................................................................................... 167 Bridge Rail Risk Assessment Process ........................................................................ 167
Discussion ................................................................................................................... 176
Implementation ....................................................................................................... 176
Critical Values for Design ...................................................................................... 177
Test Levels Considerations ..................................................................................... 178

iii
The Risk Line .......................................................................................................... 179
Recommended Selection Guidelines Verification ...................................................... 181
Comparisons to the 1989 AASHTO Guide Specification and NCHRP 22-08 ....... 181
Example Bridge Railing In Service ........................................................................ 182
CONCLUSIONS............................................................................................................. 191 APPENDIX A: Alternative Graphs for Figure 52 ......................................................... 193 APPENDIX B: Bridge Rail Selection Guidelines ......................................................... 203
Bridge Rail Risk Assessment Process ........................................................................ 205
REFERENCES ............................................................................................................... 215

iv

v
LIST OF TABLES
Table 1. Crash Test Acceptance Equivalencies from the FHWA. [Horne97] ............................. 36 Table 2. Approximate Crash Test Acceptance Equivalencies. [after Horne97] .......................... 37
Table 3. Summary of test information for selected heavy tractor-trailer crash tests. .................. 40 Table 4. 60 mi/hr portion of the 1989 GSRB selection table.[AASHTO89] ............................... 43 Table 5. Bridge railing capacity recommendations in BCAP and NCHRP 22-08.[after Mak94] 45 Table 6. Revised selection guidelines for bridge railings based on NCHRP 22-08. [Mak94] .... 47 Table 7 Summary of Minnesota “TABLE 13.2.1: Standard Rail Applications” [MNDOT06] 52
Table 8. EN 1317 Containment Levels Pertaining to Bridge Railings ........................................ 59 Table 9. Austrian containment level selection guidelines. .......................................................... 60 Table 10 Alberta Canada Roadside Design Guide Bridge Rail Specifications ........................... 60 Table 11. Bridge Height and Occupancy Factors ......................................................................... 62 Table 12. German bridge railing selection guidelines. ................................................................ 64
Table 13. Composition of Traffic by Category. [Italy11] ........................................................... 65
Table 14. Bridge Railings and Other Roadside Barriers by Traffic Category. [Italy11] ............. 65 Table 15. Summary of R350 Bridge Railing Selection by Highway Function. .......................... 68 Table 16. Summary of R350 Bridge Rail Selection Guidelines for Heavy Vehicle
Accommodation. ................................................................................................... 69 Table 17. Summary of R350 Bridge Rail Selection Guidelines by Combination of Selectors. .. 69
Table 18. Summary of R350 Bridge Rail Selection Guidelines by Geometric Design
Considerations....................................................................................................... 70 Table 19. Barrier Performance in Narrow Bridge Crashes. [FHWA83] ..................................... 71
Table 20. Penetration and rollover percentage in Texas bridge railing crashes. [Mak94] .......... 73 Table 21. Crash Costs used in BCAP. [AASHTO89] ................................................................. 78
Table 22. Question 2 Average Values. ......................................................................................... 87 Table 23. New Jersey Turnpike Crash Severity Distribution. ...................................................... 99
Table 24. NJTA After Barrier Contact Behavior. ......................................................................... 99 Table 25. Massachusetts Crash Severity Distribution. ............................................................... 100
Table 26. Massachusetts After Barrier Contact Behavior. ......................................................... 101 Table 27. Washington State Crash Severity Distribution. .......................................................... 101 Table 28. Washington State After Barrier Contact Behavior. .................................................... 101 Table 29. Pennsylvania Crash Severity Distribution. ................................................................. 103
Table 30. Pennsylvania Bridge Rail After Barrier Contact Behavior. ........................................ 103 Table 31. Ohio Crash Severity Distribution. .............................................................................. 106 Table 32. Ohio Bridge Rail After Barrier Contact Behavior. ..................................................... 107 Table 33. Nebraska Crash Severity Distribution. ....................................................................... 108 Table 34. Nebraska Bridge Rail After Barrier Contact Behavior. .............................................. 109
Table 35. Severity Distributions for After Penetration Hazards ................................................. 110
Table 36. Total Encroachment Frequency by AADT and Highway Type. ............................... 111
Table 37. Percetile of Gross Truck Weights for Classes 5 and 9. After [MEPDG04] .............. 113 Table 38. Vehicle Mix Used in RSAP to Develop the Guidelines. ........................................... 115 Table 39. Vehicle Properties Used in RSAPv3. ........................................................................ 116 Table 40. National Traffic Volumes, Crashes, and Crash Rates by Year. ................................. 120 Table 41. NHTSA FARS/GES Crash Data and Crash Rates. ................................................... 121 Table 42. National Heavy Vehicle Crashes Per 100MVMT. .................................................... 122 Table 43. NJ Turnpike Ran Off Road Left Crash Rates, 2005. ................................................. 123

vi
Table 44. NJ Turnpike Ran Off Road Left Crash Rates, 2006. ................................................. 124
Table 45. NJ Turnpike Ran Off Road Left Crash Rates, 2007. ................................................. 125 Table 46. NJ Turnpike Ran Off Road Left Crash Rates, 2008. ................................................. 126 Table 47. Truck/Bus Crash Rate Multipliers, by Year and Link. .............................................. 127
Table 48. Grade (Fgrade) Adjustment Factor. .............................................................................. 128 Table 49. Horizontal Curve (Fhcurv) Adjustment Factor. ............................................................ 128 Table 50. Bridge Railing Load Capacities. ................................................................................ 132 Table 51. RSAPv3 Predictions of Penetration and Rollovers compared to NCHRP 22-08
TXDOT Crash Data. ........................................................................................... 134
Table 52. Comparison to Crash Data of RSAPv3 predictions of Penetrating, Rolling over or
Vaulting the Bridge Railing for all Vehicle Classes. .......................................... 135 Table 53. Comparison of 1988-1990 TXDOT Bridge Crash Data for bridges built after 1965
with RSAPv3 Predictions for MASH TL3. ........................................................ 135
Table 54. EFCCR65 of Longitudinal Barriers used in RSAPv3.[after Ray12] .......................... 136 Table 55. Bridge Railing Penetration Hazard Severities. .......................................................... 139
Table 56. Crash Cost Adjustments by State to the National Average. [After Bahar11] ............ 144 Table 57. Comprehensive Crash Costs by Year. ....................................................................... 147
Table 58. National Average Construction Costs for Closed-Profile Concrete Bridge Railings.
............................................................................................................................. 149 Table 59. Annual Number and 2005 Cost of Truck Crash by Injury Severity and Truck Type.
[After Zaloshnja06] ............................................................................................. 151 Table 60. 2005 Cost of All Truck Crashes by Injury Severity and per Victim. [After
Zaloshnja06] ....................................................................................................... 152 Table 61. NSC Economic Impact Crash Costs.[NSC11] ........................................................... 153 Table 62. Summary of the Cost of Bridge Rail Crashes in the Media....................................... 153
Table 63. Summary of the Cost of Bridge Rail Crashes Investigated by NTSB. ...................... 154
Table 64. Minimum Radius and Maximum Degree of Curve Based on the Horizontal Sight
Distance Obstruction from a TL4 or TL5 Bridge Railing. ................................. 157 Table 65. Police Reported Crash Severity by Crash Cost and EFCCR. .................................... 163
Table 66. Probability a Collision Will Result in a Severe or Fatal Injury by Hazard Environment
and MASH Test Level. ....................................................................................... 166
Table 67. Encroachment Adjustments. ...................................................................................... 171 Table 68. AADT – Lifetime Encroachments per 1,000-ft of Bridge Railing. ........................... 172
Table 69. Comparison of Impact Conditions for Report 350 and MASH ordered by Impact
Severity. .............................................................................................................. 178 Table 70. Approximate Crash Test Acceptance Equivalencies. [after Horne97] ...................... 182 Table 71. Selected Examples of Existing Bridge Railings Compared to the Recommended
Selection Guidelines. .......................................................................................... 186

vii
LIST OF FIGURES
Figure 1. Mileage of Public Roads and Bridges. ........................................................................... 3 Figure 2. Miles of Urban and Rural Bridges.................................................................................. 4
Figure 3. Damage to bridge railing, St. Petersburg, FL... .............................................................. 5 Figure 4. Final position of the single-unit truck and bus, St. Petersburg, FL. ............................... 6 Figure 5. Tractor trailer truck penetration of bridge rail, Glenmont, NY. ..................................... 7 Figure 6. Tractor trailer truck which penetrated the Wiehlthal Bridge, Germany. [Wiehltal04] .. 8 Figure 7. Result of a truck penetrating the Bay Bridge, San Francisco, CA. ................................ 9
Figure 8. Location of two heavy vehicle crashes where a bridge rail was penetrated, Boston,
MA. [WBZ07]......................................................................................................... 9 Figure 9. Truck in flames under bridge after penetrating the rail, Avon, CO. [Avon12] ............ 11 Figure 10. Damaged W-beam bridge rail and final position of truck on local road under bridge,
Avon, CO. [Avon12]............................................................................................. 11
Figure 11. Cab of tractor-trailer penetrated rail and fell to road below, trailer remained on
bridge, Syracuse, NY. [Syracuse12] ..................................................................... 12 Figure 12. Site of bridge railing penetration, Syracuse, NY. [Syracuse12] ................................. 13 Figure 13. Truck Came to Rest on Railroad Tracks, Montreal, Quebec. [GAZ01] ..................... 14
Figure 14. W-beam Guardrail Roadside Barrier, Montreal, Quebec. [Google Earth] ................. 14 Figure 15. Removal of Bus from the Bottom of Gorge, Avellino, Italy. [BBC01] ..................... 15
Figure 16. Pickup Truck After Rail Penetration, Beaverton, OR. [ORHER01] .......................... 16 Figure 17. Beaverton Bridge Rail Before Crash, Beaverton, OR. [Google Earth] ...................... 16 Figure 18. Bronx River Parkway, near crash site, Bronx, NY. [GoogleEarth]. ......................... 17
Figure 19. State Highway 161 where Truck Landed, Grand Prairie, TX. [WFAA01] ................ 18 Figure 20. State Highway 161 where Truck Landed, Grand Prairie, TX. [WFAA01] ................ 19
Figure 21. Boston Beer Truck Penetration, Boston, MA. [WBZ01] ........................................... 20 Figure 22. Close-Up of Bridge Rail Type (upper left) and Exit 26 Ramp Truck, Boston, MA.
[Google Earth] ...................................................................................................... 20 Figure 23. Truck in Final Resting Position, Buellton, CA . [MOUK01] ..................................... 21
Figure 24. Rescue Workers Stabilizing Car and Freeing Passengers Buellton, CA. [MOUK01] 22 Figure 25. Gates Bridge, Galesburg, IL. [Google Earth] ............................................................. 22 Figure 26. Recreational Vehicle Location in Ravine, Williamsburg, KS. [MOUK02] ............... 23 Figure 27. Hazardous material truck crash near Houston, Texas in 1976. [NTSB77e] ............. 26
Figure 28. Crash site in Elkridge, MD where a fuel truck penetrated a concrete bridge railing.
[NTSB09a] ............................................................................................................ 27 Figure 29. Final rest position of a school bus that penetrated a concrete bridge railing near
Huntsville, AL in 2006. [NTSB09b]..................................................................... 28 Figure 30. Site of a motorcoach bus crash in Sherman, TX, 2008. [NTSB09c].......................... 29
Figure 31. Tractor Trailer Truck Penetration of Concrete Median Barrier. ................................ 32
Figure 32. Single-Unit Truck Rolling Over Concrete Bridge Rail. ............................................. 32
Figure 33. Instrumented crash wall. [Noel81] ............................................................................. 34 Figure 34. The only crash-tested TL6 bridge railing. [Hirsch85] ................................................ 38 Figure 35. 50,000-lbs tractor trailer impacting a 42-inchl bridge railing. [Menges95] ............... 39 Figure 36. Portion of the Alberta bridge rail severity index selection table. [Alberta11b] ......... 63 Figure 37. Distribution of Reponses to Question 2. .................................................................... 87 Figure 38. Distribution of Question 10 Results. .......................................................................... 93 Figure 39. Ohio Standard Drawing BR-1 [OH11a] ................................................................... 105

viii
Figure 40. Mean Axle Load by Vehicle Classification. ............................................................. 114
Figure 41. RSAPv3 Crash Prediction Module Flow Chart. ....................................................... 131 Figure 42. Lane Mile Cost Comparison by State. [after WSDOT09] ....................................... 143 Figure 43. Regional Crash Cost and Construction Cost Adjustment Factors . .......................... 145
Figure 44. NHCCI Index for 2003 through 2010. ...................................................................... 146 Figure 45. Comparison of Annual VSL to NHCCI Index Updates. .......................................... 148 Figure 46. Minimum Horizontal Curve Radius Based on Barrier Obstruction to the Stopping
Sight Distance Compared to AASHTO Exhibit 3-14. ........................................ 156 Figure 47. Cooper Encroachment Frequency Data [after Ray12] ............................................. 162
Figure 48. Cooper Encroachment Rate by Lane Volume. [after Ray12] ................................... 162 Figure 49. Cumulative EFCCR Distribution for TL2 and TL5 Bridge Railings. ...................... 164 Figure 50. AADT – Lifetime Encroachments/1,000-ft of Bridge Railing Nomograph. ............ 173 Figure 51. Minimum Horizontal Curve Radius Based on Barrier Obstruction to the Stopping
Sight Distance Compared to AASHTO Exhibit 3-14. ........................................ 174 Figure 52. Test Level Selection Nomograph (Risk<0.01 in 30 years for 1000 ft of bridge
railing). ................................................................................................................ 175 Figure 53. Comparison of 89GSBR, NCHRP22-08 with Risk values. ..................................... 183
Figure 54. 89GSBR, NCHRP22-08 with BCR values. .............................................................. 184 Figure 55. 89GSBR, Risk and BCR comparison. ...................................................................... 185 Figure 56. Test Level Selection Nomograph (Risk<0.005 in 30 years for 1000 ft of bridge
railing). ................................................................................................................ 195 Figure 57. Test Level Selection Nomograph (Risk<0.02 in 30 years for 1000 ft of bridge
railing). ................................................................................................................ 196 Figure 58. Test Level Selection Nomograph (Benefit-Cost Ratio=1). ...................................... 197 Figure 59. Test Level Selection Nomograph (Benefit-Cost Ratio=2). ..................................... 198
Figure 60. Test Level Selection Nomograph (Benefit-Cost Ratio=3). ..................................... 199
Figure 61. Rehabilitation Nomograph: Upgrade from R350 TL4 to MASH TL5.*................. 200 Figure 62. Rehabilitation Nomograph: Upgrade from R350 TL3 to MASH TL4 or MASH
TL5.* ................................................................................................................... 201
Figure 63. Rehabilitation Nomograph: Upgrade from R350 TL3 to MASH TL5.................... 202

1
INTRODUCTION
There has been interest for several decades in developing selection guidelines for the
multiple performance, service or test levels for bridge railings in the roadside safety community.
Since bridges cross over large spans of space they often cross significant features such as busy
transportation corridors. In addition, bridges carry heavy vehicles sometimes with dangerous
cargos, such as fuel and hazardous chemicals. The consequences to public safety of a heavy
truck penetrating through or rolling over a bridge railing or a passenger vehicle vaulting a bridge
railing present additional risks not considered for crashes with other types of roadside barriers.
Numerous bridge railings have been designed and crash tested in the past several decades
according to one of the several multiple test level approaches so there are a wide variety of
different test level bridge railings available. What has never been established, however, are the
criteria for selecting when a higher test level railing is needed based on the specific traffic and
site characteristics of individual bridges. The American Association of State Highway and
Transportation Officials (AASHTO) Roadside Design Guide (RDG) and LRFD Bridge Design
Specification recognize the multiple test level approach but give only very general guidance
about why a higher test level bridge railing might be used. [AASHTO06] At present, highway
agencies must make decisions on which test level is appropriate for each site on an ad hoc basis.
The objective of this project was to develop proposed selection guidelines to assist bridge
engineers and highway designers in selecting an appropriate test level for bridge railings based
on specific site and traffic conditions. The focus of the study was on TL2 through TL5 railing.
TL1 bridge railings involve very low volume and low speed applications which are not widely
encountered and are generally not considered practical except in some special situations like park
roads. At the other end of the spectrum, TL6 bridge railings are presumably intended for
locations where the severity of a penetration or rollover would be exceptionally catastrophic. A
TL6 bridge railing would be warranted to maintain public support for the highway project, even
if the barrier is not necessarily cost effective. In addition, there is only one crash tested TL6
bridge railing available at this time. It requires specially designed deck details to support the
impact loads and additional dead load of the barrier. The vast majority of bridge railings that
will be practical for use are, therefore in the TL2 through TL5 range.
The basic approach used in this project was a risk-based approach where the frequency
and severity of crashes with bridge railings are estimated and the risk of observing a serious or
fatal injury crash calculated. The third version of the Roadside Safety Analysis Program (RSAP)
was developed to perform cost-benefit analysis, but was expanded during this research effort to
preform risk-analyses as well. This report documents the research conducted to populate the
RSAP database, run the RSAP simulations, and the resulting selection guidelines for the
selection of MASH TL2 through TL5 bridge railings. The literature reviewed and a survey of
practitioners are presented in the first several chapters, the data gathered and the analysis
conducted is presented alongside a discussion of the decisions made throughout the research in
subsequent chapters. Finally, the proposed selection process and selection tables to accompany

2
the process are presented at the end of the document with accompanying discussion and
alternative selection tables for use in the establishment of policy. The recommendations are
presented in their entirety in Appendix B for a quick reference.

3
LITERATURE REVIEW
According to a Federal Highway Administration (FHWA) sponsored study in the 1980’s,
there are about 500,000 bridges in the U.S., about half of them on the National Highway System.
[Mak83] Mak also found that the fatal crash rate was about three times higher on bridges than
on similar road segments. [Mak83] One of the consequences of Mak’s findings was a steady
evolution in the guidelines for the design and testing of bridge railings. In the 1980’s, bridge
railings did not have to be crash tested and many bridge railings were found to be structurally
inadequate. Persistent research and testing in the past several decades has provided many
improved bridge railings with crash-test demonstrated impact performance.
The increase in miles of public road and miles of bridges have increased at about the
same pace over the last ten years with bridges consistently remaining approximately 0.40 percent
of the total mileage as shown in Figure 1.[FHWA12a] The mileage of urban bridges, however,
is increasing at a faster pace than rural bridges (Figure 2) indicating that more bridge rail
penetrations in more sensitive urban areas may become more common in the future. [FHWA12a]
Figure 1. Mileage of Public Roads and Bridges.
3,940,000
3,960,000
3,980,000
4,000,000
4,020,000
4,040,000
4,060,000
4,080,000
4,100,000
15,000
15,200
15,400
15,600
15,800
16,000
16,200
16,400
16,600
2000
2001
2002
2003
2004
2005
2006
2007
2008
2009
2010
2011
Mil
es o
f P
ub
lic
Road
ways
Mil
es o
f B
rid
ges
Year
Bridges
Public Road

4
Figure 2. Miles of Urban and Rural Bridges.
Exemplar Crashes
The rare occasions when a bridge railing fails to restrain an errant vehicle often results in
dramatic crashes. Such crashes have the potential to involve loss of life, the involvement of
multiple vehicles, extensive property damage and significant traffic delays. While they do not
occur often, when they do occur they nearly always are reported in the news media and demand
public attention. The purpose of this next section is to review some bridge railing crashes that
have appeared in the media and that have been investigated by the National Transportation
Safety Board (NTSB) in order to gain a perspective on both the causes and consequences of
bridge railing failures. An appreciation of the causes and consequences will be vital to properly
selecting appropriate test levels based on the traffic, and the operational and site conditions of a
particular bridge.
Crashes in the Media
St. Petersburg, Florida, 2001
On January 1st of 2001 a single-unit truck was travelling south on I-275 across a bridge
over 54th
Avenue South in St. Petersburg, Florida when the truck struck the bridge railing. The
impact fractured the concrete railing and the front axle was separated from the truck allowing the
axle and pieces of the concrete railing to fall into the bed of a pickup travelling on the roadway
below. The axle-less vehicle continued downstream where it straddled the concrete barrier and
vaulted over the top, coming to rest in the lanes of 54th
Avenue South below where it struck a
5,000
5,500
6,000
6,500
7,000
7,500
8,000
8,500
9,000
9,500
10,000
2000
200
1
200
2
200
3
200
4
200
5
200
6
200
7
200
8
200
9
201
0
201
1
201
2
Mil
es o
f B
rid
ges
Year
Rural miles
Urban miles

5
bus. The driver of the bus was killed and two other people were injured in the crash. Concrete
and vehicle debris struck at least three vehicles in addition to the bus. The barrier damage from
the initial impact with the single-unit truck is shown in Figure 3. The skid marks in Figure 3
suggest a relatively high impact angle. Other information from the scene suggest the single-unit
truck left the roadway on the right and then crossed two lanes before striking the bridge railing
on the left. The final positions of the single-unit truck and bus are shown in Figure 4.
[Alberson04]
Figure 3. Damage to bridge railing, St. Petersburg, FL...

6
Figure 4. Final position of the single-unit truck and bus, St. Petersburg, FL.

7
Glenmont, New York, 2007
Figure 5 shows an example of a tractor
trailer truck that penetrated a bridge railing in
New York State that was clearly not designed to
restrain heavy vehicles. There were apparently
no serious injuries in the crash but Figure 5
illustrates the potential dangers for facilities
beneath the roadway when a heavy vehicle
penetrates the bridge railing.
Wiehlthal Bridge, Germany, 2004
There have even been a few instances
where a truck crash caused major structural
damage to the bridge requiring the replacement
of the bridge itself. Figure 6, for example,
shows the result of a truck crash in 2004 on the
Wiehlthal Bridge in Germany. On August 26,
2004 a passenger car collided with a fuel tanker
truck on the Wiehlthal Bridge on the A4
motorway between Cologne and Olpe,
Germany. The fuel tanker truck, which was
carrying 8,500 gallons of fuel, penetrated the
bridge railing, fell 100 ft. and then burst into
flames, killing the driver. The flames burning under the bridge structure caused the steel to
deform and lose its load-bearing capacity resulting in the closure of the bridge and the need to
completely replace it. Temporary repairs to restore traffic cost the equivalent of $42 million.
The total crash cost has been estimated at nearly $400 million; certainly one of the most
expensive traffic crashes in history.
Figure 5. Tractor trailer truck
penetration of bridge rail, Glenmont, NY.

8
Figure 6. Tractor trailer truck which penetrated the Wiehlthal Bridge, Germany. [Wiehltal04]
San Francisco, California, 2009
Figure 7 shows the result of a tractor trailer truck penetrating the bridge railing on the
Bay Bridge between Oakland and San Francisco, California in November 2009.[Zimbio09] The
truck fell 200 ft. onto an island, killing the driver. According to news reports, traffic was
stopped on this bridge, which carries 250,000 vehicles/day, for over nine hours. Such long
delays affecting such large numbers of people create a significant travel delay cost. These costs
are not captured in the usual crash cost data.

9
Boston, Massachusetts, 2007
On Tuesday April 2nd, 2007 a
tractor trailer truck was traveling on the
entrance ramp to I-93 south in Charleston
Massachusetts. [WBZ07; Globe07;
Boston07] The truck struck a 30-inch tall
concrete safety shape barrier on a
horizontally curved elevated ramp and
rolled over the barrier resulting in a 70 foot
free fall onto another elevated on-ramp
below. The tractor trailer struck a luminaire
and fell on to a sport utility vehicle
traveling on the ramp below.
While the driver of the sport utility
vehicle and the truck driver were both
hospitalized with non-life threatening
injuries, the situation could have been much
worse. The crash happened at off-peak
travel hours so there were relatively few
vehicles travelling on the ramp below. If
the crash had occurred during the peak
travel hours, the truck would have fallen
onto many more vehicles. Also, the ramp
the tractor trailer truck fell onto was also an
Figure 7. Result of a truck penetrating the Bay Bridge, San Francisco, CA.
Figure 8. Location of two heavy vehicle crashes
where a bridge rail was penetrated, Boston, MA.
[WBZ07]

10
elevated ramp that crossed over the passenger rail lines to North Station. With only slightly
different impact conditions the truck could have easily struck vehicles on the lower ramp and
continued to fall onto the rail line where it may have been struck by a passenger train. The
consequences of such a crash could have jeopardized the health and safety of hundreds of people
in this highly congested heavily urbanized area especially if the truck had been carrying fuel or a
hazardous cargo. This particular crash, unfortunately, was not an isolated event since a very
similar crash occurred at essentially the same location only a few months before.
The bridge railing at this site was essentially a TL3 F-shape concrete barrier. According
to the project design documentation, the railing was originally intended to have a metal top rail
which would have made it a TL4 bridge railing. The TL4 railing appears to have been “value
engineered” out of the project to save funds. The crash history at this site suggests that a TL3
railing was perhaps not the best choice for this heavily travelled roadway with such potential for
catastrophic crashes.
Amesbury, Massachusetts, 2011
A fatal bridge railing crash occurred on I-95 in Amesbury, Massachusetts involving a
small passenger car in 2011. [Eagle-Tribunne11] While driving northbound on I-95 on the
approach to the Whittier Bridge over the Merrimack River in Amesbury, Massachusetts, a 64-
year old man lost control of his 2002 Toyota Camry and struck the bridge railing. The vehicle
vaulted over the bridge railing and fell 100 feet into the Merrimack River where it sank another
20 feet to the river bottom. An extensive search and rescue effort was required to locate the
vehicle and driver but, unfortunately, the driver died as a result of the crash. The bridge railing
at this site appears to be a 32-inch tall concrete safety shape. There appear to have been tall
snow banks in front of the barrier that may have contributed to the vehicle vaulting over the
railing. This crash points out that while heavy vehicles have more energy and are often
associated with bridge rail penetrations and rollovers, passenger vehicles can also vault or roll
over bridge railings.
Avon, Colorado, 2012
Sunday, May 13, 2012 at 9:45 AM in Avon, Colorado, a tandem trailer truck lost control
in the I-70 westbound lane and penetrated the Avon Road overpass. One of the trailers landed on
a Honda CRV traveling south on Avon Road, crushing the driver's side of the vehicle. Both of
the occupants of the Honda CRV were unharmed. However, the truck driver was fatally injured.
A witness said “…the rear trailer had become detached and was traveling at a high rate of
speed, both airborne and facing backwards when it flew off the highway and landed on the CRV.
Moments later, the cab and trailer to which it was attached also tumbled off the overpass”
leading to an explosion and fire (Figure 9). Figure 10 shows the w-beam rail in place at the time
of the crash. [Avon12]

11
Figure 9. Truck in flames under bridge after penetrating the rail, Avon, CO. [Avon12]
Figure 10. Damaged W-beam bridge rail and final position of truck on local road under
bridge, Avon, CO. [Avon12]

12
Syracuse, New York, 2012
On July 22, 2012, the front cab of a tractor-trailer penetrated a concrete bridge rail in
Syracuse, New York and dropped 25 feet. The two occupants of the cab were injured, but
responsive after the crash. The tractor-trailer was traveling north on Interstate 81 and penetrated
the rail between Erie Boulevard East and Water Street. The frame, motor and the axle remained
hanging from the bridge (Figure 11, Figure 12). About 100 gallons of diesel fuel was
spilled.[Syracuse12]
Figure 11. Cab of tractor-trailer penetrated rail and fell to road below, trailer remained
on bridge, Syracuse, NY. [Syracuse12]

13
Figure 12. Site of bridge railing penetration, Syracuse, NY. [Syracuse12]
Montreal, Quebec, 2011
On Wednesday, December 28th
, 2011 a pickup truck traveling west on the Sainte Anne de
Bellevue Road near the entrance to Highway 20 lost control and left the roadway. The vehicle
flipped off an overpass and fell onto railway tracks, where it was then hit by a train (Figure 13).
Both occupants of the pickup truck died in the crash. Police speculated poor visibility and
slippery roads may have played a role. [CBC01] The section of roadway that runs over the
railroad tracks had a w-beam guardrail as the only barrier, as can be seen in Figure 14, however,
after the crash occurred, Transport Quebec installed a concrete barrier at the location.

14
Figure 13. Truck Came to Rest on Railroad Tracks, Montreal, Quebec. [GAZ01]
Figure 14. W-beam Guardrail Roadside Barrier, Montreal, Quebec. [Google Earth]

15
Avellino, Italy, 2013
On July 29th
, 2013, a bus carrying around 50 people hit several vehicles before
penetrating a bridge rail and falling 98 ft. into a gorge near Avellino, Italy. (Figure 15) At least
38 people were killed in the crash, with an additional 10 people injured. [BBC01] The rail type
is unknown.
Figure 15. Removal of Bus from the Bottom of Gorge, Avellino, Italy. [BBC01]
Beaverton, Oregon, 2012
On Saturday, November 24, 2012 in Beaverton, Oregon a crash resulted in a pickup truck
hanging from the SW Denney bridge railing over HWY 217. The driver was the only occupant
(Figure 16). Fire and rescue personnel responded and secured the truck to a fire engine to keep
the truck from falling off the bridge. A fire engine equipped with a basket was used to get the
driver out of the truck safely. [KATU01] The bridge railing appears to be a PL2 system named
the “Foothills Parkway Bridge Railing,” approved under AASHTO Guide Specification for
Bridge Railings. The railing as it appeared before the impact is shown in Figure 17.

16
Figure 16. Pickup Truck After Rail Penetration, Beaverton, OR. [ORHER01]
Figure 17. Beaverton Bridge Rail Before Crash, Beaverton, OR. [Google Earth]

17
Bronx, New York, 2012
On April 29th
, 2012, a white 2004 a white Honda Pilot minivan “…was traveling
southbound at about 70 mph in a 50-mph zone of the Bronx River Parkway when the 12:30 p.m
accident occurred.” [NYDN01] The minivan lost control while driving southbound on the Bronx
River Parkway and hit the single-slope median barrier. After striking the barrier, the minivan
veered to the right, crossed three lanes of traffic, struck the curb on the right side of the road and
vaulted over an older style metal post and tube bridge rail. “The car never even touched the 4-
foot-high iron guardrail, though it left traces of motor oil on the rail as it sailed over it.” There
were no skid marks found on the road before the first impact, however, there were skid marks
leading up to where the van left the bridge. [NYDN01] The vehicle fell 60ft off of the bridge,
landing on its roof in a wooded area. All seven passengers, including three children, were killed
instantly. [CNN01]
Less than a year earlier, in the same section of the Bronx River Parkway, a second crash
occurred. On June 4, 2011, two people were uninjured after the driver lost control of the vehicle,
“… flew off a parkway overpass, and landed 22 feet below in the parking lot of a police station.
The media report the 2005 Acura was speeding while traveling north in the left lane before it
slammed into a concrete median barrier. “Then, it flew across both lanes of traffic, crashing
through a guard rail and a chain link fence before partially landing on an officer's GMC pickup
truck in the parking lot of the NYPD 12th district station in Morris Park.” [WPIX01]
A picture of the approximate location of both crashes can be seen in Figure 18, courtesy
of Google Earth.
Figure 18. Bronx River Parkway, near crash site, Bronx, NY. [GoogleEarth].

18
Grand Prairie, Texas, 2013
On August 3rd
, 2013 a tractor trailer was traveling westbound on Interstate 30 in Grand
Prairie, Texas when the truck veered off the right shoulder. The truck penetrated the guardrail,
then struck the bridge abutment and continued down the embankment in between the guardrail
and abutment until it crashed down onto State Highway 161 below. [KVUE01] The truck landed
on State Highway 161 and hit a single slope concrete barrier head on, penetrating the barrier
when it burst into flames, narrowly missing the I-30 westbound bridge pier (Figure 19 and Figure
20). The driver died in the crash. There were no other injuries.
While this crash appears not to be technically a bridge railing crash since the vehicle
penetrated the approach guardrail prior to the bridge, it does point out the importance of
guardrail-bridge railing transitions. In particular, typical w-beam guardrails are TL3 devices
whereas bridge railings may be TL3, TL4 or TL5. This crash raises the question of how far in
advance of the bridge railing a higher test level barrier may be needed to prevent this type of
catastrophic heavy vehicle crash.
Figure 19. State Highway 161 where Truck Landed, Grand Prairie, TX. [WFAA01]

19
Figure 20. State Highway 161 where Truck Landed, Grand Prairie, TX. [WFAA01]
Boston, Massachusetts, 2013
On August 6, 2013, a beer delivery truck partially penetrated the bridge rail on I-93 North
resulting in the cab dangling three feet beyond the bridge rail as shown in Figure 21. The driver
and the passenger were uninjured. Traffic on I-93 was significantly slowed, with one commuter
who was stuck in traffic noting: “I’ve gone about 100 feet in an hour.” [WBZ01] This crash
also disrupted commuter traffic on the Orange MBTA subway line since the commuter rail
parallels the highway.
Less than a week later and only a few feet away, on August 9, 2013 a Cadillac struck a
single unit truck on Interstate 93 northbound in Boston, Massachusetts sending the single unit
truck into the bridge rail. The truck vaulted over the rail and landed on the Exit 26 southbound
ramp. The rail type can be seen in Figure 22. Despite falling approximately 40 ft. before
crashing onto the roadway below, the driver of the truck sustained only minor injuries.
[Patriot01, WCVB01]

20
Figure 21. Boston Beer Truck Penetration, Boston, MA. [WBZ01]
Figure 22. Close-Up of Bridge Rail Type (upper left) and Exit 26 Ramp Truck, Boston,
MA. [Google Earth]
Buellton, California, 2012
On January 12, 2012 on Highway 101 in Buellton, California, a trailer truck drifted out of
its lane and sideswiped a car in the lane next to it. [NBC01] After repeatedly pushing the
passenger car into the bridge rail, the wheels of the trailer ran over the car and broke through the
rail. The truck and trailer fell down into the creek below and burst into flames, killing the driver.
(Figure 23) The passenger car was left hanging off the bridge, still containing the driver and two
children. Fortunately, a unit of Navy Seabees was on the adjacent bridge transporting a heavy-
duty forklift which they used to stabilize the vehicle while emergency personnel extracted the
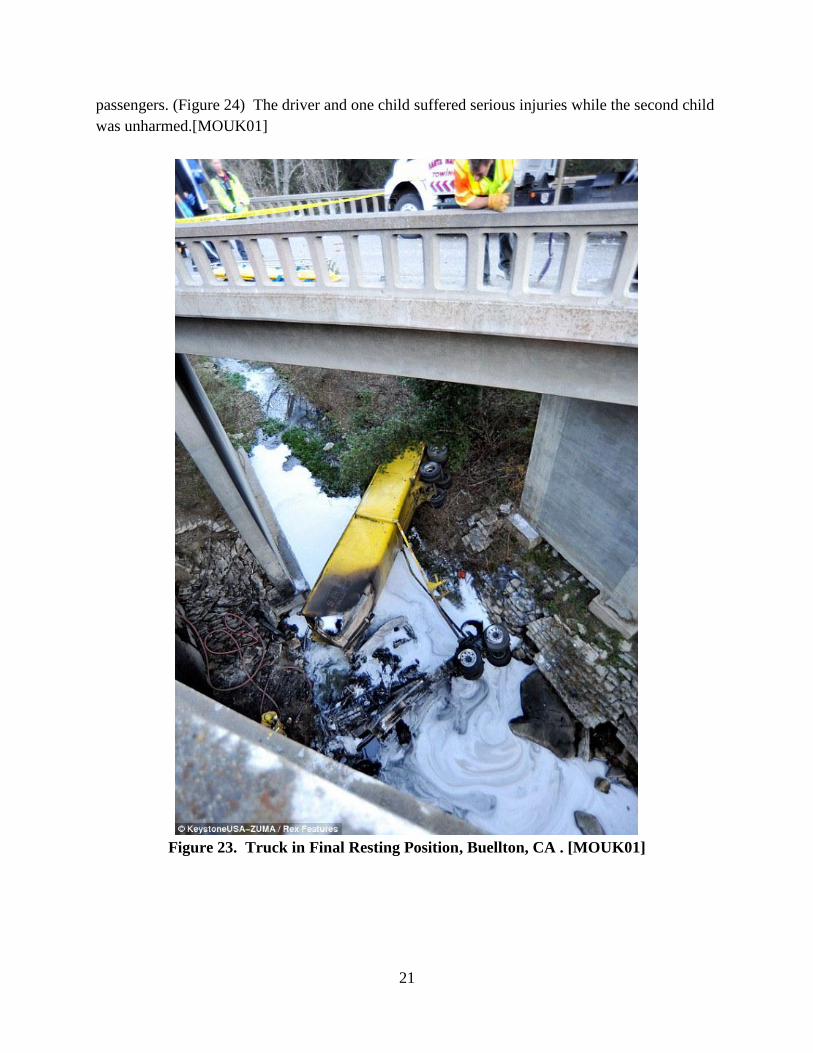
21
passengers. (Figure 24) The driver and one child suffered serious injuries while the second child
was unharmed.[MOUK01]
Figure 23. Truck in Final Resting Position, Buellton, CA . [MOUK01]

22
Figure 24. Rescue Workers Stabilizing Car and Freeing Passengers Buellton, CA.
[MOUK01]
Galesburg, Illinois, 2013
On September 7, 2013, an SUV was involved in a single-vehicle run-off road crash. The
SUV failed to negotiate a curve on U.S. Route 150 on the Gates Bridge. The vehicle went over
the guardrail, landed on the railroad tracks below the bridge, and came to rest in a wooded area
on the south embankment. One person who was partially ejected from the vehicle was killed.
Another passenger was injured in the crash, but the extent of the injuries was not released.
[PJSTAR01] A Google Earth image of the pre-crash area is located in Figure 25.
Figure 25. Gates Bridge, Galesburg, IL. [Google Earth]

23
Williamsburg, Kansas, 2012
A 17-year-old boy with a provisional license was driving a Freightliner motor home that
was pulling a trailer on Interstate 35 when it went off the road, struck a guardrail and crashed
through a bridge rail and fell into a ravine on April 1, 2012. (Figure 26) It is not clear from news
reports if the guardrail was penetrated first or if the bridge railing was penetrated after the
guardrail redirected the vehicle. Of the 18 passengers, five were killed and the remaining 13
were all injured, two critically. [MOUK02]
Figure 26. Recreational Vehicle Location in Ravine, Williamsburg, KS. [MOUK02]
On March 23, 2013, it was announce that the National Transportation Safety Board
(NTSB) would be taking over the investigation of this crash, including looking into laws that
allowed the 17-year-old boy with a provisional license to drive the 57,000 lbs vehicle.
Crashes Investigated by the National Transportation Safety Board
The National Transportation Safety Board (NTSB) investigates and determines the
probable cause of “significant crashes” on highways and other modes of transportation with the
goal of promoting transportation safety and preventing future similar crashes. In total, NTSB
investigates approximately six highway crashes per year, each investigation lasting
approximately 20 months.
NTSB crash investigation teams vary in size from three or four to more than twelve
specialists who routinely handle investigations within their specialized field (i.e., rail, highway,
marine and pipeline). Highway crash teams include specialists with backgrounds such as a truck

24
or bus mechanical expert, a highway engineer, a weather specialist, a human performance
specialist, and survival factors specialist. The team is led by an Investigator-in-Charge.
The following sections contain brief summaries of crashes involving bridge railings
which have been investigated by the NTSB since the mid-1970’s. While from a statistical point
of view, these crashes are anecdotal, they do serve to point out important features of catastrophic
crashes involving bridge railings.
Fort Sumner, New Mexico, 1972
On December 26, 1972, a school bus transporting 34 people was traveling westbound
while a tractor-trailer truck transporting cattle was eastbound on US-60 near Fort Sumner, New
Mexico. [NTSB74] As the truck approached a narrow bridge, the driver swerved to the right
after seeing approaching headlights that appeared to be on his side of the road. The truck struck
a crash cushion at the entrance to the bridge and the right-rear wheel of the trailer mounted the
curb on the bridge. The tractor “snagged” the bridge railing and rotated, mounting the curb and
causing the trailer to jackknife. The bus collided with the jackknifed trailer in the westbound
lanes. Nineteen people in the bus were killed and 15 others sustained a variety of injuries. As a
result of this crash, the NTSB recommended that the FHWA “expedite a program to improve,
where feasible, substandard bridge-rail systems on existing bridges to increase resistance to
pocketing or penetration by impacting vehicles of all classes and redirect those vehicles.
Research, including crash testing, should also be expedited to develop criteria for mandatory
standards for bridge-rail and guardrail designs for new bridge construction (H-74-7).”
[NTSB74]
Nashville, Tennessee, 1973
On July 27, 1973 while traveling through a morning fog a car carrying nine people
penetrated the bridge railing on the Silliman Evans Bridge in Nashville, Tennessee and fell 65
feet to the ground below. Seven passengers and the driver were killed. The barrier on the bridge
was apparently a type of box-beam barrier mounted on a nine-inch curb. As a result of this crash
the NTSB recommended that the FHWA “establish national performance standards, including
dynamic testing procedures, for bridge rail systems. Such standards should extend performance
criteria to include impacts by heavy vehicles and should improve performance characteristics for
impacts by all classes of vehicles. The establishment of these standards should be of high priority
and compliance should be mandatory for all new bridge rail systems used on public roadways
(H-74-18).” [NTSB74]
Siloam, North Carolina, 1975
In the morning of February 23, 1975, an automobile was traveling in a heavy fog when it
penetrated a timber bridge railing and struck a structural member on the Yadkin River Bridge
near Siloam, North Carolina. [NTSB76] The bridge was a through-truss bridge so the
penetration of the bridge railing allowed the vehicle to damage a vital structural component of
the bridge. As a result of the collision, the bridge collapsed and fell into the river. Six additional

25
vehicles drove into the river in the next 17 minutes resulting in four people being killed and 16
others being injured. As a result of this crash the NTSB recommended that the FHWA develop
and publish “guidelines for the structural retrofit of bridge railings on existing bridge structures
to protect vital structural members from impact by vehicles.” [NTSB76]
Martinez, California, 1976
On May 21st, 1976 a school bus was travelling on I-680 near Martinez, California with 52
people on-board when it struck a bridge railing on an off-ramp. The bus rolled over the bridge
railing of the curved bridge, landing on its roof. Twenty nine people were fatally injured in the
crash. [NTSB77a] The bridge railing and the integrated curb were cited by the NTSB as one of
the contributing factors to the crash.
As a result of this crash, the NTSB made three recommendations that dealt with various
aspects of bridge railing design and placement. The three recommendations were:
H-77-12: “Develop bridge railing designs that will meet performance standards to be
established by the FHWA for various classes of vehicles and that will be sufficient in number to
meet the various state requirements with regard to climatic and other physical conditions that
affect the operation and maintenance of a roadway system. Such bridge barrier railing designs
should be available to states that do not desire to develop their own designs in accordance with
mandatory performance standards issued by the FHWA.” [NTSB77b]
H-77-13: “Investigate through dynamic crash testing and analytical procedures the
effects of various geometric configurations and adjacent roadway surfaces on the performance
of traffic barrier rail systems. The investigation should also consider how maintenance practices
or the lack of maintenance affects the performance of the barrier rail systems.” [NTSB77c]
H-77-14: “In cooperation with the states, establish priority guidelines for improving,
through modification or retrofit, the performance of existing traffic barrier rail systems at
bridges. Consideration should be given in the priority guidelines to the potential for multi-
fatality accidents involving high occupancy vehicles such as buses. [NTSB77d]
Houston, Texas 1976
A tractor-trailer truck hauling over 7,500 gallons of anhydrous ammonia was traveling on
an elevated ramp between I-610 and US-59 in Houston, Texas on May 11, 1976. [NTSB77e] At
this location, US-59 is at the ground level and I-610 is elevated over it. The ramp between I-610
and US-59 passes between I-610 above and US-59 on the ground below. While negotiating the
ramp, the tractor trailer truck began to roll due to the horizontal curvature of the ramp and the
truck’s speed. The truck penetrated the bridge railing and fell about 15 feet onto US-59. As the
truck fell it also struck and sheared off a column supporting the elevated portion of I-610 above.
The truck and trailer became detached during the crash and the trailer broke into several parts
allowing the rapid escape of the ammonia into the atmosphere. Twelve automobiles were
damaged by flying debris from the tractor and trailer as it crashed onto US-59. The driver of the
truck was fatally injured in the crash and five people were killed and 178 people injured due to
breathing the ammonia gas that escaped from the ruptured trailer.

26
I-610 was designated in 1970 as a hazardous materials route by the City of Houston and
all vehicles transporting hazardous materials through the city were restricted to this route. I-610
is an elevated five-lane highway near the crash site. The ramp onto US-59 where the crash
occurred consists of two lanes arranged in an interconnected three, six and 12 degree compound
curve; the crash occurred on the third curved section (i.e., the 12 degree curve). The bridge
railing was an oval pipe section 33.5-inches high, mounted on five-inch wide, ¾-inch thick steel
bars. The support bars were bolted behind a 14-inch wide, 12-inch tall curb. The crash destroyed
94 feet of bridge railing, caused damage to the bridge deck, a column supporting the I-610
overpass was sheared off and guardrails on US-59 were damaged.
As a result of this crash, the NTSB recommended that the FHWA “in consultation with
State and local governments, establish highway design criteria for the selection, location and
placement of traffic barrier systems that will redirect and prevent penetration when struck by
heavy vehicles. The criteria for preventing vehicle penetration should consider the human
exposure to injury and the effects of hazardous cargo that could result from barrier penetration
(H-77-5).” [NTSB77e]
Elkridge, Maryland, 2004
On January 13, 2004 a tractor tanker-trailer truck was hauling 8,800 gallons of gasoline
southbound on I-895 near Elkridge, Maryland. [NTSB09a] As the tanker truck approached the
Figure 27. Hazardous material truck crash near Houston, Texas in 1976. [NTSB77e]

27
curved and elevated I-95 overpass it entered the right shoulder and struck the guardrail and
continued on to strike the attached bridge railing. The truck and trailer mounted and vaulted
over the bridge railing falling 30 feet onto the northbound lanes and median of I-95. The NTSB
estimated the vehicle’s speed did not exceed 49 mi/hr. An explosion and large fire resulted from
the tanker truck striking the ground and four vehicles travelling northbound on I-95 drove into
the conflagration. Four of the five vehicle operators were fatally injured in the crash.
The barrier on the I-95 overpass, shown in Figure 28, was a 32-inch tall concrete safety
shape bridge railing installed adjacent to a four-ft. shoulder on the overpass. The overpass was
curved to the left which promoted the vehicle rolling over the barrier while the driver was trying
to regain control by steering to the left. The guardrail transition to the bridge rail may also have
been a factor in the crash.
While the NTSB was not critical of the choice of the bridge railing at this location, the
crash site did involve some of the risk factors cited by the RDG for higher test level bridge
railings. The horizontal curve had a radius of about 954 feet. I-95, the road the bridge crossed
over, had an ADT of 189,750 in 2004. I-895 had an ADT of 13,350 in 2004 with 5.5 percent
single unit truck classes 4 through 7 and 3.2 percent combination trucks classes 8 through 13 for
a total percent trucks of 8.7.
Figure 28. Crash site in Elkridge, MD where a fuel truck penetrated a concrete bridge
railing. [NTSB09a]
The 32-inch tall concrete safety shape is probably the most common Report 350 TL4
bridge railing in use today. The curved alignment of the roadway, the hazardous material being
transported and the fact that the overpass was crossing a very heavily travelled and important
interstate magnified the importance of the bridge railing at this particular location.
Huntsville, Alabama, 2006
On November 20, 2006 at about 10 a.m. a school bus with 40 students onboard was
traveling westbound in the left lane of an elevated ramp portion of I-565 in Huntsville, Alabama.
[NTSB09b] A 1990 Toyota Celica was following the bus and apparently moved into the right-

28
hand lane and accelerated in order to pass the bus on the right. As the Toyota was abreast of the
bus it began to “fishtail” and the driver lost control, veering to the left and striking the right-front
tire of the school bus. Both vehicles swerved to the left and struck a 32-inch tall concrete bridge
railing on the left side of the ramp. The school bus climbed up onto the bridge railing and
travelled about 117 feet before completely rolling over the railing and falling about 30 feet below
onto a dirt and grass area underneath the ramp shown in Figure 29. The crash resulted in four
fatalities, 17 serious injuries, 17 minor injuries and three bus occupants were uninjured. The bus
driver was ejected in the initial crash and four passengers were either fully or partially ejected
when the bus struck the ground below. The Toyota did not penetrate the bridge railing and came
to rest against the bridge railing. The driver and passengers of the Toyota were not injured in the
crash.
Figure 29. Final rest position of a school bus that penetrated a concrete bridge railing near
Huntsville, AL in 2006. [NTSB09b]
With respect to highway design issues, the NTSB noted that the bridge railing as a 32-
inch high Report 350 TL4 concrete safety shape installed adjacent to a four-foot left shoulder.
The bus was travelling no more than 55 mi/hr, it struck the railing at 9-10 degrees and its gross
empty weight was 17,700 lbs so the impact conditions were not extraordinary in comparison to
the standard Report 350 TL4 test (i.e., 18,000-lbs single unit truck striking the barrier at 15
degrees and 50 mi/hr). The NTSB concluded that the Toyota restricted the bus from moving
back into its lane and essentially held the front of the bus to the railing until it eventually rolled
over it.
Sherman, Texas, 2008
On August 8th
, 2008 at about 12:45 a.m. a motorcoach with 55 passengers and a driver
were travelling at about 68 mi/hr northbound in the right-hand lane of the four-lane US 75 near

29
Sherman, Texas. [NTSB09c] As the motorcoach approached Post Oak Creek its right steer axle
failed and the motorcoach struck a seven-inch high curb at about a four-degree impact angle
which it overrode and then struck a steel bridge railing. The motorcoach struck the railing at
about 44 mi/hr and then slid along the railing for about 120 feet until it penetrated the bridge
railing and fell about eight feet onto the creek embankment below. Seventeen passengers were
fatally injured, the driver was seriously injured and 38 passengers received minor to serious
injuries in the crash.
Figure 30. Site of a motorcoach bus crash in Sherman, TX, 2008. [NTSB09c]
US-75 in the area of the crash had a traffic volume of about 47,000 vehicles/day in 2006
and commercial vehicles accounted for 16 percent of the total traffic volume. The bridge railing
at the crash site, shown in Figure 30, was a 27-inch tall steel beam and post system side-mounted
on an 18-inch wide, seven-inch tall curb adjacent to a 22-inch wide shoulder. The bridge railing
was 279-ft long. The bridge railing was a Texas Type II railing which was originally designed in
1954 in accordance with the AASHTO Bridge Design Specifications in effect at the time.
Apparently, this bridge railing had been struck previously in 2001 by a tractor-trailer truck. It
had penetrated the bridge railing causing some damage to the railing anchorages in the deck.

30
Based on its height alone this bridge railing would be classified today as no more than a TL3
railing but it is likely that it was never crash tested so its impact performance is doubtful.
As a result of the Sherman, Texas motorcoach crash, NTSB issued three safety
recommendations dealing with the design and warranting of bridge railings.
H-09-17: “Establish, in conjunction with the American Association of State Highway and
Transportation Officials, performance and selection guidelines for bridge owners to use to
develop objective warrants for high-performance Test Level Four, Five, and Six bridge railings
applicable to new construction and rehabilitation projects where railing replacement is
determined to be appropriate.”
H-09-25: “Work with the Federal Highway Administration to establish performance and
selection guidelines for bridge owners to use to develop objective warrants for high-performance
Test Level Four, Five, and Six bridge railings applicable to new construction and rehabilitation
projects where railing replacement is determined to be appropriate, and include the guidelines
in the Load and Resistance Factor Design (LRFD) Bridge Design Specifications.”
H-09-26: Revise Section 13 of the Load and Resistance Factor Design (LRFD) Bridge
Design Specifications to state that bridge owners shall develop objective warrants for the
selection and use of high-performance Test Level Four, Five, and Six bridge railings applicable
to new construction and rehabilitation projects where railing replacement is determined to be
appropriate.
National Transportation Safety Board Recommendations
The NTSB first made recommendations on the design and selection of bridge railings in
1977 in its recommendations H-77-12 through 14 as a result of the Martinez, California crash
discussed earlier. In 1980, the NTSB issued SEE-80-5 to, in part, assess FHWA’s efforts in
implementing the H-77-12 through 14 recommendations. SEE-80-5 contained an additional
recommendation (i.e., H-80-64) which stated:
H-80-64: “Establish mandatory performance standards, and associated test procedures to
be used in determining compliance, for all traffic barriers constructed on Federal-aid roads after
January 1, 1982. The performance standards should first address automobiles and should be
expanded for heavier passenger vehicles and trucks as research is completed to provide needed
information.” [NTSB80]
The result of these recommendations was an era of vigorous re-design and crash testing
of bridge railings by the FHWA. In the 10 year period following H-80-64, 74 bridge railings
were crash tested and accepted including W-Beam bridge railing, Thrie Beam bridge railing,
Metal Tube bridge railing, Vertical Concrete parapet, New Jersey Barrier bridge railing, Tall
Wall type, F-Shape Concrete Barrier bridge railing and Timber bridge railings. The FHWA
published three Technical Memoranda where the States were advised of the requirements to
crash test bridge railings, provided a list of the bridge railing designs that had been crash tested,
and provided a list of all FHWA accepted bridge railings. [FHWA86; FHWA90; FHWA97a]
Based on the results of this decade of research, the FHWA and AASHTO developed bridge
railing design and crash test criteria which appeared as the 1989 Guide Specification to Bridge

31
Railings which will be discussed in a later section.[AASHTO89] The recommendation was
“closed” by the NTSB and considered superseded by AASHTO’s adoption of the Guide
Specification. [AASHTO89]
Unfortunately, while the FHWA’s design and crash testing research undertaken in the
1980’s and the AASHTO Guide Specification made great advances in the design and testing of
bridge railings, the warranting or selection of which types of bridge railings are best suited to
which conditions was still very subjective. Recently, the FHWA added “Identification of
Potentially Deficient Systems” and “Bridge Rail Retrofits” to their website. This website
suggests that bridge railings designed prior to 1964 may not meet current specifications and
includes a list of items to evaluate (e.g., base plate connections, anchor bolts, material brittleness,
welding details, and reinforcement development). Additionally, the FHWA suggests that open-
faced railings present a snagging hazard and that curbs or walkways in front of the bridge
railings also present hazards. Suggestions for retrofitting any outdated bridge railings are
included and discussed (e.g., concrete retrofit is economical if the structure can carry the added
load; W-beam/thrie-beam retrofits provide an inexpensive, short-term solution; and metal post
and beam retrofits for structures with walkways).[FHWA10] This website does not address the
techniques one may use to conduct the investigation, how one may prioritize the need to retrofit
deficient bridge railings or the identification of deficient bridge rails built after 1964.
Crash Testing
Crash testing is the most direct means of assessing barrier impact performance.
Containment capacity is a function of the strength and height of a barrier. If a barrier is not
strong enough, an impacting vehicle can penetrate through it (see Figure 31). If a barrier is not
tall enough, an impacting vehicle can override or roll over it (see Figure 32). Full-scale crash
testing is typically used to verify containment capacity of a barrier for a selected test level but
testing guidelines do not indicate what traffic, geometric and operational characteristics should
be used to assess the risk of a particular crash type occurring.
Hundreds of crash tests have been performed in the past several decades, many involving
bridge railing designs for heavy vehicles. The purpose of this section is not to list or catalog all
the various types of bridge railings that have been crash tested but, rather, to point out the
different performance and test levels that have been used over the years to evaluate crash test
performance.

32
Figure 31. Tractor Trailer Truck Penetration of Concrete Median Barrier.
Figure 32. Single-Unit Truck Rolling Over Concrete Bridge Rail.

33
NCHRP Report 230
NCHRP Report 230 was published in 1981 to provide guidelines for performing and
evaluating full-scale vehicle crash tests of a variety of safety appurtenances including bridge
railings. [Michie81] Report 230 did not explicitly include a multiple performance level or test
level approach although it did include a number of supplemental tests for heavier vehicles such
as utility buses (i.e., school buses), small and large intercity buses, tractor trailer trucks and
tanker trailer trucks. The so-called “minimum” crash test matrix included small, medium and
large passenger cars. The supplemental tests recommended in Report 230 were developed in
conjunction with another NCHRP project (i.e., NCHRP Report 239) which presented
recommendations for a multiple service level approach to bridge railing design. The
supplemental tests were intended to satisfy the recommendations of Report 239 with respect to
both lower containment bridge railings used on lower volume, low speed bridges and higher
containment bridge railings intended for use in situations where bus and truck impacts would be
more likely and more serious.
Report 239 included four service levels and attempted to establish the service levels
based on the capacity of the bridge railings. The Report 230 supplemental tests were the means
used to determine the bridge railing capacity.
1989 AASHTO Guide Specification for Bridge Railings
The 1989 AASHTO Guide Specification for Bridge Railings (GSBR) recommended that
all bridge railings should be evaluated in full-scale crash tests to verify that a given bridge rail
design meets the desired impact performance criteria. [AASHTO89] Three bridge rail
performance levels and associated crash tests were recommended to access the performance of
the bridge railings. The crash test matrices for each performance level were described by crash
test conditions defined in terms of vehicle type, vehicle weight, impact speed, and impact angle.
Two passenger vehicles – a small 1800-lb passenger car and a 5400-lb pickup truck - were
common to all three performance levels. Test conditions associated with Performance Level 1
(PL1) included the 5,400-lb pickup truck impacting at a speed of 45 mph and an angle of 20
degrees. For PL2, the speed of the pickup truck test was increased to 60 mph and a test with an
18,000 lb single unit truck impacting the barrier at a speed of 50 mph and an angle of 15 degrees
was added to the test matrix. The highest performance level, PL3, incorporated a test with a
50,000 lb van-type tractor trailer impacting the barrier at a speed of 50 mph and an angle of 15
degrees. While crash testing procedures for bridge rails would quickly be wrapped into NCHRP
Report 350 in 1993, only four years after the AASHTO GSBR was published, the concept of
multiple performance levels was introduced for the first time in an AASHTO guide by the GSBR
and this concept was retained and even expanded in Report 350.
Prior to 1989, there were a few higher performance bridge railings available but the
publication of the 1989 GSBR and the later inclusion of bridge railings in Report 350 has
resulted in a large number of bridge railings being designed and crash tested. The AASHTO-
ARTBA-AGC Task Force 13 on-line bridge railing guide today (i.e., 2013) shows 117 crash-
tested bridge railings; 59 of which are essentially PL1 bridge railings; 48 PL2 bridge railings and

34
ten PL3 bridge railings. Today there are many crash tested FHWA-accepted bridge railings with
demonstrated performance across a wide spectrum of test levels that were not available in 1989.
Although the 1989 GSBR recommended crash testing as the basis for bridge rail
evaluation and acceptance, it did provide the bridge engineer with suggested design information
including the magnitude, distribution, and vertical location of railing design loads for each
performance level. The transverse loads were derived from two related research studies in which
vehicle impact forces were measured using instrumented concrete walls. [Noel81; Beason89]
In the first study, an instrumented concrete wall (shown in Figure 33) was designed to,
for the first time, measure the magnitude and location of vehicle impact forces. [Noel81] The
wall consisted of four 10-ft long concrete panels, each laterally supported by four load cells.
Each of the 42-in tall, 24-in thick panels was also instrumented with an accelerometer to account
for inertia effects. Surfaces in contact with the supporting foundation and adjacent panels were
Teflon coated to minimize friction. Eight full-scale crash tests were conducted using various
sizes of passenger cars and buses ranging from an 1,800-lb sedan to a 32,020-lb intercity bus. In
the second such study, a new wall with a height of 90 inches was constructed using similar
design details. [Beason89] Three full-scale vehicle crash tests were performed with tractor-
trailer vehicles ranging in weight from 50,000 lbs to 80,000 lbs.
Figure 33. Instrumented crash wall. [Noel81]
The data from the instrumented wall tests were analyzed to determine the resultant
magnitudes, locations, and distributions of the contact forces. Maximum forces were obtained
by averaging the data over 50 msec intervals to reduce the effect of force “spikes” in the data that
were believed to have little consequence to the required structural integrity of the bridge railings
due to their short duration. The force measurements were obtained from a nearly rigid barrier
and, therefore, were considered to represent the upper bound of forces that would be expected on
an actual bridge railing. Any deformation of the bridge rail during impact would tend to reduce

35
the magnitude of the impact forces below those obtained on the “nearly rigid” instrumented
concrete wall.
NCHRP Report 350
In 1993, NCHRP Report 350 was published superseding the previous crash testing
guidelines contained NCHRP Report 230. [Ross93] One major change in Report 350 is that six
different test levels for roadside hardware were added for roadside hardware in general and
bridge railings in particular. The intent was to provide test guidelines for developing a range of
bridge railings that could be used in different situations. Test levels 1 through 3 are focused on
the impact performance of passenger vehicles (e.g., small passenger cars and pickup trucks) and
vary by impact speed, with increasing impact speeds defined for increasing test levels. The base
test level for longitudinal barriers, including bridge railings, to be used on the National Highway
System (NHS) is Test Level 3 (TL3). The structural adequacy test for this test level consists of a
2,000 kg (4,409 lb) pickup truck impacting a barrier at 100 km/h (62 mph) and 25 degrees.
Test levels 4 through 6 also include consideration of passenger vehicles, but additionally
incorporate consideration of various sizes of trucks. Many state transportation departments
require that their bridge railings meet Report 350 TL4. The impact conditions for NCHRP
Report 350 TL4 involve an 8,000 kg (17,637 lb) single unit truck impacting the barrier at 80
km/h (50 mph) and 15 degrees. These impact conditions are similar to those associated with
Performance Limit 2 (PL2) in the 1989 AASHTO “Guide Specification for Bridge Rails.”
[AASHTO89]
A TL5 test involves an 80,000-lb (36,000-kg) van-type tractor trailer impacting the
barrier at a speed of 50 mph (80 km/hr) and an angle of 15 degrees. Test Level 6 (TL6) uses the
same impact conditions, but incorporates an 80,000-lb (36,000-kg) tractor-tank trailer. Barriers
meeting these higher containment levels are used when the owner-agency considers that site
conditions warrant the added expense. Site specific factors that might justify use of a high-
containment barrier include a high percentage of heavy truck traffic or truck related crashes
and/or an unusually high risk associated with barrier penetration. Such barriers are necessarily
taller, stronger, and more expensive to construct. The higher test levels were intended for
locations where there were a high percentage of trucks and where the consequences of trucks
penetrating or rolling over the bridge railing would be severe. While Report 350 provided the
testing recommendations, only general guidance was provided about what field conditions would
indicate the need for a higher test level bridge railing.
FHWA has established approximate equivalences between the Report 239 multiple
service levels, the three AASHTO GSBR performance levels and the Report 350 test levels in a
memorandum to FHWA Regional Administrators in 1997. [Horne97] The equivalencies set out
by the FHWA are summarized in Table 1, but the guidance from FHWA simply established
crash test equivalencies without providing any guidance on when and where to use each type of
bridge railing.

36
Table 1. Crash Test Acceptance Equivalencies from the FHWA. [Horne97]
Bridge Railing
Testing Criteria
Acceptance Equivalencies
Report 350 TL1 TL2 TL3 TL4 TL5 TL6
Report 230 MSL-1
MSL-2†
AASHTO Guide Spec PL1 PL2 PL3
AASHTO LRFD Bridge Spec PL1 PL2 PL3
† This is the performance level usually cited when describing a barrier tested under NCHRP Report 230. It is
close to TL3 but adequate TL3 performance cannot be assured without a pickup truck test.
Manual for Assessing Safety Hardware (MASH)
Since the publication of NCHRP Report 350 in 1993, changes have occurred in vehicle
fleet characteristics, operating conditions, technology, etc. NCHRP Project 22-14(2),
"Improvement of Procedures for the Safety-Performance Evaluation of Roadside Features," was
initiated to take the next step in the continued advancement and evolution of roadside safety
testing and evaluation. The results of that research effort culminated in the 2009 AASHTO
Manual for Assessing Safety Hardware (MASH) which superseded Report 350. [AASHTO09]
MASH includes essentially the same test level approach with some changes to the impact
conditions for the higher longitudinal barrier test levels. Barrier performance levels identified in
MASH were modified from its predecessor, NCHRP Report 350. [AASHTO09; Ross93] These
modifications were primarily related to the size of the test vehicles. Impact conditions associated
six test levels tend to be calibrated off of impact conditions associated with Test Level 3 (TL3).
TL3 is intended to represent barrier applications on typical high speed high-volume roadways
since TL3 is the “default” test level used on the National Highway System. Impact speeds and
angles for TL3 have traditionally been selected to be equal to the presumed 85th
percentile
impact speed and 85th
percentile impact angle from ran off road crashes. Further, vehicle
masses are normally selected to be equal to the 95th
and 5th
percentile values from the passenger
car fleet. However, in recognition of the recent increase in the size of passenger vehicles and the
expectation that high gasoline prices might push vehicle masses down, the light truck vehicle
mass was reduced to the 90th
percentile and the small car mass was reduced to the 2nd
percentile
of the 2002 new vehicle fleet.
Even with these adjustments, the severity of the TL3 test condition was increased
significantly. The weight and body style of the pickup truck test vehicle changed from a 2,000
kg (4,409 lb), ¾-ton, standard cab pickup to a 2,270 kg (5,000 lb), ½-ton, 4-door pickup. This
change in vehicle mass of approximately 15 percent was deemed to produce an impact condition
that was similar to, and possibly more severe than the TL4 single unit truck (SUT) test from
NCHRP Report 350. The primary concern was that if TL3 and TL4 converged, highway
agencies would lose one of the longitudinal barrier options. The impact energy associated with
the TL4 crash test conditions was increased by changing the single unit truck mass from 8,000

37
kg (17,637 lb) to 10,000 kg (22,000 lb) and the speed of the test vehicle from 80.47 km/h (50
mph) to 90.12 km/h (56 mph). This is particularly important to this study because the 57 percent
increase in impact severity for MASH TL4 has resulted in higher design impact loads which will
require stronger barriers and increased overturning moment which will require increased barrier
height to prevent the heavier SUTs from rolling over the top of the barrier. In short, MASH TL4
barriers will likely have much higher capacities than Report 350 TL4 barriers.
While a barrier height of 32 inches satisfied NCHRP Report 350 TL4 impact conditions,
recent crash testing conducted at the Midwest Roadside Safety Facility (MwRSF) at the
University of Nebraska (UNL) under NCHRP Project 22-14(2) and the Texas Transportation
Institute (TTI) under NCHRP Project 22-14(3) has demonstrated that taller barriers will be
required to accommodate MASH TL4 (i.e., Report 350 and MASH TL4 are not equivalent). The
Texas Department of Transportation (TxDOT) is currently sponsoring research to determine the
minimum barrier height and design impact load for MASH TL4. [Sheikh11]
The vehicle specifications and impact conditions for TL5 and TL6 have not changed.
Several user agencies have already begun applying the MASH criteria in their crash test
programs. While no official crash test equivalencies have been released to compare Report 350
and MASH test level, Table 1 can be expanded to add the first line to represent the
approximately equivalencies for MASH test levels.
Table 2. Approximate Crash Test Acceptance Equivalencies. [after Horne97]
Bridge Railing
Testing Criteria
Acceptance Equivalencies
MASH TL1 TL2 TL3 TL5 TL6
Report 350 TL1 TL2 TL3 TL4 TL5 TL6
Report 230 MSL-1
MSL-2†
AASHTO Guide Spec PL1 PL2 PL3
AASHTO LRFD Bridge Spec PL1 PL2 PL3
† This is the performance level usually cited when describing a barrier tested under NCHRP Report
230. It is close to TL3 but adequate TL3 performance cannot be assured without a pickup truck
test.
High Containment Barriers
Although fewer in number than TL3 and TL4 barriers, several barrier systems have been
successfully designed and crash tested to TL5 criteria with an 80,000-lb tractor-van trailer. Only
one barrier system is known to have been designed and successfully tested to TL6 with an
80,000-lb tractor-tank trailer (see Figure 34). [Hirsch85] TTI researchers conducted a study
using a 90-in tall rigid instrumented concrete wall to quantify the magnitude and location of
impact loads for a variety of trucks up to and including an 80,000 lb tractor trailer with both a
van-type and tank-type trailer. [Beason89] Speeds in these tests ranged from 50 mph to 60 mph
and the impact angles ranged from 15 degrees to 25 degrees.

38
Eleven additional tractor-trailer crash tests have been performed by TTI. In these tests,
the gross vehicle weights ranged from 50,000 lbs to 80,000 lbs. Figure 35 shows a photograph
from a test of a 42-in tall vertical wall bridge parapet being impacted by a 50,000 lb tractor-van
trailer at a speed of 50 mph and an angle of 15 degrees. [Menges95] This test conforms to the
impact conditions of Performance Level 3 (PL3) of the 1989 AASHTO “Guide Specification for
Bridge Rails.” Table 3 shows a summary of the test information and parameters for the tractor-
trailer barrier impacts run at TTI.
Additionally, UNL researchers successfully developed both a 42-in. and a 51-in. tall, F-
shape, half-section concrete barrier for TL5 impact criteria.[MWRSF10] For the 42-in. height,
several configurations were provided with top barrier widths ranging from 10 in. to 12 in. and
having barrier capacities ranging from 211 kips to 224 kips. Two preferred configurations were
recommended for the 51-in. tall barrier having top barrier widths of 11 in. and 12 in. The size,
quantity, and spacing of longitudinal and vertical steel reinforcing bars were selected to prevent
concrete blowouts as well as prevent vehicle penetrations through or vaulting over the top of the
barriers.
Figure 34. The only crash-tested TL6 bridge railing. [Hirsch85]

39
Figure 35. 50,000-lbs tractor trailer impacting a 42-inch vertical wall bridge railing.
[Menges95]
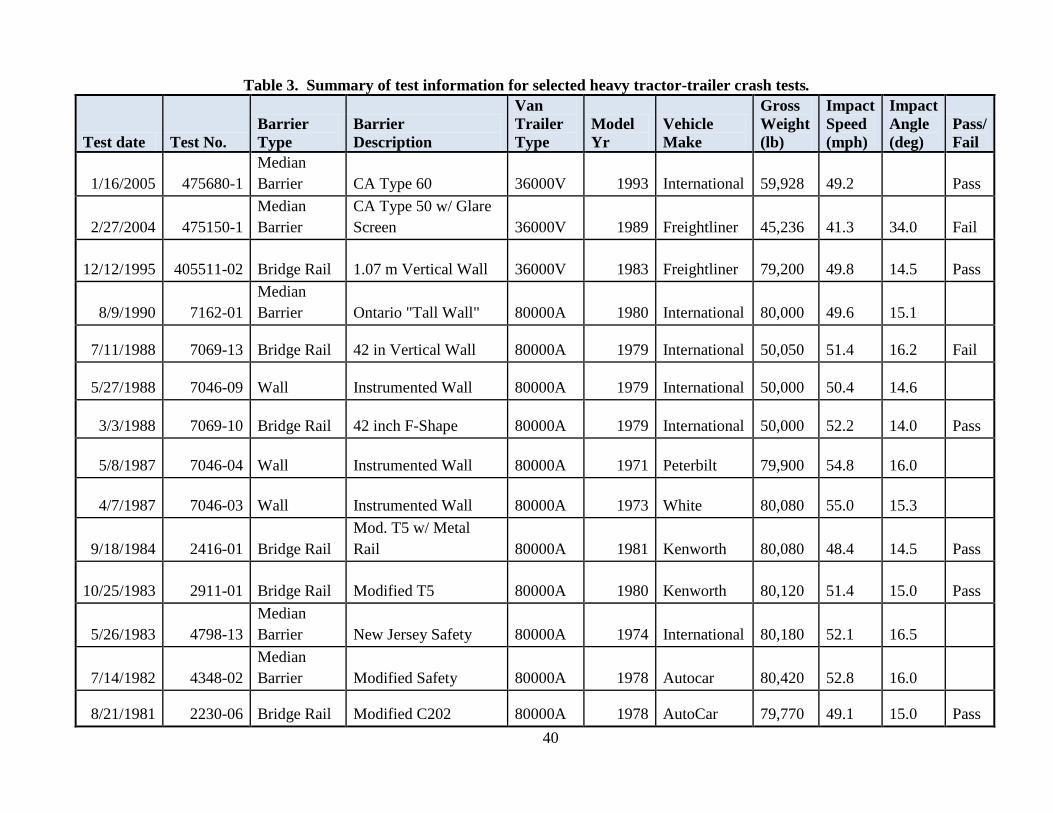
40
Table 3. Summary of test information for selected heavy tractor-trailer crash tests.
Test date Test No.
Barrier
Type
Barrier
Description
Van
Trailer
Type
Model
Yr
Vehicle
Make
Gross
Weight
(lb)
Impact
Speed
(mph)
Impact
Angle
(deg)
Pass/
Fail
1/16/2005 475680-1
Median
Barrier CA Type 60 36000V 1993 International 59,928 49.2
Pass
2/27/2004 475150-1
Median
Barrier
CA Type 50 w/ Glare
Screen 36000V 1989 Freightliner 45,236 41.3 34.0 Fail
12/12/1995 405511-02 Bridge Rail 1.07 m Vertical Wall 36000V 1983 Freightliner 79,200 49.8 14.5 Pass
8/9/1990 7162-01
Median
Barrier Ontario "Tall Wall" 80000A 1980 International 80,000 49.6 15.1
7/11/1988 7069-13 Bridge Rail 42 in Vertical Wall 80000A 1979 International 50,050 51.4 16.2 Fail
5/27/1988 7046-09 Wall Instrumented Wall 80000A 1979 International 50,000 50.4 14.6
3/3/1988 7069-10 Bridge Rail 42 inch F-Shape 80000A 1979 International 50,000 52.2 14.0 Pass
5/8/1987 7046-04 Wall Instrumented Wall 80000A 1971 Peterbilt 79,900 54.8 16.0
4/7/1987 7046-03 Wall Instrumented Wall 80000A 1973 White 80,080 55.0 15.3
9/18/1984 2416-01 Bridge Rail
Mod. T5 w/ Metal
Rail 80000A 1981 Kenworth 80,080 48.4 14.5 Pass
10/25/1983 2911-01 Bridge Rail Modified T5 80000A 1980 Kenworth 80,120 51.4 15.0 Pass
5/26/1983 4798-13
Median
Barrier New Jersey Safety 80000A 1974 International 80,180 52.1 16.5
7/14/1982 4348-02
Median
Barrier Modified Safety 80000A 1978 Autocar 80,420 52.8 16.0
8/21/1981 2230-06 Bridge Rail Modified C202 80000A 1978 AutoCar 79,770 49.1 15.0 Pass
41
Guidelines and Specifications
FHWA and AASHTO
AASHTO Standard Specifications for Highway Bridges
Historically, design of bridge rails has followed guidance contained in the AASHTO
“Standard Specifications for Highway Bridges.” Prior to 1965, the AASHTO specification
required very simply that “substantial railings along each side of the bridge shall be provided for
the protection of traffic.” It was specified that the top members of bridge railings be designed to
simultaneously resist a lateral horizontal force of 150 lb/ft and a vertical force of 100 lb/ft
applied at the top of the railing. The design load on lower rail members varied inversely with
curb height, ranging from 500 lb/ft for no curb to 300 lb/ft for curb heights of 9 in. or greater. It
was further specified that the railing have a minimum height of 27 inches and a maximum height
of 42 inches above the roadway surface.
These loads are only a fraction of what are used today. Based on poor accident history,
accentuated by increased exposure due to dramatically increasing travel volumes, the
engineering community came to realize that these criteria were inadequate. There was an urgent
necessity for a railing specification that established loading requirements more in line with the
weights and increased speeds of vehicles of that day.
Olson was perhaps the first to systematically examine the performance requirements for
bridge railings in 1970. His results, documented in NCHRP Report 86, suggested using
appropriate transitions, evaluation through crash testing, ability to minimize bridge rail
penetration and many other things that are considered standard objectives of bridge railing
design today. [Olson70] Bronstad built upon Olson’s work in NCHRP Report 239 where he
presented a multiple service level approach to selecting bridge railings. [Bronstad81] Bronstad’s
approach was a benefit-cost approach where the number of crashes exceeding the presumed
capacity of the bridge railing was estimated. Four service levels were identified where the
capacity was based on crash test results. Unfortunately, there was very little data available for
Bronstad to use in developing his collision frequency and severity models so the resulting
method was not definitive and was never widely adopted.
Revised bridge railing specifications were subsequently published in 1965 in the 9th
edition of the AASHO “Standard Specifications for Highway Bridges.” [AASHTO65] It
required that rails and parapets be designed for a transverse load of 10,000 lbs divided among the
various rail members using an elastic analysis. The force was applied as a concentrated load at
the mid-span of a rail panel with the height and distribution of the load based on rail type and
geometry as provided in an accompanying figure. Posts were designed for the transverse loading
applied to each rail element plus a longitudinal load of half the transverse load. The transverse
force on concrete parapet walls was distributed over a longitudinal length of 5 ft. The height of
the railing was required to be no less than 27 inches and railing configurations successfully crash
tested were exempt from the design provisions.

42
These bridge rail design procedures were retained through numerous editions of the
specifications. In fact, the provisions in the 17th edition of the AASHTO “Standard
Specifications for Highway Bridges” published in 2002 are essentially the same as the
specification adopted in 1965. [AASHTO02]
These requirements were intended to produce bridge rails that function adequately for
passenger cars for a reasonable range of impact conditions. The reserve load capacity of the rail,
beyond its elastic strength offers some factor of safety to accommodate more severe impact
conditions or heavier vehicles. However, several catastrophic accidents involving large vehicles
(e.g., buses and trucks) increased awareness of design requirements for bridge rails and the need
to extend protection beyond passenger cars.
1989 AASHTO Guide Specification for Bridge Railings
In 1989, AASHTO published the “Guide Specifications for Bridge Railings” (GSBR) to
provide a more comprehensive approach for the design, testing, and selection of bridge rails than
that contained in the AASHTO “Standard Specifications for Highway Bridges.” [AASHTO89]
The GSBR introduced several new and important concepts to the practice of selecting bridge
railings including:
Bridge railing performance should be demonstrated in full-scale crash tests.
There should be multiple performance levels (i.e., three were recommended) to address
the different risks and costs associated with specific traffic and bridge characteristics.
A cost-benefit encroachment modeling software program, BCAP, was introduced to help
designers make bridge railing selection decisions.
Generic selection guidelines were presented that recommended the appropriate test level
based on traffic volume, percent trucks, speed limit, horizontal curvature and grade.
The crash testing aspects of the 1989 AASHTO GSBR were discussed previously in the
section on Crash Testing so this section will focus on the selection guidelines in the 1989 GSBR.
The 1989 AASHTO GSBR provided bridge engineers guidance for determining the
appropriate railing performance level for a given bridge site. Selection guidelines were provided
that estimated the appropriate railing performance level for a given bridge site based on highway
and site characteristics. The highway and site characteristics used in the selection guidelines
included highway type (e.g., divided, undivided, etc.), design speed, traffic volume, percent
trucks, and bridge rail offset. The tables applied to bridges that were on tangent, level roadways
with deck surfaces approximately 35 feet above the underlying ground or water surface. It was
further assumed that there was low occupancy land use or shallow water under the bridge
structure. Correction factors were provided to permit the engineer to adjust the traffic volume
for horizontal curvature, vertical grade, different deck heights, and different densities of land use
beneath the bridge.
Table 4 shows a portion of the 1989 GSBR Table G2.7.1.3B which illustrates the
selection recommendations. For example, if the design speed of a four-lane divided highway is
60 mi/hr (100 km/hr) and the percent of trucks is about 15 percent and the bridge railing is offset

43
from the edge of travel eight feet, a PL1 railing is appropriate for traffic volumes up to 3,700
vpd; a PL2 bridge railing is recommended for traffic volumes between 3,700 and 31,900 vpd and
a PL3 bridge railing is recommended for traffic volumes greater than 31,900 vpd. These
recommendations presume that the highway section is straight with no grade, a deck height
above the surface of 35 ft or less and the bridge does not pass over a sensitive or occupied area.
If it does have horizontal curvature, grade or passes over a sensitive or occupied area, adjustment
factors are presented. These adjustments are multiplied by the traffic volume in Table
G2.7.1.3B.
Table 4. 60 mi/hr portion of the 1989 GSRB selection table.[AASHTO89]
Returning to the example, if the highway being considered has an ADT of 28,000 vpd, 60
mi/hr design speed, 15 percent trucks and an 8-ft shoulder; Table 4 suggests a PL2 bridge railing
is appropriate. If we assume that the bridge is on a vertical down grade of minus six percent, a

44
horizontal curve of six degrees and is actually 50 ft above a high-occupancy land use surface
below the adjustment factors would be 2.0, 2.0 and 1.8. The ADT would be adjust to 18,000 ∙
2.0 ∙ 2.0 ∙ 1.8 = 129,600 vpd which would place the railing into the PL3 category. The tables,
therefore, allow the designer to select an appropriate rail based on the traffic volume, design
speed, percent trucks, railing offset, horizontal curvature, grade, height of the structure and land
use.
These selection procedures were developed using a benefit-cost analysis combined with
engineering judgment. The benefit-cost analysis program (BCAP) estimated roadside
encroachments, the consequences of these encroachments, and the cost of the consequences. An
incremental benefit-cost ratio was computed to facilitate comparison of the relative merits or
benefits of one design alternative to another. Table G2.7.1.3B was to be used for bridge railing
selection unless the designer used the BCAP program.
The BCAP program will be discussed in more detail in a later section but obviously since
Table G2.7.1.3B was based on the predictions of BCAP, the accuracy and validity of BCAP
were fundamental to the validity of the recommendations. NCHRP Project 22-08 was initiated
in order to assess BCAP and validate the 1989 AASHTO GSBR recommendations. [Mak94]
Unfortunately, Mak and Sicking, the principal investigators for NCHRP 22-08, found some
serious short comings of BCAP itself and the assumptions that were built into the selection
tables. Mak and Sicking found that BCAP seriously over predicted bridge railing penetrations
and seriously under predicted rollovers; the opposite of what would normally be expected.
Based on crash test experience and anecdotal information, most bridge railings “fail” due to a
heavy vehicle rolling over the barrier rather than penetrating after a structural failure so the
BCAP results were counter intuitive. When a series of base-line simulations were performed
with BCAP mimicking the GSBR recommendations, the researchers found that BCAP predicted
32.7 percent of tractor-trailer trucks striking a PL2 bridge railing would penetrate the bridge
railing yet there were no predictions of rollover even though the center of gravity of a typical
tractor trailer truck is 64 inches high and the typical PL2 barrier height was 32 inches high (i.e.,
the c.g. of the vehicle is 32 inches higher than the top of the barrier). [Mak94] Mak and Sicking
discovered several reasons for this. One reason was the algorithm used to predict rollovers
resulted in unreasonably high critical velocities. A new rollover algorithm was proposed and
implemented as will be discussed in the later section devoted to BCAP.
Another reason involved barrier capacity. BCAP estimates the forces on the barrier using
an algorithm first developed by Olson. The algorithm, as will be described later, is a simple
derivation of the force based on the overall mechanics of the impact. After the impact force
imparted by the vehicle is calculated, it is compared to the assumed bridge rail capacity. If the
impact force is greater than the capacity, the bridge rail is considered failed. Estimating the
actual capacity of bridge railings is more difficult than it might first seem. Materials are
routinely assumed to be less strong and loads are routinely over estimated in design so even if
the theoretical capacity is calculated it is likely a very conservative value. For example, in
designing concrete structures a resistance factor 0.85 is usually used for bending which

45
essentially takes advantage of only 85 percent of the strength of concrete. Likewise, if an
allowable stress design method for steel were used, 67 percent of the strength of the steel is
assumed. In both cases, the designer is neglecting a significant portion of the capacity of the
structure. While this makes excellent design sense, it makes it difficult to estimate the real
failure conditions of the structure. BCAP assumed that PL1 bridge railings have a capacity of 15
kips, PL2 railings have 35 kips and PL3 railings have 55 kips. While there are relatively few
crash tests where structural failure of the bridge railing was observed, Mak and Sicking were
able to find some cases where the bridge railing experienced some degree of structural failure
(i.e., hairline cracking, spalling, etc.). When they compared the limited crash test results to the
BCAP assumptions they found that the BCAP assumptions were about half what could be
supported by crash tests as shown in Table 5.
Table 5. Bridge railing capacity recommendations in BCAP and NCHRP 22-08.[after
Mak94]
Performance Level BCAP Assumption
(kips)
Mak/Sicking
Recommendation
(kips)
PL1 15 30
PL2 35 64
PL3 55 108
Adding to the difficulty is the basic assumption in BCAP that when capacity is reached,
the bridge railing will totally fail and allow the vehicle to penetrate. In fact, this does not
generally happen. Bridge railings can experience structural failure and sometimes will still
redirect the vehicle. The “failure” may be cracks or spalls that are considered serious damage to
the bridge rail, but the bridge rail may still have enough structural integrity to prevent penetration
by the vehicle.
Recently, Alberson and others evaluated a 32-inch high PL2 concrete safety shaped
barrier, shown earlier in Figure 6, that had experienced structural failure problems in the
field.[Alberson11; Alberson04] A yield-line structural analysis was performed on the bridge
railing which resulted in an estimate of the barrier capacity of 33.6 kips when loaded near a
construction joint and 47.7 kips when loaded at the mid-span. The same design was then
constructed and statically tested to failure resulting in a near-the-joint capacity of 35.1 kips and a
mid-span capacity of 45.1 kips. The bridge railing was also subjected to full-scale Report 350
TL4 crash tests which were passed successfully and which caused relatively minor concrete
damage (e.g., hairline cracks and some gouging). As shown by Alberson’s research, the capacity
values suggested by the 1989 AASHTO GSBR were grossly over conservative and those
proposed by Mak and Sicking were more appropriate although it should be noted that this
particular railing was chosen for investigation precisely because there had been some observed
field structural failures so this particular railing probably represents the lower end of the capacity
of PL2 railings.

46
Since BCAP first assesses the capacity and then the rollover potential, the overly
conservative values for capacity tended to predict too many penetrations. Since the higher
velocity truck impacts would tend to reach the capacity too early and the rollover algorithm was
under conservative, penetrations were over predicted and rollovers under predicted.
Mak and Sicking revised the rollover algorithm and adjusted the bridge railing capacities
upward as shown in Table 5 and re-ran their analysis. For example, 32.7 percent of tractor trailer
truck crashes penetrated the railing and none rolled over in the initial BCAP runs whereas after
the improvements implemented by Mak and Sicking 3.4 percent penetrated which seemed more
reasonable.
Mak and Sicking also evaluated bridge railing crash data from Texas as will be discussed
in more detail in a later section. [Mak94] Mak and Sicking found that the Texas data indicated
that 2.2 percent of bridge railing crashes result in the vehicle going through (i.e., penetration) or
over (i.e., roll over the barrier) and they believed that even this value was a high-side estimate
due to coding errors on the police crash reports. The improved BCAP with the higher capacity
limits and improved rollover algorithm resulted in an overall estimate of 10 percent going
through (i.e., 1.2 percent penetrating and 8.9 percent rolling over) for the typical Texas
conditions so even the improved BCAP appeared to over predict penetrations/rollover by an
order of magnitude although the proportion of penetrations to rollovers appears much more
reasonable. In short, then, BCAP and the 1989 AASHTO GSBR appear to over predict bridge
railing penetrations and under predict rollovers. The improvements from NCHRP 22-08
appeared to improve the results although even the improved BCAP over predicts the incidence of
vehicles going through or over the bridge railing.
Mak and Sicking developed new versions of the selection tables based on the improved
version of BCAP. These new selection tables were structured in an identical way to the prior
tables but the traffic volume cutoffs were higher. Table 6 shows the portion of the revised
recommendations from NCHRP Project 22-08 that corresponds to Table 4 shown earlier. In the
example presented earlier, a PL2 bridge railing would be recommended for a four-lane divided
highway with a 60 mi/hr (100 km/hr) design speed, 15 percent trucks and eight-foot offset from
the travelled way and no adjustments for traffic volumes between 3,700 and 31,900 vpd whereas
Table 6 would suggest a PL2 bridge railing under the same conditions is appropriate for traffic
volumes of 17,000 to 51,000 vpd; much higher than the 1989 GSBR.
The final report for NCHRP 22-08 was never published since NCHRP Report 350
appeared about the same time and the RSAP program was also released. It was thought that
bridge railing selection guidelines would work themselves out in the process of replacing the
crash testing recommendations of the 1989 GSBR with the new recommendations of Report 350
and replacing BCAP with RSAP. Unfortunately, such was not the case and the 1989 GSBR was
never up-dated and its recommendations were never superseded.

47
Table 6. Revised selection guidelines for bridge railings based on NCHRP 22-08. [Mak94]
Roadside Design Guide
1989 also was the year that AASHTO first published the Roadside Design Guide (RDG).
The RDG is a comprehensive guide to designing many aspects of the roadside but Chapter 7
deals exclusively with bridge railings.[AASHTO89] The subject of test level selection
procedures is addressed briefly in section 7.3 of the RDG but the reader is referred back to
section 5.3 for general guidance on traffic and operational characteristics that should be used in
selecting the appropriate test level barrier.

48
RDG section 5.3 lists the following three subjective criteria that should be used in
choosing an appropriate test level barrier:
1. Percentage of heavy vehicles,
2. Adverse geometrics (e.g., small-radius horizontal curves),
3. Severe consequences of a penetration by a heavy vehicle.
In essence, the RDG restates the generally philosophy of the 1989 GSBR without
providing any additional specific information.
2004 AASHTO A Policy on the Geometric Design of Highways and Streets
The AASHTO document “A Policy on the Geometric Design of Highways and Streets”
(i.e., the Green Book) discusses the subject of bridge railings while addressing interchanges,
underpasses, and overpasses. Specifically, the Green Book recommends that “the design vehicle
should be safely redirected, without penetration or vaulting over the railing … the railings should
not pocket or snag the design vehicle, causing abrupt deceleration or spinout; and it should not
cause the design vehicle to roll over.” [AASHTO04]
Bridge railings may limit the sight distance at interchanges, intersections, on ramps and
along the road. The Green Book acknowledges this concern and suggests the bridge railing
“should provide a freedom of view … insofar as practical; however, capability to redirect errant
vehicles should have precedence over preserving the motorist’s view.” [AASHTO04]
Adjustments to the horizontal alignment are suggested to improve sight distance, when feasible.
When pedestrians or bicycles are accommodated on the bridge, the Green Book suggests
“a barrier-type bridge rail of adequate height should be installed between the pedestrian walkway
and the roadway. Also, a pedestrian rail or screen should be provided on the outer edge of the
walkway.” [AASHTO04]
FHWA Supplemental Guidance on Accommodating Heavy Vehicles on US Highways
The FHWA Office of Safety issued supplemental guidance on accommodating heavy
vehicles on US Highways in a 2004 report. [FHWA04] The report addresses both geometric
design barrier design, and placement issues. According to the report, there were 302 fatal single
vehicle truck crashes in 2002 involving van, cargo, flat-bed or dump type trailers. Of these 302
fatal crashes, the first harmful event in 26 (8.6 percent) of these cases was listed as guardrail,
concrete traffic barrier or bridge railing.
The FHWA report goes on to note that there are no specific warrants for the use of higher
performance or test level barriers because heavy vehicle impacts are generally rare events. The
report repeats the general guidance found in the RDG for subjective factors including (1) a high
percentage of trucks, (2) adverse geometrics and/or poor sight distance and (3) potentially severe
consequences associated with the truck penetrating the barrier and offers some additional
specific guidance [FHWA04].

49
This 2004 FHWA report cites a 1997 FHWA policy memorandum which formally
adopted NCHRP Report 350 as the guideline for testing bridge railings. This 1997 memorandum
summarized over a decade of crash tests conducted on bridge railings, providing a complete list
of all the crash tested bridge railings, the guidelines used to test the bridge railings (e.g., NCHRP
230, NCHRP 350, etc.), “equivalency” listings for other test standards, and sketches for
construction of the railings. This memorandum also established that the minimum acceptable
bridge railing acceptable on the national network will be Report 350 TL3, “unless supported by a
rational selection procedure.” The States were not, as a result of this memorandum, required to
upgrade existing bridge railings, beyond normal improvements. [FHWA97b]
The FHWA issued another policy memorandum in 2010, “Design Considerations for
Prevention of Cargo Tank Rollovers” in response to another fatal tanker truck crash investigated
by NTSB. [FHWA10] This memorandum reiterated the guidance in the 2004 FHWA report for
accommodating heavy vehicles, while adding some additional guidance. Some geometric
factors the FHWA suggests when selecting a bridge railing are:
Conflict points,
Dramatic horizontal and/or vertical alignments,
Lowering of the design speed, and
Super-elevation which may increase large vehicle instability.
Some highway characteristics the FHWA suggests considering in the selection of bridge
railings:
High volume highways or other such facilities (i.e., transit, commuter rail, etc.)
located beneath a bridge,
Facilities where an impact could lead to catastrophic loss of life (i.e., chemical
plants, nuclear facilities, etc.),
Sensitive environmental areas (i.e., public water supplies), or
Regionally or nationally significant bridges and tunnels.
In summary, several decades of recommendations by NTSB, crash testing by FHWA, and
multiple national research projects have resulted in general guidance from the FHWA for the
selection of bridge rails based on geometric factors and highway characteristics but there is still
relatively little specific guidance on the selection of bridge railings to fit specific local
conditions.
The States
Many states refer designers to Chapter 13 of the AASHTO LRFD Bridge Design
Specifications for strength and geometric requirements, NCHRP 350 for crash test criteria, the
1989 AASHTO Guide Specification for warrants based on ADT, design speed, percentage truck
traffic and horizontal and vertical geometry while noting that there is ongoing research to
evaluate the warrants in the 1989 Specification. These national documents are supplemented in
many States with a Bridge or Structures Design Manual in which the States detail the use of

50
specific railings under certain situations, specify particular test levels for certain roadways and
discuss retrofit polices. The Bridge or Structures Design Manuals from many different States
have been reviewed and are discussed in this section.
Florida DOT
The Florida Department of Transportation’s Structures Design Guidelines provide
guidance to designers on the selection of bridge railings. [FDOT11] This document provides the
following guidance for the installation of bridge railings, which extends to all construction,
including new, temporary, 3R (e.g., Resurfacing, Restoration and Rehabilitation) and widening
projects:
Permanent installations must install a successfully crash tested TL4, TL5 or TL6 bridge
railing.
Temporary installations must install a successfully crash tested TL3 (minimum) when
shielding drop-offs. TL2 (minimum) may be used when shielding work zones without
drop-offs and a design speed of 45 mph or less.
Upgrade both sides of a structure “when widening work is proposed for only one side and
the existing traffic railing on the non-widened side does not meet the criteria for new
traffic railings.” [FDOT11]
Designers should provide a TL5 or TL6 bridge railing “when any of the following
conditions exist:
The volume of truck traffic is unusually high.
A vehicle penetrating or overtopping the traffic railing would cause high risk to
the public or surrounding facilities.
The alignment is sharply curved with moderate to heavy truck traffic.”[FDOT11]
Standard bridge railing designs are suggested by FDOT, however, the use of non-FDOT
standard railings is permitted provided the railings meet the requirements listed above and
following the review and approval of the FDOT Structures Design Office.
When rehabilitation or renovation work is proposed on an existing structure and the
bridge railing does not meet the criteria detailed above, the existing railing should be replaced or
retrofitted to meet the TL4 minimum performance standards. When selecting a replacement or
retrofit bridge railing, FDOT suggests that designers evaluate the following aspects of the
project:
1. “Elements of the structure.
Width, alignment and grade of roadway along structure.
Type, aesthetics, and strength of existing railing.
Structure length.
Potential for posting speed limits in the vicinity of the structure.
Potential for establishing no-passing zones in the vicinity of the structure.

51
Approach and trailing end treatments (guardrail, crash cushion or rigid shoulder
barrier).
Strength of supporting bridge deck or wall.
Load rating of existing bridge.
2. Characteristics of the structure location.
Position of adjacent streets and their average daily traffic.
Structure height above lower terrain or waterway.
Approach roadways width, alignment and grade.
Design speed, posted speed, average daily traffic and percentage of truck traffic.
Accident history on the structure.
Traffic control required for initial construction of retrofit and for potential future
repairs.
Locations and characteristics of pedestrian facilities / features (if present).
3. Features of the retrofit designs.
Placement or spacing of anchor bolts or dowels.
Reinforcement anchorage and potential conflicts with existing reinforcement,
voids, conduits, etc.
Self-weight of retrofit railing.
End treatments.
Effects on pedestrian facilities.
Evaluation of existing supporting structure strength for traffic railing
retrofits.”[FDOT11]
FDOT suggests the use of the modified thrie beam guardrail or vertical face traffic railing
retrofits which are based on successfully crash-tested TL4 designs. Modifications to the designs
are offered to designers which should work with the various existing Florida bridges.[FDOT11]
Minnesota DOT
The Minnesota Department of Transportation publishes the Minnesota Bridge Design
Manual where bridge railing application is discussed.[MNDOT06] The Manual requires that
“railing designs shall include consideration of safety, cost, aesthetics and maintenance.”
[MNDOT06] The Bridge Design Manual details the use of TL2 through TL5 bridge railings for
uses with sidewalks, bicycles, various design speeds, and different geometrics. Different bridge
railings are also specified for specific routes. These specifications have been summarized and
are shown in Table 7.

52
Table 7 Summary of Minnesota “TABLE 13.2.1: Standard Rail Applications” [MNDOT06]
Description
Test
Level
Speed
Limit Application Comment
Concrete Barrier (Type P-1)
and Metal Railing TL2 ≤ 40 mph
Outside edge of walk on highway
bridges with sidewalks where bicycle
traffic on the walk is expected and
protective screening is not required.
2'-4" parapet with 2'-2" metal rail
Cloquet Bridge Railing Bridge
No. 09008 and 09009 2'-2 3/4" metal rail on 2'-4" parapet
Concrete Barrier (Type P-1)
and Wire Fence
TL2 ≤ 40 mph
Highway bridges with walks. This rail
is used on the outside edge of walk and
meets bicycle and protective screening
requirements.
2'-4" parapet and 6' metal rail with chain link
fabric.
Concrete Barrier (Type P-1)
and Tube Railing with Fence
2'-4" parapet and 5'-8 ½" metal rail with chain
link fabric
Concrete Barrier (Type P-3)
Ornamental 3'-9" metal rail on 2'-4" parapet
St. Peter Railing 4'-6" metal rail on 2'-4" parapet
TH 100 Corridor Standard 3'-9" metal rail on 2'-4" parapet
TH 212 Corridor Standard 5'-8' to 9'-2" metal rail on 2'-4" parapet
TH 610 Corridor Standard 5'-51/2" metal rail on 2'-4"parapet
Victoria Street Railing 5'-8" metal rail on 2'-4" parapet
Concrete Barrier
(Type F or P-4) TL4 All Traffic Only 2'-8" tall
Concrete Barrier (Type P-2)
and Structural Tube Railing TL4 All
Traffic Only, where an aesthetic railing
is desired. 1'-3" metal railing on 1'-9" parapet
Concrete Barrier (Type F) TL5 > 40 mph
High Protection Area where Dc > 5°
and Speed > 40 mph. 3'-6" tall
Concrete Barrier (Type F) TL5 All
Between sidewalk and roadway where
the shoulder is < 6'.
Concrete Barrier (Type F) TL5 All
Bridges with designated bike path or
where glare screen is required.
4'-8" tall (The additional height is to protect a
bicycle rider.)

53
New York State DOT
The New York State DOT uses the following recommendations for each
performance level, as outlined in the New York State DOT Bridge Manual:
[NYSDOT10]
“TL2 (PL1)–Taken to be generally acceptable for most local and collector roads
with favorable site conditions, work zones and where a small number of heavy
vehicles are expected and posted speeds are reduced.
TL4 (PL2)–Taken to be generally acceptable for the majority of applications on
high-speed highways, expressways and interstate highways with a mixture of
trucks and heavy vehicles.
TL5 (PL3)–Taken to be generally acceptable for applications on high-speed, high-
traffic volume and high ratio of heavy vehicles for expressways and interstate
highways with unfavorable site conditions.”
The railing functional and geometric characteristics are considered. These criteria
include the under-crossing features, pedestrian accommodations, and bicycle
accommodations. The formal accommodation of pedestrian and bicycle traffic requires
the use of 3.5 foot tall railings.
Table 6-1 of the NYSDOT Bridge Manual outlines bridge railing designs by
various AADTs for TL2 through TL5 which are appropriate for various scenarios
including pedestrian and bicycle accommodations and different under-crossing features.
Interstate and other controlled-access, high-speed highways are mandated to have
concrete bridge railings although parkways without truck traffic and culvert structures are
excluded. Steel railings are currently not permitted on interstates or for other TL5 uses
since, as the document in-correctly states, there were “no known steel railing systems”
crash tested for TL5.
In fact, concrete is the first choice of material for most of the bridge railing design
categories described above. “This preference is based on the concrete barrier’s strength,
durability and low initial and maintenance costs compared to metal railing systems.
Factors that may cause an alternative selection to be made are:”[NYSDOT10]
Bridge Deck Drainage
Aesthetics
Visibility
Snow Accumulation
“Railing treatments on rehabilitation projects is a complex subject with many
project specific considerations….engineering judgment will be required.” Safety is the
first considered when deciding on whether or not to upgrade bridge railing on a
rehabilitation project. After determining the long-term planning strategy for the area and

54
the structure, the existing railings are examined to determine if the railings meet NCHRP
230 crash test criteria. If the railing does meet those criteria, the existing railings are
often retrofitted with guardrail if there is a safety walk or allowed to remain in place as is.
If the bridge railings do not meet the NCHRP230 or later criteria, the railings are
upgraded. [NYSDOT10]
New Jersey DOT
The New Jersey DOT specifies, through the New Jersey Design Manual for
Bridges and Structures, 5th
Edition that TL5 systems are considered the minimally
accepted system for bridges which carry interstate traffic. [NJDOT10] TL4 systems are
used for other NHS classified roadways. On non-NHS/non-State owned roadways, the
use of TL1, TL2, and TL3 bridge railings are permitted. NJDOT suggests that the use of
crash test specifications outlined in NCHRP 350 be used to determine a test level which
best corresponds with the roadway when choosing a test level less than TL4, specifically
considering design speed, truck traffic and how the roadway characteristics relate to the
test level specifications to determine an appropriate test level for non-NHS roadways.
There are two TL5 systems used on interstate bridges in New Jersey: the 42-inch
tall “F” shape concrete barrier is recommended for heavy vehicle containment and for
horizontal curves of less than 1000 feet or on exit ramps and the 50-inch high Texas Type
HT railing is used in conjunction with noise barriers where heavy vehicle over-tipping
and potentially damaging the noise barrier is a concern.[NJDOT10]
Rhode Island DOT
The Rhode Island LRFD Bridge Design Manual states that “all railings systems
shall meet the full-scale crash-test criteria as established in the NCHRP Report 350.”
[RIDOT11] For new construction, TL4 bridge railings are the minimum test level barrier
installed, except on interstate highways where TL5 bridge railing shall be installed.
TL5 bridge railings are also considered when the bridge is expected to experience
high traffic volumes, high speeds with high truck percentages, or unfavorable site
conditions. Unfavorable conditions may include:
“High occupancy land uses below the bridge,
Deep water below the bridge,
Steep profile grades on or approaching the bridge,
High curvature along the alignment of the bridge,
Anticipated excessive number of van-type tractor trailers, or
Any other set of conditions which, through sound engineering judgment, may
justify a higher level of railing resistance.” [RIDOT11]
The installation of barriers with a test level less than TL4 may be considered
when the ADT is less than 500 vehicles per day, the percentage of trucks is less than or

55
equal to 5%, the design speed is less than 40 mph, the bridge is on a tangent section and
the bridge deck height is less than 28 feet above ground or water surface elevation.
Minor detail changes to existing, crash-tested railing systems are permitted, provided
“engineering judgment and/or analysis” is used to determine the need for additional
crash-testing. [RIDOT11]
Michigan DOT
In contrast to some other states, Michigan does not specify the minimum test level
for bridge railings but it does require upgrading all railings when the bridge deck is
replaced. [MDOT09] Regarding the installation of bridge railing, the MDOT Bridge
Design Manual states simply that the railing “shall be of a type that has passed full scale
impact (crash) tests” and provides a reference to five standard MDOT railings:
Type 4 Barrier - Standard Plan B-17-Series,
Type 5 Barrier - Standard Plan B-20-Series,
2 Tube railing - Standard PlanB-21-Series,
4 Tube railing – Standard Plan B-26-series and
Aesthetic Parapet Tube railing - Standard Plan B-25-Series.[MDOT09]
Massachusetts DOT
The Massachusetts Department of Transportation specifies the use of TL2, TL4
and TL5 barriers under different situations in the MassHighway Bridge
Manual.[MassDOT10] The following circumstances dictate the use of these different test
levels:
TL2 bridge railings may only be used on non-NHS roadways with speeds not
exceeding 45mph.
TL4 bridge railings may be used on NHS and Non-NHS highways, except
limited access highways and their ramps
TL5 bridge railings must be used on limited access highways and the ramps.
This includes interstate highways, NHS and Non-NHS highways.
Details for bridge railing designs for use in specific situations (e.g.., where
pedestrian are permitted or forbidden, bridges over electrified rail road tracks,
municipally owned bridges, etc.) are provided. Bridge railings other than the standard
railings are permitted provided that the use of non-standard railings “can be justified and
that they have been crash tested.”[MassDOT10]
Ohio DOT
An Ohio DOT inter-office memorandum restates the 2003 Design Manual policy
which established the minimum acceptable bridge railing shall be TL3, however, now
Ohio will allow the existing TL2 Deep Beam Bridge Railings to be maintained provided
they are in good condition. [ODOT02]

56
North Carolina DOT
The North Carolina Department of Transportation supplements national standards
with its Structures Design Manual where a minimum bridge railing of TL3 is established.
[NCDOT10] TL2 or aesthetic railings are permitted under the following situations:
“Non-NHS routes,
Design speeds less than or equal to 45 mph, or
In conjunction with a sidewalk.” [NCDOT10]
NCDOT suggests the use of vertical concrete barrier rail for bridges on NHS and
non-NHS routes. Bridges which accommodate pedestrians can add height to the railing
through an added metal railing. When conducting an overlay on the bridge, a minimum
rail height is established and noted on the plans to be maintained during construction,
however, guidance on establishing the minimum height is not provided in the Structures
Design Manual.[NCDOT10]
North Dakota DOT
North Dakota publishes a Design Manual which includes specifications for all
facets of highway design within the state of North Dakota. [NDDOT09] The bridge
chapter has specifications for the installation of new and retrofit bridge railings based on
height and refers designers to AASHTO for the latest specifications. NDDOT requires
all new bridge railing to be 32 inches tall (i.e., essentially Report 350 TL4) while existing
railing may be retrofitted with two-tubes where applicable. Bridge railings on sidewalks
are to be a minimum of 42 inches tall on the outer edge. Bridge railings on shared-use
paths (i.e., bicycle and pedestrian) are to be a minimum of 54 inches tall on the outer
edge. Both are to be crash tested. [NDDOT09]
Illinois DOT
The Illinois DOT provides guidance on the selection of the appropriate bridge
railing test level in its Bridge Manual where IDOT states that the owner of a structure is
“responsible for determining the test level necessary for each application” and that
railings on all new or rehabilitated bridges on Federal and State routes shall be TL4.
[IDOT09] The preferred bridge railing is the 34-inch TL4 F-Shape. A 42-inch high TL5
F-shape bridge railing “should only be used in the following scenarios:
1. Structures with a future DHV (one way) × % trucks greater than 250.
2. Structures located in areas with high incidences of truck rollover
accidents.
3. Structures with a radius of 1000 ft. or less with truck
traffic.”[IDOT09]
Following these guidelines, structures carrying 10% or more truck traffic and an
ADT of 5,000 vpd or more should install a TL5 bridge railing.

57
Indiana DOT
Indiana DOT allows the use of bridge railing designs ranging in performance
from TL2 through TL5 but does not include specifications for the specific installation of
any particular test level under any particular situation. Designers are referred to the
AASHTO LRFD Bridge Design Specifications.[INDOT10]
Nevada DOT
Nevada DOT provides guidance to designers on the general application of TL3
through TL6 bridge railings in its Structures Manual.[NDOT08] TL1 and TL2 bridge
rails “have no application in Nevada.” Specific warrants for TL3 and higher bridge
railings are not provided but the following general application guidance is offered for
each test level:
TL3 bridge railing is the minimum acceptable performance level. It may be used
for roadways with “very low mixtures of heavy vehicles and with favorable site
conditions.”
TL4 bridge railing is the minimum performance level for bridges on the NHS
system. It may be used on high-speed highways, freeways, expressways and
Interstates with a mixture of trucks and other heavy vehicles.
TL5 bridge railing is “for a special case where large trucks make up a significant
portion of the vehicular mix” and may only be used when approved by the Chief
Structures Engineer.
TL6 bridge railing is “for a special case where alignment geometry may require
the use of an extra height rail” and may only be used when approved by the Chief
Structures Engineer.
NDOT typically uses the 42-inch high F-shaped concrete barrier but the 32-inch
high version may also be used when applicable.[NDOT08]
Washington DOT
In its Bridge Design Manual Washington DOT requires the use of at least a TL4
bridge railing on all new bridges with some exceptions. [WSDOT08] TL5 bridge
railings are required under the following conditions:
“T intersections on a structure.
Barriers on structures with a radius of curvature less than 500 ft, greater than 10%
truck traffic, and where approach speeds are 50 mph or greater.
Particular systems identified as acceptable include the F-shaped and vertical face
concrete bridge railings. Washington DOT systematically improves or replaces existing
deficient bridge railings within the limits of roadway resurfacing projects by “utilizing an
approved crash tested rail system that is appropriate for the site” or designing a new

58
system. Approved systems are detailed in the Bridge Design Manual and include TL2
through TL4 retrofit designs. [WSDOT08]
International Specifications
A number of European countries have developed bridge railing selection criteria
and these are based on the crash testing standards and containment levels defined in
European Normative 1317 (EN 1317). The basic containment levels are described herein
in order to provide some basis of comparison between the US AASHTO GSBR/Report
350/MASH test levels and the EN 1317 containment levels. EN 1317 includes four
containment levels; containment “T” for low-angle containment consistent with many
temporary applications; containment “N” for the normal level on most roads;
containment H for high-containment levels and the H4 level for very high containment.
Containment level T is not appropriate for selecting bridge railings but the other three
containment levels are shown below in Table 8 with the nearest MASH test level in terms
of the target energy. The MASH and EN 1317 testing requirements are different so the
EN 1317 containment levels do not correspond exactly to the MASH test levels but for
selection guideline comparison purposes the equivalences shown in Table 8 should be
adequate. There is no MASH energy level similar to EN 1317 containment level H3 so
in later tables and in this discussion H3 barriers are referred to as TL4+ (i.e., between
TL4 and TL5).

59
Table 8. EN 1317 Containment Levels Pertaining to Bridge Railings
with the nearest MASH Test Level.
Containment
Level
Acceptance
Tests
Containment Energy
Level
Nearest
MASH
Test
Level
Minimum
MASH
Energy Level
(kJ) (ft-kips) (kJ)
(ft-
kips)
N1 TB31 370 273
N2 TB32/TB11 700 516 TL2 429 316
H1 TB42/TB11 1,890 1,393 TL3 876 645
H2 TB51/TB11 2,458 1,811 TL4 3,125 2,305
H3 TB61/TB11 3,951 1,087
H4a TB71/TB11 4,890 1,656
H4b TB81/TB11 6,194 4,565 TL5 8,889 6,556
Austria
Specifications for choosing bridge railings in Austria are contained in RVS
15.04.71(15.47). The EN1317 containment levels are specified based on the highway
type and certain characteristics of the roadway as summarized in Table 9. As shown in
Table 9, the basic or default bridge railing containment level for freeways (i.e., divided
high-speed highways) is EN1317 containment level H2 which is more or less equivalent
to Report 350 TL4. For certain geometric conditions like grades on long bridges, small-
radius horizontal curves, bridges with no emergency lanes and bridges that cross over
high-density populated areas or other transportation facilities, the containment level is
increased. The highest containment level specified is EN1317 H4b, which is roughly
equivalent to Report 350/MASH TL5.
The guidelines for bridges on secondary roads (i.e., lower speed undivided
roadways) have a similar pattern, although the basic containment level is EN1317 N1
which is broadly similar to Report 350 TL2. The containment level can be increased
based on the geometry of the bridge and land use up to a containment level of H2 (i.e.,
roughly TL4).

60
Table 9. Austrian containment level selection guidelines.
Roadway Characteristics
EN1317
Containment
Level
Freeways
Normal case H2
Upgrade > 4% for a lengths > 400m H3
Tight horizontal curves H3
Roads with no emergency lane H3
Bridges over important or protected areas H3
High-density populated areas H3
Bridges over railroads with train speed >70km/h H4
Bridges over railroads with train speed <70km/h H2
Secondary Roads
Normal case N1
Upgrade > 6% for a length > 250m N2
Tight horizontal curves N2
Bridges over important or protected areas H1
High-density populated areas H1
Bridges over railroads with train speed >70km/h H4
Bridges over railroads with train speed <70km/h H2
Canada
Within Canada, each Province largely determines its own road design policy. The
Alberta province Infrastructure and Transportation Roadside Design Guide , for example,
references the 1989 AASHTO Guide Specification and the FHWA Heavy Vehicle
Guidance discussed above. [Alberta11, AASHTO89; FHWA04] Using these documents
as references, the Alberta Province guides designers as summarized in Table 10 for new
and retrofit bridge railing installations.
Table 10 Alberta Canada Roadside Design Guide Bridge Rail Specifications
Test Level Application
TL2 For use on local roads.
TL4 Preferred bridge rail for most applications.
Urban bridges with cyclists.
Urban areas where aesthetics are important.
Short bridges (i.e., length < 20 m).
TL5
Use when high AADT with heavy truck volumes and/or
high structure dictates higher test level.

61
Appendix C1 Section HC1.1 of the Alberta Roadside Design Guide specifically
addresses upgrading existing bridge railings. [Alberta11a] Alberta employs a cost-
benefit analysis procedure, outlined in Appendix C1, to determine when to upgrade
existing bridge railings. Using encroachment rates and lateral extent probability,
adjustments for horizontal and vertical alignment, and adjustments for bridge height and
occupancy (i.e., Table 11), retrofit alternatives are considered for the remaining design
life of the bridge. The null alternative (i.e., doing nothing) is also considered. The most
cost-beneficial alternative is then implemented.
The Alberta procedure appears to be largely based on the 1989 AASHTO GSBR
and BCAP with alterations made specific to the circumstances in Alberta. The basic
equation used is:
PWCC = R ∙ kc∙ kg∙ P ∙ km ∙ ks ∙ AC ∙ L ∙ KC/100
where:
PWCC = Present worth of the collision costs for one side of the bridge,
R = Base encroachment rate in encroachments/km/yr/side,
kc = Highway curvature adjustment factor (i.e., unitless),
kg = Highway grade adjustment factor(i.e., unitless),
P = Lateral encroachment probability,
km = Multi-lane adjustment factor (i.e., unitless),
ks = Bridge height and occupancy factor (i.e., unitless),
AC = Cost per collision for severity index,
L = Length of bridge railing and
KC = Present worth and traffic growth factor.
The base encroachment rate, horizontal curve and grade factors, which are
provided in tables in the Alberta specification, are all the same as used in BCAP with the
exception they are reformulated into SI units. The factor P, the lateral extent of
encroachment, is similar to the approach used in BCAP and RSAP. The table is
organized by shoulder width and design speed. Since bridge railings are continuous and
shoulders are usually not much more than a lane-width, the lateral extent of
encroachment calculation is easily converted into a simple factor. The multi-lane factor
accounts for encroachments from other lanes. The bridge height and occupancy
adjustment factor (i.e., ks) is shown in Table 11. The adjustment can be as high as 2.85
for bridges over 75 feet high that span over high-occupancy land-use areas. The KC
factor lumps together both the present worth factor and traffic growth factors based on an
assumed four percent discount rate and two percent traffic growth and the target project
life.

62
One of the more interesting features of the Alberta selection guidelines involves
the selection of the accident cost. Appendix C2 provides a table of all the bridge railings
accepted for use in Alberta and there is a table with the severity index for each bridge
railing by the speed limit of the road the bridge is located on. A portion of the table is
shown in Figure 36. The user of these specifications would select a particular bridge
railing, find the severity index for the intended speed limit and then use that severity
index to lookup the accident costs.
Once the present worth of the accident costs and the present worth of the
upgrading costs are known for each alternative, the alternative with the smallest total
present worth is selected.
TPW = PWCC+PWUC
where:
PWCC = Present worth of the crash costs (i.e., see equation above),
PWUC = Present worth of the up-grade costs and
TPW = Total present worth.
Table 11. Bridge Height and Occupancy Factors
Bridge Height
Above
Ground (m)
Low
Occupancy
Land use
High
Occupancy
Land Use
<5 0.7 0.7
6 0.7 0.8
7 0.7 0.9
8 0.7 1
9 0.8 1.15
10 0.95 1.25
11 1.05 1.35
12 1.2 1.5
13 1.3 1.6
14 1.45 1.7
15 1.55 1.85
16 1.7 1.95
17 1.8 2.05
18 1.95 2.2
19 2.05 2.3
20 2.2 2.4
≥24 2.7 2.85

63
Figure 36. Portion of the Alberta bridge rail severity index selection table.
[Alberta11b]

64
Germany
The bridge railing selection guidelines for Germany are provided in RPS 2008 in
section 3.5.1.1 and are summarized below in Table 12. The German selection guidelines
generally segregate bridges into those that pass over sensitive areas, populated areas or
other transportation infrastructure. When the bridge crosses over a more sensitive area,
the containment level is increased. The basic containment level for low speed roads is
H1 which is essentially like Report 350 TL3. The highest containment level specified is
H4b which is well in excess of Report 350 TL5 or, for that matter, TL6. The selection is
based on the area crossed over and the speed and traffic volume of the roadway.
Table 12. German bridge railing selection guidelines.
Traffic Characteristics
Bridge Characteristics Speed >
100 km/h
Speed ≤ 100
km/h
AADT > 500
vpd
Speed ≤ 100
km/h
AADT ≤ 500
vpd
Speed ≤ 50
km/h
Bridges with dangerous areas
beneath like:
Explosive chemical
plants ,
High-density areas,
High-speed rail tracks
with speeds > 160
km/h
Two-lane roads
H4b H2 H2 H1
Other cases H2 H2 H1
Italy
The Italian Ministry of Infrastructures and Transportation instructs designers on
the selection of roadside barriers and bridge railings in a decree titled “Update of
technical instructions for the design, approval and use of road safety barriers, and
technical regulations for testing road safety barriers.”[Italy11] The decree references the
containment levels specified in EN 1317, traffic is subdivided into four categories by
volume and heavy vehicle percentage, as shown in Table 13. Table 14 is then used to
determine the appropriate application of bridge railing.

65
Table 13. Composition of Traffic by Category. [Italy11]
Type of traffic ADT* % of vehicles weighing > 3.5t
I 1000 or fewer Any
I >1000 5 or lower
II >1000 5 to 15
III >1000 >15
*ADT: Average Daily Traffic annually in both directions.
Table 14. Bridge Railings and Other Roadside Barriers by Traffic Category.
[Italy11]
Type of barrier Type of
traffic
Medians Roadside
Barriers
Bridge
Railings (1)
Freeways (A) and
main state and local
highways (B)
I H2 H1 H2
II H3 H2 H3
III H3-H4 (2) H2-H3 (2) H3-H4 (2)
Extra-urban and
secondary highways
(C) and ring roads (D)
I H1 N2 H2
II H2 H1 H2
III H2 H2 H3
Urban city street (E)
and local roads (F)
I N2 N1 H2
II H1 N2 H2
III H2 H1 H2
(1) Bridges or viaducts are defined as structures crossing a space of more than 10 meters;
structures crossing less space are considered equivalent to roadsides.
(2) The choice between the two classes is decided by the project engineer.
A review of Table 14 indicates that freeways generally have a higher performance
level bridge railing for any given traffic category then the other roadway types.
Generally speaking, EN1317 H2 barriers are more or less equivalent to TL4. The H4
barriers are approximately equivalent to TL5 barriers in the U.S. Therefore, the basic
default condition in Italy is a TL4 bridge railing with TL5 bridge railings used on
roadways with AADTs greater than 1000 vehicles/day and a percent of trucks greater
than 15.
United Kingdom
Unfortunately, the UK has experienced a number of dramatic and catastrophic
crashes involving vehicles leaving bridges and falling onto railway tracks. The 2001
Selby rail crash, for example, occurred on 28 February 2001 in Great Heck near Selby in
North Yorkshire. A Land Rover towing a trailer struck an approach guardrail and came

66
to rest below the bridge on the East Coast Main Line. The vehicle was struck by the
Newcastle to London King’s Cross train at over 120 mi/hr resulting in the derailment of
the train; 10 people were killed and 82 were injured in the crash. [Wainwright02]
While the Selby crash involved the approach guardrails to the bridge, there have
been other very similar cases involving penetrating bridge rails over rail lines in the UK.
For example, a concrete mixer truck penetrated a brick bridge parapet near the town of
Oxshott in Surey, England at about 3:30 pm on November 5th
, 2010. [RAIB11] The truck
landed on top of the sixth car of the Guildford to London Waterloo train. The truck
driver was seriously injured; one train passenger was seriously injured and five other
sustained minor injuries in the crash. Fortunately, no one was killed in the crash.
As a result of the Selby and Oxshott crashes, the UK Ministry of Transport re-
evaluated its design guidelines for barriers. The intent was to develop more explicit
detailed risk-based design guidelines. The United Kingdom has implemented a
performance based design process, supported by software coded in Excel and based on
the Design Manual for Roads and Bridges. [UK06] This process applies to the selection
of bridge railings with some pre-established minimum containment levels which
reference EN1317. These minimum Containment Levels are provided for bridge railings
over or adjacent to roads unless the Road Restraint Risk Assessment Process (RRRAP)
(i.e., the UK cost/benefit analysis process similar in some senses to RSAP) dictates a
higher containment level:
On roads with a speed limit of 50 mph or more:
1. Normal Containment Level = N2
2. Higher Containment Level = H2
3. Very High Containment Level = H4a
On roads with a speed limit of less than 50 mph:
1. Normal Containment Level = N1
2. Normal Containment Level = N2
3. Higher Containment Level = H2
4. Very High Containment Level = H4a
Other than in Northern Ireland, at minimum a very high containment Level (H4a)
bridge railing is used on new bridges and structures carrying a road over or adjacent to a
railway. The “highest practicable containment level that can be achieved without undue
cost,” as determined by the UK RRRAP, is provided for retrofit bridge railings over or
adjacent to a railway. Within Northern Ireland, the minimum bridge railing containment
level is normal containment level (N2) when the road is over or adjacent to a railway.
When a higher containment level is justified through the use of the performance-based
design process (i.e., RRRAP), “the level of provision must be confirmed with the

67
Overseeing Organization and the Railway Authority.” On an existing bridge that is not
over or adjacent to a railway, the Containment Level requirements are as follows:
Where the existing bridge or structure can support a bridge railing with a
containment level derived from the RRRAP, this level of containment must be
provided.
Where the existing bridge or structure cannot meet the containment level derived
from RRRAP, further assessment is conducted to determine the level of
containment possible without strengthening.
If the risks associated with the provision of the lower level of containment
determined through the RRRAP, then the lower containment level is provided. If
not, the bridge is improved to provide a higher containment bridge railing.
Summary
Table 15 through Table 18 shows a summary of all the bridge selection guidelines
discussed in the previous sections. These tables summarize the guidelines by highway
function, heavy vehicle accommodation, a combination of highway design selections and
by geometric design factors. The European standards have been included in these
summary tables using the following approximate equivalency between EN 1317
containment levels and Report 350 test levels.
EN1317 containment level N1 is approximately equivalent to TL3;
EN1317 containment level H2 is approximately equivalent to TL4; and
EN1317 containment level H4a is approximately equivalent to TL5.
Most States allow TL2 railings for non-NHS roadways while TL4 is generally the
preferred minimum for NHS roadways. TL5 railings are generally specified for roads
with heavy truck traffic, however the different states define heavy truck traffic differently
and a number of States recommend TL5 bridge railings on all Interstate highway
applications. TL5 railing are also recommended for some sharp horizontal curves with
varying definitions of sharp, sometimes with no definition of sharp at all.

68
Table 15. Summary of R350 Bridge Railing Selection by Highway Function. S
tate
/Countr
y
Bas
ed o
n p
rese
nt
wo
rth o
f cr
ash
and u
pgra
din
g c
ost
s (m
in).
Min
use
d f
or
retr
ofi
t des
igns.
Min
that
exis
ting m
ay r
emai
n.
Min
for
Non-N
HS
ro
adw
ays
Min
for
NH
S r
oad
way
s
Min
for
per
man
ent
inst
alla
tions.
Use
d f
or
all
new
bri
dges
Min
for
all
Sec
ondar
y h
ighw
ays
Loca
l an
d c
oll
ecto
r ro
ads
wit
h
favora
ble
sit
e co
ndit
ions.
Hig
h-s
pee
d h
ighw
ays,
expre
ssw
ays
and i
nte
rsta
tes
For
exit
ram
ps.
Work
zones
.
FL DOT TL4 TL2
NY DOT TL2 TL4 TL2
NJ DOT TL1 TL4 TL5
RI DOT TL4 TL5 <TL4
MA DOT TL2 TL4 TL5 TL5
OH DOT TL2 TL3
NC DOT TL2 TL3
IL DOT TL4
NV DOT TL4 TL3 TL4
WA DOT TL2
Austria TL4 TL2
Alberta TL3
Italy TL4 TL4
UK TL2

69
Table 16. Summary of R350 Bridge Rail Selection Guidelines for Heavy Vehicle
Accommodation.
Sta
te/C
ountr
y
Sm
all
num
ber
of
hea
vy
veh
icle
s is
expec
ted.
The
volu
me
of
truck
tra
ffic
is
unusu
ally
hig
h.
Hea
vy v
ehic
le c
onta
inm
ent
Hig
h-s
pee
d h
ighw
ays
w/
hig
h
traf
fic
volu
me
and %
T
Gre
ater
than
10%
T
A v
ehic
le p
enet
rati
ng w
ould
cause
hig
h r
isk.
Bri
dge
cross
ing o
ver
pro
tect
ed
area
s
Fre
eway
s w
ith b
ridg
es
cross
ing o
ver
rai
l li
nes
wit
h
trai
n s
pee
d ≥
50 m
i/hr
FL DOT TL5 TL6
NY DOT TL2 TL5
NJ DOT TL5
RI DOT <TL4 TL5 TL5
IL DOT TL5
NV DOT TL3 TL5
WA DOT TL5
Austria TL4+ TL5
Table 17. Summary of R350 Bridge Rail Selection Guidelines by Combination
of Selectors.
Sta
te/C
ountr
y
Hig
h P
rote
ctio
n A
rea
wh
ere
Dc
> 5
° an
d S
pee
d >
40 m
ph.
Spee
d l
imit
≤ 3
0 m
i/hr
and
dan
ger
ous
area
un
der
bri
dge
30 m
i/hr
≤ S
pee
d l
imit
≤ 6
0 m
i/hr,
AD
T ≤
500 v
pd a
nd n
o s
pec
ial
situ
atio
n u
nder
bri
dge
30 m
i/hr
≤ S
pee
d l
imit
≤ 6
0
mi/
hr,
any A
DT
, an
d a
dan
ger
ous
area
und
ern
eath
the
bri
dg
e
30 m
i/hr
≤ S
pee
d l
imit
≤ 6
0 m
i/hr,
AD
T >
500 v
pd a
nd N
o s
pec
ial
situ
atio
n u
nder
bri
dge
60 m
i/hr
≤ S
pee
d l
imit
and a
dan
ger
ous
area
un
der
bri
dge
AD
T <
1000 v
pd o
r T
ruck
s ≤
5 %
AD
T >
1000 v
pd an
d T
ruck
> 5
%
MN DOT TL5
RI DOT TL5
Germany TL3 TL3 TL4 TL4 TL5
Italy TL4 TL4+

70
Table 18. Summary of R350 Bridge Rail Selection Guidelines by Geometric
Design Considerations. S
tate
/Countr
y
Ali
gnm
ent
has
shar
p
hori
zonta
l cu
rve.
For
hori
zonta
l cu
rves
of
less
than
1000 f
eet.
Rad
ius
of
curv
ature
les
s
than
500 f
t
Wher
e al
ignm
ent
may
requir
e ex
tra
hei
ght.
Upgra
des
> 4
% l
asti
ng
more
than
400 m
Road
s w
ith n
o
emer
gen
cy l
anes
Tra
ffic
Only
(i.
e., no
bik
es o
r ped
s).
Bri
dges
wit
h d
esig
nat
ed
bik
e pat
h
‘T
’ in
ters
ecti
ons
on
bri
dge.
For
spee
ds
≤ 4
0 m
ph.
Spee
ds
≥ 5
0 m
ph
FL DOT TL5
MN DOT TL4 TL5 TL2
NJ DOT TL5
RI DOT TL5
NC DOT TL2
IL DOT TL5
NV DOT TL6
WA DOT TL5 TL5 TL5
Austria TL4+ TL4+ TL4+
Crash Data Studies
FHWA Narrow Bridge Study
The FHWA sponsored research at Southwest Research Institute in the early
1980’s to examine crash characteristics at narrow bridge sites. [FHWA83] The research,
which was performed by Mak and Calcote, was intended to determine the extent of the
crash problem associated with narrow bridge sites and collect statistics on the frequency,
severity and site characteristics. Crashes on 11,880 bridges were collected from five
states and a subfile of 1,989 bridge cases were identified for more detailed analysis.
Another subfile of 124 bridge crashes were selected for in-depth analysis. The data
included not only bridge railings but also approach guardrail, transitions and approach
guardrail terminals so it is sometimes difficult to isolate just the bridge railing effects.
Since the study was performed in the early 1980’s based on data that had been
collected primarily in the 1970’s, most of the structures were built prior to the 1965
AASHTO Bridge Design Specifications. The average construction date in the population
file was 1954. The results of this study, therefore, do not represent more modern crash
tested bridge railings. There was relatively little in the narrow bridge data to indicate the
proportion of rollovers and penetrations and, in any case, that data would not be reflective
of the types of bridge railings that are commonly installed today.

71
Table 19 shows the distribution of barrier performance in terms of the number and
percent of vehicles that were redirected, over-rode, vaulted or penetrated the barrier.
Unfortunately, the authors did not separate out different barrier types so it is believed that
the data in Table 19 include bridge railings, transitions and guardrails. Similarly, it is not
clear if there is a distinction between rollover back onto the roadway or rolling over the
bridge railing and off the bridge. In any case, nearly 75 percent of vehicle collisions
resulted in redirection and the remaining 25 percent were a combination of penetrations,
vaults and rollovers. If it is assumed that Table 19 represents mostly bridge railing
impacts, this would suggest that pre-1965 bridge railings resulted in about four percent
penetrations and 18 percent rollovers and vaults.
Table 19. Barrier Performance in Narrow Bridge Crashes. [FHWA83]
Barrier
Performance
1st Impact 2
nd Impact 3
rd Impact Total
No. % No. % No. % No. %
Redirected 87 73.1 53 79.1 16 76.2 156 75.4
Overrode 12 10.1 9 13.4 5 23.8 26 12.6
Vaulted 10 8.4 1 1.5 0 0.0 11 5.3
Penetrated 5 4.2 3 4.5 0 0.0 8 3.9
Other 5 4.2 1 1.5 0 0.0 6 2.9
Unknown 5 -- 1 -- 1 -- 7 --
Total 124 100.0 68 100.0 22 100.0 214 100.0
Interestingly, 77 percent of the crashes involved multiple impacts where the
vehicle struck and re-struck the bridge railing. While the percent redirected stays more or
less around 75 percent, the percent of over-rides increases from 10 to 23 percent and the
percentage of penetrations decreases from 4 percent to zero. This is probably reasonable
since there would be less energy available for creating a structural failure in each
subsequent crash (i.e., less chance of penetration) but the impact angles and yaw rates
probably increase for subsequent impacts which might promote overrides.
Mak and Calcote found that the crash severity increased as the bridge length,
percent of shoulder reduction and speed limit increased. The departure angle (i.e.,
encroachment angle) was 15 degrees or less for more than 61 percent of the cases and, as
would be expected due to the small distance between the edge of travel and the bridge
railing, the distance from departure to impact was less than 50 feet in 78 percent of the
cases. Mak and Calcote provided a great deal of information about the encroachment
conditions at narrow bridge sites including the encroachment speed, angle, lateral extent
and other impact conditions.

72
NCHRP 22-08
NCHRP Project 22-08 was the most comprehensive analysis of bridge rail
performance available to-date in the literature. [Mak94] The purpose of NCHRP 22-08
was to evaluate the appropriateness of AASHTO’s 1989 GSBR. Project 22-08 attempted
to determine the safety performance of existing bridge rails by examining more than
4,500 bridge rail crashes across the state of Texas. Hardcopies of the accident reports
were examined for all reported bridge departures (i.e., penetrations and rollovers).
Stratified random samples of accident reports from all other crashes were used as a
quality control check to identify the frequency of coding errors. Likewise, the age of
bridge rails were examined for all bridge departures and random samples were used to
identify characteristics of railings that retained impacting vehicles. This study found
remarkably high bridge rail crash severities for impacts involving vehicles retained on the
bridge. In fact, a total of 365 (8.1%) serious injury and fatal (A+K) crashes were
associated with vehicles retained on the bridge compared to 78 (A+K) (1.7%) crashes
arising from a vehicle penetrating through or going over a bridge rail. In other words,
more than 4.5 times more serious injury and fatal crashes occurred when a vehicle was
contained on a bridge then when the vehicle penetrated through or vaulted over the
railing. This ratio of serious injury and fatal crashes when the vehicle is retained versus
departing from the bridge was virtually unchanged when the analysis was limited to
interstate freeways which would presumably have more modern bridge rails. These
findings may indicate that societal costs of bridge rail accidents are more strongly related
to bridge rail performance during redirection crashes than to the number of vehicles
leaving the bridge. On the other hand, this also may be more a reflection of the generally
rural character of many Texas roads.
This may actually make sense since if the consequences of penetrating the railing
are limited to the truck and its occupants, there is much more potential for harm when the
vehicle actually stays on the road where it will interact with other vehicles. This
demonstrates that the potential for harm from a re-direction or a penetration/vault is very
sensitive to the land use around the bridge structure. If the bridge does not pass over a
transportation facility or urbanized area, the consequences of leaving the bridge for the
general public would be less serious than remaining on the bridge.
The importance of serious injury and fatal crashes associated with a vehicle being
retained on the bridge was further reinforced when the age of the bridge rail was taken
into consideration. Bridge railings designed to more modern standards, AASHTO’s 1965
or later Bridge Specifications, were found to have bridge departure rates (i.e., both rolling
over the bridge railing and penetration of it) of approximately 2.9% compared to 5.9% for
all vehicle types in the database as shown in Table 20. The results for trucks were even
more dramatic as shown in Table 20; single-unit truck rollovers and penetrations
decreased from 5.4 percent to 2.3 percent; a 57 percent reduction. Tractor-trailer truck

73
rollovers and penetrations experienced a dramatic decrease from 24.5 percent for bridge
railings designed before 1965 to 7.8 percent for those designed after 1965. Clearly, the
requirements of the 1965 Bridge Specifications had a dramatic effect on reducing
rollovers and penetrations of bridge railings.
Table 20. Penetration and rollover percentage in Texas bridge railing crashes.
[Mak94]
Bridge Railing
Design Year
All Vehicle
Types
(%)
Single Unit
Trucks
(%)
Tractor-
Trailer
Trucks
(%)
Before 1965 5.9 5.4 24.5
After 1965 2.9 2.3 7.8
Reduction 51 57 68
The bridge departure rate was further reduced when hardcopies of accident
reports were carefully reviewed. This hard-copy analysis found that only a third of the
reported bridge departures actually involved a vehicle striking a bridge rail. The
remaining crashes were found to involve vehicles penetrating through or going over a
bridge approach transition, a guardrail or guardrail end. Similarly, when a subset of the
data were visually inspected, many of the cases coded as single-unit trucks were, in fact,
pickup trucks, utility vehicles and vans. In fact, of the 53 cases where hard-copy were
reviewed only 15 actually involved trucks going through or over bridge railings. When
improper coding and age of the bridge rail were taken into consideration, it was found
that modern bridge rails contained approximately 99 percent of the trucks striking the
bridge railing; or conversely, the rollover and penetration percentage for trucks was
around one percent.
Kansas Bridge Rail Study
A more recent study of bridge rail crashes in Kansas found much lower severities
than reported in NCHRP 22-08. [Sicking09] This study examined all bridge rail crashes
on controlled access freeways in the state of Kansas for the years 2002 through 2006. A
total of 705 bridge rail crashes were identified. The combined A+K rate for bridge rail
crashes was found to be 3.43% compared to 8.1% found in the Texas study. The lower
crash severities observed in Kansas are believed to be related to this state’s lower
accident reporting threshold compared to Texas. When hardcopies of accident reports
from all serious injury and fatal crashes were examined, it was found that only one of the
24 reports improperly coded a guardrail crash as bridge rail impact. Of the 23 remaining
serious injury or fatal crashes involving a bridge rail, only one involved a vehicle going
through or over the railing. In fact, this crash involved a tractor trailer breaking through a

74
bridge rail and surprisingly, the driver was not killed when his truck fell 50 feet to land
on railroad tracks below the overpass. The three reported fatal bridge rail crashes
included a passenger car rollover, a light-truck that lost its driver side door, and a
passenger’s head extending out of the window to strike a concrete barrier. Based on the
more than 20:1 ratio between serious injury and fatal crashes involving containment
versus penetration, it appears that vehicles leaving a bridge are not a major source of
bridge rail crash costs in Kansas. Kansas’ controlled access freeways primarily utilize
open concrete, New Jersey, and F shape concrete bridge rails. With the exception of
bridges over railroad tracks, almost all existing Kansas bridge rails are 32 inches high and
fall into the TL3 category under the new MASH criteria.
The relatively low capacity associated with most Kansas bridge railings (i.e.,
Kansas generally uses MASH TL3 bridge railings) and the infrequency of serious injury
and fatal crashes associated with vehicles departing these bridges makes it very clear that
bridge rail selection guidelines should not be based solely upon barrier capacity.
Analysis Methods for Bridge Railing Selection
There is a surprisingly long history of using benefit-cost encroachment-based
computer programs in roadside safety. The 1977 Barrier Guide presented a hand-
calculation method based on work by Glennon but it was not particularly practical for
roadside design practitioners since there was a lot of tedious hand calculation required.
In 1989, AASHTO revised, updated and expanded the 1977 Barrier Guide transforming it
into the Roadside Design Guide. [AASHTO89] Appendix A of the Roadside Design
Guide included a revision of the cost-effectiveness procedures and provided a computer
program called Roadside to ease the calculation burden on designers and policy makers.
BCAP was largely based on the Roadside method with a number of enhancement and
improvements intended for use in selecting bridge railings using a cost-benefit
encroachment estimation procedure. [AASHTO89]
In their day, Roadside and BCAP were innovative implementations of risk-based
probabilistic roadside cost-benefit design. Of course, as computer applications became
more sophisticated and additional research was performed to refine and improve
encroachment models, severity indices and other aspects of the procedures, it became
apparent that a new computer program was needed. The resulting program, the Roadside
Safety Analysis Program (RSAP), was completed in 2003 and documented in NCHRP
Report 492 by Mak and Sicking. [Mak03] Additional research on measured vehicle
trajectories during encroachments and the replacement of severity indices with the
equivalent fatal crash cost ratio (EFCCR) as well as continued advancements in
computers culminated in the most recent update to RSAP in 2012, RSAPv3. [Ray12]
This current research is based on simulations performed using RSAPv3, however, the

75
predecessors to RSAPv3are discussed here because each of these software tools represent
individual steps forward in the development of bridge rail selection guidelines.
BCAP
Like Roadside, BCAP assumes an encroachment rate of 0.0005
encroachments/mi/yr per edge of roadway and could be modified to account for grade
and curvature of the roadway with adjustment factors. The encroachment model
investigated encroachments by 13 vehicle types leaving the roadway at 10 different
speeds and up to 12 different angles. The total crash cost associated with a design
alternative was calculated by summing the crash costs for each encroachment condition
multiplied by their associated probabilities of occurrence. The crash costs for each
encroachment were estimated based on the severity of the encroachment (i.e., the
consequences of impacting the bridge rail at the prescribed encroachment conditions).
BCAP used a severity index (SI) scale of zero to ten to define the severity of a
predicted barrier collision. Each SI had an assumed distribution of accident outcomes
ranging from property damage only (PDO) to fatality. For redirection impacts, the SI
was assumed to be linearly related to the lateral acceleration of the vehicle. BCAP also
assumed that any bridge railing with acceptable crash test performance would have the
same severity index for redirectional collisions. For a barrier penetration, the SI was
assigned a value of 7.0. For a rollover on the traffic side of the barrier, the severity was
linearly correlated to impact speed.
The probability density function (PDF) for encroachment speed ranged from zero
to 15 mph above a reference speed which was taken as 0.9 times the highway design
speed. For a given encroachment speed, the encroachment angles were varied in three
degree increments from zero up to a maximum of 36 degrees. The PDF was assumed to
vary linearly between these two points. A model was used to determine the maximum
angle a vehicle can leave the roadway without skidding or overturning. The model
included consideration of barrier offset distance, encroachment speed, tire-pavement
friction, vehicle stability, and minimum turning radius. In cases in which the model
precludes higher angle encroachments, the encroachment angle PDF was truncated and
adjusted.
BCAP assumed a straight line encroachment trajectory. The maximum extent of
lateral encroachment was estimated using a constant deceleration rate of 13 ft/sec2, which
is equivalent to a braking friction of 0.4. Since BCAP was intended only for bridge
railing applications, there is no representation of the roadside (i.e., no slopes or other off-
road hazards) and the lateral extent of encroachment is relatively unimportant since
bridge rails are by definition placed relatively close to the edge of the roadway.
As discussed earlier, BCAP estimates the force imposed on the bridge railing by
each collision using the speed, angle and mass of the encroaching vehicle. This force

76
estimate is then compared to the assumed capacity of the bridge railing. If the capacity is
less than the impact force, the bridge rail is assumed to be completely penetrated and the
vehicle is assumed to fall off the bridge. If the impact force is less than the capacity,
redirection is assumed and the vehicle conditions are checked to see if rollover is likely.
As discussed earlier with respect to the 1989 AASHTO GSBR recommendations, BCAP
was found by Mak and Sicking to over predict barrier penetrations and under predict
rollovers by a considerable margin.
The penetration model used in BCAP was based on work by Olsen in NCHRP
Report 149. [Olsen74] Olsen suggested that the lateral force imparted by the vehicle to
the barrier could be approximated as:
where:
Flat = The average lateral deceleration of the vehicle,
W = The weight of the vehicle in lbs,
V = The vehicle impact velocity in ft/sec,
Θ = The impact angle,
A = The distance from the front of the vehicle to the center of mass in ft,
B = Vehicle width in feet and
D = Lateral deflection of the barrier in feet.
BCAP generates a set of encroachment conditions (i.e., speed, angle and vehicle
type) and this lateral force can then be calculated based on those assumed impact
conditions. If the lateral impact force is greater than the capacity of a barrier, the barrier
is assumed to have failed structurally. While Olsen’s model is a good simple estimator it
certainly has its limits. First, it is based on estimating the impact force when damage is
more properly related to strain energy. Unfortunately, while impact energy is easy to
calculate (i.e., ½ mv2), the strain energy capacity of a barrier is quite difficult to calculate
at least in some simplified form. Also, in developing the 1989 GSBR recommendations,
it was assumed that the barrier deflection would always be zero. This is probably
reasonable for rigid concrete barriers but it has the effect of under estimating the capacity
of post-and-beam types of bridge railings. Another flaw with this penetration model, at
least with respect to its use in BCAP, is that once capacity has been reached it is assumed
the barrier is totally compromised when in fact the capacity load is really just the
beginning of the failure process. The barrier may often contain and redirect the vehicle
even though there are structural failures; in other words, reaching capacity does not
necessarily mean the vehicle will penetrate the barrier.

77
The rollover algorithm only is activated if the bridge railing is not penetrated.
BCAP first checks to see if the capacity has been reached. If capacity has been exceeded,
the vehicle penetrates the railing. If capacity has not been exceeded, the vehicle is
assumed to be redirected and the rollover algorithm is activated. The rollover condition
in the original BCAP is:
√ [
][√
]
where:
Vcr= The velocity in ft/sec that the vehicle would rollover,
g = The acceleration due to gravity (i.e., 32.2 ft/s2),
Hcg = The height of the vehicle center of gravity in ft,
Hb = The height of the barrier in feet and
Θ = The impact angle.
This formulation assumes that the vehicle forces act at the center of gravity of the
vehicle and that the barrier forces act at the very top of the barrier. Mak and Sicking
found that this equation yields critical velocity estimates that are too high so BCAP
seldom predicted a rollover.
Mak and Sicking modified the model by assuming the barrier forces act at the
vehicle axle rather than top of the barrier and that the truck would rotate about the top of
the barrier when the truck deck settled onto it during the rollover. The improved
impulse-momentum model is given by:
√
[ ]
[
]
where the terms are as before in addition to:
d = Distance from the vehicle c.g. to the bottom edge of the truck frame in
inches,
Hf = Height of the center of the truck axle in inches, R= The radius of gyration of the truck and its load about the bottom corner of
the truck frame.
This model was validated to some extent with HVOSM and NARD and resulted
in lower critical velocities and more rollovers in the BCAP analyses. As discussed
earlier, the improved rollover algorithm and adjustments to the barrier capacity
performed by Mak and Sicking improved the estimates of BCAP but BCAP still

78
predicted many more crashes than comparison to the real-world data available at the time
indicated.
Both of these rollover models completely ignore the effect of barrier shape on
vaulting and rollover by vehicles with c.g. heights lower than the barrier height. For
example, many passenger cars vault over safety shaped barriers even though the height of
the passenger car c.g. is lower than the barrier height. The reason is that the shape of the
barrier in some shallow impact angles has the effect of launching the vehicle over the
barrier. This is not accounted for in either model.
BCAP used the crash costs shown in Table 21 which, by today’s standards, are
very low. There is no explicit provision in the 1989 AASHTO GSBR for updating these
costs or adjusting them for inflation.
Table 21. Crash Costs used in BCAP. [AASHTO89]
Crash Severity Average Cost
Fatal $500,000
Severe $110,000
Moderate $10,000
Slight $3000
Property damage only (level 2) $2500
Property damage only (level 1) $500
In summary, the BCAP was innovative and ground-breaking in many ways in its
time. It used a benefit-cost approach to develop the guidelines and presented a
systematic method for selecting the appropriate bridge railing. Unfortunately, some of
the data in BCAP was flawed and some of the algorithms were overly conservative. The
general approach was a reasonable way to select bridge railings but the assumptions, lack
of data and lack of validation resulted in unrealistic recommendations.
RSAP
The Roadside Safety Analysis Program (RSAP) is a computer program for
performing encroachment-based cost-benefit analyses on roadside designs. A key step in
performing such analyses is to estimate the frequency and severity of roadside crashes for
a particular roadside design where the design encompasses highway geometric features
like the horizontal curvature and grade as well as the roadside features like the location
and type of guardrails, the shoulder widths and the slope of the roadside. Once the
frequency and severity of crashes has been estimated, the cost can be found by mapping
the frequency and severity into units of dollars given the average societal cost of each
expected crash. A roadside design that results in a smaller societal cost is, therefore, a
safer and better design. If the reduction in crash costs over the design life of the
improvement are greater than the construction and maintenance costs of the improvement

79
the design is cost-beneficial and should be constructed. On the other hand, if the
reductions in crash costs are less than the construction/maintenance cost of the
improvement the project probably is not worth pursuing.
Estimating the frequency and severity of crashes for a given roadside design can
be challenging since all the variables are probabilistic in nature and many are not well
known or understood. For example, vehicles will leave the roadway (i.e., encroach) at a
variety of speeds, angles and orientations; vehicles will leave the road at various points
along the road segment and the path taken by the vehicle off the road will depend on
driver steering and braking input, . Likewise, not all vehicles that leave the road will
strike an object so there is a probability distribution associated with the likelihood of
striking an object once the vehicle leaves the road. Even when a vehicle does strike an
object like a guardrail, sign support or tree on the roadside, the severity of the crash can
vary from no-injury to one with multiple fatalities. Since estimating the frequency and
severity of roadside crashes involves several conditional probabilities, methods like
RSAP are really risk-based probabilistic analysis tools where mathematical models of
probabilities and risk are manipulated in order to estimate the frequency and severity of
crashes.
RSAP uses these four modules to assess the cost-effectiveness of a design:
Encroachment Module,
Crash Prediction Module,
Severity Prediction Module, and
Benefit/Cost Analysis Module.
The encroachment probability model is built on a series of conditional
probabilities. First, given an encroachment, the crash prediction module then assesses if
the encroachment would result in a crash, P(C|E). If a crash is predicted, the severity
prediction module estimates the severity of the crash, P(I|C). The severity estimate of
each crash is calculated using crash cost figures so the output is in units of dollars.
The original version of RSAP estimated the crash costs using a Monte Carlo
simulation technique that simulates tens of thousands of encroachments and predicts the
frequency and severity of each simulated encroachment. For each alternative, an average
annual crash cost was calculated by summing the crash costs for all the simulated crashes
on each segment. These crash costs were then normalized to an annual basis. Any direct
costs, (i.e., initial installation and maintenance) were also normalized using the project
life and the discount rate. Similar to its predecessor, the original version of RSAP used
straight line vehicle trajectories and a stored table of possible angles and speeds.
The third version of RSAP (RSAPv3) was used in this research. [Ray12] Using a
series of conditional probabilities, RSAPv3 first predicts the number of encroachments
expected on a segment. Given an encroachment has occurred, the likelihood of a crash is

80
assessed by examining the location of roadside features and comparing those locations to
a wide variety of possible field collected vehicle paths across the roadside. If a crash is
predicted (i.e., one of the possible trajectories intersects with the location of a roadside
hazard), the severity is estimated and converted to units of dollars.
RSAPv3 proceeds by simulating tens of thousands of encroachment trajectories
and examining which trajectories strike objects, the probability of penetration or rolling
over the object and the likely severity of those collisions. The passenger vehicle
trajectories used in RSAPv3 were gathered from reconstructed run-off-road crashes under
NCHRP 17-22. [Mak10]
After the total crash costs and the direct costs are calculated for each alternative,
the concept of incremental benefit/cost (B/C) is used to determine the cost-effectiveness
of the design. The B/C ratio used is as follows:
B/C Ratio2-1=
Where:
B/C Ratio 2-1= Incremental B/C ratio of alternative 2 to Alternative 1
CC1, CC2, = Annualized crash cost for Alternatives 1 and 2
DC1, DC2, = Annualized direct cost for Alternatives 1 and 2
RRRAP
The Road Restraint Risk Assessment Process (RRRAP) is a software program
developed in the UK to aid in the implementation of the “Design Manual for Roads and
Bridges,” TD 19/06. [UK06] RRRAP is a risk-assessment software tool to allow
engineers to explicitly assess the risks associated with crashes and compare and evaluate
different alternatives. Alternatives are compared using a benefit-cost procedure much
like has been used in RSAP, BCAP and Roadside. RRRAP was coded in MS Excel using
extensive macros to perform the bulk of the numerical calculations.
Broadly speaking, RRRAP is limited to “trunk” roadways (i.e., roadways that are
not local roads and streets) with posted speed limits of 50 mi/hr and above and AADTs of
5,000 vehicles/day and greater. By default, RRRAP assesses the “null” conditions (i.e.,
no roadside safety features) with the basic EN 1317 containment level of N2. The user
can then elect to explore other containment levels to determine if they are or are not cost-
beneficial. Three vehicle classes are considered – “light” vehicles are all vehicles less
than 3,000 lbs, “medium vehicles” are those weighing between 3,000 and 7,000 lbs and
large goods vehicles are all vehicles weighing over 7,000 lbs.

81
RRRAP treats bridge railings a little differently than most other roadside hazards
in that the only risk that is considered is the risk of breeching (i.e., penetrating or rolling
over) the bridge railing. In other words, crashes where the vehicle is contained on the
bridge are not considered in the risk assessment. The assumption is that the major risk
for a bridge railing is the risk to third parties (i.e., either non-road users or users of other
transportation facilities beneath the bridge).
The basic procedure for bridge railings in RRRAP is to start with the basic EN
1317 N2 containment level and determine the likely number of breeches for each class of
vehicles. The bridge parapet breech rate is then computed by dividing the number of
breeches in each vehicle category by the length of the bridge and then summing those
rates to arrive at the total number breachings per year per foot of bridge. Some
modification factors are applied to account for the shoulder width and type. Next the
average cost of a crash is multiplied by the number of breachings considering first only
the road users and then third parties.
If the risk (i.e., total penetrations/mi/yr) is less than a predetermined threshold,
then the alternative is acceptable. If the risk is above the minimum threshold, the process
is repeated for the next containment level and the alternatives are compared by
calculating the benefit cost ratios between the alternatives until a cost-beneficial solution
is achieved.
Risk Analysis
Another approach not often used explicitly in roadside safety but common in
many other types of engineering fields is risk analysis. In risk analysis the risk of
experiencing a particular type of event is quantified using probabilistic models. An
acceptable level of risk is established over the project life and then the system is
engineered to ensure that the risk in-service is below the targeted acceptable risk. For
example, a transportation agency might decide that if the risk of a severe or fatal injury
over the 30-year life of the project is less than 0.05 it is acceptable.
The benefit-cost method used in roadside safety is actually a risk assessment
method to estimate the reduction in anticipated crash costs (i.e., the benefits) then a
standard benefit-cost analysis that includes the calculated crash costs and agency costs
such as construction, maintenance and repair over the life of the project. Roadside safety
analysis programs like Roadside, BCAP and RSAP have always calculated the average
expected cost of crashes by simulating tens of thousands of possible encroachments and
then multiplying by the expected number of encroachments each year. The average crash
cost is calculated as follows:

82
[∑
[∑
]]
where:
= The average annual crash cost,
CCij = The crash cost of encroachment i with vehicle type j,
Wj = The proportion of the traffic volume accounted for by vehicle type j,
N = The total number of encroachments simulated and
M = The total number of different vehicle types in the traffic mix.
Earlier roadside safety benefit-cost programs simply calculate the average annual
crash cost “on the fly” without saving the crash cost of each encroachment but RSAPv3
saves individual terms of the summation so that the distribution of crash costs over the
life of the project can be examined. Since the probability distribution of crash costs is
saved, the risk of exceeding any particular crash cost (i.e., severity level) can be easily
calculated.
Conclusions
While anecdotal from a statistical point of view, the crashes discussed earlier
illustrate several interesting points. Many of the crashes involved horizontal curvature,
curved on/off ramps, bridges and overpasses over other highways, hazardous materials
routes, heavy vehicles, or highways with large numbers of trucks and buses. In some
cases these crashes have occurred on highways specifically designated as “truck routes”
or “hazardous material routes” which would seem to suggest that these highways should
use barriers capable of restraining such vehicles. On the other hand, some of the crashes
reported by the media or investigated by NTSB occurred at sites that would likely not
have been considered to be particularly susceptible to a heavy vehicle crash.
While some of the crashes certainly occurred at sites with the three risk factors
noted in the RDG and the 1989 AASHTO GSBR (i.e., adverse geometry, percent of
trucks and adverse consequences of penetration), others do not. For example, the bridge
railing involved in the Sherman, Texas crash was probably a non-crash tested bridge
railing that had been constructed long before FHWA made crash testing of bridge railings
mandatory. The Sherman, Texas crash site did not have adverse geometric
characteristics, did not pass over a sensitive facility or area and was not on a highway
with a particularly large percentage of trucks so it is unlikely it would have warranted a
higher performance railing than most other highway applications. What was really
required at that particular site was a way to identify substandard and un-crash tested
bridge railings and replace them. On the other hand, the Sherman, Texas crash does point
out the fact that bridges generally have a design life on the order of 50 or more years so

83
there are likely still many bridges with pre-1965 designed bridge railings. There are
likely many un-crash tested bridge railings still on the National Highway System and
there are certainly many on the State and local roadway networks that need to be
identified and possibly upgraded.
The NTSB has recommended the development of selection criteria for bridge
railings and improved bridge railing design for larger vehicles for nearly 30 years. While
there has been a great deal of research, design and testing to develop high containment
bridge railings the development of selection and location criteria have lagged
considerably behind so, while there are now many more higher containment bridge
railings available States and designers are still largely left to their own judgment on
where and when to use them. While the basic approach set out in the 1989 AASHTO
GSBR was a good step forward, its guidance was still largely general and intuitive. The
BCAP computer program suggested for use in assessing the cost effectiveness of
different performance level bridge railings was found to have problems with its
underlying data and it was soon replaced by the more general RSAP program.
Some States are satisfied with TL3 bridge railings in most situations but many
other States, particularly more urbanized States, have established TL4 as the minimum
acceptable test level bridge railing installed on NHS and/or interstate highways. A few
States, generally with more high-volume urban highways, even require that TL5 bridge
railings be installed on interstate highways (e.g., New Jersey). Only a few states have
established guidelines which define adverse geometry or the percentage of trucks which
would require the installation of a higher test level bridge railing. Even fewer states have
a policy in place for the systematic retrofitting or replacement of substandard bridge
railings, with cost often cited as a major concern when deciding to upgrade to a higher
test level for new and retrofit designs. Pedestrian and bicycle accommodations, however,
dictate in all reviewed state policies the use of 42 inch bridge railing regardless of costs to
reduce the possibility of pedestrians or bicyclists from going over the railing.
There is, therefore, a need to develop more specific recommendations on where
different test level bridge railings should be used. While the general guidance provided
by the 1989 AASHTO GSBR and the Roadside Design Guide are sound, States and
designers need more specific characteristics like what percentage of trucks constitute
“large truck traffic,” or what traffic volume might be considered “high volume,” or what
degree of curvature constitutes a “sharp curve.” Providing these more specific answers is
one of the objectives of this research project.

84

85
RESULTS OF SURVEY OF PRACTICE
Introduction
A survey of practitioners was distributed via e-mail to about 2,800 roadside safety
researchers, bridge engineers, DOT engineers, and highway design consultants both
within the US and abroad. This survey was conducted to determine the current policies
for deciding which test level bridge railing to use in particular situations and to obtain
data which could be used in this research. The distribution list was compiled from the
AASHTO Subcommittee for Bridges and Structures mailing list, the TRB AFB20 and
AFB20 subcommittees’ mailing lists, the ITE database, AASHTO-ARTBA-AGC TF13
mailing list, ATSSA training course participant list, and from a list of people who have
purchased the Roadside Design Guide from AASHTO.
The survey was assembled and made available using the on-line tool
surveymonkey.com (i.e., www.surveymonkey.com). The survey had several purposes
including:
What is the default bridge railing test level used in each State or country?
Are there specific warrants for using a different test level than the default?
If there are not specific warrants, are there informal guidelines or criteria for
deciding when to use a different performance bridge railing?
Are construction or repair cost data available for bridge railings?
Can the bridge inventory be linked to the States crash data?
Approximately 54 people started the survey and 45 people completed it resulting
in a completion rate of 83 percent. The remaining recipients that did not respond in any
way are presumed to know nothing about the selection of bridge railings or are not active
in the roadside safety aspects of bridge design. The survey asked a variety of questions
about bridge rail selection guidelines in use, bridge railing inventories and crash
databases. The following sections discuss each question and summarize the responses.
Survey Questions
Question 1: Please provide the following optional information about yourself.
Respondents were asked to provide contact information. Approximately 90
percent of the respondents provided this information. Respondents represent a variety of
countries including the United States, England, China, and New Zealand.
Representatives from thirty-two states responded (listed below), however, not all of these
respondents represent a state Department of Transportation (DOT). Many are consultants
or researchers who have exposure to local and regional design guidelines. Additionally,
some respondents represent county level engineering departments responsible for their
own bridge rails.

86
1. Alabama
2. Florida
3. Georgia
4. Hawaii
5. Illinois
6. Indiana
7. Iowa
8. Kansas
9. Kentucky
10. Louisiana
11. Maryland
12. Massachusetts
13. Michigan
14. Minnesota
15. Mississippi
16. Nebraska
17. Nevada
18. New Jersey
19. New York
20. North Dakota
21. Ohio
22. Oregon
23. Pennsylvania
24. Rhode Island
25. South Carolina
26. South Dakota
27. Texas
28. Utah
29. Virginia
30. Washington
31. Wisconsin
32. Wyoming
In summary, this wide variety of respondents provided a good cross-section
regarding the type of data available for this study as well the practices currently in use
both nationally and internationally.
Question 2: What are the approximate percentages of TL2, TL3, TL4, TL5, and TL6
bridge rails you have in your jurisdiction?
Respondents were asked to provide specific information about the distribution of
bridge rails within their jurisdictions. The test levels referred to in this question are
Report 350 test levels. The approximate percentage, not mileage, of the rails was
obtained from thirty-five of the people who took this survey. An additional five
participants answered “unknown” while many others skipped the question altogether
presumably because they could not provide an estimate. Figure 37graphically displays
the distribution of results. The horizontal axis is the range of possible percentages from
the respondents. The vertical axis is a ratio of the responses per total respondents to the
question which fall into each category. There appears to be a small percentage of TL5
bridge rails currently installed, while other test levels appear to vary widely. Only one
respondent indicated that TL6 bridge rails are installed, therefore, the TL6 rails were not
included in Figure 37.
Another way to look at these results is to consider the average value for each
category. Table 22 provides the average values of the responses. Again, there appear to
be few TL5 bridge rails currently in-service, however, TL2 through TL4 barriers appear
to have wide usage rates.

87
Table 22. Question 2 Average Values.
TL2 20%
TL3 32%
TL4 51%
TL5 6%
Figure 37. Distribution of Reponses to Question 2.
With regards to TL4 bridge rails, respondents noted that “65% of new LRFD
designed bridges” use TL4 bridge rails or that “all new construction since early 80's uses
TL4.” One respondent also pointed out the disparity between State and Federal routes
verses County and Town routes when noting that “95% State and Federal routes; 10%
County/Township” are using TL4 bridge rails. It is important to also keep in mind, as a
respondent pointed out, that some jurisdictions have “60% TL2 or less timber rail from
1960 or earlier.”
In summary, there is a wide range of different bridge railing test levels in use.
Not surprisingly, the most common bridge railings installed appear to be TL3 and TL4.
TL4 bridge railings appear to be the most common at least on newer construction and
there are a few higher-level bridge railings as well (i.e., TL5).
0.00
0.10
0.20
0.30
0.40
0.50
>10
%
10
-20
%
21
-30
%
31
-40
%
41
-50
%
51
-60
%
61
-70
%
71
-80
%
81
-90
%
91
-10
0%
Un
kno
wn
Res
po
nce
s/To
tal
Amount in-service
TL-2
TL-3
TL-4
TL-5

88
Question 3: As part of this work, the research team is collecting in-service crash records
for bridge railings. If you or your agency has data available to help with the development
of these guidelines, please list the best way to contact you and the nature of the data in
the box below.
Four survey respondents listed contact information and suggested the research
team contact them directly. The information gained from these individuals was included
earlier in the Literature Review.
Question 4: Are you aware of a bridge inventory which can be linked to State crash
data?
The respondents are not aware of any bridge inventories which are linked to State
crash records. One respondent acknowledged that it may be possible but noted that “…it
is a difficult process. It requires a tedious manual effort of overlapping two data bases of
data. Unfortunately we don't have the personnel available to provide this information in a
timely manner.”
Question 5: Has your State sponsored any in-service performance studies of bridge rails
or median barriers?
While not a bridge rail study per se, the state of Washington conducted an in-
service review of cable median barriers and concrete safety shape median barriers. The
concrete safety shape results of that study were useful in postulating the effectiveness of
similar concrete safety shaped bridge railings. A similar situation appeared for New
Jersey where there is a study of concrete median barriers which provided some insight on
similar concrete bridge railings. The survey respondent noted these documents can be
found here:
Cable median barriers
(http://www.wsdot.wa.gov/Projects/CableBarrier/Report2009.htm)
Jersey shape median barriers
(http://www.wsdot.wa.gov/publications/fulltext/design/RoadsideSafety/T
RB_Report.pdf)
A survey respondent suggested the research team review documents found at
http://www.highways.gov.uk/business/14008.aspx. These documents are research reports
for a study of “Whole Life Cost-Benefit Analysis for Median Safety Barriers” where the
costs for cable barrier and concrete barrier penetration crashes, the costs for the relocation
of services when concrete barrier is installed, and the costs for traffic management were
reviewed. Again, the study is not specifically about bridge railing but was used to obtain
some useful information about similar roadside barriers extrapolated to bridge railings.
One survey respondent suggested the research team review a Michigan study on
the performance of concrete railings and barriers at

89
http://www.michigan.gov/documents/mdot/MDOT_Research_Report_R1498_207581_7.
pdf. Michigan conducted a study of the premature deterioration of Michigan’s concrete
railings and barriers. The study found that material specifications, construction methods
and maintenance practices all contributed to the observed deterioration. In addition to the
reports listed above, one respondent suggested that the research team make direct contact
to obtain information.
In summary, a few in-service studies of median barriers or bridge rails were
reviewed in detail and have been summarized in the Literature Review section of this
report.
Question 6: Are you aware of construction or repair costs available for bridge rails?
Many respondents suggested that bridge rail repair and retrofit costs range from
“$50 to $300 per linear foot based on the extent of repair/retrofit” needed and the type of
railing under repair.
New construction costs in Massachusetts, for example, were reported as:
“S3-TL4 metal railing: $320/FT;
TL4 concrete barriers: $150/FT; and
TL 5 concrete barrier: $200/FT.”
These costs were “calculated from the price guidelines in the MassDOT Bridge
Manual that can be downloaded from the following link:
http://www.mhd.state.ma.us/default.asp?pgid=content/bridgeman_new02&sid=about.”
Respondents provided these additional websites and directions for locating bridge
rail construction costs:
http://www.txdot.gov/business/avgd.htm
Historical construction costs for some FDOT standard bridge traffic railings
are available here under Items 0460-71-1 and 0521-5-x:
ftp://ftp.dot.state.fl.us/LTS/CO/Estimates/12MonthsMoving.pdf
http://www.tdot.state.tn.us/construction/Average%20Unit%20Prices/aup_201
0.pdf
Once in the Indiana DOT website, in http://www.in.gov/dot/div/contracts/pay/
- click on English Unit Price Summary, then scroll to 706 in column A.
Records identified as 706 are the bridge-railing pay items.
In summary, repair and retrofit costs range from $50 to $300/LF while new
construction ranges from $150 to 320/LF. It is assumed there are large discrepancies by
region and bridge rail test level, as well as bridge rail design. Construction costs are
further reviewed and discussed later in this report.

90
Question 7: In the conduct of your work, have you encountered guidelines for the
placement of particular test level bridge rails or median barriers under certain
situations?
Reponses varied considerably to this question. One respondent stated that
“PennDOT uses a TL5 barrier except in limited situations where sight distance is an
issue. For these situations a 32 inch barrier is used.” Conversely, another respondent
said that “WYDOT uses TL3 rails on all bridges, except on I-80 and in areas of high
truck traffic, then TL4 railing is used.” Other respondents indicated that Alabama
specifies a minimum of TL4 railing; WSDOT requires “TL5 at T-intersections on a
bridge or structure or when the barrier is on the outside curve of a structure with radius of
curvature less than 500 ft.” WSDOT also requires TL5 “where approach speeds are 50
mph or greater.” “Some standards call for the use of TL5 bridge rails for horizontal
curved bridge with high speeds while allowing for TL3 bridge rails to accommodate
historic bridge needs.”
Many States rely on the 1989 AASHTO Guide Specifications for Bridge Railing
in combination with the AASHTO LRFD Bridge Design Specifications, AASHTO
Roadside Design Guide, and the AASHTO Task Force 13 barrier guide. Some States,
including Utah and New Mexico, are in the process of updating design standards to
include guidelines for the selection of bridge rails and median barriers. Maryland has a
draft Policy and Procedure Memorandum (D-78-16(4) Barrier Railing Systems on New
or Rehabilitated Structures) for selecting bridge railings.
Internationally, the Chinese standard is issued by Ministry of Transport. In the
UK, the specification is TD19/06, and New Zealand follows NCHRP 350 guidelines and
at times references EN1317.
In summary, there does not appear to be any consensus about when to use what
type of bridge railing, however, there are some existing guidelines.
Question 8: Does your organization have a published set of guidelines for selecting
bridge rails?
Several survey respondents provided references to specific design guidelines
which were reviewed and summarized in the literature review. These references are
shown here:
FDOT Structures Design Guidelines, Section 6.7:
http://www.dot.state.fl.us/Structures/StructuresManual/CurrentRelease/Structu
resManual.shtm
MNDOT Bridge Design Manual:
http://www.dot.state.mn.us/bridge/manuals/LRFD/index.html
NJDOT Design Manual for Bridges and Structures, 5th Edition, Section 23.:
http://www.state.nj.us/transportation/eng/documents/BSDM

91
Rhode Island Bridge Engineering Design Guides
http://www.dot.ri.gov/engineering/guides/index.asp
Michigan Bridge Design Manual: http://www.michigan.gov/mdot/0,1607,7-
151-9622---,00.html
Chapter 13 of Design Manual Part 4.
ftp://ftp.dot.state.pa.us/public/PubsForms/Publications/PUB%2015M.pdf
Chapter 3 of Part I of the MassDOT Bridge Manual that you can download
from the following link:
http://www.mhd.state.ma.us/default.asp?pgid=content/bridgeman_new02&sid
=about
NYSDOT Bridge Manual:
https://www.nysdot.gov/divisions/engineering/structures/repository/manuals/b
rman-usc/Section_6_US_2010.pdf
http://www.dot.state.oh.us/Divisions/HighwayOps/Structures/standard/Bridge
s/test/railing%20selection%20procedure.pdf
NCDOT Design Manual, Section 6.2.4:
http://www.ncdot.org/doh/preconstruct/highway/structur/designmanual/lrfd/L
RFDManual(December2010).pdf
http://www.dot.nd.gov/manuals/design/designmanual/designmanual.htm
http://www.dot.state.mn.us/bridge/manuals/LRFD/index.html
SCDOT Bridge Design Manual:
http://www.scdot.org/doing/bridge/06design_manual.shtml
Illinois Bridge Manual Section 2.3.6.1.7.:
http://www.dot.il.gov/bridges/brmanuals.html
INDOT Design Manual:
http://www.in.gov/dot/div/contracts/standards/dm/english/index.html, click on
"Structural Design", then BRIDGE DECKS. Scroll down the bookmark to
61-6.0 BRIDGE RAILING, then click on it. The Manual copy then appears
on the right.
NDOT Structures Manual, Chapter 16, Section 16.5.1.2.:
http://www.nevadadot.com/divisions/011/
WSDOT BDM, Chapter 10. Search the WSDOT website for the most recent
electronic version.
Virginia Department of Transportation Structure and Bridge Division
Manuals/Manual of the Structure and Bridge Division, Volume V-Part 2,
Chapter 25

92
Question 9: Which guidelines does your organization use for selecting/specifying bridge
rail crash test performance?
Approximately two-thirds of the respondents indicated that NCHRP Report 350 is
used for specifying crash test performance of bridge railings, however, many respondents
indicated that the organizations they represent are transitioning to MASH. Participants
also noted the Chinese standard of transport JT/T F83-2004 and EN1317 are used for
specifying bridge rail crash test performance internationally.
Question 10: Which criteria do you use in the rail selection process?
Survey respondents were asked which criteria apply when selecting bridge rails.
Respondents were given several choices and allowed to select as many choices as
applicable. Choices included:
Engineering Judgment,
ADT,
Percent Trucks,
Posted Speed Limit,
Design Speed,
Number of Lanes,
Accident data,
Cost/benefit,
Roadway type,
Horizontal alignment,
Vertical alignment,
Land use around the structure, and
Other.
Design speed, traffic characteristics (i.e., volume and truck percentage), and
engineering judgment have the most impact on the selection of bridge rails while the
roadway type, horizontal alignment, and land use also appear to significantly impact
selection. All of the responses are displayed in Figure 38.

93
Figure 38. Distribution of Question 10 Results.
Survey respondents noted that accommodations for pedestrians, bicycles, flood
waters, snow removal and scenic views also play rolls in the selection of bridge rails.
Other considerations range from shoulder width and sight distance to funding source (i.e.,
local, state, federal, etc.) Often times the weight and maintenance costs of the rail are
concerns. “Aluminum rails are being stolen at an alarmingly high rate, so the state of
Iowa is proactive about replacing them with the lightest functional rail available.”
One survey respondent noted “all of the above criteria are considered, however,
there are not any published guidelines that cover all of the possible combinations …. A
formula would be nice for determining what test level to use.”
Question 11: Does your organization have a policy for identifying and/or retrofitting
substandard bridge rails?
Approximately 40 percent of the respondents indicated the organization they
represent does not have retrofitting policies. Many of the 60 percent of respondents, who
do have policies, have informal or unwritten policies. Many States inspect bridge railing
during bridge inspections. Substandard rails are identified based on age and height in
some cases or by type and visual inspection.

94
Respondents noted that when a highway safety or resurfacing project is under
construction in the area, “any structures within the limits of work are evaluated for the
parapet/railing type and condition, as well as the transition from the roadway approach
barrier to the bridge parapet. Deficient transitions are typically brought up to standards
within the safety/resurfacing contract. Deficient bridge barriers are noted and included in
a regionalized list of deficient bridge barriers. Periodic area-wide contracts are procured
to upgrade deficient bridge barriers within a region.” Other respondents note that rails
are only reviewed “per federal funding criteria, when an existing bridge is being
rehabilitated.”
Respondents suggested a review of policies at these locations:
Minnesota Bridge Preservation, Improvement and Replacement Guidelines:
http://www.dot.state.mn.us/bridge/documentsformslinks/techmemos/06-10-b-
01.pdf. A more current version should be available soon.
ODOT Bridge Design Manual, Section 304.1:
http://www.dot.state.oh.us/Divisions/HighwayOps/Structures/standard/Bridge
s/BDM/BDM2004/BDM2004_10-15-10.pdf
Indiana Design Manual:
http://www.in.gov/dot/div/contracts/standards/dm/english/index.html - click
on "BRIDGE REHABILIATION". 72-3.01(03) Rehabilitation Techniques.
Table BD-7. Also, 72-7.02(04) Bridge Railing.
Illinois Bridge Design Manual: http://www.dot.il.gov/desenv/demanuals.html
WSDOT Bridge Design, Section 10.4. Search for "BDM" on the WSDOT
home page.
It appears very few organizations have formal policies for identifying substandard
bridge rail.
Question 12: What testing has been done to support the retrofitting of substandard
bridge rail policy?
Respondents indicate that retrofitting policy is based on materials found in
NCHRP Report 350, the 2005 FHWA/CALTRANS Bridge Rail Guide, and historic crash
tests. [FHWA05] Many respondents indicated that no additional testing has been done in
support of the policies, which is not surprising given the lack of formal policies.
Question 13: Does your organization have a default bridge rail crash performance Test
Level installed/specified in the absence of other controlling criteria?
Approximately 65 percent of the respondents indicate that the organization they
represent have minimum requirements for bridge rail crash performance. Two
respondents went on to explain this minimum is TL3 while twelve respondents explained

95
the minimum is TL4. Three respondents indicated that TL5 railings are used exclusively
on interstate highways.
Question 14: What is the default bridge rail?
Respondents indicated a variety of default rail choices. Many defaults including
32” concrete barriers such as the New Jersey shape, the F-Shape and the Single Sloped
shape. Some respondents report the default use of 42” single sloped concrete on the
Interstate and US Route systems. Other default rails are shown here:
TL3 steel two tube railing,
Kansas corral rail,
Oregon Rail,
34" Single Slope,
Side mounted R-34 railing,
S3-TL4 where a see-through railing is needed,
Usually the 4-rail system, or
EN1317, N2 or H4a.
In summary, responses suggest a variety of default rails currently in use. Over 65
percent of respondents, in fact, indicate that default rails are suggested in their region.
Question 15: Are there any reasons for not installing the default bridge rail?
Not surprisingly, over 75 percent of the respondents indicated that there are often
reasons for not installing the default bridge rail. In some cases, the standard rails do not
meet the needs of the situation. For example, the rails may not attach to some types of
bridges with adequate height, rails may not combine with sound barriers or rails may not
transition well to existing rails. Respondents noted that aesthetics, the need for a higher
or lower test level, vertical and/or horizontal alignment and sight distance issues may all
lead to installing bridge rails other than the default.
Respondents also noted that often times a super-elevated horizontal curve, a high
design speed, significant truck traffic or high crash rates may lead to the installation of
rails other than the default. Sometimes it is more cost effective to use different
construction methods (e.g., extrude the railing). Dead load may be an issue as well,
especially for re-decking projects. In historic areas or areas using context sensitive
design principles, some lower test level rails are installed for aesthetic reasons.
In summary, many highway design elements are factors when choosing a bridge
rail other than the default.
Summary
It appears there are few in-service studies of median barriers or bridge rails. The
respondents were not aware of any bridge inventories which are linked to State crash

96
records. Only four crash databases were located as part of this survey. Survey
respondents noted the difficulty in linking crash records with state databases.
There does not appear to be any consensus about when to use what type of bridge
railing, however there are some existing guidelines both formal and informal. Several
survey respondents provided references to specific design guidelines. Approximately 65
percent of the respondents indicate that the organizations they represent have minimum
requirements for bridge rail crash performance and/or default bridge railings. Many
highway design elements are factors when choosing a bridge rail other than the default,
however these design decisions and polices appear to lack formality. One survey
respondent noted “A formula would be nice for determining what test level to use.”
Few organizations have formal policies for identifying substandard bridge
railings, however, retrofitting policies are based on materials found in NCHRP Report
350, the 2005 Bridge Rail Guide, and historic crash tests. Many respondents indicated
that no additional testing has been done in support of the policies.
The wide variety of respondents represented a good cross-section of the current
practices both nationally and internationally. With bridge rail repair and retrofit costs
ranging from $50 to $300/LF while new construction ranging from $150 to 320/LF, the
time for formal national guidelines which examine the appropriate installation of
different test level barriers under different scenarios has come.

97
DEVELOPMENT OF BRIDGE RAIL SELECTION GUIDELINES
The available analysis methods and software products presented in the literature
review assess the probability of a roadside feature being struck, the severity of the crash
if it has occurred and the resulting crash costs through conditional probabilities then
perform a benefit-cost analysis of roadside design alternatives to determine the most cost-
effective design. RSAPv3 has the added capability of tabulating crash costs such that the
lifetime risk of a specified crash severity can be calculated independent of the direct costs
(i.e., construction, maintenance and repair costs). The risk analysis and cost/benefit
analysis capabilities of RSAPv3 were employed in the development of the selection
guidelines. RSAPv3 uses this conditional probability model [Ray12]:
E(CC)N,M = ADT ∙ LN ∙ P(Encr) ∙ P(Cr|Encr) ∙ P(Sev|Cr) ∙ E(CCs|Sevs)
where:
E(CC)N,M = Expected annual crash cost on segment N for alternative M,
ADT = Average Daily Traffic in vehicles/day,
LN = Length of segment N in miles,
P(Encr) = The probability a vehicle will encroachment on the segment,
P(Cr|Encr) = The probability a crash will occur on the segment given that an
encroachment has occurred,
P(Sevs|Cr) = The probability that a crash of severity s occurs given that a crash
has occurred and
E(CCs|Sevs)= The expected crash cost of a crash of severity s in dollars.
An RSAPv3 analysis is composed of four major steps for assessing each
alternative:
Encroachment Probability,
Crash Prediction,
Severity Prediction, and
Benefit-Cost and/or Risk Analysis.
Some improvements were made to RSAPv3 in this project to specifically address
the challenges of developing bridge rail selection guidelines. These upgrades are
discussed below.
Crash Data
Unfortunately, the literature review and survey did not uncover much in the way
of in-service studies or even crash studies of bridge railings so it was necessary to look
for other sources of data for bridge railing performance to use in the development of the
Selection Guidelines. There are some existing databases like the NCHRP22-08 and
FHWA Narrow Bridge databases discussed earlier but these are now very old and, at

98
least in the case of the NCHRP 22-08 Texas data, have been determined to have serious
coding problems. In any case, a great deal has changed in the types of bridge railings that
are available today in comparison with the early 1990s as reflected in the NCHRP 22-08
report.[Mak94]
Crash data was collected and used to populate the crash severity module of
RSAPv3 for several concrete bridge railings and similarly shaped median barriers for use
in this project. Crashes with concrete median barriers were reviewed to determine the
severity distribution for striking the bridge railings of similar shape. Concrete median
barriers were chosen because there are more miles of median barrier installed than bridge
railing which maximizes the amount of crash data that is available for modeling the
severity of crashes with typical median barrier and bridge railing shapes. Most concrete
median barriers and concrete bridge railings use essentially the same shapes (i.e., New
Jersey shape, F shape, vertical wall, constant or single slope, etc); therefore, these
roadside devices are expected to perform similarly with respect to crash severity.
Crashes with bridge rails were analyzed to determine the severity distribution of
crashes where the bridge railing was penetrated. All types of bridge rails were
considered in this analysis because the analysis was focused on the result of penetration,
not the probability of penetration. The type of bridge rail would not impact the outcome
after penetration since the outcome is a function of the land use characteristics around
and under the bridge (i.e., presence of other transportation facilities, urban or rural areas,
etc.). Crashes with embankments and water hazards were also considered as a reference
point. The following sections briefly describe the data used in these analyses. The
computational steps and results of the analyses are discussed throughout this report in the
relevant sections.
New Jersey Median Barrier
Crash records for the New Jersey Turnpike were requested for 2003 through 2009
from Rutgers University. Rutgers maintains a database of crashes throughout New Jersey
which are linked to road geometrics.[Plan4S11] The ADT and percent of trucks for the
New Jersey Turnpike were obtained directly from the New Jersey Turnpike Authority
(NJTA). A 105-mile long section of the New Jersey Turnpike was selected for study
where a TL5 concrete safety shape median barrier is used exclusively and continuously
for the entire length of the highway. [NJTA1] The speed limits on this 105-mile long
section were either 55 or 65 mi/hr. A total of 1,816 crashes within the 65 mi/hr zone and
241 crashes within the 55 mi/hr zone were obtained and reviewed. The severity
distributions were calculated and adjusted for unreported crashes and the EFCCR65 was
determined (see the section entitled “Severity” on page 135 for a discussion of the
EFCCR65). The distributions for each speed are presented in Table 23. The penetrations
and rollovers percentages were also determined and are presented in Table 24. Narratives

99
of the crashes for which the vehicles appear to have penetrated or rolled over the barrier
were requested and subsequently reviewed to verify that a PRV had occurred.
Table 23. New Jersey Turnpike Crash Severity Distribution.
Barrier K A B C PDO/UNK Total
Contained, Stopped or Redirected on 55 mi/hr Segments
No. 0 1 12 35 193 241
% 0.00 0.41 4.98 14.52 80.08 100
Contained, Stopped or Redirected on 65 mi/hr Segments
No. 0 11 103 307 1395 1816
% 0.00 0.61 5.67 16.91 76.82 100
As shown in Table 24, two instances of a barrier PRV in the 55 mi/hr zone
occurred. One of these resulted in a possible injury (i.e., C), while the other resulted in
property damage only crash. There were 11 instances of barrier PRV in the 65 mi/hr
zone. Two of these resulted in visible injuries, one in a possible injury, five in property
damage only crashes, and the injury level was unknown for three of the cases.
Table 24. NJTA After Barrier Contact Behavior.
Behavior 55 mi/hr 65 mi/hr
# #
Contained/Redirected 241 1,816
PRV 2 11
Rollover After Redirection 5 41
The number of instances where the vehicle rolled over after being redirected by
the barrier were also collected and are shown in Table 24 for both of the speed zones. In
the 55 mi/hr zone, five instances of redirection rollovers occurred; two had visible
injuries, two had possible injuries, and one resulted in property damage only. In the 65
mi/hr zone, 41 instances occurred; 1 fatality, 1 incapacitating injury, 19 visible injuries,
11 possible injuries, 4 resulted in property damage only, and 5 cases where the injury
level was unknown.
Massachusetts Median Barrier
The Massachusetts DOT crash database was also examined for 2006-2009 to
identify median barrier collisions on specific sections of roadways where median barriers
were recently constructed (i.e., within the past five or six years). A subsequent field
review was conducted to isolate sections of roadway where 32-inch tall and 42-inch tall
concrete F-shape median barriers exist absent of other types of barriers. This field review

100
was conducted to eliminate the possibility of reviewing crash records where the reporter
may have confused the type of barrier struck. After this review, 154 crashes with 32-inch
barrier and 34 crashes with 42-inch barrier were identified. All of these crashes occurred
on roads with posted speed limits of either 55 or 65 mi/hr. The severity distribution was
determined and the results and distributions are shown in Table 25. The percentages of
penetrations and rollovers were determined and confirmed using available narratives of
the police reports. These percentages are presented in Table 26.
From Table 26 it can be seen that the 32 inch F-shape barrier had two reported
instances where the vehicle penetrated, rolled, or vaulted over the barrier in the 55 mi/hr
speed zones. Both of these crashes resulted in non-incapacitating injuries. This same
barrier had six instances of PRV failure in the 65 mi/hr zone as well, two of which were
non-incapacitating injuries and four resulted in property damage only. The 42 inch F-
shape barrier had two instances of PRV failure in the 55 mi/hr zone (which was the only
zone the 42 inch F-shape was installed), and both instances resulted in property damage
only.
Also in Table 26 is the rollover after redirection information for the different
barriers within the different speed zones. No rollover after redirection cases were
reported for the 32 inch F-shape barrier within the 55 mi/hr speed zones, but five were
reported in the 65 mi/hr zones. Of these five crashes, three resulted in non-incapacitating
injuries, one in property damage only, and one crash had an unknown level of injury.
Only one occurrence of a rollover after redirection was reported for the 42 inch F-shape
barrier in the 55 mi/hr zones (again, this was the only speed zone where crashes were
analyzed for this F-shape barrier). Unfortunately, this single rollover resulted in a
fatality.
Table 25. Massachusetts Crash Severity Distribution.
Barrier K A B C PDO/UNK Total
Contained, Stopped or Redirected on 55 mi/hr Segments, 32" F-Shape
No. 0 0 4 4 14 22
% 0.00 0.00 18.18 18.18 63.63 100
Contained, Stopped or Redirected on 65 mi/hr Segments, 32" F-Shape
No. 3 4 36 17 72 132
% 2.27 3.03 27.27 12.88 54.55 100
Contained, Stopped or Redirected on 55 mi/hr Segments, 42" F-Shape
No. 0 0 6 4 24 34
% 0.00 0.00 17.65 11.76 70.59 100

101
Table 26. Massachusetts After Barrier Contact Behavior.
Behavior 32" @ 55 mi/hr 32" @ 65 mi/hr 42" @ 55 mi/hr
# # #
Contained/Redirected 22 132 34
PRV 2 6 2
Rollover After Redirection 0 5 1
Washington State Median Barrier
The Washington State crash data was examined for I-90 and I-5 with posted speed
limits of 60 mi/hr where 32-inch New Jersey safety shape and 34-inch single-slope
concrete median barriers were used. The severity distributions of 549 cases involving 32-
inch safety shape barriers and 178 cases involving single-slope barriers were calculated
and can be seen in Table 27. The behavior after contact was determined for both barriers
and is presented in Table 28.
Table 27. Washington State Crash Severity Distribution.
Barrier K A B C PDO/UNK Total
Contained, Stopped or Redirected on 60 mi/hr Segments, 32" Safety Shape
No. 2 4 62 112 369 549
% 0.36 0.73 11.29 20.40 67.21 100
Contained, Stopped or Redirected on 60 mi/hr Segments, 34" Single Slope
No. 0 3 20 28 127 178
% 0.00 1.69 11.24 15.73 71.35 100
Table 28. Washington State After Barrier Contact Behavior.
Behavior
32"
Safety
Shape
#
34"
Single
Slope
#
Contained/Redirected 549 178
PRV 3 1
Rollover After Redirection 14 6
Table 28 shows the reported crashes that resulted in a penetration, roll or vault
over the barrier (PRV). For the 32 inch safety shape barrier, three of these crashes
occurred. One of these crashes resulted in a non-incapacitating injury, while the other
two resulted in property damage only. For the 34” single slope barrier, the only crash of
this type resulted in property damage only.
102
Table 28 also shows the number of reported crashes that resulted in a rollover
after being redirected by the two barrier types. The 32 inch safety shape barrier had 14 of
these crashes; including one that resulted in a fatality. Six of the remaining 13 crashes
resulted in non-incapacitating injuries (level B), three resulted in possible injuries (level
C), and four resulted in property damage only. The 34 inch single slope barrier had six
crashes where the vehicle rolled over after being redirected by the barrier. Two of these
crashes resulted in non-incapacitating injuries, one resulted in a possible injury, and three
resulted in property damage only.
Pennsylvania Bridge Railing
The Pennsylvania Department of Transportation (PennDOT) requires “bridge
railings that meet the requirements of Test Level 5 (TL5) of NCHRP Report 350, unless
another test level is authorized by the District Executive.” [PennDOT11] PennDOT
generally specifies a 42-inch concrete F-shape barrier as the TL5 railing, however, other
PennDOT adopted railings may also be used. A TL4 32-inch concrete F-shape barrier is
also a common barrier used and was also considered in this research.
Crash records were reviewed from 2006 to 2010 for bridge rail crashes on
interstates highways. Traffic volumes for the interstates and the roads which crossed
under the interstates were found online.[PA11] Unfortunately, the percentage of trucks in
the traffic was not available. The environmental features surrounding each bridge were
reviewed using Google Earth.[Google11]
Table 30 shows the reported PRV events for the two heights of the F-shape bridge
rail in both the 55 and 65 mi/hr speed limit zones. For the 32” F-shape bridge rail in the
55 mi/hr zone, two PRVs occurred. The first of these involved a tractor-trailer where the
trailer rolled over and stayed on the bridge but the tractor broke through the barrier and
dropped off the bridge. The tractor fell approximately 90 ft and landed on its passenger
side on a small island in the middle of Maiden Creek, resulting in a possible injury.
Witnesses say the truck was travelling at or around the speed limit at the time of the
crash.
The second 32 inch bridge rail crash that occurred in the 55 mi/hr zone involved a
passenger car that vaulted over the rail and fell approximately 80 ft and came to rest on
its roof in a wooded area next to a river. This crash resulted in property damage only.
The same bridge rail in the 65 mi/hr zone experienced five PRVs. The first of
these involved a tractor-trailer truck where the tractor portion stayed in the traveled way
of the highway, but the trailer portion broke through the bridge rail and ended up hanging
over the bridge but did not fall off. This resulted in an incapacitating injury. This bridge
crosses Pulaski Mercer Road (State Route 468), which experiences a 400 vehicle per day
traffic volume.

103
The second 32-inch bridge rail PRV crash that occurred in the 65 mi/hr zone
involved a passenger car which mounted the railing and rode on top of the rail for 30 ft
before falling off the bridge and dropping 60 ft. It came to rest on its roof, resulting in an
incapacitating injury. According to witnesses, this vehicle was travelling somewhere
between 50 and 55 mi/hr when the incident occurred, which is below the posted speed
limit. It was later discovered that a vehicle defect caused the vehicle to hit the bridge rail.
The vehicle landed in an unused area under the bridge; a fortunate occurrence as this
bridge spans South Fork Tenmile Creek (Route 188), a 5,000 vehicle per day state route,
and a set of railroad tracks.
The third PRV incident for this barrier in the 65 mi/hr speed zone also involved
an incapacitating injury. In this crash, the vehicle had rolled over onto its passenger side
prior to coming in contact with the bridge rail. As the vehicle hit the bridge rail it rolled
over the barrier and landed in a grassy area next to Bullfrog Road (unknown average
daily traffic).
Table 29. Pennsylvania Crash Severity Distribution.
Barrier K A B C PDO/UNK Total
Contained, Stopped or Redirected on 55 mi/hr Segments, 32" F-Shape Bridge Rail
No. 3 1 6 14 33 57
% 5.26 1.75 10.53 24.56 57.89 100
Contained, Stopped or Redirected on 65 mi/hr Segments, 32" F-Shape Bridge Rail
No. 1 0 7 28 71 107
% 0.93 0.00 6.54 26.17 66.36 100
Contained, Stopped or Redirected on 55 mi/hr Segments, 42" F-Shape Bridge Rail
No. 1 0 1 3 5 10
% 10.00 0.00 10.00 30.00 50.00 100
Contained, Stopped or Redirected on 65 mi/hr Segments, 42" F-Shape Bridge Rail
No. 0 0 4 9 33 46
% 0.00 0.00 8.70 19.57 71.74 100
Table 30. Pennsylvania Bridge Rail After Barrier Contact Behavior.
Behavior
32" @
55 mi/hr
#
32" @
65 mi/hr
#
42" @
55 mi/hr
#
42" @
65 mi/hr
#
Contained/Redirected 57 107 10 46
PRV 2 5 0 0
Rollover After Redirection 6 4 3 1

104
The fourth PRV crash involving the 32 inch F-Shape bridge rail in the 65 mi/hr
zone resulted in a non-incapacitating injury. The vehicle struck the bridge rail and then
rolled over, landing on the centerline of the road passing below the bridge. This road
(Route 374) experiences roughly 1,500 vehicles per day.
The last PRV crash involving the 32 inch F-Shape bridge rail in the 65 mi/hr zone
involved a bus filled with 42 passengers and resulted in a single non-incapacitating
injury. The bus struck the barrier and rode up onto the top of the barrier and balanced
there before falling approximately 100 ft into the Lehigh River below. The bus
passengers were evacuated entirely while the bus was balancing on top of the bridge rail.
The 42” F-shape bridge rail had no PRV failures for both the 55 mi/hr and 65
mi/hr speed zones.
The number of incidents for each bridge rail and speed zone where a vehicle
rolled over after being redirected by the bridge rail are tabulated in Table 30. Six
incidents were reported for the 32 inch rail in the 55 mi/hr speed zone. Two of the
incidents resulted in fatalities, two resulted in non-incapacitating injuries and two resulted
in possible injuries. For the same size rail in the 65 mi/hr speed zone, four incidents
occurred. One of these incidents resulted in a fatality while the remaining three resulted
in only possible injuries. The 42-inch bridge rail experienced four cases where the
vehicle was reported as rolling over after being redirected; three in the 55 mi/hr zone and
one in the 65 mi/hr zone. One of the events in the in the 55 mi/hr zone resulted in a non-
incapacitating injury and two resulted in possible injuries. The one reported case where a
rollover occurred in the 65 mi/hr zone resulted in a non-incapacitating injury.
Ohio Bridge Railing
Crash data for bridges for bridges in Ohio from 2005 through 2010 includes 4,600
bridge railing crashes. Ohio installs TL3 bridge rail on “all bridge structures on the
National Highway System (NHS) or the State System…as defined by NCHRP report
350,” effective October 1, 1998. The Twin Steel Tube Bridge Guardrail (Standard
Bridge Drawing TST-1-99) should be used for side draining structures, which shall not be
used over highways and railroads. “For bridges with heights of 25 feet or more above the
lowest groundline or normal water, concrete deflector parapets should be used.” [OH11;
OH11a] Therefore, the barrier shown in Figure 39 is the TL3 concrete barrier which is
typically installed on NHS roadways which cross over highways.

105
Figure 39. Ohio Standard Drawing BR-1 [OH11a]
The 2005 through 2010 Ohio data indicated that there were 4,560 police reported
crashes that involved bridge parapets (i.e., code 28) or bridge rails (i.e., code 29).
Vehicles crossed the barrier line 28 times in 4,600 crashes or only in 0.6 percent of the
crashes. Of the 28 penetration-rollover-vault (PRV) crashes, none were fatal, four
involved A-level injuries (14 percent), 11 involved B-level injuries (39 percent), two
involved C-level injuries (7 percent), 10 involved no injuries (36 percent) and one was of
unknown severity (4 percent). In three of the cases the vehicle came to rest on a roadway
that passed under the bridge and in the remaining 25 cases the vehicle came to rest in or
near a body of water. Only one event involved a tractor trailer truck. Table 31 provides a
summary of the severity distribution of all reported crashes with bridge rails during the
study period and Table 32 summarizes the behavior after the crash.

106
Table 31. Ohio Crash Severity Distribution.
Posted Speed Limit
K A B C O Total
Contained, Stopped or Redirected for 42" Constant Slope
65 1 1 19 13 83 117
60 0 0 4 2 20 26
55 0 2 4 2 33 41
50 0 0 1 0 4 5
45 0 0 1 1 2 4
Ramp 0 3 2 2 11 18
Total 1 6 31 20 153 211
% 0.47 2.84 14.69 9.48 72.51 100
Contained, Stopped or Redirected for 36" Safety Shape
65 2 8 63 46 292 411
60 0 3 8 8 34 53
55 0 4 32 27 126 189
50 0 1 1 3 11 16
45 0 0 1 5 26 32
40 0 0 1 0 6 7
35 0 2 2 6 22 32
30 0 0 0 0 0 0
25 0 0 1 1 2 4
Ramp 0 7 23 16 110 156
Total 2 25 132 112 629 900
% 0.22 2.78 14.67 12.44 69.89 100
Contained, Stopped or Redirected for 42" Safety Shape
65 1 6 38 29 169 243
60 0 8 19 20 78 125
55 0 4 6 9 61 80
50 0 0 2 1 4 7
45 0 0 3 1 8 12
40 0 0 0 1 2 3
35 0 0 2 3 4 9
30 0 1 1 0 1 3
25 0 0 0 0 2 2
Ramp 0 3 16 17 62 98
Total 1 22 87 81 391 582
% 0.17 3.78 14.95 13.92 67.18 100

107
Table 32. Ohio Bridge Rail After Barrier Contact Behavior.
Behavior 36”
#
42”
#
Combo rail
#
All Rail
Crashes
Contained/Redirected 986 873 0 4,449
PRV 5 2 0 29
Rollover After Redirection 28 27 1 82
Nebraska Bridge Rails
The Nebraska DOR crash database was examined for 2007 through 2009 to
identify bridge rail collisions on state and local highways, freeways and interstates in
Nebraska. The review contained concrete rails and metal rails. These crashes occurred
on roads with a variety of posted speed limits. The review of the Nebraska data
includes 1,212 crashes on roadways with a variety of posted speed limits. The behavior
could be determined for 979 of these crashes. This review included crashes with 29-inch,
34-inch, and 42-inch vertical wall type bridge rails, 32-inch and 42-inch New Jersey
shape bridge rails and w-beam type bridge railings. The severity distribution of the
crashes which were contained or redirected is shown in Table 33. The behavior of the
crashes with these different rails is shown in Table 34.

108
Table 33. Nebraska Crash Severity Distribution.
PSL K A B C O Total
Contained, Stopped or Redirected for 29" Vertical Wall
50mph or less 0 0 0 0 0 0
55 0 0 0 0 0 0
60 0 2 2 3 9 16
65 0 0 1 1 2 4
75 0 0 0 0 0 0
Total 0 2 3 4 11 20
% 0.00 10.00 15.00 20.00 55.00 100
Contained, Stopped or Redirected for 34" Vertical Wall
50mph or less 0 1 3 4 33 41
55 0 4 3 0 20 27
60 3 6 14 28 131 182
65 1 5 9 11 61 87
75 3 4 14 11 102 134
Total 7 20 43 54 347 471
% 1.49 4.25 9.13 11.46 73.67 100
Contained, Stopped or Redirected for 42" Vertical Wall
50mph or less 0 0 0 0 1 1
55 0 3 3 2 11 19
60 0 0 0 1 1 2
65 0 0 2 2 7 11
75 0 1 0 0 6 7
Total 0 4 5 5 26 40
% 0.00 10.00 12.50 12.50 65.00 100
Contained, Stopped or Redirected for 32" NJ Shape
50mph or less 0 2 4 2 46 54
55 0 2 1 4 19 26
60 0 2 4 6 36 48
65 0 0 4 2 19 25
75 1 0 1 0 14 16
Total 1 6 14 14 134 169
% 0.59 3.55 8.28 8.28 79.29 100

109
Table 33. Nebraska Crash Severity Distribution. (CONT’D)
PSL K A B C O Total
Contained, Stopped or Redirected for 42" NJ Shape
50mph or less 0 0 1 3 4 8
55 0 1 2 6 20 29
60 2 0 3 9 14 28
65 0 0 1 0 1 2
75 0 0 0 0 0 0
Total 2 1 7 18 39 67
% 2.99 1.49 10.45 26.87 58.21 100
Contained, Stopped or Redirected for W-Beam Guardrail
50mph or less 0 2 0 0 9 11
55 0 1 2 5 11 19
60 2 1 7 7 42 59
65 0 2 5 2 27 36
75 0 0 4 3 30 37
Total 2 6 18 17 119 162
% 1.23 3.70 11.11 10.49 73.46 100
Table 34. Nebraska Bridge Rail After Barrier Contact Behavior.
29"
Vertical
Wall
34"
Vertical
Wall
42"
Vertical
Wall
32"
NJ
Shape
42"
NJ
Shape
W-
beam All
Behavior # # # # # #
Contained/Redirected 20 471 67 169 67 162 956
PRV 0 6 0 4 0 14 24
Rollover After
Redirection 1 11 0 4 1 10 27
After Penetration Hazards
The Highway Safety Information System (HSIS) is a multistate database that
contains crash, roadway inventory, and traffic volume data for a select group of states.
[HSIS01] Crash data from Washington State HSIS data for embankments and water
hazards were reviewed. Currently, information is available for embankments in 55 and
70 mi/hr speed zones and water hazards in 55 mi/hr speed zones. Table 35 shows the
severity distribution of crashes where a bridge rail was penetrated and the vehicle entered
the embankment or water hazard.

110
Table 35. Severity Distributions for After Penetration Hazards
Hazard K A B C PDO/UNK Total
Embankment in 55 mi/hr Speed Zones
No. 7 10 42 33 93 185
% 3.78 5.41 22.70 17.84 50.27 100.00
Embankment in 70 mi/hr Speed Zones
No. 3 3 16 5 25 52
% 5.77 5.77 30.77 9.62 48.08 100
Water in 55 mi/hr Speed Zones
No. 1 2 6 4 37 50
% 2.00 4.00 12.00 8.00 74.00 100
Summary of Crash Data
This crash data has been used throughout this research effort to develop the
severity models used within RSAPv3 and to validate the results obtained. The individual
analyses conducted with this data are discussed in the relevant sections.
Encroachment
The probability that a vehicle will encroach (i.e., vehicle leaving the road) on a
segment is the first event considered in a series of conditional events evaluated in
RSAPv3. These conditional events include: the encroachment probability, the
probability of crash given an encroachment, the severity of the crash if an object is struck
and the cost of the entire crash sequence. The probability of an encroachment has been
the focus of several studies in the last forty years, however very little successful data
collection on the frequency of encroachments has been accomplished. Data collected by
Cooper and by Hutchinson and Kennedy have received much attention, but there are few
alternate sources of encroachment data. [Cooper82; Hutchinson62] RSAPv3 uses the
Cooper data. The data was re-analyzed to attempt to resolve some long-standing
problems with the data in NCHRP22-27. [Ray12]
The results of the re-analysis included generating baseline encroachment
frequencies for two-lane undivided, four-lane and multi-lane divided highways. The base
conditions for the encroachment frequencies are:
Posted speed limit of 65 mph,
Flat ground,
Relatively straight segment,
Lane width greater than or equal to twelve feet, and
Zero major access points per mile.

111
Deviating from these base conditions requires the use of adjustment factors to
calibrate the encroachment frequency to the specific site conditions. The values shown in
Table 36 are the base encroachment frequencies for the base conditions.
Table 36. Total Encroachment Frequency by AADT and Highway Type.
AADT
(bi-directional)
2 Lane
Undivided
(encr/mi/yr)
4 Lane
Divided
(encr/mi/yr) One Way
(encr/mi/yr)
1,000 1.2244 0.8473 0.4236
5,000 2.6514 3.5915 1.7958
10,000 1.8631 5.8435 2.9217
15,000 0.9819 7.1306 3.5653
20,000 1.3091 7.7344 3.8672
25,000 1.6364 7.8650 3.9325
30,000 1.9637 7.6779 3.8389
35,000 2.2909 7.2870 3.6435
40,000 2.6182 6.7749 3.3874
45,000 2.9455 7.6206 3.8103
50,000 3.2728 8.4673 4.2337
55,000 3.6000 9.3140 4.6570
60,000 3.9273 10.1608 5.0804
65,000 4.2546 11.0075 5.5038
70,000 4.5819 11.8542 5.9271
75,000 4.9091 12.7010 6.3505
80,000 5.2364 13.5477 6.7738
85,000 5.5637 14.3944 7.1972
90,000 5.8910 15.2412 7.6206
95,000 6.2182 16.0879 8.0439
100,000 6.5455 16.9346 8.4673
Encroachment models for roads over capacity
Encroachment modeling programs like RSAPv3, RSAP and BCAP make the
assumption that traffic is in a free-flow condition. In light of this assumption, showing
AADT values within the selection guidelines which exceed the AADT and percent truck
values where free-flow is possible would be a misrepresentation. The user of the
selection tables should be aware of this assumption when using these tables.

112
Low-Volume Encroachments
The 1989 GSBR was developed using the program BCAP which NCHRP 22-08
modified into the similar program ABC. Both used a constant encroachment rate based
on the Hutchison-Kennedy data. RSAP and RSAPv3, in contrast, use a variable
encroachment rate based on the Cooper data. One of the consequences is that the Cooper
data has a pronounced “hump” at about 25,000 vehicles/day for divided highways and a
pronounced trough at 40,000 vehicles/day. After 40,000 vehicles/day the expected
number of encroachments increases monotonically. RSAPv3 generally calculates the
mid-life number of encroachments and then uses that value in calculating the expected
crash costs. If the mid-life ADT turns out to be on the top of the “hump” the
encroachments would be overestimated for the entire life and if the mid-life ADT occurs
at the bottom of the “trough” the encroachments would be underestimated. In order to
avoid this problem, which only happens at low AADTs, the selection guidelines have
been developed using a procedure which calculates the number of encroachments at 10
equally spaced times over the life and then takes the average of these values to estimate
the encroachments at the mid-life. This is a more realistic estimate of the average
encroachment rate over the life of the project, however, a traffic growth rate must be
assumed for the development of these guidelines.
Annual Traffic Growth
Many traffic engineering sources like the Highway Capacity Manual (HCM) use
or recommend a default traffic growth rate of two percent. Similarly, the 1989 AASHTO
GSBR assumed a two percent traffic growth as well. The selection guidelines have been
developed by calculating the expected number of encroachments at 10 points during the
life with an assumed two percent growth rate and then averaged to find the mid-life
number of encroachments. A procedure to change these assumptions has been provided
within the selection process.
Traffic Mix Considerations
The GSBR used the FHWA 13-vehicle classification system in developing its
guidelines. According to Harwood et al., 5-axle tractor-trailer trucks (i.e., Class 9) alone
account for 46.1 percent of the trucks on the nation’s highway as measured by the vehicle
miles traveled. [Harwood03] Two-axle single-unit trucks (i.e., Class 5) account for 29.5
percent. These two types of trucks alone, then, account for more than 75 percent of the
vehicle miles travelled by trucks in the U.S.. After Class 5 and 9, the next highest class is
three-axle single-unit trucks (i.e., Class 6) at 5.3 percent and all other classes (i.e.,
Classes 7, 8, 10-13) each account for less than two percent of the vehicle miles travelled
and in many cases less than one percent. In fact, some of the higher classes of trucks

113
(e.g., multi-trailer trucks -- Classes 11 through 13) are either not allowed at all, are
allowed only by special permit or restricted to particular routes in many states.
Clearly the single-unit truck and tractor-trailer truck used in Report 350 and
MASH are good representative vehicles for trucks since they account for the majority of
vehicle miles travelled. All classes of single-unit trucks comprised about 40 percent of
the truck vehicle miles travelled and 60 percent were accounted for by a variety of tractor
trailer trucks. Generally speaking, there are on average about 1.5 times as many tractor
trailer trucks in the average traffic stream as single-unit trucks.
The rollover and penetration algorithm used in RSAPv3 was found to be
relatively sensitive to the properties of the heavy vehicles (i.e., weight, dimensions and
c.g. location). An unloaded Class 9 tractor trailer truck, for example, weighs about
27,000 lbs whereas a fully loaded Class 9 truck weighs 80,000 lbs and in some States
(e.g., Maine) may even weigh more than 100,000 lbs. In addition to selecting the most
representative trucks, it is also necessary to select truck properties that accurately reflect
the mix of loading conditions experienced on the nation’s roadways. Figure 40 shows a
cumulative axle-weight distribution of the truck classes from the new Mechanistic-
Empirical Pavement Design Guide (MEPDG). [MEPDG04] This data was used to
develop the vehicle weights shown in Table 37. The 22,000-lbs single-unit truck used in
MASH appears to be a good representation of the 85th
percentile two-axle single unit
truck whereas the 80,000-lbs tractor trailer is more representative of the 95th
percentile
for Class 9 truck weights based on the MEPDG. [MEPDG04]
An understanding of the vehicle properties of each vehicle class is needed for the
analyses, however, obtaining vehicle properties for vehicles which have not been crash
tested would require estimation. Also, the methods used in RSAPv3 to estimate the
probability of penetration and rollover are unlikely to work well with vehicles with
multiple articulations. Rather than include all 13 vehicle classes in developing the
recommendations it seemed more reasonable to focus on the vehicle types with the
highest proportion of vehicle-miles travelled. Classes 11 through 13 represent a very
small percentage of truck VMT and operate only on selected roadways so there is little
harm in ignoring them for general-purpose guidelines.
Table 37. Percetile of Gross Truck Weights for Classes 5 and 9. After [MEPDG04]
Percentile Gross Weight (lbs)
Class 5 Single
Unit Trucks
Class 9 Tractor
Trailer Trucks
15th
6,754 35,350
50th
11,942 48,822
85th
21,885 62,069

114
Figure 40. Mean Axle Load by Vehicle Classification.
The capacity and rollover algorithms in RSAPv3 are more sensitive to the c.g.
height and weight of the vehicle than the particular class so it appears to be more
important to represent the range of weights and c.g. locations for the most common
Classes than to represent the average condition of all 13 Classes. The following eight
vehicle types were used in developing the selection guidelines:
1. Passenger car,
2. Pickup truck,
3. Light Class 5 single-unit truck (i.e., 15th
percentile),
4. Average Class 5 single-unit truck (50th
percentile),
5. Heavy Class 5 single-unit truck (85th
percentile),
6. Light Class 9 combination tractor-trailer truck (15th
percentile),
7. Average Class 9 combination tractor-trailer truck (50th
percentile) and
8. Heavy Class 9 combination tractor-trailer truck (95th
percentile).
Vehicles 1, 2, 5 and 8 were specifically chosen because they are essentially
MASH test vehicles and, therefore, maintain a link to crash testing specifications. The
percent of trucks was varied between zero and 40 percent as was done in the 1989 GSBR.
Within the defined percent of trucks, the split was 67 percent tractor-trailer trucks and 33
percent single unit trucks. Within the defined percentage of passenger vehicles, the split
0
10
20
30
40
50
60
70
80
90
100
0 10000 20000 30000 40000 50000
Cu
mm
ula
tive
Dis
trib
uti
on
Mean Axle Load (lbs)
4
5
6
7
8
9
10
11
12
13

115
used was 75 percent passenger cars and 25 percent pickup trucks. This strategy results in
the traffic mix for each percentage of trucks shown in Table 38.
Table 38. Vehicle Mix Used in RSAP to Develop the Guidelines.
Percent
Trucks
Passenger
Cars
Pickup
Trucks
Light
Tractor
Trailer
Average
Tractor
Trailer
Heavy
Tractor
Trailer
Light
Single
Unit
Average
Single
Unit
Heavy
Single
Unit
0 75.00 25.00 0.00 0.00 0.00 0.00 0.00 0.00
5 72.50 22.50 1.00 2.00 0.35 0.50 0.65 0.50
10 70.00 20.00 2.00 4.00 0.70 1.00 1.30 1.00
15 67.50 17.50 3.00 6.00 1.05 1.50 1.95 1.50
20 65.00 15.00 4.00 8.00 1.40 2.00 2.60 2.00
25 62.50 12.50 5.00 10.00 1.75 2.50 3.25 2.50
30 60.00 10.00 6.00 12.00 2.10 3.00 3.90 3.00
35 57.50 7.50 7.00 14.00 2.45 3.50 4.55 3.50
40 55.00 5.00 8.00 16.00 2.80 4.00 5.20 4.00
In addition to the mix and weight properties discussed above, the inertial and
geometric properties used for the various vehicle classes are also important input
parameters. While the vehicle weight distributions for each class are relatively easy to
estimate from weigh-in-motion data, other important data like the location of the center
of gravity are very difficult to determine for the in-service fleet. The same truck loaded
will have very different properties when it is unloaded so the properties chosen for each
type of vehicle need to reflect the appropriate proportion of vehicle miles traveled.
The vehicle properties used for the vehicle mix recommended in Table 38 are
shown in Table 39. The c.g. height recommended for the tractor-trailer corresponds to
the effective c.g. of the trailer, since the trailer rolling over the barrier is generally what
pulls the tractor over as well. The effective c.g. is somewhere between the overall c.g. of
the vehicle and the c.g. of the trailer. For tractor trailer trucks, the “weight” listed in
Table 39 refers to the weight of the King Pin axle rather than the whole vehicle weight.
Tractor trailer trucks are articulated and crash test data indicates that the second impact
with the King Pin axle is generally the most demanding. A King Pin axle weight of
22,000 lbs corresponds to an 80,000 lbs tractor-trailer truck whereas a 6,800-lbs King Pin
axle weight corresponds to an empty tractor trailer truck. The 4.2-ft center of gravity
height is based on the crash-test measured value of 80,000-lbs tractor trailer trucks and
the 3.4-ft height for the empty tractor trailer truck is based on the empty-weight location
of the center of gravity based on a finite element model. The heavy tractor trailer in
Table 39 corresponds closely to the MASH 36000V vehicle. The upper bound value
(trailer c.g.), which resulted in slightly more rollover barrier incidents (i.e., this method is

116
conservative) was used in the analysis. The overall c.g. and the “effective” c.g. used in
the generation of the guidelines are listed below.
Table 39. Vehicle Properties Used in RSAPv3.
RSAPv3 VEHICLES FHWA
Vehicle
CLASS
WEIGHT LENGTH WIDTH C.G.
Long.
C.G.
Hgt
Lbs ft ft ft ft
Passenger Vehicles 2 3,300 15.00 5.40 6.00 2.00
Pickup Truck 3 5,000 19.75 6.50 8.50 2.30
Light Tractor Trailer 8-9 16,000 48.00 8.50 12.00 4.80
Average Tractor Trailer 8-13 22,250 48.00 8.50 20.00 4.80
Heavy Tractor Trailer 8-13 37,500 48.00 8.50 20.00 6.00
Light Single Unit Truck 5 6,800 35.00 7.77 12.50 3.40
Average Single Unit
Truck 6 12,000 35.00 7.77 12.50 3.40
Heavy Single Unit Truck 7 22,000 35.00 7.77 12.50 4.20
The weights shown for the single-unit trucks in Table 39 correspond to the total
weight of the truck. The weight and c.g. height for the heavy single unit truck
corresponds to the MASH 10,000S vehicle. The light single unit truck was based on
properties of the same vehicle but in an unloaded condition and average load condition,
respectively. The light and average SUT values were determined using a finite element
model.
Truck Trajectories
RSAPv3, like RSAP and BCAP, bases trajectories on information collected from
passenger vehicle encroachments. In the case of BCAP and RSAP, the distributions of
encroachment speeds and angles were used to create straight-line trajectories. RSAPv3
takes a more realistic approach where actual vehicle trajectories measured in NCHRP 17-
22 were used.[Mak10, Ray12] This allows for a much richer representation of the
vehicle trajectory since driver reactions and side-slope conditions are implicitly included
in the trajectories.
Assuming that trucks and passenger vehicle share the same encroachment
characteristics does not seem reasonable for three reasons:
1. The handling and acceleration/deceleration properties of trucks are very different
than passenger cars.
2. Trucks may leave the roadway with different speeds and angles than passenger
vehicles.
3. Trucks may encroach at a different rate than passenger vehicles.

117
Heavy Vehicle Encroachment Angle
Unfortunately, there is no database of heavy vehicle trajectories which includes
information relative to departure angle and speed, encroachment rates or trajectories.
Using passenger vehicle trajectories would include some trajectories that are clearly
difficult to attain for heavy vehicles. Passenger vehicles are smaller, have better braking
and acceleration characteristics as well as different inertial properties. BCAP recognized
this fact and used the following simple point-mass procedure for limiting the possible
encroachment angles based on the vehicle type, offset from the road, available friction
and encroachment speed: [AASHTO89]
where Θmax = The maximum likely encroachment angle in degrees,
So = The vehicle offset from the edge of the travelled way in feet,
fmax = The maximum available coefficient of friction,
g = The gravity constant (i.e., 32.2 ft/s2) and
V = The encroachment velocity in ft/s.
Table B2 in the AASHTO GSBR presents available friction coefficients of 0.60
for most single-unit trucks and 0.45 for most tractor trailer trucks. [Mak93] The
MEPDG indicates that on two-lane in one direction cross-sections 90 percent of trucks
travel in the right most lane so the most common offset value in the above equation
would be six feet (i.e., half the typical lane width).[MEPDG04]
The NCHRP 17-22 data contains 787 trajectories that were included in the
RSAPv3 trajectory tables. The maximum achievable encroachment angle using the
equation above was compared to the actual encroachment angle for each of these 787
trajectories. If the actual encroachment angle was greater than the maximum achievable
encroachment angle for single-unit trucks or tractor trailer trucks it was excluded from
the heavy vehicle analysis. For single-unit trucks, 315 trajectories were found where the
actual encroachment angle was less than the maximum achievable and 253 trajectories
were found for tractor trailer trucks. The maximum encroachment angle in the trajectory
databases used for both single-unit trucks and tractor-trailer trucks is 32 degrees.
Coincidentally, BCAP limited all encroachment angles to 36 degrees. The excluded
trajectories represent high-angle, high-speed passenger vehicle encroachment trajectories
that would be highly unlikely for trucks.
Having different trajectory tables for each type of vehicles is easily accomplished
in RSAPv3. Passenger vehicle trajectories (i.e., passenger cars and pickup trucks) are
taken from the TrajectoryGrid2 worksheet whereas single-unit truck and tractor-trailer

118
truck trajectories are taken from TrajectoryGrid3 and TrajectoryGrid4, respectively.
TrajectoryGrid3 and TrajectoryGrid4 are limited to those trajectories that satisfy the side-
friction criteria discussed in the previous paragraphs.
Heavy Vehicle Encroachment Rate
In addition to considering heavy vehicle trajectory differences, the encroachment
frequency differences were also examined. RSAPv3 uses the so-called Cooper data to
model the vehicle encroachment frequency. The vehicle type is unknown in this dataset
since the data was based on tire marks, however, data collectors were instructed to focus
on passenger vehicles.
There has been a long-held assumption that heavy vehicles leave the roadway at
the same rate as all vehicles. There is no known database of heavy vehicle
encroachments and trajectories, however, some organizations have collected heavy
vehicle paths and heavy vehicle crash statistics.[NHTSA13;FMCSA12] This research
examined the assumption that heavy vehicles encroach onto the roadside at the same rate
as passenger vehicles by analyzing a national sample of run-off-road crashes and a
detailed regional sample. The results of each are comparable and challenge the
assumption that trucks encroach at the same rate.
The national crash data examined for this analysis includes: the Federal Motor
Carrier Safety Administration (FMCSA) national dataset of commercial truck crashes
from 2002 through 2011; the U.S. Department of Transportation National Highway
Safety Administration (NHTSA) annual Traffic Safety Facts reports for the years 2002
through 2010; and the Federal Highway Administration (FHWA) Highway Statistics
website for 2002 through 2010.[NHTSA12; FMCSA12; FHWA12c] The detailed
regional dataset used for this analysis includes crash and traffic records for 100 miles of
the New Jersey Turnpike from 2005 through 2008.[ Plan4S11]
NATIONAL DATA
The NHTSA Traffic Safety Facts is a nationwide database of different crash
types, including run-off road crashes. The data is presented by crash location in relation
to the roadway. The available fields are: “On Roadway,” “Off Roadway,” “Shoulder,”
“Median,” “Other/Unknown,” and “Total”. The fields “Off Roadway,” “Shoulder,” and
“Median” were used to represent run-off road crashes, while the “Total” field was used to
represent all crashes.[ NHTSA13]
The FMCSA database contained only truck and bus crashes. Event IDs that were
labeled as “Non collision ran off road”, “Non collision overturn (rollover)”, “Non
collision cross median/centerline”, or “Collision involving fixed object” were considered
to be run-off road crashes. FMCSA data for the years 2002-2011 was used.[ FMCSA12]

119
Traffic counts by vehicle classifications were obtained from the FHWA Highway
Statistics Series. “Single-Unit 2-Axle 6-Tire or More and Combination Trucks” were
used for trucks, “Buses” was used for buses, and “All Motor Vehicles” was used with the
NHTSA Traffic Safety Facts data. Beginning in 2007 states were required to report
motorcycle data and FHWA implemented a new methodology to calculate traffic counts,
therefore, some of the VMT values given for the different years may not fit into the trend
lines that adjacent years fit into. This is apparent in Table 40 and should be kept in mind
when interpreting the results.[ FHWA12c]
REGIONAL DATA
The New Jersey Turnpike has a continuous TL5 concrete median barrier from
milepost 1.2 to 104.7. Since the median barrier is continuous and relatively close to the
left shoulder it is similar to a direct measure of primary and opposing left encroachments.
Crash data for left exiting vehicles that were reported as striking the “Concrete Traffic
Barrier” under any of the four possible sequence of events fields were considered in the
analysis. The frequency of these events was determined for all crashes on this section of
highway and for heavy vehicle crashes. Heavy vehicles were defined as one of the
following: “Bus/Large Van (9 or more seats)”, “Recreation Vehicle”, “Single Unit (2
axle)”, “Single Unit (3+ axle)”, “Single Unit Truck w/Trailer”, “Tractor Double”,
“Tractor Semi-Trailer”, “Truck Tractor (Bobtail)”, “Tractor Triple”, and “Other Truck”.
Crashes were then separated by year and the milepost where the crash occurred. The
highway segments were defined by the known traffic volumes for given mileposts, not
geometrics. The hundred million vehicle miles traveled (100 MVMT) was calculated for
each segment and year, using the following equation:
where: AADT = Annual Average Daily Traffic, and
100 MVMT = Hundred Million Vehicle Miles Traveled.
After the vehicle-miles travelled was calculated for each segment, the crash rate
was calculated for each segment and year for both heavy vehicles and all vehicles as
follows:
where: CR = Crash Rate.

120
RESULTS
The vehicle miles traveled data collected by the FHWA are shown in the second
through fourth columns of Table 40. Table 40 also contains the number of crashes and
the crash rates for truck, bus, and truck/bus for the years 2002 through 2010. These
national values represent all possible crashes from vehicles which may have encroached
from all possible directions (i.e., primary right, opposing right, primary left, opposing
left) while the NJTA data only include left encroachments.
A dramatic decrease in crash rates can be seen from the years 2006 – 2007,
presumably caused at least in part by the methodological changes for reporting MVMT
data implemented in 2007.
Table 40. National Traffic Volumes, Crashes, and Crash Rates by Year.
Year Trucks
100
MVMT
Bus 100
MVMT
Truck
& Bus
100
MVMT
Truck and Bus
ROR Crashes
Bus Only
ROR Crashes
Truck Only ROR
Crashes
# ROR Crash/
100
MVMT
# Bus
ROR
Crash/
100
MVMT
#
Truck
ROR
Crash/
100
MVMT
2002 2,146 68.45 2,214 24,483 11.06 683 9.98 23,800 11.09
2003 2,179 67.82 2,247 27,102 12.06 772 11.38 26,330 12.08
2004 2,208 68.01 2,276 32,234 14.16 902 13.26 31,332 14.19
2005 2,225 69.80 2,295 33,000 14.38 964 13.81 32,036 14.40
2006 2,225 67.83 2,293 31,754 13.85 946 13.95 30,808 13.85
2007 3,042 145.16 3,187 33,051 10.37 1,025 7.06 32,026 10.53
2008 3,107 148.23 3,255 36,954 11.35 1,471 9.92 35,483 11.42
2009 2,880 143.58 3,024 29,658 9.81 1,295 9.02 28,363 9.85
2010 2,866 137.89 3,004 28,026 9.33 997 7.23 27,029 9.43
Avg 2,542 101.86 2,644 30,696 11.61 1,006 9.88 29,690 11.68

121
Table 41 was developed from NHTSA FARS/GES data as a representation of run-
off-road crash rates for all vehicles.
Table 41. NHTSA FARS/GES Crash Data and Crash Rates. Year 100 MVMT Total Crashes “All Crash”
Crash Rate
(per 100
MVMT)
Crashes
“Off Road”
Crashes
“Shldr”
Crashes
“Med”
Total ROR
Crashes
ROR Crash
Rate
(crashes per
100
MVMT)
2002 28,555 6,316,000 221.19 790,000 25,000 122,000 1,116,000 39.08
2003 28,902 6,328,000 218.95 865,000 34,000 127,000 1,143,000 39.55
2004 29,648 6,181,000 208.48 969,000 34,000 156,000 1,128,000 38.05
2005 29,894 6,159,000 206.03 913,000 59,000 154,000 1,151,000 38.50
2006 30,144 5,973,000 198.15 859,000 65,000 143,000 1,067,000 35.40
2007 30,311 6,024,000 198.74 948,000 53,000 150,000 1,126,000 37.15
2008 29,765 5,811,000 195.23 919,000 46,000 163,000 1,159,000 38.94
2009 29,535 5,505,000 186.39 954,000 32,000 157,000 1,026,000 34.74
2010 29,665 5,419,000 182.67 946,000 33,000 137,000 937,000 31.59
Avg 29,602 5,968,444 201.76 907,000 42,333 145,444 1,094,778 37.00
Table 42 contains a summary of the ROR crash rates obtained from both the
FMCSA (i.e., heavy vehicle ROR crashes) and NHTSA FARS/GES data sets (i.e, all
vehicle ROR crashes). The last row contains a simple comparison of the crash rates
defined as:
where: CRT = Crash Rate of Trucks and Buses (crashes / 100 MVMT),
CRA = Crash Rate of All Vehicles (crashes / 100 MVMT), and
TCRM = Truck/Bus Crash Rate Multiplier (dimensionless).

122
Table 42. National Heavy Vehicle Crashes Per 100MVMT.
Year ROR
Bus
ROR
Truck
ROR
Truck and
Bus
ROR
All
Vehicles
TCRM
(CRTB/CRA)
2002 9.98 11.09 11.06 39.08 0.28
2003 11.38 12.08 12.06 39.55 0.30
2004 13.26 14.19 14.16 38.05 0.37
2005 13.81 14.40 14.38 38.50 0.37
2006 13.95 13.85 13.85 35.40 0.39
2007 7.06 10.53 10.37 37.15 0.28
2008 9.92 11.42 11.35 38.94 0.29
2009 9.02 9.85 9.81 34.74 0.28
2010 7.23 9.43 9.33 31.59 0.29
Avg 9.88 11.68 11.61 37.00 0.31
This analysis suggests that the long-held assumption that heavy vehicles encroach
onto the roadside at the same rate as all vehicles is false. In fact, heavy vehicles appear to
encroach at an average rate of approximately one-third of all vehicles.
REGIONAL ANALYSIS
A review of a regional sample of data was conducted to validate the findings from
the National average statistics. The regional sample chosen had detailed traffic volumes,
roadway inventory data, and only one hazard was considered (i.e., concrete median
barrier). The results for the New Jersey Turnpike analysis are shown in Table 43, Table
44, Table 45, and Table 46 for the years 2005, 2006, 2007, and 2008, respectively. Only
primary left (PL) and opposing left (OL) encroachment directions were considered and
the segments are defined solely by available traffic volumes.
The truck/bus crash rates of the New Jersey turnpike appear to be approximately
28 percent of the crash rates for all vehicles which is similar to the 0.31 from the
nationwide analysis. This analysis supports the national analysis finding that heavy
vehicles have a lower encroachment rate than “all vehicles.”

123
Table 43. NJ Turnpike Ran Off Road Left Crash Rates, 2005. Link and
Posted Speed
Limit
Mileposts Miles Total
Crash
#
Truck
Crash
#
ADT %T 100
MVMT
CRA
(All)
CRT
(Trk/Bus)
1 - 2 (65) 1.2 - 12.9 11.7 26 0 45830 15.3 1.96 13.28 0.00
2 - 3 (65) 12.9 - 26.1 13.2 51 2 49177 15.5 2.37 21.52 5.45
3 - 4 (65) 26.1 - 34.5 8.4 31 2 58486 15.3 1.79 17.29 7.29
4 - 5 (65) 34.5 - 44 9.5 45 2 73616 15.1 2.55 17.63 5.17
5 - JCT (65) 44 - 51 7 33 2 79833 14.9 2.04 16.18 6.60
JCT - 7 (65) 51 - 53.3 2.3 20 0 109671 15.5 0.92 21.72 0.00
7 - 7A (65) 53.3 - 60 6.7 62 3 120474 16.2 2.95 21.04 6.29
7A - 8 (65) 60 - 67.6 7.6 57 2 132809 16.7 3.68 15.47 3.25
8 - 8A (65) 67.6 - 73.7 6.1 62 4 137157 16.2 3.05 20.30 8.08
8A - 9 (65) 73.7 - 83.3 9.6 61 6 160390 15.4 5.62 10.85 6.95
9 - 10 (65) 83.3 - 88.1 4.8 31 1 202341 13.6 3.55 8.74 2.07
10 - 11 (65) 88.1 - 90.6 2.5 18 0 187670 13.7 1.71 10.51 0.00
11 - 12 (65) 90.6 - 95.9 5.3 38 0 224591 14.0 4.34 8.75 0.00
12 - 13 (65) 95.9 - 97.3 1.4 7 0 235830 14.4 1.21 5.81 0.00
12 - 13 (55) 97.3 - 99.9 2.6 39 0 235830 14.4 2.24 17.43 0.00
13 - 13A (55) 99.9 - 101.6 1.7 31 0 250812 14.8 1.56 19.92 0.00
13A - 14 (55) 101.6 - 104.7 3.1 33 1 223337 15.3 2.53 13.06 2.59
Average: 26 1.47 148697 15.1 2.59 15.27 3.16

124
Table 44. NJ Turnpike Ran Off Road Left Crash Rates, 2006. Link and
Posted Speed
Limit
Mileposts Miles Total
Crash
#
Truck
Crash
#
ADT % T 100
MVMT
CRA
(All)
CRT
(Tks/Bus)
1 - 2 (65) 1.2 - 12.9 11.7 35 0 46789 15.7 2.00 17.52 0.00
2 - 3 (65) 12.9 - 26.1 13.2 40 1 50085 15.8 2.41 16.58 2.62
3 - 4 (65) 26.1 - 34.5 8.4 34 1 59345 15.5 1.82 18.69 3.55
4 - 5 (65) 34.5 - 44 9.5 56 0 74484 15.4 2.58 21.68 0.00
5 - JCT (65) 44 - 51 7 20 0 80861 15.2 2.07 9.68 0.00
JCT - 7 (65) 51 - 53.3 2.3 15 0 110908 15.7 0.93 16.11 0.00
7 - 7A (65) 53.3 - 60 6.7 49 2 121384 16.3 2.97 16.51 4.14
7A - 8 (65) 60 - 67.6 7.6 68 1 133548 16.8 3.70 18.36 1.60
8 - 8A (65) 67.6 - 73.7 6.1 60 1 137794 16.3 3.07 19.56 2.00
8A - 9 (65) 73.7 - 83.3 9.6 51 1 160763 15.5 5.63 9.05 1.14
9 - 10 (65) 83.3 - 88.1 4.8 49 3 203277 13.7 3.56 13.76 6.13
10 - 11 (65) 88.1 - 90.6 2.5 26 1 189709 13.8 1.73 15.02 4.19
11 - 12 (65) 90.6 - 95.9 5.3 50 1 228790 14.0 4.43 11.30 1.61
12 - 13 (65) 95.9 - 97.3 1.4 7 0 240350 14.4 1.23 5.70 0.00
12 - 13 (55) 97.3 - 99.9 2.6 47 5 240350 14.4 2.28 20.61 15.23
13 - 13A (55) 99.9 - 101.6 1.7 43 5 255416 14.8 1.58 27.13 21.28
13A - 14 (55) 101.6 - 104.7 3.1 43 3 226013 15.4 2.56 16.81 7.62
Average: 41 1.47 150580 15.2 2.62 16.12 4.18

125
Table 45. NJ Turnpike Ran Off Road Left Crash Rates, 2007. Link and
Posted Speed
Limit
Mileposts Miles Total
Crash
#
Truck
Crash
#
ADT %T 100
MVMT
CRA
(All)
CRT
(Trk/Bus)
1 - 2 (65) 1.2 - 12.9 11.7 24 1 47325 16.0 2.02 11.88 3.08
2 - 3 (65) 12.9 - 26.1 13.2 40 1 50906 16.2 2.45 16.31 2.52
3 - 4 (65) 26.1 - 34.5 8.4 38 3 60384 15.9 1.85 20.53 10.21
4 - 5 (65) 34.5 - 44 9.5 55 1 75790 15.7 2.63 20.93 2.42
5 - JCT (65) 44 - 51 7 38 1 81964 15.5 2.09 18.15 3.08
JCT - 7 (65) 51 - 53.3 2.3 16 0 112538 16.1 0.94 16.94 0.00
7 - 7A (65) 53.3 - 60 6.7 49 4 122467 16.6 2.99 16.36 8.05
7A - 8 (65) 60 - 67.6 7.6 68 3 134428 17.1 3.73 18.24 4.69
8 - 8A (65) 67.6 - 73.7 6.1 38 5 138625 16.7 3.09 12.31 9.73
8A - 9 (65) 73.7 - 83.3 9.6 90 2 161555 15.8 5.66 15.90 2.23
9 - 10 (65) 83.3 - 88.1 4.8 45 0 204774 13.9 3.59 12.54 0.00
10 - 11 (65) 88.1 - 90.6 2.5 30 0 193081 14.0 1.76 17.03 0.00
11 - 12 (65) 90.6 - 95.9 5.3 41 0 232567 14.2 4.50 9.11 0.00
12 - 13 (65) 95.9 - 97.3 1.4 10 0 244033 14.4 1.25 8.02 0.00
12 - 13 (55) 97.3 - 99.9 2.6 53 3 244033 14.4 2.32 22.89 8.97
13 - 13A (55) 99.9 - 101.6 1.7 39 4 258419 14.9 1.60 24.32 16.69
13A - 14 (55) 101.6 - 104.7 3.1 39 2 227390 15.5 2.57 15.16 5.01
Average:
42 1.76 152369 15.5 2.65 16.27 4.51

126
Table 46. NJ Turnpike Ran Off Road Left Crash Rates, 2008. Link and
Posted Speed
Limit
Mileposts Miles Total
Crash
#
Truck
Crash
#
ADT %T 100
MVMT
CRA
(All)
CRT
(Trk/
Bus)
1 - 2 (65) 1.2 - 12.9 11.7 21 0 45640 15.4 1.95 10.77 0.00
2 - 3 (65) 12.9 - 26.1 13.2 43 1 48889 15.5 2.36 18.26 2.73
3 - 4 (65) 26.1 - 34.5 8.4 36 0 58134 15.4 1.78 20.20 0.00
4 - 5 (65) 34.5 - 44 9.5 39 1 73248 15.3 2.54 15.36 2.57
5 - JCT (65) 44 - 51 7 31 3 78947 15.1 2.02 15.37 9.85
JCT - 7 (65) 51 - 53.3 2.3 16 1 109200 15.7 0.92 17.45 6.95
7 - 7A (65) 53.3 - 60 6.7 48 1 118768 16.2 2.90 16.53 2.12
7A - 8 (65) 60 - 67.6 7.6 56 2 130011 16.8 3.61 15.53 3.30
8 - 8A (65) 67.6 - 73.7 6.1 46 1 134028 16.3 2.98 15.41 2.05
8A - 9 (65) 73.7 - 83.3 9.6 49 2 155581 15.5 5.45 8.99 2.36
9 - 10 (65) 83.3 - 88.1 4.8 40 1 197707 13.6 3.46 11.55 2.12
10 - 11 (65) 88.1 - 90.6 2.5 10 1 187069 13.9 1.71 5.86 4.23
11 - 12 (65) 90.6 - 95.9 5.3 38 4 225401 14.0 4.36 8.71 6.55
12 - 13 (65) 95.9 - 97.3 1.4 8 0 236947 14.4 1.21 6.61 0.00
12 - 13 (55) 97.3 - 99.9 2.6 62 3 236947 14.4 2.25 27.57 9.27
13 - 13A (55) 99.9 - 101.6 1.7 34 2 251121 15.1 1.56 21.82 8.51
13A - 14 (55) 101.6 - 104.7 3.1 35 2 221602 15.6 2.51 13.96 5.12
Average:
36 1.47 147602 15.2 2.56 14.70 3.98

127
Table 47. Truck/Bus Crash Rate Multipliers, by Year and Link.
Link and
Posted Speed
Limit
Mileposts TCRM
2005
TCRM
2006
TCRM
2007
TCRM
2008
1 - 2 (65) 1.2 - 12.9 0.00 0.00 0.26 0.00
2 - 3 (65) 12.9 - 26.1 0.25 0.16 0.15 0.15
3 - 4 (65) 26.1 - 34.5 0.42 0.19 0.50 0.00
4 - 5 (65) 34.5 - 44 0.29 0.00 0.12 0.17
5 - JCT (65) 44 - 51 0.41 0.00 0.17 0.64
JCT - 7 (65) 51 - 53.3 0.00 0.00 0.00 0.40
7 - 7A (65) 53.3 - 60 0.30 0.25 0.49 0.13
7A - 8 (65) 60 - 67.6 0.21 0.09 0.26 0.21
8 - 8A (65) 67.6 - 73.7 0.40 0.10 0.79 0.13
8A - 9 (65) 73.7 - 83.3 0.64 0.13 0.14 0.26
9 - 10 (65) 83.3 - 88.1 0.24 0.45 0.00 0.18
10 - 11 (65) 88.1 - 90.6 0.00 0.28 0.00 0.72
11 - 12 (65) 90.6 - 95.9 0.00 0.14 0.00 0.75
12 - 13 (65) 95.9 - 97.3 0.00 0.00 0.00 0.00
12 - 13 (55) 97.3 - 99.9 0.00 0.74 0.39 0.34
13 - 13A (55) 99.9 - 101.6 0.00 0.78 0.69 0.39
13A - 14 (55) 101.6 - 104.7 0.20 0.45 0.33 0.37
Average: 0.20 0.22 0.25 0.28
SUMMARY
The regional analysis found that, on average, heavy vehicles experienced an
encroachment rate that was 28 percent of the rate for all vehicle types. The national
analysis found heavy vehicle ROR crashes occur at a rate of 31 percent of the all-vehicle
run-off-road crashes. When modeling run-off-road crashes, it appears necessary to
reduce the number of heavy vehicle encroachments by about 30 percent to account for the
smaller likelihood of these vehicles encroaching.
There are several possible reasons for this reduced likelihood of heavy vehicles
encroaching. First, heavy vehicles are not as maneuverable as passenger vehicles and
they have much more restrictive acceleration and deceleration capabilities. Second,
heavy vehicles are operated by trained professional drivers who must operate their
vehicles in accordance with specific requirements including hours of rest available to the
driver. While the causes of this reduced encroachment rate are speculative, the data
examined demonstrates that the number of encroachments that can be expected from
heavy vehicles is only about 30 percent of passenger vehicles.

128
Encroachment Adjustments for Site-Specific Characteristics
The 1989 AASHTO GSBR includes three adjustment factors; a horizontal
curvature adjustment factor, a grade adjustment factor and an adjustment factor for deck
height and under-structure conditions.
The adjustments for the grade and horizontal curvature from the 1989 AASHTO
GSBR are shown in Table 48 and Table 49. These values were also used in RSAP 2.0.3
as well as the latest version of RSAP, RSAPv3. While NCHRP 17-54 is in the process
of updating these adjustments, the values shown in Table 48 and Table 49 are the best
available data at the present time. These adjustment factors should be used until suitable
replacements can be made.
Table 48. Grade (Fgrade) Adjustment Factor.
Grade Fgrade
<= -6 2
-6 2
-4 1.5
-2 1
>= -2 1
Table 49. Horizontal Curve (Fhcurv) Adjustment Factor.
Degree of
Curvature
Radius of
Curvature
Fhcurv
<= -6 -9545 4.0
-5 -1145 3.0
-4 -1430 2.0
-3 -1910 1.0
0 ∞ 1.0
3 1910 1.0
4 1430 1.3
5 1145 1.7
>= 6 955 2.0
RSAPv3 also includes adjustment factors for the number of lanes, lane width,
posted speed limit and the access density. These adjustment factors have been
incorporated into the selection guidelines.
The 1989 AASHTO GSBR bridge height adjustment to adjust for the severity of
the under-bridge conditions was applied in the 1989 AASHTO GSBR inappropriately to
the number of expected encroachments since the increase in severity should only apply to
those cases where the vehicle penetrates the bridge railing. The GSBR applies the factor
to all crashes regardless of whether a penetration occurred or not. In RSAPv3, the
condition of the area under the bridge is accounted for by a special edge hazard. The

129
severity of crossing the special edge is only calculated and included for those cases where
the vehicle crosses the special edge by penetrating, rolling over or vaulting over the
bridge railing. The area under the bridge is accounted for in the selection tables and
described in full in a later section. It is not treated as an encroachment adjustment factor.
Bridge Shoulder Offset
The 1989 GSBR and NCHRP 22-08 provided the four offset distances (i.e.,
bridge shoulders) in the selection guidelines:
0-3 ft (nominal 1 ft)
3-7 ft (nominal 4 ft)
7-12 ft (nominal 8 ft)
>12 ft (nominal 12 ft)
The effect of shoulder width on crash severity has been one of the more
interesting features of this research. BCAP, ABC and the 1989 AASHTO GSBR all
assume that encroachments follow a straight path and are in a state of constant
deceleration. Under these assumptions, any trajectory has a lower severity (i.e., slower
speed and same angle) the farther the vehicle travels so wider shoulder widths always
result in reduced crash severity.
RSAPv3, as discussed above, uses actual trajectories collected in NCHRP 17-22.
These trajectories are sometimes straight, sometimes curved to the left, sometimes curved
to the right and sometimes have compound curvatures. These various trajectory
curvatures are due to the driver’s response to leaving the roadway. In early RSAPv3 runs
it was discovered that the crash severity for a particular trajectory sometimes increased as
the shoulder width increased. The reason is that some trajectories leave the road with the
angle relative to the roadway increasing as the trajectory travels further off the road. If,
for example, the vehicle left the roadway with a speed and angle that were close to
indicating rollover or penetration with a one-ft offset, the speed and angle at a four-ft
offset sometimes was enough to indicate penetration or rollover. Simply stated, the
vehicle sometimes would not penetrate or rollover when the offset was one foot but
would penetrate or rollover at a higher offset because the angle was increasing. For
example, when performing runs for a one foot shoulder with impacts by the average
single unit truck, RSAPv3 selected 40 trajectories that matched the site conditions (i.e.,
speed limit, flat side slope, horizontal curvature and grade). Of these 40 trajectories, five
penetrated or rolled over 24-inch high low-profile barrier. When the offset was increased
to four feet, seven trajectories resulted in rollover or penetration. The reason was that the
angle for some of the trajectories was increasing so for some trajectories, a
rollover/penetration did not occur at one-ft but did occur at four-ft due to the higher
angle.

130
The offset where the equivalent adjusted ADT is minimized appears to be at about
8 ft. As the offset further increases the ADT and percent truck values increase slightly as
well so it appears that the 8-ft offset is the limiting value. Since the worst-case value
always occurs at a shoulder offset of 8 ft, the selection guidelines have been based on the
shoulder offsets at 8 ft and the shoulder offset should not be a consideration in the
selection. Doing so is conservative for narrower shoulders. If, for example, an agency
built a bridge with a 12-ft shoulder anticipating converting it to an 11-ft lane and 1-ft
shoulder in the future, the bridge railing selected would not change since it is based on
the more critical 8-ft shoulder offset.
Crash
The probability of a collision given that a vehicle has encroached onto the
roadside or median is determined in RSAPv3 by directly projecting reconstructed vehicle
trajectories onto the roadside or median and determining if the trajectory intersects the
position of any hazard, in this case bridge railings. Figure 41 provides a simplified
representation of the steps which the crash prediction module takes to determine if a
collision occurs; if a terrain rollover occurs; or if nothing happens and the encroachment
results in a non-crash event.[Ray12]
As shown in Figure 41, when examining a trajectory, there are many possible
outcomes. For example, a trajectory may interact with a roadside hazard, then either stop
in contact, penetrate, or be redirected. The probability of each of these events is
calculated and the outcome of each sub-event is evaluated. For example, if the vehicle
penetrates the barrier, the trajectory is followed further to determine if it interacts with
another hazards or results in a rollover. If the trajectory is redirected, the redirected paths
are evaluated.
Predicted Penetration, Rollovers and Vaults
The ability to reasonably predict the number of roll-over-the-barrier, vault the
barrier and penetrate-the-barrier crashes is critical to obtaining correct crash costs and so,
is also critical to obtaining correct results. In RSAPv3, a penetration implies a complete
structural failure of the barrier which allows the vehicle to pass through. A rollover-the-
barrier is when the vehicle rolls over the barrier and off the bridge whereas a redirection
rollover is one in which the vehicle rolls over but remains on the bridge. The capacity
values for TL2 through Report 350 TL 4 used in developing these guidelines are based on
taking 1.6 times the recommended AASHTO bridge railing design loads from Table
A13.2-1 of the LRFD Bridge Design Specification as shown in Table 50. [AASHTO12]
The values used for MASH TL4 and TL5 are based on recommendations from a recent
TXDOT study that examined what recommended values should be used for the new
MASH test criteria. [AASHTO09, Sheihk11] When compared to available crash tests this

131
tends to provide a good estimate of the lower bound of crash tested strengths when
complete barrier failure might occur.
Figure 41. RSAPv3 Crash Prediction Module Flow Chart.
1. Select trajectories for
a uniform segment.
2. Map selected
trajectories onto roadside.
3. Examine trajectories for intersections with hazards.
4. Collision is detected.
4a. Probability of rollover
before collision?
4b. Probability of
penetrating hazard?
4c. Probability of redirection?
Repeat analysis.
5. No collision detected.
Probability of terrain rollover?
6. Increment forward.

132
Table 50. Bridge Railing Load Capacities.
Test Level Barrier
Height
AASHTO
LRFD
BCAP ABC RSAPv3
Load Capacity
(inches) (kips) (kips) (kips) (kips)
MASH TL 2 24 -- -- -- 43.2
MASH TL 3 27 27 15 30 43.2
R350 TL 4 32 54 35 64 86.4
MASH TL 4† 36 80 -- -- 128.0
MASH TL 5† 42 160 55 108 256.0
† These values are being considered by but have not been adopted by AASHTO for a
future revision of the LRFD Bridge Design Specifications. They are based on
[Sheihk11].
NCHRP 22-08 performed a crash study of bridge railing crashes in Texas.
[Mak93] As discussed in the literature review, there were numerous problems analyzing
and interpreting the data as well as some serious coding issues. In the end, however, it
appeared that for bridge railings installed after 1965 the percentage of all vehicle types
that penetrated or rolled over the bridge railing was three percent (i.e., 1.1 percent
penetrated and 1.9 percent rolled over the bridge railing). Since NCHRP 22-08 was
completed in 1993 it is presumed that the majority of bridge railings in the TXDOT data
would, at best, represent PL1 bridge railings in the AASHTO GSBR or a mixture of TL2
and TL3 railings in NCHRP Report 350 or MASH.
RSAPv3 models the edge of bridge hazard as a line on the back side of the bridge
railing. If a vehicle crosses this line for any reason, the “hazard” is consider contacted.
Vehicles can cross this line by penetrating through the bridge railing, vaulting over it or
rolling over it. These types of events are called penetration-rollover-vaults (PRV) in
RSAPv3. Consider an example case of a 60 mi/hr highway, RSAPv3 results in the
penetration, roll-over-the-barrier and redirection rollover values shown in Table 51.
Table 51 also compares the RSAPv3 predictions to the average values for passenger
vehicles (i.e., passenger cars and pickups), the average single-unit truck and the average
tractor trailer truck. Unfortunately, there is no crash data available for the low-profile
concrete bridge railing (i.e., TL2) since there is only a small inventory of that particular
barrier installed. In general, RSAPv3 tends to slightly over predict roll-over-barrier and
penetration collisions so the method is still conservative.
Approximately 6,450 bridge rail crashes in Pennsylvania, Ohio, and Nebraska
were reviewed in this study as described earlier. Only eighty-nine of these events (i.e.,
1.4 percent) were heavy vehicle crashes. Unfortunately, the crash data does not identify
specific types or loadings of vehicles but if the RSAPv3 predictions are weighted by the
vehicle mix percentages discussed above they can be combined into a likely penetration

133
and rollover percentage that can be compared to the crash data collected in this project
and in NCHRP 22-08 (see Table 52). Given that the TXDOT data was collected in the
1980’s it is assumed that bridges constructed after 1965 would likely have bridge railings
that conform to the 1989 GSBR PL1 but there was probably still relatively little inventory
of PL2 or PL3. It is assumed in Table 51, therefore, that the crash data is mainly
representative of PL1 railings.
While the rollover and penetration percentages predicted by RSAPv3 are still
higher than observed crash data indicate, they appear to be much more reasonable than
the predictions of either BCAP or ABC. Given the acknowledged unreliability of the
NCHRP 22-08 crash data and the relatively few heavy vehicle cases that could be
obtained in the current study, the RSAPv3 penetration-rollover-vault procedures were
used in the development of these guidelines. The results are on the conservative side but
appear to be reasonable given the uncertainty in the crash data. One should also consider
that the capacity loads represent the low end of the spectrum – specific bridge railings
could be much stronger based on the geometric and reinforcement details used.

134
Table 51. RSAPv3 Predictions of Penetration and Rollovers compared to NCHRP
22-08 TXDOT Crash Data.
Veh
icle
Bri
dg
e R
ail
Hei
gh
t (i
n)
RSAPv3 Prediction NCHRP 22-12(3) Crash Data
Pen
etra
tio
n
Ro
llo
ver
Ba
rrie
r
Red
irec
tio
n
Ro
llo
ver
Red
irec
ted
Pen
etra
tio
n
Ro
llo
ver
Ba
rrie
r
Red
irec
tio
n
Ro
llo
ver
Red
irec
ted
Passenger
Car
24
(24”)
0.3 0.0 2.0 97.7 27 0.3 0.0 2.0 97.7 32 0.0 0.0 2.0 98.0 36 0.0 0.0 2.0 98.0 42 0.0 0.0 2.0 98.0
Pickup
Truck
24
(24”)
4.3 0.0 2.0 93.7 27 4.4 0.0 2.0 93.6 32 0.0 0.0 2.0 98.0 36 0.0 0.0 2.0 98.0 42 0.0 0.0 2.0 98.0
All Passenger
Vehicles
24
(24”)
1.3 0.0 2.0 96.7 -- -- -- -- 27 1.3 0.0 2.0 96.7 5.0 5.6 18.8 70.6 32 4.3 0.0 2.0 93.7 0.6 1.9 5.6 95.7 36 2.5 0.0 2.0 98.0 0.1 0.3 2.7 96.9 42 0.9 0.0 2.0 98.0 0.0 0.2 3.2 96.6
Light Single Unit
Truck
24
(24”)
3.4 12.5 4.0 80.2 27 3.8 2.9 3.5 89.8 32 0.0 5.0 0.0 95.0 36 0.0 0.0 0.0 100.0 42 0.0 0.0 0.0 100.0
Average Single
Unit Truck
24
(24”)
8.8 7.4 3.8 80.1 -- -- -- -- 27 9.3 0.6 2.4 87.7 12.2 4.9 19.5 63.4 32 2.1 3.1 0.0 94.8 2.4 4.9 2.4 90.2 36 0.0 0.0 0.0 100.0 0.0 2.4 4.9 92.7 42 0.0 0.0 0.0 100.0 0.0 0.0 4.9 95.1
Heavy Single Unit
Truck
24
(24”)
33.5 2.0 15.0 49.5 27 34.4 0.0 6.2 59.4 32 11.5 7.3 4.4 76.8 36 5.5 1.2 3.9 89.5 42 0.1 0.2 0.0 99.7
Light Tractor
Trailer Truck
24
(24”)
22.7 14.3 10.7 52.4 27 23.1 5.6 10.6 60.7 32 4.5 16.2 6.1 73.2 36 2.5 13.7 4.4 79.3 42 0.0 3.0 3.3 93.7
Average Tractor
Trailer Truck
24
(24”)
7.5 15.1 19.1 58.2 -- -- -- -- 27 8.0 9.2 19.0 63.7 12.2 4.9 19.5 63.4 32 1.1 14.1 11.4 73.4 2.4 4.9 2.4 90.2 36 0.0 4.9 14.2 80.8 0.0 2.4 4.9 92.7 42 0.0 2.7 3.4 93.9 0.0 0.0 4.9 95.1
Heavy Tractor
Trailer Truck
24
(24”)
31.5 13.9 19.5 35.1 27 32.4 8.7 20.3 38.6 32 9.3 16.7 25.0 49.0 36 2.8 21.1 19.1 57.0 42 0.0 16.3 15.9 67.8

135
Table 52. Comparison to Crash Data of RSAPv3 predictions of Penetrating, Rolling
over or Vaulting the Bridge Railing for all Vehicle Classes.
Bridge
railing
height
(inches)
BCAP
(GSBR)
ABC
(NCHRP
22-08)
RSAPv3
Full Mix
RSAPv3
Average
Mix
NCHRP
22-12(3)
Crash Data
% % % % %
24 26.8 20.5 --
27 20.8 14.8 17.1
32 32.7 10.1 15.0 11.9 7.3
36 7.5 3.3 2.4
42 2.8 1.8 0.0
Table 53. Comparison of 1988-1990 TXDOT Bridge Crash Data for bridges built
after 1965 with RSAPv3 Predictions for MASH TL3.
Vehicle Type Vehicle Retained
on Bridge
Vehicle Left Bridge
TXDOT RSAPv3
TL3
TXDOT RSAPv3
TL3
Passenger Car 97.9 99.7 2.2 0.3
Pickup Truck 95.4 95.6 4.7 4.4
Single-Unit Truck 97.7 90.1 2.4 9.9
Tractor-Trailer Truck 92.3 82.7 7.8 17.3
Severity
Once the probability of leaving the roadway and the probability of striking the
bridge rail have been calculated, it is necessary to estimate the likely average severity of
the crash in order to appropriately apportion the crash costs. RSAPv3 introduced the
Equivalent Fatal Crash Cost Ratio (EFCCR) as a measure of crash severity. “EFCCR65 is
a single, dimensionless measure of crash severity with a particular roadside feature at a
baseline speed of 65 mi/hr.”[Ray12] The EFCCR65 allows for direct comparison of
hazard severity between different hazards. The values are based on observable police-
reported crashes and adjusted to account for unreported crashes. “Using the EFCCR65 to
estimate crash severity in a conditional probability model like RSAPv3 provides a
systematic methodology based on observed data and established crash severity
relationships.”[Ray12] This approach removes the subjectivity of previously used crash
severity models.
The EFCCR can be considered the probability of a fatal injury crash given that an
impact has occurred. EFCCR65 values were determined for bridge railings and for
vehicles which leave the bridge.

136
Bridge Railing Crash Severity
An impact with a bridge railing is composed of several possible events each of
which has its own associated severity: the impact with the bridge railing itself, the
potential for another harmful event if the vehicle is redirected (e.g., rolling over in the
roadway or striking another barrier) or leaving the bridge structure and falling to the area
below the bridge. This section deals with the first hazard – striking the bridge railing
itself.
The development of RSAPv3 included research on the severity of various
longitudinal barriers. Table 54 shows an abbreviated list of EFCCR65 values, percent of
PRVs and percent of impact-side rollover (i.e., RSS) for the longitudinal barriers of
interest to this project. The EFCCR is the equivalent fatal crash cost ratio which is the
average crash cost divided by the fatal crash cost. If a roadside feature has an EFCCR of
0.0035, for example, and the fatal crash cost is $6,000,000 then the average crash cost on
a 65 mi/hr roadway is 0.0035∙6,000,000=$21,000. These data were obtained from
several data sets as well as from the literature. Ray et al provided a summary of data
sources in the RSAPv3 Engineer’s Manual. [Ray12]
Table 54. EFCCR65 of Longitudinal Barriers used in RSAPv3.[after Ray12]
Hazard EFCCR65 %PRV %RSS
TL3 27” Vertical Wall 0.0098
TL3 27” NJ SS BR 0.0066 10.08 0.00
TL4 34" Vertical BR 0.0070 0.00 0.00
TL4 34" SS MB 0.0020 0.17 1.01
TL4 32” NJ SS 0.0042 0.06 0.29
TL4 32” F Shape 0.0087 1.38 1.37
TL5 42" Vertical BR 0.0035 0.00 0.00
TL5 42" SS BR 0.0037 0.00 0.00
TL5 42” NJ SS 0.0020 0.15 0.53
TL5 42” F Shape 0.0035 0.67 1.60
The EFCCR is based on observed crashes where the vehicle did not penetrate,
over-ride or roll over the feature so it represents the ideal result of a crash (i.e.,
redirection or stopping in contact with the barrier). For closed-faced concrete barriers,
there should be little if any difference in the severity of crashes that result in redirection.
In developing the bridge railing warrants, the EFCCR65 used for all closed-face
concrete barriers was 0.0035 and the percentage of penetration-rollover-vault (PRV) was
set to zero since the penetration and rollover algorithms determine the appropriate value
based on the barrier height and vehicle properties. The EFCCR65 value of 0.0035 was

137
used to represent the crash severity with all test levels of bridge railings in the
development of these selection guidelines. This crash severity applies only to cases
where the vehicle is redirected or stops in contact with the barrier. Rollovers that occur
during or after redirection are assigned an EFCCR65 of 0.0220 consistent with the usual
RSAPv3 analysis. The EFCCR65 appropriate for use when the vehicle penetrates, rolls
over or vaults over the barrier is discussed in the next section.
Bridge Railing Penetration Severity
For purposes of estimating crash severity, the 1989 GSBR and NCHRP 22-08
assumed that penetrating the bridge railing resulted in a 35 ft drop. The subjective
severity index (i.e., SI) method was used to rate the severity of the crashes. The 35-ft
drop assumption could be modified using an adjustment factor.
RSAPv3 uses a very different severity method based on observed crash data.
Striking a bridge railing actually includes several possible outcomes in RSAPv3—the
severity of the crash with the bridge railing itself (i.e., discussed in the last section), the
possibility of being redirected into another hazard (i.e., striking another barrier or rolling
over in the roadway) and penetrating or rolling over a barrier. Penetrating through or
rolling over the bridge rail is represented by the edge-of-bridge hazard in RSAPv3. The
severity of this hazard is a function of characteristics of the area beneath the bridge.
While each bridge rail has a distinct probability of penetration which does not change
with the area around the bridge, the possibility of causing harm after the penetration
occurs does change after the penetration. For example, a bridge railing on a bridge in a
very rural area over a stream will cause no harm to others aside from the occupants of the
vehicle. On the other hand, a bridge railing on a bridge over an urban street in a heavily
populated area has much more potential for causing harm. This difference in the
consequences of penetrating the bridge railing is explained through three types of edge-
of-bridge hazards as follows:
HIGH: A high hazard environment below the bridge includes possible
interruption to regional transportation facilities (i.e., high-volume
highways, transit and commuter rail, etc.) and/or damage to a
densely populated area below the bridge. Penetrating the railing
may limit or impose severe limitations on the regional
transportation network (i.e., interstates, rail, etc.). Penetrating the
railing also has the possibility of causing multiple fatalities and
injuries in addition to the injuries associated with the vehicle crash
itself. Nearby facilities where a collision could lead to a
catastrophic loss of life such as chemical plants, nuclear facilities or
water supplies should be considered high-hazard environments. A

138
high-hazard environment is also present if penetration or rolling
over the bridge railing could lead to the vehicle damaging a critical
structural component of the bridge (e.g., a through-truss bridge).
MEDIUM: A medium hazard environment below the bridge includes possible
interruption to local transportation facilities, large water bodies used
for the shipment of goods or transportation of people, and/or
damage to an urban area which is not densely populated (i.e., single
family homes, single office buildings, etc.). Penetrating the railing
would limit local transportation routes, however, detours would be
possible and reasonable. Penetrating the railing has the possibility
of causing at least one non-motor vehicle injury or fatality.
LOW: A low hazard environment below the bridge includes water bodies
not used for transportation, low-volume transportation facilities, or
areas without buildings or houses in the vicinity of the bridge.
Penetrating a low hazard railing would have little impact on
regional or local transportation facilities. A low hazard railing has
no buildings or facilities in the area which present possible non-
motor vehicle related victims of a rail penetration.
Bridge rail crash data was examined in Pennsylvania, Ohio, and Nebraska. Only
38 penetrations were found in these censuses of crash data. These 38 bridge rail
penetrations provide possibly the only understanding of the consequence of penetrating a
bridge rail. The probability of penetration is presented above, however, the severity of a
crash which does penetrate the rail was determined from this census of data. While
catastrophic penetration events often are news worthy, a census of police reported data
should be used to understand the severity of these crashes to remove any bias toward
more catastrophic crashes. Zero motorcycles, 26 passenger cars, and 12 heavy vehicles
penetrated the bridge rails resulting in five fatal crashes, 13 A injury crashes, 5 B injury
crashes, 6 C injury crashes, 8 PDO crashes and 1 crash of unknown severity. This results
in an EFCCR of 0.1584. This value was used as the medium level hazard discussed
above. A value of 0.0584 was used for the Low-level discussed above. This is
equivalent to reducing the K + A crashes to one each. A value of 1 was used for the
High-level, which represents absolute certainty that a fatality will be observed every time
the rail is penetrated which is consistent with a catastrophic crash.

139
Table 55. Bridge Railing Penetration Hazard Severities.
Bridge Penetration
Severity
EFCCR65
Low 0.0584
Medium 0.1584
High 1.0000
The low severity bridge rail penetrations have a severity that is similar to an on-
road rollover (i.e., 0.0220) which seems reasonable since in both cases vehicle occupants
and the vehicle itself are the only cost components that are at risk.
Costs
When conducting an RSAPv3 analysis, the crash costs of each feasible alternative
are determined. A benefit-cost ratio (B/C) for each feasible alternative will be calculated
with benefits in the numerator and agency costs in the denominator. Project benefits, in
this case, would be defined as a reduction in crash costs between the alternatives under
consideration. Project costs include the design, construction, and maintenance costs
associated with each alternative.
RSAPv3 determines the crash costs of each user entered roadside design
alternative. The three conditional probabilities: (1) the encroachment frequency, (2) the
probability of a crash given an encroachment and (3) the probability of an injury given a
crash have been discussed above. The results of these analyses are converted to a
monetary unit of measure for direct comparison with project costs. The B/C ratio,
therefore, is unitless. The benefit-cost ratio (BCR) is defined as follows:
BCRi/j=
where: BCRi/j = Incremental BCR of alternative j with respect to Alternative i,
CCi , CCj = Annualized crash cost for Alternatives i and j and
DCi , DCj = Annualized direct cost for Alternatives i and j.
For each alternative, an average annual crash cost is calculated by summing the
expected crash costs for the predicted crashes. These crash costs are then normalized to
an annual basis. Any direct costs, as defined by the user (i.e., initial installation and
annual maintenance) are also normalized using the project life and the discount rate to an
annualized basis and the BCR is calculated. The project life will therefore influence the
results, regional variation in agency costs will influence the results and temporal
variations in agency costs and crash costs will influence the results. The following

140
sections discuss these influences and the costs used in the development of the selection
guidelines.
Project Life
The 1989 GSBR assumed a 30-year life for bridges. The AASHTO Red Book
generally recommends a 30-year service life for most transportation projects but the
AASHTO LRFD Bridge Design Specification recommends in Section 1.2 a 75-year
service life for bridge structures. [AASHTO12, AASHTO07] Replaceable portions of a
bridge are sometimes assumed in the AASHTO LRFD specification to have a service life
of between 30 and 50 years assuming that the component is either re-furbished or
maintained at the end of that period. Bridge railings are certainly a long-lived portion of
a bridge structure that would generally only be replaced if the structure is being replaced
or if the deck is being replaced or refurbished. Choosing a longer service life amortizes
the construction cost over a longer period so higher performance railings would be cost
beneficial at lower traffic volumes. Conversely, a shorter service life amortizes the
construction cost over a smaller period so higher performance railings would be cost
beneficial at higher traffic volumes. In short, a long service life will result in the use of
more high performance barriers and a shorter service life will result in proportionally
fewer high performance barriers. A design life of 30 years as was used in the
development of these selection guidelines, as was done in the AASHTO GSBR.
Regional Cost Variations
Construction Costs
The Washington Department of Transportation (WSDOT) preformed a survey of
highway agencies within the United States in 2002 to better understand all project related
costs and to gauge how WSDOT costs relate to other States. WSDOT found the average
construction cost nationwide was $2.3 Million per lane-mile of highway in 2002. This
figure excludes “…right of way, pre-construction environmental compliance, and
construction environmental compliance and mitigation.” [WSDOT09] These exclusions
are quite variable by project and region, let alone State so excluding them allows the
comparison to be based only on highway construction costs. Design costs, or the costs
related to preparing a project for construction, are generally accepted to be approximately
ten percent of the construction costs of the project.
Using the data gathered by the Washington Department of Transportation, the
relative cost of each state’s construction to the national average can be determined and
adjustment factors for regional variations in construction cost can be developed to adjust
costs to the national average construction cost. The relative comparison of each
responding state to the average value was determined and is shown in Figure 42. States
with a value of one have approximately the same construction costs as the national

141
average construction costs, while states with a relative value higher than 1.0 have
construction costs which are higher than the average by the multiple shown. For
example, New York has a relative cost of 3.6, therefore, it costs more than three times as
much to construct a lane mile of highway in New York than the national average.
Arkansas and California both have approximately average construction costs, while states
like Mississippi, Michigan and Montana have below average construction costs. The
regional adjustments vary from a low of 0.44 in Mississippi to a high of 3.63 in New
York State. These data show that construction costs reported from different States in the
same year vary widely by region.
Crash Costs
Bahar collected eighteen crash costs components from each state to determine the
relative crash cost per state. [Baher11] These included the cost of: police, EMS, fire,
emergency incident management, Medicaid, coroner, employee medical, employer cost,
lost wages excluding taxes, insurance administration, at-fault liability, property damage,
legal, court, roadside hardware repair, state tax loss, state welfare safety net, and
vocational rehabilitation. This list of cost components is essentially the same as that used
by Miller in his 1988 study of nationwide crash costs. [Miller88]
Bahar developed a regional crash cost application tool which includes adjustments
for comprehensive crash costs from the national average to each as shown in Table
56.[Baher11] For example, Virginia has a regional crash cost adjustment of 1 indicating
crash costs in Virginia are the same as the national average. On the other hand, crash
costs in Washington D.C. are 1.61 times higher than the national average and those in
Alaska are 64 percent of the national average. Like construction costs, therefore, crash
costs also vary widely by region.
Comparison
The regional crash cost adjustment factors from Table 56 are shown alongside the
previously introduced construction cost adjustment factors from Figure 42 in Figure 43.
Also shown in Figure 43 is the ratio of the adjustment factors for crash cost to
construction costs. This adjustment factor ratio is constructed in the same way a
benefit/cost ratio would be: the crash cost adjustment is divided by the construction cost
adjustment. One might think that these adjustments would generally cancel each other
out resulting in a value near unity. In other words, if crash costs are higher in a particular
state one might think that the construction costs are higher by the same proportion. In
reality, as shown in Figure 43, this is not true. States such as New York, New Jersey and
Hawaii have considerably higher construction cost adjustments than crash cost
adjustments, while states like Mississippi, New Mexico, and North Carolina have
considerably higher crash cost adjustments than construction cost adjustments. A few

142
States do have equal crash and construction cost ratios (e.g., Massachusetts, Oregon and
South Dakota) but they are the exceptions. The ratio of crash costs to construction costs
is 36 percent of the national average in New York but twice the national average in
Mississippi. Although both crash costs and construction costs vary by region they do not
necessarily vary in the same proportion.
As an example, say a national roadside safety guideline was developed using a
benefit-cost ratio (BCR) of 2 and national average construction and crash costs. The
policy would result in a project whose actual regionally adjusted BCR was 2 ∙ 0.36 = 0.72
in New York and 2∙ 2.02 = 4.04 in Mississippi. The guideline would have the unintended
effect of recommending a non-cost beneficial project in New York and a very cost-
beneficial project in Mississippi.

143
Figure 42. Lane Mile Cost Comparison by State. [after WSDOT09]
0.0
0.5
1.0
1.5
2.0
2.5
3.0
3.5
4.0
Ari
zona
Ark
ansa
s
Cal
iforn
ia
Colo
rado
Haw
aii
Idah
o
Illi
no
is
Kan
sas
Louis
iana
Mai
ne
Mas
sach
use
tts
Mic
hig
an
Mis
siss
ippi
Monta
na
New
Jer
sey
New
Mex
ico
New
York
Nort
h C
aroli
na
Ohio
Okla
hom
a
Ore
gon
South
Dak
ota
Was
hin
gto
n
Wes
t V
irgin
ia
Wyom
ing
Rel
ati
ve
Valu
e B
ase
=1
Relative Cost/Lane Mile Base Value

144
Table 56. Crash Cost Adjustments by State to the National Average. [After Bahar11]
State Adj. State Adj. State Adj.
Alabama 0.80 Kentucky 0.87 North Dakota 0.88
Alaska 0.64 Louisiana 0.89 Ohio 0.92
Arizona 0.86 Maine 1.08 Oklahoma 0.80
Arkansas 0.91 Maryland 1.10 Oregon 0.87
California 1.23 Massachusetts 1.31 Pennsylvania 1.01
Colorado 0.90 Michigan 0.91 Rhode Island 1.11
Connecticut 1.57 Minnesota 1.22 South Carolina 0.79
Delaware 0.92 Mississippi 0.89 South Dakota 0.73
DC 1.61 Missouri 0.82 Tennessee 0.74
Florida 0.85 Montana 0.79 Texas 0.75
Georgia 0.84 Nebraska 0.94 Utah 0.89
Hawaii 1.56 Nevada 0.96 Vermont 1.10
Idaho 0.93 New Hampshire 0.77 Virginia 1.00
Illinois 0.98 New Jersey 1.28 Washington 1.09
Indiana 0.91 New Mexico 0.89 West Virginia 0.91
Iowa 0.90 New York 1.32 Wisconsin 1.02
Kansas 0.95 North Carolina 0.96 Wyoming 1.04

145
Figure 43. Regional Crash Cost and Construction Cost Adjustment Factors Relative to a Base of One.
0
0.5
1
1.5
2
2.5
3
3.5
4
Ari
zona
Ark
ansa
s
Cal
iforn
ia
Colo
rado
Haw
aii
Idah
o
Illi
no
is
Kan
sas
Louis
iana
Mai
ne
Mas
sach
use
tts
Mic
hig
an
Mis
siss
ippi
Monta
na
New
Jer
sey
New
Mex
ico
New
York
Nort
h C
aroli
na
Ohio
Okla
hom
a
Ore
gon
South
Dak
ota
Was
hin
gto
n
Wes
t V
irgin
ia
Wyom
ing
Rel
ati
ve
Valu
e B
ase
=1
Crash Costs Relative Const. Cost/Lane Mile Relative Crash Cost/Construction Cost Base Value

146
Temporal Cost Variations
Further compounding the regional variations in costs are the variations of costs in time
due to general economic variations. For example, the U.S. economy was robustly growing in the
period between 2003 and 2008 but contracted in 2008 leading to a national recession.
Construction Costs
Since 2003 the FHWA has been collecting highway construction data and using it to
calculate the National Highway Construction Cost Index (NHCCI). [NHCCI11] This index can
be used to convert or compare current construction expenditures to other years. The NHCCI
base of one is relative to the first year of data collection, 2003. When costs increase relative to
the 2003 base year, the index is greater than 1 whereas when costs fall below the 2003 year
values the index is less than 1. Figure 44 shows the NHCCI index for 2003 through 2012. In
2006, the NHCCI index was 1.35 meaning construction costs were 1.35 times higher than they
were in 2003. In 2010, the NHCCI was 1.06 meaning construction costs had decreased almost
back to the level of 2003. Figure 44 shows, as would be expected, that highway construction
costs decreased by more than 20 percent between 2006 and 2010 in response to the general
economic conditions at the time.
Figure 44. NHCCI Index for 2003 through 2010.
Crash Costs
Miller et al. conducted a study in 1988 which determined the comprehensive costs of
crashes related to the KABCO scale commonly used on police crash reports to describe the
severity of a crash.[Miller88] Each letter of the scale equals a different severity (e.g., K for a
1.00
1.07
1.18
1.35
1.29 1.29
1.10
1.06 1.07
1.11
0.90
0.95
1.00
1.05
1.10
1.15
1.20
1.25
1.30
1.35
1.40
2003
2004
2005
2006
2007
2008
2009
2010
2011
2012
Ind
ex B
ase
Yea
r 2
00
3 =
1.0
Year

147
fatal injury and O for a property damage only crash) and results in a different comprehensive
cost. Miller noted that “these costs should be updated annually using the GDP implicit price
deflator.”[Miller88] FHWA then updated this study to 1994 dollars. [FHWA09]
FHWA issued a memorandum in 2008 which suggested that the GDP implicit price
deflator should no longer be used to update the comprehensive costs of crashes but rather the
value of statistical life (VSL) should be used instead. The memorandum notes “the relative
values of injuries of varying severity were set as a percentage of the economic value of a life.”
These values are still being reviewed by FHWA and the relative values may be modified in the
future. In 2008, a VSL of $5.8 million was established. In 2009 the VSL was changed to $6.0
million. The value was updated in 2011 to $6.2 million and again in 2012 to $9.1 million.
[FHWA08, FHWA09, FHWA11, FHWA12b]
FHWA plans to periodically issue updates to the VSL rather than having users update the
comprehensive costs through updates to the GDP, as suggested previously by Miller. Using the
relative values of injuries established in 1988 and the 2008, 2009, 2011 and 2012 VSLs provided
by FHWA, Table 57 reflects the current comprehensive cost of crashes.
Table 57. Comprehensive Crash Costs by Year.
Crash
Severity
Cost per Crash
1994 2008 2009 2011 2012
K $2,600,000 $5,800,000 $6,000,000 $6,200,000 $9,100,000
A $180,000 $401,538 $415,385 $429,231 $630,000
B $36,000 $80,308 $83,077 $85,846 $126,000
C $19,000 $42,385 $43,846 $45,308 $66,500
PDO $2,000 $4,462 $4,615 $4,769 $7,000
Comparison
After adjusting both the crash and construction indexes to a base year of 2008, the first
year the VSL was available, the data can be directly compared as shown in Figure 45. The
triangles represent the increasing VSL over the past five years while the diamonds represent the
variation in construction costs. While the construction cost varies with general economic
conditions, the VSL monotonically increases causing the values to diverge. These diverging
values will have tremendous implications to benefit-cost analysis conducted from one year to the
next. For example, an alternative which was cost-beneficial in 2010 when construction costs
were relatively low may not have been cost-beneficial in 2008 when construction costs were
higher. These significant changes can impact the choice of a preferred alternative when using an
incremental benefit-cost analysis.

148
.
Figure 45. Comparison of Annual VSL to NHCCI Index Updates.
While benefit-cost will always be a valuable tool for choosing among feasible
alternatives, the temporal and regional variations of both crash costs and construction costs
create a problem when developing national guidelines that are intended for long-term use across
all regions of the country. For example, say a roadside design guideline was developed in 2008
that assumed a decision BCR of 2. By 2011 the construction costs would decrease by a factor of
0.82 but the crash cost would have increased by a factor of 1.07 so the benefit-cost of that same
alternative would really be 2.6; even better than the conditions of the original policy. On the
other hand, if construction prices begin to increase dramatically in the coming years to an
NHCCI of 2.6 and crash cost reaches $12 million the same alternative will have a BCR of 1.5,
below the threshold value of 2 used to develop the guideline. Since design alternatives generally
have design lives of 20 to 30 years, it would seem highly likely that the actual BCR will change
dramatically over the life of the project due to temporal and regional variations.
This points out a difficulty of performing benefit-cost analyses during an economic
contraction since the real construction costs will decrease but, as a political matter, the value of
statistical life is not likely to ever decrease since devaluing the VSL would imply the Federal
government places less value on the lives of its citizens. The 2012 values for VSL and NSCCI
have been used to adjust costs from different regions and different times to a 2012 national
average to develop one option presented in these selection guidelines, however, a risk-based
guideline development method which is independent of these temporal and regional variations
was explored and ultimately recommended for implementation. The risk-based method is
0.60
0.80
1.00
1.20
1.40
1.60
1.80
2008
2009
2010
2011
2012
Ind
ex B
ase
Yea
r 2
00
8 =
1.0
NHCCI Index
VSL Index

149
discussed later, but first the costs and adjustments used in the development of the benefit-cost
tables are presented.
Bridge Railing Agency Costs
Construction Costs
Construction bid prices for various test level bridge railings from a variety of states were
reviewed, adjusted and averaged using the NCHHI index and WSDOT study discussed above to
determine the 2012 National average construction prices shown in Table 58. The 1989
AASHTO GSBR assumed the bridge railing construction costs shown on the left side of Table
58. As shown in Table 58, the ratios between the construction cost of each test level bridge
railing with respect to TL3 is very similar for both the cost data acquired in this project and that
used in the 1989 GSBR. It is also interesting to note that if the 1989 GSBR costs are inflated to
2012 dollars (i.e., 23 years at 4% interest) they are similar to the values obtained in this project
from recent construction bid projects in a variety of States so the construction costs appear to be
consistent.
The construction cost for the TL2 low-profile concrete barrier and the MASH TL4
concrete barrier are estimates. There have only been a couple of TL2 low-profile barriers built
so their documented cost is unreasonably high. In developing the values in Table 58 it is
presumed that if the low-profile concrete barrier were built in sufficient volume the cost per
linear foot would be just under the cost of a TL3 (i.e., 27” tall) concrete safety shape.
While some crash tests have been performed with the new 36” tall MASH TL4 concrete
barriers, there is no known installed inventory so the cost shown in Table 58 was interpolated
based on the better documented costs of Report 350 TL4 and TL5 barriers.
Table 58. National Average Construction Costs for Closed-Profile Concrete Bridge
Railings.
Performance
Level
GSBR
Construction
Cost
$/LF
GSBR
Ratio
wrt PL1
Equivalent Test
Level
2012
Construction
Cost
$/LF
Ratio
wrt TL3
-- -- -- MASH/R350 TL2 100 0.9
PL1 28.80 1.0 MASH/R350 TL3 110 1.0
PL2 43.62 1.5 Report 350 TL4 165 1.5
-- -- -- MASH TL4 240 2.1
PL3 68.96 2.4 MASH/R350TL5 325 2.9
Demolition Costs
A similar review of the cost to remove bridge rail was undertaken. Maryland, Colorado,
Oregon and Vermont specifically identify this line item in their standard specifications.
Maryland and Colorado list the 2010 weighted average bid price per linear foot as $15 and $6
respectively while Vermont lists the 2011 weighted average bid price as $10.59 per linear foot.

150
Oregon summarized the 2009 through 2011 weighted average bid prices as $57.23 per linear
foot. After applying the state and annual factors then averaging the values, a resulting 2012
value of $23 per linear foot was obtained as the national average cost per linear foot for the
removal and disposal of bridge rail. This cost is only applicable when considering the
rehabilitation of bridges and upgrading from an existing railing to a new railing.
Repair and Maintenance Costs
Repair costs for bridge railings can be significant but are quite difficult to determine and
often not tracked separately. One respondent to the survey conducted during this research
suggested an estimate of $54 per linear foot. A review of the Texas and Oregon weighted
average bid prices suggests that the 2011 concrete repair price ranges from $65 to $175 per
square foot of exposed area, depending on the depth of the repair.
A recent project from the State of Florida to enhance its bridge management software
includes cost elements for all types of bridge construction and repair. [Sobanjo11] The data
contained 176 winning bids for work on bridge barrier repairs and retrofits. The 2009 repair of
railing line item ranged from $215 to $3,880 per each event, however, the railing type or material
was not specified.
Many States prefer concrete bridge railings because for the vast majority of crashes there
will be little important barrier damage. In the rare case of a major collision involving a heavy
vehicle, however, concrete bridge railings can fail catastrophically. Such catastrophic damage
may including the complete structural failure of the concrete barrier itself as well as failure of the
bridge deck since many concrete bridge railings are constructed integral with the deck. It
appears that a reasonable price for minor repairs would be $110 per square foot.
Bridge Railing Crash Costs
The comprehensive costs of all vehicle crashes is discussed above and shown in Table 57
for 1994 through 2012. Zaloshnja and Miller determined the comprehensive cost of various
truck crashes by truck size. [Zaloshnja06] These costs were reported by total crash cost by most
severe injury and by cost of injury per victim. These costs include the following categories: “(1)
medically related, (2) emergency services, (3) lost productivity (wage and household work), and
(4) the monetized value of pain, suffering, and lost quality of life.” [Zaloshnja06] A summary
of the findings are presented in Table 59. Table 59 includes the annual number of truck crashes
by crash severity and truck type as well as the comprehensive cost of truck crashes by crash
severity and truck size.

151
Table 59. Annual Number and 2005 Cost of Truck Crash by Injury Severity and Truck
Type. [After Zaloshnja06]
Truck
Type
Max
Severity
in Crash
Annual
Number
of
Crashes
Cost per
Crash
Truck
Type
Max
Severity
in Crash
Annual
Number
of
Crashes
Cost per
Crash
Str
aight
truck
,
no t
rail
er
K 1,016 $3,136,409
Tru
ck-t
ract
or
wit
h
2 o
r 3 t
rail
ers
K 150 $3,352,753
A 2,612 $640,494
A 1,129 $121,936
B 4,665 $198,225
B 559 $244,084
C 17,491 $62,364
C 740 $116,920
O 116,476 $13,286
O 4,976 $24,883
U* 527 $44,307
U* - -
Unk 7,245 $22,114
Unk 420 $30,872
Str
aight
truck
wit
h t
rail
er
K 162 $3,142,831
Med
ium
/ hea
vy t
ruck
K 87 $3,105,969
A 594 $363,436
A - -
B 517 $220,440
B 259 $235,327
C 1,359 $91,530
C 455 $78,442
O 12,502 $17,295
O 3,143 $10,072
U* 20 $45,990
U* 6 $34,734
Unk 1,277 $23,396
Unk 1,767 $19,435
Bobta
il
K 37 $3,172,568
All
med
ium
/ hea
vy
truck
s
K 4,278 $3,604,518
A 858 $381,348
A 16,035 $525,189
B 266 $173,507
B 23,955 $180,323
C 1,269 $64,324
C 40,774 $78,215
O 9,843 $19,089
O 326,121 $15,114
U* 59 $22,923
U* 1,024 $38,661
Unk 786 $22,401
Unk 21,685 $23,479
Tru
ck-t
ract
or
Wit
h o
ne
trai
ler
K 2,825 $3,833,721
A 10,843 $437,845
U*-Injury, unknown severity
B 17,688 $171,710
Unk-unknown severity
C 19,461 $90,959
O 179,181 $15,749
U* 413 $33,397
Unk 10,191 $24,939

152
The FMCSA updated these costs to reflect the FHWA 2008 updated VSL. These
updated 2008 costs are shown in Table 60. The cost of a fatal truck crash in 2005 was
approximately $3.6M, while the 2008 estimate jumped to $7.2M which is a reflection of the
increase in the statistical value of life. [FMCSA08] Knowing the relationship between the cost
per crash and the cost per victim in 2005, the relationship between the 2005 cost per crash and
the 2008 cost per crash, along with the published VSLs for 2008 and 2012, an estimate of the
2012 crash cost per victim was calculated. This information is also shown in Table 60.
Table 60. 2005 Cost of All Truck Crashes by Injury Severity and per Victim. [After
Zaloshnja06]
Truck Type
Max
Severity
in Crash
Annual
Number
of
Crashes
2005 Cost
per crash
2005 Cost
per
Victim
2008 Cost
per Crash
2012 Cost
per
Victim
All medium/
heavy trucks
K 4,278 $3,604,518 $3,055,232 $7,200,310 $9,575,482
A 16,035 $525,189 $325,557 $1,049,107 $1,020,746
B 23,955 $180,323 $134,579 $360,209 $421,788
C 40,774 $78,215 $62,702 $156,241 $196,516
O 326,121 $15,114 $5,869 $30,191 $18,395
U* 1,024 $38,661 $33,759 $77,228 $105,809
Unknown 21,685 $23,479 $20,540 $46,901 $64,375
Using the information from Zaloshnja and Miller an approximate comprehensive cost of
the crashes investigated by NTSB or reported in the media discussed earlier in this report can be
determined. [Zaloshnja06] These costs are presented to show the possible range of crash costs
for these catastrophic bridge rail crashes. This comprehensive cost data is appropriate for
cost/benefit analysis when evaluating the cost of crashes that might happen against the cost of
safety improvements. However, the crash cost values published by the National Safety Council
(NSC) are best suited for calculating the cost of crashes which have already happened. The NSC
values can be used to measure the economic loss (i.e., economic impact) of crashes. The NSC
values do not include what people are willing to pay for improved safety. [NSC11] The NSC
values are therefore lower than the comprehensive cost values. The NSC crash costs per victim
values for 2011, as well as the inflation adjusted calculated values for 2012 are shown in Table
61. Using these values and the comprehensive crash cost values, the costs of each NTSB
investigated or media reported crash was determined and is shown in Table 62 and Table 63.

153
Table 61. NSC Economic Impact Crash Costs.[NSC11]
Severity 2011 Cost /Victim 2012 Cost/Victim
Death $1,420,000 $1,449,386
Nonfatal Disabling Injury $78,700 $80,329
Property Damage Crash
(including non-disabling injuries) $9,100 $9,288
Table 62. Summary of the Cost of Bridge Rail Crashes in the Media.
Crash
2012
Comprehensive
Crash Costs
NSC 2012
Crash Cost
Additional Unknown
Costs
St. Petersburg, Florida, 2001 $9,823,890 $1,467,962
Glenmont, New York, 2007 $18,395 $9,288
Wiehlthal Bridge, Germany, 2004 $9,575,482 $1,449,386 $400 Million in
Repairs to Structure
Boston, Massachusetts, 2007 $843,576 $18,576
San Francisco, California, 2009 $9,575,482 $1,449,386
Amesbury, Massachusetts, 2011 $9,575,482 $1,449,386
Avon, Colorado, 2012 $9,612,272 $1,467,962
Syracuse, New York, 2012 $843,576 $160,658
Montreal, Quebec, 2011 $19,150,964 $2,898,772
Avellino, Italy, 2013 $364,926,406 $55,169,548
Beaverton, Oregon, 2012 $421,788 $9,288
Bronx, New York, 2012 $67,028,374 $10,145,702
Grand Prairie, Texas, 2013 $9,575,482 $1,449,386
Boston, Massachusetts, 2013 (1) $214,911 $9,288
Boston, Massachusetts, 2013 (2) $18,395 $9,288
Buellton, California, 2012 $11,018,016 $1,539,003
Galesburg, Illinois, 2013 $9,681,291 $1,458,674
Williamsburg, Kansas, 2012 $51,082,801 $7,509,756

154
Table 63. Summary of the Cost of Bridge Rail Crashes Investigated by NTSB.
Crash
2012
Comprehensive
Crash Costs
NSC 2012
Crash Cost
Additional Unknown
Costs
Fort Sumner, New Mexico, 1972 $183,521,293 $27,677,654
Nashville, Tennessee, 1973 $76,603,856 $11,595,088
Siloam, North Carolina, 1975 $45,050,536 $5,946,152
Martinez, California, 1976 $277,688,978 $42,032,194 New bridge
constructed
Houston, Texas, 1976 $76,286,894 $10,349,580
Destroyed 94 feet of
bridge railing,
damaged bridge deck,
and column
supporting overpass
was sheared off.
Elkridge, Maryland, 2004 $38,301,928 $5,797,544
Huntsville, Alabama, 2006 $62,825,006 $7,321,033
Sherman, Texas, 2008 $167,824,682 $25,072,835
The costs of repairs to bridges are considerably higher than any other given section of
highway and generally not considered in the comprehensive and NSC crash cost figures
presented above. In addition to these calculated crash cost values, for example, the bridge rail
crash in Wiehlthal Germany ultimately required that the entire bridge be reconstructed.
[Wiehlthal04] The temporary traffic control and bridge repair costs totaled approximately $400
million. The bridge rail crash in Martinez, California [Marinez76] required that a new bridge be
constructed in addition to the approximately $277 million in calculated crash costs.
Sight Distance Considerations
The AASHTO LRFD Bridge Design Specification (LRFD) states in section C2.3.2.2.2
“Special conditions, such as curved alignment, impeded visibility, etc.., may justify barrier
protection, even with low design velocities.”
The AASHTO Policy on Geometric Design of Highways (Green Book) offers this
guidance for sight distance considerations:
“For stopping sight distance calculations, the height of object is considered to be
600 mm [2.0 ft] above the road surface. … The basis for selection of a 600 mm [2.0 ft]
object height was largely an arbitrary rationalization of the size of object that might
potentially be encountered in the road and of a driver’s ability to perceive and react to
such situations.” [AASHTO01]
For passing sight distance calculations, the height of object is considered to be
1,080mm [3.5 ft] above the road surface.” “It is not necessary to consider passing sight

155
distance on highways or streets that have two or more traffic lanes in each direction of
travel.” [AASHTO01]
When “horizontal sight distance on the inside of a curve is limited by
obstructions” measurements are taken at an average of the stopping sight distance and
passing sight distance height (i.e., 2.75 ft). “Such refinement on two-lane highways
generally is not necessary and measurement of sight distance along the centerline of
traveled way edge is suitable.” [AASHTO01]
For Intersection Sight Distance, “the determination of whether an object
constitutes a sight obstruction should consider both the horizontal and vertical alignment
of both intersecting roadways, as well as the height and position of the object.” In
making this determination, it should be assumed that the driver’s eye is 1,080mm [3.5ft]
above the roadway surface and that the object to be seen is 1,080mm [3.5ft] above the
surface of the intersecting road. “The recommended dimensions of the sight triangles
vary with the type of traffic control used at an intersection….” [AASHTO01]
It seems the LRFD and Green Book have somewhat conflicting guidance for improving
visibility along the roadway, where the LRFD suggests considering a barrier if visibility is
limited and the Green Book limits object height to two feet (24 inches) for stopping sight
distance (SSD), 3.5 feet (42 inches) for passing sight distance (PSD) and 2.75 feet (33 inches) for
horizontal sight distance (HSD).
All TL2 through TL5 bridge railings are 24 inches high or taller so even a TL2 bridge
railing is a sight obstruction for stopping sight distance since the obstruction height is 24 inches.
The guidelines presented herein use a shoulder width of eight feet so if, as suggested by the
AASHTO Green Book, the sight line is taken from the “centerline of the travelled way edge” and
the lane width is assumed to be 12 feet, then the middle ordinate of the circular curve is 20 feet
(i.e., 12+8=20). Knowing the stopping sight distance based on the design speed and the middle
ordinate, the minimum radius of the horizontal curve which would not present a stopping sight
distance obstruction was calculated and is shown in Figure 46 and Table 64. Also shown in
Figure 51 is the Green Book recommended minimum horizontal curvature based on 10 percent
super-elevation and design speed. As shown in Figure 46 and Table 64, the minimum radius
imposed by the stopping sight distance obstruction of the barrier is always greater than the
minimum Green Book radius from Green Book Exhibit 3-14 and the disparity increases with the
design speed. This is true even if the shoulder width is increased to 14 feet or more which is
probably an unreasonable shoulder width to expect on a typical bridge. Stopping sight distance
is generally considered necessary at all points along the highway but the above analysis suggests
that it is not possible to supply the appropriate stopping sight distance for radii less than the
dashed line in Figure 51 with any bridge railing.
The same curves apply for “horizontal sight distance” (HSD) and indicate that MASH
TL4 and TL5 bridge railings would limit the HSD when the radius of the curve is less than the
dashed line in Figure 46. If HSD were considered in the bridge rail selection then the values

156
shown below in Table 64 could be used as minimum radii. The Green Book recommendation for
the HSD object height is 33 inches.
Intersection sight distance (ISD) can be impeded by bridge rail choice. Options may
exist early in design to realign the intersection to provide an acceptable sight triangle. There are
plans to study improving roadside safety hardware choices at bridge ends/intersection in the near
future that may provide some additional options and insight to this problem (i.e., NCHRP Project
15-53). The Green Book recognizes the continual development of roadside hardware through a
single statement: “highway designers should recognize the dynamic developments currently
under way in the entire area of roadside design. … Highway designers should endeavor to use
the most current acceptable information in their designs.” Maintaining the intersection sight
triangles may necessitate stopping or modifying the barrier as the end of the ramp or bridge is
approached.
Figure 46. Minimum Horizontal Curve Radius Based on Barrier Obstruction to the
Stopping Sight Distance Compared to AASHTO Exhibit 3-14.
0
500
1,000
1,500
2,000
2,500
3,000
3,500
4,000
4,500
25 30 35 40 45 50 55 60 65 70 75
Min
imu
m C
urv
e R
adiu
s (f
t)
Design Speed (mi/hr)
AASHTO Ex. 3-14 with e<=10%
Min. Radius Based on BarrierObstruction to SSD

157
Table 64. Minimum Radius and Maximum Degree of Curve Based on the Horizontal
Sight Distance Obstruction from a TL4 or TL5 Bridge Railing.
Design
Speed
Minimum
Radius
Maximum
Degree of
Curve
25 141 40.7
30 238 24.0
35 375 15.3
40 561 10.2
45 805 7.1
50 1,119 5.1
55 1,512 3.8
60 1,999 2.9
65 2,592 2.2
70 3,305 1.7
75 4,153 1.4
Analysis Methods
The objective of this project was to establish selection guidelines for test level two
through five bridge railings. The publication of MASH at the onset of this research required
some evaluation of which crash testing procedures the barriers guidelines should be based on. A
decision was made to limit the selection guidelines to MASH performance criteria, thereby
having this research completely coordinated with the current literature on crash testing bridge
railings. The alternatives considered in the analyses were, therefore, MASH TL2 through
MASH TL5.
The analyses performed to develop the selection procedures were performed using
RSAPv3 release 130912XL14. [Ray12] RSAPv3 is the software implementation of a
conditional probability model for estimating the number and severity of crashes based on
roadway, traffic and site conditions. The model has three basic parts:
Estimating the number of vehicle encroachments (i.e., the encroachment module),
Estimating the probability of a vehicle striking a hazard if it leaves the roadway
(i.e., the collision module) and
Estimating the expected crash cost or severity of a collision with a roadside object
if it occurs (i.e., the severity module).
Details on the methods and algorithms used in RSAPv3 functions are available elsewhere
and will not be repeated here (see [Ray12]) other than those specifically related to or updated for
this project. The inputs to the conditional probability model and necessary changes to RSAPv3
needed to accomplish the goals of this project include determining:
Encroachment characteristics for heavy vehicles,

158
Encroachment characteristics over the project life at low traffic volumes (i.e.,
averaging out the Cooper data “humps”),
Vehicle mix characteristics,
Penetration, rollover, and vault potential for each test level of bridge railing,
The severity of a bridge rail penetration if it does occur, and
An improved understanding of how temporal and regional variations in crash costs
and construction costs impact the development of national guidance development.
Each of these issues has been discussed in detail in an earlier section of this report. Using
these inputs and having made the necessary changes to RSAPv3, the four alternatives (i.e.,
MASH TL2 through TL5) were evaluated across a range of traffic volumes and heavy vehicle
percentages to determine the expected annual crash cost of each alternative. Using the expected
annual crash costs, a benefit-cost approach or a risk approach can be taken to generate the
selection guidelines.
Benefit-Cost versus Risk Approach
There are advantages and disadvantages to both methods of analysis. The benefit-cost
method has the advantage that it includes both societal benefits (i.e., reduction in crash costs) and
agency costs (i.e., construction, maintenance and repair) such that the benefits are maximized
while making the best possible use of agency funds. The disadvantage is that since costs are
explicitly included, regional and temporal variations in the cost elements can make the same
solution cost-beneficial in one region and not cost beneficial in another. Similarly, an alternative
that is cost beneficial under one set of economic assumptions may become not cost beneficial if
economic conditions change in the future. Another disadvantage to a benefit-cost approach is
that the risk is not necessarily uniform so one cost-beneficial solution can have a different
inherent risk than another with the same benefit-cost ratio.
On the other hand, risk analysis sets a specific risk objective that is uniform across
regions and through time such that the risk of an unacceptable event is always the same.
Temporal and regional variations in either the crash or construction cost do not change the
underlying risk of each alternative. The disadvantage is that the best risk-based solution may not
always be cost-beneficial in every region or at every point in time.
The primary advantage to a risk-based approach is that construction and maintenance
costs do not affect the results so the performance goal will not change over time or from one
region to another. This allows the policy decision about the appropriate level of safety that
should be provided to be separated from the question of which alternative is the most
economically attractive. A further advantage is that policy decisions for new construction,
rehabilitation, or retrofitting would be identical using a risk-based approach. For example, a
decision to install 32-inch concrete bridge rail for 20,000 vpd and 10% trucks would be set
regardless of whether the barrier will be installed where no barrier currently exists (i.e., new
barrier construction costs only) or for replacing an existing barrier (i.e., new barrier construction
costs plus demolition and removal of an existing barrier costs). The risk-based goal remains the
same for both problems.

159
Benefit-cost analysis has been a valuable tool in roadside safety for nearly 35 years and
has been used to both prioritize specific projects as well as develop State and national guidelines
for barrier selection and placement. One the one hand, benefit-cost analyses helps transportation
agencies make the most effective use of their limited roadside safety funding. On the other hand,
the level of risk implicit in these decisions is usually hidden, resulting in different levels of risk
based on the time an analysis was performed and the region where the alternative was placed in
service.
The two tools can, in fact, be used together when guidelines are developed based on
acceptable risk criteria. Benefit-cost methods can be used to determine the most economical way
of achieving the desired risk level on a project-by-project basis. Agencies in different regions
may chose different roadside safety alternatives based on the economic situation in their locale
but the overall level of risk would be uniform throughout the nation. For these reasons, a risk
method has been used in the development of the selection guidelines.
While the selection guidelines are presented as a risk-based approach, the process
through which the guidelines are applied is very flexible. Additional tables have been provided
in Appendix A for those that prefer a cost-benefit approach. Both sets of tables and the selection
process are discussed below.
Developing the Selection Guidelines
The most straight-forward way to develop selection guidelines would be to simply run a
large number of RSAPv3 analyses and present them in table format with the construction year
AADT listed in the rows and percent trucks in the columns and each entry indicating the
appropriate test level. For three different highway types and three hazard environments this
would have resulted in at least nine pages of tables not including additional material needed for
the roadway adjustment factors like horizontal curvature and grade as well as space to explain
the procedure. Adding a dozen pages to Chapter 13 of the LRFD Bridge Design Manual for
bridge railing selection did not seem to be the best approach so another more concise method
was developed as discussed below.
The encroachment-based procedure used by RSAPv3, as discussed above, is naturally
broken into three parts: probability of encroachment, probability of collision and expected
severity. For bridge railings, the bridge railing is located relatively close to the edge of the
travelled lane (i.e., shoulders are generally between two and 12 ft) so the probability of collision
estimation in a bridge railing problem is fairly simple and is easily combined with the severity
portion of the analysis. The analysis can be deconstructed into two parts – encroachment and
collision/severity – such that the guidelines can be made much more concise.
The problem of estimating the risk associated with observing a severe or fatal crash along
a 1000-ft segment of bridge railing over its 30-year life is analogous to a coin toss problem and,
therefore, follows the binomial distribution:
[
]

160
where,
P(k) = Probability or risk of observing k failures (i.e., severe or fatal crashes) in n trials,
n = Number of trials (i.e., the number of encroachments over the life of the bridge
railing, k = Number of failures (i.e., severe or fatal crashes) observed and
p = Probability of a failure in any one trial.
The equation above shows that if a fair coin (i.e., a fair coin is one where the probability of
“tails” = probability of “heads” = 0.5) is tossed 10 times, the probability that “heads” will appear
twice is:
[
] [
]
The chance of observing exactly two “heads” in a series of 10 fair coin tosses is 0.0440 or
approximately 1 in 22 (i.e., 1/22~0.0440). Stated another way, if 22 people flip a coin ten times,
one of those persons should get two heads and eight tails and the other 21 will get some other
combination. While the probability of observing exactly two heads is very small, it is not zero.
In the case of a severe or fatal crash involving a bridge railing, the number of trials is the
number of encroachments expected over the 30-year life of the bridge railing and the number of
failures is the number of severe or fatal crashes that should occur in that time period.
The term on the left hand side of the equation, P(k), is the risk of observing one or more
crashes with a particular severity over the life of the bridge railing. Only three values are
required to calculate the risk of a severe or fatal crash over the life of a bridge railing in this
problem:
n = The number of encroachments over the 30-year life of 1,000-ft of bridge railing,
k = 1 and
p = Probability of a severe or fatal crash in any encroachment.
Estimate the number of life-time encroachments on 1,000-ft of bridge railing
Input to the guidelines are the construction year AADT, anticipated traffic growth and
percent of trucks in the traffic stream as well as roadway characteristics like the highway type,
speed limit, horizontal curvature, grade, lane width and access density. The first step in the
analysis, therefore, is to predict the number of encroachments that can be expected over the life
of the bridge railing based on the highway type and AADT. As discussed earlier, the assumed
life of a bridge railing is 30 years and a traffic growth of 2 percent per year was assumed in
developing the guidelines.
Bridges, of course, vary in length so it is necessary to select a standard unit length for the
analyses. A unit length of 1,000-ft was chosen. Any length could have been used to develop the
selection guidelines but the same length needs to used throughout the process since the risk
criterion includes units of length.

161
RSAPv3 uses the so-called Cooper data to estimate the number of encroachments as a
function of highway type and AADT. The Cooper data, which was collected over a wide area in
Canada in the 1970’s, along with the statistical methods used to develop the relationships
pictured in Figure 47 are discussed in much more detail in the RSAPv3 Engineer’s
Manual.[Ray12]
One of the interesting features of the Cooper data shown in Figure 47 are the pronounced
“humps” in each of the curves. For two-lane undivided highways, the top of the “hump” occurs
at about 5,000 veh/day and for four-lane divided highways it occurs at about 30,000 veh/day.
The relationship is a little clearer if the encroachment rate (i.e., encroachments per million
vehicle miles travelled) is examined as is shown in Figure 48. The encroachment rate is highest
for two-lane undivided roadways at low volumes. The encroachment rate for all highway types
decays rapidly as the lane volume increases. Eventually each curve reaches an asymptotic value;
The two-lane undivided curve reaches the value of 0.0448 encroachments/MVMT for all lane
volumes greater than about 8,000 veh/day and the four-lane divided curves reaches the value of
0.1160 encroachments/MVMT for all values greater than about 10,000 veh/day.
Some may think the relationships shown in Figure 47 are counter-intuitive since four-lane
divided highways have a larger number of expected encroachments than two-lane undivided
highways at the same traffic volume regardless of whether rates or frequencies are examined.
One important fact to remember in viewing Figure 46 and Figure 47 is that the Cooper data
predicts encroachments not crashes. While the observational Cooper data suggests that more
vehicles encroach on the roadside on four-lane undivided highways, the roadside of four-lane
divided highways generally feature much more generous clearzones, roadsides with less dramatic
slopes and many fewer fixed objects so while there may be more encroachments, there are fewer
crashes.
In developing the selection guidelines, RSAPv3 analyses were performed for the
following conditions:
- Two-lane undivided, four-lane divided and one-way highway types,
- 1,000-ft long highway segment,
- 500 veh/day ≤ AADT ≤ 110,000 veh/day,
- 30 year design life,
- 2 percent annual traffic growth and
- Flat, tangent sections with 12-foot lanes and 8-ft shoulders.
The results were then tabulated by AADT and highway type as shown later in Figure 50
and Table 68.
At this point, the adjustments for roadway conditions like grade, horizontal curvature,
lane width, access density, number of lanes and posted speed can be determined. The
adjustments are applied to the number of expected encroachments. The result of this first step,
then, is a tabulation of the expected number of encroachments over the 30 year life assuming a 2-
percent growth that also accounts for the roadway characteristics at the site.

162
Figure 47. Cooper Encroachment Frequency Data [after Ray12]
Figure 48. Cooper Encroachment Rate by Lane Volume. [after Ray12]

163
Estimate the probability of a severe or fatal crash in any encroachment
The probability of a severe or fatal crash occurring in each particular collision is the next
parameter that needs to be calculated for applying the binomial distribution. RSAPv3 uses the
conventional police reported crash severity (i.e., the KABCO scale) which can be converted into
dollar values based on the FHWA crash cost recommendations for the particular year of interest.
While the fatal crash cost (i.e., the value of statistical life) changes from year to year as discussed
earlier, the distribution of crash costs by severity does not; the proportion of each injury severity
with respect to a fatal crash remains constant based on the work of Miller. [Miller88] Table 65
shows a table of crash costs by police reported crash severity and the EFCCR represented by
each severity. As shown in Table 65, an encroachment whose sum of event EFCCRs is equal to
0.0692 corresponds to a severe (i.e., A-level in the police reported scale) injury so any
encroachment resulting in an EFCCR (i.e., dimensionless crash cost) of 0.0692 or greater is a
severe or fatal crash (i.e., A+K).
Table 65. Police Reported Crash Severity by Crash Cost and EFCCR.
2006 Crash Cost EFCCR
K $ 2,600,000 1.0000
A $ 180,000 0.0692
B $ 36,000 0.0139
C $ 19,000 0.0073
PDO $ 2,000 0.0008
For each encroachment, RSAPv3 calculates the cumulative EFCCR for each event that
occurs during the encroachment. The EFCCR is generally converted to a crash cost considering
the VSL and vehicle type for each predicted crash. When only considering the risk of a crash,
the EFCCR of each encroachment is not converted to crash costs, but is carried forward as an
EFCCR and the cumulative probability distribution of EFCCRs is obtained similar to the
example shown in Figure 49.
Using the cumulative crash severity distribution in Figure 49 for a TL2 bridge railing in a
low-hazard environment, an EFCCR of 0.0692 is associated with a probability of 0.9560. The
probability of an EFCCR of 0.0692 or greater (i.e., the probability of a severe or fatal injury) is 1
– 0.9560 = 0.0440. If the hazard environment is high, an EFCCR of 0.0692 corresponds to a
cumulative probability of 0.8552 for a TL2 bridge railing and 40 percent trucks. For a high-
hazard environment, therefore, the probability of a severe or fatal injury crash on a TL2 bridge
railing is 1 – 0.8552 = 0.1448. A cumulative probability distribution of the encroachment
EFCCRs was developed for each test level bridge railing, each hazard environment and each
percent of trucks and the cumulative probability of a severe or fatal crash was assembled in
Table 65. Each entry in Table 66 is associated with a cumulative probability distribution like the
example shown in Figure 49. The cumulative probability distributions, like the examples shown
in Figure 49, are the conditional probability of a severe of fatal injury involving a particular test

164
level bridge railing given that a crash occurs so they are only dependent on the vehicle mix (i.e.,
percent of trucks) and the hazard environment. This fact is what allows the guidelines to be split
into an encroachment prediction part and a crash severity prediction part.
Figure 49. Cumulative EFCCR Distribution for TL2 and TL5 Bridge Railings with
40% Trucks.
Unlike the fair coin toss discussed above where the probability of “failure” is 0.5, the
probability of observing a failure in a bridge rail crash is very small and depends on (1) the
number of trucks in the traffic mix and (2) the test level of the bridge railing. As shown in Table
66, for a given hazard environment, the probability of single encroachment resulting in a severe
or fatal crash decreases as the test level increases. This would be expected with an increase in
the performance level of the bridge railing. Also, for a particular test level bridge railing, the
probability of a severe or fatal crash increases as the percent of trucks increases which is also as
expected since more heavy vehicles in the mix make a collision with a very heavy high-energy
vehicle more likely.
The values in Table 66 are invariants of AADT and encroachment meaning that the
probability of a single encroachment resulting in a severe or fatal crash does not depend on the
traffic volume or the roadway characteristics. The AADT, traffic mix and roadway
characteristics influence the number of encroachments to be expected but not the severity of any

165
particular crash. The severity is influenced by the area under the bridge (i.e., High, Medium,
Low). Thus, Table 66 only needs to be generated once.
The probabilities shown in Table 66 where obtained by performing RSAPv3 analyses at
varying percentages of truck traffic for the following conditions:
Primary right encroachments only,
Shoulder width of 8 ft (i.e., face of bridge railing is 8 ft from the edge of the lane),
65 mi/hr divided highways and
An encroachment increment of 500 ft on a 1,000-ft segment of roadway (Station 5+00 to
15+00) in the middle of a 2,000 section of bridge railing (Station 0+00 to 20+00).
Calculating the risk
Now that the number of encroachments and the probability of a single crash resulting in a
severe or fatal crash have been estimated, the risk of observing a severe or fatal crash over the
30-year life of a 1,000-ft section of bridge railing can be calculated. The risk can now be
calculated using the cumulative density function of the binomial distribution with:
k = The number of failures =1,
n = The expected number of encroachments from the first step and;
p = The probability of any particular encroachment resulting in severe or fatal crash
from Table 66 calculated in the second step.
A worksheet was developed listing the range of percent trucks and encroachments for
each hazard environment and the risk associated with each cell was calculated. This was done
for each of three risk levels (i.e., 0.005, 0.01 and 0.02). The resulting data was then formulated
into tables such as those shown later in Figure 52, Figure 56 and Figure 57. These tables form
the basis of the selection process as will be outlined in the next section.

166
Table 66. Probability a Collision Will Result in a Severe or Fatal Injury by Hazard Environment and MASH Test Level.
Low Hazard Medium Hazard High Hazard
Percent
Trucks TL2 TL3 TL4 TL5 TL2 TL3 TL4 TL5 TL2 TL3 TL4 TL5
0.00 0.0203 0.0220 0.0016 0.0016 0.0560 0.0571 0.0084 0.0016 0.1251 0.1268 0.0101 0.0016
1.00 0.0207 0.0223 0.0018 0.0017 0.0563 0.0574 0.0086 0.0017 0.1254 0.1270 0.0103 0.0017
2.00 0.0210 0.0226 0.0020 0.0018 0.0567 0.0577 0.0088 0.0018 0.1257 0.1272 0.0105 0.0018
3.00 0.0214 0.0229 0.0022 0.0019 0.0571 0.0580 0.0090 0.0020 0.1260 0.1275 0.0108 0.0020
4.00 0.0218 0.0232 0.0024 0.0020 0.0575 0.0583 0.0093 0.0021 0.1264 0.1278 0.0110 0.0021
5.00 0.0223 0.0236 0.0026 0.0022 0.0579 0.0586 0.0095 0.0022 0.1267 0.1280 0.0112 0.0023
10.00 0.0244 0.0253 0.0038 0.0028 0.0599 0.0602 0.0107 0.0029 0.1285 0.1294 0.0125 0.0030
15.00 0.0268 0.0272 0.0051 0.0035 0.0623 0.0621 0.0121 0.0037 0.1305 0.1309 0.0139 0.0038
20.00 0.0295 0.0293 0.0065 0.0043 0.0648 0.0641 0.0136 0.0045 0.1327 0.1327 0.0154 0.0047
25.00 0.0325 0.0317 0.0081 0.0052 0.0677 0.0664 0.0153 0.0055 0.1352 0.1346 0.0172 0.0057
30.00 0.0358 0.0344 0.0099 0.0062 0.0709 0.0689 0.0172 0.0066 0.1380 0.1367 0.0191 0.0069
35.00 0.0397 0.0374 0.0120 0.0073 0.0746 0.0718 0.0193 0.0078 0.1412 0.1392 0.0214 0.0082
40.00 0.0440 0.0409 0.0143 0.0086 0.0788 0.0751 0.0218 0.0092 0.1448 0.1419 0.0239 0.0097

167
SELECTION GUIDELINES
The following section presents the recommended selection guidelines and the process for
the application of the guidelines for the selection of MASH TL2 though TL5 bridge railings. A
risk approach applicable to new construction, rehabilitation and retrofitting is recommended. An
alternative cost-benefit approach is provided and discussed following the presentation of the
process. A discussion of the process and the policy decisions necessary for implementation are
also contained later in this section.
Appendix B includes only the process, without any discussion. Appendix B is presented
in a format that could be inserted directly into the AASHTO LRFD Bridge Design Specification
or the Roadside Design Guide.
Bridge Rail Risk Assessment Process
The selection of the appropriate MASH test level bridge railing for new or rehabilitation
construction is dependent on site-specific conditions and results may differ for each side of the
bridge. This process, therefore, should be followed for each bridge edge.
These selection procedures only apply to the bridge railing itself. Providing appropriate
guardrail-bridge rail transitions, adequate guardrail approaches, and appropriate terminals and
crash cushions are also important considerations in the complete safety performance of the
bridge. Users should refer to the AASHTO Roadside Design Guide for guidance on appropriate
transitions, approach guardrails and terminals.
The following selection guidelines include six parts: (1) determine the anticipated
construction year traffic volume (AADT); (2) estimate the total encroachments expected over the
30-year life of a 1,000-ft section of the bridge; (3) adjust the expected number of encroachments
for site-specific conditions; (4) select the test level from the appropriate chart; (5) additional
considerations; and (6) if guidelines do not apply. These steps are described in full below.
1. Traffic Conditions – Determine the anticipated construction year traffic volume (AADT)
and percent trucks (PT). These selection guidelines assume an annual traffic growth rate
of 2% per year and a design life of 30 years. If the anticipated growth rate or design life
are significantly different, use the following equation to compute the equivalent
construction year traffic volume for use in these selection guidelines:
where:
AADT0 = The anticipated construction year bi-directional traffic volume (use the
one-way traffic volume for one-way roads and ramps),
AADTEQ = The equivalent construction year bi-directional traffic volume,
G = The anticipated annual traffic growth rate where 0≤G≤1.
L = The design-life of the bridge railing in years.

168
2. Encroachments – Estimate the total number of encroachments (NENCR) that will be
experienced on a 1,000-ft section of the bridge railing during the life of the bridge railing
by entering Table 68 or Figure 50 with the bi-directional construction year AADT from
Step 1 and the highway type.
a. Do not proportion the value of NENCR based on the length of the bridge. The
entire method is based on a per 1,000-ft basis.
b. If the AADT of interest falls to the right of the end of the curve for the desired
highway type, the level of service for the highway is likely D or worse and these
procedures cannot be used; refer to step 6.
3. Site Conditions – Determine the site-specific adjustment factors for the bridge under
consideration using the adjustment factors shown in Table 67. Multiply all the
adjustments from Table 67 together to obtain fTOT. Find the modified total number of
encroachments (NMOD ENCR) either by:
a. Drawing a horizontal line in Figure 50 until the curve corresponding to fTOT is
obtained (interpolation between lines is acceptable) then reading down to the
horizontal axis for the value of the modified total number of encroachments
(NMOD ENCR) on 1,000-ft of bridge railing over the 30-year life of the bridge railing
or
b. Multiplying the estimated encroachments (NENCR) from Table 68 by the total
adjustments (fTOT) from Step 2 to obtain the modified total number of
encroachments (NMOD ENCR) on 1,000-ft of bridge railing over the 30-year life of
the bridge railing.
4. Test Level Selection – Characterize the hazard environment under the bridge as high,
medium or low according to the following definitions:
HIGH: A high hazard environment below the bridge includes possible interruption
to regional transportation facilities (i.e., high-volume highways, transit and
commuter rail, etc.) and/or interaction with a densely populated area below
the bridge. Penetrating the railing may limit or impose severe limitations
on the regional transportation network (i.e., interstates, rail, etc.).
Penetrating the railing also has the possibility of causing multiple fatalities
and injuries in addition to the injuries associated with the vehicle
occupants. A high-hazard environment is also present if penetration or
rolling over the bridge railing could lead to the vehicle damaging a critical
structural component of the bridge (e.g., a through-truss bridge).
MEDIUM: A medium hazard environment below the bridge includes possible
interruption to local transportation facilities, large water bodies used for the
shipment of goods or transportation of people, and/or damage to an urban

169
area which is not densely populated. Penetrating the railing would limit
local transportation routes, however, detours would be possible and
reasonable. Penetrating the railing has the possibility of causing at least
one non-motor vehicle injury or fatality.
LOW: A low hazard environment below the bridge includes water bodies not used
for transportation, low-volume transportation facilities, or areas without
buildings or houses in the vicinity of the bridge. Penetrating a low hazard
railing would have little impact on regional or local transportation facilities.
A low hazard railing has no buildings or facilities in the area which present
possible non-motor vehicle related victims of a rail penetration.
Choose the hazard environment most applicable to the bridge under consideration.
Enter the appropriate chart in Figure 52 for the hazard environment selected above, the
modified lifetime encroachments per 1,000-ft of bridge edge (NMOD ENCR) from Step 3,
and the percent trucks (PT) from Step 1 to select the appropriate MASH test level for the
bridge railing. If the point plots above the dashed risk boundary these charts cannot be
used and the engineer should refer to step 6.
5. Additional Considerations – The bridge railing selected using this process provides a
solution where the risk of observing a severe or fatal injury crash over the design-life of
the bridge railing should be less than 0.01 when the specific site conditions evaluated
(i.e., traffic volume and mix, geometry, posted speed limit, and access density) are
considered. Engineering judgment should be used when unusual or difficult to
characterize site conditions are encountered when selecting a bridge railing. Limited
numbers of crash tested bridge railings are available at some test levels, therefore, it is
possible that the recommended test level barrier for the evaluated site conditions may not
be the best choice for some site conditions not explicitly addressed in these selection
guidelines. For example, the particular layout of the barrier at the end of a ramp may
influence intersection sight distances and require the use of engineering judgment in
designing the interchange to determine an appropriate barrier as it approaches the
intersection. Another example might be the presence of pedestrians or bicyclists which
might benefit from a higher or different type of railing or the use of sidewalks. Some of
the factors that should also be considered are:
a. TL5 bridge railings may be appropriate for specially designated hazardous
material or truck routes.
b. Intersection sight distance obstructions created by higher test level bridge railings
at the ends of ramps or bridges should be considered and the bridge railings may
require transitioning to a lower height approaching the intersection.
c. Stopping sight distance on bridges where the radius and design speed plot below
the dashed line in Figure 51 may limit the use of higher test level bridge railings.
d. The presence of pedestrians, bicyclists, snowmobiles, all-terrain vehicles and
other recreational vehicles may affect the choice of bridge railing.

170
e. Crash history especially as it relates to heavy vehicle crashes or bridge rail
penetrations may justify higher performance bridge railings.
f. Regional concerns about snow removal, hydrological impact of flood waters
flowing over the bridge, and maintaining scenic views may also play a role in the
selection of bridge railings beyond these selection guidelines.
g. The capacity of the bridge deck may limit the choices available for higher test
level bridge railings on rehabilitation projects.
6. Guidelines Do Not Apply – There are some situations where these guidelines should not
be used, namely:
a. The traffic conditions violate the free traffic flow assumption used in developing
the guidelines such that the estimate of the number of encroachments is not
reliable. Generally, this results from a plot point in Figure 50 that is to the right
of the end of the highway-type line. This indicates that the level of service may
be D or worse and the basic assumptions of the method are invalid.
b. The user may find that the selection plots above the boundary of Figure 52. In
such a case the following options should be considered:
i. Can the traffic operational conditions (i.e., AADT and percent trucks) be
reduced?
ii. Are the roadway characteristics (e.g., horizontal curvature, grade, etc.)
resulting in large adjustments to the NENCR? Can the geometry be
modified to reduce the adjustments?
iii. Can the deck and superstructure support a TL6 bridge railing?
These situations require a more detailed analysis of the site conditions that examines a
broader range of alternatives beyond just the bridge railing test level selection. A
solution will probably require the collaboration of traffic operations, geometric design
and bridge railing design engineers to either modify the traffic or geometry conditions of
the bridge such that these guidelines can be used or perform a crash history investigation
to determine the actual performance of the existing bridge railing.

171
Table 67. Encroachment Adjustments.
Num
ber
of
Acc
ess
Poin
ts o
n
Bri
dge
or
within
200 f
t of
eith
er e
nd
Undiv
ided
Div
ided
and O
new
ay
Avg. L
ane
Wid
th in f
eet
Undiv
ided
Div
ided
and O
new
ay
Hori
zonta
l C
urv
e R
adiu
s at
Cen
terl
ine
in f
eet
All H
ighw
ay T
ypes
0 1.0 1.0 9≥ 1.50 1.25 950≥RL 4.00
1 1.5 2.0 10 1.30 1.15 1910>RL>950 (2228.2-RL)/318.3
2≤ 2.2 4.0 11 1.05 1.03 1910≤RL 1.00
12≤ 1.00 1.00 950≥RR 2.00
1910>RR>950 (RR-2864.8)/954.9
1910≤RR 1.00
fACC= fLW= fHC=
No. of
Thro
ugh
Lan
es in O
ne
Dir
ection
Undiv
ided
Div
ided
and O
new
ay
Post
Spee
d L
imit
Undiv
ided
Div
ided
and O
new
ay
Per
cent G
rade
All H
ighw
ay T
ypes
1 1.00 1.00 <65 1.42 1.18 -6 ≥ G 2.00
2 0.76 1.00 ≥65 1.00 1.00 -6<G<-2 0.5-G/4
3≤ 0.76 0.91 -2≤G 1.00
fLN= fPSL= fG=
fTOT = fACC∙fLN∙fLW∙fG∙fHC∙fPSL =
Grade
Horizontal Curve Radius
For roads with
unposted speed
limits use the
adjustment for
<65 mi/hr.
Posted Speed
Access Density
Lanes in One Direction
Lane Width

172
Table 68. AADT – Lifetime Encroachments per 1,000-ft of Bridge Railing.
AADT 4 LN
DIV
2 LN
UNDIV
1 LN
ONEWAY AADT
4 LN
DIV
2 LN
UNDIV
1 LN
ONEWAY
500 0.8 1.2 1.7 33,000 11.6 4.3
1,000 1.6 1.9 3.4 34,000 11.8 4.4
2,000 3.1 3.2 6.0 35,000 12.1 4.6
3,000 4.4 3.6 8.1 36,000 12.4 4.7
4,000 5.5 3.6 9.6 37,000 12.6 4.8
5,000 6.5 3.4 10.6 38,000 12.9 5.0
6,000 7.4 3.1 11.4 39,000 13.2 5.1
7,000 8.1 2.7 11.8 40,000 13.5 5.2
8,000 8.8 2.3 12.0 41,000 13.9 5.4
9,000 9.3 2.0 12.0 42,000 14.2 5.5
10,000 9.7 1.9 11.9 43,000 14.5 5.6
11,000 10.1 1.8 11.7 44,000 14.9 5.8
12,000 10.4 1.8 11.6 45,000 15.2 5.9
13,000 10.6 1.8 46,000 15.6 6.0
14,000 10.8 1.9 47,000 15.9
15,000 10.9 2.0 48,000 16.2
16,000 11.0 2.1 49,000 16.6
17,000 11.0 2.2 50,000 16.9
18,000 11.0 2.4 51,000 17.2
19,000 10.9 2.5 52,000 17.6
20,000 10.9 2.6 53,000 17.9
21,000 10.8 2.7 54,000 18.3
22,000 10.7 2.9 55,000 18.6
23,000 10.6 3.0 60,000 20.3
24,000 10.6 3.1 65,000 22.0
25,000 10.5 3.3 70,000 23.7
26,000 10.6 3.4 75,000 25.4
27,000 10.7 3.5 80,000 27.1
28,000 10.8 3.7 85,000 28.7
29,000 10.9 3.8 90,000 30.4
30,000 11.0 3.9 95,000
31,000 11.2 4.1 100,000
32,000 11.4 4.2 105,000
33,000 11.6 4.3 110,000
LOS ≥ D
LOS ≥ DLOS ≥ D
LOS ≥ D

173
Figure 50. AADT – Lifetime Encroachments/1,000-ft of Bridge Railing Nomograph.
110100
NMO D ENCR
1
10
100
100 1,000 10,000 100,000
NE
NC
R
AADT0 or AADTEQ )
4 LANE DIVIDED
2 LANW UNDIVIDED
1 LANE ONE WAY

174
Figure 51. Minimum Horizontal Curve Radius Based on Barrier Obstruction to the
Stopping Sight Distance Compared to AASHTO Exhibit 3-14.
0
500
1,000
1,500
2,000
2,500
3,000
3,500
4,000
4,500
25 30 35 40 45 50 55 60 65 70 75
Min
imu
m C
urv
e R
adiu
s (f
t)
Design Speed (mi/hr)
AASHTO Ex. 3-14 with e<=10%
Min. Radius Based on BarrierObstruction to SSD

175
LOW MEDIUM HIGH
Figure 52. Test Level Selection Nomograph (Risk<0.01 in 30 years for 1000 ft of bridge railing).
TL2 or TL3
TL2 or TL3 TL2 or TL3
TL4
TL4
TL4
TL5 TL5
TL5
Risk
Boundary Risk
Boundary
Risk
Boundary

176
Discussion
Implementation
The LRFD Bridge Design Specifications address the issue of the selection of the
appropriate test level for bridge railings in Chapter 13 Section 13.7.2 and the Roadside Design
Guide addresses the same issue in Chapter 7 Sections 7.3 and 7.5.[AASHTO11, AASHTO12]
Section 13.7.2 of the AASHTO LRFD Bridge Design Specification provides general
principles for selecting the appropriate test level for bridge railings. The general principles
involve using higher capacity barriers for situations where there are more trucks, higher traffic
volumes or particularly hazardous conditions. There is no precise definition of what constitutes
a “high” traffic volume or a suitably larger percentage of trucks so it is left to the designer to
make a subjective decision regarding how to apply the definitions of Section 13.7.2 to the
selection for a particular site.
Chapter 7 of the Roadside Design Guide generally defers to the AASHTO LRFD Bridge
Design Specifications with respect to the selection of an appropriate bridge railing. Section 7.3
provides general guidance on bridge railing test level selection and Section 7.5 provides
somewhat more detailed descriptions. Section 7.5 provides the following five factors that should
be considered in selecting a bridge railing:
1. Performance,
2. Compatibility,
3. Cost,
4. Field Experience and
5. Aesthetics.
Of the five factors, only the first and third (i.e., performance and cost) directly affect the
bridge railing selection with respect to the test level. The Roadside Design Guide, in Section
7.5.1, refers to the FHWA policy which requires the use of bridge railings that are crash tested
according to Report 350 or subsequent FHWA-approved guidelines such as MASH. [FHWA97a]
The FHWA policy also states that “the minimum acceptable bridge railing will be a TL3 …
unless supported by a rational selection procedure.” [FHWA97a] The selection procedures
recommended herein should satisfy the requirement for a “rational selection procedure” for using
TL2 bridge railings in particular locations on the NHS with low volumes and low percentages of
trucks.
The selection guidelines developed in this project were formulated such that they can be
inserted into Section 13.7.2 of the AASHTO LRFD Bridge Design Specification. These new
selection guidelines are consistent with the existing wording of Section 13.7.2 and could be
inserted after the definitions of the six test levels. It is expected that the AASHTO RDG will
continue to defer to the AASHTO LRFD Bridge Specification and refer users to that document
although the same guidelines could be inserted into RDG Section 7.5.1 if desired.

177
Critical Values for Design
The recommended guidelines use a risk-based method where the risk of observing a
severe or fatal crash (i.e., A+K) during the design life of the bridge railing was less than 0.01 per
1000-ft of bridge railing. Several policy decisions are inherent in this choice:
Use of risk rather than benefit-cost,
A critical value of 0.01 risk of a severe or fatal crash during the 30-year design life of
each 1,000-ft of bridge railing,
2 percent annual traffic growth and
The 30-year design life of the bridge railing.
While the recommendations assumed a risk-based method, a critical risk of 0.01 and a
design life of 30 years, these values can be changed relatively easily within the context of the
procedure outlined above. For example, switching from a risk to a benefit-cost approach is
accomplished simply by changing the version of Figure 52; likewise, changing from a risk of
0.01 to 0.02 is accomplished simply by using the appropriate figure in place of Figure 52.
Figures that can be used to modify the method type (i.e., risk or benefit cost) and critical value
(i.e., various risk or BCR values) are contained in Appendix A. Regardless of which figure is
chosen for the final procedures, the process outlined in the last section is exactly the same; only
Figure 52 needs to be changed in order to transform the selection procedures from a risk-base to
a benefit-cost based procedure or to change the critical design values. If AASHTO SCOBS and
TCRS desire to change the recommendations herein, the following replacements can be easily
made:
For New Construction
Risk of 0.005 Exchange Figure 56 for Figure 52.
Risk of 0.01 Use Figure 52 as shown (i.e., the recommended selection guidelines).
Risk of 0.02 Exchange Figure 57 for Figure 52.
Benefit-Cost Ratio of 1 Exchange Figure 58 for Figure 52.
Benefit-Cost Ratio of 2 Exchange Figure 59 for Figure 52.
Benefit-Cost Ratio of 3 Exchange Figure 60for Figure 52.
For Rehabilitation Construction
Risk of 0.005 Exchange Figure 56 for Figure 52 (i.e., same as for new construction).
Risk of 0.01 Use Figure 52 as shown (i.e., the recommended selection guidelines).
Risk of 0.02 Exchange Figure 57 for Figure 52(i.e., same as for new construction).
Benefit-Cost Ratio of 1, 2, or 3
o Consideration of upgrading from R350 TL4 Exchange Figure 61 for Figure 52.
o Consideration of upgrading from R350 TL3 Exchange Figure 62 and/or Figure
63for Figure 52.
Notice that the selection guidelines are exactly the same for new and rehabilitation
construction if a risk-based procedure is used. If a benefit-cost procedure is chosen there will be
different versions of the selection figure for new construction versus rehabilitation construction.

178
The cost-benefit rehabilitation selection figures assume that a Report 350 TL3 or TL4 bridge
railing is already in-place and must be demolished and replaced by either a MASH TL4 or TL5
bridge railing.
Test Levels Considerations
Currently, FHWA requires that roadside hardware developed and tested after January 1,
2011 be evaluated according to the AASHTO MASH but still allows the use of hardware
designed, tested and accepted under Report 350. [AASHTO09] In developing bridge railing
selection guidelines, therefore, there is some ambiguity since new hardware will be evaluated
under the MASH criteria but existing hardware tested under Report 350 can and likely will still
be used on new or retrofit construction.
Table 69 shows a list of the TL2 through TL5 impact conditions for both the Report 350
and MASH longitudinal barrier crash tests arranged in order of increasing impact severity. One
of the difficulties resolved by MASH was that the nominal impact severity of TL3 and TL4 in
Report 350 had converged to about 100 ft-kips under Report 350. The MASH TL4 tests were
increased in severity, particularly for TL4, in order to provide a broader range of selection
options. One of the results is that MASH TL4 barriers generally need to be at least 36-inches tall
rather than the 32-inch height that was common for Report 350 TL4.
Table 69. Comparison of Impact Conditions for Report 350 and MASH ordered by
Impact Severity.
Test
Vehicle
Mass Speed Angle
Nominal
Impact
Severity
Typical
Barrier
Height
lbs mi/hr deg ft-kips in.
R350 TL2 4,409 44 25 50 24
MASH TL2 5,004 44 25 57 Unk
R350 TL4 17,637 50 15 98 32
R350 TL3 4,409 62 25 102 27
MASH TL3 5,004 62 25 116 31
MASH TL4 22,046 56 15 155 36
R350 TL5 79,367 50 15 441 42
MASH TL5 79,367 50 15 441 42
One of the interesting features of developing both the benefit-cost and risk based
selection guidelines is that Report 350 TL2 and TL3 and MASH TL3 bridge railings tend to
overlap each other. The reason that they overlap is that there is a great deal of performance
overlap and relatively little difference in cost. As a result, the TL2 bridge railings generally
always appear since the performance difference is small and the cost is slightly less (i.e., even in
the risk-based criteria, the least costly railing that meets the risk criteria is the preferred
alternative). There are few TL2 bridge railings that were designed and specifically crash tested to
the Report 350 TL2 conditions and none at this time to the MASH TL2 conditions. For example,

179
the AASHTO-ARTBA-AGC Guide to Bridge Railings currently contains one concrete and one
wood railing that were designed for Report 350 TL2.[TF1313] The construction costs of these
new TL2 railings are not well documented since there have only been a handful of installations
constructed. Similarly, there is virtually no field crash data experience available so the values
used in RSAPv3, while reasonable estimates, cannot be validated with field crash data. There
are also a number of older bridge railings that were tested under the AASHTO Guide
Specifications for Bridge Railings for PL1 that were “grandfathered” into TL2 when Report 350
was adopted. TL2, as shown in these recommended selection guidelines, can be interpreted as
any crash tested bridge railing with a height of less than 27 inches. The recommended selection
guidelines offered earlier show TL2 in the recommendations, although SCOBS T-7, TCRS and
FHWA may rather change it to MASH TL3 as a policy matter until more data is available on the
field performance of these bridge railings.
The Risk Line
Figure 52, as well as its alternate versions in Figure 56 and Figure 57, show a dashed line
that indicates the point where even a MASH TL5 bridge railing does not satisfy the selected risk
criteria. The line was included so that it is clear to users that the desired criteria could not be met
even with a TL5 bridge railing.
It is tempting to consider the risk line a de facto indication that a MASH TL6 bridge
railing should be used when the point plots above the risk line. In fact, however, a point plotting
above the risk line can be interpreted in several different ways including:
The assumptions built into the development of the process may have been
violated,
There are traffic or roadway conditions that may need to be examined more
closely before making a bridge railing selection or
A TL6 bridge railing may be appropriate.
Knowing which of these situations apply requires some further examination as described
in the following sections. Regardless of whether a point plots above the risk line or outside the
boundary of the figure chosen for the LRFD, Step 6 in the selection guidelines was added to
provide some guidance to engineers who encounter situations where the guidelines may not be
appropriate for use.
The selection figures were developed using RSAPv3 and the encroachment model in
RSAPv3 assumes that traffic is generally in a free-flowing condition. This has been interpreted
to mean that the level of service is at least C or better. Of course sites with poor levels of service
do not operate at those levels at all hours. A particular highway might have a level of service of
D or F in peak hours but operate at B or even A conditions at the off-peak hours. At this time it
simply not known what the effect of degraded levels of service are on the encroachment models
so the predictions from RSAPv3 may not be reliable. Further research is needed to determine
how the encroachment relationships change at high traffic volumes and levels of service of D or
E.

180
If the traffic volumes for a particular highway type result in a level of service of D or
greater, the resulting selection may plot above the risk boundary. To prevent this from
happening, Figure 50 and Table 68 were constructed such that each line representing a highway
type ends at the AADT corresponding to the transition from level of service C to D for 40
percent trucks. The engineer is also told explicitly in step 2b not to extrapolate to the right of the
highway-type lines because doing so will violate the basic assumptions used to develop the
tables. If a particular AADT plots to the right of the highway-type line, the user is directed to
step 6 for advice. A selection above the risk boundary should not be the result of poor level of
service as long as the user has followed the instructions in step 2.
More important is the fact that the risk line indicates that there are probably other issues
related to the site or traffic conditions which a simple choice of bridge railing test level may not
adequately address. The selection figures use the expected number of life-time encroachments
on a 1,000-ft section, the percent of trucks and the hazard environment as input to select a bridge
railing. If a particular bridge situation plots above the risk line or outside the boundary of the
figure then the combination of these three input values have resulted in a situation where one of
the other inputs should be considered for change.
The hazard environment determines which figure is used in the selection process. The
hazard environment is determined based on the character of the area beneath and around the
bridge. Changing the hazard environment is generally not a feasible alternative since it involves
land use outside the typical DOT’s right of way and control or very expensive changes to the
transportation infrastructure. For example, a gasoline tank farm may be located beneath a bridge
causing the hazard environment to be categorized as a high. While moving the tank farm is a
theoretical possibility it is probably not practical due to the expense involved as well as the need
to coordinate and collaborate with private property owners and a variety of local agencies. For
these types of reasons, changing the hazard environment is generally not an option.
Sometimes selections below the risk boundary could be made if the percent trucks were
reduced thereby moving the plot point to the left. If a particular bridge plots above the hazard
line the engineer may want to consider if the high percentage of truck traffic is desirable at the
site and if there are ways to reduce the truck traffic in the long term. Returning to the tank farm
example, if the site experienced 30 percent trucks and was located in a heavily urban area it
might make sense to consider redirecting truck through-traffic to another route to avoid the high
hazard areas (e.g., loop route around urban area). Reducing the percent trucks from 30 to 10
may be enough to reduce the risk below the risk line. Obviously, this alternative has
consequences far afield from the consideration of the one bridge under consideration since it
would involve a change in the operation of the highway network and how traffic is managed.
Probably the most important consideration, however, is to examine why so many
encroachments are predicted at the site. There are several possible reasons for predicting a large
number of encroachments including (1) very high traffic volumes and/or (2) geometric
characteristics that result in large adjustments. The adjustment factors can increase the expected
number of encroachments dramatically. For example, if a one-way ramp has a radius of
horizontal curvature of 950 ft, a six percent downhill grade and a speed limit of 45 mi/hr, Table
67 indicates an encroachment adjustment of 9.44 is needed. This is a very high adjustment

181
indicating that the geometry of the roadway may be very challenging. This adjustment applied to
encroachments for a moderate AADT could well place the site above the risk boundary. The
engineer should seriously consider addressing the curvature and grade of the site to reduce the
number of encroachments expected and bring the site conditions below the risk boundary.
While a MASH TL6 bridge railing might be appropriate for some conditions above the
dotted risk line, there is at present only one crash tested TL6 bridge railing, the 90-inch tall TX
T80TT bridge railing. [TXDOT13] This bridge railing requires the use of non-standard deck
details since the dead-load of the bridge railing and overturning resistance are so large. Because
it cannot be used on a conventional deck it is not generally a viable option for most bridge
construction projects. Before selecting a TL6 bridge railing, the engineer will need to carefully
examine the structural characteristics of the deck and bridge structure as well as traffic and site
conditions to determine if a TL6 bridge railing is a realistic alternative. There is no guaranteed
that even if a TL6 bridge railing is used it will satisfy the risk criteria since sometimes the added
risk is a result of very high traffic volumes and passenger vehicle redirection-rollovers which are
likely not improved with a TL6 bridge railing.
As these examples illustrate, when a point plots above the risk boundary in Figure 52
reducing the risk will almost always involve a more comprehensive approach than simply
selecting a bridge railing. Reducing the risk may involve highway geometric design, traffic
operations and management, structural design of the bridge deck and superstructure as well as
the selection of a bridge railing.
Recommended Selection Guidelines Verification
The 1989 AASHTO Guide Specification to Bridge Rails, NCHRP Report 22-08 and a
series of example problems were reviewed and compared to the recommended procedure as a
verification exercise.
Comparisons to the 1989 AASHTO Guide Specification and NCHRP 22-08
The 1989 AASHTO Guide Specification for Bridge Railings and the selection guidelines
that were prepared in NCHRP 22-08 have been converted to the same format as the proposed
selection guidelines for comparison purposes. These converted tables are shown in Figure 53 on
the left side. While the purpose of this project is not to mimic the 1989 AASHTO GSBR
guidelines, those earlier guidelines do provide some insight into what roadside safety engineers
in the past have considered “reasonable” selection guidelines. The proposed selection guidelines
from this project are compared to the 1989 GSBR and the NCHRP 22-08 selection guidelines to
gauge how these new guidelines compare to what was accepted to some degree in the past.
Figure 53 shows the recommended risk figure for a medium hazard in the center overlaid
on the 1989 GSBR guidelines. It appears the recommendations from this research are slightly
more conservative than the 1989 GSBR for a lifetime risk of 0.01. Figure 53 also shows the risk
of 0.03, which more closely matches the 1989 GSBR guidelines. Figure 54 provides a
comparison of the GSBR with the recommended BCR approach. Figure 55 directly compares
the GSBR selection guidelines, the recommended risk-based approach and the corresponding
cost-benefit approach.

182
Each of these tables have underlying assumptions and adjustments which cannot be
captured in a straight-forward comparison of the charts. Furthermore, the GSBR was developed
using bridge rails designed to a different performance specification. While no official crash test
equivalencies have been released to compare Report 350 and MASH test level, Table 70 was
originally released by the FHWA to compare the GSBR performance levels with Report 350 and
was expanded to add the first line to represent the approximately equivalencies for MASH test
levels.
Table 70. Approximate Crash Test Acceptance Equivalencies. [after Horne97]
Bridge Railing
Testing Criteria
Acceptance Equivalencies
MASH TL1 TL2 TL3 TL4 TL5 TL6
Report 350 TL1 TL2 TL3 TL4 TL5 TL6
Report 230 MSL-1
MSL-2†
1989 AASHTO Guide Spec PL1 PL2 PL3
AASHTO LRFD Bridge Spec PL1 PL2 PL3
† This is the performance level usually cited when describing a barrier tested under NCHRP Report 230. It is
close to TL3 but adequate TL3 performance cannot be assured without a pickup truck test.
Each of these guidelines has been used to evaluate a series of example problems where
the bridge rail is already in place as a verification exercise.
Example Bridge Railing In Service
Table 71 shows several example bridge railings along with the characteristics of the site,
traffic conditions and the type of bridge railings currently installed at the bridge. These
examples are meant to compare what some agencies currently have installed and compare the
current installation to the bridge railings selected by the recommended procedure and the 1989
GSBR. Table 71 also serves as a verification exercise since the bridge railing selection
determined from the recommended procedure is compared to the result recommended by an
independent RSAPv3 analysis. While the recommended selection guidelines are based on
numerous RSAPv3 simulations, the results were re-formulated, rearranged and simplified to
develop the recommended procedure so it was important to verify that the final procedure was
consistent with individually generated results from RSAPv3. As shown in Table 71, the
recommended selection guidelines produce the same or slightly more conservative results than
performing an RSAPv3 analysis. This verification exercise was completed for each risk level
and benefit-cost ratio presented in the alternate figures shown in Appendix A.

183
1989 GSBR and 22-08 Findings Risk≤0.01 overlaid on 89GSBR Risk≤.03 overlaid on 89GSBR
Figure 53. Comparison of 89GSBR, NCHRP22-08 with Risk values.
MASH TL5
MASH TL4
GSBR PL3
MASH TL5
MASH TL4
MASH TL2
GSBR PL2
MASH TL2
GSBR PL1
22-08 PL1/PL2
breakline
22-08 PL2/PL3
breakline
22-08
GSBR
89GSBR PL1/PL2
breakline
89GSBR PL2/PL3
breakline
89GSBR PL2/PL3
breakline
89GSBR
PL1/PL2
breakline

184
1989 GSBR and 22-08 Findings BCR=2 overlaid on 89GSBR BCR=5 overlaid on 89GSBR
Figure 54. 89GSBR, NCHRP22-08 with BCR values.
MASH TL5
GSBR PL3
GSBR PL2
MASH TL2
GSBR PL1
22-08 PL1/PL2
breakline
22-08 PL2/PL3
breakline
22-08
GSBR
MASH TL5
MASH TL2
89GSBR PL1/PL2
breakline
89GSBR PL2/PL3
breakline
89GSBR PL2/PL3
breakline
89GSBR
PL1/PL2
breakline

185
A. MASH TL2 satisfies risk and cost-
benefit criteria.
B. MASH TL2 satisfies risk criteria,
MASH TL3 is cost-beneficial.
C. MASH TL2 satisfies risk criteria,
MASH TL4 is cost-beneficial.
D. MASH TL4 satisfies risk criteria,
MASH TL2 is cost-beneficial.
E. MASH TL4 satisfies risk criteria,
MASH TL3 is cost-beneficial.
F. MASH TL4 satisfies risk criteria,
MASH TL4 is cost-beneficial.
G. MASH TL4 satisfies the risk
criteria, MASH TL5 is cost-
beneficial.
H. MASH TL5 satisfies the risk
criteria, MASH TL5 is cost-
beneficial.
A-F comparable to 89GSBR PL1
G comparable to 89 GSBR PL2
H is comparable to 89 GSBR PL3
1989 GSBR overlaid on findings Risk≤0.01 and BCR=2 Comparison of Risk and CBR tables
Figure 55. 89GSBR, Risk and BCR comparison.
G
A
D
C B
E F
H
A
D
C B
E F
H
G

186
Table 71. Selected Examples of Existing Bridge Railings Compared to the Recommended Selection Guidelines.
Characteristics Photograph
ADT =1,710 vpd
Currently Installed PT =22%
1989 AASHTO GSBR PL1 Haz. Env. = Low
RSAP Procedure Grade = +/-4%
Risk<0.005 MASH TL4 MASH TL4 Curv. Rad. = Tangent
Risk<0.010 MASH TL4 MASH TL4 Acc. Pts. = 0
Risk<0.020 MASH TL4 MASH TL2/3 Shldr = 4 ft
BCR=1 MASH TL3 MASH TL5 No. Prim. Lns. = 1
BCR=2 MASH TL3 MASH TL3 PSL = 50 mi/hr
BCR=3 MASH TL3 MASH TL3 fTOT = 2.13
NECNR = 3.1
Characteristics Photograph
ADT =3,780 vpd
PT = 15%
Currently Installed Haz. Env. = Low
1989 AASHTO GSBR PL2 Grade = Flat
RSAP Procedure Curv. Rad. = Tangent
Risk<0.005 MASH TL4 MASH TL4 Acc. Pts. = 2
Risk<0.010 MASH TL4 MASH TL4 Shldr = 7 ft
Risk<0.020 MASH TL4 MASH TL4 No. Prim. Lns. = 1
BCR=1 MASH TL4 MASH TL5 PSL = 55 mi/hr
BCR=2 MASH TL4 MASH TL4 Length = 170 ft
BCR=3 MASH TL4 MASH TL3 fTOT = 3.12
NECNR = 3.6
ME SR140 over the Androscoggin River in Canton ME
Rt 15 over the Piscataquis River in Guilford ME. There
are intersections on each end of the bridge
Location
UNDIVIDED HIGHWAYS
Location
R350 TL4 2-bar NETC
Obsolete

187
Table 71. Selected Examples of Existing Bridge Railings Compared to the Recommended Selection Guidelines. (continued)
Characteristics Photograph
ADT =25,428 vpd
PT = 5%
Currently Installed Haz. Env. = Low
1989 AASHTO GSBR PL2 Grade = Flat
RSAP Procedure Curv. Rad. = Tangent
Risk<0.005 MASH TL2 MASH TL2 Acc. Pts. = 0
Risk<0.010 MASH TL2 MASH TL2 Shldr = 2 ft
Risk<0.020 MASH TL2 MASH TL2 Sidewalk = 5 ft
BCR=1 MASH TL2 MASH TL3 No. Prim. Lns. = 2
BCR=2 MASH TL2 MASH TL3 PSL = 50 mi/hr
BCR=3 MASH TL2 MASH TL3 fTOT = 1.08
NECNR = 3.3
Characteristics Photograph
ADT =11,555 vpd
PT = 8%
Currently Installed Haz. Env. = High
1989 AASHTO GSBR PL2 Grade = Flat
RSAP Procedure Curv. Rad. = Tangent
Risk<0.005 MASH TL4 MASH TL4 Acc. Pts. = 2
Risk<0.010 MASH TL4 MASH TL4 Shldr = 2 ft
Risk<0.020 MASH TL4 MASH TL4 Sidewalk = 5 ft
BCR=1 MASH TL4 MASH TL5 No. Prim. Lns. = 2
BCR=2 MASH TL3 MASH TL4 PSL = 50 mi/hr
BCR=3 MASH TL2 MASH TL3 fTOT = 2.3
NECNR = 1.8
SR 20 over the French River in Oxford MA
SR 122A over SR 146, a railroad yard and bikepath in
Worcester MA
Unknown
R350 TL4 Vertical Wall
Location
UNDIVIDED HIGHWAYS
Location

188
Table 71. Selected Examples of Existing Bridge Railings Compared to the Recommended Selection Guidelines. (continued)
Characteristics Photograph
ADT =48,500 vpd
PT =10%
Currently Installed Haz. Env. = Low
1989 AASHTO GSBR PL2 Grade = Flat
RSAP Procedure Curv. Rad. = Tangent
Risk<0.005 MASH TL4 MASH TL4 Acc. Den. = 0 pts/mi
Risk<0.010 MASH TL4 MASH TL4 Rt. Shldr = 12 ft
Risk<0.020 MASH TL4 MASH TL4 Lt. Shldr = 2 ft
BCR=1 MASH TL4 MASH TL5 No. Prim. Lns. = 2
BCR=2 MASH TL4 MASH TL4 Med. Width = 190 ft
BCR=3 MASH TL4 MASH TL4 fTOT = 1.00
NECNR = 16.4
Characteristics Photograph
ADT =59,450 vpd
PT =15%
Currently Installed Haz. Env. = Medium
1989 AASHTO GSBR PL3 Grade = Flat
RSAP Procedure Curv. Rad. = Tangent
Risk<0.005 MASH TL5 MASH TL5 Acc. Den. = 0 pts/mi
Risk<0.010 MASH TL5 MASH TL5 Rt. Shldr = 10 ft
Risk<0.020 MASH TL5 MASH TL5 Lt. Shldr = 12 ft
BCR=1 MASH TL5 MASH TL5 No. Prim. Lns. = 2
BCR=2 MASH TL5 MASH TL5 Med. Width = 27 ft
BCR=3 MASH TL5 MASH TL5 fTOT = 1.00
NECNR = 20.3
Location
I-190 over Princeton Rd in Sterling MA
R350 TL4 F Shape
New Jersey Turnpike over SR 30 in NJ
R350 TL4 NJ w/ top rail
DIVIDED HIGHWAYS
Location

189
Table 71. Selected Examples of Existing Bridge Railings Compared to the Recommended Selection Guidelines. (continued)
Characteristics Photograph
ADT =6,280 vpd
PT =2%
Currently Installed Haz. Env. = High
1989 AASHTO GSBR PL2 Grade = -4%
Risk<0.005 MASH TL5 MASH TL5 Curv. Rad. = 300 ft
Risk<0.010 MASH TL5 MASH TL5 Acc. Den. = 0 pts/mi
Risk<0.020 MASH TL5 MASH TL4 Rt. Shldr = 2 ft
BCR=1 MASH TL4 MASH TL5 Lt. Shldr = 2 ft
BCR=2 MASH TL4 MASH TL5 No. Prim. Lns. = 1
BCR=3 MASH TL3 MASH TL5 fTOT = 7.08
NECNR = 10.2
R350 TL4 NJ
I-290 Exit 15 Ramp over Shrewsbury Street, Worcester
MA
Location
ONE WAY HIGHWAYS

190

191
CONCLUSIONS
The objective of this project was to develop recommended guidelines for the selection of
Test Levels 2 through 5 bridge rails considering in-service performance, site and traffic
conditions such as traffic volume, percent trucks and land use under and around the bridge.
Currently, only general guidance is available from FHWA and AASHTO on when to use one of
the six test levels identified in MASH. State DOT policy makers, bridge engineers and highway
designers have little basis for their decisions aside from the general philosophical guidance
contained in Chapter 7 of the Roadside Design Guide and Chapter 13 of the AASHTO LRFD
Bridge Design Specifications. This project filled that gap using a risk-based approach based on
risk and cost-benefit analyses performed with version 3.0.1 of the Roadside Safety Analysis
Program (RSAPv3). The results of this project were selection guidelines for choosing the
appropriate test level for bridge railings based on site and traffic conditions as well as the
observed crash performance of common bridge railings. These selection guidelines, as presented
earlier, will be useful to designers and State DOTs for selecting the appropriate bridge railings
based on particular site conditions.
The resulting selection guidelines are based on the risk of observing a severe or fatal
crash during the 30-year life of the bridge railing less than or equal to 0.01 for a 1000-ft long
bridge railing. The guidelines explicitly use the traffic volume and percent of trucks as well as
the geometric characteristics of the bridge like the horizontal curvature, grade and number of
lanes to estimate the likely number of vehicles that will leave the travelled way and strike the
bridge rail. The crash performance characteristics of modern crash tested bridge railings were
included by examining and modeling real-world crash data to predict the occupant injury, post-
impact trajectory and probability of penetrating, rolling over or vaulting over the bridge railing.
The area around and surrounding the bridge has been characterized into three categories: low
hazard, medium hazard and high hazard. Low hazard areas are those where penetrating the
bridge railing places only the occupants of the impacting vehicle at risk whereas high hazard
areas have the potential for catastrophic loss of life. The selection guidelines use these
characteristics of the bridge, traffic and surrounding area as input and present a recommendation
for the appropriate MASH test level bridge railing that will result in a risk equal to or less than
0.01 of observing a severe or fatal crashes over the 30-year life of 1,000-ft of the bridge. These
selection guidelines, therefore, make choosing the appropriate bridge railing a function of the
characteristics of the bridge and the potential for catastrophic harm if the bridge railing is
penetrated.
In developing these selection guidelines several areas for improvement were identified
that would require further research. First, little is known about the nature and character of
vehicle encroachment at high traffic volumes, especially as service level conditions degrade from
the free-flow. A better understanding of encroachment rates at poor service level conditions and
high traffic volumes would help make these guidelines applicable to a broader range of traffic
conditions, especially on heavily travelled urban corridors. Second, there is relatively little
known about the encroachment characteristics of heavy vehicles. This project used what little

192
data is available to estimate the encroachment rates and trajectories of heavy vehicles but there is
a need for a more comprehensive approach to predicting the frequency and extent of heavy
vehicle encroachments. This research was focused exclusively on selecting an appropriate
bridge railing but it is also important to ensure that the guardrail-bridge rail transitions, approach
guardrail and terminals are also adequately designed. Ultimately, the designer is responsible for
the complete safety system on the bridge not just the selection of the bridge railing test level so
further research aimed at better specifying how these test level selections should be integrated
with the transitions and approach guardrails is a logical next step. While additional research in
these areas would help to extend the applicability of these selection guidelines, the guidelines
presented herein are a good first step since they should adequately account for the majority of
bridge railing selection situations.

193
APPENDIX A: ALTERNATIVE GRAPHS FOR FIGURE 52

194

195
LOW MEDIUM HIGH
Figure 56. Test Level Selection Nomograph (Risk<0.005 in 30 years for 1000 ft of bridge railing).
TL2 or TL3 TL2 or TL3 TL2 or TL3
TL4
TL4 TL4
T
TL5 TL5
TL5
Risk
Boundary Risk
Boundary
Risk
Boundary

196
LOW MEDIUM HIGH
Figure 57. Test Level Selection Nomograph (Risk<0.02 in 30 years for 1000 ft of bridge railing).
TL2 or TL3
TL2 or TL3
TL2 or TL3
TL4
TL4
TL4
TL5 TL5 TL5
Risk
Boundary
Risk
Boundary Risk
Boundary

197
LOW MEDIUM HIGH
Figure 58. Test Level Selection Nomograph (Benefit-Cost Ratio=1).
TL2 TL2
TL4
TL4
TL4
TL5
TL5
TL5
TL3
TL3

198
LOW MEDIUM HIGH
Figure 59. Test Level Selection Nomograph (Benefit-Cost Ratio=2).
TL2
TL2
TL2
TL4
TL4
TL4
TL5 TL5
TL5
TL3
TL3

199
LOW MEDIUM HIGH
Figure 60. Test Level Selection Nomograph (Benefit-Cost Ratio=3).
TL2 TL2
TL2
TL4
TL4
TL4
TL5
TL5
TL5
TL3
TL3

200
BCR=1 BCR=2 BCR=3
Figure 61. Rehabilitation Nomograph: Upgrade from R350 TL4 to MASH TL5.*
A: In this region, upgrade for all hazard levels. *NOTE: It is not cost-beneficial to upgrade from a R350 TL4 to
a MASH TL4.
B: In this region, upgrade for high or median hazard levels
C: In this region, upgrade for high hazard levels.
D: Do not upgrade in this region.
A
B
C
A
B
C
A
B
C
D D
D

201
BCR=1 BCR=2 BCR=3
Figure 62. Rehabilitation Nomograph: Upgrade from R350 TL3 to MASH TL4 or MASH TL5.*
A: In this region, upgrade for all hazard levels. *NOTE: When a double line is present, the bottom line
represents when it is cost-beneficial to upgrade to a
TL4 barrier, where the top line represents when it is
cost-beneficial to upgrade to the TL5 barrier.
B: In this region, upgrade for high or median hazard levels
C: In this region, upgrade for high hazard levels.
D: Do not upgrade in this region.
A
B
C
A
B
C
A
B
C
D D D

202
BCR=1 BCR=2 BCR=3
Figure 63. Rehabilitation Nomograph: Upgrade from R350 TL3 to MASH TL5.
A: In this region, upgrade for all hazard levels.
B: In this region, upgrade for high or median hazard levels
C: In this region, upgrade for high hazard levels.
D: Do not upgrade in this region.
A
B
C
A
B
C
A
B
C
D D
D

203
APPENDIX B: BRIDGE RAIL SELECTION GUIDELINES

204

205
The following section presents the recommended selection guidelines and the process for
the application of the guidelines for the selection of MASH TL2 though TL5 bridge railings. A
risk approach applicable to new construction, rehabilitation and retrofitting is recommended. An
alternative cost-benefit approach is provided and discussed following the presentation of the
process. A discussion of the process and the policy decisions necessary for implementation are
also contained later in this section.
Appendix B includes only the process, without any discussion. Appendix B is presented
in a format that could be inserted directly into the AASHTO LRFD Bridge Design Specification
or the Roadside Design Guide.
Bridge Rail Risk Assessment Process
The selection of the appropriate MASH test level bridge railing for new or rehabilitation
construction is dependent on site-specific conditions and results may differ for each side of the
bridge. This process, therefore, should be followed for each bridge edge.
These selection procedures only apply to the bridge railing itself. Providing appropriate
guardrail-bridge rail transitions, adequate guardrail approaches, and appropriate terminals and
crash cushions are also important considerations in the complete safety performance of the
bridge. Users should refer to the AASHTO Roadside Design Guide for guidance on appropriate
transitions, approach guardrails and terminals.
The following selection guidelines include six parts: (1) determine the anticipated
construction year traffic volume (AADT); (2) estimate the total encroachments expected over the
30-year life of a 1,000-ft section of the bridge; (3) adjust the expected number of encroachments
for site-specific conditions; (4) select the test level from the appropriate chart; (5) additional
considerations; and (6) if guidelines do not apply. These steps are described in full below.
7. Traffic Conditions – Determine the anticipated construction year traffic volume (AADT)
and percent trucks (PT). These selection guidelines assume an annual traffic growth rate
of 2% per year and a design life of 30 years. If the anticipated growth rate or design life
are significantly different, use the following equation to compute the equivalent
construction year traffic volume for use in these selection guidelines:
where:
AADT0 = The anticipated construction year bi-directional traffic volume (use the
one-way traffic volume for one-way roads and ramps),
AADTEQ = The equivalent construction year bi-directional traffic volume,
G = The anticipated annual traffic growth rate where 0≤G≤1.
L = The design-life of the bridge railing in years.

206
8. Encroachments – Estimate the total number of encroachments (NENCR) that will be
experienced on a 1,000-ft section of the bridge railing during the life of the bridge railing
by entering Table 68 or Figure 50 with the bi-directional construction year AADT from
Step 1 and the highway type.
a. Do not proportion the value of NENCR based on the length of the bridge. The
entire method is based on a per 1,000-ft basis.
b. If the AADT of interest falls to the right of the end of the curve for the desired
highway type, the level of service for the highway is likely D or worse and these
procedures cannot be used; refer to step 6.
9. Site Conditions – Determine the site-specific adjustment factors for the bridge under
consideration using the adjustment factors shown in Table 67. Multiply all the
adjustments from Table 67 together to obtain fTOT. Find the modified total number of
encroachments (NMOD ENCR) either by:
a. Drawing a horizontal line in Figure 50 until the curve corresponding to fTOT is
obtained (interpolation between lines is acceptable) then reading down to the
horizontal axis for the value of the modified total number of encroachments
(NMOD ENCR) on 1,000-ft of bridge railing over the 30-year life of the bridge railing
or
b. Multiplying the estimated encroachments (NENCR) from Table 68 by the total
adjustments (fTOT) from Step 2 to obtain the modified total number of
encroachments (NMOD ENCR) on 1,000-ft of bridge railing over the 30-year life of
the bridge railing.
10. Test Level Selection – Characterize the hazard environment under the bridge as high,
medium or low according to the following definitions:
HIGH: A high hazard environment below the bridge includes possible interruption
to regional transportation facilities (i.e., high-volume highways, transit and
commuter rail, etc.) and/or interaction with a densely populated area below
the bridge. Penetrating the railing may limit or impose severe limitations
on the regional transportation network (i.e., interstates, rail, etc.).
Penetrating the railing also has the possibility of causing multiple fatalities
and injuries in addition to the injuries associated with the vehicle
occupants. A high-hazard environment is also present if penetration or
rolling over the bridge railing could lead to the vehicle damaging a critical
structural component of the bridge (e.g., a through-truss bridge).
MEDIUM: A medium hazard environment below the bridge includes possible
interruption to local transportation facilities, large water bodies used for the
shipment of goods or transportation of people, and/or damage to an urban
area which is not densely populated. Penetrating the railing would limit

207
local transportation routes, however, detours would be possible and
reasonable. Penetrating the railing has the possibility of causing at least
one non-motor vehicle injury or fatality.
LOW: A low hazard environment below the bridge includes water bodies not used
for transportation, low-volume transportation facilities, or areas without
buildings or houses in the vicinity of the bridge. Penetrating a low hazard
railing would have little impact on regional or local transportation facilities.
A low hazard railing has no buildings or facilities in the area which present
possible non-motor vehicle related victims of a rail penetration.
Choose the hazard environment most applicable to the bridge under consideration.
Enter the appropriate chart in Figure 52 for the hazard environment selected above, the
modified lifetime encroachments per 1,000-ft of bridge edge (NMOD ENCR) from Step 3,
and the percent trucks (PT) from Step 1 to select the appropriate MASH test level for the
bridge railing. If the point plots above the dashed risk boundary these charts cannot be
used and the engineer should refer to step 6.
11. Additional Considerations – The bridge railing selected using this process provides a
solution where the risk of observing a severe or fatal injury crash over the design-life of
the bridge railing should be less than 0.01 when the specific site conditions evaluated
(i.e., traffic volume and mix, geometry, posted speed limit, and access density) are
considered. Engineering judgment should be used when unusual or difficult to
characterize site conditions are encountered when selecting a bridge railing. Limited
numbers of crash tested bridge railings are available at some test levels, therefore, it is
possible that the recommended test level barrier for the evaluated site conditions may not
be the best choice for some site conditions not explicitly addressed in these selection
guidelines. For example, the particular layout of the barrier at the end of a ramp may
influence intersection sight distances and require the use of engineering judgment in
designing the interchange to determine an appropriate barrier as it approaches the
intersection. Another example might be the presence of pedestrians or bicyclists which
might benefit from a higher or different type of railing or the use of sidewalks. Some of
the factors that should also be considered are:
a. TL5 bridge railings may be appropriate for specially designated hazardous
material or truck routes.
b. Intersection sight distance obstructions created by higher test level bridge railings
at the ends of ramps or bridges should be considered and the bridge railings may
require transitioning to a lower height approaching the intersection.
c. Stopping sight distance on bridges where the radius and design speed plot below
the dashed line in Figure 51 may limit the use of higher test level bridge railings.
d. The presence of pedestrians, bicyclists, snowmobiles, all-terrain vehicles and
other recreational vehicles may affect the choice of bridge railing.

208
e. Crash history especially as it relates to heavy vehicle crashes or bridge rail
penetrations may justify higher performance bridge railings.
f. Regional concerns about snow removal, hydrological impact of flood waters
flowing over the bridge, and maintaining scenic views may also play a role in the
selection of bridge railings beyond these selection guidelines.
g. The capacity of the bridge deck may limit the choices available for higher test
level bridge railings on rehabilitation projects.
12. Guidelines Do Not Apply – There are some situations where these guidelines should not
be used, namely:
a. The traffic conditions violate the free traffic flow assumption used in developing
the guidelines such that the estimate of the number of encroachments is not
reliable. Generally, this results from a plot point in Figure 50 that is to the right
of the end of the highway-type line. This indicates that the level of service may
be D or worse and the basic assumptions of the method are invalid.
b. The user may find that the selection plots above the boundary of Figure 52. In
such a case the following options should be considered:
i. Can the traffic operational conditions (i.e., AADT and percent trucks) be
reduced?
ii. Are the roadway characteristics (e.g., horizontal curvature, grade, etc.)
resulting in large adjustments to the NENCR? Can the geometry be
modified to reduce the adjustments?
iii. Can the deck and superstructure support a TL6 bridge railing?
These situations require a more detailed analysis of the site conditions that examines a
broader range of alternatives beyond just the bridge railing test level selection. A
solution will probably require the collaboration of traffic operations, geometric design
and bridge railing design engineers to either modify the traffic or geometry conditions of
the bridge such that these guidelines can be used or perform a crash history investigation
to determine the actual performance of the existing bridge railing.

209
Table 67. Encroachment Adjustments.
Num
ber
of
Acc
ess
Poin
ts o
n
Bri
dge
or
within
200 f
t of
eith
er e
nd
Undiv
ided
Div
ided
and O
new
ay
Avg. L
ane
Wid
th in f
eet
Undiv
ided
Div
ided
and O
new
ay
Hori
zonta
l C
urv
e R
adiu
s at
Cen
terl
ine
in f
eet
All H
ighw
ay T
ypes
0 1.0 1.0 9≥ 1.50 1.25 950≥RL 4.00
1 1.5 2.0 10 1.30 1.15 1910>RL>950 (2228.2-RL)/318.3
2≤ 2.2 4.0 11 1.05 1.03 1910≤RL 1.00
12≤ 1.00 1.00 950≥RR 2.00
1910>RR>950 (RR-2864.8)/954.9
1910≤RR 1.00
fACC= fLW= fHC=
No. of
Thro
ugh
Lan
es in O
ne
Dir
ection
Undiv
ided
Div
ided
and O
new
ay
Post
Spee
d L
imit
Undiv
ided
Div
ided
and O
new
ay
Per
cent G
rade
All H
ighw
ay T
ypes
1 1.00 1.00 <65 1.42 1.18 -6 ≥ G 2.00
2 0.76 1.00 ≥65 1.00 1.00 -6<G<-2 0.5-G/4
3≤ 0.76 0.91 -2≤G 1.00
fLN= fPSL= fG=
fTOT = fACC∙fLN∙fLW∙fG∙fHC∙fPSL =
Grade
Horizontal Curve Radius
For roads with
unposted speed
limits use the
adjustment for
<65 mi/hr.
Posted Speed
Access Density
Lanes in One Direction
Lane Width

210
Table 68. AADT – Lifetime Encroachments per 1,000-ft of Bridge Railing.
AADT 4 LN
DIV
2 LN
UNDIV
1 LN
ONEWAY AADT
4 LN
DIV
2 LN
UNDIV
1 LN
ONEWAY
500 0.8 1.2 1.7 33,000 11.6 4.3
1,000 1.6 1.9 3.4 34,000 11.8 4.4
2,000 3.1 3.2 6.0 35,000 12.1 4.6
3,000 4.4 3.6 8.1 36,000 12.4 4.7
4,000 5.5 3.6 9.6 37,000 12.6 4.8
5,000 6.5 3.4 10.6 38,000 12.9 5.0
6,000 7.4 3.1 11.4 39,000 13.2 5.1
7,000 8.1 2.7 11.8 40,000 13.5 5.2
8,000 8.8 2.3 12.0 41,000 13.9 5.4
9,000 9.3 2.0 12.0 42,000 14.2 5.5
10,000 9.7 1.9 11.9 43,000 14.5 5.6
11,000 10.1 1.8 11.7 44,000 14.9 5.8
12,000 10.4 1.8 11.6 45,000 15.2 5.9
13,000 10.6 1.8 46,000 15.6 6.0
14,000 10.8 1.9 47,000 15.9
15,000 10.9 2.0 48,000 16.2
16,000 11.0 2.1 49,000 16.6
17,000 11.0 2.2 50,000 16.9
18,000 11.0 2.4 51,000 17.2
19,000 10.9 2.5 52,000 17.6
20,000 10.9 2.6 53,000 17.9
21,000 10.8 2.7 54,000 18.3
22,000 10.7 2.9 55,000 18.6
23,000 10.6 3.0 60,000 20.3
24,000 10.6 3.1 65,000 22.0
25,000 10.5 3.3 70,000 23.7
26,000 10.6 3.4 75,000 25.4
27,000 10.7 3.5 80,000 27.1
28,000 10.8 3.7 85,000 28.7
29,000 10.9 3.8 90,000 30.4
30,000 11.0 3.9 95,000
31,000 11.2 4.1 100,000
32,000 11.4 4.2 105,000
33,000 11.6 4.3 110,000
LOS ≥ D
LOS ≥ DLOS ≥ D
LOS ≥ D

211
Figure 50. AADT – Lifetime Encroachments/1,000-ft of Bridge Railing Nomograph.
110100
NMO D ENCR
1
10
100
100 1,000 10,000 100,000
NE
NC
R
AADT0 or AADTEQ )
4 LANE DIVIDED
2 LANW UNDIVIDED
1 LANE ONE WAY

212
Figure 51. Minimum Horizontal Curve Radius Based on Barrier Obstruction to the
Stopping Sight Distance Compared to AASHTO Exhibit 3-14.
0
500
1,000
1,500
2,000
2,500
3,000
3,500
4,000
4,500
25 30 35 40 45 50 55 60 65 70 75
Min
imu
m C
urv
e R
adiu
s (f
t)
Design Speed (mi/hr)
AASHTO Ex. 3-14 with e<=10%
Min. Radius Based on BarrierObstruction to SSD

213
LOW MEDIUM HIGH
Figure 52. Test Level Selection Nomograph (Risk<0.01 in 30 years for 1000 ft of bridge railing).
TL2 or TL3
TL2 or TL3 TL2 or TL3
TL4
TL4
TL4
TL5 TL5
TL5
Risk
Boundary Risk
Boundary
Risk
Boundary

214

215
REFERENCES
AASHTO01 AASHTO, A Policy on Geometric Design of Highways and Streets, 4th
Ed.,
American Association of State Highway and Transportation Officials,
Washington, D.C., 2001.
AASHTO02 AASHTO, “Standard Specifications for Highway Bridges,” 17th Edition.
American Association of State Highway and Transportation Officials.
Washington, D.C., 2002.
AASHTO03 “User Benefit Analysis for Highways Manual,” American Association of State
Highway and Transportation Officials (AASHTO), Washington D.C., 2003.
AASHTO06 Technical Committee for Roadside Safety, “Roadside Design Guide,” American
Association of State Highway and Transportation Officials, Washington, D.C.,
2009.
AASHTO07 AASHTO, “AASHTO LRFD Bridge Design Specification,” 4th
Edition,
American Association of State Highway and Transportation Officials,
Washington, D.C., 2007.
AASHTO09 Technical Committee for Roadside Safety, “Manual for Assessing Safety
Hardware,” American Association of State Highway and Transportation Officials,
Washington, D.C., 2009.
AASHTO10 AASHTO, “User and Non-User Benefit Analysis for Highways,” American
Association of State Highway and Transportation Officials, Washington, D.C.,
September 2010.
AASHTO11 AASHTO, Roadside Design Guide, 4th
Ed., American Association of State
Highway and Transportation Officials, Washington, D.C., 2011.
AASHTO12 AASHTO, AASHTO LRFD Bridge Design Specifications, American Association
of State Highway and Transportation Officials, Washington, D.C., 2012.
AASHTO65 AASHTO, “Standard Specifications for Highway Bridges,” Ninth Edition.
American Association of State Highway Officials. Washington, D.C., 1965.
AASHTO89 AASHTO, “Guide Specifications for Bridge Railings,” American Association of
State Highway and Transportation Officials, Washington, D.C., 1989.
Alberson04 D. C. Alberson, W. F. Williams, W. L. Mengers and R. R. Hauig, “Testing and
Evaluation of the Florida Jersey Safety Shaped Bridge Rail,” Report FHWA/TX-
049-8132-1, Federal Highway Administration, Washington, D.C., February 2004.
Alberson11 D. C. Alberson, W. F. Williams, M. J. Bloschock, C. E. Boyd, “Analysis and
Design of Concrete Traffic Railings,” Presentation at the 2011 Transportation
Research Record Annual Meeting, Transportation Research Board, Washington,
D.C., 2011.
Alberta11 Alberta Infrastructure and Transport, Roadside Design Guide, January 2009. <
http://www.transportation.alberta.ca/Content/docType233/Production/H7-
Bridges.pdf>, Online version, Accessed January 19, 2011.

216
Alberta11a Alberta Infrastructure and Transport, Roadside Design Guide Appendix C,
January 2009, <http://www.transportation.alberta.ca/Content/docType233/
Production/RDG-Appendix-C-RevJul-09.pdf >, Online version, Accessed January
20, 2011.
Avon12 Fiery Avon crash leaves one dead, accessed online:
http://www.vaildaily.com/article/20120513/NEWS/120519933, October 2, 2012.
Bahar11 Bahar, G., “Estimating the Costs to State Governments Due to Highway-Related
Fatal and Non-Fatal Injury Crashes,” National Cooperative Highway Research
Program Project 20-24, Task 68, Transportation Research Board, Washington,
D.C., 2011.
BBC01 British Broadcasting Corporation, Accessed 5 August, 2013.
http://www.bbc.co.uk/news/world-europe-23486086
Beason89 W. L. Beason and T.J. Hirsch, Measurement of Heavy Vehicle Impact Forces and
Inertia Properties, Research Report. Texas Transportation Institute, College
Station, TX, 1989.
Blincoe00 Blincoe, L., Seay, A., Zaloshnja, E., Miller, T., Romano, E., Luchter, S., Spicer
R., “The Economic Impact of Motor Vehicle Crashes, 2000,” Report No. DOT
HS 809 446, online version, http://www-nrd.nhtsa.dot.gov/Pubs/809446.PDF,
accessed November 1, 2009
Boston07 See “4 hurt in city after truck plunges off I-93 onramp: Wreck is near site of fatal
March crash”. April 7, 2007. http://www.boston.com/news/local/
articles/2007/04/03/4_hurt_in_city_after_truck_plunges_off_i_93_onramp/ .
Bronstad81 M. E. Bronstad and J. D. Michie, “Multiple-Service Level Highway Bridge
Railing Selection Procedures,” Report 239, National Cooperative Highway
Research Program, Transportation Research Board, Washington, D.C., 1981.
Buth93 C.E. Buth and T.J. Hirsch, Testing of New Bridge Rail and Transition Designs,
Federal Highway Administration, Report No. FHWA-RD-93-058, Washington,
D.C., 1993.
CADOT11 California Department of Transportation Summary Price Index For Selected
Highway Construction Items, <http://www.dot.ca.gov/hq/esc/
oe/contract_progress/index.html>, accessed February 1, 2011.
CBC01 Canadian Broadcasting Corporation website, accessed 13 February, 2012:
http://www.cbc.ca/news/canada/montreal/story/2011/12/28/montreal-overpass-
crash.html?cmp=rss
CBC02 Canadian Broadcasting Corporation website, accessed 13 February, 2012:
http://www.cbc.ca/news/canada/montreal/story/2011/12/28/montreal-overpass-
crash.html?cmp=rss
CNN01 CNN.com, Online news article, http://www.cnn.com/2012/04/29/us/new-york-
fatal-crash/index.html?hpt=hp_t2 accessed 30 April, 2012

217
Conron09a Conron, C.E., Ray, M.H., Incorporating Crash Costs into Highway Cost Analysis,
American Association of State Highway and Transportation Officials, National
Value Engineering Conference Proceedings, September 2009.
Council11 Council, F., Zaloshnja, E., Miller, T., Persuad, B., “Crash Cost Estimates by
Maximum Police-Reported Injury Severity Within Selected Crash Geometries,”
Federal Highway Administration, FHWA-HRT-05-051, October 2005,
http://www.cmfclearinghouse.org/collateral/Crash_Cost_Estimates.PDF, online
version accessed February 23, 2011.
Faller05 Faller, R.K., et al., Development, Testing, and Evaluation of NDOR’s TL5
Aesthetic Open Concrete Bridge Rail, MwRSF Report No. TRP-03-148-04,
University of Nebraska-Lincoln, Lincoln, Nebraska, 2005
FDOT11 Florida Department of Transportation, FDOT Structures Design Guidelines,
Section 6.7, Topic No. 625-020-018, January 2011. <http://www.dot.state.fl.us/
Structures/StructuresManual/CurrentRelease/StructuresManual.shtm>, Online
version, Accessed December 31, 2010.
FDOT11a Florida DOT Weighted Average Bid Prices, ftp://ftp.dot.state.fl.us/LTS/CO/
Estimates/12MonthsMoving.pdf, online version accessed February 9, 2011.
FHWA04 FHWA, “Supplemental Guidance on Safe Accommodation of Heavy Vehicles on
US Highways,” Federal Highway Administration, Office of Safety, Office of
Safety Design, Washington, D.C., 8 October 2004.
FHWA05 FHWA, “Bridge Railing Guide 2005,” Federal Highway Administration,
Washington, D.C., 2005. See
http://www.fhwa.dot.gov/bridge/bridgerail/br053000.cfm.
FHWA09 Motor Vehicle Accident Costs, Federal Highway Administration,
http://safety.fhwa.dot.gov/facts_stats/t75702.cfm, accessed August 23, 2009
FHWA10 FHWA Bridge Railings, FHWA SAFETY, http://safety.fhwa.dot.gov
/roadway_dept/policy_guide/road_hardware/ ctrmeasures/bridge_railings/>,
accessed December 30, 2010.
FHWA11 Memorandum To: Secretarial Officers, Federal Highway Administration,
“Treatment of the Economic Value of a Statistical Life in Departmental Analyses
– 2011 Interim Adjustment,”
http://www.dot.gov/sites/dot.dev/files/docs/Value_of_Life_Guidance_2011_Upda
te_07-29-2011.pdf , signed July 29, 2011, accessed November 19, 2012.
FHWA12a Office of Highway Policy, “Highway Statistics Series,” online version
http://www.fhwa.dot.gov/policyinformation/statistics/2010/ access 8/30/2012.
FHWA12b Economic Value of Statistical Life, Federal Highway Administration,
http://www.dot.gov/sites/dot.dev/files/docs/VSL%20Guidance%202013.pdf
accessed 10 September, 2013.

218
FHWA12c Federal Highway Administration, “Highway Statistics Series,” access online,
November 2012, Main access page,
http://www.fhwa.dot.gov/policyinformation/statistics.cfm.
FHWA83 K. K. Mak and L. R. Calcote, “Accident Analysis of Highway Narrow Bridge
Sites,” Report No. FHWA-RD-82-138, Federal Highway Administration,
Washington, D.C., 1983.
FHWA86 1986 Letter from FHWA to States listings bridge railing designs that were
considered acceptable for use on Federal-aid projects by virtue of their crash test
performance.
FHWA90 1990 Letter from FHWA to States listings bridge railing designs that were
considered acceptable for use on Federal-aid projects by virtue of their crash test
performance.
FHWA97a 1997 Letter from FHWA to States Consolidating 1986&1990 letters.
<http://safety.fhwa.dot.gov/roadway_dept/policy_guide/road_hardware/barriers/b
ridgerailings/docs/bridge.pdf> Online version access December 30, 2010.
FHWA97b FHWA, Action: Crash Testing of Bridge Railings, Memorandum, Federal
Highway Administration, Washington, D.C., May 30, 1997.
FMCSA08 Current FMCSA Crash Cost Figures, December 8, 2008,
http://mcsac.fmcsa.dot.gov/documents/Dec09/FMCSACrashCostCalculationsDec
08.pdf online version accessed February 25, 2011.
FMCSA10 Commercial Motor Vehicle Facts, Federal Motor Carrier Safety Administration,
http://www.fmcsa.dot.gov/documents/facts-research/CMV-Facts.pdf, online
version accessed February 10, 2011.
FMCSA11 About FMCSA, Federal Motor Carrier Safety Administration, U.S. Department of
Transportation, http://www.fmcsa.dot.gov/about/aboutus.htm, website accessed
February 10, 2011.
FMCSA12 About FMCSA, Federal Motor Carrier Safety Administration, U.S. Department of
Transportation, http://www.fmcsa.dot.gov/about/aboutus.htm, website accessed
November, 2012.
GAZ01 Montreal Gazette Website, accessed 13 February, 2012:
http://www.montrealgazette.com/news/killed+truck+flips+Montreal+overpass+on
to+rail+tracks/5919774/story.html
Globe07 Online news report. See “Officials: ramps aren’t to blame for accidents”. April 9,
2007. http://www.boston.com/news/globe/city_region/breaking
_news/2007/04/officials_ramps.html.
Google11 Google Earth, download the latest version
http://www.google.com/earth/index.html, accessed online maps September, 2011.
Harwood03 Harwood, D.W., Torbic, D.J., Richard, K.R., Glauz, W.D., Elefteriadou, L.,
"Review of Truck Characteristics as Factors in roadway Design," Final Report,

219
National Cooperative Highway Research Program Report 505, Transportation
Research Board, Washington, D.C., 2003.
Hirsch85 Hirsch, T.J., and Fairbanks, W.L., Bridge Rail to Contain and Redirect 80,000-lb
Tank Trucks, Transportation Research Record No. 1024, Transportation Research
Board, National Research Council, Washington, D.C., 1985.
Horne97 D. W. Horne, “ACTION: Crash Testing of Bridge Railings,” Letter for FHWA
Regional Administrators, Federal Highway Administration, Washington, D.C., 30
May 1997.
HSIS01 Highway Safety Information System website: http://www.hsisinfo.org/ Accessed
9 Feb. 2012
IDOT09 Illinois Department of Transportation, Bridge Manual, updated November 2009,
<http://www.dot.il.gov/bridges/brmanuals.html>, Online version, Accessed
January 10, 2011.
INDOT10 Indiana Department of Transportation, INDOT Design Manual, January 2010.
<http://www.in.gov/dot/div/contracts/standards/dm/english/index.html>, Online
version, Accessed January 10, 2011.
INDOT11 Indiana Design Manual, 2010, http://www.in.gov/dot/div/contracts/standards/
dm/english/Part6/ECh61/ch61.htm, online version accessed February 9, 2011.
INDOT11a Indiana DOT Weighted Average Bid Prices, http://www.in.gov/dot/div/
contracts/pay/, online version accessed February 9, 2011.
Italy11 Italian Ministry of Infrastructures and Transportation, Degree Official Gazette182
of 5-8-2004, June 21, 2004
KATU01 Katu.com, Accessed 17 December, 2012: http://www.katu.com/news/local/Truck-
ends-up-hanging-over-an-overpass-with-the-driver-stuck-inside-
180710711.html?tab=video&c=y
KCTV01 Online news article, accessed 9 September, 2013,
http://www.kctv5.com/story/17327151/ntsb-taking-over-fatal-rv-crash-
investigation
KVUE01 Online news article, accessed 6 August, 2013,
http://www.kvue.com/news/slideshows/Grand-Prairie-truck-crash-
218354851.html
Mak03 Mak, K.K. and Sicking, D.L., “Roadside Safety Analysis Program (RSAP)—
Engineer’s Manual,” National Cooperative Highway Research Program Report
No. 492, Transportation Research Board, Washington, D.C., 2003.
Mak10 Mak, K.K., Sicking, D.L., and B. A. Coon, “Identification of Vehicular Impact
Conditions Associated with Serious Ran-off-Road Crashes,” National
Cooperative Highway Research Program Report 665, Transportation Research
Board, Washington, D.C., 2010.

220
Mak83 K. K. Mak and L. R. Calcote, “Accident Analysis of Highway Narrow Bridge
Sites,” Report No. FHWA/RD-82/138, Federal Highway Administration,
Washington, D.C., February 1983.
Mak92 Mak, K.K. and D.L. Sicking, "Rollover Caused by Concrete Safety Shaped
Barrier," Transportation Research Record 1258, Transportation Research Board,
Transportation Research Board, Washington, D.C., 1992.
Mak93 Mak, K. K.and Sicking, D. L., “Evaluation of Performance Level Selection
Criteria for Bridge Railings,” Draft Final Report (Unpublished), NCHRP Project
22-08, National Cooperative Highway Research Program, Washington, D.C.,
September 1993.
Mak94 K. K. Mak and D. L. Sicking, "Evaluation of Performance Level Selection
Criteria for Bridge Railings," Final Report, National Cooperative Highway
Research Program Project 22-08, Transportation Research Board, Washington,
D.C., 1994.
MassDOT10 Massachusetts Department of Transportation, MassHighway Bridge Manual,
Updated November 2010. <http://www.mhd.state.ma.us/default.asp?pgid
=content/bridgeman_new02&sid=about>, Online version, Accessed January 10,
2011.
MDOT09 Michigan Department of Transportation, Michigan Bridge Design Manual,
Updated September 16, 2009, <http://www.michigan.gov/mdot/0,1607,7-151-
9622---,00.html >, Online version, Accessed January 10, 2011.
Menges95 Menges, W.L., Buth, C.E., Bullard, D.L., Jr., and McDevitt, C.F., Performance
Level 3 Bridge Railings, Transportation Research Record No. 1500,
Transportation Research Board, National Research Council, Washington, D.C.,
July 1995, [Test nos. 7069-13 and 7069-10].
MEPDG04 “Guide For Mechanistic-Empirical Design of New and Rehabilitated Pavement
Structures,” National Cooperative Highway Research Program,, Transportation
Research Board, Washington, D.C., 2004.
Michie81 J. D. Michie, “Recommended Procedures for the Safety Performance Evaluation
of Highway Appurtenances,” National Cooperative Highway Research Program
Report 230, Transportation Research Board, Washington, D.C., 1981.
Miller88 Miller, Ted R., C. Philip Brinkman, and Stephen Luchter; "Crash Costs and
Safety Investment;" Proceedings of the 32nd Annual Conference, Association for
the Advancement of Automotive Medicine, Des Plaines, IL, 1988.
MNDOT06 Minnesota Department of Transportation, MNDOT Bridge Design Manual, May
2006. < http://www.dot.state.mn.us/bridge/manuals/LRFD/index.html>, Online
version, Accessed January 4, 2011.
MOUK01 Online news article, accessed 9 September, 2013,
http://www.dailymail.co.uk/news/article-2086530/Charles-Allison-Truck-driver-
perished-hitting-familiys-car-plunging-California-bridge-pictured-time.html

221
MOUK02 Online news article, accessed 9 September, 2013,
http://www.dailymail.co.uk/news/article-2124131/Boy-17-provisional-license-
driving-motor-home-plunged-bridge-killing-family-injuring-13.html
MwRSF10 “Evaluation of Rollover and Injury Rates for Vertical and Safety Shape Bridge
Rails in Iowa,” ongoing study sponsored by the Midwest Pooled Fund States,
Midwest Roadside Safety Facility, University of Nebraska-Lincoln, Lincoln
Nebraska, 2010.
NBC01 “Dateline” television show, episode section titled “Trapped”, broadcast on
internet in six parts on June 28, 2013, accessed 9 September, 2013,
http://www.nbcnews.com/video/dateline/52346714#52346714
NCDOT10 North Carolina Department of Transportation Structure Design - Design Manual,
December 2010, <http://www.ncdot.org/doh/preconstruct/highway/structur/
designmanual/lrfd/LRFDManual(December2010).pdf >, Online version,
Accessed January 10, 2011.
NDDOT09 North Dakota Department of Transportation, Design Manual, Updated September
24, 2009, <http://www.dot.nd.gov/manuals/design/designmanual/
designmanual.htm>, Online version, Accessed January 10, 2011.
NDOT08 Nevada Department of Transportation, Structures Manual, 2008.
<http://www.nevadadot.com/divisions/011/ >, Online version, Accessed January
10, 2011
NHCCI11 National Highway Construction Cost Index, Federal Highway Administration,
<http://www.fhwa.dot.gov/ohim/nhcci/desc.cfm>, January, 2010, accessed online
NHTSA12 National Highway Traffic Safety Administration, “Traffic Safety Facts,” access
online, November 2012, Main access page, http://www-
nrd.nhtsa.dot.gov/cats/listpublications.aspx?Id=E&ShowBy=DocType, February
1, 2011.
NHTSA13 National Highway Traffic Safety Administration, “Large Truck Crash Causation
Survey Case Viewer.” http://www-nass.nhtsa.dot.gov/nass/4/SearchForm.aspx.
Accessed 05/21/2013.
NJDOT10 New Jersey Department of Transportation, Design Manual for Bridges and
Structures, 5th Edition, March 24, 2010 <http://www.state.nj.us/transportation/
eng/documents/BSDM >, Online version, Accessed January 7, 2011.
NJDOT11 New Jersey DOT Weighted Average Bid Prices, http://www.state.nj.us/
transportation/eng/CCEPM/pdf/report2008.pdf, online version accessed February
9, 2011.
NJTA1 New Jersey Turnpike Authority Standard Plans, “Concrete Median Barrier”
Noel81 Noel, J.S., T.J. Hirsch, C.E.,Buth, and A. Arnold, Loads on Bridge Railings,
Transportation Research Record 796, Transportation Research Board,
Washington, D.C., 1981, pp 31-35.

222
NSC11 Estimating the Cost of unintentional Injuries, National Safety Council,
http://www.nsc.org/news_resources/injury_and_death_statistics/Pages/Estimating
theCostsofUnintentionalInjuries.aspx , online version access September 12, 2013.
NTSB09a NTSB, “Highway Accident Brief: HWY-04-MH-012,” Accident No. HWY-04-
MH-012, National Transportation Safety Board, Washington, D.C., 30 July 2009.
NTSB09b NTSB, “Highway Accident Brief: HWY-07-MH-007,” Accident No. HWY-07-
MH-007, National Transportation Safety Board, Washington, D.C., 19 November
2009.
NTSB09c NTSB, “Highway Accident Report: Motorcoach Run-Off-the-Bridge and
Rollover, Sherman, Texas, August 9, 2009,” NTSB Report No. NTSB/HAR-
09/02 PB2009-916202, Washington, D.C., 2009.
NTSB74 NTSB, “Automobile Crash Off the Silliman Evans Bridge, I-24/65, Nashville,
Tennessee, July 27, 1973,” Highway Accident Report NTSB/HAR-74/02,
National Transportation Safety Board, Washington, DC, 1974.
NTSB74a NTSB, “Wilmeth Cattle Company Truck/Bridge Transportation Enterprises, Inc.,
Bus, U.S. 60-84, Fort Sumner, New Mexico, December 26, 1972,” Highway
Accident Report NTSB/HAR-74/01, National Transportation Safety Board,
Washington, DC, 1974.
NTSB76 NTSB, “Automobile Collision With and Collapse of the Yadkin River Bridge,
Near Siloam, North Carolina, February 23, 1975,” Highway Accident Report
NTSB/HAR-76/03, National Transportation Safety Board, Washington, DC,
1976.
NTSB77a NTSB, “Student Transportation Lines, Inc. Charter Bus Climbing of Bridge Rail
and overturn Near Martinez, California, May 21, 1976,” Highway Accident
Report No. NTSB/HAR-77/02, National Transportation Safety Board,
Washington, D.C., 1977.
NTSB77b NTSB, “Safety Recommendation No. H-77-12,” National Transportation Safety
Board, Washington, D.C., 1977.
NTSB77c NTSB, “Safety Recommendation No. H-77-13,” National Transportation Safety
Board, Washington, D.C., 1977.
NTSB77d NTSB, “Safety Recommendation No. H-77-14,” National Transportation Safety
Board, Washington, D.C., 1977.
NTSB77e NTSB, “Transport Company of Texas, Tractor Semitrailer (Tank) Collision with
Bridge Column and Sudden Dispersal of Anhydrous Ammonia Cargo, Houston,
Texas, May 11, 1976,” Highway Accident Report NTSB/HAR-77/01, National
Transportation Safety Board, Washington, DC, 1977.
NTSB80 NTSB, “Safety Recommendation No. H-80-64,” National Transportation Safety
Board, Washington, D.C., 1980.

223
NYDN01 New York Daily News, Online news article, http://www.nydailynews.com/new-
york/killed-van-drove-overpass-bronx-zoo-article-1.1069488#ixzz1tY1B45Fp
accessed 30 April, 2012
NYSDOT10 New York Department of Transportation, NYSDOT Bridge Manual,
2010.dot.state.oh.us/Divisions/HighwayOps/Structures/standard/Bridges/test/raili
ng%20selection%20procedure.pdf >, Online version, Accessed January 10, 2011.
ODOT02 Ohio Department of Transportation Inter-office Communication From Tim Keller
to Districts, Revised Bridge Railing Policy, December 19, 2002. < http://www.
manuals/brman-usc/Section_6_US_2010.pdf>, Online version, Accessed January
5, 2011.
Olson70 R. M. Olson, E. R. Post, W. F. McFarland, “Tentative Service Requirements for
Bridge Railing Systems,” NCHRP Report 86, National Cooperative Highway
Research Program, Transportation Research Board, Washington, D.C., 1970.
ORDOT11 Oregon DOT Weighted Average Bid Prices, http://www.oregon.gov/ODOT/
HWY/ESTIMATING/docs/bid_item_prices/EngReg3.pdf, online version
accessed February 9, 2011.
ORHER01 Oregon Herald, The, online article, accessed 17 December, 2012:
http://www.oregonherald.com/oregon/local.cfm?id=2688&Business-
News=Truck-crashes,-hangs-over-bridge-over-HWY-217.htm
Patriot01 PatriotLedger.com, Accessed 8 August, 2013:
http://www.patriotledger.com/news/x1815317455/Crash-shuts-down-Leverett-
Connector
PennDOT11 Pennsylvania Design Manual, ftp://ftp.dot.state.pa.us/public/Bureaus/design/
PUB13M/Chapters/Chap12.pdf, access online on October 3, 2011.
PHMSA12 U.S. Department of Transporation Pipeline and Hazardous Materials Safety
Administration, http://phmsa.dot.gov/hazmat/incident-report, accesed September
2012.
PJSTAR01 Online news article, accessed 9 September, 2013,
http://www.pjstar.com/news/x1803826290/Wataga-woman-dies-after-SUV-
crashes-goes-over-bridge-guardrail
Plan4S11 Plan4Safety, Transportation Safety Resource Center, Rutgers University, online:
http://cait.rutgers.edu/tsrc/plan4safety, accessed June, 2011.
RAIB11 Rail Accident Investigation Branch, “Investigation into an accident involving a
heavy goods vehicle and a train near Oxshott, Surrey, on 5 November 2010.” See
http://www.raib.gov.uk/publications/current_investigations_register/101105_Oxs
hott.cfm.
Ray03 M. H. Ray, J. Weir, J. Hopp, “In-Service Performance Of Traffic Barriers,”
NCHRP Report 490, Worcester Polytechnic Institute, 2003.
Ray09 M. H. Ray and M. Mastova, “Evaluation of Crash test of the MDS-4 and MDS-5
Barriers According to Report 350,” MDS LLC, Canton, ME, July 2008.

224
Ray12 Ray, M. H., Carrigan, C. E., Plaxico, C. A., Johnson, T. O., “Engineer’s Manual:
Roadside Safety Analysis Program (RSAP) Update,”
http://rsap.roadsafellc.com/RSAPv3EngineersManual.pdf, Roadsafe LLC,
Canton, ME, December 2012.
RIDOT Rhode Island Department of Transportation, Rhode Island LRFD Bridge Design
Manual, 2007 < http://www.dot.state.ri.us/engineering/guides/index.asp >, Online
version, Accessed January 7, 2011.
Ross93 Ross, H.E., Jr., Sicking, D. L., Zimmer, R. A. and Michie, J.D., “Recommended
Procedures for the Safety Performance Evaluation of Highway Features,”
National Cooperative Highway Research Program Report 350, Transportation
Research Board, National Academy Press, Washington, D.C., 1993.
Shankar00 V. N. Shankar, R. B. Albin, J. C. Milton and M. Nebergall, “In-Service
Performance Based Roadside Design Policy,” Transportation Research Record
No. 1720, Transportation Research Board, Washington, D.C., 2000.
Sheikh11 N. M. Sheikh, R. P. Bligh and W. L. Menges, “Determination of Minimum
Height and Lateral Design Load for MASH Test Level 4 Bridge Rails,” Texas
Transportation Institute, Report No. FHWA/TX-12/9-1002-5, College Station,
TX, December 2011.
Sicking09 D. L. Sicking, K. A. Lechtenberg and S. Peterson, “Guidelines for Guardrail
Implementation,” NCHRP Report 638, National Cooperative Highway Research
Program, Transportation Research Board, Washington, D.C., 2009.
Sicking86 D. L. Sicking and H.E. Ross, Jr., "Benefit/Cost Analysis of Roadside Safety
Alternatives," Transportation Research Record l065, Transportation Research
Board, Washington, D.C., 1986.
Sobanjo11 J. O. Sobanjo and P. D. Thompson, “Enhancement of the FDOT’s Project Level
and Network Level Bridge Management Analysis Tool,” Florida State University,
Tallahassee, FL, February 2011.
Syracuse12 Cab of tractor-trailer plunges 25 feet off Interstate 81 in Syracuse, accessed
online: http://www.syracuse.com/news/index.ssf/2012/07/tractor-trailer.html,
October 2, 2012.
TF1313 AASHTO-ARTBA-AGC, Online Guide to Bridge Railings,
http://guides.roadsafellc.com, accessed September, 2013.
TXDOT11 Texas DOT Bridge Standards (English), http://www.txdot.gov/insdtdot/orgchart
/cmd/cserve/standard/bridge-e.htm, online version accessed February 9, 2011.
TXDOT11a Texas DOT Weighted Average Bid Prices, http://www.txdot.gov/business/
avgd.htm, online version accessed February 9, 2011.
TXDOT13 Texas Department of Transportation, Bridge Railing Manual,
http://onlinemanuals.txdot.gov/txdotmanuals/rlg/rlg.pdf, accessed September
2013.

225
UK06 The Highway Agency, Transport Scotland, Welsh Assembly Government and the
Department for Regional Development, Northern Ireland, “Design Manual for
Roads and Bridges,” Volume 2: Highway Structures: Design, Section 2: Special
Structures, Part 8: Requirement for Road Restraint Systems, (see
www.highways.gov.uk), August 2006.
USBUDG03 Letter to US Senate Subcommittee on Financial Management Budget and
Committee on Governmental Affairs, November 3, 2003.
Vincoli93 J. W. Vicoli, “System Safety,” VNR Basic Guide Series, VanNostrand Reinhold
Publishers, New York, 1993.
Wainwright02 Martin Wainwright, “Rail Crash Inquiry Calls for Monitors,” The Guardian,
London, UK, December 5, 2002.
WBZ01 Online News Report, accessed 9 September, 2013,
http://boston.cbslocal.com/2013/08/09/tractor-trailer-crash-snarls-traffic-on-i-93-
north-in-boston/
WBZ07 Online news report. See “Tractor-trailer crashes off of Route 93 ramp,”
http://www.wbz.com/pages/332622.php .
WCVB01 Online news report, Accessed 8 August, 2013:
http://www.wcvb.com/news/local/metro/traffic-squeezing-by-on-leverett-
connector-after-truck-crash/-/11971628/21330782/-/l31qw4/-/index.html
WFAA01 Online news article, accessed 6 August, 2013,
http://www.wfaa.com/news/local/dallas/Fiery-crash-at-Grand-Prairie-highway-
intersection-218236921.html
Wiehltal04 Online news report. See
http://www.cylive.com/content/28444/Expensive_Disaster_of_Wiehltal_Bridge_
Tanker_Truck_Crash
WPIX01 Online news article, http://www.wpix.com/news/wpix-bronx-river-parkway-
crash-bronx-zoo-dead-story,0,7908554.story accessed 30 April, 2012
WSDOT08 Washington Department of Transportation, Bridge Design Manual, August 2010
.< http://www.wsdot.wa.gov/publications/manuals/fulltext/M23-50/
Chapter10.pdf>, Online version, Accessed January 11, 2011.
WSDOT09 Highway Construction Cost Comparison Survey, <http://www.wsdot.wa.gov/biz/
Construction/pdf/I-C_Const_Cost.pdf>, online version accessed September 11,
2009.
Zaloshnja06 Zaloshnja, E., Miller, T., Unit Costs of Medium/Heavy Truck Crashes, Federal
Motor Carrier Safety Administration, Federal Highway Administration, 2006.
Zimbio09 Online news report, see http://www.zimbio.com/Truck+Accident+Lawyers/
articles/-aOryLlEC7_/Fatal+San+Francisco+Semi+Truck+Accident+Bay