final report lake balboa - empowerla• lake balboa has a lower percentage of the population living...
TRANSCRIPT


Lake%Balboa%Neighborhood%Profile%
!!
Sarah!Chandlee,!Shayne!Smith,!and!Nicole!Walter!University!of!California,!Los!Angeles!
Fall!2013!%%%%%%%%%%%%%%%%%%%Front%and%Back%Cover%Design:%Nicole!Walter!%Photo%Credits%(Front%Cover):%Lake%Balboa%Park.%Sarah!Chandlee!and!Shayne!Smith% !

ii
%ACKNOWLEDGEMENTS%
!The! completion! of! this! neighborhood! report! was! made! possible! through! the! UCLA!Department!of!Urban!Planning!course!in!Neighborhood!Analysis.!The!students!would!like!to! thank! Dr.! Paul! Ong! and! Chhandara! Pech! for! their! guidance! and! comments! provided!along!the!way.!!!We! would! also! like! to! thank! the! Lake! Balboa! Neighborhood! Council! and! neighborhood!residents!who!graciously!provided!their!time!to!answer!numerous!questions!and!lead!us!on!a! tour!of! their! community,! especially!Cynthia!Weichelt,! Steve!Leffert,! Linda!Pruett,!Brian!Tessier,!Allen!Nelson,!Bethany!Harris,!Leela!Woods,!and!Mary!Bower.!In!addition,!we!also!wish! to!extend!our!deepest!gratitude! to!Amy!Rice,!Mitchell!Walker,!and!Conor!Maher! for!their!assistance!during!the!editing!process.!!!!!! !!!!!!!!!!!!!!!!!!
18!December!2013!!!!!~!!!!!This!report!supersedes!all!previous!drafts!and!earlier!versions.!DISCLAIMER:!The!contents,!claims,!and!findings!of!this!report!are!the!sole!responsibility!of!the!authors.! !

iii
Table of Contents
Introduction………………………………….………………………………………………… 1
Data and Analyses Summary of Major Findings
Part I: Background………………………………………….………………………………… 3
Neighborhood History and Location Lake Balboa Neighborhood Council Neighborhood Boundaries Zoning
Part II: Demographics………………………………………….…………………………….. 12
Population by Race/Ethnicity Population by Age and Gender Nativity Household Types Language
Part III: Socioeconomic Profile………………………………………….…………………… 18
Household Income and Poverty Labor Market Characteristics Full-Time Full-Year Workers Occupation Class of Worker Educational Attainment Public Assistance Programs
Part IV: Housing and Transportation Characteristics……………………………………... 26
Housing Resident Tenure Home Values Rent Levels Housing Burden
Transportation Car Ownership Commute Patterns
Part V: Neighborhood Economic Base……………………………………..………………... 33
Employment Trends Types of Jobs Jobholder Characteristics
Conclusions and Recommendations………………………………………………..………… 46
Works Cited………………………………………………..……….………………………….. 48 Appendix A…………………………………………………..……….………………………... 51
Data Sources & Limitations Decennial Census and American Community Survey (ACS)
U.S. Census Bureau, Longitudinal Employer-Household Dynamics (LEHD)

iv
Demographics Socioeconomics Housing and Transportation Economic Base
Appendix B…………………………………………………..……….………………………... 64
Supplemental Definitions and Statistics Appendix C…………………………………………………..……….………………………... 67
Supplemental Data

v
List of Figures and Tables1
Figure 1: Location of Lake Balboa within Los Angeles………………………………………… 3 Figure 2: Childhood Home of Shirley Temple………….…………………………….………… 6 Figure 3: Army Hospital barracks used as modern day Classrooms……………………….…… 6 Figure 4: Exterior of an Emergency Storage Locker in Lake Balboa…………………..………. 7 Figure 5: Interior of an Emergency Storage Locker in Lake Balboa………………………….… 7 Figure 6: Map showing the street boundaries of the Lake Balboa NC………………………….. 9 Figure 7: Lake Balboa Zoning Map…………………….……………………………………… 11 Figure 8: 2010 Lake Balboa Demographic Composition……………………….………...…… 13 Figure 9: Population Pyramid………………………………………………………………..… 14 Figure 10: Lake Balboa and L.A. Nativity Percentages………………………………..……… 15 Figure 11: Percent of Family and Nonfamily Households………………………….…………. 16 Figure 12: Household Income…………………………….……………………………….…… 19 Figure 13: Percentage of Lake Balboa’s Male and Female Population below Poverty Level… 19 Figure 14: Employment Status………….………………………………………………..……. 20 Figure 15: Occupation…………………………………………………………………………. 22 Figure 16: Class of Worker: Population 16 Years and Over……………………………...…… 23 Figure 17: Lake Balboa Class of Worker – Government Workers……………………….…… 23 Figure 18: Educational Attainment for Population 25 years and over………………………… 24 Figure 19: Percentage of Population 25 years and over in Lake Balboa living below
Poverty Level by Educational Attainment……………………………………………… 25 Figure 20: Estimate Home Values…………………………….………………………..……… 28 Figure 21: Gross Rent Paid by Percent of Population……………………………………….… 29 Figure 22: Means of Transportation…………………….………………………………..……. 32
1 Photographs of Lake Balboa are inserted throughout this report add further context for the readers and to highlight the character of the neighborhood (see pp. 4, 24, 27, 31, and 38; Source: authors’ photographs, October 2013).

vi
Figure 23: Employment Trends from 2002-2011 for Lake Balboa………………………...….. 34 Figure 24: Employment Trends from 2002-2011 for L.A. City……….………………….…… 34 Figure 25: Proportion of Jobs per square mile for Lake Balboa………………………….….… 35 Figure 26: Inflow/Outflow Job Counts for Lake Balboa………………………………….…… 36 Figure 27: Distance from Work to Home Locations for Lake Balboa and L.A. City…….…… 37 Figure 28: Most Common Jobs by Industry in Lake Balboa in 2011, compared to L.A. City… 38 Figure 29: Top Jobs by Industry Sector for Lake Balboa……………………………………… 39 Figure 30: Earnings Data for Lake Balboa and L.A. City……………………………...……… 40 Figure 31: Earnings Data for Lake Balboa………………………………………………..…… 40 Figures 32-34: Spatial Data for Salaries in Lake Balboa…………………………….………… 41 Figure 35: Jobholder Age in Lake Balboa and L.A. City……………………………………… 42 Figure 36: Jobholder Race in Lake Balboa and L.A. City………………………………...…… 43 Figure 37: Jobholder Ethnicity in Lake Balboa and L.A. City………………………………… 43 Figure 38: Jobholder Education in Lake Balboa and L.A. City in 2011………………………. 44 Figure 39: Census Tracts of Lake Balboa……………………………………………………… 64 Figure 40: Language Map for Lake Balboa………………………………………….………… 67 Figure 41: Lake Balboa Homes Worth $50,000 or Less……………………………….……… 68 Figure 42: Lake Balboa Homes Worth $100,000 or More……………………….…….……… 68 Figure 43: Jobs by Industry Sector for Lake Balboa and L.A. City………………..……..…… 69 Figures 44-46: Spatial Data for the three most common Jobs in Lake Balboa in 2011……….. 70 Figures 47-49: Spatial Data for Jobholder Age in Lake Balboa………………………….….… 70

vii
Table 1: Lake Balboa Population by Race/Ethnicity: 1970 – 2010……………………………. 13 Table 2: Housing Tenure: Owner and Renter Occupied Units………………………………… 26 Table 3: L.A. City and Lake Balboa Resident Move-in Years by Percentage………….……... 27 Table 4: Percentage of Households Spending 30% or More of Income on Housing by
Resident Type……………………………………………………………………...…… 30 Table 5: Vehicle Ownership in Lake Balboa and L.A. City.………………………………..…. 30 Table 6: Jobholder Gender in Lake Balboa and L.A. City…………………………….………. 42 Table 7: Numerical List of Census Tracts located within Lake Balboa with tract weight.….… 65 Table 8: Total Counts for the Spatial Location of Lake Balboa Jobholders.………………...… 69

1
Introduction
__________________________________________________________________
This report examines the current state of Lake Balboa, a neighborhood in Los Angeles
County, in five areas: demographics, socioeconomic status, housing, transportation, and
economics. At this time, there has been no overall analysis completed on the neighborhood of
Lake Balboa. Therefore, this report will review the structure and urban characteristics of this
community utilizing U.S. Census Data in order to provide a comprehensive background of the
area. Combined with historical data and comments from community members, it is hoped that
this report will shed light on a unique and diverse neighborhood.
Data and Analyses
This report uses data from the 2010 U.S. Decennial Census reports, data compiled in the
American Community Survey (ACS) 2007-2011 five-year estimate, and statistics from the U.S.
Census Bureau Longitudinal Employer-Household Dynamics (LEHD).2 Relevant data sets were
compiled on the neighborhood of Lake Balboa to thoroughly explore each of the five areas
highlighted in this report. Once data of the neighborhood was gathered, the authors also collected
similar data on Los Angeles (L.A.) City. The data on L.A. City was then compared with the data
on Lake Balboa. This was done to provide a baseline and a more comprehensive approach to
detailing the characteristics of Lake Balboa.
Summary of Major Findings
Demographics--
• Lake Balboa has a relatively young population that is essentially evenly comprised of males and females.
• Approximately 70% of households in Lake Balboa identify as being family-households, distinguishing them as a family-oriented neighborhood.
• The majority of Lake Balboa residents identify as Hispanic (55%), which includes Mexicans, Cubans, and Puerto Ricans.
• Lake Balboa has more residents that speak Spanish than residents that speak only English (47% and 37%, respectively).
• 63% of Lake Balboa residents over the age of five speak a language other than English.
2 More detailed information of the methodology and data sources use in this report can be found in the Appendices.
2
Socioeconomic-Status--
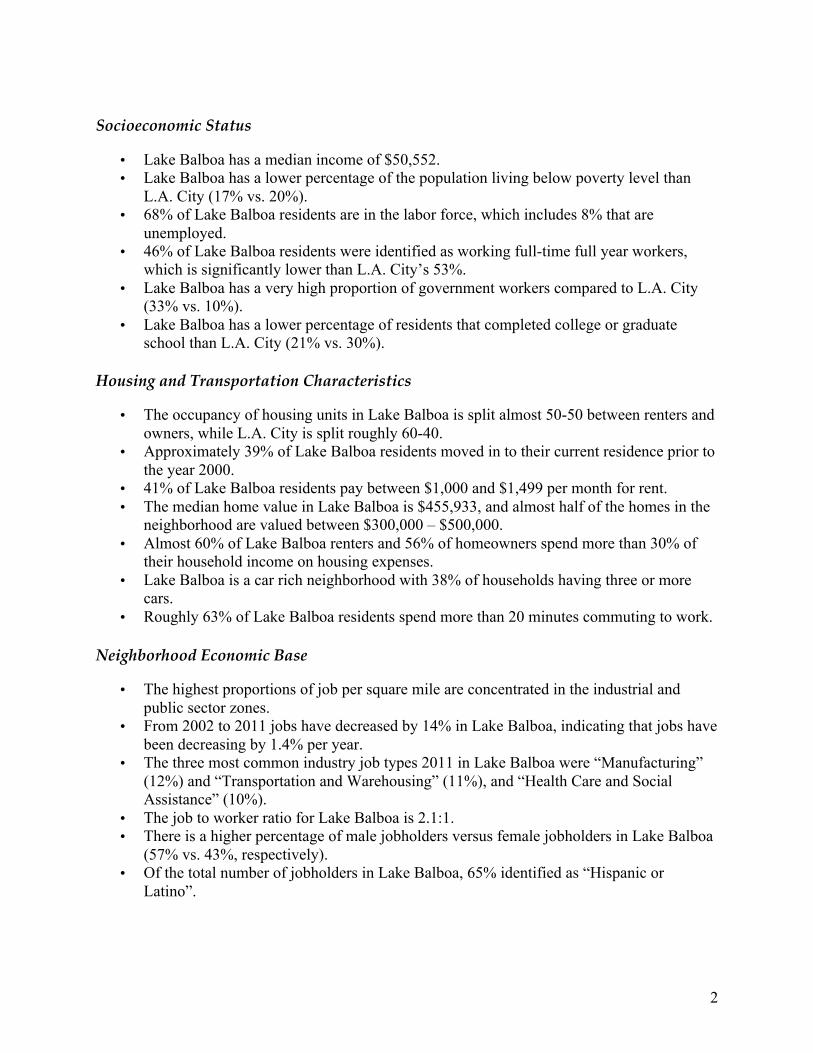
• Lake Balboa has a median income of $50,552. • Lake Balboa has a lower percentage of the population living below poverty level than
L.A. City (17% vs. 20%). • 68% of Lake Balboa residents are in the labor force, which includes 8% that are
unemployed. • 46% of Lake Balboa residents were identified as working full-time full year workers,
which is significantly lower than L.A. City’s 53%. • Lake Balboa has a very high proportion of government workers compared to L.A. City
(33% vs. 10%). • Lake Balboa has a lower percentage of residents that completed college or graduate
school than L.A. City (21% vs. 30%). Housing-and-Transportation-Characteristics--
• The occupancy of housing units in Lake Balboa is split almost 50-50 between renters and owners, while L.A. City is split roughly 60-40.
• Approximately 39% of Lake Balboa residents moved in to their current residence prior to the year 2000.
• 41% of Lake Balboa residents pay between $1,000 and $1,499 per month for rent. • The median home value in Lake Balboa is $455,933, and almost half of the homes in the
neighborhood are valued between $300,000 – $500,000. • Almost 60% of Lake Balboa renters and 56% of homeowners spend more than 30% of
their household income on housing expenses. • Lake Balboa is a car rich neighborhood with 38% of households having three or more
cars. • Roughly 63% of Lake Balboa residents spend more than 20 minutes commuting to work.
Neighborhood-Economic-Base--
• The highest proportions of job per square mile are concentrated in the industrial and public sector zones.
• From 2002 to 2011 jobs have decreased by 14% in Lake Balboa, indicating that jobs have been decreasing by 1.4% per year.
• The three most common industry job types 2011 in Lake Balboa were “Manufacturing” (12%) and “Transportation and Warehousing” (11%), and “Health Care and Social Assistance” (10%).
• The job to worker ratio for Lake Balboa is 2.1:1. • There is a higher percentage of male jobholders versus female jobholders in Lake Balboa
(57% vs. 43%, respectively). • Of the total number of jobholders in Lake Balboa, 65% identified as “Hispanic or
Latino”.

3
PART I: Background __________________________________________________________________ Neighborhood History and Location
Lake Balboa is a neighborhood in the San Fernando Valley Region of Los Angeles (see
Figure 1). While the Lake Balboa area was established in 2004, current neighborhood boundaries
were updated by the City of L.A. in November 2007 (Los Angeles City Council, 2007).
Figure 1: Location of Lake Balboa within Los Angeles (Source: Empower L.A., 2013; Los Angeles Almanac, 2013)
Before being recognized in 2007, Lake Balboa was referred to as Van Nuys. Isaac
Newton Van Nuys (1835-1923) moved to Los Angeles for health reasons and decided to join his
partner in creating a wheat farming empire in the San Fernando Valley (Van Nuys History,
2013). Van Nuys built and lived on a ranch near the Van Nuys Airport. Eventually, he sold his
land south of Roscoe Boulevard and west of Lankershim to Harry Chandler and other prominent
businessmen. One of their first projects was a 14-mile “super” road (Sherman Way), which runs
through the present day neighborhood of Lake Balboa. This road was built as a replica of the
4
Paseo de la Reforma in Mexico City. The road began at what is now Chandler and Lankershim
Boulevards, following west on Chandler, then north on what is now Van Nuys Boulevard,
turning west along present-day Sherman Way to Owensmouth.
William Paul Whitsett (1875-1965), a prominent developer, was given the responsibility
of selling this new town to Angelenos. Whitsett organized the opening day on February 22, 1911,
which was referred to as the “largest opportunity on the entire Pacific Coast today” (Van Nuys
History, 2013). Land lots were sold at $350 for private residences and $660 for business
property. During the first day, buyers made significant investments in these properties with
approximately $40,000 in down payments (Van Nuys History, 2013). Although this development
began in Van Nuys in 1911, the real housing boom started at the end of World War II when
many G.I.s traveled West to buy a house and settle down, as well as when the Sepulveda Dam
and Hansen Dam were built to channel flood waters (Yates, 2013).
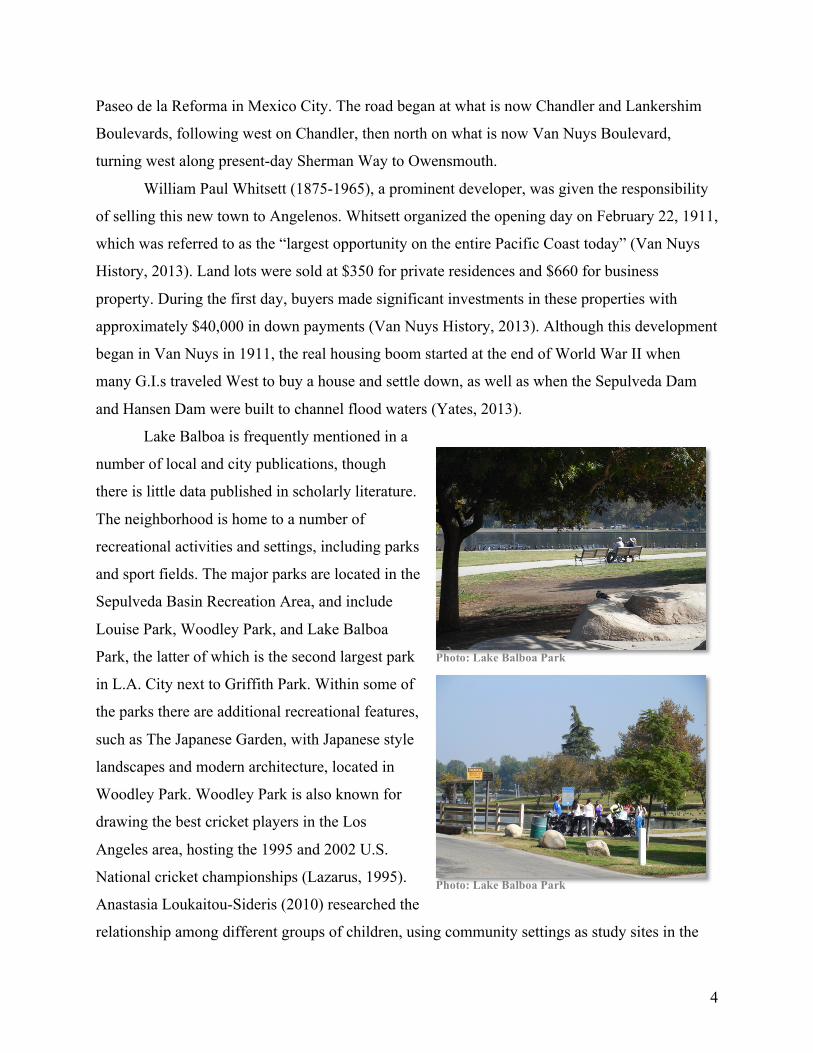
Lake Balboa is frequently mentioned in a
number of local and city publications, though
there is little data published in scholarly literature.
The neighborhood is home to a number of
recreational activities and settings, including parks
and sport fields. The major parks are located in the
Sepulveda Basin Recreation Area, and include
Louise Park, Woodley Park, and Lake Balboa
Park, the latter of which is the second largest park
in L.A. City next to Griffith Park. Within some of
the parks there are additional recreational features,
such as The Japanese Garden, with Japanese style
landscapes and modern architecture, located in
Woodley Park. Woodley Park is also known for
drawing the best cricket players in the Los
Angeles area, hosting the 1995 and 2002 U.S.
National cricket championships (Lazarus, 1995).
Anastasia Loukaitou-Sideris (2010) researched the
relationship among different groups of children, using community settings as study sites in the
Photo: Lake Balboa Park
Photo: Lake Balboa Park

5
research project. Lake Balboa Park was included as a research area along with schools and other
community areas. The author noted that the park was home to a number of cultural groups,
utilizing a variety of park features such as the playgrounds, footpaths, bike paths, fishing areas,
gardens, and picnic areas. The parks also house other recreational activities, including archery
and bird watching. Additionally, the Sepulveda Basin is home to a wildlife preserve that houses
over 200 species in 225 acres (L.A. Mountains, 2013).
While widely known as a recreation center, the Basin is actually a flood control area for
the Los Angeles River and houses a dam. In 1941, the U.S. Army Corps of Engineers built the
Sepulveda Dam to withhold floodwaters along the Los Angeles River. Sepulveda Dam, along
with Hansen Dam in the north of the Valley, were constructed after 144 people were killed
during the historic 1938 L.A. River floods (KCET and Simpson, 2013).
Historically, there are several interesting events and locations to note. In the 1920’s and
30’s, Van Nuys Airport (VNY) was the site of numerous pioneer flights and record-breaking
flights including a man’s solo endurance record of 37 hours, a woman’s endurance record of 42
hours, and a women’s speed record of 196 mph (Los Angeles World Airports, 2013). The airport
was also known for the Hollywood stars that frequently used the airport. The Great Depression
put an end to the corporation that started VNY, but Hollywood filmmakers kept the airport
operating through the war by using it in famous movies scenes such as Hell’s Angels,
Casablanca, Lost Horizon, Men with Wings, and Storm Over the Andes. Filmmakers still
frequent this airport, with scenes shot there found in the films True Lies, Lethal Weapon,
American Beauty, and Pearl Harbor. Today, the Van Nuys Airport also connects with the local
population by hosting a career fair for high school students to promote careers in aviation and a
job-shadowing day for interested students (Los Angeles World Airports, 2013).
Hollywood stars also call Lake Balboa home. Sally Fields graduated from Lake Balboa’s
Birmingham High School in 1964, and in 2010 her alma mater honored her by naming their arts
center after her, now called the “Sally Fields Performing Arts Center.” A childhood home of
Shirley Temple is also located off of Louise Avenue (see Figure 2; Steve Leffert, personal
communication, 2013). Lake Balboa’s secondary schools also house a bit of history as well.
These schools are located in a space once owned by the U.S. Army. Parts of the school and even
the classrooms are located in a building that used to operate as an Army Hospital (see Figure 3).

6
Figures 2-3: A childhood home of Shirley Temple (left) and Army Hospital barracks used for modern day classrooms (right) (authors’ photographs, October 2013)
Lake Balboa Neighborhood Council
The Neighborhood Council (NC) for Lake Balboa was officially chartered by the City of
Los Angeles in September 2004 (Empower L.A., 2012). The Lake Balboa NC board consists of
seventeen publically elected members, including a president, two vice presidents, a secretary, a
treasurer, a communications officer, five chair members, and board members. The five chair
offices are Community Improvement Chair, Land Use and Planning Chair, Emergency
Preparedness Chair, Business Outreach Chair, and General Outreach Chair (Lake Balboa
Neighborhood Council, 2013). Elections were last held in September 2012, with upcoming
elections scheduled for March 2014. NC meetings are held on the first Wednesday of every
month in a public location (Empower L.A., 2012; Lake Balboa Neighborhood Council, 2013).
The overall purpose of the NC, as outlined by the NC Bylaws, is to provide a open forum
for residents to connect with the City of Los Angeles, improve the well-being of the
neighborhood, and participate as representatives of Lake Balboa in City meetings, events, and
local affairs (Empower L.A., 2012). More specifically, one of the current aims of the Lake
Balboa NC is to enable schools to engage in community outreach. Not only will student
involvement benefit the community, but the NC also hopes that students will be able to gain the
necessary community service credits needed for graduation (Empower L.A., 2012). The NC’s
short-term goals are to increase neighborhood awareness of Lake Balboa’s history, activities and
culture, as well as to increase resident engagement in community activities and improvements.

7
Long-term goals include emergency planning, road and sidewalk improvements, increased
economic interest, the construction of a library, and neighborhood beautification.3
Soon after the NC was chartered, funds were applied to the construction of two
emergency lockers (one in the north of Lake Balboa, and one in the south). Housed in large
outdoor storage containers, these lockers hold emergency gear for disaster preparedness,
including search and rescue equipment, triage and medical supplies, emergency lighting, and
power generation equipment (see Figures 4-5).
Figures 4-5: Pictures of the exterior and interior of the emergency locker located in the north of Lake Balboa neighborhood (authors’ photographs, October 2013)
Lake Balboa resident Linda Pruett, the current NC Emergency Preparedness Chair, has also put
emergency preparedness into action following the 1994 Northridge Earthquake. She is certified
to be part of the Community Emergency Response Team (CERT), providing her with the skills
to protect her family, friends, and neighborhood during an emergency (CERT Los Angeles,
2013). Due to her extensive training in this program, Pruett holds the record of training and
graduating the largest CERT class in Los Angeles History (Empower L.A., 2013; Lake Balboa
NC, personal communication, 2013).
3 In addition to a literature search, a portion of the neighborhood history and NC data was collected during a series of on-site visits by the authors to the neighborhood of Lake Balboa. Several NC members graciously answered a number of our inquiries and showed us the main features of their neighborhood.

8
Neighborhood Boundaries
The neighborhood of Lake Balboa covers an area of approximately 3.13 square miles
(Los Angeles Times, 2013), with the most recent boundaries established in 2007 (see Figure 6).
Sastry et al. (2002) assert that despite formal governmental definitions of neighborhood
boundaries in the L.A. area, acceptance of these neighborhood boundaries often varies greatly
depending on one’s level of familiarity with the area. For the purpose of this report, Lake Balboa
refers to the boundaries established by the Lake Balboa NC. Roscoe Boulevard covers the largest
portion of Lake Balboa’s northern boundary. It extends from Louise Avenue east to the 405-
Freeway. The eastern boundary of the neighborhood is not only the longest continuous boundary;
it is also the most clearly defined boundary. The eastern limit consists of the stretch of 405-
Freeway that runs south from Roscoe Boulevard to the 101-Highway interchange. According to
the Lake Balboa NC, the southern boundary is constructed in a way that includes shared space
with the Encino Neighborhood Council (Lake Balboa Neighborhood Council, 2013). The largest
stretch of the neighborhood’s southern boundary runs from along the 101-Highway, leading west
from the I-405 interchange to Balboa Boulevard. It is the largest stretch of the community’s
southern boundary. In addition, small segments of Burbank Boulevard and Oxnard Street make
up the remainder of the southern boundaries. White Oak Avenue serves as Lake Balboa’s largest
western boundary, followed by Louise Avenue in the northwest, connecting with the northern
boundary of Roscoe Boulevard.

9
Figure 6: Map showing the street boundaries of the Lake Balboa NC (Source: Tiger/Line 2010; map created by Shayne Smith, 2013)
Lake Balboa is adjacent to six neighborhoods. The city of Reseda is the largest adjacent
neighborhood to the west, followed by Encino, which is also the only adjoining neighborhood to
the south of Lake Balboa. The eastern border of Lake Balboa touches the neighborhoods of
Sherman Oaks and Van Nuys, while the neighborhoods of North Hills and Northridge run along
Lake Balboa’s northern border.
It is important to note that the traditional Lake Balboa neighborhood boundary lines do
not include portions of the area governed by the Lake Balboa NC. There are two significant areas
governed by the NC that do not technically fall within the Lake Balboa neighborhood
boundaries. The first area is the space between the blocks of Balboa Boulevard and the 405 -
Freeway, and Roscoe Avenue and Saticoy Street. Although this portion of land does not fall
inside the boundaries of Lake Balboa proper, it is nonetheless governed by the Lake Balboa NC.
The second area is located to the south of the traditional Lake Balboa neighborhood boundaries.
The area, known as the Sepulveda Basin Recreation Area, is predominately non-residential

10
space. The Basin is of particular interest not only because it is located outside of the Lake Balboa
neighborhood boundaries, but also because it is the only area that the Lake Balboa NC shares
with another Neighborhood Council, the Encino NC. The two NC’s share the Sepulveda Basin
due to potential stakeholder interest. It is hoped that this will encourage stakeholder involvement
from both of these communities. For the purposes of this report, the authors have relied on the
boundaries set forth by the Lake Balboa NC to calculate data sets and analyze the characteristics
of the neighborhood (see Figures 1 and 6).
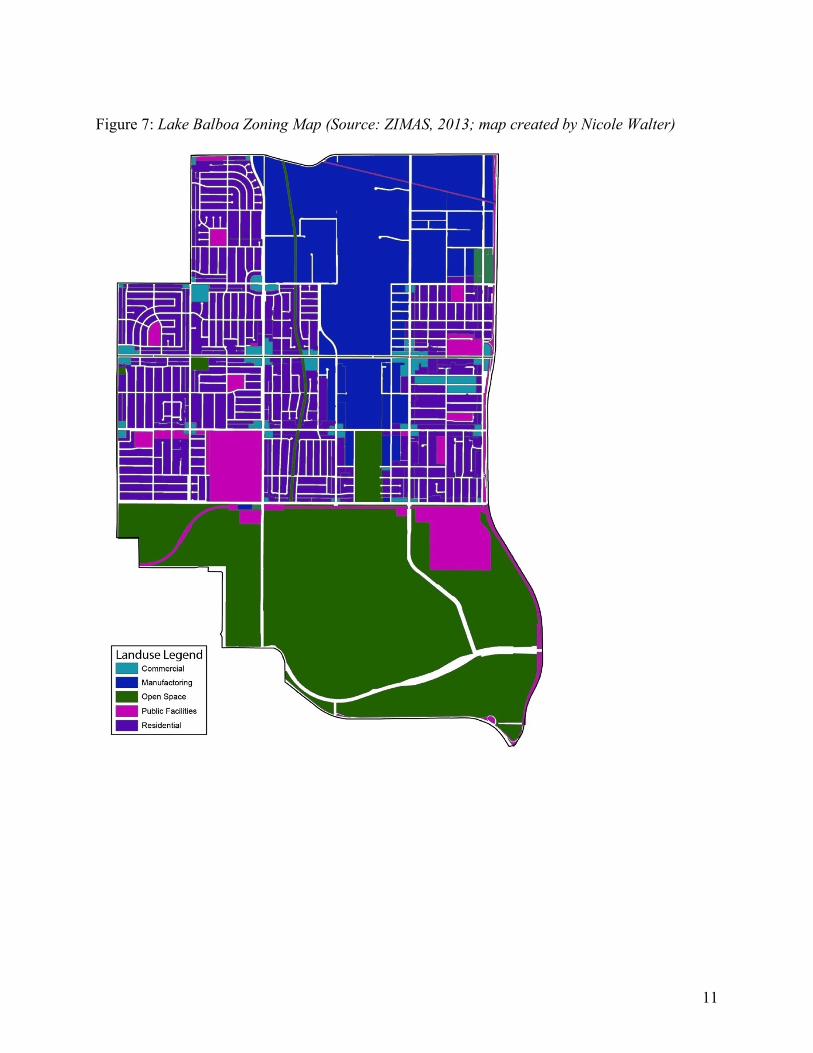
Zoning
Lake Balboa is comprised of numerous land-use zones, though the majority of zones can
be divided into three categories: residential, industrial, and open spaces/public facilities (see
Figure 7). This comments on the basic make-up of the neighborhood, a residential community,
with the residential zones placed in the center of Lake Balboa. The open spaces/public facilities
areas are located in southern are of the community, encompassing the Sepulveda Basin
Recreation Area, and its numerous parks. The industrial zones are mainly concentrated in the
center, and to the north, of the NC area. This area includes the Van Nuys Airport, associated
airport businesses, and MGA Entertainment, a large toy company with headquarters in the north
of the neighborhood (MGA Entertainment, 2013). Though they are not numerous, there are
several commercial zones situated within Lake Balboa.
11
Figure 7: Lake Balboa Zoning Map (Source: ZIMAS, 2013; map created by Nicole Walter)

12
PART II: Demographics
__________________________________________________________________
This section of the report aims to investigate the demographic composition of
contemporary Lake Balboa. Lake Balboa occupies a unique space within the San Fernando
Valley; defined by vast open recreational spaces and large residential lots, this place is the home
to a wide range of individuals. In many ways, the demographics of Lake Balboa closely mirror
the demographics of L.A. City. Lake Balboa is a diverse community with links to many different
ethnicities. Although the majority of Lake Balboa residents identify as Hispanic, Asians and
Whites represent a significant proportion of the overall population. In fact, businesses targeting
the Asian and Hispanic populations can be found throughout the neighborhood, rather than in
concentrated areas on the periphery of Lake Balboa.
Population by Race/Ethnicity
Lake Balboa has a population of 42,271 individuals, who represent a wide range of
races/ethnicities. Although the community is racially diverse, the majority of the population
identifies as Hispanic (55% vs. 49%, respectively; see Figure 8). However, prior to 2000, the
majority of Lake Balboa residents identified as white (see Table 1). Since 1970, Lake Balboa’s
white population has decreased by 61%, while the Hispanic population has increased by 359%
(U.S. Census Bureau, 2010). The data suggests that over time, Lake Balboa’s population has
become more racially diverse. One major difference between Lake Balboa and L.A. City is the
percentage of residents that identify as African American. Proportionally, Lake Balboa’s Black
population is significantly smaller than that of L.A. City (5% vs. 10%, respectively).

13
Table 1: Lake Balboa Population by Race / Ethnicity: 1970 – 2010 Year% White% Hispanic% Asian% Black% Other% Population%
1970% 32937! N/A! 281! 45! 78! 33341!
1980% 24216! 5033! 999! 656! 446! 31350!
1990% 21015! 12927! 2229! 1648! 192! 38011!
2000% 14829! 19391! 3186! 2361! 857! 40625!
2010% 12925! 23079! 3660! 2265! 342! 42271!Increase%from%1970%R%2010*% R61%% 359%% 1201%% 4987%% 338%% 27%%
*Hispanic!data!was!unavailable!for!1970.!Percent!indicates!percentage!increase!from!1980\2010.!
Source:!Logan,!John!R.,!Zengwang!Xu,!and!Brian!Stults.!2012.!"Interpolating!US!Decennial!Census!Tract!Data!from!as!early!as!1970!to!2010:!A!Longitudinal!Tract!Database"!Professional!Geographer,!forthcoming.!
Figure 8: 2010 Lake Balboa Demographic Composition
Additional data suggests that the Lake Balboa Hispanic/Latino population is fairly
diverse. Mexicans are the single largest Hispanic group in Lake Balboa, accounting for 58% of
the Hispanic population, and 32% of Lake Balboa’s overall population. Additionally,
approximately 22% of Lake Balboa’s Hispanic population identifies as “Other Hispanic or
Latino” (ACS, 2011). Puerto Ricans are the second largest individually recognized Hispanic/
Latino group, accounting for less than 1% of the Hispanic/Latino population. Cubans are the
31%!
55%!
9%!5%!
1%!
29%!
48%!
11%! 10%!
2%!
0%!
10%!
20%!
30%!
40%!
50%!
60%!
White! Hispanic! Asian! Black! Other!
Lake!Balboa! LA!City!

14
third largest individually recognized group, representing less than 1% of the Hispanic/ Latino
population as well. Although these groups all identify as Hispanic/ Latino, each group has
different cultural influences on the community. By acknowledging the diversity that exists within
the Hispanic/ Latino population, the Lake Balboa NC could begin to better understand the needs
of the community and build upon their neighborhood’s cultural identity.
Population by Age and Gender
Lake Balboa’s population is comprised of nearly 50% male and 50% female residents.
The median age of Lake Balboa’s population is 33-years of age (compared to L.A. City’s median
age of 34). Approximately 87% of Lake Balboa residents are below the age of 60. This data
suggests that Lake Balboa is a relatively young community. Approximately 43% of Lake Balboa
residents are between the ages of 30 and 59. Lake Balboa’s population by age nearly mirrors that
of L.A. City, with only a couple of exceptions. Lake Balboa has a greater percentage of residents
ages 19 or younger compared with L.A. City (28% vs. 26%, respectively). Conversely, L.A. City
has a larger percentage of residents between the ages of 20 and 29 than Lake Balboa (17% vs.
15%, respectively). The most significant difference between the populations of Lake Balboa and
L.A. City pertains to the elderly population. Approximately 4% of L.A.’s overall population is
80 years of age or older, whereas only 2% of Lake Balboa’s population identifies as such (see
Figure 9). The data supports the notion that Lake Balboa has a relatively young population.
Figure 9: Population Pyramid (Source: U.S. 2010 Decennial Census, Tables SL140 & S010)
6.6!6.1!6.3!7.2!8.3!
16.8!15.0!
13.3!9.9!
5.5!3.4!
1.6!
7.4!6.7!6.7!7.1!7.4!
16.1!16.3!
13.9!9.7!
4.8!2.7!
1.2!
20! 15! 10! 5! 0! 5! 10! 15! 20!
Under!5!!5!to!9!!
10!to!14!!15!to!19!!20!to!24!!25!to!34!!35!to!44!!45!to!54!!55!to!64!!65!to!74!!75!to!84!!
85!+!
Percentage%
Lake!Balboa! LA!City!

15
Nativity
Lake Balboa has a similar U.S. native population as L.A. City (59% vs. 61%,
respectively). Of the foreign-born population, 18% are naturalized citizens and 23% are non-U.S.
citizens (see Figure 10). This means that 77% of Lake Balboa’s residents are U.S. citizens. Lake
Balboa’s higher percentage of naturalized citizens than L.A. City reinforces the notion that Lake
Balboa has a highly diverse population, with a variety of cultural backgrounds.
Figure 10: Lake Balboa and L.A. Nativity Percentages (Source: ACS 2007-2011 5-Year Estimate, Tables B05001 & S0501)
Household Types
As discussed in the Population by Age subsection, Lake Balboa has a higher percentage
of people between the ages of 25 and 44 than L.A. City (33% vs. 30%, respectively). Lake
Balboa also appears to have a higher percentage of children under the age of five, as well as
between the ages of 5 and 14 years old (22% vs. 20%, respectively). Combined, these statistics
indicate that the Lake Balboa has a relatively young population. Furthermore, approximately
70% of the households in Lake Balboa identify as being family-households, indicating that Lake
Balboa is a very family-oriented neighborhood. Of the reported 14,151 households in Lake
Balboa, 42% or 6,021 identify as being a married-family-household. The remaining family-
households fall in one of two categories, “Male Householder” or “Female Householder,” with
females outnumbering males by a count of 2,694 to 1,213. Although women in Lake Balboa tend
to head most of the single-earner family-households, more males head non-family households
than women (2,294 compared to the 1,939 headed by women). Overall though, exclusively male-
59%!
18%! 23%!
61%!
16%!24%!
0%!10%!20%!30%!40%!50%!60%!70%!
Native!Born! Naturalized! Not!A!U.S.!Citizen!
Population%
Lake!Balboa! LA!City!

16
led households account for 25% of all households in Lake Balboa, while exclusively female-led
households and married households account for the remaining households (33% vs. 42%).
Lake Balboa has a considerably higher percentage of married-family households than
L.A. City (70% and 61%, respectively; see Figure 11), further confirming that Lake Balboa is a
family-oriented community. As can be expected, Lake Balboa has a smaller percentage of non-
family households than L.A. City. Although the data presented here demonstrates the household
structure in present-day Lake Balboa, comparing household types overtime will provide further
insight about the shift in population characteristics over the years. This will be explored in the
Housing subsection of this report.
Figure 11: Percent of Family and Nonfamily Households (Source: ACS 2007-2011 5-Year Estimate, SL140 & S1101)
Language
It is likely that Lake Balboa’s racial and ethnic diversity play a significant role in the
languages that are spoken within community. In fact, approximately 63% of Lake Balboa
residents over the age of five speak a language other than English (ACS, 2013; see Appendix C,
Figure 40 for a spatial display of languages). Lake Balboa’s diverse population is likely
responsible for the relatively small population of residents that only speak English, who account
for 37% of the overall population. Diversity also provides at least partial explanation for Lake
Balboa’s considerably large population of only Spanish speaking residents, which make up 47%
61%!
70%!
39%!
30%!
0%!
10%!
20%!
30%!
40%!
50%!
60%!
70%!
80%!
LA!City!! Lake!Balboa!
Family!Households! Nonfamily!Households!

17
of the overall population (ACS, 2013). Additionally, 5% of Lake Balboa’s population speaks
either an Asian or Pacific Island language.
Summary
The demographic characteristics presented in this section revealed several interesting
findings about Lake Balboa. Lake Balboa has a young, racially diverse population with residents
that speak a wide variety of languages. Appreciating the racial diversity and the presence of
family in Lake Balboa will help facilitate the investigation into the community’s socioeconomic
characteristics.
18
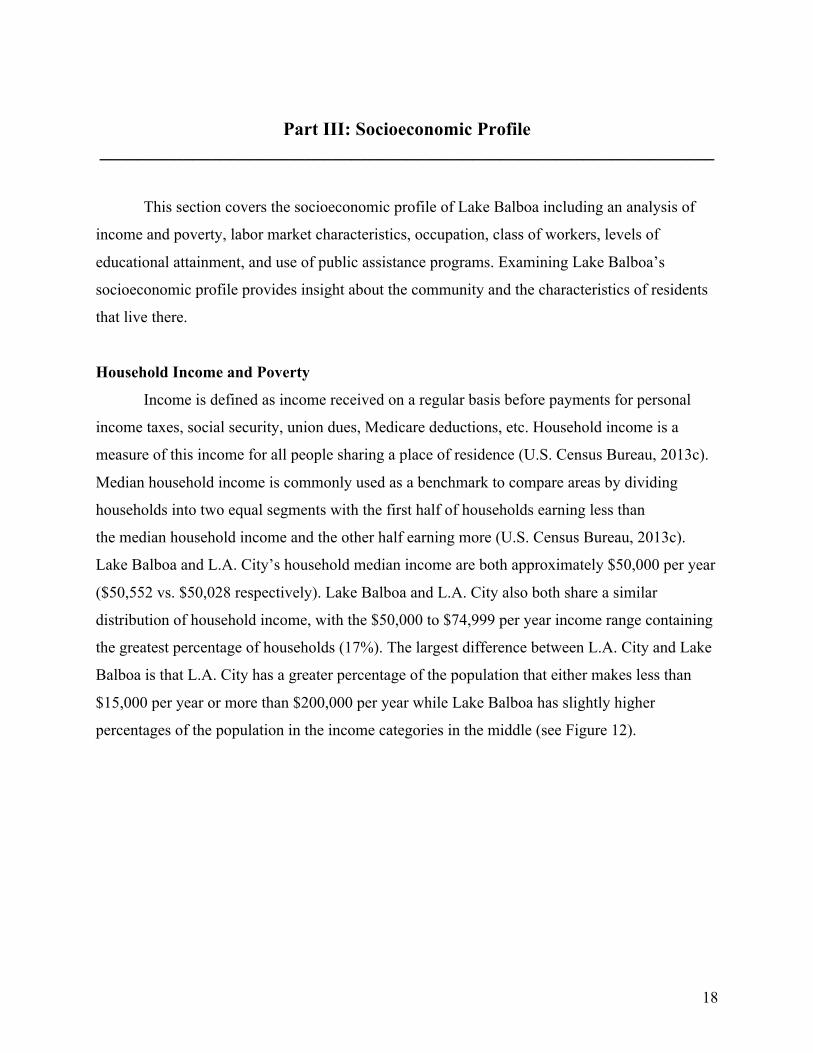
Part III: Socioeconomic Profile
__________________________________________________________________
This section covers the socioeconomic profile of Lake Balboa including an analysis of
income and poverty, labor market characteristics, occupation, class of workers, levels of
educational attainment, and use of public assistance programs. Examining Lake Balboa’s
socioeconomic profile provides insight about the community and the characteristics of residents
that live there.
Household Income and Poverty
Income is defined as income received on a regular basis before payments for personal
income taxes, social security, union dues, Medicare deductions, etc. Household income is a
measure of this income for all people sharing a place of residence (U.S. Census Bureau, 2013c).
Median household income is commonly used as a benchmark to compare areas by dividing
households into two equal segments with the first half of households earning less than
the median household income and the other half earning more (U.S. Census Bureau, 2013c).
Lake Balboa and L.A. City’s household median income are both approximately $50,000 per year
($50,552 vs. $50,028 respectively). Lake Balboa and L.A. City also both share a similar
distribution of household income, with the $50,000 to $74,999 per year income range containing
the greatest percentage of households (17%). The largest difference between L.A. City and Lake
Balboa is that L.A. City has a greater percentage of the population that either makes less than
$15,000 per year or more than $200,000 per year while Lake Balboa has slightly higher
percentages of the population in the income categories in the middle (see Figure 12).

19
Figure 12: Household Income (Source: ACS 2007-2011 5-Year Estimate, Tables B19001 & B22008)
The percentage of households living below poverty level is important neighborhood
information, which can be used to inform policy or budgeting decisions. Poverty level is a
minimum income level below which a person is officially considered to lack adequate
subsistence and to be living in poverty (U.S. Census Bureau, 2013c). For example, the poverty
level for a family of four is $23,550 per year (add or subtract $4,020 per family member). In
Lake Balboa, 17% of the population is living below the poverty level, which is lower than the
percentage of the population living below the poverty level in L.A. City (20%). Of the total
number of females living in Lake Balboa, 18% were living below the poverty level, while only
8% of all males were living below the poverty level (see Figure 13). This substantial difference
shows that women in Lake Balboa are more prone to living in poverty than males.
Figure 13: Percentage of Lake Balboa’s Male and Female Population living below Poverty Level (Source: ACS 2007-2011 5-Year Estimate, Table S1501)
0%!
5%!
10%!
15%!
20%!
<!$10,000! $10,000!\!$14,999!
$15,000!\!$24,999!
$25,000!\!$34,999!
$35,000!\!$49,999!
$50,000!\!$74,999!
$75,000!\!$99,999!
$100,000!\!$149,999!
$150,000!\!$199,999!
>!$200,000!!
Household%Income%Per%Year%
Lake!Balboa! LA!City!
18%!
8%!
0%!
5%!
10%!
15%!
20%!
Females! Males!

20
Labor Market Characteristics
Labor force participation rate (LFPR) indicates the actual number of residents available
for work, which includes the employed and unemployed, divided by the overall size of the
worker population (U.S. Census Bureau, 2013c). Of residents aged 16 years and over in Lake
Balboa, 68% are in the labor force (compared to 67% in L.A. City), which includes 8% that are
unemployed and currently seeking work (see Figure 14). Lake Balboa and L.A. City have
essentially the same LFPR. However, Lake Balboa’s unemployment rate is about two percentage
points less than L.A. City, which has a 10% unemployment rate. This could indicate that Lake
Balboa residents have an easier time finding employment than L.A. City residents. Though
unemployment is lower than L.A. City, a large percentage of residents are living below poverty,
suggesting that Lake Balboa residents may have lower paying jobs.
Figure 14: Employment Status (Source: ACS 2007-2011 5-Year Estimate, Table S2301 & B23025)
Full-Time Full-Year Workers
Another important aspect to look at is the Full-Time Full-Year (FTFY) employment. A
person is considered employed FTFY if he or she works 35 hours or more per week and 50 or
more weeks per year (U.S. Census Bureau, 2013c). While FTFY does not signify whether a
person is eligible for fringe benefits (employee benefits such as health insurance), full-time
employees are more likely to have benefits. Furthermore, full-time workers are less likely to
among the working poor than part-time workers (U.S. Bureau of Labor Statistics, 2013).
According to the UC Davis Center for Poverty Research, working poor are defined as people
who spend 27 weeks or more in a year “in the labor force” either working or looking for
68%!
32%!
67%!
34%!
0%!10%!20%!30%!40%!50%!60%!70%!80%!
In!Labor!Force! Not!in!Labor!Force!
Lake!Balboa! LA!City!
21
work, but whose incomes fall below the poverty level. In analyzing the American Community
Survey data, 46% of residents in Lake Balboa were identified as being FTFY workers. This is
quite lower than L.A. City’s 53% of the population that are FTFY. Lake Balboa’s much lower
percentage of residents working FTFY than L.A. City could potentially indicate that Lake
Balboa residents are less likely to have employee benefits than in the rest of L.A. City. In
looking at the disaggregated gender data, Lake Balboa has significantly less women (40%)
working FTFY than men (60%). These proportions are almost exactly the same as L.A. City
(41% vs. 59%, respectively). There is also not much difference between Lake Balboa and L.A.
City’s median annual income in earnings for FTFY workers ($38,438 vs. $37,960, respectively).
The lower percentage of FTFY workers in Lake Balboa reaffirms the existence of a working
poor population.
Occupation
Looking at the breakdown of occupations in Lake Balboa reveals that there is some
variation in comparison to L.A. City. While Lake Balboa residents have much less residents
working in management, business, science and art occupations than L.A. City (27% vs. 35%,
respectively), it is still the most common occupation group in Lake Balboa (see Figure 15). One
of the greatest differences between Lake Balboa and L.A. City is Lake Balboa’s higher
percentage of residents working in natural resources, construction and maintenance operations
than L.A. City (13% vs. 9%, respectively). This breakdown of occupation categories may
provide information on Lake Balboa’s working poor population since working in natural
resources, construction and maintenance jobs is often associated with lower paying jobs while
management, business, science and art occupations may be higher paying jobs.

22
Figure 15: Occupation (source: ACS 2007-2011 5-Year Estimate, Table C24060, B23025)
Class of Worker
Class of worker looks at people according to their employing organization. This
information describes the work activity of the labor force in Lake Balboa. The American
Community Survey breaks class of worker into the following categories: private sector,
government, self-employed, and unpaid family workers (ACS, 2013). The private sector includes
those who work for wages or salaries for a private for-profit employer, nonprofit, or individuals
who are self-employed within their own incorporated businesses. While L.A. City has more than
three quarters of it’s workers in the private wage and salary category, Lake Balboa has only 41%.
Lake Balboa has a very high percentage (33%) of workers that work for the government,
including local, state and federal. Class of worker can include teachers at a public school or
employees of a bus company or a city owned airport (such as Van Nuys Airport), which is most
likely the case in Lake Balboa. In looking at a breakdown of those residents that work for the
government, over 60% work for the local government, with about 30% working for the state (see
Figure 16 and 17). This data could potentially be used to formulate policies for career
development and training or for creating jobs since companies may use this data to decide where
to locate new plants or offices.
27%!
22%!26%!
13%!11%!
35%!
20%!24%!
9%!12%!
0%!5%!10%!15%!20%!25%!30%!35%!40%!
!!Management,!business,!science,!and!arts!occupations!
!!Service!occupations! !!Sales!and!ofhice!occupations!
!!Natural!resources,!construction,!and!maintenance!occupations!
!!Production,!transportation,!and!material!moving!occupations!
Lake!Balboa! LA!City!

23
Figure 16: Class of Worker: Population 16 Years and Over (Source: ACS 2007-2011 5-Year Estimate, Table B24081)
Figure 17: Lake Balboa Class of Worker – Government Workers (Source: ACS 2007-2011 5-Year Estimate, Table B24081)
Educational Attainment
Education attainment refers to the highest level of education that an individual has
completed (U.S. Census Bureau, 2013c). In comparing the population 25 years and older in Lake
Balboa and L.A. City, there are quite a few differences that should be noted. Lake Balboa and
L.A. City have similar percentages for those who with less than a high school diploma (23% vs.
26%, respectively). Lake Balboa has a higher percentage of residents that completed high school
with about 26% versus L.A. City’s 20%. Educational attainment in Lake Balboa continues to
increase after high school completion with 30% completing some college or obtaining an
associate’s degree. However, Lake Balboa has fewer residents that have obtained a bachelor’s
degree or higher education (21%) than LA City (31%), which is a 10-percentage point difference
49%!
33%!
19%!
78%!
10%! 12%!
0%!10%!20%!30%!40%!50%!60%!70%!80%!90%!
Private!wage!&!salary! Government! Self\employed!in!own!not!incorporated!business!workers!
&!unpaid!family!!
Lake!Balboa! LA!City!
61%!
30%!
9%!
Local!government!!
State!Government!!
Federal!Government!

24
(see Figure 18). Considering Lake Balboa’s younger
population, it could be useful to invest in assisting
residents to obtain a bachelor’s degree or higher levels
of education. Furthermore, the likelihood of being
classified as working poor diminishes as workers attain
higher levels of education. This relationship can be
seen in Lake Balboa, where 37% of the population 25
years and over living below poverty level have not
completed high school (see Figure 19). According to a
profile of the working poor in the USA by the U.S. Bureau of Labor Statistics, 2% of college
students who were in the labor force for at least 27 weeks were classified as working poor,
compared with 20% percent of those with less than a high school diploma (U.S. Bureau of Labor
Statistics, 2013). Though not categorized by FTFY, it is apparent that attaining higher levels of
education could reduce the population living below poverty level, as well as with the working
poor in Lake Balboa.
Figure 18: Educational Attainment for Population 25 years and over (source: ACS 2007-2011 5-Year Estimate, Tables B22008 & S1501)
23%!26%!
30%!
21%!
26%!
20%!
24%!
31%!
0%!
5%!
10%!
15%!
20%!
25%!
30%!
35%!
Less!than!high!school! !High!school!graduate!(includes!equivalency)!
Some!college/associate's!degree!
!Bachelor's!degree!or!higher!
Lake!Balboa! LA!City!
Photo: Birmingham Community Charter School in Lake Balboa

25
Figure 19: Percentage of Population 25 years and over in Lake Balboa living below Poverty Level by Educational Attainment (Source: ACS 2007-2011 5-Year Estimate, Table S1501)
Public Assistance Programs
The percentages of the population using public assistance are also similar between L.A.
City (8%) and Lake Balboa (7%). Public assistance refers to social security income, cash public
assistance, food stamps and the Supplemental Nutrition Assistance Program (SNAP). These
programs allow households to not spend as much of their income on meeting their basic needs.
Supplemental Security Income (SSI) is also available for individuals with a low income who are
65 and older, or for individuals who are blind and/or disabled. In Lake Balboa and L.A. City, 6%
of residents receive SSI. Overall, the percentages for public assistance and SSI benefits in Lake
Balboa mirror those of L.A. City.
Summary
Many of Lake Balboa’s socioeconomic characteristics are similar to those of L.A. City.
Some of the key differences about Lake Balboa include its higher percentage of government
workers, lower percentage of residents that completed college or high education, lower
percentage of FTFY workers, and lower percentage of residents that work in business
management, science or art occupations.
37%!
28%! 28%!
7%!
0%!
5%!
10%!
15%!
20%!
25%!
30%!
35%!
40%!
Less!than!high!school!graduate!
High!school!graduate!(includes!
equivalency)!
Some!college,!associate's!degree!
Bachelor's!degree!or!higher!

26
PART IV: Housing and Transportation Characteristics
__________________________________________________________________
This section of the report focuses on two topics, housing and transportation. The housing
portion focuses on resident tenure, home values, rent levels, and housing burden. Transportation
characteristics that will be covered include car ownership and commute patterns. Both housing
and transportation in Lake Balboa have seen dramatic changes in recent years. Lake Balboa’s
current housing market is full of intense variation.
Housing
Resident Tenure
The community of Lake Balboa is split evenly between renter-occupied units and owner-
occupied units (49% vs. 51%, respectively; ACS, 2011). When compared to L.A. City, it
becomes apparent that Lake Balboa has a significantly higher percentage of owner-occupied
units (see Table 2). This suggests that Lake Balboa resident’s have an easier time buying a home
than L.A. City residents. In addition, this data also suggests that homes may simply be more
affordable in Lake Balboa than in L.A. City.
Table 2: Housing Tenure: Owner and Renter Occupied Units (Source: ACS 2007-2011 5-Year Estimate, Tables S250 & DP04) Location% OwnerRoccupied% RenterRoccupied%
Lake!Balboa! 49%! 51%!
L.A.!City! 38%! 62%!

27
As a whole the majority of Lake Balboa residents moved in to their current home after 2000
(60% compared to the 40% who moved in prior to 2000; see Table 3). Of the 40% who moved in
prior to 2000, 30% moved into their current home between 1980 and 1999. The remaining 9% of
Lake Balboa residents have lived in their home for more than 43 years. Although Lake Balboa
and L.A. City are similar regarding resident’s move-in years, a greater percentage of Lake
Balboa residents moved into their current home prior to 2000 (40% vs. 37%, respectively).
Given Lake Balboa’s relatively young population, this suggests that new families are moving to
the area. However, the high number of residents who moved in prior to 2000 suggests that there
is not a lot of movement in or out of the area.
Table 3: L.A. City and Lake Balboa Resident Move-in Years by Percentage (Source: ACS 2007-2011 5-Year Estimate, Tables S250 & DP04) Location% 1999%or%Earlier% 2000%or%Earlier%
Lake!Balboa! 40%! 60%!
L.A.!City! 37%! 63%!
Home Values
The housing market in Lake Balboa, like many San Fernando Valley communities, is still
in the process of recovering from the housing market collapse, commonly referred to as The
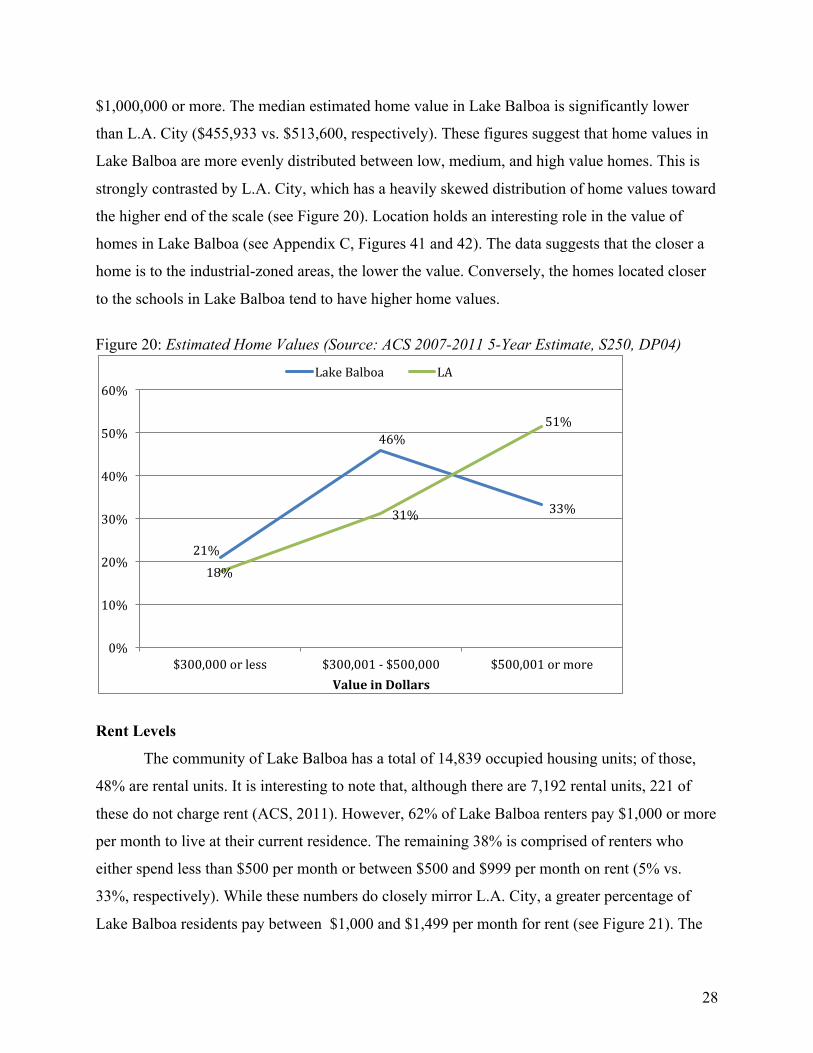
Great Recession of 2007-2009 (Saez, 2012). A total of 46% of the homes in the area have an
estimated value between $300,001-$500,000. In fact, only 21% of Lake Balboa homes have an
estimated value of $300,000 or less. Data indicates that 33% of Lake Balboa homes have an
estimated value of at least $500,001; while just over 2% of homes in the area have a value of
Photo: Homes in Lake Balboa Photo: Apartments in Lake Balboa
28
$1,000,000 or more. The median estimated home value in Lake Balboa is significantly lower
than L.A. City ($455,933 vs. $513,600, respectively). These figures suggest that home values in
Lake Balboa are more evenly distributed between low, medium, and high value homes. This is
strongly contrasted by L.A. City, which has a heavily skewed distribution of home values toward
the higher end of the scale (see Figure 20). Location holds an interesting role in the value of
homes in Lake Balboa (see Appendix C, Figures 41 and 42). The data suggests that the closer a
home is to the industrial-zoned areas, the lower the value. Conversely, the homes located closer
to the schools in Lake Balboa tend to have higher home values.
Figure 20: Estimated Home Values (Source: ACS 2007-2011 5-Year Estimate, S250, DP04)
Rent Levels
The community of Lake Balboa has a total of 14,839 occupied housing units; of those,
48% are rental units. It is interesting to note that, although there are 7,192 rental units, 221 of
these do not charge rent (ACS, 2011). However, 62% of Lake Balboa renters pay $1,000 or more
per month to live at their current residence. The remaining 38% is comprised of renters who
either spend less than $500 per month or between $500 and $999 per month on rent (5% vs.
33%, respectively). While these numbers do closely mirror L.A. City, a greater percentage of
Lake Balboa residents pay between $1,000 and $1,499 per month for rent (see Figure 21). The
21%!
46%!
33%!
18%!
31%!
51%!
0%!
10%!
20%!
30%!
40%!
50%!
60%!
$300,000!or!less! $300,001!\!$500,000! $500,001!or!more!
Value%in%Dollars%
Lake!Balboa! LA!

29
high percentage of Lake Balboa residents spending between $1,000 and $1,499 per month on
rent has resulted in the neighborhood having a slightly higher median gross rent than L.A. City
($1,195 vs. $1,127, respectively).
Figure 21: Gross Rent Paid by Percent of Population (Source: ACS 2007-2011 5-Year Estimate, S250, DP04)
Housing Burden
Similar to many communities in the United States, the real estate market in Lake Balboa
changed dramatically as a result of The Great Recession. As a result, a number of current Lake
Balboa residents have what the U.S. Department of Housing and Urban Development (HUD)
suggests are unaffordable housing costs (HUD, 2013). According to HUD, monthly housing
expenses are deemed cost-burdened when they exceed 30% of the household income. Currently
59% of Lake Balboa renters spend more than 30% of their monthly income on housing expenses,
while 56% of homeowners spend 30% or more of their income on housing costs (see Table 4).
Housing burden in Lake Balboa appears to affect all residents the same, whether renting or
owning, the percentages of affected residents is approximately the same for both.
0%!
5%!
10%!
15%!
20%!
25%!
30%!
35%!
40%!
45%!
$200!or!Less! $200!to!$299! !$300!to!$499! $500!to!$749! $750!to!$999! $1,000!to!$1,499!
$1,500!or!more!
Lake!Balboa! LA!

30
Table 4: Percentage of Households Spending 30% or More of Income on Housing by Resident Type (Source: ACS 2007-2011 5-Year Estimate, S250, DP04). Location% Renters%% Owners%%
Lake!Balboa! 59%! 56%!
L.A.!City! 59%! 55%!
Transportation
Car Ownership
Like virtually all Los Angeles communities, Lake Balboa is a car-oriented neighborhood.
The most recent count indicates that there are approximately 16,095 vehicles in Lake Balboa,
with 38% of households having 3 or more cars. Although Lake Balboa is considered to be car-
oriented, with approximately 42,271 residents there is a car to person ratio of 1:2.7. This high
number of cars per household could be because Lake Balboa is a family-oriented neighborhood,
with various family members needing to go to different locations and thus creating the need for
households to have more than one car. Males make up the majority of vehicle owners in Lake
Balboa, accounting for 56% of owners. This disparity could be the result of fewer females being
in the labor force and thus not needing transportation to commute to work. Car ownership rates
in Lake Balboa closely mirror L.A. City (see Table 5). The similarities between L.A. City and
Lake Balboa are surprising given that Lake Balboa drivers account for only 1.3% of all L.A. area
drivers.
Table 5: Vehicle Ownership in Lake Balboa and L.A. City (Source: ACS 2007-2011 5-Year Estimate, S250, DP04). Location% Male% Female%
Lake!Balboa!! 56%! 44%!
L.A.!City! 56%! 44%!
Commute Patterns
As can be expected with any car-oriented community, driving to and from work or school
is an essential part of daily life. In Lake Balboa approximately 85% of the commuting population
drives a car, truck, or van. Conversely, only 2% of Lake Balboa commuters walk or use a bike on
their commute, while only 12% carpooled or took public transportation (ACS, 2013). The

31
remaining 2% of commuters commute via taxi, motorcycle, or other means. When compared to
L.A. City, it becomes clear that Lake Balboa has a higher percentage of commuters driving alone
(77% vs. 67%, respectively). It is also important to note that Lake Balboa has a significantly
smaller percentage of carpoolers, public transit riders, and walkers, than the City of L.A. (see
Figure 22). In terms of time spent commuting, roughly 63% of Lake Balboa residents spend
more than 20 minutes commuting to work (ACS, 2011). Just over 14% of residents have
commute times exceeding 60 minutes.
When looking at commute
patterns by gender, two patterns stand out.
First, more male’s commute alone than
females. Secondly, more females
commute via public transit than males.
These figures are significant primarily
because Lake Balboa’s working-age
population is split 50-50 between males
and females. With regard to commute
patterns by gender, a few possible conclusions can be drawn. One possible explanation for the
disproportionate number of females using public transit is that, females, in general, tend to work
closer to their homes. Another possible explanation is that since working-age females own fewer
cars than working-age males, they are more reliant on public transportation
Photo: Bus stop in Lake Balboa

32
Figure 22: Means of Transportation (Source: ACS 2007-2011 5-Year Estimate, S250, DP04).
Summary
The housing and transportation trends presented in this section revealed several
interesting findings. The occupancy of housing units in Lake Balboa is split almost 50-50
between renters and owners, with similar percentages of each group experiencing a housing
burden. Homes in Lake Balboa tend to have low values and high rents, with the majority of
residents spending between $1,000 and $1,499 per month for rent.
77%!
9%! 6%!1%! 3%! 5%!
67%!
11%! 11%!4%! 2%! 5%!
0%!
10%!
20%!
30%!
40%!
50%!
60%!
70%!
80%!
90%!
Car,!truck,!or!van!\!drove!alone!
Car,!truck,!or!van!\!carpooled!
Public!transportation!(excluding!taxicab)!
Walked! Taxicab,!motorcycle,!
bicycle,!or!other!means!
Worked!at!home!
Lake!Balboa! LA!City!
33
PART V: Neighborhood Economic Base
__________________________________________________________________
This section discusses the economic profile of Lake Balboa by utilizing job and jobholder
data from the past decade (2002-2011; U.S. Census Bureau, LEHD, 2013).4 Neighborhood
economy is centered on the process of producing and circulating goods and services in a
particular area. Specifically, this section reviews recent employment trends, job types, and
characteristics of jobholders, including age, gender, race/ethnicity, and educational attainment.
Spatial patterning of each of these topics will also be reviewed to provide a clearer picture of the
economic profile of this neighborhood graphically.
Employment Trends
Over the last ten years there has been some shift in the employment trends in Lake
Balboa. This can be seen when examining the total number of jobs in the neighborhood from
2002-2011 (see Figure 23). It appears there was a large decrease in jobs from 2002 to 2009,
although the total number of jobs has seen a slight increase since 2009. Conversely, jobs have
increased substantially in L.A. City since 2002 (see Figure 24). To determine the growth of jobs
over the last decade, the total number of jobs from 2011 can be compared with the total number
of jobs from 2002. In 2011, there were 21,825 jobs in Lake Balboa. In 2002, however, the total
count was higher at 25,389 jobs. Based on this, job growth in the neighborhood has decreased by
14% or declined 1.4% per year.5 In L.A. City, however, jobs have increased by 14%. Therefore,
while there has been an overall increase of jobs in L.A. City overall, these jobs have not been
located in Lake Balboa. This could indicate that Lake Balboa has shifted from a mainly industrial
neighborhood to more of a residential area, or that companies are moving away or decreasing
their staff.
4 For more information on this data source, see Appendix A. 5 The formula used to calculate the growth rate, see Appendix B.

34
Figure 23: Employment Trends from 2002-2011 for Lake Balboa (Source: U.S. Census Bureau, LEHD)
Figure 24: Employment Trends from 2002-2011 for L.A. City (Source: U.S. Census Bureau, LEHD)
Looking at the most recently available data from 2011, we can see that the jobs within
Lake Balboa are concentrated in specific areas of the neighborhood (see Figure 25). Most jobs
per square mile are located in the middle and northern areas of the NC boundaries, positioned
around the Van Nuys Airport. This data is most telling when compared with the zoning
information for the neighborhood (see Figure 7). Based on this, it appears that the majority of
jobs are located in industrial and public facilities zoned areas. This association agrees with the
overall zoning spaces of Lake Balboa, as roughly two thirds of the neighborhood is zoned as
industrial and for public facilities (and includes numerous parks, Van Nuys Airport, MGA
0!
5000!
10000!
15000!
20000!
25000!
30000!
2002! 2003! 2004! 2005! 2006! 2007! 2008! 2009! 2010! 2011!
Num
ber%of%Jobs%
Year%
1,350,000!
1,400,000!
1,450,000!
1,500,000!
1,550,000!
1,600,000!
1,650,000!
1,700,000!
2002! 2003! 2004! 2005! 2006! 2007! 2008! 2009! 2010! 2011!
Num
ber%of%Jobs%
Year%

35
Entertainment, and a Budweiser brewery), while the remaining third of the zoning is mostly
residential.
Figure 25: Proportion of Jobs per square mile for Lake Balboa (Source: U.S. Census Bureau, LEHD)
Data has also been complied on the inflow and outflow of jobholders by the U.S. Census
Bureau, LEHD (2013). Inflow factors are those that increase economic activity, while outflow
characteristics decrease economic levels. In relation to jobs, the inflow total represents the
number of individuals who work in Lake Balboa, but live outside the neighborhood. Conversely,
the outflow total represents those individuals who live in Lake Balboa, but work outside the
neighborhood boundaries. There is also a count of individuals who both live and work in Lake
Balboa noted in the statistics. Compared with the outflow counts of the jobholders living and/or
working in Lake Balboa, 57% held jobs in the community, with 2% of this total being NC
residents (see Figure 26). Of the jobholders employed in Lake Balboa but living outside the NC
boundaries, the majority resided in L.A. City (52%; U.S. Census Bureau, LEHD, 2013). In 2011,
43% of NC jobholders were employed outside the neighborhood. Based on this, it is possible to
conclude that there was a favorable economic situation in Lake Balboa in 2011.
Legend
Lake Balboa NC

36
Figure 26: Inflow/Outflow Job Counts for Lake Balboa (Source: U.S. Census Bureau, LEHD)
Figure 26 above highlights that there are a large percentage of jobholders who commute
in and out of the NC boundaries. Commuting statistics for Lake Balboa and L.A. City reveal that
the majority of jobholders travel less than ten miles from work to home (46% and 47%,
respectively; see Figure 27). The proportion of distance for commuters gradually decreases for
both areas, with less than 12% of Lake Balboa and L.A. City residents traveling greater than 50
miles from work to home. As outlined in the Housing and Transportation section of this report,
most residents own at least one car and use this as their primary means of transportation. An
increase in the use of public transportation might help to continue to reduce travel times from
work to home with the amount of heavy traffic that is present in Los Angeles.
Inflow/Outflow Report
Inflow/Outflow Job Counts (AllJobs)
2011
Count Share
Employed in the SelectionArea 21,825 100.0%Employed in the SelectionArea but Living Outside 20,880 95.7%Employed and Living in theSelection Area 945 4.3%Living in the Selection Area 17,512 100.0%Living in the Selection Areabut Employed Outside 16,567 94.6%Living and Employed in theSelection Area 945 5.4%
Source: U.S. Census Bureau, OnTheMap Application and LEHD Origin-Destination EmploymentStatistics (Beginning of Quarter Employment, 2nd Quarter of 2002-2011).Notes:
1. Race, Ethnicity, Educational Attainment, and Sex statistics are beta release results and are notavailable before 2009.2. Educational Attainment is only produced for workers aged 30 and over.3. Firm Age and Firm Size statistics are beta release results and are not available before 2011.

37
Figure 27: Distance from Work to Home Locations for Lake Balboa and L.A. City (Source: U.S. Census Bureau, LEHD)
Types of Jobs
In Lake Balboa, the three most common industry job types are “Manufacturing” (12%)
and “Transportation and Warehousing” (11%), and “Health Care and Social Assistance” (10%)
as of 2011 (see Figure 28). There is a difference when comparing these three jobs in Lake Balboa
with the most common jobs found in L.A. City. That is, in L.A. City, the most common industry
job is “Health Care and Social Assistance” (12%), followed by “Education” (10%) and “Retail
Trade” (9%).6 While there is a difference comparing Lake Balboa with L.A. City, the two most
common occupations in Lake Balboa are agreeable with the zoning areas of the neighborhood.
That is, these jobs correspond to the largest concentration of jobs being located in the industrial
zone sector of the neighborhood as discussed above, especially when noting the spatial location
of “Manufacturing” and “Transportation and Warehousing” jobs (see Appendix C, Figures 44-
46).
6 While the most common jobs for Lake Balboa are displayed in this section, all other industry job types for 2011 for both Lake Balboa and L.A. City can be viewed in Appendix C, Figure 43.
46%!
27%!
16%!12%!
47%!
30%!
13%!10%!
0%!
10%!
20%!
30%!
40%!
50%!
Less!than!10!miles! 10!to!24!miles! 25!to!50!miles! Greater!than!50!miles!
Distance%Traveled%
Lake!Balboa! LA!City!

38
Figure 28: Most Common Jobs by Industry in Lake Balboa in 2011, compared to L.A. City (Source: U.S. Census Bureau, LEHD)
Over the last ten years (2002-2011), there has been a shift in employment trends by type
of industry job. Figure 29 displays the trends for job counts by industry for the three most
common jobs in Lake Balboa. From this, it can be noted that there has been a significant decline
in the number of manufacturing jobs, though there has been an increase in jobs related to health
care and social services. Despite the decline in manufacturing jobs, it is still the most common
industry job for the most recent year statistics. With the presence of the Van Nuys Airport in the
neighborhood, it is not surprising that
“Manufacturing” continues to be the most common
job type in the neighborhood. The shift in jobs by
industry, however, could indicate a changing
economic focus in Lake Balboa, with more
emphasis being placed on jobs located outside the
industrial zones.
70%!
10%!
5%!
12%!
4%!
6%!
61%!
8%!
10%!
10%!
11%!
12%!
0%! 10%! 20%! 30%! 40%! 50%! 60%! 70%! 80%!
All!Other!Industry!Jobs!
Educational!Services!
Wholesale!Trade!
Health!Care!and!Social!Assistance!
Transportation!and!Warehousing!
Manufacturing!
Lake!Balboa! LA!City!
Photo: Van Nuys Airport in Lake Balboa

39
Figure 29: Top Jobs by Industry Sector for Lake Balboa (2002-2011) (Source: U.S. Census Bureau, LEHD)
A discussion of earnings obtained from employment data sheds light on the purchasing
power abilities of jobholders. In 2011, the majority of Lake Balboa jobholders earned either
$1,251 to $3,333 per month or $3,333 or more than per month (see Figure 30). Based on this
data, it is possible to state that 76% of Lake Balboa jobholders made more than $1,251 per
month. The most recent earnings data for the neighborhood best displayed with statistics from
the previous ten years (see Figure 31). In the past decade, there has been a decrease in the middle
range salaries ($1,251-$3,333 earned per month), while the higher range salaries have been
increasing (>$3,333 earned per month). The increase in monthly earnings continues to highlight
a growing favorable economic situation in Lake Balboa.
In 2011, L.A. City’s earning trends in the top two wage divisions are noticeably different
than those of Lake Balboa. While 42% of L.A. City jobholders earned more than $3,333 per
month, only 33% of jobholders were paid between $1,251 and $3,333 per month. Based on these
numbers (see Figure 30), it becomes apparent that there is a better distribution of wealth in Lake
Balboa compared to L.A. City. The latter appears to have more income disparity based on the
2011 statistics.
0!
1,000!
2,000!
3,000!
4,000!
5,000!
6,000!
2002! 2003! 2004! 2005! 2006! 2007! 2008! 2009! 2010! 2011!
Num
ber%of%Jobs%
Year%
Manufacturing! Transportation!and!Warehousing! Health!Care!and!Social!Assistance!

40
Figure 30: Earnings Data for Lake Balboa and L.A. City (Source: U.S. Census Bureau, LEHD)
Figure 31: Earnings Data for Lake Balboa (Source: U.S. Census Bureau, LEHD)
Figures 32-34 display certain areas of Lake Balboa that are associated with one or more
of the three income ranges mentioned above. These spatial illustrations are more telling though,
when connected to the zoning areas for the neighborhood and the spatial data for the three most
common jobs in 2011 (see Figures 7, and 44-46). Particularly, the areas with the highest
concentration of “Manufacturing” and “Transportation and Warehousing” industry jobs are
similar to the areas with the higher concentration of jobs paying $1,251 to $3,333 per month and
more than $3,333 per month (see Figures 32-34 and 44-46). Again, these spatial areas are linked
24%!
38%!38%!
25%!
33%!
42%!
10%!
15%!
20%!
25%!
30%!
35%!
40%!
45%!
50%!
$1,250!per!month!or!less! $1,251!to!$3,333!per!month! More!than!$3,333!per!month!
Lake!Balboa! LA!City!
26%! 24%! 22%! 24%!
46%! 45%!42%!
38%!
28%!31%!
36%! 38%!
0%!5%!10%!15%!20%!25%!30%!35%!40%!45%!50%!
2002! 2005! 2008! 2011!
Earnings%per%Month%by%Year%
$1,250!or!less! $1,251!to!$3,333! $3,333!or!more!

41
with the parts of the neighborhood that are zoned as industrial (Figure 7). For “Health Care and
Social Assistance” industry jobs, the areas with highest job counts are comparable to the areas
with the higher concentration of jobs paying less than $1,251 per month (see Figures 33 and 46).
Figures 32-34: Spatial Data for Salaries in Lake Balboa (Source: U.S. Census Bureau, LEHD).
Jobholder Characteristics
Jobholders form the basis of any economic system, as they are the ones to design,
manufacture, and distribute products and services. In 2011, there were a total of 17,514
jobholders in the neighborhood of Lake Balboa, which represents 1.2% of all jobholders in Los
Angeles, where jobholders totaled at 1,475,097 (U.S. Census Bureau, LEHD, 2013). Comparing
the total number of jobholders with the total job count in Lake Balboa for 2011, the job to
worker ratio is 1.2:1. That is, for every worker there were 1.2 jobs available in 2011. The job to
worker ratio for L.A. City in 2011 was 1:1. Of the 17,514 jobholders in Lake Balboa, the
majority were aged 30 to 54 (58%). The remaining 40.8% was divided by jobholders of ages ‘55
or older’ and ‘29 or younger’. These statistics for Lake Balboa, showing the division of
jobholders by age, were similar to those for L.A. City (see Figure 35).
<%$1,251/Month%%
$1,251%R%$3,333/Month%%
>%$3,333/Month%%

42
Figure 35: Jobholder Age in Lake Balboa and L.A. City (Source: U.S. Census Bureau, LEHD).
There is an even distribution of male and female jobholders in L.A. City (see Table 6).
The data for Lake Balboa, however, displays a slightly higher proportion of males over females
(57% versus 43%, respectively).
Table 6: Jobholder Gender in Lake Balboa and L.A. City (Source: U.S. Census Bureau, LEHD).
Lake%Balboa! L.A.%City!
Male! Female! Male! Female!
57%! 43%! 50%! 50%!
Additional statistics are also available to further portray jobholders by race and ethnicity.
In Lake Balboa, the majority of jobholders identified as White at 81%, with most other residents
identifying as African American and Asian (see Figure 36). Overall, the statistics for L.A. City
paralleled those of Lake Balboa, though there are some slight differences. The jobholders who
identified as White in L.A. City totaled at 71% (slightly less than Lake Balboa at 81%), followed
by those who marked Asian at 15% (slightly more than Lake Balboa at 10%), and African
American at 11% (slightly more than Lake Balboa at 6%). The remaining race categories of
“American Indian or Alaskan Native”, “Native Hawaiian or Other Pacific Islander”, and “Two or
More Races” were all less than 2% (similar to Lake Balboa). These characteristics for the race of
jobholders closely mirrors the overall race data compiled for Lake Balboa, found in the
Demographics section of this report.
24%!
58%!
18%!22%!
59%!
20%!
0%!
10%!
20%!
30%!
40%!
50%!
60%!
70%!
Age!29!or!Younger! Age!30!to!54! Age!55!or!Older!
Lake!Balboa! LA!City!

43
Figure 36: Jobholder Race in Lake Balboa and L.A. City (Source: U.S. Census Bureau, LEHD).
Further evaluation of the ethnicity of jobholders reveals more information regarding the
diversity of jobholders in Lake Balboa. The ethnicity data from the U.S. Census Bureau LEHD
statistics provides data on the Hispanic population in Lake Balboa, which was noted earlier as
comprising 56% of the neighborhood population. Of the total number of jobholders in Lake
Balboa, 65% identified as “Hispanic or Latino”, while 35% identified as “Not Hispanic or
Latino” (see Figure 37). These statistics were similar to those for L.A. City.
Figure 37: Jobholder Ethnicity in Lake Balboa and L.A. City (Source: U.S. Census Bureau, LEHD).
81%!
6%!1%!
10%!0%! 2%!
71%!
11%!1%!
15%!
0%! 2%!
0%!
10%!
20%!
30%!
40%!
50%!
60%!
70%!
80%!
90%!
100%!
White!! Black!or!African!American!!
American!Indian!or!
Alaskan!Native!!
Asian!! Native!Hawaiian!or!Other!Pacihic!Islander!!
Two!or!More!Race!Groups!
Lake!Balboa! LA!City!
62%!
38%!
65%!
35%!
0%!
20%!
40%!
60%!
80%!
100%!
Hispanic!or!Latino! Not!Hispanic!or!Latino!
Lake!Balboa! LA!City!

44
Educational attainment for Lake Balboa was briefly discussed in the Socioeconomic
section. At this point, we can also specifically consider jobholder education data for the
neighborhood. A review of the educational attainment for jobholders 25 years and older in Lake
Balboa reveals that 45% of jobholders have some college education (either “Some College or
Associate Degree” totaling 23% and “Bachelor’s Degree or Advanced Degree” totaling 22%; see
Figure 38). This closely parallels the educational attainment figures obtained for the entire
neighborhood of Lake Balboa, where 51% of the populace obtained some college, an associates
degree, bachelor’s degree, or graduate/professional degree, based on the ACS 2007-2011 five-
year estimate.
The data on jobholder education also shows that 16% of jobholders had an educational
attainment up through high school, with no college, while 15% of jobholders in Lake Balboa did
not complete high school.7 The statistics for the educational attainment of Lake Balboa
jobholders are similar to the data acquired for L.A. City, with only slight differences. There was
a slightly lower percentage of jobholders with a “Bachelor’s Degree or Advanced Degree” in
Lake Balboa versus L.A. City jobholders (22% vs. 27%, respectively). There was also a slightly
higher percentage of jobholders with “Educational Attainment not available” when comparing
Lake Balboa versus L.A. City (24% vs. 21%, respectively).
Figure 38: Jobholder Education in Lake Balboa and L.A. City in 2011 (Source: U.S. Census Bureau, LEHD).
7 There is also a category for “Educational Attainment not available” tallied at 24%, which represents the percentage of jobholders who are less than 25 years of age.
15%! 16%!
23%! 22%! 24%!
15%! 15%!
23%!27%!
21%!
0%!
10%!
20%!
30%!
40%!
50%!
Less!than!High!School!
High!School!or!Equivalent!(no!
college)!
Some!College!or!Associate!Degree!
Bachelor's!Degree!or!Advanced!Degree!
Educational!Attainment!not!
available!!!
Lake!Balboa! LA!City!

45
Summary
The section of the report reviewed a number of telling economic characteristics of Lake
Balboa. The highest proportions of job counts per square mile are concentrated in the industrial
and public sector zones. While the job to worker ratio is 1.2:1, the growth rate for total jobs in
the neighborhood from 2002 to 2011 is -14%. Jobholder characteristics presented a higher
percentage of male jobholders compared with female jobholders in Lake Balboa (57% vs. 43%,
respectively), though jobholder race, ethnicity, and educational attainment correspond to the
demographic and socioeconomic data compiled for the whole neighborhood.
46
Conclusions and Recommendations
__________________________________________________________________
Based on the data analyzed for this report, several recommendations can be made for the
neighborhood of Lake Balboa. The Demographics section revealed that Lake Balboa is
comprised of a diverse population. In particular, the majority of residents identify as Hispanic
and 63% of residents speak a language other than English. Based on these statistics, future
services and information should be provided in languages other than English in order to reach the
greatest number of Lake Balboa residents. Additionally, this section highlighted that Lake
Balboa is a relatively young community that is family-oriented. Therefore, community activities
should be designed with these demographic characteristics in mind in order to increase
community involvement.
Lake Balboa’s population living below poverty level in Lake Balboa (17%), the high
percentage of the population in the labor force (68%), and overall lower percentage of FTFY
workers compared to L.A. City (46% vs. 53%) indicates that a working poor population exists in
Lake Balboa. Further research of Lake Balboa’s working poor population should be examined in
order to address their particular needs and help them attain a higher income. Lake Balboa’s low
percentage of FTFY workers should also be addressed as not having a full-time job often leads to
lack of individual and family benefits, as well as income stability. Promoting local full-time
hiring among businesses may help alleviate this problem. Another option would be to assist in
job referral services to help those with part-time jobs find full-time employment. However,
attaining higher levels of education is important in helping this population achieve these
employment positions.
The educational attainment data for Lake Balboa reveals that approximately half of the
residents (49%) had only a high school diploma or had not completed high school. Therefore,
consideration should be given to invest in assisting residents to obtain higher levels of education.
Promoting and supporting Lake Balboa’s working poor population to attain higher levels of
education will help them find better paying jobs once their degree is attained. Community
workshops at strategic locations and during appropriate hours could provide information about
the various colleges and universities in the Los Angeles area that offer a variety of degree
options (for either part-time or full-time attendance) as well as online classes. Promoting online

47
classes and possibly providing a community space with computers and internet could also assist
residents who have families and/or need to maintain a full-time employment while enrolled.
The Housing section discussed characteristics related to home values and housing cost
burdens. The majority of homeowners are cost-burdened, spending more than 30% of their
income on housing costs. Almost 60% of Lake Balboa renters and 56% of homeowners spend
more than 30% of their household income on housing expenses, which may be a cost burden for
many families and individuals. In order to address this, information and help in obtaining
affordable housing would greatly benefit the majority of Lake Balboa residents and could even
potentially help the local economy since residents would have more available income to spend.
Analyzing transportation characteristics in Lake Balboa indicated that 38% of Lake Balboa
households had three or more cars and that 77% of residents drove alone in a car when
commuting. While there are many reasons why Lake Balboa is a car-rich neighborhood, efforts
could be made to decrease barriers that make numerous cars per household necessary. For
example, Lake Balboa NC could promote the use of public transportation, bicycle use, walking,
and carpooling as a means of transportation. By gathering information about where their
residents work and facilitating communication, they may be able to set up a carpooling system or
even gather community support for the expansion of particular public transportation lines. With
the exception of the commonly used Orange Line, public transportation in Lake Balboa is
underutilized.
Although there was favorable economic activity in Lake Balboa in 2011 (as inflow
counts are higher than outflow counts, and the percentage of the population making higher
salaries was increasing), jobs decreased 14% from 2002 to 2011 or at a rate of -1.4% per year.
This figure is most striking when compared with the 14% increase in jobs in L.A. City.
Therefore, while L.A. City has seen an increase in the total number of jobs over the past ten
years, these jobs have not been appearing in Lake Balboa. This could be due to a number of
factors, such as zoning restrictions, residents working outside the neighborhood, companies
moving away, or merely decreasing their number of staff. If possible, attention should be placed
on investing in job creation within the neighborhood to continue to increase economic activity
and possibly provide more local jobs for residents.

48
Works Cited American Community Survey (ACS): 2007-2011 5-year estimate 2013 Electronic Document. http://www.socialexplorer.com. Baldassare, M. 1992 Suburban Communities. Annual Review of Sociology 18: 475-494. Beveridge, A. and D. Halle 2013 The Uncertain Future. In New York and Los Angeles: An Uncertain Future, edited by D.
Halle. Oxford University Press, New York. CERT Los Angeles 2013 Community Emergency Response Team. Electronic Document. http://www.cert-la.com/. Empower L.A. 2012 Lake Balboa Neighborhood Council. Electronic Document. http://empowerla.org/lbnc/. KCET and Kelly Simpson 2013 Los Angeles Flood of 1938: The Destruction Begins. Electronic Document.
http://www.kcet.org/socal/departures/landofsunshine/la-river/the-destructions-begins.html.
L.A. Mountains 2013 Sepulveda Basin Recreation Area. Electronic Document.
http://www.lamountains.com/parks.asp?parkid=126. Lake Balboa Neighborhood Council 2013 LB Neighborhood Council. Electronic Document. http://lakebalboanc.org/. Lazarus, Michael 1995 Cricketers' Proving Grounds: Recreation: Woodley Park zone matches help in selection
of U.S. team. Los Angeles Times. Electronic Document. http://articles.latimes.com/1995-07-06/sports/sp-20627_1_u-s-national-team.
Los Angeles Almanac 2013 City of Los Angeles: Wall Maps. Electronic Document. http://www.laalmanac.com/LA/. Los Angeles City Council 2007 Naming a Community Lake Balboa. Electronic Document.
http://clkrep.lacity.org/onlinedocs/2006/06-2613_ca_11-02-07.pdf. Los Angeles Times 2013 Lake Balboa. Electronic Document,
http://maps.latimes.com/neighborhoods/neighborhood/lake-balboa/.

49
Los Angeles World Airports 2013 Van Nuys Airport. Electronic Document. http://www.lawa.org/welcomeVNY.aspx. Loukaitou-Sideris, Anastasia 2010 Children's Common Grounds: A Study of Intergroup Relations Among Children in Public
Settings. Journal of the American Planning Association 69, 2: 130-143. MGA Entertainment 2013 MGA Entertainment Homepage. Electronic Document. http://www.mgae.com/. Saez, Emmanuel 2012 Striking it Richer: The Evolution of Top Incomes in the United States (updated with 2009
and 2010 estimates). Electronic Document. http://elsa.berkeley.edu/~saez/saez-UStopincomes-2010.pdf.
Sastry, Narayan, Anne Pebley, and Michela Zonta 2002 Neighborhood Definitions and the Spatial Dimension of Daily Life in Los Angeles.
Labor and Population Program, Working Paper Series 03-02: 1-34. U.S. Bureau of Labor Statistics 2013 A Profile of the Working Poor, 2011. BLS Report 1041. Electronic Document.
http://www.bls.gov/cps/cpswp2011.pdf. U.S. Census Bureau 2013a American Fact Finder. Electronic Document. http://factfinder2.census.gov/. 2013b History: Tracts and Block Numbering Areas. Electronic Document.
http://www.census.gov/history/www/programs/geography/tracts_and_block_numbering_areas.html.
2013c People and Households. Electronic Document. http://www.census.gov/people/. U.S. Census Bureau, Longitudinal Employer-Household Dynamics (LEHD) 2013 On the Map. Electronic Document. http://onthemap.ces.census.gov/. U.S. 2010 Decennial Census 2013 Electronic Document.
http://factfinder2.census.gov/faces/nav/jsf/pages/searchresults.xhtml?refresh=t. U.S. Department of Housing and Urban Development (HUD) 2013 Electronic Document. http://portal.hud.gov/hudportal/HUD. Van Nuys History 2013 Sherman Oaks Real Estate. Electronic Document. http://dianalipari.com/van-nuys-
history/.

50
Yates, Seana 2013 Along Ventura – Real Estate and Lifestyle in the South San Fernando Valley: Lake
Balboa. Electronic Document. http://www.alongventura.com/neighborhood-guides/lake-balboa/.
ZIMAS (Zone Information Map Access System) 2013 Land Use Map: Lake Balboa Neighborhood Council. Electronic Document.
http://zimas.lacity.org/.

51
Appendix A Data Sources & Limitations: Decennial Census and American Community Survey (ACS) Decennial Census: The U.S. Census counts every resident in the United States. It is mandated by Article I, Section 2 of the Constitution and takes place every 10 years. The data collected by the decennial census determine the number of seats each state has in the U.S. House of Representatives and is also used to distribute billions in federal funds to local communities. Planners of the first U.S. decennial census in 1790 established the concept of "usual residence" as the main principle in determining where people were to be counted. Usual residence is defined as the place where a person lives and sleeps most of the time. Guiding principles:
• Count people at their usual residence, which is the place where they live and sleep most of the time.
• People in certain types of facilities or shelters (i.e., places where groups of people live together) on Census Day should be counted at the facility or shelter.
• People who do not have a usual residence, or cannot determine a usual residence, should be counted where they are on Census Day.
Limitations: The decennial census only captures the count of the U.S. population or, the number of people, and it does so once every 10 years. It is not updated as frequently as the American Community Survey (ACS) that collects estimates at the annual, 3-year, and 5-year levels. However, the ACS captures characteristics of the population and not the count. Applying the usual residence concept to real living situations means that people will not always be counted at the place where they happen to be staying on Thursday, April 1, 2010 (Census Day). Census forms can be accessed at the following web address: http://www.census.gov/dmd/www/2000quest.html American Community Survey (ACS):8 The ACS is a survey that occurs every year to collect basic statistical information in order to better distribute federal and state funding. The questionnaire for the ACS is shorter than the one sent to residents for the Decennial Census, and includes questions related to age, gender, race, family relationships, income, disabilities, education, veteran status, work location, and home location. Though data is collected every year, researchers can access ACS data in 1-year, 3-year, and 5-year increments. Data is available for public use and can be retrieved on the U.S. Census Bureau’s American FactFinder website (U.S. Census Bureau, 2013a). The ACS is mandatory by law under Title 13 and samples 3.54 million
8 https://www.census.gov/acs/www/

52
households every year; approximately 295,000 addresses per month and as a result, it receives over 96% participation rate. The American Community Survey is an estimate that shows “how” people live and the data is released by the calendar year for geographic areas. Geography is highly significant in ACS sampling, being used for data collection, weights, and tabulation of activities. Maps are also generated to compare data from different geographical areas. The strength of the ACS is the estimation of characteristic distributions measured with percentages, means, and medians rather than the estimation of population totals. It is helpful for business and non-profit organizations to determine where to locate and to predict the types of products or services needed in a geographic area. Academic researchers use ACS results to understand trends over time and gather information. Improvements to the American Community Survey: Beginning in 2011, the ACS modified its sample design by conducting personal visits in remote parts of Alaska, American Indian areas with an estimated American Indian population greater than 10% and all Hawaiian Home Lands. Due to the large number of non-malleable addresses in these areas, conducting follow-up for approximately 27,000 additional sample addresses proved an effective way to improve the quality of estimates. In addition, ACS was modified to improve the reliability of estimates and increases for small Census tracts. This slightly decreased the sampling rates for larger tracts and minimized the differences in the reliability of ACS estimates. The purposes of the newly administered ACS are to:
• Reduce sampling error • Provide efficient allocation of funds distributed on the basis of ACS estimates • Provide accurate sampling rates of the community and small-area statistics.
ACS 1-year, 3-year and 5-year Estimates – Below are the differences and limitations of ACS 1-year, 3-year and 5-year estimates. For the purposes of the report, we have conducted the analysis using 5-year estimates.
1-year estimates 3-year estimates 5-year estimates
12 months of collected data
36 months of collected data 60 months of collected data
Data for areas with populations of 65,000+
Data for areas with populations of 20,000+
Data for all areas
Smallest sample size
Larger sample size than 1-year Largest sample size
Less reliable than 3-year or 5-year
More reliable than 1-year; less reliable than 5-year
Most reliable
Most current data Less current than 1-year estimates; more current than 5-year
Least current

53
Best used when Best used when Best used when
Currency is more important than precision Analyzing large populations
More precise than 1-year, more current than 5-year Analyzing smaller populations Examining smaller geographies because 1-year estimates are not available
Precision is more important than currency Analyzing very small populations Examining tracts and other smaller geographies because 1-year estimates are not available
Below are images of the first two pages of the ACS questionnaire:

54

55
U.S. Census Bureau, Longitudinal Employer-Household Dynamics (LEHD)
The LEHD is a program of the U.S. Center for Economics and the U.S. Census Bureau, produced for public use. Data from this program was accessed through the LEHD application On the Map, which provides spatial patterns and statistics of jobs by employment and residential locations. The geographical base is comprised of census blocks, as defined by the 2010 Decennial Census. The current version of the application, utilized by this report, contains data from 2002 to 2011. Data is divided by twelve variables, some of which are further subdivided:
• Age
o 29 or Younger o 30 to 54 o 55 or Older
• Earnings o $1,250/month or less o $1,250/month to $3,333/month o $3,333/month or more
• Industry Group o Good Producing Industry Sectors o Trade, Transportation, and Utilities Sectors o All Other Services Industry Sectors
• Industry Sectors o 20 Categories (see: http://www.census.gov/eos/www/naics/)
• Race o White (alone) o Black or African American (alone) o American Indian or Alaska Native (alone) o Asian (alone) o Native Hawaiian or Other Pacific Islander (alone) o Two or More Race Groups
• Ethnicity o Not Hispanic or Latino o Hispanic or Latino
• Educational Attainment o Not Available (represents the population 29 or younger) o Less than High School o High School or Equivalent, no College o Bachelor’s Degree or Advanced Degree
• Sex/Gender o Male o Female
• Job Dominance (defined as the job that earned a jobholder the most money) o Primary Job o Non-Primary Job
• Ownership Class of the Firm o Private

56
o Public ! Consists of local, state, and Federal government employers
• Firm Age (only available for Private Jobs) o 0-1 Years o 2-3 Years o 4-5 Years o 6-10 Years o 11+ Years
• Firm Size (only available for Private Jobs) o 0-19 Employees o 20-49 Employees o 50-249 Employees o 250-499 Employees o 500+ Employees
There are several data limitations to note. Data for gender is only available for the years 2009-2011. The LEHD also tracks jobs, not people; therefore more than one job could be counted for a single individual. As stated above, no educational data is provided for jobholders under the age of 30. Additionally, “Firm Age” and “Firm Size” are only present for “All Private Jobs.”9 - -
9 U.S. Census Bureau, LEHD (http://lehd.ces.census.gov/); LEHD, On the Map (http://onthemap.ces.census.gov/).

57
Demographics:"" Age is defined by the U.S. Census Bureau as the length of time in completed years that a person has lived. Sex/Gender is defined as a person’s reported biological sex. Race/Ethnicity: In using census data, the definition of race becomes complicated because racial categories included in the census questionnaire reflect the social definition of race recognized in the United States and is not determined biologically, anthropologically, or genetically. The 1970 Decennial Census does not include Hispanic or Latino as a race. Additionally, reports on race are by self-identification. The following definitions use definitions provided by the U.S. Census Bureau.
White – A person having origins in any of the original peoples of Europe, the Middle East, or North Africa.
White alone – includes those who report only the white racial category. This includes those who are non-Hispanic and Hispanic whites.
Non-Hispanic White – includes those who are both Non-Hispanic and white alone
Black or African American – A person refers to a person having origins in any of the Black racial groups of Africa.
For the purposes of this report, where many of the Blacks or African Americans are not of Hispanic origins, we have used the category of Black or African American alone. Only for the racial trends have we used Non-Hispanic Blacks or African Americans.
American Indian or Alaska Native – A person having origins refers to a person having origins in any of the original peoples of North and South America (including Central America) and who maintains tribal affiliation or community attachment.
Asian – A person having origins in any of the original peoples of the Far East, Southeast Asia, or the Indian subcontinent including, for example, Cambodia, China, India, Japan, Korea, Malaysia, Pakistan, the Philippine Islands, Thailand, and Vietnam.
Asians alone – includes those who reported exactly one Asian group and no other Asian group or race category.
It must be noted that earlier Census data, including 1970, 1980, and 1990 include Native Hawaiians and Pacific Islanders into the Asian category. It was not until 1990 when Asians were reported as Asians and Pacific Islanders, but the category was still lumped together.

58
The 2000 Census is when Native Hawaiians and Pacific Islanders become a completely separate category.
Hispanic or Latino - those who classify themselves in one of the specific Hispanic or Latino categories, such as Mexican, Mexican American, Chicano, Puerto Rican, or Cuban as well as those of another Hispanic, Latino, or Spanish origin. Nativity
Native born – includes those who are U.S. citizens born in the United States, Puerto Rico or U.S. Island areas. It also includes those who are U.S. citizens born abroad but with at least one American parent.
Total population of native born = Total population of U.S Citizen born in the United States in Lake Balboa + population of U.S. citizens born in Puerto Rico or U.S. Island areas in Lake Balboa + population born abroad of American parent(s) in Lake Balboa
Foreign-born – includes those that are not born in the United States, Puerto Rico, or U.S. Island areas. These include U.S. citizens by naturalization or not a U.S. Citizen.
Total population of foreign born in Lake Balboa = Total population of naturalized citizens in Lake Balboa + Non-Citizen residents in Lake Balboa
Language
Speak Only English – Includes those individuals 5 years and over who can speak English only and no other language
Speak English “very well” – Includes those 5 years and over who report speaking English “very well.” The total population 5 years or over for those who can speak English “very well” in Lake Balboa is calculated by adding those that report “Speak English ‘very well’” for each language spoken in Lake Balboa.
Speak English “less than very Well” – Includes those 5 years and over who report speaking English “well”, “not Well”, or “not At All.”
Household - Includes all of the people who occupy a housing unit. Householder - In most cases, this is the person, or one of the people, in whose name the home is owned, being bought, or rented. If there is no such person in the household, any household member 15 years old and over can be designated as the householder. Family - Consists of a householder and one or more other people living in the same household who are related to the householder by birth, marriage, or adoption.

59
Nonfamily Household - Consists of a householder living alone or with nonrelatives only, for example, with roommates or an unmarried partner. Socioeconomics:10! Human capital (Educational Attainment) – Data on educational attainment were derived from answers to Question 11 on the American Community Survey, which was asked of all respondents. Educational attainment data are tabulated for people 18 years old and over. Respondents are classified according to the highest degree or the highest level of school completed. The question included instructions for persons currently enrolled in school to report the level of the previous grade attended or the highest degree received. Employed – This category includes all civilians 16 years old and over who either (1) were “at work,” that is, those who did any work at all during the reference week as paid employees, worked in their own business or profession, worked on their own farm, or worked 15 hours or more as unpaid workers on a family farm or in a family business; or (2) were “with a job but not at work,” that is, those who did not work during the reference week but had jobs or businesses from which they were temporarily absent due to illness, bad weather, industrial dispute, vacation, or other personal reasons. Excluded from the employed are people whose only activity consisted of work around the house or unpaid volunteer work for religious, charitable, and similar organizations; also excluded are all institutionalized people and people on active duty in the United States Armed Forces. Unemployed – All civilians 16 years old and over are classified as unemployed if they (1) were neither “at work” nor “with a job but not at work” during the reference week, and (2) were actively looking for work during the last 4 weeks, and (3) were available to start a job. Also included as unemployed are civilians who did not work at all during the reference week, were waiting to be called back to a job from which they had been laid off, and were available for work except for temporary illness. Civilian Labor Force – Consists of people classified as employed or unemployed in accordance with the criteria described above. Unemployment Rate – The unemployment rate represents the number of unemployed people as a percentage of the civilian labor force. Labor Force Participation Rate (LFPR) – According to the U.S. Census Bureau, the Labor Force Participation Rate (LFPR) represents the proportion of a population that is currently in the labor force—meaning persons who are working age (16 years and older) and either working or looking for work. Those not considered part of the labor force include individuals 16 years and older who are students, homemakers, retirees, institutionalized people, seasonal workers not
10 Language in the definitions for this section are quoted directly from the ACS 2011 Subject Definitions (http://www.census.gov/acs/www/Downloads/data_documentation/SubjectDefinitions/2010_ACSSubjectDefinitions.pdf).

60
currently looking for work, and those doing unpaid family work (U.S. Department of Commerce, 2013). Earnings – Earnings are defined as the sum of wage or salary income and net income from self-employment. “Earnings” represent the amount of income received regularly for people 16 years old and over before deductions for personal income taxes, Social Security, bond purchases, union dues, Medicare deductions, etc. Income of Households – This includes the income of the householder and all other individuals 15 years old and over in the household, whether they are related to the householder or not. Thus, the income of the household does not include amounts received by individuals who were members of the household during all or part of the past 12 months if these individuals no longer resided in the household at the time of interview. Poverty – To determine a person's poverty status, one compares the person’s total family income in the last 12 months with the poverty threshold appropriate for that person's family size and composition. If the total income of that person's family is less than the threshold appropriate for that family, then the person is considered “below the poverty level,” together with every member of his or her family. If a person is not living with anyone related by birth, marriage, or adoption, then the person's own income is compared with his or her poverty threshold. The total number of people below the poverty level is the sum of people in families and the number of unrelated individuals with incomes in the last 12 months below the poverty threshold Cash Assistance
Supplemental Security Income (SSI): Supplemental Security Income (SSI) is a nationwide U.S. assistance program administered by the Social Security Administration that guarantees a minimum level of income for needy aged, blind, or disabled individuals.
Public assistance income: Public assistance income includes general assistance and Temporary Assistance to Needy Families (TANF). Separate payments received for hospital or other medical care (vendor payments) are excluded. This does not include Supplemental Security Income (SSI) or noncash benefits such as Food Stamps. The terms “public assistance income” and “cash public assistance” are used interchangeably in the 2011 ACS data products.
Non-Cash Assistance – On October 1, 2008, the Federal Food Stamp program was renamed SNAP (Supplemental Nutrition Assistance Program). Respondents were asked if one or more of the current members received food stamps or a food stamp benefit card during the past 12 months. !!!

61
Housing-and-Transportation:11- Housing
Year Structure Built indicates when the building was first built (not remodeled or converted).
Housing Unit – A housing unit is a house, an apartment, mobile home, grouped rooms, or single room that is occupied (or intended for occupancy) as independent living quarters. Independent or separate living quarters is determined by direct access from outside the building or through a common hall.
Household – Household refers to all the people who occupy a housing unit. People who do not liv in households are listed as living in group quarters.
Housing Tenure – identifies a basic feature of the housing inventory, whether a unit is owner occupied or renter occupied. Data on housing tenure has been collected since 1890.
Owner Occupied – A housing unit is owner occupied if the owner or co-owner lives in the unit (even if it is mortgaged or not fully paid, or purchased with some other debt arrangement such as deed of trust, trust deed, contract to purchase, land contract, or purchase agreement).
Renter Occupied – A housing unit is renter occupied if it is not defined as owner occupied (whether they are rented or occupied without payment of rent). Housing units located on military bases are also included as renter occupied.
Housing Value – Respondent’s estimate of how much their property is (including house & lot) worth in a sale.
Median Household Values – Median divides the value distribution into two equal parts: one-half of the cases falling below the median value of the property (house and lot) and one have above the median. Below is a the formula for calculating
Calculating Median: ([U + (W*(0.5 - LCF)]
[(UCF) - (LCF)]
U = upper limit of the interval containing the median W = width of the interval containing the median LCF = cumulative frequency corresponding to the lower limit of the median UCF = cumulative frequency corresponding to the upper limit of the interval that contains the median
11 U.S. Census. American Community Survey & Puerto Rico Community Survey 2012 Subject Definitions Link: http://www.census.gov/acs/www/Downloads/data_documentation/SubjectDefinitions/2012_ACSSubjectDefinitions.pdf

62
Gross Rent - Gross rent refers to the contract rent (rent asked for) in addition to the estimated average monthly cost of utilities (electricity, gas, water, and sewer) and fuels (oil, coal, kerosene, wood, etc.) if these are renter-paid (or paid by someone else).
Housing Burden – Housing burden occurs when households spend more than 30 percent of their income on housing costs.
Transportation
Vehicles Available – Vehicles available refers to the number of the total number of passenger cars, vans, and pickup or panel trucks of one-ton capacity or less kept at home and available for the use of household members. Vehicles rented or leased for one month or more, company vehicles, and police or government vehicles are included in this if kept at home and used for non-business purposes as well.
Means of Transportation to Work – Means of transportation refers to the principal mode (most often used) of transportation that workers use. People who use a variety of transportation means were asked to specify the mode most often used; those with various modes per day were asked to choose the mode on which they have the longest trip.
Economic-Base:--
Total Primary Jobs: Number of jobs held by workers. A job is counted if a worker is employed with positive earnings during the reference quarter as well as in the quarter prior to the reference quarter.
Jobs by Worker Age: Earnings is displayed by three categories: 29 or younger, 30 to 54, and 55 or older.
Jobs by Earnings: Earnings is displayed by three categories: $1250/month or less, $1251/month to $3333/month, and Greater than $3333/month.
Jobs by NAICS Industry Sector: The Industry Sectors are the 20 top�level NAICS (North American Industry Classification System), sectors and these are part of the area characteristics data (http://www.census.gov/eos/www/naics/).
Jobs by Worker Race: Race is displayed six categories: White Alone, Black or African American Alone, American Indian or Alaska Native Alone, American Indian or Alaska Native Alone, Asian Alone, Two or More Race Groups. The Race variables conform to OMB (Office of Budget and Management) standards for publication of data on race and ethnicity. Further information about OMB standards can be found at http://www.whitehouse.gov/omb/fedreg_1997standards/

63
Jobs by Worker Ethnicity: Ethnicity is displayed by two categories: Not Hispanic or Latino and Hispanic or Latino. The Ethnicity variable conforms to OMB (Office of Budget and Management) standards for publication of data on race and ethnicity. Further information about OMB standards can be found at http://www.whitehouse.gov/omb/fedreg_1997standards/.
Jobs by Worker Educational Attainment: Worker Educational Attainment is displayed by four categories: Less than high school, high school or equivalent or no college, Some college or Associate degree, Bachelor’s degree or advanced degree.
Jobs by Worker Sex: The Sex variable is displayed by two variables: Male or Female.
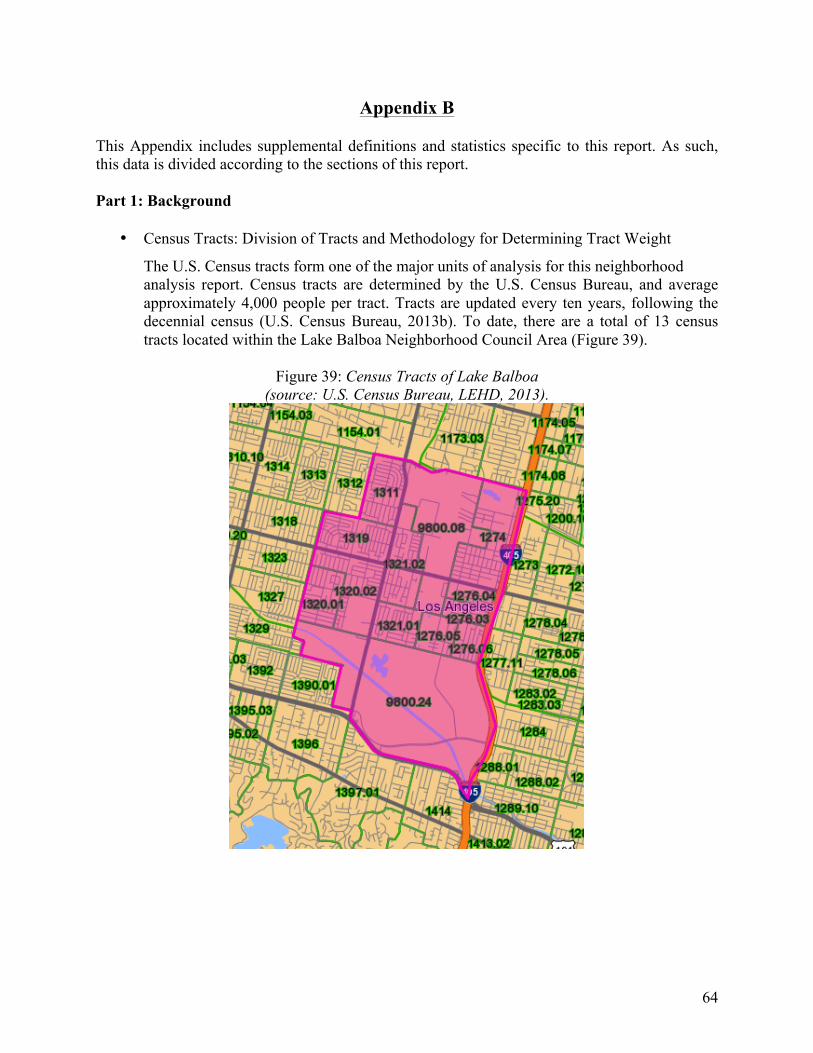
64
Appendix B This Appendix includes supplemental definitions and statistics specific to this report. As such, this data is divided according to the sections of this report. Part 1: Background
• Census Tracts: Division of Tracts and Methodology for Determining Tract Weight
The U.S. Census tracts form one of the major units of analysis for this neighborhood analysis report. Census tracts are determined by the U.S. Census Bureau, and average approximately 4,000 people per tract. Tracts are updated every ten years, following the decennial census (U.S. Census Bureau, 2013b). To date, there are a total of 13 census tracts located within the Lake Balboa Neighborhood Council Area (Figure 39).
Figure 39: Census Tracts of Lake Balboa (source: U.S. Census Bureau, LEHD, 2013).
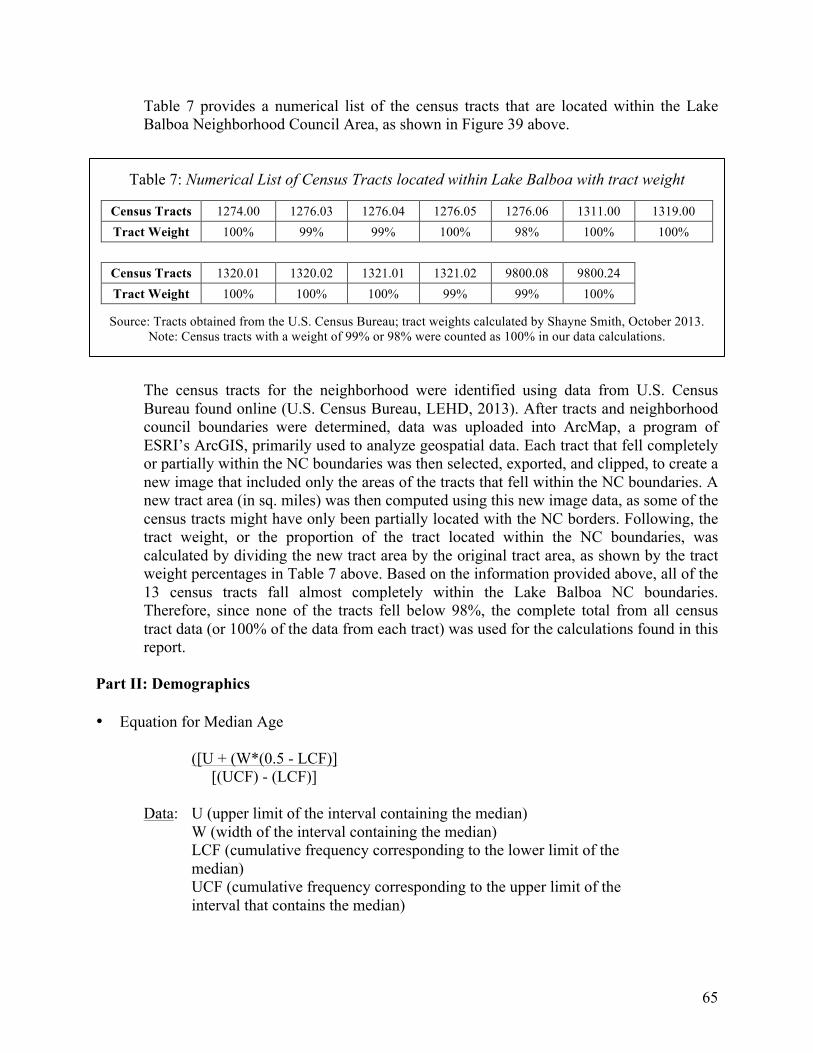
65
Table 7 provides a numerical list of the census tracts that are located within the Lake Balboa Neighborhood Council Area, as shown in Figure 39 above.
Table 7: Numerical List of Census Tracts located within Lake Balboa with tract weight
Census Tracts 1274.00 1276.03 1276.04 1276.05 1276.06 1311.00 1319.00 Tract Weight 100% 99% 99% 100% 98% 100% 100%
! ! ! ! ! ! ! !Census Tracts 1320.01 1320.02 1321.01 1321.02 9800.08 9800.24 !Tract Weight 100% 100% 100% 99% 99% 100% !
Source: Tracts obtained from the U.S. Census Bureau; tract weights calculated by Shayne Smith, October 2013. Note: Census tracts with a weight of 99% or 98% were counted as 100% in our data calculations.
The census tracts for the neighborhood were identified using data from U.S. Census Bureau found online (U.S. Census Bureau, LEHD, 2013). After tracts and neighborhood council boundaries were determined, data was uploaded into ArcMap, a program of ESRI’s ArcGIS, primarily used to analyze geospatial data. Each tract that fell completely or partially within the NC boundaries was then selected, exported, and clipped, to create a new image that included only the areas of the tracts that fell within the NC boundaries. A new tract area (in sq. miles) was then computed using this new image data, as some of the census tracts might have only been partially located with the NC borders. Following, the tract weight, or the proportion of the tract located within the NC boundaries, was calculated by dividing the new tract area by the original tract area, as shown by the tract weight percentages in Table 7 above. Based on the information provided above, all of the 13 census tracts fall almost completely within the Lake Balboa NC boundaries. Therefore, since none of the tracts fell below 98%, the complete total from all census tract data (or 100% of the data from each tract) was used for the calculations found in this report.
Part II: Demographics • Equation for Median Age
([U + (W*(0.5 - LCF)] [(UCF) - (LCF)]
Data: U (upper limit of the interval containing the median) W (width of the interval containing the median) LCF (cumulative frequency corresponding to the lower limit of the median) UCF (cumulative frequency corresponding to the upper limit of the interval that contains the median)

66
Part III: Socioeconomic Profile • Equation for Median Household Income
([U + (W*(0.5 - LCF)] [(UCF) - (LCF)]
Data: U (upper limit of the interval containing the median) W (width of the interval containing the median) LCF (cumulative frequency corresponding to the lower limit of the median) UCF (cumulative frequency corresponding to the upper limit of the interval that contains the median)
Part IV: Housing and Transportation Characteristics • Car to Person Ratio for Lake Balboa
Total Number of Cars / Total Number of People
Data: Total Number of Cars = 16,095 Total Number of Residents = 43,589
…therefore, 16,095 / 43,589 = 1 : 2.7
Part V: Neighborhood Economic Base • Equation for Growth Rate (G.R.)
Most Recent Job Count = Previous Job Count * (1 + G.R.)
Data: 2011 Job Count = 21,825 2002 Job Count = 25,389
…therefore, 21,825 = 25,389 * (1 + G.R.)
G.R. = -0.14 …multiplied by 100 to get the percentage
G.R. = -14% • Job to Worker Ratio for Lake Balboa
Total Number of Jobs : Total Number of Jobholders
Data: 2011 Job Count = 21,825 2011 Jobholder Count = 17,514
…therefore, 21,825 / 17,514 = 1.2 : 1

67
Appendix C
This Appendix includes supplemental data that is connected to earlier discussions of neighborhood findings presented in the sections above. Part II: Demographics
Figure 40: Language Map for Lake Balboa (Source: ACS 2007-2011 5-Year Estimate; map created by Nicole Walter)

68
Part IV: Housing and Transportation Characteristics
Figure 41: Lake Balboa Homes Worth $500,000 or Less (Source: ACS 2007-2011 5- Year Estimate, S250, DP40; map created by Shayne Smith, 2013).
Figure 42: Lake Balboa Homes Worth $1,000,000 or More (Source: ACS 2007-2011 5-Year Estimate, S250, DP04; map created by Shayne Smith, 2013).

69
Part V: Neighborhood Economic Base
Figure 43: Jobs by Industry Sector for Lake Balboa and L.A. City (source: U.S. Census Bureau, LEHD).
Table 8: Total Counts for the Spatial Location of Lake Balboa Jobholders (source: U.S. Census Bureau, LEHD).
Where%Jobholders%Work%% Total%
Los!Angeles! 10,491!Burbank! 1,153!
Santa!Monica! 377!Beverly!Hills! 246!Glendale! 241!Culver!City! 220!
Thousand!Oaks! 172!Santa!Clarita! 159!
West!Hollywood! 158!Calabasas!! 153!
All!Other!Locations! 4,171!

70
Figures 44-46: Spatial Data for the three most common Jobs in Lake Balboa in 2011
(Source: U.S. Census Bureau, LEHD)
Figures 47-49: Spatial Data for Jobholder Age in Lake Balboa (source: U.S. Census Bureau, LEHD).
Ages 29 & Younger
Ages 30 to 54
Ages 55 & Older
Health%Care%and%Social%Assistance%
Transportation%and%Warehousing%
Manufacturing%

71
The spatial distribution for Jobholders ages in 2011 is interesting to remark upon further (Figures 47-49). Comparing these with the spatial data from 2011 for the three salaries ranges, several correlations appear. The job counts for jobholders ages 29 and younger corresponds with the job counts for the salaries less than $1,251 (Figures 32-34). Likewise, job counts for jobholders ages 30 to 54 can be matched to the job counts for salaries ranging between $1,251 and $3,333 per month, and the job counts for jobholders ages 54 and older are similar to the job counts for salaries more than $3,333 per month. Therefore, as it is expected, it appears that the older a person is, a larger salary is obtained. This could be due to several factors, including higher educational attainment in later ages and/or promotions within a job over time.
