final report jan26mk - libqual report_jan26mk.pdf · final report 3 arl staff: martha kyrillidou,...
TRANSCRIPT

MINES for Libraries™
Measuring the Impact of Networked Electronic Services
and the
Ontario Council of University Libraries’ Scholars Portal
Final Report

Final Report
2
©2005 ARL
Published by the Association of Research Libraries 21 Dupont Circle, Suite 800
Washington, DC 20036 202-296-2296
http://www.arl.org/

Final Report
3
ARL Staff:
Martha Kyrillidou, Director, Statistics and Measurement Program, Association of Research Libraries (ARL)
MaShana Davis, Jr. Technical Applications Developer, Association of Research Libraries (ARL)
Jonathan Sousa, Technical Applications Development Manager, Association of Research Libraries (ARL)
Project Leadership:
Joyce Garnett, University Librarian, University of Western Ontario Libraries Brinley Franklin, Vice Provost for University Libraries, University of Connecticut Libraries Terry Plum, Assistant Dean, Simmons Graduate School of Library and Information Science Toni Olshen, Business Librarian, Peter F. Bronfman Business Library, York University
Links:
MINES for Libraries™: a project from StatsQUAL™ http://www.statsqual.org/mines/index.cfm
MINES for Libraries™ http://www.arl.org/stats/newmeas/mines.html Ontario Council of University Libraries (OCUL) http://www.ocul.on.ca/ Scholars Portal http://www.scholarsportal.info/ Association of Research Libraries (ARL) http://www.arl.org/

Final Report
4

Final Report
5
Measuring the Impact of Networked Electronic Services (MINES) and the Ontario Council of University Libraries' Scholars Portal
Final Report
Martha Kyrillidou, Director, ARL Statistics and Measurement Program, Association of Research Libraries <[email protected]>
Toni Olshen, Business Librarian, Peter F. Bronfman Business Library, York University <[email protected]>
Brinley Franklin, Vice Provost for University Libraries, University of Connecticut <[email protected]>
Terry Plum, Assistant Dean, Simmons Graduate School of Library and Information Science <[email protected]>
Executive Summary
• Scholars Portal has successfully mounted and delivered information resources acquired through OCUL consortia purchases and has ensured rapid and reliable access to these resources
• Continuing support for the Scholars Portal will provide for the long term, secure archiving of resources to ensure continued availability
• MINES for Libraries™, a transaction-based research methodology consisting of a web-based survey form and a random moments sampling plan, shows that Scholars Portal resources are heavily used by faculty and students in all OCUL institutions collecting data from more than 20,000 uses over the course of a year
• The majority of the uses of the Scholars Portal resources are from the sciences and the medical health field
• Close to half of the use made of the Scholars Portal resources is by undergraduate students (46%)
• Close to half of the use made of the Scholars Portal resources is from off-campus locations (45%)
• The largest portion of the use of the Scholars Portal resources is for purposes of coursework (42%) with sponsored research representing an important second highest category of use (26%)
• MINES for Libraries™, combined with usage counts, provides an infrastructure to make Scholars Portal usage studies routine, robust, and easily integrated into OCUL’s administrative decision-making process for assessing networked electronic resources

Final Report
6
Introduction
As libraries implement access to electronic resources through portals, collaborations, and consortium arrangements, the MINES for Libraries™ protocol offers a convenient way to collect information from users in an environment where they no longer need to physically enter the library in order to access resources (Franklin and Plum, 2004, 2003, 2002). MINES for Libraries™ adapts a long-established methodology to account for the use of information resources in the digital environment. The survey is based on methods developed to determine the indirect costs (Franklin, 2001) of conducting grant-funded R&D activities, and was adopted as part of ARL’s New Measures program in May 2003.
Ontario Council of University Libraries (OCUL) The Ontario Council of University Libraries (OCUL) is a consortium of twenty university libraries cooperating to enhance information services through resource sharing, collective purchasing, document delivery and many other similar activities. Funding from a government initiatives fund, the Ontario Innovation Trust (OIT), was instrumental in the creation of the Ontario Information Infrastructure (OII) Scholars Portal. OCUL received $7.6 million for the start-up period of 2000-2005. Beginning in 2006, OCUL universities will share the cost of the Scholars Portal. In 2001, OCUL created the Scholars Portal, an information infrastructure to support digital content which delivers resources for research, teaching and learning to the province’s universities. The Scholars Portal includes a number of core services that are shared by all members. The project goals for the electronic resources component of OCUL services are:
• Centrally mounting and delivering information resources acquired through OCUL consortia purchases to ensure rapid and reliable access, and secure archiving.
• Ensuring that the resources and services provided by the OII address the needs of faculty, students and staff.
• Ensuring that resources and services can be seamlessly integrated to the local library and information systems of the institution.
In January 2004, the evaluation phase of the electronic journals project began.
John Cotton Dana, a key figure in 20th century librarianship, wrote in 1920:
“All public institutions…should give returns for their costs; and those returns should be in good degree positive, definite, visible and measurable […] Common sense demands that a publicly-supported institution do something for its supporters and that some part at least of what it does be capable of clear description and downright valuation.” 1
1 John Cotton Dana. The New Museum: Selected Writings by John Cotton Dana, edited by William Penniston (1999). Quoted in The 2003 OCLC Environmental Scan: Pattern Recognition in chapter “The Economic Landscape”, Online Computer Library Centre, (Dublin Ohio: OCLC, 2004):30.

Final Report
7
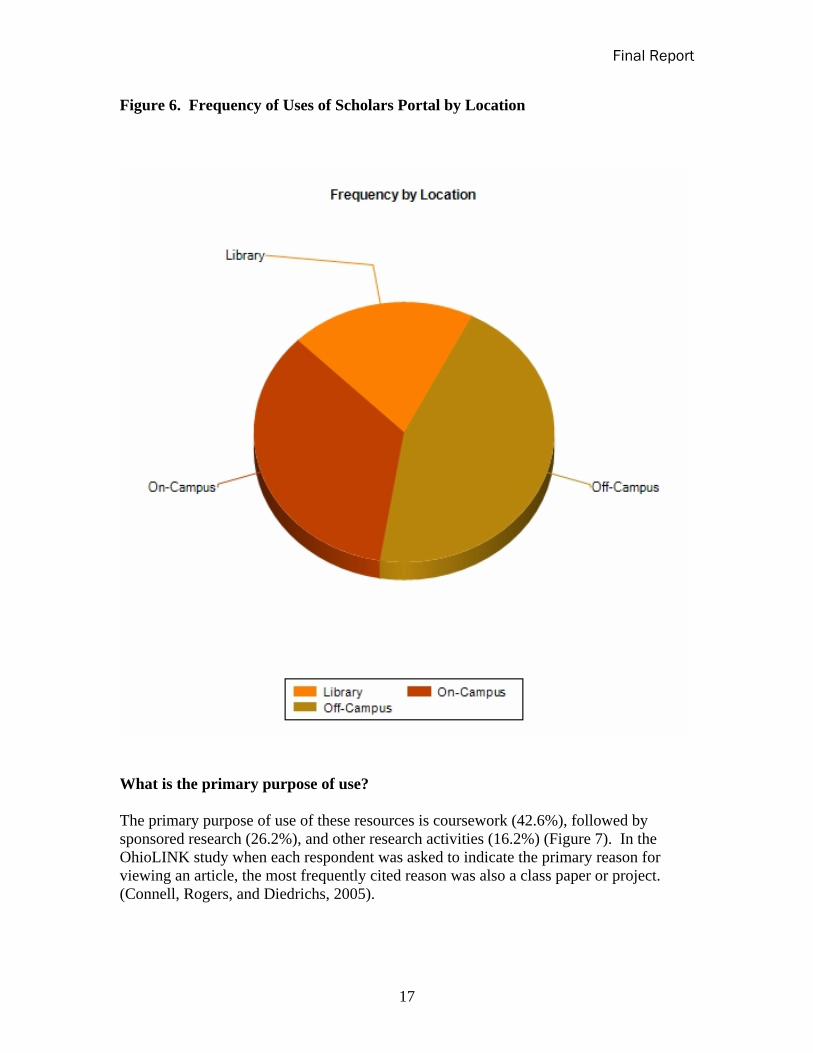
To meet that imperative, OCUL applied the innovative measurement survey tool, Measuring the Impact of Networked Electronic Services (MINES), to this multi-library multi-million dollar province-wide electronic resources project to measure its success and impact on the users of Ontario’s academic libraries. The Ontario universities are public institutions and therefore have a responsibility to provide government funders and campus stakeholders with measurable evidence that the resources and efforts poured into the Scholars Portal have resulted in meeting the projects goals and constituents’ expectations. Table 1 shows the OCUL member libraries and the number of full-time equivalents (FTE) students enrolled in each institution. These institutions span a wide spectrum with differences that impact the nature of their collections and services as well as the electronic journal usage patterns of their students, faculty and staff. All consortia members dip into the same pool of quality electronic resources. The Scholars Portal Electronic Journals cover most disciplines, with a concentration in the sciences, but with growing social sciences and humanities content. It is one of the largest collections of electronic journals available to researchers anywhere. Technical and developmental support is provided by OCUL staff housed at the University of Toronto, which acts as OCUL’s service provider. The Scholars Portal contains 8.2 million articles from 7,219 full text electronic journals2 from the following publishers which are locally loaded on to an OCUL server at the University of Toronto:
• Academic Press, • American Psychological Association, • American Chemical Society, • Berkeley Electronic Press, • Blackwell Publishing • Cambridge University Press, • Emerald Publishing, • Elsevier Science (Elsevier Science, Harcourt Health Sciences), • IEEE Publication, • Kluwer (Kluwer Academic Publishers, Kluwer Law International and
Kluwer/Plenum), • Oxford University Press, • Project MUSE, • Sage Publications, • Springer-Verlag, • Taylor and Francis • John Wiley & Sons.
2 As of July, 2005.

Final Report
8
The MINES for LibrariesTM Methodology MINES for LibrariesTM is a research methodology that been used to measure which networked electronic resources of a library or consortium are utilized by a specific category of the patron population (e.g., patron status or university departmental affiliation). It also solicits the patron’s location at the time of use, and the purpose of use. MINES for LibrariesTM is different from other electronic resource usage measures that quantify total usage, such as Project COUNTER and the Association of Research Libraries’ E-metrics initiatives, or how well a library or consortium of libraries makes electronic resources accessible, such as ARL’s DigiQualTM or LibQual+ TM. MINES for LibrariesTM was adopted by the Association of Research Libraries as part of the “New Measures” toolkit in May, 2003. The primary difference between the MINES for LibrariesTM approach and many of the other web-based user surveys is the emphasis on usage. Although user demographic information is collected, the web survey is really a usage survey, not a user survey. The questions are asked at the point of downloading articles, “meaning uses rather than users, and respondents could answer the survey multiple times during the data collection period” (Connell, Rogers, and Diedrichs, 2005).3 The sampling methodology employed in the Scholars Portal assessment project is a random moments sampling technique that surveyed Scholars Portal users during a twelve month period using one randomly selected two hour survey period each month. Because OCUL maintains detailed Scholars Portal usage statistics that tracks usage by time of day, we were able to weight the choice of two hour time periods so that periods of higher use received a higher proportionate likelihood of being selected as a survey period time. The OCUL usage statistics are similar to vendor supplied frequency data for sessions, searches, and views, but they are commensurable across different vendors, and are broken out by institution. From electronic resource usage data collected in five previous MINES surveys, a statistician, Uwe Koehn, reported that, in the electronic environment, the sample size (n) required for accuracy (A) is n=1/A2 (Koehn, 2003). Koehn also recommended stratifying survey periods throughout the year, as was done in the OCUL Scholars Portal study. Based on Koehn’s calculations a twelve period, or twenty-four hours per year, sampling plan was employed for the OCUL Scholars Portal survey. Data was collected from sixteen OCUL libraries, comprising more than 20,000 uses, between May, 2004 and April, 2005. During the one randomly selected two hour survey period each month, all Scholars Portal users were presented with a brief web-based survey form each time they accessed a networked electronic resources offered through OCUL’s Scholars Portal. The respondent had to choose or select the resource in order to be presented with the survey, therefore 3 This is similar to a recently published study regarding electronic journal use at Ohio State University using OhioLINK resources

Final Report
9
memory or impression management errors were avoided. Once the survey is completed, the respondent’s browser was forwarded to the desired networked electronic resource. Participation in the survey was mandatory in order to connect to the electronic resource being sought by a user. Because the random moments sampling technique requires samples of only a very small time period (two hours per month), it was important to obtain as high a response rate as possible during the sample period. An ongoing study at another library seems to show that voluntary participation in the survey, or a sample of a sample, does not yield as representative an estimate of total usage as a sample requiring all users to participate. (Franklin and Plum, 2005, unpublished data) Technically, the Scholars Portal presented some unusual challenges, which were overcome by Alan Darnell and Vidhya Parthasarathy, who comprised the University of Toronto OCUL technical group for this project. The Scholars Portal resources are accessed from web pages within each library either through direct links to the ejournal titles as presented on various lists of e-resources, direct links to the ejournal titles through records in the online catalog, or prominently displayed links to the Scholars Portal home page on the library’s web site. Electronic journals are authenticated by Internet Protocol (IP) address, but the Scholars Portal also restricts by IP. Most member libraries have a proxy server; primarily, but not exclusively, EZProxy. Once in Scholars Portal, there is a search function which retrieves journal articles, and a browse function retrieving journal titles. Roughly, 60% of the usage was through browse, and the remaining 40% was through the search feature, based on Scholars Portal frequency of use data. For this reason, the survey was placed at the point of viewing an article. Intercepting the library patron at the article view solved the problem of trying count usage of journal titles and journal articles as though they were the same. Surveying at the article view also made consistent the survey intercept for all libraries, so that those libraries emphasizing browsing of titles would not have different results from those libraries which chose to highlight the search function on the Scholars Portal home page. In the case of repeated usage by the same user (that is, the same workstation) the survey auto-populated, using a cookie, retaining the values for the previously completed survey. This strategy captured repeated usage and lessened the potential for annoying the patron. The Scholars Portal technical group used perl scripts and CGIs to provide access to resources, and the survey was written using same these techniques. MINES has followed the web survey design guidelines recommended by Dillman (2000), which suggests fourteen principles for the design of web surveys to mitigate the traditional sources of web survey error: sampling, coverage, measurement and non-response. To reduce the effects on the respondents of different renderings of the survey by different workstation browsers, the survey used simple text for its questions. The survey is short, with only a few questions, easy to navigate, and plain. In addition to the values of the questions to which the users responded, the record for each surveyed usage included a time and date stamp, the IP address of the client workstation or proxy server, the referring URL, the destination or target URL, and the institution with which the patron was affiliated. The IP address was used to identify the institutional affiliation of the surveyed patron. ISSNs are part of the target file structure, and so could be broken out, easily identifying the target ejournal.

Final Report
10
MINES SURVEY at OCUL The focus of the MINES survey was this electronic journals component of the Scholars Portal. The aim was to evaluate how well Ontario university libraries were meeting researcher needs with the consortia-purchased electronic resources offered.
The desired outcomes in utilizing the MINES survey methodology were:
To capture in-library and remote web usage of Scholars Portal in a sound representative sample using MINES methodology
To identify the demographic differences between in-house library users as
compared to remote users by status of user (presently we cannot get user status from our Scholars Portal usage data).
To identify users’ purposes for accessing Scholars Portal electronic services
(funded research, non-funded research, instruction/education use, student research papers and course work) to assist with the evaluation of the project ( as well as to broaden the scope to capture information for OCUL about indirect research costs.)
To develop an OCUL infrastructure to make studies of patron usage of OCUL
networked electronic resources routine, robust and integrated in to the decision-making process.
History of OCUL Involvement and Survey Implementation OCUL used a customized version of the MINES instrument and methodology previously employed at five academic health sciences libraries and two large main academic libraries in the United States. These studies were designed and conducted by Brinley Franklin (University of Connecticut) and Terry Plum (Simmons Graduate School of Library and Information Science). MINES for Libraries™ came to OCUL’s attention in 2003 after it was incorporated into ARL’s New Measures Initiatives. The OII Project Management Team was excited about the MINES project because of its potential to provide OCUL with unique information about actual Scholars Portal use that was not achievable through other means. In the fall of 2003, an agreement was signed with ARL to work on a joint project in implementing the MINES survey for OCUL libraries. Details were worked out with the key people at the University of Toronto responsible for running the methodology for the seventeen OCUL institutions which had computing environments that would sustain the application of the survey. ARL prepared a schedule for random two-hour monthly runs of the survey. A year’s worth of data would be
Final Report
11
collected that would span all times of the day and night and academic sessions. It was recognized that the methodology was unorthodox in that it included a mandatory element that might be problematic. It was also acknowledged that the survey might be annoying for patrons who were retrieving a large number of electronic journals during the same two-hour sample period, and therefore would be repeatedly surveyed. However, it was agreed that the benefits of rigorous data collection were great and every effort was made to minimize user inconvenience, including an immediate automatic connection to the resource of choice, and an auto-populated form if a user was accessing more than one journal in succession. Several OCUL libraries mounted web pages or produced newsletter articles explaining the project, its methodology, and benefits. In order to accommodate the needs at the three bilingual institutions in the province, the survey form and the explanatory material were translated into French. Each survey participant was given a choice of language on the survey form. A test run was implemented in January 2004. The pilot highlighted the need for all institutions to be using a consistent link resolver URL when connecting to the Scholars Portal from their catalogues or eResources databases. Each site reviewed their configuration and necessary changes were made. Due to technical problems including a server disruption, the February and March runs were considered tests and the April run was cancelled. The real data collection ran from May 2004 through April 2005. The February and March runs of the survey highlighted the different ways OCUL libraries implemented and accessed the Scholars Portal. That variety needed to be reflected in the data gathering. As originally planned, the data gathering was revised to capture every journal usage during the two- hour survey periods coming from :
– local electronic resources databases – library catalogues – Scholars Portal browse and search functions.
OCUL employed a unique definition of usage which was possible since article-level data was archived on an OCUL server: a successful search was defined as connecting the user to an article of interest for viewing, downloading or printing. The figure below shows the survey form as it appeared on the web (see Figure 1). Benefits of the Methodology The methodology is based on an attempt to capture every user of the service. Without a random sampling plan, in which each user has an equal chance of being included in the sample, we cannot really say anything about the population from which the sample is drawn. The sample based on random moments permits OCUL to make reliable inferences about the population, and to test hypotheses. The random sampling plan and the mandatory nature of the questions are both required to create a statistically sound study. If the survey is not mandatory, the group of non-respondents is likely to be different from the group of respondents, and we will not know what that difference is. One of the strengths and innovations of this survey technique is that it is based upon actual use, not on predicted, intended, or remembered use.

Final Report
12
Figure 1:OCUL MINES for Libraries™ Survey Form
Figure 2. Scholars Portal Usage Report Generator

Final Report
13
Ethics Review All Canadian Universities must comply with the Tri-Council Policy Statement on Ethical Conduct for Human Research Involving Humans 1998 (Updated 2000, 2002 http://www.ncehr-cnerh.org/english/code_2/) put out by the Medical Research Council of Canada, the Natural Sciences and Engineering Research Council of Canada, and the Social Sciences and Humanities Research Council of Canada. A major step in implementing the MINES survey in each of the seventeen eligible libraries was contacting research ethics officers and/or Ethics Review Boards to get approval to run the survey. The purpose of ethics reviews for human subjects is to prevent putting subjects at risk. In the document, “the standard of minimal risk is commonly defined as follows: if potential subjects can reasonably be expected to regard the probability and magnitude of possible harms implied by participation in the research to be no greater than those encountered by the subject in those aspects of his or her everyday life that relate to the research then the research can be regarded as within the range of minimal risk.” Ultimately, eight campuses did not require approval because the survey fell into quality assurance guidelines and was seen as a library management tool; eight received approval after an application process. One library did not receive approval due to the mandatory nature of the survey. It was determined that it was preferable to go with statistical valid data from the large number of OCUL libraries (sixteen out of seventeen) able to participate rather than stray from the benefits of the methodology. The findings of the MINES for Libraries™ survey are complemented by journal usage statistics maintained by the University of Toronto (see Figure 2). Survey Findings A total of 20,293 usable cases were collected through the MINES for Libraries ™ evaluation of the OCUL Scholars Portal survey during the period May 2004 to April 2005. Detailed analysis of all of the variables for all institutions is presented to OCUL in three different ways: (a) through a series of print reports – summary tables for all OCUL institutions and institutional specific reports; (b) an html spss file available under password protection on the web; (c) an interactive analytical interface built with ColdFusion, SQLServer, and Dundas Charts. The interactive analytical interface shows interactive analysis of the data with specific institutional level tables is presented through StatsQUAL™ -- a gateway to library assessment tools. MINES for Libraries™ is one of these tools in the StatsQUAL™ interface and is accessible by OCUL libraries through a password protected interface at: http://www.statsqual.org/mines/index.cfm Figure 3 presents a web page that demonstrates the analytical interface ARL has created for the OCUL MINES for Libraries™ project.

Final Report
14
Figure 3. MINES for Libraries™ through the StatsQUAL™ gateway
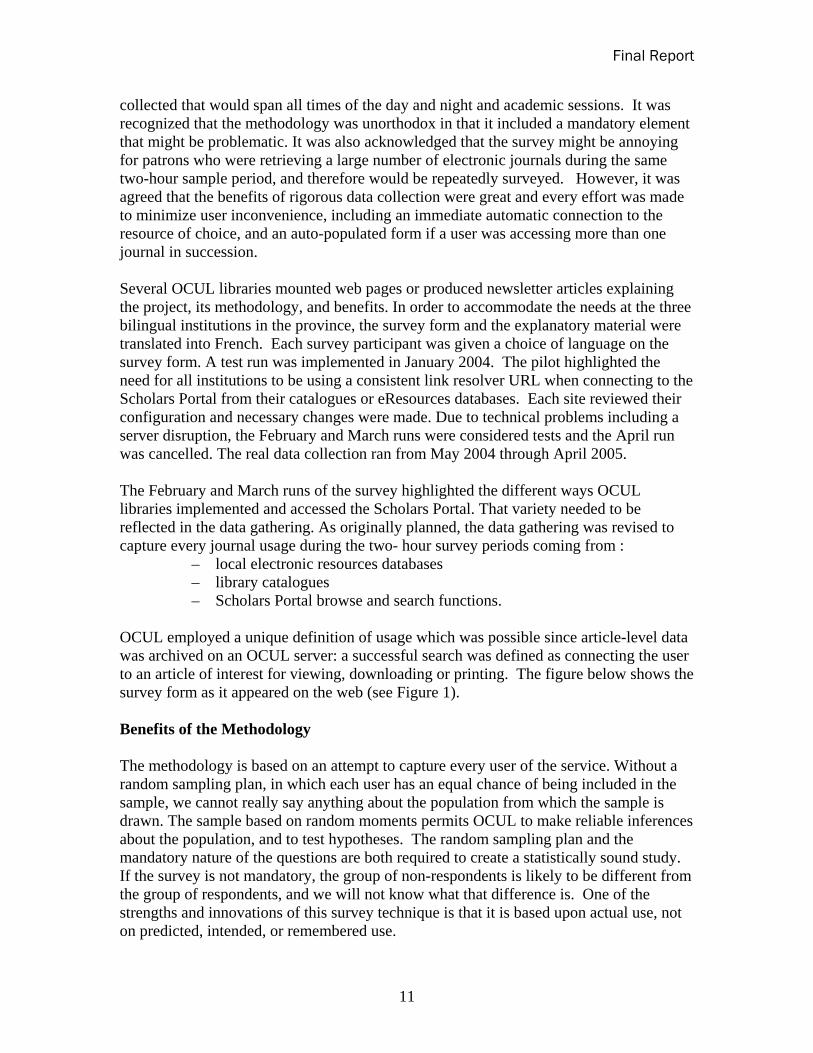
The MINES for Libraries™ database is a rich resources for all sixteen OCUL institutions that participated in this study. The analysis presented here can cover only a basic approach which is expected to be enhanced locally by the participating libraries. It highlights only a select number of findings from the perspective of the analysts at the Association of Research Libraries Statistics and Measurement Program. Who uses electronic resources? There were 20,293 complete responses for the Affiliation, User Status, Location and Purpose of Use questions. Table 2 presents the distribution of the respondents on these key variables. The subject affiliation of the majority of the respondents is science comprising 23.2% (4,698 respondents), closely followed by medical health (21.6%), social sciences (19.2%) and applied sciences (14.4%) (Figure 4).
Final Report
15
Figure 4. Frequency of Uses of Scholars Portal by Affiliation
Close to half of the respondents are undergraduates (45.9%), followed by graduate professionals (32.3%), and faculty (11.1%) (Figure 5). Where are the users located at the point of use? Most respondents use these resources from off-campus (45.1%), next from on campus locations but outside the library (34.9%) and only 19.9% of them use electronic resources from within a library building (Figure 6).

Final Report
16
Figure 5. Frequency of Uses of Scholars Portal by User Status
Final Report
17
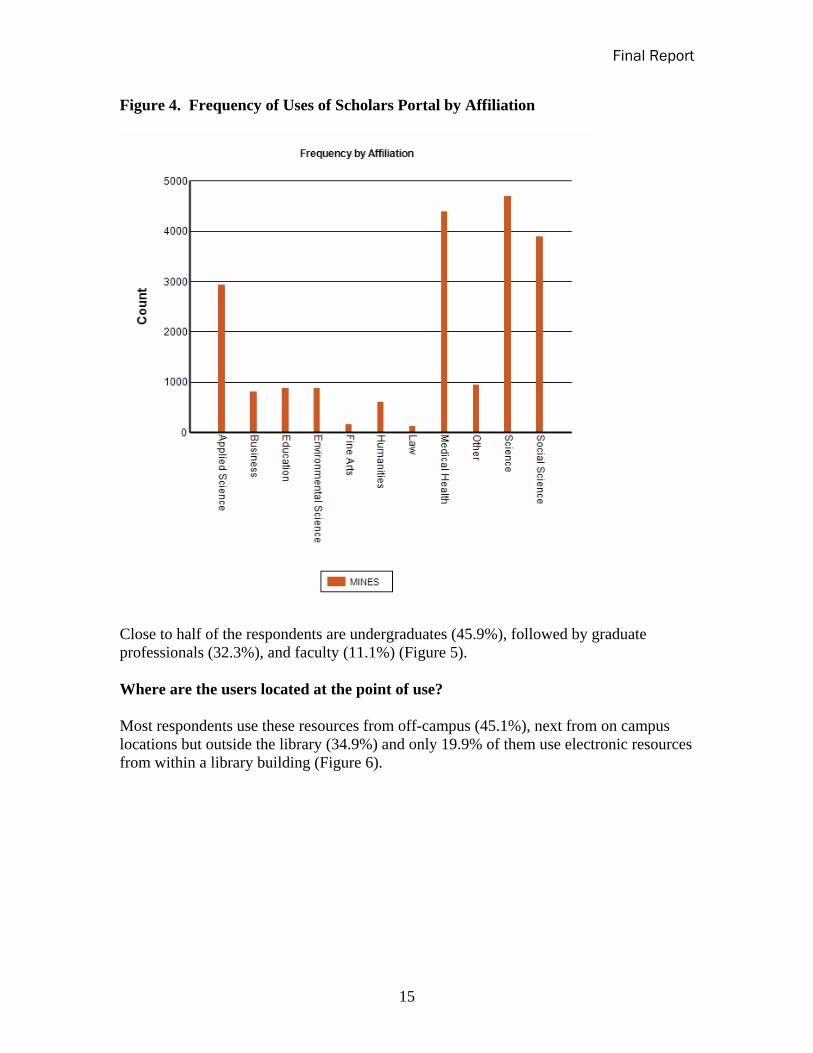
Figure 6. Frequency of Uses of Scholars Portal by Location
What is the primary purpose of use? The primary purpose of use of these resources is coursework (42.6%), followed by sponsored research (26.2%), and other research activities (16.2%) (Figure 7). In the OhioLINK study when each respondent was asked to indicate the primary reason for viewing an article, the most frequently cited reason was also a class paper or project. (Connell, Rogers, and Diedrichs, 2005).

Final Report
18
Figure 7. Frequency of Uses of Scholars Portal by Primary Purpose of Use
A cross tabulation of purpose of use with affiliation shows that while coursework accounts for 42% (8,530/20,293) of the overall uses of Scholars Portal resources, it accounts for 62.6% (2,435/3,887) of the uses in the social sciences, 44.6% (2,096/4,698) of the uses in the sciences, but only 29.7% (1,305/4,391) of the uses in medical health and 24% (704/2,930) in applied sciences. Sponsored research accounts overall for 26.2%. There is variation across discipline categories though. Sponsored research represents 32% (1,404/4,391) of the uses of the Scholars Portal in the medical health, 46.3% (1,357/2,930) in the applied sciences, 31.8% (1,495/4,698) in the sciences, and only 13.6% (529/3,887) in the social sciences. In

Final Report
19
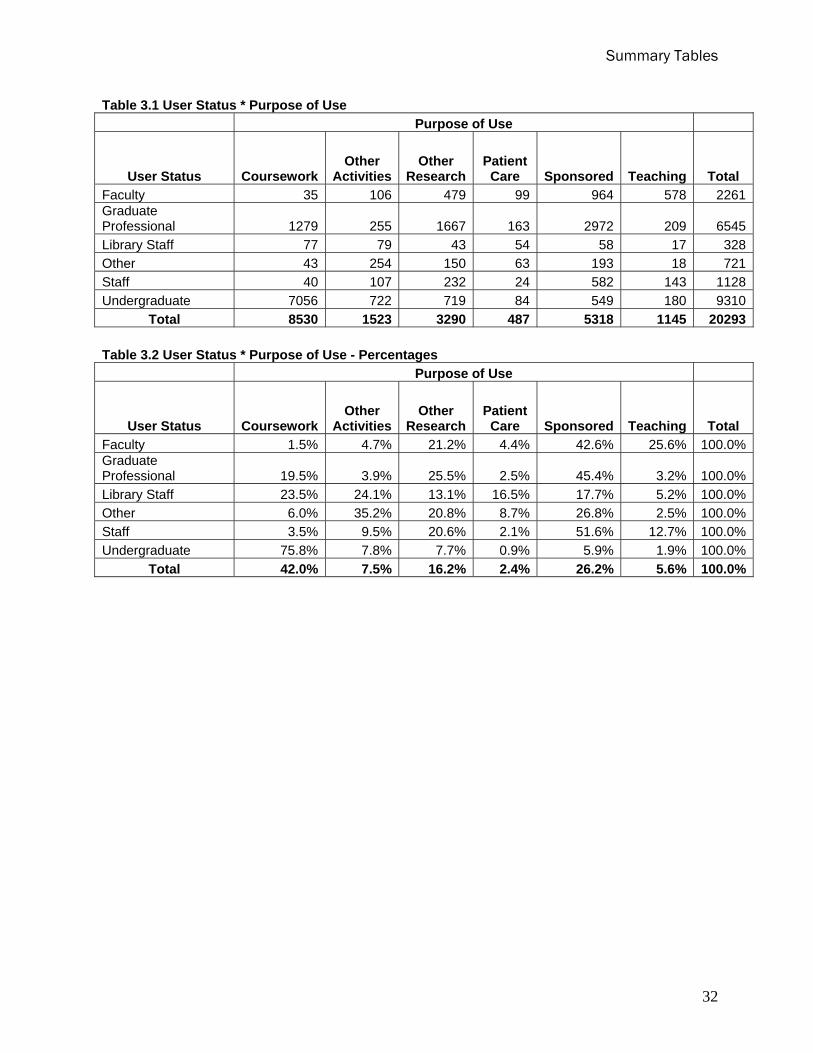
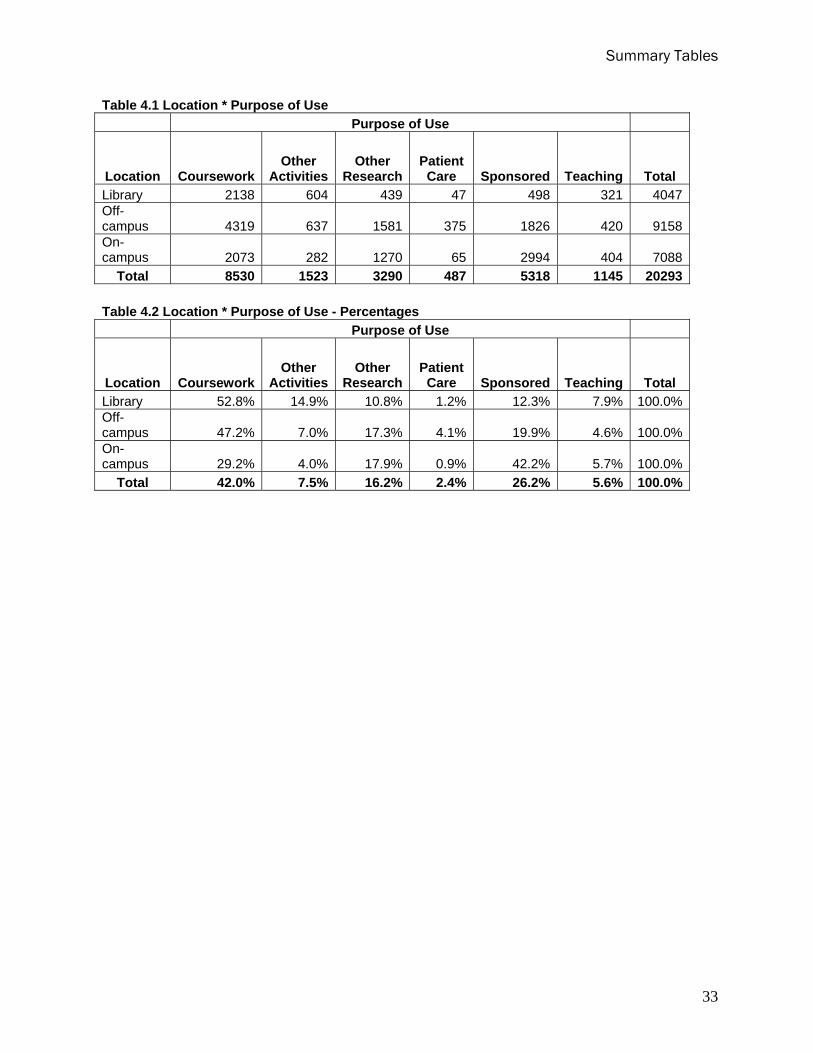
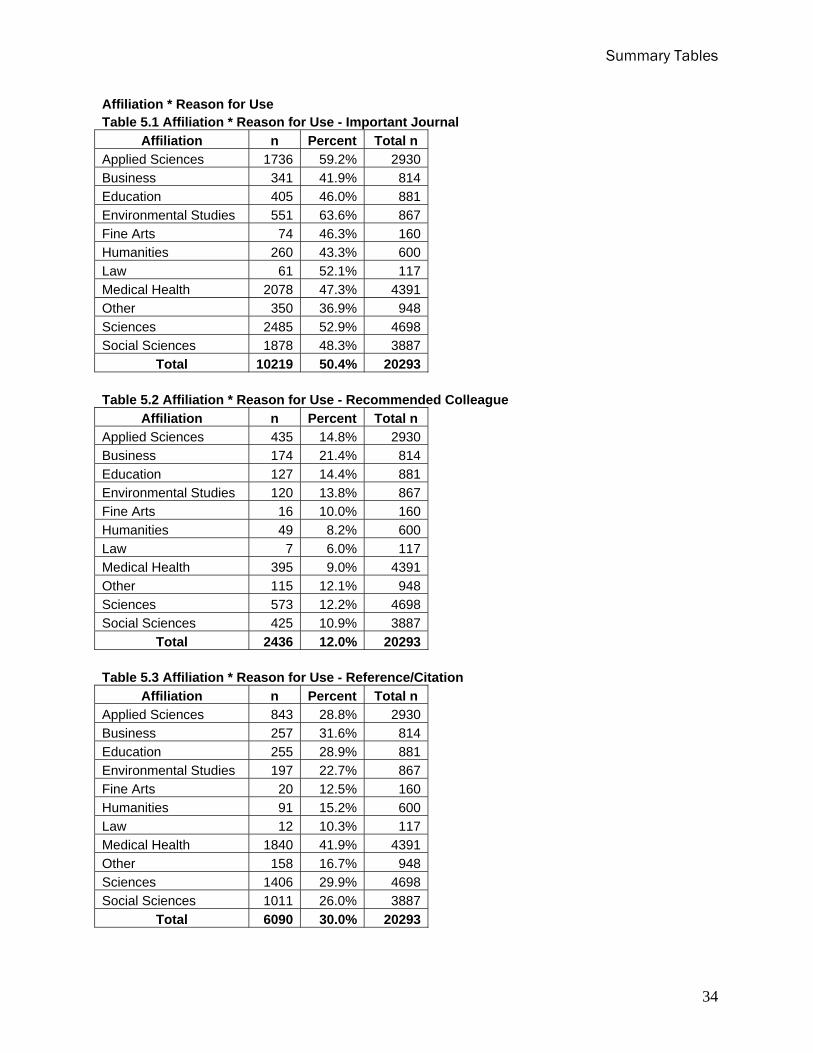
addition to the 32% sponsored research uses in the medical health field, another 18.4% (810/4,391) are for other research purposes, accounting for more than 50% use for research purposes in medical health. Similarly in addition to the 46.3% sponsored research uses in applied sciences, another 17.7% (520/2,930) are for other research purposes. The Scholars Portal is heavily used for purposes of medical health and applied science research (Table 3). A cross tabulation of purpose of use with users’ status (Table 4) shows that 75.8% (7,056/9,310) of the undergraduate uses were for coursework. 45.4% (2,972/6,545) of the graduate professional uses were for purposes of sponsored research and 25.5% (1,667/6,545) for other research purposes. Only 19.5% (1,279/6,545) of the graduate professional category indicated that their primary purpose was coursework. Similarly, 42.6% (964/2,261) of the faculty uses were for sponsored research, and 21.2% (479/2,261) were for other research purposes. If undergraduate sponsored research is assigned to instruction, then the percentages of user status by sponsored research remains unchanged, except that undergraduate sponsored research goes to 0%, and undergraduate coursework increases to 81.7%. It could be argued that undergraduates are not involved in sponsored research. In Table 4, the undergraduate sponsored research value is as reported and not re-assigned. A cross tabulation of purpose of use with location (Table 5) shows that a large portion of the use is off-campus (45.1%, 9,158/20,293) and most of that off-campus use happens for the purposes of coursework (47.2%, 4,319/9,158). Other research has 17.3% (1,581/9,158) uses off-campus, and sponsored research had 19.9% (1,826/9,158) uses off-campus. On campus location but outside the library is the second most frequent location for users of the Scholars Portal (34.9%, 7,088/20,293). A large portion of these on campus uses are for sponsored research (42.2%, 2,994/7,088). The next most frequent purpose of use for on campus location was coursework (29.2%, 2,073/7,088). Only 4,047 out of the 20,293 (19.9%) uses take place within the library. From the uses within the library, 52.8% (2,138/4,047) are for coursework purposes, and only 12.3% (498/4,047) of the uses within the library are for sponsored research. Reason for Use Unlike the other questions in the survey, it was possible for the patron to pick more than one reason for use. The most frequent reason for use provided for the 20,293 uses, was the importance of the journal (50.4%), the second most frequent reason was by following a reference or a citation (30%), next recommended by colleague (12%), followed by course reading assignment (4.6%) and recommended by a librarian (3.1%). This pattern is rather consistent across the different discipline affiliations when it comes to the importance of the journal and recommendations by colleagues. There is more variation though across disciplines regarding the propensity to use other references/citations, with medical health indicating 41.9% (1,840/4,391), business 31.6% (257/814), sciences 29.9% (1,406/4,698), applied sciences 28.8% (843/2,930), social sciences 26% (1,011/3,887), to a low of 10.3% (12/117) for law, 12.5% for humanities (91/600), and 15.2% (20/160) for fine arts.

Final Report
20
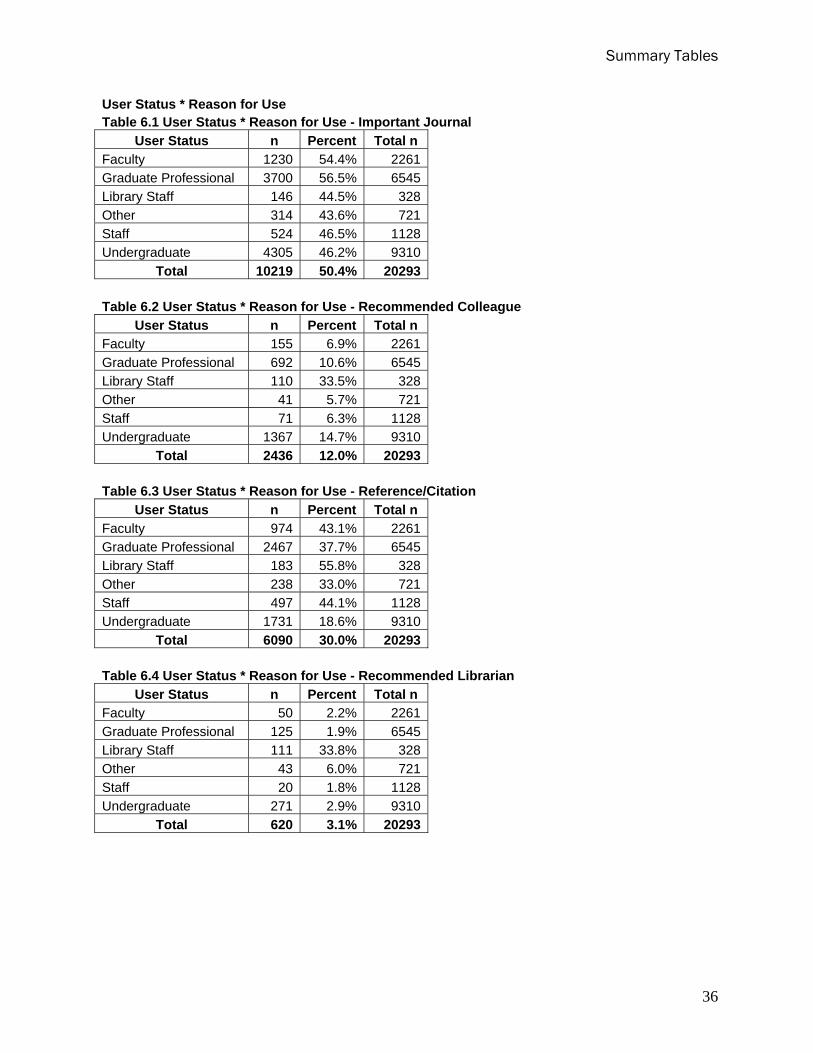
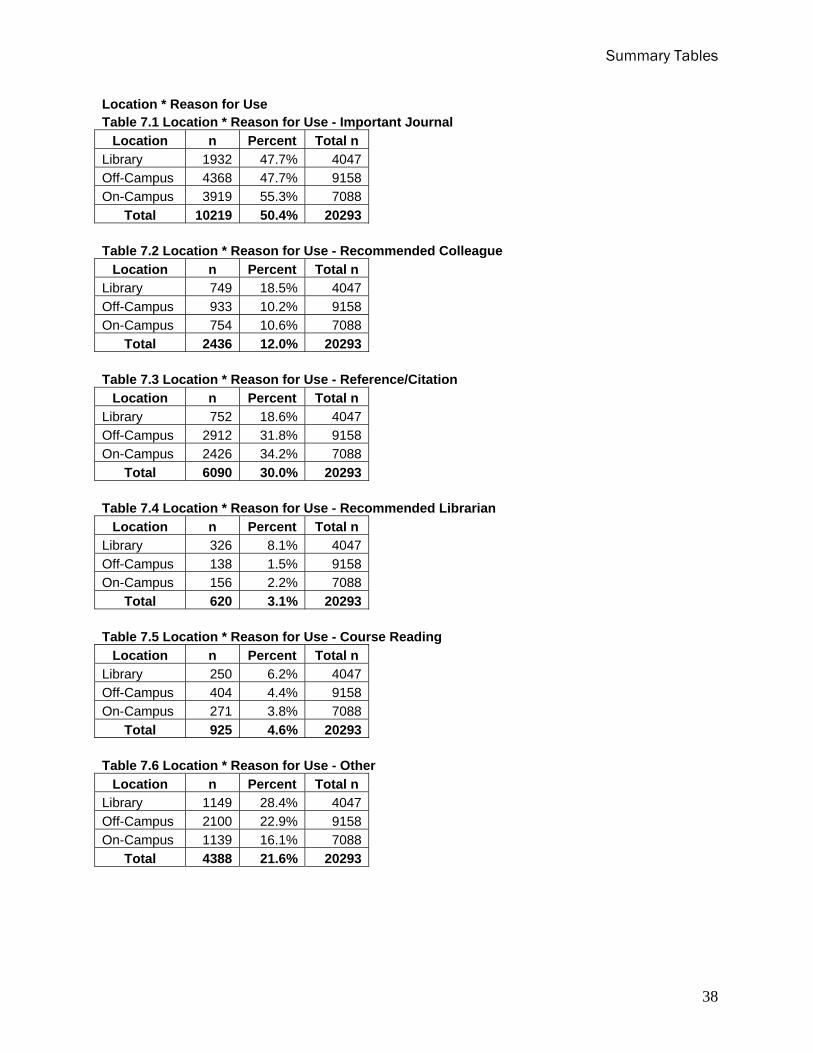
There are also variations across user groups (faculty, graduate professional, library staff, other, staff) and undergraduate, when it comes to the reasons they offer for use of these resources. For example, faculty indicated that 54.4% (1,230/2,261) of all faculty uses are because of the importance of the journal, and only 46.2% (4,305/9,310) of all undergraduate uses are for this reason. A larger proportion of faculty uses (43.1%, 974/2,261)) are motivated by following reference/citations and a smaller percent of undergraduate uses (18.6%, 1,731/9,310) are for this reason. Graduate professional patterns tend to be similar to the faculty uses patterns when it comes to the various reasons for use. As one might expect, the “recommended by librarian” reason for use occurs much more frequently from within the library (8.1%, 326/4047) than from on campus but not in the library (2.2%, 156/7088) or off campus (138/9158) For the reason for use “reference/citation,” 34.2% (2,426/7,088) uses are on-campus, 31.8% (2,912/9,158) are off campus, and 18.6% (752/4,047) are from within the library. The most popular reason for use, that is, the journal is important, represents roughly the same percentage of the total n for each location (47.7% - 55.3%). Where are the users? As we indicated earlier, most use is outside the library, 45.1% (9,158/20,293) off campus, and 34.9% (7,088/20,293) on campus. Yet from the three primary user groups – faculty, graduate professional and undergraduates, a larger portion of undergraduates (30.2%, 2,812/9,310) uses of Scholars Portal are from within the library compared to faculty (9.7%, 219/2,261) and graduate professional (8.4%, 552/6,545). 47.9% (1,084/2,261) faculty uses and 48.6% (3,184/6,545) of graduate professional uses are from on-campus locations but only 22% (2,047/9,310) of undergraduate uses are from on-campus locations outside the library. A large portion of uses is from off-campus locations for all three user groups: 42.4% for faculty, 42.9% for graduate professionals, and 47.8% for undergraduates. In Summary
The goal of the analysis is to inform decision making for future funding of these resources and a sense of perceived value based on use across different user categories. Scholars Portal has successfully mounted and delivered information resources acquired through OCUL consortia purchases and has ensured rapid and reliable access to these resources. Continuing support for the Scholars Portal will provide for the long term, secure archiving of resources to ensure continued availability.
By sampling uses of electronic resources and capturing additional information about these uses through an online survey, we are adding to the value of the usage statistics collected by OCUL through the MINES for Libraries™ protocol. As users are not physically coming into the library and are not physically checking out physical items, our

Final Report
21
knowledge of who they are, what is their purpose of use and how they use these resources is diminished. Increased knowledge of how these resources are used can assist those making collection management decisions during difficult fiscal times and help them prioritize the need for additional resources.
• How extensively do sponsored researchers use OCUL’s Scholars Portal? How much usage is for non-funded research, instruction/education, student research papers, and course work?
MINES for Libraries™, a transaction-based research methodology consisting of a web-based survey form and a random moments sampling plan, shows that the Scholars Portal resources are heavily used by faculty and students in all OCUL. The majority of the use is from the sciences and the medical field and particularly in those fields the majority of the use is for sponsored research purposes.
• Are researchers more likely to use the Scholars Portal from inside or outside the library? What about other classifications of users?
Most faculty, graduate professionals and undergraduates uses of the Scholars Portal are from outside the library building. Undergraduates though do show many uses of the Scholars Portal from within the library as they are probably becoming more exposed to these resources by having more physical contact with the library.
• Are there differences in Scholars Portal based on the user’s location (e.g., in the
library; on-campus, but not in the library; or off-campus)?
Most of the faculty and graduate professionals use Scholars Portal either from on-campus locations outside the library or from other off-campus locations. Most of the uses from these locations outside the library are for sponsored research purposes.
• Could MINES, combined with usage counts, provide an infrastructure to make Scholars Portal usage studies routine, robust, and easily integrated into OCUL’s administrative decision-making process for assessing networked electronic resources?
MINES for Libraries™, combined with usage counts, provides an infrastructure to make Scholars Portal usage studies routine, robust, and easily integrated into OCUL’s administrative decision-making process for assessing networked electronic resources. It is relatively easy to continue this evaluation on an ongoing basis to justify the costs associated with the purchase of electronic resources. This type of evaluation provides both quantitative and qualitative information about the use of electronic resources and can be mined on an ongoing basis to assess library services to a user community that is increasingly self-sufficient and independent in the way it is approaching information discovery and retrieval.

Final Report
22
References Connell, Tschera Harkness, Sally A. Rodgers, and Carol Pitts Diedrichs. 2005. “OhioLINK Electronic Journal Use at Ohio State University” portal: Libraries and the Academy 5 (3): 371-390. Dillman, Don. A. 2000. Mail and Internet Surveys, The Tailored Design Method. 2nd Ed. New York: John Wiley & Sons.
Franklin, Brinley, and Terry Plum. 2004. “Library usage patterns in the electronic information environment.” Information Research, 9(4), paper 187. http://informationr.net/ir/9-4/paper187.html
Franklin, Brinley, and Terry Plum. 2003. “Documenting Usage Patterns of Networked Electronic Services.” ARL Bimonthly Report, No. 230/231 (October/December): 20-21. http://www.arl.org/newsltr/230/usage.html
Franklin, Brinley, and Terry Plum. 2002. “Networked Electronic Services Usage Patterns at Four Academic Health Sciences Libraries.” Performance Measurement and Metrics 3(3): 123-133. http://www.emeraldinsight.com/1467-8047.htm
Franklin, Brinley. 2001. “Academic Research Library Support of Sponsored Research in the United States.” Proceedings of the 4th Northumbria International Conference on Performance Measurement in Libraries and Information Services. Association of Research Libraries, Washington, D.C. http://www.libqual.org/documents/admin/franklin.pdf
Koehn, Uwe. 2003. Personal communication. (June 15).
Final Report
23
Table 1. Ontario Council of University Libraries July 2005
Partner Institutions FTEs
Brock University 13,691
Carleton University 19,574
University of Guelph 18,082
Lakehead University 6,738
Laurentian University 7,505
McMaster University 20,497
Nipissing University 4,285
Ontario College of Art and Design 2,717
University of Ontario Institute of Technology 900
University of Ottawa 26,893
Queen's University 18,877
Royal Military College of Canada* 1,941
Ryerson University 20,990
University of Toronto 60,456
Trent University 6,726
University of Waterloo 22,765
University of Western Ontario 31,336
Wilfrid Laurier University 11,306
University of Windsor 14,577
York University 40,899
*2002
Total 350,755

Final Report
24
Table 2. Frequencies by Affiliation, User Status, Location, Purpose of Use
Affiliation Frequency Applied Sciences 2930Business 814Education 881Environmental Studies 867Fine Arts 160Humanities 600Law 117Medical Health 4391Other 948Sciences 4698Social Sciences 3887
Total 20293User Status Frequency
Faculty 2261Graduate Professional 6545Library Staff 328Other 721Staff 1128Undergraduate 9310
Total 20293Location Frequency
Library 4047Off-Campus 9158On-Campus 7088
Total 20293Purpose of Use Frequency
Coursework 8530Other Activities 1523Other Research 3290Patient Care 487Sponsored 5318Teaching 1145
Total 20293
Affiliation Percent Applied Sciences 14.4%Business 4.0%Education 4.3%Environmental Studies 4.3%Fine Arts 0.8%Humanities 3.0%Law 0.6%Medical Health 21.6%Other 4.7%Sciences 23.2%Social Sciences 19.2%
Total 100.0%User Status Percent
Faculty 11.1%Graduate Professional 32.3%Library Staff 1.6%Other 3.6%Staff 5.6%Undergraduate 45.9%
Total 100.0%
Location Percent Library 19.9%Off-Campus 45.1%On-Campus 34.9%
Total 100.0%Purpose of Use Percent
Coursework 42.0%Other Activities 7.5%Other Research 16.2%Patient Care 2.4%Sponsored 26.2%Teaching 5.6%
Total 100.0%

Table 3. Affiliation * Purpose of Use - Percentages Purpose of Use
Affiliation Coursework Other
ActivitiesOther
ResearchPatient Care
Sponsored Research Teaching Total
Applied Sciences 24.0% 7.6% 17.7% 0.6% 46.3% 3.7% 100.0%Business 34.8% 7.6% 30.0% 0.9% 10.8% 16.0% 100.0%Education 40.9% 5.4% 17.1% 0.8% 11.8% 24.0% 100.0%Environmental Studies 43.5% 2.5% 24.0% 0.3% 23.3% 6.3% 100.0%Fine Arts 56.3% 6.9% 20.6% 1.3% 5.6% 9.4% 100.0%Humanities 51.5% 10.8% 21.0% 0.5% 9.5% 6.7% 100.0%Law 67.5% 6.8% 12.8% 0.9% 2.6% 9.4% 100.0%Medical Health 29.7% 5.5% 18.4% 8.6% 32.0% 5.7% 100.0%Other 51.9% 22.8% 10.9% 2.1% 7.4% 5.0% 100.0%Sciences 44.6% 9.7% 11.1% 0.4% 31.8% 2.4% 100.0%Social Sciences 62.6% 4.5% 14.4% 0.7% 13.6% 4.2% 100.0%
Total 42.0% 7.5% 16.2% 2.4% 26.2% 5.6% 100.0%

Summary Tables
26
Table 4. User Status * Purpose of Use - Percentages Purpose of Use
User Status Coursework Other
ActivitiesOther
ResearchPatient
Care Sponsored Research Teaching Total
Faculty 1.5% 4.7% 21.2% 4.4% 42.6% 25.6% 100.0%Graduate Professional 19.5% 3.9% 25.5% 2.5% 45.4% 3.2% 100.0%Library Staff 23.5% 24.1% 13.1% 16.5% 17.7% 5.2% 100.0%Other 6.0% 35.2% 20.8% 8.7% 26.8% 2.5% 100.0%Staff 3.5% 9.5% 20.6% 2.1% 51.6% 12.7% 100.0%Undergraduate 75.8% 7.8% 7.7% 0.9% 5.9% 1.9% 100.0%
Total 42.0% 7.5% 16.2% 2.4% 26.2% 5.6% 100.0% Table 5. Location * Purpose of Use - Percentages Purpose of Use
Location Coursework Other
ActivitiesOther
ResearchPatient
Care Sponsored Research Teaching Total
Library 52.8% 14.9% 10.8% 1.2% 12.3% 7.9% 100.0%Off-campus 47.2% 7.0% 17.3% 4.1% 19.9% 4.6% 100.0%On-campus 29.2% 4.0% 17.9% 0.9% 42.2% 5.7% 100.0%
Total 42.0% 7.5% 16.2% 2.4% 26.2% 5.6% 100.0%
Summary Tables
27
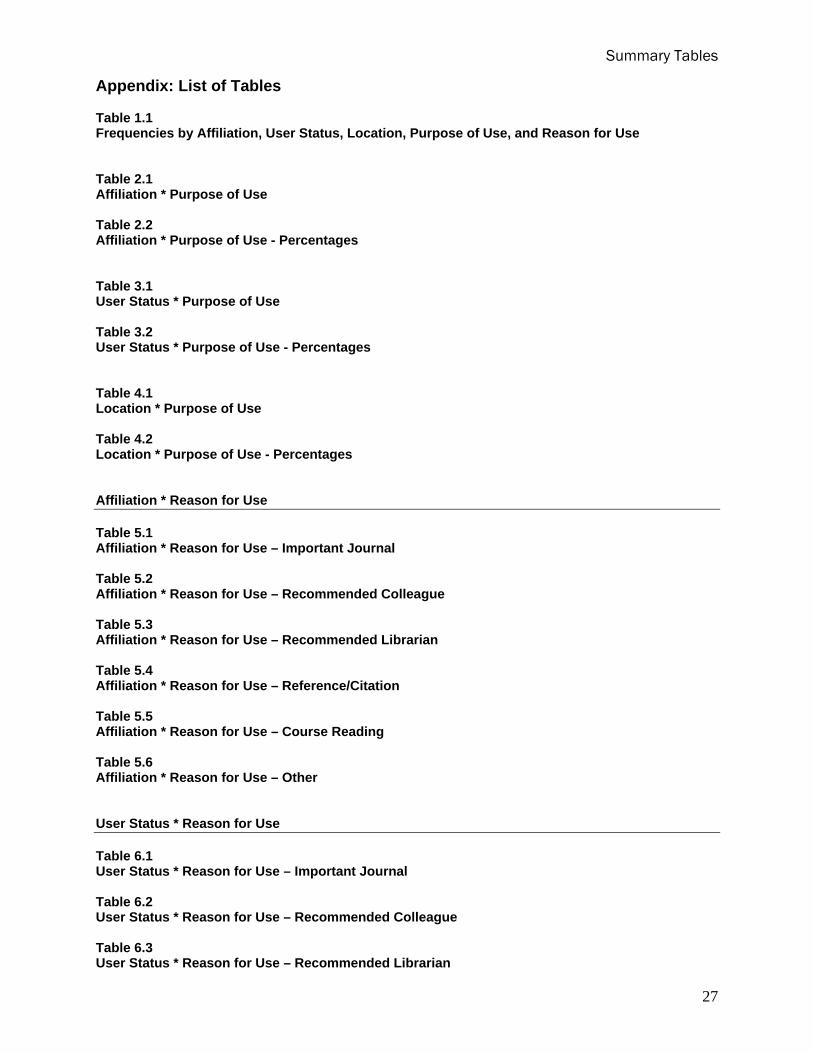
Appendix: List of Tables Table 1.1 Frequencies by Affiliation, User Status, Location, Purpose of Use, and Reason for Use Table 2.1 Affiliation * Purpose of Use Table 2.2 Affiliation * Purpose of Use - Percentages Table 3.1 User Status * Purpose of Use Table 3.2 User Status * Purpose of Use - Percentages Table 4.1 Location * Purpose of Use Table 4.2 Location * Purpose of Use - Percentages Affiliation * Reason for Use Table 5.1 Affiliation * Reason for Use – Important Journal Table 5.2 Affiliation * Reason for Use – Recommended Colleague Table 5.3 Affiliation * Reason for Use – Recommended Librarian Table 5.4 Affiliation * Reason for Use – Reference/Citation Table 5.5 Affiliation * Reason for Use – Course Reading Table 5.6 Affiliation * Reason for Use – Other User Status * Reason for Use Table 6.1 User Status * Reason for Use – Important Journal Table 6.2 User Status * Reason for Use – Recommended Colleague Table 6.3 User Status * Reason for Use – Recommended Librarian

Summary Tables
28
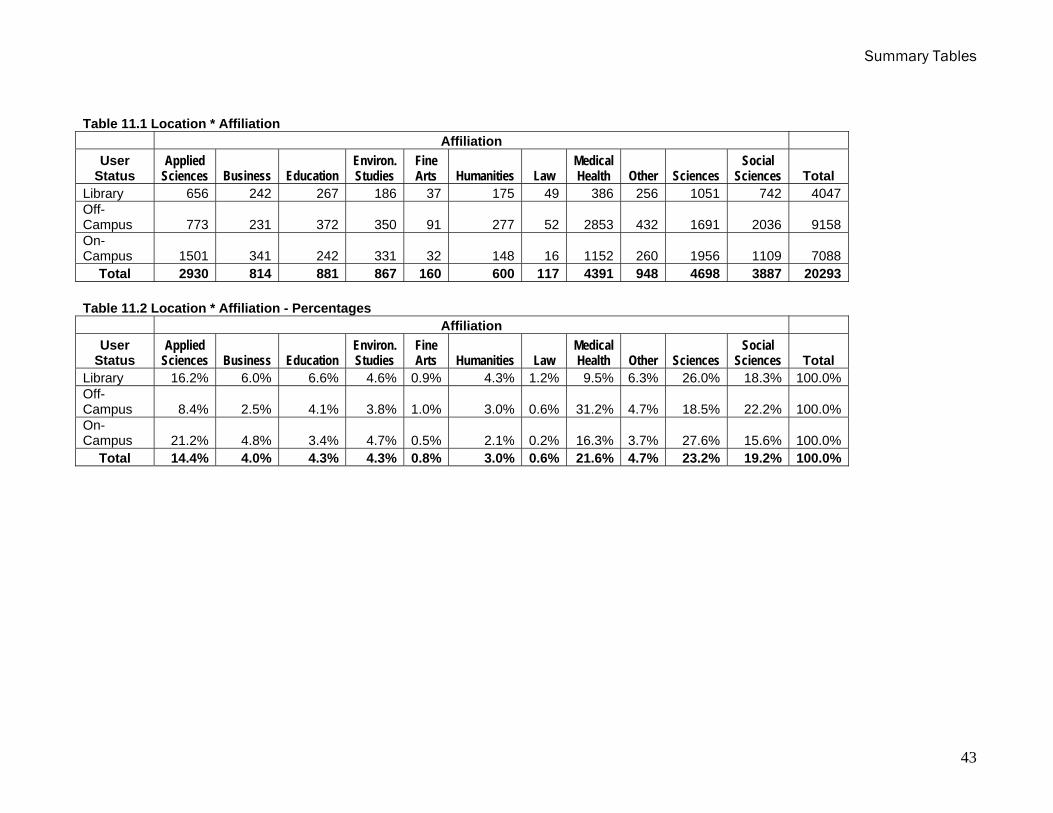
Table 6.4 User Status * Reason for Use – Reference/Citation Table 6.5 User Status * Reason for Use – Course Reading Table 6.6 User Status * Reason for Use – Other Location * Reason for Use Table 7.1 Location * Reason for Use – Important Journal Table 7.2 Location * Reason for Use – Recommended Colleague Table 7.3 Location * Reason for Use – Recommended Librarian Table 7.4 Location * Reason for Use – Reference/Citation Table 7.5 Location * Reason for Use – Course Reading Table 7.6 Location * Reason for Use – Other Table 8.1 User Status * Location Table 8.2 User Status * Location - Percentages Table 9.1 Purpose of Use by User Status * Location Table 9.2 Purpose of Use by User Status * Location - Percentages Table 10.1 User Status * Affiliation Table 10.2 User Status * Affiliation - Percentages Table 11.1 Location * Affiliation Table 11.2 Location * Affiliation - Percentages

Summary Tables
29
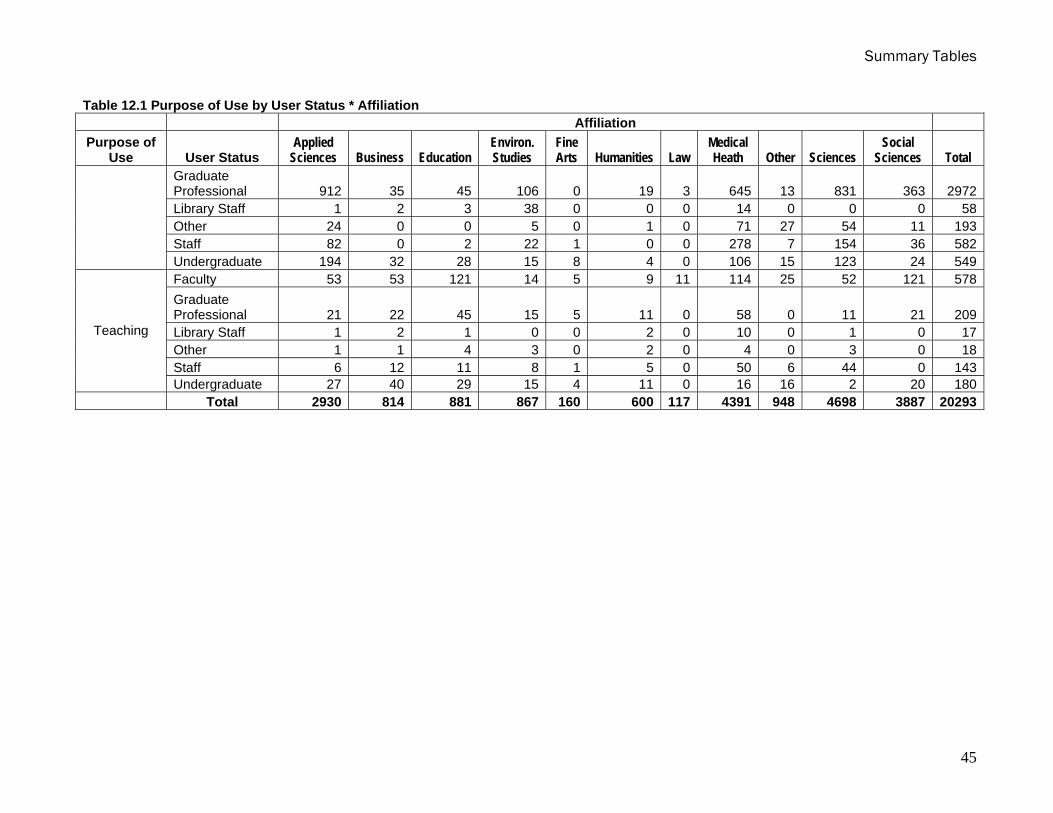
Table 12.1 Purpose of Use by User Status * Affiliation Table 13.1 User Status by Location * Affiliation

Summary Tables
30
Table 1.1 Frequencies by Affiliation, User Status, Location, Purpose of Use, and Reason for Use
Affiliation Frequency Affiliation Percent Applied Sciences 2930 Applied Sciences 14.4% Business 814 Business 4.0% Education 881 Education 4.3% Environmental Studies 867 Environmental Studies 4.3% Fine Arts 160 Fine Arts 0.8% Humanities 600 Humanities 3.0% Law 117 Law 0.6% Medical Health 4391 Medical Health 21.6% Other 948 Other 4.7% Sciences 4698 Sciences 23.2% Social Sciences 3887 Social Sciences 19.2%
Total 20293 Total 100.0%
User Status Frequency User Status Percent Faculty 2261 Faculty 11.1% Graduate Professional 6545 Graduate Professional 32.3% Library Staff 328 Library Staff 1.6% Other 721 Other 3.6% Staff 1128 Staff 5.6% Undergraduate 9310 Undergraduate 45.9%
Total 20293 Total 100.0%
Location Frequency Location Percent Library 4047 Library 19.9% Off-Campus 9158 Off-Campus 45.1% On-Campus 7088 On-Campus 34.9%
Total 20293 Total 100.0%
Purpose of Use Frequency Purpose of Use Percent Coursework 8530 Coursework 42.0% Other Activities 1523 Other Activities 7.5% Other Research 3290 Other Research 16.2% Patient Care 487 Patient Care 2.4% Sponsored 5318 Sponsored 26.2% Teaching 1145 Teaching 5.6%
Total 20293 Total 100.0%
Reason for Use (n=20293) Frequency Reason for Use (n=20293) Percent Important Journal 10219 Important Journal 50.4% Recommended Colleague 2436 Recommended Colleague 12.0% Reference/Citation 6090 Reference/Citation 30.0% Recommended Librarian 620 Recommended Librarian 3.1% Course Reading 925 Course Reading 4.6% Other 4388 Other 21.6%
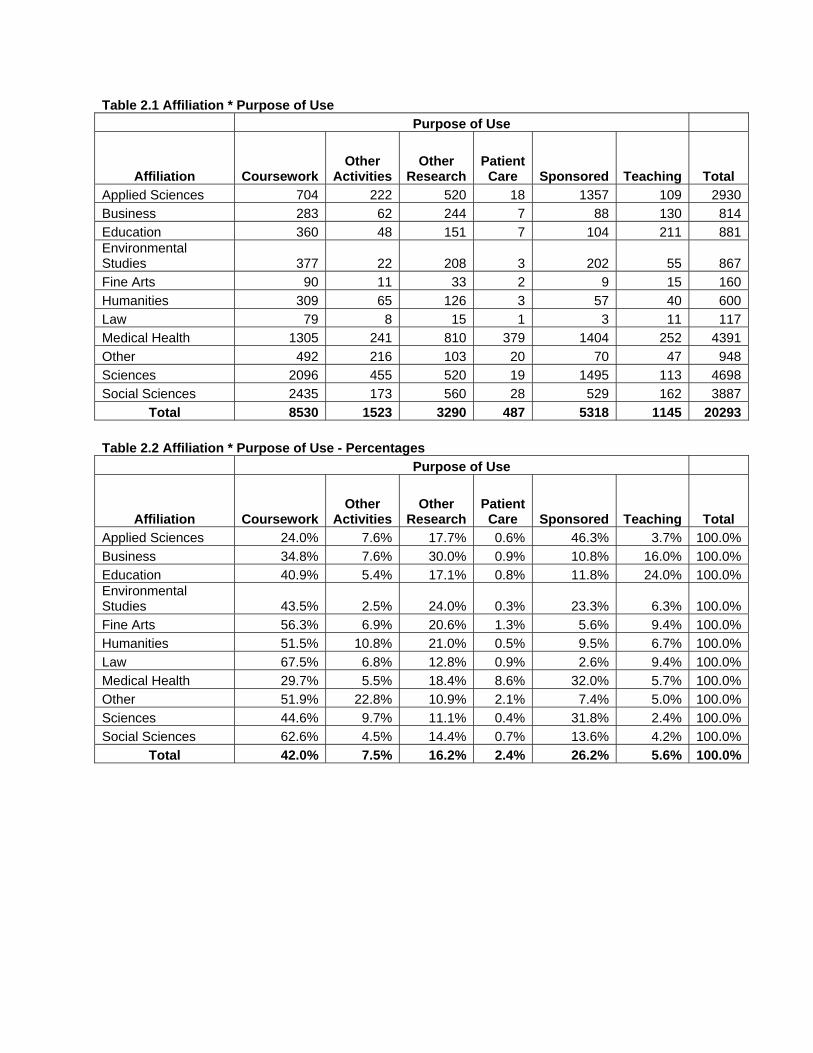
Table 2.1 Affiliation * Purpose of Use Purpose of Use
Affiliation Coursework Other
ActivitiesOther
ResearchPatient Care Sponsored Teaching Total
Applied Sciences 704 222 520 18 1357 109 2930Business 283 62 244 7 88 130 814Education 360 48 151 7 104 211 881Environmental Studies 377 22 208 3 202 55 867Fine Arts 90 11 33 2 9 15 160Humanities 309 65 126 3 57 40 600Law 79 8 15 1 3 11 117Medical Health 1305 241 810 379 1404 252 4391Other 492 216 103 20 70 47 948Sciences 2096 455 520 19 1495 113 4698Social Sciences 2435 173 560 28 529 162 3887
Total 8530 1523 3290 487 5318 1145 20293 Table 2.2 Affiliation * Purpose of Use - Percentages Purpose of Use
Affiliation Coursework Other
ActivitiesOther
ResearchPatient Care Sponsored Teaching Total
Applied Sciences 24.0% 7.6% 17.7% 0.6% 46.3% 3.7% 100.0%Business 34.8% 7.6% 30.0% 0.9% 10.8% 16.0% 100.0%Education 40.9% 5.4% 17.1% 0.8% 11.8% 24.0% 100.0%Environmental Studies 43.5% 2.5% 24.0% 0.3% 23.3% 6.3% 100.0%Fine Arts 56.3% 6.9% 20.6% 1.3% 5.6% 9.4% 100.0%Humanities 51.5% 10.8% 21.0% 0.5% 9.5% 6.7% 100.0%Law 67.5% 6.8% 12.8% 0.9% 2.6% 9.4% 100.0%Medical Health 29.7% 5.5% 18.4% 8.6% 32.0% 5.7% 100.0%Other 51.9% 22.8% 10.9% 2.1% 7.4% 5.0% 100.0%Sciences 44.6% 9.7% 11.1% 0.4% 31.8% 2.4% 100.0%Social Sciences 62.6% 4.5% 14.4% 0.7% 13.6% 4.2% 100.0%
Total 42.0% 7.5% 16.2% 2.4% 26.2% 5.6% 100.0%
Summary Tables
32
Table 3.1 User Status * Purpose of Use Purpose of Use
User Status Coursework Other
ActivitiesOther
ResearchPatient
Care Sponsored Teaching Total Faculty 35 106 479 99 964 578 2261Graduate Professional 1279 255 1667 163 2972 209 6545Library Staff 77 79 43 54 58 17 328Other 43 254 150 63 193 18 721Staff 40 107 232 24 582 143 1128Undergraduate 7056 722 719 84 549 180 9310
Total 8530 1523 3290 487 5318 1145 20293 Table 3.2 User Status * Purpose of Use - Percentages Purpose of Use
User Status Coursework Other
ActivitiesOther
ResearchPatient
Care Sponsored Teaching Total Faculty 1.5% 4.7% 21.2% 4.4% 42.6% 25.6% 100.0%Graduate Professional 19.5% 3.9% 25.5% 2.5% 45.4% 3.2% 100.0%Library Staff 23.5% 24.1% 13.1% 16.5% 17.7% 5.2% 100.0%Other 6.0% 35.2% 20.8% 8.7% 26.8% 2.5% 100.0%Staff 3.5% 9.5% 20.6% 2.1% 51.6% 12.7% 100.0%Undergraduate 75.8% 7.8% 7.7% 0.9% 5.9% 1.9% 100.0%
Total 42.0% 7.5% 16.2% 2.4% 26.2% 5.6% 100.0%
Summary Tables
33
Table 4.1 Location * Purpose of Use Purpose of Use
Location Coursework Other
ActivitiesOther
ResearchPatient
Care Sponsored Teaching Total Library 2138 604 439 47 498 321 4047Off-campus 4319 637 1581 375 1826 420 9158On-campus 2073 282 1270 65 2994 404 7088
Total 8530 1523 3290 487 5318 1145 20293 Table 4.2 Location * Purpose of Use - Percentages Purpose of Use
Location Coursework Other
ActivitiesOther
ResearchPatient
Care Sponsored Teaching Total Library 52.8% 14.9% 10.8% 1.2% 12.3% 7.9% 100.0%Off-campus 47.2% 7.0% 17.3% 4.1% 19.9% 4.6% 100.0%On-campus 29.2% 4.0% 17.9% 0.9% 42.2% 5.7% 100.0%
Total 42.0% 7.5% 16.2% 2.4% 26.2% 5.6% 100.0%
Summary Tables
34
Affiliation * Reason for Use Table 5.1 Affiliation * Reason for Use - Important Journal
Affiliation n Percent Total n Applied Sciences 1736 59.2% 2930 Business 341 41.9% 814 Education 405 46.0% 881 Environmental Studies 551 63.6% 867 Fine Arts 74 46.3% 160 Humanities 260 43.3% 600 Law 61 52.1% 117 Medical Health 2078 47.3% 4391 Other 350 36.9% 948 Sciences 2485 52.9% 4698 Social Sciences 1878 48.3% 3887
Total 10219 50.4% 20293 Table 5.2 Affiliation * Reason for Use - Recommended Colleague
Affiliation n Percent Total n Applied Sciences 435 14.8% 2930 Business 174 21.4% 814 Education 127 14.4% 881 Environmental Studies 120 13.8% 867 Fine Arts 16 10.0% 160 Humanities 49 8.2% 600 Law 7 6.0% 117 Medical Health 395 9.0% 4391 Other 115 12.1% 948 Sciences 573 12.2% 4698 Social Sciences 425 10.9% 3887
Total 2436 12.0% 20293 Table 5.3 Affiliation * Reason for Use - Reference/Citation
Affiliation n Percent Total n Applied Sciences 843 28.8% 2930 Business 257 31.6% 814 Education 255 28.9% 881 Environmental Studies 197 22.7% 867 Fine Arts 20 12.5% 160 Humanities 91 15.2% 600 Law 12 10.3% 117 Medical Health 1840 41.9% 4391 Other 158 16.7% 948 Sciences 1406 29.9% 4698 Social Sciences 1011 26.0% 3887
Total 6090 30.0% 20293
Summary Tables
35
Table 5.4 Affiliation * Reason for Use - Recommended Librarian Affiliation n Percent Total n
Applied Sciences 181 6.2% 2930 Business 69 8.5% 814 Education 42 4.8% 881 Environmental Studies 63 7.3% 867 Fine Arts 14 8.8% 160 Humanities 9 1.5% 600 Law 15 12.8% 117 Medical Health 63 1.4% 4391 Other 45 4.7% 948 Sciences 43 0.9% 4698 Social Sciences 76 2.0% 3887
Total 620 3.1% 20293 Table 5.5 Affiliation * Reason for Use - Course Reading
Affiliation n Percent Total n Applied Sciences 117 4.0% 2930 Business 69 8.5% 814 Education 94 10.7% 881 Environmental Studies 75 8.7% 867 Fine Arts 25 15.6% 160 Humanities 53 8.8% 600 Law 7 6.0% 117 Medical Health 132 3.0% 4391 Other 42 4.4% 948 Sciences 138 2.9% 4698 Social Sciences 173 4.5% 3887
Total 925 4.6% 20293 Table 5.6 Affiliation * Reason for Use - Other
Affiliation n Percent Total n Applied Sciences 479 16.3% 2930 Business 163 20.0% 814 Education 139 15.8% 881 Environmental Studies 191 22.0% 867 Fine Arts 60 37.5% 160 Humanities 218 36.3% 600 Law 32 27.4% 117 Medical Health 704 16.0% 4391 Other 385 40.6% 948 Sciences 960 20.4% 4698 Social Sciences 1057 27.2% 3887
Total 4388 21.6% 20293
Summary Tables
36
User Status * Reason for Use Table 6.1 User Status * Reason for Use - Important Journal
User Status n Percent Total n Faculty 1230 54.4% 2261 Graduate Professional 3700 56.5% 6545 Library Staff 146 44.5% 328 Other 314 43.6% 721 Staff 524 46.5% 1128 Undergraduate 4305 46.2% 9310
Total 10219 50.4% 20293 Table 6.2 User Status * Reason for Use - Recommended Colleague
User Status n Percent Total n Faculty 155 6.9% 2261 Graduate Professional 692 10.6% 6545 Library Staff 110 33.5% 328 Other 41 5.7% 721 Staff 71 6.3% 1128 Undergraduate 1367 14.7% 9310
Total 2436 12.0% 20293 Table 6.3 User Status * Reason for Use - Reference/Citation
User Status n Percent Total n Faculty 974 43.1% 2261 Graduate Professional 2467 37.7% 6545 Library Staff 183 55.8% 328 Other 238 33.0% 721 Staff 497 44.1% 1128 Undergraduate 1731 18.6% 9310
Total 6090 30.0% 20293 Table 6.4 User Status * Reason for Use - Recommended Librarian
User Status n Percent Total n Faculty 50 2.2% 2261 Graduate Professional 125 1.9% 6545 Library Staff 111 33.8% 328 Other 43 6.0% 721 Staff 20 1.8% 1128 Undergraduate 271 2.9% 9310
Total 620 3.1% 20293

Summary Tables
37
Table 6.5 User Status * Reason for Use - Course Reading User Status n Percent Total n
Faculty 93 4.1% 2261 Graduate Professional 210 3.2% 6545 Library Staff 43 13.1% 328 Other 13 1.8% 721 Staff 20 1.8% 1128 Undergraduate 546 5.9% 9310
Total 925 4.6% 20293 Table 6.6 User Status * Reason for Use - Other
User Status n Percent Total n Faculty 199 8.8% 2261 Graduate Professional 827 12.6% 6545 Library Staff 203 61.9% 328 Other 202 28.0% 721 Staff 155 13.7% 1128 Undergraduate 2802 30.1% 9310
Total 4388 21.6% 20293
Summary Tables
38
Location * Reason for Use Table 7.1 Location * Reason for Use - Important Journal
Location n Percent Total n Library 1932 47.7% 4047 Off-Campus 4368 47.7% 9158 On-Campus 3919 55.3% 7088
Total 10219 50.4% 20293 Table 7.2 Location * Reason for Use - Recommended Colleague
Location n Percent Total n Library 749 18.5% 4047 Off-Campus 933 10.2% 9158 On-Campus 754 10.6% 7088
Total 2436 12.0% 20293 Table 7.3 Location * Reason for Use - Reference/Citation
Location n Percent Total n Library 752 18.6% 4047 Off-Campus 2912 31.8% 9158 On-Campus 2426 34.2% 7088
Total 6090 30.0% 20293 Table 7.4 Location * Reason for Use - Recommended Librarian
Location n Percent Total n Library 326 8.1% 4047 Off-Campus 138 1.5% 9158 On-Campus 156 2.2% 7088
Total 620 3.1% 20293 Table 7.5 Location * Reason for Use - Course Reading
Location n Percent Total n Library 250 6.2% 4047 Off-Campus 404 4.4% 9158 On-Campus 271 3.8% 7088
Total 925 4.6% 20293 Table 7.6 Location * Reason for Use - Other
Location n Percent Total n Library 1149 28.4% 4047 Off-Campus 2100 22.9% 9158 On-Campus 1139 16.1% 7088
Total 4388 21.6% 20293

Summary Tables
39
Table 8.1 User Status * Location Location
User Status Library Off-
CampusOn-
Campus Total Faculty 219 958 1084 2261Graduate Professional 552 2809 3184 6545Library Staff 224 89 15 328Other 127 437 157 721Staff 113 414 601 1128Undergraduate 2812 4451 2047 9310
Total 4047 9158 7088 20293 Table 8.2 User Status * Location - Percentages Location – Percent
User Status Library Off-
CampusOn-
Campus Total Faculty 9.7% 42.4% 47.9% 100.0%Graduate Professional 8.4% 42.9% 48.6% 100.0%Library Staff 68.3% 27.1% 4.6% 100.0%Other 17.6% 60.6% 21.8% 100.0%Staff 10.0% 36.7% 53.3% 100.0%Undergraduate 30.2% 47.8% 22.0% 100.0%
Total 19.9% 45.1% 34.9% 100.0%

Summary Tables
40
Table 9.1 Purpose of Use by User Status * Location
Location Purpose of
Use User Status Library Off-
Campus On-
Campus Total Faculty 3 18 14 35Graduate Professional 156 649 474 1279Library Staff 68 8 1 77Other 14 22 7 43Staff 5 9 26 40
Coursework
Undergraduate 1892 3613 1551 7056Faculty 12 67 27 106Graduate Professional 23 145 87 255Library Staff 71 3 5 79Other 56 169 29 254Staff 21 33 53 107
Other Activities
Undergraduate 421 220 81 722Faculty 28 259 192 479Graduate Professional 142 741 784 1667Library Staff 20 16 7 43Other 30 93 27 150Staff 28 117 87 232
Other Research
Undergraduate 191 355 173 719Faculty 2 75 22 99Graduate Professional 11 124 28 163Library Staff 1 52 1 54Other 5 56 2 63Staff 6 16 2 24
Patient Care
Undergraduate 22 52 10 84Faculty 33 330 601 964Graduate Professional 176 1049 1747 2972Library Staff 48 10 0 58Other 18 84 91 193Staff 34 187 361 582
Sponsored
Undergraduate 189 166 194 549Faculty 141 209 228 578Graduate Professional 44 101 64 209Library Staff 16 0 1 17Other 4 13 1 18Staff 19 52 72 143
Teaching
Undergraduate 97 45 38 180 Total 4047 9158 7088 20293

Summary Tables
41
Table 9.2 Purpose of Use by User Status * Location - Percentages Location
Purpose of Use User Status Library
Off-Campus
On-Campus Total
Faculty 8.6% 51.4% 40.0% 100.0%Graduate Professional 12.2% 50.7% 37.1% 100.0%Library Staff 88.3% 10.4% 1.3% 100.0%Other 32.6% 51.2% 16.3% 100.0%Staff 12.5% 22.5% 65.0% 100.0%
Coursework
Undergraduate 26.8% 51.2% 22.0% 100.0%Faculty 11.3% 63.2% 25.5% 100.0%Graduate Professional 9.0% 56.9% 34.1% 100.0%Library Staff 89.9% 3.8% 6.3% 100.0%Other 22.0% 66.5% 11.4% 100.0%Staff 19.6% 30.8% 49.5% 100.0%
Other Activities
Undergraduate 58.3% 30.5% 11.2% 100.0%Faculty 5.8% 54.1% 40.1% 100.0%Graduate Professional 8.5% 44.5% 47.0% 100.0%Library Staff 46.5% 37.2% 16.3% 100.0%Other 20.0% 62.0% 18.0% 100.0%Staff 12.1% 50.4% 37.5% 100.0%
Other Research
Undergraduate 26.6% 49.4% 24.1% 100.0%Faculty 2.0% 75.8% 22.2% 100.0%Graduate Professional 6.7% 76.1% 17.2% 100.0%Library Staff 1.9% 96.3% 1.9% 100.0%Other 7.9% 88.9% 3.2% 100.0%Staff 25.0% 66.7% 8.3% 100.0%
Patient Care
Undergraduate 26.2% 61.9% 11.9% 100.0%Faculty 3.4% 34.2% 62.3% 100.0%Graduate Professional 5.9% 35.3% 58.8% 100.0%Library Staff 82.8% 17.2% 0.0% 100.0%Other 9.3% 43.5% 47.2% 100.0%Staff 5.8% 32.1% 62.0% 100.0%
Sponsored
Undergraduate 34.4% 30.2% 35.3% 100.0%Faculty 24.4% 36.2% 39.4% 100.0%Graduate Professional 21.1% 48.3% 30.6% 100.0%Library Staff 94.1% 0.0% 5.9% 100.0%Other 22.2% 72.2% 5.6% 100.0%Staff 13.3% 36.4% 50.3% 100.0%
Teaching
Undergraduate 53.9% 25.0% 21.1% 100.0% Total 19.9% 45.1% 34.9% 100.0%

Summary Tables
42
Table 10.1 User Status * Affiliation Affiliation
User Status Applied
Sciences Business Education Environ. Studies
Fine Arts Humanities Law
Medical Health Other Sciences
Social Sciences Total
Faculty 253 124 202 59 10 64 17 688 48 449 347 2261Graduate Professional 1482 258 284 320 15 113 28 1565 122 1341 1017 6545Library Staff 68 8 4 38 3 13 0 115 72 3 4 328Other 50 13 17 21 4 38 2 244 172 102 58 721Staff 136 27 38 50 7 8 0 482 48 275 57 1128Undergraduate 941 384 336 379 121 364 70 1297 486 2528 2404 9310
Total 2930 814 881 867 160 600 117 4391 948 4698 3887 20293 Table 10.2 User Status * Affiliation - Percentages Affiliation
User Status Applied
Sciences Business Education Environ. Studies
Fine Arts Humanities Law
Medical Health Other Sciences
Social Sciences Total
Faculty 11.2% 5.5% 8.9% 2.6% 0.4% 2.8% 0.8% 30.4% 2.1% 19.9% 15.3% 100.0%Graduate Professional 22.6% 3.9% 4.3% 4.9% 0.2% 1.7% 0.4% 23.9% 1.9% 20.5% 15.5% 100.0%Library Staff 20.7% 2.4% 1.2% 11.6% 0.9% 4.0% 0.0% 35.1% 22.0% 0.9% 1.2% 100.0%Other 6.9% 1.8% 2.4% 2.9% 0.6% 5.3% 0.3% 33.8% 23.9% 14.1% 8.0% 100.0%Staff 12.1% 2.4% 3.4% 4.4% 0.6% 0.7% 0.0% 42.7% 4.3% 24.4% 5.1% 100.0%Undergraduate 10.1% 4.1% 3.6% 4.1% 1.3% 3.9% 0.8% 13.9% 5.2% 27.2% 25.8% 100.0%
Total 14.4% 4.0% 4.3% 4.3% 0.8% 3.0% 0.6% 21.6% 4.7% 23.2% 19.2% 100.0%
Summary Tables
43
Table 11.1 Location * Affiliation Affiliation
User Status
Applied Sciences Business Education
Environ. Studies
Fine Arts Humanities Law
Medical Health Other Sciences
Social Sciences Total
Library 656 242 267 186 37 175 49 386 256 1051 742 4047Off-Campus 773 231 372 350 91 277 52 2853 432 1691 2036 9158On-Campus 1501 341 242 331 32 148 16 1152 260 1956 1109 7088
Total 2930 814 881 867 160 600 117 4391 948 4698 3887 20293 Table 11.2 Location * Affiliation - Percentages Affiliation
User Status
Applied Sciences Business Education
Environ. Studies
Fine Arts Humanities Law
Medical Health Other Sciences
Social Sciences Total
Library 16.2% 6.0% 6.6% 4.6% 0.9% 4.3% 1.2% 9.5% 6.3% 26.0% 18.3% 100.0%Off-Campus 8.4% 2.5% 4.1% 3.8% 1.0% 3.0% 0.6% 31.2% 4.7% 18.5% 22.2% 100.0%On-Campus 21.2% 4.8% 3.4% 4.7% 0.5% 2.1% 0.2% 16.3% 3.7% 27.6% 15.6% 100.0%
Total 14.4% 4.0% 4.3% 4.3% 0.8% 3.0% 0.6% 21.6% 4.7% 23.2% 19.2% 100.0%

Summary Tables
44
Table 12.1 Purpose of Use by User Status * Affiliation
Affiliation Purpose of
Use User Status Applied
Sciences Business Education Environ. Studies
Fine Arts Humanities Law
Medical Heath Other Sciences
Social Sciences Total
Faculty 1 5 11 2 0 0 0 6 0 0 10 35Graduate Professional 164 62 111 70 6 26 12 286 80 195 267 1279Library Staff 61 0 0 0 0 3 0 4 9 0 0 77Other 0 0 10 1 0 0 2 9 12 8 1 43Staff 0 4 13 0 0 1 0 11 3 3 5 40
Coursework
Undergraduate 478 212 215 304 84 279 65 989 388 1890 2152 7056Faculty 10 5 17 0 0 1 0 54 3 4 12 106Graduate Professional 67 16 7 5 0 6 4 69 4 41 36 255Library Staff 1 4 0 0 3 5 0 9 54 0 3 79Other 9 12 0 8 4 18 0 46 108 18 31 254Staff 29 0 3 0 0 1 0 24 19 27 4 107
Other Activities
Undergraduate 106 25 21 9 4 34 4 39 28 365 87 722Faculty 42 41 27 27 4 19 6 143 12 58 100 479Graduate Professional 311 119 74 121 4 50 9 371 22 260 326 1667Library Staff 3 0 0 0 0 3 0 26 9 2 0 43Other 16 0 1 4 0 17 0 70 8 19 15 150Staff 19 11 9 20 5 1 0 97 13 47 10 232
Other Research
Undergraduate 129 73 40 36 20 36 0 103 39 134 109 719Faculty 3 1 0 0 1 2 0 81 0 2 9 99Graduate Professional 7 4 2 3 0 1 0 136 3 3 4 163Library Staff 1 0 0 0 0 0 0 52 0 0 1 54Other 0 0 2 0 0 0 0 44 17 0 0 63Staff 0 0 0 0 0 0 0 22 0 0 2 24
Patient Care
Undergraduate 7 2 3 0 1 0 1 44 0 14 12 84Sponsored Faculty 144 19 26 16 0 33 0 290 8 333 95 964
Summary Tables
45
Table 12.1 Purpose of Use by User Status * Affiliation Affiliation
Purpose of Use User Status
Applied Sciences Business Education
Environ. Studies
Fine Arts Humanities Law
Medical Heath Other Sciences
Social Sciences Total
Graduate Professional 912 35 45 106 0 19 3 645 13 831 363 2972Library Staff 1 2 3 38 0 0 0 14 0 0 0 58Other 24 0 0 5 0 1 0 71 27 54 11 193Staff 82 0 2 22 1 0 0 278 7 154 36 582Undergraduate 194 32 28 15 8 4 0 106 15 123 24 549Faculty 53 53 121 14 5 9 11 114 25 52 121 578Graduate Professional 21 22 45 15 5 11 0 58 0 11 21 209Library Staff 1 2 1 0 0 2 0 10 0 1 0 17Other 1 1 4 3 0 2 0 4 0 3 0 18Staff 6 12 11 8 1 5 0 50 6 44 0 143
Teaching
Undergraduate 27 40 29 15 4 11 0 16 16 2 20 180 Total 2930 814 881 867 160 600 117 4391 948 4698 3887 20293

Summary Tables
46
Table 13.1 User Status by Location * Affiliation Affiliation
User Status Location Applied
Sciences Business Education Environ. Studies
Fine Arts Humanities Law
Medical Health Other Sciences
Social Sciences Total
Library 43 29 84 14 4 1 11 18 5 3 7 219Off-Campus 59 22 58 20 5 48 3 480 20 110 133 958Faculty On-Campus 151 73 60 25 1 15 3 190 23 336 207 1084Library 121 61 43 46 1 16 8 74 28 94 60 552Off-Campus 377 58 135 109 14 50 8 1061 57 413 527 2809Graduate
Professional On-Campus 984 139 106 165 0 47 12 430 37 834 430 3184Library 65 7 4 38 0 13 0 34 57 3 3 224Off-Campus 0 0 0 0 3 0 0 77 9 0 0 89Library Staff On-Campus 3 1 0 0 0 0 0 4 6 0 1 15Library 6 9 5 3 1 32 0 9 18 23 21 127Off-Campus 20 4 12 13 3 2 2 195 110 49 27 437Other On-Campus 24 0 0 5 0 4 0 40 44 30 10 157Library 19 11 8 4 0 5 0 30 25 8 3 113Off-Campus 39 4 12 20 6 2 0 247 8 53 23 414Staff On-Campus 78 12 18 26 1 1 0 205 15 214 31 601Library 402 125 123 81 31 108 30 221 123 920 648 2812Undergraduate Off-Campus 278 143 155 188 60 175 39 793 228 1066 1326 4451

Summary Tables
47
Table 13.1 User Status by Location * Affiliation Affiliation
User Status Location Applied
Sciences Business Education Environ. Studies
Fine Arts Humanities Law
Medical Health Other Sciences
Social Sciences Total
On-Campus 261 116 58 110 30 81 1 283 135 542 430 2047
Total 2930 814 881 867 160 600 117 4391 948 4698 3887 20293