final report i-6 supporting report annex-6 …open_jicareport.jica.go.jp/pdf/12123873_06.pdf ·...
TRANSCRIPT

Ministry of Agriculture Republic of Peru
THE PREPARATORY STUDY ON
PROJECT OF THE PROTECTION OF FLOOD PLAIN AND VULNERABLE
RURAL POPULATION AGAINST FLOOD IN THE REPUBLIC OF PERU
FINAL REPORT
I-6 SUPPORTING REPORT ANNEX-6 SEDIMENT CONTROL
(TEMPORARY VERSION)
March 2013
JAPAN INTERNATIONAL COOPERATION AGENCY
(JICA)
YACHIYO ENGINEERING CO., LTD. NIPPON KOEI CO., LTD.
NIPPON KOEI LATIN AMERICA – CARIBBEAN Co., LTD.


Study Area


The Preparatory Study on Project of the Protection of Flood Plain and Vulnerable Rural Population against Flood in the Republic of Peru
Feasibility Study Report, Supporting Report, Annex-6 Sediment Control
ABBREVIATION
Abbreviation Official Form or Meaning
ANA Autoridad Nacional del Agua/National Water Authority
ALA Autoridad Local del Agua/Local Water Authority
B/C Costo Benefit Ratio/Benefit Cost Ratio
GDP Gross Domestic Product/Gross Domestic Product
GIS Geographic Information System/ Geographic Information System
DGAA Dirección General de Asuntos Ambientales/General Directorate of Environmental
Affairs
DGFFS Dirección General de Forestal y de Fauna Silvestre/Directorate General of Forest and
Wildlife
DGIH Dirección General de Infraestructura Hidráulica/Directorate General for Water
Infrastructure
DGPI
(Paleo-DGPM)
Dirección General de Política de Inversiones/Directorate General of Investment Policy
DNEP Dirección Nacional de Endeudamiento Público/National Directorate of Public Debt
DRA Dirección Regional de Aguricultura/Regional Directorate Aguriculture
EIA Evaluación de Impacto Ambiental/Environmental Impact Assessment
FAO Agricultura y la Alimentación Organización de las Naciones Unidas/Food and
Agriculture Organization of the United Nations
F/S Estudio de factibilidad/Feasibility Study
GORE Gobierno Regional/Regional Government
HEC-HMS Centros de Ingeniería Hidrológica Sistema de Modelación Hidrológica Método /
Hydrologic Engineering Centers Hydrologic Modeling System Method
HEC-RAS Centros de Ingeniería Hidrológica del Río de Análisis del Sistema Método /
Hydrologic Engineering Centers River Analysis System Method
IGN Instituto Geográfico Nacional/National Geographic Institute
IGV Impuesto General a Ventas/General Sales Tax
INDECI Instituto Nacional de Defensa Civil/National Institute of Civil Defense
INEI Instituto Nacional de Estadística/National Institute of Statistics
INGEMMET Instituto Nacional Geológico Minero Metalúrgico/National Geological and Mining Metallurgical Institute
INRENA Instituto Nacional de Recursos Naturales/Natural Resources Institute
IRR Tasa Interna de Retorno (TIR)/Internal Rate of Return
JICA Japonés de Cooperación Internacional /Japan International Cooperation Agency
JNUDRP Junta Nacional de Usuarios de Distritos del Perú/National Board of Peru Districts Users
L/A Convenio de Préstamo/Loan Agreement
MEF Ministerio de Economía y Finanzas/Ministry of Economy and Finance
MINAG Ministerio de Agricultura/Ministry of Agriculture

The Preparatory Study on Project of the Protection of Flood Plain and Vulnerable Rural Population against Flood in the Republic of Peru
Feasibility Study Report, Supporting Report, Annex-6 Sediment Control
M/M Acta de la reunion/Minutes of Meeting
NPV Valor Actual Neto (VAN)/NET PRESENT VALUE
O&M Operación y mantenimiento /Operation and maintenance
OGA Oficina General de Administración/General Office of Administration
ONERRN Oficina Nacional de Evaluación de Recursos Naturales/National Bureau of Natural
Resource Evaluation
OPI
(OPP)
Oficina de Programación e Inversiones/Programming and Investment Office
(Oficina de Planificación e Prespuesto/Office of Planning and Budget)
PBI Producto Bruto Interno/Gross Domestic Product
PE Exp. Proyecto Especial (PE) Chira-Piura/Exp. Special Project Chira-Piura
PES Pago por Servicos Ambientales (PSA)/Payment for Environmental Services
PERFIL PERFIL/ PROFILE (Preparatory survey of project before investment)
Pre F/S Estudio de Prefactibilidad /Pre-Feasibility Study
PERPEC Programa de Encauzamiento de Ríos y protección de Estructura de Captación
PRONAMACHIS Programa Nacional de Manejo de Cuencas Hidrográficas y Conservación de Suelos/
National Program of River Basin and Soil Conservation Management
PSI Programa de Sub Sectorial de Irrigaciones/Program of Sub Irrigation Sector
SCF Factor de conversión estándar/Standard conversion factor
SENAMHI Servicio Nacional de Meteorología y Hidrología/National Service of Meteorology and Hydrology
SNIP Sistema Nacional de Inversión Pública/National Public Investment System
UF Unidad formuladora/Formulator unit
VALLE Valle/Valley
VAT Impuesto al valor agregado/Value-added tax

The Preparatory Study on Project of the Protection of Flood Plain and Vulnerable Rural Population against Flood in the Republic of Peru
Feasibility Study Report, Supporting Report, Annex-6 Sediment Control
i
THE PREPARATORY STUDY ON PROJECT OF THE PROTECTION
OF FLOOD PLAIN AND VULNERABLE RURAL POPULATION AGAINST FLOOD
IN THE REPUBLIC OF PERU FEASIBILITY STUDY REPORT
SUPPORTING REPORT
Annex-6
Sediment Control (Temporary Version)
TABLE OF CONTENTS STUDY AREA CHAPTER 1 SEDIMENT PRODUCTION IN THE BASINS OF THE STUDY AREA 1.1 Data Collection and Processing ............................................................................................ 1-1 1.2 Watershed Characteristics ..................................................................................................... 1-2 1.3 Condition of sediment production ........................................................................................ 1-15 1.4 Calculation of Sediment Yield .............................................................................................. 1-25 1.5 Classification of Erodible Areas ........................................................................................... 1-48 CHAPTER 2 SEDIMENT CONTROL PLAN 2.1 Basic policy ........................................................................................................................... 2-1 2.2 Component of Sediment Control .......................................................................................... 2-2 2.3 Quantity and cost for sediment control in this project .......................................................... 2-6 2.4 Problems for Implementation of Sediment Control Plan ...................................................... 2-18 2.5 Recommendations ................................................................................................................. 2-21

The Preparatory Study on Project of the Protection of Flood Plain and Vulnerable Rural Population against Flood in the Republic of Peru
Feasibility Study Report, Supporting Report, Annex-6 Sediment Control
ii
LIST OF TABLES Pages
Table 1.1 List of Collected Data ................................................................................................. 1-1 Table 1.2 Characteristics of the Altitude of each Basin .............................................................. 1-2 Table 1.3 Percentage of Pending Classification Areas in each Basin ......................................... 1-3 Table 1.4 River bed Slope in each Basin .................................................................................... 1-5 Table 1.5 List of the typical vegetation in the watersheds of Cañete, Chincha,Pisco and
Yauca .......................................................................................................................... 1-6 Table 1.6 List of Major Vegetation in Chira River Basin ........................................................... 1-7 Table 1.7 List of Geological conditions frequently suffered from debris flow .......................... 1-7 Table 1.8 Areas of Annual Rainfall Volume in each Basin ........................................................ 1-12 Table 1.9 Relationship between Slopes and Elevations in each Basin ....................................... 1-14 Table 1.10 Relationship between Area and Altitude of each Basin .............................................. 1-15 Table 1.11 The List of the Debris Flows in the Majes River ........................................................ 1-18 Table 1.12 List of Rainfall Stations Verified the Precipitation ..................................................... 1-21 Table 1.13 The Precipitation of 2, 5, 10, 25, 50, 100 and 200-yr return periods in each
Rainfall stations and the maximum 24-hr maximum precipitation in 1998 ............... 1-21 Table 1.14 The Widths and Depth of the Movable Sediment Volume in each Order ................... 1-28 Table 1.15 The Movable Sediment Volume in each Basin ........................................................... 1-29 Table 1.16 Rainfall Stations of the Chira River Basin .................................................................. 1-32 Table 1.17 Measurement Period of Adopted Stations .................................................................. 1-33 Table1.18 Details of the Combining Rainfall .............................................................................. 1-33 Table 1.19 Catchment area of the Poechos dam ........................................................................... 1-33 Table 1.20 Input Flow, Sediment Volume and Rainfall in the Poechos Dam ............................... 1-35 Table 1.21 The weighting of erosion by the slope gradient .......................................................... 1-39 Table 1.22 Sediment Volume by 50mm Rainfall due to Slope Gradient ...................................... 1-39 Table 1.23 Specific Discharge of Sediment due to Difference in Geology .................................. 1-40 Table 1.24 Specific Discharge of Sediment in 4 Basin without Chira Basin ............................... 1-40 Table 1.25 Input Data of each River ............................................................................................. 1-41 Table 1.26 Sediment Volume Calculated by the Method of Flowing Soil .................................... 1-41 Table 1.27 Sediment volume in Cañete basin ............................................................................... 1-43 Table 1.28 Sediment volume in Chincha basin ............................................................................ 1-44 Table 1.29 Sediment Yield in Pisco Basin .................................................................................... 1-45 Table 1.30 Sediment volume in Yauca Basin ............................................................................... 1-46 Table 1.31 Sediment Volume in Yauca Basin ............................................................................... 1-47 Table 1.32 Sediment Volume in each Basin ................................................................................. 1-47 Table 1.33 Classification of Erosion............................................................................................. 1-48 Table 1.34 Characteristics of each River Erosion ......................................................................... 1-48 Table 2.1 Components of Sediment Control .............................................................................. 2-1 Table 2.2 Classification of Countermeasures against Sediment Control .................................... 2-2 Table 2.3 Applicability of Sediment Control Measures in the this Study Area .......................... 2-6 Table 2.4 Approximate Quantity and Cost of Revetment Works ............................................... 2-7 Table 2.5 Estimated cost of bed girdles ...................................................................................... 2-7 Table 2.6 Estimation conditions for sediment volume ............................................................... 2-7 Table 2.7 Quality and the Approximate Costs of Check Dams .................................................. 2-9 Table 2.8 Production Sediment Volume and Plan of the Check Dams in Chira Basin ............... 2-9 Table 2.9 Production Sediment Volume and Plan of the Check Dams in Cañete Basin ............. 2-9 Table 2.10 Production Sediment Volume and Plan of the Check Dams in Chincha Basin .......... 2-9 Table 2.11 Production Sediment Volume and Plan of the Check Dams in Pisco Basin ............... 2-9 Table 2.12 Production Sediment Volume and Plan of the Check Dams in Yauca Basin .............. 2-9 Table 2.13 Production Sediment Volume and Plan of the Check Dams in Camana-Majes
Basin ........................................................................................................................... 2-9 Table 2.14 Results of Analysis of the Variation in Bed ................................................................ 2-16 Table 2.15 Construction Cost in Each Basin ................................................................................ 2-18

The Preparatory Study on Project of the Protection of Flood Plain and Vulnerable Rural Population against Flood in the Republic of Peru
Feasibility Study Report, Supporting Report, Annex-6 Sediment Control
iii
Table 2.16 Population in the Mountains and on the Alluvial Fans ............................................... 2-19 Table 2.17 Classification of Environmental Protective Areas ...................................................... 2-20 Table 2.18 Prohibited matters in Environmental Protective Areas ............................................... 2-20 Table 2.19 Number of Disasters in Peru (sediment disasters, floods) ....................................... 2-23

The Preparatory Study on Project of the Protection of Flood Plain and Vulnerable Rural Population against Flood in the Republic of Peru
Feasibility Study Report, Supporting Report, Annex-6 Sediment Control
iv
LIST OF FIGURES
Pages
Figure 1.1 Characteristics of each Watershed Elevation ........................................................... 1-2 Figure 1.2 Percentage of Classification of Earrings in each Basin ............................................ 1-3 Figure 1.3 River Profile in each River ....................................................................................... 1-4 Figure 1.4 Riverbed Slope of each Watershed ........................................................................... 1-5 Figure 1.5 Classification of basins according to the slope bed .................................................. 1-5 Figure 1.6 Isohyetal Map (Chira Basin) .................................................................................... 1-9 Figure 1.7 Isohyetal Map (Cañete Basin) .................................................................................. 1-9 Figure 1.8 Isohyetal Map (Chincha Basin) ................................................................................ 1-10 Figure 1.9 Isohyetal Map (Pisco Basin) .................................................................................... 1-10 Figure 1.10 Isohyetal Map (Yauca Basin) ................................................................................... 1-11 Figure 1.11 Isohyetal Map (Camana-majes Basin) ..................................................................... 1-11 Figure 1.12 Surface Rainfall Volume in each Basin .................................................................... 1-12 Figure 1.13 Relationship between Slope and Altitude in each Basin .......................................... 1-13 Figure 1.14 Characteristics of Watersheds .................................................................................. 1-15 Figure 1.15 Areas of detachment or Basaltic Andesite Bases ..................................................... 1-16 Figure 1.16 Location of Sediment yield of Sedimentary Rocks .................................................. 1-16 Figure 1.17 Location of the Invasion of Cactus .......................................................................... 1-17 Figure 1.18 Location of erosion of the terraces ........................................................................... 1-17 Figure 1.19 Cross section of Majes valley(At the 50km areas From the outlet) .................... 1-18 Figure 1.20 The Location map of the Debris Flows in the Majes River ..................................... 1-19 Figure 1.21 Situation around Km 60 (The width of the Valley is about 5km ) ........................... 1-19 Figure 1.22 Location of Sediment Deposit in the Cosos River (width approx. 900m) ............... 1-19 Figure 1.23 Rural road Pass Cosos River (In rainy season sediment covering the rural road,
but it is restored in a day) ......................................................................................... 1-20 Figure 1.24 Situation of Ongoro River (In 1998, 2 people died because of flood) ..................... 1-20 Figure 1.25 Location of sediment deposit in the San Francisco River (The irrigation canals
was visited by the disaster. The height of sediment was 10m) ................................. 1-20 Figure 1.26 Location Horon river (alluvial sediments gone into the Majes river in 1998) ......... 1-20 Figure 1.27 Situation around 110 km from the outlet (Inlet Flow to the River from the
Sediment of the Slopes is Small). ............................................................................ 1-20 Figure 1.28 Intersection of River Andamayo Camaná and river (the Andamayo river is a
Spillway) .................................................................................................................. 1-20 Figure 1.29 Location Map of Rainfall Station ............................................................................. 1-22 Figure 1.30 Location of Sediment Production in Normal Circumstances ................................... 1-23 Figure 1.31 Location of Sediment Production in the Rainy Season with El Niño ...................... 1-24 Figure 1.32 Production of Sediment in Large Flood (Geological Scale) .................................... 1-25 Figure 1.33 Relationship between the Sediment yield Volume and Rainfall Volume ................. 1-25 Figure 1.34 Classification of Basins According to Strehler ........................................................ 1-26 Figure 1.35 Methodology of Primarily of Basins ........................................................................ 1-27 Figure 1.36 Methodology for Calculation of Movable Sediment Volume on the Riverbed ........ 1-27 Figure 1.37 Calculation of the Sediment Production Volume in the Traction Area .................... 1-28 Figure 1.38 Annual input Flow Volume and Sediment Accumulation in Poechos Dam ............. 1-30 Figure 1.39 Relationship between Annual input Flow Volume and Sediment Volume ............... 1-31 Figure 1.40 Diagram of sediment accumulation (from 1976 to2010) ......................................... 1-31 Figure 1.41 Annual Specific Discharge of Sediment .................................................................. 1-32 Figure 1.42 Rainfall Stations Near the Chira River ..................................................................... 1-34 Figure 1.43 Relationship between Annual Rainfall and Annual Sediment Volume .................... 1-36 Figure 1.44 Relationship between Maximum Continuous Rainfall and Annual Sediment
Volume ..................................................................................................................... 1-36 Figure 1.45 Relationship between Maximum Daily Rainfall and annual Sediment Volume ...... 1-36

The Preparatory Study on Project of the Protection of Flood Plain and Vulnerable Rural Population against Flood in the Republic of Peru
Feasibility Study Report, Supporting Report, Annex-6 Sediment Control
v
Figure 1.47 Relationship Between Annual Rainfall and Annual Input Flow Volume ................. 1-37 Figure 1.48 Relationship Between Annual Input Flow volume and Annual Sediment Volume .. 1-37 Figure 1.49 Relationship Between Annual Rainfall and Annual Sediment Volume .................... 1-37 Figure 1.50 Specific discharge of Sediment (m3/km2/1mm)&(m3/km2) ................................... 1-38 Figure 1.51 Relationship between slope gradient and annual erosion depth ............................... 1-39 Figure 1.52 Sediment Volume in Cañete Basin ........................................................................... 1-43 Figure 1.53 Sediment volume in Chincha Basin ......................................................................... 1-44 Figure 1.54 Sediment yield Volume in Pisco Basin..................................................................... 1-45 Figure 1.55 Sediment Volume in Yauca Basin ............................................................................ 1-46 Figure 1.56 Sediment Volume in Yauca Basin ............................................................................ 1-47 Figure 1.57 Erosion Map in Chira Basin ..................................................................................... 1-49 Figure 1.58 Erosion Map in Cañete basin ................................................................................... 1-50 Figure 1.59 Erosion Map in Chincha basin ................................................................................. 1-51 Figure 1.60 Erosion Map in Pisco Basin ..................................................................................... 1-52 Figure 1.61 Erosion Map in Yauca Basin .................................................................................... 1-53 Figure 1.62 Erosion Map in Camana-Majes Basin ...................................................................... 1-54 Figure 2.1 Concept of the Sediment Control ............................................................................. 2-2 Figure 2.2 Typical Structures of Technical Hillside Works ....................................................... 2-3 Figure 2.3 Typical Structures of Hillside Seeding ..................................................................... 2-3 Figure 2.4 Cross Section of Revetment Works .......................................................................... 2-6 Figure 2.5 Cross section of Bed sill ........................................................................................... 2-7 Figure 2.6 Outflow Correction Factor ....................................................................................... 2-8 Figure 2.7 Plan of Countermeasure Works in the Chira Basin .................................................. 2-10 Figure 2.8 Plan of Countermeasure works in the Cañete Basin ................................................ 2-11 Figure 2.9 Plan of countermeasure works in the Chincha Basin ............................................... 2-12 Figure 2.10 Plan of Countermeasure Works in the Pisco Basin .................................................. 2-13 Figure 2.11 Plan of countermeasure works in the basin Yaura .................................................... 2-14 Figure 2.12 Plan of countermeasure works in the Camana Majes Basin .................................... 2-15 Figure 2.13 Results of Riverbed Analysis ................................................................................... 2-17 Figure 2.14 Location Map of Plantanal Dam .............................................................................. 2-17 Figure 2.15 Process of the Provinces Population in each Relevant Pref ..................................... 2-19 Figure 2.16 Process of the Rural Population in the Relevant Pref .............................................. 2-20


The Preparatory Study on Project of the Protection of Flood Plain and Vulnerable Rural Population against Flood in the Republic of Peru
Feasibility Study Report, Supporting Report, Annex-6 Sediment Control
1-1
CHAPTER 1 SEDIMENT PRODUCTION IN THE BASINS OF THE STUDY AREA
1.1 Data Collection and Processing
(1) Organization of Collection Material
In order to evaluate the production of sediments in the basins of the project area were collected the materials as below.
Table 1.1 List of Collected Data Collected information Year Format Copyright organization
Topography(S=1/50,000) 2003 Shp INSTITUTO GEOGRAFICO NACIONAL(IGN)
Geological map(S=1/10,0000)
2007 Shock Wave Instituto Geológico Minero y Metalúrgico (INGEMMET)
Universal Traverse Mercator grid
2008 GEO TIFF Nacional eronautics and Space Administration (NASA)
River data 2008 SHP IGN Basin data 2010 SHP Autoridad Nacional del Agua (ANA) Isohyetal line map 1965-74 PDF ANA Erosion map 1996 SHP Instituto Nacional de Recursos Naturales
(INRENA) Soil map 1996 SHP INRENA Vegetation map 2,000
1995 SHP: Year 2000 PDF: Year 1995
Dirección General de Flora y Fauna Silvestre (DGFFS)
Rainfall data Text Servicio Nacional de Metereología e Hidrología del Perú (SENAMHI)
Population distribution map
2007 SHP Instituto Nacional de Estadística e Informática (INEI)
Source:Jica Study Team
(2) Preparation of data for evaluation
The following data were made from the data collected. These data are included in the appendix.
・Hydrological map ・Map of watersheds (watersheds zoning by third-order) ・Geological and hydrographic map ・Map of erosion and hydrographic map ・Zoning map of vegetation – year 2,000 ・Zoning map of vegetation - year 1995 ・Geological map and bed slope ・Hydrological zoning map and bed slope ・Zoning map of soil and hydrological map ・Precipitation curve ・Population classification map

The Preparatory Study on Project of the Protection of Flood Plain and Vulnerable Rural Population against Flood in the Republic of Peru
Feasibility Study Report, Supporting Report, Annex-6 Sediment Control
1-2
1.2 Watershed Characteristics
Watershed characteristics of the study basins is described below. Chira basin has been classified into upstream and downstream at the basic point of the Poechos dam
(1) Altitude
The altitude distribution of each basin is as shown in Table 1.2 and Figure 1.1. Cañete basin has a higher percentage of altitudes above 4,000 m. The altitudes above 4,000 m have a smooth rugged topography with many Snow Mountains and lakes. Cañete basin has large areas in these conditions and has more water sources and therefore greater volume of water flow, compared to other basins. Chira basin has the highest percentage of areas between 0 to 1,000m.
0
2000
4000
6000
8000
10000
12000
14000
16000
18000
Chira - upstream Chira -downstream
Cañete Chincha Pisco Yauca Camana - Majes
Are
as (
km
2 )
Cuencas
5000 - Mas
4000 - 5000
3000 - 4000
2000 - 3000
1000 - 2000
0 - 1000
Figure 1.1 Characteristics of each Watershed Elevation
Source:Jica Study Team, based on NASA
Table 1.2 Characteristics of the Altitude of each Basin
Altitude (m )
Area ( Km2 ) Chira up stream
Chira downstream Cañete Chincha Pisco Yauca
Camana Majes
0 - 1,000 3262.43 3861.54 381.95 435.6 694.58 332.79 1040.56
1,000 - 2,000 1629.48 207.62 478.2 431.33 476.7 575.82 2618.77
2,000 - 3,000 1153.61 43.24 1015.44 534.28 684.78 1302.58 1277.54
3,000 - 4,000 313.74 156.11 1012.58 882.39 760.47 1504.8 2305.64
4,000 - 5,000 0.22 0.00 3026.85 1019.62 1647.8 602 9171.56
5,000 - more 0.00 0.00 108.95 0.67 6.19 0.55 635.44
TOTAL 6359.48 4268.51 6023.97 3303.89 4270.52 4318.54 17049.51
Max Altitude 4110.00 5355.00 5005.00 5110.00 5060.00 5821.00
Source:Jica Study Team, based on NASA

The Preparatory Study on Project of the Protection of Flood Plain and Vulnerable Rural Population against Flood in the Republic of Peru
Feasibility Study Report, Supporting Report, Annex-6 Sediment Control
1-3
(2) Classification of Slope Gradient
Slope gradient map were made for each basin. Table 1.3 and Figure 1.2 show the percentage of slopes in each basin. This shows that the topography is more pronounced in the basins of Cañete, Chincha, Pisco, Yauca and Chira, in that order. Over 50% of total area with slopes greater than 35 ° are located in the basins of Cañete and Chincha. The stronger the mountain slopes, more is the occurrence of sediment disaster commonly, so we can estimate that the debris flow occur more often in that order mentioned above.
0.00
2000.00
4000.00
6000.00
8000.00
10000.00
12000.00
14000.00
16000.00
18000.00
Ch
ira
-up
stre
am
Ch
ira
-do
wns
tream
Cañ
ete
Ch
inch
a
Pis
co
Yau
ca
Cam
ana-
Maj
es
Are
as (
Km
2 )
Over 35
15 - 35
2 - 15
0 - 2
Source:JICA Study Team, based on NASA
Figure 1.2 Percentage of Classification of Earrings in each Basin
Table 1.3 Percentage of Pending Classification Areas in each Basin
Slope Basin
( % )
Chira upstream Chira down stream Cañete Chincha
Area(km2) percentage Area(km2) Area(km2) Area(km2) percentage Area(km2) percentage
0 - 2 131.62 2% 651.28 90.62 36.37 1% 90.62 3%
2 - 15 2167.69 34% 2859.35 499.68 650.53 11% 499.68 15%
15 - 35 1852.79 29% 465.86 1019.77 1689.81 28% 1019.77 31%
Over 35 2237.64 35% 261.76 1693.82 3647.26 61% 1693.82 51%
TOTAL 6389.74 100% 4238.25 3303.89 6023.97 100% 3303.89 100%
Slope Basin
( % )
Pisco Yauca Camana Majes
Area(km2) percentage Area(km2) percentage Area(km2) percentage
0 - 2 168.57 4% 79.01 2% 869.75 5%
2 - 15 947.86 22% 1190.19 28% 6210.54 36%
15 - 35 1426.18 33% 1591.21 37% 5452.97 32%
Over 35 1727.91 40% 1458.13 34% 4516.25 26%
TOTAL 4270.52 100% 4318.54 100% 17049.51 100%
Source:JICA Study Team, based on NASA data

The Preparatory Study on Project of the Protection of Flood Plain and Vulnerable Rural Population against Flood in the Republic of Peru
Feasibility Study Report, Supporting Report, Annex-6 Sediment Control
1-4
(3) River Profile
The river Profile of each river is as shown in Figure 1.3. The river profiles of Canete, Chincha, Pisco and Yauca river analogize. The river profile of Camana-Majes river from the outlet to 200km is steep. And this river from 200km to 400km is gentleness. The river profile of Chira river from outlet to 300km is gentleness, The river profile of the upper stream from 300km is steep.
0
500
1000
1500
2000
2500
3000
3500
4000
4500
5000
0 50 100 150 200 250 300 350 400
Elevation(m
)
Distance(km)
Chira Canete Chincha Pisco Yauca Camana/majes
Source:JICA Study Team, based on NASA data
Figure 1.3 River Profile in each River
(4) Bed slope
As shown in Figure 1.5, the streams can be classified into traction area and debris flow area, according to the slope of the bed. The distribution of the slope is shown in Figure 1.4 and Table 1.4. In general, debris flow area are found in streams with slopes greater than 1/3 and this is the longest in the basin of Cañete. The area corresponding to the sediment areas has higher percentages on slopes 1/30-1/ 6 in all basin. This indicates that in all basins sediment regulation of riverbeds is high.
ChinchaPisco
Yauca
Canete Camana Majes
Chira

The Preparatory Study on Project of the Protection of Flood Plain and Vulnerable Rural Population against Flood in the Republic of Peru
Feasibility Study Report, Supporting Report, Annex-6 Sediment Control
1-5
0
2,000
4,000
6,000
8,000
10,000
12,000
14,000
Chira - upstream Chira -downstream
Cañete Chincha Pisco Yauca Camana - Majes
Lo
ng
itu
d (
Km
)
33.33 - Mas
25.00 - 33.33
16.67 - 25.00
3.33 - 16.67
1.00 - 3.33
0.00 - 1.00
Figure 1.4 Riverbed Slope of each Watershed
Source:JICA Study Team, based on NASA data
Table 1.4 River bed Slope in each Basin
Slope River ( % ) Chira
upstream Chira
downstream Cañete Chincha Pisco Yauca Camanamajes
0.00 - 1.00 6.00 233.34 12.82 5.08 12.15 39.13 263.45
1.00 - 3.33 345.77 471.67 173.88 177.78 165.05 312.82 1953.19
3.33 - 16.67 2534.14 1751.16 1998.6 1250.82 1683.15 1687.19 7511.73
16.67 - 25.00 435.46 97.84 753.89 458.76 519.64 352.42 1383.17
25.00 - 33.33 201.72 37.51 467.78 255.98 291.84 185.78 761.15
33.33 - More 318.46 42.72 975.48 371.8 511.76 226.92 1425.65
TOTAL 3841.55 2634.24 4382.45 2520.22 3183.59 2804.26 13298.34
Source:JICA Study Team, based on NASA
Zero order stream
More than first order stream
Objet to beconserved
Occurrence areaFlow area
Sediment area
20°(about 1/3)
15°(about 1/4)
10°(about 1/6)
2°(about 1/30)
Traction area Debris Flow area Figure 1.5 Classification of basins according to the slope bed
Source:JICA study team

The Preparatory Study on Project of the Protection of Flood Plain and Vulnerable Rural Population against Flood in the Republic of Peru
Feasibility Study Report, Supporting Report, Annex-6 Sediment Control
1-6
(5) Vegetation
(a) Cuencas de Cañete, Chincha, Pisco y Yauca The latest vegetation study in Peru was carried out by FAO mainly with cooperation of INRENA (Department of Natural Resources, Ministry of Agriculture) in 2005. This study used the data of “vegetation maps 1995” and the description of the maps, which was carried out in 1995 by INRENA and the General Department of Forest. The National Institution of Planning (Instituto Nacional de Planificacion) and the National Office of Natural Resource Evaluation (ONERN:
Oficina Nacional de Evaluacion de Recursos Naturales) prepared “the list of the evaluation and rational use of the natural resources in the coastal area in Peru” which describes the characteristics of the natural condition and vegetation in the coastal area in Peru. In accordance with the vegetation maps in 1995, the river basins of Canete, Chincha, Pisco and Yauca cover whole areas from the coastal line until the Andes highland. The vegetation distribution is characterized by the elevation (please refer to Table 1.5). It can be said as below. i) the vegetation is very poor in the area between the coastal line to about 2,500m above sea level (Cu, Dc in the maps). There is only the cactus and grasses in this area and they are major vegetations in this area. Some scattered shrubs can be found in the high elevation area. ii) the shrub forests can be found in the area between 2,500m to 3,500m, where the rainfall is enough much for the vegetation. iii) the grasses becomes major in the area where higher than 3,500m above the sea level, because the temperature is too low for the vegetation in the area. In four (4) river basins, the size of the trees is about 4m in maximum even in the shrub forests. Exceptionally, the tree species along the rivers can grow up toll.
Table 1.5 List of the typical vegetation in the watersheds of Cañete, Chincha,Pisco and Yauca Symbol Name of Zone Elevation Annual Rainfall Major Vegetation
1)Cu Agriculture lands in the coastal area
Coastal area Almost zero Agricultural lands in the coastal area
2)Dc Desarts inthe coastal area
0 - 1,500m Almost zero. There are some places with fog.
There are almost no vegetation, juts small areas covered with grasses
can be found in the fog areas.3)Ms Dry-grass/shrub
area 1,500 - 3,900m 120 - 220m Cactus and grasses
4)Msh Semi-humidgrass/shrub area
In North & central area: 2,900 - 3,500m
In Andes highland: 2,000 - 3,700m
220 - 1,000m Evergreen & Low trees which are not toller than 4m.
5)Mh Humid grass/shrub area
Northern area: 2,500 - 3,400m Southern area: 3,000 - 3,900m
500 - 2,000m Evergreen trees, height is lower than 4m
6)Cp Grass lands in Andes highland
Around 3,800m (no description) Poaceous grasses
7)Pj Grass land 3,200 - 3,300m Central-southern area: up to 3,800m
In Southern rainless area: lower than 125m
Eastern Slopes: more than 4,000m
Poaceous grasses
8)N Snowpacked mountain
- - -
Source: JICA Study Team based on the vegetation maps in 1995 (INRENA)
(b) Chira River Basin In accordance with the vegetation maps and the description in 1995, the xerophile forest is major in

The Preparatory Study on Project of the Protection of Flood Plain and Vulnerable Rural Population against Flood in the Republic of Peru
Feasibility Study Report, Supporting Report, Annex-6 Sediment Control
1-7
this zone as different with the other four river basins. There are three types of xerophile forest as, i) savanna xerophile (Bas a), ii) terrace xerophile forest (Bs co), and iii) mountainous xerophile forest (Bs mo). These forest types have characteristics by the elevation (Refer to Table 1.6). The major plant species in this zone is Algarrobo (Prospis pallida). Toll trees and shrubs are mixed in Algarrobo forest. The tree species in the terrace xerophile forest and the mountainous xerophile forest is almost same; deciduous tree species. And the height of the trees is about 12m. There are some evergreen trees with more than 10cm diameters along the rivers, because the groundwater level there is high. It is difficult to recover the vegetation naturally in the xerophile forests in case of being destroyed once. The vegetation of the mountainous humid forest type has rich in plant species and the height of the most of trees is less than 10m.
Table 1.6 List of Major Vegetation in Chira River Basin Symbol Name of Zone Elevation Annual Rainfall Major Vegetation
1)Bs sa Savanna xerophile forest
0 to 500m 160 to 240mm Algarrobo forest (evergreen tree forest) . Deciduous trees & shrubs/grasses can be found in high elevation areas.
2)Bs co Terrace xerophile forest
400 to 700m 230 to 1,000mm Almost same situation as mountainous xerophile forest
3)Bs mo Montainus xerophile forest
500 to 1,200m 230 to 1,000m Evergreen tree is major. The average height of high layer trees in the forest is about 12m.
4)Bh mo Mountainoushumid forest
Up to 3,200m (in the areas of Amazon highland to the Northern areas in Peru) Up to 3,800m (in the central southern areas in Peru)
Fogs are common in this zone, there are some mist forests.
The high layer tree measure about 10m in height, palm trees measure 2 to 4m. There are grasses too, and the vegetation is rich in this type.
In addition to above, as described fore, there are the desert area (Dc and Cu), semi-humid shrub forest (Msh), and humid shrub forest (Mh) in this river basin.
Source: JICA Study Team based on the vegetation maps in 1995 (INRENA)
(6) Geology
Table 1.7 shows geology are organized according to examples of sediment disaster that occur in Japan. This makes it clear that these are more disaster-prone in areas with volcanic rocks, andesitic and basaltic land and tertiary lulita. These geological formations are deposited in all basins object widely, it is clear that the geological conditions tend to take place sediment disaster. the characteristic of each basin are described below.
Table 1.7 List of Geological conditions frequently suffered from debris flow Site of occurrence Geology Hokkaido Mt Usu (Ousu river) Hokkaido Nishiyama River、shousu River) Iwate pref Mt.iwaki(Kuasuke River) Iwate pref Ibaragi pref Mt.Akanag(Arasawa,Inari River) Ibaragi pref Niigata Pref Hiramaru Niigata Pref Mt. shishino Nagano pref Mt. yakedake (Joujouhiri River) Nagano pref (Nigori River) Gifu pref Gifu pref Gifu pref Hyogo pref Shodoshima Hyogo pref Kumamoto pref Amakusa Kumamoto pref Kagoshima pref Sakurajima(Nojiri River) Kagoshima pref
Source: JICA Study Team

The Preparatory Study on Project of the Protection of Flood Plain and Vulnerable Rural Population against Flood in the Republic of Peru
Feasibility Study Report, Supporting Report, Annex-6 Sediment Control
1-8
(a) Chira basin Downstream of Poechos dam are alluvial deposits. The east upstream area of Poechos Dam are volcanic rocks and Cretaceous volcanic rocks correspond to 32% of the catchment area in Peru. In this basin are basaltic rocks and diorites, which represent 18% of the catchment area on the Peruvian side. The slopes in these areas are quite steep, above 35 degrees. In the west side are Cretaceous sedimentary rocks.
(b) Cañete Basin Alluvial formation are deposited in the study area. At a distance from the outlet to 15-30km are granodiorites. From 1,000m to 2,000m are diorites and between 2,000 and 4,000 m are granodiorite and sedimentary rocks. The upper level from 4,000m are Mesozoic and Cenozoic sedimentary rocks. The slopes of the high are gentler , in this area there are the 447 natural lakes. Much of these lakes were formed by erosion and melting glacial sedimentation, but some of them were shaped by the landslide.
(c) Chincha Basin Alluvial formation are deposited up to 1,000m. Between 1,000 and 3,000 m of altitude are granites and granodiorites. From 3,000m to 4,000m are granodiorites and Mesozoic sedimentary rocks. The upper level from 4,000m are Mesozoic and Cenozoic sedimentary rocks
(d) Pisco Basin Alluvial formation are deposited up to 1,000m. Between 1,000 and 3,000m of altitude are granites and granodiorites. From 3,000 m to 4,000m are Mesozoic sedimentary rocks. The upper level from 4,000m are Cenozoic sedimentary rocks.
(e) Yauca Basin Alluvial formation are deposited up to 1,000m. Between 1,000 and 3,000m of altitude are granites and granodiorites. From 3,000 m to 4,000m are Mesozoic sedimentary rocks. The upper level from the 4,000m are basaltic rocks.
(f) Camana-majes Basin Alluvial formation are deposited up to 1,000m. Between 1,000 and 4,000 m of altitude are Mesozoic sediment, granites and granodiorites. The upper level from 4,000 m are Jurassic sedimentary rocks. There are The Colca Valley that is one of the deepest valley in the world Between 1,000m and 4,000m.
(7) Precipitation
Isohyetal maps were produced by rainfall data for the period from 1965 to 1974 collected by the SENAMHI produced isohyetal maps for each basin (refer to Figure 1.6 to Figure1.11). Below are the characteristics of rainfall in each basin.

The Preparatory Study on Project of the Protection of Flood Plain and Vulnerable Rural Population against Flood in the Republic of Peru
Feasibility Study Report, Supporting Report, Annex-6 Sediment Control
1-9
Figure 1.6 Isohyetal Map (Chira Basin) Source:JICA Study Team, based on SENAMHI data
The annual rainfall in study areas is 0-200mm. The annual rainfall in the east area with above 2,000 m altitudes is 750-1,000 mm.
Figure 1.7 Isohyetal Map (Cañete Basin) Source:JICA Study Team, based on SENAMHI data

The Preparatory Study on Project of the Protection of Flood Plain and Vulnerable Rural Population against Flood in the Republic of Peru
Feasibility Study Report, Supporting Report, Annex-6 Sediment Control
1-10
The annual rainfall in study areas is 0-25mm. The annual rainfall in the north area with 4,000 m altitudes is 750-1,000 mm.
Figure 1.8 Isohyetal Map (Chincha Basin) Source:JICA Study Team, based on SENAMHI data
The annual rainfall in study areas is 0-25mm. The annual rainfall in the east area with 4,000 m altitudes is 500-750mm.
Figure 1.9 Isohyetal Map (Pisco Basin)
Source:JICA Study Team, based on SENAMHI data

The Preparatory Study on Project of the Protection of Flood Plain and Vulnerable Rural Population against Flood in the Republic of Peru
Feasibility Study Report, Supporting Report, Annex-6 Sediment Control
1-11
The annual rainfall in study areas is 0-25mm. The annual rainfall in the east area with 4,000 m altitudes is 500-750mm.
Source:JICA Study Team, based on SENAMHI data
Figure 1.10 Isohyetal Map (Yauca Basin)
The annual rainfall in study areas is 0-25mm. The annual rainfall in the north area with altitudes between 3,000-4,000 m is 500-750mm.
Figure 1.11 Isohyetal Map (Camana-majes Basin)

The Preparatory Study on Project of the Protection of Flood Plain and Vulnerable Rural Population against Flood in the Republic of Peru
Feasibility Study Report, Supporting Report, Annex-6 Sediment Control
1-12
The annual rainfall in study areas is 0-50 mm. The annual rainfall in the southeast area with 3,000-4,000 m altitudes is 500-750mm.
Calculated the area between the spaces of the distribution curves the distribution map of curves. (Refer to Table 1.8 and Figure 1.12).
In the upper basin of Chira, there are many areas with 300-400mm, representing 30% of the total. There are some areas with rainfall ranging from 1,000 to 1.500 mm.
In the lower basin of Chira, many of the areas have 0-200mm annual rainfall, with a comparatively low volume of rainfall.
In Cañete there are many areas with 500 to 1,000 mm and these areas account for half of the total basin.
In Chincha , Pisco and Camana-Majes basin, there are many areas with 500mm-750mm rainfall, these areas account for about 30% of the each total basin.
In Yauca, compared to other basins ,a rainfall volume is very low, and 0-25mm areas account for 20% of the total basin.
Table 1.8 Areas of Annual Rainfall Volume in each Basin
Precipitation Chira upper
stream Chira down
stream Cañete Chincha Pisco Yauca Camana Majes
0-25 0% 0% 703 12% 643 19% 829 19% 865 20% 3,243 19%25-50 0% 789 19% 198 3% 226 7% 191 4% 338 8% 624 4%50-100 0% 847 20% 237 4% 202 6% 257 6% 349 8% 823 5%
100-200 0% 1,127 27% 263 4% 353 11% 307 7% 379 9% 762 4%200-300 936 15% 551 13% 318 5% 211 6% 377 9% 247 6% 869 5%300-400 1,909 30% 340 8% 252 4% 220 7% 231 5% 314 7% 746 4%400-500 713 11% 172 4% 495 8% 296 9% 211 5% 701 16% 2,313 14%500-750 1,167 18% 200 5% 1,955 32% 1,153 35% 1,390 33% 754 17% 5,816 34%
750-1,000 1,162 18% 213 5% 1,645 27% 0% 479 11% 375 9% 1,849 11%1,000-1500 502 8% 0% 0% 0% 0% 0% 0%
total 6,390 100% 4,238 100% 6,066 100% 3,304 100% 4,272 19% 4,323 100% 17,049 100%Source:Jica Study Team, based on SENAMHI data
0
1,000
2,000
3,000
4,000
5,000
6,000
7,000
chira‐up chira‐down canete chincha pisco yauca camana/majes
Are(km2)
0‐25
25‐50
50‐100
100‐200
200‐300
300‐400
400‐500
500‐750
750‐1000
1000‐1500
Source:JICA Study Team, based on SENAMHI data
Figure 1.12 Surface Rainfall Volume in each Basin

The Preparatory Study on Project of the Protection of Flood Plain and Vulnerable Rural Population against Flood in the Republic of Peru
Feasibility Study Report, Supporting Report, Annex-6 Sediment Control
1-13
(8) Slope and Altitude
The relationship between slope and altitude in each basin was analyzed (refer to Figure 1.13 and Table 1.9). In the upper basin of Chira, at altitudes between 1,000 ~ 3,000 m are many slopes steeper than 35 degrees. In the lower basin slopes with 2 ~ 15° represent 67% of the total. In Cañete basin, slopes greater than 35° represent 60%, there are many areas more than 35°, mainly at altitudes between 4,000 ~ 5,000 m. In Chincha Basin at altitudes between 2,000~4,000 m, slopes over 35° are predominant. In Pisco Basin, slopes over 35° are numerous at altitudes between 1,000~4,000 m. At altitudes above 4,000 m, the slopes become more gentle, less than 35°. In Yauca basin, slopes over 35 ° are most common at altitudes between 1,000 ~ 3,000m. For altitudes above 3,000m, slopes are gentl, with the slope less than 35°. In Camana Majes basin, landform change at altitudes between 1,000 ~ 4,000m is large. There is Colca valley that is one of deepest valley in the world.
0
1,000
2,000
3,000
4,000
5,000
6,000
7,000
8,000
9,000
10,000
0 ‐1000
2000 ‐3000
4000 ‐5000
0 ‐1000
2000 ‐3000
4000 ‐5000
0 ‐1000
2000 ‐3000
4000 ‐5000
0 ‐1000
2000 ‐3000
4000 ‐5000
0 ‐1000
2000 ‐3000
4000 ‐5000
0 ‐1000
2000 ‐3000
4000 ‐5000
0 ‐1000
2000 ‐3000
4000 ‐5000
Chira ‐ upstream basin
Chira ‐downstream
basin
Canete basin Chincha basin Pisco basin Yauca basin Camana/Majes basin
Over 35
15 ‐ 35
2 ‐ 15
0 ‐ 2
Source:JICA Study Team based on SENAMHI data
Figure 1.13 Relationship between Slope and Altitude in each Basin

The Preparatory Study on Project of the Protection of Flood Plain and Vulnerable Rural Population against Flood in the Republic of Peru
Feasibility Study Report, Supporting Report, Annex-6 Sediment Control
1-14
Table 1.9 Relationship between Slopes and Elevations in each Basin
Source:JICA Study Team, based on SENAMHI data
(9) Watershed characteristics
The characteristics without Chira basin are as shown Figure 1.14. In altitudes below 500 m, there is no vegetation and the rainfall volume and sediment volume is very small (Area A). This area, which is called the Costa (coastal area), consist of the desert area covering N-S 2,414 km from Ecuador to Chile and E-W below 500m from the Pacific. In altitudes between 1,000 ~ 4,000 m, the vegetation is sparse with accented with infertile land topography (Area B). This area is called the Sierra region, Quechua region and Suni region. Sierra region that take over 28% of all country is area in altitudes between 500m and 1,500m. Quechua region is moderate area which altitude is between 2,300 and 3,500m. Suni region is microthermal climate area which altitude is between 3,500 and 4,000m. Above 4,000 m, the rainfall volume is intense and the temperature is low. The surface is covered by low vegetation, characteristic of low temperatures and as the topography is
Basin Slope degree
Altitude (m) Total
0 - 1,000 1,000 - 2,000 2,000 - 3,000 3,000 - 4,000 4,000 - 5,000 5,000 - More
Chira upper stream
0 - 2 129.06 98% 1.34 1% 0.83 1% 0.39 0% 0.00 0% 0.00 0% 131.62
2 - 15 1934.27 89% 99.74 5% 84.46 4% 49.22 2% 0.00 0% 0.00 0% 2167.69
15 - 35 859.87 46% 443.18 24% 432.88 23% 116.86 6% 0.00 0% 0.00 0% 1852.79
Over 35 319.67 14% 1084.79 48% 677.65 30% 155.31 7% 0.22 0% 0.00 0% 2237.64
Chira Down stream
0 - 2 647.61 99% 0.21 0% 0.13 0% 3.33 1% 0.00 0% 0.00 0% 651.28
2 - 15 2777.68 97% 12.58 0% 6.70 0% 62.39 2% 0.00 0% 0.00 0% 2859.35
15 - 35 300.77 65% 87.38 19% 10.34 2% 67.37 14% 0.00 0% 0.00 0% 465.86
Over 35 100.13 38% 108.92 42% 31.86 12% 20.85 8% 0.00 0% 0.00 0% 261.76
Cañete
0 - 2 15.51 60% 0.56 2% 0.15 1% 0.52 2% 8.88 35% 0.05 0% 25.67
2 - 15 111.54 17% 18.13 3% 11.10 2% 35.27 5% 490.68 73% 3.26 0% 669.98
15 - 35 101.99 6% 75.00 4% 64.27 4% 193.48 11% 1252.70 73% 21.88 1% 1709.32
Over 35 141.11 4% 435.02 12% 604.91 17% 751.43 21% 1668.31 46% 59.99 2% 3660.77
Chincha
0 - 2 78.15 86% 0.00 0% 0.00 0% 0.00 0% 12.47 14% 0.00 0% 90.62
2 - 15 80.09 16% 5,000 10% 47.83 10% 32.12 6% 289.52 58% 0.12 0% 499.68
15 - 35 148.11 15% 234.91 23% 64.87 6% 256.02 25% 315.65 31% 0.21 0% 1019.77
Over 35 129.25 8% 146.42 9% 421.58 25% 594.25 35% 401.98 24% 0.34 0% 1693.82
Pisco
0 - 2 132.09 76% 1.79 1% 2.08 1% 3.58 2% 33.74 19% 0.02 0% 173.30
2 - 15 371.35 39% 25.01 3% 23.33 2% 67.75 7% 459.43 48% 1.51 0% 948.38
15 - 35 118.98 8% 107.69 8% 101.38 7% 230.25 16% 856.43 60% 4.06 0% 1418.79
Over 35 60.92 4% 373.82 22% 479.29 28% 415.34 24% 398.45 23% 3.8 0% 1731.62
Yauca
0 - 2 21.13 27% 1.48 2% 14.72 19% 25.07 32% 16.56 21% 0.05 0% 79.01
2 - 15 106.81 9% 40.14 3% 350.89 29% 498.75 42% 193.38 16% 0.22 0% 1190.19
15 - 35 86.07 5% 94.66 6% 399.92 25% 685.64 43% 324.82 20% 0.10 0% 1591.21
Over 35 118.78 8% 439.54 30% 537.05 37% 295.34 20% 67.24 5% 0.18 0% 1458.13
Camana Majes
0 - 2 140.95 15% 158.22 17% 14.72 2% 78.54 8% 480.22 51% 61.23 7% 140.95
2 - 15 446.73 7% 1164.54 18% 350.89 5% 560.22 9% 3850.12 59% 128.91 2% 446.73
15 - 35 222.03 4% 622.51 12% 399.92 8% 673.63 13% 3014.22 59% 154.69 3% 222.03
Over 35 230.75 5% 677.32 15% 537.05 12% 993.25 22% 1823.81 40% 290.08 6% 230.75

The Preparatory Study on Project of the Protection of Flood Plain and Vulnerable Rural Population against Flood in the Republic of Peru
Feasibility Study Report, Supporting Report, Annex-6 Sediment Control
1-15
smooth, erosion is not significant (Area C). Table 1.10 shows the relationship of each basin and altitude.
0
1,000
2,000
3,000
4,000
5,000
rainfall700~1000mm
0mm
temperature4℃
20~25℃
・ Landform is shelving・Rain fall is about 700mm・Temperature is low (about 4℃)
Bushy tree suited low temperature
Erosion volume is few
・ Landform is precipitous・Rainfall is 200~300mm・Temperature is about 10℃
Bare are
Erosion volume is much
・Landform is shelving・rainfall is 0~50mm・Temperature is about 20℃
Erosion volume is few
Vegetation is few
Geography
alutitude
Characteristic
AREA A:COSTA AREA C:PUNAAREA B:SIERRA - SUNI
Erosion volume
Figure 1.14 Characteristics of Watersheds Source: JICA Study team
Table 1.10 Relationship between Area and Altitude of each Basin
Area Cañete Chincha Pisco Yauca Camana Majes
A 0-1,000 1,000-5,000 1,000-5,000 0-1,000 0-1,000
B 1,000-5,000 1,000-4,000 1,000-4,000 1,000-3,000 1,000-3,000
C 4,500-5,000 4,000-5,000 4,000-5,000 3,000-5,000 3,000-5,000
Source:JICA Study team
1.3 Condition of sediment production
(1) Results of field survey
Field survey was conducted in the watersheds of Pisco ,Cañete and Camana-Majes. With the exception of Chira and Camana-Majes , all the other 4 basins are close and almost similar conditions. In the upper basin of the Chira River, there is the Poechos dam and sediments become deposited down, so the sediments cannot flow to the downstream from this dam. Characteristics of the Pisco, Canete basin and Camana-majes basin are described below.

The Preparatory Study on Project of the Protection of Flood Plain and Vulnerable Rural Population against Flood in the Republic of Peru
Feasibility Study Report, Supporting Report, Annex-6 Sediment Control
1-16
(a) Pisoco and Canate basin ・ On the slopes of the mountains are observed deposit formation crushed materials released by
the collapse or wind erosion. ・ Production patterns differ depending on the geology of the rock base. If the rock is andesite or
basalt base, the mechanism mainly consists of large gravel falling and fracturing (refer to Figure 1.15 and Figure 1.16)
・ As shown in Figure 1.17, there is no rooted vegetation probably due to the sediment transport in ordinary time in the joints of the andesitic bedrock, etc., where little sediment movement occurs has been observed algae growth and cactus.
・ In almost all channels are observed the formation of the lower terraces. In these places, the sediment washed from the slopes do not enter directly into the channel, but are deposited on the terrace. For this reason, most of the sediment entering the river, probably provided by the deposits of the terrace sediments eroded or accumulated due to the alteration of the bed. (Figure 1.18)
・ In the upper basin there was less terraces and sediment washed from the slopes fall directly into the river confirmed, although its volume is extremely low.
Figure 1.15 Areas of detachment or Basaltic Andesite Bases
Figure 1.16 Location of Sediment yield of Sedimentary Rocks

The Preparatory Study on Project of the Protection of Flood Plain and Vulnerable Rural Population against Flood in the Republic of Peru
Feasibility Study Report, Supporting Report, Annex-6 Sediment Control
1-17
Figure 1.17 Location of the Invasion of Cactus
Training materials colluvial deposit the foothills to the sediment washed (without the intervention of water)
Normally the terrace collapses and is moved with the flow
terrace
Deposit
Figure 1.18 Location of erosion of the terraces
(b) Camana-Majes Basin ・ Camana Majes river run in the valley that has been fretted about 800m depth. The Valley width
is 4.2 km, the width of the river is 400m (Figure 1.21). It has similar landform to Yauca basin. However, the depth and width of the basin-Majes Camaná is larger than Yauca basin.
・ On the mountain surface there is no vegetation, however there are deposits released by the collapse or wind erosion. (Figure 1.27)
・ The Mesozoic sedimentary rocks are distributed in this area mainly. Almost of sediment production are made by slope failure and wind erosion. (Figure 1.27)
・ As shown in Figures 1.21 and 1.27, there is no rooted vegetation on the slope due to moving of the deposit in ordinary time.
・ In the study are, There are deposits on the terrace side the river, because there are the lower
Note the presence of cactus where the soilsurface is rough and sediments are poorly drawn.

The Preparatory Study on Project of the Protection of Flood Plain and Vulnerable Rural Population against Flood in the Republic of Peru
Feasibility Study Report, Supporting Report, Annex-6 Sediment Control
1-18
terraces under the slope due to river width. For this reason few sediment enter the river directly. (Figure 1.27).
・ In the upper stream, because there are few terraces, sediment enter the river in the river directly from the slope. but this volume is few. (Figure 1.27).
・ Due to the interviews for local people, the situation of debris flow is as shown in Table 1.11. And observation of sediment in the river is not conducted.
・ In the valley, there are many terraces, the foot of the terraces contact with the flow channel at various points. It is supposed that the ordinary water flow brings the sediments.
0
500
1000
1500
0 1000 2000 3000 4000 5000 6000
Figure 1.19 Cross section of Majes valley(At the 50km areas From the outlet)
Table 1.11 The List of the Debris Flows in the Majes River
No River name Distance from the outlet
Situation
1 Cosos (Figure 1.23)
Around 88km
In the rainy season the debris flows have occurred once a one month. And Sediments cover the city road. The recovery period is one day. Sometimes Water supplying pipe are visited by debris Flows.
2 Ongoro (Figure 1.24)
Around 103km
In 1998 The debris flows occurred and two people died from the debris flows. The irrigation cannels were visited and the recovery period was one month. The earth sounds occured before 30minutes, so inhabitants escaped this debris flow.
3 San Fransisco (Figure 1.25)
Around 106km
In 1998 the debris flows occurred and two people died from the debris flows. The irrigation cannels were visited and the complete recovery period was 4 years. The height of this debris flow is about 10 m.
4 Joron (Figure 1.26)
Around 106km
The flood was generated sediment and crawled up the main river. The size of the alluvial sediments of sand has been 10m. in height. It is said that has dragged 100,000 to 1,000, 000 m3 of sediment.
River channel of the Camana-Majes

The Preparatory Study on Project of the Protection of Flood Plain and Vulnerable Rural Population against Flood in the Republic of Peru
Feasibility Study Report, Supporting Report, Annex-6 Sediment Control
1-19
Figure 1.20 The Location map of the Debris Flows in the Majes River
Figure 1.21 Situation around Km 60 (The width of the Valley is about 5km )
Figure 1.22 Location of Sediment Deposit in the Cosos River (width approx. 900m)
1.Cosos
2. Ongoro
3. SanFrancisco
4. Joron

The Preparatory Study on Project of the Protection of Flood Plain and Vulnerable Rural Population against Flood in the Republic of Peru
Feasibility Study Report, Supporting Report, Annex-6 Sediment Control
1-20
Figure 1.23 Rural road Pass Cosos River (In rainy season sediment covering the rural road, but it is
restored in a day)
Figure 1.24 Situation of Ongoro River (In 1998, 2 people died because of flood)
Figure 1.25 Location of sediment deposit in the San Francisco River (The irrigation canals was
visited by the disaster. The height of sediment was 10m)
Figure 1.26 Location Horon river (alluvial sediments gone into the Majes river in 1998)
Figure 1.27 Situation around 110 km from the outlet (Inlet Flow to the River from the Sediment of
the Slopes is Small).
Figure 1.28 Intersection of River Andamayo Camaná and river (the Andamayo river is a Spillway)
The Preparatory Study on Project of the Protection of Flood Plain and Vulnerable Rural Population against Flood in the Republic of Peru
Feasibility Study Report, Supporting Report, Annex-6 Sediment Control
1-21
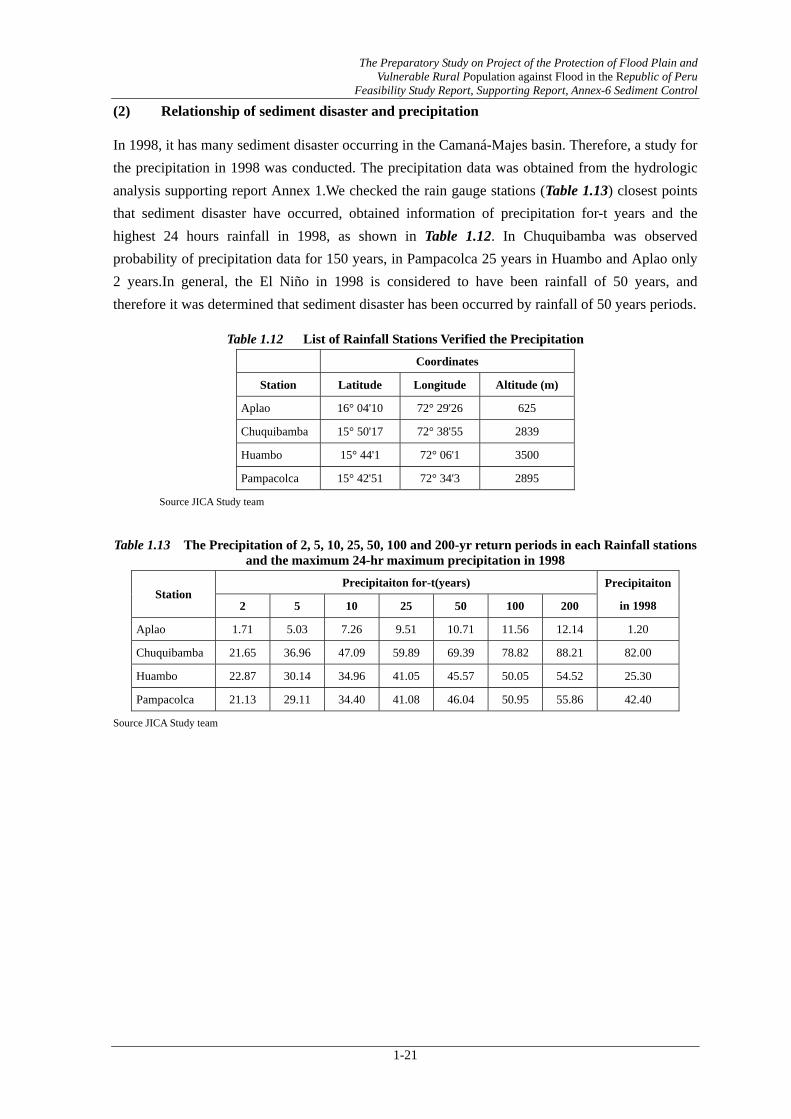
(2) Relationship of sediment disaster and precipitation
In 1998, it has many sediment disaster occurring in the Camaná-Majes basin. Therefore, a study for the precipitation in 1998 was conducted. The precipitation data was obtained from the hydrologic analysis supporting report Annex 1.We checked the rain gauge stations (Table 1.13) closest points that sediment disaster have occurred, obtained information of precipitation for-t years and the highest 24 hours rainfall in 1998, as shown in Table 1.12. In Chuquibamba was observed probability of precipitation data for 150 years, in Pampacolca 25 years in Huambo and Aplao only 2 years.In general, the El Niño in 1998 is considered to have been rainfall of 50 years, and therefore it was determined that sediment disaster has been occurred by rainfall of 50 years periods.
Table 1.12 List of Rainfall Stations Verified the Precipitation Coordinates
Station Latitude Longitude Altitude (m)
Aplao 16° 04'10 72° 29'26 625
Chuquibamba 15° 50'17 72° 38'55 2839
Huambo 15° 44'1 72° 06'1 3500
Pampacolca 15° 42'51 72° 34'3 2895
Source JICA Study team
Table 1.13 The Precipitation of 2, 5, 10, 25, 50, 100 and 200-yr return periods in each Rainfall stations
and the maximum 24-hr maximum precipitation in 1998
Station Precipitaiton for-t(years) Precipitaiton
in 1998 2 5 10 25 50 100 200
Aplao 1.71 5.03 7.26 9.51 10.71 11.56 12.14 1.20
Chuquibamba 21.65 36.96 47.09 59.89 69.39 78.82 88.21 82.00
Huambo 22.87 30.14 34.96 41.05 45.57 50.05 54.52 25.30
Pampacolca 21.13 29.11 34.40 41.08 46.04 50.95 55.86 42.40
Source JICA Study team

The Preparatory Study on Project of the Protection of Flood Plain and Vulnerable Rural Population against Flood in the Republic of Peru
Feasibility Study Report, Supporting Report, Annex-6 Sediment Control
1-22
Source JICA Study team
Figure 1.29 Location Map of Rainfall Station
(3) Projected Production and Sediment Transport
It is considered that the condition of production and sediment transport depend on factors such as rainfall, flow, etc. Since no survey has been performed, here are some qualitative observations for a typical year, a year with rainfall of El Nino and special flood.
(a) Ordinary years Figure 1.30 shows the sediment production during normal times.
There is virtually no sediment production from the slopes. The sediments on the foot of the slope and terraces are produced by the water stream
collision against the sediment deposition. It is considered that the sediment transport occurs by the following mechanism: the
sediments accumulated in the sand banks are pushed into the river and carried downstream by changing the channel during small floods.

The Preparatory Study on Project of the Protection of Flood Plain and Vulnerable Rural Population against Flood in the Republic of Peru
Feasibility Study Report, Supporting Report, Annex-6 Sediment Control
1-23
Mountain stream
(mainly Tributary)
Mountain are
Plain of valley~Top of alluvial fanalluvial fan
Only wind erosion, soil do not slid into the river.
Bank erosion, bank sand terraces, sediment movement due to the change of the bed. Mainly fine grains.
Bank erosion, bank sand terraces, sediment movement due to the change of the bed. The materia l is mainly fine grains.
Wind erosion
Deposit zone
Erosion zone
Sediment remotion
Water flow( traction )
Sediment flow ( traction zone )
Legend
Source JICA Study team
Figure 1.30 Location of Sediment Production in Normal Circumstances
(b) Rains of Similar Magnitude to El Niño According to the interviews conducted in the locality, In the phenomenon of El Niño, at all times the debris flows occur in the tributaries. However, the river has sufficient capacity to regulate sediment transport, the sediment yield deposit in the river. Hence the influence of the downstream is few. Figure 1.3-16 shows the production and sediment transport during the heavy rains like El Niño that return period is 50 years.
The debris flow from reaching tributaries enter the main river. Since the channel has sufficient capacity to regulate sediment transport, the sediment yield
deposit in the river. Hence the influence of the downstream is few.

The Preparatory Study on Project of the Protection of Flood Plain and Vulnerable Rural Population against Flood in the Republic of Peru
Feasibility Study Report, Supporting Report, Annex-6 Sediment Control
1-24
Debris flows occur in Tributary. Sediment flow in main river
Debris flow
Legend
Mountain stream
(mainly tributary)
Mountain arePlain of valley~
Top of alluvial fan
alluvial fan
Wind erosion
Deposit zone
Erosion zone
Sediment remotion
Water flow( traction )
Sediment flow
( traction zone )
Only wind erosion, soil do not slid into the river.
Bank erosion, bank sand terraces, sediment movement due to the change of the bed. The material is mainly fine grains.
Bank erosion, bank sand terraces, sediment movement due to the change of the bed. The material is mainly fine grains.
Source JICA Study team
Figure 1.31 Location of Sediment Production in the Rainy Season with El Niño
(c) Rains of enormous magnitude (which can lead to the formation of terraces similar to those present), with a return period of years several thousands
In the Costa area, the rainfall of 100-years return periods is approximately 50 mm. Hence sediment transport is few. However, the potential for sediment production is very high. So enormous magnitude rains cause serious sediment disaster and sediment transport described below (Refer to
Figure 1.32). Meanwhile, the frequency of large scale flooding has been estimated at several thousand years that match the heating cycle - global cooling.
Sediment transport from the hillsides occur commensurate with water volume. Sediment transport is increase, and landslides and debris flows occur. The rivers are closed
by these sediment. Destruction of the natural prey of closed channels by sediments, the debris flows due to
destruction of towhead and sediment flow occur. In the lower basin amount of the sediment deposit in the river . Many terraces are formed.
Cross section of the river becomes small. Water overflows occur in the alluvial fan.

The Preparatory Study on Project of the Protection of Flood Plain and Vulnerable Rural Population against Flood in the Republic of Peru
Feasibility Study Report, Supporting Report, Annex-6 Sediment Control
1-25
Sediment flow in main river and tributary
Sedimentation and frequent overflow below the alluvial fan, being able to alter the channel.
Frequent drag and accumulation of sediments forming sedimentary surface. The excessive accumulation of land form terraces.
Heavy debris flow
Slope failure
Sediment deposit
Legend
Deposit zone
Erosion zone
Sediment flow( traction zone )
Water flow( traction )
Mountain stream
(mainly Tributary)
Mountain arePlain of valley~
Top of alluvial fan
alluvial fan
Source JICA Study team
Figure 1.32 Production of Sediment in Large Flood (Geological Scale)
(d) Scope of the Study The scope of this study is focused on rainfall under return period of 50 years, equivalent to rainfall that cause the debris flows from the tributaries.
10 25 50 100 10^4
R=The return period time
V
=Sedim
ent vo
lume
Sediment discharge in the past
Equal to El Nino
Debris flows occurin tributary
Bank erosion in main river
The scope of this project
Source JICA Study team
Figure 1.33 Relationship between the Sediment yield Volume and Rainfall Volume
1.4 Calculation of Sediment Yield
To analyze deformation of the riverbed, it is necessary to calculate the sediment inflow volume. Hence the sediment production volume in each basin were calculated. The production sediment volume was calculated by 3 sediment volume types below.

The Preparatory Study on Project of the Protection of Flood Plain and Vulnerable Rural Population against Flood in the Republic of Peru
Feasibility Study Report, Supporting Report, Annex-6 Sediment Control
1-26
(1) The movable sediment volume (2) Comparative sediment volume using the sediment volume from the Poechos dam (3) Sediment volume from the flow rate
(1) Estimation of the movable sediment volume
(a) Watershed Classification To calculate the sediment volume, hydrological maps and classification of watersheds and made. The classification of the valley by the methodology Strehler (Refer to Figure 1.34) is performed. It is consider that the 0 order valley is the depression of the contour lines with depth less than the width of contour lines in the a topographic map scale S = 1/50,000.(refer to Figure 1.35)
The movable sediment volume has been calculated from the sum of the movable sediment yield volume in the debris area and sediment production volume in the traction area. In Japan, the calculation of the movable sediment volume from the 0 order valley are included in the sediment transport volume. However, in this study are, once the slopes are steep and the rocks are exposed in 0 order valley and it is estimated that the sediment transport volume is small due to small rainfall, so the movable sediment volume from the 0 order valley are not include in movable sediment volume.
Source: Technical Standards River sediment Control in the Ministry of Construction in Japan.
Figure 1.34 Classification of Basins According to Strehler
Order 1 Order 2 Order 3 Order 4

The Preparatory Study on Project of the Protection of Flood Plain and Vulnerable Rural Population against Flood in the Republic of Peru
Feasibility Study Report, Supporting Report, Annex-6 Sediment Control
1-27
Source: Technical Standards River sediment Control in the Ministry of Construction in Japan.
Figure 1.35 Methodology of Primarily of Basins
(b) Calculating the movable sediment volume in the debris flow area The movable sediment volume in the debris flow area is calculated from the sum of movable sediment volume on the riverbed and the sediment volume due to slope failure. The movable sediment volume from the 0 order valley are not include in movable sediment volume because of thickness of weathered layer.
(c) Movable sediment volume on the riverbed The movable sediment volume on the bed is multiplied by the average width (Bd) ,which are erodible by the debris flow, by the average depth (De) where are erodible by the debris flow.
Source: Basic Methodology Guide Project Planning Sediment Control
Figure 1.36 Methodology for Calculation of Movable Sediment Volume on the Riverbed
Grass area
Timber area
Outcrop
Sidehill
Sediments on the valley
outcrop
b
a
Contour line
b>=a valley b<a not valley 0order valley

The Preparatory Study on Project of the Protection of Flood Plain and Vulnerable Rural Population against Flood in the Republic of Peru
Feasibility Study Report, Supporting Report, Annex-6 Sediment Control
1-28
(d) Calculating the sediment production volume in other areas (without debris flow area) It is supposed that sediment yield in the traction areas are erosion of the deposit on the riverbed and bank. If it is difficult to determine the sediment yield in the channel, the method of product two to three times of the width, relative elevation and the length of design. (Refer to Figure 1.37) are employed. In this study, this method is adopted. In case that the river width is large and riverbed slope is gentle and the river is not meandering two is adopted. In case that the river width is narrow and riverbed slope is steep and the river is meandering three is adopted. In this study, three is adopted due to the rivers meandering.
Source: JICA study Team
Figure 1.37 Calculation of the Sediment Production Volume in the Traction Area
The Table 1.14 shows the width (Bd) and depth (De) used to calculate the sediment production volume in each basin. It is assumed that the 1-3 order is debris flow area and 4-7 order areas is traction area for calculation of the sediment volume.
Table 1.14 The Widths and Depth of the Movable Sediment Volume in each Order
Order Classification Widths(Bd)
Depth (De)
1 Debris 2 0.2 2 Debris 5 0.5 3 Debris 15 4 4 tranction 30 5 5 tranction 60 7 6 tranction 90 10 7 tranction 100 10
Source:JICA study Team
The movable sediment volume in each basin is shown to Table 1.15. In all basins the percentage of first-order valley is 60%. There are variations between each basin, but the volume of sediment transport potential per 1 km2 is 4,000 m3 to 5,600 m3. Pisco basin has more volume per km2 compared to the others. This reason is that the 6th order river in the Pisco basin is longer than the other basins.
River width
Relative elevation

The Preparatory Study on Project of the Protection of Flood Plain and Vulnerable Rural Population against Flood in the Republic of Peru
Feasibility Study Report, Supporting Report, Annex-6 Sediment Control
1-29
Table 1.15 The Movable Sediment Volume in each Basin
Chira basin※1 Canete basin Chincha basin
47,932 m3/km 42,122 m3/km 47,323 m3/km
orderWidth
(m)depth(m)
Length(km)
Sedimentvolume
(m3)
Ratio(%)
Length(km)
Sedimentvolume
(m3)
Ratio(%)
Length(km)
Sediment volume(m3)
Ratio(%)
1 2 0.2 3,698 1,479,348 57% 2,500 1,000,104 57% 1,522 608,878 60%
2 5 0.5 1,210 3,025,625 19% 931 2,326,441 21% 530 1,325,893 21%
3 15 4 625 37,501,200 10% 441 26,482,162 10% 170 10,204,388 7%
4 30 5 397 59,601,000 6% 210 31,549,328 5% 132 19,728,461 5%
5 60 7 223 93,542,400 3% 162 67,845,999 4% 52 21,856,708 2%
6 90 10 81 73,269,000 1% 138 124,539,795 3% 114 102,627,283 5%
7 100 10 241 241,000,000 4%1-3
total 5,534 42,006,173 85% 3,872 29,808,707 1 2,223 12,139,159 88%4-7
total 942 467,412,400 15% 510 223,935,122 0 298 144,212,452 12%
total 6,476 509,418,573 100% 4,382 253,743,830 1 2,520 156,351,611 100%
Pisco basin Yauca basin Camana-majes basin
56,634 m3/km 39,780 m3/km 42,739 m3/km
orderWidth
(m)depth(m)
Length(km)
Sedimentvolume
(m3)
Ratio(%)
Length(km)
Sedimentvolume
(m3)
Ratio(%)
Length(km)
Sediment volume(m3)
Ratio(%)
1 2 0.2 1,955 781,876 30% 1,681 672,547 38% 8,142 3,256,768 323%2 5 0.5 600 1,498,775 9% 541 1,353,482 12% 2,599 6,497,925 103%3 15 4 236 14,137,800 4% 275 16,485,824 6% 1,141 68,436,600 45%4 30 5 102 15,259,500 2% 87 13,113,662 2% 610 91,512,000 24%5 60 7 110 46,065,600 2% 119 50,056,950 3% 348 146,063,400 14%6 90 10 182 164,115,000 3% 100 90,110,750 2% 459 412,911,000 18%7 100 10
1-3total 2,790 16,418,451 43% 2,498 18,511,854 57% 11,882 78,191,293 471%4-7
total 394 225,440,100 6% 307 153,281,362 7% 1,417 650,486,400 56%
total 3,184 241,858,551 49% 2,804 171,793,215 64% 13,298 728,677,693 528%※1 Without Ecuador
Basin
Area(km2)Area(km2)10627.99 Area(km2)6023.97 Area(km2)3303.89
Source:Jica Study Team
Area(km2)Area(km2)4270.52 Area(km2)4318.54 Area(km2)17049.51
Basin
per 1km2
per 1km2
(2) Calculation of sediment volume using sediment volume in the Poechos dam
In the Poechos dam the sediment measurements have been conducted periodically. The specific discharge of sediment was calculated from this sediment volume and the sediment volume in other basin were calculated by using the specific discharge of sediment in the Poechos dam.

The Preparatory Study on Project of the Protection of Flood Plain and Vulnerable Rural Population against Flood in the Republic of Peru
Feasibility Study Report, Supporting Report, Annex-6 Sediment Control
1-30
(a) Sediment volume in the Poechos dam Poechos dam is located in the upper basin of the Chira River, the border with Ecuador. This dam was built during the period from 1972 to 1976 and began operations from 1976. The catchment area is approximately 13,000 km2 and half of it is located in the neighboring country of Ecuador. The storage capacity is 790 million tons, but after 34 years from the inauguration, the sediment deposited accumulated 460 million tons and storage capacity reduced to 410 million tons. Currently, problems that flood control capacity is depression. (Refer to Figure 1.38 and Figure 1.40). For this reason, in ordinary times the full water level has been changed 103m to 104m.
The sediment volume inflow in the years 1983 and 1998 occurred the phenomenon of El Niño were accumulated about 7,500 ton per year. The specific discharge of sediment are considered 500m3/km2/years, it reaches 6,000 m3/km2/year, about 10 times more than normal. In some dams in Japan too, it have been recorded that a double-digit increase in the sediment volume deposited by flood, compared to normal years. Measuring the sediment volume have been conducted by survey.
0
40
80
120
160
200
240
280
320
360
400
440
480
0
4000
8000
12000
16000
20000
24000
1976
1977
1978
1979
1980
1981
1982
1983
1984
1985
1986
1987
1988
1989
1990
1991
1992
1993
1994
1995
1996
1997
1998
1999
2000
2001
2002
2003
2004
2005
2006
2007
2008
2009
2010
SED=MMCQ=MMC
Input Flow volume
Sediment volume
Source:PECHP
Figure 1.38 Annual input Flow Volume and Sediment Accumulation in Poechos Dam

The Preparatory Study on Project of the Protection of Flood Plain and Vulnerable Rural Population against Flood in the Republic of Peru
Feasibility Study Report, Supporting Report, Annex-6 Sediment Control
1-31
y = 0.0043x - 5.2954R² = 0.8451
0.00
10.00
20.00
30.00
40.00
50.00
60.00
70.00
80.00
0 2000 4000 6000 8000 10000 12000 14000 16000 18000 20000
Se
dim
ent vo
lum
e(M
MC
/yea
r)
Input f low volume(m3/year)
Source: JICA Study Team
Figure 1.39 Relationship between Annual input Flow Volume and Sediment Volume
Source: PECHP
Figure 1.40 Diagram of sediment accumulation (from 1976 to2010)

The Preparatory Study on Project of the Protection of Flood Plain and Vulnerable Rural Population against Flood in the Republic of Peru
Feasibility Study Report, Supporting Report, Annex-6 Sediment Control
1-32
Source:JICA Study Team Figure 1.41 Annual Specific Discharge of Sediment
(b) Calculating the comparative discharge volume Based on data from the status of the Poechos sediment volume is calculated comparing sediment for one flood.
a) Rainfall data
Rainfall data around the Poechos were organized. Table 1.16 lists rainfall station of the chira river basin. Figure 1.42 shows location of rain-guage station. Table 1.17 shows measurement period in each rainfall station that have long periods rainfall data. Combining rainfall data (as shown in Tabla1.18) were made by these rainfall data. The catchment area covers about 6.500 km2, covering both Peru and Ecuador, as shown in Table 1.19.
Table 1.16 Rainfall Stations of the Chira River Basin Name of rainfall station Prefecture District Town Longitude Latitude ElevationALAMOR PIURA SULLANA LANCONES 80░23'00.0" 04░28'00.0" 150 ALIVIADERO PIURA SULLANA LANCONES 80░31'00.0" 04░43'00.0" 103 ALTAMIZA PIURA MORROPON CHALACO 79░44'00.0" 05░04'00.0" 2600 ANIA CABUYAL PIURA AYABACA AYABACA 79░29'00.0" 04░51'00.0" 2450 ARANZA PIURA AYABACA AYABACA 79░59'00.0" 04░51'00.0" 1300 ARDILLA (SOLANA BAJA) PIURA SULLANA LANCONES 80░26'00.0" 04░31'00.0" 150 ARENALES PIURA AYABACA FRIAS 79░51'00.0" 04░55'00.0" 3010 ARRENDAMIENTOS PIURA AYABACA LAGUNAS 79░54'00.0" 04░50'00.0" 3010 AUL (C. MEMBRILLO) PIURA AYABACA AYABACA 79░42'00.0" 04░33'00.0" 640 AYABACA PIURA AYABACA AYABACA 79░43'00.0" 04░38'00.0" 2700 CHALACO PIURA MORROPON CHALACO 79░47'30.0" 05░02'13.0" 2276 CHILACO PIURA SULLANA LANCONES 80░30'00.0" 04░42'00.0" 90 EL CIRUELO PIURA AYABACA SUYO 80░09'00.0" 04░18'00.0" 202 EL TABLAZO PIURA PIURA TAMBO GRANDE 80░28'00.0" 04░53'00.0" 148 ESPINDOLA PIURA AYABACA AYABACA 79░30'00.0" 04░38'00.0" 2300 FRIAS PIURA AYABACA FRIAS 79░51'00.0" 04░56'00.0" 1700 HACIENDA YAPATERA PIURA MORROPON CHULUCANAS 80░08'00.0" 05░04'00.0" 117 HUARA DE VERAS PIURA AYABACA AYABACA 79░34'00.0" 04░35'00.0" 1680 JILILI PIURA AYABACA JILILI 79░48'00.0" 04░35'00.0" 1330 LA ESPERANZA PIURA PAITA COLAN 81░03'38.0" 04░55'04.0" 12
Spec
ific
disc
harg
e of
sedi
men
t (m
3/km
3/ye
ar)

The Preparatory Study on Project of the Protection of Flood Plain and Vulnerable Rural Population against Flood in the Republic of Peru
Feasibility Study Report, Supporting Report, Annex-6 Sediment Control
1-33
LA TINA PIURA AYABACA SUYO 79░57'00.0" 04░24'00.0" 427 LAGARTERA PIURA AYABACA SAPILLICA 79░58'00.0" 04░44'00.0" 307 LAGUNA SECA PIURA AYABACA PACAIPAMPA 79░29'00.0" 04░53'00.0" 2450 LANCONES PIURA SULLANA LANCONES 80░32'50.0" 04░38'34.0" 150 LAS ARREBIATADAS PIURA AYABACA AYABACA 79░28'00.0" 04░45'00.0" 3450 LAS LOMAS PIURA PIURA LAS LOMAS 80░15'00.0" 04░38'00.0" 265 LAS PIRCAS PIURA AYABACA FRIAS 79░48'00.0" 04░59'00.0" 3300 LOS ENCUENTROS PIURA SULLANA LANCONES 80░17'00.0" 04░26'00.0" 175 MALLARES PIURA SULLANA MARCAVELICA 80░42'52.9" 04░51'25.6" 47 MONTERO PIURA AYABACA MONTERO 79░50'00.0" 04░38'00.0" 1070 NACIENTES DE ARANZA PIURA AYABACA PACAIPAMPA 79░29'00.0" 04░53'00.0" 2450 NANGAY MATALACAS PIURA AYABACA PACAIPAMPA 79░46'00.0" 04░52'00.0" 2100 OLLEROS PIURA AYABACA AYABACA 79░39'00.0" 04░42'00.0" 1360 PACAYPAMPA PIURA AYABACA PACAIPAMPA 79░39'46.0" 04░59'35.0" 2041 PAIMAS PIURA AYABACA PAIMAS 79░57'00.0" 04░37'00.0" 545 PAITA PIURA PAITA PAITA 81░08'00.0" 05░07'00.0" 3 PANANGA PIURA SULLANA MARCAVELICA 80░53'00.0" 04░33'00.0" 480 PARAJE GRANDE PIURA AYABACA PAIMAS 79░54'00.0" 04░37'00.0" 555 PARTIDOR PIURA SULLANA LANCONES 80░15'00.0" 04░38'00.0" 265 PASAPAMPA PIURA HUANCABAMBA HUANCABAMBA 79░36'00.0" 05░07'00.0" 2410 PICO DE LORO PIURA AYABACA SUYO 79░52'00.0" 04░32'00.0" 1325 PUENTE INTERNACIONAL PIURA AYABACA SUYO 79░57'00.0" 04░23'00.0" 408 PUENTE SULLANA PIURA SULLANA SULLANA 80░41'00.0" 04░53'00.0" 32 REPRESA SAN LORENZO PIURA PIURA LAS LOMAS 80░13'00.0" 04░40'00.0" 300 SAN ISIDRO PIURA PIURA LAS LOMAS 80░16'00.0" 04░47'00.0" 160 SAN JACINTO PIURA SULLANA IGNACIO ESCUDERO 80░52'00.0" 04░51'00.0" 103 SAN JUAN DE LOS ALISOS PIURA AYABACA PACAIPAMPA 79░32'00.0" 04░58'00.0" 2150 SAPILLICA PIURA AYABACA SAPILLICA 79░59'00.0" 04░47'00.0" 1456 SAUSAL DE CULUCAN PIURA AYABACA AYABACA 79░45'42.0" 04░44'52.0" 980 SICCHEZ PIURA AYABACA SICCHEZ 79░46'00.0" 04░34'00.0" 1435 SOMATE PIURA SULLANA SULLANA 80░31'00.0" 04░45'00.0" 112 SUYO PIURA AYABACA SUYO 80░00'00.0" 04░32'00.0" 250 TACALPO PIURA AYABACA AYABACA 79░36'00.0" 04░39'00.0" 2012 TALANEO PIURA HUANCABAMBA HUANCABAMBA 79░33'00.0" 05░03'00.0" 3430 TAPAL PIURA AYABACA AYABACA 79░33'00.0" 04░46'00.0" 1890 TEJEDORES PIURA PIURA LAS LOMAS 80░14'00.0" 04░45'00.0" 230 TIPULCO PIURA AYABACA AYABACA 79░34'00.0" 04░42'00.0" 2600 TOMA DE ZAMBA PIURA AYABACA LAGUNAS 79░54'00.0" 04░40'00.0" 585 VADO GRANDE PIURA AYABACA AYABACA 79░36'00.0" 04░27'00.0" 900
Source:JICA Study Team
Table 1.17 Measurement Period of Adopted Stations
RIO CHIRA
1976
1977
1978
1979
1980
1981
1982
1983
1984
1985
1986
1987
1988
1989
1990
1991
1992
1993
1994
1995
1996
1997
1998
1999
2000
2001
2002
2003
2004
2005
2006
2007
2008
2009
2010
ALAMOR
EL CIRUELO
PARTIDOR
Source: JICA Study Team
Table1.18 Details of the Combining Rainfall
Observing station Time period adopted Missing data period
ALAMOR 1stDec- 31thMar1996 May 1992 – June 1993 August 1995
EL CIRUELO 1st Apr1996 – 31th Dec1997
PARTIDOR 1st Jan 1998 -25th Jun 2010 Jun1998- Dec1998 Jan 2009, May 2010
※ The years 1992 and 1993 were excluded from the analysis because no data. The months of January to May in 1998 if taken into
account as it has with the respective data.
Source: JICA Study Team
Table 1.19 Catchment area of the Poechos dam Boundary Area (km2)
Peru side basin 6,410 Ecuator side basin About 6,590
Total About 13,000 Source:JICA Study Team

The Preparatory Study on Project of the Protection of Flood Plain and Vulnerable Rural Population against Flood in the Republic of Peru
Feasibility Study Report, Supporting Report, Annex-6 Sediment Control
1-34
Fig
ure
1.4
2
Rai
nfal
l Sta
tions
Nea
r th
e C
hira
Riv
er
Sour
ce: J
ICA
Stu
dy T
eam
bas
ed o
n SE
NA
MH
I

The Preparatory Study on Project of the Protection of Flood Plain and Vulnerable Rural Population against Flood in the Republic of Peru
Feasibility Study Report, Supporting Report, Annex-6 Sediment Control
1-35
b) Relationship between rainfall and the volume of sediment
The input flow volume, sediment volume and the rainfall are as shown in Table 1.20 and Figure
1.43 to 1.49. In the years of 1983 and 1998, occurred the phenomenon of El Niño, sediment volume was accumulated 370 million m3. The annual rainfall volume and the input flow volume are congruent, and the input flow volume and sediment volume are congruent, too. Because catchment areas of the basin is almost the same for both Peru and in Ecuador, Half of The input flow volume and the sediment volume are used for calculation of the specific discharge of sediment
Table 1.20 Input Flow, Sediment Volume and Rainfall in the Poechos Dam
Year Peak rainfall per 24 hours
mm
Maximum continuous
rainfall mm
Annual rainfall
mm
Sediment volume *1
MMC
Inflow *1 MMC remarks
1976 13.30 2,661.5 1977 135.9 234.1 894.2 8.65 1,736.5 1978 28.0 38.2 149.3 3.70 744.0 1979 30.0 70.1 181.9 4.05 814.5 1980 72.9 187.4 360.1 5.50 900.0 1981 93.2 450.5 555.2 5.85 951.0 1982 100.8 199.7 488.6 3.85 821.0 1983 209.1 942.0 3112.6 37.50 7,965.0 El Niño 1984 82.5 196.4 783.5 8.50 3,297.0 1985 49.7 111.9 265.3 2.25 876.0 1986 100.5 206.1 607.9 2.55 990.5 1987 152.3 401.5 1288.8 4.75 1,838.5 1988 16.1 25.3 120.4 1.40 701.0 1989 91.0 185.4 973.5 4.10 2,035.0 1990 18.3 58.3 173.9 1.80 890 1991 105.3 163.8 416.1 2.00 989.5 1992 186.0 411.5 1275.4 4.90 2,496.5 1993 4.75 2,625.0 no data 1994 116.5 245.0 737.6 2.70 2,375.5 1995 85.0 145.9 404.4 2.25 747.1 1996 76.5 172.5 299.4 2.40 815.6 1997 91.8 180.4 622.8 3.15 1,120.0 1998 191.4 599.8 2816.8 37.95 8,778.0 El Niño 1999 108.6 239.5 562.9 15.65 3,508.7 2,000 53.7 85.7 499.3 6.00 3057 2001 99.4 495.1 983.2 4.00 2,892.5 2002 105.6 382.6 914.1 3.25 3,105.5 2003 55.0 58.1 149.6 0.75 996.0 2004 35.4 36.1 140.5 1.13 747.9 2005 48.9 128.4 238.2 0.13 1,150.5 2006 105.6 140.3 677.1 2.68 2,210.6 2007 48.2 78.3 202.4 1.73 1,062.9 2008 114.3 318.6 990.7 18.82 4,433.8 2009 51.3 87.7 377.2 6.33 3,491.4
* 1 50% is taken as the catchment areas of Peru and Ecuador are about half the total catchment area
Source: JICA Study Team based on PECHP data.

The Preparatory Study on Project of the Protection of Flood Plain and Vulnerable Rural Population against Flood in the Republic of Peru
Feasibility Study Report, Supporting Report, Annex-6 Sediment Control
1-36
0
5
10
15
20
25
30
35
40
0
500
1000
1500
2000
2500
3000
3500
19761977197819791980198119821983198419851986198719881989199019911992199419951996199619971998199920002001200220032004200520062007200820092010
Annual rainfall(mm)
Sediment VolumeMMC
Figure 1.43 Relationship between Annual Rainfall and Annual Sediment Volume
0
5
10
15
20
25
30
35
40
0
100
200
300
400
500
600
700
800
900
1000
Maximum continuous rainfall(mm)
Sediment VolumeMMC
Figure 1.44 Relationship between Maximum Continuous Rainfall and Annual Sediment Volume
0
5
10
15
20
25
30
35
40
0
50
100
150
200
250
19761977197819791980198119821983198419851986198719881989199019911992199419951996199619971998199920002001200220032004200520062007200820092010
The maximum daily rainfall(mm)
Sediment VolumeMMC
Figure 1.45 Relationship between Maximum Daily Rainfall and annual Sediment Volume
Source: JICA study team

The Preparatory Study on Project of the Protection of Flood Plain and Vulnerable Rural Population against Flood in the Republic of Peru
Feasibility Study Report, Supporting Report, Annex-6 Sediment Control
1-37
0
5
10
15
20
25
30
35
40
0.0
1,000.0
2,000.0
3,000.0
4,000.0
5,000.0
6,000.0
7,000.0
8,000.0
9,000.0
10,000.0
19761977197819791980198119821983198419851986198719881989199019911992199419951996199619971998199920002001200220032004200520062007200820092010
Input flow volumeMMC
Sediment VolumeMMC
Figure 1.46 Relationship between Annual Input Flow Volume and Annual Sediment Volume
0
1,000
2,000
3,000
4,000
5,000
6,000
7,000
8,000
9,000
10,000
0
500
1000
1500
2000
2500
3000
3500
19761977197819791980198119821983198419851986198719881989199019911992199419951996199619971998199920002001200220032004200520062007200820092010
Annual rainfall(mm)
Input flow volumeMMC
Figure 1.47 Relationship Between Annual Rainfall and Annual Input Flow Volume
Source: JICA study team
Figure 1.48 Relationship Between Annual Input Flow volume and Annual Sediment Volume
Figure 1.49 Relationship Between Annual Rainfall and Annual Sediment Volume
c) Relationship between rainfall and soil erosion
USLE (Universal Soil Loss Equation), its revised version RUSLE (Revised Universal Soil Loss
Input flow volume(MMC/year)
Ann
ual s
edim
ent v
olum
e (M
MC
/yea
r)
Ann
ual s
edim
ent v
olum
e (M
MC
/yea
r)
Annual rainfall(MMC/year)

The Preparatory Study on Project of the Protection of Flood Plain and Vulnerable Rural Population against Flood in the Republic of Peru
Feasibility Study Report, Supporting Report, Annex-6 Sediment Control
1-38
Equation) and MUSLE (Modified Universal Soil Loss Equation) are typical experimental model to estimate soil erosion volume. USLE formula shown below is consolidated by Wishmeier and others using experimental field data base on static model developed and succeeded by various researchers.
A = R K L S C P Where,
A : Annual Soil loss per unit area [t ha-1 y-1] R : Rainfall erosive factor [MJ mm ha-1 h-1 y-1] K : Erodibility factor [t h MJ-1 mm-1] L : Factor of slope length [a dimensional] S : Steepness factor of the slope [a dimensional] A(Annual soil loss) is proportional to R, K, L y S
Thus it is clear that soil loss is proportional to
Where, Ei : Rainfall kinetic energy [MJ ha-1] in the random event of rain i I30i : Maximum amount of rain for 30 minutes [mm h-1] in the random event of rain i (note units) n : Nunber of random events of rainfall per year Because there are only daily data, it is assumed that the volume of soil loss and rainfall volume is proportional, we have calculated the volume of soil per 1 mm rainfall and per 1 km2. There are dispersion in this result, but the results are 0.5 - 4m3/km2/mm, averaging 1.48 m3/km2/mm.
0
1000
2000
3000
4000
5000
6000
7000
0
0.5
1
1.5
2
2.5
3
3.5
4
4.5
2005
2002
1994
1987
1992
2006
2001
1986
1989
1991
2003
1997
1995
1982
1996
2004
1985
2007
1977
1990
1981
1984
1988
2000
1983
1998
1980
2009
2008
1979
1978
1999
Specific discharge
of sediment(m3/km2)
Specific discharge
of sediment
(m3/m
m/km2)
Specific discharge of sediment(m3/mm/km2) Specific dischargeof sediment km2(m3/km2)
Figure 1.50 Specific discharge of Sediment (m3/km2/1mm)&(m3/km2) Source: JICA study team
d) Soil erosion and slope gradient According to Measurements in Jinzukawa River basin, it is clear that the annual erosion depth is

The Preparatory Study on Project of the Protection of Flood Plain and Vulnerable Rural Population against Flood in the Republic of Peru
Feasibility Study Report, Supporting Report, Annex-6 Sediment Control
1-39
proportionate to slope gradient mainly, so erosion depth is larger in the steeper slope. [Kazuo Ashida, Tamotsu Takahashi, Tomiaki Sawada, S60.4] The relationship between slope angle and erosion depth are as shown to below (Refer to Figure 1.51) from these measured data in this study. The classification of inclination of the basin was made and using these data, weighting for slope gradient and soil erosion were conduct (Refer to Table 1.21).
Source: JICA study team based on
Figure 1.51 Relationship between slope gradient and annual erosion depth
Table 1.21 The weighting of erosion by the slope gradient
Slope gradient(dgree) Area (km2) Percentage (%) Weight coefficient
0-2 335.24 5% 1 2-15 2065.31 32% 1
15-35 1854.42 29% 6 35- 2155.05 34% 59
Total 6410.02 100% Source: JICA study team
e) Specific discharge of sediment around the Poechos dam From this result, the sediment volume by 50 mm rainfall are as shown in Table 1.22.
Table 1.22 Sediment Volume by 50mm Rainfall due to Slope Gradient
Slope gradient(dgree) Sediment volume by 50mm rainfall
0-15° 3.4m3/km2
15-35° 21.2m3/km2
35° 199.5m3/km2
Source: JICA study team
f) Sediment volume in other basins Possibility of application sediment volume in the Poechos dam to other basins were considered. Ii is said that sediment volume greatly depend on the geological. Specific discharge of sediment due
Slope Gradient(°)
Dep
th o
f ero
sion
(cm
)

The Preparatory Study on Project of the Protection of Flood Plain and Vulnerable Rural Population against Flood in the Republic of Peru
Feasibility Study Report, Supporting Report, Annex-6 Sediment Control
1-40
to the difference in geology are as shown Table 1.23. Volcanic Rocks are distributed around Poechos the dam, while granitic and andesitic rocks are mainly distributed around the basins of Cañete, Chincha, Pisco, and Yauca. According to the table 1.4.10, Specific discharge of sediment in the 4 basins of Cañete, Chincha, Pisco and Yauca is between 60% and 75% compared with Chira. So it is assumed that Specific discharge of sediment in the other 4 basins without Chira is 75% of Chira, as shown in Table 1.24.
Table 1.23 Specific Discharge of Sediment due to Difference in Geology Basin
classification Geology Specific discharge of sediment by 1 flood
Debris flow zone Granic area 50,000~150,000m3/km2/1 flood
Volcanic ejection area 80,000~200,000m3/km2/1 flood
Tertiary area 40,000~100,000m3/km2/1 flood
Crushed zone 100,000~200,000m3/km2/1 flood
Otheir area 30,000~800,000m3/km2/1 flood
Traction Zone Granic area 45,000~60,000m3/km2/1flood
Volcanic ejection area 60,000~80,000m3/km2/1 flood
Tertiary area 40,000~50,000m3/km2/1 flood
Crushed zone 100,000~125,000m3/km2/1 flood
Otheir area 20,000~30,000m3/km2/1 flood 0.5 times is used when the watershed area is 10 times the average, when 1 / 10 can use up to 3 times. Source: JICA Study Team based on the Revised Draft Technical Standards Sediment Control of the Ministry of Construction S61
Table 1.24 Specific Discharge of Sediment in 4 Basin without Chira Basin
Slope Gradient Sediment transport volume by 50mm rainfall
0-15° 2.5m3/km2
15-35° 15.9m3/km2
35° 149.6m3/km2
Source : JICA study team
g) Bedload volume calculated from the flow volume If movable sediment is entered into the river and the possible sediment flow to the downstream by the river flow, it is possible to estimate the maximum possible sediment is discharged from the formula for sediment transport volume. The maximum movable sediment were estimated by MPM (Meyer Peter and Müller) equation that is most appropriate for mountain areas.
unnu
sgdu
be
ee
eB
4/3
2
2/3
/
/
047.08
Where τ*e :Critical traction force U*c :Critical friction velocity

The Preparatory Study on Project of the Protection of Flood Plain and Vulnerable Rural Population against Flood in the Republic of Peru
Feasibility Study Report, Supporting Report, Annex-6 Sediment Control
1-41
U* :Friction velocity Sg : Gravitational acceleration D :Average particle diameter
The conditions of the input data are as shown in Table 1.25.
Table 1.25 Input Data of each River
Input condition Cañete Chincha Pisco Yauca Camana Majes
Average grain diameter(cm)※1 1cm,10cm 3.8cm,5cm 1.2cm,3.8cm 0.9cm,6.3cm 1.3cm,6.3cm,
Density of sand gravel(σ)g/cm3 2.6 2.6 2.6 2.6 2.6
Density of water(ρ)g/cm3 1 1 1 1 1
Coeficiente de Manning (n) 0.03 0.03 0.03 0.03 0.03
Pendiente del lecho (1/I)※2 45 63 76 60 66
Ancho del rio (B)(m)※2 75 150 100 150 30 ※1 The average diameter calculation was based on the results of a research laboratory (D50) made with material taken from the riverbed. The estimation was conducted with 2 results that are all sample analysis and under 150mm sample analysis. ※2 From the results of surveying activities
Source : JICA study team
Given the conditions above, the possible sediment volume was calculated from the flow volume obtained through the hydrologic analysis (Annex-1)
Table 1.26 Sediment Volume Calculated by the Method of Flowing Soil
Basin Retern period Max
Discharge(m3/s)
Calculation result
Cañete
Grain diameter φ1cm φ10cm
The probability flow in 10 years 408 50,541 21,814
The probability flow in 25 years 822 75,016 39,466
The probability flow in 50 years 1496 111,963 67,443
The probability flow in 100 years 2175 127,615 80,635
Chincha
Grain diameter φ3.8cm φ5cm
The probability flow in 10 years 472 135,501 87,276
The probability flow in 25 years 579.6 187,323 131,099
The probability flow in 50 years 806.7 214,464 154,300
The probability flow in 100 years 916.8 270,144 203,437
Pisco
Grain diameter φ1.2cm φ3.8cm
The probability flow in 10 years 287 123,893 52,008
The probability flow in 25 years 451 171,511 88,622
The probability flow in 50 years 688 196,456 113,136
The probability flow in 100 years 855 247,655 130,429
Yauca Grain diameter φ0.9cm φ6.3cm
The probability flow in 10 years 36.5 22,238 1

The Preparatory Study on Project of the Protection of Flood Plain and Vulnerable Rural Population against Flood in the Republic of Peru
Feasibility Study Report, Supporting Report, Annex-6 Sediment Control
1-42
The probability flow in 25 years 90 44,212 4,497
The probability flow in 50 years 167 71,405 16,090
The probability flow in 100 years 263 111,523 38,267
Camana Majes
Grain diameter Φ1.3cm φ6.3cm
The probability flow in 10 years 1,166 459,173 384,896
The probability flow in 25 years 1,921 719,715 631,326
The probability flow in 50 years 2,658 943,849 846,222
The probability flow in 100 years 3,562 1,192,347 1,087,202
Source : JICA study team
(1) The Sediment Volume in each Basin
Calculated for each basin, all 3 types of sediment volume was estimated for each basin. In all basins, the order of sediment volume are Case 2, Case 1, Case 3 and Case 4, in that order. Case1: The sediment volume of sediment estimated from the flow (Grain diameter is D50 in original) Case2: The sediment volume of sediment estimated from the flow (Grain diameter is D50 in max
150mm) Case3: The sediment volume calculated by Poechosu dam specific discharge of sediment Case 4: The movable sediment volume (a) Cañete basin The sediment yield volume in Cañete basin is as shown below. The sediment volume of Case 3 is two times of the sediment volume of Case2. In Cases 1 and 2, the diameter of the particles is different about 10 times, but it is not a significant difference in the sediment volume due to abundant.

The Preparatory Study on Project of the Protection of Flood Plain and Vulnerable Rural Population against Flood in the Republic of Peru
Feasibility Study Report, Supporting Report, Annex-6 Sediment Control
1-43
0
100,000
200,000
300,000
400,000
500,000
600,000
700,000
800,000
0 20 40 60 80 100 120
Sedim
ent volume (m3)
Return Period
Case1
Case2
Case3
Source : JICA study team
Figure 1.52 Sediment Volume in Cañete Basin
Case4 : The movable sediment volume 253,743,829m3
Table 1.27 Sediment volume in Cañete basin
Reteurn perid
Case1 Case2 Case3 Case4
The sediment volume estimated
from the flow(Grain diameter is D50 in
original) φ1cm
The sediment volume estimated from the
flow(Grain diameter is D50 in max 150mm)
φ10cm
The sediment volume calculated by Poechosu
dam specific discharge of sediment
The movable sediment volume
10 76,836 39,817 459,519 253,743,830
25 143,457 93,392 536,106 253,743,830
50 223,142 159,295 612,693 253,743,830
100 296,170 224,433 689,279 253,743,830
Source : JICA study team Unit: m3
(b) Chincha basin The sediment volume in Chincha basin is as shown below. The sediment volume of Case 3 is 1.3 - 1.5times of one of Case1 and Case2. There is a difference of about 1.3 times in Case 1 and Case 2. This is consistent with the diameter of the particles due to the difference of diameter.

The Preparatory Study on Project of the Protection of Flood Plain and Vulnerable Rural Population against Flood in the Republic of Peru
Feasibility Study Report, Supporting Report, Annex-6 Sediment Control
1-44
0
50,000
100,000
150,000
200,000
250,000
300,000
350,000
0 20 40 60 80 100 120
Sedim
ent volume (m3)
Return period
Case1
Case2
Case3
Source : JICA study team
Figure 1.53 Sediment volume in Chincha Basin
Case4: The movable sediment volume 156,351,611m3
Table 1.28 Sediment volume in Chincha basin
Reteurn perid
Case1 Case2 Case3 Case4
The sediment volume estimated
from the flow(Grain diameter is D50 in original) φ3.8cm
The sediment volume estimated from the
flow(Grain diameter is D50 in max 150mm)
φ5cm
The sediment volume calculated by Poechosu
dam specific discharge of sediment
The movable sediment volume
10 135,501 87,276 216,832 156,351,611
25 187,323 131,099 252,970 156,351,611
50 214,464 154,300 289,109 156,351,611
100 270,144 203,437 325,247 156,351,611
Source : JICA study team Unit: m3
(c) Pisco Basin The production sediment volume in Pisco Basin is as shown below. The sediment volume of Case3 is about 1.5 ~ 2.0 times of case 1 and case 2. In Cases 1 and 2, the difference is about two times.

The Preparatory Study on Project of the Protection of Flood Plain and Vulnerable Rural Population against Flood in the Republic of Peru
Feasibility Study Report, Supporting Report, Annex-6 Sediment Control
1-45
0
50,000
100,000
150,000
200,000
250,000
300,000
350,000
400,000
0 20 40 60 80 100 120
Sedim
ent volume (m3)
Return period
Case1
Case2
Case3
Source : JICA study team
Figure 1.54 Sediment yield Volume in Pisco Basin
Case 4: The movable sediment volume 241,858,551m3
Table 1.29 Sediment Yield in Pisco Basin
Reteurn perid
Case1 Case2 Case3 Case4
The sediment volume estimated
from the flow(Grain diameter is D50 in original) φ1.2cm
The sediment volume estimated from the
flow(Grain diameter is D50 in max 150mm)
Φ3.8cm
The sediment volume calculated by Poechosu
dam specific discharge of sediment
The movable sediment volume
10 123,893 52,008 227,803 241,858,551
25 171,511 88,622 265,770 241,858,551
50 196,456 113,136 303,737 241,858,551
100 247,655 130,429 341,704 241,858,551
Source : JICA study team Unit: m3
(d) Yauca Basin The sediment volume in Yauca basin is as shown below. The sediment volume of Case 3 is about three – six times of the case 1 and case 2. In cases 1 and 2, the difference is about three times.

The Preparatory Study on Project of the Protection of Flood Plain and Vulnerable Rural Population against Flood in the Republic of Peru
Feasibility Study Report, Supporting Report, Annex-6 Sediment Control
1-46
0
50,000
100,000
150,000
200,000
250,000
300,000
350,000
0 20 40 60 80 100 120
Sedim
ent volume (m3)
Return period
Case1
Case2
Case3
Source : JICA study team
Figure 1.55 Sediment Volume in Yauca Basin
Case 4: The movable sediment volume 171,793,215m3
Table 1.30 Sediment volume in Yauca Basin
Reteurn perid
Case1 Case2 Case3 Case4
The sediment volume estimated
from the flow(Grain diameter is D50 in original) φ0.9cm
The sediment volume estimated from the
flow(Grain diameter is D50 in max 150mm)
Φ6.3cm
The sediment volume calculated by Poechosu
dam specific discharge of sediment
The movable sediment volume
10 22,238 1 201,568 171,793,215
25 44,212 4,497 235,162 171,793,215
50 71,405 16,090 268,757 171,793,215
100 111,523 38,267 302,352 171,793,215
Source : JICA study team Unit: m3
(e) Camana-Majes basin The sediment volume in the Camana-Majes basin is as shown below. The sediment volume of case 1, 2 and 3 is similar. This is due to large basin and much flow volume.

The Preparatory Study on Project of the Protection of Flood Plain and Vulnerable Rural Population against Flood in the Republic of Peru
Feasibility Study Report, Supporting Report, Annex-6 Sediment Control
1-47
0
200,000
400,000
600,000
800,000
1,000,000
1,200,000
1,400,000
0 20 40 60 80 100 120
Sedim
ent volume (m3)
Return period
Case1
Case2
Case3
Source : JICA study team
Figure 1.56 Sediment Volume in Yauca Basin
Case 4: The movable sediment volume 728,677693 m3
Table 1.31 Sediment Volume in Yauca Basin
Reteurn perid
Case1 Case2 Case3 Case4
The sediment volume estimated
from the flow(Grain diameter is D50 in original) φ0.9cm
The sediment volume estimated from the
flow(Grain diameter is D50 in max 150mm)
Φ6.3cm
The sediment volume calculated by Ponchos
dam specific discharge of sediment
The movable sediment volume
10 459,173 384,896 712,945 728,677,693
25 719,715 631,326 858,829 728,677,693
50 943,849 846,222 968,636 728,677,693
100 1,192,347 1,087,202 1,079,822 728,677,693
Source : JICA study team Unit: m3
(f) Sediment volume in each basin Sediment volume of four basin were calculated for each basin. It is judged that Case 1 and case 2 are best suited for sediment volume in each basin by one rainfall. In relation to the diameter of the particles, it is said that a test particle size distribution for the total material is most appropriate river to express the material properties of the river. From the above, the sediment volume in each basin is as shown in Table 1.32.
Table 1.32 Sediment Volume in each Basin Return period
Cañete basin
Chincha basin
Pisco basin
Yauca basin
Camana Majes basin
10 39,817 87,276 52,008 1 384,896
25 93,392 131,099 88,622 4,497 631,326
50 159,295 154,300 113,136 16,090 846,222
100 224,433 203,437 130,429 38,267 1,087,202
Source : JICA study team unit: m3

The Preparatory Study on Project of the Protection of Flood Plain and Vulnerable Rural Population against Flood in the Republic of Peru
Feasibility Study Report, Supporting Report, Annex-6 Sediment Control
1-48
1.5 Classification of Erodible Areas
The most erodible areas of each basin were determined from the slope gradient and riverbed inclination. First we analyzed the relation between the slope gradient and riverbed inclination for each basin. The both tendency is virtually similar, so The Classification of erodible areas in each basin were determined by riverbed inclination. The debris flow areas where riverbed inclination is larger than one third. are areas where the slope of the channel is greater than 1/3. The most erodible areas have been identified according to the classification shown in Table 1.33. The results are shown in Figure 1.57 to Figure 1.62 and Table 1.34. In Cañete and Chincha basins there are large erodible areas, while in Chira and Yauca basins erodible areas are less.
Table 1.33 Classification of Erosion Clasifi- cation Degree of erosion Conditions
A Strong erosion The length of the channel has slopes greater than one third is over 20%. B Moderate erosion The length of the channel has slopes greater than one third is between 10% and 20% C Week erosion The length of the channel has slopes greater than one third is less than 10%
Source : JICA study team
Table 1.34 Characteristics of each River Erosion
Basin A B C Total
Area (km2) Percentage Area (km2) Percentage Area (km2) Percentage Area (km2)
Chira 605 6% 2,115 20% 7,908 74% 10,628
Cañete 2,603 43% 1,702 28% 1,719 29% 6,024
Chincha 1,223 37% 590 18% 1,490 45% 3,304
Pisco 1,013 24% 893 21% 2,365 55% 4,271
Yauca 0 0% 1,385 32% 2,933 68% 4,319
Camana/Majes 2,273 13% 2,050 12% 12,726 75% 17,049
Source : JICA study team

The Preparatory Study on Project of the Protection of Flood Plain and Vulnerable Rural Population against Flood in the Republic of Peru
Feasibility Study Report, Supporting Report, Annex-6 Sediment Control
1-49
Fig
ure
1.5
7
Ero
sion
Map
in C
hira
Bas
in
Sour
ce: J
ICA
Stu
dy T
eam

The Preparatory Study on Project of the Protection of Flood Plain and Vulnerable Rural Population against Flood in the Republic of Peru
Feasibility Study Report, Supporting Report, Annex-6 Sediment Control
1-50
Figure 1.58 Erosion Map in Cañete basin
Source: JICA Study Team

The Preparatory Study on Project of the Protection of Flood Plain and Vulnerable Rural Population against Flood in the Republic of Peru
Feasibility Study Report, Supporting Report, Annex-6 Sediment Control
1-51
Fig
ure
1.5
9
Ero
sion
Map
in C
hinc
ha b
asin
So
urce
: JIC
A S
tudy
Tea
m

The Preparatory Study on Project of the Protection of Flood Plain and Vulnerable Rural Population against Flood in the Republic of Peru
Feasibility Study Report, Supporting Report, Annex-6 Sediment Control
1-52
Fig
ure
1.6
0
Ero
sion
Map
in P
isco
Bas
in
Sour
ce: J
ICA
Stu
dy T
eam

The Preparatory Study on Project of the Protection of Flood Plain and Vulnerable Rural Population against Flood in the Republic of Peru
Feasibility Study Report, Supporting Report, Annex-6 Sediment Control
1-53
Figure 1.61 Erosion Map in Yauca Basin Source: JICA Study Team

The Preparatory Study on Project of the Protection of Flood Plain and Vulnerable Rural Population against Flood in the Republic of Peru
Feasibility Study Report, Supporting Report, Annex-6 Sediment Control
1-54
Fig
ure
1.6
2
Eros
ion
Map
in C
aman
a-M
ajes
Bas
in
Sour
ce: J
ICA
Stu
dy T
eam

The Preparatory Study on Project of the Protection of Flood Plain and Vulnerable Rural Population against Flood in the Republic of Peru
Feasibility Study Report, Supporting Report, Annex-6 Sediment Control
2-1
CHAPTER 2 SEDIMENT CONTROL PLAN
2.1 Basic policy Basic Policy is below: (1) Relationship of Rainfall and Sediment Transport
Sediment transport in lower rainfall rather than with return period of 50 years are caused by erosion of the banks and riverbed evolutions (regular year).
The sediment production from the slopes and debris flows occur in exceptional years by rainfall like El Niño, with a return period of 50 years.
(2) Countermeasures for Ordinary years It is efficient countermeasures that revetment works that prevent the bank erosion, Groundsel and Bed hill that control riverbed evaluation. It is possible to control sediment discharge that flow in ordinary years by settlement of riverbank and riverbed. Control regulation of outflow and sediment control by training dike and revetment work should be conducted in the alluvial fans. Also sediment control for downstream should be conducted by settlement flow path that caused by the Groundsel, Bed hill and stream prevention works, and decrease of flow rate (3) Countermeasures for Rainfall Return Period of 50 years As countermeasures for rainfall with return period of 50 years, sediment control in the flood season by the check dams that allocated in the erodible areas should be conducted. It is effectual Is more effective to implementation by two methods. (a) Control of Sediment Production In flood season, Slope failure that composed by weathered soil occurs by the rainfall. So due to the prevention of slope failure Conservation works on the hillside should be mainly implemented and due to determent of sediment discharge transected structure that settle riverbed should be mainly implemented. (b) Acquisition and control of sediment Sediment discharge to the downstream should be prevented by settlement of riverbed and acquisition of sediment discharge by construction of dams in the valley.
Table 2.1 Components of Sediment Control Condition Ordinary years Rainfall with return period of 50 years
Condition of Sediment Flow
Bank erosion and riverbed evolution Bank erosion and riverbed evolution Debris Flow from small valley
Countermeasures
Erosion control: Revetment works Prevention of riverbed evolution : Groundsel, Bed hill
Erosion control: Revetment works Prevention of riverbed evolution: Groundsel, Bed hill Prevention for debris flow: Check dam
Source: JICA Study Team

The Preparatory Study on Project of the Protection of Flood Plain and Vulnerable Rural Population against Flood in the Republic of Peru
Feasibility Study Report, Supporting Report, Annex-6 Sediment Control
2-2
2.2 Component of Sediment Control
(1) Sediment Control Countermeasures
The control of sediment discharge to downstream that keep the river cross section enable the flood control. The countermeasures for sediment control shown in Figure 2.1 enable sediment control.
Check dam
technical hillside works
sand pocket
stream preservation works
groundsel
bed sill
bed sill
groundsel
works for catching driftwood
technical hillside works
stream preservation works
Groyne works
Figure 2.1 Concept of the Sediment Control
Source: JICA Study Team
Countermeasures against sediment control are classified as production facilities for sediment control and sediment control in accordance with the objectives. Table 2.2, shows each target and the type of work.
Table 2.2 Classification of Countermeasures against Sediment Control
Works of sediment product control They are works which protect mountain slope, river bank and river bed to reduce sediment product in generation source.
Conservation works on the hillside Planting works on the hillside Technical hillside works Check dam
Groundsel
Bed hill
Revetment works
Stream prevention works
Works of sediment flow control They are works which control the sediment that rundown in traction area
Check dam
Groundsel
Bed hill
Groyne works
Revetment work
Sand pocket
Stream preservation works
Training dike
Source: JICA Study Team

The Preparatory Study on Project of the Protection of Flood Plain and Vulnerable Rural Population against Flood in the Republic of Peru
Feasibility Study Report, Supporting Report, Annex-6 Sediment Control
2-3
(a) Works of sediment product control Works of sediment product control are works that protect mountain slope, river bank and river bed to reduce sediment product in generation source. (2) Conservation Works on the Hillside Works of sediment product control are classified into three below. The purpose of this works is to control sediment production by implementation of these works independently or in combination.
a) The technical hillside works are that stabilize slopes and prevent erosion on the slopes. b) The hillside seeing is that installation of vegetation mitigating the surface erosion and
surface slope failure in the slope failures and devastated areas. c) Reinforced earth methods are that reinforce the slopes by the construction of concrete
retaining walls and rock bolts. The technical hillside works are works that stabilize the slope after the cutting and prevent surface erosion due to rainfall by construction of drainage of mountain areas. Also this function is helpful for invitation of vegetation Figure 2.2 shows typical countermeasures.
Figure 2.2 Typical Structures of Technical Hillside Works
The hillside seeing are works that prevention of erosion and weathering of surface, and recover the vegetation by the installation of the vegetation directly. The hillside seeing seldom grows until prospective figure by the initial construction. So the soils are improved by the installation of an indigenous plant and function of prevention is upgraded gradually. Figure 2.3 shows typical countermeasures.
Hillside seeding
Stepped dam
Covering works
Lelicopter seeding
Planting works
Fence works, Terracing worksSimple terracing works, Terracing with stone, Brushwoods
Figure 2.3 Typical Structures of Hillside Seeding

The Preparatory Study on Project of the Protection of Flood Plain and Vulnerable Rural Population against Flood in the Republic of Peru
Feasibility Study Report, Supporting Report, Annex-6 Sediment Control
2-4
(3) Check dams The purpose of sediment control dams classified sediment product control is below:
a) Prevention and mitigation of the spread and occurrence of slope failure due to settlement foot of the slope
b) Prevention and mitigation erosion of the riverbed length c) Prevention and mitigation sediment discharge on the riverbed.
In the plan, dimensions suited to the purpose of the allocation of the dams should be selected. Allocations of the check dams should be determined in condition of expected effect for check dams ,the topography, geology and sediment condition. Allocation of the check dams should be determined below: The check dams are allocated at downstream of anticipated place of slope failures The check dams are allocated at downstream of areas with longitudinal erosion The check dams are allocated at downstream of areas with unstable sediment on the river bed. (4) Groundsel Groundsel have the purpose that prevention and mitigation bank erosion and slope failure and stabilization the sediment on the riverbed due to removal of the sediment. Also They have the function to protect the base of revetment. Allocation of Groundsel should be planned in consideration with below: The place that erosion of the bed The purpose is to protect the foot of the structure, downstream of the works In erodible, landslides and slope failure areas, the location should be downstream of their
areas.
(5) Bed hill They have the purposes that prevent erosion, stabilize the riverbed and regulate the flow. The difference between Bed hill and Groundsel is presence or absence of drop. Bed hill do not have the drop and do not have function of mitigation for gradient. (6) Revetment works The Revetment works have the purpose that prevent bank erosion and slope failure. These works should be located at the area needed the protection for erosion and the settlement of the foot of slope, and where there is a high possibility of the landslide and slope failures.
(a) Stream prevention works Stream prevention works have the purposes that prevent the bank erosion and slope failure due to control of water flow and the riverbed gradient. Stream prevention works consists of combination of Groundsel Bed hill, Revetment works and Groyne works. Stream prevention works should be planned to conserve the landscapes and ecosystems.

The Preparatory Study on Project of the Protection of Flood Plain and Vulnerable Rural Population against Flood in the Republic of Peru
Feasibility Study Report, Supporting Report, Annex-6 Sediment Control
2-5
(b) Works control sediment transport Works control sediment transport have the purpose that control the sediment discharge in the traction areas. (7) Check dam The check dams as Works control sediment transport have the purpose as below:
Control and regulation of sediment discharge Acquisition and mitigation of debris flows
There are two types that are open type and closed type. For planning, types of the check dam, dimensions and structures should be selected with consideration for the purpose of the check dam. The allocation of check dams as Works control sediment transport should be planned at the area where is narrowed area that have wide areas in upper stream and confluence. (8) Groyne works Groyne works are structures to prevent bank erosion and slope failure by control of flow and fixation of the river. They have the functions to protect the revetment works by sedimentation on the base of revetments. Groyne works should be planned at downstream areas of mountain streams and turbulent flow areas in alluvial fan. (9) Sand pockets Sand pockets are structures to control the bed load by widening the valley and turning down the flow rate. Sand pockets are planned that have the place to sedimentation around the downstream. (10) Training dike Training dikes are the structures that guide the debris flows to the safety areas not to do harm the object to be conserved. The debris flows should be acquired at the upper stream. If it is difficult to acquire the debris flows and there are the spaces for sedimentation of debris flows safety, Training dike can be planed. Training dikes are principally artificially-excavated types. And Training dikes have the check dam and sand pocket for acquit ion of the debris flows. If it is difficult to take on the artificially-excavated type, training dike can be planned for guide the debris flows. The applicability of these measures for this project is as shown in Table 2.3.

The Preparatory Study on Project of the Protection of Flood Plain and Vulnerable Rural Population against Flood in the Republic of Peru
Feasibility Study Report, Supporting Report, Annex-6 Sediment Control
2-6
Table 2.3 Applicability of Sediment Control Measures in the this Study Area
Works of sediment product control determination
Conservation works on the hillside
In the study area, there are not water and it is difficult to grow the vegetation. For water supply, huge irrigation facilities are needed. Therefore, this is not an appropriate measure.
×
Check dam These have effects for sediment control. But only after sedimentation, they produce effects. So it takes too long for production effects. △
Groundsel These have effects for sediment control. However, effects are limited in the production area. △
Bed hill These have effects for sediment control. However, effects are limited in the production area. △
Revetment works These have effects for sediment control. However, effects are limited in the production area. △
Stream prevention works
These have few effects for sediment control. Effects are limited in the production area. △
Works of sediment flow control determinationCheck dam These have effects for debris flow. ○
Groundsel These have effects for sediment control and are suitable. ○
Bed hill These have effects for sediment control and are suitable. ○
Groyne works These have effects for sediment control. but location areas are limited. ○ Revetment works These have effects for sediment control and are suitable for this project. ○ Sand pocket These have effects for sediment control and are suitable in the alluvial fans. ○ Stream preservation works These have effects for sediment control. but location areas are limited. ○
Training dike It is inappropriate because debris flows do not occur in the alluvial fans. × Source: JICA Study Team
2.3 Quantity and cost for sediment control in this project
Outline designs of revetment works, bed hill and check dams. The plan of location and drawing of the check dams are attached in appendix.
(1) Reventment works and Bed hill
(a) Revetment works The revetment works are planned at the area where Cenozoic sediment distribute. And approximate quantity and cost are estimated. (Refer to Table 2.4). Figure 2.4 shows the cross section of revetment works. Also Figure 2.7 to Figure 2.12 show the plan of location.
Source: JICA Study Team
Figure 2.4 Cross Section of Revetment Works

The Preparatory Study on Project of the Protection of Flood Plain and Vulnerable Rural Population against Flood in the Republic of Peru
Feasibility Study Report, Supporting Report, Annex-6 Sediment Control
2-7
Table 2.4 Approximate Quantity and Cost of Revetment Works
(b) Bed hill The bed hills are planed every 5km. Approximate quantity and cost of Bed hills are estimated. (refer to Table 2.5). The dimensions of the Bed hill are as follows: Length 40m, Height 3m, Width 0.5m and Volume60m3. (Refer to Figure 2.5).
Figure 2.5 Cross section of Bed sill
Source:JICA study team
Table 2.5 Estimated cost of bed girdles
(2) Check dams
(a) Estimation of design sediment volume The conditions for estimation the sediment volume is as shown in Table 2.6.
Table 2.6 Estimation conditions for sediment volume Item Conditions
Design Specifications Output third-order basin Layout Size Rainfall with return period of 50 years
Calculation for each small watershed (estimated by the hydrology specialist) Design sediment volume
Sediment Volume can be transported It is clear that movable sediment volume is larger than Sediment Volume can be transported.
Source: JICA study team
(b) Estimation of sediment volume can be transported Sediment volume can be transported by the design debris flow is estimated by equation below:
Where; Vdy2 : Sediment volume can be transported by the design debris flow (m3) PP : Design volume of precipitation (rainfall with return period of 50 years) A : Watershed area (km2) Kv : Porosity (= 0.4) Cd : Density of debris flows Kf2 : Discharge coefficient correction
0.05・(log A-2.0)2+0.05 〔Kf2:Threshold 0.1 Celling 0.5〕

The Preparatory Study on Project of the Protection of Flood Plain and Vulnerable Rural Population against Flood in the Republic of Peru
Feasibility Study Report, Supporting Report, Annex-6 Sediment Control
2-8
Source: Basic Methodology Guide Project Planning Sediment Control
Figure 2.6 Outflow Correction Factor
Density of debris flows (Cd) is estimated by the equation below.
Where;
Cd : Density of debris flows〔If Cd≧0.9C*is Cd=0.9C* and If Cd≦ 0.3 is Cd=0.3〕 C* : Density of the sediment on the river bed(=0.6) σ : Density of the gravel (2,600kg/m3 ) ρ : Density of the water (1,200kg/m3) Cd : Internal friction angle (°)〔Generally 35°〕 θ : Riverbed inclination (°) Inclination is measured by GIS
(c) Plan of location of check dams Detentions and quality of check dams needed for estimated sediment volume are estimated. Meanwhile, it is prerequisite that the sedimentation in the check dams are taken away. Regulation of rivers for sedimentation are calculated on ten % of all. And it is without target that inclination of riverbed is under two degrees. Sediment volume of one check dam is estimated by equation below. In Camana Majes rivers only classification of erosion A and B (Refer to Table 1.33) is target. Because catchment area is large and landform of upper stream is gentle.
Sediment volume =W・H・H・N
Where: W : Average width of sediment H : height of check damt 1/N : Riverbed inclination sediment length L=H・N
(d) Estimation of the approximate cost It is assumed that the check dams are constructed by concrete, volume of concrete are estimated, and the approximate cost are estimated.(Refer to Table 2.7) And classification of erosion are conducted, two it is estimated for two cases. One case is target for all area and Two case is target for erodible area. Plans of location are as shown in Figure 2.7 to Figure 2.12. It is assumed that Secondary dam and apron protection are not planed. If they are planed, the approximate cost is 1.5
Horizontal axis: The basin area (km2)
Vertical axis: Discharge coefficient

The Preparatory Study on Project of the Protection of Flood Plain and Vulnerable Rural Population against Flood in the Republic of Peru
Feasibility Study Report, Supporting Report, Annex-6 Sediment Control
2-9
times. Temporary works such as temporary road are not planed.
Table 2.7 Quality and the Approximate Costs of Check Dams
Table 2.8 Production Sediment Volume and Plan of the Check Dams in Chira Basin
Table 2.9 Production Sediment Volume and Plan of the Check Dams in Cañete Basin
Table 2.10 Production Sediment Volume and Plan of the Check Dams in Chincha Basin
Table 2.11 Production Sediment Volume and Plan of the Check Dams in Pisco Basin
Table 2.12 Production Sediment Volume and Plan of the Check Dams in Yauca Basin
Table 2.13 Production Sediment Volume and Plan of the Check Dams in Camana-Majes Basin

The Preparatory Study on Project of the Protection of Flood Plain and Vulnerable Rural Population against Flood in the Republic of Peru
Feasibility Study Report, Supporting Report, Annex-6 Sediment Control
2-10
Fig
ure
2.7
P
lan
of C
ount
erm
easu
re W
orks
in th
e C
hira
Bas
in
Sour
ce: J
ICA
Stu
dy T
eam

The Preparatory Study on Project of the Protection of Flood Plain and Vulnerable Rural Population against Flood in the Republic of Peru
Feasibility Study Report, Supporting Report, Annex-6 Sediment Control
2-11
Fig
ure
2.8
P
lan
of C
ount
erm
easu
re w
orks
in th
e C
añet
e B
asin
Sour
ce: J
ICA
Stu
dy T
eam

The Preparatory Study on Project of the Protection of Flood Plain and Vulnerable Rural Population against Flood in the Republic of Peru
Feasibility Study Report, Supporting Report, Annex-6 Sediment Control
2-12
Fig
ure
2.9
P
lan
of c
ount
erm
easu
re w
orks
in th
e C
hinc
ha B
asin
So
urce
: JIC
A S
tudy
Tea
m

The Preparatory Study on Project of the Protection of Flood Plain and Vulnerable Rural Population against Flood in the Republic of Peru
Feasibility Study Report, Supporting Report, Annex-6 Sediment Control
2-13
Fig
ure
2.1
0
Plan
of C
ount
erm
easu
re W
orks
in th
e Pi
sco
Basi
n
Sour
ce: J
ICA
Stu
dy T
eam

The Preparatory Study on Project of the Protection of Flood Plain and Vulnerable Rural Population against Flood in the Republic of Peru
Feasibility Study Report, Supporting Report, Annex-6 Sediment Control
2-14
Fig
ure
2.1
1
Plan
of c
ount
erm
easu
re w
orks
in th
e ba
sin
Yaur
a
Sour
ce: J
ICA
Stu
dy T
eam

The Preparatory Study on Project of the Protection of Flood Plain and Vulnerable Rural Population against Flood in the Republic of Peru
Feasibility Study Report, Supporting Report, Annex-6 Sediment Control
2-15
Fig
ure
2.1
2
Plan
of c
ount
erm
easu
re w
orks
in th
e C
aman
a M
ajes
Bas
in
Sour
ce: J
ICA
Stu
dy T
eam

The Preparatory Study on Project of the Protection of Flood Plain and Vulnerable Rural Population against Flood in the Republic of Peru
Feasibility Study Report, Supporting Report, Annex-6 Sediment Control
2-16
(3) Sediment Countermeasure in the alluvial fan
It is clear that sediment control works for the all basin need huge investment costs. So it was considered that sediment control works which covers only the alluvial fan. In this process, the results of the analysis of variation of riverbed that are conducted in this study are considered.
(a) Results of the analysis of variation of riverbed Table 2.14 and Figure2.13 shows t Results of the analysis of variation of riverbed. According to these results, sedimentation in Chincha, Canete, Pisco and Camana&Majes is high. In these rivers sediment control works in alluvial fans should be planned in alluvial fans. However sediment disaster occur gustily and locally, so countermeasure for keeping the river channels suited for monitoring of river variation should be planned for a total extent of the rivers. In Canete basin the Plantanal dam, which is electric-generating dam, were constructed last year (Refer to Figure 2.14). Due to the small reservoir capacity, the dam will be filled with sediment soon, but the control function of sediment will be keeping up. Due to this function, inpact of sediment to the river will be estimate to be diminished.
The total income sediment volume and of sediment carried to the total amount of variation in bed are higher in rivers Chincha and Pisco, Cañete and compared with Yauca. Consequently, the volume of bed variation is also high in Chincha and Pisco rivers.
It was estimated that the average height of the riverbed in 50 years will be high in all four rivers except the Chira basin. In particular, the average height of the riverbed in the Chincha basin is 0.5 meters relatively high.
Table 2.14 Results of Analysis of the Variation in Bed
Basin Total income
sediment volume(Mil m3)
Total variation volume variation(Mil m3)
Average height variation of bed
(m)
Interval length(km)
Chira (Total) 5,000 -1,648 -0.01 49 Cañete 3,263 673 0.3 32
Chincha(Chico) 5,759 1,131 0.4 24
Chincha(Matagente) 1,479 0.5 25 Pisco 8,658 2,571 0.2 45 Yauca 1,192 685 0.1 46
Camana Majes 20,956 5,316 0.2 120 ※ 1:Caluculation periods is 50 years Source: Annex 3

The Preparatory Study on Project of the Protection of Flood Plain and Vulnerable Rural Population against Flood in the Republic of Peru
Feasibility Study Report, Supporting Report, Annex-6 Sediment Control
2-17
-4000
0
4000
8000
12000
16000
20000
24000
Chira Cañete Chincha Pisco Yauca Camaná-Majes
Sedi
ment vo
lum
e (m
il m
3 )
Total sediment inflow volume(mil m3)
Total variation of riverbed (mil m3)
Source:JICA study Team
Figure 2.13 Results of Riverbed Analysis
Figure 2.14 Location Map of Plantanal Dam
Plantanal dam Height of dam:35.7m Purpose:Electrical production Reservoir capacity:0.8MMC Catchment area:3,280km2 Completion:Sep 2009

The Preparatory Study on Project of the Protection of Flood Plain and Vulnerable Rural Population against Flood in the Republic of Peru
Feasibility Study Report, Supporting Report, Annex-6 Sediment Control
2-18
(b) Sediment Control Works in the alluvial fan As sediment control works in the alluvial fan, there are Sand pocket, groundsel, bed hills, groyne works and Stream preservation works that combinate with them. There are function for not only sedimentation works but also river structure. The river structures that planed in this study, in Pisco basin flood control basin is planned at the 34.5K, Flood control basin have function of sand pocket. Also in Chincha basin diversion weir is planned. This diversion weir have channel works and training levee that have function to control the sediment. In the Camana Majes basin, There are river width area with narrowed areas in the upper stream that width is 600m at the 107K. This area have the function of sand pocket. So removal of stone in this area enable to keep the function to control the sediment. These works are economical and investment effect of them is high. If the cost of stone removal are calculated on, it is judged that these structures have higher investment effects by far than the works targeted for all basin. In the Pisoco and Chincha basin, the river structures are plan that have the function to control the sediment, approach route for stone removal and space for O&M should be planned. 2.4 Problems for Implementation of Sediment Control Plan
Problems for implementation of sediment control plan are below. (1) Project Schedule and Project Costs Every one of the basin in this project is varsity, if revetment woks and Check dams would be implemented, the project need not only construction costs but also periods until project completion. So it is supposed that a great deal of time are taken until project effect would present itself. In addition, the frequency of debris flows in the upper streams is 1 per 50 years, in consideration of this matters, it is supposed that economic effects of the check dams are lower.
Table 2.15 Construction Cost in Each Basin
(a) Population in the mountainous area The population in the mountainous area that are directly object to be conserved from debris flows are researched. The population in the mountainous area are few and it is clear that economic effects at the view of sediment control that are radical function for sediment control works.
1) Population in intermediate and mountainous area The population in the mountainous area in this project are as shown in Table 2.16. Without Yauca and Chira basin, the population in the mountain area is smaller than the population in the alluvial fans. The population density in the mountains is quite few, less than a ten peoples per one km2. The objects to be conserved in the mountain areas are few, and Cost-benefit performance of the sediment control works is low.

The Preparatory Study on Project of the Protection of Flood Plain and Vulnerable Rural Population against Flood in the Republic of Peru
Feasibility Study Report, Supporting Report, Annex-6 Sediment Control
2-19
Table 2.16 Population in the Mountains and on the Alluvial Fans Basin Area Mountain area Alluvial fan Total
Chira Population(persons) 116,716 3,975 120,691 Area (km2) 337,766 668,339 1,006,105 Population density (persons/km2) 0.35 0.01 0.12
Cañete Population(persons) 29,987 50,133 80,120 Area (km2) 5,939 110 6,049 Population density (persons/km2) 5.05 455.84 13.24
Chincha Population(persons) 12,665 83,602 96,267 Area (km2) 3,140 165 3,304 Population density (persons/km2) 4 507 29
Pisco Population(persons) 18,269 84,220 102,489 Area (km2) 3,907 367 4,274 Population density (persons/km2) 5 230 24
Yauca Population(persons) 26,253 3,171 29,424 Area (km2) 4,053 269 4,323 Population density (persons/km2) 6.48 11.77 6.81
Camana Majes
Population(persons) 47,764 41,517 89,281
Area (km2) 12,403.14 4,646.37 17,049.51
Population density (persons/km2) 3.85 8.93 5.23
Source: JICA Study Team based on data from the INEI (2007)
2) Process of the population The process of the population and agricultural population in the study areas are as shown in Figure
2.15 and Table 2.16. In four area without Chira basin, agricultural population decrease. In Chira basin, climate condition and landform are favored by comparison with other four basin and agriculture is main industry and agricultural populations increase. On the other hand in four basin climate condition and landform are severe, agricultural populations decrease. Especially decrease of the agricultural population in the mountainous area are continuing. So directly objects to be conserved from debris flows are decrease, Cost-benefit performance of the sediment control works becomes lower.
0
0.5
1
1.5
2
2.5
3
3.5
4
4.5
1,961 1972 1981 1993 2007
Change
rate (base1961)
Arequipa
Ica
Lima
Piura
Total general
Source: JICA Study Team based on census data
Figure 2.15 Process of the Provinces Population in each Relevant Pref

The Preparatory Study on Project of the Protection of Flood Plain and Vulnerable Rural Population against Flood in the Republic of Peru
Feasibility Study Report, Supporting Report, Annex-6 Sediment Control
2-20
0.4
0.5
0.6
0.7
0.8
0.9
1
1.1
1.2
1.3
1961 1972 1981 1993 2007
Change
rate(Base1961)
Arequipa
Ica
Lima
Piura
Total general
Source: JICA Study Team based on census data
Figure 2.16 Process of the Rural Population in the Relevant Pref
(2) Land acquisition
The revetment works are structure in the river and land acquisition is not required. However check dam need the land acquisition. Land Expropriation Act (Law No. 27117) (Ley General de Expropiaciones (Ley No. 27117) set down proceeding of expropriation in the Public works. We must obey this law. Before implementation of new project, the contents of the project should be applied for Ministry of the Environment (Ministerio de Ambiente, Sevicio Nacional de Areas Naturales Protegidas por el Estado), it must be confirmed that there are no natural reserve in the project site. Natural protection is classified by manager, that is National management, Regional Government management and Private and Company Management as shown in Table 2.17. In the Natural protection of National management, Prohibited matter are established.(Refer to Table 2.18) In this study area there are only National forests in the downstream of Canete and there is no Natural protection that regulate the project implementation. Many digs are dotted about in the Peru. For this reason, before implementation certification of no digs (Certificación de Inexistente de Restos Arqueológicos: CIRA) must be taken out in the Ministry of the culture(Comision Nacional Tecnica de Arqueologia).
Table 2.17 Classification of Environmental Protective Areas
ANP National management (Sistema Nacional de Areas NaturalesProtegidas-SINANPE)
ACR Regional Government management (Management by Regional Government and Provincial Government)
ACP Private and Company Management (After coordination with MINAM / MINAG)
Table 2.18 Prohibited matters in Environmental Protective Areas
Name Characteristics Prohibited Matter Indirect Utilization National Parks Protection area of diverse ecosystems Immigration and extraction of
resources for commercial

The Preparatory Study on Project of the Protection of Flood Plain and Vulnerable Rural Population against Flood in the Republic of Peru
Feasibility Study Report, Supporting Report, Annex-6 Sediment Control
2-21
Area purposes
National Shrines
Protection zone of specific flora and fauna. It allowed the collection of the flora and fauna that is used to maintain the life of the people who lived from the beginning.
Immigration and extraction of resources for commercial purposes
Historical Shrines
Areas where cultural heritage, also have areas that are valuable in the aspect of nature.
Immigration and extraction of resources for commercial purposes
Direct Utilization Area
National protective zone
Protection zones of Ecosystem and forest areas. Deforestation is prohibited. However, gathering plants and hunting animals are allowed (including commercial use) provided to ensure the sustainability of species. (according to in Ministry of Environment)
Immigration
Protection zones of Landscapes
Protection zones of Landscapes. If you want to exploit the resources must seek permission from the Ministry of Environment. According to the zoning in Ministry of Environment is possible to immigrate.
Extraction of resources without
permission of the Ministry of
Environment.
Protection zones for specific flora and fauna
Protection zones for specific flora and fauna. The exploitation of flora and fauna that is not included in specific can be done provided with the regulations of the Ministry of Environment. (including commercial use)
Immigration and extraction of resources for commercial purposes
Communities protective zone
Protection of areas inhabited by indigenous people. Priority permission for the extraction of resources necessary for the survival of purple. Extraction for non-residents are also allowed provided it is in accordance with the regulations in the Ministry of Environment.
Immigration and extraction of resources for commercial purposes
National forests
Group of trees that serve to prevent erosion on river banks and hilly areas.
Immigration and extraction of resources for commercial purposes
Game area Hunting is only permitted with permission by the Ministry of Environment.
Immigration and extraction of resources for commercial purposes
Investigation Area
protective zone (ZR)
Research areas that would be recorded, areas under the research for extensions and classification
(3) Sediment control in this project Cost for sediment control plan for all basin is expensive, in addition project need long term periods. So it is clear that it would take long time before effective appearance and cost-benefit performance is low. Main purpose in this project is mitigation of the flood disaster. With the view to this purpose, it is judged that sediment control works in the alluvial fans is most effective. It is judged that implementation of the river structures that have the functions of sediment control in Chincha and Pisco basin that have a profound effect of the sedimentation would be most effective. (4) Schedule of project implementation The schedule should follow the components of river structures (Refer to the annex of river structures). 2.5 Recommendations (1) Measures for the structures Cost for sediment control plan in the mountainous area is expensive, in addition project need long term periods. There are no objects to be conserved in the mountainous area, so cost-benefit

The Preparatory Study on Project of the Protection of Flood Plain and Vulnerable Rural Population against Flood in the Republic of Peru
Feasibility Study Report, Supporting Report, Annex-6 Sediment Control
2-22
performance is low. Main purpose in this project is mitigation of the flood disaster. With the view to this purpose, it is judged that sediment control works in the alluvial fans is most effective. It is judged that implementation of the river structures that have the functions of sediment control in Chincha and Pisco basin that have a profound effect of the sedimentation would be most effective. (2) Formulation of the monitoring system for the behavior of the river channel and
sedimentation. To manage the optimal preservation method of river channel, river channel change in the tandem with rainfall should be figured out. The understanding of the river channel change clarify the places needed for countermeasures and O&M terms and frequency. The understanding of the river channel change enable optimal preservation method of river channel. Currently Formulation of the monitoring system for the behavior of the river channel and sedimentation is not established, actual rivet channel change are not figure out. For this reason Formulation of the monitoring system for the behavior of the river channel and sedimentation should be established, periodic the river cross section survey should be conducted and river channel change in the tandem with rainfall should be figure out. (3) Climate change The design sediment volume are be proportionate to rainfall. So rainfall increased the sediment volume increase, the numbers of the check dams increase and project cost increase. Rain fall volume depend on Climate Change Prediction, so precision Climate Change Prediction should be required. (4) Non-structural measures Despite being distinct from the project purpose, in Peru sediment disasters have occurred frequently. So Non-structural measures to mitigate the sediment disasters below would be suggested. These Non structural measures are more economical than structural measures and have function to prevent the human life and minimum property from the sediment disaster. Regulation of agricultural areas and residential areas Setting the alert rainfall for each region and establishment early warning Systems. Collect sample of sediment disaster and raise awareness of disaster prevention through
education and patrimony of disaster prevention
1) Legislation In Peru, except in urban areas, there are no large towns near mountain stream or in the exits of mountain stream. And rainfall is little, also direct damages due to sediment disaster are few. From the point of view of heritage protection, it is necessary to regulate cultivation in disaster-prone area. 2) Rainfall observation and configuration of caution rainfall, establishment an early
warning system In Peru there is few precipitation station, it is difficult to establish early warning System by rainfall

The Preparatory Study on Project of the Protection of Flood Plain and Vulnerable Rural Population against Flood in the Republic of Peru
Feasibility Study Report, Supporting Report, Annex-6 Sediment Control
2-23
gauges. However, it is possible to establish an early warning system using radar rain gauge system (RRGS) that cover wide areas. RRGS are effective against flood alert as well. However due to the topography is steep, it is necessary to carefully evaluate to install. 3) To raise awareness of disaster prevention through education and patrimony Table 2.5.1 shows the occurrence of disasters during the period 1995-2010 in Peru. During the period 1997-2002 occurred several floods and sediment disasters. It is necessary to raise awareness about disaster prevention, building on past experiences as lessons to be learned.
Table 2.19 Number of Disasters in Peru (sediment disasters, floods)
year type Total Total of 4 districts Arequipa Ica Lima Piura
1995 sediment disasters 51 15 6 2 7 0
floods 30 9 3 4 2 0
1996 sediment disasters 38 6 2 0 3 1
floods 53 7 1 4 2 0
1997 sediment disasters 74 12 7 2 3 0
floods 224 48 42 0 1 5
1998 sediment disasters 182 39 15 0 21 3
floods 358 93 6 13 23 51
1999 sediment disasters 89 28 4 5 19 0
floods 292 88 44 14 21 9
2,000 sediment disasters 131 13 5 2 5 1
floods 208 15 2 1 9 3
2001 sediment disasters 116 15 6 0 5 4
floods 239 37 15 2 15 5
2002 sediment disasters 64 18 2 0 15 1
floods 136 22 3 0 5 14
2003 sediment disasters 265 45 4 2 27 12
floods 470 17 1 0 13 3
2004 sediment disasters 175 19 3 3 12 1
floods 234 19 2 1 11 5
2005 sediment disasters 223 36 11 3 19 3
floods 134 16 2 1 7 6
2006 sediment disasters 396 53 4 1 40 8
floods 348 27 3 0 10 14
2007 sediment disasters 248 29 1 3 20 5
floods 272 23 0 4 11 8
2008 sediment disasters 251 40 0 2 30 8
floods 242 33 1 6 4 22
2009 sediment disasters 285 30 10 0 15 5
floods 219 8 3 1 4 0
2010 sediment disasters 258 44 7 1 33 3
floods 229 4 3 0 0 1 Blank cells no information
Source: Compiled by JICA Study Team based on data from INDECI
