final report hbl market effects study -...
TRANSCRIPT

Experience you can trust.
Final Report
HBL Market Effects Study
Project 1A New Construction
Market Characterization
Massachusetts Energy Efficiency Programs’
Large Commercial & Industrial Evaluation
Prepared for: Massachusetts Energy Efficiency Program Administrators
Submitted to: National Grid
Burlington, Massachusetts, June 7, 2011

Experience you can trust.
Copyright © 2011, KEMA, Inc.
Page | i
1. Executive Summary ................................................................................................................. 1
1.1 Introduction to Market Effects Research ....................................................................... 1
1.2 Approach ........................................................................................................................ 3
1.2.1 Limitations to the Approach .................................................................................... 6
1.3 Key findings .................................................................................................................... 8
1.3.1 Modeled market effects results ............................................................................... 8
1.3.2 Additional evidence of market effects results ....................................................... 12
2. Introduction ............................................................................................................................ 16
2.1 Research objective and questions ............................................................................... 16
2.2 Overview of study ......................................................................................................... 18
2.2.1 Analytical framework ............................................................................................. 18
2.2.2 Data elements ....................................................................................................... 19
2.3 Organization of report .................................................................................................. 22
3. Methodology .......................................................................................................................... 23
3.1 Study data .................................................................................................................... 23
3.1.1 Primary research data .......................................................................................... 23
3.1.2 Comparison area data .......................................................................................... 30
3.1.3 Secondary data ..................................................................................................... 30
3.1.4 Program tracking data .......................................................................................... 31
3.2 Market effects model .................................................................................................... 31
3.3 Market effects model calculations................................................................................ 34
4. Results ................................................................................................................................... 36
4.1 Market effects model results ........................................................................................ 36
4.1.1 Estimation of Market Size ..................................................................................... 36
4.1.2 Lighting requirements of HBL purchases ............................................................. 38
4.1.3 Estimation of Technology Shares and Wattage Installed .................................... 40
4.1.4 Estimation of Demand and Energy Use Reductions: Massachusetts and the
Comparison Area ........................................................................................................... 43
4.1.5 Savings ―Outside the Program‖ and Attribution to Program Effects .................... 44

Page | ii
4.1.6 Addressing uncertainty in high bay space and purchase assumptions ............... 46
4.2 Preponderance of evidence of market effects results ................................................. 47
4.2.1 Research Question 1: Have HBL energy efficiency measures resulted in
increased energy efficient HBL installations? ............................................................... 48
4.2.2 Research Question 2: Have HBL energy efficiency programs resulted in
increased knowledge and awareness of energy efficient HBL technologies? ............. 53
4.2.3 Research Question 3: Have HBL energy efficiency programs resulted greater
marketing and promotional activity of energy efficient HBL technologies by market
actors?............................................................................................................................ 55
4.2.4 Research Question 4: Have market barriers either impeded the effectiveness of,
or been reduced by energy efficient HBL programs? ................................................... 59
4.3 Spillover effects ............................................................................................................ 66
5. Conclusions ........................................................................................................................... 70
5.1 Overview ...................................................................................................................... 70
5.2 Key Findings................................................................................................................. 71
5.2.1 Quantitative Estimate of Total Energy Savings from Accelerated Adoption of
Efficient High Bay Lighting in Massachusetts ............................................................... 71
5.2.2 Allocation of Savings to In-program and ―Out-of-Program‖ Projects ................... 72
5.2.3 Attribution of ―Out-of-Program‖ Savings to Program Effects and Total Net
Savings .......................................................................................................................... 72
5.2.4 Other Indicators of Market Effects ........................................................................ 73
5.3 Limitations .................................................................................................................... 74
5.3.1 Limitation to the Approach .................................................................................... 74
5.3.2 Compatibility of Comparison Area ........................................................................ 74
5.3.3 Temporal Issues ................................................................................................... 81
5.3.4 Removing impacts associated with different length study period ........................ 85
5.3.5 Other limitations .................................................................................................... 86
List of Tables:
Table 1-1: Market Actors Interviewed ............................................................................................. 5
Table 1-2: Estimated market effects from the electric PA’s HBL programs .................................. 8
Table 1-3: Contractor-reported Technology Shares of High Bay Lighting Installations .............. 10
Table 1-4: Preponderance of evidence of market effects (part 1) ............................................... 13

Page | iii
Table 1-5 Preponderance of evidence of market effects (part 2) ............................................... 14
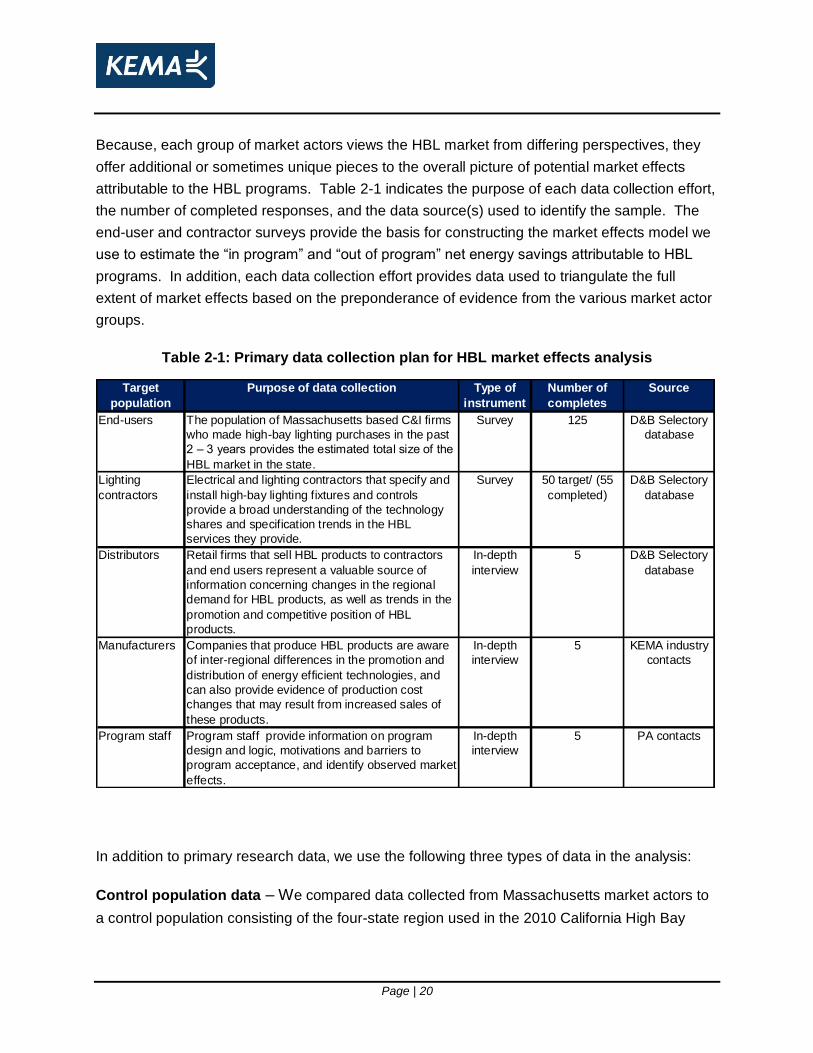
Table 2-1: Primary data collection plan for HBL market effects analysis .................................... 20
Table 3-1: Summary of Comparison Area Data ........................................................................... 24
Table 3-2: Summary of primary research efforts by market actor group ..................................... 24
Table 3-3: Inventory of primary research by market actor research instrument .......................... 28
Table 3-4: Topics covered by market actor group and general research question ..................... 29
Table 4-1: Estimates of Market Size: Number of HBL purchases from 2007 to 2010 .............. 37
Table 4-2: Estimates of Market Size: Square feet served by 2007 – 2010 purchases ............. 38
Table 4-3: Estimate of Lumens of HBL Installed ......................................................................... 40
Table 4-4: Contractor-reported Technology Shares of High Bay Lighting Installations ............. 41
Table 4-5: Efficacy of High Bay Lighting Technologies .............................................................. 42
Table 4-6: Demand and annual energy use reductions ............................................................... 44
Table 4-7: HBL Gross GWh Savings ............................................................................................ 45
Table 4-8: Energy Savings Associated with out of program adoptions ...................................... 45
Table 4-9: Alternate scenarios for estimated in-program and out-of-program savings ............... 47
Table 4-10: Research question 1: Have HBL energy efficiency programs resulted in increased
energy efficient HBL installations? ........................................................................................ 49
Table 4-11: Research question 1: Have HBL energy efficiency programs resulted in increased
energy efficient HBL installations? ........................................................................................ 50
Table 4-12: Research question 2: Have HBL energy efficiency measures resulted in increased
knowledge and awareness of energy efficient HBL technologies? ...................................... 54
Table 4-13: Research question 3: Have HBL energy efficiency programs resulted greater
marketing and promotional activity of energy efficient HBL technologies by market
actors? ................................................................................................................................... 56
Table 4-14: Research question 3: Have HBL energy efficiency measure resulted in increased
marketing and promotional activity of energy efficient HBL technologies? .......................... 57
Table 4-15: Research question 4: Have market barriers either impeded the effectiveness of, or
been reduced by energy efficient HBL programs? ............................................................... 60
Table 4-16: Have market barriers either impeded the effectiveness of, or been reduced by
energy efficient HBL programs? ............................................................................................ 61
Table 4-17: Scenario A spillover calculation C&F, corporate policy, and building code savings
independent (100 percent additive)....................................................................................... 67
Table 4-18: Scenario B spillover calculation C&F, corporate policy, and building code savings 50
percent additive ..................................................................................................................... 68
Table 4-19: Scenario C spillover calculation C&F, corporate policy, and building code savings
50 percent additive ................................................................................................................ 68

Page | iv
Table 4-20 Estimated market effects from the electric PA’s HBL programs ............................... 69
Table 5-1: Profile of end users: Massachusetts, California, and the comparison area survey
results .................................................................................................................................... 77
Table 5-2: Comparison of key economic indicators between Massachusetts and the
comparison area .................................................................................................................... 80
Table 5-3: Massachusetts electric PA’s HBL tracking records by year ...................................... 82
Table 5-4: Alternative savings estimates:..................................................................................... 86
List of Figures:
Figure 1-1: Accounting for Energy Efficient Sales ......................................................................... 2
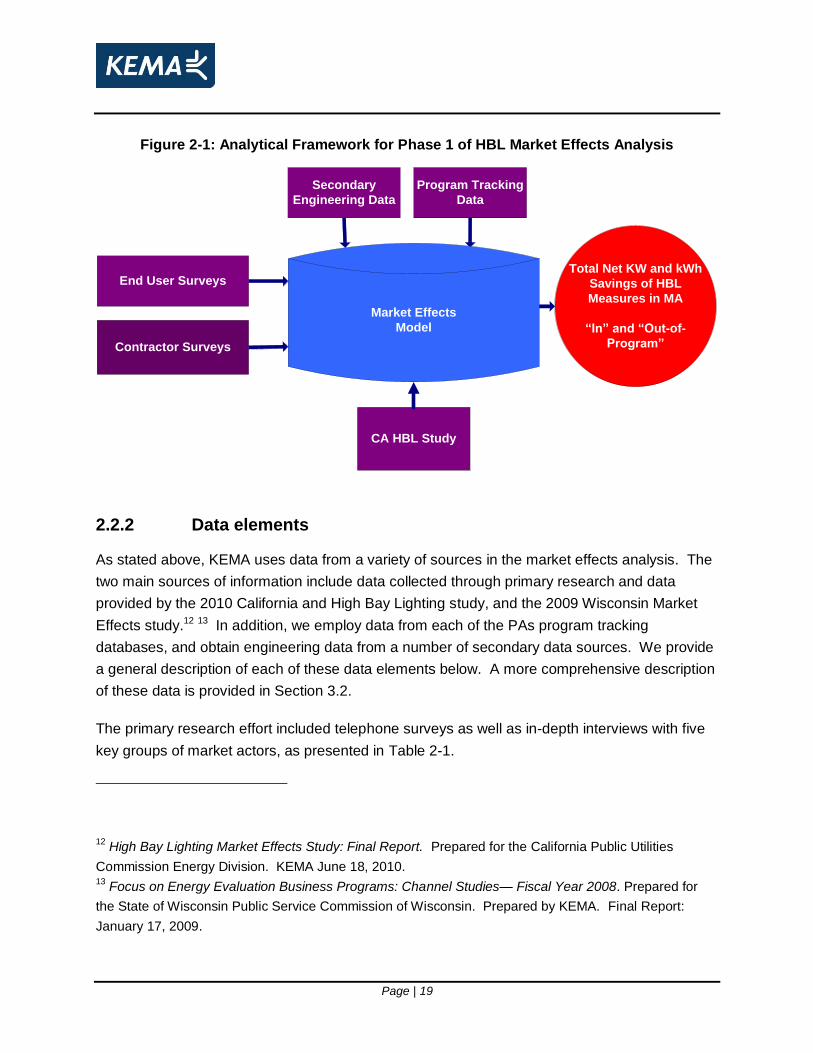
Figure 2-1: Analytical Framework for Phase 1 of HBL Market Effects Analysis .......................... 19
Figure 3-1: Graphical Overview of the Market Effects Model ..................................................... 33
Figure 5-1: Average electricity prices by state ............................................................................. 83
Figure 5-2: Annual unemployment rate by state .......................................................................... 84
Figure 5-3: Annual gross state product by state .......................................................................... 85
List of Equations:
Equation 1: Number of end users making HBL purchases ......................................................... 34
Equation 2: Total high bay space impacted by HBL purchases ................................................. 34
Equation 3: Influence of C&F corporate policies on savings from HBL programs ..................... 62
Equation 4: Influence of corporate policies on savings from HBL .............................................. 63
Equation 5: Savings resulting from building codes ..................................................................... 65

Page | 1
1. Executive Summary
This Executive Summary provides a high level review of the results for Project 1A New
Construction Market Characterization’s High Bay Lighting (HBL) Market Effects Study1 for the
evaluation of the large commercial and industrial (C&I) programs operated by the
Massachusetts program administrators (PA). In this section, we provide a brief introduction to
market effects research, the study objectives, summarize the evaluation approach, and present
key findings and recommendations.
1.1 Introduction to Market Effects Research
A market effect is ―a change in the structure of a market or the behavior of participants in a
market that is reflective of an increase in the adoption of energy efficient products, services, or
practices and is causally related to market intervention(s).‖2 Examples of changes to markets or
behaviors of participants include increased levels of end user adoption of energy efficient
equipment, contractor changes in design and installation practices, distributor changes in
stocking practices and manufacturer changes in production. The purpose of market effects
research is to estimate the energy savings associated with the changes to a targeted
market and assess the attribution of these market effects to the PAs’ energy efficiency
programs.
The measurement of net market effects, or Untracked Spillover, excludes naturally occurring
energy efficient sales and all energy efficient sales that are currently accounted for by program
tracking or other evaluation activities. It is important that the market effects research avoid
double counting by making appropriate adjustments to untracked spillover or program tracked
sales if necessary. For example, if a PA applies a non-participant spillover rate to the entire C&I
portfolio then the resulting non-participant spillover energy savings must be removed for the
1 Massachusetts Large Commercial & Industrial Evaluation Contractor (LCIEC). Final Work Plan Project
1A New Construction Market Characterization. Prepared for the Massachusetts Energy Efficiency
Program Administrators. August 6, 2010. Two additional Project 1A studies were conducted in parallel to
this study. They are the Supply Chain Profile and the Commercial New Construction Customer
Quantitative Profile. 2 Eto, Joe, Ralph Prahl and Jeff Schlegal. A Scoping Study on Energy-Efficiency Market Transformation
by California Utility DMS Programs. Lawrence Berkeley National Laboratory, 1996.

Page | 2
market effect study’s targeted market (e.g. HBL). It will be replaced with a more robust estimate
based on the targeted market study.
Figure 1-1 provides an overview of the relationship between Program Tracked Sales (in
program) and Untracked Sales (out of program). These terms and definitions are used
throughout this report.
Program Tracked Sales: Sales of energy efficient equipment that are currently accounted for
by program tracking systems and existing evaluation activities. This includes program tracked
sales that would not have occurred in the absence of the program (―Tracked Program
Attributable‖), naturally occurring sales that received program rebates or assistance (―free
riders‖), and may include participant spillover and non-participant spillover estimated from
existing studies.
Untracked Sales: Includes sales of non energy efficient equipment, naturally occurring sales
that did not receive a program rebate or assistance, and untracked spillover. Untracked spillover
is the additional program attributable energy efficient sales that are currently not accounted for
by the programs. This study quantifies the attributable energy savings for those untracked sales.
Figure 1-1: Accounting for Energy Efficient Sales

Page | 3
The California Market Effects Protocol3 (Protocol) is the leading market effects methodological
document. The Protocol provides a clear framework for market effects evaluation. It is designed
to measure untracked spillover for a target market at the market level rather than focusing on
individual program influences and interventions. KEMA used the framework as the basis of the
MA research and three other recent C&I market effects studies conducted for California4 and
Wisconsin5, 6 that focused on high bay lighting. Each of these previous studies found significant
market effects attributable to the effort of the long standing programs in California and
Wisconsin. This is the foundation of the LCIEC Team’s initial belief that significant market
effects exist in Massachusetts.
The Protocol acknowledges the field of market effects research continues to evolve and there is
no agreed upon best method. Therefore it is important for the research to clearly describe the
approach and state all known uncertainties around the estimates and limitations to the methods.
The value of market effects research should not be dismissed based on the perceived accuracy
of the point estimate of savings. For this reason the Protocol recommends the presentation of a
range of probable effects rather than a point estimate of savings. This allows regulators to
assess the complete body of evidence presented and weigh it against the known limitations of
the approach to decide the level of untracked spillover credit to be awarded to the program.
1.2 Approach
The Massachusetts electric PAs have been promoting energy efficient lighting in the commercial
and industrial market via technical assistance and financial incentives for more than twenty
years. The LCIEC Team believes the PA’s on-going efforts have caused changes to the
Massachusetts C&I lighting market that result in energy savings that are not accounted for by
program tracking systems or existing evaluation activities. The LCIEC Team estimated
3 The TecMarket Works Team. California Energy Efficiency Evaluation Protocols: Technical,
Methodological, and Reporting Requirements for Evaluation Professionals. Prepared for California Public
Utilities Commission. April 2006. 4 California Public Utilities Commission Energy Division. High Bay Lighting Market Effects Study. Final
Report June 18, 2010. 5 Public Service Commission of Wisconsin. Focus on Energy Evaluation. Business Programs: Supply-side
Evaluation. Final Report April 22, 2010. 6 Public Service Commission of Wisconsin. Focus on Energy Evaluation. Business Programs: Channel
Studies - Fiscal Year 2008. Final Report January 17, 2009.
Page | 4
untracked spillover and assessed the attribution of these savings to the PA’s energy efficiency
programs based on a comparison of the level of adoption of energy efficient high bay lighting in
Massachusetts versus a comparison area lacking programs promoting energy efficient high bay
lighting. The primary analytic steps include:
1. Estimate the volume of high bay lighting installed in Massachusetts and the comparison
area.
2. Estimate the market share of energy efficient high bay lighting installed in
Massachusetts and the comparison area.
3. Assess attribution of untracked spillover to the PA’s energy efficiency programs.
According to the California Protocols, the ―key considerations for the rigor of market effects
estimates are the accuracy of the estimates of energy impacts and the accuracy of the
attribution of market effects.‖7 The LCIEC Team approach achieved the Protocols’ highest level
of rigor via data collected using representative samples from multiple sources and comparison
markets.
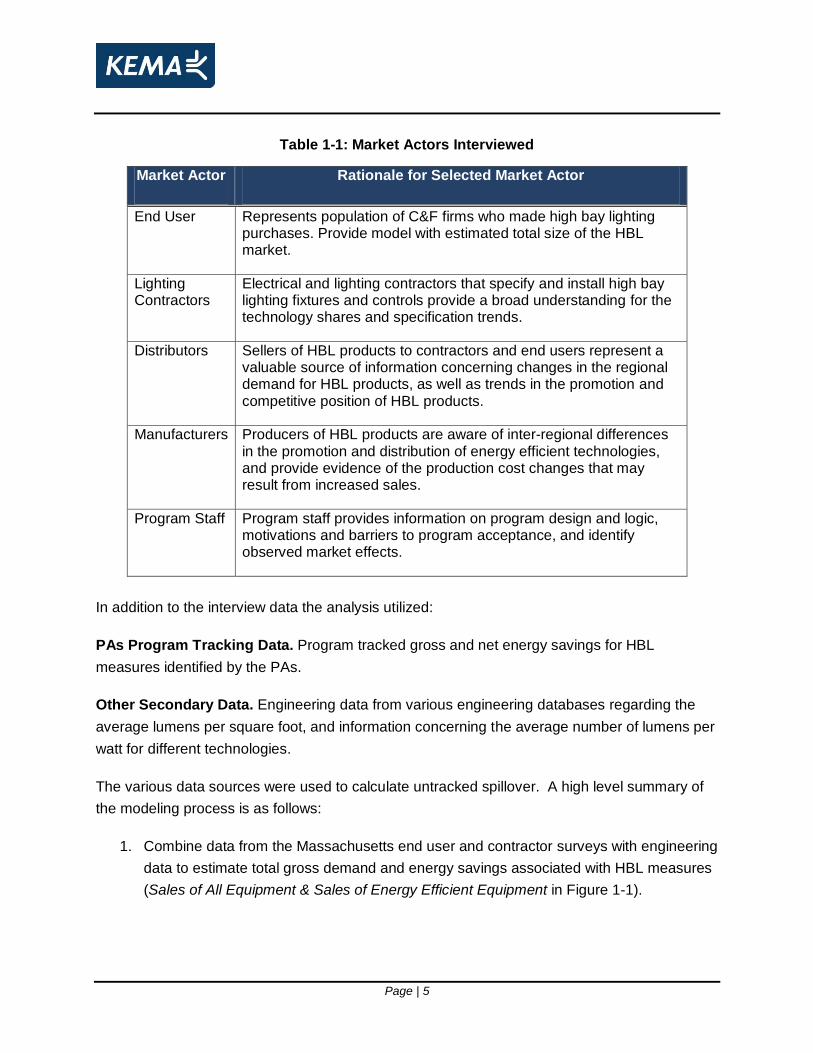
Information collected from interviews with key market actors were used to estimate the level of
adoption of specific HBL technologies in Massachusetts. The rationale for the selection of each
market actor is provided in Table 1-1.
The MA study used that same comparison area (Mississippi, Alabama, Georgia, and South
Carolina) and data collected for the CA study in 2009. To ensure comparability of the results the
MA instruments mirrored those of the CA study with minor modifications. We also compared the
Massachusetts market actors’ responses to a number of survey responses that were examined
in Illinois, serving as the comparison area for the two Wisconsin studies. These additional
triangulation points provide further credibility to the modeled results.
7 The TecMarket Works Team. California Energy Efficiency Evaluation Protocols: Technical,
Methodological, and Reporting Requirements for Evaluation Professionals. Prepared for California Public
Utilities Commission. April 2006, page 152.
Page | 5
Table 1-1: Market Actors Interviewed
Market Actor Rationale for Selected Market Actor
End User Represents population of C&F firms who made high bay lighting purchases. Provide model with estimated total size of the HBL market.
Lighting Contractors
Electrical and lighting contractors that specify and install high bay lighting fixtures and controls provide a broad understanding for the technology shares and specification trends.
Distributors Sellers of HBL products to contractors and end users represent a valuable source of information concerning changes in the regional demand for HBL products, as well as trends in the promotion and competitive position of HBL products.
Manufacturers Producers of HBL products are aware of inter-regional differences in the promotion and distribution of energy efficient technologies, and provide evidence of the production cost changes that may result from increased sales.
Program Staff Program staff provides information on program design and logic, motivations and barriers to program acceptance, and identify observed market effects.
In addition to the interview data the analysis utilized:
PAs Program Tracking Data. Program tracked gross and net energy savings for HBL
measures identified by the PAs.
Other Secondary Data. Engineering data from various engineering databases regarding the
average lumens per square foot, and information concerning the average number of lumens per
watt for different technologies.
The various data sources were used to calculate untracked spillover. A high level summary of
the modeling process is as follows:
1. Combine data from the Massachusetts end user and contractor surveys with engineering
data to estimate total gross demand and energy savings associated with HBL measures
(Sales of All Equipment & Sales of Energy Efficient Equipment in Figure 1-1).
Page | 6
2. Compare gross savings estimates in Massachusetts to the comparison area savings
estimates to identify total program attributable demand and energy savings in
Massachusetts (Program Attributable Energy Savings {dark blue} in Figure 1-1).
3. Use program tracking data to remove program attributable saving that are currently
accounted for by the program (Program Tracked Sales {In Program} in Figure 1-1).
4. Assess attribution of untracked energy efficient sales to the PA’s energy efficiency
programs (Untracked Spillover in Figure 1-1).
As previously stated, we analyzed survey results from a broad range of market actors to provide
supplemental evidence of market effects. In contrast to the modeled approach outlined above,
this portion of the analysis relies on a preponderance of evidence obtained from primary
research to determine the extent of program related changes to market share, availability,
design specification, marketing practices, production costs, awareness, and perceptions of
energy efficient HBL products. As stated in the Protocols:
―In this approach the analyst relies on triangulation from multiple data sources to draw
conclusions about the presence and attribution of market effects. This approach is
accomplished by interviewing and surveying knowledgeable market actors. Program staff, utility
staff and trade allies provide useful information for understanding the context of sales and
counts of behavior. Over time, these views provide much of the information needed to draw
conclusions about attribution and sustainability.‖8
1.2.1 Limitations to the Approach
The LCIEC Team acknowledges several limitations to the approach.
1.2.1.1 Compatibility of Comparison Area
The loss of the comparison market is an increasingly problematic limitation for using quasi-
experimental techniques to estimate market effects attributable to C&I and residential energy
efficiency programs. Due to the limited number of remaining states without energy efficient
lighting programs, the LCIEC Team determined that the four state region used for the 2010
California HBL Study was the best available region to use a comparison group. Similar to the
8 Ibid. page 156.
Page | 7
CA study team, the LCIEC team concluded it was more important to select a comparison area
without prior or existing HBL programs than one with closely linked socio-economic factors. The
choice of this region does, however, represent a limitation to the analysis due to key differences
among the regions. KEMA analyzed a number of these differences to provide insight into their
impact on the estimated market effects. Important findings from this analysis include:
The inventory of Massachusetts end user facilities is older, smaller, and has lower
ceilings than in both the comparison region and California, partially explaining the higher
proportion of lighting projects over the past few years.
A greater share of firms in the comparison area are used for warehousing and process
manufacturing, while Massachusetts has a slightly greater proportion of food sales
stores. This difference may result in greater savings as warehouse and manufacturing
facilities are likely to have multiple shifts requiring continual usage of HBL.
Electric prices in Massachusetts are 1.7 to 2 times higher than in the southern states,
while incomes are only 1.2 to 1.6 times higher. These higher rates are likely to result in
greater attention to efficiency measures, thereby potentially reducing the amount of
savings attributable to the electric PAs programs.
The level of education in Massachusetts is also higher than in the south. While it is very
difficult to quantify, increased education is often believed to correlate to a higher level of
social awareness. This effect can be seen by Massachusetts ACEEE 2010 Efficiency
scorecard, which indicates Massachusetts ranks second in the US, while the southern
region ranks between 37th and 49th.
1.2.1.2 Temporal Issues
The comparison area from the 2010 California HBL Study provided analysis of market effects
based self-reported data from market actors for 2006 through 2008, while the Massachusetts
study used 2007 through 2010 as the study period.
The periods being examined in the Massachusetts and California HBL studies were also
different lengths. This difference in length presents another limitation to the analysis; therefore,
KEMA reviewed a range of data to suggest the magnitude and direction of effect these
differences impose on the analysis. Our findings in this regard include:
Page | 8
Program tracked sales and estimated savings in Massachusetts increased sharply from
2007 to 2008, but then leveled off between 2008 and 2010.
Falling energy prices in Massachusetts should lead to less exogenous pressure to adopt
energy efficient technologies, thereby supporting the evidence of relatively high
program-attributable market effects.
Economic indicators suggest that while Massachusetts’ economy is clearly much
different than the comparison area, it has not experienced trends that are dissimilar to
those experienced by the comparison area.
1.3 Key findings
1.3.1 Modeled market effects results
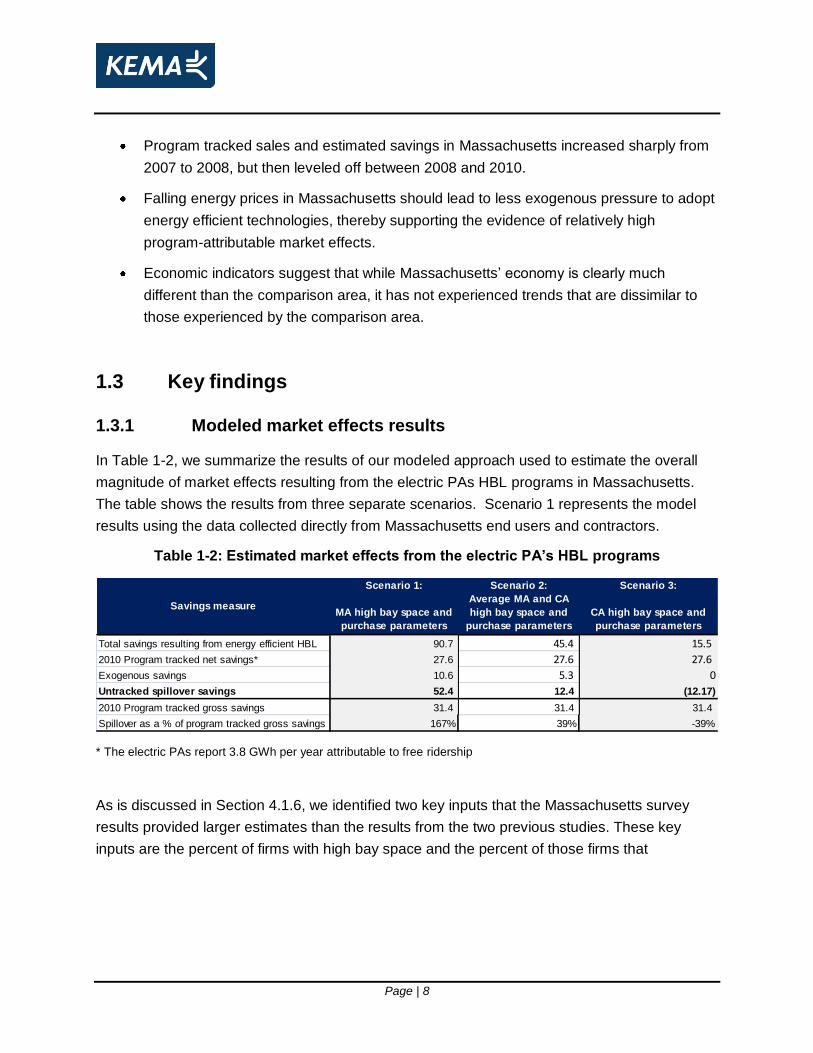
In Table 1-2, we summarize the results of our modeled approach used to estimate the overall
magnitude of market effects resulting from the electric PAs HBL programs in Massachusetts.
The table shows the results from three separate scenarios. Scenario 1 represents the model
results using the data collected directly from Massachusetts end users and contractors.
Table 1-2: Estimated market effects from the electric PA’s HBL programs
Scenario 1: Scenario 2: Scenario 3:
MA high bay space and
purchase parameters
Average MA and CA
high bay space and
purchase parameters
CA high bay space and
purchase parameters
Total savings resulting from energy efficient HBL 90.7 45.4 15.5
2010 Program tracked net savings* 27.6 27.6 27.6
Exogenous savings 10.6 5.3 0
Untracked spillover savings 52.4 12.4 (12.17)
2010 Program tracked gross savings 31.4 31.4 31.4
Spillover as a % of program tracked gross savings 167% 39% -39%
Savings measure
* The electric PAs report 3.8 GWh per year attributable to free ridership
As is discussed in Section 4.1.6, we identified two key inputs that the Massachusetts survey
results provided larger estimates than the results from the two previous studies. These key
inputs are the percent of firms with high bay space and the percent of those firms that

Page | 9
purchased high bay lighting during the study period. After examination of key differences
between the Massachusetts and California HBL studies,9 we created two additional scenarios
that incorporate data from the 2010 California HBL study to estimate these parameters. The
LCIEC Team recommends the level of savings provided by Scenario 2, which uses the
average of the Massachusetts and California values for the percent of firms with high bay
space and the percent that made HBL purchases.
Based Scenario 2, the LCIEC Team estimates over 45 GWh per year in savings is attributable
to the electric PAs HBL programs. The PA’s program tracking data reports that program
tracked net savings accounts for 28 GWh of this 45 GWh. This provides an additional 12
GWh of 2010 savings attributable to the program that did not receive rebates, and
therefore occurs outside the program. These program-attributable savings represent our
measured estimate of market effects. In addition to these program attributable savings, we
identified 5 GWh per year in savings that result from naturally occurring sales of energy efficient
HBL in the state. These additional savings would occur in the absence of the program and
include roughly 4 GWh per in savings that the PAs identified as savings resulting from free
riders. Our estimate of untracked spillover savings amounts to 39 percent of the 2010 program
gross tracked savings, which the PAs report at 31 GWh in 2010.
These modeled estimates are driven by differences in the technology shares between
Massachusetts and the comparison area. Specifically, the model reflects differences in the
percent of high bay space illuminated using fixtures with high efficiency (lumens per watt) in
Massachusetts relative to those found in the comparison area. These differences in lighting
specifications translate into a higher overall wattage in the comparison area relative to
Massachusetts in order to provide the amount of light necessary to illuminate space served by
recent Massachusetts HBL purchases.
The following research results serve as key inputs to our modeled approach and provide
supporting evidence of the untracked spillover savings estimates presented above.
9 See Section 5.3.2 and 5.3.3.

Page | 10
Comparison of technology shares
As see in Table 1-3, Massachusetts lighting contractors report a much higher percentage of
HBL projects use high efficiency T-5 HBL than the comparison area. With nearly the same
percentage of T-5’s as California, one of the most aggressive states in terms of energy
efficient lighting programs, Massachusetts is a leader in the adoption of energy efficient
HBL. This point is further supported by findings from manufacturer interviews. Conversely,
Massachusetts contractors report much lower shares of T-12 fixtures which are less
efficient. In terms of the modeled results, the higher market share of these less efficient
fixtures in the comparison area relative to T-5 fluorescents results in greater energy
consumption in the comparison area to light the same amount of space, and therefore,
greater energy savings for Massachusetts.
Table 1-3: Contractor-reported Technology Shares of High Bay Lighting Installations
2007-2010 for MA Massachusetts
Comparison
Area California
Fluorescent Tube: T-5/ Electronic Ballast T-5 64% 29% 65%
Fluorescent Tube: T-8 /Electronic Ballast T-8 13% 16% 14%
Fluorescent Tube: All other, including T12/Magnetic
Ballast 1% 11% 1%
HID: Pulse-start metal halide 3% 31% 14%
HID: High-pressure sodium 1% 8% 3%
HID: Other HID such as mercury vapor or probe-start
metal halide 1% 3% 1%
Other: technologies such as Induction or LED 17% 2% 2%
We found that contractors representing only 3 percent of Massachusetts HBL projects install
pulse-start metal halide fixtures compared to 31 percent in the comparison area. Although
these fixtures are program supported, evidence provided by each group of market actors
indicates that pulse-start metal halides are recognized as an out-dated technology due to
their lower efficiency and product attributes. As discussed in greater detail below, this
finding suggests that the pulse-start metal halide fixtures no longer represent an effective
technology for achieving energy savings goals. Consequently, the PAs should consider
discontinuing their sponsorship through the energy efficiency programs.
The table shows that contractors representing a substantial share of projects report
installing LED fixtures in Massachusetts. While these fixtures are not sponsored by the
Page | 11
existing programs, this finding is supportive of greater market effects because it suggests
that the programs result in changes to market actor behavior supportive of energy efficient
technologies. We attribute the relatively high adoption of LEDs in Massachusetts to the
electric PAs programs’ ability to educate contractors and end users about the benefits of
energy efficient HBL. Specifically, firms in Massachusetts appear to be more interested in
energy and life cycle cost savings associated with fixtures than their acquisition cost.
However, we also find a number of important limitations concerning the extent of savings
resulting from LEDs in high bay applications. Specifically, numerous market actors report
that LEDs face considerable barriers to entry in the high bay sector due to issues associated
with light dispersion at greater heights. Further, LED fixtures face considerable acquisition
cost constraint essentially pricing them out of most applications.
Program tracked savings
Each of the electric PAs provided program tracking records reporting their estimated gross and
net energy and demand savings associated with various lighting measures, including HBL. Our
analysis of these data revealed the following values for program tracked savings from measures
target towards HBL applications:
Total gross savings –31.4 GWh in 2010;
Total net savings – 27.6 GWh / year;
Estimated free ridership – 3.8 GWh / year;
Untracked Spillover
As shown in Table 1-2, in the recommended Scenario 2 we estimated 17.7 GWh/year (12.4 +
5.3 GWh) in savings results from untracked adoptions of increased energy efficient lighting in
Massachusetts. However, a portion of this savings, 5.3 GWh/year, cannot be attributed to the
program because it results from exogenous influences rather than being program induced. We
identified and analyzed the following three sources of this exogenous savings:
1. Savings from chain & franchise corporate policies – We estimate that design and
construction policies of national chain & franchises account for 3.73 GWh/year (8.2
percent) of the 45.3 GWh/year total savings resulting from greater efficacy in HBL in
Massachusetts.

Page | 12
2. Savings from other corporate policies – We estimate that design and construction
policies of non-chain & franchise firms account for 3.53 GWh/year (7.8 percent) of the
45.3GWh/year total savings resulting from greater efficacy in HBL in Massachusetts.
3. Savings from building codes – We estimate building codes account for 3.35 GWh (7.4
percent) of the 45.3 GWh/year total savings resulting from greater efficacy in HBL in
Massachusetts.
Total savings from exogenous factors – In combining savings attributable to these
exogenous factors, we assume that 50 percent of the estimated savings from each source are
independent of the other two sources, and therefore additive. This provides our estimated
savings estimate for these three exogenous sources of 5.3 GWh/year. As shown in Table 1-2,
we reduce the amount of out of program savings by this amount to provide our estimate of
untracked spillover savings of 12.4 GWh/year.
1.3.2 Additional evidence of market effects results
We provide evidence of market effects based on a preponderance of evidence from primary
research data obtained from each of the five groups of market actors. Where possible, we
compare results from the Massachusetts market actors to those in the comparison area. These
comparisons allow us to make conclusions regarding the extent of market effects relative to
baseline conditions, which are represented by the comparison area. In addition the primary
comparison area for this study, a limited number of results are compared to results for the
comparison area from the Wisconsin market effects studies, Illinois. Table 1-4 and Table 1-5
summarize key findings from this portion of the analysis.

Page | 13
Table 1-4: Preponderance of evidence of market effects (part 1)
Summary
Contractors report T5 fluorescent tubes accounted for 64% percent
of all fixtures used in high bay situations in Massachusetts relative
to 29% in the four state comparison area, and 28% in IL. These
differences are statistically significant at 90%.
17% of projects reported by contractors in Massachusetts
installed "other" HBL types such as induction and LED indicating
increased focus on energy efficient lighting.
Contractors representing 46% of Massachusetts HBL projects
report installing occupancy sensors compared to 22% in IL. This
difference is statistically significant at 95%.
End users report 78% of high bay space in MA served by
fluorescent tube fixtures compared to 55% in the comparison area.
This difference is statistically significant at 95%.
68% of end users who installed fluorescent tubes report installing
T8's and 37% report T5's compared to 45% and 16% in the
comparison area. This difference is statistically significant at
95%.
43% end users report installing occupancy or motion sensors and
26% installed daylight controls compared to 12% and 3%,
respectively, in the comparison area. This difference is
statistically significant at 95%.
23% of end users installed daylight controls compared to 14% in
the comparison area. This difference is not statistically
significant.
ManufacturersFour of five manufacturers agree that fluorescent HBLs T-5s and T-
8s are driving their MA HBL sales.
Contractors that represent 74% of projects report talking directly
to customers to promote energy efficient high bay lighting
technologies.
Contractors representing 73% of Massachusetts HBL projects
report recommending energy efficient HBL always or most of the
time compared to 86% in the comparison area and 80% in CA.
This difference is not statistically significant. By comparison,
contractors representing 90% of IL projects report recommending
T5 or T8 fluorescent fixtures, while only 80% of WI projects
installing these technologies were recommended by contractors.
Contractors representing 66% of Massachusetts HBL projects
report recommending occupancy sensors compared to 21% in IL.
This difference is statistically significant at 95%.
Distributors
All five distributors recommend energy efficient option, and 4 of the
5 make such recommendations ―always‖, one does so
―sometimes‖.
For 80% of end users in MA who installed fluorescent tubes, the
contractor recommended using them compared to 67% in the
comparison area. This difference is not statistically significant.
53% of end users in MA who installed fluorescent HBL heard of
the technology through lighting vendors compared to 19% in the
comparison area.
Contractors that represent 41% of Massachusetts projects
indicate that concern/awareness about saving energy are main
factors in determining the market share of high bay fluorescent
lighting in the next two years relative to 22% in the comparison
area. This difference is not statistically significant.
Contractors that represent 63% of Massachusetts projects
indicate that the majority of customers are aware of the full range
of options for energy-efficient high bay lighting available to them
before they provide recommendations about the lighting system
compared to 17% in the comparison area.
Massachusetts contractors rate both the initial equipment costs
and operation costs 9.7, and rate life cycle costs 8.4 out of 10.
Contractors from Illinois rate each of these factors 7.3, 6.1 and
6.0, respectively.
End Users44% of end users in MA who installed fluorescent HBL heard of
the technology through previous projects compared to 38% in the
comparison area. This difference is not statistically significant.
Data from both contractors and end users
indicate greater sales of energy efficient
HBL products relative to the four state
comparison area as well as Illinois.
Fluorescent T-5 fixtures are clearly the
preferred technology among MA
contractors. End users also report a high
concentration of T-5 fluorescent tubes, but
an even greater number of T-8's.
Information provided by the 5
manufacturers affirms the popularity of T5's
and T8's in Massachusetts.
Massachusetts contractors also report
installing LEDs on a significantly greater
number of projects than in the comparison
area, providing a further indication of
market effects as firms are willing to trade
short term acquisition costs for long term
savings from reduced energy costs.
Finally, Massachusetts contractors and
end users both report greater adoption of
lighting controls than the comparison area
and Illinois.
Massachusetts contractors and end users
have a greater level of awareness of the
cost, energy savings, and other benefits
associated with HBL choices than firms in
the comparison region and Illinois. This
indicates that Massachusetts HBL
programs have been effective in educating
market actors on HBL choices and the
implications those choices represent to
their bottom line.
Evidence
Sales of HBL by
technology
Awareness of
benefits of energy
efficient HBL
Topics Covered Market Actor Group
Contractors
End Users
End users
Contractors
The evidence suggests that contractors,
distributors, and manufacturers actively
promote energy efficient HBL in
Massachusetts. However, contractors are
more likely to recommend fixtures in the
comparison region. Contrasting contractor
results from Massachusetts with those
from the WI study, illustrates that
contractors in WI are also less likely to
recommend energy efficient fixtures than
IL. This finding, coupled with the relatively
high proportion of projects in which energy
efficient fixtures are installed suggest that
end users in each of the program states
are better informed about energy efficient
options prior to undertaking projects than
in non-program areas.
Recommendations
for energy efficient
HBL
Contractors
Page | 14
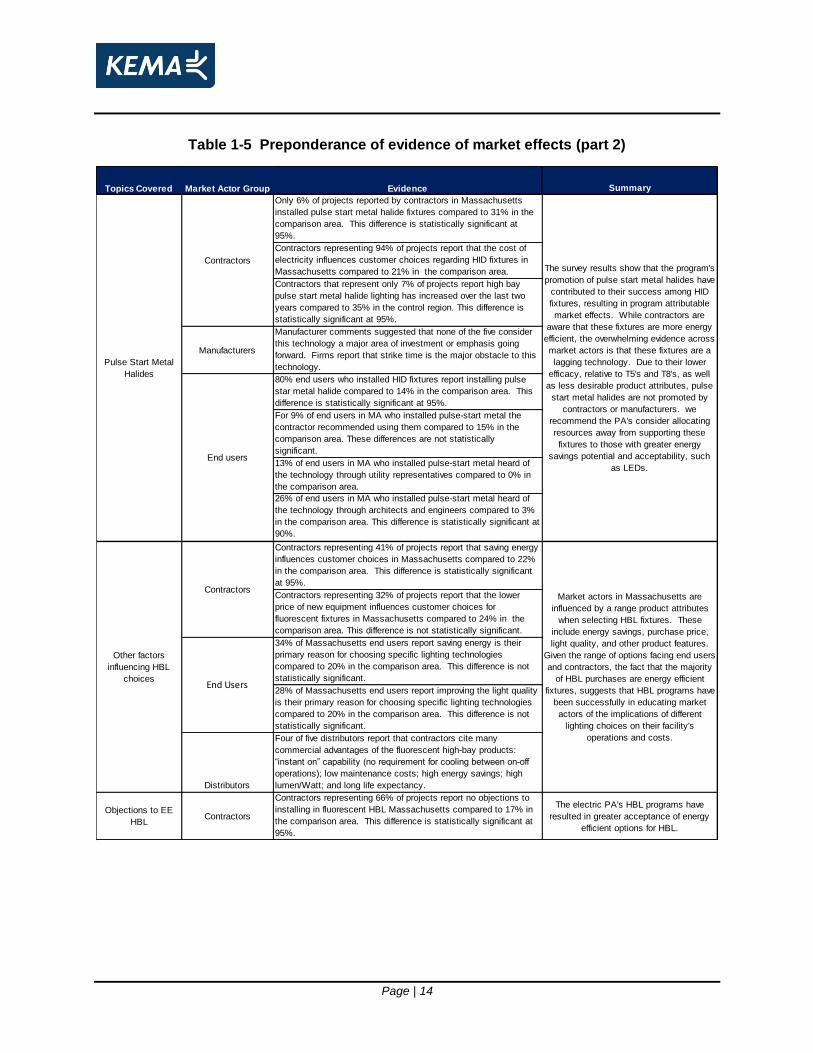
Table 1-5 Preponderance of evidence of market effects (part 2)
Summary
Only 6% of projects reported by contractors in Massachusetts
installed pulse start metal halide fixtures compared to 31% in the
comparison area. This difference is statistically significant at
95%.
Contractors representing 94% of projects report that the cost of
electricity influences customer choices regarding HID fixtures in
Massachusetts compared to 21% in the comparison area.
Contractors that represent only 7% of projects report high bay
pulse start metal halide lighting has increased over the last two
years compared to 35% in the control region. This difference is
statistically significant at 95%.
Manufacturers
Manufacturer comments suggested that none of the five consider
this technology a major area of investment or emphasis going
forward. Firms report that strike time is the major obstacle to this
technology.
80% end users who installed HID fixtures report installing pulse
star metal halide compared to 14% in the comparison area. This
difference is statistically significant at 95%.
For 9% of end users in MA who installed pulse-start metal the
contractor recommended using them compared to 15% in the
comparison area. These differences are not statistically
significant.
13% of end users in MA who installed pulse-start metal heard of
the technology through utility representatives compared to 0% in
the comparison area.
26% of end users in MA who installed pulse-start metal heard of
the technology through architects and engineers compared to 3%
in the comparison area. This difference is statistically significant at
90%.
Contractors representing 41% of projects report that saving energy
influences customer choices in Massachusetts compared to 22%
in the comparison area. This difference is statistically significant
at 95%.
Contractors representing 32% of projects report that the lower
price of new equipment influences customer choices for
fluorescent fixtures in Massachusetts compared to 24% in the
comparison area. This difference is not statistically significant.
34% of Massachusetts end users report saving energy is their
primary reason for choosing specific lighting technologies
compared to 20% in the comparison area. This difference is not
statistically significant.
28% of Massachusetts end users report improving the light quality
is their primary reason for choosing specific lighting technologies
compared to 20% in the comparison area. This difference is not
statistically significant.
Distributors
Four of five distributors report that contractors cite many
commercial advantages of the fluorescent high-bay products:
―instant on‖ capability (no requirement for cooling between on-off
operations); low maintenance costs; high energy savings; high
lumen/Watt; and long life expectancy.
Objections to EE
HBLContractors
Contractors representing 66% of projects report no objections to
installing in fluorescent HBL Massachusetts compared to 17% in
the comparison area. This difference is statistically significant at
95%.
The electric PA's HBL programs have
resulted in greater acceptance of energy
efficient options for HBL.
Pulse Start Metal
Halides
End users
Contractors
Topics Covered Market Actor Group
Market actors in Massachusetts are
influenced by a range product attributes
when selecting HBL fixtures. These
include energy savings, purchase price,
light quality, and other product features.
Given the range of options facing end users
and contractors, the fact that the majority
of HBL purchases are energy efficient
fixtures, suggests that HBL programs have
been successfully in educating market
actors of the implications of different
lighting choices on their facility's
operations and costs.
The survey results show that the program's
promotion of pulse start metal halides have
contributed to their success among HID
fixtures, resulting in program attributable
market effects. While contractors are
aware that these fixtures are more energy
efficient, the overwhelming evidence across
market actors is that these fixtures are a
lagging technology. Due to their lower
efficacy, relative to T5's and T8's, as well
as less desirable product attributes, pulse
start metal halides are not promoted by
contractors or manufacturers. we
recommend the PA's consider allocating
resources away from supporting these
fixtures to those with greater energy
savings potential and acceptability, such
as LEDs.
Evidence
Other factors
influencing HBL
choices
Contractors
End Users

Page | 15
1.4 Recommendations
Based on the modeled approach and the preponderance of evidence presented in this market
effects study, KEMA recommends the electric PAs claim untracked spillover energy savings
associated with Massachusetts HBL measures. We recommend the Scenario 2 energy savings
estimate of 12.4 GWh per year or 39 percent of 2010 program tracked gross savings. This value
is consistent with the untracked spillover estimate of 34 percent of program tracked savings
estimated for Wisconsin in the 2010 Wisconsin HBL study.
Several of the electric PAs are currently claiming low levels of participant and or non-participant
energy savings for HBL measures. Prior to claiming the untracked spillover savings
recommended by this report the PAs must remove participant and or non-participant spillover
energy savings for HBL measures already being claimed to avoid double counting.
Page | 16
2. Introduction
This report presents the results of KEMA’s study of the market effects associated with the
Massachusetts Program Administrator’s (PA’s) electric energy efficiency programs that promote
energy efficient high-bay lighting (HBL) and lighting control in Massachusetts. These programs
are offered to Commercial and Industrial (C&I) customers by five electric PAs: Cape Light
Compact, National Grid, NSTAR, Unitil, and WMECo. This market effects study is part of a
multi-year C&I market characterization.10
KEMA conducted this Market Effects Study to determine the presence and extent of market
effects resulting from high-bay lighting programs offered by the PAs over the past 4 years. The
theory behind this investigation is that designers and equipment vendors learned about the
customer and business benefits of specifying efficient equipment and design practices through
their participation in the program. As a result of participating in the program, a portion of market
participants realized the benefits of the energy efficient products and have become motivated to
continue using them in projects regardless of whether or not they continue to receive any
incentives. These behavioral changes represent market effects, which are defined by the
California Protocols as follows11:
―A change in the structure of a market or behavior of participants in a market that is reflective of
an increase in the adoption of energy-efficient products, services, or practices and is causally
related to market intervention(s).‖
2.1 Research objective and questions
The overall goal of the market effects study is to assess the extent to which the PA’s recent HBL
programs affected the adoption of energy efficient high-bay lighting equipment and controls.
Specifically, we developed a quantitative model to estimate the effect of the PAs’ programs on
10
Final Work Plan Project 1A New Construction Market Characterization. Prepared for the
Massachusetts Energy Efficiency Programs in Large Commercial & Industrial Evaluation Contractor
(LCIEC). KEMA August 6, 2010. 11
California Energy Efficiency Evaluation Protocols: Technical, Methodological, and Reporting
Requirements for Evaluation Professional. San Francisco: California Public Utilities Commission.
TecMarket Works Team. April 2006.
Page | 17
the rate of adoption of energy-efficient high bay lighting technologies among all customers,
whether or not those customers participated in the promotional programs.
This modeled approach yields our estimated total ―in-program‖ and ―out-of-program‖ net
demand (MW) and energy (MWh) savings associated with the HBL programs. The modeled
results address the following three research questions:
1. What is the total (gross) demand and energy savings attributable to HBL measures
implemented by the Massachusetts PA’s over the past 4 years?
2. What is the total program tracked attributable savings?
3. What is the level of untracked spillover?
We supplement this quantitative assessment with additional evidence of market effects provided
by interviews with a broad range of key market players. This additional information provides
further evidence of behavioral changes among the various HBL market actors. These
behavioral changes include changes to awareness, design specification, marketing practices,
production practices, and market barriers associated with energy efficient HBL products. Based
on market actor survey and interview results, we provide a preponderance of evidence of
market effects that addresses the following four research questions:
1. Have HBL energy efficiency programs resulted in increased energy efficient HBL
installations?
2. Have HBL energy efficiency programs resulted in increased knowledge and awareness
of energy efficient HBL technologies?
3. Have HBL energy efficiency programs resulted in greater marketing and promotional
activity of energy efficient HBL technologies by market actors?
4. Have market barriers either impeded the effectiveness of, or been reduced by energy
efficient HBL programs?

Page | 18
2.2 Overview of study
2.2.1 Analytical framework
Our modeled approach is depicted in Figure 2-1 below in which the data inputs, represented by
the purple rectangles, include end-user and contractor survey data, various engineering data
elements from secondary data sources, and program tracking data. The final inputs to the
model are data derived from the California HBL study, which provides energy consumption
estimates for the control area, the four-state region that includes Alabama, Georgia, Mississippi,
and South Carolina between 2006 and 2008. Data inputs are fed through the market effects
model, depicted by the blue cylinder, to provide the model outputs, represented by the red
circle. While a detailed description of the model is provided in Section 3, the general modeling
process is as follows:
1. Combine data from the Massachusetts end user and contractor surveys with engineering
data to estimate total gross demand and energy savings associated with HBL measures
(Sales of All Equipment & Sales of Energy Efficient Equipment in Figure 1-1).
2. Compare gross savings estimates in Massachusetts to the comparison area savings
estimates to identify total program attributable demand and energy savings in
Massachusetts (Program Attributable Energy Savings {dark blue} in Figure 1-1).
3. Use program tracking data to remove program attributable saving that are currently
accounted for by the program (Program Tracked Sales {In Program} in Figure 1-1).
4. Assess attribution of untracked energy efficient sales to the PA’s energy efficiency
programs (Untracked Spillover in Figure 1-1).
Page | 19
Figure 2-1: Analytical Framework for Phase 1 of HBL Market Effects Analysis
End User Surveys
CA HBL Study
Secondary
Engineering Data
Contractor Surveys
Program Tracking
Data
Total Net KW and kWh
Savings of HBL
Measures in MA
“In” and “Out-of-
Program”
Market Effects
Model
2.2.2 Data elements
As stated above, KEMA uses data from a variety of sources in the market effects analysis. The
two main sources of information include data collected through primary research and data
provided by the 2010 California and High Bay Lighting study, and the 2009 Wisconsin Market
Effects study.12 13 In addition, we employ data from each of the PAs program tracking
databases, and obtain engineering data from a number of secondary data sources. We provide
a general description of each of these data elements below. A more comprehensive description
of these data is provided in Section 3.2.
The primary research effort included telephone surveys as well as in-depth interviews with five
key groups of market actors, as presented in Table 2-1.
12
High Bay Lighting Market Effects Study: Final Report. Prepared for the California Public Utilities
Commission Energy Division. KEMA June 18, 2010. 13
Focus on Energy Evaluation Business Programs: Channel Studies— Fiscal Year 2008. Prepared for
the State of Wisconsin Public Service Commission of Wisconsin. Prepared by KEMA. Final Report:
January 17, 2009.
Page | 20
Because, each group of market actors views the HBL market from differing perspectives, they
offer additional or sometimes unique pieces to the overall picture of potential market effects
attributable to the HBL programs. Table 2-1 indicates the purpose of each data collection effort,
the number of completed responses, and the data source(s) used to identify the sample. The
end-user and contractor surveys provide the basis for constructing the market effects model we
use to estimate the ―in program‖ and ―out of program‖ net energy savings attributable to HBL
programs. In addition, each data collection effort provides data used to triangulate the full
extent of market effects based on the preponderance of evidence from the various market actor
groups.
Table 2-1: Primary data collection plan for HBL market effects analysis
Target
population
Purpose of data collection Type of
instrument
Number of
completes
Source
End-users The population of Massachusetts based C&I firms
who made high-bay lighting purchases in the past
2 – 3 years provides the estimated total size of the
HBL market in the state.
Survey 125 D&B Selectory
database
Lighting
contractors
Electrical and lighting contractors that specify and
install high-bay lighting fixtures and controls
provide a broad understanding of the technology
shares and specification trends in the HBL
services they provide.
Survey 50 target/ (55
completed)
D&B Selectory
database
Distributors Retail firms that sell HBL products to contractors
and end users represent a valuable source of
information concerning changes in the regional
demand for HBL products, as well as trends in the
promotion and competitive position of HBL
products.
In-depth
interview
5 D&B Selectory
database
Manufacturers Companies that produce HBL products are aware
of inter-regional differences in the promotion and
distribution of energy efficient technologies, and
can also provide evidence of production cost
changes that may result from increased sales of
these products.
In-depth
interview
5 KEMA industry
contacts
Program staff Program staff provide information on program
design and logic, motivations and barriers to
program acceptance, and identify observed market
effects.
In-depth
interview
5 PA contacts
In addition to primary research data, we use the following three types of data in the analysis:
Control population data – We compared data collected from Massachusetts market actors to
a control population consisting of the four-state region used in the 2010 California High Bay

Page | 21
Lighting Study that included Alabama, Georgia, Mississippi, and South Carolina. 14 In addition,
we also compare the Massachusetts market actors’ responses to a number of survey responses
that were examined in Illinois, serving as the control state for the 2009 and 2010 Wisconsin
study.15
Program tracking data – Each of the five electric PA’s provided KEMA with program tracking
records that allowed identification of gross and net savings associated with HBL measures.
These data are essential for distinguishing between ―in program‖ and ―out of program‖ savings.
Other secondary data – The HBL market effects model requires additional data provided by
various engineering databases. Specifically, we obtained data regarding the average lumens
per square foot, and information concerning the average number of lumens per watt for different
technologies. This is based upon IESNA16, NYSERDA 17 as well as information provided by
RUDD and other lighting manufacturers.18
14
High Bay Lighting Market Effects Study: Final Report. Prepared for the California Public Utilities
Commission Energy Division. KEMA June 18, 2010.
Final Work Plan Project 1A New Construction Market Characterization. Prepared for the Massachusetts
Energy Efficiency Programs in Large Commercial & Industrial Evaluation Contractor (LCIEC). KEMA
August 6, 2010. 15
Focus on Energy Evaluation, Business Programs: Supply-side Evaluation. State of Wisconsin, Public
Service Commission of Wisconsin. Prepared by PA Consulting and KEMA. April 22, 2010. 16
Rea, Mark S., Editor-in-Chief. 2000. IESNA Lighting Handbook, (New York: Illuminating Engineering Society of
North America). 17 Technical Guide for Effective, Energy-Efficient Lighting. Prepared by The Lighting Research
Center Rensselaer Polytechnic Institute for the New York Energy $martSM Small Commercial
Lighting Program.
18 Ruud Lighting, High Bay Lighting Comparison Guide.
www.ruudlighting.com/literature/high_bay_lighting_guide.pdf, Accessed January 26, 2010..

Page | 22
2.3 Organization of report
The remainder of this report is structured as follows:
Methodology – Provides a detailed description of the methodology employed by this study
including the sample populations, primary research efforts, and a description of the analytical
approach.
Results – Presents results of both the market effects model and additional evidence of market
effects based on the preponderance of evidence from market actor surveys and interviews.
Conclusions –Summarizes the market effects analysis, discusses limitations of the analysis,
and provides recommendations.
Appendix – We also include the following three appendices at the end of the report:
Appendix A – provides a detailed description of the sampling approach used for each study,
response rate and sample weight calculations.
Appendix B provides detailed tabulated results from each market actor study.
Appendix C contains the individual research instruments.
Page | 23
3. Methodology
In order to account for the full range of market effects, our methodology provides specific point
estimates of the magnitude of net and gross savings that can be attributed to the program. We
further distinguish ―in program‖ from ―out of program‖ net savings, which are defined as follows:
In program effects – Gross and net (i.e. gross less free-ridership) savings from high-
bay lighting measures that receive program incentives and are tracked by program
tracking records.
Out of program effects (spillover) – Purchases and installations of energy-efficient
high bay lighting equipment that are attributable to the program, but did not receive
program incentives, and therefore, are not tracked by program tracking data.
The modeled approach we use to estimate program-attributable savings is limited in its ability to
isolate a true estimate of untracked spillover (i.e. out-of-program savings that attributable to the
program) from savings that results from exogenous factors such as separate building codes and
corporate policies. Therefore, we use data provided by market actor surveys to savings
resulting from these estimate these exogenous factors, allowing us to isolate untracked spillover
from out-of-program savings.
3.1 Study data
3.1.1 Primary research data
As discussed in Section 2, our basic approach to characterizing the market effects of the PAs’
programs is to compare the rate of adoption of efficient high bay lighting and related indicators
of their market acceptance in Massachusetts to the same indicators in a comparison area.
KEMA developed the data for the comparison area, which comprises Mississippi, Alabama,
Georgia, and South Carolina in the course of conducting a similar study of programs offered by
California utilities. Thus, in developing primary data for the Massachusetts market, we focused
on maintaining comparability with the methods and results of the earlier study, and on updating
information in the broader market where required by the overall method. For each group of
market actors addressed by the study, Table 3-1 shows the availability of control population
data from the California HBL studies.
Page | 24
Table 3-1: Summary of Comparison Area Data
MA 2010
CA MS, AL,
GA, SC
MA
Program Staff X X
Manufacturers X X X
Distributors X X X
Contractors X X X
End Users X X X
Market actor
group
CA 2010
Study/Comparison Area
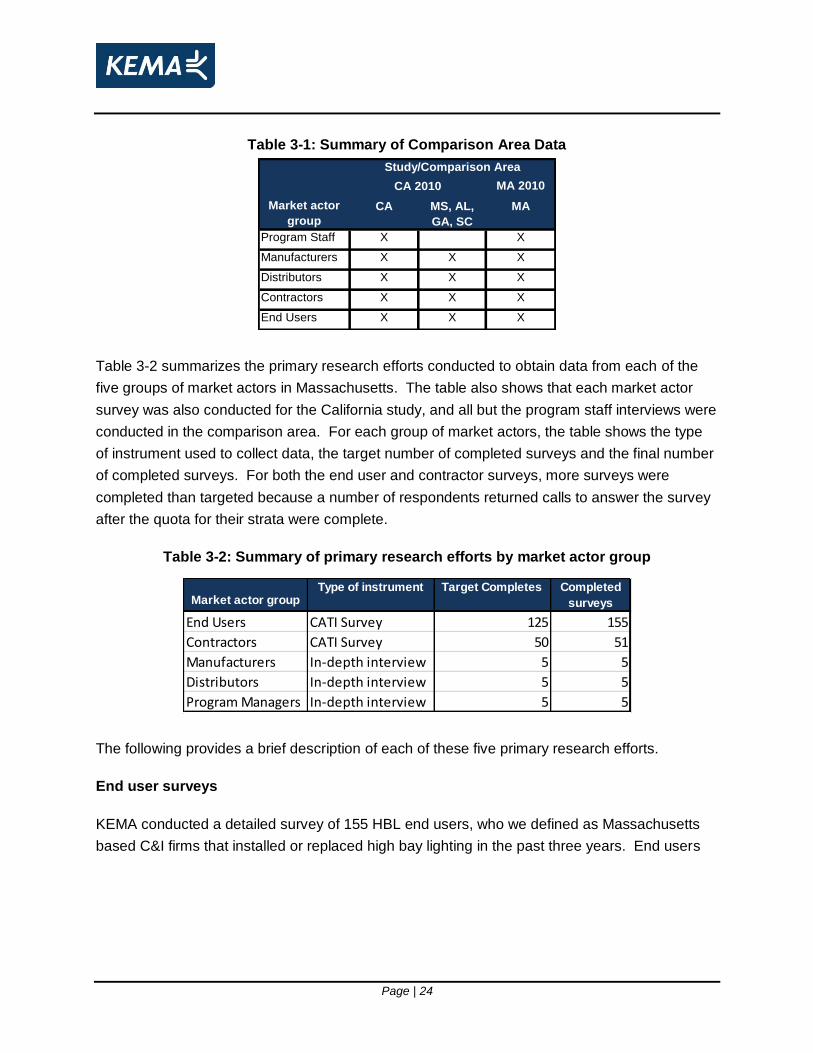
Table 3-2 summarizes the primary research efforts conducted to obtain data from each of the
five groups of market actors in Massachusetts. The table also shows that each market actor
survey was also conducted for the California study, and all but the program staff interviews were
conducted in the comparison area. For each group of market actors, the table shows the type
of instrument used to collect data, the target number of completed surveys and the final number
of completed surveys. For both the end user and contractor surveys, more surveys were
completed than targeted because a number of respondents returned calls to answer the survey
after the quota for their strata were complete.
Table 3-2: Summary of primary research efforts by market actor group
Market actor groupType of instrument Target Completes Completed
surveys
End Users CATI Survey 125 155
Contractors CATI Survey 50 51
Manufacturers In-depth interview 5 5
Distributors In-depth interview 5 5
Program Managers In-depth interview 5 5
The following provides a brief description of each of these five primary research efforts.
End user surveys
KEMA conducted a detailed survey of 155 HBL end users, who we defined as Massachusetts
based C&I firms that installed or replaced high bay lighting in the past three years. End users

Page | 25
were selected using a stratified random sampling approach that controlled for the number of
completed surveys by industry and company size.19 These data provided the basis for
estimating the total market size of high bay lighting and energy efficient high bay lighting in
Massachusetts. The primary objectives of the end user survey are listed below:
Estimate the total market for commercial and industrial high bay lighting;
Determine the share of high bay lighting that is energy efficient;
Provide evidence of market effects surrounding energy efficient high bay lighting;
Identify perceived drivers/barriers in selecting energy-efficient high bay lighting;
Identify decision makers and sources of information regarding lighting choices; and
Determine the presence of program effects and free-ridership.
End user survey results are weighted to reflect the total number of firms in the D&B database by
industry and employee size category for industries within the sample frame.
Contractor surveys
The research team collected data from a sample of 51 high bay lighting contractors (i.e. firms
that install high bay lighting fixtures) in Massachusetts. Data collected through this survey are
used to apportion estimates of the total market size (provided by the end user survey) by high
bay lighting technology. Lighting contractors were selected using a stratified random sampling
approach that controlled for the number of completed surveys by company size.20 Information
collected from these interviews is used to estimate the level of adoption of specific HBL
technologies in Massachusetts to meet the following objectives:
Estimate the share of high bay lighting that is energy efficient;
Determine the share of high bay lighting by technology;
19
See Appendix C.1 for a detailed description of the end user sampling approach. 20
See Appendix C.2 for a detailed description of the contractor sampling approach.

Page | 26
Investigate the promotion and customer adoption of lighting controls;
Assess the influence of building codes on high bay specification;
Investigate chain and franchise high bay lighting specification policies; and
Assess the influence of the program on the promotion and marketing of energy efficient
lighting.
Vendor survey responses are weighted to reflect the number of units of reported as sold or
installed by the sample establishment as well as by the population weight of the size stratum
from which the firm was drawn. Where the questionnaire seeks responses in the form of a
number or percentage—say, the percent of fixtures installed that used efficient technologies—
survey responses will be calculated using the combined ratio estimator cR̂ :
h i
i
h
h
h i
ih
h
h
c
xn
N
xBn
N
Ri
ˆ ,
Where
i = sample contractor, dealer, or distributor,
Nh = number of vendors in the population in sample stratum h,
nh = number of vendors in the sample in stratum h,
ihB = vendor i’s response (expressed as a number or percentage), and
xi = number of units vendor i reported installed in the evaluation period.
If the question elicits a categorical response (e.g., yes/no), a ihB will be created for each
possible response. For the selected response (responses if choose all that apply), ihB = 1. For
the response/s not selected, ihB = 0.
This procedure essentially weights responses by the reported number of units sold or installed
for each sample firm, thus providing an explicit representation of market share.

Page | 27
Lighting distributors and manufacturer interviews
KEMA conducted in-depth interviews with five lighting distributors and five lighting
manufacturers in order to provide qualitative evidence of market effects resulting from HBL
programs to meet the following objectives:
Provide evidence of sales trends, level of awareness, and attitudes toward energy efficient high-
bay lighting;
Investigate the promotion and customer adoption of lighting controls; and
Assess the influence of the program on promotion and marketing of energy efficient lighting.
Program staff
Program Administrator staff represent a rich knowledgebase regarding current and past market
trends and program effects. KEMA conducted five interviews with key players from each of the
five PA’s to meet the following objectives:
Provide information on program design and logic;
Identify potential motivations and barriers to program acceptance; and
Identify observed market effects.
Table 3-3 summarizes the data collected from each of these five market actor groups. We
present the sampling plan for each research effort and the actual market actor survey
instruments in Appendices A and C, respectively.

Page | 28
Table 3-3: Inventory of primary research by market actor research instrument
Primary research questions Co
ntr
acto
rs
En
d U
sers
Man
ufa
ctu
rers
Dis
trib
uto
rs
Pro
gra
m M
anag
ers
Screening and Firmographics √ √ √ √
Sales/Inventory of HLB by technology
Fluorescent lamps √ √ √ √
High pressure sodium √ √ √
LED √ √ √
Lighting controls √ √
Pulse start metal halides √ √ √ √
Overall √ √ √ √ √
Factors influencing lighting choices
Chains and franchises √
State and local building codes √
Program incentives √ √
Reasons for installing √ √ √ √ √
Awareness of energy efficient HBL products and their benefits √ √ √ √
Customer approval of HBL energy efficient technologies √
Marketing support and promotion of energy efficient HBL √ √ √ √
Recommendations of energy efficient HBL
Extent recommendations are made √ √
Degree recommendations are followed √ √
Reasons for recommending √ √
Impact of ceiling height on recommendations √
Program information
Awareness √ √
Descriptions √
Logic √
Regional comparisons of energy efficient lighting
Awareness √
Sales √
Programs √
Page | 29
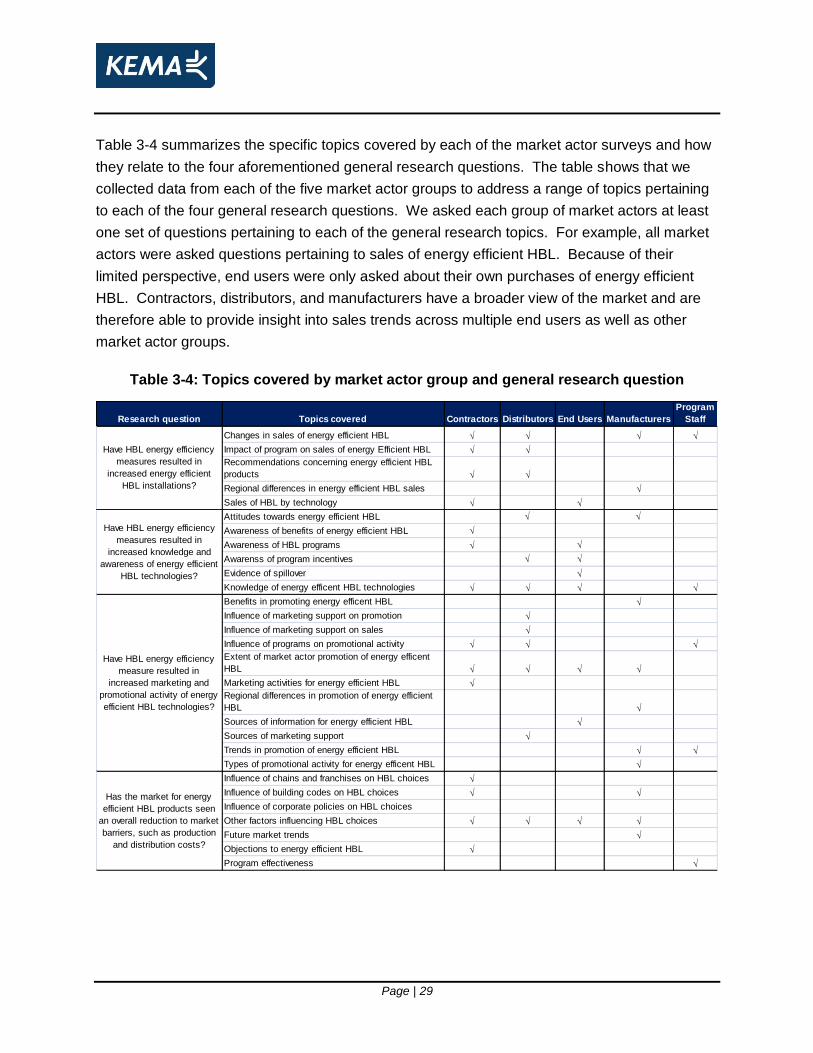
Table 3-4 summarizes the specific topics covered by each of the market actor surveys and how
they relate to the four aforementioned general research questions. The table shows that we
collected data from each of the five market actor groups to address a range of topics pertaining
to each of the four general research questions. We asked each group of market actors at least
one set of questions pertaining to each of the general research topics. For example, all market
actors were asked questions pertaining to sales of energy efficient HBL. Because of their
limited perspective, end users were only asked about their own purchases of energy efficient
HBL. Contractors, distributors, and manufacturers have a broader view of the market and are
therefore able to provide insight into sales trends across multiple end users as well as other
market actor groups.
Table 3-4: Topics covered by market actor group and general research question
Research question Topics covered Contractors Distributors End Users Manufacturers
Program
Staff
Changes in sales of energy efficient HBL √ √ √ √
Impact of program on sales of energy Efficient HBL √ √
Recommendations concerning energy efficient HBL
products √ √
Regional differences in energy efficient HBL sales √
Sales of HBL by technology √ √
Attitudes towards energy efficient HBL √ √
Awareness of benefits of energy efficient HBL √
Awareness of HBL programs √ √
Awarenss of program incentives √ √
Evidence of spillover √
Knowledge of energy efficent HBL technologies √ √ √ √
Benefits in promoting energy efficent HBL √
Influence of marketing support on promotion √
Influence of marketing support on sales √
Influence of programs on promotional activity √ √ √
Extent of market actor promotion of energy efficent
HBL √ √ √ √
Marketing activities for energy efficient HBL √
Regional differences in promotion of energy efficient
HBL √
Sources of information for energy efficient HBL √
Sources of marketing support √
Trends in promotion of energy efficient HBL √ √
Types of promotional activity for energy efficent HBL √
Influence of chains and franchises on HBL choices √
Influence of building codes on HBL choices √ √
Influence of corporate policies on HBL choices
Other factors influencing HBL choices √ √ √ √
Future market trends √
Objections to energy efficient HBL √
Program effectiveness √
Have HBL energy efficiency
measures resulted in
increased energy efficient
HBL installations?
Have HBL energy efficiency
measures resulted in
increased knowledge and
awareness of energy efficient
HBL technologies?
Have HBL energy efficiency
measure resulted in
increased marketing and
promotional activity of energy
efficient HBL technologies?
Has the market for energy
efficient HBL products seen
an overall reduction to market
barriers, such as production
and distribution costs?
Page | 30
3.1.2 Comparison area data
Our analysis isolates market effects resulting from the Massachusetts PAs HBL program
measures from naturally occurring trends in the HBL market. In order to distinguish program
induced market effects from naturally occurring trends, we compared our modeled energy
savings to savings resulting from energy efficiency sales in a non-program region, the
comparison area. The comparison area represents the baseline level of energy efficient
technology adoption. However, due to widespread adoption of HBL programs among many
states, only a limited number of suitable comparison states currently exist. Therefore, our
analysis uses the comparison population from the 2010 California HBL study to identify the total
program attributable market effects savings resulting from naturally occurring sales of energy
efficient HBL.
3.1.3 Secondary data
The market effects model we used to derive estimates of net program savings requires two
critical data elements derived from secondary sources: the lighting requirements of the space
illuminated by new HBL purchases; and the installed efficacy of that equipment. The former is
measured in terms of average lumens per square foot, while the latter provides a measure of
the average watts per lumen of recent purchases. In order to use the control group from the
2010 California HBL study to construct the model for our analysis, we base our estimates of
these two values on the same data inputs and assumptions used in the California study, but
adjust the calculations to reflect the mix of HBL space and technology shares in Massachusetts.
The following provides a brief description of these data elements.
Lumens per square foot –KEMA obtained the standard lighting levels for various types of high
bay spaces from IESNA.21 These estimates are then applied to the distribution of high-bay
spaces provided by the Massachusetts end user survey to obtain the average lumens per
square foot associated with recent HBL purchases.
21
IESNA recommended lighting levels and CLP lighting power allowances from the New York State Energy
Research and Development Authority Commercial Lighting Program,
http://www.nyserda.org/sclp2/technicalGuide/about/avgIlluminance.asp?section=1.1.7, accessed February 2, 2010.

Page | 31
Lumens per watt – For each of the HBL technologies analyzed, we used the estimated number
of lumens per watt. These data were derived from the IESNA Lighting Handbook,22and Ruud.23
The IESNA Lighting Handbook24 indicates that initial lighting levels of HBL technologies should
be set such that the amount of lighting installed will provide a recommended lighting level after
40 percent of the fixtures’ rated life has elapsed. In addition, lighting levels should be further
adjusted to reflect ceiling height. We estimated the average lumen per watt installed for
Massachusetts and the comparison area fixture sales by applying the results of the technology
share analysis to the design efficacy of the various technology types.
3.1.4 Program tracking data
A key input to the HBL market effects model is the gross MWh savings for HBL measures.
KEMA used the PA provided program tracking data to develop an operational definition of HBL
measures. The tracking data did not specifically call out HBL measures, but did identify the
lighting products covered. Therefore, the evaluation team employed the following steps to
define HBL measures for this analysis:
1. Non-Lighting measures were excluded;
2. Data for years prior to 2006 were excluded;
3. Measure descriptions were screened for the terms ―high bay‖, ―T5,‖ ―pulse start metal
halide,‖ and
4. Following PA reviews, additional HBL measures were identified, including some high
intensity fluorescent fixtures and occupancy controls.
3.2 Market effects model
Figure 3-1 provides a visual representation of the market effects model. The top half of the
diagram shows the data inputs and processes we used to estimate the total MW resulting from
recent HBL purchases in Massachusetts (MW installed). The bottom half of the diagram shows
22
Rea, Mark S., Editor-in-Chief. 2000. IESNA Lighting Handbook, (New York: Illuminating Engineering Society of
North America). 23
Ruud Lighting, High Bay Lighting Comparison Guide.
www.ruudlighting.com/literature/high_bay_lighting_guide.pdf, Accessed January 26, 2010. 24
Rea, Mark S., Editor-in-Chief. 2000. IESNA Lighting Handbook, (New York: Illuminating Engineering Society of
North America).
Page | 32
data and processes used to estimate the MW installed for the control population. We identify
data inputs to the modeling process using purple rectangles. The pink hexagonal shapes
represent processes in which we have synthesized data inputs, while the blue diamonds depict
intermediary outputs.
Starting in the top half of the diagram first, the process of estimating MW installed in
Massachusetts begins with the end user surveys, which we used to obtain the estimated square
footage served by recent HBL purchases. Next, we incorporated engineering data concerning
the average lumens per square foot for buildings in Massachusetts to estimate total lumen
output of recent HBL purchases in Massachusetts. Third, we combined the estimated total
lumens requirements of recent HBL purchases with engineering estimates of the average watts
per lumen, and the contractor reported technology shares associated with recent HBL
purchases. This provides us with the estimated MW installed in Massachusetts.
The bottom half of the diagram shows that we use the same process to estimate the number of
MW that would be needed to provide lighting levels required by current standards to C&I high
bay spaces in Massachusetts, assuming baseline levels of efficiency.25 Next, we subtract the
MW installed in the control area from the mega-watts installed in Massachusetts to arrive at the
difference in installed MW that corresponds to the difference in the market share of energy
efficient high bay lighting equipment between Massachusetts and the comparison area. Finally,
incorporating the program tracking data supports an estimate of the portion of the difference in
MW installed that is associated with program participants on the one hand, and with non-
participants on the other. These correspond to ―in program‖ measure adoptions and ―out-of-
program‖ measure adoptions respectively.
25
Note the market effects model uses the control population from the 2010 California HBL study.

Page | 33
Figure 3-1: Graphical Overview of the Market Effects Model
(1) End User Surveys
(A) Total HBL Space
Served by Recent
Purchases in
MA
(3) CA HBL Study
(End User Data)
(B) Total HBL
Space Served by
Recent Purchases
in Control Area
(5) Secondary Data
(Average Lumens per SQFT)
Total Lumen
Output of HBL
Purchases in Control
Area
Total Lumen
Output of HBL
Purchases in MA
(2) Contractor Surveys
(4) CA HBL Study
(Contractor Data)
(D) Technology
Shares of Recent
HBL Purchases in
Control Area
(6) Secondary Data
(Lumens per watt at
design levels)
(C) Technology
Shares of Recent
HBL Purchases in
MA
MW Installed
MA HBL
MW Installed
Control Area
HBL
Total Net Savings
Resulting from Differing
Technology Shares
between MA and Control
Area
(7) Program
Tracking Data
“In” and “Out-of-
Program” total Net
Savings of HBL
Measured in MA
Mas
sach
use
tts
Co
ntr
ol A
rea
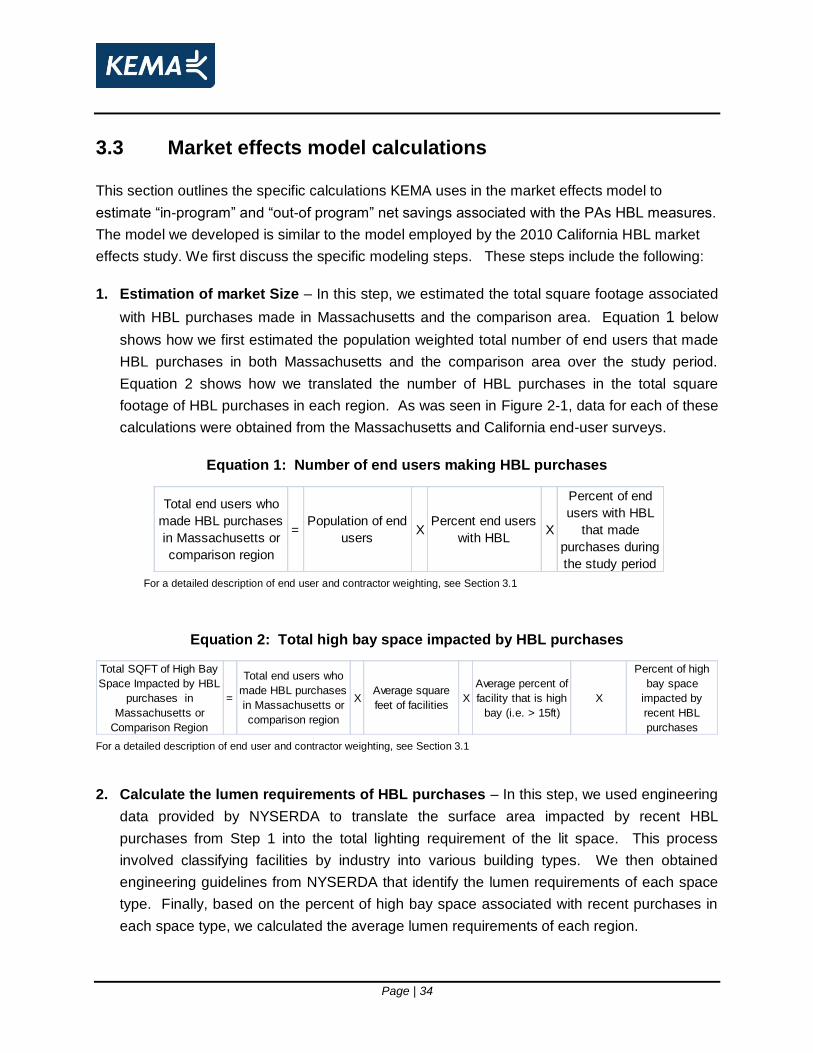
Page | 34
3.3 Market effects model calculations
This section outlines the specific calculations KEMA uses in the market effects model to
estimate ―in-program‖ and ―out-of program‖ net savings associated with the PAs HBL measures.
The model we developed is similar to the model employed by the 2010 California HBL market
effects study. We first discuss the specific modeling steps. These steps include the following:
1. Estimation of market Size – In this step, we estimated the total square footage associated
with HBL purchases made in Massachusetts and the comparison area. Equation 1 below
shows how we first estimated the population weighted total number of end users that made
HBL purchases in both Massachusetts and the comparison area over the study period.
Equation 2 shows how we translated the number of HBL purchases in the total square
footage of HBL purchases in each region. As was seen in Figure 2-1, data for each of these
calculations were obtained from the Massachusetts and California end-user surveys.
Equation 1: Number of end users making HBL purchases
Total end users who
made HBL purchases
in Massachusetts or
comparison region
=Population of end
usersX
Percent end users
with HBLX
Percent of end
users with HBL
that made
purchases during
the study period For a detailed description of end user and contractor weighting, see Section 3.1
Equation 2: Total high bay space impacted by HBL purchases
Total SQFT of High Bay
Space Impacted by HBL
purchases in
Massachusetts or
Comparison Region
=
Total end users who
made HBL purchases
in Massachusetts or
comparison region
XAverage square
feet of facilitiesX
Average percent of
facility that is high
bay (i.e. > 15ft)
X
Percent of high
bay space
impacted by
recent HBL
purchases For a detailed description of end user and contractor weighting, see Section 3.1
2. Calculate the lumen requirements of HBL purchases – In this step, we used engineering
data provided by NYSERDA to translate the surface area impacted by recent HBL
purchases from Step 1 into the total lighting requirement of the lit space. This process
involved classifying facilities by industry into various building types. We then obtained
engineering guidelines from NYSERDA that identify the lumen requirements of each space
type. Finally, based on the percent of high bay space associated with recent purchases in
each space type, we calculated the average lumen requirements of each region.

Page | 35
3. Estimate the technology shares and wattage installed: For both Massachusetts and the
comparison area, we identified the percent of HBL purchases that employ different HBL
technologies through surveys of lighting installation contractors, which were weighted
according to the percent of all HBL projects completed by each respondent. We combine
these technology shares with information pertaining to the average lumens per watt as
identified by the IESNA Lighting Handbook to obtain the average efficacy of HBL purchases
in each region.
4. Estimate demand and energy use reductions in Massachusetts and the comparison
area (total program attributable savings) – In this step, we multiplied the surface area
impacted by HBL purchases in Massachusetts by the average efficacy for purchases in
each region (from Step 3) to estimate the average efficacy of HBL purchases in each region.
Then, we subtracted the efficacy associated with purchases in the comparison region from
those in Massachusetts to estimate the demand reductions in Massachusetts, net naturally
occurring savings that are present in the comparison area. Finally, we multiplied the
demand savings by an assumed value for average annual hours of use estimate program-
attributable savings.
5. Separate total savings into “in-program” and “outside the program” – In this step, we
subtract the tracked net savings provided by each of the PAs from the modeled result in
step 4 to identify those savings attributable to the program.
As previously stated, we analyzed survey results from a broad range of market actors to provide
supplemental evidence of market effects. In contrast to the modeled approach outlined above,
this portion of the analysis relies on a preponderance of evidence obtained from primary
research to determine the extent of program related changes to market share, availability,
design specification, marketing practices, production costs, awareness, and perceptions of
energy efficient HBL products.

Page | 36
4. Results
In this section, we present the results of our estimates of net savings based on the market
effects model we defined in the previous section. First, the presentation of results follows the
model development process as we identify the survey and other data collection results used as
model inputs. After developing the final model, we present the resulting savings estimates for
HBL measures in Massachusetts. Finally, we present additional evidence of market effects
identified through the analysis of the various market actor surveys.
4.1 Market effects model results
To show how the market effects model results were calculated, this section describes the
processes used in all five steps of the model.
4.1.1 Estimation of Market Size
The first step in estimating the savings attributable to HBL measures is to estimate the total
market for HBL purchases over the past four years in both Massachusetts and the control area.
Of course, it would be best to have information on the number, type, and wattage of fixtures sold
for use in high bay spaces in Massachusetts. However, no market actors keep track of that kind
of information. We therefore developed and implemented a multi-step method to estimate the
number of fixtures sold and the total installed wattage they represent. As a first step, we
defined the total market as the floor space served by HBL purchases over the study period.
This value provided a limit to potential savings resulting from energy efficient HBL purchases.
In the absence of published HBL purchase data, our estimate of HBL purchases in
Massachusetts were based on the end-user survey results, while the control area estimates
were derived from the 2010 California HBL study. Estimating the total floor space served by
recent HBL purchases required the following two steps:
Estimate the number of end users who purchased HBL during the study period; and
Calculate the total square footage associated with those purchases.
Table 4-1 below presents the calculated number of end users who made HBL purchases during
the study period for both Massachusetts and the control region. For comparison purposes, we
also present the calculations used in the 2010 California HBL study. Due to the timing of the
two studies, data collected through the CA study are reported for 2006 through 2008, while the
Massachusetts data are reported for 2007 through 2010. As seen in Table 4-1, the estimated
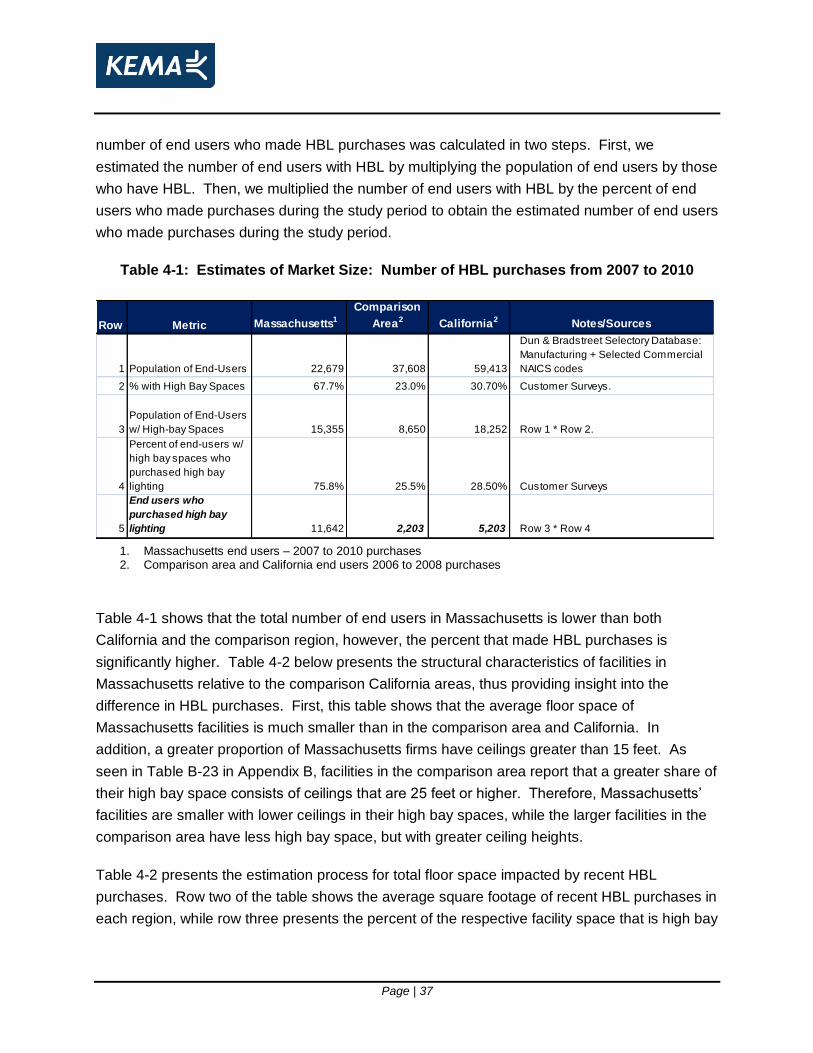
Page | 37
number of end users who made HBL purchases was calculated in two steps. First, we
estimated the number of end users with HBL by multiplying the population of end users by those
who have HBL. Then, we multiplied the number of end users with HBL by the percent of end
users who made purchases during the study period to obtain the estimated number of end users
who made purchases during the study period.
Table 4-1: Estimates of Market Size: Number of HBL purchases from 2007 to 2010
Row Metric Massachusetts1
Comparison
Area2 California2 Notes/Sources
1 Population of End-Users 22,679 37,608 59,413
Dun & Bradstreet Selectory Database:
Manufacturing + Selected Commercial
NAICS codes
2 % with High Bay Spaces 67.7% 23.0% 30.70% Customer Surveys.
3
Population of End-Users
w/ High-bay Spaces 15,355 8,650 18,252 Row 1 * Row 2.
4
Percent of end-users w/
high bay spaces who
purchased high bay
lighting 75.8% 25.5% 28.50% Customer Surveys
5
End users who
purchased high bay
lighting 11,642 2,203 5,203 Row 3 * Row 4
1. Massachusetts end users – 2007 to 2010 purchases 2. Comparison area and California end users 2006 to 2008 purchases
Table 4-1 shows that the total number of end users in Massachusetts is lower than both
California and the comparison region, however, the percent that made HBL purchases is
significantly higher. Table 4-2 below presents the structural characteristics of facilities in
Massachusetts relative to the comparison California areas, thus providing insight into the
difference in HBL purchases. First, this table shows that the average floor space of
Massachusetts facilities is much smaller than in the comparison area and California. In
addition, a greater proportion of Massachusetts firms have ceilings greater than 15 feet. As
seen in Table B-23 in Appendix B, facilities in the comparison area report that a greater share of
their high bay space consists of ceilings that are 25 feet or higher. Therefore, Massachusetts’
facilities are smaller with lower ceilings in their high bay spaces, while the larger facilities in the
comparison area have less high bay space, but with greater ceiling heights.
Table 4-2 presents the estimation process for total floor space impacted by recent HBL
purchases. Row two of the table shows the average square footage of recent HBL purchases in
each region, while row three presents the percent of the respective facility space that is high bay
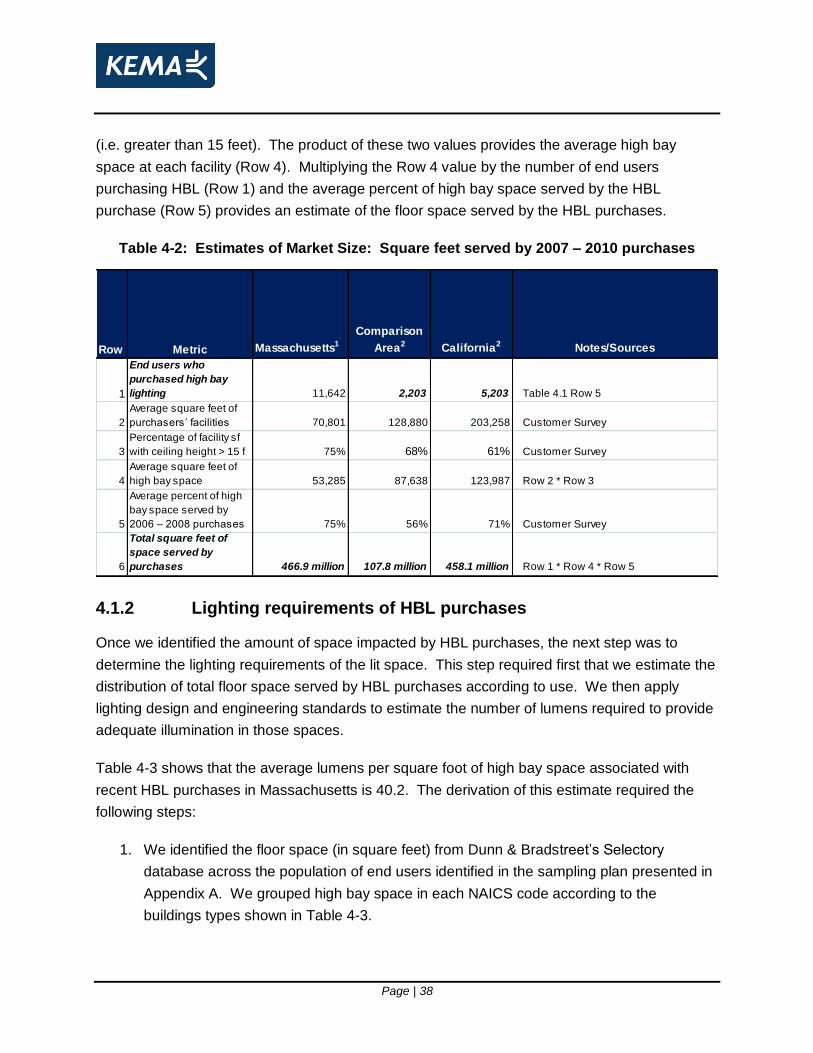
Page | 38
(i.e. greater than 15 feet). The product of these two values provides the average high bay
space at each facility (Row 4). Multiplying the Row 4 value by the number of end users
purchasing HBL (Row 1) and the average percent of high bay space served by the HBL
purchase (Row 5) provides an estimate of the floor space served by the HBL purchases.
Table 4-2: Estimates of Market Size: Square feet served by 2007 – 2010 purchases
Row Metric Massachusetts1
Comparison
Area2 California2 Notes/Sources
1
End users who
purchased high bay
lighting 11,642 2,203 5,203 Table 4.1 Row 5
2
Average square feet of
purchasers’ facilities 70,801 128,880 203,258 Customer Survey
3
Percentage of facility sf
with ceiling height > 15 f 75% 68% 61% Customer Survey
4
Average square feet of
high bay space 53,285 87,638 123,987 Row 2 * Row 3
5
Average percent of high
bay space served by
2006 – 2008 purchases 75% 56% 71% Customer Survey
6
Total square feet of
space served by
purchases 466.9 million 107.8 million 458.1 million Row 1 * Row 4 * Row 5
4.1.2 Lighting requirements of HBL purchases
Once we identified the amount of space impacted by HBL purchases, the next step was to
determine the lighting requirements of the lit space. This step required first that we estimate the
distribution of total floor space served by HBL purchases according to use. We then apply
lighting design and engineering standards to estimate the number of lumens required to provide
adequate illumination in those spaces.
Table 4-3 shows that the average lumens per square foot of high bay space associated with
recent HBL purchases in Massachusetts is 40.2. The derivation of this estimate required the
following steps:
1. We identified the floor space (in square feet) from Dunn & Bradstreet’s Selectory
database across the population of end users identified in the sampling plan presented in
Appendix A. We grouped high bay space in each NAICS code according to the
buildings types shown in Table 4-3.

Page | 39
2. Next, we similarly grouped end user survey responses by the nine building types listed
and identified the percent of each building type that is high bay.
3. Multiplying the total floor space in each building type by the percent of space that is high
bay provided the estimated total high bay space for each building type.
4. We then divided the high bay space in each building type by the roughly 620 million sq ft
of high bay space in Massachusetts to obtain the percent of all high bay space in
Massachusetts located in each building type.
5. Using NYSERDA data on lumens per square foot by building type and the percent of
high bay space by building type, we calculated the weighted average of lumens per
square foot across all Massachusetts facilities.
6. Finally, we multiplied the 466.9 million square feet of high bay space in Massachusetts
by 40.2 lumens per square foot to estimate the total lumen output of HBL purchases,
equal to 18,773 lumens.
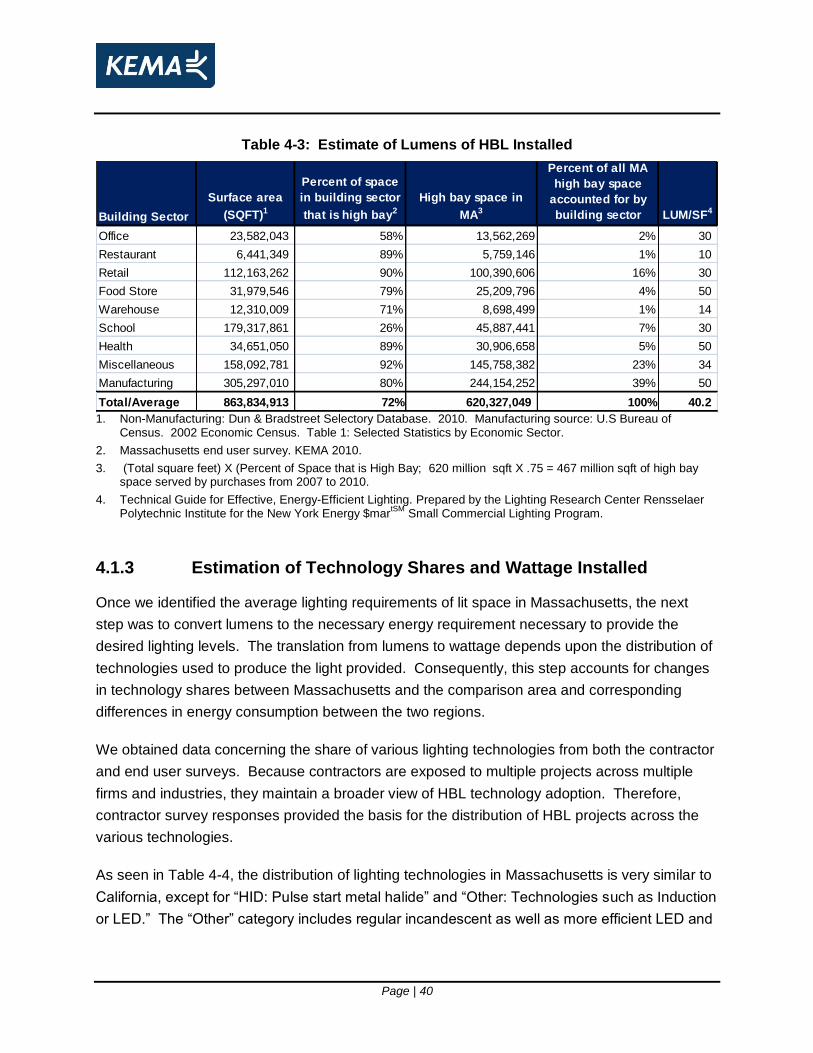
Page | 40
Table 4-3: Estimate of Lumens of HBL Installed
Building Sector
Surface area
(SQFT)1
Percent of space
in building sector
that is high bay2
High bay space in
MA3
Percent of all MA
high bay space
accounted for by
building sector LUM/SF4
Office 23,582,043 58% 13,562,269 2% 30
Restaurant 6,441,349 89% 5,759,146 1% 10
Retail 112,163,262 90% 100,390,606 16% 30
Food Store 31,979,546 79% 25,209,796 4% 50
Warehouse 12,310,009 71% 8,698,499 1% 14
School 179,317,861 26% 45,887,441 7% 30
Health 34,651,050 89% 30,906,658 5% 50
Miscellaneous 158,092,781 92% 145,758,382 23% 34
Manufacturing 305,297,010 80% 244,154,252 39% 50
Total/Average 863,834,913 72% 620,327,049 100% 40.2 1. Non-Manufacturing: Dun & Bradstreet Selectory Database. 2010. Manufacturing source: U.S Bureau of
Census. 2002 Economic Census. Table 1: Selected Statistics by Economic Sector.
2. Massachusetts end user survey. KEMA 2010.
3. (Total square feet) X (Percent of Space that is High Bay; 620 million sqft X .75 = 467 million sqft of high bay space served by purchases from 2007 to 2010.
4. Technical Guide for Effective, Energy-Efficient Lighting. Prepared by the Lighting Research Center Rensselaer Polytechnic Institute for the New York Energy $mar
tSM Small Commercial Lighting Program.
4.1.3 Estimation of Technology Shares and Wattage Installed
Once we identified the average lighting requirements of lit space in Massachusetts, the next
step was to convert lumens to the necessary energy requirement necessary to provide the
desired lighting levels. The translation from lumens to wattage depends upon the distribution of
technologies used to produce the light provided. Consequently, this step accounts for changes
in technology shares between Massachusetts and the comparison area and corresponding
differences in energy consumption between the two regions.
We obtained data concerning the share of various lighting technologies from both the contractor
and end user surveys. Because contractors are exposed to multiple projects across multiple
firms and industries, they maintain a broader view of HBL technology adoption. Therefore,
contractor survey responses provided the basis for the distribution of HBL projects across the
various technologies.
As seen in Table 4-4, the distribution of lighting technologies in Massachusetts is very similar to
California, except for ―HID: Pulse start metal halide‖ and ―Other: Technologies such as Induction
or LED.‖ The ―Other‖ category includes regular incandescent as well as more efficient LED and

Page | 41
induction fixtures. Analysis of the verbatim responses to the ―Other‖ category from
Massachusetts contractors revealed that a number of the largest contractors have moved away
from program sponsored bulbs and are now primarily installing LED fixtures. This finding
indicates that contractors recognize the benefits of energy efficient lighting, absent program
incentives. This table also shows that Massachusetts and California contractors report
substantially higher shares of T-5 fluorescent tubes than the comparison area.
Table 4-4: Contractor-reported Technology Shares of High Bay Lighting Installations
Technology Massachusetts1
Comparison
Area2 California2
Fluorescent Tube: T-5/ Electronic Ballast T-5 64% 29% 65%
Fluorescent Tube: T-8 /Electronic Ballast T-8 13% 16% 14%
Fluorescent Tube: All other, including T12/Magnetic
Ballast 1% 11% 1%
HID: Pulse-start metal halide 3% 31% 14%
HID: High-pressure sodium 1% 8% 3%
HID: Other HID such as mercury vapor or probe-start
metal halide 1% 3% 1%
Other: technologies such as Induction or LED 17% 2% 2%
1. Massachusetts contractor shares for 2007 to 2010 2. Comparison area and California contractor shares for 2008
Table 4-4 presents initial and design level efficacies for each lighting technology. The IESNA
Lighting Handbook indicates that lighting design levels should reflect the expected amount of
lighting after 40 percent of the fixture’s useful life. KEMA recognizes that actual installation
levels may differ from recommended, but in the absence of data to suggest the appropriate we
adjusted the design level efficacy to account for an average installation levels, we assume, on
average the data in Table 4-5 are representative of actual practices. In addition, design
efficacies should be adjusted downward to account for ceiling height. As seen in the last
column of Table 4-5, ceiling height of 27 feet. We estimated the average lumen per watt
installed for the Massachusetts and comparison area fixture sales by applying the results of the
technology share analysis to the design efficacy of the various technology types.
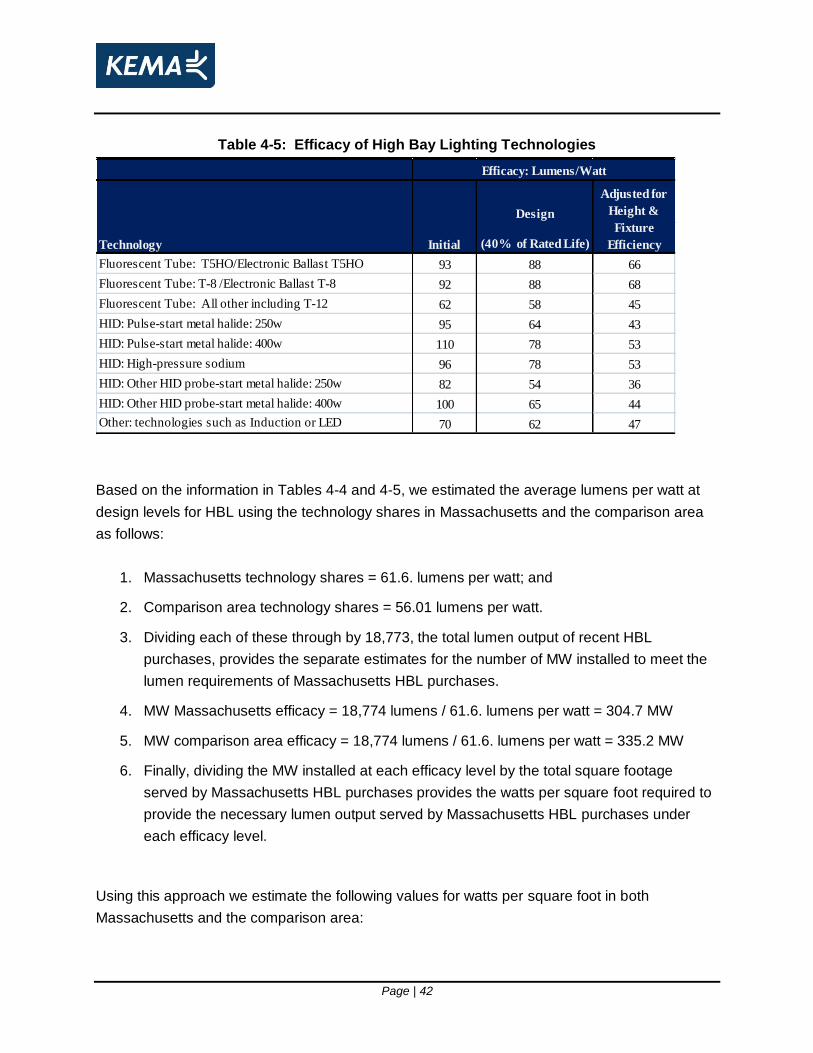
Page | 42
Table 4-5: Efficacy of High Bay Lighting Technologies
Design
(40% of Rated Life)
Fluorescent Tube: T5HO/Electronic Ballast T5HO 93 88 66
Fluorescent Tube: T-8 /Electronic Ballast T-8 92 88 68
Fluorescent Tube: All other including T-12 62 58 45
HID: Pulse-start metal halide: 250w 95 64 43
HID: Pulse-start metal halide: 400w 110 78 53
HID: High-pressure sodium 96 78 53
HID: Other HID probe-start metal halide: 250w 82 54 36
HID: Other HID probe-start metal halide: 400w 100 65 44
Other: technologies such as Induction or LED 70 62 47
Efficacy: Lumens/Watt
Technology Initial
Adjusted for
Height &
Fixture
Efficiency
Based on the information in Tables 4-4 and 4-5, we estimated the average lumens per watt at
design levels for HBL using the technology shares in Massachusetts and the comparison area
as follows:
1. Massachusetts technology shares = 61.6. lumens per watt; and
2. Comparison area technology shares = 56.01 lumens per watt.
3. Dividing each of these through by 18,773, the total lumen output of recent HBL
purchases, provides the separate estimates for the number of MW installed to meet the
lumen requirements of Massachusetts HBL purchases.
4. MW Massachusetts efficacy = 18,774 lumens / 61.6. lumens per watt = 304.7 MW
5. MW comparison area efficacy = 18,774 lumens / 61.6. lumens per watt = 335.2 MW
6. Finally, dividing the MW installed at each efficacy level by the total square footage
served by Massachusetts HBL purchases provides the watts per square foot required to
provide the necessary lumen output served by Massachusetts HBL purchases under
each efficacy level.
Using this approach we estimate the following values for watts per square foot in both
Massachusetts and the comparison area:

Page | 43
Watts per Square foot Massachusetts efficacy = 304.7 MW / 466.7 sqft = 0.65 watts/sqft
Watts per Square foot Comparison area efficacy = 335.7 MW / 466.7 sqft = 0.72 watts/sqft
4.1.4 Estimation of Demand and Energy Use Reductions: Massachusetts and the Comparison Area
In this section, we describe the process by which the model inputs identified above are
combined to estimate the total program-attributable savings.
Table 4-6 below details the steps used in this computation. In the first step of this calculation,
we combined the technology shares for each region and the corresponding efficacy of each
technology to obtain the estimated efficacy of purchases in each region (Rows 2 and 3). Next,
we estimated the total MW of HBL purchased in both regions by dividing the total number of
square feet (Row1) by the lighting efficacy for purchases in each region, Rows 2 and 3
respectively. Subtracting the MW installed in the comparison area (Row 5) from that in
Massachusetts (Row 4) provided the difference in baseline and actual installed capacity (Row
6), 30.5 MW. Finally, we multiplied this difference by an assumed estimate of average annual
operating hours (2,975 hours) to estimate the difference in energy consumption between the
program and comparison areas, 90.7 GWh/year.26 This value represents our estimated total
program-attributable energy savings. Because this estimate removes savings associated with
naturally occurring sales of energy efficient high bay lighting (i.e. sales in the no program
comparison area), it represents total program-attributable savings only.
26
For comparison purposes, the 2010 CA study found 97.2 GWh/year in annual savings.

Page | 44
Table 4-6: Demand and annual energy use reductions
Row Item Value Notes/Sources
1
Total square feet served by 2007
– 2010 HBL Purchases 466.9 million Estimated from MA end-user survey
2
Average watts per square foot
(lighting power density):
Program Area Efficacy 0.65 w/sf
Estimated based on technology share
results from the MA contractor survey
3
Average watts per square foot
(lighting power density): Baseline
Efficacy 0.72 w/sf
Estimated based on technology share
results from the Comparison Area
contractor survey
4
Total MW of high bay lighting
purchased: Program Area 304.7 MW Row 2 * Row 1
5
Total MW of high bay lighting
purchased: Baseline Efficacy 335.2 MW Row 3 * Row 1
6
Difference in MW installed:
Program Area v. Baseline
Efficacy 30.5 MW Row 5 – Row 4
7
Difference in GWh/Year
Usage: Program Area v.
Baseline Efficacy 90.7 GWh/Year
Row 6 * average annual operating hours
per – 2,975 hours/year
4.1.5 Savings “Outside the Program” and Attribution to Program Effects
In the final step in the modeling process, we separated the 90.7 GWh of savings into ―in-
program‖ and ―out-of-program‖ savings. The former are savings that receive program incentives
and are consequently tracked by program records. Therefore, this step in the analysis used the
average net savings estimates provided by the PA’s program tracking data to distinguish
between ―in-program‖ and ―out-of-program saving‖ net savings.
Program tracking data KEMA obtained from each of the five PAs contained 8,044 transactions
that were likely to have involved high bay lighting over the past four years. These data are
summarized in Table 4-7 which presents the number of rebates and fixtures, as well as gross
and net energy savings. The table shows HBL measures account for over 145 GWh in gross
and 137 GWh in net savings since 2007. However, the data clearly demonstrate that tracked
savings are not constant throughout the time period. Specifically, the initial level of savings in
2007 and 2008 is much higher than that seen in the latter two years, particularly, 2010. In order
to reduce the impact of higher in-program savings realized in the early part of the study period,
we use the 2010 level of program tracked savings to account for program tracked net and gross
savings.
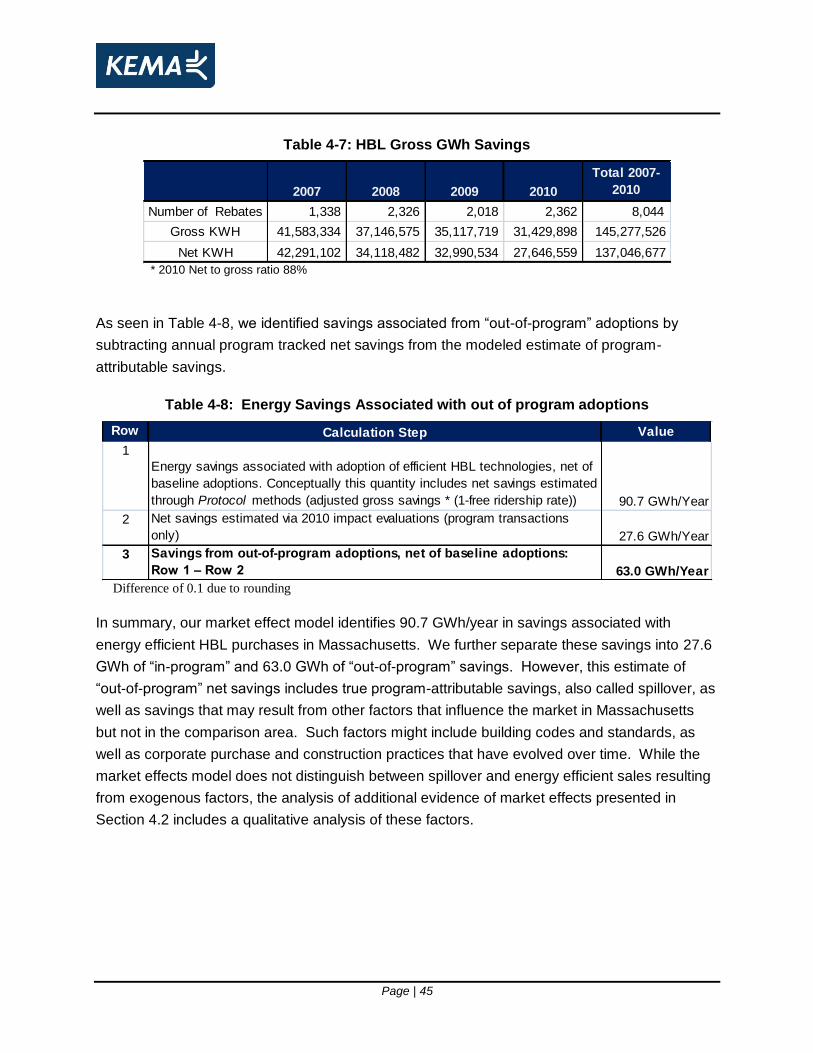
Page | 45
Table 4-7: HBL Gross GWh Savings
2007 2008 2009 2010
Total 2007-
2010
Number of Rebates 1,338 2,326 2,018 2,362 8,044
Gross KWH 41,583,334 37,146,575 35,117,719 31,429,898 145,277,526
Net KWH 42,291,102 34,118,482 32,990,534 27,646,559 137,046,677 * 2010 Net to gross ratio 88%
As seen in Table 4-8, we identified savings associated from ―out-of-program‖ adoptions by
subtracting annual program tracked net savings from the modeled estimate of program-
attributable savings.
Table 4-8: Energy Savings Associated with out of program adoptions
Row Calculation Step Value
1
Energy savings associated with adoption of efficient HBL technologies, net of
baseline adoptions. Conceptually this quantity includes net savings estimated
through Protocol methods (adjusted gross savings * (1-free ridership rate)) 90.7 GWh/Year
2 Net savings estimated via 2010 impact evaluations (program transactions
only) 27.6 GWh/Year
3 Savings from out-of-program adoptions, net of baseline adoptions:
Row 1 – Row 2 63.0 GWh/Year Difference of 0.1 due to rounding
In summary, our market effect model identifies 90.7 GWh/year in savings associated with
energy efficient HBL purchases in Massachusetts. We further separate these savings into 27.6
GWh of ―in-program‖ and 63.0 GWh of ―out-of-program‖ savings. However, this estimate of
―out-of-program‖ net savings includes true program-attributable savings, also called spillover, as
well as savings that may result from other factors that influence the market in Massachusetts
but not in the comparison area. Such factors might include building codes and standards, as
well as corporate purchase and construction practices that have evolved over time. While the
market effects model does not distinguish between spillover and energy efficient sales resulting
from exogenous factors, the analysis of additional evidence of market effects presented in
Section 4.2 includes a qualitative analysis of these factors.

Page | 46
4.1.6 Addressing uncertainty in high bay space and purchase assumptions
The research team constructed two additional scenarios to address the uncertainty concerning
the percent of Massachusetts firms reporting to have high bay space and the percent that
indicated making HBL purchases in the past four years. In order to address this uncertainty, we
estimated total savings due to the adoption of energy efficient HBL technologies under the
following three scenarios:
1. Scenario 1 – Assumes 67.7 percent of end users have high bay space and 75.8 percent
of those firms made HBL purchases between 2007 and 2010, as identified by the
Massachusetts end user survey. This serves as our baseline savings estimates and
provides the same estimate of in-program and out-of-program savings identified above.
2. Scenario 2 – Averages the Massachusetts and California results for each of these
parameters, providing 49.2 percent of firms with high bay space, and 52.2 of those firms
making purchases during the study period.
3. Scenario 3 – Assumes the same percent of end users have high bay space and percent
of those firms made HBL purchases as identified by the survey of California end users,
30.7 percent and 28.5 percent, respectively.
Table 4-9 below presents the results of each of these scenarios. The data clearly show that
using the percentages directly from the Massachusetts end user survey (Scenario 1) provides a
relatively high estimate of program tracked and out-of-program savings. The results from
Scenario 2, result in 45.3 GWh/year in savings, which provides for 17.7 GWh/year in out-of-
program savings. Finally, Scenario 3, which assumes the same level of high bay space and
purchase activity as the California high bay lighting study actually provides less savings than is
currently tracked by Massachusetts program records at only 15.5 GWh/year in savings, which is
exceeded by the 27.6 GWh/year in program tracked savings, resulting in negative 12.2
GWh/year in out-of-program savings. This suggests that the California study under estimates
savings associated with energy efficient HBL purchases.
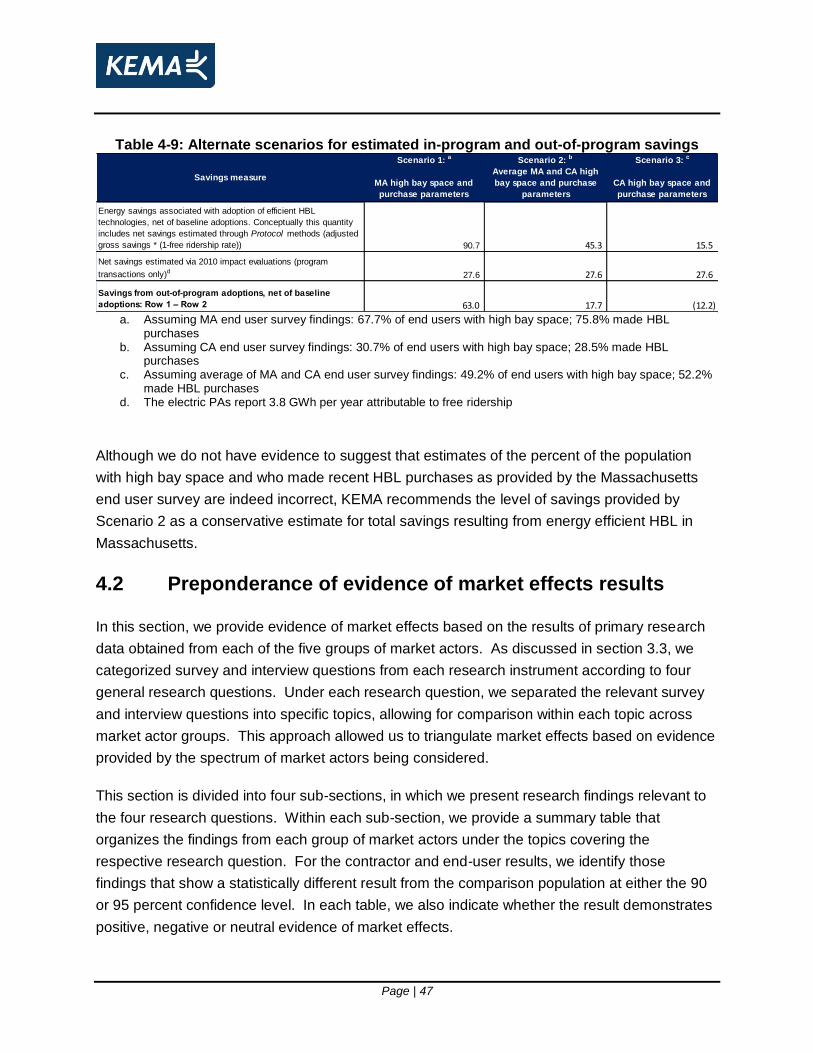
Page | 47
Table 4-9: Alternate scenarios for estimated in-program and out-of-program savings Scenario 1: a Scenario 2: b Scenario 3: c
MA high bay space and
purchase parameters
Average MA and CA high
bay space and purchase
parameters
CA high bay space and
purchase parameters
Energy savings associated with adoption of efficient HBL
technologies, net of baseline adoptions. Conceptually this quantity
includes net savings estimated through Protocol methods (adjusted
gross savings * (1-free ridership rate)) 90.7 45.3 15.5
Net savings estimated via 2010 impact evaluations (program
transactions only)d27.6 27.6 27.6
Savings from out-of-program adoptions, net of baseline
adoptions: Row 1 – Row 2 63.0 17.7 (12.2)
Savings measure
a. Assuming MA end user survey findings: 67.7% of end users with high bay space; 75.8% made HBL
purchases b. Assuming CA end user survey findings: 30.7% of end users with high bay space; 28.5% made HBL
purchases c. Assuming average of MA and CA end user survey findings: 49.2% of end users with high bay space; 52.2%
made HBL purchases d. The electric PAs report 3.8 GWh per year attributable to free ridership
Although we do not have evidence to suggest that estimates of the percent of the population
with high bay space and who made recent HBL purchases as provided by the Massachusetts
end user survey are indeed incorrect, KEMA recommends the level of savings provided by
Scenario 2 as a conservative estimate for total savings resulting from energy efficient HBL in
Massachusetts.
4.2 Preponderance of evidence of market effects results
In this section, we provide evidence of market effects based on the results of primary research
data obtained from each of the five groups of market actors. As discussed in section 3.3, we
categorized survey and interview questions from each research instrument according to four
general research questions. Under each research question, we separated the relevant survey
and interview questions into specific topics, allowing for comparison within each topic across
market actor groups. This approach allowed us to triangulate market effects based on evidence
provided by the spectrum of market actors being considered.
This section is divided into four sub-sections, in which we present research findings relevant to
the four research questions. Within each sub-section, we provide a summary table that
organizes the findings from each group of market actors under the topics covering the
respective research question. For the contractor and end-user results, we identify those
findings that show a statistically different result from the comparison population at either the 90
or 95 percent confidence level. In each table, we also indicate whether the result demonstrates
positive, negative or neutral evidence of market effects.

Page | 48
4.2.1 Research Question 1: Have HBL energy efficiency measures resulted in increased energy efficient HBL installations?
Table 4-10 below summarizes the research findings relevant to Research Question 1, that the
program has resulted in increased installations of energy efficient HBL and controls. While
much the information relevant to this research question is used in the market effects model
above, including this research question allows us to contrast sales trends across market actors.
We divide information pertaining to this research question into five topics: Sales of HBL by
technology; Changes in sales of energy efficient HBL; Impact of programs on energy efficient
HBL; Recommendations concerning energy efficient HBL products; and Regional differences in
energy efficient HBL sales.

Page | 49
Table 4-10: Research question 1: Have HBL energy efficiency programs resulted in
increased energy efficient HBL installations?
Contractors report T5 fluorescent tubes accounted for 64% percentage
of all fixtures used in high bay situations in Massachusetts relative to
29% in the comparison area , and 28% in IL. 90% positiveOnly 6% of projects reported by contractors in Massachusetts
installed pulse start metal halide fixtures compared to 31% in the
comparison area. 95% neutralContractors representing 46% of Massachusetts HBL projects report
installing occupancy sensors compared to 22% in IL. 95% positive17% of projects reported by contractors in Massachusetts installed
"other" HBL types including induction LED and incandescent.
Adoption of LEDs and induction is a positive effect indicating
increased focus on energy efficient lighting, but incandescent is a
negative effect indicating less efficient lighting. 90% neutralEnd users report 79% of high bay space in MA served by fluorescent
tube fixtures compared to 55% in the comparison area 95% positive68% of end users who installed fluorescent tubes report installing T8's
and 37% report T5's compared to 45% and 16% in the comparison
area 95% positive22% of end users who installed fluorescent tubes report installing
induction lights compared to 5% in the comparison area 90% negative80% end users who installed HID fixtures report installing pulse star
metal halide compared to 14% in the comparison area 95% positive43% end users report installing occupancy or motion sensors and
26% installed daylight controls compared to 12% and 3%,
respectively, in the comparison area 95% positive23% installed daylight controls compared to 14% in the comparison
area not sig positiveContractors that represent 78% of projects report high bay fluorescent
lighting has increased over the last two years compared to 76% in the
control region. not sig neutralContractors that represent only 7% of projects report high bay pulse
start metal halide lighting has increased over the last two years
compared to 35% in the control region. 95% negative2/5 distributors report increased sales of fluorescent HBL fixtures over
the past 2 years. na neutral4/5 distributors report increased sales T5 fluorescent HBL has lead to
a decline in metal halide sales. na positiveAll five manufacturers report that their sales of fluorescents for high
bay applications have increased in the last two years, and that the
trend toward increasing sales of fluorescents for HBL applications will
continue, but are divided about the applicability of these trends to
Massachusetts. na positiveTwo reported that their HID sales had increased, one reported a
decrease, and two others don’t manufacture the technology and/or
didn’t answer. Their comments suggested that none of the five
consider this technology a major area of investment or emphasis
going forward. na neutral
Four of five manufacturers agree that fluorescent HBLs T-5s and T-8s
responsible the technologies responsible for their MA HBL sales. na positive
Program StaffThree PAs report that HBL sales have increased, while two do not
know. na positive
Topics Covered
Market Actor
Group Evidence
Manufacturers
Changes in sales of
energy efficient HBL
Contractors
Sales of HBL by
technology
Statistical
Significance
Direction of
Effect
Distributors
Contractors
End Users
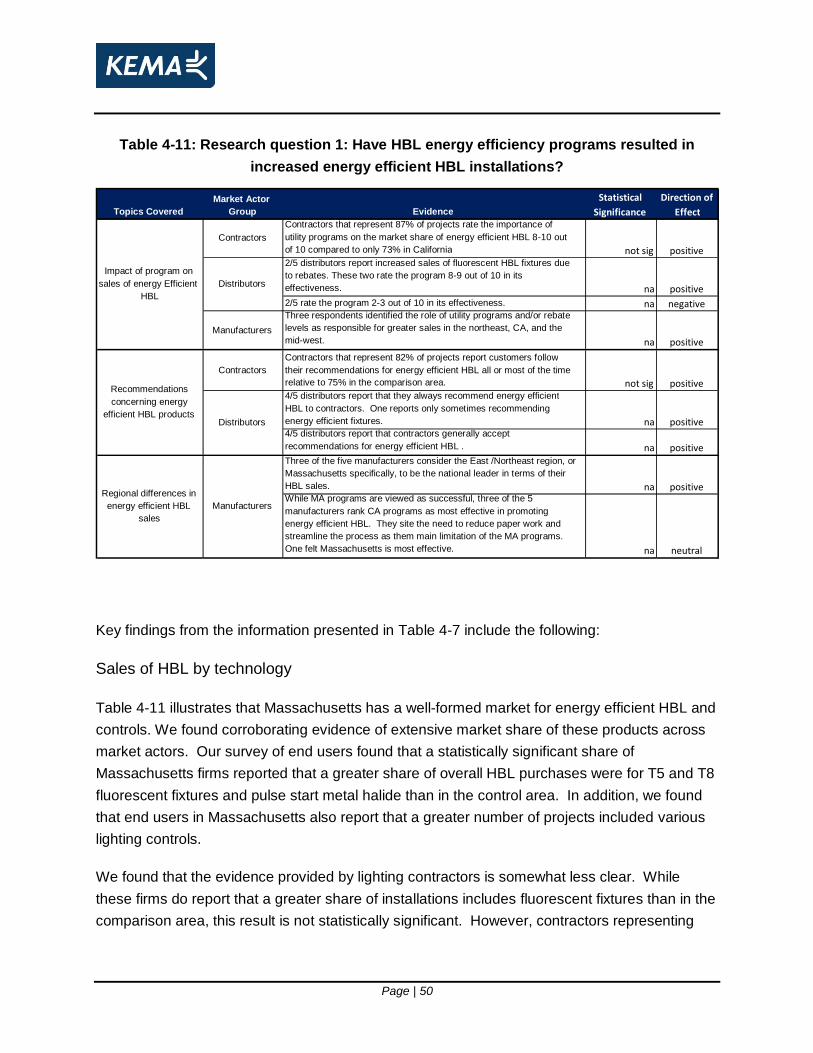
Page | 50
Table 4-11: Research question 1: Have HBL energy efficiency programs resulted in
increased energy efficient HBL installations?
Key findings from the information presented in Table 4-7 include the following:
Sales of HBL by technology
Table 4-11 illustrates that Massachusetts has a well-formed market for energy efficient HBL and
controls. We found corroborating evidence of extensive market share of these products across
market actors. Our survey of end users found that a statistically significant share of
Massachusetts firms reported that a greater share of overall HBL purchases were for T5 and T8
fluorescent fixtures and pulse start metal halide than in the control area. In addition, we found
that end users in Massachusetts also report that a greater number of projects included various
lighting controls.
We found that the evidence provided by lighting contractors is somewhat less clear. While
these firms do report that a greater share of installations includes fluorescent fixtures than in the
comparison area, this result is not statistically significant. However, contractors representing
Contractors Contractors that represent 87% of projects rate the importance of utility programs on the market share of energy efficient HBL 8-10 out of 10 compared to only 73% in California not sig positive 2/5 distributors report increased sales of fluorescent HBL fixtures due to rebates. These two rate the program 8-9 out of 10 in its effectiveness. na positive 2/5 rate the program 2-3 out of 10 in its effectiveness. na negative
Manufacturers Three respondents identified the role of utility programs and/or rebate levels as responsible for greater sales in the northeast, CA, and the mid-west. na positive
Contractors Contractors that represent 82% of projects report customers follow their recommendations for energy efficient HBL all or most of the time relative to 75% in the comparison area. not sig positive 4/5 distributors report that they always recommend energy efficient HBL to contractors. One reports only sometimes recommending energy efficient fixtures. na positive 4/5 distributors report that contractors generally accept recommendations for energy efficient HBL . na positive Three of the five manufacturers consider the East /Northeast region, or Massachusetts specifically, to be the national leader in terms of their HBL sales. na positive While MA programs are viewed as successful, three of the 5 manufacturers rank CA programs as most effective in promoting energy efficient HBL. They site the need to reduce paper work and streamline the process as them main limitation of the MA programs. One felt Massachusetts is most effective. na neutral
Statistical Significance
Direction of Effect
Impact of program on sales of energy Efficient
HBL
Market Actor Group Evidence
Manufacturers
Distributors
Distributors
Recommendations concerning energy
efficient HBL products
Regional differences in energy efficient HBL
sales
Topics Covered

Page | 51
roughly 17 percent of projects in Massachusetts report installing ―Other‖ fixture types, including
LEDs and induction. Further analysis of these responses revealed that a number of the largest
contractors did, in fact, indicate that they install LED fixtures, which is possibly the result of a
shift in the market toward energy efficient products. In addition, we found that contractors report
that a lower percent of Massachusetts projects specified pulse-start metal halide fixture than in
the comparison area. We identify this as a negative effect on program attributable market
effects because these are program-sponsored fixtures, thus lower sales implied that the
program has not resulted in increased sales and market effects are lessened. While this
finding represents a negative market effect, additional evidence provided by each group of
market actors concerning this technology reveals that these fixtures are at a strategic
disadvantage to fluorescent fixtures, LEDs, and other types of energy efficient HBL due to
delayed strike time. Consequently, we believe that lower sales of these fixtures do not
necessarily detract from the positive effects resulting from increased fluorescent fixture sales.
Changes in sales of energy efficient HBL
In contrast to the first topic, which looked at the sales (or market) share of different
technologies, information contained under this topic allowed us to examine the change in sales
of energy efficient HBL products. Since end users are only able to report on sales to their own
facility, their perceptions of sales trends are limited. Therefore, we limit information presented
under this research topic to the remaining four groups of marker actors. Information obtained
from these market actors suggest that the change in sales over time provides a less clear
indication of market effects than sales (or market) shares of energy efficient products.
Our examination of these data suggests that this finding may result from a variety of factors that
include the timing of this market effects study, market saturation, and transition to newer, more
advanced energy efficient technologies. For example, while manufacturers are split on whether
pulse start metal halides sales have increased or decreased over time, they are in agreement
that HIDs are not a major investment are for them. This result is seen across market actors, as
contractors and distributors also report declining sales of metal halides.
Although market actors are in agreement that sales of fluorescent fixtures have increased, they
do not consistently reported that these changes took place over the past two years. For
example, only two out of five distributors reported that fluorescent fixture sales increased over
the past two years. While manufacturers also reported increased sales of fluorescent fixtures,
they cannot specifically identify that Massachusetts sales increased. Finally, contractors

Page | 52
reported a greater proportion of Massachusetts projects involve T5’s and T8’s than the
comparison area, but this result was not statistically significant.
Impact of programs on energy efficient HBL
Our analysis shows that programs have a positive impact on the sale of energy efficient HBL.
The overwhelming majority (87 percent) of Massachusetts’ contractors reported that programs
are important determinants of the share of energy efficient HBL. While the results also show
that distributors are split on the effectiveness of the HBL programs, the two distributors who
rated the program’s effectiveness low expressed frustration with paperwork as their reason.
The remaining two distributors who answered the question rate the program very high in terms
of its effectiveness. Manufacturers also indicated that the programs are successful in increasing
sales, although, once again are less supportive of pulse-start metal halide fixtures.
Recommendations concerning energy efficient HBL products
Market actors are actively recommending energy efficient HBL products in Massachusetts.
Four out of five distributors report that they always recommend energy efficient HBL to
contractors. The remaining distributor indicates they sometimes make such recommendations,
but not always. However, this distributor also indicated that they are typically not able to make
recommendations because contractors arrive with a pre-defined bill of goods to fulfill. In
addition, contractors that represent the vast majority of projects (82 percent) state that end
users follow their recommendations for energy efficient HBL lighting always or most of the time.
Regional differences in energy efficient HBL sales
Data pertaining to this topic come from manufacturers who are exposed to HBL sales across the
country. Three of the five firms interviewed indicate that Massachusetts is a leader in energy
efficient HBL sales. However, only one felt that nationally, Massachusetts programs are the
most successful in promoting sales. While three others indicated that while Massachusetts is
successful, it lags California due to the excessive paperwork requirements associated with the
programs.
Page | 53
4.2.2 Research Question 2: Have HBL energy efficiency programs resulted in increased knowledge and awareness of energy efficient HBL technologies?
Table 4-12 below summarizes research findings relevant to Research Question 2 which
examines whether the programs have resulted in increased knowledge and awareness of
energy efficient HBL technologies. We divide information pertaining to this research question
into four topics: Attitudes towards energy efficient HBL; Awareness of the benefits associated
with energy efficient HBL; Awareness of HBL programs; and Knowledge of energy efficient HBL
technologies. We present a summary of our findings on each these topics in the discussion that
follows.
Attitudes and awareness of energy efficient HBL
Table 4-12 shows that both distributors and manufacturers reported favorable attitudes towards
energy efficient HBL products. All five of the distributors interviewed reported that they received
favorable feedback from contractors regarding energy efficient HBL products. Further, all five
manufacturers indicated that energy efficient lighting is an essential part of their corporate
strategy. Although this finding is not specific to Massachusetts, when coupled with the fact that
these manufacturers feel Massachusetts leads the pack in terms of energy efficient products, it
provides a powerful indication that the PA’s programs play a significant role in shaping attitudes
in the industry.
Awareness of the benefits of energy efficient HBL
The results of these questions indicate that awareness of energy efficient HBL lighting
technologies is high in Massachusetts, but could still improve. Contractors who represent
nearly two thirds of all HBL projects indicated that customers are aware of the full range of
options for energy efficient HBL before undertaking their projects, although, this result is not
statistically different from the comparison area. In addition, while contractors indicated that
energy savings drive a substantial share of HBL projects, 11 percent also indicated that greater
education and training are needed. Further, contractors that represent 41 percent of projects
reported that concern or awareness about saving energy is a determining factor in the choice of
HBL equipment in Massachusetts. However, we also found that three out of 5 distributors
reported that contractors are aware of the full range of benefits of energy efficient HBL,
indicating that contractor awareness still remains high.
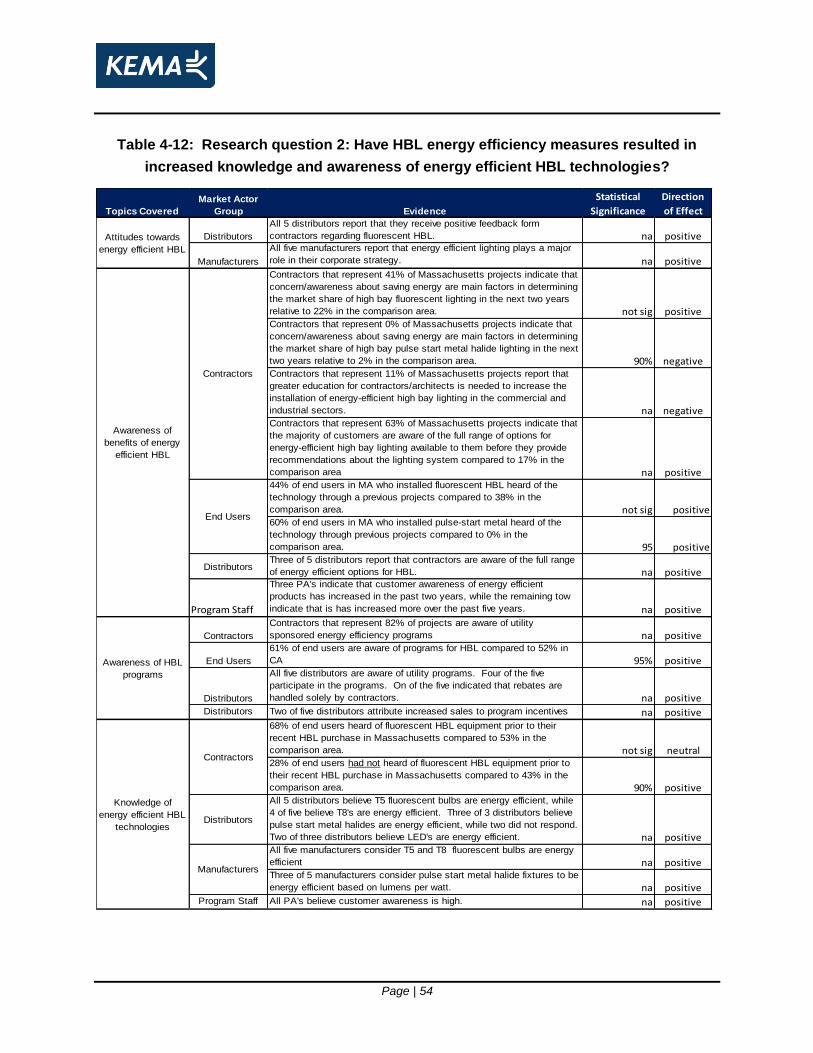
Page | 54
Table 4-12: Research question 2: Have HBL energy efficiency measures resulted in
increased knowledge and awareness of energy efficient HBL technologies?
Distributors
All 5 distributors report that they receive positive feedback form
contractors regarding fluorescent HBL. na positive
Manufacturers
All five manufacturers report that energy efficient lighting plays a major
role in their corporate strategy. na positiveContractors that represent 41% of Massachusetts projects indicate that
concern/awareness about saving energy are main factors in determining
the market share of high bay fluorescent lighting in the next two years
relative to 22% in the comparison area. not sig positiveContractors that represent 0% of Massachusetts projects indicate that
concern/awareness about saving energy are main factors in determining
the market share of high bay pulse start metal halide lighting in the next
two years relative to 2% in the comparison area. 90% negativeContractors that represent 11% of Massachusetts projects report that
greater education for contractors/architects is needed to increase the
installation of energy-efficient high bay lighting in the commercial and
industrial sectors. na negativeContractors that represent 63% of Massachusetts projects indicate that
the majority of customers are aware of the full range of options for
energy-efficient high bay lighting available to them before they provide
recommendations about the lighting system compared to 17% in the
comparison area na positive44% of end users in MA who installed fluorescent HBL heard of the
technology through a previous projects compared to 38% in the
comparison area. not sig positive60% of end users in MA who installed pulse-start metal heard of the
technology through previous projects compared to 0% in the
comparison area. 95 positive
DistributorsThree of 5 distributors report that contractors are aware of the full range
of energy efficient options for HBL. na positive
Program Staff
Three PA's indicate that customer awareness of energy efficient
products has increased in the past two years, while the remaining tow
indicate that is has increased more over the past five years. na positive
Contractors
Contractors that represent 82% of projects are aware of utility
sponsored energy efficiency programs na positive
End Users
61% of end users are aware of programs for HBL compared to 52% in
CA 95% positive
Distributors
All five distributors are aware of utility programs. Four of the five
participate in the programs. On of the five indicated that rebates are
handled solely by contractors. na positiveDistributors Two of five distributors attribute increased sales to program incentives na positive
68% of end users heard of fluorescent HBL equipment prior to their
recent HBL purchase in Massachusetts compared to 53% in the
comparison area. not sig neutral28% of end users had not heard of fluorescent HBL equipment prior to
their recent HBL purchase in Massachusetts compared to 43% in the
comparison area. 90% positive
Distributors
All 5 distributors believe T5 fluorescent bulbs are energy efficient, while
4 of five believe T8's are energy efficient. Three of 3 distributors believe
pulse start metal halides are energy efficient, while two did not respond.
Two of three distributors believe LED's are energy efficient. na positiveAll five manufacturers consider T5 and T8 fluorescent bulbs are energy
efficient na positiveThree of 5 manufacturers consider pulse start metal halide fixtures to be
energy efficient based on lumens per watt. na positiveProgram Staff All PA's believe customer awareness is high. na positive
Manufacturers
Knowledge of
energy efficient HBL
technologies
Awareness of
benefits of energy
efficient HBL
Statistical
Significance
Direction
of Effect
Contractors
Contractors
Topics Covered
Market Actor
Group Evidence
Attitudes towards
energy efficient HBL
End Users
Awareness of HBL
programs

Page | 55
Awareness of HBL programs
Contractors, end users, and distributors all report a high level of awareness of efficiency
programs. However, we see that 11percnet of contractors report that increased education is
needed. We identify this finding as a negative impact on market effects as it demonstrates that
the Massachusetts electric PA’s have not been effective in providing sufficient education to
contractors regarding energy efficient lighting options..
Knowledge of energy efficient HBL technologies
Our findings reveal that market actors are very knowledgeable about energy efficient
technologies in Massachusetts, thus suggesting the programs are successful in educating end
users, contractors, and distributors. Contractors that represent over two-thirds of all HBL
projects indicated that end users were knowledgeable of efficient technologies prior to projects.
4.2.3 Research Question 3: Have HBL energy efficiency programs resulted greater marketing and promotional activity of energy efficient HBL technologies by market actors?
The extent to which market actors promote and market energy efficient technologies provides a
valuable indicator of the presence of program induced structural changes in the HBL market.
Thus far, our analysis shows that market actors reported substantial sales of energy efficient
HBL. Further, the market actors reported that sales in Massachusetts are higher than other
regions of the country and attribute that increased level of activity to the success of HBL
programs. We also found that knowledge, awareness and acceptance of energy efficient HBL
products is relatively high in Massachusetts, although a number of market actors reported the
need for increased education and training regarding the benefits of energy efficient
technologies.
We now turn our analysis to an examination of marketing and promotional activity concerning
the technologies sponsored by the HBL programs. Increased product promotion is a signal that
market actors have established efficient marketing channels and recognize existing business
advantages of the program sponsored products beyond the program incentives. Table 4-13
summarizes information pertaining to Research Question 3. Key findings from this analysis are
provided below.

Page | 56
Table 4-13: Research question 3: Have HBL energy efficiency programs resulted greater marketing and promotional activity of energy efficient HBL technologies by market
actors?
Contractors that represent 74% of projects report
talking directly to customers to promote energy
efficient high bay lighting technologies na positiveContractors representing 66% of Massachusetts
HBL projects report recommending occupancy
sensors compared to 21% in IL. 95% nuetral
Contractors representing 73% of Massachusetts
HBL projects report recommending energy efficent
HBL always or most of the time compared to 86% in
the comparison area and 80% in CA. This difference
is statistically not significant. By comparison,
contractors represetngin 90% of IL projects report
recomending T5 or T8 fluroesecent fixtures, while
only 80% of WI projects installing these
technologies wererecomended by contractors not sig nuetralFor 9% of end users in MA who installed pulse-start
metal the contractor recommended using them
compared to 15% in the comparison area. not sig negativeFor 80% of end users in MA who installed
fluorescent tubes, the contractor recommended
using them compared to 67% in the comparison
area. not sig positiveFour of 5 distributors report that contractors do
generally accept the distributor’s recommendations
for energy efficient products. The fifth reported that
contractors typically cannot accept them because
they have a pre-established bill of materials. na negativeAll five distributors recommend energy efficient
lighting options, and 4 of the 5 make such
recommendations ―always‖, one does so
―sometimes‖. na positive
Manufacturers
Only 1 of the 5 manufacturers interviewed does any
promotion directly to customers, and this is only for
the five percent of their sales that originates with
national accounts. na neutral47% of end users in MA who installed pulse-start
metal heard of the technology through lighting
vendors compared to 3% in the comparison area. 95% positive53% of end users in MA who installed fluorescent
HBL heard of the technology through lighting vendors
compared to 19% in the comparison area. 95% positive
26% of end users in MA who installed pulse-start
metal heard of the technology through architects and
engineers compared to 3% in the comparison area. 90% positive
13% of end users in MA who installed fluorescent
HBL heard of the technology through architects and
engineers compared to 6% in the comparison area. not sig neutral13% of end users in MA who installed pulse-start
metal heard of the technology through utility
representatives compared to 0% in the comparison
area. not sig neutral10% of end users in MA who installed fluorescent
HBL heard of the technology through utility
representatives compared to <1% in the comparison
area. not sig neutral
Statistical
Significance
End UsersSources of information
for energy efficient HBL
Contractors
Direction of
EffectTopics covered Market Actor Group Evidence
Distributors
Extent of market actor
promotion of energy
efficient HBLEnd Users
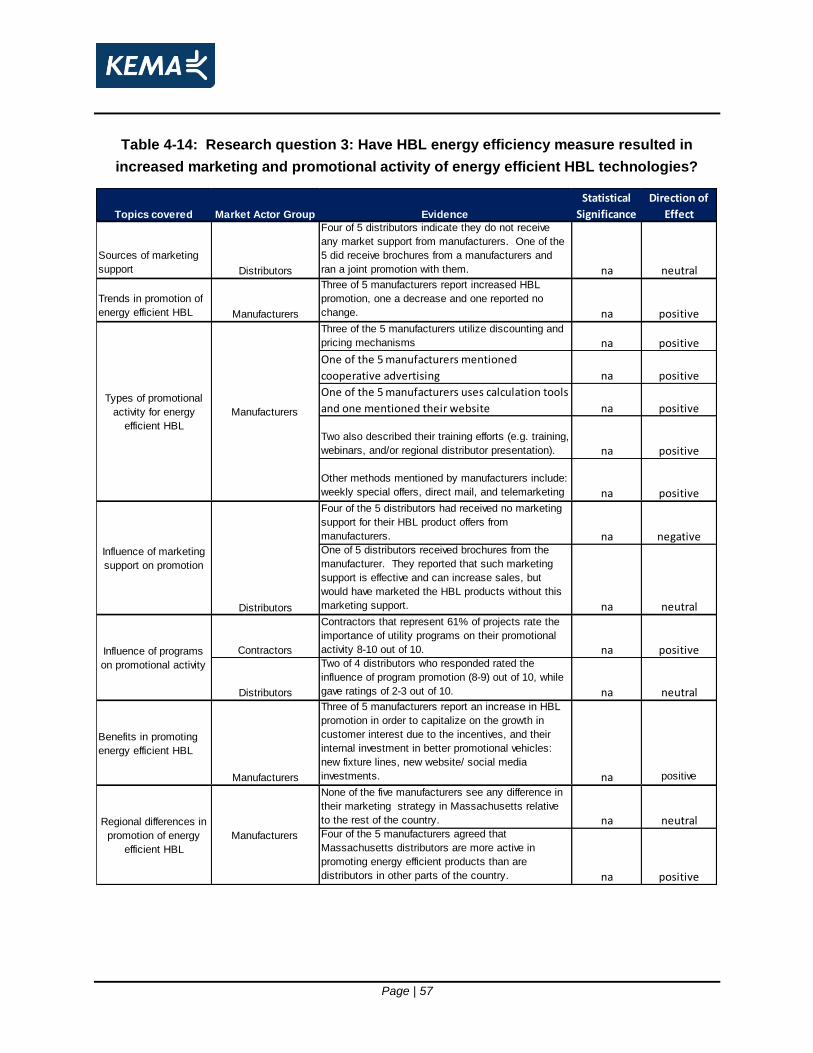
Page | 57
Table 4-14: Research question 3: Have HBL energy efficiency measure resulted in
increased marketing and promotional activity of energy efficient HBL technologies?
Sources of marketing
support Distributors
Four of 5 distributors indicate they do not receive
any market support from manufacturers. One of the
5 did receive brochures from a manufacturers and
ran a joint promotion with them. na neutral
Trends in promotion of
energy efficient HBL Manufacturers
Three of 5 manufacturers report increased HBL
promotion, one a decrease and one reported no
change. na positiveThree of the 5 manufacturers utilize discounting and
pricing mechanisms na positive
One of the 5 manufacturers mentioned
cooperative advertising na positive
One of the 5 manufacturers uses calculation tools
and one mentioned their website na positive
Two also described their training efforts (e.g. training,
webinars, and/or regional distributor presentation). na positive
Other methods mentioned by manufacturers include:
weekly special offers, direct mail, and telemarketing na positiveFour of the 5 distributors had received no marketing
support for their HBL product offers from
manufacturers. na negativeOne of 5 distributors received brochures from the
manufacturer. They reported that such marketing
support is effective and can increase sales, but
would have marketed the HBL products without this
marketing support. na neutral
Contractors
Contractors that represent 61% of projects rate the
importance of utility programs on their promotional
activity 8-10 out of 10. na positive
Distributors
Two of 4 distributors who responded rated the
influence of program promotion (8-9) out of 10, while
gave ratings of 2-3 out of 10. na neutral
Benefits in promoting
energy efficient HBL
Manufacturers
Three of 5 manufacturers report an increase in HBL
promotion in order to capitalize on the growth in
customer interest due to the incentives, and their
internal investment in better promotional vehicles:
new fixture lines, new website/ social media
investments. na positive
None of the five manufacturers see any difference in
their marketing strategy in Massachusetts relative
to the rest of the country. na neutralFour of the 5 manufacturers agreed that
Massachusetts distributors are more active in
promoting energy efficient products than are
distributors in other parts of the country. na positive
Manufacturers
Regional differences in
promotion of energy
efficient HBL
Influence of programs
on promotional activity
Influence of marketing
support on promotion
Distributors
Market Actor Group
Statistical
Significance
Direction of
Effect
Manufacturers
Types of promotional
activity for energy
efficient HBL
Topics covered Evidence

Page | 58
Extent of market actor promotion of energy efficient HBL
Information provided by contractors, end users, and distributors clearly shows that market
actors are engaged in extensive promotion of energy efficient HBL products in Massachusetts.
Contractors representing nearly three-quarters of all HBL projects reported promoting energy
efficient technologies through talking directly to customers. This information is corroborated by
the 80 percent of end users who installed fluorescent HBL that learned about this technology
from their contractor. Finally, we see that distributors also actively promote energy efficient
HBL, with 4 out of 5 always making recommendations.
Our findings also show that market actors do not actively promote pulse-start metal halides in
Massachusetts, due to their relatively lower efficiency and less desirable product attributes.
This is consistent with our earlier finding that pulse-start metal halides are a lagging technology.
Sources of information for energy efficient HBL
Table 4-15 shows that HBL measures resulted in the increased promotion of energy efficient
fluorescent fixtures and, to a lesser extent, pulse-start metal halide lamps. We find that a
significantly greater proportion of end users in Massachusetts reported that lighting vendors as
the primary source of information concerning high bay fluorescent fixtures and pulse-start metal
halide lamps than in the comparison area. In addition, we also found that significantly more end
users in Massachusetts learn about pulse-start metal halide lamps from architects and
engineers than in the comparison region. While not statistically different from the comparison
area, we also note that over one-quarter of Massachusetts’ end users hear of pulse-start metal
halide lamps from architects and engineers. Finally, utility representatives are also a major
source of information concerning fluorescent and pulse-start metal halide HBL.
Influence of programs on promotional activity
Contractors and distributors indicated that utility programs have a high degree of influence on
their level of promotional activity. In addition, our analysis of regional differences in
promotional activity showed that all five manufacturers indicated that Massachusetts distributors
are more active in promoting energy efficient HBL than in other regions of the country.
Page | 59
4.2.4 Research Question 4: Have market barriers either impeded the effectiveness of, or been reduced by energy efficient HBL programs?
Whereas the first three research questions focused primarily on the presence or absence of
positive indicators of market effects, the fourth research question examines a number of factors
that may limit the effectiveness of HBL programs. Specifically, we considered the role of market
barriers in the determination of market effects. In the analysis that follows, we review research
findings that identify the extent to which market externalities lessen savings attributable to the
HBL programs. We also examine the degree to which the programs have worked to reduce
some of these external barriers. For topics represented in this table, we do not interpret the
findings as positive or negative as this characterization is ambiguous or not relevant for many of
the topics listed.
Table 4-15 presents a summary of the research findings relevant to Research Question 4. We
categorize these findings into the following five topics: Influence of chains and franchises and
other corporate policies; Influence of building codes; Impact of LEDs; Other factors influencing
HBL choices; and Objections to energy efficient HBL.
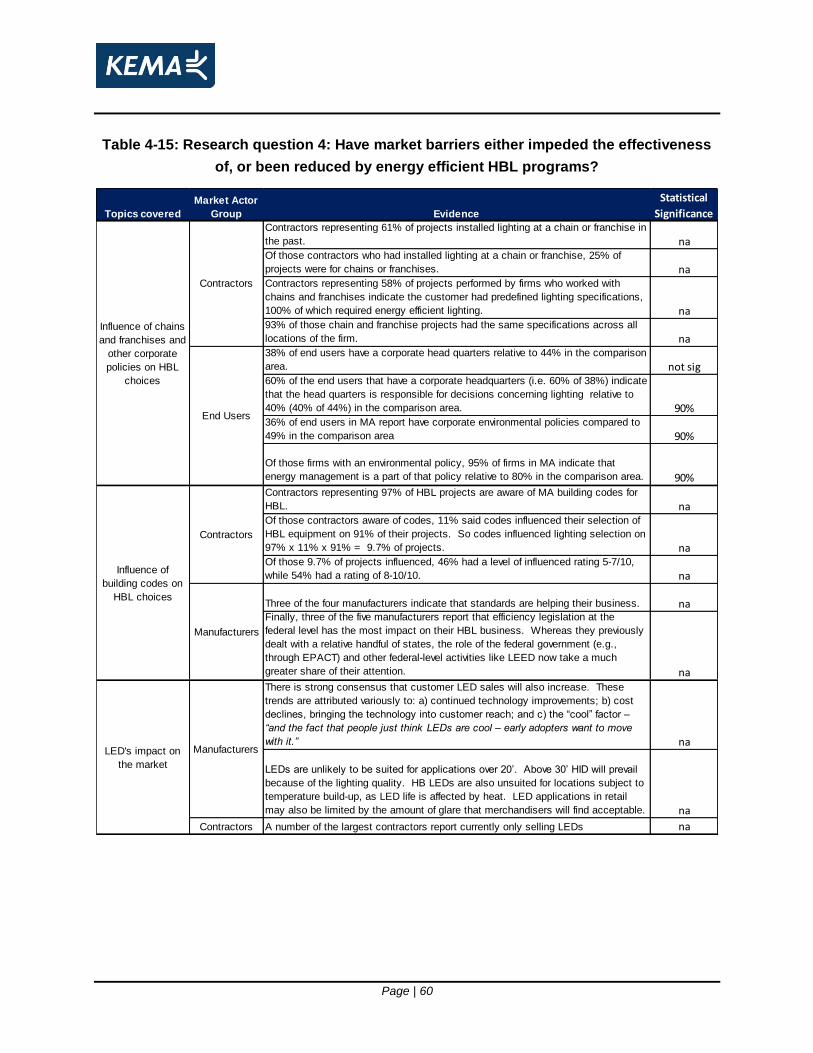
Page | 60
Table 4-15: Research question 4: Have market barriers either impeded the effectiveness
of, or been reduced by energy efficient HBL programs?
Contractors representing 61% of projects installed lighting at a chain or franchise in
the past. naOf those contractors who had installed lighting at a chain or franchise, 25% of
projects were for chains or franchises. naContractors representing 58% of projects performed by firms who worked with
chains and franchises indicate the customer had predefined lighting specifications,
100% of which required energy efficient lighting. na93% of those chain and franchise projects had the same specifications across all
locations of the firm. na38% of end users have a corporate head quarters relative to 44% in the comparison
area. not sig60% of the end users that have a corporate headquarters (i.e. 60% of 38%) indicate
that the head quarters is responsible for decisions concerning lighting relative to
40% (40% of 44%) in the comparison area. 90%36% of end users in MA report have corporate environmental policies compared to
49% in the comparison area 90%
Of those firms with an environmental policy, 95% of firms in MA indicate that
energy management is a part of that policy relative to 80% in the comparison area. 90%Contractors representing 97% of HBL projects are aware of MA building codes for
HBL. naOf those contractors aware of codes, 11% said codes influenced their selection of
HBL equipment on 91% of their projects. So codes influenced lighting selection on
97% x 11% x 91% = 9.7% of projects. naOf those 9.7% of projects influenced, 46% had a level of influenced rating 5-7/10,
while 54% had a rating of 8-10/10. na
Three of the four manufacturers indicate that standards are helping their business. naFinally, three of the five manufacturers report that efficiency legislation at the
federal level has the most impact on their HBL business. Whereas they previously
dealt with a relative handful of states, the role of the federal government (e.g.,
through EPACT) and other federal-level activities like LEED now take a much
greater share of their attention. naThere is strong consensus that customer LED sales will also increase. These
trends are attributed variously to: a) continued technology improvements; b) cost
declines, bringing the technology into customer reach; and c) the ―cool‖ factor –
―and the fact that people just think LEDs are cool – early adopters want to move
with it.‖ na
LEDs are unlikely to be suited for applications over 20’. Above 30’ HID will prevail
because of the lighting quality. HB LEDs are also unsuited for locations subject to
temperature build-up, as LED life is affected by heat. LED applications in retail
may also be limited by the amount of glare that merchandisers will find acceptable. na
Contractors A number of the largest contractors report currently only selling LEDs na
LED's impact on
the market
Manufacturers
Contractors
Manufacturers
Influence of
building codes on
HBL choices
Influence of chains
and franchises and
other corporate
policies on HBL
choices
End Users
Contractors
Statistical
SignificanceTopics covered
Market Actor
Group Evidence
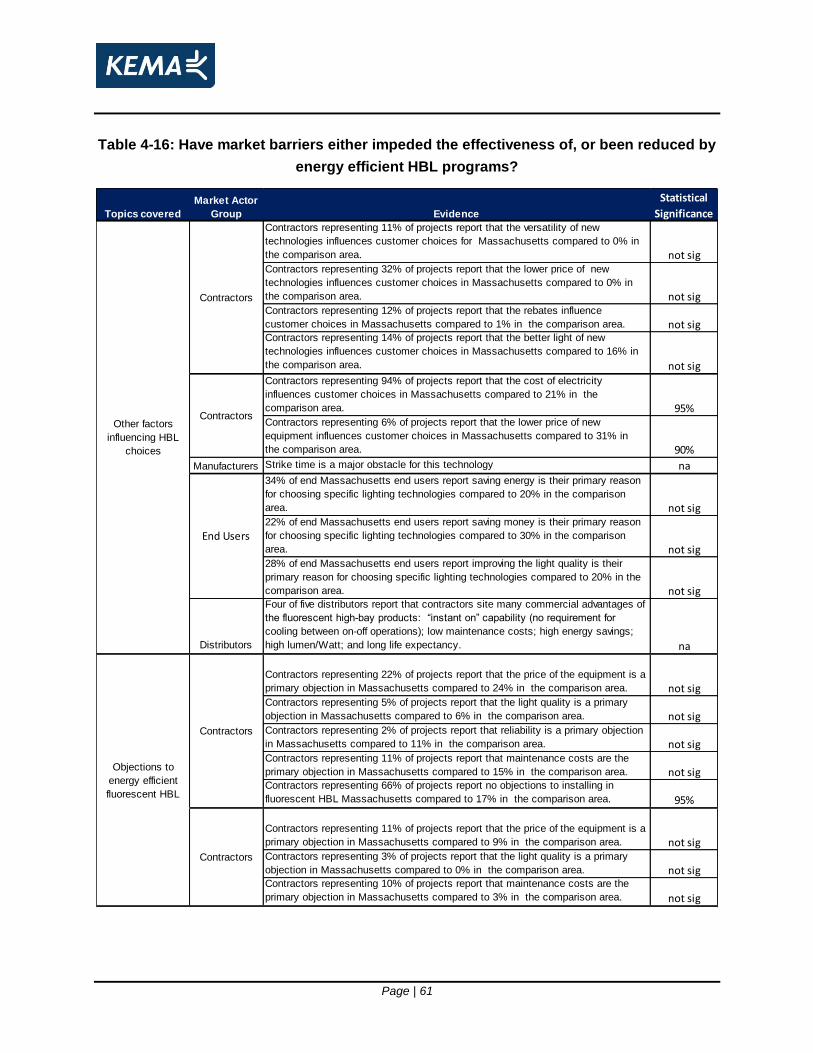
Page | 61
Table 4-16: Have market barriers either impeded the effectiveness of, or been reduced by
energy efficient HBL programs?
Contractors representing 11% of projects report that the versatility of new
technologies influences customer choices for Massachusetts compared to 0% in
the comparison area. not sigContractors representing 32% of projects report that the lower price of new
technologies influences customer choices in Massachusetts compared to 0% in
the comparison area. not sigContractors representing 12% of projects report that the rebates influence
customer choices in Massachusetts compared to 1% in the comparison area. not sigContractors representing 14% of projects report that the better light of new
technologies influences customer choices in Massachusetts compared to 16% in
the comparison area. not sigContractors representing 94% of projects report that the cost of electricity
influences customer choices in Massachusetts compared to 21% in the
comparison area. 95%Contractors representing 6% of projects report that the lower price of new
equipment influences customer choices in Massachusetts compared to 31% in
the comparison area. 90%
Manufacturers Strike time is a major obstacle for this technology na34% of end Massachusetts end users report saving energy is their primary reason
for choosing specific lighting technologies compared to 20% in the comparison
area. not sig22% of end Massachusetts end users report saving money is their primary reason
for choosing specific lighting technologies compared to 30% in the comparison
area. not sig28% of end Massachusetts end users report improving the light quality is their
primary reason for choosing specific lighting technologies compared to 20% in the
comparison area. not sig
Distributors
Four of five distributors report that contractors site many commercial advantages of
the fluorescent high-bay products: ―instant on‖ capability (no requirement for
cooling between on-off operations); low maintenance costs; high energy savings;
high lumen/Watt; and long life expectancy. na
Contractors representing 22% of projects report that the price of the equipment is a
primary objection in Massachusetts compared to 24% in the comparison area. not sigContractors representing 5% of projects report that the light quality is a primary
objection in Massachusetts compared to 6% in the comparison area. not sigContractors representing 2% of projects report that reliability is a primary objection
in Massachusetts compared to 11% in the comparison area. not sigContractors representing 11% of projects report that maintenance costs are the
primary objection in Massachusetts compared to 15% in the comparison area. not sigContractors representing 66% of projects report no objections to installing in
fluorescent HBL Massachusetts compared to 17% in the comparison area. 95%
Contractors representing 11% of projects report that the price of the equipment is a
primary objection in Massachusetts compared to 9% in the comparison area. not sigContractors representing 3% of projects report that the light quality is a primary
objection in Massachusetts compared to 0% in the comparison area. not sigContractors representing 10% of projects report that maintenance costs are the
primary objection in Massachusetts compared to 3% in the comparison area. not sig
Evidence
Statistical
SignificanceTopics covered
Market Actor
Group
Objections to
energy efficient
fluorescent HBL
Other factors
influencing HBL
choices
Contractors
Contractors
End Users
Contractors
Contractors
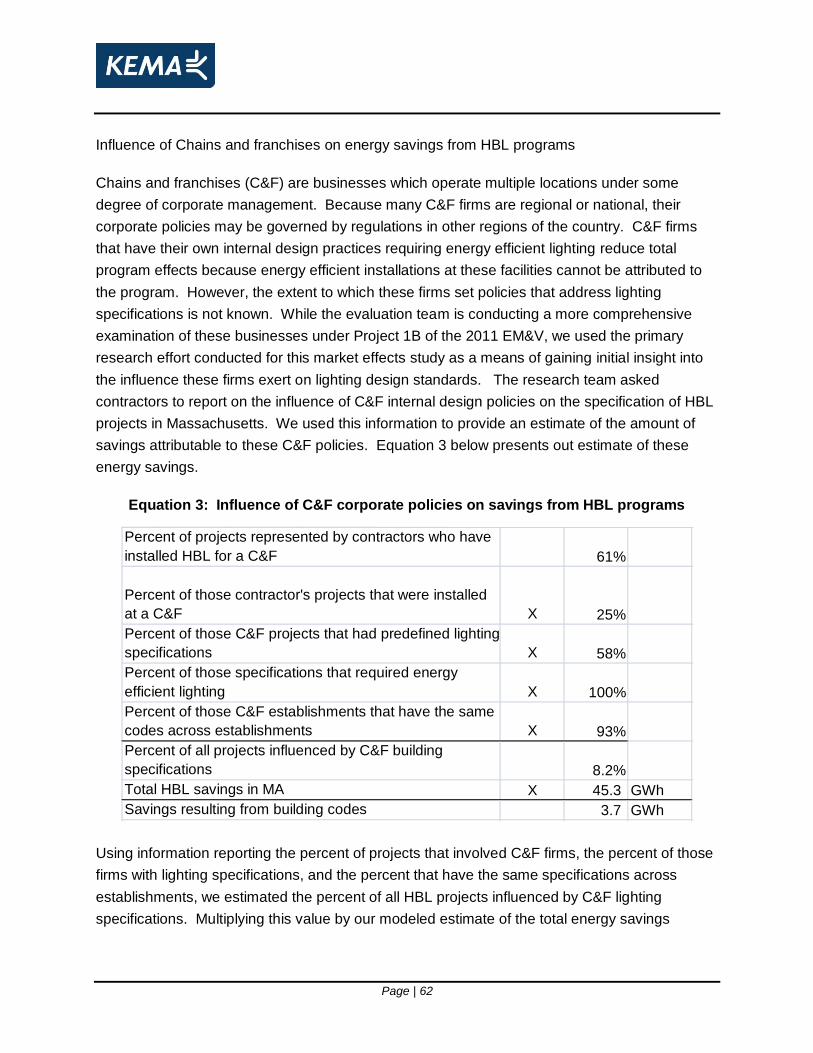
Page | 62
Influence of Chains and franchises on energy savings from HBL programs
Chains and franchises (C&F) are businesses which operate multiple locations under some
degree of corporate management. Because many C&F firms are regional or national, their
corporate policies may be governed by regulations in other regions of the country. C&F firms
that have their own internal design practices requiring energy efficient lighting reduce total
program effects because energy efficient installations at these facilities cannot be attributed to
the program. However, the extent to which these firms set policies that address lighting
specifications is not known. While the evaluation team is conducting a more comprehensive
examination of these businesses under Project 1B of the 2011 EM&V, we used the primary
research effort conducted for this market effects study as a means of gaining initial insight into
the influence these firms exert on lighting design standards. The research team asked
contractors to report on the influence of C&F internal design policies on the specification of HBL
projects in Massachusetts. We used this information to provide an estimate of the amount of
savings attributable to these C&F policies. Equation 3 below presents out estimate of these
energy savings.
Equation 3: Influence of C&F corporate policies on savings from HBL programs
Using information reporting the percent of projects that involved C&F firms, the percent of those
firms with lighting specifications, and the percent that have the same specifications across
establishments, we estimated the percent of all HBL projects influenced by C&F lighting
specifications. Multiplying this value by our modeled estimate of the total energy savings
Percent of projects represented by contractors who have
installed HBL for a C&F 61%
Percent of those contractor's projects that were installed
at a C&F X 25%
Percent of those C&F projects that had predefined lighting
specifications X 58%
Percent of those specifications that required energy
efficient lighting X 100%
Percent of those C&F establishments that have the same
codes across establishments X 93%
Percent of all projects influenced by C&F building
specifications 8.2%
Total HBL savings in MA X 45.3 GWh
Savings resulting from building codes 3.7 GWh

Page | 63
attributable to HBL efficiency programs provided an estimate of the amount of savings from C&F
lighting specifications.27 This amount should be subtracted from the out-of-program savings
estimate provided in section 4.1.5. In addition to policies set by C&F firms, we also investigated
the influence of other corporate policies on HBL specifications. For this information, we relied
on data collected through the end user survey. Equation 4 presents our analysis of the savings
that result from these policies.
As seen in equation 4, we estimated the amount of savings resulting from corporate policies by
first multiplying the percent of end users with a corporate headquarters by the percent whose
headquarters is responsible for lighting decisions. Next, we multiplied this product by the
percent of firms who have a corporate sustainability policy and the percent of those whose
sustainability policy includes energy management. This provided our estimate of the percent of
end users with internal policies that influence lighting, roughly 8 percent. Multiplying this result
by 45.3 GWh, gives our estimate of savings resulting from corporate policies, roughly 3.5 GWh.
Equation 4: Influence of corporate policies on savings from HBL programs from end user survey results
27
See Section 4.1.3: KEMA recommends using the Scenario 2 level of savings, 45.3 GWh.
End users that have a corporate head quarters 38%
The percent of end users that have a corporate headquarters
who is responsible for decisions concerning lighting X 60%
36% of end users in MA report have corporate environmental
policies X 36%
Firms with an environmental policy in which energy
management is a part of that policy X 95%
Percent of end users with internal policies that influence
lighting X 7.8%
Total HBL savings in MA X 45.3 GWh
Savings resulting from corporate policies 3.5 GWh
Page | 64
Influence of Building codes on energy savings from HBL programs
In addition to corporate policies, the influence of building codes impacts the degree to which
savings are attributable to HBL programs. Specifically, savings from projects in which lighting
specifications are restricted by building codes should not be included in program-attributable
savings. Therefore, we used data collected from contractors to estimate the share of savings
for which building codes are responsible. This calculation is shown in Equation 5 below.
To estimated the share of savings attributable to building codes we started with the percent of
projects represented by contractors that are aware of building codes governing HBL (97
percent). This is multiplied by the by the percent of projects associated with contractors who
say codes influenced their HBL lighting choices (11 percent), and then by the percent of their
projects that are influenced by codes (91 percent). This provides the percent of all projects
influenced by codes, (7.4 percent). Next, we weight that 9.7 percent by the level of influence of
codes on those projects. From the table we see that 46 percent of the 9.7 percent are 60
percent influenced by codes (46% x 60% x 9.7% = 2.7% of projects), while 54 percent of the 9.7
percent are 90 percent influences (54% x 90% x 9.7% = 4.71% of projects). The sum of these
two provides the 7.4% of projects impacted by building codes, which when multiplied by 45.3
GWh of total HBL savings in Massachusetts yields our estimate of savings attributable to
building codes, 3.4 GWh. 28
28
See footnote 27.

Page | 65
Equation 5: Savings resulting from building codes
LED’s
Increased adoption of LEDs provides an indication of a shift in the market toward greater
awareness and demand for energy conservation. Our analysis shows that both contractors and
manufacturers are focused on the greater use and production of LEDs. As previously stated, a
number of the largest contractors report only selling LED’s which leads to our estimated
contractor shares of ―other HBL‖ of 17 percent. However, it is important to note that LEDs are
just one of the technologies included in the ―other‖ category. One possible explanation for this
shift is that lower cost program sponsored technologies are responsible for demonstrating the
benefits associated with life-cycle cost savings that result from energy efficient fixtures. The
realization of these savings has resulted in willingness to adopt innovative technologies at a
higher acquisition cost, provided they demonstrate life-cycle cost savings.
However, manufacturers’ interviews cautioned that the extent to which LED’s are able to
displace fluorescent fixtures is limited because they are unlikely to be suited for applications
above 20 feet due to problems associated with light dispersion, or in applications that require
limited glare.
Percent of projects represented by contractors who are aware
of codes influencing HBL choices 97%
Percent of projects represented by contractors who say codes
influence their lighting choices on projects X 11%
Percent of those contractor's projects in which codes have an
influence X 91%
Percent of all projects influenced by codes 9.7%
Percent of codes with 50-70% influence X 46.0%
Percent of codes with 80-100% influence X 54.0%
Percent of all projects influenced by codes weighted by the
degree that the code influence of lighting 7.4%
Total HBL savings in MA X 45.3 GWh
Savings resulting from building codes 3.4 GWh

Page | 66
Other factors influencing HBL choices
Table 4-17 presents a number of additional factors that influence HBL decisions. Looking at
end users, we see that cost is a primary concern of specific HBL technologies. This is
particularly true in Massachusetts relative to the comparison area. However, the fact that end
users are also driven by concerns for energy savings suggests that they may link costs and
energy savings, particularly in today’s climate of sustained elevated energy prices.
Contractors that represent only 12 percent of Massachusetts HBL projects reported that rebates
are a primary factor in determining lighting choices, while 32 percent indicate that lower prices
of new technologies are a driving factor. In addition, our analysis shows that, while greater
education is still needed, Massachusetts distributors report that contractors are aware of the
benefits of energy efficient HBL. However, this result cannot be compared to the comparison
group as only five Massachusetts distributors were interviewed. Provided acquisition costs
continue to decrease and/or new products are able to realize even greater efficiency, then
relatively high fuel prices coupled with product acceptability provides the appropriate market
conditions for sustained energy savings resulting from HBL products.
4.3 Spillover effects
In this section, we incorporate the findings in section 4.2 into the ―out-of-program savings‖
estimates calculated in Section 4.1 to isolate the true out-of program savings (i.e. spillover) from
savings resulting from C&F and corporate policies and building codes. As discussed in Section
4.2, savings resulting from these additional sources do not represent program-attributable
savings because they come from exogenous factors, rather than from program-related market
effects.
While savings from corporate policies and building codes should be removed from out of-
program savings, we must account for uncertainty regarding the degree to which these
estimates are independent of one another. This is because our estimate of C&F policy savings
is based on data provided by the survey of contractors, while the estimate of corporate policies
is based on the survey of end users. Further, we could not determine whether any of the
corporate policies are in response to building codes. Finally, there is uncertainty concerning the
extent to which corporate policies are in response to Massachusetts efficiency programs.
Therefore, we examined spillover under the following three separate scenarios to account for
this uncertainty:

Page | 67
A. Savings derived from C&F policies, corporate policies, and building codes are
independent (i.e. 100 percent additive);
B. Savings derived from C&F policies, corporate policies, and building codes overlap by 50
percent (i.e. 50 percent additive); and
C. Savings derived from C&F policies, corporate policies, and building codes are not
additive.
Table 4-17 shows our estimate of spillover under Scenario A in which the three sources of
exogenous savings are independent. Under this scenario, our estimate of total exogenous
savings is 10.6 GWh/year, which we subtract from the 17.7 GWh/year of out-of-program savings
calculated above. This leaves 7.1 GWh of savings from spillover and 34.7 GWh/year in total
program-attributable savings.
Table 4-17: Scenario A spillover calculation C&F, corporate policy, and building code
savings independent (100 percent additive)
Row Metric
Savings GWh /
year Calulation
1 Savings resulting from C&F policies 3.7
2 Corporate policies 3.5
3 Savings resulting from building codes 3.4
4 Senario A: Three savings are indepent (100 percent additve) 10.6 (Sum Row 1, 2, 3)
5 Savings from out-of-program adoptions net of baseline adoptions (Table 4.6 17.7
6 Senario 1 Spillover savings 7.1 (Row 1 - Row 2)
7 Net savings estimated via 2010 impact evaluations 27.6 (Table 4.6)
8 Total Program attributable savings 34.7 (Row 7 + Row 8)
Next, Table 4-18 presents our estimate of spillover under Scenario B in which the three sources
of exogenous savings are only 50 percent independent. Under this scenario, our estimate of
total exogenous savings is 5.3 GWh. Subtracting this from the 17.7 GWh of out-of-program
savings leaves 12.4 GWh/year in spillover savings and 40.0 GWh/year in total program-
attributable savings.

Page | 68
Table 4-18: Scenario B spillover calculation C&F, corporate policy, and building code
savings 50 percent additive
Row Metric
Savings GWh /
year Calulation
1 Savings resulting from C&F policies 3.7
2 Corporate policies 3.5
3 Savings resulting from building codes 3.4
4 Senario Two: 50 Percent of savings are additive 5.3 50% *(Sum Row 1, 2, 3)
5 Savings from out-of-program adoptions net of baseline adoptions (Table 4.6 17.7
6 Senario 1 Spillover savings 12.4 (Row 1 - Row 2)
7 Net savings estimated via 2007 - 2010 impact evaluations 27.6 (Table 4.6)
8 Total Program attributable savings 40.0 (Row 7 + Row 8)
Finally, Table 4-19 shows our estimate of spillover and total program-attributable savings under
Scenario C. Because exogenous savings are not additive, we only remove 3.7 GWh/year of
savings from out-of-program savings, leaving 14.0 GWh/year in spillover savings. Our estimate
of total savings under this scenario is 41.6 GWh/year.
Table 4-19: Scenario C spillover calculation C&F, corporate policy, and building code
savings are not additive
Row Metric
Savings GWh /
year Calulation
1 Savings resulting from C&F policies 3.7
2 Corporate policies 3.5
3 Savings resulting from building codes 3.4
4 Senario Three: Savings are not additive 3.7 (Max Row 1, 2, 3)
5 Savings from out-of-program adoptions net of baseline adoptions (Table 4.6 17.7
6 Senario 1 Spillover savings 14.0 (Row 1 - Row 2)
7 Net savings estimated via 2007 - 2010 impact evaluations 27.6 (Table 4.6)
8 Total Program attributable savings 41.6 (Row 7 + Row 8)
Table 4-20 presents the breakout of total savings resulting from energy efficient HBL purchases
in Massachusetts into program tracked net savings, exogenous savings, and untracked spillover
savings. For comparison, we also provide similar estimates for savings estimates provided by
Scenarios 1 and 3 presented in Section 4.1.6. Finally, we represent Untracked Spillover
savings provided by Scenario as a percent of program tracked gross savings. From the table
we see that the level of untracked spillover identified by Scenario 2 is 39 percent of program
tracked gross savings. This value is consistent with the estimated percentage identified in the
2010 Wisconsin HBL study which estimated untracked spillover at 34 percent of gross tracked
savings. Manufacturers interviews confirmed that sales of energy efficient HBL in
Massachusetts is consistent with that of Wisconsin, and only surpassed by California.

Page | 69
Table 4-20
Estimated market effects from the electric PA’s HBL programs
Scenario 1: Scenario 2: Scenario 3:
MA high bay space and
purchase parameters
Average MA and CA
high bay space and
purchase parameters
CA high bay space and
purchase parameters
Total savings resulting from energy efficient HBL 90.7 45.4 15.5
2010 Program tracked net savings* 27.6 27.6 27.6
Exogenous savings 10.62 5.3 0
Untracked spillover savings 52.42 12.4 (12.17)
2010 Program tracked gross savings 31.43 31.43 31.43
Spillover as a % of program tracked gross savings 167% 39% -39%
Savings measure

Page | 70
5. Conclusions
5.1 Overview
The overall goal of this study was to assess the extent to which the PA’s energy efficiency
programs related to HBL affected the adoption of energy efficient high-bay lighting equipment
and controls. To accomplish that goal, we developed a quantitative model to estimate the effect
of the PAs’ programs on the rate of adoption of energy-efficient high bay lighting technologies
among all customers, whether or not those customers participated in the promotional programs.
The model was based primarily on a comparison of the market share of energy-efficient high
bay lighting products sold in Massachusetts during the past four years to the market share of
those products in a four-state comparison area in which no programs to promote energy-
efficient commercial lighting had been in effect. This analysis showed conclusively that the
market share of energy-efficient high bay lighting was significantly higher in Massachusetts than
in the comparison area, and that they volume of efficient fixtures purchased in Massachusetts
far exceeded the number of units rebated by the PAs’ programs.
To place the results of this quantitative analysis in perspective, we supplemented it with
additional evidence of market effects provided by interviews with a broad range of key market
players. This additional information provides further evidence of behavioral changes among the
purchasers and vendors associated with increased market share for efficient high bay lighting.
These behavioral changes include increased awareness of the performance benefits of energy-
efficient HBL equipment among vendors and end-users and increased marketing and
specification of efficient equipment by vendors. Using these results, we estimated an upper and
lower bound for the portion of ―out-of-program‖ purchases of efficient HBL equipment that could
be attributed to the program. We also used these results to develop a ―weight of evidence‖ case
in support of the hypothesis that the PAs’ programs were causally related to the observed
differences between Massachusetts and the comparison area in the market share of energy-
efficient high bay lighting. This additional information allowed us to isolate spillover effects from
savings that likely resulted due to other influences, such as changes in commercial building
codes.
Page | 71
5.2 Key Findings
5.2.1 Quantitative Estimate of Total Energy Savings from Adoption of Efficient High Bay Lighting in Massachusetts
During the study period, 51 percent of customers in key commercial and industrial segments
purchased and installed high bay lighting. Spaces lit by these purchases accounted for 75
percent of total floor space in the targeted markets. In contrast, the 2010 California HBL study
found that only 9 percent of customers purchased high bay lighting, accounting for 29 percent of
lit space. Due to this discrepancy, we estimated market effects under three separate scenarios,
each varying the percent of customers with high bay lighting and the percent who made
purchases during the study period as follows:
1. Scenario 1 – Assumes 67.7 percent of end users have high bay space and 75.8 percent
of those firms made HBL purchases between 2007 and 2010, as identified by the
Massachusetts end user survey. This serves as our baseline savings estimates and
provides the same estimate of in-program and out-of-program savings identified above.
2. Scenario 2 – Averages the Massachusetts and California results for each of these
parameters, providing 49.2 percent of firms with high bay space, and 52.2 of those firms
making purchases during the study period.
3. Scenario 3 – Assumes the same percent of end users have high bay space and percent
of those firms made HBL purchases as identified by the survey of California end users,
30.7 percent and 28.5 percent, respectively.
The difference between MA and comparison areas in market share of efficient high bay lighting
technologies during the study period: T-5s – 64 versus 29 percent, T-8s 13 percent versus 16
percent, Pulse Start Metal Halides 3 percent versus 31 percent, LEDs 17 percent versus 2
percent. The difference between MA and comparison areas in the mean efficacy of HBLs
installed was 65 watts square foot verses 72 watts square foot, respectively.
Under Scenario 1, the difference in efficacy translated to reduced wattage installed of 30.5 MW
and reduced consumption of 90.7 GWh per year. Under Scenario 2, the difference the
difference in efficacy translated to reduced wattage installed of 15.2 MW and reduced
consumption of 45.3 GWh per year. Under Scenario 3, the difference the difference in efficacy
translated to reduced wattage installed of 5.2 MW and reduced consumption of 15.5 GWh per
year. Due to uncertainty concerning the compatibility of the comparison area and temporal

Page | 72
effects, the study team recommends the level of savings provided by Scenario 2, which projects
45.3 GWh in savings resulting from increased adoption of energy efficient HBL in
Massachusetts.
5.2.2 Allocation of Savings to In-program and Out-of-Program Projects
Based on the results of previous evaluations, savings from high bay lighting projects supported
by PA programs accounted for 34% of all savings due to accelerated adoption of efficient HBL
technologies in Massachusetts, as gross program tracked savings amounted to 31.4 GWh in
2010. Net savings, accounting for free ridership, amounted to 27.6 of the 31.4 GWh per year.
Subtracting net savings from our Scenario 2 estimate of the total savings resulting from energy
efficient HBL in Massachusetts (45.4 GWh/year), provides roughly 17.7 GWh per year in out-of
program savings attributable to reduced wattage in Massachusetts.
5.2.3 Attribution of Out-of-Program Savings to Program Effects and Total Net Savings
Assuming Scenario 2, we estimated 17.7 GWh/year in savings results from untracked adoptions
of increased energy efficient lighting in Massachusetts. However, a portion of this savings, 5.3
GWh/year, cannot be attributed to the program because it results from exogenous influences
rather than being program induced. We identified and analyzed the following three sources of
this exogenous savings:
1. Savings from chain & franchise corporate policies – We estimate that design and
construction policies of national chain & franchises account for 3.73 GWh/year (8.2
percent) of the 45.3 GWh/year total savings resulting from greater efficacy in HBL in
Massachusetts.
2. Savings from other corporate policies – We estimate that design and construction
policies of non-chain & franchise firms account for 3.53 GWh/year (7.8 percent) of the
45.3GWh/year total savings resulting from greater efficacy in HBL in Massachusetts.
3. Savings from building codes – We estimate building codes account for 3.35 GWh (7.4
percent) of the 45.3 GWh/year total savings resulting from greater efficacy in HBL in
Massachusetts.
In combining savings attributable to these exogenous factors, we assume that 50 percent of the
estimated savings from each source are independent of the other two sources, and therefore
additive. This provides our estimated savings estimate for these three exogenous sources of

Page | 73
5.3 GWh/year. This reduces the amount of out of program savings by this amount to provide
our estimate of untracked spillover savings of 12.4 GWh/year.
5.2.4 Other Indicators of Market Effects
Other indicators that showed that the PA programs led to market effects include the following:
1. Changes in awareness of efficient HBL benefits and benefits to their business.
2. Contractors are aware of the full range of benefits of energy efficient HBL, indicating that
contractor awareness still remains high, but could still improve;
3. Distributors and manufacturers reported favorable attitudes towards energy efficient HBL
products;
4. Contractors, end users, and distributors all report a high level of awareness of efficiency
programs; and
5. End users were knowledgeable of efficient technologies prior to projects
6. Changes in marketing and specification practices.
7. Market actors are engaged in extensive promotion of energy efficient HBL products;
8. HBL measures resulted in the increased promotion of energy efficient fluorescent
fixtures and, to a lesser extent, pulse-start metal halide lamps; and
9. Utility programs have a high degree of influence on their level of promotional activity.
10. Changes in barriers
11. Increased adoption of LEDs provides an indication of a shift in the market toward greater
awareness and demand for energy conservation;
12. HBL programs lowered barriers to adoption of energy efficient lighting by helping
customers and contractors to focus purchase decisions on life-cycle rather than
acquisition costs of HBL products.
Page | 74
5.3 Limitations
5.3.1 Limitation to the Approach
The LCIEC Team acknowledges several limitations to the market effects approach that should
be considered when assessing the validity of the untracked spillover estimate and the attribution
of market effects.
5.3.2 Compatibility of Comparison Area
The loss of the comparison market is an increasingly problematic limitation for using quasi-
experimental techniques to estimate market effects attributable to C&I and residential energy
efficiency programs. There are a number of phenomenon that are contributing to this challenge
that include: the development of energy efficiency programs in the no-program areas, the
success of national programs such as ENERGY STAR, ARRA funded initiatives, the promotion
of high efficiency technologies by national supply-side firms, and the acceptance and
commitment to energy efficiency by end-use customers with locations in both program and non-
program areas.29
Quasi-experimental designs lack random assignment to the experimental and control groups
thereby introducing exogenous factors that may contribute to the differences in the dependent
variable (i.e. adoption of energy efficient HBL equipment) between the experimental and control
groups. Therefore it is critical when employing quasi-experimental designs to select controls
groups that are as similar to the experimental groups as possible. Characteristics to consider
when selecting control groups include:
1. Alignment of socioeconomics of the two areas (e.g. education levels, income levels,
urban versus rural).
2. Climate differences between comparison areas (particularly for weather sensitive
measures).
3. Similarity of commercial and industrial bases.
29
Barry, J. Ryan, Bloch, Goldberg, Prahl and Rosenberg. State-to-State Comparison to Establish
Existence of Market Effects in the Non-Residential Sector. IEPEC Proceedings 2009.

Page | 75
4. Prevalence of demand side differences that are not associated with the existing energy
efficiency program; such as, prior utility demand side management activity, presence of
national supply-side and end-use customer firms, and the cost of energy.30
Clearly, if Massachusetts (or California) was the only state to have energy efficiency programs
that promote energy efficient HBL equipment then Alabama, Georgia, Mississippi, and South
Carolina would not have been selected for the control group. Pennsylvania (excluding
Philadelphia), Ohio, and Michigan were originally selected as the comparison area for the CA
study. However during initial market actor interviews, several market actors mentioned
―intermittent experiences with HBL programs which could affect awareness levels of efficiency
and specification practice.‖31 Furthermore several HBL programs were entering the
development stage throughout the Midwest and therefore the CA Study Team decided that
although these states were more similar to CA based on the criteria listed above, it was more
important to select a comparison area without prior or existing HBL programs.
The selection of dissimilar comparison groups makes it more difficult to isolate the effect of the
energy efficiency programs on the adoption of energy efficient high bay lighting equipment.
Researchers can attempt to identify the exogenous variables but it is not possible to definitively
identify and neutralize all of them. The LCIEC Team investigated the end user survey data for
MA and the comparison area and secondary data sources to identify additional exogenous
factors not accounted for in the report and discuss how they may affect the study outcomes.
KEMA contrasted a range of survey results from end users in Massachusetts, California, and
the comparison region in order to examine the appropriateness of the four state southern region
comparison area for the market effects study. These results are presented in Table 5-1.
The data show that the inventory of Massachusetts end user facilities is older, smaller, and has
lower ceilings than in both the comparison region and California. The relative age and size of
Massachusetts facilities partially explains the higher proportion of lighting projects over the past
few years as a greater share of structures in the comparison area were recently built. Further,
because facilities in Massachusetts are much smaller, renovation costs should be substantially
lower than in larger facilities.
30
Ibid. 31
California Public Utilities Commission Energy Division. High Bay Lighting Market Effects Study. Final
Report June 18, 2010. Page 20.
Page | 76
Recall, in executing the primary research efforts, each study selected a sample of firms
proportional to their distribution across industries. As can also be seen in Table 5-1, a greater
share of firms in the comparison area are used in the warehousing and process manufacturing
industries, while Massachusetts has slightly greater proportion of food sales stores. This
difference may result in greater savings as warehouse and manufacturing facilities are likely to
have multiple shifts requiring continual usage of HBL.
We also report a number of metrics specific to HBL itself. First, we see that Massachusetts has
nearly 25 percent more fluorescent fixtures installed than the comparison region. While recent
purchases are partly responsible for this difference, the fact that the Massachusetts electric
PA’s efficiency programs have been ongoing for much longer than the study period is likely
responsible for a large share of this difference. Consequently, it is reasonable to assume that a
longer term study would result in even greater savings attributable to the electric PAs programs
impacting HBL. Finally, the data show that a greater share of Massachusetts projects result
from older fixtures, while those in the comparison area occur due to new construction or
retrofits.

Page | 77
Table 5-1: Profile of end users: Massachusetts, California, and the comparison area survey results
Metric MA CA SE
Average Number of
Employees 91 169 161
Average Square
Footage 31,978 203,258 128,880
% Pay Electric Bill
Directly to Utility 86% 87% 88%
23% Since 2000 42% Since 2000 48% Since 2000
24% In the 1990s 25% In the 1990s 12% In the 1990s
16% In the 1980s 12% In the 1980s 11% In the 1980s
4% In the 1970s 6% In the 1970s 13% In the 1970s
8% In the 1960s 4% In the 1960s 10% In the 1960s
8% In the 1950s 6% In the 1950s 5% In the 1950s
1% In the 1940s 5% In the 1940s 1% In the 1940s
3%1900-1939 0%1900-1939 0%1900-1939
1% Before 1900 0% Before 1900 0% Before 1900
Age of Building 35 31 27
% High Bay Space 15-25
ft 58% 61% 68%
% High Bay Space >25 ft 17% 35% 30%
28% Retail 31% Retail 31% Retail
5% Manufacturing- 14% Manufacturing- 10% Manufacturing-
process process process
15% Education 12% Education 14% Education
10% Manufacturing- 11% Manufacturing- 13% Manufacturing-
assembly assembly assembly
7% Warehouse/Storage 11% Warehouse/Storage 14% Warehouse/Storage
3% Office 7% Office 1% Office
0% Other Commercial 4% Other Commercial 4% Other Commercial
7% Other industrial 3% Other industrial 3% Other industrial
5% Health Care 3% Health Care 2% Health Care
7% Services 2% Services 3% Services
1% Public Assembly 2% Public Assembly <1% Public Assembly
10% Food sales <1% Food sales 5% Food sales
2% Food service <1% Food service 1% Food service
Space Type
Tenure
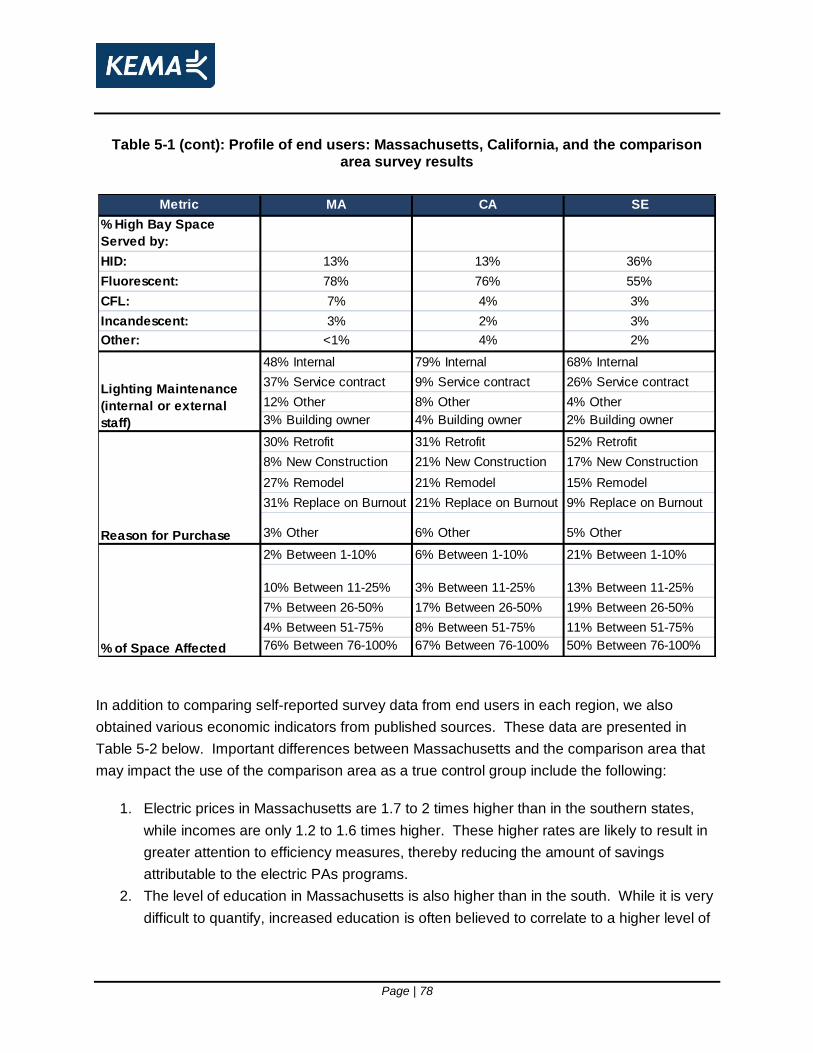
Page | 78
Table 5-1 (cont): Profile of end users: Massachusetts, California, and the comparison area survey results
Metric MA CA SE
% High Bay Space
Served by:
HID: 13% 13% 36%
Fluorescent: 78% 76% 55%
CFL: 7% 4% 3%
Incandescent: 3% 2% 3%
Other: <1% 4% 2%
48% Internal 79% Internal 68% Internal
37% Service contract 9% Service contract 26% Service contract
12% Other 8% Other 4% Other
3% Building owner 4% Building owner 2% Building owner
30% Retrofit 31% Retrofit 52% Retrofit
8% New Construction 21% New Construction 17% New Construction
27% Remodel 21% Remodel 15% Remodel
31% Replace on Burnout 21% Replace on Burnout 9% Replace on Burnout
3% Other 6% Other 5% Other
2% Between 1-10% 6% Between 1-10% 21% Between 1-10%
10% Between 11-25% 3% Between 11-25% 13% Between 11-25%
7% Between 26-50% 17% Between 26-50% 19% Between 26-50%
4% Between 51-75% 8% Between 51-75% 11% Between 51-75%
76% Between 76-100% 67% Between 76-100% 50% Between 76-100%% of Space Affected
Reason for Purchase
Lighting Maintenance
(internal or external
staff)
In addition to comparing self-reported survey data from end users in each region, we also
obtained various economic indicators from published sources. These data are presented in
Table 5-2 below. Important differences between Massachusetts and the comparison area that
may impact the use of the comparison area as a true control group include the following:
1. Electric prices in Massachusetts are 1.7 to 2 times higher than in the southern states,
while incomes are only 1.2 to 1.6 times higher. These higher rates are likely to result in
greater attention to efficiency measures, thereby reducing the amount of savings
attributable to the electric PAs programs.
2. The level of education in Massachusetts is also higher than in the south. While it is very
difficult to quantify, increased education is often believed to correlate to a higher level of
Page | 79
social awareness. This effect can be seen by Massachusetts ACEEE 2010 Efficiency
scorecard, which indicates Massachusetts ranks second in the US, while the southern
region ranks between 37th and 49th. This finding also provides evidence that some of the
out-of-program energy savings is likely the result of cultural differences rather than
program related market effects.
Finally, while not depicted in Table 5-2 according to EPA's ―National Awareness of Energy Star‖
report32 Massachusetts has historically had high levels of energy-efficient technology promotion
and awareness. In contrast, the states in the southeast comparison group have not previously
had high levels of energy star and energy efficient technology awareness. This report
discusses the results of the CEE 2010 ENERGY STAR Household Survey by building on prior
years’ survey results and focusing on the extent to which consumers recognize the ENERGY
STAR label, understand its intended messages, and utilize (or are influenced by) the label in
their energy-related purchase decisions. Promotion of energy efficiency benefits and rebates,
and general awareness of the ENERGY STAR® program varies considerably across the
country; each of the top 57 designated market areas (DMAs) are classified as ―high publicity‖
―low‖ or ―other‖. The report shows that Massachusetts has had high levels of energy star
awareness since the study began in 2000. On the other hand, the designated market area
(DMA) in Georgia, Atlanta, has only been recognized as high publicity since 2008 and the
Greenvll-Spart-Ashevll (SC), Little Rock-PineBluff (AR) and Birmingham (AL) DMAs have been
categorized as low since the study conception.
32
EPA Office of Air and Radiation, Climate Protection Partnerships Division. National Awareness of
ENERGY STAR® for 2010: Analysis of 2010 CEE Household Survey. U.S. EPA, 2011.

Page | 80
Table 5-2: Comparison of key economic indicators between Massachusetts and the comparison area
Metric/
Source
Electric Prices
EIA - 2010, A ll secto rs
Gross State Product
USgo vernmentrevenue.co m
% Urban vs. Rural
(% Housing units Urban)
2000 C ensus data T able H 002
Education
(Percent of population over 25 with High
School Degree) 88.4% 80.8% 78.9% 82.9% 82.2%
(Percent of population over 25 with Bachelors) 37.8% 21.5% 19.1% 27.1% 23.5%
2005-2009 A merican C o mmunity Survey
Median Household Income
2009 C ensus data
Square feet per employee
2003 C B EC S
Private non-residential construction
spending
2009 C ensus data
ACEEE 2010 Efficiency Scorecard
Ranking 2 49 50 37 40
0.1445 $/kwh 0.0851 $/kwh 0.0817 $/kwh 0.0858 $/kwh 0.0853 $/kwh
MA AL MS GA SC
91.10% 55.00% 48.70% 70.70% 61.20%
$391.5 Billion $179.9 Billion $98.1 Billion $416.8 Billion $169.7 Billion
$59,393 $49,777 $35,078 $43,340 $41,101
New England: 939 East South Central:1,109 East South Central:1,109 South Atlantic: 732 South Atlantic: 732
$6,382 million $7,618 million $2,505 million $6,681 million $3,428 million
Page | 81
5.3.3 Temporal Issues
In developing the primary research instruments, KEMA considered a number of important
factors pertaining to the relevance of data collected to near term evidenced of market effects,
respondent recall, and compatibility of the results to the comparison area. In weighing the
combined impact of the time period selected on these factors, the research team chose to
analyze end user HBL purchases over the past four years (2007 to 2010) for the following
reasons:
1. The primary reason for selecting the multiple year study was to mirror the California HBL
study as much as possible, which asked end users to report on projects that occurred
between 2006 and 2008. While the research team felt extending the timeframe back to
2006 (five years) would add too many exogenous factors to the analysis, we felt the four
year study period enabled us to capture enough data to compare to the California
results, and also include more recent activity as the economy recovered;
2. Multiple years provide for a much greater volume of projects, and consequently a greater
response rate as there is a higher probability that firms undertook HBL project than in a
single year;
3. Extending the study period smoothes out programmatic changes and annual market
spikes that may bias the results of a single year study.
This market effects analysis includes data from 2009 and 2010 which the California study did
not include. The incorporation of these additional years provides for greater adoption of energy
efficient HBL as the economy recovered from the economic down turn that began in 2007.
While our analysis does attempt to mitigate the impact of this temporal change by annualizing
savings resulting from differences in technology shares, the modeled approach does not
account for changes to the technology shares that may have occurred in the comparison area
after 2008. In this section we analyze the impact of this longer time frame and also provide a
supplemental analysis in which we attempt to assess the impact of this difference on our
estimated program-attributable savings.
As a first step in understanding the impact of the study period length on the market effects
analysis, we examined the tracking data provided by the Massachusetts eclectic PAs. As seen
in Table 5-3, program tracked sales and estimated savings increased sharply from 2007 to
2008, but then leveled off between 2008 and 2010.
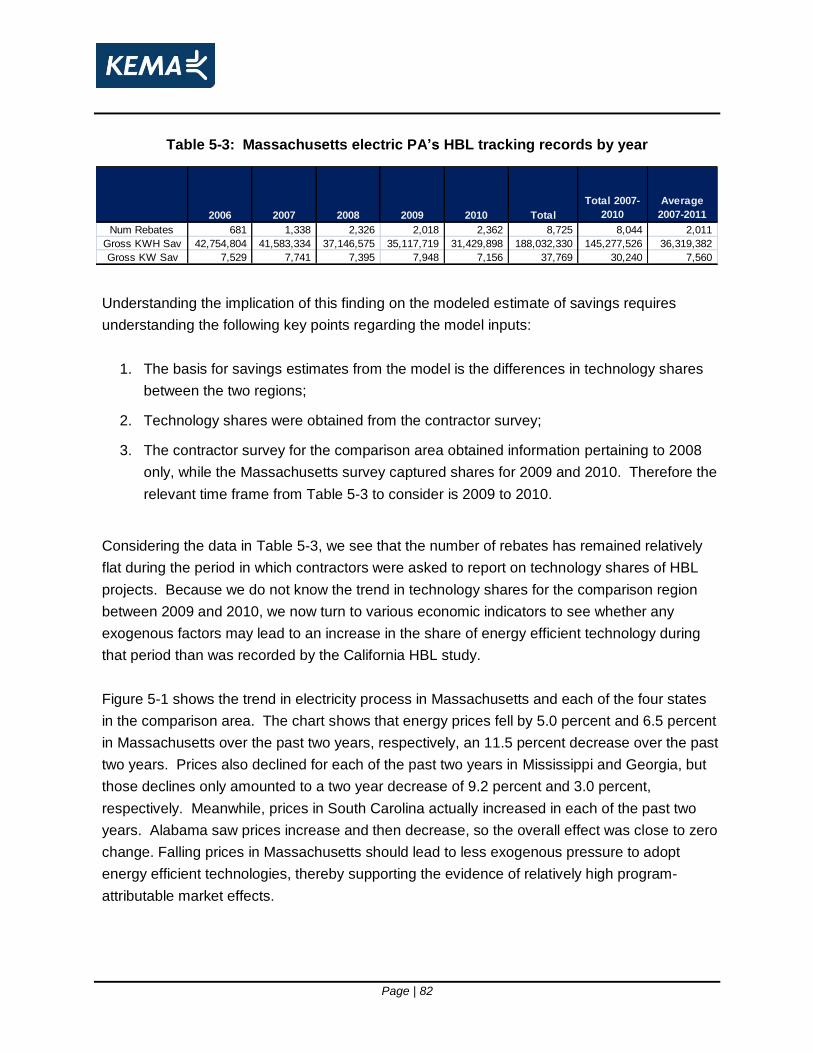
Page | 82
Table 5-3: Massachusetts electric PA’s HBL tracking records by year
2006 2007 2008 2009 2010 Total
Total 2007-
2010
Average
2007-2011
Num Rebates 681 1,338 2,326 2,018 2,362 8,725 8,044 2,011
Gross KWH Sav 42,754,804 41,583,334 37,146,575 35,117,719 31,429,898 188,032,330 145,277,526 36,319,382
Gross KW Sav 7,529 7,741 7,395 7,948 7,156 37,769 30,240 7,560
Understanding the implication of this finding on the modeled estimate of savings requires
understanding the following key points regarding the model inputs:
1. The basis for savings estimates from the model is the differences in technology shares
between the two regions;
2. Technology shares were obtained from the contractor survey;
3. The contractor survey for the comparison area obtained information pertaining to 2008
only, while the Massachusetts survey captured shares for 2009 and 2010. Therefore the
relevant time frame from Table 5-3 to consider is 2009 to 2010.
Considering the data in Table 5-3, we see that the number of rebates has remained relatively
flat during the period in which contractors were asked to report on technology shares of HBL
projects. Because we do not know the trend in technology shares for the comparison region
between 2009 and 2010, we now turn to various economic indicators to see whether any
exogenous factors may lead to an increase in the share of energy efficient technology during
that period than was recorded by the California HBL study.
Figure 5-1 shows the trend in electricity process in Massachusetts and each of the four states
in the comparison area. The chart shows that energy prices fell by 5.0 percent and 6.5 percent
in Massachusetts over the past two years, respectively, an 11.5 percent decrease over the past
two years. Prices also declined for each of the past two years in Mississippi and Georgia, but
those declines only amounted to a two year decrease of 9.2 percent and 3.0 percent,
respectively. Meanwhile, prices in South Carolina actually increased in each of the past two
years. Alabama saw prices increase and then decrease, so the overall effect was close to zero
change. Falling prices in Massachusetts should lead to less exogenous pressure to adopt
energy efficient technologies, thereby supporting the evidence of relatively high program-
attributable market effects.

Page | 83
Figure 5-1: Average electricity prices by state
0.00
2.00
4.00
6.00
8.00
10.00
12.00
14.00
16.00
18.00
2006 2007 2008 2009 2010
Ce
nts
pe
r k
ilo
wa
tth
ou
r
MA
AL
MS
GA
SC
Source Bureau of Labor Statistics: http://www.bls.gov/schedule/archives/all_nr.htm#SRGUNE
Next, we consider whether relative economic conditions could lead to a reduction in the amount
of program-attributable savings. Stronger economic conditions in Massachusetts than the
comparison area would suggest that purchasing power in the comparison area is stymied by
economic conditions.
Figure 5-2 compares the unemployment rates of each state since 2006. The data show that
Massachusetts has one of the lowest unemployment rates each year relative to the states in the
comparison region. Lower unemployment provides an indication that the Massachusetts
economy was not impacted by the recent recession to the same extent as states in the
comparison area. The finding would place downward pressure on the level of program
attributable savings are firms in the comparison area are able to spend less on renovations,
thereby impeding their ability to make efficiency improvements.

Page | 84
Figure 5-2: Annual unemployment rate by state
0%
2%
4%
6%
8%
10%
12%
14%
2006 2007 2008 2009 2010
Un
em
plo
ym
en
t R
ate
MA
AL
MS
GA
SC
Source Bureau of Labor Statistics: http://www.bls.gov/schedule/archives/all_nr.htm#SRGUNE
Finally, Figure 5-3 shows trends in Gross state product for Massachusetts and the comparison
area. The diagram clearly illustrates that the Massachusetts economy is much larger than three
of the four states in the comparison area. Only Georgia generates more value added goods
and services than Massachusetts, and the remaining three states combined are just slightly
target than Massachusetts. However, the data do show that each state has experienced similar
trends in the value of goods and services over the past two years.
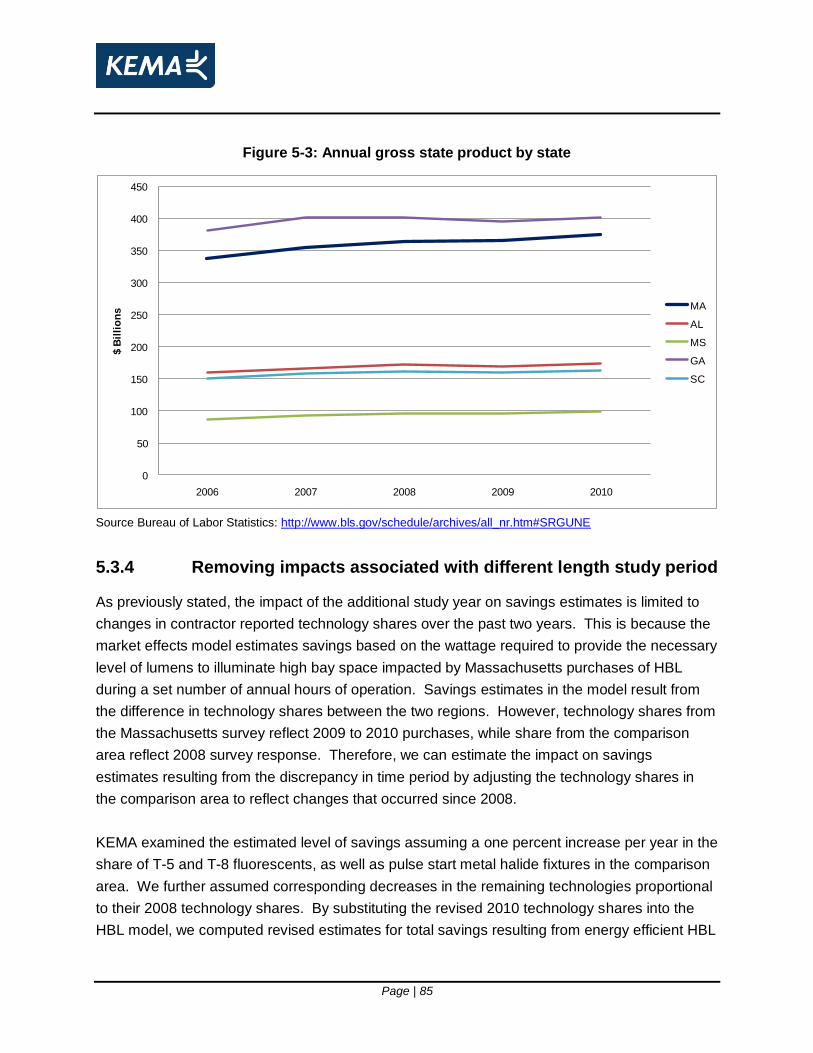
Page | 85
Figure 5-3: Annual gross state product by state
0
50
100
150
200
250
300
350
400
450
2006 2007 2008 2009 2010
$ B
illi
on
s MA
AL
MS
GA
SC
Source Bureau of Labor Statistics: http://www.bls.gov/schedule/archives/all_nr.htm#SRGUNE
5.3.4 Removing impacts associated with different length study period
As previously stated, the impact of the additional study year on savings estimates is limited to
changes in contractor reported technology shares over the past two years. This is because the
market effects model estimates savings based on the wattage required to provide the necessary
level of lumens to illuminate high bay space impacted by Massachusetts purchases of HBL
during a set number of annual hours of operation. Savings estimates in the model result from
the difference in technology shares between the two regions. However, technology shares from
the Massachusetts survey reflect 2009 to 2010 purchases, while share from the comparison
area reflect 2008 survey response. Therefore, we can estimate the impact on savings
estimates resulting from the discrepancy in time period by adjusting the technology shares in
the comparison area to reflect changes that occurred since 2008.
KEMA examined the estimated level of savings assuming a one percent increase per year in the
share of T-5 and T-8 fluorescents, as well as pulse start metal halide fixtures in the comparison
area. We further assumed corresponding decreases in the remaining technologies proportional
to their 2008 technology shares. By substituting the revised 2010 technology shares into the
HBL model, we computed revised estimates for total savings resulting from energy efficient HBL
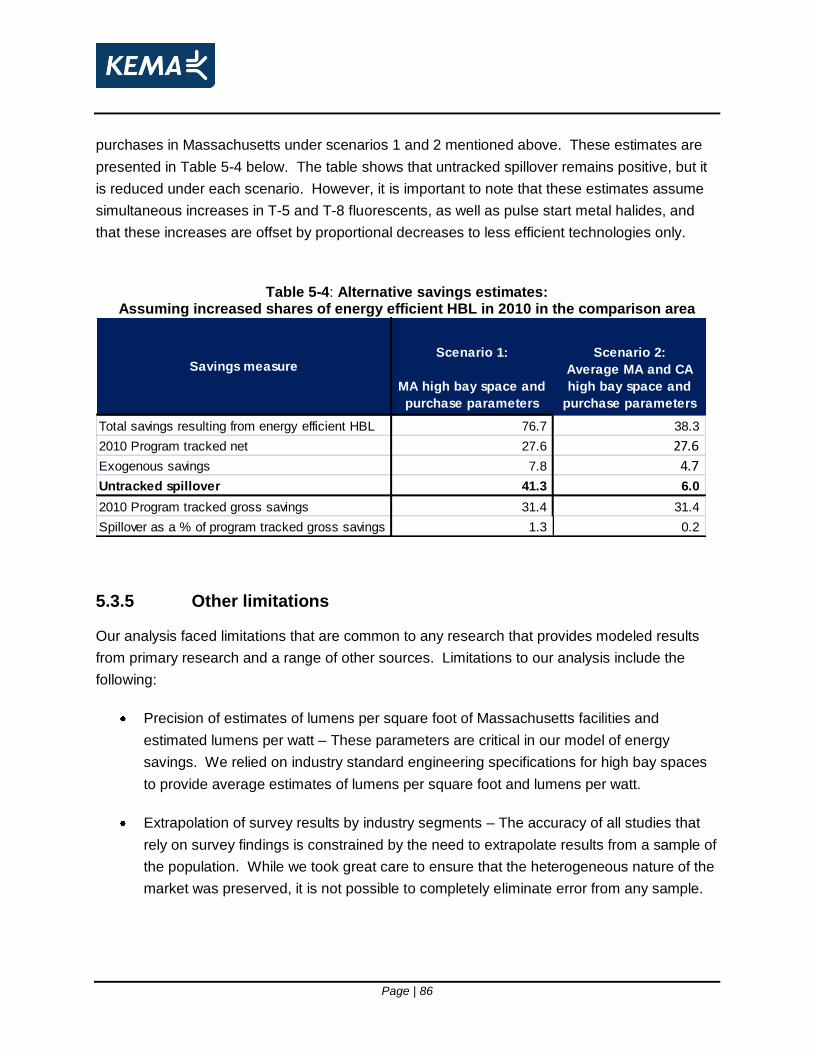
Page | 86
purchases in Massachusetts under scenarios 1 and 2 mentioned above. These estimates are
presented in Table 5-4 below. The table shows that untracked spillover remains positive, but it
is reduced under each scenario. However, it is important to note that these estimates assume
simultaneous increases in T-5 and T-8 fluorescents, as well as pulse start metal halides, and
that these increases are offset by proportional decreases to less efficient technologies only.
Table 5-4: Alternative savings estimates: Assuming increased shares of energy efficient HBL in 2010 in the comparison area
Scenario 1: Scenario 2:
MA high bay space and
purchase parameters
Average MA and CA
high bay space and
purchase parameters
Total savings resulting from energy efficient HBL 76.7 38.3
2010 Program tracked net 27.6 27.6
Exogenous savings 7.8 4.7
Untracked spillover 41.3 6.0
2010 Program tracked gross savings 31.4 31.4
Spillover as a % of program tracked gross savings 1.3 0.2
Savings measure
5.3.5 Other limitations
Our analysis faced limitations that are common to any research that provides modeled results
from primary research and a range of other sources. Limitations to our analysis include the
following:
Precision of estimates of lumens per square foot of Massachusetts facilities and
estimated lumens per watt – These parameters are critical in our model of energy
savings. We relied on industry standard engineering specifications for high bay spaces
to provide average estimates of lumens per square foot and lumens per watt.
Extrapolation of survey results by industry segments – The accuracy of all studies that
rely on survey findings is constrained by the need to extrapolate results from a sample of
the population. While we took great care to ensure that the heterogeneous nature of the
market was preserved, it is not possible to completely eliminate error from any sample.
Page | 87
Uncertainty surrounding exogenous factors impacting energy efficient HBL sales – Our
analysis of spillover was limited to those factors we could identify though survey findings
collected to meet a number of research objectives. A more focused research effort is
necessary isolate and measure exogenous factors contributing to energy efficient HBL
sales.
Variation in the interpretation of survey questions – While the research team used great
care in crafting research instruments, the manner in which respondents interpret
questions varies according to their own perceptions and experiences.
Page | 88
6. Recommendations
Based on the modeled approach and the preponderance of evidence presented in this market
effects study, KEMA recommends the electric PAs claim untracked spillover energy savings
associated with Massachusetts HBL measures. We recommend the Scenario 2 energy savings
estimate of 12.4 GWh per year or 39 percent of 2010 program tracked gross savings. This value
is consistent with the untracked spillover estimate of 34 percent of program tracked savings
estimated for Wisconsin in the 2010 Wisconsin HBL study.
Several of the electric PAs are currently claiming low levels of participant and or non-participant
energy savings for HBL measures. Prior to claiming the untracked spillover savings
recommended by this report the PAs must remove participant and or non-participant spillover
energy savings for HBL measures already being claimed to avoid double counting.