final report for pesticide air monitoring · monitoring report approval . report title: final...
TRANSCRIPT


+
State of California California Environmental Protection Agency
AIR RESOURCES BOARD
Final Report for Pesticide Air Monitoring 2,4-dichorphenoxyacetic Acid Dimethylamine Salt (2,4-D DMAS)
Application Study Stanislaus County November 2013
Prepared by
Steven Aston, Air Resources Engineer Special Purpose Monitoring Section
Air Quality Surveillance Branch Monitoring and Laboratory Division
May 16, 2016
Monitoring Report Approval
Report Title: Final Report for Pesticide Air Monitoring 2,4-Dichorphenoxyacetic Acid Dimethylamine Salt (2,4-D DMAS) Application Study Stanislaus County November 2013
Project Lead: Steve Aston, Air Resource Engineer
Approval: The following monitoring report has been reviewed and approved by the Monitoring and Laboratory Division.
Signatures:
Mac McDougall, Manager Date Special Purpose Monitoring Section
Kenneth R. Stroud, Chief Date Air Quality Surveillance Branch
i

Executive Summary
At the request of the Department of Pesticide Regulation (DPR), the Air Resources Board (ARB) conducted ambient air monitoring adjacent to an application of the pesticide 2,4Dichorphenoxyacetic Acid Dimethtylamine Salt (2,4-D DMAS) in Stanislaus County November 2013. The 2,4-D DMAS is applied directly to fields by ground application spraying and is used as an herbicide to control a wide range of grasses and broad-leaved weeds.
Seventy one field samples, including seven (7) field spikes, one (1) trip spike, one (1) field blank and nine (9) background samples were collected from eight different locations around the perimeter of an 39 acre almond orchard located in Stanislaus County. The 2,4-D DMAS was applied by ground using a spray rig which was pulled by a small cart at a rate of 1.43 lbs. of 2,4-D DMAS per acre.
Samples were collected by passing 1.0 liter per minute (LPM) of ambient air through XAD-2 sorbent tubes positioned 1.5 meters above ground level.
There were a total of seven (7) ambient sampling periods per DPR’s request (including a background). At the end of each sampling period, the XAD tubes were placed in containers with an affixed identification label and transported on dry ice following the last post sampling period to the ARB Sacramento Monitoring and Laboratory Division (MLD) laboratory for analysis. The samples were then stored in a freezer until analyzed. Samples were analyzed using gas chromatography with an electron capture detector.
DPR requested a target estimated quantitation limit (EQL) of 4 micrograms per cubic meter (µg/m³) which is equal to 4000 nanograms per cubic meter (ng/m³). The ARB’s laboratory achieved an EQL of 0.027 µg/m³ (27 ng/m³) based on a 12-hour sample with a flow rate of 1.0 LPM.
There were no positive concentrations of 2,4-D DMAS above the established analytical MDL of 3.82 ng/sample and estimated 12-hour sampling duration MDL of 0.0053 µg/m³
The seven (7) field spike recoveries ranged from 96 to 117% and the trip spike recovery of 106%
The seven laboratory (7) spikes for this study reported an average recovery of 87.3% with a standard deviation of 3.46%
ii

Table of Contents
Section Page
MONITORING REPORT APPROVAL………………………………………………………..i
EXECUTIVE SUMMARY………………………………………………………………………ii
TABLE OF CONTENTS……………………………………………………………………….iii-iv
1.0 INTRODUCTION.………………………………………………………………………1-3
2.0 SAMPLING SITES……………………………………………………………………...3-5
3.0 METHODS……………………………………………………………………………....5-7
4.0 RESULTS…………………………………………………………..............................8-15
5.0 QUALITY CONTROL RESULTS SUMMARY ……………………………………..16-17
6.0 DISCUSSION......……………………………………………………….....................18
TABLES:
Table 1: Application Information............................................................................2
Table 2: Application Sampling Periods…….......................…………………………3
Table 3: Sampling Waypoints.…………………...….................……………………..5
Table 4: Application Results By Site………................………………………………9-10
Table 5: Quality Control Data Field Spikes.………..................…………………….17
Table 6: Quality Control Trip Spikes………………………………………................17
Table 7: Quality Control Laboratory Spikes...……................……………………….17
FIGURES:
Figure 1: Spray Rig with Tank …………...……………………..……………………..2
Figure 2: Satellite Map of Overview Monitoring Area………...……………………..3
iii

Figure 3: Satellite Map of 2, 4-D DMAS Sampling Sites……....……………….......4
Figure 4: Ambient Air Sampler………………………....………………………….......6
Figure 5: Background Wind Rose....…………………....………………………….....11
Figure 6: Sampling Period 1 Application Wind Rose....………………………….....12
Figure 7: Sampling Period 2 Overnight Wind Rose…………………....……………13
Figure 8: Sampling Period 3 Daytime Wind Rose…………………….….………….14
Figure 9: Formulas Used to Calculate Application Results...………....……………15
APPENDICES:
APPENDIX A: Department of Pesticide Regulation Request to the Air Resource Board for Proposed Toxic Air Contaminants Monitoring for 2011
APPENDIX B: Site Photographs
APPENDIX C: Sampling Protocol
APPENDIX D: Laboratory Results Report
APPENDIX E: XAD2 Sample Field Log Sheet
APPENDIX F: Calibration/Certification Reports
APPENDIX G: Meteorological Data
iv

1.0 Introduction
At the request of the California Department of Pesticide Regulation (DPR) (2011 Memorandum, Reardon to Ayala, Appendix A), Air Resources Board (ARB) staff conducted sampling of airborne concentrations of 2,4-Dichorphenoxyacetic Acid Dimethtylamine Salt (2,4-D DMAS) during an application in Stanislaus County.
Seventy one field samples, including seven (7) field spikes and one (1) trip spike, one (1) field blank and nine (9) background samples were collected from eight different locations around the perimeter of an 39 acre almond orchard located in Stanislaus County from November 13 through November 17, 2013.
The 2,4-D DMAS was applied by ground spraying using a spray rig which was pulled by a small cart (See Figure 1) on November 14 from approximately 08:17 to 14:18 AM PST which calculates to a 6 hours and 1 minute application period which includes an approximately one (1) hour break to reload the tank on the spray rig.
The 2,4-D DMAS application rate of 1.43 lbs./acre was calculated using the farmer’s seed ticket and manufacture’s listed product label specification sheet. The information from the seed ticket showed that 117.0 pints of 2,4-D DMAS was applied to a 39 acre field. Per the manufacture’s listed product label specification sheet, 2,4-D DMAS Flowable Herbicide contains 3.8 lbs. of 2,4-D DMAS/gallon. The equations used to calculate the amount applied per acre is listed on page 15
Refer to the next page Table 1 and Table 2 for Application Information and Application Sampling periods.
The application sampling periods located in Table 2 have overlapping times due to the time it took to go around the field and when the samples were actually started. Each sample start/stop time is recorded on the field log sheets located in Appendix E.
1

Figure 1 Spray Rig with Tank
Parameter Details
Location Stanislaus County, CA. South of Ceres, west of Highway 99
Field Size 39 acres
Product Applied Saber Herbicide Active Ingredients:46.6% 2,4-D DMAS (Dimethylamine salt of 2,4-Dichlorophenoxyacetic acid) Inert Ingredients: 53.4% *Contains 3.8 lbs. 2,4-Dichlorophenoxyacetic acid equivalent per U.S. gallon or 456 liter *Contains 38.7% 2,4-Dichlorophenoxyacetic acid equivalent, by weight
Application Type Ground air-blast (cart pulled sprayer) Start = November 14, 2013, 0817 to 1418 PST
Commodity Almond Orchard
Application Rate 0.375 gallons of 2,4-D DMAS product per acre at a calculated 1.43 lbs./acre of 2,4-D DMAS
Table 1 Application Information
2

Sampling Period Sample Period Duration
(Hours)
Nov-2013
(Date)
Time
(Start/Stop)
Background 20.0 13-14 1212 to 0814
1 (Application) 7.0 14 0819 to 1558
2 (Nighttime) 16.8 14-15 1513 to 0800
3 (Daytime) 8.6 15 0727 to 1601
4 (Nighttime) 16.6 15-16 1526 to 0801
5 (Daytime) 8.9 16 0730 to 1625
6 (Nighttime) 16.3 16-17 1548 to 0807
Note: Exact duration for each sample is listed in APPENDIX D XAD2 Sample Field Log Sheets.
Table 2 Application Sampling Periods
2.0 Sampling Sites
Figure 2 (Satellite Map of Overview of Monitoring Area) and Figure 3 (Satellite Photo of 2, 4-D DMAS Sampling Sites) presents a Google map-view of the area surrounding the application field located in Stanislaus County and the locations of each sampler during the background, application and post-application sampling periods and the location of the Met One auto-met weather station.
39 Acre Almond Orchard
Figure 2 Satellite Map of Overview of Monitoring Area
3

Eight (8) samplers and one (1) co-located sampler were located approximately 20 meters from the edges of the treated field’s corners and were positioned midway down the length and width of the 39 acre almond orchard. See Appendix B for individual site photographs.
NEC
SEC
NNWC
W
SEC-C
SWC S
E
MET
Figure 3 Satellite Map of 2, 4-D DMAS Sampling Sites
During the background period the prevailing winds were coming out of the northwest, so the southeast corner of the field was chosen as the downwind site for quality control samples.
4

Table 3 below lists the sampler locations and coordinates.
Sampler ID Sample Position Related to Monitored Field Waypoints
MET (Meteorology Station)
53’ Southeast Corner of field Southeast
Corner of Field
NEC (Northeast Corner) 60’ East of the Northeast Corner of the field, Elevation = 16’
N 37˚33’04.1” W 120˚56’02.4”
N (North Side) 60’ North of the field and 670’ from the Northeast Corner, Elevation = 15’
N 37˚32’51.0” W 120˚56’10.9”
NWC (Northwest Corner) 60’ West of the Northwest Corner of the field and 670’ from North Side, Elevation = 13’
N 37˚33’04.1” W 120˚56’20.2”
W (West) 60’ West of the field and 620’ from the Northwest Corner of the field, Elevation = 13’
N 37˚32’58.0” W 120˚56’20.1”
SWC (Southwest Corner) 40’ West of the Southwest Corner and 620’ from the West of the field, Elevation = 13’
N 37˚32’51.7” W 120˚56’19.8”
S (South Side) 58’ South of the field and 670’ from the Southwest Corner of the field, Elevation = 12’
N 37˚32’51.0” W 120˚56’10.9”
SEC (Southeast Corner) 60’ East of the Southeast Corner of the field, 670’ from the South Side of the field, Elevation = 14’
N 37˚32’50.4” W 120˚56’03.4”
E (East) 60’ East of the field and 684’ from the Southeast Corner of the field, Elevation = 14’
N 37˚32’57.9” W 120˚56’02.6”
Table 3 Sample Waypoints
3.0 Methods
Samples were collected by passing 1.0 liter per minute (LPM) of ambient air through XAD-2 sorbent tubes, 1.5 meters above the ground level as shown in (Figure 4) Ambient Air Sampler. There were a total of seven (7) ambient sampling periods including a background as requested by DPR. Air samples were taken before, during, and after the 2, 4-D DMAS application. There were three (3) daytime and four (4) overnight sampling periods.
The background sampling started on November 13, 2013 at 12:12 (PST) and ran till the morning of November 14, 2013, 08:14 (PST).
The 2, 4-D DMAS application samples were started at 8:19 (PST) on April 14, 2013 and ended at 15:58 (PST).
5

Immediately after removing the application samples the post application samples were installed and ran overnight. Thereafter the post-application samples started one (1) hour before sunset and were collected one (1) hour after sunrise and reloaded with XAD-2 sorbent tubes for the daytime sampling.
At the end of each sampling period, the XAD-2 sorbent tubes were placed in containers with an affixed identification label. The exposed sample XAD-sorbent tubes were transported on dry ice, as soon as possible, to the ARB Sacramento Monitoring and Laboratory Division (MLD) laboratory for analysis. The samples were then stored in a freezer until analyzed.
Figure 4 Ambient Air Sampler
An AALBORG certified mass flow meter (MFM) was used to measure and adjust sample flow rates. The flow rates were set to 1.0 LPM, as measured using a digital 0-5 LPM MFM before the start and the sample flow rate was measured at the end of each sampling period. Samplers were leak checked prior to each sampling period with the sampling tubes installed. Any change in the flow rates were recorded in the field logbook. The field logbook was also used to record start and stop times, start and stop flow rates, start and stop time counter readings, sample identifications and any other significant information.
In addition to ambient air samples, quality control samples consisted of collocated samples, field spikes, a field blank and a trip spike.
6

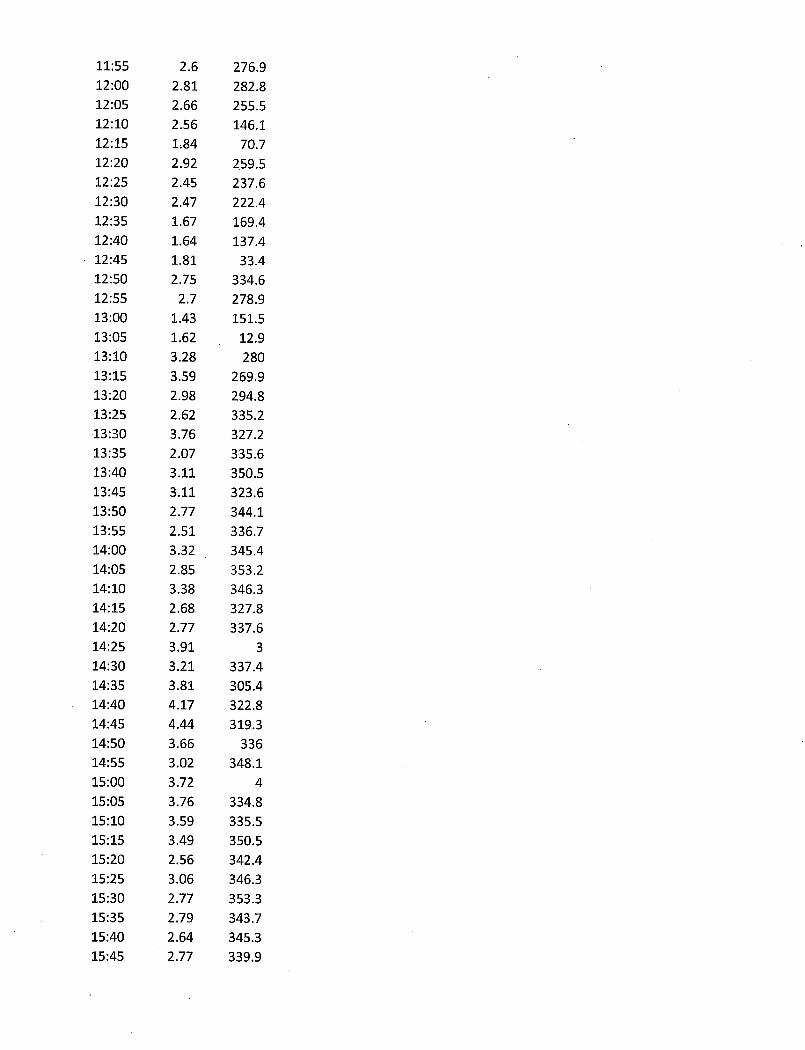
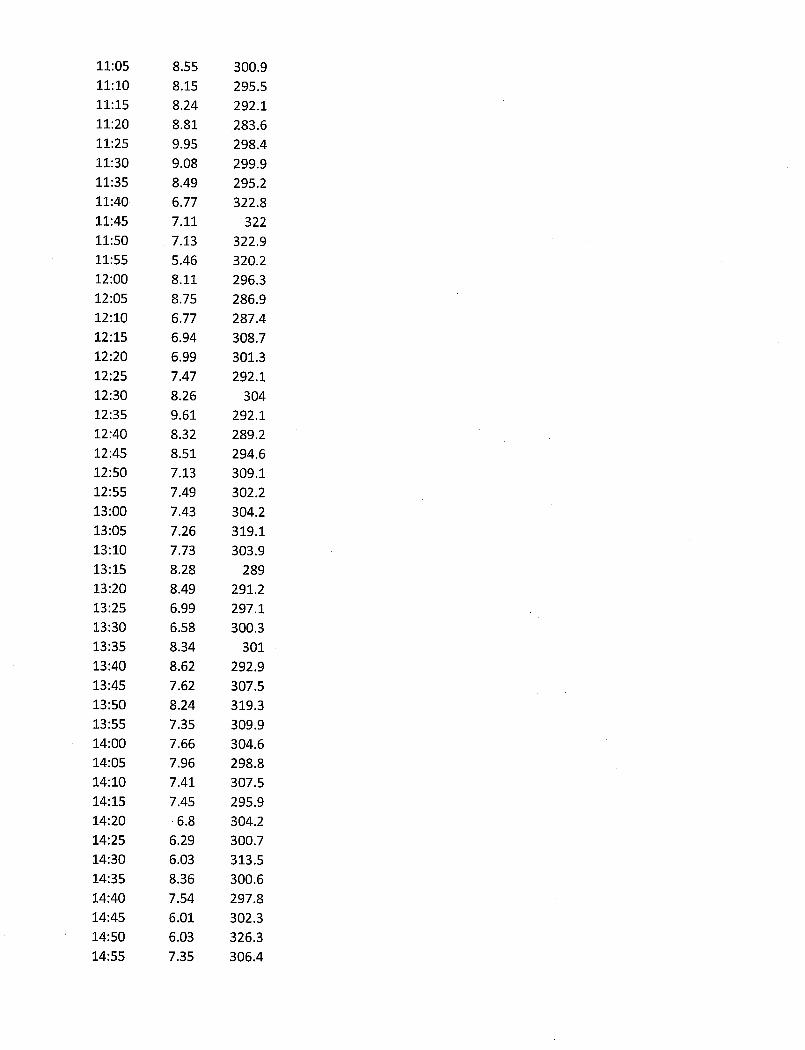
Meteorological data was collected using a Met One auto-met weather station which logged 5 minute averages for wind speed and direction along with temperature and relative humidity. See Figure 5, 6, 7, 8 for Wind Roses and APPENDIX G for meteorological data.
For details of the monitoring method, please refer to Appendix C, “Sampling Protocol for 2,4-Dichorphenoxyacetic Acid Dimethylamine Salt (2,4-D DMAS) Application Study” (dated November 7, 2013). The number of sampling periods were reduced from eight (8) sampling periods to seven (7) resulting in having less than the proposed number of samples reduce from (92) down to (71). There were no other significant deviations from this protocol.
Collected samples were analyzed by the Special Analysis Laboratory Section of MLD’s Northern Laboratory Branch using a gas chromatography analyzer with an electron capture detector.
The estimated quantitation level (EQL) based on a 24 hour sampling period for this method is 0.013 µg/m³ prior to any sample dilution for sampling at one (1) LPM and a four (4) milliliter (ml) extraction.
Per the laboratory’s report (APPENDIX D) the minimum detection limit (MDL) calculation follows the United States Environmental Protection Agency (USEPA) procedures for calculating MDL’s. Using the analysis of seven low-level matrix spikes (20 ng/ml), the MDL and EQL for a four-ml extract is calculated as follows:
s = the standard deviation of the concentration calculated for the seven replicate spikes. For 2,4-D DMAS: s = 0.3040
MDL = (3.143) x (s) = (3.143) x (0.3040) = 0.955 ng/ml. MDL (ng/sample) = 0.955 ng/ml x 4.00ml = 3.82 ng/sample EQL = (5) x (MDL) = (5) x (3.82) = 19.1 ng/sample
Based on a total collection volume of 1.440 m3 over a 24 hour sampling period the EQL would be 0.013 µg/m3. Most samples are collected during a 12 hour sampling period so to adjust for the collection volume of 0.720 m³ the, EQL is 0.027 µg/m³ and the MDL is 0.0053 µg/m³. All laboratory results are reported in ng/sample. Results less than the calculated MDL are reported as “<3.82 ng/sample.” See Appendix D
7

4.0 Results
The results reported indicated all levels of 2, 4-D DMAS were all less than the calculated MDL of 3.82 ng/sample.
The results are located in Table 4 and are reported by sample location, elapsed time in minutes and hours, average flow in LPM, calculated total volume m³. These values were used to calculate the reported lab results ng/sample to ng/m³ for each sampling location.
Wind roses are located in Figure 5 thru 8 showing the wind characteristics for each of the first (4) sampling periods including the background. The fourth through the sixth sampling period’s meteorological data was lost due to a malfunction in the met station data logger. The meteorological data was captured using five (5) minute averaging. (See APPENDIX G Meteorological Data)
The following abbreviation scheme is used to identify individual samples and sampling events.
Site/Sample Identification Ambient Site Naming: NEC 1-6 Northeast Corner of Field N 1-6 North Side of Field NWC 1-6 Northwest Corner of Field W 1-6 West Sid of Field SWC 1-6 Southwest Corner of Field S 1-6 South Side of Field SEC 1-6 Southeast Corner of Field SEC 1C-6C Southeast Corner of Field Co-located E 1-6 East Side of Field
See Figure 3, Satellite Map of 2,4-D DMAS Sampling Sites
Letter Abbreviations as follows: FS = Field Spike, CO= Co-located
8

Log # Sample
Location
Elapsed
Time
(Minutes)
Elapsed
Time
(Hours)
Avg.
Flow
(LPM)
Total
Volume
(m³)
2,4-D
(ng/sample)
2,4-D
(ng/m³)
11 NWC-1 402.0 6.7 1.47 0.59 <3.82 <6.46
21 NWC-2 972.0 16.2 1.14 1.11 <3.82 <3.45
31 NWC-3 480.0 8 1.06 0.51 <3.82 <7.51
41 NWC-4 960.0 16 1.11 1.07 <3.82 <3.58
51 NWC-5 498.0 8.3 1.10 0.55 <3.82 <6.97
61 NWC-6 948.0 15.8 1.04 0.99 <3.82 <3.87
2 BKG-W 1146.0 19.1 0.80 0.92 <3.82 <4.17
12 W-1 420.0 7 1.15 0.48 <3.82 <7.91
22 W-2 972.0 16.2 1.14 1.11 <3.82 <3.45
32 W-3 480.0 8 1.08 0.52 <3.82 <7.37
42 W-4 960.0 16.0 1.10 1.06 <3.82 <3.62
52 W-5 498.0 8.3 1.08 0.54 <3.82 <7.10
62 W-6 948.0 15.8 1.05 1.00 <3.82 <3.84
3 BKG-SWC 1152.0 19.2 0.78 0.90 <3.82 <4.25
13 SWC-1 426.0 7.1 1.21 0.52 <3.82 <7.41
23 SWC-2 972.0 16.2 1.06 1.03 <3.82 <3.71
33 SWC-3 480.0 8.0 1.10 0.53 <3.82 <7.23
43 SWC-4 960.0 16.0 1.12 1.08 <3.82 <3.55
53 SWC-5 498.0 8.3 1.10 0.55 <3.82 <6.97
63 SWC-6 942.0 15.7 1.04 0.98 <3.82 <3.90
4 BKG-S 978.0 16.3 0.83 0.81 <3.82 <4.71
14 S-1 432.0 7.2 0.95 0.41 <3.82 <9.31
24 S-2 972.0 16.2 1.12 1.09 <3.82 <3.51
34 S-3 480.0 8.0 1.08 0.52 <3.82 <7.37
44 S-4 960.0 16.0 1.11 1.07 <3.82 <3.58
54 S-5 498.0 8.3 1.10 0.55 <3.82 <6.97
64 S-6 942.0 15.7 1.05 0.99 <3.82 <3.86
5 BKG-SEC 1152.0 19.2 0.86 0.99 <3.82 <3.86
15 SEC-1 438.0 7.3 1.11 0.49 <3.82 <7.86
25 SEC-2 972.0 16.2 1.18 1.15 <3.82 <3.33
35 SEC-3 480.0 8.0 1.08 0.52 <3.82 <7.37
45 SEC-4 960.0 16.0 1.13 1.08 <3.82 <3.52
55 SEC-5 498.0 8.3 1.10 0.55 <3.82 <6.97
65 SEC-6 942.0 15.7 1.08 1.02 <3.82 <3.75
Table 4 Application Results by Site
9

Log # Sample
Location
Elapsed
Time
(Minutes)
Elapsed
Time
(Hours)
Avg.
Flow
(LPM)
Total
Volume
(m³)
2,4-D
(ng/sample)
2,4-D
(ng/m³)
6 BKG-SEC-C 1152.0 19.2 0.81 0.93 <3.82 <4.09
16 SEC-1C 444.0 7.4 1.15 0.51 <3.82 <7.48
26 SEC-2C 966.0 16.1 1.22 1.18 <3.82 <3.24
36 SEC-3C 486.0 8.1 1.08 0.52 <3.82 <7.28
46 SEC-4C 960.0 16 1.19 1.14 <3.82 <3.34
56 SEC-5C 492.0 8.2 1.11 0.55 <3.82 <6.99
66 SEC-6C 948.0 15.8 1.05 1.00 <3.82 <3.84
7 BKG-FS-1 1152.0 19.2 0.88 1.01 <3.82 <3.77
17 SEC-1FS 438.0 7.3 1.01 0.44 <3.82 <8.64
27 SEC-2FS 972.0 16.2 1.21 1.18 <3.82 <3.25
37 SEC-3FS 480.0 8.0 1.10 0.53 <3.82 <7.23
47 SEC-4FS 960.0 16 1.12 1.08 <3.82 <3.55
57 SEC-5FS 498.0 8.3 1.08 0.54 <3.82 <7.10
67 SEC-6FS 942.0 15.7 1.05 0.99 <3.82 <3.86
8 BKG-E 1158.0 19.3 1.06 1.23 <3.82 <3.11
18 E-1 450.0 7.5 0.88 0.40 <3.82 <9.65
28 E-2 966.0 16.1 1.26 1.22 <3.82 <3.14
38 E-3 480.0 8 1.08 0.52 <3.82 <7.37
48 E-4 960.0 16 1.08 1.04 <3.82 <3.68
58 E-5 504.0 8.4 1.10 0.55 <3.82 <6.89
68 E-6 936.0 15.6 1.01 0.95 <3.82 <4.04
9 BKG-NEC 1158.0 19.3 1.05 1.22 <3.82 <3.14
19 NEC-1 414.0 6.9 0.89 0.37 <3.82 <10.37
29 NEC-2 966.0 16.1 1.25 1.21 <3.82 <3.16
39 NEC-3 480.0 8 1.13 0.54 <3.82 <7.04
49 NEC-4 960.0 16 1.10 1.06 <3.82 <3.62
59 NEC-5 504.0 8.4 1.11 0.56 <3.82 <6.83
69 NEC-6 942.0 15.7 1.05 0.99 <3.82 <3.86
10 BKG-N 1152.0 19.2 1.20 1.38 <3.82 <2.76
20 N-1 462.0 7.7 0.92 0.43 <3.82 <8.99
30 N-2 966.0 16.1 1.24 1.20 <3.82 <3.19
40 N-3 480.0 8 1.10 0.53 <3.82 <7.23
50 N-4 960.0 16 1.10 1.06 <3.82 <3.62
60 N-5 504.0 8.4 1.10 0.55 <3.82 <6.89
70 N-6 942.0 15.7 1.03 0.97 <3.82 <3.94
Table 4 Application Results by Site
10

Figure 5
Background Wind Rose
11

Figure 6
Sampling Period 1 Application Wind Rose
12

Figure 7
Sampling Period 2 Overnight Wind Rose
13

Figure 8 Sampling Period 3 Daytime Wind Rose
14

The Formulas Used to Calculate Monitoring Results
Sample Volume m³ = (Sample Flow liters) x (Sample Time minute) x (___1 m³ ) ( minute ) (1000 liters )
2,4-D DMAS ng = (2,4-D DMAS ng) x (__ Sample )
m³ ( Sample ) ( Total Volume m³ )
2,4-D DMAS ng = (2,4-D DMAS ng) x ( 4 ml Extraction Volume)
sample ( ml ) ( 1 Sample )
2,4-D DMAS ng = (2,4-D DMAS ng) x (Sample Volume m³) x ( 1 Sample )
ml ( m³ ) ( 1 Sample ) (4 ml Extraction Volume)
Note: 4 ml sample dilution Extraction Volume per sample
Calculating Percent Recovery of Field Spikes (FS)
Difference ng = FS ng – Primary Sample ng m³ m³ m³
Percent Recovery % = (Difference ng) x (FS Volume m³) x ___________ x 100 m³ (FS Concentration ng)
ml Note: The field spike concentrations were spiked by the laboratory at 100 ng/ml. If the field spike corresponding sample is reported less than the analytical MDL the following % recovery calculation is used.
Percent Recovery % = (Field spike Recovery ng/ml) x 100 100 ng/ml
Calculating 2,4-D DMAS Application Rate lbs. /acre
117 pints 2,4-D DMAS Total Product Used = 1872 fluid oz 2,4-D DMAS
1872 fluid oz. = 14.63 gallons of 2,4-D DMAS Flowable Product 128.0 oz. /gallon
(14.63 gallons 2,4-D DMAS Flowable product) x (3.8 lbs. 2,4-D DMAS/gallon) = 1.43 lbs./acre ( 39.00 acres ) 2,4-D DMAS
Note: Per manufacture’s listed product label specification sheet, 2,4-D DMAS Flowable Herbicide contains 3.8 lbs. of 2,4-D DMAS/gallon
Figure 9 Formulas Used to Calculate Application Results
15

5.0 Quality Control Results
The quality control results from the Special Analysis Laboratory Section of MLD’s Northern Laboratory Branch are presented in Appendix D, “2,4-Dichlorophenoxyacetic Acid Dimethylamine Salt (2,4-D DMAS) Analytical Results for an Application Study.”
Laboratory staff analyzes a system blank with each analytical batch, before the calibration, after the control and check samples, and after every tenth sample, and after samples containing high levels of chlorthal-dimethyl or co-extracted contaminants. The staff defines an analytical batch as all the samples extracted together, but not to exceed 20 samples. The system blank is analyzed to ensure the solvent and instrument does not contribute interferences to the analysis, and to minimize carryover from high level samples. All system blanks were less than the analytical MDL (3.82 ng/sample)
Method Blanks: Laboratory staff analyzed a method blank with each analytical batch. This is an XAD tube prepared and analyzed as described for the ambient samples. All method blanks were less than the analytical MDL.
Laboratory staff analyzed a Laboratory Control Standard (LCS) with each analytical batch. The LCS is an XAD tube spiked with 100 ng/ml of 2,4-D DMAS. The LCS is extracted and analyzed as described for the samples. The acceptance criterion for LCS results is ± 20%. The LCS averaged 87.3% with a standard deviation of 3.8%.
Following standard lab procedures, laboratory staff analyzed a Continuing Calibration Verification (CCV) after every calibration curve, after every tenth sample and at the end of an analytical batch. The CCV must be within + 25% of the expected value. If any of the CCVs are outside this limit, the affected samples are re-analyzed. The CCV standard for each analytical batch was 30 ng/ml. All CCV’s were in the expected range.
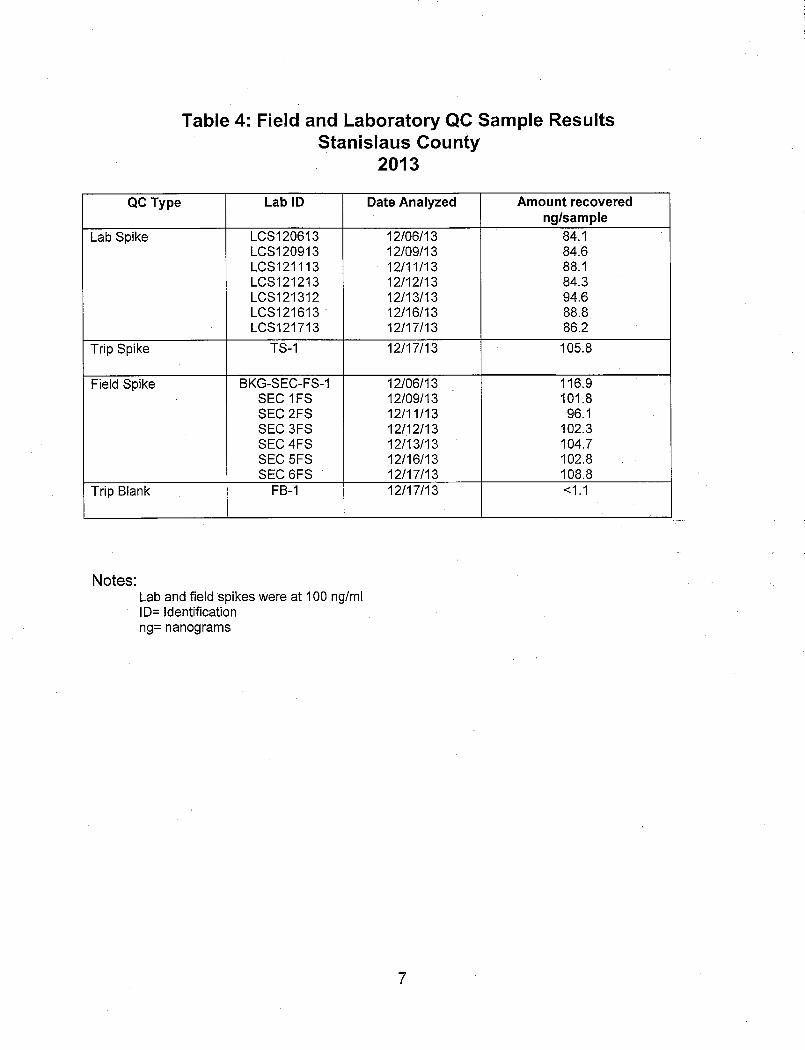
Field Spikes: The seven (7) field spikes were collected in the SEC quadrant. Samples were collected during the application and the three post-application periods. All field spikes were prepared with 100 ng/ml of 2,4-D DMAS. The average recovery for the field spikes of 2,4-D DMAS was 105% with a standard deviation of 6.06%. Refer to Table 5
Trip Spikes: The trip spike recovery of 106%. Refer to Table 6
Lab Spikes: The seven laboratory spikes for this study reported an average recovery of 87.3% with a standard deviation of 3.46% Refer to Table 7
16

Log
#
Sample
Location
Expected
ng/ml
Measured
ng/ml
Recovery
%
7 BKG-FS-1 100 116.9 117
17 SEC-1FS 100 101.8 102
27 SEC-2FS 100 96.1 96
37 SEC-3FS 100 102.3 102
47 SEC-4FS 100 104.7 105
57 SEC-5FS 100 102.8 103
67 SEC-6FS 100 108.8 109
Table 5 Quality Control Data Field Spikes
Log
#
Sample
Location
Date
Collected
Date
Analyzed
Expected
ng/ml
Measured
ng/ml
Difference
ng/ml
Recovery
%
TS-1 Trip Spike 1 11/16/2013 12/17/2013 100 105.8 5.8 106
Table 6 Quality Control Data Trip Spikes
Sample
Location
Date
Analyzed
Expected
ng/ml
Measured
ng/ml
Difference
ng/ml
Recovery
%
Lab Spike 1 12/6/2013 100 84.1 15.9 84
Lab Spike 2 12/9/2013 100 84.6 15.4 85
Lab Spike 3 12/11/2013 100 88.1 11.9 88
Lab Spike 4 12/12/2013 100 84.3 15.7 84
Lab Spike 5 12/13/2013 100 94.6 5.4 95
Lab Spike 6 12/16/2013 100 88.8 11.2 89
Lab Spike 7 12/17/2013 100 86.2 13.8 86
Table 7 Quality Control Data Laboratory Spikes
17

6.0 Discussion
Seventy one field samples were collected during the background, application and post-application period (including seven field spikes, one trip spike and one field blank) from eight different locations around the perimeter of a 39 acre almond orchard located in Stanislaus County. Seven laboratory spikes were prepared and held at the laboratory at the same time the field/trip spikes were prepared. No 2,4-D DMAS was detected during the background or application sampling periods. The results reported indicated all levels of 2, 4-D DMAS were all less than the calculated analytical MDL of 3.82 ng/sample.
The non-detection of 2, 4-D DMAS may be attributed to the applicator who applied when the winds were calm. Additionally, The 2, 4-D DMAS was applied by ground using a spray rig which was low to ground and helped to contain the applied pesticide.
18

APPENDIX A
Department of Pesticide Regulation Request to the Air Resource Board for Proposed Toxic Air Contaminants Monitoring for
2013


APPENDIX B
Site Photographs
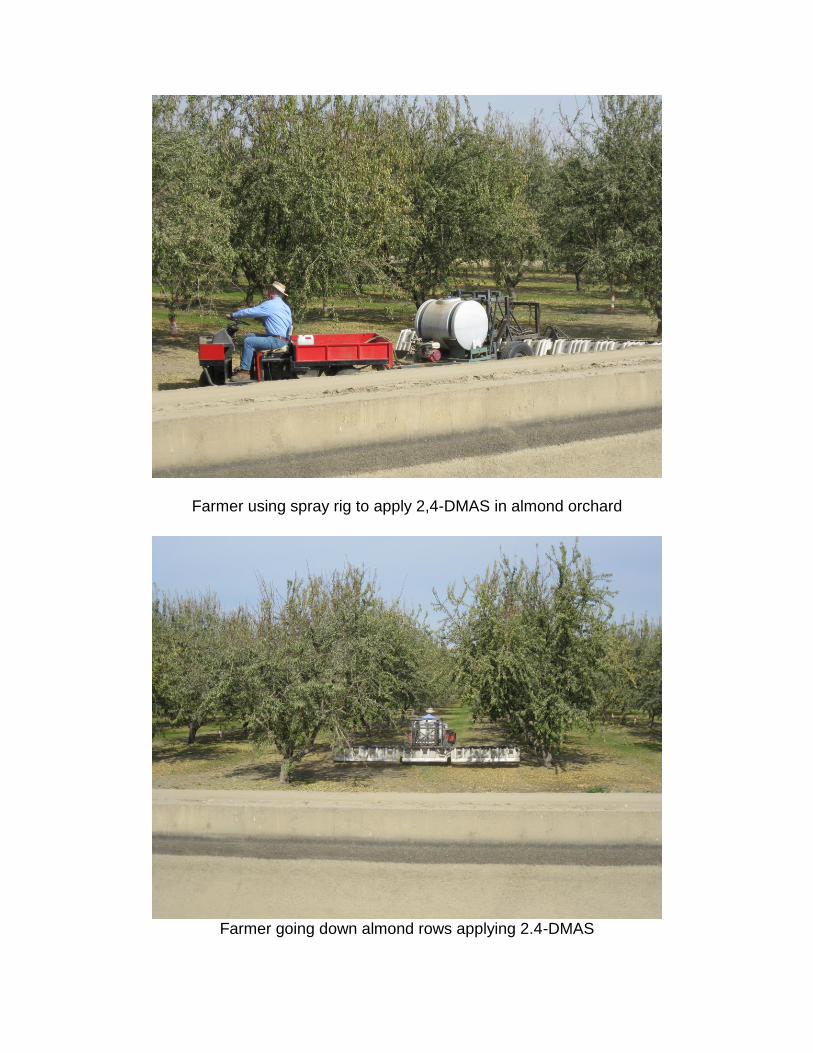
Farmer using spray rig to apply 2,4-DMAS in almond orchard
Farmer going down almond rows applying 2.4-DMAS

North Sampler Looking North
North Sampler Looking South

North Sampler Looking West
North Sampler Looking East

North West Corner Sampler Looking East
North West Corner Sampler Looking North

North West Corner Sampler Looking West
North West Corner Sampler Looking South

West Sampler Looking South
West Sampler Looking North

West Sampler Looking East
South West Corner Sampler Looking South

South West Corner Sampler Looking East
South West Corner Sampler Looking North

South West Corner Sampler Looking West
South Sampler Looking East

South Sampler Looking North
South Sampler Looking West

South Sampler Looking South
South East Corner Co-Located Samplers Looking South

South East Corner Co-Located Samplers Looking West
South East Corner Co-Located Samplers Looking North

South East Corner Co-Located Samplers Looking East
South East Corner Auto Met Station Looking North East

South East Corner Auto Met Station Looking East
South East Corner Auto Met Station Looking South
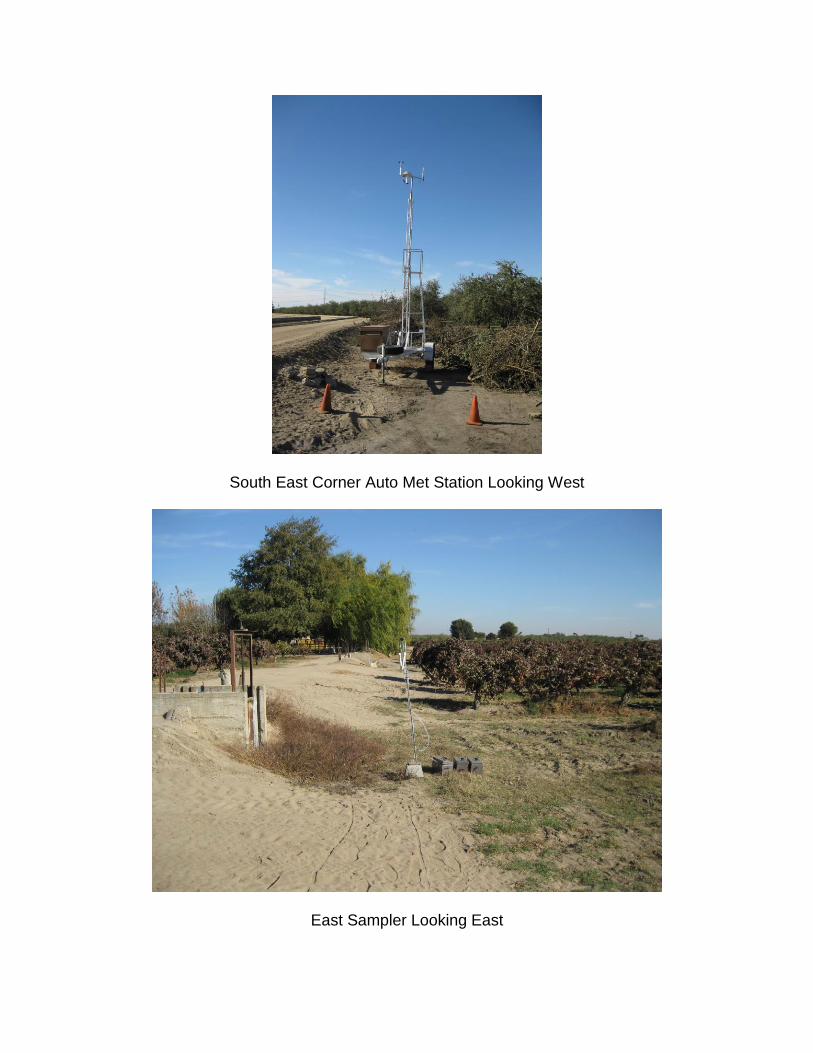
South East Corner Auto Met Station Looking West
East Sampler Looking East

East Sampler Looking North
East Sampler Looking West

East Sampler Looking South
North East Corner Sampler Looking East

North East Corner Sampler Looking West
North East Corner Sampler Looking South

North East Corner Sampler Looking North
Personal Protective Equipment Abatement Air Sampler Worn by Staff

Personal Protective Equipment Abatement Air Sampler Worn by Staff
Farmer Finishing Up Application on Almond Orchard

Spray Rig Washed Down After Application
Spray Rig Washed Down After Application

APPENDIX C
Sampling Protocol

_______________________________
Monitoring and Laboratory Division Air Quality Surveillance Branch
Sampling Protocol for 2,4-Dichorphenoxyacetic Acid Dimethylamine Salt (2,4-D DMAS) Application Study
November 7, 2013
Prepared by:
Steve Aston Air Resources Engineer
Special Purpose Monitoring Section
Signatures:
Kenneth R. Stroud, Chief Date Air Quality Surveillance Branch Air Resources Board
Mac McDougall, Manager Date Special Purpose Monitoring Air Quality Surveillance Branch

Table of Contents
Section Page
1.0 INTRODUCTION.…………………………………………………………….……………..3
2.0 PROJECT GOAL AND OBJECTIVES……………………………………………………4 3.0 CONTACTS………………………………………...…………………………….…………5 4.0 STUDY LOCATION…………………………………………………………………….......6
5.0 STUDY DESIGN………………………………………………………………………….6-9 6.0 SAMPLING AND ANALYSIS PROCEDURES.……………………………………...9-10
7.0 LIST OF FIELD EQUIPMENT...................................................................................10
8.0 QUALITY CONTROL……..………………………..................................................10-11
9.0 DELIVERABLES..………………………………………………………………………..12
Figures
FIGURE 1: AIR SAMPLER TREE WITH PUMP.…………….…………………………..…..8
FIGURE 2: RESIN SORBENT TUBE FIELD LOG SHEET………………………….….…13
Appendix
APPENDIX A: Standard Operating Procedure Sampling and Analysis of Chlorthal-Dimethyl (DCPA).
2

1.0 Introduction
The California Department of Pesticide Regulation’s (DPR) memorandum dated February 13, 2013, “Proposed Toxic Air Contaminant Monitoring For 2013”, requests that the Air Resources Board (ARB) conduct a comprehensive air monitoring study for the herbicide 2,4-Dichlorophenoxyacetic Acid Dimethylamine Salt (2,4-D DMAS) during a ground application.
This study will consist of eight sampling periods.
1) A background sample period duration time minimum 18-24 hours (arrival Wednesday)
2) Application sampling period begins Thursday morning until one (1) hour after end of application
3) Post application sampling period begins Thursday morning one (1) hour after end of application until one (1) hour before sunset.
4) Post application overnight sampling period begins Thursday evening one (1) hour before sunset and is removed one (1) hour after sunrise Friday morning.
5) Post application daytime sampling period begins Friday morning one (1) hour after sunrise and is removed one (1) hour before sunset.
6) Post application overnight sampling period begins Friday evening one (1) hour before sunset and is removed one (1) hour after sunrise Saturday morning.
7) Post application daytime sampling period begins Saturday morning one (1) hour after sunrise and is removed one (1) hour before sunset.
8) Post application overnight sampling period begins Saturday evening one (1) hour before sunset and is removed one (1) hour after sunrise Sunday morning.
The background sampling period will be performed eighteen to twenty-four hours prior to the application of DCPA. The application sampling period will begin thirty minutes prior to the application of 2,4-D DMAS. There will be a total of 92 resin sorbent tube samples eight (8) background, eight (8) collocated, eight (8) field spikes, one (1) trip spike, one (1) trip blank, 56 application/post application and ten (10) spares.
Background sampling will be started the day before the application and end approximately one (1) hour prior to the start of the application or when the elapsed time reaches a minimum of 12 hours. Eight (8) background samplers will be placed around the perimeter of the field along with one (1) collocated sampler and one (1) field spike sampler on the downwind side.
3

2.0 Project Goals and Objectives
The primary goal of this monitoring project is to measure the concentrations of 2,4-D DMAS in the ambient air during and after application. To achieve the project goal, the following objectives should be met:
1. Identification of monitoring sites that mutually satisfies criteria for ambient air sampling and DPR’s requirements.
2. Appropriate application of sampling/monitoring equipment to determine 2,4-D DMAS concentrations in the air adjacent to the application.
3. Application of relevant field quality assurance/quality control practices to ensure the integrity of field samples.
4. A final report containing all relevant information, data and results gathered in the course of MLD’s activities during the planning and execution of this project.
4

3.0 Contacts
Mac McDougall, Manager Special Purpose Monitoring Section 916-327-4720 [email protected]
Neil Adler, Air Pollution Specialist Special Purpose Monitoring Section Office 916-323-3231 [email protected]
Steve Rider, Air Pollution Specialist Special Purpose Monitoring Section Office 916-327-4719 [email protected]
Steve Aston, Air Resources Engineer Special Purpose Monitoring Section Office 916-327-0885 [email protected]
Russell Grace, Manager Special Analysis Section Office 916-322-2496 [email protected]
Glen Peoples, Air Pollution Specialist Special Analysis Section Office 916-322-8972 [email protected]
Pam Wofford, Agriculture Program Supervisor Department of Pesticide Regulation Office 916-825-8076 [email protected]
5

4.0 Study Location
A 2,4-D DMAS application is planned for November 14, 2013 in Stanislaus County. The field is located 2 miles south/southeast of Ceres on the west side of Highway 99.
5.0 Study Design
The 2,4-D DMAS sampling schedule is listed in Table 1 (Sampling Periods). For November 14, 2013 sunrise occurs at 0643 PST and sunset occurs at 1655 PST.
TABLE 1: SAMPLING PERIODS
Sampling Period Begins Sampling Duration/Event Time Background (Wednesday Arrival) Minimum 12-24 hours (Pre-Application) Application (8 PST Thursday Morning)
Sample is removed one (1) hour after (Application)
Post Application (Thursday Morning) Sample is installed one (1) hour after (Application) Post Application (Thursday Evening) Sample is installed one (1) hour before sunset
(Overnight) Post Application (Friday Morning) Sample is installed one (1) hour before sunrise
(Morning) Post Application (Friday Evening) Sample is installed one (1) hour before sunset
(Overnight) Post Application (Saturday Morning) Sample is installed one (1) hour before sunrise
(Morning) Post Application (Saturday Evening) Sample is installed one (1) hour before sunset
(Overnight) All overnight samples must include the period from one hour before sunset to one hour after sunrise.
a) Background sampling will start the day before the application for a minimum of twelve hours, but no more than twenty four hours. The background samples will be removed at least one (1) hour prior to the start of the application. The background samplers will be installed at all four corners and at each of the four sides of the field at quarterly lengths with one (1) field spike sampler and one (1) collocated sampler next to the downwind site for a total of ten (10) samplers. The field spike samples will be pre-spiked with a concentration of 100 nanograms (ng) per sample for 2,4-D DMAS.
b) The application sampling period will start approximately thirty minutes prior to the ground application of 2,4-D DMAS and will continue until one (1) hour after the application. First post application sample one (1) hour after end of application until one (1) hour before sunset. Second post application overnight sampling period will start one (1) hour before sunset and continue until one (1) hour after sunrise. Third post application daytime sampling period will start one (1) hour after sunrise and will continue until one (1) hour before sunset. Fourth post
6

application overnight sampling period will start one (1) hour before sunset and will continue until one (1) hour after sunrise. Fifth post application daytime sampling period will start one (1) hour after sunrise and will continue until one (1) hour before sunset. Sixth post application overnight sampling period will start one (1) hour before sunset and will continue until one (1) hour after sunrise.
c) There will be eight (8) sampling sites around the orchard. For a square field, four (4) sites will be located at each corner and four (4) sites will be located at quarterly lengths on each side. The projected downwind site will have two additional samplers, one (1) collocated and one (1) field spike, located within 0.6 meters of the primary sampler. All sampler intakes will be 1.7 meters (67 + 6 inches) above the ground. Samplers will be placed 20 +10 meters (33 to 98 feet) from the edge of the field.
d) Each sample will be collected by passing a measured volume of ambient air through one XAD resin sorbent tube that is mounted on a sampling tree as shown in Figure 1. Sample flow is controlled by an inline rotameter (flow range of 0-5 LPM) and the resin sorbent tube will be protected from direct sunlight or rain. Prior to each sampling period, the sampler is checked for leaks. After the sample resin sorbent tube is installed, the flow rate will be set at 1.0 lpm using a digital mass flow meter. The flow rate will be checked at the end of each sampling period and the average of the start and stop flows shall be 1.0 lpm +20%. At the end of each sampling period, the tubes will be placed in culture tubes with an identification label affixed and placed in a dry ice cooler. The field log sheet and resin sorbent tube label will contain the following information: log #, sample name, sampler ID number, start and end date/time, start/end elapsed time meter reading, start/end mass flow meter display reading, comments (if applicable), weather conditions and the start/end initials of the operator. The exposed XAD-2 resin sorbent tubes (SKC #226-30-06) with 400 and 200 mg of packing are stored in an ice chest (on dry ice) or in a freezer until extracted in the laboratory.
7

DWYER
1 2 3 4 5
0
DWYER
1 2 3 4 5
0
AC/DC Pump Cement Pier
1.7 Meters
XA
D
PVC
Tube
& C
ap Conn
ector
FIGURE 1: AIR SAMPLER TREE WITH PUMP
e) In order to reduce direct exposure to ARB staff during the pesticide application period all samplers will begin a minimum of thirty minutes prior to the start of the application. At the end of each sampling period the following general procedure will occur at each site; flows will be verified, documentation completed, all resin sorbent tubes removed, the battery replaced, a new resin sorbent tube installed and flows adjusted if necessary. Field notes and observations will be recorded (such as 2,4-D DMAS application flow rate and total amount of 2,4-D DMAS applied).
f) Meteorological data will be collected using a Met-One Automet portable meteorology system. The Automet will be located no closer than twenty meters from the edge of the field being monitored. The meteorological sensors will be installed 7.5 meters above the ground. The AutoMet station will continuously measure and record 5 minute averages for wind speed, wind direction, ambient
8

temperature and percent relative humidity throughout the background and application sampling periods.
g) The MLD will provide DPR with a final report containing all relevant information, collected data and analytical results gathered during the course of the study.
6.0 Sampling and Analysis Procedures
Special Purpose Monitoring Section (SPM) staff will hand-carry resin sorbent tubes to and from MLD’s laboratory in Sacramento, and to and from the sampling location. The resin sorbent tubes will not be exposed to extreme conditions or subjected to rough handling that might cause loss or degradation of sample. At the end of the each sampling period, all resin sorbent tubes will be removed from the sampler, placed in a culture tube, labeled, and secured in a dry ice cooler.
At each sampling site, the operator will replace the batteries for each pesticide sampler with charged batteries; install a new resin sorbent tube and install the rain/sun shield over the resin tube. The resin sorbent tube field log sheet (See Figure 2) shall be filled out a long with the resin sorbent tube label. Prior to any sampling, flows will be set to 1.0 + 0.1 lpm. At the start of each sampling period, the pesticide samplers will be manually turned on and the start date, time, elapsed time meter reading and indicated flow rate will be recorded. At the end of each sampling period, the flow rate will be measured, the pesticide sampler manually shut off and the following recorded on the resin sorbent tube field log sheet; end date, time, elapsed time meter reading and flow.
Sampling will occur as scheduled unless ambient conditions at the start include rain or instantaneous gusts of wind over ten (10) miles per hour. All reported sampling times, including meteorological data, will be reported in Pacific Standard Time (PST).
The Northern Laboratory Branch (NLB) will supply Special Purpose Monitoring with 92 resin sorbent tubes; eight (8) backgrounds, five (8) collocated, five (8) field spikes, one (1) trip spike, one (1) trip blank, 56 application/post application and ten (10) spares. A label will be affixed around the top section of the resin sorbent tube identifying the sample. Spikes and other QC resin sorbent tubes will be identified. The NLB will perform analyses for 2,4-D DMAS on all collected samples and report results to SPM in electronic format (Excel) and hardcopy. Laboratory analysis will be performed in accordance with the draft standard operating procedures, “Standard Operating Procedure Sampling and Analysis of 2,4-Dichorophenoxyacetic Acid Dimethylamine Salt (2,4-D DMAS).” The current analytical Method Detection Limit (MDL) is 0.66 nanograms (ng) per sample for 2,4-D DMAS. The laboratory’s operating procedure is included in this Protocol as Appendix A.
The following resin sorbent tube validation and analytical quality control criteria will be followed during pesticide analysis.
1. Sample Hold Time: Sample hold time criteria will be consistent with the laboratory’s operation procedure stated 28 days.
9

2. Duplicate Analysis: Laboratory to provide duplicate analytical results and the corresponding relative percent difference (RPD)
3. Method Detection Limit (MDL): Sample analysis results less than the MDL shall be reported as a less than numerical value. This less than numerical value shall incorporate any dilutions (dilution factor will be included in the report)
4. Analytical Linear Range: Analytical results greater than 10% of the highest calibration standard shall be diluted and reanalyzed within the calibrated linear range.
7.0 List of Field Equipment
Quantity Item Description
(1) Met-One Automet portable meteorology system consisting of a data logger and calibrated sensors measuring 5 minute averages for wind speed, direction, ambient temperature, and relative humidity.
(1) Measuring Wheel (1) 200 foot measuring tape (1) Tripod and compass (1) Global Positioning System (GPS) with backup batteries and carrying case (1) Digital Camera with backup batteries and carrying case (2) Aalborg certified mass flow meter 0-5 lpm (92) Resin sorbent tubes (8 backgrounds, 8 collocated, 8 field spikes, 1 trip spike, 1
trip blank, 56 application/post application and 10 spares) (10) Pesticide sampler each equipped with one (1) each sampling train and voloflows
setup to sample one (1) resin tube. (12) Pump, 12 VDC. (80) Battery, 12 VDC 40 amps. (6) Chargers
8.0 Quality Control
Quality control procedures will be observed to ensure the integrity of samples collected in the field. National Institute of Standards and Technology (NIST) traceable transfer standards will be used to calibrate meteorological sensors and measure sample flow rates.
The sample flow rate of the pesticide sampler’s voloflows will be measured using certified mass flow meters with a range of 0-5 liters per minute.
The metrological sensors will be calibrated and aligned following the procedures outlined in the standard operating procedures on the Air Monitoring Web Manual at the following link.
http://arb.ca.gov/airwebmanual/amwmn.php?c=5&t=sop
10

A label will be affixed around the top section of the resin sorbent tube identifying the sample with the following information: log #, sample name, sampler ID number, start and end date and time, start and end elapsed time meter (ETM) reading, start and end mass flow meter display reading and operators initials. Collocated (side-by-side) air samplers will operate at one site during the study period. This collocated site will be located at the projected downwind site.
Field Spike (FS): Eight (8) field spikes will be prepared by the laboratory by injecting resin sorbent tubes with a known concentration of 2,4-D DMAS. The field spike resin sorbent tubes will be coupled with a pesticide sampler and collocated next to the projected downwind sampler. One (1) each field spike will be collected during each sampling period.
Trip Spike (TS): A trip spike will be prepared by the laboratory by injecting a resin sorbent tube with a known concentration of 2,4-D DMAS with the same level as the field spikes. The trip spike resin sorbent tube accompanies the sample resin sorbent tubes from the lab to the field but is not sampled.
Trip Blank (TB): A trip blank will be prepared by the field staff. The trip blank resin sorbent tube accompanies the sample resin sorbent tubes from the lab to the field and returns but is not sampled.
Collocated (C): Collocated samples will be collected at the designated down wind sampling site during all sampling periods starting with the background period.
Valid samples are those that have a final corrected average flow within + 20% of 1.0 lpm.
Site/Sample Identification The 2,4-D DMAS application sampling sites will be named accordingly for the background, ambient, application, and post application as follows: Background Site Naming: Letter Abbreviations as follows BKG-NE-1 N = North Side BKG-NE-C S = South Side BKG-NE-FS-1 W = West Side
E = East Side BKG = Background Sample FS = Field Spike
Application Site Naming: C = Co-located NE-1 NE-1C NE-1FS NEC = NE Corner Sample SE1-1 SE2-1 NWC = NW Corner Sample SW1-1 SW2-1 SEC = SE Corner Sample NWC-1 NEC-1 SWC = SW Corner Sample SEC-1 SWC-1 TS = Trip Spike
TB = Trip Blank FB = Field Blank
Following the quality control procedures listed above will ensure the quality and integrity of the samples collected in the field and will insure accurate field and laboratory results.
11

9.0 Deliverables
9.1 Northern Laboratory Branch (NLB) Deliverables
Within 90 days after the last collected sample is received at the laboratory, the NLB will provide SPM with a report that will include the following topics: 1) Table(s) of sample to include:
a. Sample identification (name). b. Date sample received from field. c. Date sample analyzed. d. Dilution ratio. e. Analytical results.
2) All equations used in calculating analytical results. 3) Table of duplicate results including calculated relative percent difference
(RPD) when applicable. 4) Table of collocated results. 5) Table of analytical results from all field, trip and laboratory spikes including
percent recoveries when applicable. 6) Table of analytical results from all trip blanks. 7) Table of analytical results from all laboratory blanks, standards and control
checks performed, including dates performed and relative percent recoveries when applicable.
8) Copy or location of analytical method or Standard Operating Procedures (SOP) used for analysis.
9) Section or provision listing or reporting any and all deviations from analytical SOP and this protocol.
9.2 Air Quality Surveillance Branch Deliverables
Within 90 days from receipt of the final results report from the NLB, AQSB will provide DPR with a report containing the following topics: 1) Sampling Protocol. 2) Personnel Contact List. 3) Site Maps. 4) Site Photographs. 5) Site Descriptions and Measurements (site, sampler, GPS coordinates,
inlet height, distance to roads, site-specific comments, 2,4-D DMAS application rate, and total pounds or gallons of 2,4-D DMAS applied).
6) Sample Summary Table. 7) Field Log Sheets. 8) Laboratory Analysis Reports with calculations in electronic format. 9) Met Station and Sampler Calibration Reports. 10) Transfer Standards’ Certification Reports. 11) Disk containing electronic files of 5-minute averaged Meteorological Data. 12) Disk containing electronic files of Report.
12

XAD-2 RESIN SORBENT TUBE FIELD LOG SHEET Project: 2,4-D DMAS Pesticide Application Air Monitoring Start Flow Set: 1.0 +0.1 lpm End Flow Criteria: 1.0 lpm +20%
Sampler ID
Number
Date & Time Entry Example (6/14/08 13:42)
Elapsed Time Meter (ETM)
Mass Flow Meter Display
Corrected Average
Flow
Weather K,P,C,F&R Initials Log
# Sample Name
Comment Number Start End Start End Start End Start End Start End
MFM Used #: Slope: Intercept:
1 of 6 Weather Codes: K = Clear, P = Partly Cloudy, C = >67% Cloudy, F = Fog and R = Rain (any)
Figure 2: Resin Sorbent Tube Field Log Sheet
13

APPENDIX A: Standard Operating Procedure Sampling and Analysis of 2,4Dichorophenoxy Acetic Acid Dimethylamine Salt (2,4-D DMAS).
The Special Analysis Section of MLD’s Northern Laboratory Branch will perform the analyses for 2,4-D DMAS collected by the resin sorbent tube method. This analytical procedure is entitled, “Standard Operating Procedure Sampling and Analysis of 2,4-Dichorophenoxy Acetic Acid Dimethylamine Salt (2,4-D DMAS)” and can be located starting on the next page.

APPENDIX D
Laboratory Results Report


APPENDIX E
XAD2 Sample Field Log Sheets

FILTER FIELD LOG SHEET Project: 2, 4-DMAS Pesticide Application Air Monitoring
Start Flow Set: 1.0 +0.1 lpm End Flow Criteria: 1.0 lpm +20%
Sampler ID
Number
Date & Time Entry Example (11/14/13 13:42)
TOTAL Mass Flow Meter Display
Corrected Average
Flow
Weather K,P,C,F&R Initials Log
# Sample Name
Counter TIME Start End Start End HOURS Start End Start End Start End
001 BKG-NWC 2957 11/13/13 12:12 11/14/09 0:00 475.1 0.0 -475.1 0.95 0 0.5 K PC SA SA
002 BKG-W 4665 11/13/13 12:17 11/14/13 7:25 506.2 525.3 19.1 0.95 0.53 0.8 K PC SA SA
003 BKG-SWC 4675 11/13/13 12:22 11/14/13 7:37 557.7 576.9 19.2 0.95 0.5 0.8 K PC SA SA
004 BKG-S 4644 11/13/13 12:26 11/14/13 7:42 726.2 745.4 19.2 0.95 0.59 0.8 K PC SA SA
005 BKG-SEC 4661 11/13/13 12:37 11/14/13 7:50 326.0 345.2 19.2 0.95 0.66 0.9 K PC SA SA
006 BKG-SEC-C 4677 11/13/13 12:39 11/14/13 7:53 872.9 892.1 19.2 0.95 0.55 0.8 K PC SA SA
007 BKG-SEC-FS-1 4663 11/13/13 12:42 11/14/13 7:54 884.6 903.8 19.2 0.95 0.69 0.9 K PC SA SA
008 BKG-E 4673 11/13/13 12:48 11/14/13 8:08 1252.1 1271.4 19.3 0.95 1.05 1.1 K PC SA SA
009 BKG-NEC 4664 11/13/13 12:56 11/14/13 8:10 508.9 528.2 19.3 0.95 1.04 1.1 K PC SA SA
010 BKG-N 4676 11/13/13 13:00 11/14/13 8:14 529.6 548.8 19.2 0.95 1.34 1.2 K PC SA SA
011 NWC-1 4654 11/14/13 8:19 11/14/13 15:13 747.3 754.0 6.7 0.95 1.87 1.5 PC PC SSR SRR
012 W-1 4665 11/14/13 8:20 11/14/13 15:19 525.4 532.4 7.0 0.95 1.23 1.1 PC PC SSR SRR
013 SWC-1 4675 11/14/13 8:20 11/14/13 15:23 576.9 584.0 7.1 0.95 1.35 1.2 PC PC SRR SRR
014 S-1 4644 11/14/13 8:21 11/14/13 15:28 745.4 752.6 7.2 0.95 0.84 1.0 PC PC SRR SRR
015 SEC-1 4661 11/14/13 8:23 11/14/13 15:35 345.2 352.5 7.3 0.95 1.15 1.1 PC PC SRR SRR
016 SEC-1C 4677 11/14/13 8:23 11/14/13 15:39 892.1 899.5 7.4 0.95 1.23 1.1 PC PC SRR SRR
017 SEC-1FS 4663 11/14/14 8:23 11/14/13 15:40 903.9 911.2 7.3 0.95 0.95 1.0 PC PC SRR SRR
018 E-1 4673 11/14/13 8:20 11/14/13 15:48 1271.4 1278.9 7.5 0.95 0.69 0.9 PC PC SRR SRR
019 NEC-1 4664 11/14/13 8:18 11/14/13 15:52 528.2 535.7 7.5 0.95 0.71 0.9 PC PC SRR SRR
020 N-1 4676 11/14/13 8:17 11/14/13 15:58 548.8 556.5 7.7 0.95 0.78 0.9 PC PC SRR SRR
021 NWC-2 4654 11/14/13 15:13 11/15/13 7:27 754.0 770.2 16.2 1.05 1.12 1.1 K K JP JP
022 W-2 4665 11/14/13 15:19 11/15/13 7:31 532.4 548.6 16.2 1.05 1.11 1.1 K K JP JP MFM Used #: 2E+07 Slope: 1.004 Intercept: 0.052
Weather Codes: K = Clear, P = Partly Cloudy, C = >67% Cloudy, F = Fog and R = Rain (any)

FILTER FIELD LOG SHEET Project: 2, 4-DMAS Pesticide Application Air Monitoring
Start Flow Set: 1.0 +0.1 lpm End Flow Criteria: 1.0 lpm +20%
Sampler Date & Time TOTAL Mass Flow Meter Corrected Weather Log Sample ID Entry Example (11/14/13 13:42) Counter TIME Display Average K,P,C,F&R Initials
# Name Number Start End Start End HOURS Start End Flow Start End Start End
023 SWC-2 4675 11/14/13 15:23 11/15/13 7:35 584.0 600.2 16.2 1.05 0.96 1.1 K K JP JP
024 S-2 4644 11/14/13 15:28 11/15/13 7:39 752.6 768.8 16.2 1.05 1.08 1.1 K K JP JP
025 SEC-2 4661 11/14/13 15:35 11/15/13 7:45 352.5 368.7 16.2 1.05 1.2 1.2 K K JP JP
026 SEC-2C 4677 11/14/13 15:39 11/15/13 7:46 899.5 915.6 16.1 1.05 1.28 1.2 K K JP JP
027 SEC-2FS 4663 11/14/13 15:40 11/15/13 7:48 911.2 927.4 16.2 1.05 1.25 1.2 K K JP JP
028 E-2 4673 11/14/13 15:48 11/15/13 7:52 1278.9 1295.0 16.1 1.05 1.36 1.3 K K JP JP
029 NEC-2 4664 11/14/13 15:52 11/15/13 7:55 535.7 551.8 16.1 1.05 1.34 1.3 K K JP JP
030 N-2 4676 11/14/13 15:58 11/15/13 8:00 556.5 572.6 16.1 1.05 1.32 1.2 K K JP JP
031 NWC-3 4654 11/15/13 7:27 11/15/13 15:26 770.2 778.2 8.0 1.05 0.96 1.1 K K JP JP
032 W-3 4665 11/15/13 7:31 11/15/13 15:30 548.6 556.6 8.0 1.05 1 1.1 K K JP JP
033 SWC-3 4675 11/15/13 7:35 11/15/13 15:34 600.2 608.2 8.0 1.05 1.03 1.1 K K JP JP
034 S-3 4644 11/15/13 7:39 11/15/13 15:38 768.8 776.8 8.0 1.05 1 1.1 K K JP JP
035 SEC-3 4661 11/15/13 7:45 11/15/13 15:45 368.7 376.7 8.0 1.05 1 1.1 K K JP JP
036 SEC-3C 4677 11/15/13 7:46 11/15/13 15:47 915.6 923.7 8.1 1.05 1 1.1 K K JP JP
037 SEC-3FS 4663 11/15/13 7:48 11/15/13 15:49 927.4 935.4 8.0 1.05 1.04 1.1 K K JP JP
038 E-3 4673 11/15/13 7:52 11/15/13 15:53 1295.0 1303.0 8.0 1.05 1 1.1 K K JP JP
039 NEC-3 4664 11/15/13 7:55 11/15/13 15:59 551.8 559.8 8.0 1.05 1.09 1.1 K K JP JP
040 N-3 4676 11/15/13 8:00 11/15/13 16:01 572.6 580.6 8.0 1.05 1.03 1.1 K K JP JP
041 NWC-4 4654 11/15/13 15:26 11/16/13 7:30 778.2 794.2 16.0 1.05 1.06 1.1 K K JP JP
042 W-4 4665 11/15/13 15:30 11/16/13 7:33 556.6 572.6 16.0 1.05 1.04 1.1 K K JP JP
043 SWC-4 4675 11/15/13 15:34 11/16/13 7:37 608.2 624.2 16.0 1.05 1.08 1.1 K K JP JP
044 S-4 4644 11/15/13 15:38 11/16/13 7:40 776.8 792.8 16.0 1.05 1.05 1.1 K K JP JP MFM Used #: 2E+07 Slope: 1.004 Intercept: 0.052
Weather Codes: K = Clear, P = Partly Cloudy, C = >67% Cloudy, F = Fog and R = Rain (any)

FILTER FIELD LOG SHEET Project: 2, 4-DMAS Pesticide Application Air Monitoring
Start Flow Set: 1.0 +0.1 lpm End Flow Criteria: 1.0 lpm +20%
Sampler Date & Time TOTAL Mass Flow Meter Corrected Weather Log Sample ID Entry Example (11/14/13 13:42) Counter TIME Display Average K,P,C,F&R Initials
# Name Number Start End Start End HOURS Start End Flow Start End Start End
045 SEC-4 4661 11/15/13 15:45 11/16/13 7:45 376.7 392.7 16.0 1.05 1.09 1.1 K K JP JP
046 SEC-4C 4677 11/15/13 15:47 11/16/13 7:48 923.7 939.7 16.0 1.05 1.22 1.2 K K JP JP
047 SEC-4FS 4663 11/15/13 15:49 11/16/13 7:50 935.4 951.4 16.0 1.05 1.08 1.1 K K JP JP
048 E-4 4673 11/15/13 15:53 11/16/13 7:54 1303.0 1319.0 16.0 1.05 1 1.1 K K JP JP
049 NEC-4 4664 11/15/13 15:57 11/16/13 7:57 559.8 575.8 16.0 1.05 1.04 1.1 K K JP JP
050 N-4 4676 11/15/13 16:01 11/16/13 8:01 580.6 596.6 16.0 1.05 1.04 1.1 K K JP JP
051 NWC-5 4654 11/16/13 7:30 11/16/13 15:48 794.2 802.5 8.3 1.05 1.03 1.1 K K JP JP
052 W-5 4665 11/16/13 7:33 11/16/13 15:51 572.6 580.9 8.3 1.05 1 1.1 K K JP JP
053 SWC-5 4675 11/16/13 7:37 11/16/13 15:54 624.2 632.5 8.3 1.05 1.03 1.1 K K JP JP
054 S-5 4644 11/16/13 7:40 11/16/13 15:58 792.8 801.1 8.3 1.05 1.03 1.1 K K JP JP
055 SEC-5 4661 11/16/13 7:45 11/16/13 16:04 392.7 401.0 8.3 1.05 1.03 1.1 K K JP JP
056 SEC-5C 4677 11/16/13 7:48 11/16/13 16:06 939.7 947.9 8.2 1.05 1.06 1.1 K K JP JP
057 SEC-5FS 4663 11/16/13 7:50 11/16/13 16:09 951.4 959.7 8.3 1.05 1 1.1 K K JP JP
058 E-5 4673 11/16/13 7:54 11/16/13 16:17 1319.0 1327.4 8.4 1.05 1.03 1.1 K K JP JP
059 NEC-5 4664 11/16/13 7:57 11/16/13 16:21 575.8 584.2 8.4 1.05 1.05 1.1 K K JP JP
060 N-5 4676 11/16/13 8:01 11/16/13 16:25 596.6 605.0 8.4 1.05 1.03 1.1 K K JP JP
061 NWC-6 4654 11/16/13 15:48 11/17/13 7:34 802.5 818.3 15.8 1.05 0.92 1.0 K K JP JP
062 W-6 4665 11/16/13 15:51 11/17/13 7:36 580.9 596.7 15.8 1.05 0.93 1.0 K K JP JP
063 SWC-6 4675 11/16/13 15:54 11/17/13 7:39 632.5 648.2 15.7 1.05 0.92 1.0 K K JP JP
064 S-6 4644 11/16/13 15:58 11/17/13 7:42 801.1 816.8 15.7 1.05 0.94 1.1 K K JP JP
065 SEC-6 4661 11/16/13 16:04 11/17/13 7:47 401.0 416.7 15.7 1.05 1 1.1 K K JP JP
066 SEC-6C 4677 11/16/13 16:06 11/17/13 7:49 947.9 963.7 15.8 1.05 0.94 1.1 K K JP JP MFM Used #: 2E+07 Slope: 1.004 Intercept: 0.052
Weather Codes: K = Clear, P = Partly Cloudy, C = >67% Cloudy, F = Fog and R = Rain (any)

FILTER FIELD LOG SHEET Project: 2, 4-DMAS Pesticide Application Air Monitoring
Start Flow Set: 1.0 +0.1 lpm End Flow Criteria: 1.0 lpm +20%
Sampler Date & Time TOTAL Mass Flow Meter Corrected Weather Log Sample ID Entry Example (11/14/13 13:42) Counter TIME Display Average K,P,C,F&R Initials
# Name Number Start End Start End HOURS Start End Flow Start End Start End
067 SEC-6FS 4663 11/16/13 16:09 11/17/13 7:51 959.7 975.4 15.7 1.05 0.93 1.0 K K JP JP
068 E-6 4673 11/16/13 16:17 11/17/13 7:57 1327.4 1343.0 15.6 1.05 0.85 1.0 K K JP JP
069 NEC-6 4664 11/16/13 16:21 11/17/13 8:03 584.2 599.9 15.7 1.05 0.93 1.0 K K JP JP
070 N-6 4676 11/16/13 16:25 11/17/13 8:07 605.0 620.7 15.7 1.05 0.9 1.0 K K JP JP
071 TS-1 N/A 11/16/13 16:12 0.0 K K JP JP
072 FB-1 N/A 11/16/13 16:14 0.0 K K JP JP
MFM Used #: 2E+07 Slope: 1.004 Intercept: 0.052
Weather Codes: K = Clear, P = Partly Cloudy, C = >67% Cloudy, F = Fog and R = Rain (any)

APPENDIX F
Calibration/Certification Report


APPENDIX G
Meteorological Data

ARB Calibration Report - Outside Temperature
Calibration Summary: ID Information: Calibration Info.:
Station Name: Automet 5304 Manufacturer: Met One AS-IS: Site #: Pre-2,4-D Application Model #: 060A-2 FINAL: X
Station Address: Sacto. 5th St. Warehouse Serial #: A6801 Calibration Date: 03/13/13 Agency: ARB Translator #: 466A Report Date: 03/15/13
Serial #: X1042 Previous Cal. Date: 09/06/11
Component: Outside Temp. Instrument Range (degrees centigrade):
AS-LEFT Average Ice Bath Difference (oC): -50 to 50
0.34 AS-LEFT Average Ambient Bath Difference (oC): 0.22
AS-LEFT Average Hot Bath Difference (oC): 0.25 Slope:
Intercept: 1.002
Outside Temperature Best Fit Line -0.318 Correlation: 1.00000
AS-LEFT Meets PSD oC Difference Requirement: YES
Calibration Results: Meteorology:
Sensor Height:
Temperature (oC): 20.0 Elevation (Feet.): 25
Pressure (mmHg): 760.0
Feet Above Ground: 20.5 Feet Above Roof: N.A.
Calibration Standards: Standard: I.D. #: Cert. Date: Slope: Intercept:
Digi-Sense 93410-50 Digital Thermometer Cole Parmer Thermister Probe
196743 01/22/13 0.9990 -0.3300 N.A. N.A. N.A. N.A.
============================================================================================= Calibration Data:
If Average Difference of any bath is >0.50oC, correct. Transalator: Reference
Bath DAS
Degree C (x) Digital
Degree C True
Degree C (y) Difference DAS - True
Zero Scale: N.A. N.A.
ICE 0.16 0.17 -0.16 0.32 DMM Volts Degrees C 0.21 0.17 -0.16 0.37 N.A. N.A. 0.16 0.17 -0.16 0.32 Full Scale:
Average 0.18 -0.16 0.34
AMBIENT 27.53 27.61 27.25 0.28 Regression & Graph Data: 27.42 27.60 27.24 0.18 x y 27.42 27.57 27.21 0.21 0.18 -0.16
Average 27.46 27.24 0.22 27.46 27.24
HOT 48.44 48.55 48.17 0.27 48.42 48.17 48.39 48.53 48.15 0.24
PSD Data: 0.34
48.44 48.58 48.20 0.24 0.22 Average 48.42 48.17 0.25 0.25
Outside Temperature Regression Data
x Coefficient (Slope): 1.0019 y Constant (Intercept): -0.3182
Number of Observations: Correlation:
3 0.999999
Regression Results: Corrected OTEMP: (DAS * x) + y
-0.14 27.19 48.20
Comments: Initial around +0.5 diff. Changed AutoMet intercept from -72.89 to -79.09.
Calibrated by: Steve Rider Checked by:
Rev. 07/00 (SUR)

ARB Calibration Report - Resultant Wind Speed
Calibration Summary: ID Information: Calibration Info.:
Station Name: Automet 5304 Manufacturer: Met One AS-IS: Site #: Post-2,4-D Application Model #: 010C FINAL: X
Station Address: Sacto. 5th St. Warehouse Serial #: A6703 Calibration Date: 01/23/14 Agency: ARB Translator #: 466A Report Date: 01/23/14
Serial #: X1042 Previous Cal. Date: 03/13/13
Calibration Results: Meteorology: Component: Wind Speed
Instrument Range (knots per hour): AS-LEFT Starting Torque (gm-cm):
AS-LEFT Absolute Avg Speed Difference (knots):
0 to 86.84 0.27 0.02
Slope: 0.999 Wind Speed Best Fit Line Intercept: 0.020
Correlation: 1.00000 AS-LEFT Meets Both PSD Requirements: YES
Sensor Height:
Calibration Standards:
Temperature (oC): 23.2 Elevation (Feet.): 25
Pressure (mmHg): 760.0
Feet Above Ground: 22.5 Roof height in feet.: 0.0
Calculated data to 10.3 meet EPA height: -22.5
To meet EPA height: 10.3
Standard: I.D. #: Cert. Date: Cert. Factor: R.M. Young 18310 Torque Disc (0 to 15 gm-cm):
R.M. Young 18810 Selectable Drive (10-1,000 rpm): Factory N.A.
10329 01/18/13 RPM=(Meter*10)+0
============================================================================================= Calibration Data:
Translator: Zero Scale: Full Scale:
DMM Voltage: Knots: DMM Voltage: Knots: N.A. N.A. N.A. N.A.
Starting Torque: In gm-cms:
K Factor: 0.1 Starting speed in meters/sec:
Meets PSD torque standard: 0.27
1.4 YES
Speed Accuracy (@ 0 <0.54 & Difference DAS - True <+5% of True)
RPM: True (y): Knots per Hour
DAS (x): Knots
Difference DAS - True
PSD Difference Data
Meets PSD Difference Standard:
0 0.52 0.50 -0.02 1 YES 50 3.11 3.10 -0.01 0.3% 110 6.22 6.21 -0.01 0.1% Absolute Avg. Diff.: 220 11.92 11.88 -0.04 0.3% 0.02 450 23.83 23.84 0.01 0.1% 920 48.17 48.18 0.01 0.0%
x Coefficient (Slope): 0.9993 y Constant (Intercept): 0.0203
Number of Observations: Correlation:
6 1.000000
Corrected RWS: Wind Speed Regression Data
Regression Results:
(DAS * x) + y 0.52 3.12 6.23 11.89 23.84 48.17
Comments: Post-2,4-D Cal. Performed in Sacto.
Calibrated by: Steve Aston Checked by:
Rev. 07/00 (SUR)

ARB Calibration Report - Resultant Wind Speed
Calibration Summary: ID Information: Calibration Info.:
Station Name: Automet 5304 Manufacturer: Met One AS-IS: Site #: Pre-2,4-D Application Model #: 010C FINAL: X
Station Address: Sacto. 5th St. Warehouse Serial #: A6703 Calibration Date: 03/13/13 Agency: ARB Translator #: 466A Report Date: 03/15/13
Serial #: X1042 Previous Cal. Date: 09/06/11
Calibration Results: Meteorology: Component: Wind Speed
Instrument Range (knots per hour): AS-LEFT Starting Torque (gm-cm):
AS-LEFT Absolute Avg Speed Difference (knots):
0 to 86.84 0.38 0.02
Slope: 1.000 Wind Speed Best Fit Line Intercept: 0.018
Correlation: 1.00000 AS-LEFT Meets Both PSD Requirements: YES
Sensor Height:
Calibration Standards:
Temperature (oC): 20.0 Elevation (Feet.): 25
Pressure (mmHg): 760.0
Feet Above Ground: 22.5 Roof height in feet.: 0.0
Calculated data to 10.3 meet EPA height: -22.5
To meet EPA height: 10.3
Standard: I.D. #: Cert. Date: Cert. Factor: R.M. Young 18310 Torque Disc (0 to 15 gm-cm):
R.M. Young 18810 Selectable Drive (10-1,000 rpm): Factory N.A.
10329 01/18/13 RPM=(Meter*10)+0
============================================================================================= Calibration Data:
Translator: Zero Scale: Full Scale:
DMM Voltage: Knots: DMM Voltage: Knots: N.A. N.A. N.A. N.A.
Starting Torque: In gm-cms:
K Factor: 0.2 Starting speed in meters/sec:
Meets PSD torque standard: 0.38
1.4 YES
Speed Accuracy (@ 0 <0.54 & Difference DAS - True <+5% of True)
RPM: True (y): Knots per Hour
DAS (x): Knots
Difference DAS - True
PSD Difference Data
Meets PSD Difference Standard:
0 0.52 0.50 -0.02 1 YES 50 3.11 3.10 -0.01 0.3% 110 6.22 6.21 -0.01 0.1% Absolute Avg. Diff.: 220 11.92 11.88 -0.04 0.3% 0.02 450 23.83 23.80 -0.03 0.1% 920 48.17 48.14 -0.03 0.1%
x Coefficient (Slope): 1.0003 y Constant (Intercept): 0.0179
Number of Observations: Correlation:
6 1.000000
Corrected RWS: Wind Speed Regression Data
Regression Results:
(DAS * x) + y 0.52 3.12 6.23 11.90 23.83 48.17
Comments: Pre-2,4-D Cal. Performed in Sacto.
Calibrated by: Steve Rider Checked by:
Rev. 07/00 (SUR)

ARB Calibration Report - Resultant Wind Direction Calibration Summary:
ID Information: Calibration Info.: Station Name: Automet 5304 Manufacturer: Met One AS-IS:
Site #: Pre-2,4-D Application Model #: 020C-1 FINAL: X Station Address: Sacto. 5th St. Warehouse Serial #: A6978 Calibration Date: 01/23/14
Agency: ARB Translator #: 466A Report Date: 01/23/14 Serial #: X1042 Installation Date: 03/13/13
Calibration Results: Meteorology: Component: Wind Direction
Instrument Range (degrees): AS-LEFT Azimuth in relation to True North (deg):
AS-LEFT Starting Torque (gm-cms):
0 to 360 2.1 2.4
AS-LEFT Absolute Average Difference (degrees): 2.1 Slope: 1.021
Wind Direction Best Fit Line Intercept: -3.631 Correlation: 1.00000
AS-LEFT Meets Both PSD Requirements: NO
Temperature (oC): 23.2 Elevation (Feet.): 25
Pressure (mmHg): 760.0 Sensor Height: Feet Above Ground: 22.5 Roof height in feet.: 0.0
Calculated data to 10.3 meet EPA height: -22.5
To meet EPA height: 10.3
Calibration Standards: Standard: I.D. #: Cert. Date: Cert. Factor:
Brunton 5008 Pocket Transit 5081192140 Factory WYSIWYG R.M. Young 18310 Torque Disk N.A. Factory N.A.
Met One 040 Degree Fixture N.A. Factory WYSIWYG =============================================================================================
Calibration Data: Direction Accuracy:
True Degrees (y):
DAS Degrees (x):
Difference DAS - True
Calculated Data to Meet PSD
Direction
Translator: DMM Voltage: Degrees: Zero Scale: N.A. N.A.
10 13.3 3.3 Half Scale: N.A. N.A. 90 91.5 1.5 1
Starting Torque:
gram-centimeters: K Factor:
Speed in m/sec.: Meets torque std.:
2.4 180 180.1 0.1 0 38 270 268.4 -1.6 1 0.25 350 346.0 -4.0 1 YES
Absolute Avg. Diff.: 2.1 PSD Correction: 2.1
Regression Results:
Wind Direction Regression Data
x Coefficient (Slope): 1.0210 y Constant (Intercept): -3.6309
Number of Observations: Correlation:
5 0.999997
Corrected RWD: (DAS * x) + y
9.9 89.8 180.2 270.4 349.6
AS-LEFT Condition (0 to 360o only): Declination of Site (Degrees East): Calculated Data to
Meet PSD Direction Calculated True North Heading: 360.0 Crossarm Orientation Uncorrected Transit Reading:
Crossarm Degrees in Relation to True North: 0.0 Meets 1 DAS Output with Vane Parallel to Crossarm: 2.1 Direction 0
DAS Output Degrees off from True North: -357.9 Standard 1 Azimuth computed from above measurements: 2.1 NO 1
Comments: Cal in Sac. Crossarm Orientation Uncorrected Transit Reading at site.
Calibrated by: Steve Rider Checked by:
Rev. 07/00 (SUR)

ARB Calibration Report - Resultant Wind Direction Calibration Summary:
ID Information: Calibration Info.: Station Name: Automet 5304 Manufacturer: Met One AS-IS:
Site #: Pre-2,4-D Application Model #: 020C-1 FINAL: X Station Address: Sacto. 5th St. Warehouse Serial #: A6978 Calibration Date: 01/23/14
Agency: ARB Translator #: 466A Report Date: 01/23/14 Serial #: X1042 Installation Date: 11/13/13
Calibration Results: Meteorology: Component: Wind Direction
Instrument Range (degrees): AS-LEFT Azimuth in relation to True North (deg):
AS-LEFT Starting Torque (gm-cms):
0 to 360 2.1 3.7
AS-LEFT Absolute Average Difference (degrees): 2.2 Slope: 1.021
Wind Direction Best Fit Line Intercept: -2.866 Correlation: 0.99999
AS-LEFT Meets Both PSD Requirements: YES
Temperature (oC): 20.0 Elevation (Feet.): 25
Pressure (mmHg): 760.0 Sensor Height: Feet Above Ground: 22.5 Roof height in feet.: 0.0
Calculated data to 10.3 meet EPA height: -22.5
To meet EPA height: 10.3
Calibration Standards: Standard: I.D. #: Cert. Date: Cert. Factor:
Brunton 5008 Pocket Transit 5081192140 Factory WYSIWYG R.M. Young 18310 Torque Disk N.A. Factory N.A.
Met One 040 Degree Fixture N.A. Factory WYSIWYG =============================================================================================
Calibration Data: Direction Accuracy:
True Degrees (y):
DAS Degrees (x):
Difference DAS - True
Calculated Data to Meet PSD
Direction
Translator: DMM Voltage: Degrees: Zero Scale: N.A. N.A.
10 11.9 1.9 Half Scale: N.A. N.A. 90 91.6 1.6 1
Starting Torque:
gram-centimeters: K Factor:
Speed in m/sec.: Meets torque std.:
3.7 180 179.8 -0.2 1 38 270 267.1 -2.9 1 0.31 350 345.5 -4.5 1 YES
Absolute Avg. Diff.: 2.2 PSD Correction: 2.1
Wind Direction Regression Data
Regression Results: x Coefficient (Slope): 1.0206
y Constant (Intercept): -2.8659 Number of Observations:
Correlation: 5
0.999990
Corrected RWD: (DAS * x) + y
9.3 90.6 180.6 269.7 349.7
AS-LEFT Condition (0 to 360o only): Declination of Site (Degrees East): Calculated Data to
Meet PSD Direction Calculated True North Heading: 360.0 Crossarm Orientation Uncorrected Transit Reading:
Crossarm Degrees in Relation to True North: 0.0 Meets 1 DAS Output with Vane Parallel to Crossarm: 2.1 Direction 1
DAS Output Degrees off from True North: -357.9 Standard 1 Azimuth computed from above measurements: 2.1 YES 1
Comments: Cal in Sac. Crossarm Orientation Uncorrected Transit Reading at site.
Calibrated by: Steve Rider Checked by:
Rev. 07/00 (SUR)

Relative Humidity Regression Data
egression Results:
ARB Calibration Report - Relative Humidity
Calibration Summary: ID Information: Calibration Info.:
Station Name: Automet 5304 Manufacturer: Vaisala AS-IS: Site #: Post-2,4-D Application Model #: HMP45D FINAL: X
Station Address: 5th St. Warehouse in Sacto. Serial #: W4410024 Calibration Date: 03/13/13 Agency: ARB Translator #: 466A Report Date: 03/15/13
Serial #: X1042 Previous Cal. Date: 09/06/11
Component: Relative Humidity Instrument Range (Percent Relative Humidity): 0 to 100
Slope: 1.065 Relative Humidity Best Fit Line Intercept: -0.502
Correlation: 0.99914 Absolute Average Percent Difference (%RH):
AS-LEFT Meets PSD Requirements: 2.7
YES
Calibration Results: Meteorology:
Sensor Height:
Temperature (oC): 23.2 Elevation (Ft.): 25
Pressure (mmHg): 760.0
Feet Above Ground: 20.5 Feet Above Roof: N.A.
Calibration Standards: Standard: I.D. #: Cert. Date: Cert. Factor:
Rotronic ER25 Calibration Device: None Factory N.A. Rotronic EA10 Salt Standard: 101201 01/25/12 (10 x 1)+0 Rotronic EA35 Salt Standard: 351103 11/21/11 (35 x 1)+0 Rotronic EA50 Salt Standard: 501103 11/16/11 (50 x 1)+0 Rotronic EA80 Salt Standard: 801201 02/24/12 (80 x 1)+0
============================================================================================= Calibration Data:
Translator: Zero Scale: Full Scale:
DMM Voltage: %RH: DMM Voltage: %RH: N.A. N.A. N.A. N.A.
% Relative Humidity Accuracy (If Any Difference > 5.0%RH, adjust so Avg. Diff. Is <2.0%RH Difference) TRUE
%RH (y) DAS
%RH (x) DAS
Voltage Difference DAS - True
Meets PSD Criteria
0 0.5 N.A. N.A. YES 10.0 11.0 N/A 1.0 1 35.0 32.2 N/A -2.8 1 50.0 46.6 N/A -3.4 1 80.0 76.4 N/A -3.6 1 100.0 94.4 ABS Avg. Diff.: 2.7
Corrected %RH:
R
(DAS * x) + y 0.0 11.2 33.8 49.1 80.9 100.0
X Coefficient (Slope): 1.0650 Y Constant (Intercept): -0.5017
Number of Observations: Correlation:
4 0.999135
Pre-2,4-D cal. Perfomed in Sacto. Comments: Initial was 78.4 @ 79.9. Adjusted Wet Pot.
Rev. 07/00 (SUR)

ARB Calibration Report - Relative Humidity
Calibration Summary: ID Information: Calibration Info.:
Station Name: Automet 5304 Manufacturer: Vaisala AS-IS: Site #: Pre-2,4-D Application Model #: HMP45D FINAL: X
Station Address: 5th St. Warehouse in Sacto. Serial #: W4410024 Calibration Date: 03/13/13 Agency: ARB Translator #: 466A Report Date: 03/15/13
Serial #: X1042 Previous Cal. Date: 09/06/11
Component: Relative Humidity Instrument Range (Percent Relative Humidity): 0 to 100
Slope: 1.010 Relative Humidity Best Fit Line Intercept: -0.270
Correlation: 0.99988 Absolute Average Percent Difference (%RH):
AS-LEFT Meets PSD Requirements: 0.5
YES
Calibration Results: Meteorology:
Sensor Height:
Temperature (oC): 20.0 Elevation (Ft.): 25
Pressure (mmHg): 760.0
Feet Above Ground: 20.5 Feet Above Roof: N.A.
Calibration Standards: Standard: I.D. #: Cert. Date: Cert. Factor:
Rotronic ER25 Calibration Device: None Factory N.A. Rotronic EA10 Salt Standard: 100701 04/12/07 (10 x 1)+0 Rotronic EA35 Salt Standard: 350704 01/09/08 (35 x 1)+0 Rotronic EA50 Salt Standard: 500604 08/17/06 (50 x 1)+0 Rotronic EA80 Salt Standard: 800706 12/12/07 (80 x 1)+0
============================================================================================= Calibration Data:
Translator: Zero Scale: Full Scale:
DMM Voltage: %RH: DMM Voltage: %RH: N.A. N.A. N.A. N.A.
% Relative Humidity Accuracy (If Any Difference > 5.0%RH, adjust so Avg. Diff. Is <2.0%RH Difference) TRUE
%RH (y) DAS
%RH (x) DAS
Voltage Difference DAS - True
Meets PSD Criteria
0 0.3 N.A. N.A. YES 9.7 10.3 N/A 0.6 1 34.6 33.9 N/A -0.7 1 50.2 49.9 N/A -0.3 1 79.9 79.6 N/A -0.3 1 100.0 99.3 ABS Avg. Diff.: 0.5
Corrected %RH: Relative Humidity Regression Data
Regression Results:
(DAS * x) + y 0.0 10.1 34.0 50.1 80.1 100.0
X Coefficient (Slope): 1.0102 Y Constant (Intercept): -0.2698
Number of Observations: Correlation:
4 0.999876
Pre-2,4-D cal. Perfomed in Sacto. Comments: Initial was 78.4 @ 79.9. Adjusted Wet Pot.
Rev. 07/00 (SUR)

ARB Calibration Report - Outside Temperature
Calibration Summary: ID Information: Calibration Info.:
Station Name: Automet 5304 Manufacturer: Met One AS-IS: Site #: Post-2,4-D Application Model #: 060A-2 FINAL: X
Station Address: Sacto. 5th St. Warehouse Serial #: A6801 Calibration Date: 01/23/14 Agency: ARB Translator #: 466A Report Date: 01/23/14
Serial #: X1042 Previous Cal. Date: 03/13/13
Component: Outside Temp. Instrument Range (degrees centigrade):
AS-LEFT Average Ice Bath Difference (oC): -50 to 50
0.39 AS-LEFT Average Ambient Bath Difference (oC): 0.30
AS-LEFT Average Hot Bath Difference (oC): 0.46 Slope:
Intercept: 0.999
Outside Temperature Best Fit Line -0.348 Correlation: 1.00000
AS-LEFT Meets PSD oC Difference Requirement: YES
Calibration Results: Meteorology:
Sensor Height:
Temperature (oC): 23.0 Elevation (Feet.): 25
Pressure (mmHg): 760.0
Feet Above Ground: 20.5 Feet Above Roof: N.A.
Calibration Standards: Standard: I.D. #: Cert. Date: Slope: Intercept:
Digi-Sense 93410-50 Digital Thermometer Cole Parmer Thermister Probe
196743 01/22/13 0.9990 -0.3300 N.A. N.A. N.A. N.A.
============================================================================================= Calibration Data:
If Average Difference of any bath is >0.50oC, correct. Transalator: Reference
Bath DAS
Degree C (x) Digital
Degree C True
Degree C (y) Difference DAS - True
Zero Scale: N.A. N.A.
ICE 0.98 0.92 0.59 0.39 DMM Volts Degrees C 0.98 0.92 0.59 0.39 N.A. N.A. 0.98 0.92 0.59 0.39 Full Scale:
Average 0.98 0.59 0.39
AMBIENT 23.59 23.66 23.31 0.28 Regression & Graph Data: 23.59 23.66 23.31 0.28 x y 23.64 23.65 23.30 0.34 0.98 0.59
Average 23.61 23.30 0.30 23.61 23.30
HOT 48.00 47.92 47.54 0.46 48.00 47.54 48.00 47.92 47.54 0.46
PSD Data: 0.39
48.00 47.92 47.54 0.46 0.30 Average 48.00 47.54 0.46 0.46
Outside Temperature Regression Data
x Coefficient (Slope): 0.9985 y Constant (Intercept): -0.3481
Number of Observations: Correlation:
3 0.999996
Regression Results: Corrected OTEMP: (DAS * x) + y
0.63 23.22 47.58
Comments: Initial around +0.5 diff. Changed AutoMet intercept from -72.89 to -79.09.
Calibrated by: Steve Aston Checked by:
Rev. 07/00 (SUR)