final report final report submission date: april 18, 2016 report final report submission date: april...
TRANSCRIPT

1
Final Report Final Report Submission Date: April 18, 2016
Submitted to: Fats and Proteins Research Foundation, Inc.
Project Title: High fat pre-starter rations for broilers
Principal Investigator:
J D Firman, PhD, Poultry Nutrition
116 ASRC, University of Missouri
Columbia, MO 65211
573-882-9427, Fax 573-882-6640
Co-Investigators:
Adam Birk
Corey Johnson
Project Started: July 2015 Project Completed: July, 2016

2
INDUSTRY SUMMARY
Introduction:
The rendering industry produces significant quantities of rendered fats. Yellow
grease is widely available and in many cases the cheapest fat source available for animal
feeding. A variety of other rendered fats are also available. Fat use by the broiler industry
has gone down in recent years as the cost of energy has climbed and typical ME levels
have been lowered. In many cases, levels of fat fed are quite low with even finisher
rations containing less than 3% added fat. The turkey industry continues to feed
reasonably high levels of fat with some finisher rations containing as much as 6-8%
added fat. However, the initially high protein levels fed preclude high energy levels
during the starter period as most protein ingredients are low energy. Feeding high fat
diets in the pre-starter period may improve starting of poults (always a problem) as well
as increase fat utilization by the turkey industry. We would not anticipate any changes in
the fat use in later diets by either the broiler or turkey industry. This research, if
successful, would provide data on a new practice that has the potential to increase the use
of fat in pre-starter rations. This could be as much as 200,000 tons of fat usage yearly in
the US.
Objectives:
This project was designed to determine if high fat pre-starter rations would
improve initial bodyweight of chicks and if the increases seen would be maintained to
market weight.

3
Industry Summary:
Significantly improved feed conversion of broilers fed a high amount of dietary
fat was observed at 10, 14, and 17 days of age. This effect was not maintained to market
weight. At 49 days of age, high dietary fat inclusion during the pre-starter period did not
significantly improve the measured growth parameters. From this study we can conclude
that under normal, industry comparable conditions, high dietary fat inclusion in the pre-
starter ration of broilers to 10 or 14 days is not advisable as it does not improve growth
parameters at market. With no improvement seen at market, the added cost of fat in the
pre-starter ration does not provide a substantial enough return to implement this strategy.
Under more adverse conditions it is possible a greater effect would have been observed at
market but it is unlikely the industry would adopt a practice that does not improve
performance under normal conditions as observed in the present study.
In turkeys, few differences were seen in any of the parameters measured. Birds
performed well reaching ~44 pounds at 20 weeks of age. No consistent differences were
seen in body weight gain, feed/gain or feed intake. At the conclusion of the trial no
differences in any parameters were noted. It would appear that early inclusion of fat at
high levels does not result in performance benefits.

4
EFFECTS OF HIGH FAT BROILER PRE-STARTER
RATIONS ON PERFORMANCE AND COST
ABSTRACT
A 49 day experiment was conducted to test the addition of 6% or 8% yellow
grease (YG) to diets of broilers during the 0-10 day or 0-14 day pre-starter period. Forty-
eight pens of birds were fed one of 6 treatments to consist of a control (least cost addition
of YG), 6% YG, or 8% YG, each fed to either 10 or 14 days. Eight replicate pens were
used for each treatment arranged in a randomized complete block design with location as
the blocking factor. Each pen contained 33 commercial strain broilers placed at hatch and
raised to seven weeks of age. Diets consisted of commercial type corn-soy-DDGS-meat
meal base and were adjusted to maintain a consistent relationship between energy and
crude protein as well as amino acids. Birds were weighed and diets changed at 10 or 14
days, 17 days, or 35 days with completion of the trial at 49 days. Feed conversion was
significantly improved by the addition of fat during the treatment period, a result of
numerically higher body weight and reduced feed intake although neither was significant.
Improved growth performance from the addition of fat during the treatment period did
not result in improved performance at market, as no effects by dietary treatment were
found at 49 days. Feeding a high plain of nutrition pre-starter ration to 14 days did
improve feed conversion at 14 days. This effect was carried through to 49 days and
similar body weights were observed. These results suggest the addition of high levels of
fat in the pre-starter ration does not improve growth performance at 49 days.

5
INTRODUCTION
The first 2 weeks of life make up 28% of a typical broiler’s life, slaughtered at 49
days, but only accounts for about 8.5% of total feed consumption (Cobb-Vantress, 2015).
Lilburn (1998) and Ebling and coworkers (2015) agree that this separation gives
nutritionists an opportunity to use more expensive ingredients to provide a higher plain of
nutrition could improve performance during the first two weeks and should be seen as an
investment rather than a cost. At current prices of about $220/ton and $200/ton in the
pre-starter and finisher rations respectively, an 8% increase in the price of the pre-starter
ration would have to occur to raise the total cost of feed/bird one cent (CME, 2015;
Cobb-Vantress, 2015). This calculation would be assuming the increase in diet cost
caused no improvements in feed efficiency and thus demonstrates the potential for
cheaply improving the growth and efficiency of broilers.
Feed costs represent about 70% of the cost of poultry production (Willems et al.,
2013). As the cost of feed continues to increase, improved feed conversion and reduced
mortality become more valuable (Jiang et al., 1998; Donohue and Cunningham, 2009;
Wood, 2009; Willems et al., 2013). For a broiler marketed at 49 days, about 50% of feed
consumption occurs in the last two weeks resulting in about 50% of feed costs being
incurred during this period (Cobb-Vantress, 2015). As the broiler grows older and larger,
maintenance requirements increase causing a decline in feed conversion and increased
feed consumption. This high amount of feed consumption later in life causes improved
feed conversion to be very important economically and mortality to be expensive since
the bird has already consumed so much feed. Optimizing nutrition during the first two
weeks, with a practical disregard for cost, could improve gut health and insure birds

6
develop to their maximum genetic potential. Ferket (2015) suggests under nutrition in
the perinatal and immediate post-hatch nutrition are constraining development to support
subsequent growth. With proper development and gut health during the immediate post-
hatch period, when intense changes are occurring in the small intestine (Sklan, 2001), we
may be able to improve feed conversion and reduce mortality later in the life of the bird
as well as improve the final body weight (BW) of the bird at marketing.
Increased nutrient density via the use of high fat rations is a promising method for
achieving optimal nutrition in the young chick. Traditionally, the young chicks ability to
digest and absorb fats has been considered to be low (Renner and Hill, 1961; Carew et
al., 1972; Krogdahl, 1985; Sell et al., 1986; Tancharoenrat et al., 2013). These studies
have caused a dogma in poultry nutrition that fats should not be used in the diets of
young chicks, but this is no reason to avoid fats since the young chick is outfitted for fatty
acid metabolism (Lilburn, 1998), digestion improves rapidly (Firman, 2006), and total
absorption of fat and energy increases with increased dietary fat inclusion (Noy and
Sklan, 2001). Fat, starch, and amino acid digestibility are all lowest in the young chick
during the first week and all improve with age (Noy and Sklan, 1995; Batal and Parsons,
2002; Thomas et al., 2008). The young chick also has a low capacity for feed
consumption due to physical limitations. Utilization of a high nutrient density diets via
the use of high dietary fat inclusion thus has the potential to increase total nutrient uptake
in the young chick.
The primary objective of this experiment was to determine if high fat pre-starter
rations could improve initial performance of chicks and if the observed increase would be
maintained to market weight.

7
MATERIALS AND METHODS
General Procedures
To determine if industry growth standards could be improved, an experiment was
conducted using as hatched Cobb/Cobb birds obtained from a commercial hatchery. Birds
were housed and maintained according to the University of Missouri standard operating
procedures and the University of Missouri Animal Care and Use Guidelines. Standard US
corn-soy-DDGS-animal byproduct diets were used with the exception of the changes in
yellow grease addition.
Trial Design
Forty-eight pens of broilers with 33 birds/pen for a total of 1,584 birds were used
in a 2 x 3 factorial design with 6 treatments and 8 replicate pens. Treatments included a
low fat pre-starter diet, 6% or 8% added fat (yellow grease) x 10 days and 14 days on
diet. These diets were fed for either the 10 or 14 day period followed by industry standard
diets through the remaining growout period with ration changes at 17 and 35 days. Each
floor pen measured 4 feet wide and 8 feet deep, and contained one metal feeder, one
nipple waterer with 5 nipples each 6 inches apart, one heat lamp, and new cedar shavings.
Supplemental feed trays were used in each pen from 0 to 5 days to encourage acclimation
to feed. Heat lamps were used during brood and removed at 14 days of age. Birds
received continuous light throughout the trial.
Treatment Descriptions
Three experimental diets were fed representing 6 treatments with time fed being
the other variable. Experimental diets consisted of an industry standard control diet (C),
6% added fat (YG6), or 8% added fat (YG8) (Table 3.1). Fat used was yellow grease

8
(YG) (15% max FFA) from Hahn and Phillips Grease Company in Marshall, MO. The
control diet and post-experimental period diets (Table 3.2) were industry standard diets
based on Cobb-Vantress (2015) recommendations, formulated on a digestible amino
acids basis and a minimum level of CP. Minimum constraints were placed on YG to force
6 or 8% fat addition. Energy was allowed to increase accordingly. Crude protein (CP)
and amino acids (AA) were increased to maintain a consistent CP and AA ratio to energy
across all treatments. Fat addition and adjustment for CP and AA were done without
regard to cost. All diets were formulated using least-cost formulation software, and
included an industry provided premix.
Measurements
Birds were weighed by pen at 0, 10, 14, 17, 35, and 49 days via electronic scale.
Feed was weighed and placed in front of pens; a total quantity was recorded at that time
and feed disappearance measured at 10 or 14, 17, 35, and 49 days. Mortality weights
were recorded daily and used to adjust feed conversion. Feed intake, body weight gain,
feed conversion, and adjusted feed conversion were calculated for each period. At 49
days of age, 3 birds per pen (24 birds per treatment), of average weight for their pen,
were selected for processing. On day 50 birds were processed to determine carcass and
parts yield. Parts collected were pectoralis major and minor, thigh, leg, wing, and fat pad.
Statistical Analysis:
The experiment was a complete randomized block design with the position of
each block of pens in the barn being the blocking factor. Data was analyzed by analysis
of variance (ANOVA) with a two-way design with the pen being the experimental unit

9
throughout the study. All statements are based on the 0.05 level of significance. Mean
separations were done as appropriate using the Tukey’s least significant difference test.
RESULTS
Body weight was similar across treatments at 10 DOA, although feed intake (FI)
of treatment Cx10 was significantly higher than all other treatments except Cx14 at 10
DOA (Table 3.3). From 0 to 10 days birds fed diet C did not consume significantly more
than diets YG6 or YG8 (p-value=0.128, not shown) but feed/gain and adjusted feed/gain
were both significantly poorer in birds fed diet C than diets YG6 or YG8 (Table 3.3).
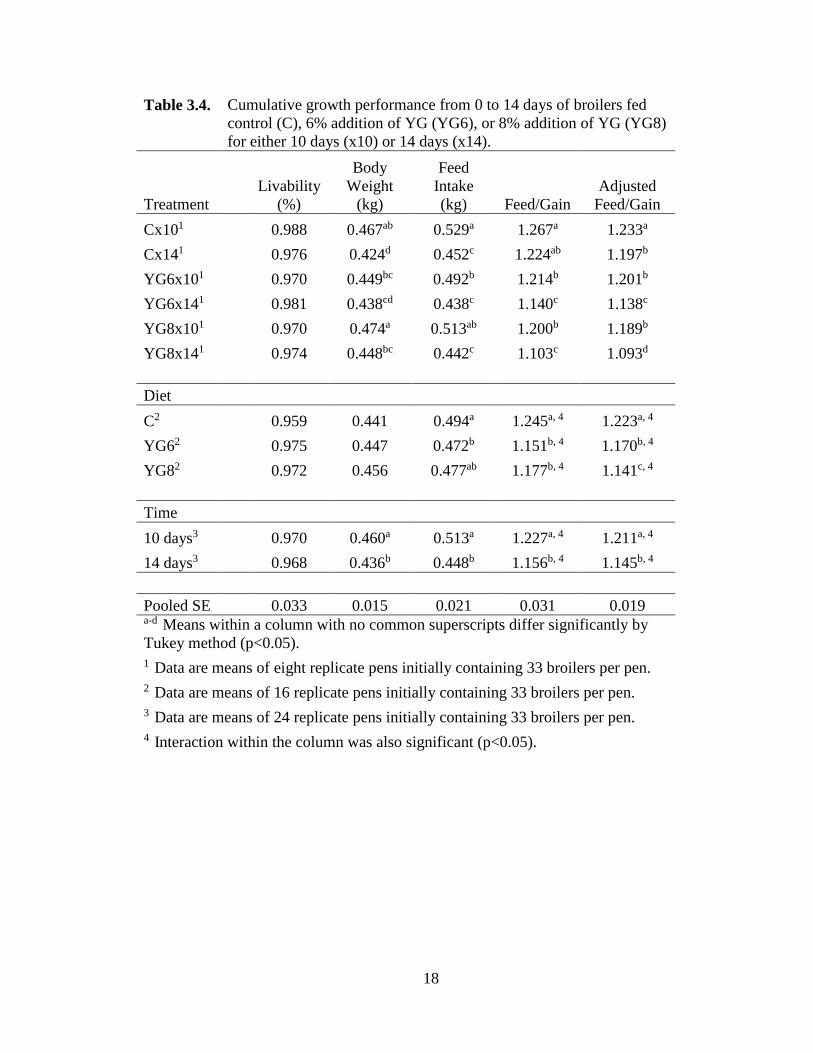
At 14 days, YG8x10 was significantly heavier than all other treatments except
Cx10 while Cx14 was significantly lighter than all other treatments except YG6x14
(Table 3.4). From 10 to 14 days, birds fed a pre-starter ration to 10 DOA consumed and
gained significantly more than birds fed a pre-starter ration to 14 DOA resulting in
significantly poorer feed conversion of birds fed pre-starter to 10 days during the 10 to 14
day period (Table 3.8). Consequently, birds fed pre-starter to 10 days were found to have
significantly increased cumulative BW, feed intake, and feed/gain (Table 3.4).
Cumulative feed consumption at 14 DOA was significantly higher in birds fed diet C than
YG6 but not significantly greater than YG8 (Table 3.4). This resulted in significantly
improved feed conversion as fat inclusion increased (Table 3.4). Interactive effects were
found in treatments cumulative feed/gain and adjusted feed/gain at 14 DOA (Table 3.4)
although only YG8x14 was significantly lower than all other treatments during the 10 to
14 day period (Table 3.8).
From 14 to 17 days, birds fed a pre-starter ration to 14 days gained significantly
more weight than birds fed a pre-starter ration to 10 DOA despite similar feed intake

10
causing significantly poorer feed conversion in birds fed pre-starter to 10 DOA (Table
3.9). Cumulative feed intake at 17 DOA was significantly increased in birds fed pre-
starter to 10 days due to the difference found at 14 DOA resulting in significantly poorer
feed conversion of birds fed pre-starter to 10 days (Table 3.5). Cumulative feed intake
and BW at 17 DOA was similar when comparing diet or time fed pre-starter separately
although feed conversion was significantly higher in birds fed diet C than YG6 or YG8
(Table 3.5).
There were no cumulative or period effects from time fed pre-starter or diet on
BW or feed intake after 17 DOA (Tables 3.6, 3.7, 3.10, 3.11) although cumulative feed
consumption of YG8x10 was significantly higher than YG6x14 at both 35 (Table 3.6)
and 49 DOA (Table 3.7). At 49 DOA feed conversion of treatment Cx10 was
significantly poorer than treatments Cx14, YG6x10, and YG8x14 (Table 3.7).
Cumulative feed conversion at 49 DOA was also found to be significantly poorer (2.25
points) in birds fed pre-starter to 10 days than 14 days (Table 3.7).
Although no significance was found between treatments at 49 DOA, treatment C
was heaviest followed by YG6 or YG8, each about 40 grams lighter than the previous
(Table 3.7). Final BW at 49 DOA was heavier than expected at an average of 3.60 kg,
0.10 kg above the suggested 49 day BW of 3.50 kg (Cobb-Vantress, 2015).
Under normal conditions with no extreme immune challenge, livability was
unaffected throughout the trial.
At 50 days of age, three birds of average weight from each pen were slaughtered
and parts yield measured. All treatments were similar in percentage of hot carcass, fat
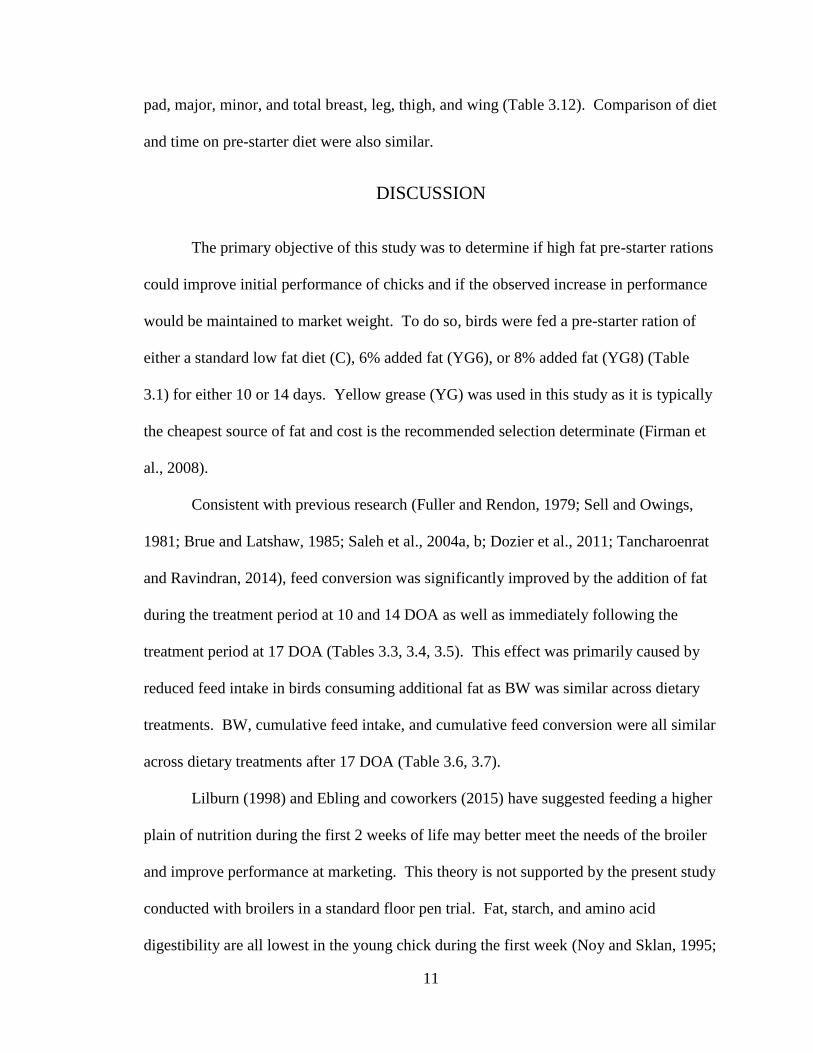
11
pad, major, minor, and total breast, leg, thigh, and wing (Table 3.12). Comparison of diet
and time on pre-starter diet were also similar.
DISCUSSION
The primary objective of this study was to determine if high fat pre-starter rations
could improve initial performance of chicks and if the observed increase in performance
would be maintained to market weight. To do so, birds were fed a pre-starter ration of
either a standard low fat diet (C), 6% added fat (YG6), or 8% added fat (YG8) (Table
3.1) for either 10 or 14 days. Yellow grease (YG) was used in this study as it is typically
the cheapest source of fat and cost is the recommended selection determinate (Firman et
al., 2008).
Consistent with previous research (Fuller and Rendon, 1979; Sell and Owings,
1981; Brue and Latshaw, 1985; Saleh et al., 2004a, b; Dozier et al., 2011; Tancharoenrat
and Ravindran, 2014), feed conversion was significantly improved by the addition of fat
during the treatment period at 10 and 14 DOA as well as immediately following the
treatment period at 17 DOA (Tables 3.3, 3.4, 3.5). This effect was primarily caused by
reduced feed intake in birds consuming additional fat as BW was similar across dietary
treatments. BW, cumulative feed intake, and cumulative feed conversion were all similar
across dietary treatments after 17 DOA (Table 3.6, 3.7).
Lilburn (1998) and Ebling and coworkers (2015) have suggested feeding a higher
plain of nutrition during the first 2 weeks of life may better meet the needs of the broiler
and improve performance at marketing. This theory is not supported by the present study
conducted with broilers in a standard floor pen trial. Fat, starch, and amino acid
digestibility are all lowest in the young chick during the first week (Noy and Sklan, 1995;

12
Batal and Parsons, 2002). Inclusion of a high level of fat, and thus a high plain of
nutrition did improve total nutrient retention as feed conversion was improved at 10, 14,
and 17 DOA but this effect was not apparent at market (Table 3.7). This improved feed
conversion also suggests the use of fats in the diets of young chicks is advisable in
agreement with Lilburn (1998).
Although BW was similar between dietary treatments at 10 and 14 DOA (Table
3.5), weight gain was significantly higher and feed conversion was significantly
improved in birds consuming YG8 from 10 to 14 days (Table 3.8). In addition, weight
gain and feed intake were both significantly higher in birds fed pre-starter to 10 DOA
(Table 3.8). In Table 3.8, weight gain is significantly higher in birds fed pre-starter to 10
DOA and YG8x14 over Cx14 and YG6x14. This would appear to confirm the
suggestions set by Cobb-Vantress (2015) that a feed change should occur at 10 DOA as
the bird appears to require a higher level of energy post 10 DOA. This may not be the
case though as treatment YG8x14 feed conversion was significantly better at 14 DOA
than all other treatments (Tables 3.4, 3.8) suggesting the bird may still require a high
level of energy and protein to 14 DOA. In addition, weight gain and feed conversion
were significantly improved from 14 to 17 days in broilers fed pre-starter to 14 DOA
compared to pre-starter to 10 DOA (Table 3.9). Consequently, at 17 DOA broilers fed
pre-starter to 14 DOA had numerically heavier BW, significantly reduced cumulative
feed intake, and significantly improved cumulative feed conversion (Table 3.5).
Although no significant cumulative effects were found at 35 DOA, feed conversion was
significantly improved in broilers fed pre-starter to 14 DOA compared to broilers fed pre-
starter to 10 DOA (Table 3.7).

13
From the present study, we find the broiler gains more weight immediately
following a feed change but improvement in feed conversion does not mirror the
improvement in weight gain (Tables 3.8, 3.9). Feeding pre-starter to 14 DOA rather than
10 DOA appears to be beneficial as cumulative feed conversion was significantly
improved at 49 DOA (Table 3.7). Feeding a pre-starter ration for a longer period would
likely be more beneficial to growth but cost must be considered as a pre-starter ration is
essentially a diet with a higher plain of nutrition and thus costs more.
Broilers are commonly fed a starter ration to 17 or 21 days (NRC, 1994).
According to the present study, feeding a pre-starter ration with a high plain of nutrition
via the addition of high levels of fat to 14 DOA may improve cumulative feed conversion
at market thus reducing cost of gain. Maximizing the improvement in feed conversion
will require further research to determine at what age a pre-starter, high plain of nutrition
ration should be fed to while reduced cost of gain will be highly dependent on ingredient
cost and the level of nutrient inclusion in the pre-starter ration.
Today’s broiler appears to have an outstanding ability to compensate for lack of
BW gain and achieve flock uniformity. This is likely due to the remarkable
improvements in broiler genetics (Havenstein et al., 2003b, a) leading to a drive in the
broiler to maximally consume feed and grow accordingly. In the current study, Cx14 was
the lightest treatment at 17 DOA (Table 3.5) but was the heaviest at both 35 (Table 3.6)
and 49 DOA (Table 3.7). At 49 DOA, BW was similar across all treatments with only
130 gram (3.6% of average 49 day BW) difference between the lightest and heaviest
treatment (Table 3.7). Studies in how today’s broiler adjusts and compensates to
deficient or excess energy and protein may lead to a better understanding of how to

14
improve growth through marketing or how to more cheaply feed the birds with early
intervention strategies.
CONCLUSION
Additional fat in the pre-starter diet did not result in improved BW or improved
feed conversion at market. Feeding the pre-starter ration to 14 DOA rather than 10 DOA
did result in improved feed conversion at 49 DOA but further research should be
conducted to determine the ideal plain of nutrition and time feeding the pre-starter ration.
Under normal conditions, the addition of high level of fats during the pre-starter phase
only is not recommended. In the current study, significant improvements in growth and
feed conversion were not observed at market and inclusion of high levels of fat raised the
pre-starter diet cost.

15
Table 3.1.
Ingredient composition and nutrient profile of experimental diets fed to
broilers to either 10 or 14 days of age.
Treatments
C YG6 YG8
Ingredient % % %
Corn 59.28 50.27 46.41
Soybean Meal 27.01 31.17 32.94
Porkmeal 5.00 5.00 5.00
Corn DDGS 5.00 5.00 5.00
Yellow Grease1 1.33 6.00 8.00
Dicalcium Phosphate 0.59 0.72 0.77
Copper Sulfate 0.00 0.00 0.00
Sodium Chloride 0.32 0.32 0.32
Limestone 0.51 0.55 0.60
Choline Chloride 0.02 0.01 0.00
Vitamin/Mineral Premix2,3 0.18 0.18 0.18
DL-Methionine 0.33 0.36 0.37
Lysine HCL 0.26 0.23 0.22
Threonine 0.15 0.15 0.15
Avatec 0.05 0.05 0.05
Nutrient
ME (kcal/kg) 3035 3209 3283
Crude Protein 22.00 23.30 23.85
Calcium 0.90 0.95 0.98
Available Phosphorus 0.45 0.48 0.49
Lysine 1.18 1.25 1.28
Methionine + Cysteine 0.88 0.93 0.95
Threonine 0.77 0.82 0.84
Valine 0.80 0.85 0.87 1 Yellow Grease Analysis: Total fatty acids, min. 90.0%; Moisture, max. 1.0%;
Insoluble impurities, max. 0.5%; Unsaponifiable matter, max. 1.0%; Total M.I.U.,
max. 2.0%; Free fatty acids, max. 15.0%. 2 Vitamins provided per kilogram: Vitamin E 93,697 mg; B-12 18000 mcg; Thiamin
2,343 mg; Riboflavin 9,369 mg; Niacin 81,983 mg; Pyridoxine 5,857 mg; Biotin 205
mg; Folate 3,514 mg 3 Minerals provided per kilogram: Mn 160,000 mg; Zn 150,000 mg; Fe 10,000 mg; Se
240 mg; Mg 20,000 mg

16
Table 3.2.
Ingredient composition and nutrient profile of common diets fed to
broilers in all treatments starting at either 11 or 15 days of age through 49
days of age.
Period
11-17 18-35 36-49
Ingredient % % %
Corn 63.79 65.46 67.95
Soybean Meal 22.22 20.06 17.60
Porkmeal 5.00 5.00 5.00
Corn DDGS 5.00 5.00 5.00
Yellow Grease1 1.88 2.77 2.74
Dicalcium Phosphate 0.48 0.31 0.32
Copper Sulfate 0.00 0.00 0.00
Sodium Chloride 0.32 0.32 0.32
Limestone 0.44 0.33 0.34
Choline Chloride 0.00 0.00 0.00
Vitamin/Mineral Premix2,3 0.18 0.18 0.18
DL-Methionine 0.28 0.24 0.22
Lysine HCL 0.24 0.18 0.20
Threonine 0.13 0.11 0.10
Avatec 0.05 0.05 0.05
Nutrient
ME (kcal/kg) 3110 3180 3200
Crude Protein 20 19 18
Calcium 0.84 0.76 0.76
Available Phosphorus 0.42 0.38 0.38
Lysine 1.05 0.95 0.90
Methionine + Cysteine 0.80 0.74 0.70
Threonine 0.69 0.65 0.61
Valine 0.73 0.70 0.66 1 Yellow Grease Analysis: Total fatty acids, min. 90.0%; Moisture, max. 1.0%;
Insoluble impurities, max. 0.5%; Unsaponifiable matter, max. 1.0%; Total M.I.U.,
max. 2.0%; Free fatty acids, max. 15.0%. 2 Vitamins provided per kilogram: Vitamin E 93,697 mg; B-12 18000 mcg; Thiamin
2,343 mg; Riboflavin 9,369 mg; Niacin 81,983 mg; Pyridoxine 5,857 mg; Biotin 205
mg; Folate 3,514 mg 3 Minerals provided per kilogram: Mn 160,000 mg; Zn 150,000 mg; Fe 10,000 mg; Se
240 mg; Mg 20,000 mg

17
Table 3.3.
Growth performance from 0 to 10 days of broilers fed control (C),
6% addition of YG (YG6), or 8% addition of YG (YG8) for either
10 days (x10) or 14 days (x14).
Treatment
Livability
(%)
Body
Weight
(kg)
Feed
Intake
(kg) Feed/Gain
Adjusted
Feed/Gain
Cx101 0.975 0.269 0.258a 1.115a 1.105a
Cx141
0.960 0.264 0.238ab 1.114a 1.099a
YG6x101
0.977 0.269 0.227b 1.026b 1.029b
YG6x141
0.981 0.269 0.230b 1.025b 1.018b
YG8x101
0.970 0.275 0.233b 1.011b 1.014b
YG8x141
0.978 0.270 0.229b 1.010b 1.011b
Diet
C2
0.958 0.259 0.240 1.114a 1.120a
YG62
0.979 0.266 0.229 1.025b 1.020b
YG82
0.964 0.266 0.225 1.026b 1.009b
Time
10 days3
0.974 0.264 0.232 1.055 1.047
14 days3
0.960 0.264 0.230 1.055 1.046
Pooled SE 0.028 0.014 0.013 0.024 0.018 a-b Means within a column with no common superscripts differ significantly by
Tukey method (p<0.05).
1 Data are means of eight replicate pens initially containing 33 broilers per pen.
2 Data are means of 16 replicate pens initially containing 33 broilers per pen.
3 Data are means of 24 replicate pens initially containing 33 broilers per pen.
18
Table 3.4.
Cumulative growth performance from 0 to 14 days of broilers fed
control (C), 6% addition of YG (YG6), or 8% addition of YG (YG8)
for either 10 days (x10) or 14 days (x14).
Treatment
Livability
(%)
Body
Weight
(kg)
Feed
Intake
(kg) Feed/Gain
Adjusted
Feed/Gain
Cx101 0.988 0.467ab 0.529a 1.267a 1.233a
Cx141
0.976 0.424d 0.452c 1.224ab 1.197b
YG6x101
0.970 0.449bc 0.492b 1.214b 1.201b
YG6x141
0.981 0.438cd 0.438c 1.140c 1.138c
YG8x101
0.970 0.474a 0.513ab 1.200b 1.189b
YG8x141
0.974 0.448bc 0.442c 1.103c 1.093d
Diet
C2
0.959 0.441 0.494a 1.245a, 4 1.223a, 4
YG62
0.975 0.447 0.472b 1.151b, 4 1.170b, 4
YG82
0.972 0.456 0.477ab 1.177b, 4 1.141c, 4
Time
10 days3
0.970 0.460a 0.513a 1.227a, 4 1.211a, 4
14 days3
0.968 0.436b 0.448b 1.156b, 4 1.145b, 4
Pooled SE 0.033 0.015 0.021 0.031 0.019 a-d Means within a column with no common superscripts differ significantly by
Tukey method (p<0.05).
1 Data are means of eight replicate pens initially containing 33 broilers per pen.
2 Data are means of 16 replicate pens initially containing 33 broilers per pen.
3 Data are means of 24 replicate pens initially containing 33 broilers per pen.
4 Interaction within the column was also significant (p<0.05).

19
Table 3.5.
Cumulative growth performance from 0 to 17 days of broilers fed
control (C), 6% addition of YG (YG6), or 8% addition of YG (YG8)
for either 10 days (x10) or 14 days (x14).
Treatment
Livability
(%)
Body
Weight
(kg)
Feed
Intake
(kg) Feed/Gain
Adjusted
Feed/Gain
Cx101 0.939 0.618ab 0.770a 1.319a 1.278a
Cx141
0.934 0.591b 0.696bc 1.290a 1.226bc
YG6x101
0.939 0.603ab 0.738abc 1.293a 1.254ab
YG6x141
0.947 0.610ab 0.689bc 1.224b 1.193cd
YG8x101
0.935 0.625a 0.741ab 1.288a 1.241ab
YG8x141
0.944 0.604ab 0.682c 1.179b 1.156d
Diet
C2
0.937 0.604 0.725 1.310a 1.258a
YG62
0.947 0.611 0.720 1.250b 1.218b
YG82
0.939 0.622 0.712 1.242b 1.200b
Time
10 days3
0.938 0.606 0.749a 1.304a 1.258a
14 days3
0.945 0.618 0.689b 1.231b 1.192b
Pooled SE 0.034 0.021 0.037 0.034 0.026 a-d Means within a column with no common superscripts differ significantly by
Tukey method (p<0.05).
1 Data are means of eight replicate pens initially containing 33 broilers per pen.
2 Data are means of 16 replicate pens initially containing 33 broilers per pen.
3 Data are means of 24 replicate pens initially containing 33 broilers per pen.

20
Table 3.6.
Cumulative growth performance from 0 to 35 days of broilers fed
control (C), 6% addition of YG (YG6), or 8% addition of YG (YG8)
for either 10 days (x10) or 14 days (x14).
Treatment
Livability
(%)
Body
Weight
(kg)
Feed
Intake
(kg) Feed/Gain
Adjusted
Feed/Gain
Cx101 0.952 2.169ab 3.253ab 1.509 1.493
Cx141
0.939 2.216a 3.248ab 1.490 1.477
YG6x101
0.924 2.151ab 3.218ab 1.512 1.486
YG6x141
0.943 2.098b 3.143b 1.501 1.491
YG8x101
0.926 2.175ab 3.271a 1.507 1.493
YG8x141
0.935 2.127ab 3.248ab 1.486 1.476
Diet
C2
0.933 2.193 3.262 1.500 1.490
YG62
0.934 2.158 3.195 1.508 1.486
YG82
0.931 2.179 3.221 1.514 1.491
Time
10 days3
0.930 2.174 3.250 1.517 1.498
14 days3
0.935 2.179 3.203 1.497 1.480
Pooled SE 0.027 0.067 0.074 0.024 0.027 a-b Means within a column with no common superscripts differ significantly by
Tukey method (p<0.05).
1 Data are means of eight replicate pens initially containing 33 broilers per pen.
2 Data are means of 16 replicate pens initially containing 33 broilers per pen.
3 Data are means of 24 replicate pens initially containing 33 broilers per pen.

21
Table 3.7.
Cumulative growth performance from 0 to 49 days of broilers fed
control (C), 6% addition of YG (YG6), or 8% addition of YG (YG8)
for either 10 days (x10) or 14 days (x14).
Treatment
Livability
(%)
Body
Weight
(kg)
Feed
Intake
(kg) Feed/Gain
Adjusted
Feed/Gain
Cx101 0.947 3.532 6.138ab 1.757 1.730a
Cx141
0.933 3.661 6.101ab 1.689 1.671b
YG6x101
0.917 3.574 6.017ab 1.717 1.686b
YG6x141
0.928 3.612 5.938b 1.690 1.691ab
YG8x101
0.913 3.646 6.169a 1.720 1.686ab
YG8x141
0.913 3.610 5.953ab 1.718 1.6832b
Diet
C2
0.935 3.645 6.120 1.722 1.698
YG62
0.922 3.606 5.978 1.704 1.677
YG82
0.913 3.563 6.093 1.736 1.685
Time
10 days3
0.926 3.587 6.086 1.730 1.699a
14 days3
0.921 3.623 6.041 1.711 1.674b
Pooled SE 0.038 0.087 0.137 0.043 0.026 a-b Means within a column with no common superscripts differ significantly by
Tukey method (p<0.05).
1 Data are means of eight replicate pens initially containing 33 broilers per pen.
2 Data are means of 16 replicate pens initially containing 33 broilers per pen.
3 Data are means of 24 replicate pens initially containing 33 broilers per pen.

22
Table 3.8.
Growth performance from 10 to 14 days of broilers fed control (C),
6% addition of YG (YG6), or 8% addition of YG (YG8) for either
10 days (x10) or 14 days (x14).
Treatment
Livability
(%)
Body
Weight
Gain (kg)
Feed
Intake
(kg) Feed/Gain
Adjusted
Feed/Gain
Cx101 0.988 0.196a 0.278a 1.392a 1.373a
Cx141
0.976 0.161b 0.221b 1.335a 1.332a
YG6x101
0.970 0.194a 0.267a 1.411a 1.398a
YG6x141
0.981 0.157b 0.209b 1.333a 1.333a
YG8x101
0.970 0.198a 0.280a 1.402a 1.400a
YG8x141
0.974 0.183a 0.216b 1.199b 1.198b
Diet
C2
0.959 0.179b 0.247 1.366a, 4 1.362a, 4
YG62
0.975 0.179b 0.239 1.361a, 4 1.352a, 4
YG82
0.972 0.190a 0.246 1.300b, 4 1.299b, 4
Time
10 days3
0.970 0.196a 0.273a 1.402a, 4 1.394a, 4
14 days3
0.968 0.169b 0.215b 1.282b, 4 1.281b, 4
Pooled SE 0.033 0.01352 0.01118 0.0517 0.0553 a-b Means within a column with no common superscripts differ significantly by
Tukey method (p<0.05).
1 Data are means of eight replicate pens initially containing 33 broilers per pen.
2 Data are means of 16 replicate pens initially containing 33 broilers per pen.
3 Data are means of 24 replicate pens initially containing 33 broilers per pen.
4 Interaction within the column was also significant (p<0.05).

23
Table 3.9.
Growth performance from 14 to 17 days of broilers fed control (C),
6% addition of YG (YG6), or 8% addition of YG (YG8) for either
10 days (x10) or 14 days (x14).
Treatment
Livability
(%)
Body
Weight
Gain (kg)
Feed
Intake
(kg) Feed/Gain
Adjusted
Feed/Gain
Cx101 0.939 0.152 0.218 1.560a 1.395a
Cx141
0.934 0.175 0.219 1.410c 1.297b
YG6x101
0.939 0.156 0.224 1.516ab 1.373a
YG6x141
0.947 0.173 0.226 1.429bc 1.307b
YG8x101
0.935 0.160 0.218 1.569a 1.345ab
YG8x141
0.944 0.175 0.208 1.425bc 1.302b
Diet
C2
0.937 0.163 0.219 1.500 1.349
YG62
0.947 0.164 0.223 1.492 1.357
YG82
0.939 0.165 0.217 1.497 1.343
Time
10 days3
0.938 .158b 0.219 1.547a 1.384a
14 days3
0.945 .170a 0.221 1.446b 1.316b
Pooled SE 0.034 0.015 0.019 0.057 0.033 a-c Means within a column with no common superscripts differ significantly by
Tukey method (p<0.05).
1 Data are means of eight replicate pens initially containing 33 broilers per pen.
2 Data are means of 16 replicate pens initially containing 33 broilers per pen.
3 Data are means of 24 replicate pens initially containing 33 broilers per pen.

24
Table 3.10.
Growth performance from 17 to 35 days of broilers fed control (C),
6% addition of YG (YG6), or 8% addition of YG (YG8) for either
10 days (x10) or 14 days (x14).
Treatment
Livability
(%)
Body
Weight
Gain (kg)
Feed
Intake
(kg) Feed/Gain
Adjusted
Feed/Gain
Cx101 0.952 1.554ab 2.473 1.574 1.574
Cx141
0.939 1.625a 2.555 1.561 1.561
YG6x101
0.924 1.584ab 2.484 1.598 1.582
YG6x141
0.943 1.529b 2.460 1.602 1.602
YG8x101
0.926 1.570ab 2.499 1.589 1.601
YG8x141
0.935 1.523b 2.501 1.609 1.598
Diet
C2
0.933 1.589 2.528 1.567b 1.567
YG62
0.934 1.547 2.472 1.594ab 1.586
YG82
0.931 1.557 2.500 1.599a 1.594
Time
10 days3
0.930 1.556 2.492 1.587 1.582
14 days3
0.935 1.572 2.508 1.587 1.583
Pooled SE 0.027 0.059 0.063 0.033 0.032 a-b Means within a column with no common superscripts differ significantly by
Tukey method (p<0.05).
1 Data are means of eight replicate pens initially containing 33 broilers per pen.
2 Data are means of 16 replicate pens initially containing 33 broilers per pen.
3 Data are means of 24 replicate pens initially containing 33 broilers per pen.

25
Table 3.11.
Growth performance from 35 to 49 days of broilers fed control (C),
6% addition of YG (YG6), or 8% addition of YG (YG8) for either
10 days (x10) or 14 days (x14).
Treatment
Livability
(%)
Body
Weight
Gain (kg)
Feed
Intake
(kg) Feed/Gain
Adjusted
Feed/Gain
Cx101 0.947 1.431 2.914 2.107 2.095
Cx141
0.933 1.438 2.848 1.997 1.974
YG6x101
0.917 1.422 2.824 1.969 1.976
YG6x141
0.928 1.473 2.813 1.974 1.975
YG8x101
0.913 1.394 2.835 2.065 2.011
YG8x141
0.913 1.376 2.870 2.022 1.980
Diet
C2
0.935 1.434 2.881 2.052 1.996
YG62
0.922 1.448 2.806 1.970 1.958
YG82
0.913 1.385 2.823 2.104 2.011
Time
10 days3
0.926 1.415 2.849 2.047 2.013
14 days3
0.921 1.429 2.825 2.037 1.964
Pooled SE 0.038 0.119 0.099 0.082 0.097 a-b Means within a column with no common superscripts differ significantly by
Tukey method (p<0.05).
1 Data are means of eight replicate pens initially containing 33 broilers per pen.
2 Data are means of 16 replicate pens initially containing 33 broilers per pen.
3 Data are means of 24 replicate pens initially containing 33 broilers per pen.

26
Table 3.12.
Processing yields of broilers at 50 days of age, after 12 hours fasting, fed control (C), 6% addition of YG
(YG6), or 8% addition of YG (YG8) for either 10 days (x10) or 14 days (x14).
Treatment
Hot
Carcass4 Fat Pad5
Major
Breast5
Minor
Breast5
Total
Breast5 Leg5 Thigh5 Wing5
Cx101
71.39 2.33 26.11 5.36 31.08 15.29 18.64 11.57
Cx141
72.68 2.59 26.56 5.52 31.67 15.10 19.16 11.45
YG6x101
72.04 2.55 26.46 5.54 32.00 15.30 19.30 11.78
YG6x141
72.40 2.50 26.09 5.51 31.68 15.22 18.81 11.23
YG8x101
71.70 2.91 25.92 5.29 31.22 15.20 18.97 11.60
YG8x141
72.68 2.44 26.50 5.36 31.83 15.05 18.65 11.58
Diet
C2
72.41 2.46 26.09 5.31 31.37 15.30 18.99 11.56
YG62
72.43 2.59 26.27 5.57 31.84 15.33 18.99 11.50
YG82
72.24 2.72 26.39 5.33 31.72 15.13 18.81 11.58
Time
10 days3
72.17 2.64 26.08 5.37 31.43 15.30 18.93 11.68
14 days3
72.56 2.54 26.42 5.44 31.86 15.21 18.93 11.41
Pooled SE 1.96 0.83 2.40 0.68 2.91 1.19 1.38 0.88
a-b Means within a column with no common superscripts differ significantly by Tukey method (p<0.05).
1 Data are means of 24 carcasses per treatment.
2 Data are means of 48 carcasses per treatment.
3 Data are means of 72 carcasses per treatment.
4 Expressed as a percent of live weight.
5 Expressed as a percent of the hot carcass weight.

27
EFFECTS OF HIGH FAT TURKEY PRE-STARTER
RATIONS ON PERFORMANCE
Abstract
An experiment was conducted to test the addition of 6% or 8% yellow grease (YG) to
diets of turkeys during the 0-10 day or 0-14 day pre-starter period. Forty-eight pens of birds were
fed one of 6 treatments to consist of a control (least cost addition of YG), 6% YG, or 8% YG,
each fed to either 10 or 14 days. Eight replicate pens were used for each treatment arranged in a
randomized complete block design with location as the blocking factor. Each pen contained 12
commercial strain tom poults placed at hatch and raised to 20 weeks of age. Diets consisted of
commercial type corn-soy-DDGS-meat meal base and were adjusted to maintain a consistent
relationship between energy and crude protein as well as amino acids. Birds were weighed and
diets changed at 10 or 14 days, and at 3 week intervals to 20 weeks of age. No differences in
performance were observed by addition of high levels of fat during the pre-starter period.These
results suggest the addition of high levels of fat in the pre-starter ration does not improve
performance in turkeys.
Keywords: turkeys, fat addition, pre-starter
Introduction
Relatively little recent research has been published on use of different fat levels in poultry. No
publications described the proposed research per se. High fat diets have a positive impact on
body weight (BW) gain and feed efficiency (FE) as compared to diets with normal amounts of
fat when fed throughout the life of the bird in both chickens (Sahito et al., 2012) and turkeys
(Sell and Owings, 1981). This phenomenon is true in nearly every variation of environment
tested. Chicks 5-7 weeks of age in a floor pen trial, a proper stimulation of industry settings,
preferred and achieved improved BW gain with high fat diets over high CHO and low fat diets in

28
both temperate and heat stress environments (Dale and Fuller, 1978). When temperatures were
hot, cool, and cycled to simulate day and night during the summer, the 4+ week old chicks fed
high fat diets had a significant improvement of BW gain over those fed low fat diets. This
benefit may be due to the lower heat increment of dietary fat (Dale and Fuller, 1980). In addition
to all environmental conditions, improved BW gain and FE were observed in all high fat diets
regardless of source in a finishing diet (Fuller and Rendon, 1979; Ouart et al., 1992). The one
exception might be high free fatty acid (FFA) yellow grease (YG) which was found to have
negative effects on BW gain after 21 days of age when the inclusion rate was 3%. Interestingly,
FFA levels had no effect on BW gain or FE during the starter phase when inclusion rate was only
1.5% (Wu et al., 2011). Dale and Fuller (1978) again observed a preference for high fat diets
over low fat diets regardless of temperature, but also found the same preference true in both
mash and pellet form. No preference was found between mash and pellets of the same high fat
diet. From this Dale and Fuller (1979) inferred that reduced heat increment and texture of high
fat diets may not be the reason for the birds preference because they preferred high fat to low fat,
which have the same texture and color, and they preferred high fat in the cold environment
where a higher heat increment would be beneficial. The benefit that influences the birds decision
to consume high fat diets may be the extra-caloric effect by which fat positively affects the
energy availability of other ingredients (Jensen et al., 1970). This was confirmed in a study
finding the addition of fat improved the digestibility of meat and bone meal (Firman and Remus,
1994). Higher fat diets increase the metabolizable energy (ME) available due to the increase in
ME from the fat and because of the extra caloric effect. A concern became that feed intake may
decrease. Only minor adjustments in feed intake were found between 2.5 and 10% fat inclusion
with the high levels of fat resulting in more BW gain and improved FE. With only minor feed
intake adjustments made, the birds total ME consumption increased and it was found that the
birds ate more feed/day, but average daily gain (ADG) and FE were improved because of a
shorter time to slaughter weight. Most high fat studies have been done with birds 3+ weeks of
age. The little research conducted over the life of the bird has shown positive effects at a young
age as noted above. It has been found that fat absorbability is poor in the very young chick, but
appears to develop rapidly after the first few days and is maximally absorbing fat by two weeks
of age if not sooner (Carew et al., 1972). As noted by Lilburn (1998), the low absorbability of
fats in the young chick doesn't mean that fat shouldn't be used in young chick diets. The

29
hatchling is geared to oxidize fatty acids so providing it with a large amount of energy in the
form of fat would be beneficial as compared to the normal method of providing energy with
high-protein, low available carbohydrates that rely on gluconeogenesis to be used. The use of
high fat during the starter phase is still a practical implication (Lilburn, 1998). Research has also
found that the effects of feeding a high concentration of protein, energy, vitamins, and minerals
during the first 2 weeks resulted in a larger BW bird at the end of 2 weeks and that this increased
BW was still apparent at the end of 14 weeks when the trial ended (Moran, 1978). The proposed
study would seek to determine if fat alone for a short period during the beginning of the life
cycle would be beneficial to the turkey throughout the growth period.
Experimental Procedures
Forty-eight pens of broilers turkeys (12 toms/pen) were used in a 2 x 3 factorial design with 6
treatments and 8 replicate pens. Treatments included a low fat starter diet, 6% and 8% added fat
(standard yellow grease-15% max FFA, std FA profile) x two time periods (10 days and 14 days)
on diet. Fat was split and added both in the mix and post-pelleting when levels are high. Fat at
less than 4% of the diet was added in the mixer before pelleting. Energy levels were allowed to
increase with the fat additions and other ingredients/nutrients were adjusted as needed to
accommodate the additional fat and maintain ME/ideal protein ratio (0.46%dlysine/mcal). These
diets will be fed for either the 10 or 14 day period noted above followed by industry standard
diets through the rest of the growout period. Poults were obtained from a commercial source on
day of hatch. Birds were weighed and (small birds removed from the group) placed into floor
pens in curtain sided buildings. Standard husbandry practices were followed based on our SOP’s
(copies available on request) and birds were weighed at each feed change. Turkeys and feed were
weighed at 10 or 14 days followed by diet changes at 21, 42, 63, 84, 105, 126 and 140 days. On
day 141, 2 toms per pen were slaughtered in our pilot processing plant for carcass yield
determination. Mortality was monitored on a daily basis. All data were analyzed by the GLM
procedure for a 2 x 3 factorial ANOVA using Minitab software with a significance level set at
0.05

30
Results and discussion
Results of the turkey trial are noted in the tables below. In turkeys, few differences were seen in
any of the parameters measured. Birds performed well reaching ~44 pounds at 20 weeks of age.
No consistent differences were seen in body weight gain, feed/gain or feed intake at any of the
time periods. At the conclusion of the trial no differences in any parameters were noted. A slight
increase in fat pad size was noted in the processing yield at the higher fat inclusion level. No
other yield differences were noted.
The primary objective of this study was to determine if high fat pre-starter rations could improve
initial performance of turkey poults and if the observed increase in performance would be
maintained to market weight. Yellow grease (YG) was used in this study as it is typically the
cheapest source of fat and cost is the recommended selection determinate (Firman et al., 2008).
Unlike previous research (Fuller and Rendon, 1979; Sell and Owings, 1981; Brue and
Latshaw, 1985; Saleh et al., 2004a, b; Dozier et al., 2011; Tancharoenrat and Ravindran, 2014),
feed conversion was not improved by the addition of fat during the treatment period through fat
addition. Lilburn (1998) and Ebling and coworkers (2015) have suggested feeding a higher plain
of nutrition during the first 2 weeks of life may better meet the needs of the broilers and improve
performance at marketing. This theory is not supported by the present study conducted with
turkeys in a standard floor pen trial. Fat, starch, and amino acid digestibility are all lowest in the
young chick during the first week (Noy and Sklan, 1995; Batal and Parsons, 2002). It would
appear that early inclusion of fat at high levels does not result in performance benefits.

31
Table 1.1.
Growth performance from 0 to 10 days of tom turkeys fed control
(C), 6% addition of YG (YG6), or 8% addition of YG (YG8) for
either 10 days (x10) or 14 days (x14).
Treatment
Livability
(%)
Body
Weight
(kg)
Feed
Intake
(kg) Feed/Gain
Adjusted
Feed/Gain
Cx101 0.969 0.217 0.207 1.350 1.334
Cx141
0.958 0.218 0.203 1.348 1.329
YG6x101
0.916 0.209 0.199 1.459 1.417
YG6x141
0.927 0.209 0.200 1.509 1.458
YG8x101
0.989 0.219 0.203 1.269 1.261
YG8x141
0.958 0.214 0.203 1.397 1.298
Diet
C2
0.964a 0.217 0.207 1.349 1.332
YG62
0.921ab 0.209 0.203 1.484 1.437
YG82
0.974b 0.216 0.199 1.333 1.279
P-Value 0.04
Time
10 days3
0.958 0.215 0.207 1.359 1.337
14 days3
0.948 0.214 0.203 1.418 1.362
Pooled SE a-b Means within a column with no common superscripts differ significantly by
Tukey method (p<0.05).
1 Data are means of 8 replicate pens initially containing 12 tom turkeys per pen.
2 Data are means of 16 replicate pens initially containing 12 tom turkeys per pen.
3 Data are means of 24 replicate pens initially containing 12 tom turkeys per pen.

32
Table 1.2.
Growth performance from 0 to 14 days of tom turkeys fed control
(C), 6% addition of YG (YG6), or 8% addition of YG (YG8) for
either 10 days (x10) or 14 days (x14).
Treatment
Livability
(%)
Body
Weight
(kg)
Feed
Intake
(kg) Feed/Gain
Adjusted
Feed/Gain
Cx101 0.969 0.355 0.382 1.286 1.278
Cx141
0.948 0.355 0.374 1.272 1.254
YG6x101
0.917 0.349 0.384 1.311 1.249
YG6x141
0.927 0.340 0.361 1.332 1.289
YG8x101
0.989 0.361 0.384 1.267 1.263
YG8x141
0.958 0.348 0.361 1.251 1.237
Diet
C2
0.959 0.355 0.378 1.279 1.266
YG62
0.922 0.345 0.372 1.322 1.269
YG82
0.974 0.354 0.373 1.259 1.250
Time
10 days3
0.958 0.355 0.383a 1.288 1.263
14 days3
0.945 0.348 0.365b 1.285 1.260
P-Value 0.01
Pooled SE a-b Means within a column with no common superscripts differ significantly by
Tukey method (p<0.05).
1 Data are means of 8 replicate pens initially containing 12 tom turkeys per pen.
2 Data are means of 16 replicate pens initially containing 12 tom turkeys per pen.
3 Data are means of 24 replicate pens initially containing 12 tom turkeys per pen.

33
Table 1.3.
Growth performance from 0 to 21 days of tom turkeys fed control
(C), 6% addition of YG (YG6), or 8% addition of YG (YG8) for
either 10 days (x10) or 14 days (x14).
Treatment
Livability
(%)
Body
Weight
(kg)
Feed
Intake
(kg) Feed/Gain
Adjusted
Feed/Gain
Cx101 0.958 0.747 0.847 1.297 1.287
Cx141
0.948 0.740 0.850 1.269 1.262
YG6x101
0.917 0.720 0.839 1.277 1.268
YG6x141
0.885 0.714 0.829 1.371 1.331
YG8x101
0.979 0.748 0.869 1.275 1.274
YG8x141
0.958 0.715 0.848 1.295 1.288
Diet
C2
0.953ab 0.744 0.848 1.283 1.275
YG62
0.901b 0.717 0.834 1.324 1.299
YG82
0.969a 0.731 0.859 1.285 1.281
P-Value 0.023
Time
10 days3
0.951 0.738 0.852 1.283 1.276
14 days3
0.931 0.723 0.843 1.312 1.294
Pooled SE a-b Means within a column with no common superscripts differ significantly by
Tukey method (p<0.05).
1 Data are means of 8 replicate pens initially containing 12 tom turkeys per pen.
2 Data are means of 16 replicate pens initially containing 12 tom turkeys per pen.
3 Data are means of 24 replicate pens initially containing 12 tom turkeys per pen.

34
Table 1.4.
Growth performance from 0 to 42 days of tom turkeys fed control
(C), 6% addition of YG (YG6), or 8% addition of YG (YG8) for
either 10 days (x10) or 14 days (x14).
Treatment
Livability
(%)
Body
Weight
(kg)
Feed
Intake
(kg) Feed/Gain
Adjusted
Feed/Gain
Cx101 0.948 2.97 4.07 1.360 1.344
Cx141
0.927 2.96 4.19 1.488 1.479
YG6x101
0.881 2.93 4.26 1.558 1.542
YG6x141
0.864 2.90 4.42 1.563 1.554
YG8x101
0.928 2.99 4.20 1.505 1.504
YG8x141
0.948 2.87 4.29 1.501 1.496
Diet
C2
0.938a 2.96 4.13 1.424 1.412
YG62
0.873b 2.92 4.34 1.560 1.548
YG82
0.938a 2.93 4.25 1.503 1.501
P-Value 0.024
Time
10 days3
0.958 2.96 4.18 1.475 1.463
14 days3
0.948 2.91 4.30 1.517 1.509
Pooled SE a-b Means within a column with no common superscripts differ significantly by
Tukey method (p<0.05).
1 Data are means of 8 replicate pens initially containing 12 tom turkeys per pen.
2 Data are means of 16 replicate pens initially containing 12 tom turkeys per pen.
3 Data are means of 24 replicate pens initially containing 12 tom turkeys per pen.

35
Table 1.5.
Growth performance from 0 to 63 days of tom turkeys fed control
(C), 6% addition of YG (YG6), or 8% addition of YG (YG8) for
either 10 days (x10) or 14 days (x14).
Treatment
Livability
(%)
Body
Weight
(kg)
Feed
Intake
(kg) Feed/Gain
Adjusted
Feed/Gain
Cx101 0.948 6.01 10.31 1.733 1.722
Cx141
0.917 6.01 10.35 1.758 1.754
YG6x101
0.869 6.20 10.61 1.756 1.747
YG6x141
0.855 5.99 10.30 1.775 1.752
YG8x101
0.917 5.71 10.47 1.862 1.862
YG8x141
0.948 5.88 10.38 1.801 1.785
Diet
C2
0.933a 6.01 10.33 1.746 1.738
YG62
0.862b 6.09 10.45 1.766 1.749
YG82
0.933a 5.79 10.42 1.831 1.823
P-Value 0.01
Time
10 days3
0.912 5.97 10.46 1.784 1.777
14 days3
0.906 5.96 10.34 1.778 1.764
Pooled SE a-b Means within a column with no common superscripts differ significantly by
Tukey method (p<0.05).
1 Data are means of 8 replicate pens initially containing 12 tom turkeys per pen.
2 Data are means of 16 replicate pens initially containing 12 tom turkeys per pen.
3 Data are means of 24 replicate pens initially containing 12 tom turkeys per pen.

36
Table 1.6.
Growth performance from 0 to 84 days of tom turkeys fed control
(C), 6% addition of YG (YG6), or 8% addition of YG (YG8) for
either 10 days (x10) or 14 days (x14).
Treatment
Livability
(%)
Body
Weight
(kg)
Feed
Intake
(kg) Feed/Gain
Adjusted
Feed/Gain
Cx101 0.938 9.58 18.86 2.010 1.985
Cx141
0.865 9.77 19.32 2.129 2.032
YG6x101
0.798 9.93 19.89 2.216 2.074
YG6x141
0.782 9.39 20.13 2.175 2.052
YG8x101
0.875 9.77 19.44 2.131 2.048
YG8x141
0.917 9.75 19.61 2.147 2.060
Diet
C2
0.901a 9.67 19.09 2.069 2.009
YG62
0.789b 9.93 20.01 2.195 2.063
YG82
0.896a 9.76 19.52 2.139 2.054
P-Value 0.002
Time
10 days3
0.870 9.76 19.40 2.119 2.035
14 days3
0.854 9.82 19.69 2.150 2.048
Pooled SE a-b Means within a column with no common superscripts differ significantly by
Tukey method (p<0.05).
1 Data are means of 8 replicate pens initially containing 12 tom turkeys per pen.
2 Data are means of 16 replicate pens initially containing 12 tom turkeys per pen
3 Data are means of 24 replicate pens initially containing 12 tom turkeys per pen.

37
Table 1.7.
Growth performance from 0 to 105 days of tom turkeys fed control
(C), 6% addition of YG (YG6), or 8% addition of YG (YG8) for
either 10 days (x10) or 14 days (x14).
Treatment
Livability
(%)
Body
Weight
(kg)
Feed
Intake
(kg) Feed/Gain
Adjusted
Feed/Gain
Cx101 0.855 13.86 31.46 2.570 2.343
Cx141
0.823 14.25 31.38 2.329 2.194
YG6x101
0.738 14.27 32.72 2.400 2.255
YG6x141
0.771 14.47 32.46 2.313 2.124
YG8x101
0.833 14.29 31.93 2.387 2.246
YG8x141
0.844 13.90 32.24 2.535 2.266
Diet
C2
0.839a 14.05 31.42 2.449 2.269
YG62
0.755b 14.37 32.59 2.357 2.189
YG82
0.839a 14.09 32.08 2.461 2.256
P-Value
0.015 Time
10 days3
0.809 14.14 32.04 2.452 2.281a
14 days3
0.813 14.21 32.02 2.393 2.195b
P-Value 0.047
Pooled SE a-b Means within a column with no common superscripts differ significantly by
Tukey method (p<0.05).
1 Data are means of 8 replicate pens initially containing 12 tom turkeys per pen.
2 Data are means of 16 replicate pens initially containing 12 tom turkeys per pen.
3 Data are means of 24 replicate pens initially containing 12 tom turkeys per pen.

38
Table 1.8.
Growth performance from 0 to 126 days of tom turkeys fed control
(C), 6% addition of YG (YG6), or 8% addition of YG (YG8) for
either 10 days (x10) or 14 days (x14).
Treatment
Livability
(%)
Body
Weight
(kg)
Feed
Intake
(kg) Feed/Gain
Adjusted
Feed/Gain
Cx101 0.792 17.69 44.26 2.785 2.364
Cx141
0.729 17.86 44.32 2.750 2.359
YG6x101
0.691 18.03 44.96 2.686 2.312
YG6x141
0.760 18.21 44.79 2.507 2.317
YG8x101
0.802 18.08 43.91 2.515 2.319
YG8x141
0.771 17.62 44.72 2.687 2.426
Diet
C2
0.760 17.78 43.79 2.767 2.361
YG62
0.726 18.12 44.87 2.596 2.314
YG82
0.787 17.85 44.32 2.601 2.373
Time
10 days3
0.762 17.93 44.38 2.662 2.332
14 days3
0.754 17.90 44.28 2.648 2.367
Pooled SE a-b Means within a column with no common superscripts differ significantly by
Tukey method (p<0.05).
1 Data are means of 8 replicate pens initially containing 12 tom turkeys per pen.
2 Data are means of 16 replicate pens initially containing 12 tom turkeys per pen.
3 Data are means of 24 replicate pens initially containing 12 tom turkeys per pen.

39
Table 1.9.
Growth performance from 0 to 140 days of tom turkeys fed control
(C), 6% addition of YG (YG6), or 8% addition of YG (YG8) for
either 10 days (x10) or 14 days (x14).
Treatment
Livability
(%)
Body
Weight
(kg)
Feed
Intake
(kg) Feed/Gain
Adjusted
Feed/Gain
Cx101 0.739 19.59 52.83 2.995 2.406
Cx141
0.677 19.90 51.04 2.793 2.256
YG6x101
0.643 20.45 53.07 2.864 2.299
YG6x141
0.708 20.11 52.95 2.756 2.495
YG8x101
0.750 20.06 51.40 2.797 2.450
YG8x141
0.719 19.90 52.93 2.902 2.424
Diet
C2
0.708 19.75 51.94 2.894 2.331
YG62
0.676 20.28 53.01 2.810 2.397
YG82
0.734 19.98 52.17 2.849 2.437
Time
10 days3
0.711 20.03 52.43 2.885 2.385
14 days3
0.701 19.97 52.31 2.817 2.392
Pooled SE a-b Means within a column with no common superscripts differ significantly by
Tukey method (p<0.05).
1 Data are means of 8 replicate pens initially containing 12 tom turkeys per pen.
2 Data are means of 16 replicate pens initially containing 12 tom turkeys per pen.
3 Data are means of 24 replicate pens initially containing 12 tom turkeys per pen.

40
Conclusions
No differences in performance were noted in the study. While it would appear that increased fat
levels should improve performance and feed efficiency, such was not the case in this study.

41
Literature Cited
Batal, A. B., and C. Parsons. 2002. Effects of age on nutrient digestibility in chicks fed different
diets. Poultry Science 81: 400-407.
Brue, R. N., and J. D. Latshaw. 1985. Energy utilization by the broiler chicken as affected by
various fats and fat levels. Poultry Science 64: 2119-2130.
Carew, L., R. Machemer, R. Sharp, and D. Foss. 1972. Fat absorption by the very young chick.
Poultry Science 51: 738-742.
CME, C. M. E. 2015. Agricultural Products Home.
http://www.cmegroup.com/trading/agricultural/ Accessed 3/10/16.
Cobb-Vantress. 2015. Broiler Performance and Nutrition Supplement. http://www.cobb-
vantress.com/docs/default-source/cobb-500-
guides/Cobb500_Broiler_Performance_And_Nutrition_Supplement.pdf.
Donohue, M., and D. Cunningham. 2009. Effects of grain and oilseed prices on the costs of US
poultry production. The Journal of Applied Poultry Research 18: 325-337.
Dozier, W., C. Gehring, A. Corzo, and H. Olanrewaju. 2011. Apparent metabolizable energy
needs of male and female broilers from 36 to 47 days of age. Poultry science 90: 804-
814.
Ebling, P. et al. 2015. Rice and soy protein isolate in pre-starter diets for broilers. Poultry science
94: 2744-2752.
Ferket, P. 2015. Nutrient Requirements of Poultry: Nutrition & Health Feedstuffs: Reference
Issue & Buyers Guide No. 87. p 9. Sarah Muirhead, Bloomington, MN.
Firman, J. D. 2006. Rendered products in poultry nutrition. ESSENTIAL RENDERING: 125.
Firman, J. D., A. Kamyab, and H. Leigh. 2008. Comparison of fat sources in rations of broilers
from hatch to market. Int. J. Poult. Sci 7: 1152-1155.
Fuller, H., and M. Rendon. 1979. Energetic efficiency of corn oil and poultry fat at different
levels in broiler diets. Poultry science 58: 1234-1238.
Havenstein, G., P. Ferket, and M. Qureshi. 2003a. Carcass composition and yield of 1957 versus
2001 broilers when fed representative 1957 and 2001 broiler diets. Poultry Science 82:
1509-1518.
Havenstein, G., P. Ferket, and M. Qureshi. 2003b. Growth, livability, and feed conversion of
1957 versus 2001 broilers when fed representative 1957 and 2001 broiler diets. Poultry
Science 82: 1500-1508.
Jiang, X., A. Groen, and E. Brascamp. 1998. Economic values in broiler breeding. Poultry
science 77: 934-943.
Krogdahl, A. 1985. Digestion and absorption of lipids in poultry. The Journal of nutrition 115:
675-685.
Lilburn, M. 1998. Practical aspects of early nutrition for poultry. The Journal of Applied Poultry
Research 7: 420-424.
Noy, Y., and D. Sklan. 1995. Digestion and absorption in the young chick. Poultry Science 74:
366-373.
Noy, Y., and D. Sklan. 2001. Yolk and exogenous feed utilization in the posthatch chick. Poultry
Science 80: 1490-1495.
NRC. 1994. Nutrient Requirements of Poultry. 9th rev. ed. National Academy Press, Washington
D.C.

42
Renner, R., and F. Hill. 1961. Utilization of fatty acids by the chicken. Journal of Nutrition 74:
259-264.
Saleh, E., S. Watkins, A. Waldroup, and P. Waldroup. 2004a. Consideration for dietary nutrient
density and energy feeding programs for growing large male broiler chickens for further
processing. Int. J. Poult. Sci 3: 11-16.
Saleh, E., S. Watkins, A. Waldroup, and P. Waldroup. 2004b. Effects of dietary nutrient density
on performance and carcass quality of male broilers grown for further processing. Int. J.
Poult. Sci 3: 1-10.
Sell, J. L., A. Krogdahl, and N. Hanyu. 1986. Influence of age on utilization of supplemental fats
by young turkeys. Poultry Science 65: 546-554.
Sell, J. L., and W. J. Owings. 1981. Supplemental fat and metabolizable energy-to-nutrient ratios
for growing turkeys. Poultry Science 60: 2293-2305.
Sklan, D. 2001. Development of the digestive tract of poultry. World's Poultry Science Journal
57: 415-428.
Tancharoenrat, P., and V. Ravindran. 2014. Influence of tallow and calcium concentrations on
the performance and energy and nutrient utilization in broiler starters. Poultry science 93:
1453-1462.
Tancharoenrat, P., V. Ravindran, F. Zaefarian, and G. Ravindran. 2013. Influence of age on the
apparent metabolisable energy and total tract apparent fat digestibility of different fat
sources for broiler chickens. Animal Feed Science and Technology 186: 186-192.
Thomas, D., V. Ravindran, and G. Ravindran. 2008. Nutrient digestibility and energy utilisation
of diets based on wheat, sorghum or maize by the newly hatched broiler chick. British
poultry science 49: 429-435.
Willems, O., S. Miller, and B. Wood. 2013. Aspects of selection for feed efficiency in meat
producing poultry. World's Poultry Science Journal 69: 77-88.
Wood, B. 2009. Calculating economic values for turkeys using a deterministic production model.
Canadian journal of animal science 89: 201-213.

43
0-3 wks 6% Fat

44
0-3 weeks 8% Fat

45
0-3 weeks control

46
3-6 weeks

47
6-9 weeks

48
9-12 weeks

49
12-15 weeks

50
15-18 weeks

51
18-20 weeks

52
Yellow grease
Proximates CP Moisture Fat Fiber Ash