final report - eng.usm.my · this report highlights results of ... 3.3.12 conclusion . 3-26 :...
TRANSCRIPT

COLLABORATIVE CONSULTATION PROJECT
FINAL REPORT THE PROPOSED DESIGN AND TENDERING FOR A
SAFE CLOSURE OF MUASSIM MINA LANDFILL- PHASE 1
Department of Environmental Sciences, King Abdulaziz University (جامعة الملك عبدالعزيز),
Kingdom of Saudi Arabia And
Research Cluster on Waste Management, c/o School of Civil Engineering,
Universiti Sains Malaysia, Pulau Pinang Tel: +604 599 6200 Fax: +604 594 1009
APRIL 2011

SUSTAINABLE CLOSURE DEVELOPMENT PLANNING AND DESIGN FOR THE MUASSIM LANDFILL
i | M U A S S I M L A N D F I L L 2 0 1 1
EXECUTIVE SUMMARY
This report provides detailed site investigations, proposed plans and detailed design of
safety closure of Muassim landfill. Muassim landfill is located near Wadi Add and had
been operated since 1406 to 1423 Hijrah (1985 – 2002) for about 17 years. The landfill
has been ceased in operation after achieving its maximum capacity. However, it has not
been fully restored technically, hence, pollution to surrounding environment may be a
subject of concern, especially to groundwater and air. This report highlights results of
monitoring and investigation works done to remediate the site. This is a collaborative
project involving teams and experts from King Abdul Aziz University (KAU), Jeddah led
by Assoc. Prof. Dr. Asad Siraj Omar Abu-Rizaiza, and Research Cluster on Waste
Management, Universiti Sains Malaysia (USM), led by Prof. Dr. Hamidi Abdul Aziz. A
total of 3 technical visits were conducted during the study period, i.e., 19-26 June 2008,
22 January-05 February 2010, and 21 February-06 March 2011. Surveying works were
conducted to establish the exact area and topography of the site. Hydrogeological data
was established from the existing literature which was used in the design of the drainage
system. A geophysical studies were carried out with 28 lines covering the project site.
The result of resistivity analysis indicated the sub-strata layers including the levels of
waste, leachate, groundwater, alluvial strata and bedrock. This was further confirmed by
erecting a few boreholes which provided soil profiling information, the depth of waste
volume and groundwater level. Leachate was sampled from the existing and newly
constructed boreholes to establish information on potential pollution levels to
groundwater. Landfill gas was sampled at existing ventilation pipes and subsequently
mapping of gas concentrations were made. All the data were analysed and a proposal is
made for the safe closure of this site with detailed design for each. However, a few
constraints were encountered during this study, which caused unavailability of some
required design data. This is particularly critical in designing a leachate barrier system for
mitigating sub-strata leachate movement. As site investigation work was not able to be
made due to accessability problem, as agreed with KAU counterpart, the design was
based on the existing geophyisical information. From the field survey data, the estimated
surface area is 0.8 km2. Borehole readings indicated that the thickness of waste was in
the range of 10 m to 20 m thick throughout the area and highly variable. Since the
underlying bedrock topography of valley is also undulating, the variation of waste
thickness could be more severe than stated. The average waste volume is estimated to
be 12,150,000 cubic meter. The bedrock is expected to deepen as one moves to the NW

SUSTAINABLE CLOSURE DEVELOPMENT PLANNING AND DESIGN FOR THE MUASSIM LANDFILL
ii | M U A S S I M L A N D F I L L 2 0 1 1
direction, therefore, the leachate barrierr is proposed at the outmost downstream. For
east site, the water level was recorded as 18 feet (5.5 m) below ground surface. Water
sample collected from this borehole had indicated contamination by leachate. As for the
safe closure, the following approaches are proposed:
1) Surface runoff will be diverted out of the landfill site to prevent further infiltration
and formation of leachate. Consequently, the perimeter drainage system is
proposed consisting of 3 sub-catchments which are divided based on the contour
levels and the direction of flow to the lowest point.
2) A leachate barrier is proposed at the outmost narrowest cross section
downstream of the main landfill. Based on initial water quality study, it was
observed that leachate flow from within landfill area to another area downstream,
probably consisting of a resourceful wadi. Therefore, it is essential to construct
the barrier in order to limit downward migration of leachate and to confine it
behind wall, while being pumped away for disposal.
3) In order to minimize routine maintenance and as agreed with KAU counterpart,
leachate will be collected from the proposed four pumping wells. It will be pumped
out at certain interval for off-site treatment at suitable industrial waste water
treatment plant which will be determined later.
4) The gas vents will be grouped accordingly and will be connected to a collection
system. Existing PVC gas vents will be replaced with HDPE pipe. Broken and
unusable vents will also be replaced. The gas will be conveyed to the flaring
facilities via vacuum system.
5) In the final capping, slope design considerations should be taken into account
when planning the cover at Muassim to protect against infiltration and to control
gas emission. It is proposed that the Geosynthetic Clay Liner (GCL) is utilized as
final cover. The choice of GCL as the impermeable barrier in Muassim is
considered cost effective.

SUSTAINABLE CLOSURE DEVELOPMENT PLANNING AND DESIGN FOR THE MUASSIM LANDFILL
iii | M U A S S I M L A N D F I L L 2 0 1 1
SECTION TABLE OF CONTENTS PAGE NO EXECUTIVE SUMMARY i-ii TABLE OF CONTENTS iii-vi LIST OF FIGURES vii-viii LIST OF TABLES ix PART A :PROJECT INTRODUCTION SECTION 1 1.0 INTRODUCTION 1-1 1.1 PROJECT BACKGROUND 1-2 1.2 SITE DESCRIPTION 1-2 1.3 PROJECT TEAM 1-3 1.4 OBJECTIVES 1-3 1.5 DURATION AND WORK PROGRESS 1-5 1.6 REPORT PRESENTATION OUTLINE 1-7 PART B : SITE INVESTIGATION RESULTS SECTION 2 2.0 MAPPING OF MUASSIM LANDFILL 2-1 2.1 BACKGROUND 2-2 2.2 METHODOLOGY 2-2 2.3 PROBLEMS RELATED WITH SURVEYING WORKS 2-3 2.4 RESULTS 2-3 2.5 SUPPORTING DRAWINGS 2-11
SECTION 3 3.0 GEOLOGY, GEOPHYSICAL AND GEOTECHNICAL INVESTIGATION 3-1
3.1 INTRODUCTION 3-2 3.2 ENGINEERING GEOLOGY AND GEOTECHNICAL STUDY 3-3 3.2.1 Geological Mapping and Structural Analyses 3-3
3.2.2 Boring results from drillings within waste dump area of landfill 3-4
3.2.3 Boring results from drillings in wadi off eastern edge of landfill 3-7
3.2.4 Earth Resistivity (ERT) subsurface imaging survey 3-12
3.2.5 Cancellation of an intended boring work in western (NW) edge of landfill 3-15
3.3 ANALYSES OF CAPPING MATERIAL 3-15 3.3.1 Outline of the study 3-15 3.3.2 Material and test setup of a vertical infiltration test 3-16 3.3.3 Rainfall 3-18 3.3.4 Further test setup 3-20 3.3.5 Results and discussions 3-20
3.3.6 Verification of laboratory results by vertical infiltration tests at site
3-22
3.3.7 Consequence of considering total catchment area 3-25

SUSTAINABLE CLOSURE DEVELOPMENT PLANNING AND DESIGN FOR THE MUASSIM LANDFILL
iv | M U A S S I M L A N D F I L L 2 0 1 1
3.3.8 Notion of a low permeability barrier and top cover to support vegetation 3-25
3.3.9 Notion of capillary barrier 3-26 3.3.10 Effect of repeated inundation 3-26 3.3.11 Results of a further test in Malaysian laboratory 3-26 3.3.12 Conclusion 3-26 SECTION 4 4.0 BURIED WASTE AND VOLUME 4-1 4.1 BURIED WASTE 4-2 4.2 REFUSAL WASTE VOLUME 4-2 4.2.1 Results 4-4 SECTION 5 5.0 HYDROLOGY STUDY 5-1 5.1 INTRODUCTION 5-2 5.2 RAINFALL 5-2 SECTION 6 6.0 GROUNDWATER AND LEACHATE QUALITY 6-1
6.1 LEACHATE SAMPLING, ANALYSES AND TREATMENT DESIGN 6-2
6.2 GROUNDWATER AND LEACHATE QUALITY 6-3 6.3 CONSTRUCTION OF NEW MONITORING WELL 6-5 SECTION 7 7.0 LANDFILL GAS ANALYSES 7-1 7.1 LANDFILL GAS SAMPLING AND ANALYSES DESIGN 7-2 7.2 LANDFILL GAS MONITORING AND QUALITY 7-2 PART C : PROPOSED TECHNICAL DESIGNS SECTION 8 8.0. LANDFILL CLOSURE PROGRAM 8-1 8.1 PROPOSAL FOR FINAL LANDFILL CAP 8-2 8.1.1 Design considerations of cover/capping materials 8-2 8.1.2 Settlement 8-4 8.1.3 Geo-synthetic clay liner (GCL) for cap 8-4 8.1.4 Erosion Protection 8-5 8.1.5 Concluding remarks and final design proposal 8-5 8.2 GAS COLLECTION AND MANAGEMENT SYSTEM 8-7 SECTION 9 9.0 LEACHATE CONTAINMENT, AND COLLECTION 9-1 9.1 PROPOSAL FOR LEACHATE BARRIER 9-2 9.1.1 Concept 9-2 9.1.2 Design and construction 9-4 9.2 PROPOSAL FOR LEACHATE PUMPING WELLS 9-6 9.2.1 Concept 9-6 9.2.2 Construction of a pumping well 9-8 9.2.3 Proposed locations of leachate pumping wells 9-8 9.2.4 Leachate collection and management system 9-9 SECTION 10 10.0 LANDFILL INFRASTRUCTURE SYSTEM 10-1 10.1 DRAINAGE SYSTEM 10-2 10.1.1 Introduction 10-2
SUSTAINABLE CLOSURE DEVELOPMENT PLANNING AND DESIGN FOR THE MUASSIM LANDFILL
v | M U A S S I M L A N D F I L L 2 0 1 1
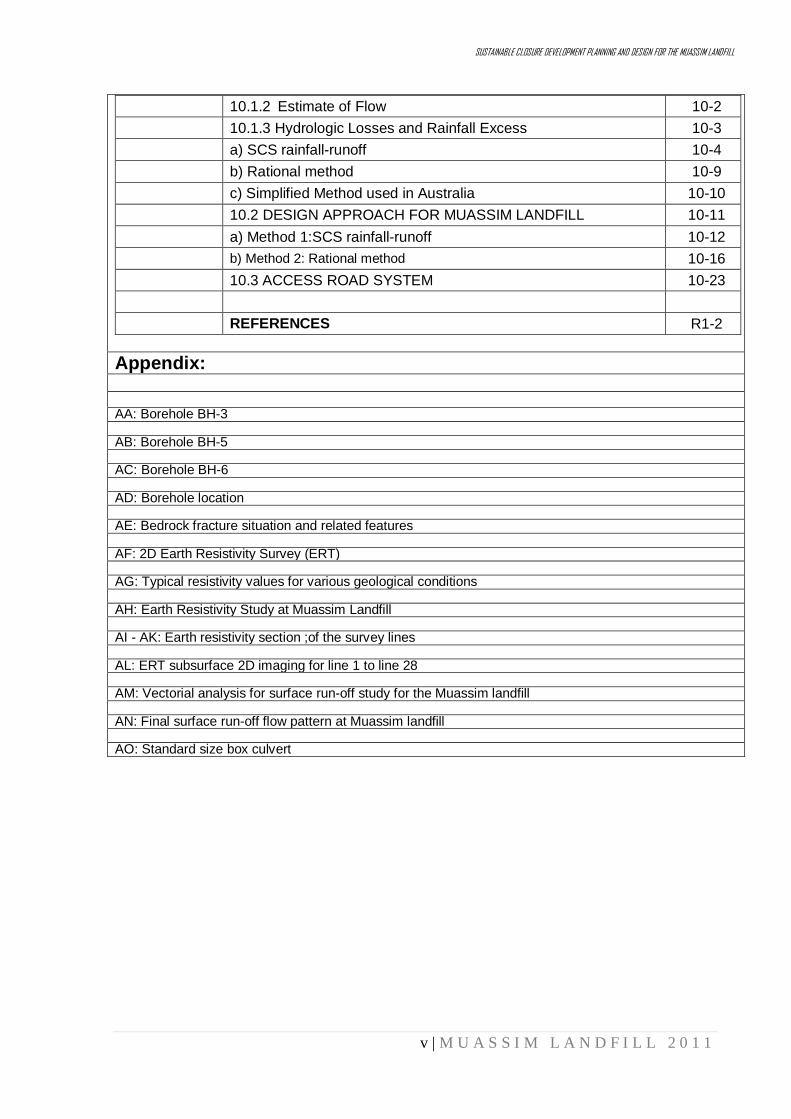
10.1.2 Estimate of Flow 10-2 10.1.3 Hydrologic Losses and Rainfall Excess 10-3 a) SCS rainfall-runoff 10-4 b) Rational method 10-9 c) Simplified Method used in Australia 10-10 10.2 DESIGN APPROACH FOR MUASSIM LANDFILL 10-11 a) Method 1:SCS rainfall-runoff 10-12 b) Method 2: Rational method 10-16 10.3 ACCESS ROAD SYSTEM 10-23 REFERENCES R1-2
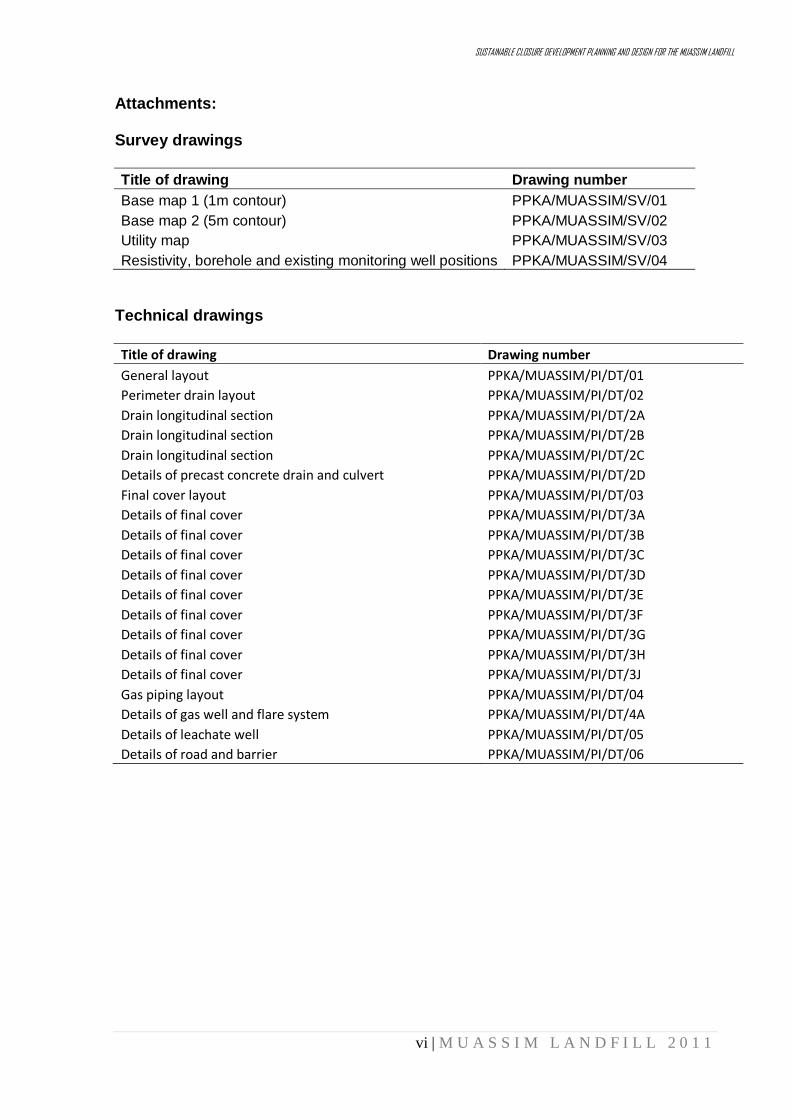
Appendix: AA: Borehole BH-3 AB: Borehole BH-5 AC: Borehole BH-6 AD: Borehole location AE: Bedrock fracture situation and related features AF: 2D Earth Resistivity Survey (ERT) AG: Typical resistivity values for various geological conditions AH: Earth Resistivity Study at Muassim Landfill AI - AK: Earth resistivity section ;of the survey lines AL: ERT subsurface 2D imaging for line 1 to line 28 AM: Vectorial analysis for surface run-off study for the Muassim landfill AN: Final surface run-off flow pattern at Muassim landfill AO: Standard size box culvert
SUSTAINABLE CLOSURE DEVELOPMENT PLANNING AND DESIGN FOR THE MUASSIM LANDFILL
vi | M U A S S I M L A N D F I L L 2 0 1 1
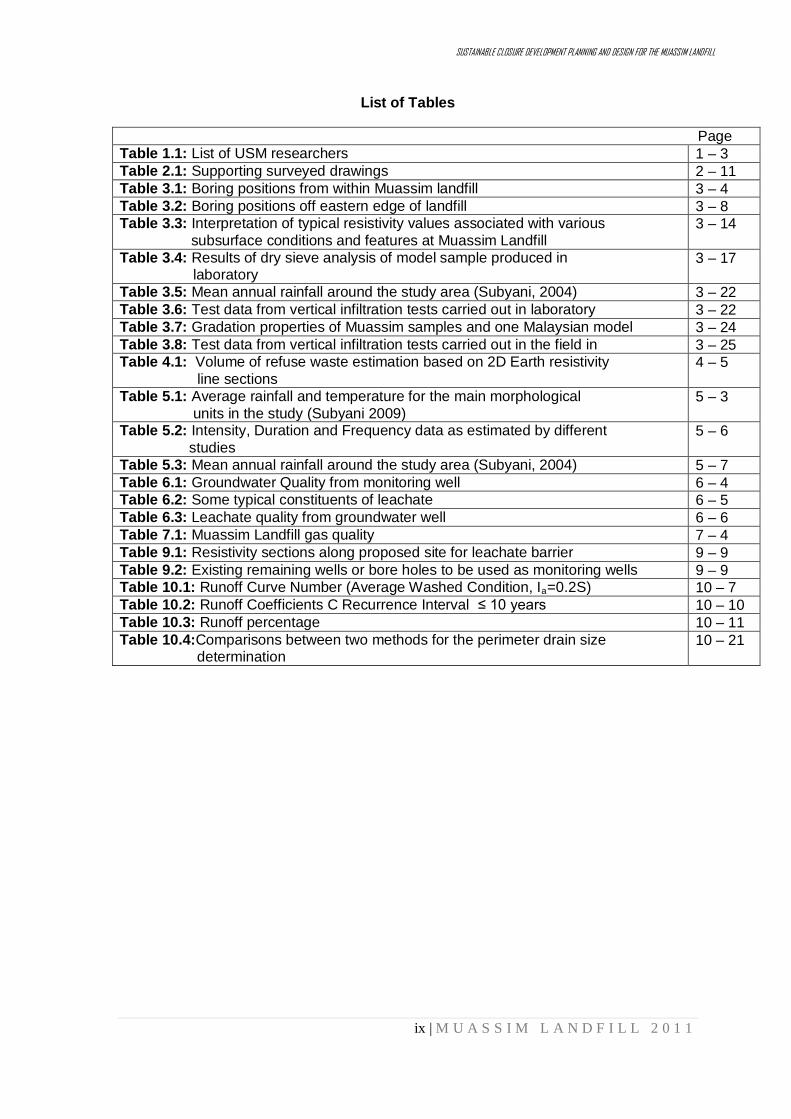
Attachments: Survey drawings Title of drawing Drawing number Base map 1 (1m contour) PPKA/MUASSIM/SV/01 Base map 2 (5m contour) PPKA/MUASSIM/SV/02 Utility map PPKA/MUASSIM/SV/03 Resistivity, borehole and existing monitoring well positions PPKA/MUASSIM/SV/04
Technical drawings Title of drawing Drawing number General layout PPKA/MUASSIM/PI/DT/01 Perimeter drain layout PPKA/MUASSIM/PI/DT/02 Drain longitudinal section PPKA/MUASSIM/PI/DT/2A Drain longitudinal section PPKA/MUASSIM/PI/DT/2B Drain longitudinal section PPKA/MUASSIM/PI/DT/2C Details of precast concrete drain and culvert PPKA/MUASSIM/PI/DT/2D Final cover layout PPKA/MUASSIM/PI/DT/03 Details of final cover PPKA/MUASSIM/PI/DT/3A Details of final cover PPKA/MUASSIM/PI/DT/3B Details of final cover PPKA/MUASSIM/PI/DT/3C Details of final cover PPKA/MUASSIM/PI/DT/3D Details of final cover PPKA/MUASSIM/PI/DT/3E Details of final cover PPKA/MUASSIM/PI/DT/3F Details of final cover PPKA/MUASSIM/PI/DT/3G Details of final cover PPKA/MUASSIM/PI/DT/3H Details of final cover PPKA/MUASSIM/PI/DT/3J Gas piping layout PPKA/MUASSIM/PI/DT/04 Details of gas well and flare system PPKA/MUASSIM/PI/DT/4A Details of leachate well PPKA/MUASSIM/PI/DT/05 Details of road and barrier PPKA/MUASSIM/PI/DT/06

SUSTAINABLE CLOSURE DEVELOPMENT PLANNING AND DESIGN FOR THE MUASSIM LANDFILL
vii | M U A S S I M L A N D F I L L 2 0 1 1
List of Figures Page
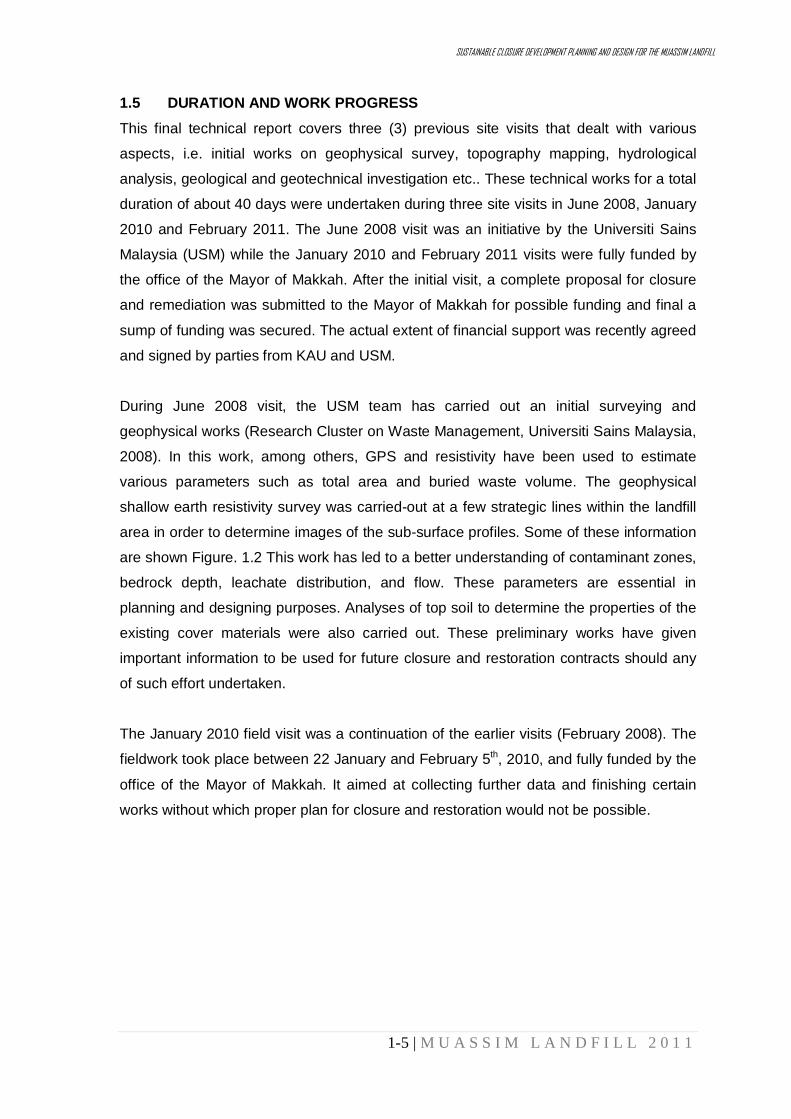
Figure 1.1: Topographical map of Muassim landfill site (the area is indicated in green)
1 – 6
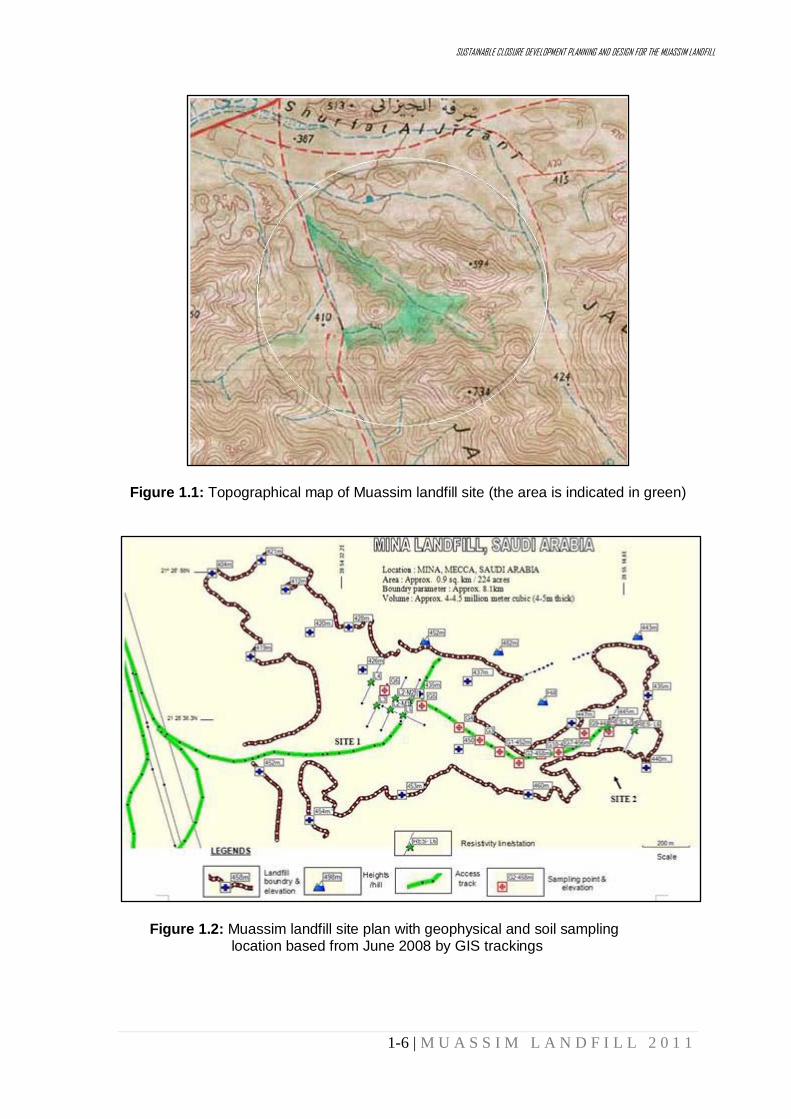
Figure 1.2: The Muassim landfill site plan with geophysical and soil sampling location based from June 2008 by GIS trackings
1 – 6
Figure 2.1: Surveying Traverse 2 – 5 Figure 2.2: Integration of USM surveying works with Saudi Topographical map 2 – 6 Figure 2.3: Dividing lines for drainage system 2 – 7 Figure 2.4: Sub-drainage at the entrance of landfill 2 – 8 Figure 2.5: Sub-drainage to the East 2 – 9 Figure 2.6: Expected inundated area 2 – 10 Figure 2.7: Key base map of the Muassim landfill with major features 2 – 11 Figure 2.8: Contour map of the Muassim landfill with surrounding hilly area 2 – 12 Figure 2.9: Cross-section view of the Muassim landfill along A-to-B (SW-NE direction)
2 – 12
Figure 2.10: Cross-section view of the Muassim landfill along C-to-D (SW-NE direction
2 – 13
Figure 3.1: Profile of boreholes installed in waste dump area 3 – 5 Figure 3.2: Rose Diagram showing typical fracture system of the granite joint system and pinkish vein orientation patterns in the main area of Muassim landfill
3 – 7
Figure 3.3: Locations of BH11 and BH12 in the wadi, off eastern edge of Muassim landfill
3 – 9
Figure 3.4: Interpreted profile at BH11, off eastern edge of Muassim landfill 3 – 10 Figure 3.5: Interpreted profile at BH12, Muassim landfill, Eastern Edge 3 – 11 Figure 3.6: Illustration of leachate breach into the wadi off eastern edge of Muassim Landfill
3 – 12
Figure 3.7: Typical sections of 2D subsurface ERT imaging tomography at Muassim landfill. Line 12(L8) with BH-6 (top) and resistivity characteristics dividing waste refuse with bedrock as indicated in Line 14(L19) and Line18 (L25) (bottom)
3 – 14
Figure 3.8: Earth resistivity cross section of Line 1 on western (NW) constriction of the landfill
3 – 15
Figure 3.9: Grain size distribution of model sample produced in Malaysian laboratory
3 – 17
Figure 3.10: Grain size distribution of representative cover material from Muassim
3 – 17
Figure 3.11: Schematic diagram of a vertical infiltration apparatus 3 – 18 Figure 3.12: Annual rainfall distribution over study area (Subyani, 2004) 3 – 19 Figure 3.13: Soil thickness versus breakthrough time 3 – 21 Figure 3.14: Amount of water collected for various sample thicknesses 3 – 21 Figure 4.1: Borehole correlation that show variability in waste and dept to bedrock thickness at Muassim landfill
4 – 3
Figure 4.2: Illustrations that show the examples of total volume estimation via Trapezoidal principle with reference to 2D ERT sections
4 – 6
Figure 4.3: Earth resistivity area lines used in the waste volume estimation using Trapezoidal principle and volumes from areas noted A to F
4 – 7
Figure 5.1: Map showing the isohyetal lines of annual rainfall (Subyani, 2009) 5 – 3 Figure 5.2: Annual maximum observed of 24-h rainfall (Subyani, 2009) 5 – 4 Figure 5.3: Intensity, Duration and Frequency curve for Jeddah (After Saudi Consult, 2003)
5 – 5

SUSTAINABLE CLOSURE DEVELOPMENT PLANNING AND DESIGN FOR THE MUASSIM LANDFILL
viii | M U A S S I M L A N D F I L L 2 0 1 1
Page
Figure 6.1: Location of existing monitoring wells (yellow) and initially proposed monitoring wells (red star)
6 – 3
Figure 6.2: Location of boreholes constructed during investigation (blue colour) 6 – 7 Figure 7.1: Landfill gas analysis activity 7 – 3 Figure 7.2: PVC gas Collection system 7 – 3 Figure 7.3: Detailed survey PVC gas vent points 7 – 5 Figure 7.4: Contour of CH4 7 – 6 concentration level in Muassim landfill Figure 8.1: A recommended design for final cover (after Oweis and Khera, 1998)
8 – 3
Figure 8.2: Photo of geo-synthetic liner 8 – 5 Figure 8.3: Final cap proposal for Muassim landfill 8 – 6 Figure 9.1: Location of proposed leachate barrier 9 – 2 Figure 9.2: Resistivity section along line along proposed site for leachate barrier (Line 1(L23))
9 – 3
Figure 9.3: Conceptual picture of leachate barrier and surrounding items 9 – 4 Figure 9.4: Conceptual picture of leachate barrier during placement 9 – 5 Figure 9.5: Cross sectional view from landfill of site barrier 9 – 5 Figure 9.6: Line of estimated leachate plume along bedrock depression and proposed positions of leachate pumping wells
9 – 7
Figure 9.7: Determining best (approximate) positions for leachate pumping wells
9 – 7
Figure 9.8: A typical pumping well for leachate proposed for Mina landfill 9 – 8 Figure 10.1: Variables in the SCS method of rainfall abstractions: Ia = initial abstractions, Pe = rainfall excess, Fa
10 – 5 = continuing abstraction, and
P =total rainfall Figure 10.2: Solution of the SCS runoff equations (Mays, 2001) 10 – 6 Figure 10.3: Catchment area 10 – 22 Figure 10.4: Proposed cross section of access road 10 – 24 Figure 10.5: Proposed layout of access road 10 – 25
SUSTAINABLE CLOSURE DEVELOPMENT PLANNING AND DESIGN FOR THE MUASSIM LANDFILL
ix | M U A S S I M L A N D F I L L 2 0 1 1
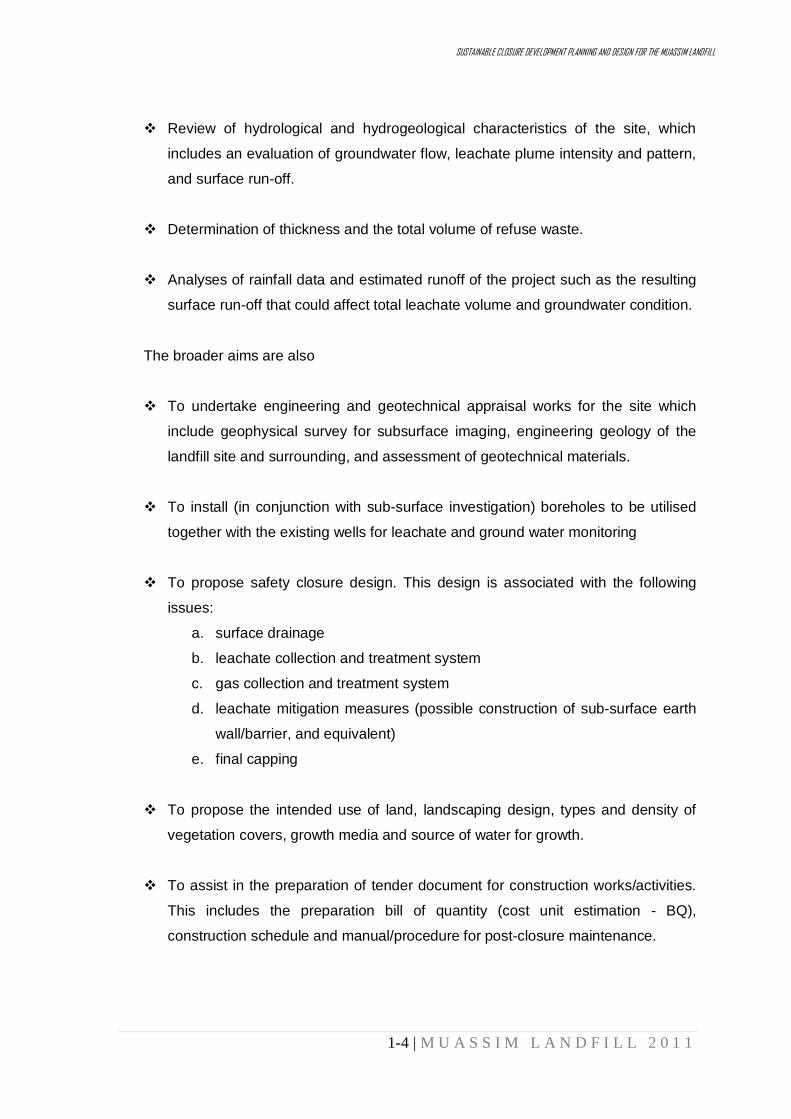
List of Tables
Page Table 1.1: List of USM researchers 1 – 3 Table 2.1: Supporting surveyed drawings 2 – 11 Table 3.1: Boring positions from within Muassim landfill 3 – 4 Table 3.2: Boring positions off eastern edge of landfill 3 – 8 Table 3.3: Interpretation of typical resistivity values associated with various subsurface conditions and features at Muassim Landfill
3 – 14
Table 3.4: Results of dry sieve analysis of model sample produced in laboratory
3 – 17
Table 3.5: Mean annual rainfall around the study area (Subyani, 2004) 3 – 22 Table 3.6: Test data from vertical infiltration tests carried out in laboratory 3 – 22 Table 3.7: Gradation properties of Muassim samples and one Malaysian model 3 – 24 Table 3.8: Test data from vertical infiltration tests carried out in the field in 3 – 25 Table 4.1: Volume of refuse waste estimation based on 2D Earth resistivity line sections
4 – 5
Table 5.1: Average rainfall and temperature for the main morphological units in the study (Subyani 2009)
5 – 3
Table 5.2: Intensity, Duration and Frequency data as estimated by different studies
5 – 6
Table 5.3: Mean annual rainfall around the study area (Subyani, 2004) 5 – 7 Table 6.1: Groundwater Quality from monitoring well 6 – 4 Table 6.2: Some typical constituents of leachate 6 – 5 Table 6.3: Leachate quality from groundwater well 6 – 6 Table 7.1: Muassim Landfill gas quality 7 – 4 Table 9.1: Resistivity sections along proposed site for leachate barrier 9 – 9 Table 9.2: Existing remaining wells or bore holes to be used as monitoring wells 9 – 9 Table 10.1: Runoff Curve Number (Average Washed Condition, Ia 10 – 7 =0.2S) Table 10.2: Runoff Coefficients C Recurrence Interval ≤ 10 years 10 – 10 Table 10.3: Runoff percentage 10 – 11 Table 10.4:Comparisons between two methods for the perimeter drain size determination
10 – 21

SUSTAINABLE CLOSURE DEVELOPMENT PLANNING AND DESIGN FOR THE MUASSIM LANDFILL
1-1 | M U A S S I M L A N D F I L L 2 0 1 1
PART A: SECTION 1
INTRODUCTION

SUSTAINABLE CLOSURE DEVELOPMENT PLANNING AND DESIGN FOR THE MUASSIM LANDFILL
1-2 | M U A S S I M L A N D F I L L 2 0 1 1
1.1 PROJECT BACKGROUND Muassim Landfill is a closed landfill, located outside Muassim, near Makkah, in Saudi
Arabia. It was operated between 1406 to 1423 Hijrah (1985 – 2002) for about 17 years,
and then closed after achieving maximum capacity. Now is 1432 Hijrah, therefore the
landfill has ceased operation for about 9 years. The immediate aim of this project is to
provide consultancy for safety closure, restoration and associated designs and
construction of the landfill area.
This report presents an account of site investigation result and subsequently followed by
the proposals of technical designs and other measures for Muassim Landfill. An
appropriate site investigation was planned and carried-out to ensure a safety closure of
the abandoned landfill. In this report, planning and strategies of safety closure plans,
specifications and construction options considered for the site are also discussed.
Among the matters considered are the surrounding environment, the existing
maintenance facilities and practices, and the intended land use after closure.
Technical site investigations, mapping and the required analyses have been carried-out
and completed (19-26 June 2008, 22 January-05 February 2010, and 21 February-06
March 2011).These essential information have been used as a basis for technical
planning and specification for the final safety closure designs and other proposals. The
proposed planning and designs are based on the best available data/information.
Constrains beyond consultants’ jurisdiction were also dealt with in the work. Sensitive
matters were treated with strict confidentially.
1.2 SITE DESCRIPTION Muassim landfill is located (21°26'38.94"N, 39°54'40.30"E) about 8 km to the north-
northeast (N-NE) of Al-Haram Mosque, Makkah holy city or just about 3-4 km to the NE
of Jamrah location. A topographical map of the area is given in Figure 1.1. In the past
this disposal site was the main solid waste disposal site that served areas of Makkah,
Muassim, Arafat and other districts under the administration of Makkah City Council. It
was operated between 1406 and 1423 Hijrah (1985-2002). The landfill has since been
closed and there are about 10 layers of waste dumped at this site, as highlighted by the
local authority
The initial study conducted by Saudi ASMA Environmental Solutions (SAES) estimated
that the landfill covers an area of about 224 acres or 9,000,000 sq. meters (0.9 sq. km)

SUSTAINABLE CLOSURE DEVELOPMENT PLANNING AND DESIGN FOR THE MUASSIM LANDFILL
1-3 | M U A S S I M L A N D F I L L 2 0 1 1
(SAES). The perimeter was measured at about 8.1 km long. The landfill area is
surrounded by a steep rocky rugged terrain, with estimated elevation of 400m to 600m
above sea level. The dumped waste bodies occupy two floors of an elongated, U-shape
valley, aligned in NW-SE trend as shown in Figure 1.1.
1.3 PROJECT TEAM This project is a collaborative work, involving experts and teams from King Abdulaziz
University (KAU) Jeddah and Universiti Sains Malaysia (USM). The main researcher
from KAU is Associate Professor Dr. Asad Siraj Omar Abu-Rizaiza. On the Malaysian
side, the main personnel is Professor Dr. Hamidi Abdul Aziz, who is also heading the
Research Cluster on Waste Management in USM. The detail list of USM Team is shown
in Table 1.1
Table 1.1: List of USM researchers and their specialisation
NO. RESEARCHER SPECIALISATION 1 Hamidi Abdul Aziz, Prof. Environmental engineer and Project leader 2 Mohd. Nordin Adlan, Assoc. Prof. Civil engineer 3 Ismail Abustan, Assoc. Prof. Civil engineer and hydrologist 4 Mohd. Suffian Yusoff, Dr. Environmental scientist 5 Mohamad Razip Selamat, Assoc. Prof. Geotechnical engineer 6 Mohd. Nawawi Mohd Nordin, Assoc. Prof. Geophysicist 7 Kamar Shah Ariffin, Assoc. Prof. Geologist, Geophysicist 8 Rosli Saad, Dr. Geophysicist 9 Zulkifli Hashim Assistant engineer 10 Mohamad Anuar Kamaruddin Supporting staff
1.4 OBJECTIVES The main objectives of the site investigation are to acquire sufficient and essential
information of the Muassim landfill which are required as key points of concern for a safe
closure planning, design, specification, construction, restoration and monitoring.
The key items concerned in order to design a safety closure plan are as follows:
Determination of general environment and land use of the site.
Determination of detailed area topography survey mapping and preparation of
site map to provide comprehensive base map to support appraisal, planning and
design works.
SUSTAINABLE CLOSURE DEVELOPMENT PLANNING AND DESIGN FOR THE MUASSIM LANDFILL
1-4 | M U A S S I M L A N D F I L L 2 0 1 1
Review of hydrological and hydrogeological characteristics of the site, which
includes an evaluation of groundwater flow, leachate plume intensity and pattern,
and surface run-off.
Determination of thickness and the total volume of refuse waste.
Analyses of rainfall data and estimated runoff of the project such as the resulting
surface run-off that could affect total leachate volume and groundwater condition.
The broader aims are also
To undertake engineering and geotechnical appraisal works for the site which
include geophysical survey for subsurface imaging, engineering geology of the
landfill site and surrounding, and assessment of geotechnical materials.
To install (in conjunction with sub-surface investigation) boreholes to be utilised
together with the existing wells for leachate and ground water monitoring
To propose safety closure design. This design is associated with the following
issues:
a. surface drainage
b. leachate collection and treatment system
c. gas collection and treatment system
d. leachate mitigation measures (possible construction of sub-surface earth
wall/barrier, and equivalent)
e. final capping
To propose the intended use of land, landscaping design, types and density of
vegetation covers, growth media and source of water for growth.
To assist in the preparation of tender document for construction works/activities.
This includes the preparation bill of quantity (cost unit estimation - BQ),
construction schedule and manual/procedure for post-closure maintenance.
SUSTAINABLE CLOSURE DEVELOPMENT PLANNING AND DESIGN FOR THE MUASSIM LANDFILL
1-5 | M U A S S I M L A N D F I L L 2 0 1 1
1.5 DURATION AND WORK PROGRESS This final technical report covers three (3) previous site visits that dealt with various
aspects, i.e. initial works on geophysical survey, topography mapping, hydrological
analysis, geological and geotechnical investigation etc.. These technical works for a total
duration of about 40 days were undertaken during three site visits in June 2008, January
2010 and February 2011. The June 2008 visit was an initiative by the Universiti Sains
Malaysia (USM) while the January 2010 and February 2011 visits were fully funded by
the office of the Mayor of Makkah. After the initial visit, a complete proposal for closure
and remediation was submitted to the Mayor of Makkah for possible funding and final a
sump of funding was secured. The actual extent of financial support was recently agreed
and signed by parties from KAU and USM.
During June 2008 visit, the USM team has carried out an initial surveying and
geophysical works (Research Cluster on Waste Management, Universiti Sains Malaysia,
2008). In this work, among others, GPS and resistivity have been used to estimate
various parameters such as total area and buried waste volume. The geophysical
shallow earth resistivity survey was carried-out at a few strategic lines within the landfill
area in order to determine images of the sub-surface profiles. Some of these information
are shown Figure. 1.2 This work has led to a better understanding of contaminant zones,
bedrock depth, leachate distribution, and flow. These parameters are essential in
planning and designing purposes. Analyses of top soil to determine the properties of the
existing cover materials were also carried out. These preliminary works have given
important information to be used for future closure and restoration contracts should any
of such effort undertaken.
The January 2010 field visit was a continuation of the earlier visits (February 2008). The
fieldwork took place between 22 January and February 5th, 2010, and fully funded by the
office of the Mayor of Makkah. It aimed at collecting further data and finishing certain
works without which proper plan for closure and restoration would not be possible.
SUSTAINABLE CLOSURE DEVELOPMENT PLANNING AND DESIGN FOR THE MUASSIM LANDFILL
1-6 | M U A S S I M L A N D F I L L 2 0 1 1
Figure 1.1: Topographical map of Muassim landfill site (the area is indicated in green)
Figure 1.2: Muassim landfill site plan with geophysical and soil sampling location based from June 2008 by GIS trackings

SUSTAINABLE CLOSURE DEVELOPMENT PLANNING AND DESIGN FOR THE MUASSIM LANDFILL
1-7 | M U A S S I M L A N D F I L L 2 0 1 1
1.6 REPORT PRESENTATION OUTLINE Topics of discussion in this report are divided into three (3) main parts which are Part A,
B and C. Each part consists of several sections.
Part A highlights the background, objectives and update on work progress of the project.
Part B discusses the results of mapping works, site investigations and other preliminary
data analysis from available resources, which become focal points and important input
for the safe and economic design. Meanwhile, Part C
outlines the proposed measures
and technical designs adopted for the project. In brief; the contents of those parts are as
follows:
Part B presents the site investigation and mapping results. Part B consists of Section 2
(surveying works and map preparations, area size and recognition of the landfill site into
zones based on topography and surface features), Section 3 (Geology, Geophysical and
geotechnical investigation), Section 4 (Buried waste), Section 5 (Hydrology study),
Section 6 (Ground water and Leachate quality), and Section 7
(Landfill gas analysis).
PART CThis is the critical part that highlights and discusses matters concerning measures and
technical designs proposed for the landfill safety closure project. This part consist of
: PROPOSED TECHNICAL DESIGNS
Section 8 (Landfill closure program), Section 9 (Leachate containment and collection),
and Section 10 (Landfill infrastructure system).
SUSTAINABLE CLOSURE DEVELOPMENT PLANNING AND DESIGN FOR THE MUASSIM LANDFILL
2-1 | M U A S S I M L A N D F I L L 2 0 1 1
PART B: SECTION 2
MAPPING OF MUASSIM LANDFILL
SUSTAINABLE CLOSURE DEVELOPMENT PLANNING AND DESIGN FOR THE MUASSIM LANDFILL
2-2 | M U A S S I M L A N D F I L L 2 0 1 1
2.1 BACKGROUND The mapping exercise was carried out to provide comprehensive topographical map by
applying current and standard practice in the land surveying works. This will provide a
basic map for related investigation works and finally for engineering details and design.
Other available maps, plans or engineering drawings from Saudi Arabia geological
survey, Makkah municipality council and landfill operator are also analysed.
2.2 METHODOLOGY
The surveying work on Muassim landfill was carried out on 23 January to 27 January
2010 and followed on the following week from 30 January to 3rd
February 2010. USM
team was divided into two groups to conduct the work. A complete set of the surveying
equipment was brought down from Malaysia, which included a total station, observation
prism, measuring tape, Garmin type GPS etc. and another set was supplied by Saudi
counterpart from Saudi Geological Survey.
The surveying works are used as a basis for the following purposes:
1. To develop a contour of the Muassim Landfill.
2. To estimate the surface area of the landfill for planning and designing purposes.
3. To estimate the catchment area for the landfill so that proper drainage system
could be developed.
4. To determine an appropriate location for cut-off barrier construction in order to
prevent leachate intrusion into nearby wadi, especially for the NW end corner
section of the landfill (refer Figue. 1.2, Section 1)
5. To estimate the total amount of waste materials (refer Section 4) and the amount
needs to be removed from the NE location (one of the options considered) to the
main valley (Wadi Aad) of the landfill so that leachate intrusion to Wadi Aad could
be minimized.
6. To determine spot levels at every gas vent pipes, gas monitoring well, boreholes
and other existing installation including water well, geophysical survey lines, soil
sampling points etc.

SUSTAINABLE CLOSURE DEVELOPMENT PLANNING AND DESIGN FOR THE MUASSIM LANDFILL
2-3 | M U A S S I M L A N D F I L L 2 0 1 1
2.3 PROBLEMS RELATED WITH SURVEYING WORKS As the surveying works were carried out in a foreign environment and due to limited time
frame to be engaged in Saudi Arabia, it is anticipated that several problems will occur.
During surveying work the following problems were encountered:
1. No reference point (control points) given by the Saudi counterpart that could be
used as the basis for ordinance datum (based on mean sea level from Jeddah).
2. No equipment to measure accurately of the reference point as our GPS that we
brought could lead to an error of ±3 metres.
3. Control points suggested and supplied by the Saudi counterpart were found
obsolete after several efforts were made to determine them.
4. Difficulty in communication system since the walkie-talkie system provided does
not functioning properly.
5. Personnel helpers supplied were general labourers that were not familiar with
surveying works. Additionally there were problems with communication.
6. Surveying group has to walk considerable distance without any four wheeled
drive vehicle designated for them to carry out their instrument. This has caused
exhaustion even before the actual work has to begun.
In spite of all the above problems, the surveying team from USM has managed to
complete their works up to the last date of the assignment.
2.4 RESULTS The landfill is surrounded by hilly areas running at approximately from south-east (SE) to
the north-west (NW). The lowest contour line plotted at the landfill site is 420m while the
only spot level available from contour map is 410m A.O.D. Initial report by SAES
suggested that the landfill is having a surface area of 0.9 sq. km with a perimeter length
of 8.1 km.
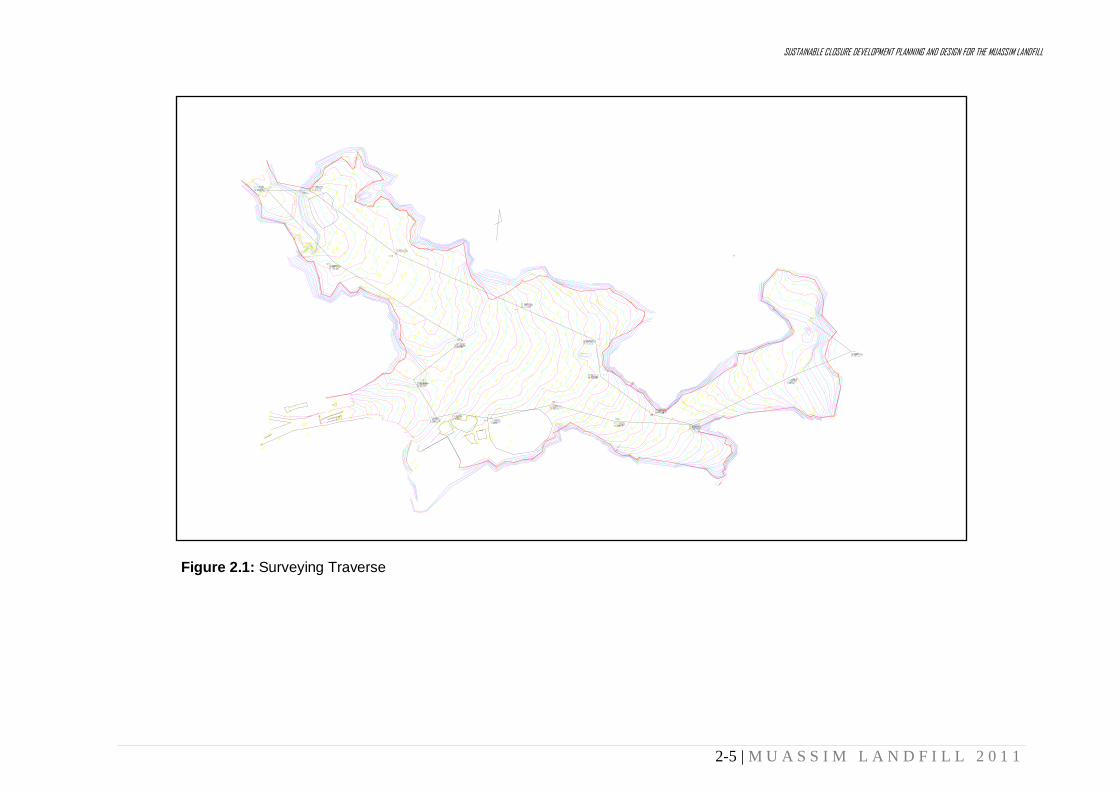
The results of the survey work are presented in Figure 2.1. The estimated surface area is
0.8 km2. The traverse which forms the backbone of the surveying works is shown in this
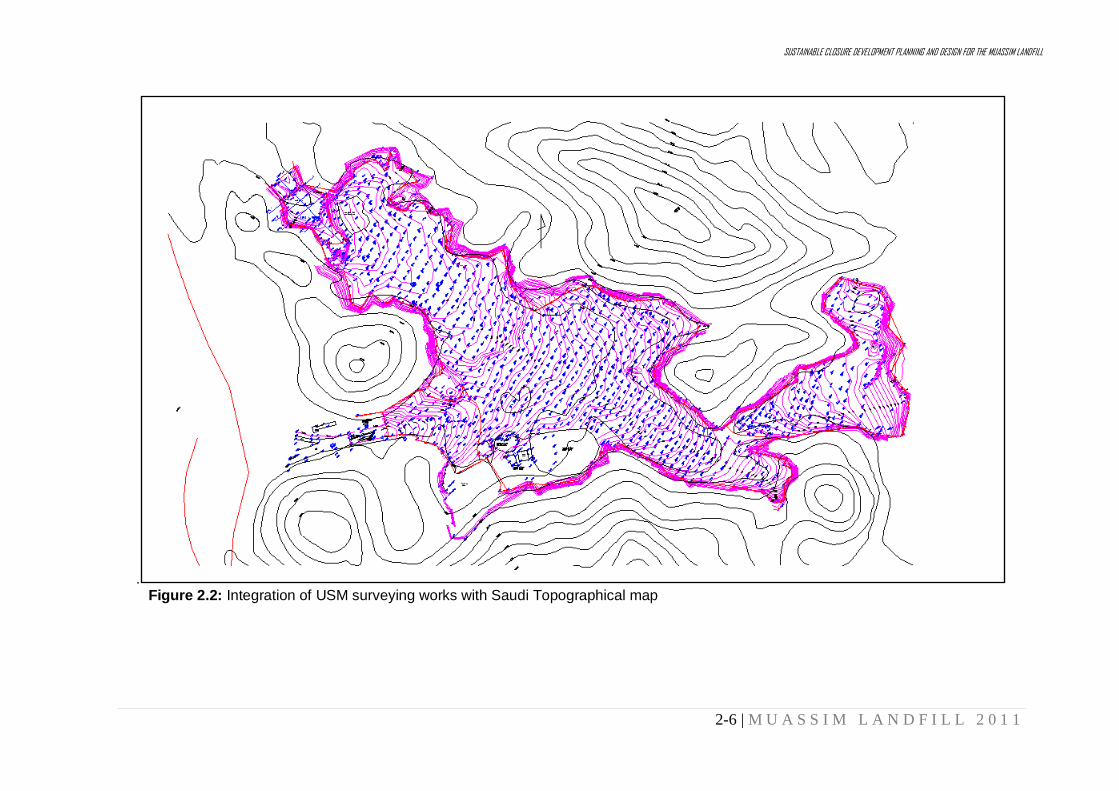
figure which is represented by the black line. Figure 2.2 shows contour map of Muassim
Landfill where the contours of the surrounding areas were digitised from topographical
map given to USM team and incorporated with the result of survey works done by USM
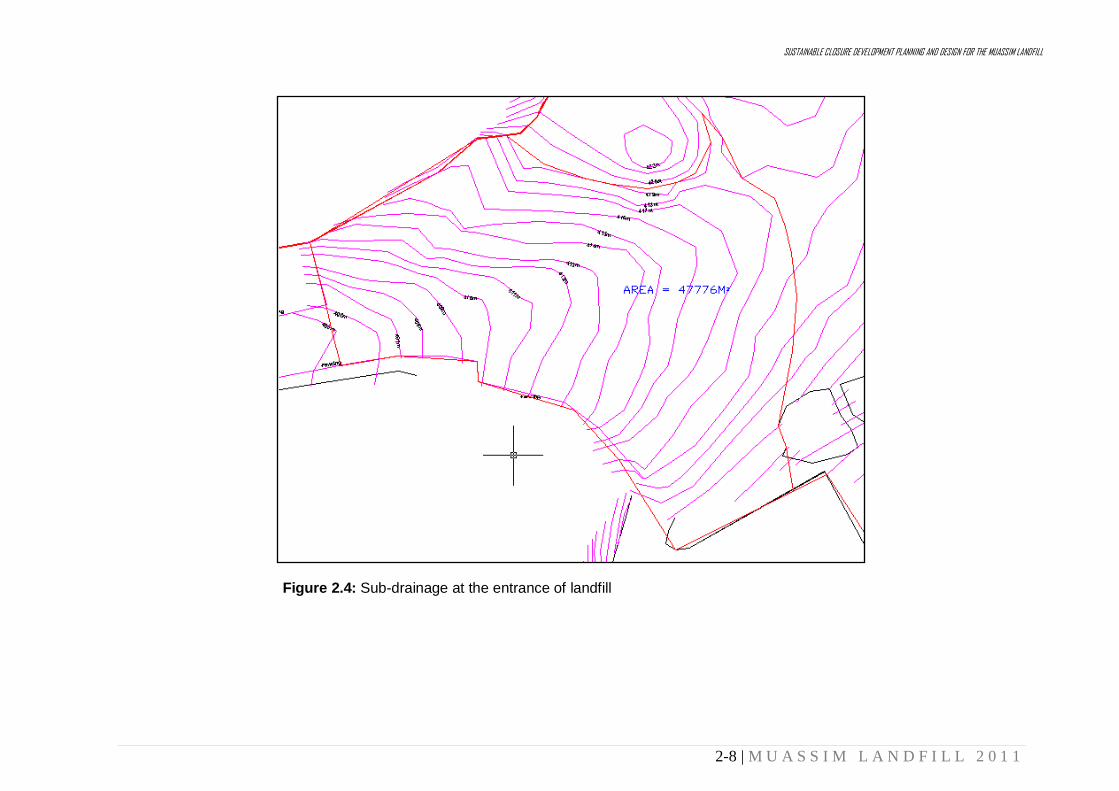
team. Figure 2.3 shows the delineation areas of the drainage system. The drainage
system can be divided into 3 parts and the dividing lines are shown in red colour. The

SUSTAINABLE CLOSURE DEVELOPMENT PLANNING AND DESIGN FOR THE MUASSIM LANDFILL
2-4 | M U A S S I M L A N D F I L L 2 0 1 1
first part (Figure 2.4) is located at the entrance of the landfill (western part) which covers
an area of 47,776 m2 (Area A1), the second part (Figure 2.5) located to the east which
has an area of 139,149 m2 (Area A2) and the last part consisting of the rest of the landfill
running from south-east to north-west. The outlet of the major drainage system is located
on the downside of the contour system (to the north-west) which covers an area of
19,218 m2 as shown in Figure 2.6. Area A1 is sloping towards the entrance or access
road and thus a drain is proposed to cut through between A1 and the main area of
landfill as marked with red line as shown in Figure 2.3. Area A2 is sloping towards the
east and thus a thus a drain is proposed to cut through between A2 and the main area of
landfill as marked with red line as shown in Figure 2.3. Figure 2.6 shows downstream of
the landfill where the lowest point recorded was at 386.2m A.O.D. An elevation of 394m
is marked with the red line and the latter forms the boundary of this area with a surface
area of 19,218m2. If there is a need to construct a cut-off dam in the future, the surface
area of 19,218m2
is suggested to be the inundated area. The proposed cut-off dam (if
any) is to be located at the narrowest width between the two hills which is marked by the
red line and with the lowest elevation of 386.2m. A Temporary Bench Mark (TBM) was
also established at one corner of the Mussala for future reference.
SUSTAINABLE CLOSURE DEVELOPMENT PLANNING AND DESIGN FOR THE MUASSIM LANDFILL
2-5 | M U A S S I M L A N D F I L L 2 0 1 1
Figure 2.1: Surveying Traverse
SUSTAINABLE CLOSURE DEVELOPMENT PLANNING AND DESIGN FOR THE MUASSIM LANDFILL
2-6 | M U A S S I M L A N D F I L L 2 0 1 1
. Figure 2.2: Integration of USM surveying works with Saudi Topographical map

SUSTAINABLE CLOSURE DEVELOPMENT PLANNING AND DESIGN FOR THE MUASSIM LANDFILL
2-7 | M U A S S I M L A N D F I L L 2 0 1 1
Figure 2.3: Dividing lines for drainage system
SUSTAINABLE CLOSURE DEVELOPMENT PLANNING AND DESIGN FOR THE MUASSIM LANDFILL
2-8 | M U A S S I M L A N D F I L L 2 0 1 1
Figure 2.4: Sub-drainage at the entrance of landfill

SUSTAINABLE CLOSURE DEVELOPMENT PLANNING AND DESIGN FOR THE MUASSIM LANDFILL
2-9 | M U A S S I M L A N D F I L L 2 0 1 1
Figure 2.5: Sub-drainage to the East

SUSTAINABLE CLOSURE DEVELOPMENT PLANNING AND DESIGN FOR THE MUASSIM LANDFILL
2-10 | M U A S S I M L A N D F I L L 2 0 1 1
Figure 2.6: Expected inundated area

SUSTAINABLE CLOSURE DEVELOPMENT PLANNING AND DESIGN FOR THE MUASSIM LANDFILL
2-11 | M U A S S I M L A N D F I L L 2 0 1 1
2.5 SUPPORTING DRAWINGS As a result, three (3) categories of drawing were drawn, at 1:3000 and 1:5000 scales.
These drawings are categorized as contour map, utility map and resistivity, borehole and
existing monitoring well positions map as shown in Table 2.1 and attached at the back of
the report.
Table 2.1: Supporting surveyed drawings Title of drawing Drawing number Base map 1 (1m contour) PPKA/MUASSIM/SV/01 Base map 2 (5m contour) PPKA/MUASSIM/SV/02 Utility map PPKA/MUASSIM/SV/03 Resistivity, borehole and existing monitoring well positions PPKA/MUASSIM/SV/04
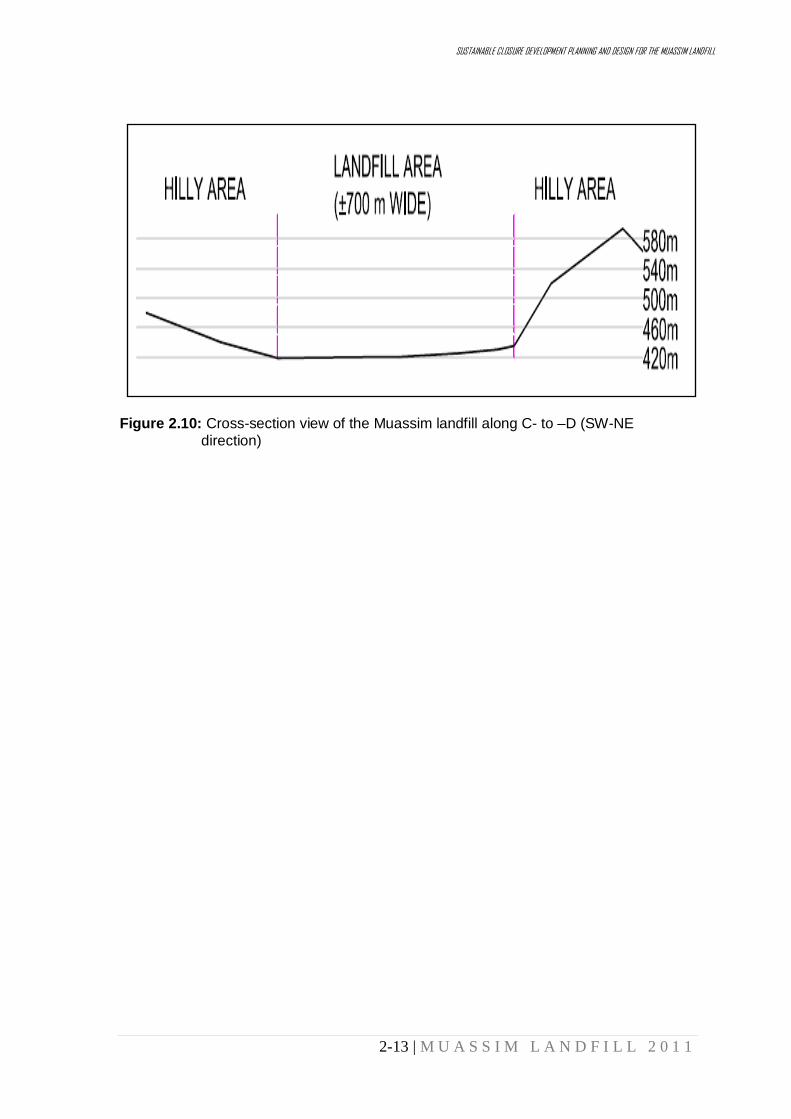
Figure 2.7 shows the key base map of the Muassim landfill with 5m contour. Based on
this contour map, two cross-sections (refer Figure 2.8) are drawn along A-B and C-D to
indicate the overall elevation of the landfill as shown in Figures 2.9 and 2.10.
Figure 2.7: Key base map of the Muassim Landfill with major features

SUSTAINABLE CLOSURE DEVELOPMENT PLANNING AND DESIGN FOR THE MUASSIM LANDFILL
2-12 | M U A S S I M L A N D F I L L 2 0 1 1
Figure 2.8: Contour map of the Muassim landfill with surrounding hilly area
Figure 2.9:Cross-section view of the Muassim landfill along A- to –B (SW-NE direction)
C
A D
B
SUSTAINABLE CLOSURE DEVELOPMENT PLANNING AND DESIGN FOR THE MUASSIM LANDFILL
2-13 | M U A S S I M L A N D F I L L 2 0 1 1
Figure 2.10: Cross-section view of the Muassim landfill along C- to –D (SW-NE direction)

SUSTAINABLE CLOSURE DEVELOPMENT PLANNING AND DESIGN FOR THE MUASSIM LANDFILL
3-1 | M U A S S I M L A N D F I L L 2 0 1 1
SECTION 3
GEOLOGY, GEOPHYSICAL AND GEOTECHNICAL INVESTIGATION
SUSTAINABLE CLOSURE DEVELOPMENT PLANNING AND DESIGN FOR THE MUASSIM LANDFILL
3-2 | M U A S S I M L A N D F I L L 2 0 1 1
3.1 INTRODUCTION Engineering geology is the application of the geologic sciences to engineering practice
for the purpose of assuring that the geologic factors affecting the location, design,
construction, operation and maintenance of engineering works are recognized and
adequately addressed.
These factors were thoroughly evaluated for the closure and restoration plans of
Muassim landfill. Nevertheless, the work carried out for the work can be described as
mainly to investigate, provide geologic and geotechnical analyses, and give
recommendations towards an efficient and economical final design. This report gives
emphases on rational and practical landfill closure specifications.
This works have been organized as follows:
1) Geological mapping - Preparation of maps to show geological features such
as rock units and structural features such as faults, bedding planes, strikes,
and dip. Report of geomorphology, i.e., weathering and topography features
of the landfill. Analyses of structural geology - the primary goal of structural
geology is to use measurements of present-day rock geometries like strike,
dip, and orientations of joint and bedding pattern to determine fracture
densities (aquifer dimension) and stability of rock slopes. Statements on
groundwater flow and penetration, which may affect, for instance, seepage of
leachate from waste dumps into aquifers.
2) Conventional deep boring investigation– Determination of lithology, waste
nature and thickness, and geotechnical features. Sampling and monitoring of
fluid - ground water and leachate. Determination of water table and fracture
zone (aquifer). Reporting RQD data. Description of profiles and changes in
material composition with depth. Deep boring investigations were carried out
in two distinct areas i.e. (1) waste dump area and (2) wadi area which has no
waste.
3) Geophysical subsurface investigation: Determination of subsurface spatial
features, rock units, types of materials, waste thickness, depth to bedrock,
and connectivity of fractured zone (aquifer zone) through surface imaging
method.
SUSTAINABLE CLOSURE DEVELOPMENT PLANNING AND DESIGN FOR THE MUASSIM LANDFILL
3-3 | M U A S S I M L A N D F I L L 2 0 1 1
4) Capping and landscaping: Investigation of present capping and
determination of required design. Proposal of post-closure land-use including
a proposal of plant species and growth media.
3.2 ENGINEERING GEOLOGY AND GEOTECHNICAL INVESTIGATION 3.2.1 Geological mapping and structural analyses The landfill acreage generally occupies a narrow valley running approximately in the
direction of NNW-ESE and surrounded by the rocky and hilly side of the Jabal Al Ahdab
ridge. The highest point along the landfill perimeter is approximately 550 m above sea
level. The almost flat, filled part of the landfill generally has an elevation of between 410
m to 440 m above sea level. The location indicated as Site 1 in Figure 1.2 (Section 1) is
lowest of the landfill area.
Generally speaking, the geology of western part of Saudi Arabia, including Makkah
where Mina landfill is located, is part of the Arabian Shield coming from a pre-Cambrian
category of rock stratigraphy (more than 600 million years old). The Arabian Shield has
long been recognized as a region where plate-tectonic processes have been in action
during most of the Late Proterozoic era resulting in the amalgamation of the five
constituent terrenes of the shield along four major suture zones (Ahmad, et al., 1998;
Moore and Al-Rehaili, 1989; Jeff et al., 2007). The terrain is composed of a magmatic arc
complex and syn- to post-orogenic intrusions and metasedimentary rock like Abt schist
and gneiss.
The mountainous area around Muassim landfill is completely underlain by oroginic
intrusion of rock types (igneous rocks) belonging to the Arabian Shield. A vast majority of
the area is underlain by grey to greenish-grey, coarse-grained, biotite granite (or
granodorite) in composition that is rich with greenish to brownish biotite and some
hornblende. These main rock types are occasionally intruded by the late, light grey,
pinkish or greyish white colour granitic rock (probably tonalite sill) with variable intrusion
thickness, ranging from a few cm to 4 m wide and having variable mineral constituents,
thus the mineral grain sizes are also variable. The narrow intrusion normally shows
somewhat fine-grained mineral composition, whereas the thicker beds frequently have
the medium to coarse-grained variety.
This biotite granite to granodiorite composition is also traversed by the dark grey and
very fine-grained dykes (lamprophyre), ranging from a few cm to one meter in local

SUSTAINABLE CLOSURE DEVELOPMENT PLANNING AND DESIGN FOR THE MUASSIM LANDFILL
3-4 | M U A S S I M L A N D F I L L 2 0 1 1
thickness. Microscopically, the biotite granite to granodiorite (quartz diorite) rocks also
contain significant amount of sulphide minerals (possibly pyrite).
The rocks described above, especially in the upper parts or near the outcrops, had
experienced past intense physical weathering rather than chemical weathering, as due to
the arid climate land form with very little rain. In such condition, the floor of the valley is
expected to be underlain by a formation full of fractured zones, thus the high permeable
capacity, which now is covered by the waste. The situation may imply the existence of an
aquifer or at least an underground Wadi.
3.2.2 Boring results from drillings within waste dump area of landfill Three boreholes were installed during the January 2010 visit. Borehole positions are
summarized in Table 3.1 and the logs are illustrated in Figure 3.1. These positions can
also be referred to in attachment map ML-SM (Appendix AD) as BH-3, BH-5, and BH-6.
Detailed description of each borehole logs can be found in Appendix AA to AC
. The
locations of these boreholes were selected from the results of the first phase earth
resistivity survey.
Table 3.1: Boring positions from within Muassim landfill
Borehole (BH)
Azimuth (earth
coordinate) (UTM Grid) Elevation
(m) Drilling Start
Date
BH-3 39o
2155’9.366”E
o37 Q E595257 N2371413
26’33.389”N 454 1/2/10
BH-5 39o
2154’33.601”E
o37 Q
26’41.683”N E594226 N2371662
433 26/1/10
BH-6 39o
2154’43.513”E
o37 Q
26’37.889”N E594512 N2371547
433 24/1/10

SUSTAINABLE CLOSURE DEVELOPMENT PLANNING AND DESIGN FOR THE MUASSIM LANDFILL
3-5 | M U A S S I M L A N D F I L L 2 0 1 1
Note:
Note 1. BH-3 and BH-6 were separated between each other by a ridge therefore the deeper lithologies could not be related. 2. Horizontal scale is not equal to vertical scale 3. Sands, gravels, and rocks found underneath waste layer were found contaminated with
leachate Figure 3.1: Profile of boreholes installed in waste dump area
0
5
10
15
20
24
Metre BH-3 BH-6 BH-5 Sandy gravels, the cover materials (yellow). Well sorted. Partly decomposed solid waste (black shade). Mainly domestic waste and some industrial waste Thin sandy and gravel interlayer with waste. Seemed not continuous Thin gravely sand/rock fragments
High fractured/jointed granitic bedrock (RQD < 10-15%) with leachate contamination.
NW E
Separation by ridge
LEGEND: Sandy gravel Refuse waste gravely sand Bedrock

SUSTAINABLE CLOSURE DEVELOPMENT PLANNING AND DESIGN FOR THE MUASSIM LANDFILL
3-6 | M U A S S I M L A N D F I L L 2 0 1 1
Figure 3.1 also illustrates possible correlation between profiles of these boreholes
stretching between BH-3 of the eastern portion of landfill and BH-5 of the far NW portion.
The thickness of waste was generally in a range of 10 m to 20 m thick throughout the
area and highly variable. Since the underlying bedrock topography of valley is also
undulating, the variation of waste thickness could be more severe than stated. The
bedrock is expected to deepen as one move to the NW direction.
Thin layers of sand could be found separating between layers of waste which indicates
that at some points the refuse had been covered with soil (sandy gavel) after specific
thickness, before new fresh refuse dumped again on top of it.
The drillings were normally terminated after penetrating 2 m of rock. The last meters of
rock often showed highly jointed or fractured bedrock formation, with estimated RQD
value of less than 15%. This granitic rock mass at the base of the landfill was mainly
made-up of fractured, course grained granite/granodiorite. The discoloration of the
jointed/fractured rock surface to a darker tune with strong odour, as evidenced from the
retrieved samples, strongly suggests that this fractured zone is filled with leachate. The
thickness of this zone with open fractures is unknown; however, estimation made from
resistivity pseudo sections suggested that the full extent of it could go down to more than
40 m or even up to 55 m below surface. Fresh, compacted, and impervious granitic
bedrock basement could be expected beyond that depth.
Geologically speaking, due to geo-tectonic complexity and structural overprinting
episodes experienced by the rock formation, many major discontinuity features,
especially joints (and secondary fractures) were formed during and throughout the
geological time periods. For the case of Muassim, the density of fractures within the
bedrock was apparently very high, i.e., at 6-10 discontinuities per meter, and could
behave as a high permeability zone and therefore could also become potential
underground drainage or storage/conduit to leachate and underground water resources.
Phenomenon, in which such fracture zones were contaminated or highly stained by
leachate, was noticed while drilling BH-3, BH-5 and BH-6. It was estimated that the
density of fractured zone in the granite bedrock is over 60% with RQD values around 10-
15%, i.e., as evidenced from borehole data.
There were at least 4 major joint sets identified mainly striking in SSE-NNE, NW-SE
trends (Site 1) and NNE-SSW, NEE-SWW and SWE-NEE elsewhere. The dips were all

SUSTAINABLE CLOSURE DEVELOPMENT PLANNING AND DESIGN FOR THE MUASSIM LANDFILL
3-7 | M U A S S I M L A N D F I L L 2 0 1 1
almost vertical. The presence of such fracture zone situation is illustrated in Appendix
AE.
Meanwhile, most main pinkish quartz-veins were trending in E-W and SW directions, and
also truncated in various places. In other words these veins were not continuous. Such
information could be vital considerations in the construction of leachate barrier planned
for the Northwest end. The rose diagram of Figure 3.2 summarizes some discontinuities
at Muassim.
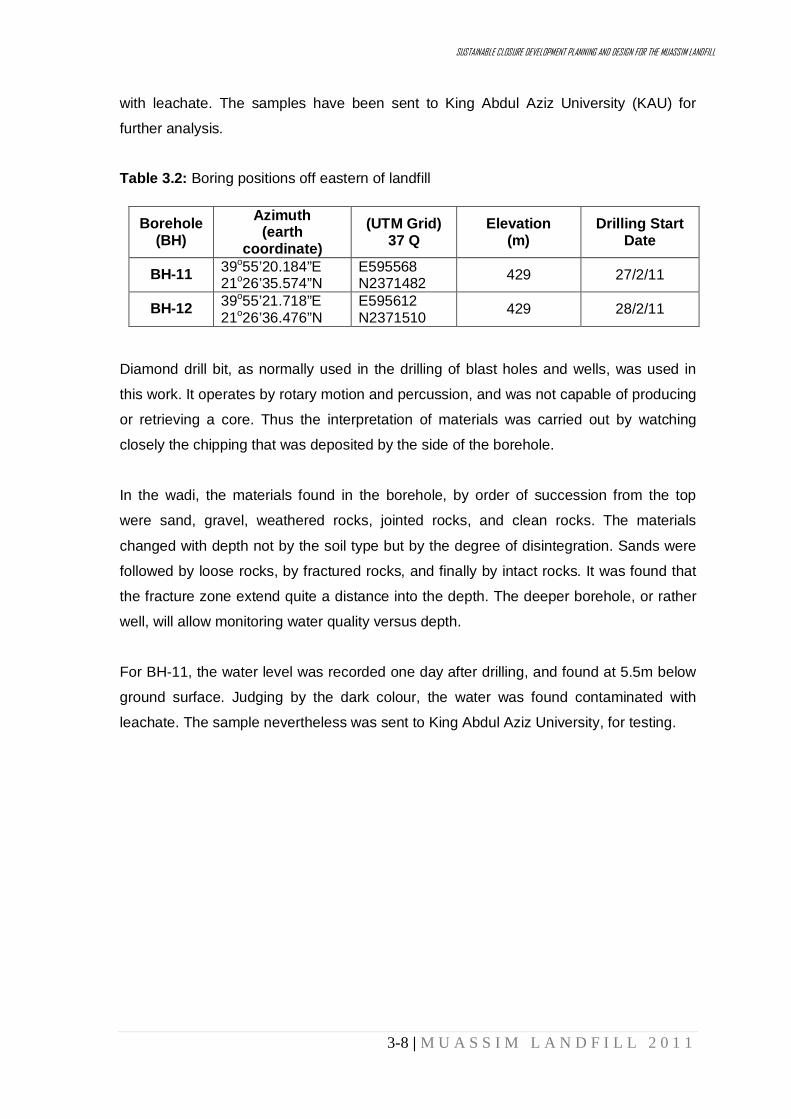
Figure 3.2: Rose Diagram showing typical fracture system of the granite joint system and pinkish vein orientation patterns in the main area of Muassim landfill 3.2.3 Boring results from drillings in wadi off eastern of landfill The aim of doing site investigation in eastern of Muassim landfill was to look for possible
solution in containing or controlling leachate flow into the wadi which might contaminate
the ground water. Two boreholes were drilled. BH-11, drilled and completed on Feb 27th,
2011, is now located 8 m from the edge of waste dump. BH-12 drilled and completed on
Feb 28th
, 2011, is now located 70 m off the edge of waste dump. Both boreholes are 1
foot in diameter and cased down to about 3 m from surface. Table 3.2 summarizes
borehole locations while Figure 3.3 shows the locations in map. Figure 3.4 and Figure
3.5 show the interpreted profiles for BH-11 and BH-12.
These boreholes are located in the only area along the edge of dump where there are no
rock outcrops – these features are dominating other areas along the edge. Water
samples taken from boreholes indicate that the level of contamination at BH-11 was
more severe than at BH-12, as evidenced by relative darkness of the samples.
Nevertheless, the ground water at both borehole locations was already contaminated
SUSTAINABLE CLOSURE DEVELOPMENT PLANNING AND DESIGN FOR THE MUASSIM LANDFILL
3-8 | M U A S S I M L A N D F I L L 2 0 1 1
with leachate. The samples have been sent to King Abdul Aziz University (KAU) for
further analysis.
Table 3.2: Boring positions off eastern of landfill
Diamond drill bit, as normally used in the drilling of blast holes and wells, was used in
this work. It operates by rotary motion and percussion, and was not capable of producing
or retrieving a core. Thus the interpretation of materials was carried out by watching
closely the chipping that was deposited by the side of the borehole.
In the wadi, the materials found in the borehole, by order of succession from the top
were sand, gravel, weathered rocks, jointed rocks, and clean rocks. The materials
changed with depth not by the soil type but by the degree of disintegration. Sands were
followed by loose rocks, by fractured rocks, and finally by intact rocks. It was found that
the fracture zone extend quite a distance into the depth. The deeper borehole, or rather
well, will allow monitoring water quality versus depth.
For BH-11, the water level was recorded one day after drilling, and found at 5.5m below
ground surface. Judging by the dark colour, the water was found contaminated with
leachate. The sample nevertheless was sent to King Abdul Aziz University, for testing.
Borehole (BH)
Azimuth (earth
coordinate) (UTM Grid)
37 Q Elevation
(m) Drilling Start
Date
BH-11 39o55’20.184”E 21o
E595568 N2371482 26’35.574”N 429 27/2/11
BH-12 39o55’21.718”E 21o
E595612 N2371510 26’36.476”N 429 28/2/11

SUSTAINABLE CLOSURE DEVELOPMENT PLANNING AND DESIGN FOR THE MUASSIM LANDFILL
3-9 | M U A S S I M L A N D F I L L 2 0 1 1
Note: BH11, drilled and completed on Feb 27th, 2011, is located 8 m from the edge of waste dump. BH12 drilled and completed on Feb 28th
, 2011, is located 70 m from edge of waste dump. Both boreholes are 1 foot in diameter and were cased down to about 3 m from surface. These boreholes are located in the only area along the edge of dump where there is no rock outcrop. Water samples taken from boreholes indicate that the level of contamination at BH1 is more severe than at BH2, as evidenced by relative darkness of the samples. Nevertheless, the ground water at both borehole locations is already contaminated with leachate. The samples were sent to King Abdul Aziz University (KAU) for further analysis.
Figure 3.3: Locations of BH-11 and BH-12 in the wadi, off eastern of Muassim landfill
SUSTAINABLE CLOSURE DEVELOPMENT PLANNING AND DESIGN FOR THE MUASSIM LANDFILL
3-10 | M U A S S I M L A N D F I L L 2 0 1 1
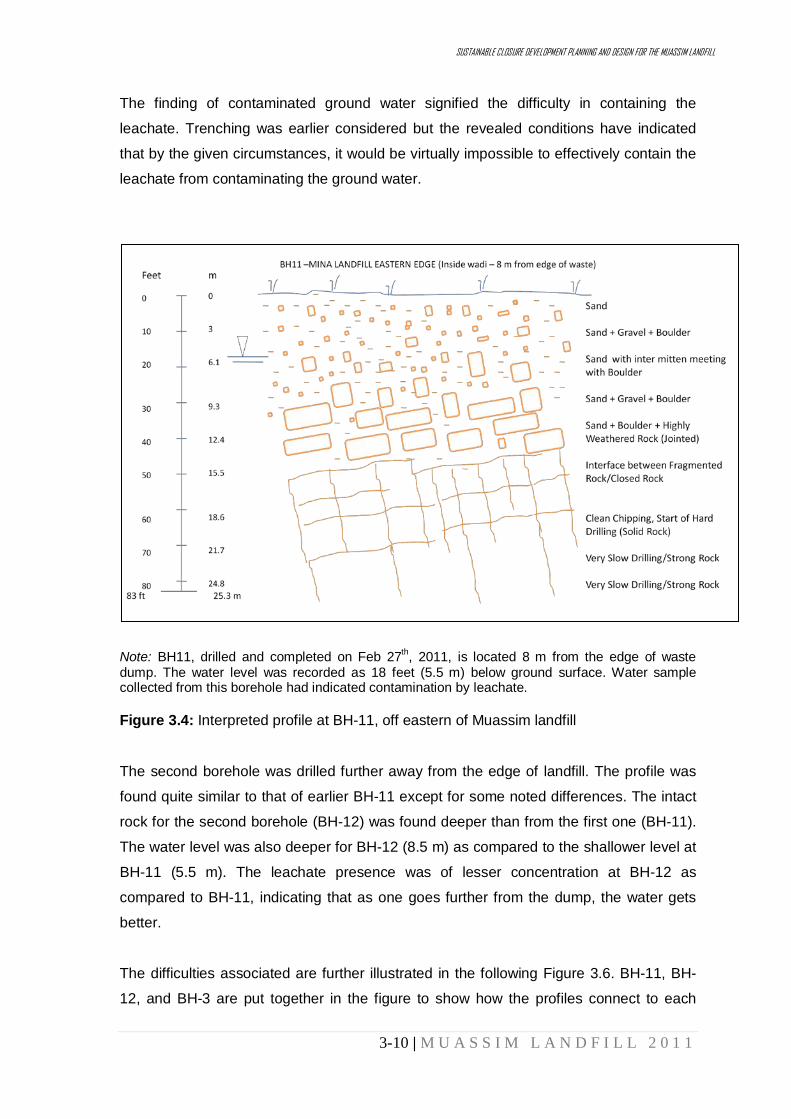
The finding of contaminated ground water signified the difficulty in containing the
leachate. Trenching was earlier considered but the revealed conditions have indicated
that by the given circumstances, it would be virtually impossible to effectively contain the
leachate from contaminating the ground water.
Note: BH11, drilled and completed on Feb 27th
, 2011, is located 8 m from the edge of waste dump. The water level was recorded as 18 feet (5.5 m) below ground surface. Water sample collected from this borehole had indicated contamination by leachate.
Figure 3.4: Interpreted profile at BH-11, off eastern of Muassim landfill
The second borehole was drilled further away from the edge of landfill. The profile was
found quite similar to that of earlier BH-11 except for some noted differences. The intact
rock for the second borehole (BH-12) was found deeper than from the first one (BH-11).
The water level was also deeper for BH-12 (8.5 m) as compared to the shallower level at
BH-11 (5.5 m). The leachate presence was of lesser concentration at BH-12 as
compared to BH-11, indicating that as one goes further from the dump, the water gets
better.
The difficulties associated are further illustrated in the following Figure 3.6. BH-11, BH-
12, and BH-3 are put together in the figure to show how the profiles connect to each

SUSTAINABLE CLOSURE DEVELOPMENT PLANNING AND DESIGN FOR THE MUASSIM LANDFILL
3-11 | M U A S S I M L A N D F I L L 2 0 1 1
other. BH3 was installed about in the middle of the eastern section of landfill. The
horizontal distances in Figure 3.6 are not drawn to scale. The figure illustrates how
leachate would breach the ground water in the wadi by flowing though rock fractures that
form the base of the unlined landfill.
Note: BH-12, drilled and completed on Feb 28th
, 2011, is located 60 m from the edge of waste dump. The water level was recorded as 28 feet (8.5 m) below ground surface. Water sample collected from this bore hole had also indicated contamination by leachate, but less serious than at BH11.
Figure 3.5: Interpreted profile at BH-12, Muassim landfill, eastern
SUSTAINABLE CLOSURE DEVELOPMENT PLANNING AND DESIGN FOR THE MUASSIM LANDFILL
3-12 | M U A S S I M L A N D F I L L 2 0 1 1
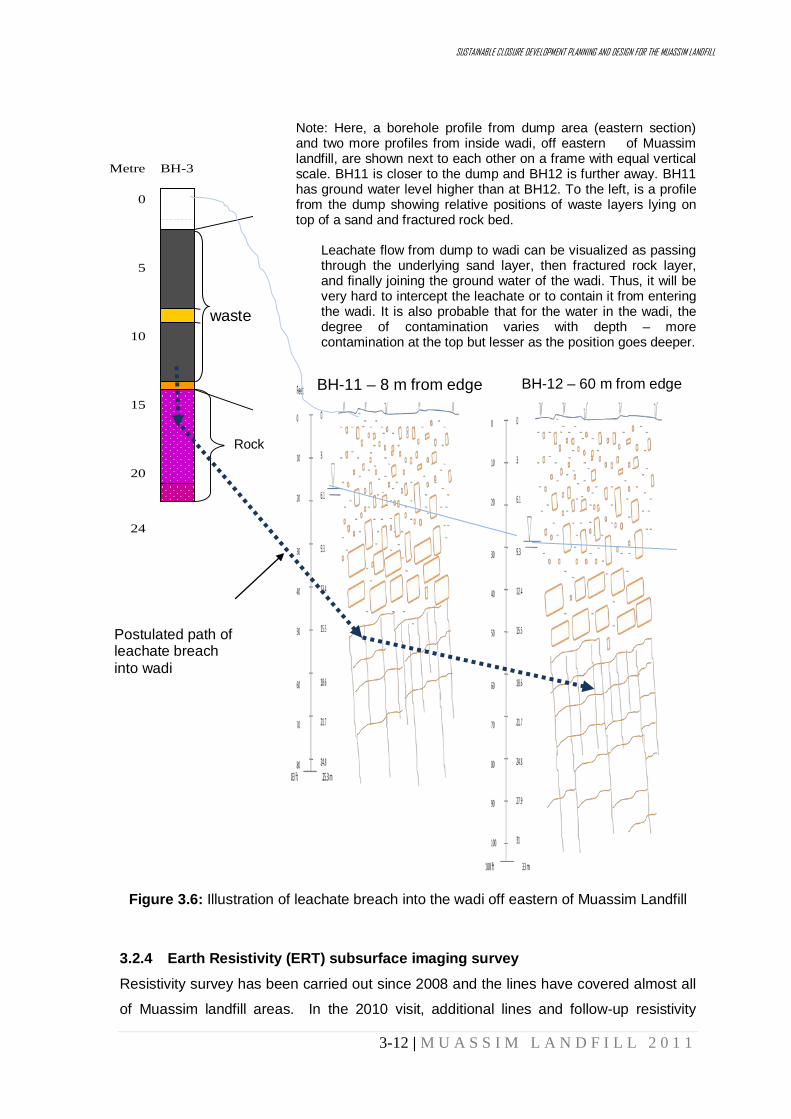
Figure 3.6: Illustration of leachate breach into the wadi off eastern of Muassim Landfill 3.2.4 Earth Resistivity (ERT) subsurface imaging survey Resistivity survey has been carried out since 2008 and the lines have covered almost all
of Muassim landfill areas. In the 2010 visit, additional lines and follow-up resistivity
Note: Here, a borehole profile from dump area (eastern section) and two more profiles from inside wadi, off eastern of Muassim landfill, are shown next to each other on a frame with equal vertical scale. BH11 is closer to the dump and BH12 is further away. BH11 has ground water level higher than at BH12. To the left, is a profile from the dump showing relative positions of waste layers lying on top of a sand and fractured rock bed.
Leachate flow from dump to wadi can be visualized as passing through the underlying sand layer, then fractured rock layer, and finally joining the ground water of the wadi. Thus, it will be very hard to intercept the leachate or to contain it from entering the wadi. It is also probable that for the water in the wadi, the degree of contamination varies with depth – more contamination at the top but lesser as the position goes deeper.
0
5
10
15
20
24
Metre BH-3
0
5
10
15
20
24
Metre BH-3
BH-12 – 60 m from edge BH-11 – 8 m from edge
Postulated path of leachate breach into wadi
waste
Rock
SUSTAINABLE CLOSURE DEVELOPMENT PLANNING AND DESIGN FOR THE MUASSIM LANDFILL
3-13 | M U A S S I M L A N D F I L L 2 0 1 1
survey were carried out to provide more detailed and comprehensive overview and
better pictures of the subsurface features and condition of the Muassim landfill. The work
was mainly to characterize and predict the geometry of leachate plumps occurrences,
waste refuse thickness and volume, depth to bedrock, presence of dry or saturated
zone/fractured zone, underground drainage/aquifer, and predicting flow direction. The
methodology of ERT survey and some of the typical resistivity values of earth materials
are given in Appendix AE and Appendix AF, respectively.
As a result, twenty eight (28) resistivity survey lines traversing across Muassim landfill,
which are generally oriented in the SW-NE direction and 2 in-line (NW-SE) line have
been established as shown in site plans given in Appendix AH-AK and Attachment map
ML-SM. All the 28 2D-ERT sections (Lines 1 to 28) are shown in Appendix AI. The
geophysical survey data were compared with other available information, particularly
boring data for validation of various dimensions, the most important being refusal
volume.
Typical pseudo sections of the work are presented in Figure 3.8. Table 3.3 provides
typical resistivity values for some common subsurface features that normally associated
with landfill. Interpretations of electrical survey data show low resistivity zones below 10
ohm-m which appear to be zones fully saturated with leachate (Yoon, 2003; Loke, 2003).

SUSTAINABLE CLOSURE DEVELOPMENT PLANNING AND DESIGN FOR THE MUASSIM LANDFILL
3-14 | M U A S S I M L A N D F I L L 2 0 1 1
Figure 3.7: Typical sections of 2D subsurface ERT imaging tomography at Muassim Landfill. Line 12(L8) with BH-6 (top) and resistivity characteristics dividing waste refuse with bedrock as indicated in Line 14(L19) and Line18 (L25) (bottom)
Table 3.3: Interpretation of typical resistivity values associated with various subsurface conditions and features at Muassim Landfill
Resistivity range (ohm-m) Possible features/condition
1 1.5 Typical Leachate (plump) 2 0.4 Sea water (dissolved salt) 3 < 6 Saturated fractured zoned with leachate 4 10-100 Fresh Ground water 5 200 Unsaturated fractured zone 6 > 4000 Bedrock – igneous bedrock
SUSTAINABLE CLOSURE DEVELOPMENT PLANNING AND DESIGN FOR THE MUASSIM LANDFILL
3-15 | M U A S S I M L A N D F I L L 2 0 1 1
3.2.5 Cancellation of an intended boring work in western (NW) of landfill The aim of intended drillings for western (NW) of Muassim landfill was to look for
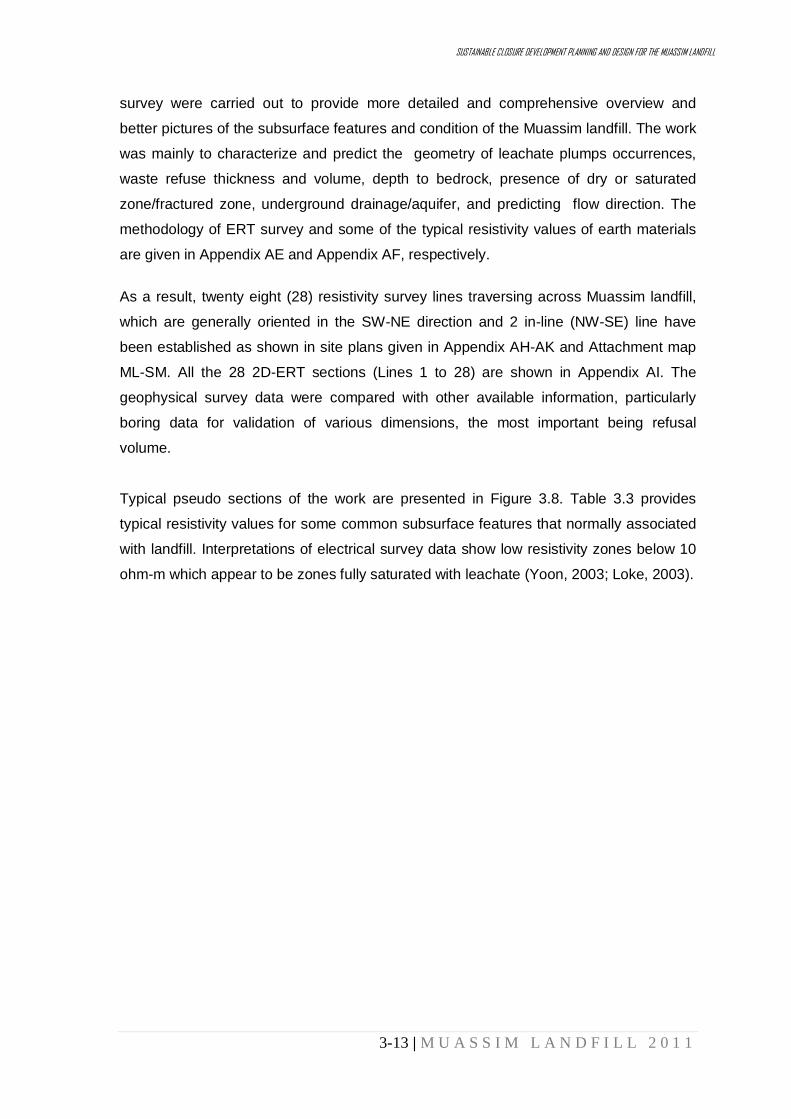
possible solution in containing or controlling leachate flow out of landfill area and into the
adjoining wadi which might contaminate the ground water. A leachate barrier is planned
for the site. However, due to lack of access for the heavy drilling machinery to mobilize,
the work could not be carried out and was called off.
Nevertheless, the site was visited and surface measurements were made. At the
narrowest point, the distance across the valley, where the cut off barrier was planned,
was 60 m. A geophysical resistivity survey has been carried out earlier for the purpose of
estimating the cross sectional profile of the constriction, the result of which is shown in
Figure 3.7. The interpreted maximum depth to hard rock was determined as about 16 m.
The site visit also revealed the severity of the problem. Leachate was found filling up
ground pores up to the surface.
Figure 3.8: Earth resistivity cross section of Line 1 on western (NW) constriction of the landfill 3.3 ANALYSES OF CAPPING MATERIAL 3.3.1 Outline of the study Landfill cover is applied when a landfill reaches maximum volume capacity in order to
minimize rainfall infiltration, reduce leachate generation, and avoid possible
environmental contamination. Designing a sufficient final cover is crucial in ensuring a
proper landfill closure.

SUSTAINABLE CLOSURE DEVELOPMENT PLANNING AND DESIGN FOR THE MUASSIM LANDFILL
3-16 | M U A S S I M L A N D F I L L 2 0 1 1
This section aims to study the effectiveness of existing sandy landfill cover in Muassim in
protecting the waste body against rainfall infiltration. Some laboratory tests have been
carried out in Malaysia involving model sand sample, put in columns, and subjected to
vertical infiltration from simulated rainfalls. Since the landfill is located within the ‘Haram’
sanctuary of Makkah, it was not possible to take away large amount of earthly material
for tests in Malaysian laboratory. The model sand sample was therefore produced using
local sands in Malaysia to match that of the site in Makkah. The main objective of this
study was to assess the adequacy of the current cover and to propose improvements
that would make it acceptable for the landfill cover. The results indicate that a thickness
of 1.0 m of the given cover material will be sufficient to protect the waste body against
the ideal infiltration of unrepeated, one-time inundation of a one-year equivalent of local
rainfall which coincidently also equal to the Saudi Arabian average annual precipitation.
Similar column tests carried out at site have verified the veracity the conclusion.
Nevertheless, since the infiltration circumstances at site are not as ideal as assumed for
the tests, the new upgraded design of the cover will be outlined to ensure effectiveness
of the overall work of rehabilitating the Muassim landfill.
In the first stage, the study has investigated the effectiveness of a single sand layer, 1.0
m to 2.3 m thick, put as cover material of the land fill in Muassim. The complete study
has also looked into the possibility of improving the cover by applying appropriate
concepts and aspects associated with a properly designed facility.
3.3.2 Material and test setup of a vertical infiltration test As Muassim landfill is located within the ‘Haram’ sanctuary, soil samples could not be
taken out of the area in great quantity let alone transported to distant Malaysia for tests
in the laboratory of Universiti Sains Malaysia. Therefore a model sample was prepared
that closely resembled the cover soils of Muassim.
The model sample has grain size information given in Table 3.4 and the corresponding
grain size distribution curve shown in Figure 3.9. The coefficient of uniformity, Cu,
amounts to 6.7 and the coefficient of gradation, Cc, equals to 2.3, thus the sand can be
classified as Well Graded Sand, SW. A slight variation in Cu and Cc
would likely change
the classification into Poorly Graded Sand, SP, implying that an SW is almost the same
as an SP. The soil was placed in the oven overnight to rid of any moisture and to have it
resembles one from arid environment such as prevalent at site. Grain size distribution of
representative cover material from Muassim is given in Figure 3.10.

SUSTAINABLE CLOSURE DEVELOPMENT PLANNING AND DESIGN FOR THE MUASSIM LANDFILL
3-17 | M U A S S I M L A N D F I L L 2 0 1 1
Table 3.4: Results of dry sieve analysis of model sample produced in laboratory
Sieve Opening Diameter
(mm)
Weight Retained
(g)
Cumulative Weight
Retained (g)
Cumulative Weight
Retained (%)
Passing (%)
25.0 0.0 0.0 0.0 100.0 19.0 17.3 17.3 1.5 98.5 12.5 13.6 30.9 2.6 97.4 4.8 58.4 89.3 7.7 92.3 2.0 144.5 233.8 20.4 79.6 0.4 481.2 714.9 63.6 36.4 0.2 255.5 970.4 89.0 11.0 0.1 77.1 1047.4 97.3 2.7
Figure 3.9: Grain size distribution of model sample produced in Malaysian laboratory
Figure 3.10: Grain size distribution of representative cover material from Muassim
SUSTAINABLE CLOSURE DEVELOPMENT PLANNING AND DESIGN FOR THE MUASSIM LANDFILL
3-18 | M U A S S I M L A N D F I L L 2 0 1 1
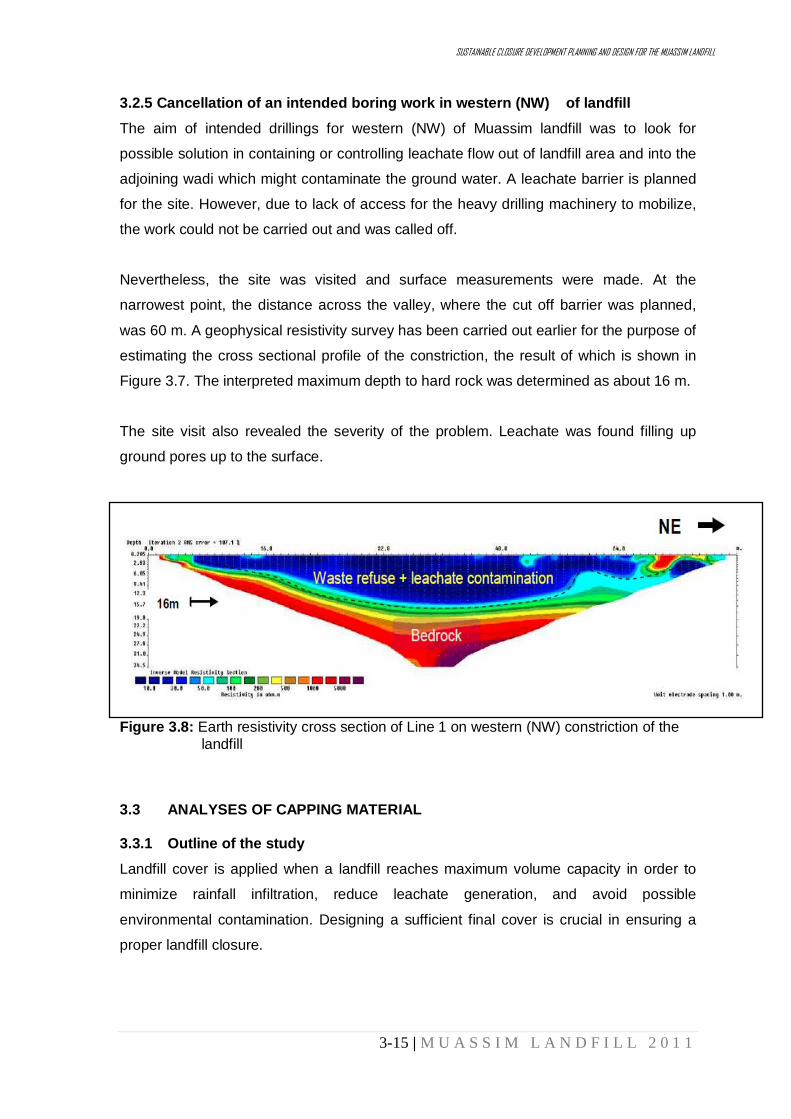
The soil was placed in a soil column as shown in Figure 3.11, which was a transparent
Perspex cylinder, 0.194 m in internal diameter and 1.200 m in height. The rain simulator
was used to apply water at the top of column and a container was placed at the bottom
to collect water once ‘breakthrough’ occurred. Breakthrough is the term used to describe
a situation where water is at the threshold of passing through the entire thickness of soil
cap. Thus in the test, breakthrough can be said to have occurred when the wet front of
advancing infiltration reaches the bottom most part of the soil sample.
Figure 3.11: Schematic diagram of a vertical infiltration apparatus
3.3.3 Rainfall The amount of rainfall for Muassim was based on precipitation data by Subyani (2004) of
towns in the area, including Makkah, as shown in Table 3.5. Figure 3.12 is another of
Subyani (2004) which presents a contoured distribution of yearly precipitation around the
area.

SUSTAINABLE CLOSURE DEVELOPMENT PLANNING AND DESIGN FOR THE MUASSIM LANDFILL
3-19 | M U A S S I M L A N D F I L L 2 0 1 1
Table 3.5: Mean annual rainfall around the study area (Subyani (2004)
Location Longitude Latitude Mean Annual Rainfall (mm) Adham 40.91 20.48 327 Firrain 40.12 21.37 192 Wadi Muhrem 40.33 21.27 185 Ashafa 40.36 21.07 260 Jerinuz 40.42 21.07 180 Lith 40.28 20.15 90 Ghomaiga 40.45 20.33 75 Makkah 39.83 21.427 100 Bahrah 39.7 21.43 60 Jeddah 39.18 21.568 60 Dahya 40.28 21.27 165 Shadad 40.22 21.35 130 Kur 40.253 21.344 131
. Notes: 1. Unit for contour is mm; 2. Study areas are by Subyani (2004); 3. The current study area is 7 km East of Makkah
Figure 3.12: Annual rainfall distribution over study area (Subyani, 2004)

SUSTAINABLE CLOSURE DEVELOPMENT PLANNING AND DESIGN FOR THE MUASSIM LANDFILL
3-20 | M U A S S I M L A N D F I L L 2 0 1 1
Muassim being slightly east – 7 km - of Makkah should receive a little more than the
city’s 100 mm, thus 112 mm per year is a reasonable estimate. Coincidently, the country,
Saudi Arabia, is also receiving 112 mm per year on the average. To simulate the given
amount, the required amount for inundation in the test cylinder would be 3.31 liter.
3.3.4 Further test setup In the experiments, soil thicknesses were varied from 0.1 m to 0.9 m. It was found later
that the minimum thickness of sand cover in the field was 1.0 m. The tests on thinner
samples were meant to determine the critical thickness at where breakthrough could be
avoided and to observe general breakthrough time variation with thickness.
The measured data were mainly time at the occurrence of breakthrough, cumulative
volume of collected water over time, and absorption depth over time. Absorption depth is
the apparent increasing thickness of wet soil as the experiment advances with time.
Each experiment was allowed to run for 24 hours except in cases of thinner samples
where flow activities appeared to have ceased much earlier.
3.3.5 Results and discussions As indicated earlier, samples were tested with 3.31 liter of water, which is equivalent to
having a rainfall of 112 mm, applied over the surface in the column. The thickness of
sample in the first experiment was 0.1 m, and increased gradually for the followings, until
no breakthrough occurred within given test period.
Figure 3.13 indicates that breakthrough time increases with sample thickness.
Breakthrough has taken place in samples up to 0.6 m thick, within 24 hours.
Breakthrough did not occur when thickness was 0.9 m, not even when test time
extended to 48 hours. The ‘thickness-breakthrough time’ curve appears to be asymptotic
towards a certain critical sample thickness. The result suggests that a 1.0 m of cap
material is capable of holding indefinitely 112 mm of rain, if the inundation amount were
to be applied just for once. Figure 3.14 shows the amount of water collected in tests
involving various selected sample thicknesses within the 24 hours test period. Table 3.6
has the complete data from the remaining tests.

SUSTAINABLE CLOSURE DEVELOPMENT PLANNING AND DESIGN FOR THE MUASSIM LANDFILL
3-21 | M U A S S I M L A N D F I L L 2 0 1 1
Figure 3.13: Soil thickness versus breakthrough time
Note: In test involving 0.8 m sample thickness, only 3 drops of water were collected at the end of a 24 hour period. Figure 3.14: Amount of water collected for various sample thicknesses
1.5 526
59149
1330
0
200
400
600
800
1000
1200
1400
0 100 200 300 400 500 600 700 800 900
Bre
akth
roug
h Ti
me
(min
utes
)
Soil Thickness (mm)
Soil Thickness (mm) vs. Breakthrough Time (minutes)
426
323
165
0 00
50
100
150
200
250
300
350
400
450
500 600 700 800 900
Col
lect
ed W
ater
(ml)
Soil Thickness (mm)
Soil Thickness vs. Water Volume after Breakthrough (at 24hours)

SUSTAINABLE CLOSURE DEVELOPMENT PLANNING AND DESIGN FOR THE MUASSIM LANDFILL
3-22 | M U A S S I M L A N D F I L L 2 0 1 1
Table 3.6: Test data from vertical infiltration tests carried out in laboratory
Thickness, m
Inundation Volume,
liter
Time after start when
breakthrough takes place,
h
Time after start when
reading made of
volume of collected water, h
Volume of
collected water,
liter
Notes
0.1 3.31
0:01:47 1:19:00 1.912 0.2 0:04:59 0.3 0:26:15 2:08:00
18:07:20 0.566 0.588
0.4 0:26:02 16:51:55 0.267 0.5 0:59:09 23:29:00
24:00:00 0.417 0.426
0.6 2:29:24 23:25:00 24:00:00
0.316 0.323
0.7 Unrecorded 24:00:00 0.165 Breakthrough occurs at night
0.8 Unrecorded 22:50:00 3 drops Breakthrough occurs at night
0.9 No breakthrough
24:00:00 48:00:00
None No breakthrough even after 48 hours
Notes: Rainfall equivalent of 112 mm was applied at once, and for one time only (unrepeated). Each test
generally begins in the morning, circa 10.00 am. Breakthrough considered occurring when water begins to appear in the container underneath the cylinder. Breakthrough can be expected to occur when absorption depth reaches the bottom end of cylinder
Further tests have been carried out involving a layer of Malaysian laterite soil put on top
of Muassim equivalent sand in one test and laterite plus sand at 50:50 mix ratio put on
top of Muassim equivalent sand. In both cases, the thickness of sand used was 400 mm.
By referring to Figure 3.13, the poured water would only need 26 minutes to pass
through the 400 mm sand. By placing a 100 mm layer of laterite on top of the sand, the
breakthrough did not happen within 24 hour period. By placing 120 mm of laterite plus
sand, at 50:50 ratio, the same result was obtained, i.e., no breakthrough took place
within 24 hour period.
The results have indicated the merit of placing topsoil material on top of the existing sand
cover in Muassim in order to limit water from passing through the cover.
3.3.6 Verification of laboratory results by vertical infiltration tests at site The verification tests were conducted in Muassim, while earlier laboratory tests were
carried out in Universiti Sains Malaysia. The landfill site covers an area of about 0.81
km2. Being located in an arid environment, sands were the most convenient material
SUSTAINABLE CLOSURE DEVELOPMENT PLANNING AND DESIGN FOR THE MUASSIM LANDFILL
3-23 | M U A S S I M L A N D F I L L 2 0 1 1
from surrounding area that could be used for cover. From an earlier work, samples were
collected by grabbing at the surface at 9 spots. Nine samples were collected, that is one
sample from each spot, each about 2 kg. The sampling spots ran along a line traversing
the centre of the landfill with distances between spots at about 100 m. The samples were
taken to King Abdul Aziz University in Jeddah, Saudi Arabia, for geotechnical tests –
mainly the sieve analyses. Soils were then classified according to the Unified Soil
Classification System (USCS) based mainly on the results of sieve analyses. Out of the
9 samples tested, 5 have been classified as Poorly Graded Sand (SP), 3 were in the
borderline between Poorly Graded Sand (SP) and Well Graded Sand (SW), and one was
outright Well Graded Sand (SW).
As SP and SW were very closely positioned in the classification chart and looked almost
the same in naked eyes, they both can be said as representative of the soils at site.
Furthermore, the assessment at site suggested that the cover material was quite uniform
throughout the area. The extracts from grain size distributions of the sands from
Muassim as well as one produced in the Malaysian laboratory are given in Table 3.7.
The samples were never tested for permeability. However, any reference to geotechnical
engineering textbooks would suggest that the materials should have a permeability value
of between 10-3
cm/s to 1.0 cm/s. The soils could be described as highly permeable.
One would suggest that if given sufficient precipitation, surface water would readily
penetrate into the cover soils without much resistance. In normal circumstances, the type
of soils found at site would be considered poor or insufficient for the purpose it has been
intended for. As final cover of the landfill, the soil needed more fines in order to protect
rainwater from reaching the waste boy. Else, an impermeable membrane or a layer of
clayey soils could be applied at the surface. The other alternative would be to increase
the overall thickness of the cover such that any water from precipitation may just be
suspended within the cap with none reaching the waste body. Considering the lack of
clayey soils in the vicinity and the high cost of geotechnical liner, this last resort would
seem appealing to any engineer standing at the site working for a solution. Due to the
extremely arid climate of the region, a precipitation event would only cause surface water
to be suspended temporarily within the cover soils before evaporation returns it to the
atmosphere.

SUSTAINABLE CLOSURE DEVELOPMENT PLANNING AND DESIGN FOR THE MUASSIM LANDFILL
3-24 | M U A S S I M L A N D F I L L 2 0 1 1
Table 3.7: Gradation properties of Muassim samples and one Malaysian model
Sample 1
Sample 2
Sample 3
Sample 4
Sample 5
Sample 6
Sample 7
Sample 8
Sample 9
Model Sample
D 0.100 10 0.184 0.148 0.136 0.241 0.148 0.085 0.197 0.150 0.15 D 0.237 30 0.570 0.325 0.366 0.515 0.397 0.161 0.451 0.384 0.33 D 0.589 60 2.391 1.007 1.455 1.007 1.132 0.309 0.880 0.957 1.00 C 5.870 u 12.990 6.820 10.720 4.190 7.670 3.640 4.480 6.380 6.67 C 0.950 c 0.740 0.710 0.680 1.100 0.950 0.990 1.170 1.030 2.30
SP-SW SP SP SP SP SP-SW SP SP-SW SW SW Notes:
1. The units for D10, D30, and D60 are mm 2. Sample 1 to Sample 9 were taken from Muassim while Model Sample was produced in
Malaysian laboratory
A site investigation carried out later at site has indicated that the cover material ranged in
thickness from 1.0 m to 2.3 m. The waste thickness along the central line of the landfill
ranged from 12 m to 20 m and averaging around 17 m.
A convenient site around the centre of landfill was selected as test location where tests
were carried out a few meters from each other. In each test, sand was taken from
immediate ground and placed in a soil column which was a transparent perspex cylinder,
0.194 m in internal diameter and 1.200 m in height – exactly the same as ones used in
laboratory tests. Two sample thicknesses were used – 0.6 m and 1.0 m. The amount of
water used was 3.3 liter for each test. Times were taken at various stages of the tests.
The amount of water that passed through the sample in each test was not collected.
Instead, attention was paid on the required time for the absorption depth to reach the
base of column which indicates a breakthrough. The results of tests are given in Table
3.8 with various notes given at the bottom of the table.
It is apparent from Table 3.6 and Table 3.8 that the time required from breakthrough to
occur in a 0.6 m sample in the field is exactly the same as in the laboratory of the same
sample thickness. The breakthrough time for 1.1 m thick sample is again as long as in
the laboratory of comparable sample thickness of 0.9 m. Therefore it can be concluded
that the samples from site have behaved the same in terms of capacities associated with
vertical infiltration test in a column. Thus the validity of results obtained from working with
model samples produced in the Malaysian laboratory was corroborated.

SUSTAINABLE CLOSURE DEVELOPMENT PLANNING AND DESIGN FOR THE MUASSIM LANDFILL
3-25 | M U A S S I M L A N D F I L L 2 0 1 1
Table 3.8: Test data from vertical infiltration tests carried out in the field in Muassim
A B C D E F Test # Thickness
of sample inside column, m
Time taken for all of inundated water to penetrate into sand, min
Absorption depth when all of inundated water penetrated into sand, m
Absorption depth 30 minutes after start, m
Time breakthrough takes place, h
1
0.600
13 0.40 0.51 2 18 0.39 0.55 3 24 0.41 0.46 4 34 0.45 0.45 2:30 5 1.100 12 0.40 0.66 More than 22:00 6 1.100 12 0.40 0.61 More than 24:00
Note: 1. The inundation volume in each test was 3.3 liter 2. Absorption depth is the apparent depth of soil wetted by the advancing water (Column E) 3. The varying time taken for inundated water to penetrate into sand samples (Column C)
indicates that the samples differ in gradation, yet are having similar holding capacities (as indicated by data in Column D and Column E).
4. Tests 1, 2, and 3 were terminated before breakthrough took place.
3.3.7 Consequence of considering total catchment area The concluding remarks on the adequacy of the current cover have only considered
precipitation that would occur within the landfill boundary. The fact is all rainfall within the
larger catchment area would finally converge into the landfill area thus increasing the
amount of inundation that had been appointed in the previous analyses. The
determination of the amount of this increased average precipitation will require an
estimate of the total catchment area in addition to the landfill area unless a good cutoff
drainage is provided to deter surrounding precipitation from entering landfill area.
3.3.8 Notion of a low permeability barrier and top cover to support vegetation The complete design will consist of additional layers on top of existing one in Muassim. A
low permeability barrier may be introduced into the layers in addition to a top soil layer to
support vegetation.

SUSTAINABLE CLOSURE DEVELOPMENT PLANNING AND DESIGN FOR THE MUASSIM LANDFILL
3-26 | M U A S S I M L A N D F I L L 2 0 1 1
3.3.9 Notion of capillary barrier The capillary notion which has been proposed elsewhere is very much applicable for the
purpose of getting an efficient cover. In a capillary barrier, a fine grained soil layer is
placed on the top of a coarse-grained soil. When layers start to de-saturate, suction of
the underlying coarse layer is higher than that of the overlying fine-grained layer, thus
maintaining firmness of the hybrid combination. The effectiveness of a capillary barrier
comes from the ability of evaporation, transpiration, and lateral diversion, together, to
exceed infiltration from precipitation thereby keeping the system sufficiently dry so that
appreciable breakthrough does not occur. If breakthrough occurs, the system could no
longer function as a capillary barrier to the downward water movement and therefore
leachate will be generated. A report on the application of capillary barrier concepts at the
landfill however would be beyond the scope of this current report. The applicability of the
concepts for this project is also questionable due to the arid nature of the region.
3.3.10 Effect of repeated inundation Further tests will be required in order to investigate the effect of repeated rainfall
applications over the cover. Water can be applied into the column in stages in a period of
a few days, while the amount of each inundation may be decided in accordance to
monthly precipitation rates. 3.3.11 Results of a further test in Malaysian laboratory
As described earlier in Section 3.3.5, tests involving laterite layers have been carried out
in Malaysian laboratory. Laterite is a soil abundantly available in Malaysia which has
favorable properties for construction. The Saudi Arabian topsoil probably has properties
resembling Malaysian laterites. The results of the tests have indicated the merit of
placing topsoil material on top of the existing sand cover in Muassim in order to limit
water from passing through the cover.
3.3.12 Conclusion This section aims to study the effectiveness of an existing sandy landfill cover in
protecting a waste body against rainfall infiltration. The laboratory tests carried out in
Malaysia and field tests carried out in Muassim have suggested that the existing cover
material may protect the waste body against infiltration of unrepeated, one-time
inundation of a one-year equivalent of local rainfall which coincidently also equal to the
SUSTAINABLE CLOSURE DEVELOPMENT PLANNING AND DESIGN FOR THE MUASSIM LANDFILL
3-27 | M U A S S I M L A N D F I L L 2 0 1 1
Saudi Arabian average annual precipitation. However the laboratory tests and the field
tests are only valid for unrepeated rainfall situation. Therefore in order to have total
protection, an additional layer consisting of suitable liner is proposed together with an
overlaying topsoil to cater for vegetation.
SUSTAINABLE CLOSURE DEVELOPMENT PLANNING AND DESIGN FOR THE MUASSIM LANDFILL
4-1 | M U A S S I M L A N D F I L L 2 0 1 1
SECTION 4
BURIED WASTE AND VOLUME
SUSTAINABLE CLOSURE DEVELOPMENT PLANNING AND DESIGN FOR THE MUASSIM LANDFILL
4-2 | M U A S S I M L A N D F I L L 2 0 1 1
4.1 BURIED WASTE The area concerned from surface to bottom was generally covered by 3 types of
waste/contamination, i.e. scattered construction waste, domestic solid waste and
contaminated sandy gravel soil (as seen in borehole logs). Detailed descriptions of the
domestic waste composition and other refuse are given in borehole log (BH-3, 5 and 6)
as attached in APPENDIX AA (BH-3), APPENDIX AB (BH-5) and APPENDIX AC (BH-5),
respectively.
As observed in the boreholes logs, the domestic waste to certain extend were mixed with
industrial wastes. The general composition of the waste often made-up of loose to soft,
partly to slightly decomposed solid waste, comprising, mainly, mixture of thin plastics
bags/sheet, broken/fragmented pieces of plastic made bottle containers (PVC, HDPE
etc.), pieces of paper carton drink containers, brown cardboards, and occasionally
rubber tyres, tin cans, woods chunks, old carpet, ropes, broken glass containers, metal
plates and traces of decomposed organics matters remain. Generally wet and thoroughly
contaminated by the presence of strong leachate odour.
In general, the thickness of the solid waste refused is varied from places to places within
the landfill of about 10 to 20m which reflected the depth of the existing ground surface.
This was clearly shown by the individual borehole logs and its correlation as shown in
Figure 4.1 and 2D Earth resistivity tomography cross-sections (Figure 4.1). Presence of
thin sandy layers at specific depth intervals (around 5m and 10m) indicated sand layers
were applied to separate top and bottom waste lift.
4.2 REFUSAL WASTE VOLUME
Information obtained from survey map, 2D Earth resistivity (ERT) section tomography
and borehole log information were generally used to determine the total volume of
Muassim landfill’s solid waste refused in the area.
Three approaches and assumptions were employed in the practice to estimate the total
volume of the solid waste, including contaminant zone within Muassim landfill as follows.
1. Assumption the average thickness of the refuse waste based on the borehole data
of about 10 to 20m, especially in the middle of the valley time the total surface area
(Figure 4.1).

SUSTAINABLE CLOSURE DEVELOPMENT PLANNING AND DESIGN FOR THE MUASSIM LANDFILL
4-3 | M U A S S I M L A N D F I L L 2 0 1 1
Figure 4.1: Borehole correlation that show variability in waste and dept to bedrock thickness at Muassim landfill Note : Detailed records of the above boreholes are attached in Appendix AA (BH-3), Appendix AB (BH-5) and Appendix AC (BH-6) 2. Estimation by incorporated the 16 numbers of 2D Earth resistivity (ERT) subsurface
imaging cross-sections, normally with SW-NE trending survey line which each line
length between 200-400m as detailed in Table 4.1. The total depth to the base of the
waste body was approximated from resistivity values for waste/leachate bearing
region. AutoCAD was used to calculate the slice area of each 2D cross-section.
Horizontal: not to scale (for illustration only)
0
5
10
15
20
24
Metre BH-3 BH-6 BH-5 Sandy gravels, the cover materials (yellow). Well sorted. Partly decomposed, solid waste (black shade). Mainly domestic waste and some industrial waste Thin sandy and gravel interlayer with waste. Seemed not continuous Thin gravely sand/rock fragments
High fractured/jointed granite bedrock (RQD < 10-15%. Leachate contaminated is likely.
NW SW
? ?
?
LEGEND: Sandy gravel Refuse waste gravely sand Bedrock
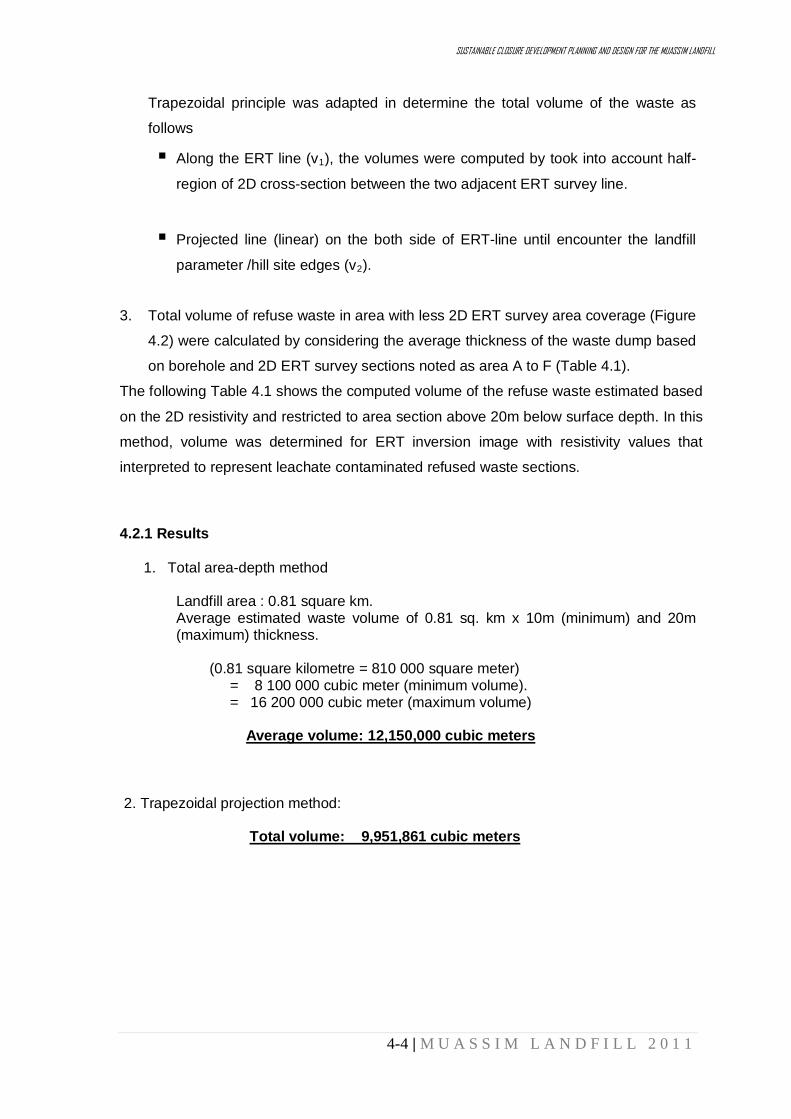
SUSTAINABLE CLOSURE DEVELOPMENT PLANNING AND DESIGN FOR THE MUASSIM LANDFILL
4-4 | M U A S S I M L A N D F I L L 2 0 1 1
Trapezoidal principle was adapted in determine the total volume of the waste as
follows
Along the ERT line (v1
), the volumes were computed by took into account half-
region of 2D cross-section between the two adjacent ERT survey line.
Projected line (linear) on the both side of ERT-line until encounter the landfill
parameter /hill site edges (v2
).
3. Total volume of refuse waste in area with less 2D ERT survey area coverage (Figure
4.2) were calculated by considering the average thickness of the waste dump based
on borehole and 2D ERT survey sections noted as area A to F (Table 4.1).
The following Table 4.1 shows the computed volume of the refuse waste estimated based
on the 2D resistivity and restricted to area section above 20m below surface depth. In this
method, volume was determined for ERT inversion image with resistivity values that
interpreted to represent leachate contaminated refused waste sections.
4.2.1 Results
1. Total area-depth method Landfill area : 0.81 square km.
Average estimated waste volume of 0.81 sq. km x 10m (minimum) and 20m (maximum) thickness.
(0.81 square kilometre = 810 000 square meter) = 8 100 000 cubic meter (minimum volume). = 16 200 000 cubic meter (maximum volume)
Average volume: 12,150,000 cubic meters
2. Trapezoidal projection method:
Total volume: 9,951,861 cubic meters

SUSTAINABLE CLOSURE DEVELOPMENT PLANNING AND DESIGN FOR THE MUASSIM LANDFILL
4-5 | M U A S S I M L A N D F I L L 2 0 1 1
Table 4.1: Volume of refuse waste estimation based on 2D Earth resistivity line sections (sections and lines are shown in Figure 4.2 and Figure 4.3 respectively)
Note: This method only apply to area with the availability of 2D earth resistivity data. In this case, the second method is more acceptable, where we believed that the topography features of the landfill basement is U-shape like, undulating in places, and shallow on the area near the hill sites.
ERT survey line and other section
2D
resistivity (< 20m depth)
section (m sq.)
Both site
area section (m.sq.)
Total area (m
sq.)
Projection
section (m. sq.)
Distance between
two adjacent line (m)
Average waste depth
(m)
Volume (meter cubic)
A B (A+B) C D E Line 2 –Line 3 (L18-L17) 2844 628 3472 4120 72.78 276272.88 Line 3 –Line 4 (L17-L16) 3044 1076 4120 2250 78.89 251264.65 Line 4 –Line 5 (L16-L15) 1830 420 2250 2413 97.14 226481.91 Line 5 –Line 6 (L15-L4) 2363 50 2413 3740 97 298420.50 Line 6 –Line 7 (L4-L14) 3340 400 3740 4311 59.04 237665.52 Line 7 –Line 8 (L14-L3) 3851 460 4311 3251 48.65 183945.65 Line 8 –Line 9 (L3-L13) 2751 500 3251 2903 80.64 248129.28 Line 9 –Line 10 (L13-L12) 2903 0 2903 3908 71.81 244548.96 Line 10 –Line 11 (L12-L11) 3221 588 3809 5394 53.8 247560.70 Line 11 –Line 12 (L11-L8) 3644 1750 5394 7843 37.97 251304.45 Line 12 –Line 13 (L8-L9) 7365 478 7843 8870 64.86 542002.59 Line 13 –Line 14 (L9-L19) 8200 670 8870 9487 57.73 529874.81 Line 14 –Line 15 (L19-L20) 9357 130 9487 5779 111.79 853293.07 Line 15 –Line 16 (L20-L21) 5317 462 5779 3222 120.11 540555.06 Line 16 –Line 17 (L 21-L22) 3222 0 3222 2309 131.54 363773.87 Line 21 –Line 20 (L 28-L27) 2309 0 2309 3629 140.53 417233.57 Area A 18 805392.00 Area B 18 950706.00 Area C 18 350298.00 Area D 18 737604.00 Area E 18 759384.00 Area F 15 636150.00
Total Volume >>> 9,951,861

SUSTAINABLE CLOSURE DEVELOPMENT PLANNING AND DESIGN FOR THE MUASSIM LANDFILL
4-6 | M U A S S I M L A N D F I L L 2 0 1 1
Example 1: Cross section – area estimation – Line 2 (L18)
Example 2: Cross section – area estimation –Line 3 (L17)
Example 3: Cross section – area estimation – Line 10 (L12) ( <100m)
Figure 4.2: Illustrations that show the examples of total volume estimation via Trapezoidal principle with reference to 2D ERT sections
Note: The whole earth resistivity survey line positions (LINE 1-28) are presented in APPENDIX AH- AK

SUSTAINABLE CLOSURE DEVELOPMENT PLANNING AND DESIGN FOR THE MUASSIM LANDFILL
4-7 | M U A S S I M L A N D F I L L 2 0 1 1
Figure 4.3: Earth resistivity area lines used in the waste volume estimation using Trapezoidal principle and volumes from areas noted A to F

SUSTAINABLE CLOSURE DEVELOPMENT PLANNING AND DESIGN FOR THE MUASSIM LANDFILL
5-1 | M U A S S I M L A N D F I L L 2 0 1 1
SECTION 5
HYDROLOGY STUDY
5-2 | M U A S S I M L A N D F I L L 2 0 1 1
5.1 INTRODUCTION Makkah lies in the arid region, where the average annual rainfall is as low as 60 mm.
The historical rainfall data show that the annual rainfall may vary between almost 0 to
285 mm. During the winter months, the weather is very pleasant with mean monthly
minimum temperature varying between 19°C and 22°C while the mean monthly
maximum varies between 29°C and 32°C. The absolute minimum and maximum
temperature in this period may reach 11°C and 40°C, respectively. While in summer
months, the mean monthly minimum temperature varies from 25°C to 29°C and the
monthly maximum of this period may ranges between 36°C and 37°C. The absolute
minimum and maximum temperatures in this season may reach 20°C and 47°C,
respectively. The minimum relative humidity values range between 38% and 50%
throughout the year, while the maximum values range between 78% and 85%. 5.2 RAINFALL The climate in Makkah area can be described by considering the various air masses that
affect rainfall distribution over the area. The climate is a combination of Mediterranean
(cyclonic system), which moves in from the north during winter and monsoonal from the
southwest in summer. The Hijaz Escarpment altitude is the major factor controlling the
quantity and pattern of rainfall. How these air masses and rainfall patterns influence the
Kingdom was discussed and mapped previously (Şen 1983; Alyamani and Şen 1992;
Subyani 2004; Nouh 2006).
Due to the different morphological units in the landfill area, which encompassed foothills,
and mountains, the climatological stations were combined based on whether its location
was related to one of these three morphological units. Average rainfall and temperature
data are summarized in Table 5.1. This table shows high variation in mean rainfall
between the coastal and mountainous areas. Temperatures in the foothills were only
slightly different from those in the coastal area, but differed greatly from the mountains.
Assessment of the long-term average annual rainfall depth in the study area from 1970
to 2005 demonstrates that the spatial variation of rainfall is influenced by topography
(Figure 5.1 and 5.2). The orographic effect states that annual rainfall increases with
elevation. Generally, the eastern part of the wadi catchments received considerably
more rainfall with an average of more than 220 mm per year near the Hijaz Escarpment
as compared to the lower (western) part of the wadi, which received an average of less
than 100 mm per year near the Red Sea coast (Tihamah). Overall, rainfall tended to be
more regular in the highlands than the coastal plain. As refer to Figure 5.1, the Makkah
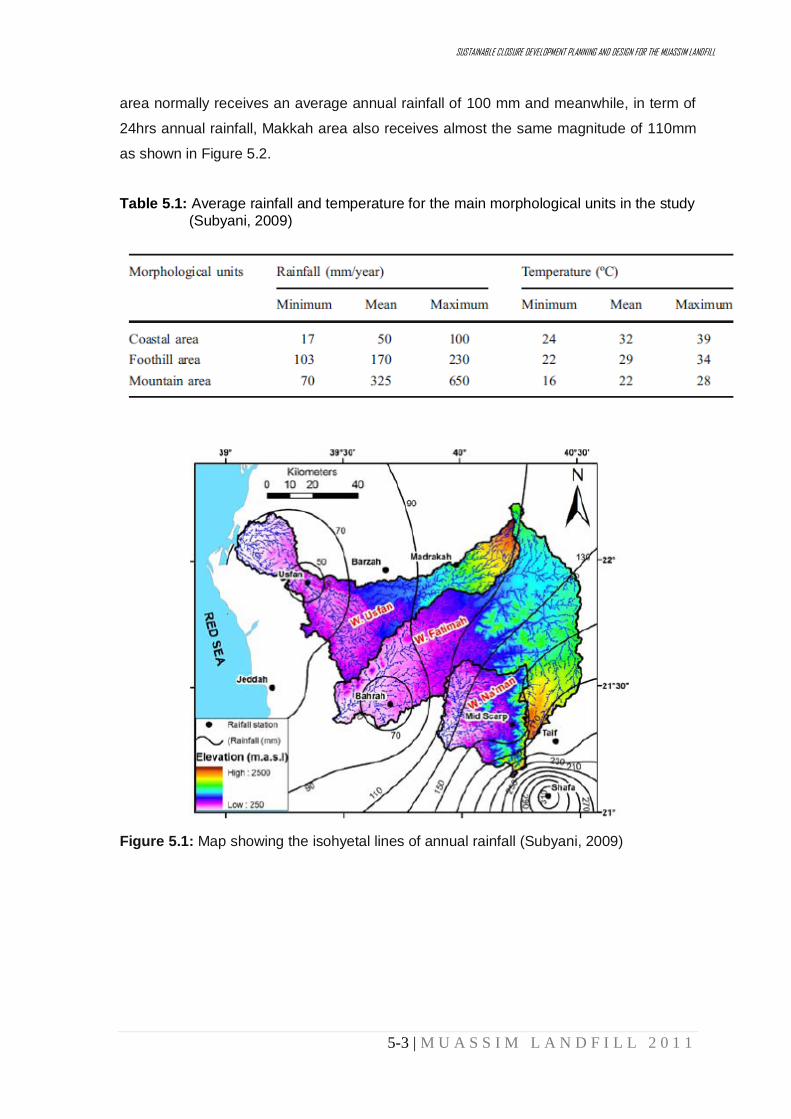
SUSTAINABLE CLOSURE DEVELOPMENT PLANNING AND DESIGN FOR THE MUASSIM LANDFILL
5-3 | M U A S S I M L A N D F I L L 2 0 1 1
area normally receives an average annual rainfall of 100 mm and meanwhile, in term of
24hrs annual rainfall, Makkah area also receives almost the same magnitude of 110mm
as shown in Figure 5.2.
Table 5.1: Average rainfall and temperature for the main morphological units in the study (Subyani, 2009)
Figure 5.1: Map showing the isohyetal lines of annual rainfall (Subyani, 2009)

SUSTAINABLE CLOSURE DEVELOPMENT PLANNING AND DESIGN FOR THE MUASSIM LANDFILL
5-4 | M U A S S I M L A N D F I L L 2 0 1 1
Figure 5.2: Annual maximum observed of 24-h rainfall (Subyani, 2009)
A number of wadis originated from the foothills drain their seasonal flood water towards
the Holy city. The Makkah city expands much faster than the capability of the city
municipality to design and construct a complete storm sewer network, and as the new
development intercepts the natural flood plain and lead to an increase in stormwater
runoff as a result of the increase in the percentage of impervious area. For example,
many city streets are flooded during the rainy season due to local catchments runoff and
depressions or due to unmanageable flow from the wadis. In this situation, even the
occurrences of relatively low rainfall events create drainage problems. The Intensity, Duration and Frequency (IDF) curves for Jeddah based on Saudi
Consulting Services (2003) data are shown in Figure 5.3. The Makkah IDF is not
available, however based on the annual rainfall depth, the Jeddah IDF curve could be
utilized in the design processes.

SUSTAINABLE CLOSURE DEVELOPMENT PLANNING AND DESIGN FOR THE MUASSIM LANDFILL
5-5 | M U A S S I M L A N D F I L L 2 0 1 1
Figure 5.3: Intensity, Duration and Frequency curve for Jeddah (After Saudi Consult, 2003) As refered to Saudi Consult (2003), the curve fitting of the data presented in Figure 5.3
that produces the following correlation for rainfall intensity as a function of storm duration
and frequency (R2
I = [8.37+ 17.14 ln(F)] (D)
= 0.99):
Where,
-0.60
I is the rainfall intensity (mm/hr),
F is the storm frequency period (years) = 2, 10, 20, 50 or 100 years,
D is the storm duration in hours.
Although the average rainfall is only 60 mm, and the maximum and minimum values
ranges up to 280 mm, but the storms are more often characterized by a short period but
high intensity storm which may lead to flash floods. The recorded history of the Makkah
does not record any sever casualty of the flash flood, until the unprecedented
devastating flood that hit the eastern part of the Makkah on 1426 (Subyani et al.2009).
For example, during Hajj season, Makkah area, 1426H (22 January 2005), experienced
a heavy rain storm that was described as the worst in 20 years. As a result, 29 people
were killed, and 17 were wounded. Flood waters swept cars off roads and destroyed
bridges, electrical towers, and communications. Flash floods also occurred in some parts
of Makkah city in January 2008. Most rainstorms within the Makkah area did not exceed

SUSTAINABLE CLOSURE DEVELOPMENT PLANNING AND DESIGN FOR THE MUASSIM LANDFILL
5-6 | M U A S S I M L A N D F I L L 2 0 1 1
3 h, and according to rain gauge data, rainfall totals did not exceed 100 mm in this area
(Subyani et al.2009). Muassim landfill is being slightly 7 km east off Makkah should
receive a little more than the Makkah city’s 100 mm, thus 110 mm per year is a
reasonable estimate. Coincidently, the country, Saudi Arabia, is also receiving 112 mm
per year on the average. The amount of rainfall for Muassim landfill is based on
precipitation data by Subyani (2004) of towns in the area, including Makkah, as shown in
Table 5.2. Table 5.3 is another of Subyani (2004) which presents a contoured distribution
of yearly precipitation around the area.
Table 5.2: Intensity, Duration and Frequency data of Jeddah as estimated by different studies
Return Period (Years) Duration Saudi Consulting
Services (2003) Al-Rashid (1994) Kattand and Gibb (1984)
2
Intensity (mm) 10 Min 9.3 12.6 11.3 30 Min 15.7 19 18.9 1 Hr 20 23.1 22.6 3 Hr 23.5 26.6 26.2 12 Hr 27.6 30.5 28 24 Hr 29 32.1 32
5
10 Min 17.9 20.4 16.4 30 Min 30.2 33.4 27.7 1 Hr 38.6 41.6 36.4 3 Hr 45.4 48.7 43 12 Hr 53.2 56.8 46.6 24 Hr 56 59.9 53.1
10
10 Min 23.7 25.5 20 30 Min 40 42.9 33.1 1 Hr 51.1 53.9 45.1 3 Hr 59.9 63.4 53.9 12 Hr 70.3 74.1 59 24 Hr 74 78.4 67
20
10 Min 29.1 30.5 23.3 30 Min 49.1 52.1 38.9 1 Hr 62.8 65.7 53.9 3 Hr 73.7 77.5 64.4 12 Hr 86.5 90.8 71 24 Hr 91 96.1 80.4
50
10 Min 36.2 36.8 27.7 30 Min 61 63.9 45.9 1 Hr 78 81 64.8 3 Hr 91.5 95.7 77.9 12 Hr 107.4 112.4 85.9 24 Hr 113 119 97.6
100
10 Min 41.6 41.6 30.9 30 Min 70.2 72.7 51.5 1 Hr 89.7 92.4 73.5 3 Hr 105.3 109.4 88.5 12 Hr 123.5 128.6 97.9 24 Hr 130 136.1 110.7

SUSTAINABLE CLOSURE DEVELOPMENT PLANNING AND DESIGN FOR THE MUASSIM LANDFILL
5-7 | M U A S S I M L A N D F I L L 2 0 1 1
Table 5.3: Mean annual rainfall around the study area (Subyani, 2004)
Location Longitude Latitude Mean Annual Rainfall (mm) Adham 40.91 20.48 327 Firrain 40.12 21.37 192 Wadi Muhrem 40.33 21.27 185 Ashafa 40.36 21.07 260 Jerinuz 40.42 21.07 180 Lith 40.28 20.15 90 Ghomaiga 40.45 20.33 75 Makkah 39.83 21.427 100 Bahrah 39.7 21.43 60 Jeddah 39.18 21.568 60 Dahya 40.28 21.27 165 Shadad 40.22 21.35 130 Kur 40.253 21.344 131

SUSTAINABLE CLOSURE DEVELOPMENT PLANNING AND DESIGN FOR THE MUASSIM LANDFILL
6-1 | M U A S S I M L A N D F I L L
SECTION 6
GROUNDWATER AND LEACHATE QUALITY

SUSTAINABLE CLOSURE DEVELOPMENT PLANNING AND DESIGN FOR THE MUASSIM LANDFILL
6-2 | M U A S S I M L A N D F I L L
6.1 LEACHATE SAMPLING, ANALYSES AND TREATMENT DESIGN Leachate may be defined as liquid that has percolated through solid waste and has
extracted dissolved or suspended materials (Tchobanoglous et al. 1993). In most cases
leachate is composed of liquid that has entered the landfill via external sources including
surface drainage, rainfall, groundwater, water from underground spring and the liquid
produced from the decomposition of the wastes, if any. Presence and composition of
leachate from existing wells and newly drilled boreholes are sampled and analysed.
The main objective and methodological approach taken in this study is to provide adequate
information for understanding leachate behaviour in terms of their distribution, chemical
composition and their impact to the environment. Eventually to design the appropriate and
strategic leachate collection system and treatment plant construction (size, location and
capacity).
The following convention and strategies were initially proposed in the design of leachate
collection and treatment system:
1. To lay leachate collection pipes system within the existing landfill by digging the main
conveyance trench at least 2/3 of the depth or if possible to the base of the landfill.
The branch pipes will be laid accordingly.
2. To draft specification for leachate collection pipes and associated works.
3. To propose a leachate collection pond situated downstream of the main conveyance
pipe.
4. To propose a cut-off dam after the leachate collection pond. Aeration will be carried
out in the leachate collection pond and the leachate will be pump back into the
landfill through the gas vent pipes. This means there will be a total of 3 leachate
collection ponds, each located at the upstream of cut-off point.
5. The cut-off points will be made based on the shortest distance between two hills at
the landfill site. The purpose is to contain leachate migration. It is proposed that
waste materials downstream of the cut-off points have to be transferred to upstream.
6. Three leachate treatment plants will be constructed near each cut-off point and the
design will be based on the current leachate treatment plant at Pulau Burung and
Langkawi, Malaysia for which the team members have the experience.

SUSTAINABLE CLOSURE DEVELOPMENT PLANNING AND DESIGN FOR THE MUASSIM LANDFILL
6-3 | M U A S S I M L A N D F I L L
However, after discussion with Dr Asaad, and additional site technical evaluation, the above
proposals could not be implemented and further revised. Alternative solution involving
leachate pumping wells is presented in Part C: Section 10
6.2 GROUNDWATER AND LEACHATE QUALITY There were six existing monitoring well constructed (three inside and three outside the
landfill). The wells were labelled as MLG1, MLG2, MLG3, MLG4, MLG5 and MLG6 (Figure
6.1). MLG6 as indicated on utility map were locked and can’t be accessed for ground
water/leachate sampling. The 6” PVC screen was installed and covered by sandy gravel.
Lengths of the screens were depending on the depth of the ground water level. The
leachate or groundwater was sampled using a baler. All results were shown in Table 6.1
with Pulau Burung, Malaysia data as a comparison.
Figure 6.1: Location of existing monitoring wells (yellow) and initially proposed monitoring wells (red star)
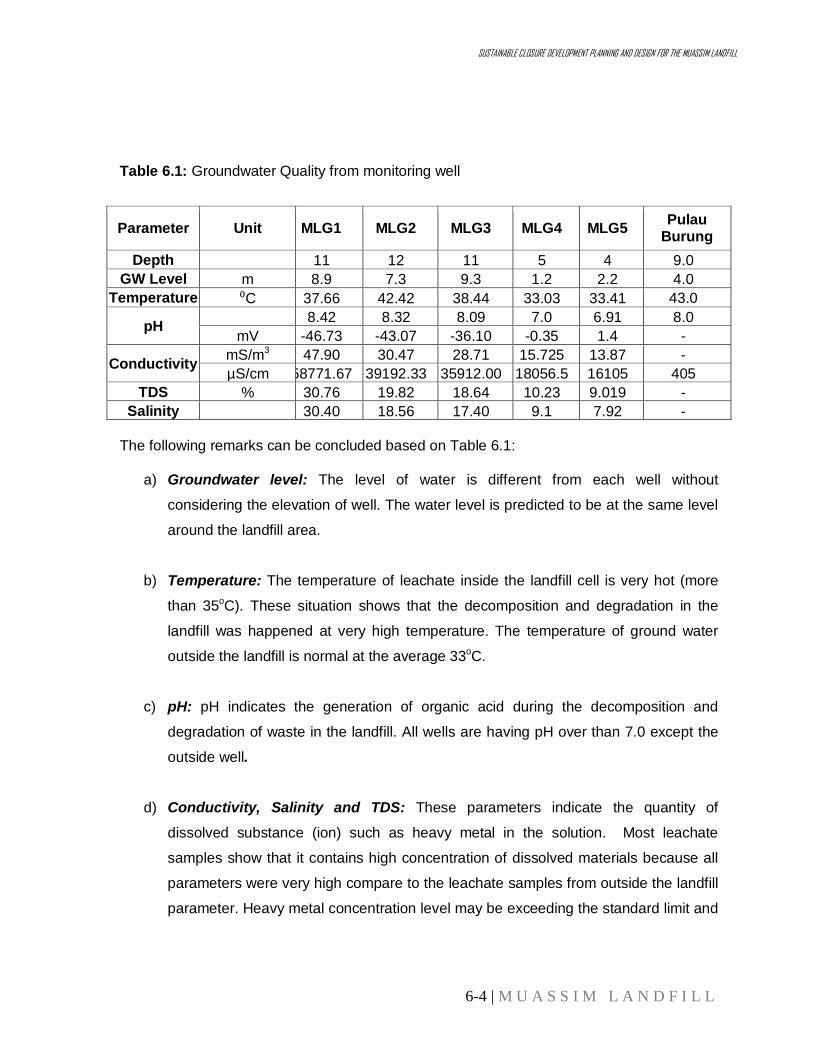
SUSTAINABLE CLOSURE DEVELOPMENT PLANNING AND DESIGN FOR THE MUASSIM LANDFILL
6-4 | M U A S S I M L A N D F I L L
Table 6.1: Groundwater Quality from monitoring well
Parameter Unit MLG1 MLG2 MLG3 MLG4 MLG5 Pulau Burung
Depth
11 12 11 5 4 9.0 GW Level m 8.9 7.3 9.3 1.2 2.2 4.0
Temperature ⁰C 37.66 42.42 38.44 33.03 33.41 43.0
pH 8.42 8.32 8.09 7.0 6.91 8.0 mV -46.73 -43.07 -36.10 -0.35 1.4 -
Conductivity mS/m3 47.90 30.47 28.71 15.725 13.87 - µS/cm 58771.67 39192.33 35912.00 18056.5 16105 405
TDS % 30.76 19.82 18.64 10.23 9.019 - Salinity 30.40 18.56 17.40 9.1 7.92 -
The following remarks can be concluded based on Table 6.1:
a) Groundwater level: The level of water is different from each well without
considering the elevation of well. The water level is predicted to be at the same level
around the landfill area.
b) Temperature: The temperature of leachate inside the landfill cell is very hot (more
than 35oC). These situation shows that the decomposition and degradation in the
landfill was happened at very high temperature. The temperature of ground water
outside the landfill is normal at the average 33o
C.
c) pH: pH indicates the generation of organic acid during the decomposition and
degradation of waste in the landfill. All wells are having pH over than 7.0 except the
outside well.
d) Conductivity, Salinity and TDS: These parameters indicate the quantity of
dissolved substance (ion) such as heavy metal in the solution. Most leachate
samples show that it contains high concentration of dissolved materials because all
parameters were very high compare to the leachate samples from outside the landfill
parameter. Heavy metal concentration level may be exceeding the standard limit and

SUSTAINABLE CLOSURE DEVELOPMENT PLANNING AND DESIGN FOR THE MUASSIM LANDFILL
6-5 | M U A S S I M L A N D F I L L
there is a need to check the heavy metal concentration. Table 6.2 shows the typical
composition of leachate (Tchobanoglous et al. 1993)
Table 6.2: Some typical constituents of leachate
Constituent Value in mg/L
New landfill (less than 2 years)
Mature landfill (>10 years)
BOD 10,000 5 100-200 TOC 6,000 80-160 COD 18,000 100-500 TSS 500 100-400 Alkalinity as CaCO 3,000 3 200-1000 Total hardness as CaCO 3,500 3 200-500 Calcium 1,000 100-400 Magnesium 250 50-200 Potassium 300 50-400 Sodium 500 100-200 Chloride 500 100-400 Sulfate 300 20-50 Ammonia nitrogen 200 20-40 Source:Tchobanoglous et al. 1993
e) Dissolved oxygen (DO): Dissolved oxygen in the landfill leachate was measured by
DO meter. The results show that the values were in the range of 30 to 47 %.
Meanwhile, the DO of groundwater from outside well is much higher than the
leachate.
f) Oxygen Reduction Potential (ORP): Oxygen Reduction Potential (ORP) indicates
the aerobic or anaerobic condition in the landfill cell. The results clearly show the
anaerobic condition occurred in the landfill cell.
6.3 CONSTRUCTION OF NEW MONITORING WELL There were 12 new groundwater wells being proposed to be constructed (Figure 6.1). The
purposes of these wells were to study the quality of leachate, water level and the direction of
water flow. After some adjustments only three wells were installed inside the landfill. (BH3,
BH5, BH6) whereas 2 wells were installed outside (BH11 and 12) as shown in Figure 6.2.
Only groundwater (leachate) from two newly established boreholes (BH5 and BH6)
(groundwater wells) were sampled. The location of the actual constructed boreholes during
the investigation are shown in Figure 6.2 (marked in blue color)

SUSTAINABLE CLOSURE DEVELOPMENT PLANNING AND DESIGN FOR THE MUASSIM LANDFILL
6-6 | M U A S S I M L A N D F I L L
The results (Table 6.3.) show that anaerobic condition occured in the landfill with thermopile
degradation process. Electrical conductivity of the leachate is very high which indicates that
the concentration of organic materials and dissolved ions are also higher.
Table 6.3: Leachate quality from groundwater well
Parameter Unit BH-6 BH-5 Pulau Burung Malaysia
Depth M 22.2 22.62 9.0 GW Level M 17.5 10 4.0 Temperature ⁰C 43.06 35.6 43.0 Conductivity mS/m 47.23 3 13.08 - Conductivity µS/cm 63376 15963 405 TDS % 30.46 8.623 - Salinity 29.83 7.51 - DO % 35.1 39.3 - DO mg/L 1.85 2.58 - pH 9.5 8.0 8.0 pH Mv 82.2 -33.2 - ORP -243.2 -185.6 350
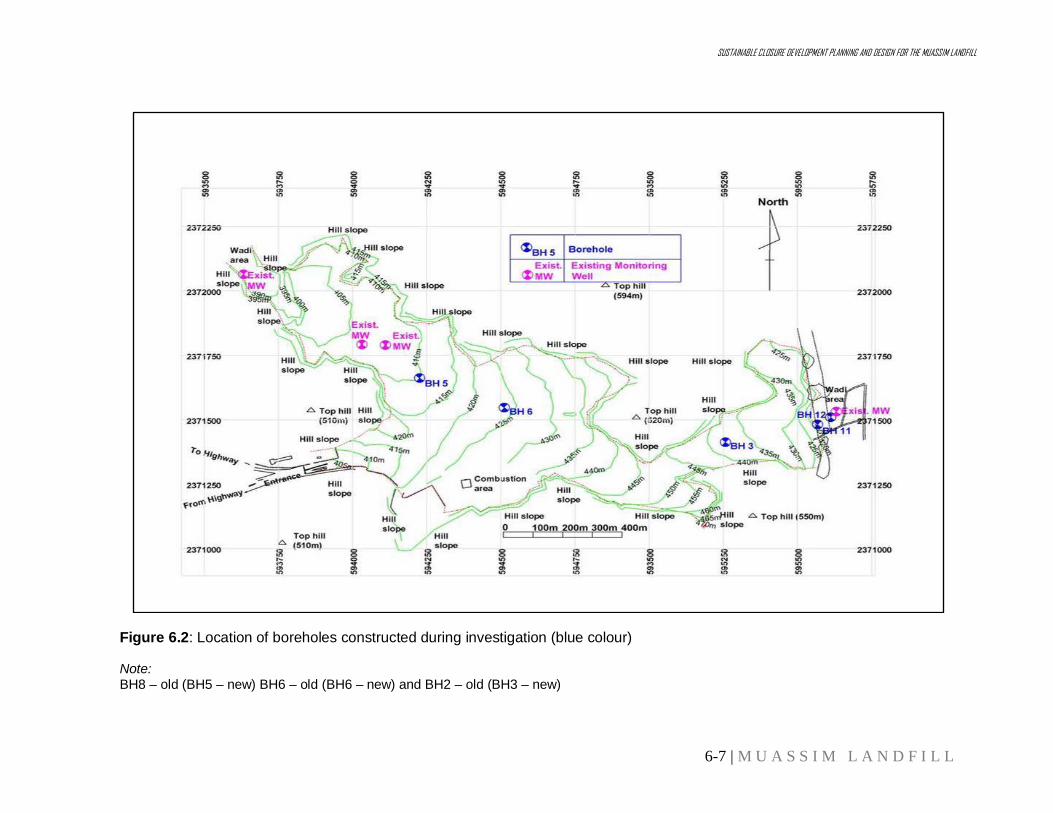
SUSTAINABLE CLOSURE DEVELOPMENT PLANNING AND DESIGN FOR THE MUASSIM LANDFILL
6-7 | M U A S S I M L A N D F I L L
Figure 6.2: Location of boreholes constructed during investigation (blue colour) Note: BH8 – old (BH5 – new) BH6 – old (BH6 – new) and BH2 – old (BH3 – new)

SUSTAINABLE CLOSURE DEVELOPMENT PLANNING AND DESIGN FOR THE MUASSIM LANDFILL
7-1 | M U A S S I M L A N D F I L L 2 0 1 1
SECTION 7
LANDFILL GAS ANALYSES

SUSTAINABLE CLOSURE DEVELOPMENT PLANNING AND DESIGN FOR THE MUASSIM LANDFILL
7-2 | M U A S S I M L A N D F I L L 2 0 1 1
7.1 LANDFILL GAS SAMPLING AND ANALYSES DESIGN Gas emission from existing gas-vent installation throughout the landfill was sampled and
analysed for its composition as given by Tchobanoglous et al. (1993). This will provide
basis for the closure design of the gas collection and treatment system.
Landfill gases must be controlled for as long as they are expected to be generated
during decomposition of waste after being buried. Typical landfill gas control facilities are
extraction wells, collector and transmission piping, and gas flaring or combustion
facilities. The landfill gas control system used while the landfill was active is also used for
the control of landfill gases after the landfill has been closed. The most critical design
steps are the selection of materials and placement of wellheads, valves and collection
pipes in the final cover. The materials gas piping system must be flexible to withstand
movement when the land settles, and strong enough to withstand the loadings of
vehicles passing over the surface when maintaining landscape plants and the gas
extraction and collection facilities.
7.2 LANDFILL GAS MONITORING AND QUALITY Gas monitoring was carried out between 30th January and 3 February 2010. It was found
that the gas collection facilities consist of main vertical ventilation 4” PVC pipe and
connected with horizontal 4” PVC pipe. All connections equipped with ball valve. The
distance between each vertical pipe is 30’. There are about 600 gas monitoring wells
were installed inside the landfill area as shown in Appendix AF. Average depth of vertical
pipe is 7.0m and in the range of 1.9m to 14.0m. About 120 gas vents have been
monitored around the landfill. The methane gas is mainly emitted from the landfill. The
average rate is 54%, which indicates that it can be utilized as a fuel to generate power.
The distribution of the monitor PVC gas vent is shown in Figures 7.3 and 7.4 based on
the CH4 composition.
Some of the gas connection pipes (Made of PVC materials) were broken and need to be
replaced (Figure 7.2). Changing with the other HDPE pipe is recommended. Table 7.1
gives the results of analysed samples in comparison with Pulau Burung, Malaysia.

7-3 | M U A S S I M L A N D F I L L
Figure 7.1: Landfill gas analysis activity
Figure 7.2: PVC gas Collection system
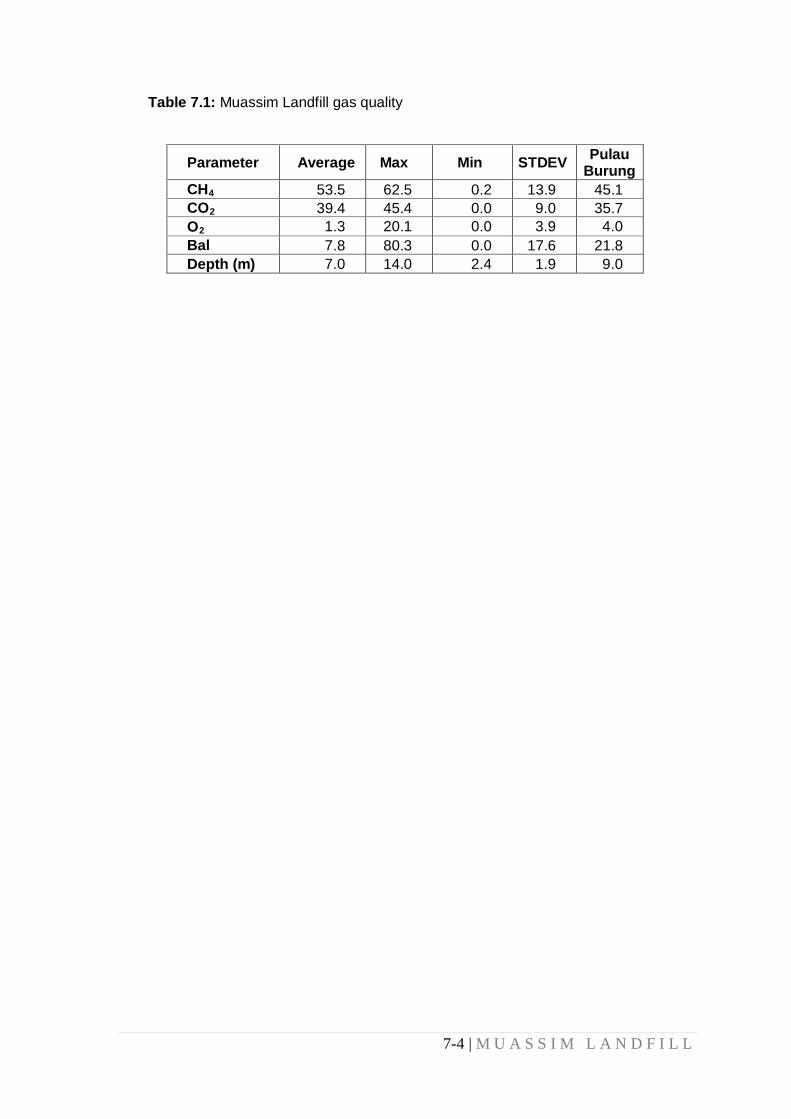
7-4 | M U A S S I M L A N D F I L L
Table 7.1: Muassim Landfill gas quality
Parameter Average Max Min STDEV Pulau Burung
CH4 53.5 62.5 0.2 13.9 45.1 CO2 39.4 45.4 0.0 9.0 35.7 O2 1.3 20.1 0.0 3.9 4.0 Bal 7.8 80.3 0.0 17.6 21.8 Depth (m) 7.0 14.0 2.4 1.9 9.0

7-5 | M U A S S I M L A N D F I L L
:
Figure 7.3: Detailed survey PVC gas vent points

7-6 | M U A S S I M L A N D F I L L
Figure 7.4: Contour of CH4
concentration level in Muassim landfill

SUSTAINABLE CLOSURE DEVELOPMENT PLANNING AND DESIGN FOR THE MUASSIM LANDFILL
8-1 | M U A S S I M L A N D F I L L 2 0 1 1
PART C: SECTION 8
LANDFILL CLOSURE PROGRAM

SUSTAINABLE CLOSURE DEVELOPMENT PLANNING AND DESIGN FOR THE MUASSIM LANDFILL
8-2 | M U A S S I M L A N D F I L L 2 0 1 1
8.1 PROPOSAL FOR FINAL LANDFILL CAP 8.1.1 Design considerations of cover/capping materials This section aims to compile various considerations for the improved cover design of the
landfill in Muassim. The adequacy of the current cover layer has been described in
Chapter 3. The currently existing 1 m to 2.3 m thick cover layer made of sandy materials
was found to be sufficient in protecting the waste body against an ideal infiltration of
unrepeated, one-time inundation of a one-year equivalent of local rainfall which
coincidently also equal to the Saudi Arabian average annual precipitation. However,
since the circumstances at site are not as ideal as assumed in the analyses, the new
upgraded design of the cover should consider the non-ideal factors such as catchment
area being larger than precipitation area, inundations being repeated phenomena and
not only a one-time occurrence, and cap layer being a medium to support vegetation and
recycled leachate, not only to retain precipitation.
A landfill cover design for Muassim, such as recommended in Figure 8.1, should
attempt to achieve the following five goals (Oweis and Khera, 1998):
1. Minimize infiltration from precipitation, and hence minimize leachate generation.
2. Develop a cap that is not more permeable than the bottom liner system (which is
non-existent in the case of Muassim).
3. Promote drainage from the surface with minimal erosion.
4. Accommodate settlements and subsidence.
5. Operate with minimum maintenance.

SUSTAINABLE CLOSURE DEVELOPMENT PLANNING AND DESIGN FOR THE MUASSIM LANDFILL
8-3 | M U A S S I M L A N D F I L L 2 0 1 1
Figure 8.1: A recommended design for final cover (after Oweis and Khera, 1998) From Oweis and Khera (1998), a cover design for Muassim should further consider the
following matters:
1. The vegetation cover is needed to minimize erosion and bring about naturalization
process.
2. Plant species for vegetation should not have a deep root system that damages the
barrier layer.
3. The recommended top soil layer should accommodate non-woody cover plants.
4. Top slopes between 3 % and 5 % are recommended to avoid pooling and
erosion. In Muassim, the existing contour indicates that this gradient requirement
is achievable.
5. A surface drainage system must accommodate runoff to avoid rills and gullies.
6. To avoid clogging, a separation filter is recommended between the drainage
layer and the vegetative support layer (Figure 8.1).
7. The 20-mil (minimum thickness) geomembrane (also called liner) must be
protected by a bedding of sand (SP – poorly graded sand) free of stone or
sharp objects 15 cm above and below the barrier unless the clay below-
and the
drainage layer serves as bedding.
Nevertheless, the cover design selected for Muassim will be simpler than one proposed
by Oweis and Khera (1998), and more cost effective too.

SUSTAINABLE CLOSURE DEVELOPMENT PLANNING AND DESIGN FOR THE MUASSIM LANDFILL
8-4 | M U A S S I M L A N D F I L L 2 0 1 1
8.1.2 Settlement Settlement is still progressing in Muassim landfill but the rate should have been reduced
significantly since it has ceased operation for almost 10 years. The settlement problem
should now be in tolerable situation as far as the cap design is concerned. Thus, it is
assumed that a geo-membrane or geo-synthetic clay liner can be used for the
impermeable sheet without fear of possible tearing due to differential settlement. Unless
water is applied continuously, use of clay for the impermeable layer has the potential
problem of cracking due to dry weather. In the case of Muassim, the proposed planting
of the area also requires continuous watering. Therefore, the watering will serve two
purposes, to provide water to the plants and to continuously wet the clay liner if such is
to be used.
8.1.3 Geo-synthetic clay liner (GCL) for cap
Settlements could cause cracking of a clay cap. Other causes of cracking are
dehydration and build up of gas pressure beneath the cap. Differential settlements
or presence of voids cause tensile-bending stresses. Because of the low tensile
resistance of clays, a crack can easily developed, which reduces the effective
thickness of the cap and decreases the effectiveness of the cap in limiting
percolation.
For Muassim, the use of synthetic clay liner (GCL) as in Figure 8.2 has been
considered. The clay liner, in this case, is reinforced on both sides by strong fibres
and fabrics. The top fibres, although very thin in dimension, can also act as
drainage layer. The geo-synthetic clay liner comes in readymade sheets and can
be conveniently installed at site over a prepared ground.
A geo-synthetic clay liner (GCL) is a thin layer (6 mm) of bentonite sandwiched between
two geo-textiles or glued to a geo-membrane. At placement time, the bentonite will be
dry and permeable to gas. After exposure to water and hydration, the bentonite barrier in
intact position, is virtually impermeable to gas and water. Because of the reinforcing
effect of the attaching geo-textile, and the relatively high tensile strength of bentonite, the
GCL is expected to be more resistant to cap settlement. GCL requires lesser quality
control or maintenance than a clay liner or geo-membrane would need.
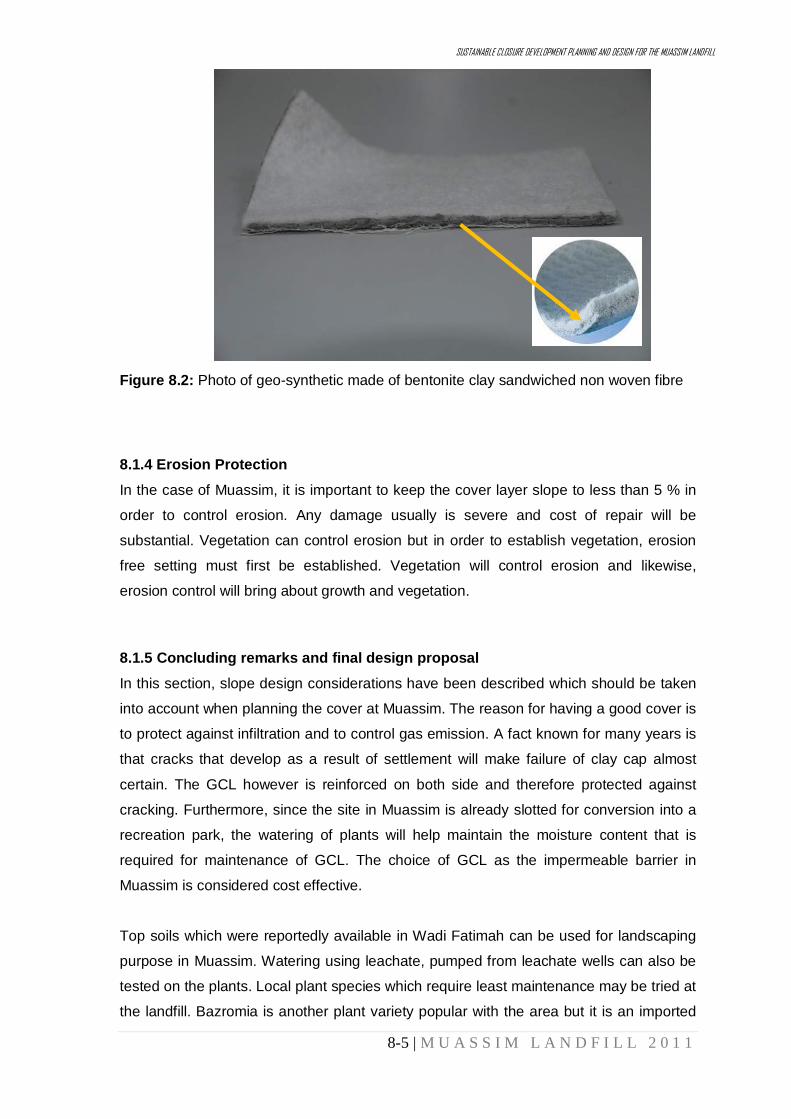
SUSTAINABLE CLOSURE DEVELOPMENT PLANNING AND DESIGN FOR THE MUASSIM LANDFILL
8-5 | M U A S S I M L A N D F I L L 2 0 1 1
Figure 8.2: Photo of geo-synthetic made of bentonite clay sandwiched non woven fibre
8.1.4 Erosion Protection In the case of Muassim, it is important to keep the cover layer slope to less than 5 % in
order to control erosion. Any damage usually is severe and cost of repair will be
substantial. Vegetation can control erosion but in order to establish vegetation, erosion
free setting must first be established. Vegetation will control erosion and likewise,
erosion control will bring about growth and vegetation.
8.1.5 Concluding remarks and final design proposal In this section, slope design considerations have been described which should be taken
into account when planning the cover at Muassim. The reason for having a good cover is
to protect against infiltration and to control gas emission. A fact known for many years is
that cracks that develop as a result of settlement will make failure of clay cap almost
certain. The GCL however is reinforced on both side and therefore protected against
cracking. Furthermore, since the site in Muassim is already slotted for conversion into a
recreation park, the watering of plants will help maintain the moisture content that is
required for maintenance of GCL. The choice of GCL as the impermeable barrier in
Muassim is considered cost effective.
Top soils which were reportedly available in Wadi Fatimah can be used for landscaping
purpose in Muassim. Watering using leachate, pumped from leachate wells can also be
tested on the plants. Local plant species which require least maintenance may be tried at
the landfill. Bazromia is another plant variety popular with the area but it is an imported

SUSTAINABLE CLOSURE DEVELOPMENT PLANNING AND DESIGN FOR THE MUASSIM LANDFILL
8-6 | M U A S S I M L A N D F I L L 2 0 1 1
species. Judging from the height of grown Bazromia trees along the streets of Makkah,
the roots can be very deep and therefore will be damaging to the impermeable
membrane intended to protect the waste against infiltration. The use of shallow rooted
grass therefore is recommended.
Scoria is a rock-mineral available in Saudi Arabia which can be used to boost plant
growth and which has high water retention capacity (Hani, 2009). Compost soil and
imported peat moss can also be used to promote growth and this material is also
reportedly available in the country.
Landscaping should be attempted stage by stage to see the performance of various
plants and growth media. For erosion control, the most suitable gradient of finished
ground is between 3 % and 5 %. Further aspects of landscaping and general
maintenance may be referred to in manuals.
The final design proposal for Muassim is shown in Figure 8.3, while detail drawings are
given separately in attachments (Drawings 7-15). The construction will involve clearing of
rocks and boulders prior to laying of a layer of sand of about 300 mm to act as cushion to
the GCL. Connections of gas pipes will also be concealed within this sand cushion. The
sand will be graded and moderately compacted. GCL will be placed on top of the sand
and finally a layer of topsoil will be placed on top of the GCL. The thickness of topsoil will
be 600 mm.
Figure 8.3: Final cap proposal for Muassim landfill

SUSTAINABLE CLOSURE DEVELOPMENT PLANNING AND DESIGN FOR THE MUASSIM LANDFILL
8-7 | M U A S S I M L A N D F I L L 2 0 1 1
8.2 GAS COLLECTION AND MANAGEMENT SYSTEM There are about 600 gas vents inside the landfill area. The number of gas vents will be
grouped accordingly and will be connected to a collection system. Existing PVC gas
vents will be replaced with HDPE pipe. Broken and unusable vents will also be replaced.
The gas will be conveyed to the flaring facilities via vacuum system. The collection
system consists of gas well, header pipe, sub-header, vacuum system and flaring
system. The current flaring house is still functioning and can still be utilized for the
purpose. Detailed design of the system is given in drawing PPKA/MUASSIM/PI/DT/04.

SUSTAINABLE CLOSURE DEVELOPMENT PLANNING AND DESIGN FOR THE MINA LANDFILL
9-1 | M U A S S I M L A N D F I L L 2 0 1 1
SECTION 9
LEACHATE CONTAINMENT AND COLLECTION
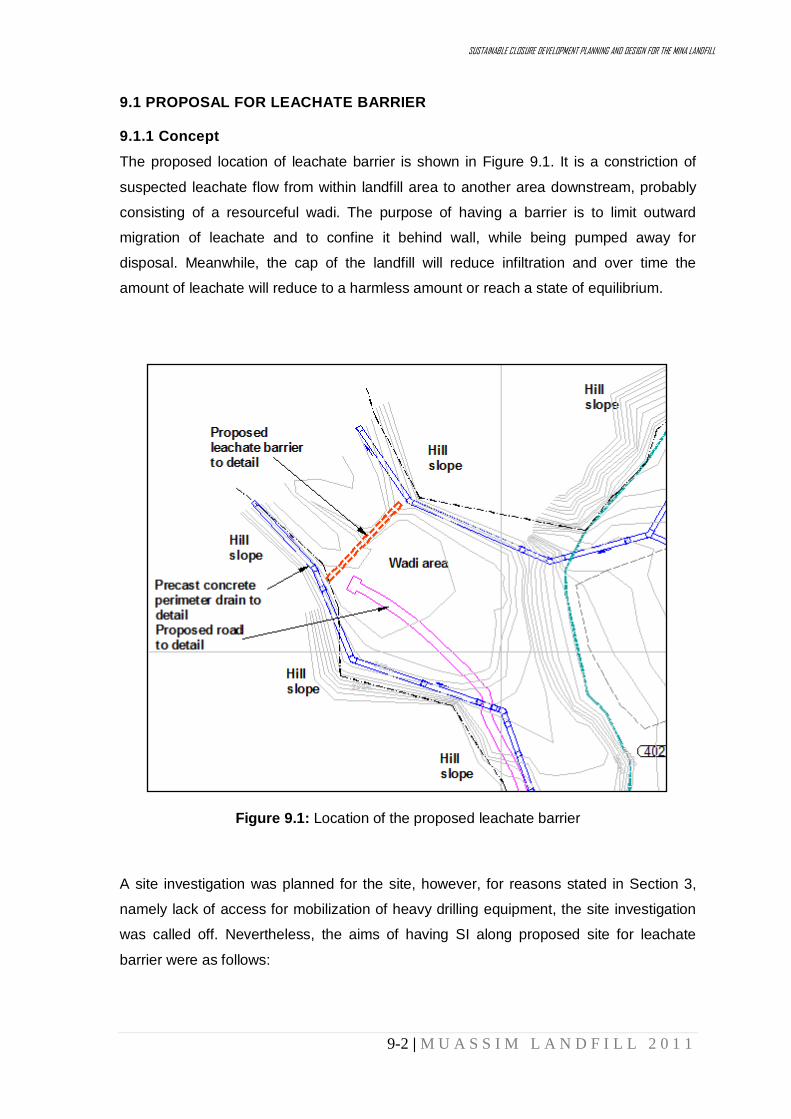
SUSTAINABLE CLOSURE DEVELOPMENT PLANNING AND DESIGN FOR THE MINA LANDFILL
9-2 | M U A S S I M L A N D F I L L 2 0 1 1
9.1 PROPOSAL FOR LEACHATE BARRIER 9.1.1 Concept The proposed location of leachate barrier is shown in Figure 9.1. It is a constriction of
suspected leachate flow from within landfill area to another area downstream, probably
consisting of a resourceful wadi. The purpose of having a barrier is to limit outward
migration of leachate and to confine it behind wall, while being pumped away for
disposal. Meanwhile, the cap of the landfill will reduce infiltration and over time the
amount of leachate will reduce to a harmless amount or reach a state of equilibrium.
Figure 9.1: Location of the proposed leachate barrier
A site investigation was planned for the site, however, for reasons stated in Section 3,
namely lack of access for mobilization of heavy drilling equipment, the site investigation
was called off. Nevertheless, the aims of having SI along proposed site for leachate
barrier were as follows:

SUSTAINABLE CLOSURE DEVELOPMENT PLANNING AND DESIGN FOR THE MINA LANDFILL
9-3 | M U A S S I M L A N D F I L L 2 0 1 1
1. To determine the extent of depth of required barrier
2. To verify results from earlier resistivity survey particularly on depths of bedrock
3. To ascertain the level of leachate around the location of the barrier
4. To estimate the amount of work required in constructing the leachate barrier and the
degree of difficulty associated with the construction
As the site investigation was cancelled, the required information for design of the barrier
was obtained from the results of resistivity survey and site reconnaissance. The
geophysical survey profile for the site is shown in Figure 9.2. The valley is a V or U
shaped channel filled with sand and leachate within the pores. In the centre, the bedrock
was estimated to be about 16 m deep. The jointed rock may extend a few metres, which
will require grouting if it is to be used as foundation for leachate barrier.
Figure 9.2: Resistivity section along Line 1(L23) for the proposed leachate barrier site
The purposes of having a leachate barrier are as follows:
1. To confine the leachate while being pumped away for treatment.
2. To prevent migration of leachate to downstream aquifers.
3. To prevent backflow into the confinement should leachate level in the landfill
become lower than the downstream water level due to pumping.
The leachate barrier should be able to fulfill the following requirements:
1. The leachate barrier must not function as a dam for surface water or as retention
of runoff will only increase recharge and therefore defeat the purpose barrier.
2. The barrier must not be higher than the current leachate level as withholding the
flow of clean water above the leachate level will only increase recharge.
NE
Level16m

SUSTAINABLE CLOSURE DEVELOPMENT PLANNING AND DESIGN FOR THE MINA LANDFILL
9-4 | M U A S S I M L A N D F I L L 2 0 1 1
3. The leachate barrier will be totally embedded in sand/soil and therefore will not
be subjected to any net horizontal force.
4. Cap material will be extended to cover the barrier such that surface runoff will
cross over the barrier and not discharge behind (up of) of the barrier (Figure 9.3)
5. The leachate barrier should be made of impervious material.
9.1.2 Design and construction Geo-synthetic clay liner (GCL), the same material proposed for cap, will also be used as
the barrier. The installation of GCL barrier will require excavation of the site, placement
of the liner, and finally filling back the space left open by the excavation. After
excavation, the cleared foundation must be grouted to seal all bedrock fractures. The
excavated channel, before placement of GCL, is illustrated in Figure 9.4. The front view
of the barrier is shown in Figure 9.5. More details of the barrier are available in attached
drawings PPKA/MUASSIM/PI/DT/06.
Figure 9.3: Conceptual picture of leachate barrier and surrounding items

SUSTAINABLE CLOSURE DEVELOPMENT PLANNING AND DESIGN FOR THE MINA LANDFILL
9-5 | M U A S S I M L A N D F I L L 2 0 1 1
Figure 9.4: Conceptual picture of leachate barrier during placement
Figure 9.5: Cross sectional view from landfill of site barrier

SUSTAINABLE CLOSURE DEVELOPMENT PLANNING AND DESIGN FOR THE MINA LANDFILL
9-6 | M U A S S I M L A N D F I L L 2 0 1 1
9.2 PROPOSAL FOR LEACHATE PUMPING WELLS 9.2.1 Concept The proposed locations for leachate pumping wells were determined by the following
procedure:
1. From each geophysical survey cross section, determine the location of deepest
bedrock.
2. Connect the points obtained from Item 1 above and form the line of bedrock
depression where leachate plume most likely follows. The exercise in this report
has produced Figure 9.6; nevertheless more accurate plotting is given in
attachment.
3. Along the line obtained from Item 2 above and based on ground contour,
determine the ground elevation.
4. Obtain the profile of bedrock level versus (straight line) distance along the line of
bedrock depression
5. Plot the profile from Item 3 above. Plot also the profile of Item 4 above, together
expected water (leachate) level profile. The exercise in this report has produced
Figure 9.7.
6. Wells were positioned at concave portions of bedrock depression where leachte
likely to pond.
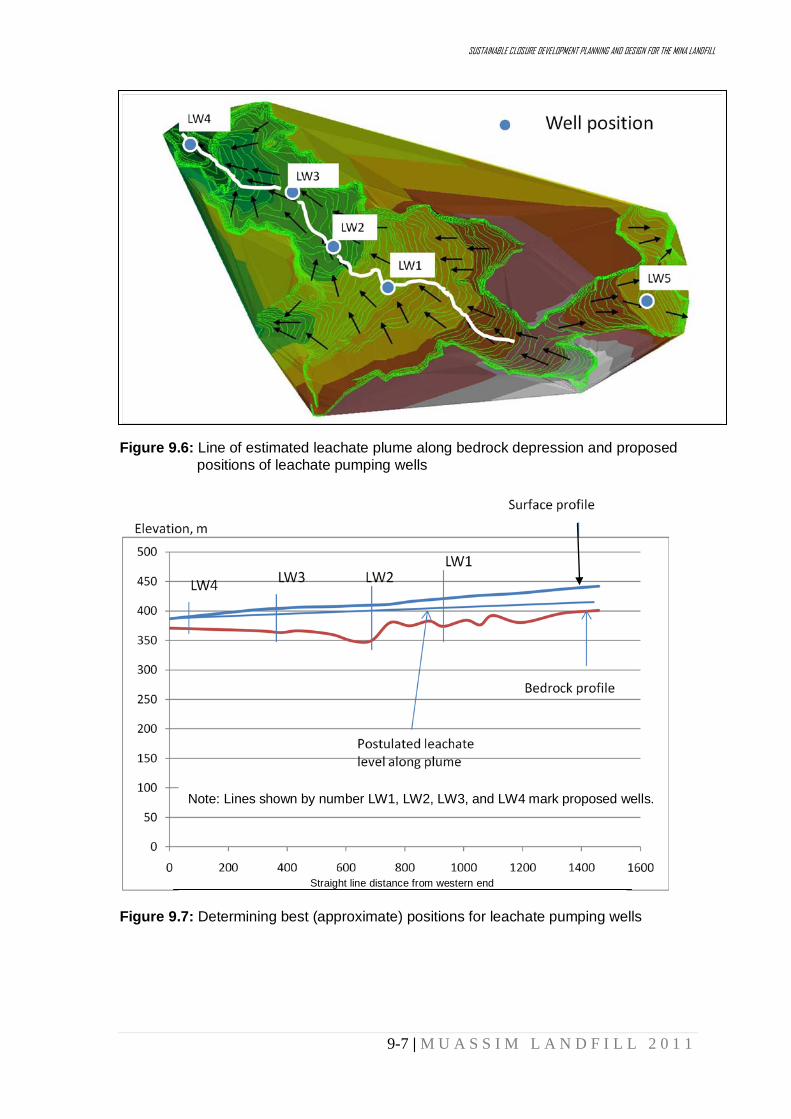
SUSTAINABLE CLOSURE DEVELOPMENT PLANNING AND DESIGN FOR THE MINA LANDFILL
9-7 | M U A S S I M L A N D F I L L 2 0 1 1
Figure 9.6: Line of estimated leachate plume along bedrock depression and proposed positions of leachate pumping wells
Figure 9.7: Determining best (approximate) positions for leachate pumping wells
Note: Lines shown by number LW1, LW2, LW3, and LW4 mark proposed wells.
Straight line distance from western end
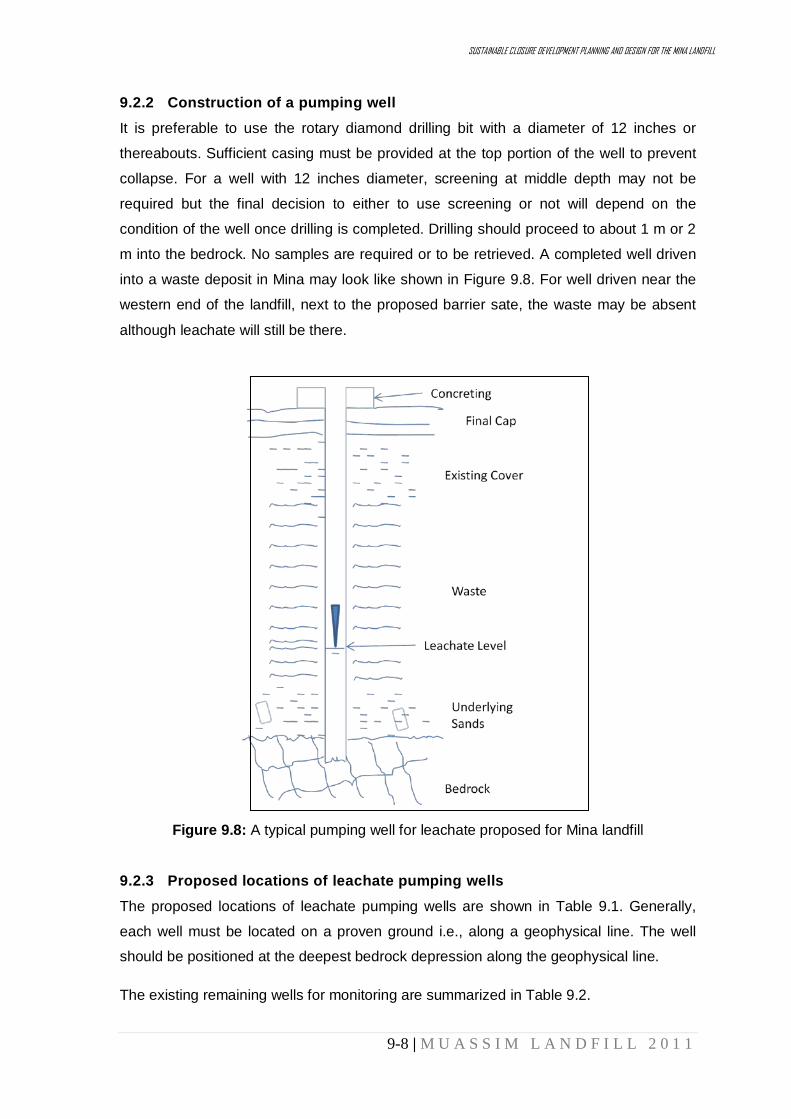
SUSTAINABLE CLOSURE DEVELOPMENT PLANNING AND DESIGN FOR THE MINA LANDFILL
9-8 | M U A S S I M L A N D F I L L 2 0 1 1
9.2.2 Construction of a pumping well It is preferable to use the rotary diamond drilling bit with a diameter of 12 inches or
thereabouts. Sufficient casing must be provided at the top portion of the well to prevent
collapse. For a well with 12 inches diameter, screening at middle depth may not be
required but the final decision to either to use screening or not will depend on the
condition of the well once drilling is completed. Drilling should proceed to about 1 m or 2
m into the bedrock. No samples are required or to be retrieved. A completed well driven
into a waste deposit in Mina may look like shown in Figure 9.8. For well driven near the
western end of the landfill, next to the proposed barrier sate, the waste may be absent
although leachate will still be there.
Figure 9.8: A typical pumping well for leachate proposed for Mina landfill 9.2.3 Proposed locations of leachate pumping wells The proposed locations of leachate pumping wells are shown in Table 9.1. Generally,
each well must be located on a proven ground i.e., along a geophysical line. The well
should be positioned at the deepest bedrock depression along the geophysical line.
The existing remaining wells for monitoring are summarized in Table 9.2.
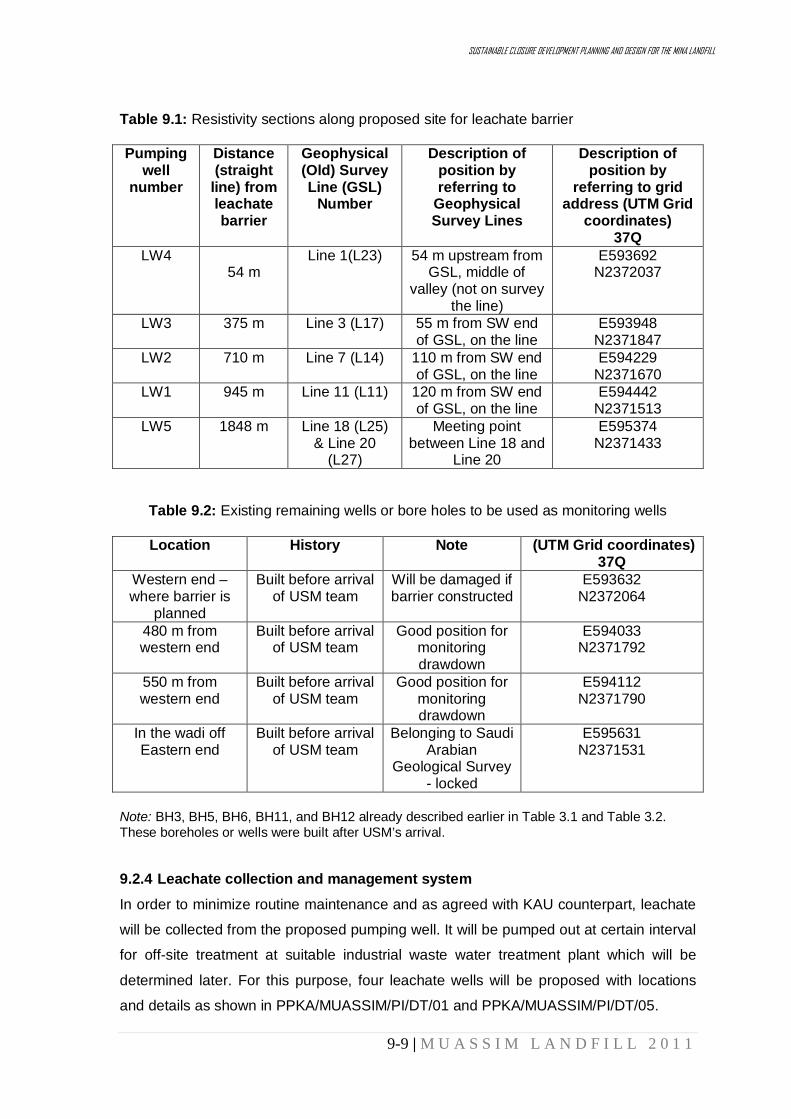
SUSTAINABLE CLOSURE DEVELOPMENT PLANNING AND DESIGN FOR THE MINA LANDFILL
9-9 | M U A S S I M L A N D F I L L 2 0 1 1
Table 9.1: Resistivity sections along proposed site for leachate barrier
Pumping
well number
Distance (straight
line) from leachate barrier
Geophysical (Old) Survey Line (GSL)
Number
Description of position by referring to
Geophysical Survey Lines
Description of position by
referring to grid address (UTM Grid
coordinates) 37Q
LW4 54 m
Line 1(L23) 54 m upstream from GSL, middle of
valley (not on survey the line)
E593692 N2372037
LW3 375 m Line 3 (L17) 55 m from SW end of GSL, on the line
E593948 N2371847
LW2 710 m Line 7 (L14) 110 m from SW end of GSL, on the line
E594229 N2371670
LW1 945 m Line 11 (L11) 120 m from SW end of GSL, on the line
E594442 N2371513
LW5 1848 m Line 18 (L25) & Line 20
(L27)
Meeting point between Line 18 and
Line 20
E595374 N2371433
Table 9.2: Existing remaining wells or bore holes to be used as monitoring wells
Location History Note (UTM Grid coordinates) 37Q
Western end – where barrier is
planned
Built before arrival of USM team
Will be damaged if barrier constructed
E593632 N2372064
480 m from western end
Built before arrival of USM team
Good position for monitoring drawdown
E594033 N2371792
550 m from western end
Built before arrival of USM team
Good position for monitoring drawdown
E594112 N2371790
In the wadi off Eastern end
Built before arrival of USM team
Belonging to Saudi Arabian
Geological Survey - locked
E595631 N2371531
Note: BH3, BH5, BH6, BH11, and BH12 already described earlier in Table 3.1 and Table 3.2. These boreholes or wells were built after USM’s arrival. 9.2.4 Leachate collection and management system In order to minimize routine maintenance and as agreed with KAU counterpart, leachate
will be collected from the proposed pumping well. It will be pumped out at certain interval
for off-site treatment at suitable industrial waste water treatment plant which will be
determined later. For this purpose, four leachate wells will be proposed with locations
and details as shown in PPKA/MUASSIM/PI/DT/01 and PPKA/MUASSIM/PI/DT/05.

SUSTAINABLE CLOSURE DEVELOPMENT PLANNING AND DESIGN FOR THE MUASSIM LANDFILL
10-1 | M U A S S I M L A N D F I L L 2 0 1 1
SECTION 10
LANDFILL INFRASTRUCTURE SYSTEM

SUSTAINABLE CLOSURE DEVELOPMENT PLANNING AND DESIGN FOR THE MUASSIM LANDFILL
10-2 | M U A S S I M L A N D F I L L 2 0 1 1
10.1 DRAINAGE SYSTEM 10.1.1 Introduction Drainage basins, catchments and watersheds are three synonymous terms that refer to the
topographic area that collects and discharges surface stream flow through one outlet or
mouth. Drainage is the term applied to systems for dealing with excess water. The three
primary drainage tasks are urban storm drainage, land drainage and highway drainage. The
primary distinction between drainage and flood mitigation is in the techniques employed to
cope with excess water and in fact that drainage deals with water before it has reached
major stream channels. Investment in drainage is substantially more than the total
investment in flood mitigation or irrigation. For example for highway projects, about one-
fourth of the cost of highways is spent on drainage facilities.
In cities, storm water is usually collected in the streets and conveyed through inlets to buried
conduits that carry it to a point where it can be safely discharged into stream, lake, or ocean.
In some instances storm water is percolated into the ground using infiltration ponds. A single
outfall may be used to convey the storm water to the point of disposal or a number of
disposal points may be selected on the basis of the topography of the area.
The design of a drainage project requires a detailed map of the area with a scale between
1:1000 and 1:5000. The contour interval should be small enough to define the divides
between the various sub-drainages within the system. Final design requires even more
detailed maps of those areas where construction is proposed. All existing underground
facilities must be accurately located, together with other structures that might interfere with
the proposed route. If rock is expected near the surface, rock profiles as determined by
borings along the proposed conduit lines are necessary to that pipe layout can be selected
to minimize rock excavation.
10.1.2 Estimate of Flow The first step in the design of storm drainage works is the determination of the quantities of
water that must be accommodated. In most cases, only an estimate of the peak flow is
required, but where storage or pumping of water is proposed the volume of flow must also
be known. Drainage works are usually designed to dispose of the flow from a storm having
specified return period. It is often difficult to evaluate the damage that results from urban

SUSTAINABLE CLOSURE DEVELOPMENT PLANNING AND DESIGN FOR THE MUASSIM LANDFILL
10-3 | M U A S S I M L A N D F I L L 2 0 1 1
storm water, especially when the damage is merely a nuisance. Hence the selection of the
return period is often dependent on the designer’s judgement. In residential area, there may
be little harm in filling gutters and flooding intersections several times each year if the
flooding lasts only a short time. Return periods of 1 or 2 year in residential districts and 5 to
10 year in commercial districts are all that can be justified for the average city.
Drainage projects almost always deal with flows from ungaged areas, so that design flows
must be synthesized from rainfall data. For urban drainage the most widely used method
has been the rational formula using rainfall of the desired frequency.
The most satisfactory method for estimating urban runoff is by simulation using a computer
program or software. In this approach, flows are simulated throughout the system from
available rainfall data. For adequate definition of the 10 yr event, at least 30 yr of flow should
be simulated. Output is the simulated flow at all key points in the system. From this output
annual flow peaks can be selected and subjected to frequency analysis to define the design
flow at each point. Calibration of the simulation model should be made against the nearest
gaged stream having soil characteristics similar to those of the areas under study.
10.1.3 Hydrologic Losses and Rainfall Excess Rainfall excess or effective rainfall is that rainfall that is neither retained on the land surface
nor infiltrated into the soil. After flowing across the watershed surface, rainfall excess
becomes direct runoff at the watershed outlet. The graph of rainfall excess versus time is
the rainfall excess hyetograph. The difference between the total observed rainfall
hyetograph and the rainfall excess hyetograph is called the abstractions or losses. Losses
are primarily water absorbed by infiltration with some allowance for inception and surface
storage.
The objective of many hydrologic design and analysis problems is to determine the surface
runoff from a watershed due to a particular storm. The process is commonly referred to as
rainfall-runoff analysis with the objective to develop the runoff hydrograph. Where the
system is a watershed or river catchment, the input is rainfall hyetograph, and the output is
the runoff or discharge hydrograph.

SUSTAINABLE CLOSURE DEVELOPMENT PLANNING AND DESIGN FOR THE MUASSIM LANDFILL
10-4 | M U A S S I M L A N D F I L L 2 0 1 1
a) SCS rainfall-runoff The depth of excess precipitation or direct runoff Pe, is always less than or equal to depth of
precipitation P, likewise, after runoff begins, the additional depth of water retained in the
watershed Fa, is less than or equal to some potential maximum retention S. There is some
amount of rainfall Ia, (initial abstraction before ponding) for which no runoff will occur, so the
potential runoff is P-Ia. The SCS method assumes that the ratios of the two actual potential
quantities are equal, that is,
𝐹𝐹𝑎𝑎𝑆𝑆
= 𝑃𝑃𝑒𝑒
𝑃𝑃 − 𝐼𝐼𝑎𝑎 (1)
From continuity, 𝑃𝑃 = 𝑃𝑃𝑒𝑒 + 𝐼𝐼𝑎𝑎 + 𝐹𝐹𝑎𝑎 (2) so combining equations 1 and 2 and solving for Pe gives
𝑃𝑃𝑒𝑒 = (𝑃𝑃 − 𝐼𝐼𝑎𝑎)2
𝑃𝑃 − 𝐼𝐼𝑎𝑎 + 𝑆𝑆 (3)
Which is the basic equation for computing the depth of excess rainfall or direct runoff from a
storm by the SCS method.
From the study by many small experimental watersheds, an empirical relation was developed for I a:
𝐼𝐼𝑎𝑎 = 0.2𝑆𝑆 (4) So that equation (2) is now expressed as
𝑃𝑃𝑒𝑒 = (𝑃𝑃 − 0.2𝑆𝑆)2
𝑃𝑃 + 0.8𝑆𝑆 (5)
Empirical studies by the SCS indicate that the potential maximum retention can be estimated as
𝑆𝑆 = 100𝐶𝐶𝐶𝐶
− 10 (6)
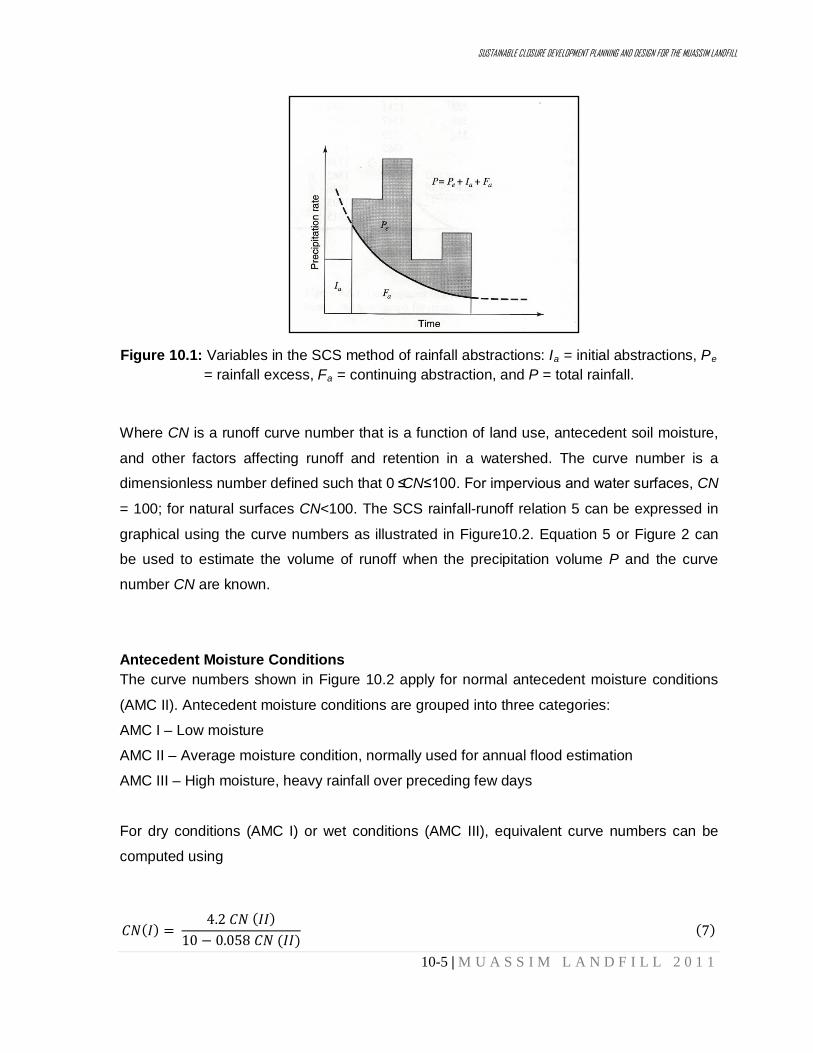
SUSTAINABLE CLOSURE DEVELOPMENT PLANNING AND DESIGN FOR THE MUASSIM LANDFILL
10-5 | M U A S S I M L A N D F I L L 2 0 1 1
Figure 10.1: Variables in the SCS method of rainfall abstractions: Ia = initial abstractions, Pe
= rainfall excess, Fa = continuing abstraction, and P = total rainfall. Where CN is a runoff curve number that is a function of land use, antecedent soil moisture,
and other factors affecting runoff and retention in a watershed. The curve number is a
dimensionless number defined such that 0 ≤CN≤100. For impervious and water surfaces, CN
= 100; for natural surfaces CN<100. The SCS rainfall-runoff relation 5 can be expressed in
graphical using the curve numbers as illustrated in Figure10.2. Equation 5 or Figure 2 can
be used to estimate the volume of runoff when the precipitation volume P and the curve
number CN are known.
Antecedent Moisture Conditions The curve numbers shown in Figure 10.2 apply for normal antecedent moisture conditions
(AMC II). Antecedent moisture conditions are grouped into three categories:
AMC I – Low moisture
AMC II – Average moisture condition, normally used for annual flood estimation
AMC III – High moisture, heavy rainfall over preceding few days
For dry conditions (AMC I) or wet conditions (AMC III), equivalent curve numbers can be
computed using
𝐶𝐶𝐶𝐶(𝐼𝐼) = 4.2 𝐶𝐶𝐶𝐶 (𝐼𝐼𝐼𝐼)
10 − 0.058 𝐶𝐶𝐶𝐶 (𝐼𝐼𝐼𝐼) (7)
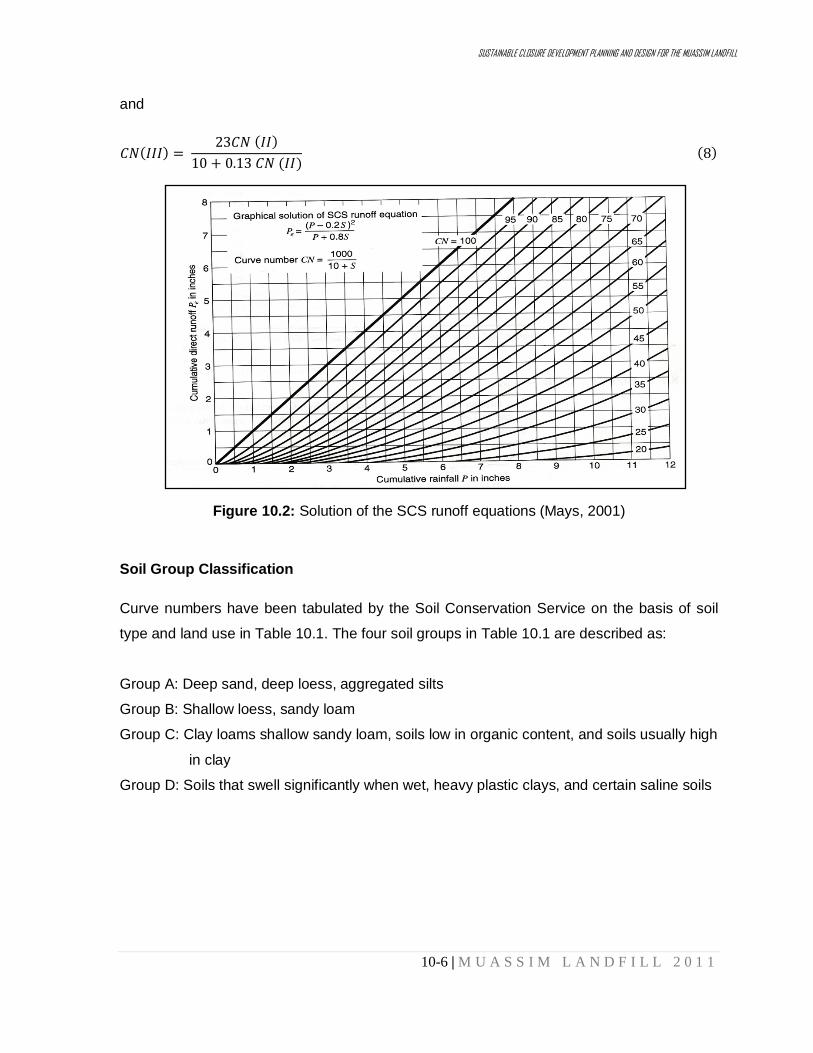
SUSTAINABLE CLOSURE DEVELOPMENT PLANNING AND DESIGN FOR THE MUASSIM LANDFILL
10-6 | M U A S S I M L A N D F I L L 2 0 1 1
and
𝐶𝐶𝐶𝐶(𝐼𝐼𝐼𝐼𝐼𝐼) = 23𝐶𝐶𝐶𝐶 (𝐼𝐼𝐼𝐼)
10 + 0.13 𝐶𝐶𝐶𝐶 (𝐼𝐼𝐼𝐼) (8)
Figure 10.2: Solution of the SCS runoff equations (Mays, 2001) Soil Group Classification Curve numbers have been tabulated by the Soil Conservation Service on the basis of soil
type and land use in Table 10.1. The four soil groups in Table 10.1 are described as:
Group A: Deep sand, deep loess, aggregated silts
Group B: Shallow loess, sandy loam
Group C: Clay loams shallow sandy loam, soils low in organic content, and soils usually high
in clay
Group D: Soils that swell significantly when wet, heavy plastic clays, and certain saline soils

SUSTAINABLE CLOSURE DEVELOPMENT PLANNING AND DESIGN FOR THE MUASSIM LANDFILL
10-7 | M U A S S I M L A N D F I L L 2 0 1 1
Table 10.1: Runoff Curve Numbers (Average Washed Condition, Ia
=0.2S)

SUSTAINABLE CLOSURE DEVELOPMENT PLANNING AND DESIGN FOR THE MUASSIM LANDFILL
10-8 | M U A S S I M L A N D F I L L 2 0 1 1
Table 10.1: Runoff Curve Numbers (continued)

SUSTAINABLE CLOSURE DEVELOPMENT PLANNING AND DESIGN FOR THE MUASSIM LANDFILL
10-9 | M U A S S I M L A N D F I L L 2 0 1 1
b) Rational method If rainfall intensity remains constant over the time interval required to completely drain a
watershed, then the runoff (intensity) would be equal to the rainfall intensity. From a mass
balance relating rainfall intensity to runoff both intensities can be equated and expressed in
the following formula with suitable conversion factors.
𝑄𝑄 = 𝐶𝐶𝐶𝐶𝐶𝐶 (9) Where Q = runoff (cm3/s) i = rainfall intensity (m/s) CA = net effective area (m2) The assumptions for use of the formula requires a delineation of the contributing area and
intensity remains constant over the time period required to drain the area (time of
concentration). The contributing area can be related to the characteristics of the watershed
that contribute runoff. For impervious areas that are hydraulically connected (water flow
continuous), runoff and rainfall excess must come from this area. However, other areas may
contribute during heavy or additional rainfall conditions making the contributing area larger.
The impervious area that contributes runoff frequently called the directly connected area
(DCIA). For watersheds that have long travel times, it is almost impossible to have a
constant intensity over that time period. This limits the use of Equation 9 to short time of
travel watersheds. Equation 9 can be restated as the rational formula:
𝑄𝑄𝑝𝑝 = 𝐶𝐶𝐶𝐶𝐶𝐶 (10) Where Qp = peak discharge (cm3/s) C = runoff coefficient (dimensionless) i = rainfall intensity (m/s) A= watershed area (m2) The basic assumptions for using the rational formula are:
1. The rainfall intensity must be constant for a time interval at least equal to the time of
concentration.
2. The runoff is a maximum when the rainfall intensity lasts as long as the time of
concentration.
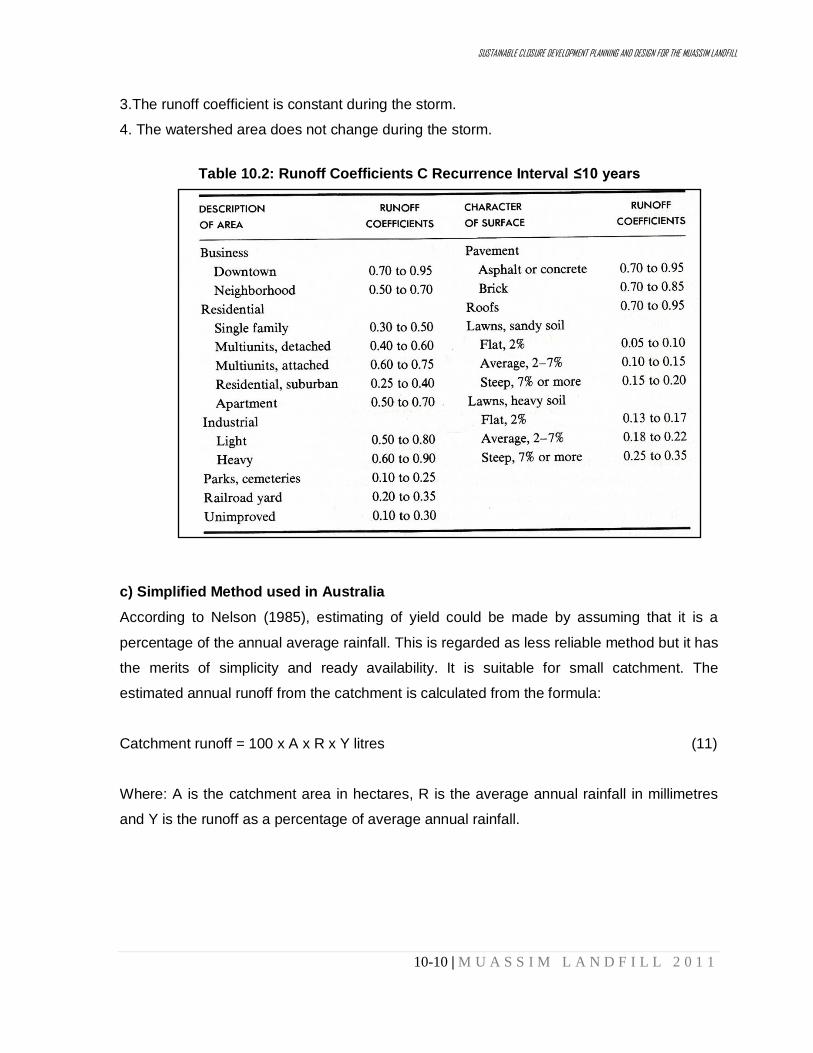
SUSTAINABLE CLOSURE DEVELOPMENT PLANNING AND DESIGN FOR THE MUASSIM LANDFILL
10-10 | M U A S S I M L A N D F I L L 2 0 1 1
3.The runoff coefficient is constant during the storm.
4. The watershed area does not change during the storm.
Table 10.2: Runoff Coefficients C Recurrence Interval ≤10 years
c) Simplified Method used in Australia According to Nelson (1985), estimating of yield could be made by assuming that it is a
percentage of the annual average rainfall. This is regarded as less reliable method but it has
the merits of simplicity and ready availability. It is suitable for small catchment. The
estimated annual runoff from the catchment is calculated from the formula:
Catchment runoff = 100 x A x R x Y litres (11)
Where: A is the catchment area in hectares, R is the average annual rainfall in millimetres
and Y is the runoff as a percentage of average annual rainfall.

SUSTAINABLE CLOSURE DEVELOPMENT PLANNING AND DESIGN FOR THE MUASSIM LANDFILL
10-11 | M U A S S I M L A N D F I L L 2 0 1 1
Table 10.3: Runoff percentage
10.2 DESIGN APPROACH FOR MUASSIM LANDFILL
Due to unavailability of hourly rainfall data from the surrounding areas and the urgency of
the project, USM team has to discard the approach of rainfall analysis using unit
hydrograph. Three methods were initially considered namely SCS rainfall-runoff relation,
rational method and the Australian method. The Australian method was discarded as it is
applicable for localised situation. Thus two methods are used.
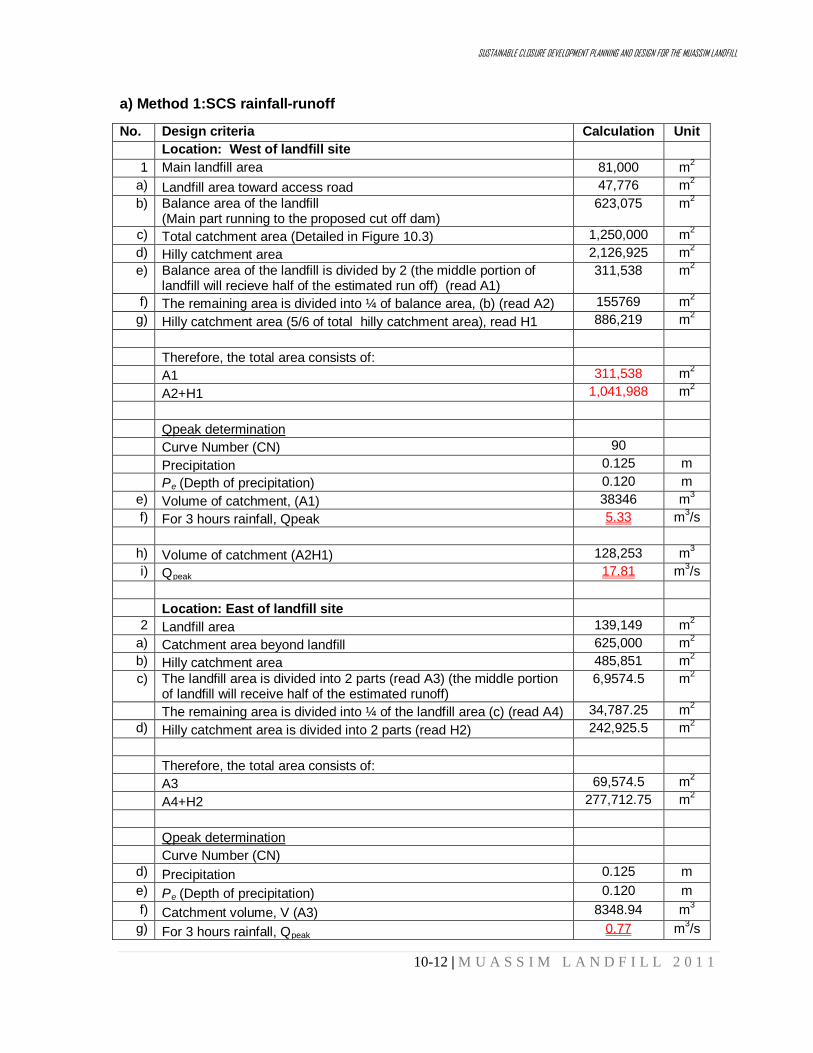
SUSTAINABLE CLOSURE DEVELOPMENT PLANNING AND DESIGN FOR THE MUASSIM LANDFILL
10-12 | M U A S S I M L A N D F I L L 2 0 1 1
a) Method 1:SCS rainfall-runoff
No. Design criteria Calculation Unit Location: West of landfill site
1 Main landfill area 81,000 m2 a) Landfill area toward access road 47,776 m2 b) Balance area of the landfill
(Main part running to the proposed cut off dam) 623,075 m2
c) Total catchment area (Detailed in Figure 10.3) 1,250,000 m2 d) Hilly catchment area 2,126,925 m2 e) Balance area of the landfill is divided by 2 (the middle portion of
landfill will recieve half of the estimated run off) (read A1) 311,538 m2
f) The remaining area is divided into ¼ of balance area, (b) (read A2) 155769 m2 g) Hilly catchment area (5/6 of total hilly catchment area), read H1 886,219 m2
Therefore, the total area consists of: A1 311,538 m2 A2+H1 1,041,988 m2 Qpeak determination Curve Number (CN) 90 Precipitation 0.125 m Pe 0.120 (Depth of precipitation) m
e) Volume of catchment, (A1) 38346 m3 f) For 3 hours rainfall, Qpeak 5.33 m3/s
h) Volume of catchment (A2H1) 128,253 m3 i) Qpeak 17.81 m3/s Location: East of landfill site
2 Landfill area 139,149 m2 a) Catchment area beyond landfill 625,000 m2 b) Hilly catchment area 485,851 m2 c) The landfill area is divided into 2 parts (read A3) (the middle portion
of landfill will receive half of the estimated runoff) 6,9574.5 m2
The remaining area is divided into ¼ of the landfill area (c) (read A4) 34,787.25 m2 d) Hilly catchment area is divided into 2 parts (read H2) 242,925.5 m2
Therefore, the total area consists of: A3 69,574.5 m2 A4+H2 277,712.75 m2 Qpeak determination Curve Number (CN)
d) Precipitation 0.125 m e) Pe 0.120 (Depth of precipitation) m f) Catchment volume, V (A3) 8348.94 m3
g) For 3 hours rainfall, Qpeak 0.77 m3/s
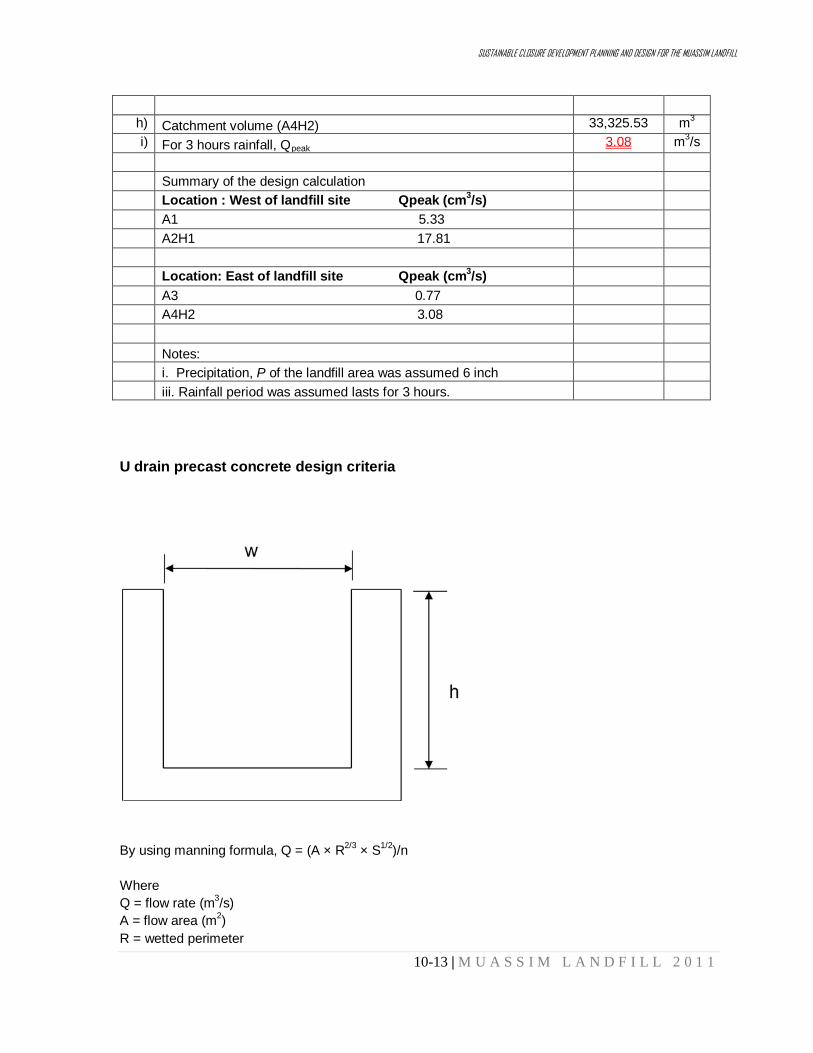
SUSTAINABLE CLOSURE DEVELOPMENT PLANNING AND DESIGN FOR THE MUASSIM LANDFILL
10-13 | M U A S S I M L A N D F I L L 2 0 1 1
U drain precast concrete design criteria
By using manning formula, Q = (A × R2/3 × S1/2)/n Where Q = flow rate (m3/s) A = flow area (m2
) R = wetted perimeter
h) Catchment volume (A4H2) 33,325.53 m3 i) For 3 hours rainfall, Qpeak 3.08 m3/s
Summary of the design calculation Location : West of landfill site Qpeak (cm3 /s) A1 5.33 A2H1 17.81 Location: East of landfill site Qpeak (cm3 /s)
A3 0.77 A4H2 3.08 Notes: i. Precipitation, P of the landfill area was assumed 6 inch iii. Rainfall period was assumed lasts for 3 hours.

SUSTAINABLE CLOSURE DEVELOPMENT PLANNING AND DESIGN FOR THE MUASSIM LANDFILL
10-14 | M U A S S I M L A N D F I L L 2 0 1 1
S= channel slope n = Manning’s roughness coefficient In order to determine the appropriate size of the u-drain, trial and error method was utilized. Let the width of the drain, w = 1.5 m, and the height, h = 1.2m
For economical purpose, the drain size of 1.5 X 1.2 m shall be applied to the A1 and A4H2 portions. 2.
n
= 0.015
Qpeak m3 Location /s A1 5.33 Middle drain -West of landfill site
A2H1 17.81 Southern and Northern of landfill site (West landfill) A3 0.77 Middle drain – East of landfill site
A4H2 3.08 Southern and Nortern of landfill site (East landfill)
1.
n
= 0.015
S
= 0.0066667
Let w
= 1.5 m
h
= 1.2 m
Area, A
= w*h
= 1.8 m
2
Wetted perimeter, P
= w + 2h
= 3.9 m
Hydraulic radius, R
= A/P
= 0.4615385 m
Q capacity
= 5.85 m3
/s
velocity, V = Q/A
= 3.25 m/s (V should larger than 0.6 and less than 4 m/s)
Therefore, Qcapacity>Qpeak
OK
Suitable size will be 2.1 X1.2 m considering medium flow rate

SUSTAINABLE CLOSURE DEVELOPMENT PLANNING AND DESIGN FOR THE MUASSIM LANDFILL
10-15 | M U A S S I M L A N D F I L L 2 0 1 1
S
= 0.0066667
Let w
= 2.4 m
h
= 1.8 m
Area, A
= w*h
= 4.32 m
2
Wetted perimeter, P
= w + 2h
= 6 m
Hydraulic radius, R
= A/P
= 0.72 m
Q capacity
= 18.89 m3
/s
velocity, V = Q/A
= 4.37 m/s (V should larger than 0.6 and less than 4 m/s)
Therefore, Qcapacity>Qpeak
OK
The appropriate size of the drain should be 2.4 X1.8 m considering high flow rate for A2H1
n
= 0.015
S
= 0.0066667
Let w
= 0.75 m
h
= 0.60 m
Area, A
= w*h
= 0.45 m
2
Wetted perimeter, P
= w + 2h
= 1.95 m
Hydraulic radius, R
= A/P
= 0.2307692 m
Q capacity
= 0.92 m3
/s
velocity, V = Q/A
= 2.05 m/s (V should larger than 0.6 and less than 4 m/s)
Therefore, Qcapacity>Qpeak
The suitable size of the drain should be 0.75 X 0.6 m considering low flow rate for A3
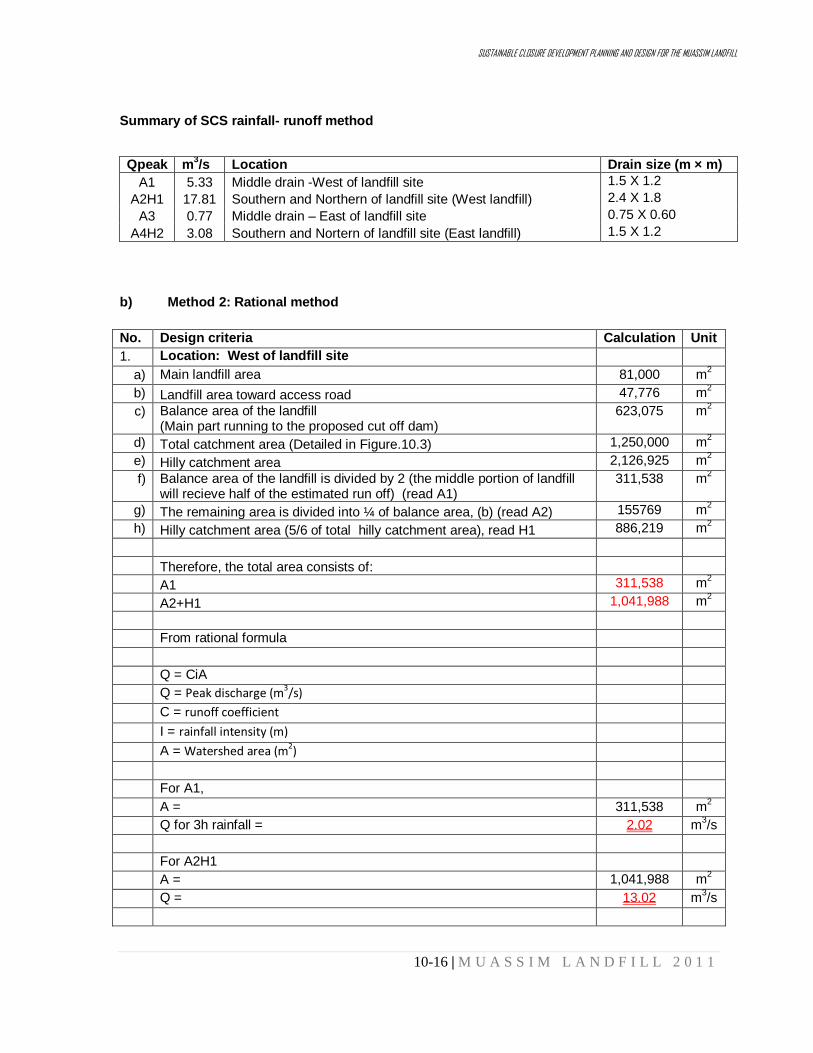
SUSTAINABLE CLOSURE DEVELOPMENT PLANNING AND DESIGN FOR THE MUASSIM LANDFILL
10-16 | M U A S S I M L A N D F I L L 2 0 1 1
Summary of SCS rainfall- runoff method
b) Method 2: Rational method No. Design criteria Calculation Unit 1. Location: West of landfill site
a) Main landfill area 81,000 m2 b) Landfill area toward access road 47,776 m2 c) Balance area of the landfill
(Main part running to the proposed cut off dam) 623,075 m2
d) Total catchment area (Detailed in Figure.10.3) 1,250,000 m2 e) Hilly catchment area 2,126,925 m2 f) Balance area of the landfill is divided by 2 (the middle portion of landfill
will recieve half of the estimated run off) (read A1) 311,538 m2
g) The remaining area is divided into ¼ of balance area, (b) (read A2) 155769 m2 h) Hilly catchment area (5/6 of total hilly catchment area), read H1 886,219 m2
Therefore, the total area consists of: A1 311,538 m2 A2+H1 1,041,988 m2 From rational formula Q = CiA Q = Peak discharge (m3 /s) C = runoff coefficient I = rainfall intensity (m) A = Watershed area (m2 ) For A1, A = 311,538 m2 Q for 3h rainfall = 2.02 m3/s For A2H1 A = 1,041,988 m2 Q = 13.02 m3/s
Qpeak m3 Location /s Drain size (m × m) A1 5.33 Middle drain -West of landfill site 1.5 X 1.2
A2H1 17.81 Southern and Northern of landfill site (West landfill) 2.4 X 1.8 A3 0.77 Middle drain – East of landfill site 0.75 X 0.60
A4H2 3.08 Southern and Nortern of landfill site (East landfill) 1.5 X 1.2

SUSTAINABLE CLOSURE DEVELOPMENT PLANNING AND DESIGN FOR THE MUASSIM LANDFILL
10-17 | M U A S S I M L A N D F I L L 2 0 1 1
No. Design criteria Calculation Unit Location: East of landfill site
2 Landfill area 139,149 m2 a) Catchment area beyond landfill 625,000 m2 b) Hilly catchment area 485,851 m2
c) The landfill area is divided into 2 parts (read A3) (the middle portion of landfill will receive half of the estimated runoff) 6,9574.5 m2
The remaining area is divided into ¼ of the landfill area (c) (read A4) 34,787.25 m2 d) Hilly catchment area is divided into 2 parts (read H2) 242,925.5 m2
Therefore, the total area consists of: A3 69,574.5 m2 A4+H2 277,712.75 m2 From rational formula Q = CiA Q = Peak discharge (m3 /s) C = runoff coefficient I = rainfall intensity (m) A = Watershed area (m2 ) For A3, A = 69,574.5 m2 Q for 3h rainfall = 0.87 m3/s For A4H2, A = 277,712.75 Q = 1.80 m3/s Summary of the design calculation using rational method Location : West of landfill site Qpeak (cm3 /s) A1 2.02 A2H1 13.02 Location: East of landfill site Qpeak (cm3 /s) A3 0.87 A4H2 1.80

SUSTAINABLE CLOSURE DEVELOPMENT PLANNING AND DESIGN FOR THE MUASSIM LANDFILL
10-18 | M U A S S I M L A N D F I L L 2 0 1 1
Summary for maximum dishcarge flow rate U drain precast concrete design criteria
By using manning formula, Q = (A × R2/3 × S1/2)/n Where Q = flow rate (m3/s) A = flow area (m2
) R = wetted perimeter S= channel slope n = Manning’s roughness coefficient In order to determine the appropriate size of the u-drain, trial and error method was utilized. Let the width of the drain, w = 1.5 m, and the height, h = 1.2m
Qpeak m3 Location /s A1 2.02 Middle drain -West of landfill site
A2H1 13.02 Southern and Northern of landfill site (West landfill) A3 0.87 Middle drain – East of landfill site
A4H2 1.80 Southern and Northern of landfill site (East landfill)

SUSTAINABLE CLOSURE DEVELOPMENT PLANNING AND DESIGN FOR THE MUASSIM LANDFILL
10-19 | M U A S S I M L A N D F I L L 2 0 1 1
n
= 0.02
S
= 0.006667
Let w
= 2.1 m
h
= 1.8 m
Area, A
= w*h
= 3.78 m
2
Wetted perimeter, P
= w + 2h
= 5.7 m
Hydraulic radius, R
= A/P
= 0.66 m
Q capacity
= 15.65 m3
/s
velocity, V = Q/A
= 4.14 m/s (V should larger than 0.6 and less than 4 m/s)
Therefore, Qcapacity>Qpeak
OK
Suitable size of the drain should be 2.1 X1.8 m considering high flow rate contributed from large area for A2H1
n
= 0.015
S
= 0.006667
Let w
= 1.5 m
h
= 0.75 m
Area, A
= w*h
= 1.125 m
2
Wetted perimeter, P
= w + 2h
= 3 m
Hydraulic radius, R
= A/P
= 0.375 m
Q capacity
= 3.184 m3
/s
velocity, V = Q/A
= 2.83 m/s (V should larger than 0.6 and less than 4 m/s)
Therefore, Qcapacity>Qpeak

SUSTAINABLE CLOSURE DEVELOPMENT PLANNING AND DESIGN FOR THE MUASSIM LANDFILL
10-20 | M U A S S I M L A N D F I L L 2 0 1 1
The suitable size of drain should be 1.5 X 0.75 m considering medium flow rate for A1 and A4H2.
n
= 0.015
S
= 0.006667
Let w
= 0.9 m
h
= 0.6 m
Area, A
= w*h
= 0.54 m
2
Wetted perimeter, P
= w + 2h
= 2.1 m
Hydraulic radius, R
= A/P
= 0.257143 m
Q capacity
= 1.189 m3
/s
velocity, V = Q/A
= 2.20 m/s (V should larger than 0.6 and less than 4 m/s)
Therefore, Qcapacity>Qpeak
Suitable size will be 0.9 X 0.6 m considering low flow rate for A3
Summary of rational method
Qpeak m3 Location /s Drain size (m X m)
A1 2.02 Middle drain -West of landfill site 1.5 X 0.75 A2H1 13.02 Southern and Northern of landfill site (West landfill) 2.1 x 1.8
A3 0.87 Middle drain – East of landfill site 0.9 X 0.6 A4H2 1.80 Southern and Northern of landfill site (East landfill) 1.5 X 0.75
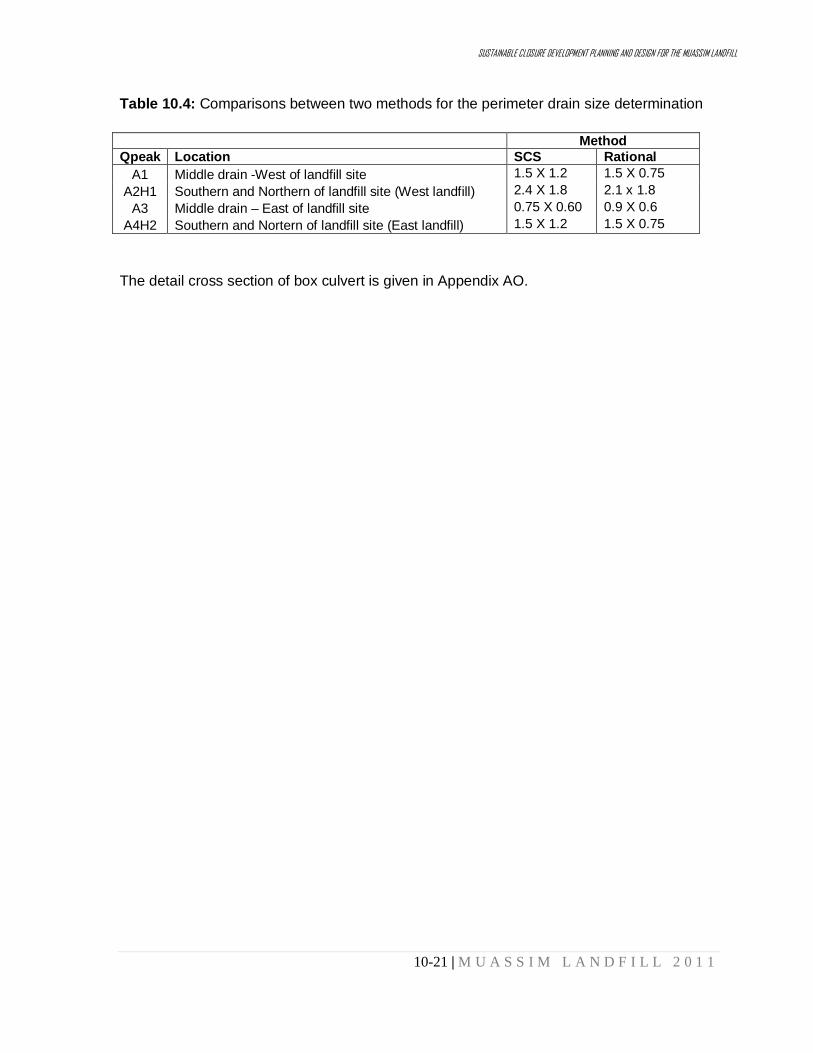
SUSTAINABLE CLOSURE DEVELOPMENT PLANNING AND DESIGN FOR THE MUASSIM LANDFILL
10-21 | M U A S S I M L A N D F I L L 2 0 1 1
Table 10.4: Comparisons between two methods for the perimeter drain size determination
The detail cross section of box culvert is given in Appendix AO.
Method
Qpeak Location SCS Rational A1 Middle drain -West of landfill site 1.5 X 1.2 1.5 X 0.75
A2H1 Southern and Northern of landfill site (West landfill) 2.4 X 1.8 2.1 x 1.8 A3 Middle drain – East of landfill site 0.75 X 0.60 0.9 X 0.6
A4H2 Southern and Nortern of landfill site (East landfill) 1.5 X 1.2 1.5 X 0.75

SUSTAINABLE CLOSURE DEVELOPMENT PLANNING AND DESIGN FOR THE MUASSIM LANDFILL
10-22 | M U A S S I M L A N D F I L L 2 0 1 1
Figure 10.3: Catchment area
SUSTAINABLE CLOSURE DEVELOPMENT PLANNING AND DESIGN FOR THE MUASSIM LANDFILL
10-23 | M U A S S I M L A N D F I L L 2 0 1 1
10.3 ACCESS ROAD SYSTEM In this proposed design, an access road will be constructed to serve the leachate pumping
well and maintenance of gas ventilation systems. It covers the whole sections, the main
landfill and the east side of the landfill. The design is based on conventional standard that
consists of premix (top layer), crusher run and sub base. Details of cross section and the
access road system layout in the landfill are shown in Figures 10.4 and 10.5, respectively.
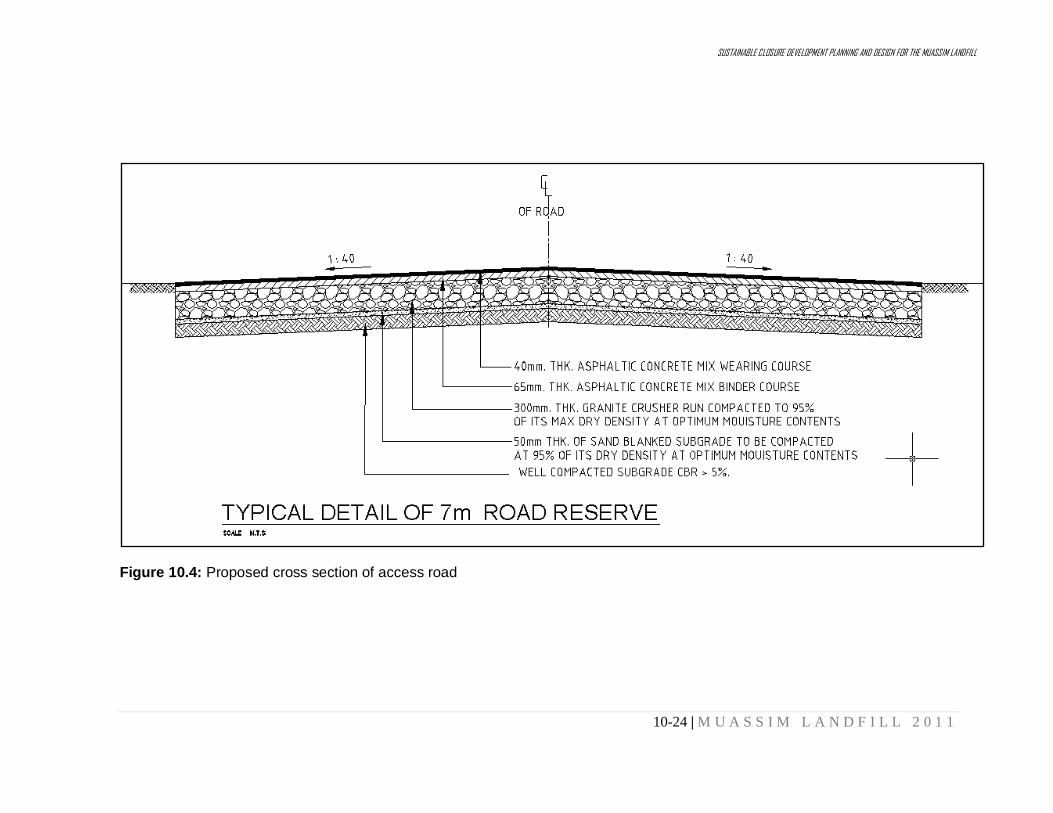
SUSTAINABLE CLOSURE DEVELOPMENT PLANNING AND DESIGN FOR THE MUASSIM LANDFILL
10-24 | M U A S S I M L A N D F I L L 2 0 1 1
Figure 10.4: Proposed cross section of access road
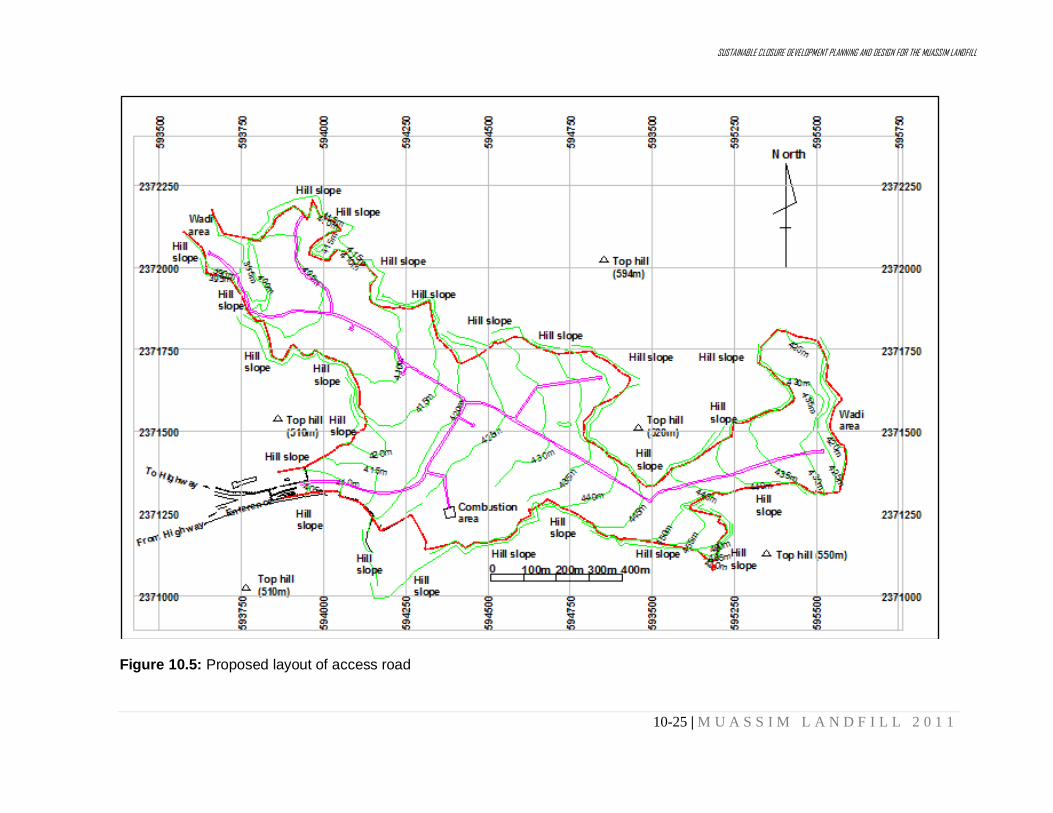
SUSTAINABLE CLOSURE DEVELOPMENT PLANNING AND DESIGN FOR THE MUASSIM LANDFILL
10-25 | M U A S S I M L A N D F I L L 2 0 1 1
Figure 10.5: Proposed layout of access road

SUSTAINABLE CLOSURE DEVELOPMENT PLANNING AND DESIGN FOR THE MUASSIM LANDFILL
R-1 | M U A S S I M L A N D F I L L 2 0 1 1
REFERENCES
1. Abu-Zeid, N, Bianchini G.,. Santarato G., Vaccaro, C. (2004) Geochemical characterization and geophysical mapping of Landfill leachates: the Marozzo, canal case study (NE Italy) Environmental Geology,45, 439-447.
2. Ahmad,T., Thakur,V.C., Islam,R., Khanna,P.P., Mukherjee,P.K.
3. (1998)Geochemistry and geodynamic implications of magmatic rocks from the
Trans-Himalayan arc Geochemical Journal, 32 (6), pp. 383-404.
4. Aksakal, A. (1998), Rainfall amount in Saudi Arabia and a technique to increase the rainfall by cloud seeding, Arabian Journal for Science and Engineering, 23, 101-119.
5. AWWA/APHA/WEF (2005), STANDARD METHODS 10084 Standard Methods
for the Examination
of Water and Wastewater, 21st Edition.
6. Bagchi, A., 'Design of Landfills and Integrated Solid Waste Management', John Wiley & Sons, 1990.
7. Barker R.D., (1996). The application of electrical tomography in groundwater
contamination studies. EAGE 58th Conference and Technical Exhibition Extended Abstracts, P082.
8. Bernstone, C. and Dahlin, T., (1999). Assessment of two automated electrical
resistivity data acquisition systems for landfill location surveys : Two case histories. Journal of Environmental and Engineering Geophysics, 4, 113-122.
9. EPA, (2008), Guidelines for groundwater investigation and monitoring for landfills
10. Fred E. and Mostafa B., (2009). Flood risk modeling for Holy Sites in Makkah
11. Haj Research Cluster on Waste Management, Universiti Sains Malaysia,
'Geophysical study (2-D electrical imaging method) at the closedMina landfill, Makkah', Final Report submitted to the Mayor of Makkah, August, 2008 (Unpublished)
12. JICA (2005), Guideline for Safe Closure and Rehabilitation of Landfill Sites.
13. Kim HS, Lee K, Hahn JS (1995) Electrical surveys for mapping leachate in Nanji-
Do landfill site. J Eng Geol 5:259–276.
14. Kurdi, Hani H. (2009) Geology And Technical Evaluation Of Scoria And Basalt From Jabal Bata’ah, Harrat Rahat, Saudi Geological Survey Technical Report, Jiddah.
15. Loke, M.H., (1999). Time-lapse resistivity imaging inversion. Proceedings of the
5th Meeting of the Environmental and Engineering Geophysical Society European Section, Em1.
16. Ministry of Health Malaysia, (2005). National Guidelines for Raw Drinking Water
Quality, Malaysia.
SUSTAINABLE CLOSURE DEVELOPMENT PLANNING AND DESIGN FOR THE MUASSIM LANDFILL
R-2 | M U A S S I M L A N D F I L L 2 0 1 1
17. Monteiro F.A., Mateusc, A., Figueirasc, J., Gonçalvesc, M. A. (2006) Santosa Mapping groundwater contamination around a landfill facility using the VLF-EM method — A case study, Journal of Applied Geophysics, (60), 115-125.
18. Moore CA, Alzaydi AA (1979) Methane migration around sanitary landfills. J
Geotech Div, ASCE, 105(GT2), Proc Pap 14372.
19. Moore T.A. and Al-Rehaili, H. (1989) Geologic map of the Makkah Quadrangle, Sheet 21D, Kingdom of Saudi Arabia, Saudi Geological Survey, Jiddah.
20. New York State (1990), 6 NYCRR Part 360, Solid Waste Management Facilities,
New York State Department of Environmental Conservation, Division of Solid Waste, Albany, NY.
21. Oweis I S and Khera R P (1998), Geotechnology of Waste Management, 2nd
Ed., PWS Publishing, Boston, MA.
22. Parker A (1983) Behavior – leachate. Behavior of waste in landfill-methane generation. In: Holes (ed) John Wiley, Chichester.
23. Pfeffer, J.T. (1992) Solid Waste Management Engineering. Chapter 12, Prentice-
Hall Inc.
24. Subyani, A.M. (2004), Study evaluation of groundwater resources in Wadi Yalamlam and Wadi Adam Basins, Makkah Al-Mukarramah, Al-Mukarramah Area, International Conferences on Water Resources, Makkah.
25. Subyani A. M., (2009). Hydrologic behavior and flood probability for selected
basins in Makkah area, western Saudi Arabia. Arab Journal of Geoscience
26. Tchobanoglous G., Theisen, H. and Vigil, S. (1993) Integrated Solid Waste
Management – Engineering Principles and Management Issues.McGraw-Hill.
27. Tchobanoglous G., Theisen, H. and Vigil, S. (1993) Integrated Solid Waste Management – Engineering Principles and Management Issues.McGraw-Hill.
28. UNEP (1997) Technical Guidelines On Specially Engineered Landfill, Bazel
Convention, Geneva.
29. Wanielista M, Kersten R. and Eaglin R., (1997). Hydrology: Water quantity and quality control. John Wiley and Sons, United States of America.
31. Yildirim M (1997) Engineering Geological Evaluation of Solid Waste Landfill Sites Two Examples From Istanbul, Turkey, Bull of Eng. Geology, France, 55, 151-158.

SUSTAINABLE CLOSURE DEVELOPMENT PLANNING AND DESIGN FOR THE MINA LANDFILL
1 | M U A S S I M L A N D F I L L
APPENDICES

SUSTAINABLE CLOSURE DEVELOPMENT PLANNING AND DESIGN FOR THE MINA LANDFILL
2 | M U A S S I M L A N D F I L L 2 0 1 0
MINA LANDFILL CLOSURE PROJECT 2010-2011
DEEP BORING: BH-3 COLLAR: N21 26 33.4 E39 55 09.4 START DATE: 01/02/2010
Top Bottom Descriptions
(metre) 0.00 2.30
Dry, light grey to yellowish grey sand gravel (SP and SW) and numerus rock fragments that formed the cover materials (same as for BH5 and BH6 ).
2.30
8.30
Moderate to good recovery, very dark grey, generally wet, with strong waste odour (leachate), loose to soft, partly to slightly decomposed solid waste, comprising mainly of mixture of plastics bags/sheets, broken pieces of plastics (PVC, HDPE etc), pieces of paper carton containers, brown cardboards, occasionally rubber tyres, tin cans, woods chucks, old carpet, ropes, broken glass containers, metal plates and traces of decomposed organic matters remains. Presence of dark grey leachate is evidence.
8.30
9.00
Grey to greyish-dark, sandy soil and a little of rock fragments; also mixture of waste and gravely sand.
9.00
13.5
Moderate to good recovery Very dark grey, loose to soft, generally wet with strong waste odour (leacheate), partly to slightly decomposed solid waste. Solid waste mainly composed of sand, broken glass, gravel, masonry, and brown carton paper etc mixture.
13.50 14.00 Black sand due to leachate; with strong waste odour.
14.00
20.50
Good recovery (RQD ± 10-15%) Grey, rock chunks or highly jointed (or sheared) rock fragments (grey granite) accompanied by strong leachate odour.
20.50
22.00
Greyish to dark grey, jointed and fractured granitic (granodiorite) bedrock with traces of leachate End of Borehole
Note : Wet condition is mainly due to water circulation in wash boring. Perforated screen, 4in in diameter, installed.
Appendix AA

SUSTAINABLE CLOSURE DEVELOPMENT PLANNING AND DESIGN FOR THE MINA LANDFILL
3 | M U A S S I M L A N D F I L L 2 0 1 0
MINA LANDFILL CLOSURE PROJECT 2010-2011
DEEP BORING : BH-5 COLLAR : N21 26’ 41.7” E39 54’ 33.6” START DATE: 25/01/2010
Top Bottom Description
(metre)
0.00
Dry, light grey to yellowish grey, gravely sand, and rock fragments that formed the cover materials.
9.50
Moderate to good recovery, dark grey, generally wet, with strong waste odour, loose to soft, partly to slightly decomposed solid waste, comprising mainly of mixture of plastics bags/sheets, broken pieces of plastics (PVC, PE etc), and paper carton containers, cardboards, and occasionally rubber tyres, tin cans, woods, carpet, ropes, broken glass containers and metal plates. Also mixture of waste and gravely sand; and rock fragments and rock boulders for certain depths. Presence of dark grey leachate also detected.
9.50 9.80 Sandy interlayer; probably old or interim cover layer; dark grey in colour.
9.80
16.70
Moderate to good recovery, slightly wet, dark grey, partly decomposed solid waste comprising mainly of black plastic sheets, plastics containers, woods, soil, and occasionally rock fragments, metal pieces, paper cartoons, brown cardboards, old carpet, and glass pieces etc. Lack of leachate.
16.70
18.00
Medium to good recovery. RQD ± 15%) Grey to greenish grey, friable to hard, coarse grained, highly sheared rock fragments, pinkish metamorphous granitic rock (of fracture zone); likely granodiorite. End of bore hole
Note : Wet condition is mainly due to water circulation in wash boring. Perforated screen of 4 and 2 installed.
Appendix AB
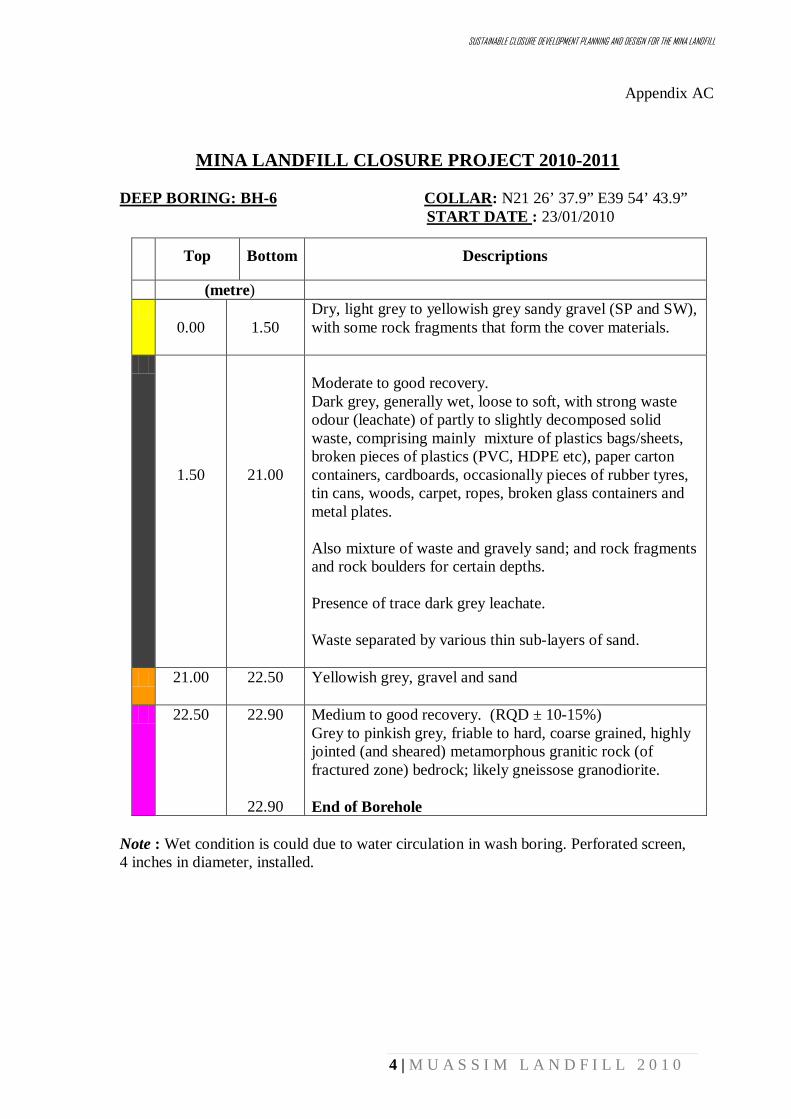
SUSTAINABLE CLOSURE DEVELOPMENT PLANNING AND DESIGN FOR THE MINA LANDFILL
4 | M U A S S I M L A N D F I L L 2 0 1 0
MINA LANDFILL CLOSURE PROJECT 2010-2011
DEEP BORING: BH-6 COLLAR
: N21 26’ 37.9” E39 54’ 43.9” START DATE
: 23/01/2010
Top Bottom Descriptions
(metre)
0.00
1.50
Dry, light grey to yellowish grey sandy gravel (SP and SW), with some rock fragments that form the cover materials.
1.50
21.00
Moderate to good recovery. Dark grey, generally wet, loose to soft, with strong waste odour (leachate) of partly to slightly decomposed solid waste, comprising mainly mixture of plastics bags/sheets, broken pieces of plastics (PVC, HDPE etc), paper carton containers, cardboards, occasionally pieces of rubber tyres, tin cans, woods, carpet, ropes, broken glass containers and metal plates. Also mixture of waste and gravely sand; and rock fragments and rock boulders for certain depths. Presence of trace dark grey leachate. Waste separated by various thin sub-layers of sand.
21.00 22.50 Yellowish grey, gravel and sand
22.50 22.90
22.90
Medium to good recovery. (RQD ± 10-15%) Grey to pinkish grey, friable to hard, coarse grained, highly jointed (and sheared) metamorphous granitic rock (of fractured zone) bedrock; likely gneissose granodiorite. End of Borehole
Note : Wet condition is could due to water circulation in wash boring. Perforated screen, 4 inches in diameter, installed.
Appendix AC

SUSTAINABLE CLOSURE DEVELOPMENT PLANNING AND DESIGN FOR THE MINA LANDFILL
5 | M U A S S I M L A N D F I L L
Appendix AD
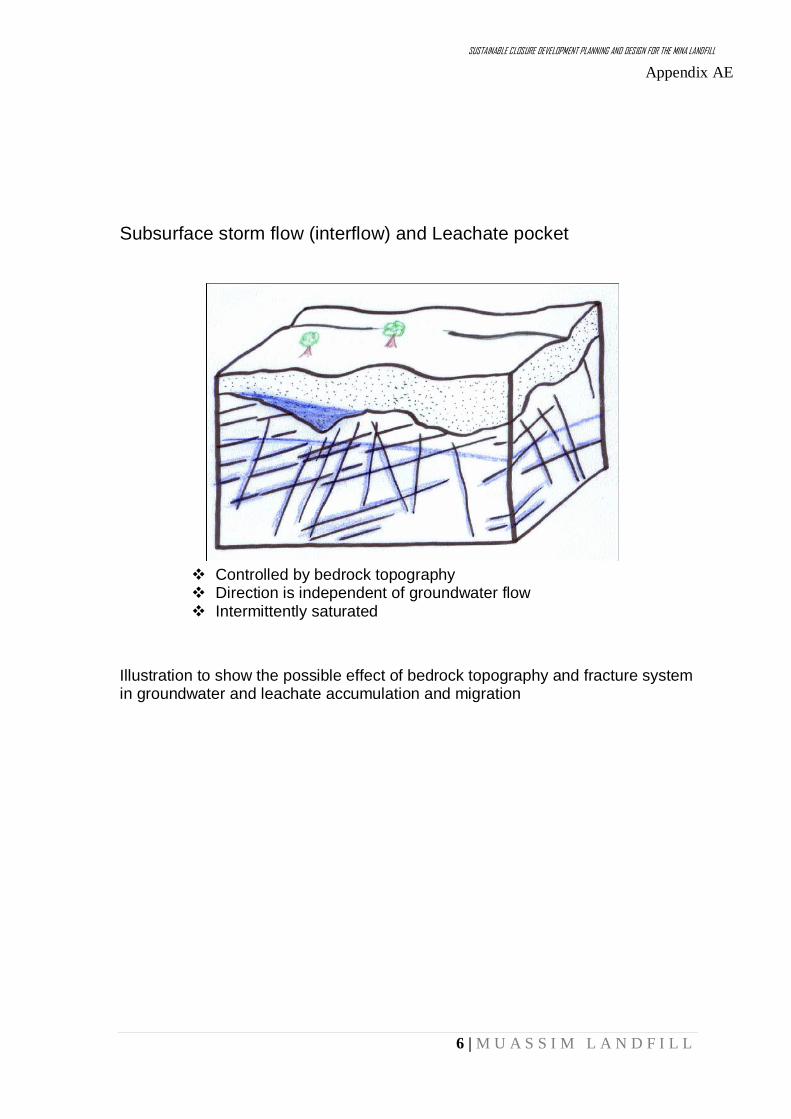
SUSTAINABLE CLOSURE DEVELOPMENT PLANNING AND DESIGN FOR THE MINA LANDFILL
6 | M U A S S I M L A N D F I L L
Subsurface storm flow (interflow) and Leachate pocket
Controlled by bedrock topography Direction is independent of groundwater flow Intermittently saturated
Illustration to show the possible effect of bedrock topography and fracture system in groundwater and leachate accumulation and migration
Appendix AE

SUSTAINABLE CLOSURE DEVELOPMENT PLANNING AND DESIGN FOR THE MINA LANDFILL
7 | M U A S S I M L A N D F I L L
2-D EARTH RESISTIVITY SURVEYS (ERT)
EQUIPMENTS AND FIELD PROCEDURES The resistivity measurements were made along twenty one 2-D electrical imaging survey
lines at Muassim Landfill site.
Electrical Imaging System is now mainly carried out with a multi-electrode resistivity
meter system as shown below. Such surveys use a number (usually 25 to 100) of
electrodes laid down in a straight line with a constant spacing. A computer-controlled
system is then used to automatically select the active electrodes for each measure
(Griffith & Barker, 1993). Throughout the survey conducted in the proposed site, the Pole
–dipole and Wenner array has been used with the ABEM SAS4000 system and SYSCAL
system. The data collected in the survey is process and interpreted using RES2DINV
software.
The arrangement of electrodes for a 2-D electrical survey and the sequence of measurement used to build up a pseudosection.
Appendix AF
a a a C1 C2 P1 P2
Station 1
P1 C1 C2 P2 2a 2a 2a
Station 2
C1 P1 P2 C2 3a 3a 3a
Station 3
E l e c t r o d e s
. . . . . . . . . . . . . . . . . . . . . . . . . . . . . .
• . . . . . .
. . . . . . . . . .
. . . . . . . . . . .
.
n = 1 n = 2 n = 3 n = 4 n = 5 n = 6
Data level
Resistivity meter
Laptop computer
1 2
3 4
5 6
• •
• •
•

SUSTAINABLE CLOSURE DEVELOPMENT PLANNING AND DESIGN FOR THE MINA LANDFILL
8 |M U A S S I M L A N D F I L L 2 0 1 1
Typical resistivity values for various geological conditions (Yoon, 2003; Loke, 2004).
Appendix AG
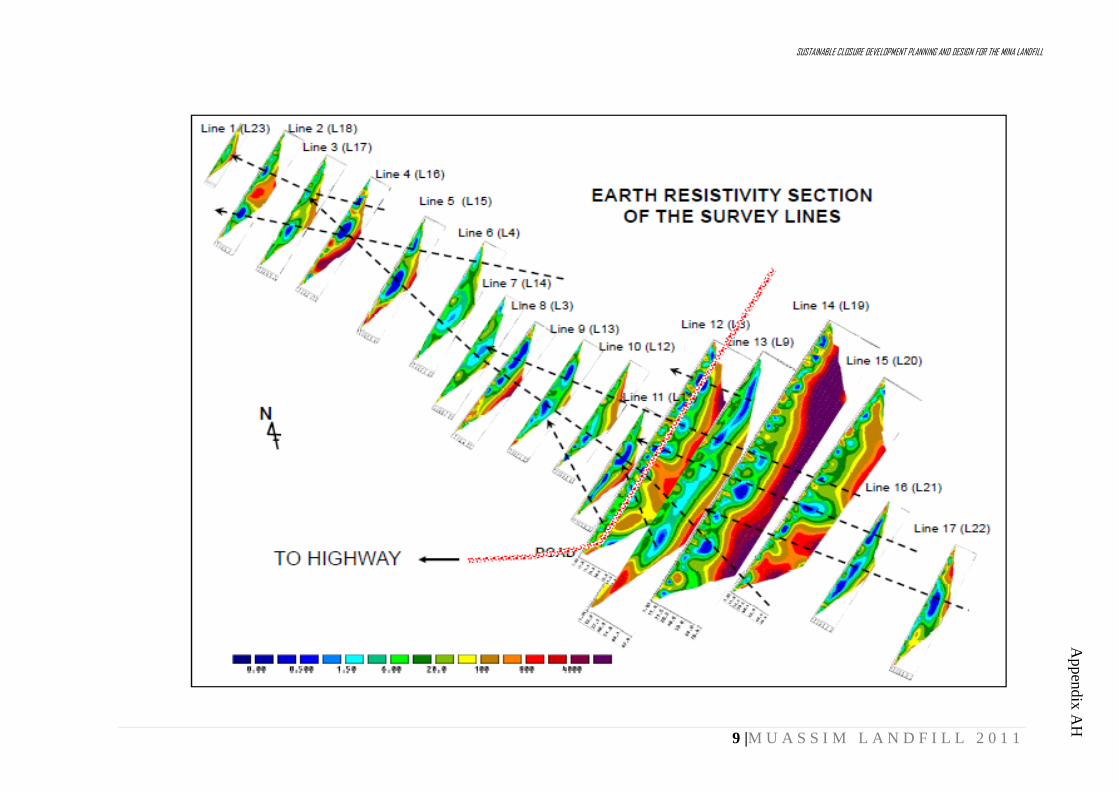
SUSTAINABLE CLOSURE DEVELOPMENT PLANNING AND DESIGN FOR THE MINA LANDFILL
9 |M U A S S I M L A N D F I L L 2 0 1 1
Appendix A
H

SUSTAINABLE CLOSURE DEVELOPMENT PLANNING AND DESIGN FOR THE MINA LANDFILL
10 |M U A S S I M L A N D F I L L 2 0 1 1
Appendix A
I
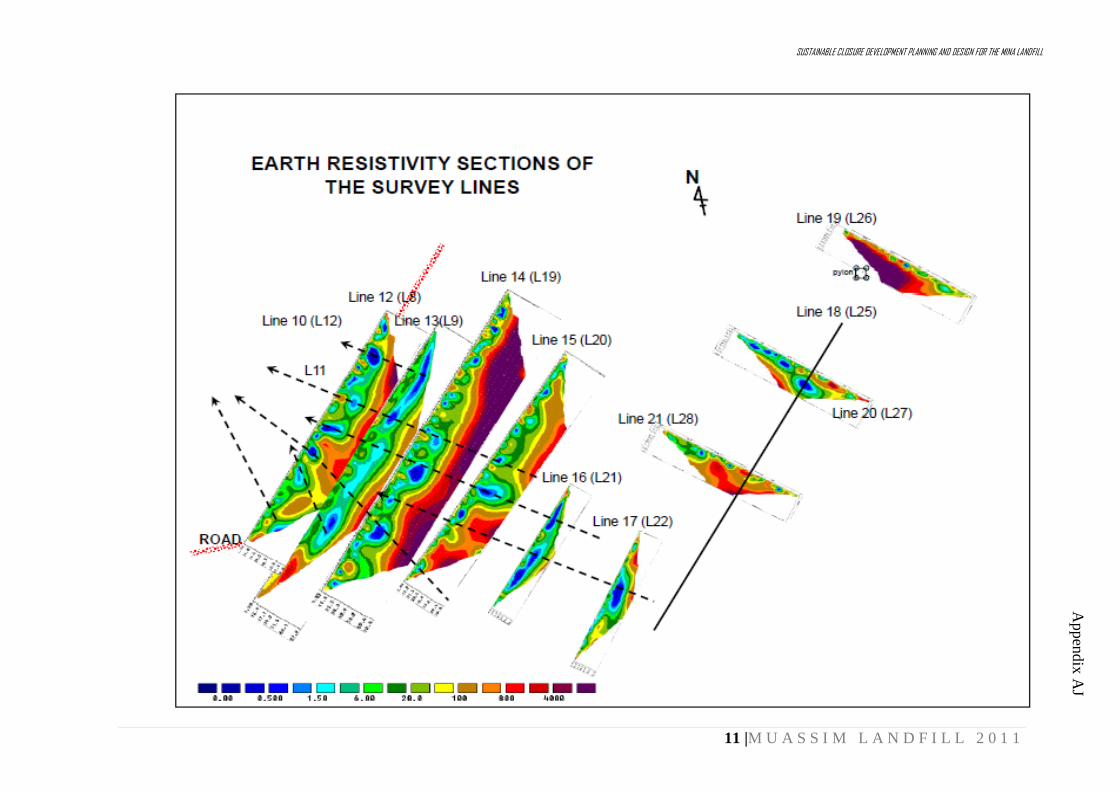
SUSTAINABLE CLOSURE DEVELOPMENT PLANNING AND DESIGN FOR THE MINA LANDFILL
11 |M U A S S I M L A N D F I L L 2 0 1 1
Appendix A
J
Appendix A
J
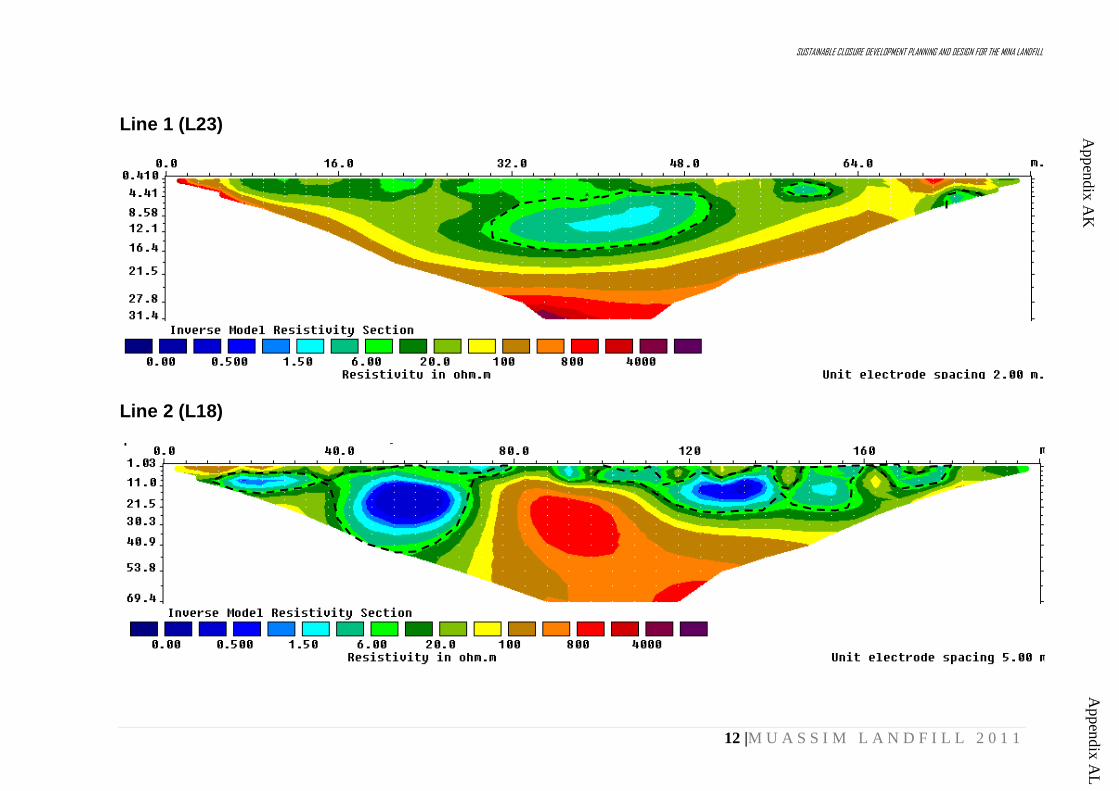
SUSTAINABLE CLOSURE DEVELOPMENT PLANNING AND DESIGN FOR THE MINA LANDFILL
12 |M U A S S I M L A N D F I L L 2 0 1 1
Line 1 (L23)
Line 2 (L18)
Appendix A
K
Appendix A
L

SUSTAINABLE CLOSURE DEVELOPMENT PLANNING AND DESIGN FOR THE MINA LANDFILL
13 |M U A S S I M L A N D F I L L 2 0 1 1
Line 3 (L17)
Line 4 (L16)

SUSTAINABLE CLOSURE DEVELOPMENT PLANNING AND DESIGN FOR THE MINA LANDFILL
14 |M U A S S I M L A N D F I L L 2 0 1 1
Line 5 (L15)
Line 6 (L4)

SUSTAINABLE CLOSURE DEVELOPMENT PLANNING AND DESIGN FOR THE MINA LANDFILL
15 |M U A S S I M L A N D F I L L 2 0 1 1
Line 7 (L14)
Line 8 (L3)
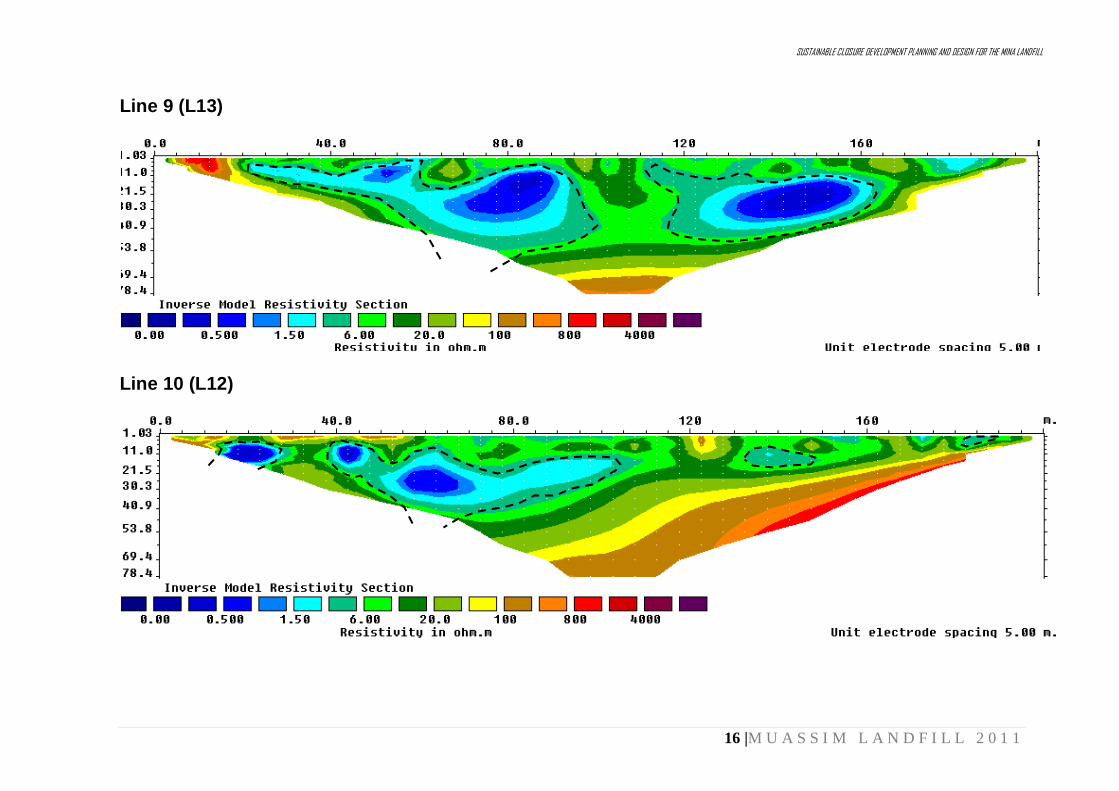
SUSTAINABLE CLOSURE DEVELOPMENT PLANNING AND DESIGN FOR THE MINA LANDFILL
16 |M U A S S I M L A N D F I L L 2 0 1 1
Line 9 (L13)
Line 10 (L12)

SUSTAINABLE CLOSURE DEVELOPMENT PLANNING AND DESIGN FOR THE MINA LANDFILL
17 |M U A S S I M L A N D F I L L 2 0 1 1
Line 11 (L11)
Line 12 (L8)

SUSTAINABLE CLOSURE DEVELOPMENT PLANNING AND DESIGN FOR THE MINA LANDFILL
18 |M U A S S I M L A N D F I L L 2 0 1 1
Line 13 (L9)
Line 14 (L19)

SUSTAINABLE CLOSURE DEVELOPMENT PLANNING AND DESIGN FOR THE MINA LANDFILL
19 |M U A S S I M L A N D F I L L 2 0 1 1
Line 15 (L20)
Line 16 (L21)

SUSTAINABLE CLOSURE DEVELOPMENT PLANNING AND DESIGN FOR THE MINA LANDFILL
20 |M U A S S I M L A N D F I L L 2 0 1 1
Line 17 (L22)
Line 18 (L25)

SUSTAINABLE CLOSURE DEVELOPMENT PLANNING AND DESIGN FOR THE MINA LANDFILL
21 |M U A S S I M L A N D F I L L 2 0 1 1
Line 19 (L26)
Line 20 (L27)

SUSTAINABLE CLOSURE DEVELOPMENT PLANNING AND DESIGN FOR THE MINA LANDFILL
22 |M U A S S I M L A N D F I L L 2 0 1 1
Line 21 (L28)

SUSTAINABLE CLOSURE DEVELOPMENT PLANNING AND DESIGN FOR THE MINA LANDFILL
23 |M U A S S I M L A N D F I L L 2 0 1 1
593600 593800 594000 594200 594400 594600 594800 595000 5952002371000
2371200
2371400
2371600
2371800
2372000
0 100 200 300 400
meter
MINA LANDFILL, MAKKAH
General surface run-off map
Vector analysis for the surface run-off in supporting the final flow pattern establishment for Muassim landfill (Appendix AM) using Surfer 8
Appendix A
M
MUASSIM LANDFILL, MAKKAH

SUSTAINABLE CLOSURE DEVELOPMENT PLANNING AND DESIGN FOR THE MINA LANDFILL
24 |M U A S S I M L A N D F I L L 2 0 1 1
Final surface run-off flow pattern at the Muassim Landfill
Appendix A
N

SUSTAINABLE CLOSURE DEVELOPMENT PLANNING AND DESIGN FOR THE MINA LANDFILL
25 |M U A S S I M L A N D F I L L 2 0 1 1
STANDARD SIZE BOX CULVERTS TABLE 1 * tc=tb for b=600, 900, 1500 and 1800, tc=50 for b=1200
NOMINAL SIZE DIMENSIONS WEIGHT (tonnes)
b h B H tb G J M LID INVERT
600 300 740 370 70 140 128 - 0.25 0.25 450 740 520 70 140 128 - 0.25 0.29 600 740 670 70 140 128 - 0.25 0.34
750 450 910 530 80 140 128 - 0.31 0.38 600 910 680 80 140 128 - 0.31 0.44 750 910 830 80 140 128 - 0.31 0.50
900
450 1060 530 80 140 100 225 0.33 0.41 600 1060 680 80 140 100 225 0.33 0.47 750 1060 830 80 140 100 225 0.33 0.52 900 1060 980 80 140 100 225 0.33 0.58
1200
600 1390 695 95 150 110 225 0.48 0.62 750 1390 845 95 150 110 225 0.48 0.69 900 1390 995 95 150 110 225 0.48 0.76 1050 1390 1145 95 150 110 225 0.48 0.83 1200 1390 1295 95 150 110 225 0.48 0.90
1500
750 1700 850 100 175 125 300 0.66 0.84 900 1700 1000 100 175 125 300 0.66 0.91 1050 1700 1150 100 175 125 300 0.66 0.98 1200 1700 1300 100 175 125 300 0.66 1.05 1350 1700 1450 100 175 125 300 0.66 1.13 1500 1700 1600 100 175 125 300 0.66 1.21
1800
900 2030 1015 115 175 125 300 0.79 1.14 1050 2030 1165 115 175 125 300 0.79 1.22 1200 2030 1315 115 175 125 300 0.79 1.31 1350 2030 1465 115 175 125 300 0.79 1.39 1500 2030 1615 115 175 125 300 0.79 1.48 1650 2030 1765 115 175 125 300 0.79 1.57 1800 2030 1915 115 175 125 300 0.79 1.65
Appendix AO

SUSTAINABLE CLOSURE DEVELOPMENT PLANNING AND DESIGN FOR THE MINA LANDFILL
26 |M U A S S I M L A N D F I L L 2 0 1 1
TABLE 2
NOMINAL SIZE DIMENSIONS WEIGHT (tonnes)
b h B H tb c tc e LID INVERT
600 300 740 440 70 300 70 70 0.25 0.33 450 740 590 70 300 70 70 0.25 0.39 600 740 740 70 300 70 70 0.25 0.44
750 450 910 610 80 450 80 80 0.31 0.50 600 910 760 80 450 80 80 0.31 0.56 750 910 910 80 450 80 80 0.31 0.62
900
450 1060 610 80 450 80 80 0.33 0.55 600 1060 760 80 450 80 80 0.33 0.61 750 1060 910 80 450 80 80 0.33 0.66 900 1060 1060 80 450 80 80 0.33 0.72
1200
600 1390 920 95 1075 50 225 0.48 0.97 750 1390 1070 95 1075 50 225 0.48 1.05 900 1390 1220 95 1075 50 225 0.48 1.11
1050 1390 1370 95 1075 50 225 0.48 1.19 1200 1390 1520 95 1075 50 225 0.48 1.25
1500
750 1700 1075 100 1075 100 225 0.66 1.35 900 1700 1225 100 1075 100 225 0.66 1.42
1050 1700 1375 100 1075 100 225 0.66 1.50 1200 1700 1525 100 1075 100 225 0.66 1.58 1350 1700 1675 100 1075 100 225 0.66 1.65 1500 1700 1825 100 1075 100 225 0.66 1.72
1800
900 2030 1240 115 1075 115 225 0.79 1.83 1050 2030 1390 115 1075 115 225 0.79 1.92 1200 2030 1540 115 1075 115 225 0.79 2.00 1350 2030 1690 115 1075 115 225 0.79 2.09 1500 2030 1840 115 1075 115 225 0.79 2.17 1650 2030 1990 115 1075 115 225 0.79 2.26 1800 2030 2140 115 1075 115 225 0.79 2.34
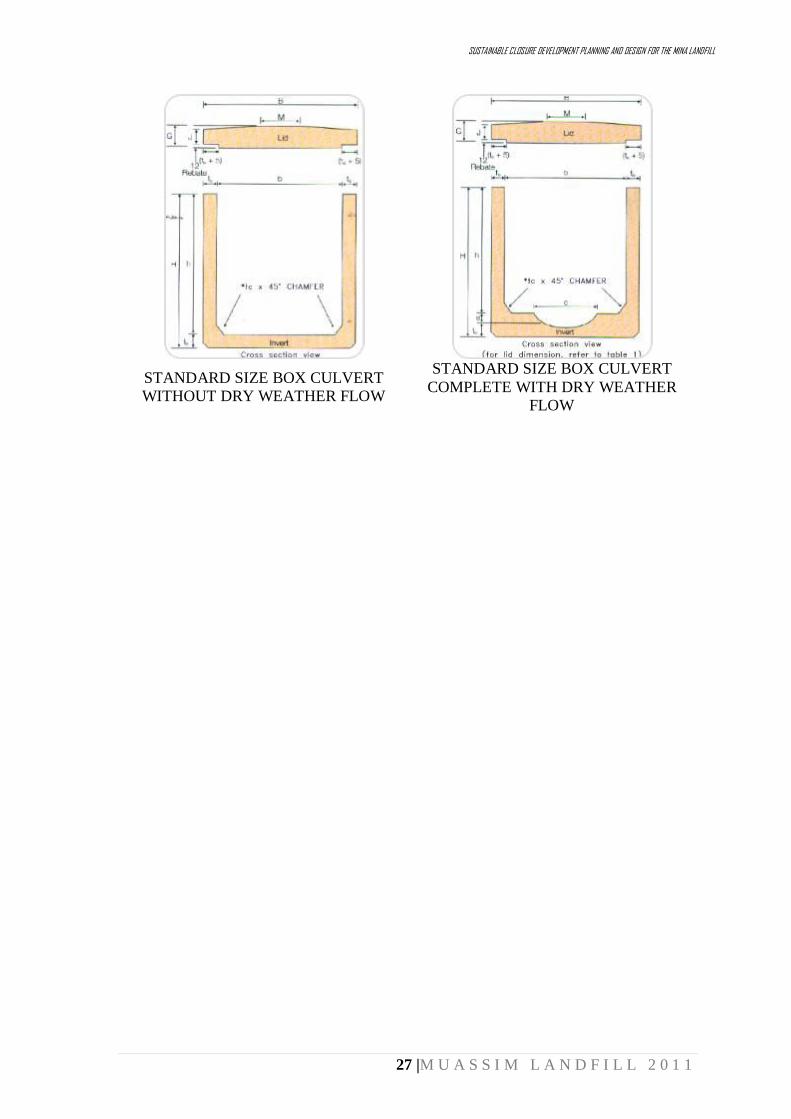
SUSTAINABLE CLOSURE DEVELOPMENT PLANNING AND DESIGN FOR THE MINA LANDFILL
27 |M U A S S I M L A N D F I L L 2 0 1 1
STANDARD SIZE BOX CULVERT WITHOUT DRY WEATHER FLOW
STANDARD SIZE BOX CULVERT COMPLETE WITH DRY WEATHER
FLOW