final report (arial 22) - serdp and estcpp ew...4.3 fort carson building 1444 dining facility ......
TRANSCRIPT
(EW-201151)
EXHAUST HOOD AND MAKEUP AIR OPTIMIZATION
August 2014 This document has been cleared for public release; Distribution Statement A
i
COST & PERFORMANCE REPORT Project: EW-201151
TABLE OF CONTENTS
Page
EXECUTIVE SUMMARY ...................................................................................................... ES-1
1.0 INTRODUCTION .............................................................................................................. 1 1.1 BACKGROUND .................................................................................................... 1 1.2 OBJECTIVE OF THE DEMONSTRATION ......................................................... 1 1.3 REGULATORY DRIVERS ................................................................................... 2
2.0 TECHNOLOGY DESCRIPTION ...................................................................................... 3 2.1 TECHNOLOGY OVERVIEW ............................................................................... 3 2.2 TECHNOLOGY DEVELOPMENT ....................................................................... 4 2.3 ADVANTAGES AND LIMITATIONS OF THE TECHNOLOGY...................... 5
3.0 PERFORMANCE OBJECTIVES ...................................................................................... 7
4.0 FACILITY/SITE DESCRIPTION ...................................................................................... 9 4.1 FORT LEE, VA BUILDING 18028 ....................................................................... 9 4.2 ELLSWORTH AIR FORCE BASE (AFB) BASE EXCHANGE (BX)
FOOD COURT ..................................................................................................... 10 4.3 FORT CARSON BUILDING 1444 DINING FACILITY ................................... 12 4.4 U.S. AIR FORCE ACADEMY (USAFA) BUILDING 5218 DINING
FACILITY ............................................................................................................ 13
5.0 TEST DESIGN ................................................................................................................. 15 5.1 CONCEPTUAL TEST DESIGN .......................................................................... 15 5.2 BASELINE CHARACTERIZATION .................................................................. 15 5.3 DESIGN AND LAYOUT OF TECHNOLOGY COMPONENTS ...................... 16 5.4 OPERATIONAL TESTING ................................................................................. 16 5.5 SAMPLING PROTOCOL .................................................................................... 17 5.6 SAMPLING RESULTS ........................................................................................ 18
6.0 SYSTEM PERFORMANCE ASSESSMENT .................................................................. 21 6.1 FORT LEE SYSTEM PERFORMANCE ASSESSMENT .................................. 21
6.1.1 Fan Motor Electrical Savings.................................................................... 21 6.1.2 Heating and Cooling Energy Savings ....................................................... 21
6.2 TYPICAL DCV CONTROL SYSTEM FOR APPLICATION ACROSS DOD ...................................................................................................................... 22
7.0 COST ASSESSMENT ...................................................................................................... 29 7.1 COST MODEL ..................................................................................................... 29
7.1.1 Installation Cost Considerations ............................................................... 29 7.2 VFD AND FAN MOTOR INSTALLATION ISSUES ........................................ 31

TABLE OF CONTENTS (continued)
Page
ii
7.3 SUPPLY AIR SYSTEM ISSUES ......................................................................... 31 7.4 ECONOMIC COST ANALYSIS AND COMPARISON BETWEEN
SITES .................................................................................................................... 31 7.4.1 Economic Cost Analysis of Site Installations ........................................... 31 7.4.2 Economical Analysis of Potential DoD Sites ........................................... 32
8.0 IMPLEMENTATION ISSUES ........................................................................................ 35 8.1 INSTALLATION CONSIDERATIONS .............................................................. 35
8.1.1 Sensors ...................................................................................................... 35 8.1.2 Fan Motor Issues ....................................................................................... 35 8.1.3 Supply Air System Issues ......................................................................... 35 8.1.4 Elements Requiring Maintenance ............................................................. 36
8.2 CODES AND REGULATIONS THAT RELATE TO KITCHEN HOODS ....... 36 8.3 PROCUREMENT CONSIDERATIONS ............................................................. 37
9.0 REFERENCES ................................................................................................................. 39 APPENDIX A DEMONSTRATION PROJECT POINTS OF CONTACT ................... A-1
iii
LIST OF FIGURES
Page Figure 1. Melink Intelli-Hood controls. ................................................................................. 3 Figure 2. Building 18028, a large two-story DFAC. .............................................................. 9 Figure 3. Building 18028 main kitchen – one side of hood 1. ............................................... 9 Figure 4. BX building with food court restaurants. .............................................................. 10 Figure 5. Burger King’s kitchen hood. ................................................................................. 11 Figure 6. Charley’s kitchen hood. ........................................................................................ 12 Figure 7. James R Wolf DFAC, Building 1444, Fort Carson, CO. ...................................... 12 Figure 8. Building 1444, hood 1 side two. ........................................................................... 13 Figure 9. Building 5218 USAFA prep school dining facility. ............................................. 13 Figure 10. Building 5218 exhaust hood. ................................................................................ 14 Figure 11. Melink components added to each exhaust hood. ................................................ 16 Figure 12. Building 18028, plan view of temperature/relative humidity (T/RH) logger
locations (red dots). ............................................................................................... 18 Figure 13. Building 18028, EF-1 average daily power profiles, weekdays, weekends,
and all days. .......................................................................................................... 18 Figure 14. Building 18028, average daily space temperature profile, pre-/post-retrofit. ....... 19

iv
LIST OF TABLES
Page Table ES1. Summary of energy savings provided by DCV systems on kitchen hoods. ..... ES-2 Table ES2. Economic results of installed DCV systems. .................................................... ES-2 Table ES3. DCV control system economics when applied to United States climate
regions. .............................................................................................................. ES-3 Table 1. Sample performance objectives. ............................................................................. 7 Table 2. Building 18028 kitchen ventilation rates. ............................................................. 10 Table 3. Operational testing schedule for the four test sites. .............................................. 17 Table 4. Building 18028, summary of daily average electric use. ...................................... 18 Table 5. Summary of energy savings provided by DCV systems on kitchen hoods. ......... 19 Table 6. Fort Lee Building 18208 fan motor electrical power savings............................... 21 Table 7. Fort Lee Building 18208 estimated air flows due to fan motor speed
reduction. .............................................................................................................. 22 Table 8. Fort Lee Building 18208 heating energy savings. ................................................ 22 Table 9. Fort Lee Building 18208 cooling electrical energy savings. ................................ 22 Table 10. Typical kitchen hood ventilation with heating and cooling provided. .................. 23 Table 11. Typical kitchen hood ventilation with heating and no cooling provided. ............. 23 Table 12. Climate zone cities. ............................................................................................... 24 Table 13. Typical kitchen annual fan motor electrical savings from DCV controls. ........... 25 Table 14. Typical kitchen annual thermal energy savings from DCV controls. ................... 25 Table 15. Electricity savings from avoiding hood ventilation during night unoccupied
hours. ..................................................................................................................... 26 Table 16. Thermal energy savings from avoiding hood ventilation during night
unoccupied hours. ................................................................................................. 26 Table 17. Comparison of Fort Carson energy savings versus typical DFAC energy
savings using DoD average energy unit costs....................................................... 26 Table 18. Typical kitchen DCV control energy savings in 15 climate zone cities. .............. 27 Table 19. Site factors that influence installed DCV control system cost. ............................. 29 Table 20. Project study site installation costs. ...................................................................... 30 Table 21. DCV control system costing information. ............................................................ 30 Table 22. Typical DCV control system cost. ........................................................................ 31 Table 23. Economic results of installed DCV systems. ........................................................ 32 Table 24. Economic result comparison of typical DCV control system and site
installation at Fort Carson. .................................................................................... 32 Table 25. DCV control system economics when applied to United States climate
regions. .................................................................................................................. 33
v
ACRONYMS AND ABBREVIATIONS AFB Air Force Base AHU air handling unit AIRR Adjusted Internal Rate of Return ANSI American National Standards Institute APU air purge unit ASHRAE American Society of Heating, Refrigerating, and Air-Conditioning
Engineers ASTM American Society for Testing and Materials BACnet building automation and control networks BAS building automation system Btu British thermal unit BX Base Exchange CFM cubic feet per minute CO carbon monoxide CONUS Continental United States CoP coefficient of performance DCV demand controlled ventilation DFAC dining facility DoD U.S. Department of Defense EF exhaust fan EO Executive Order EPAct 2005 Energy Policy Act of 2005 ESTCP Environmental Security Technology Certification Program EW Energy and Water °F degrees Fahrenheit fpm feet per minute ft2 square feet FY fiscal year GHG greenhouse gas HGL HydroGeoLogic, Inc. hp horsepower HQIIS (Army) Headquarters Information System HVAC heating, ventilating, and air-conditioning IES Illuminating Engineering Society IMC International Mechanical Building Code IOP input/output processor
ACRONYMS AND ABBREVIATIONS (continued)
vi
kW kilowatt kWh kilowatt hour MAU makeup air unit MMBtu million metric British thermal units NEMA National Electrical Manufacturers Association NFPA National Fire Protection Association OA outside air OEM original equipment manufacturer QSR quick service restaurant RH relative humidity SAT supply air temperature SERDP Strategic Environmental Research and Development Program SIOH supervision, inspection, and overhead SIR savings to investment ratio T/RH temperature/relative humidity UFC Unified Facilities Criteria USAFA U.S. Air Force Academy USEPA U.S. Environmental Protection Agency VAV variable air volume VFD variable-frequency drive VSD variable speed drive

Technical material contained in this report has been approved for public release. Mention of trade names or commercial products in this report is for informational purposes only;
no endorsement or recommendation is implied.
vii
ACKNOWLEDGEMENTS Funding for this demonstration was provided by the Strategic Environmental Research and Development Program (SERDP) under Energy and Water (EW) Project 201151, “Exhaust Hood and Makeup Air Optimization.” Two Army installations and two Air Force installations provided demonstration sites and technical support to this project. At Fort Lee, Virginia, Mr. Gary Ogden and Mr. Robert Andrus provided much needed support. Mr. Ted Cleberg provided guidance and support at Ellsworth Air Force Base (AFB), South Dakota. At Fort Carson, Colorado, Mr. Scott Clark and Mr. Vince Guthrie were equally as helpful. Mr. Thomas Hykes supported the demonstration at the U.S. Air Force Academy Preparatory School, Colorado Springs, Colorado. Finally, the team and authors gratefully acknowledge the financial support and technical guidance provided by the Environmental Security Technology Certification Program (ESTCP) Office under the leadership of Mr. James Galvin, as well as support provided by Mr. Jonathan Thigpen of HydroGeoLogic, Inc. (HGL), throughout the project period of performance.

This page left blank intentionally.
ES-1
EXECUTIVE SUMMARY
The overall goal of this work was to demonstrate a technology (variable flow exhaust hoods) that can decrease energy usage at U.S. Department of Defense (DoD) facilities while maintaining or improving occupant comfort. This ESTCP research project demonstrated the optimization potential of exhaust flow hoods and related makeup air units (MAU), primarily in dining facilities located in several Continental United States (CONUS) climate zones, by use of demand controlled ventilation (DCV) technologies. The two performance objectives for this project were: (1) to demonstrate a minimum of 30% savings in both energy use and associated greenhouse gas (GHG) emissions, and (2) to maintain or improve occupant comfort. These objectives were accomplished primarily through the installation of DCV technology. Energy savings were validated by monitoring energy use before and after the installation of DCV technology. Qualitative benefits, such as noise reduction, were validated through surveys of personnel working with the retrofitted systems.
This technology has widespread energy savings potential. The Army alone has approximately 1900 cafeterias, dining facilities, and various other eateries occupying over 12 million square feet (ft2), many of which have exhaust hoods. The majority of the exhaust hoods and related MAUs are constant volume systems, some of which operate 24 hours a day regardless of activity in the facility. In DoD kitchens, exhaust flow rates range from a few thousand up to about 50,000 cubic feet per minute (CFM). Operating exhaust hood equipment in this manner wastes large quantities of energy and may result in uncomfortable working conditions in the dining facilities.
DCV technology operates automatically by monitoring cooking activity and by automatically modulating exhaust airflow using temperature and opacity sensors connected to a controller and variable-frequency drives (VFD) on exhaust hood and MAU fan motors. The sensor data is passed to a controller that is programmed to increase airflow to 100% of design when active cooking is detected and to reduce the airflow typically to between 50 to 70% of design at idle conditions. These sensors measure cooking activities by sensing exhaust air temperature, infrared temperature of cooking surfaces, and/or the presence of smoke/steam.
Between 2012 and 2013, this demonstration installed DCV systems on the main kitchen hoods in three dining facilities (DFAC) and one food court at the following selected sites:
• Three DFACs: o U.S. Air Force Academy (USAFA) Preparatory School, Colorado Springs,
Colorado, High Country Inn Building 5218, a DFAC with a 240-person serving capacity.
o Fort Lee, Virginia, Samuel Sharpe Dining Facility Building 18028, a large DFAC with a 5000-person serving capacity.
o Fort Carson, Colorado Springs, Colorado, James R. Wolf Dining Facility Building 1444, with a 600-person serving capacity.
• Food Court: o Ellsworth Air Force Base (AFB), South Dakota, Base Exchange Food Court with
fast food restaurants (Burger King and Charley’s).

ES-2
Table ES1 lists the energy savings achieved by the DCV systems installed on the kitchen hoods at the four sites. Before the DCV systems were installed at these sites, kitchen hood ventilation equipment was turned off at night when the dining facilities were closed approximately 75% of the time. Energy savings would be much greater at sites where kitchen hood ventilation equipment runs continuously throughout the day and night.
Table ES1. Summary of energy savings provided by DCV systems on kitchen hoods.
Test Site Energy Use Before DCV Energy Saved By DCV Percent Saved
kWh/yr Therms/yr MMBtu/yr kWh/yr Therms/yr MMBtu/yr kWh Therms Btu Fort Lee 215,560 23,716 3108 99,294 6436 983 46% 27% 32% Ellsworth 8889 3548 385 5169 1166 134 58% 33% 35% Fort Carson 29,313 22,546 2355 16,582 7043 761 57% 31% 32% USAFA 60,655 18,975 2105 31,885 6722 781 53% 35% 37% Totals 314,417 68,785 7952 152,930 21,367 2659 49% 31% 33%
kWh/yr = kilowatt hours per year therms/yr = therms per year MMBtu/yr = million metric British thermal units The economics results listed in Table ES2 indicate that the cost effectiveness of the energy saving results varied from very good (savings to investment ratio [SIR] of 2.14 at Fort Lee) to poor (SIR of 0.3 at Ellsworth AFB, where installation of the technology was not economically justified). The simple payback ranged from 4.6 years (best return) to 37.2 years (worst return). Both goals of reduced GHG emission and energy reduction were reached to varying degrees. Other goals, e.g., to maintain maintenance requirements with no increase and to satisfy users, were met at all locations.
Table ES2. Economic results of installed DCV systems.
DFAC Site
Utility Cost Savings
Maintenance Cost
Total Savings
System Cost
Simple Payback,
Years SIR Electric Natural
Gas Fort Lee $7,427 $3,579 $800 $10,003 $48,410 4.7 1.86 Ellsworth AFB $339 $875 $400 $813 $30,255 37.2 0.28 Fort Carson $995 $3,521 $600 $3,916 $51,790 13.2 0.79 Air Force Academy $1,913 $3362 $400 $4875 $41,161 8.4 1.18 SIR = savings to investment ratio The Fort Carson facility was chosen as the basis for a “typical” Army installation DFAC, in size and layout, for an Army-wide assessment of the value of installing DCV systems on DFAC kitchen hoods. The Fort Carson facility’s kitchen hood ventilation system had a much lower ventilation rate than what the system design specified. Design ventilation rates that would be more appropriate for a typical facility in combination with other information gained from the test results were used to do an economic evaluation that placed each test facility in one of the 15 climate zone cities found in the United States (Table ES3).

ES-3
Table ES3. DCV control system economics when applied to United States climate regions.
Climate Zone City
Annual Energy Costs
Savings
Annual Maintenance
Costs
DCV System
Cost
Simple Payback Period, Years SIR AIRR
1A Miami, FL $5951 $600 $43,496 8.13 1.08 3.75% 2A Houston, TX $7918 $600 $43,496 5.94 1.56 7.69% 2B Phoenix, AZ $9101 $600 $43,496 5.12 1.78 9.10% 3A Memphis, TN $9632 $600 $43,496 4.82 1.99 10.32% 3B El Paso, TX $8785 $600 $43,496 5.31 1.77 9.06% 3C San Francisco, CA $9432 $600 $43,496 4.92 2.00 10.38% 4A Baltimore, MD $11,601 $600 $43,496 3.95 2.48 12.80% 4B Albuquerque, NM $10,201 $600 $43,496 4.53 2.13 11.12% 4C Seattle, WA $10,967 $600 $43,496 4.20 2.37 12.31% 5A Chicago, IL $12,242 $600 $43,496 3.74 2.69 13.71% 5B Colorado Springs, CO $10,970 $600 $43,496 4.19 2.365 12.25% 6A Burlington, VT $13,918 $600 $43,496 3.27 3.10 15.34% 6B Helene, MT $12,926 $600 $43,496 3.53 2.86 14.40% 7A Duluth, MN $16,192 $600 $43,496 2.79 3.66 17.27% 8A Fairbanks, AK $21,501 $600 $43,496 2.08 4.96 20.91%
AIRR = Adjusted Internal Rate of Return An economic analysis done to determine which size kitchen hoods were the best candidates to be fitted with DCV technology indicated that the DCV control systems were most economical when installed on main exhaust airflow hoods found in dining facilities with a total motor size greater than 5 horsepower (hp) and/or exhaust volumes greater than 5000 CFM. It appears that DCV technology is not optimally cost effective when applied to infrequently used or smaller hoods, such as those found in food service facilities located in food courts. Based on the analysis of typical energy savings, the number of facilities that could be economically retrofitted in the Army was estimated to be 378 of the 1900 eating facilities. Due to the size of investment for this technology, it was determined that a majority of the following parameters must be met to justify the installation cost:
• Relatively large exhaust hood (minimum of 5000 CFM); • Climate requiring significant heating and or cooling of makeup air; • Relatively long operating hours; and • Medium to high utility costs.

This page left blank intentionally.

1
1.0 INTRODUCTION
Exhaust hoods and makeup air units (MAU) are often poorly designed and controlled. It is common for these components to operate at constant flow rates for long periods, sometimes up to 24 hours per day. This practice results in a waste of large amounts of fan energy and conditioned air, where reducing fan speed to an idle can save up to 90% fan energy and 70% conditioned air. Application of Variable Frequency Drive (VFD) technologies can achieve overall average energy savings of 66% fan speed, and average savings for conditioned air of around 35%. Additionally, the waste of conditioned air often results in uncomfortable working conditions in dining facilities (DFAC). This report includes information on the energy savings that may be gained by the use of variable flow systems in exhaust hoods and MAUs.
1.1 BACKGROUND
The Army alone has approximately 1900 cafeterias, DFACs, and various other restaurants that occupy an area of over 12 million square feet (ft2) (per the Army Headquarters Installation Information System [HQIIS] database). Many of these locations have exhaust hoods. The majority of the exhaust hoods and related MAUs are constant volume systems, some of which operate 24 hours a day regardless of activity in the facility. Exhaust rates in U.S. Department of Defense (DoD) kitchens range from a few thousand up to about 50,000 cubic feet per minute (CFM). The heating, ventilating, and air-conditioning (HVAC) industry has adopted demand controlled ventilation (DCV) to reduce overall ventilation rates and energy use in high occupancy spaces. DCV technology has been used in kitchens to modulate exhaust hood and makeup air ventilation rates since the 1990s. Kitchen DCV has been implemented in a few DFACs in the past 10 years, at which time “the high performance building” became a design objective. However, DCV technology is not yet a standard option in military design guides.
1.2 OBJECTIVE OF THE DEMONSTRATION
The main objectives of this project were to validate energy savings and to demonstrate the optimization of exhaust flow hoods and related MAUs, primarily in DFACs. This was accomplished primarily through installation of temperature and opacity sensors connected to a controller and VFDs on exhaust hood and MAU fan motors. The controller modulates the exhaust hood fan speeds and the MAU fans based on input from the temperature and opacity sensors. End panels were installed on the exhaust hoods, where appropriate, to improve capture and containment performance. Energy savings were validated through monitoring energy use before and after the installation of DCV technology. Qualitative benefits, such as noise reduction, were validated through surveys of personnel working with the retrofitted systems. Insights from the demonstration were used to provide guidance for the alteration of various criteria and guidelines, such as Unified Facilities Criteria (UFC) 4-722-1 Dining Facilities and Prospect Course 391 HVAC Design.
2
1.3 REGULATORY DRIVERS
The need to reduce building energy use has been documented in many government regulations, including:
• Energy Policy Act of 2005 (EPAct 2005), 8 August 2005;
• 2005 Army Energy Strategy for Installations;
• Executive Order (EO) 13423, 24 January 2007;
• 2006/2007 Defense Science Board Key Facility Energy Strategy Recommendations;
• Energy Independence & Security Act, effective 19 December 2007; and
• EO 13514, Federal Leadership in Environmental, Energy, and Economic Performance, October 2009.
Many of these policies, directives, and EOs overlap in their requirements. Collectively, the pertinent requirements are to:
• Reduce energy consumption by 20% by fiscal year (FY) 2015 (relative to 2003);
• Improve energy efficiency in buildings by 30% using American Society of Heating, Refrigerating, and Air-Conditioning Engineers (ASHRAE) Standard 90.1 as a baseline;
• Reduce dependence on fossil fuels and make renewable energy at least 7.5% of total energy purchase by 2013 (DoD Internal Guidance calls for 25% by 2025);
• Improve energy security;
• Construct or renovate buildings in accordance with sustainability strategies, including re-source conservation, use, site criteria, and indoor environmental quality; and
• Set greenhouse gas (GHG) emission reduction goals for FY2020 based on a FY2008 baseline.

3
2.0 TECHNOLOGY DESCRIPTION
2.1 TECHNOLOGY OVERVIEW
The technology retrofit includes installing:
1. Melink® Intelli-Hood® system (sensors and control for VFD motors), and 2. Stainless steel end panels (to direct and control exhaust flow).
The Melink® Intelli-Hood® system adds optical and temperature sensors inside the exhaust hood to detect when active cooking occurs and when additional appliances are turned on (see Figure 1). The sensor data is passed to a controller that is programmed to increase airflow to 100% of design when active cooking is detected and to reduce the airflow typically to between 50 to 70% of design at idle conditions. To change the exhaust airflow rate, the exhaust fan and the MAU fans must have VFDs with VFD-rated motors. A signal indicating airflow rate through the kitchen hood is shared with MAUs so that their airflow can also be varied according to actual makeup airflow requirements. This DCV hood control approach provides a marked improvement over the typical constant volume single speed full design flow approach.
Figure 1. Melink Intelli-Hood controls.

4
2.2 TECHNOLOGY DEVELOPMENT
This technology uses a temperature sensor to monitor heat load and an optical sensor to monitor smoke load; together, these parameters determine the cooking load. The optical sensor includes an air purge unit that ensures that the sensor stays clean with a positive pressure of clean, uncontaminated air from above the hood. Other components include the processor, user interface, and VFDs, which vary the speed of the exhaust and makeup air fan motors. This project used the second generation Intelli-Hood, which is described throughout the report. Key system upgrades that compose the product’s evolution from invention to industry standard include:
• REM-1 (1989-1997) to 1st Generation Intelli-Hood (1997-2005) o Control system redubbed “Intelli-Hood.”
o Unit designed for both hood original equipment manufacturers (OEM) and retrofits with keypad and easy to mount components.
o Addition of plug-n-play cables for easy field wiring.
o Addition of low-voltage air purge units and automatic recalibration feature.
o Incorporation of Simplissimo programming menu for easy set-up.
• 1st Generation Intelli-Hood (1999-2005) to 2nd Generation Intelli-Hood (2004-Current) o Addition of single home run cable from hood to processor to allow for easier and
cleaner installation. Prior version required a cable per sensor.
o Use of remote monitoring via analog phone lines to allow for remote diagnostics, alarming, and verification of energy savings.
o Incorporated communications with VFD via Modbus to allow for increased diagnostics when integrated with remote monitoring. Prior version communicated via an analog signal.
o Improved algorithms for saving energy and ensuring optimal kitchen comfort.
o Added broader keypad display to allow for more intuitive fault codes and easier programming.
• 2nd Generation Intelli-Hood (2004-Current) to 3rd Generation Intelli-Hood (available August 2013)
o Uses building automation and control network (BACnet) communications protocol to allow for communication with building automation systems (BAS).
o Incorporated increased scalability to allow for control of up to 39 hoods per system controller versus four previously.
o Uses enhanced full-color graphic display on primary user interface for more intuitive customer experience. Also added capability to use multiple user interfaces per system.
5
o Added Ethernet communication access for additional remote capabilities including re-mote firmware upgrades.
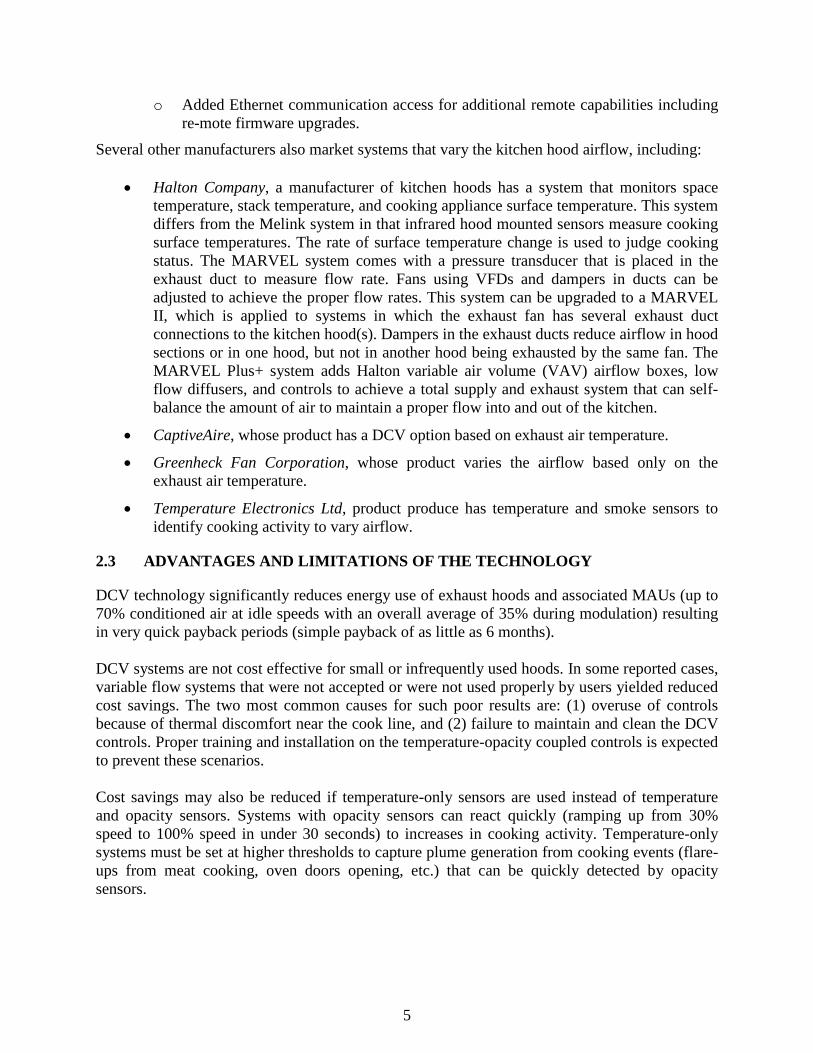
Several other manufacturers also market systems that vary the kitchen hood airflow, including:
• Halton Company, a manufacturer of kitchen hoods has a system that monitors space temperature, stack temperature, and cooking appliance surface temperature. This system differs from the Melink system in that infrared hood mounted sensors measure cooking surface temperatures. The rate of surface temperature change is used to judge cooking status. The MARVEL system comes with a pressure transducer that is placed in the exhaust duct to measure flow rate. Fans using VFDs and dampers in ducts can be adjusted to achieve the proper flow rates. This system can be upgraded to a MARVEL II, which is applied to systems in which the exhaust fan has several exhaust duct connections to the kitchen hood(s). Dampers in the exhaust ducts reduce airflow in hood sections or in one hood, but not in another hood being exhausted by the same fan. The MARVEL Plus+ system adds Halton variable air volume (VAV) airflow boxes, low flow diffusers, and controls to achieve a total supply and exhaust system that can self-balance the amount of air to maintain a proper flow into and out of the kitchen.
• CaptiveAire, whose product has a DCV option based on exhaust air temperature.
• Greenheck Fan Corporation, whose product varies the airflow based only on the exhaust air temperature.
• Temperature Electronics Ltd, product produce has temperature and smoke sensors to identify cooking activity to vary airflow.
2.3 ADVANTAGES AND LIMITATIONS OF THE TECHNOLOGY
DCV technology significantly reduces energy use of exhaust hoods and associated MAUs (up to 70% conditioned air at idle speeds with an overall average of 35% during modulation) resulting in very quick payback periods (simple payback of as little as 6 months). DCV systems are not cost effective for small or infrequently used hoods. In some reported cases, variable flow systems that were not accepted or were not used properly by users yielded reduced cost savings. The two most common causes for such poor results are: (1) overuse of controls because of thermal discomfort near the cook line, and (2) failure to maintain and clean the DCV controls. Proper training and installation on the temperature-opacity coupled controls is expected to prevent these scenarios. Cost savings may also be reduced if temperature-only sensors are used instead of temperature and opacity sensors. Systems with opacity sensors can react quickly (ramping up from 30% speed to 100% speed in under 30 seconds) to increases in cooking activity. Temperature-only systems must be set at higher thresholds to capture plume generation from cooking events (flare-ups from meat cooking, oven doors opening, etc.) that can be quickly detected by opacity sensors.

This page left blank intentionally.

7
3.0 PERFORMANCE OBJECTIVES
The overall goal of this project was to demonstrate a technology that can decrease energy usage at DoD facilities while maintaining or improving occupant comfort. The two main performance objectives for this demonstration were:
• Savings: To achieve at least 30% savings of energy use and resulting associated GHG reduction with and without the retrofit to the exhaust and MAUs.
• Building Environment: To maintain or improve building occupants’ comfort, as determined by survey or communications with the kitchen facility personnel.
Table 1 lists sample performance objectives.
Table 1. Sample performance objectives.
Performance Objective Metric Data Requirements Success Criteria Results
Quantitative Performance Objectives Exhaust hood and MAU energy use
Heating, cooling, and fan energy use kWh, BTU
Hours of equipment run time, electric meter readings, heating and cooling
30% reduction in total energy use
Achieved 37% energy use reduction based on totals from the four sites
GHG emissions Fossil fuel GHG emissions (metric tons)
Energy reduction, energy source, and USEPA estimates of resulting emissions
30% reduction Achieved 37% reduction based on results from the four sites
Return on investment
SIR Energy savings, energy cost and investment cost
SIR > 2 Only demonstrated DCV system at Fort Lee provided SIR>2 but across DoD a typical 5000 CFM hood estimated to range from 1 to 5
Qualitative Performance Objectives User satisfaction Degree of
satisfaction Interview of DFAC personnel
No change in satisfaction over baseline, new controls routinely used
Feedback from Fort Lee installation showed no concerns with the of DCV system. Other sites provided no feedback
BTU = British thermal unit kWh = kilowatt hour SIR = Savings to investment ratio USEPA = U.S. Environmental Protection Agency

This page left blank intentionally.
9
4.0 FACILITY/SITE DESCRIPTION
4.1 FORT LEE, VA BUILDING 18028
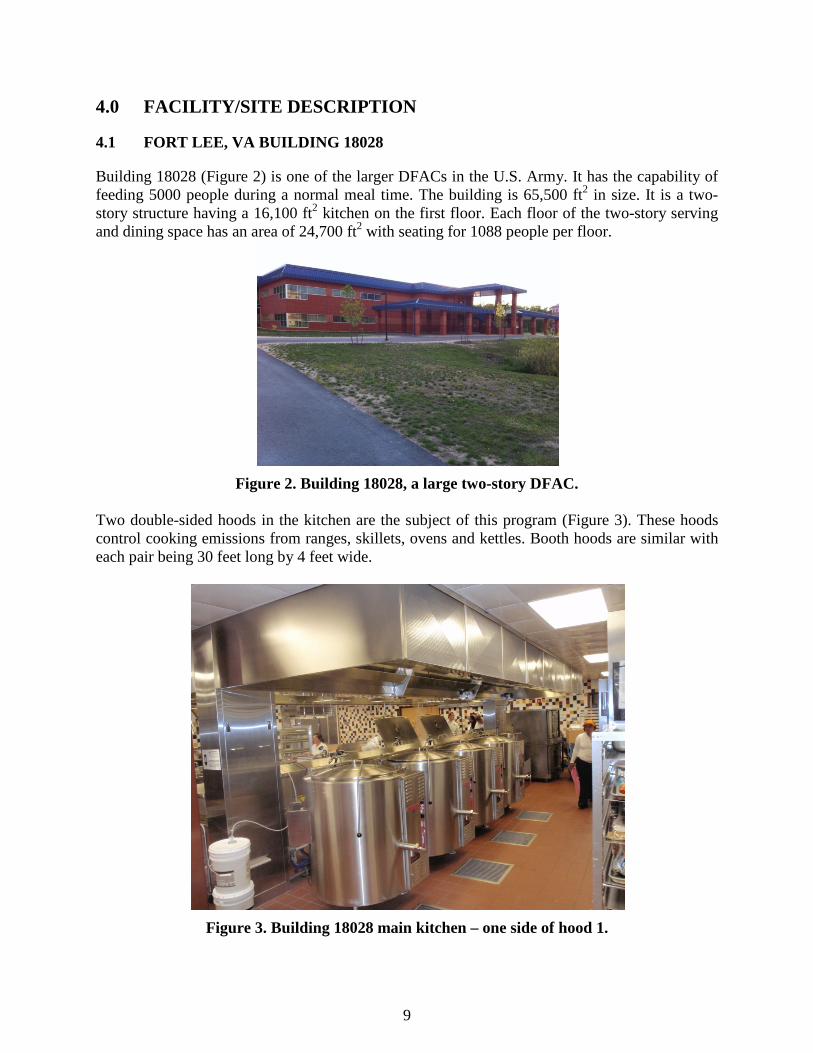
Building 18028 (Figure 2) is one of the larger DFACs in the U.S. Army. It has the capability of feeding 5000 people during a normal meal time. The building is 65,500 ft2 in size. It is a two-story structure having a 16,100 ft2 kitchen on the first floor. Each floor of the two-story serving and dining space has an area of 24,700 ft2 with seating for 1088 people per floor.
Figure 2. Building 18028, a large two-story DFAC.
Two double-sided hoods in the kitchen are the subject of this program (Figure 3). These hoods control cooking emissions from ranges, skillets, ovens and kettles. Booth hoods are similar with each pair being 30 feet long by 4 feet wide.
Figure 3. Building 18028 main kitchen – one side of hood 1.

10
The main kitchen in Building 18028 has two large double island-mounted canopy exhaust hoods. They are served by exhaust fans (EF) EF-1 and EF-2. MAU 1 is interlocked with EF-1, and MAU 2 is interlocked with EF-2. These two EFs and MAUs were selected for the demonstration project. Also, two EFs serve the pot washer area of the main kitchen. Air handling unit (AHU) 5 (AHU-5) provides makeup air for these EFs. Individual EFs in the serveries account for the remainder of the exhaust flow rate (Table 2). The balance of the makeup air is from the AHUs, which provide occupancy ventilation air in the dining, kitchen, and storage areas.
Table 2. Building 18028 kitchen ventilation rates.
System
Total Exhaust
CFM Total OA
CFM
# Exhaust
Fans
# Makeup
Fans Total Building Ventilation 66,460 72,830 Total Kitchen and Servery Ventilation 63,290 47,450 21 14 DCV Retrofit Systems 30,240 24,200 2 2 DCV Retrofit Systems % of Total CFM 48% 51% OA = outside air
4.2 ELLSWORTH AIR FORCE BASE (AFB) BASE EXCHANGE (BX) FOOD COURT
The BX Food Court (Figure 4) has three quick service restaurants (QSR): Burger King, Charley’s, and Anthony’s Pizza.
Figure 4. BX building with food court restaurants.
The Burger King and Charley’s restaurants are adjacent to each other and a doorway connects the cooking areas of both kitchens.

11
The Burger King kitchen is much larger than the cooking area for the grilled sub shop, which is located behind the serving counter. The hood in the Burger King area (Figure 5) is a custom designed Gaylord wall-mounted close-proximity hood having the dimensions of approximately 12 feet long and 4 feet wide. The cooking appliances under the hood include a gas three-vat fryer, an 18-inch gas fryer, and a gas chain broiler. A French fry freezer was located under the hood, and a meat freezer was located in front of the chain broiler, but outside of the hood.
Figure 5. Burger King’s kitchen hood.
The replacement air for the Burger King hood comes from AHU-4, the AHU that provides the general ventilation for Burger King and Charley’s. Replacement air may also be drawn from the general seating area in the Food Court, which is served by AHU-5. The exhaust hood at Charley’s (Figure 6) is a Captive Aire single island-mounted hood with a ceiling-mounted perforated plenum makeup air diffuser that runs the length of the hood. The hoods dimensions are approximately 8 feet long and 4 feet wide. On December 6, 2012, Melink measured an exhaust rate of 3034 CFM while the EF was at full speed. The MAU supply air rate was 2222 CFM. The replacement air for the Charley’s hood comes from the MAU and two four-way diffusers served by AHU-4. Replacement air may also be drawn from the general seating area in the Food Court. The four-way diffusers are close enough to the hood to create a low pressure area at the hood edge. This configuration may result in entrainment and spillage of cooking effluent. A recommended retrofit would be to replace the four-way vaned diffusers with perforated plate diffusers. This reduces the overall exhaust velocity (provided the open area of the plate is large enough) and directs it downward instead of horizontally.
12
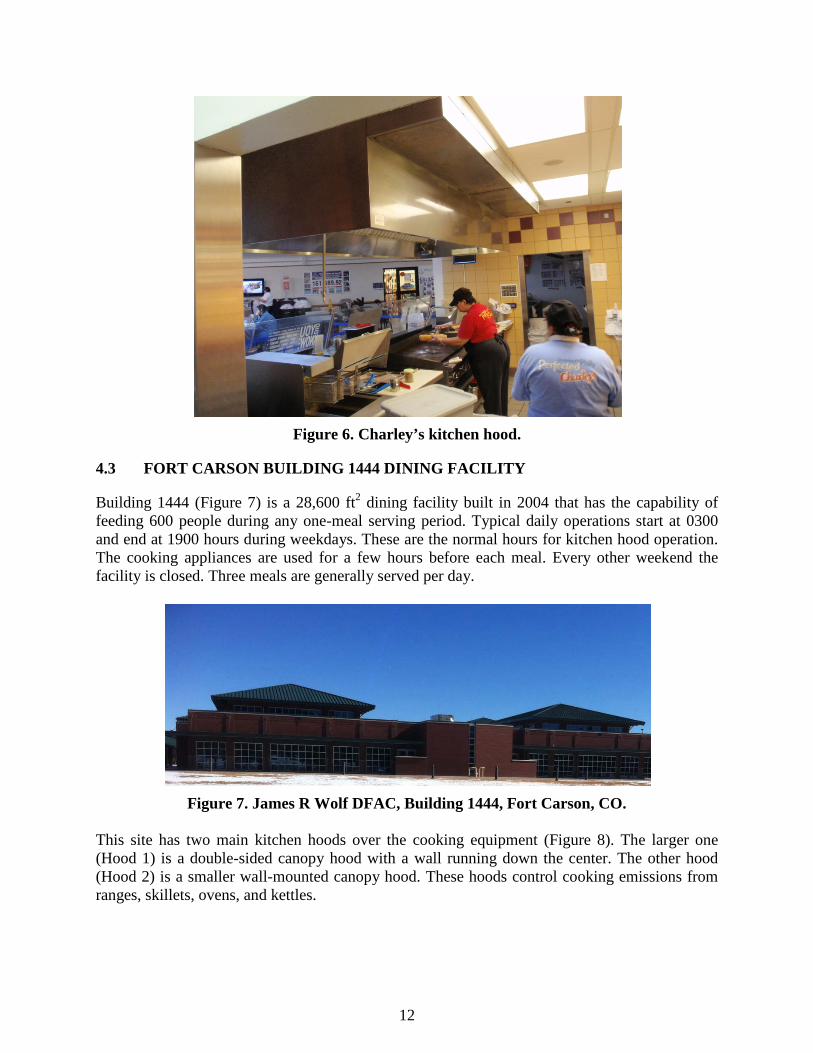
Figure 6. Charley’s kitchen hood.
4.3 FORT CARSON BUILDING 1444 DINING FACILITY
Building 1444 (Figure 7) is a 28,600 ft2 dining facility built in 2004 that has the capability of feeding 600 people during any one-meal serving period. Typical daily operations start at 0300 and end at 1900 hours during weekdays. These are the normal hours for kitchen hood operation. The cooking appliances are used for a few hours before each meal. Every other weekend the facility is closed. Three meals are generally served per day.
Figure 7. James R Wolf DFAC, Building 1444, Fort Carson, CO.
This site has two main kitchen hoods over the cooking equipment (Figure 8). The larger one (Hood 1) is a double-sided canopy hood with a wall running down the center. The other hood (Hood 2) is a smaller wall-mounted canopy hood. These hoods control cooking emissions from ranges, skillets, ovens, and kettles.

13
Figure 8. Building 1444, hood 1 side two.
4.4 U.S. AIR FORCE ACADEMY (USAFA) BUILDING 5218 DINING FACILITY
Building 5218, the DFAC for the Prep School (Figure 9), known as the “High Country Inn,” was built in 1983. The building occupies 31,800 ft2 and has a full service kitchen capable of feeding all 240 students. Typical Building 5218 kitchen serving hours and hours of kitchen operation, i.e., when cooking appliances and exhaust hoods are in use, are from 0330 to 2000 hours.
Figure 9. Building 5218 USAFA prep school dining facility.
14
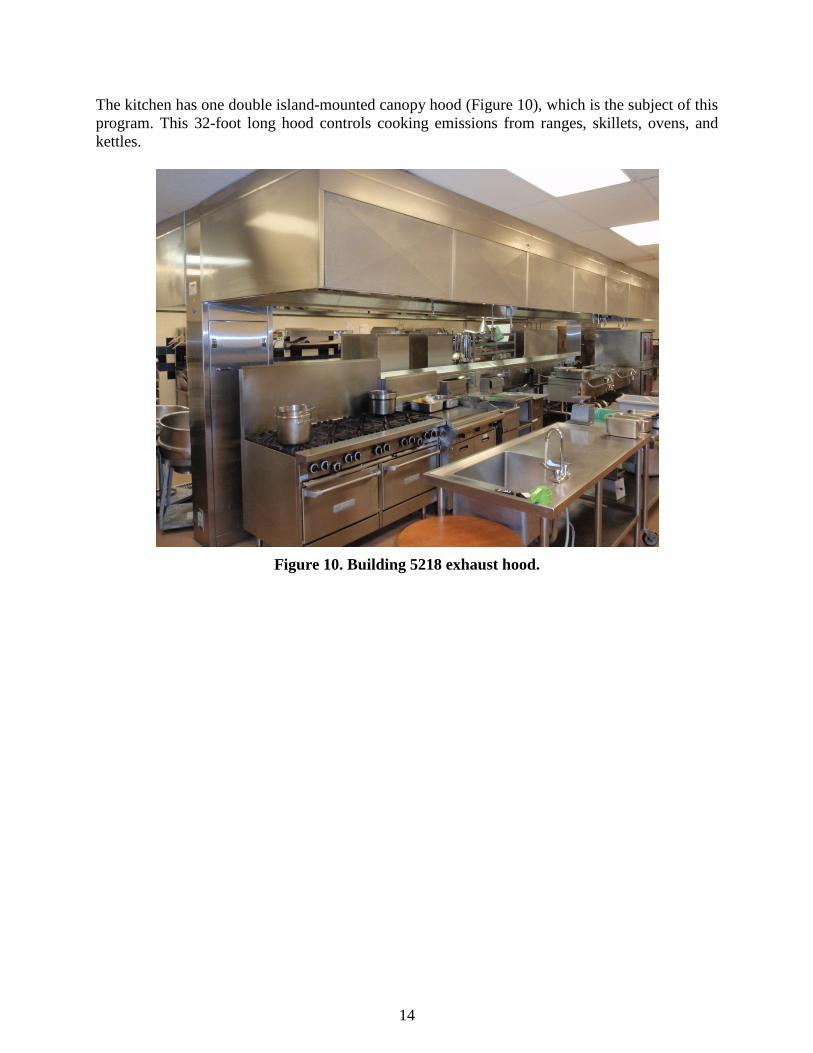
The kitchen has one double island-mounted canopy hood (Figure 10), which is the subject of this program. This 32-foot long hood controls cooking emissions from ranges, skillets, ovens, and kettles.
Figure 10. Building 5218 exhaust hood.
15
5.0 TEST DESIGN
5.1 CONCEPTUAL TEST DESIGN
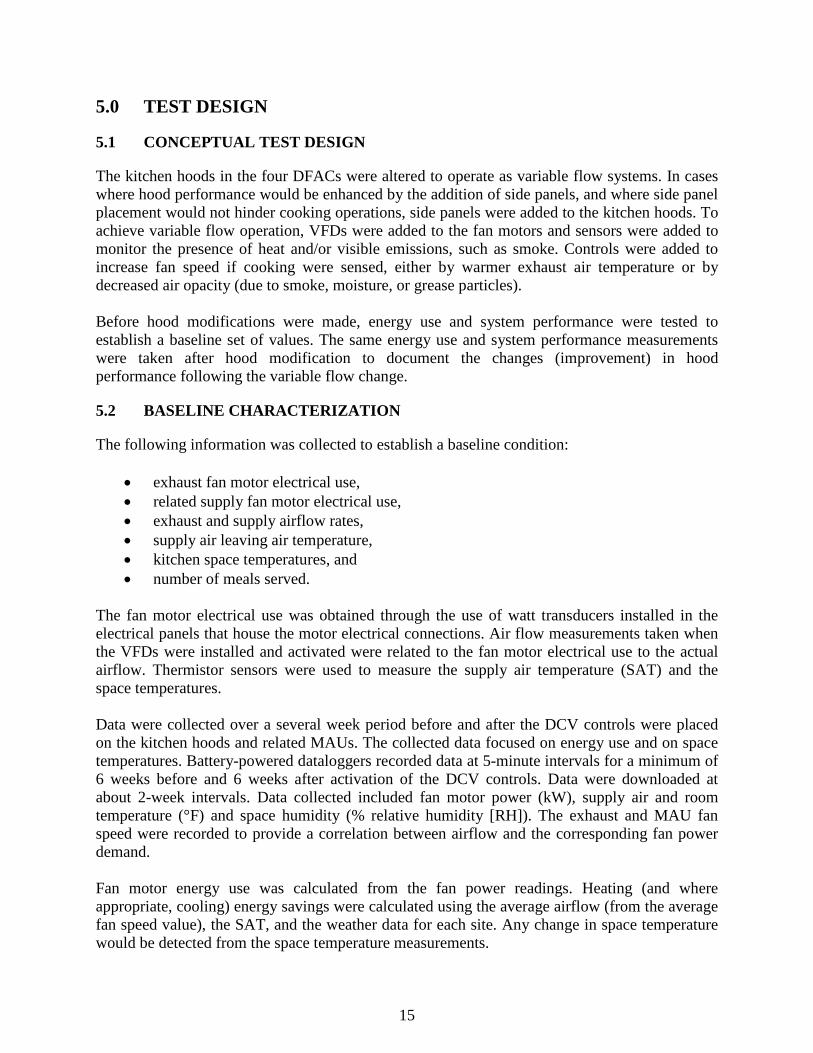
The kitchen hoods in the four DFACs were altered to operate as variable flow systems. In cases where hood performance would be enhanced by the addition of side panels, and where side panel placement would not hinder cooking operations, side panels were added to the kitchen hoods. To achieve variable flow operation, VFDs were added to the fan motors and sensors were added to monitor the presence of heat and/or visible emissions, such as smoke. Controls were added to increase fan speed if cooking were sensed, either by warmer exhaust air temperature or by decreased air opacity (due to smoke, moisture, or grease particles). Before hood modifications were made, energy use and system performance were tested to establish a baseline set of values. The same energy use and system performance measurements were taken after hood modification to document the changes (improvement) in hood performance following the variable flow change.
5.2 BASELINE CHARACTERIZATION
The following information was collected to establish a baseline condition:
• exhaust fan motor electrical use, • related supply fan motor electrical use, • exhaust and supply airflow rates, • supply air leaving air temperature, • kitchen space temperatures, and • number of meals served.
The fan motor electrical use was obtained through the use of watt transducers installed in the electrical panels that house the motor electrical connections. Air flow measurements taken when the VFDs were installed and activated were related to the fan motor electrical use to the actual airflow. Thermistor sensors were used to measure the supply air temperature (SAT) and the space temperatures. Data were collected over a several week period before and after the DCV controls were placed on the kitchen hoods and related MAUs. The collected data focused on energy use and on space temperatures. Battery-powered dataloggers recorded data at 5-minute intervals for a minimum of 6 weeks before and 6 weeks after activation of the DCV controls. Data were downloaded at about 2-week intervals. Data collected included fan motor power (kW), supply air and room temperature (°F) and space humidity (% relative humidity [RH]). The exhaust and MAU fan speed were recorded to provide a correlation between airflow and the corresponding fan power demand. Fan motor energy use was calculated from the fan power readings. Heating (and where appropriate, cooling) energy savings were calculated using the average airflow (from the average fan speed value), the SAT, and the weather data for each site. Any change in space temperature would be detected from the space temperature measurements.
16
5.3 DESIGN AND LAYOUT OF TECHNOLOGY COMPONENTS
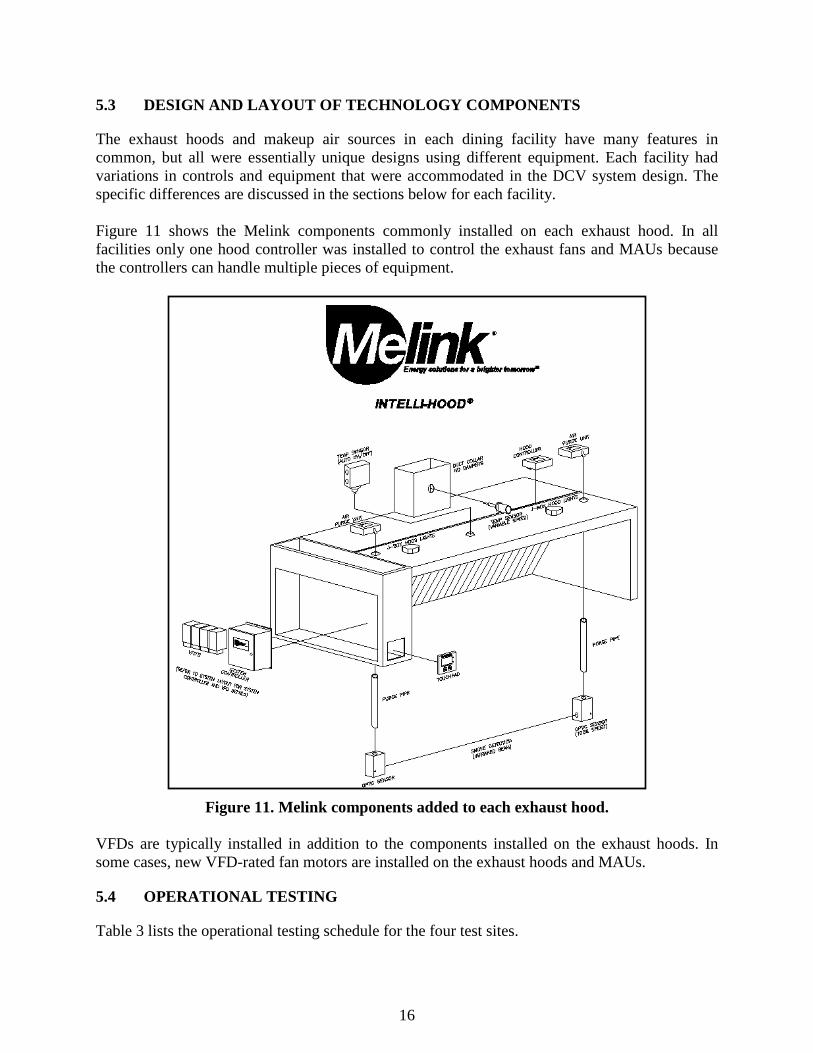
The exhaust hoods and makeup air sources in each dining facility have many features in common, but all were essentially unique designs using different equipment. Each facility had variations in controls and equipment that were accommodated in the DCV system design. The specific differences are discussed in the sections below for each facility. Figure 11 shows the Melink components commonly installed on each exhaust hood. In all facilities only one hood controller was installed to control the exhaust fans and MAUs because the controllers can handle multiple pieces of equipment.
Figure 11. Melink components added to each exhaust hood.
VFDs are typically installed in addition to the components installed on the exhaust hoods. In some cases, new VFD-rated fan motors are installed on the exhaust hoods and MAUs.
5.4 OPERATIONAL TESTING
Table 3 lists the operational testing schedule for the four test sites.
17
Table 3. Operational testing schedule for the four test sites.
USAFA = U.S. Air Force Academy
5.5 SAMPLING PROTOCOL
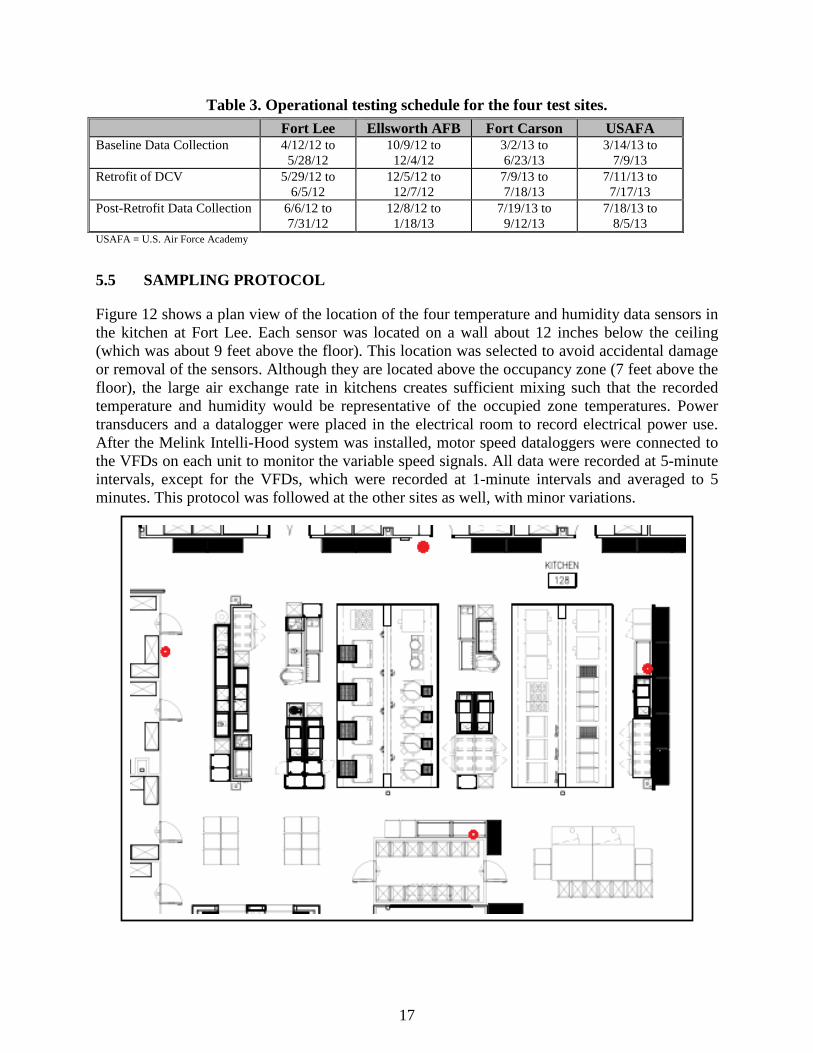
Figure 12 shows a plan view of the location of the four temperature and humidity data sensors in the kitchen at Fort Lee. Each sensor was located on a wall about 12 inches below the ceiling (which was about 9 feet above the floor). This location was selected to avoid accidental damage or removal of the sensors. Although they are located above the occupancy zone (7 feet above the floor), the large air exchange rate in kitchens creates sufficient mixing such that the recorded temperature and humidity would be representative of the occupied zone temperatures. Power transducers and a datalogger were placed in the electrical room to record electrical power use. After the Melink Intelli-Hood system was installed, motor speed dataloggers were connected to the VFDs on each unit to monitor the variable speed signals. All data were recorded at 5-minute intervals, except for the VFDs, which were recorded at 1-minute intervals and averaged to 5 minutes. This protocol was followed at the other sites as well, with minor variations.
Fort Lee Ellsworth AFB Fort Carson USAFA Baseline Data Collection 4/12/12 to
5/28/12 10/9/12 to
12/4/12 3/2/13 to 6/23/13
3/14/13 to 7/9/13
Retrofit of DCV 5/29/12 to 6/5/12
12/5/12 to 12/7/12
7/9/13 to 7/18/13
7/11/13 to 7/17/13
Post-Retrofit Data Collection 6/6/12 to 7/31/12
12/8/12 to 1/18/13
7/19/13 to 9/12/13
7/18/13 to 8/5/13
18
Figure 12. Building 18028, plan view of temperature/relative humidity (T/RH) logger locations (red dots).
5.6 SAMPLING RESULTS
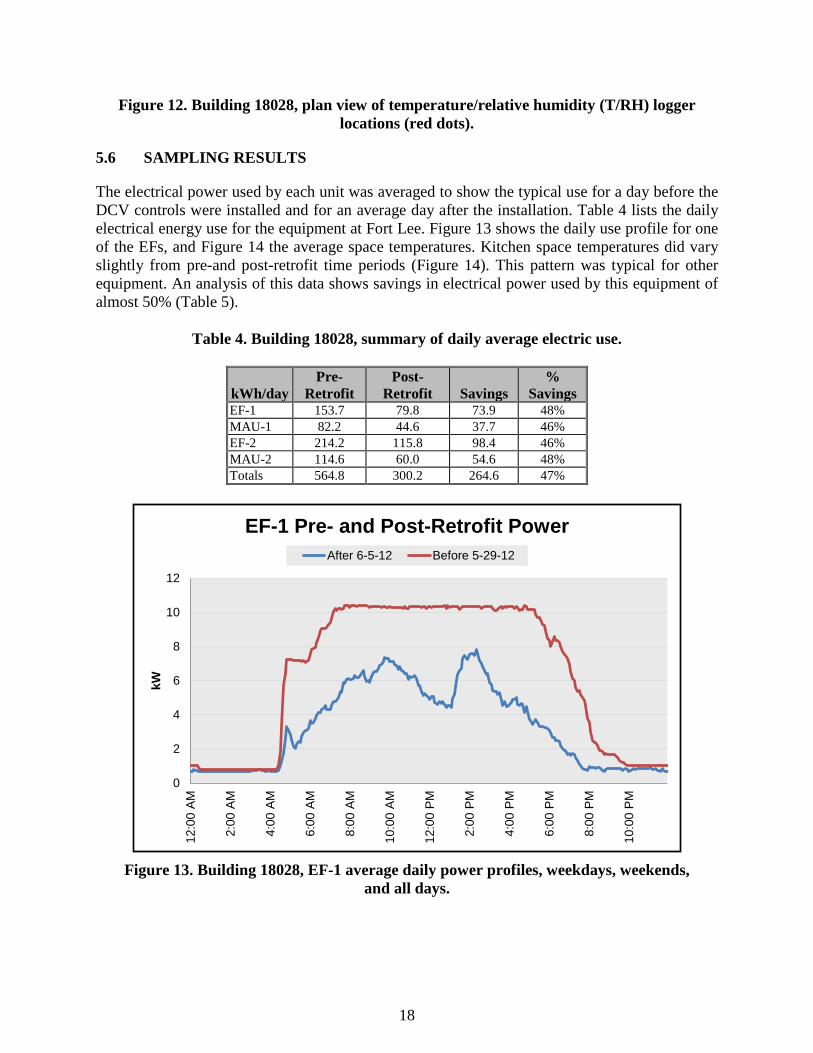
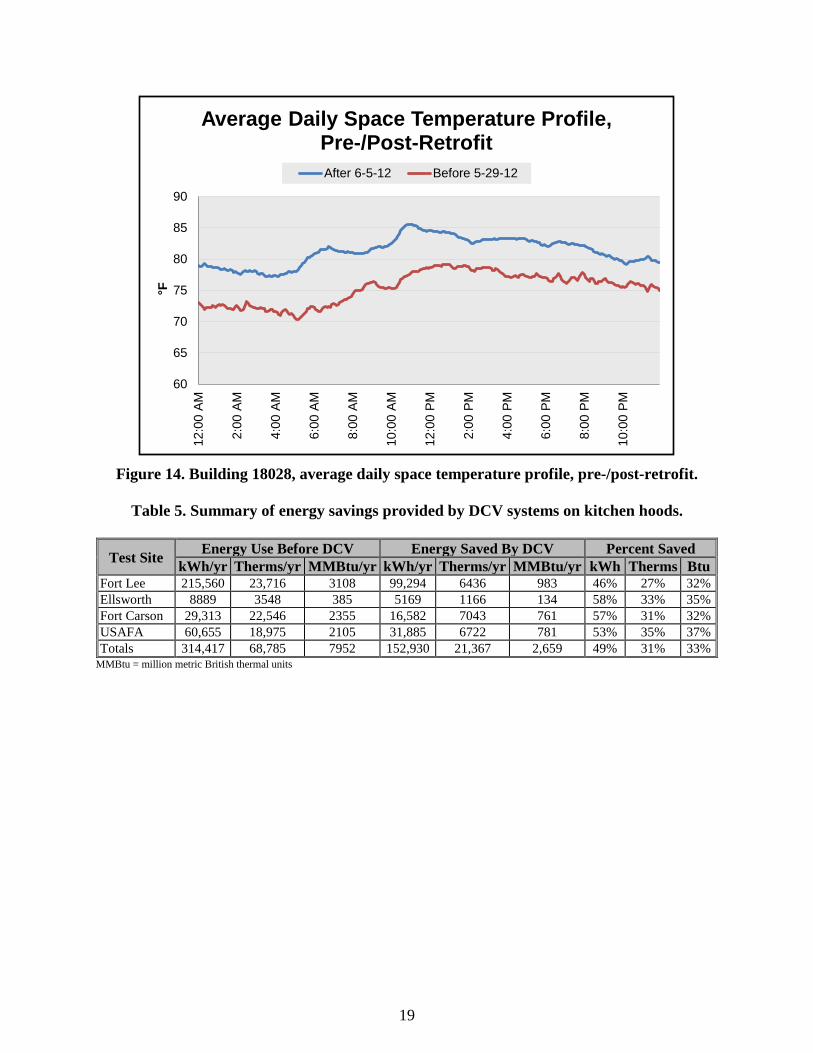
The electrical power used by each unit was averaged to show the typical use for a day before the DCV controls were installed and for an average day after the installation. Table 4 lists the daily electrical energy use for the equipment at Fort Lee. Figure 13 shows the daily use profile for one of the EFs, and Figure 14 the average space temperatures. Kitchen space temperatures did vary slightly from pre-and post-retrofit time periods (Figure 14). This pattern was typical for other equipment. An analysis of this data shows savings in electrical power used by this equipment of almost 50% (Table 5).
Table 4. Building 18028, summary of daily average electric use.
kWh/day Pre-
Retrofit Post-
Retrofit Savings %
Savings EF-1 153.7 79.8 73.9 48% MAU-1 82.2 44.6 37.7 46% EF-2 214.2 115.8 98.4 46% MAU-2 114.6 60.0 54.6 48% Totals 564.8 300.2 264.6 47%
Figure 13. Building 18028, EF-1 average daily power profiles, weekdays, weekends,
and all days.
0
2
4
6
8
10
12
12:0
0 AM
2:00
AM
4:00
AM
6:00
AM
8:00
AM
10:0
0 AM
12:0
0 PM
2:00
PM
4:00
PM
6:00
PM
8:00
PM
10:0
0 PM
kW
EF-1 Pre- and Post-Retrofit PowerAfter 6-5-12 Before 5-29-12
19
Figure 14. Building 18028, average daily space temperature profile, pre-/post-retrofit.
Table 5. Summary of energy savings provided by DCV systems on kitchen hoods.
Test Site Energy Use Before DCV Energy Saved By DCV Percent Saved kWh/yr Therms/yr MMBtu/yr kWh/yr Therms/yr MMBtu/yr kWh Therms Btu
Fort Lee 215,560 23,716 3108 99,294 6436 983 46% 27% 32% Ellsworth 8889 3548 385 5169 1166 134 58% 33% 35% Fort Carson 29,313 22,546 2355 16,582 7043 761 57% 31% 32% USAFA 60,655 18,975 2105 31,885 6722 781 53% 35% 37% Totals 314,417 68,785 7952 152,930 21,367 2,659 49% 31% 33%
MMBtu = million metric British thermal units
60
65
70
75
80
85
9012
:00
AM
2:00
AM
4:00
AM
6:00
AM
8:00
AM
10:0
0 AM
12:0
0 PM
2:00
PM
4:00
PM
6:00
PM
8:00
PM
10:0
0 PM
°F
Average Daily Space Temperature Profile, Pre-/Post-RetrofitAfter 6-5-12 Before 5-29-12

This page left blank intentionally.
21
6.0 SYSTEM PERFORMANCE ASSESSMENT
System performance varied from installation to installation. The detailed results from Fort Lee are presented here as an example and a summary of the results for all four sites. Additionally, the results were extrapolated to estimate typical expected results across all continental U.S. climate zones. The full results are presented in the Final ESTCP Report (Underwood, 2014).
6.1 FORT LEE SYSTEM PERFORMANCE ASSESSMENT
The DCV controls provided electrical and natural gas energy savings. The electrical savings are the result of reduced fan motor energy use and cooling energy savings that lowered the operation of the building’s cooling equipment. The natural gas savings are the result of less outside airflow, which reduced the heating energy for warming this air. A total of 96,600 kWh of electrical energy and 5600 therms of natural gas are estimated to be saved during a year operating period. This represents a total energy cost savings provided by the DCV controls of $11,000 per year.
6.1.1 Fan Motor Electrical Savings
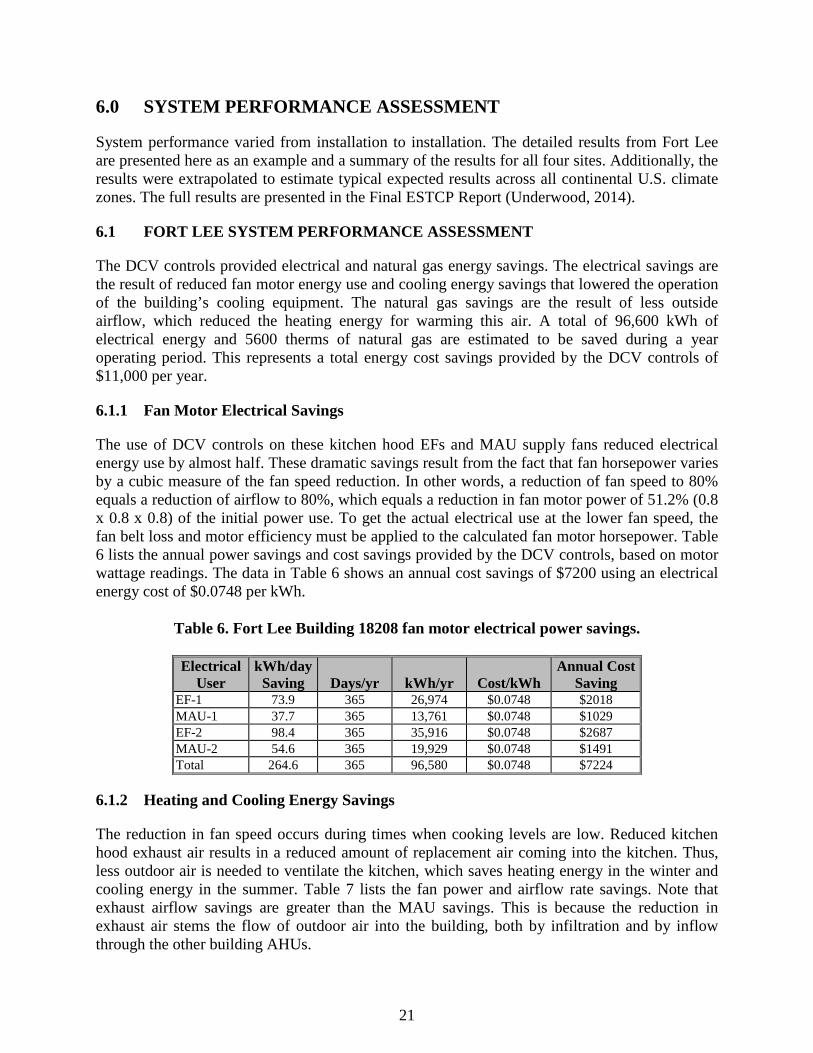
The use of DCV controls on these kitchen hood EFs and MAU supply fans reduced electrical energy use by almost half. These dramatic savings result from the fact that fan horsepower varies by a cubic measure of the fan speed reduction. In other words, a reduction of fan speed to 80% equals a reduction of airflow to 80%, which equals a reduction in fan motor power of 51.2% (0.8 x 0.8 x 0.8) of the initial power use. To get the actual electrical use at the lower fan speed, the fan belt loss and motor efficiency must be applied to the calculated fan motor horsepower. Table 6 lists the annual power savings and cost savings provided by the DCV controls, based on motor wattage readings. The data in Table 6 shows an annual cost savings of $7200 using an electrical energy cost of $0.0748 per kWh.
Table 6. Fort Lee Building 18208 fan motor electrical power savings.
Electrical User
kWh/day Saving Days/yr kWh/yr Cost/kWh
Annual Cost Saving
EF-1 73.9 365 26,974 $0.0748 $2018 MAU-1 37.7 365 13,761 $0.0748 $1029 EF-2 98.4 365 35,916 $0.0748 $2687 MAU-2 54.6 365 19,929 $0.0748 $1491 Total 264.6 365 96,580 $0.0748 $7224
6.1.2 Heating and Cooling Energy Savings
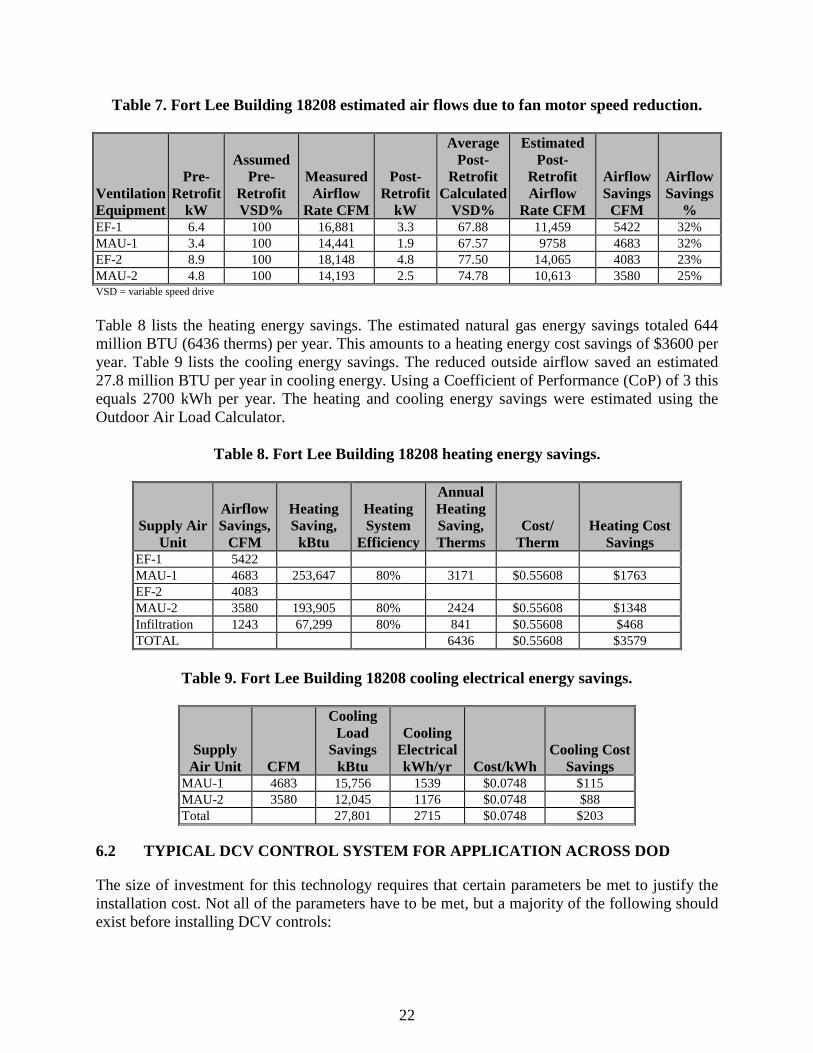
The reduction in fan speed occurs during times when cooking levels are low. Reduced kitchen hood exhaust air results in a reduced amount of replacement air coming into the kitchen. Thus, less outdoor air is needed to ventilate the kitchen, which saves heating energy in the winter and cooling energy in the summer. Table 7 lists the fan power and airflow rate savings. Note that exhaust airflow savings are greater than the MAU savings. This is because the reduction in exhaust air stems the flow of outdoor air into the building, both by infiltration and by inflow through the other building AHUs.
22
Table 7. Fort Lee Building 18208 estimated air flows due to fan motor speed reduction.
Ventilation Equipment
Pre-Retrofit
kW
Assumed Pre-
Retrofit VSD%
Measured Airflow
Rate CFM
Post-Retrofit
kW
Average Post-
Retrofit Calculated
VSD%
Estimated Post-
Retrofit Airflow
Rate CFM
Airflow Savings
CFM
Airflow Savings
% EF-1 6.4 100 16,881 3.3 67.88 11,459 5422 32% MAU-1 3.4 100 14,441 1.9 67.57 9758 4683 32% EF-2 8.9 100 18,148 4.8 77.50 14,065 4083 23% MAU-2 4.8 100 14,193 2.5 74.78 10,613 3580 25% VSD = variable speed drive Table 8 lists the heating energy savings. The estimated natural gas energy savings totaled 644 million BTU (6436 therms) per year. This amounts to a heating energy cost savings of $3600 per year. Table 9 lists the cooling energy savings. The reduced outside airflow saved an estimated 27.8 million BTU per year in cooling energy. Using a Coefficient of Performance (CoP) of 3 this equals 2700 kWh per year. The heating and cooling energy savings were estimated using the Outdoor Air Load Calculator.
Table 8. Fort Lee Building 18208 heating energy savings.
Supply Air Unit
Airflow Savings,
CFM
Heating Saving,
kBtu
Heating System
Efficiency
Annual Heating Saving, Therms
Cost/ Therm
Heating Cost Savings
EF-1 5422 MAU-1 4683 253,647 80% 3171 $0.55608 $1763 EF-2 4083 MAU-2 3580 193,905 80% 2424 $0.55608 $1348 Infiltration 1243 67,299 80% 841 $0.55608 $468 TOTAL 6436 $0.55608 $3579
Table 9. Fort Lee Building 18208 cooling electrical energy savings.
Supply Air Unit CFM
Cooling Load
Savings kBtu
Cooling Electrical kWh/yr Cost/kWh
Cooling Cost Savings
MAU-1 4683 15,756 1539 $0.0748 $115 MAU-2 3580 12,045 1176 $0.0748 $88 Total 27,801 2715 $0.0748 $203
6.2 TYPICAL DCV CONTROL SYSTEM FOR APPLICATION ACROSS DOD
The size of investment for this technology requires that certain parameters be met to justify the installation cost. Not all of the parameters have to be met, but a majority of the following should exist before installing DCV controls:
23
• Relatively large exhaust hood (minimum of 5000 CFM); • Climate requiring significant heating and or cooling of makeup air; • Relatively long operating hours; and • Medium to high utility costs.
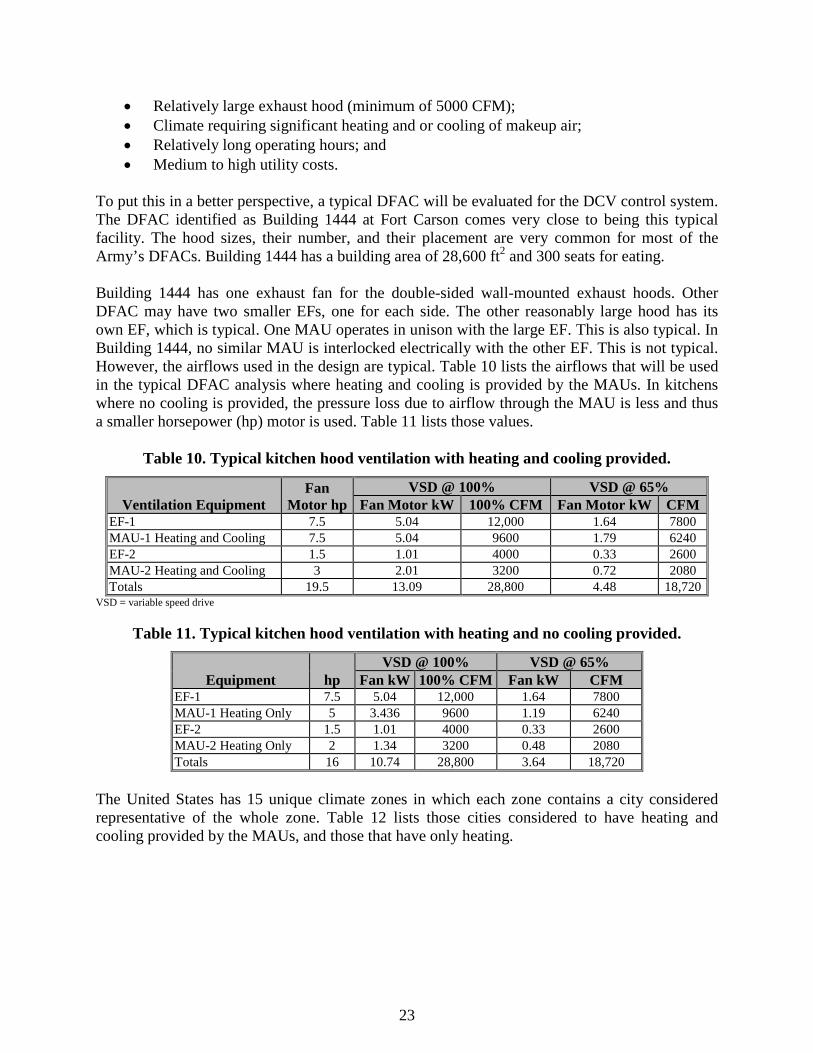
To put this in a better perspective, a typical DFAC will be evaluated for the DCV control system. The DFAC identified as Building 1444 at Fort Carson comes very close to being this typical facility. The hood sizes, their number, and their placement are very common for most of the Army’s DFACs. Building 1444 has a building area of 28,600 ft2 and 300 seats for eating. Building 1444 has one exhaust fan for the double-sided wall-mounted exhaust hoods. Other DFAC may have two smaller EFs, one for each side. The other reasonably large hood has its own EF, which is typical. One MAU operates in unison with the large EF. This is also typical. In Building 1444, no similar MAU is interlocked electrically with the other EF. This is not typical. However, the airflows used in the design are typical. Table 10 lists the airflows that will be used in the typical DFAC analysis where heating and cooling is provided by the MAUs. In kitchens where no cooling is provided, the pressure loss due to airflow through the MAU is less and thus a smaller horsepower (hp) motor is used. Table 11 lists those values.
Table 10. Typical kitchen hood ventilation with heating and cooling provided.
Ventilation Equipment Fan
Motor hp VSD @ 100% VSD @ 65%
Fan Motor kW 100% CFM Fan Motor kW CFM EF-1 7.5 5.04 12,000 1.64 7800 MAU-1 Heating and Cooling 7.5 5.04 9600 1.79 6240 EF-2 1.5 1.01 4000 0.33 2600 MAU-2 Heating and Cooling 3 2.01 3200 0.72 2080 Totals 19.5 13.09 28,800 4.48 18,720
VSD = variable speed drive
Table 11. Typical kitchen hood ventilation with heating and no cooling provided.
Equipment hp VSD @ 100% VSD @ 65%
Fan kW 100% CFM Fan kW CFM EF-1 7.5 5.04 12,000 1.64 7800 MAU-1 Heating Only 5 3.436 9600 1.19 6240 EF-2 1.5 1.01 4000 0.33 2600 MAU-2 Heating Only 2 1.34 3200 0.48 2080 Totals 16 10.74 28,800 3.64 18,720
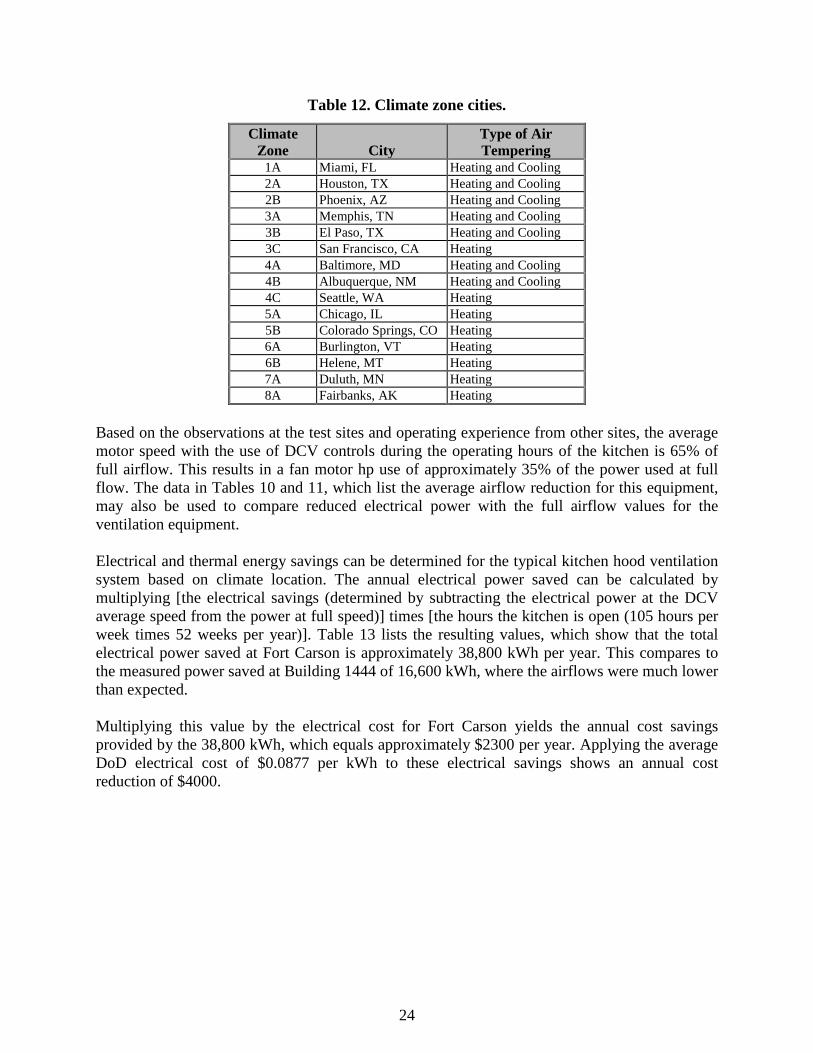
The United States has 15 unique climate zones in which each zone contains a city considered representative of the whole zone. Table 12 lists those cities considered to have heating and cooling provided by the MAUs, and those that have only heating.
24
Table 12. Climate zone cities.
Climate Zone City
Type of Air Tempering
1A Miami, FL Heating and Cooling 2A Houston, TX Heating and Cooling 2B Phoenix, AZ Heating and Cooling 3A Memphis, TN Heating and Cooling 3B El Paso, TX Heating and Cooling 3C San Francisco, CA Heating 4A Baltimore, MD Heating and Cooling 4B Albuquerque, NM Heating and Cooling 4C Seattle, WA Heating 5A Chicago, IL Heating 5B Colorado Springs, CO Heating 6A Burlington, VT Heating 6B Helene, MT Heating 7A Duluth, MN Heating 8A Fairbanks, AK Heating
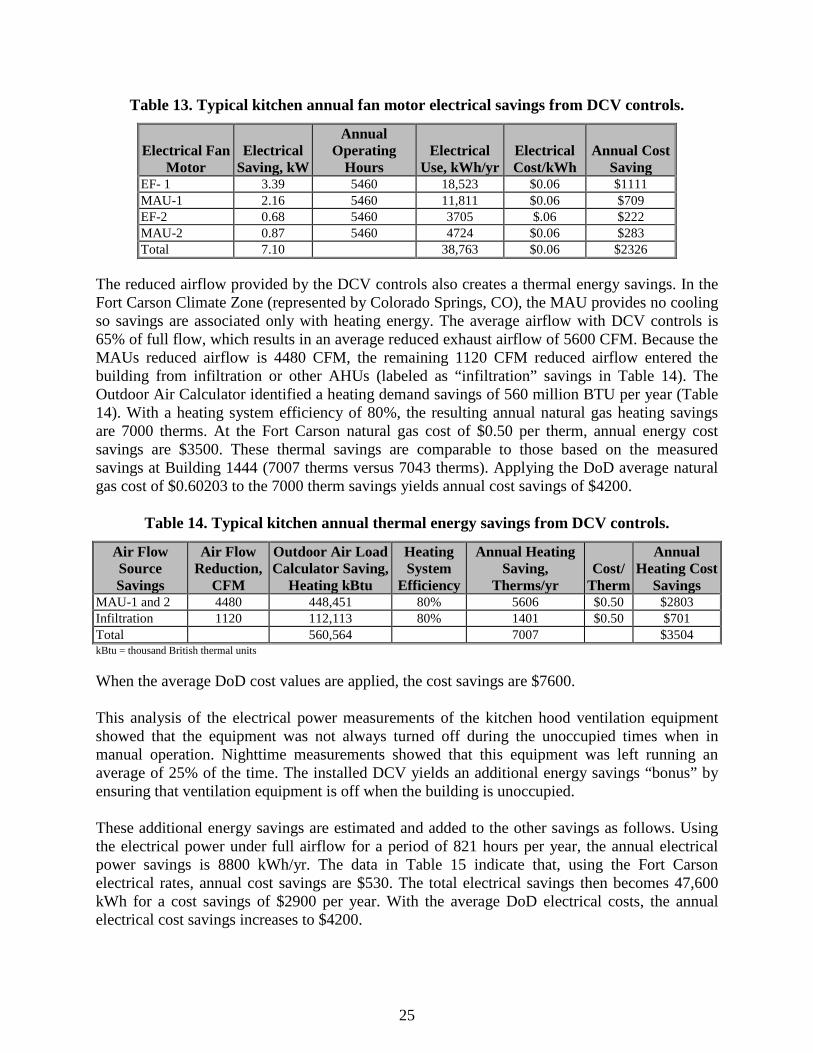
Based on the observations at the test sites and operating experience from other sites, the average motor speed with the use of DCV controls during the operating hours of the kitchen is 65% of full airflow. This results in a fan motor hp use of approximately 35% of the power used at full flow. The data in Tables 10 and 11, which list the average airflow reduction for this equipment, may also be used to compare reduced electrical power with the full airflow values for the ventilation equipment. Electrical and thermal energy savings can be determined for the typical kitchen hood ventilation system based on climate location. The annual electrical power saved can be calculated by multiplying [the electrical savings (determined by subtracting the electrical power at the DCV average speed from the power at full speed)] times [the hours the kitchen is open (105 hours per week times 52 weeks per year)]. Table 13 lists the resulting values, which show that the total electrical power saved at Fort Carson is approximately 38,800 kWh per year. This compares to the measured power saved at Building 1444 of 16,600 kWh, where the airflows were much lower than expected. Multiplying this value by the electrical cost for Fort Carson yields the annual cost savings provided by the 38,800 kWh, which equals approximately $2300 per year. Applying the average DoD electrical cost of $0.0877 per kWh to these electrical savings shows an annual cost reduction of $4000.
25
Table 13. Typical kitchen annual fan motor electrical savings from DCV controls.
Electrical Fan Motor
Electrical Saving, kW
Annual Operating
Hours Electrical
Use, kWh/yr Electrical Cost/kWh
Annual Cost Saving
EF- 1 3.39 5460 18,523 $0.06 $1111 MAU-1 2.16 5460 11,811 $0.06 $709 EF-2 0.68 5460 3705 $.06 $222 MAU-2 0.87 5460 4724 $0.06 $283 Total 7.10 38,763 $0.06 $2326
The reduced airflow provided by the DCV controls also creates a thermal energy savings. In the Fort Carson Climate Zone (represented by Colorado Springs, CO), the MAU provides no cooling so savings are associated only with heating energy. The average airflow with DCV controls is 65% of full flow, which results in an average reduced exhaust airflow of 5600 CFM. Because the MAUs reduced airflow is 4480 CFM, the remaining 1120 CFM reduced airflow entered the building from infiltration or other AHUs (labeled as “infiltration” savings in Table 14). The Outdoor Air Calculator identified a heating demand savings of 560 million BTU per year (Table 14). With a heating system efficiency of 80%, the resulting annual natural gas heating savings are 7000 therms. At the Fort Carson natural gas cost of $0.50 per therm, annual energy cost savings are $3500. These thermal savings are comparable to those based on the measured savings at Building 1444 (7007 therms versus 7043 therms). Applying the DoD average natural gas cost of $0.60203 to the 7000 therm savings yields annual cost savings of $4200.
Table 14. Typical kitchen annual thermal energy savings from DCV controls.
Air Flow Source Savings
Air Flow Reduction,
CFM
Outdoor Air Load Calculator Saving,
Heating kBtu
Heating System
Efficiency
Annual Heating Saving,
Therms/yr Cost/
Therm
Annual Heating Cost
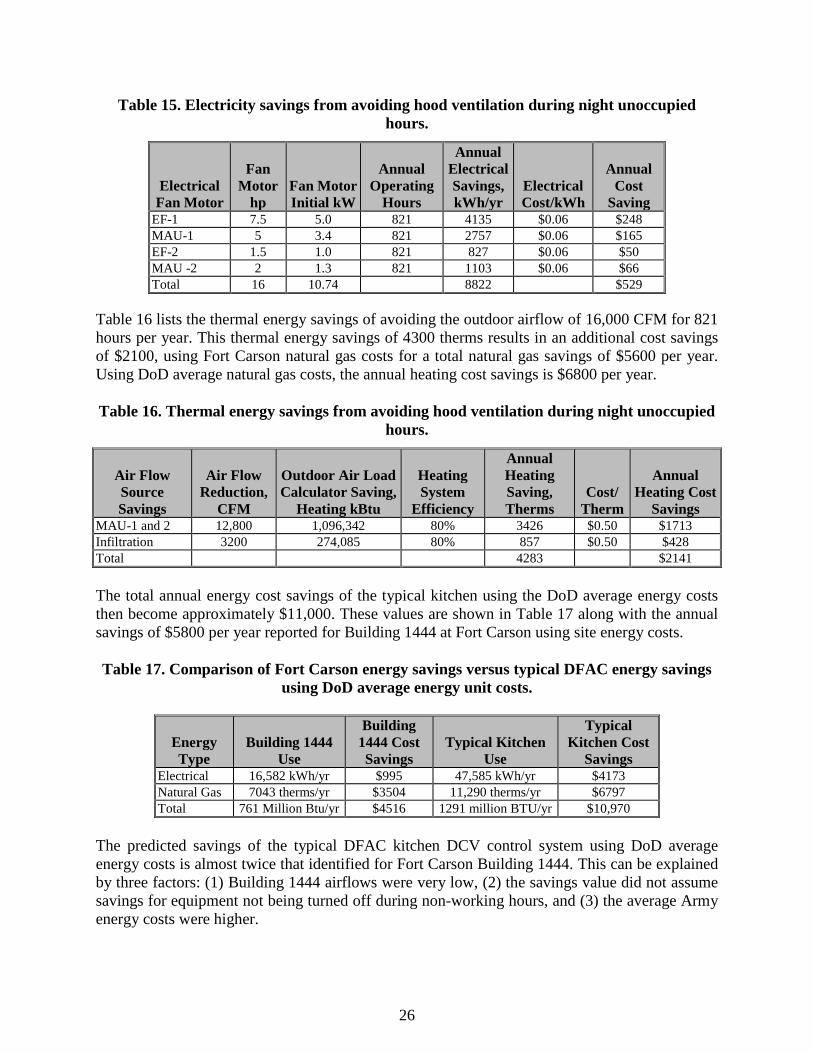
Savings MAU-1 and 2 4480 448,451 80% 5606 $0.50 $2803 Infiltration 1120 112,113 80% 1401 $0.50 $701 Total 560,564 7007 $3504 kBtu = thousand British thermal units When the average DoD cost values are applied, the cost savings are $7600. This analysis of the electrical power measurements of the kitchen hood ventilation equipment showed that the equipment was not always turned off during the unoccupied times when in manual operation. Nighttime measurements showed that this equipment was left running an average of 25% of the time. The installed DCV yields an additional energy savings “bonus” by ensuring that ventilation equipment is off when the building is unoccupied. These additional energy savings are estimated and added to the other savings as follows. Using the electrical power under full airflow for a period of 821 hours per year, the annual electrical power savings is 8800 kWh/yr. The data in Table 15 indicate that, using the Fort Carson electrical rates, annual cost savings are $530. The total electrical savings then becomes 47,600 kWh for a cost savings of $2900 per year. With the average DoD electrical costs, the annual electrical cost savings increases to $4200.
26
Table 15. Electricity savings from avoiding hood ventilation during night unoccupied hours.
Electrical Fan Motor
Fan Motor
hp Fan Motor Initial kW
Annual Operating
Hours
Annual Electrical Savings, kWh/yr
Electrical Cost/kWh
Annual Cost
Saving EF-1 7.5 5.0 821 4135 $0.06 $248 MAU-1 5 3.4 821 2757 $0.06 $165 EF-2 1.5 1.0 821 827 $0.06 $50 MAU -2 2 1.3 821 1103 $0.06 $66 Total 16 10.74 8822 $529
Table 16 lists the thermal energy savings of avoiding the outdoor airflow of 16,000 CFM for 821 hours per year. This thermal energy savings of 4300 therms results in an additional cost savings of $2100, using Fort Carson natural gas costs for a total natural gas savings of $5600 per year. Using DoD average natural gas costs, the annual heating cost savings is $6800 per year. Table 16. Thermal energy savings from avoiding hood ventilation during night unoccupied
hours.
Air Flow Source Savings
Air Flow Reduction,
CFM
Outdoor Air Load Calculator Saving,
Heating kBtu
Heating System
Efficiency
Annual Heating Saving, Therms
Cost/ Therm
Annual Heating Cost
Savings MAU-1 and 2 12,800 1,096,342 80% 3426 $0.50 $1713 Infiltration 3200 274,085 80% 857 $0.50 $428 Total 4283 $2141 The total annual energy cost savings of the typical kitchen using the DoD average energy costs then become approximately $11,000. These values are shown in Table 17 along with the annual savings of $5800 per year reported for Building 1444 at Fort Carson using site energy costs. Table 17. Comparison of Fort Carson energy savings versus typical DFAC energy savings
using DoD average energy unit costs.
Energy Type
Building 1444 Use
Building 1444 Cost Savings
Typical Kitchen Use
Typical Kitchen Cost
Savings Electrical 16,582 kWh/yr $995 47,585 kWh/yr $4173 Natural Gas 7043 therms/yr $3504 11,290 therms/yr $6797 Total 761 Million Btu/yr $4516 1291 million BTU/yr $10,970
The predicted savings of the typical DFAC kitchen DCV control system using DoD average energy costs is almost twice that identified for Fort Carson Building 1444. This can be explained by three factors: (1) Building 1444 airflows were very low, (2) the savings value did not assume savings for equipment not being turned off during non-working hours, and (3) the average Army energy costs were higher.
27
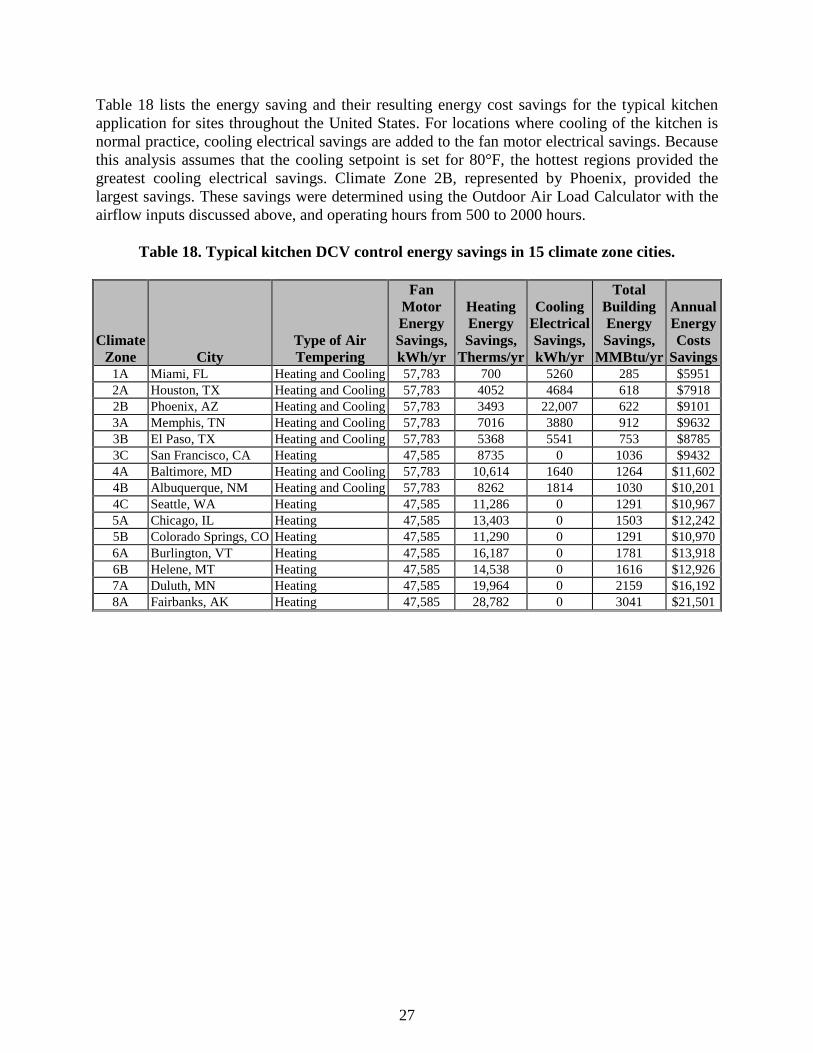
Table 18 lists the energy saving and their resulting energy cost savings for the typical kitchen application for sites throughout the United States. For locations where cooling of the kitchen is normal practice, cooling electrical savings are added to the fan motor electrical savings. Because this analysis assumes that the cooling setpoint is set for 80°F, the hottest regions provided the greatest cooling electrical savings. Climate Zone 2B, represented by Phoenix, provided the largest savings. These savings were determined using the Outdoor Air Load Calculator with the airflow inputs discussed above, and operating hours from 500 to 2000 hours.
Table 18. Typical kitchen DCV control energy savings in 15 climate zone cities.
Climate Zone City
Type of Air Tempering
Fan Motor Energy Savings, kWh/yr
Heating Energy Savings,
Therms/yr
Cooling Electrical Savings, kWh/yr
Total Building Energy Savings,
MMBtu/yr
Annual Energy Costs
Savings 1A Miami, FL Heating and Cooling 57,783 700 5260 285 $5951 2A Houston, TX Heating and Cooling 57,783 4052 4684 618 $7918 2B Phoenix, AZ Heating and Cooling 57,783 3493 22,007 622 $9101 3A Memphis, TN Heating and Cooling 57,783 7016 3880 912 $9632 3B El Paso, TX Heating and Cooling 57,783 5368 5541 753 $8785 3C San Francisco, CA Heating 47,585 8735 0 1036 $9432 4A Baltimore, MD Heating and Cooling 57,783 10,614 1640 1264 $11,602 4B Albuquerque, NM Heating and Cooling 57,783 8262 1814 1030 $10,201 4C Seattle, WA Heating 47,585 11,286 0 1291 $10,967 5A Chicago, IL Heating 47,585 13,403 0 1503 $12,242 5B Colorado Springs, CO Heating 47,585 11,290 0 1291 $10,970 6A Burlington, VT Heating 47,585 16,187 0 1781 $13,918 6B Helene, MT Heating 47,585 14,538 0 1616 $12,926 7A Duluth, MN Heating 47,585 19,964 0 2159 $16,192 8A Fairbanks, AK Heating 47,585 28,782 0 3041 $21,501

This page left blank intentionally.

29
7.0 COST ASSESSMENT
7.1 COST MODEL
7.1.1 Installation Cost Considerations
A number of factors can affect the overall cost of the Intelli-Hood system, making it difficult to make accurate cost assumptions. Among the most significant cost factors are electrical labor, in which both VFD requirements, and project and equipment location are driving factors. Table 19 lists a number of the key variables that can increase system cost. Additionally, to provide an accurate proposal, a site survey should be completed by a qualified exhaust hood controls representative and a licensed electrician, in which kitchen/site layout, hood information, and exhaust and supply fan data is collected.
Table 19. Site factors that influence installed DCV control system cost. Electrical labor cost:
• Electrical cost, which can vary significantly from city to city • Prevailing wage requirements (also increases Melink Technician labor cost)
VFD requirements: • Bypass • National Electrical Manufacturers Association (NEMA) 3R enclosures
Motor replacement: • All motors must be 3-phase, inverter duty rated as specified in NEMA standard MG 1, Part 31
Access: • Limited access on top of hood due to low ceiling, hard ceiling, ductwork, piping, etc. • Limited working hours to install; to avoid interference with kitchen operations
Equipment Locations: • Distance from VFD to fan • Increased conduit with long runs • Output wiring from VFD to fan must be in separate conduit • Output electrical filters must be used when distance from VFD to fan is over 200 ft for 230V, 70 ft for 460V, or
40 ft for 575V • Equipment mounted outdoors must be in a NEMA 3R enclosure
Equipment Integration: • Fireman’s override panel • Building Management Systems • Water wash Panels • MAU controls for heating/cooling
Table 20 lists the cost for the DCV controls for the kitchen hoods reviewed in this study. These costs do not include the Corps of Engineers mark-up (supervision, inspection, and overhead [SIOH]), which is 5.7% of the contractor cost. The SIOH covers the costs of over-seeing the construction work. Table 20 also lists the site factors that had an influence on the installed cost.

30
Table 20. Project study site installation costs.
Location Fort Lee Ellsworth AFB Fort Carson USAFA Number of Hoods 4 2 3 2 Material $14,128.60 (31%) $14,672.60 (51%) $21,831.77 (45%) $16,391.37 (42%) Labor $31,670.00 (69%) $13,950.00 (49%) $27,165.00 (55%) $22,550.00 (58%) Total $45,798.60 $28,622.60 $48,996.77 $38,941.37 Optical quantity 4 2 3 2 $/Optical $13,949.65 $14,311.30 $16,332.26 $19,470.69 Cost variables *Used existing VFDs *Low electrical labor
cost *NEMA 3R VFDs *NEMA 3R VFDs
*Installed hood side panels
Because these are actual costs for this project, they included some additional costs for coordination, additional measurements, and effort in preparing this report. Thus, they may not represent the true cost for a future DCV control project at a DoD installation. Table 21 lists the cost information that would be more representative for such a project. For example, the typical Army kitchen DCV control system, which is similar to the system in Fort Carson Building 1444, would have a cost of $41,150 plus the SIOH cost of $2350 for a total cost of $44,500, compared to cost of $49,000 charged for this project. Table 22 lists the estimated Typical DCV Control system installed cost.
Table 21. DCV control system costing information.
Material Cost Intelli-Hood Sensors/Cables Hood Qty: 1 2 3 4 5 6 7 8 9 10 $ $4500 $8200 $11,900 $15,600 $19,300 $23,000 $26,700 $30,400 $34,100 $37,800 Hood Components Include: IOP, Optic sensors, temperature sensors, keypad, cables **Prices will vary some due to number of temperature sensors and Cable lengths** VFD Cost (Assumes ABB, Inc. Bypass) VFD hp 1 2 3 5 7.5 10 15 20 25 30 40 50 230V $ $825 $1000 $1050 $1150 $1200 $1350 $1650 $2000 $2500 $3550 $4200 $4900 460V $ $825 $900 $1000 $1050 $1100 $1200 $1400 $1700 $2000 $2300 $2750 $3350 VFD Cost (Assumes NEMA 3R ABB Bypass) VFD hp 1 2 3 5 7.5 10 15 20 25 30 40 50 230V $ $2475 $3000 $3150 $3450 $3600 $4050 $4950 $6000 $7500 $10,650 $12,600 $14,700 460V $ $2475 $2700 $3000 $3150 $3300 $3600 $4200 $5100 $6000 $6900 $8250 $10,050 ** NEMA 3R drives are an adder as they Motor Cost Motor hp 1 2 3 5 7.5 10 15 $ $575 $650 $700 $725 $1050 $1275 $1800 **Add an additional $750 labor per motor replacement **Pricing not available for motors over 15hp Labor Cost Melink Labor Cost Hood Qty: 1 2 3 4 5 6 7 8 9 10 Installation $5000 $6500 $8000 $9500 $11,000 $12,500 $14,000 $15,500 $17,000 $18,500 Start-up $2000 $2750 $3500 $4250 $5000 $5750 $6500 $7250 $8000 $8750 Electrical Labor Hood Qty: 1 2 3 4 5 6 7 8 9 10 Hours/Hood 40 56 68 80 92 104 116 128 140 152 $ $6000 $8400 $10,200 $12,000 $13,800 $15,600 $17,400 $19,200 $21,000 $22,800 **Note: The cost assumptions do not take into account any specialized materials, access restrictions, prevailing wage rates, unusually long cable runs, or any other significant challenges that will increase cost. IOP = input/output processor

31
Table 22. Typical DCV control system cost.
Cost Item Motor
hp No.
Hoods No.
Motors Cost Cost
/Motor Total Cost
Hood Controls 3 $11,900 $11,900
VFD 7.5 hp 2 $1100 $2200 3 hp 1 $1000 $1000
1.5 hp 1 $900 $900
Motor 7.5 hp 2 $1050 $2100 3 hp 1 $700 $700
1.5 hp 1 $650 $650 Control Install 3 $8000 $8000 Start-up 3 $3500 $3500 Electric Install 3 $10,200 $10,200 Total DCV Cost $41,150
7.2 VFD AND FAN MOTOR INSTALLATION ISSUES
In addition to the issue of the fan motor being compatible with a VFD, the distance from the fan motor to VFD is also a concern. A distance greater than 100 feet can cause problems with the operation of the motor. In some cases, the VFD would need to be mounted outdoors, which would increase the expense of the electrical enclosure. In other cases, a line reactor is used. Line reactors must also be used when VFD to motor distance exceeds manufacturer recommendations. Line reactors are also used on the input side of the VFD when there are known “dirty power issues,” such as surges or spikes and harmonic distortion.
7.3 SUPPLY AIR SYSTEM ISSUES
The controls of the supply air system must be able to track the airflow of the exhaust air fan to maintain the air balance in the kitchen. Generally, the exhaust air fan motor is interlocked with a MAU fan motor. Then, the signal to the exhaust system VFD can also be sent to the MAU’s VFD. Thus, both systems increase and decrease fan speed (and airflow) at the same time. Varying the airflow through a heating system in the MAU can cause problems. If the MAU heating equipment is a direct-fired gas burner (like some of those found at Ellsworth), then a constant airflow is required through the burner plates for proper combustion. If the airflow is too low, incomplete combustion will likely create a flow of carbon monoxide (CO) in the supply air, which would be hazardous to building occupants. In some MAUs, a sail switch is used to detect low airflow and prevent the burner from firing. This condition may cause comfort complaints.
7.4 ECONOMIC COST ANALYSIS AND COMPARISON BETWEEN SITES
7.4.1 Economic Cost Analysis of Site Installations
The economic analysis of the DCV control system indicates that it is economical to install this system on the main exhaust airflow hoods found in DFACS. It appears that it is not cost effective to use the DCV system on smaller hoods as found in food service facilities found in food courts. This is due to the smaller airflow, a more constant level of cooking when the restaurant is open,
32
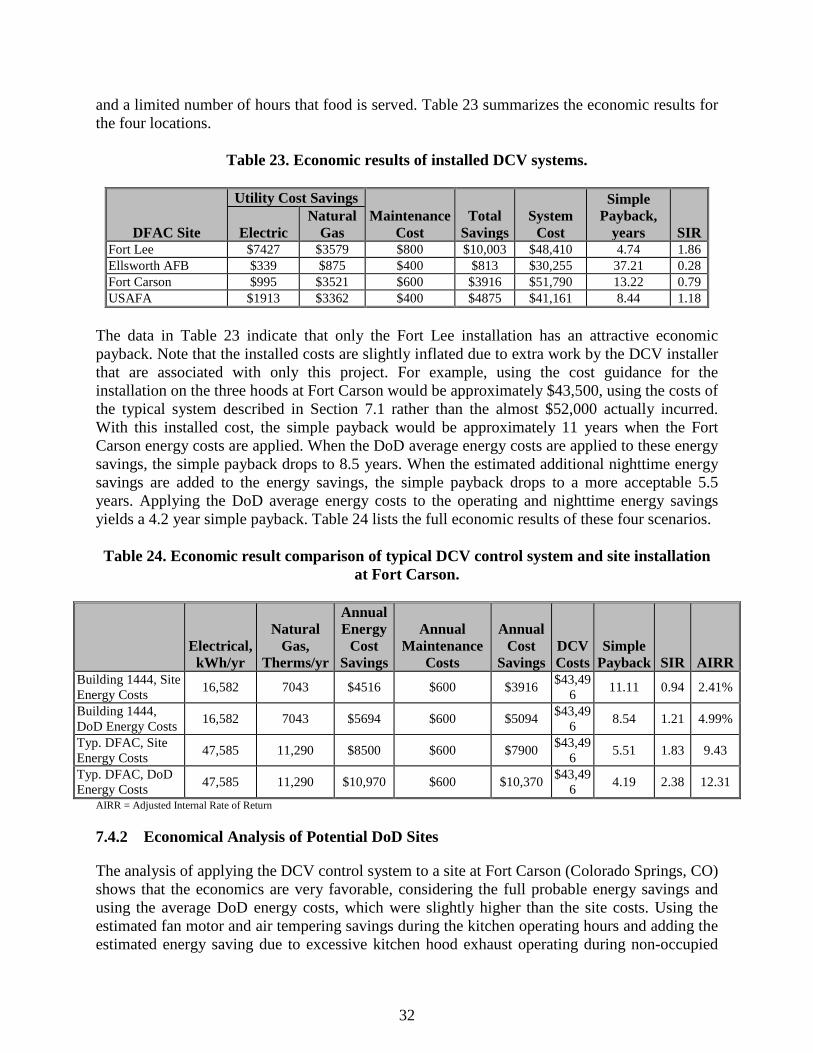
and a limited number of hours that food is served. Table 23 summarizes the economic results for the four locations.
Table 23. Economic results of installed DCV systems.
DFAC Site
Utility Cost Savings Maintenance
Cost Total
Savings System
Cost
Simple Payback,
years SIR Electric Natural
Gas Fort Lee $7427 $3579 $800 $10,003 $48,410 4.74 1.86 Ellsworth AFB $339 $875 $400 $813 $30,255 37.21 0.28 Fort Carson $995 $3521 $600 $3916 $51,790 13.22 0.79 USAFA $1913 $3362 $400 $4875 $41,161 8.44 1.18
The data in Table 23 indicate that only the Fort Lee installation has an attractive economic payback. Note that the installed costs are slightly inflated due to extra work by the DCV installer that are associated with only this project. For example, using the cost guidance for the installation on the three hoods at Fort Carson would be approximately $43,500, using the costs of the typical system described in Section 7.1 rather than the almost $52,000 actually incurred. With this installed cost, the simple payback would be approximately 11 years when the Fort Carson energy costs are applied. When the DoD average energy costs are applied to these energy savings, the simple payback drops to 8.5 years. When the estimated additional nighttime energy savings are added to the energy savings, the simple payback drops to a more acceptable 5.5 years. Applying the DoD average energy costs to the operating and nighttime energy savings yields a 4.2 year simple payback. Table 24 lists the full economic results of these four scenarios. Table 24. Economic result comparison of typical DCV control system and site installation
at Fort Carson.
Electrical, kWh/yr
Natural Gas,
Therms/yr
Annual Energy
Cost Savings
Annual Maintenance
Costs
Annual Cost
Savings DCV Costs
Simple Payback SIR AIRR
Building 1444, Site Energy Costs 16,582 7043 $4516 $600 $3916 $43,49
6 11.11 0.94 2.41%
Building 1444, DoD Energy Costs 16,582 7043 $5694 $600 $5094 $43,49
6 8.54 1.21 4.99%
Typ. DFAC, Site Energy Costs 47,585 11,290 $8500 $600 $7900 $43,49
6 5.51 1.83 9.43
Typ. DFAC, DoD Energy Costs 47,585 11,290 $10,970 $600 $10,370 $43,49
6 4.19 2.38 12.31
AIRR = Adjusted Internal Rate of Return
7.4.2 Economical Analysis of Potential DoD Sites
The analysis of applying the DCV control system to a site at Fort Carson (Colorado Springs, CO) shows that the economics are very favorable, considering the full probable energy savings and using the average DoD energy costs, which were slightly higher than the site costs. Using the estimated fan motor and air tempering savings during the kitchen operating hours and adding the estimated energy saving due to excessive kitchen hood exhaust operating during non-occupied

33
hours, allows an economic evaluation of potential DoD sites throughout the United States to be made. For this analysis, the 15 cities were entered into the Outdoor Airload Calculator using the airflow savings provided by the typical system to obtain the air tempering savings. Fan motor energy savings were calculated using the average electrical power savings. The additional nighttime energy savings were estimated in a similar manner. Table 25 lists the results. Colder climates tend to have greater savings than warm climates.
Table 25. DCV control system economics when applied to United States climate regions.
Climate Zone City
Annual Energy Costs
Savings
Annual Maintenance
Costs
DCV System
Cost
Simple Payback
Period, yrs SIR AIRR 1A Miami, FL $5951 $600 $43,496 8.13 1.08 3.75% 2A Houston, TX $7918 $600 $43,496 5.94 1.56 7.69% 2B Phoenix, AZ $9101 $600 $43,496 5.12 1.78 9.10% 3A Memphis, TN $9632 $600 $43,496 4.82 1.99 10.32% 3B El Paso, TX $8785 $600 $43,496 5.31 1.77 9.06% 3C San Francisco, CA $9432 $600 $43,496 4.92 2.00 10.38% 4A Baltimore, MD $11,601 $600 $43,496 3.95 2.48 12.80% 4B Albuquerque, NM $10,201 $600 $43,496 4.53 2.13 11.12% 4C Seattle, WA $10,967 $600 $43,496 4.20 2.37 12.31% 5A Chicago, IL $12,242 $600 $43,496 3.74 2.69 13.71% 5B Colorado Springs, CO $10,970 $600 $43,496 4.19 2.36 12.25% 6A Burlington, VT $13,918 $600 $43,496 3.27 3.10 15.34% 6B Helene, MT $12,926 $600 $43,496 3.53 2.86 14.40% 7A Duluth, MN $16,192 $600 $43,496 2.79 3.66 17.27% 8A Fairbanks, AK $21,501 $600 $43,496 2.08 4.96 20.91%
The number of Army facilities that could be economically retrofit was estimated based on the analysis of energy savings for a typical Army kitchen DCV control system, and on the following assumptions and data:
• Facility must be greater than 10,000 ft2 (for it to be likely to have a large exhaust hood); and
• 40% of facilities greater than 10,000 ft2 are not appropriate for this retrofit for other reasons.
The Army has 378 eating facilities that meet this requirement. Of these:
• The average facility uses 400,000 BTU/ft2/yr; • Average energy cost is $15/million BTU (electric and gas combined); • Savings are 60% electric and 40% gas; and • Exhaust and makeup air comprises 25% of the facility energy use.

34
The above analysis is for a typical DFAC at a DoD site. The analysis of the four sites where measurements were taken showed that kitchen hoods with a low airflow would not be cost effective to have a DCV system installed. To quantify the level of airflow that is “too low,” a kitchen hood exhausting 5000 CFM was analyzed. This airflow is chosen because it matches the airflow identified in ASHRAE Standard 90.1-2010, where conservation measures must be provided on kitchen hood exhaust equipment (see Section 8.3). It is assumed that there is a 4000 CFM MAU that operates when the EF is running. The motor hp for this equipment is 2 hp for the EF and 3 hp for the MAU. Using the operating conditions used in the typical DFAC analysis for the Colorado Springs location, the annual energy savings are:
• Electrical 12,131 kWh/yr; • Natural gas 3520 therms/yr; and • Energy cost savings $3188/yr.
The estimated cost including SIOH for a DCV system on this equipment, for a simple payback of 7.34 years and a SIR equal to 1.37, is $21,933. An annual cleaning cost of $200 is factored into the annual cost savings that is used to determine the payback period. If two kitchen hoods were exhausting 5000 CFM each, with associated MAUs each at 4000 CFM, the estimated installed cost for a DCV system, including SIOH, for both should be $34,194. The energy savings would be double the amounts for the single 5000 system and thus the simple payback period would be 5.7 years and the SIR equal to 1.76. Based on these calculations, if the kitchen has a single kitchen hood with an exhaust airflow greater than 5000 CFM, the application of DCV should be investigated. The cost savings could vary given the climate MAU setpoints, motor hp, hours of operation, and cost of energy. The cost to install could become lower if the installation of the DCV system is part of new construction or a major renovation of the kitchen. Such a situation would probably lower the labor for installing the equipment, because there would already an electrician installing electrical wiring and the installation of the sensors could be accomplished without working around other kitchen operations.

35
8.0 IMPLEMENTATION ISSUES
8.1 INSTALLATION CONSIDERATIONS
By far the most difficult part of implementation was the existing operational condition of the building’s HVAC. Several of the systems initially identified as good candidates for demonstration were found to have operational issues that would have made implementation difficult. It is recommended to ensure that:
• Electrical installation was properly performed; • Proper labeling took place; • Temperature and optical sensors were correctly placed; • Start-up operation was successfully completed; and • Site personnel were trained.
8.1.1 Sensors
The placement of the cooking sensors is very important to ensure a successful operating system. Installation of the sensors typically requires access to the top of the hood. The temperature sensors are installed in the exhaust duct collar near the top of the hood. Optical sensors are installed on the sides of the hood with the air purge unit (APU) on top of the hood. All cables connecting the sensors are typically installed above the hood. Access to above the hood is important for the installation of sensors. At some sites, multiple exhaust fans draw air from a single hood. The fan that ventilates a given hood section must be identified so sensor locations can be planned.
8.1.2 Fan Motor Issues
When retrofitting a constant speed motor with a VFD, the motor must be compatible with the VFD. If the motor was not designed for use with a VFD, it should be replaced. Users typically prefer to use bypass VFDs. Bypass drives give the end user the ability to easily override the controls if necessary. Bypass drives give the maintenance personnel the ability to operate fans via a simple start/stop function should any problem arise. The downside to bypass drives is that they are large.
8.1.3 Supply Air System Issues
In some cases, a dedicated MAU services the cooking area. In other cases, an MAU services both the cooking and dining areas. For this technology, a dedicated MAU for the cooking area is preferred. Another consideration is the method of heating. If outdoor air is heated using a direct-fired gas burner, the outside air that flows over the burner cannot be modulated. A constant airflow is needed to assure proper combustion to avoid creating harmful CO. In such systems, exhaust air should not be varied, especially during the heating season. Because part of the energy savings is achieved by reducing the use of the supply air unit, systems having a direct-fired gas system can only achieve limited energy savings. On the other hand, MAU units with indirect

36
gas-fired burners, hot water, steam, or electric heating can modulate outside airflow and are better able to achieve the predicted energy savings.
8.1.4 Elements Requiring Maintenance
The required maintenance needs mainly relate to keeping the sensors functioning. Because cooking fumes and smoke can collect on the optical, sensors may need to be cleaned whenever the “Clean” indicator light on the system keypad begins to flash from red to green. To clean, wipe the units’ lenses at each end of the hood with a clean soft cloth. Do not use water or steam on the housing, which can wet the electrical components. Temperature sensors should be cleaned at least once per year using a clean cloth.
8.2 CODES AND REGULATIONS THAT RELATE TO KITCHEN HOODS
The International Mechanical Building Code (IMC) (507.2.1.1) requires that a kitchen hood exhaust be automatically started when cooking operations begin assuming that the exhaust fans are not already running. This requirement is traditionally satisfied by monitoring the exhaust air temperature and starting the exhaust fan upon a significant rise in temperature. National Fire Protection Association (NFPA) 96 (Standard for Ventilation Control and Fire Protection of Commercial Cooking Operations) has been amended to allow exhaust air duct velocities as low as 500 feet per minute (fpm) in the ductwork and exhaust collar. The normal flow rate at full exhaust rates is in the range of 1500 to 1800 fpm. This change allows the use of variable flow kitchen hoods. American National Standards Institute (ANSI)/ASHRAE/Illuminating Engineering Society (IES) Standard 90.1-2010 requires that a kitchen with an exhaust rate more than 5,000 CFM must satisfy one of the three following conditions:
• At least 50% of all replacement air must be transfer air that would otherwise be exhausted.
• There must be demand ventilation system(s) on at least 75% of the exhaust air. Such systems shall be capable of at least 50% reduction in exhaust and replacement air system airflow rates, including controls necessary to modulate airflow in response to appliance operation and to maintain full capture and containment of smoke, effluent, and combustion products during cooking and idle.
• Listed energy recovery devices must have a sensible heat recovery effectiveness of not less than 40% on at least 50% of the total exhaust airflow.
Other regulations that affect the variable flow exhaust hood technology include:
• American Society for Testing and Materials (ASTM) Standard Test Method F 1704-05, Standard Test Method for Capture and Containment Performance of Commercial Kitchen Exhaust Ventilation Systems.
• 2007 ASHRAE Handbook HVAC Applications, Chapter 31.
37
• ANSI/ASHRAE/IES Standard 90.1-2010.
8.3 PROCUREMENT CONSIDERATIONS
Some vendors offer systems that use only temperature sensors, i.e., they do not use optical or opacity sensors. This is not recommended since the optical sensors provide an indication of cooking when the exhaust air has not yet reached the setpoint temperature. Thus, the hood would continue to operate at a low exhaust rate and cooking effluent would spill from the exhaust hood. Temperature-only systems are usually set to higher exhaust rates to mitigate this issue.

This page left blank intentionally.
39
9.0 REFERENCES
Bohlig, C. and D. Fisher, 2004. Demand Ventilation in Commercial Kitchens: An Emerging Technology Case Study. FSTC Report 5011.04.17. San Ramon, CA: Food Service Technology Center, http://www.fishnick.com/publications/appliancereports/hoods/mark_hopkins_melink_report.pdf.
Fisher Nickel, Inc.: Food Service Technology Center, http://www.fishnick.com/about/fni/.
Fisher, D., F. Schmid, and A.J. Spata, 1999. Estimating the energy-saving benefit of reduced-flow and/or multi-speed commercial kitchen ventilation systems. ASHRAE Transactions. 105(1).
Fisher, D., 2009. Energy efficiency in dining facilities. Chicago Workshop and Army Energy Summit.
Fuller, S.K., and S.R. Petersen, 1995. Life Cycle Costing Manual for the Federal Energy Management Program. NIST Handbook 135. Washington, DC: National Institute of Standards and Technology (NIST), http://www.wbdg.org/ccb/NIST/hdbk_135.pdf.
Melink: Vendor of variable flow exhaust hood controls, http://www.melinkcorp.com.
Petersen, S.R., 1995. The NIST “Building Life Cycle Cost” Program, Version 4.3 User’s Guide and Rference Manual. NISTIR 5185-3. Gaithersburg, MD: NIST.
Underwood, D.M., 2014. Exhaust Hood and Makeup Air Optimization. SERDP/ESTCP Project EW-201151. ERDC/CERL TR-14-5. Champaign, IL: Engineer Research and Development Center, Construction Engineering Research Laboratory (ERDC-CERL).

This page left blank intentionally.
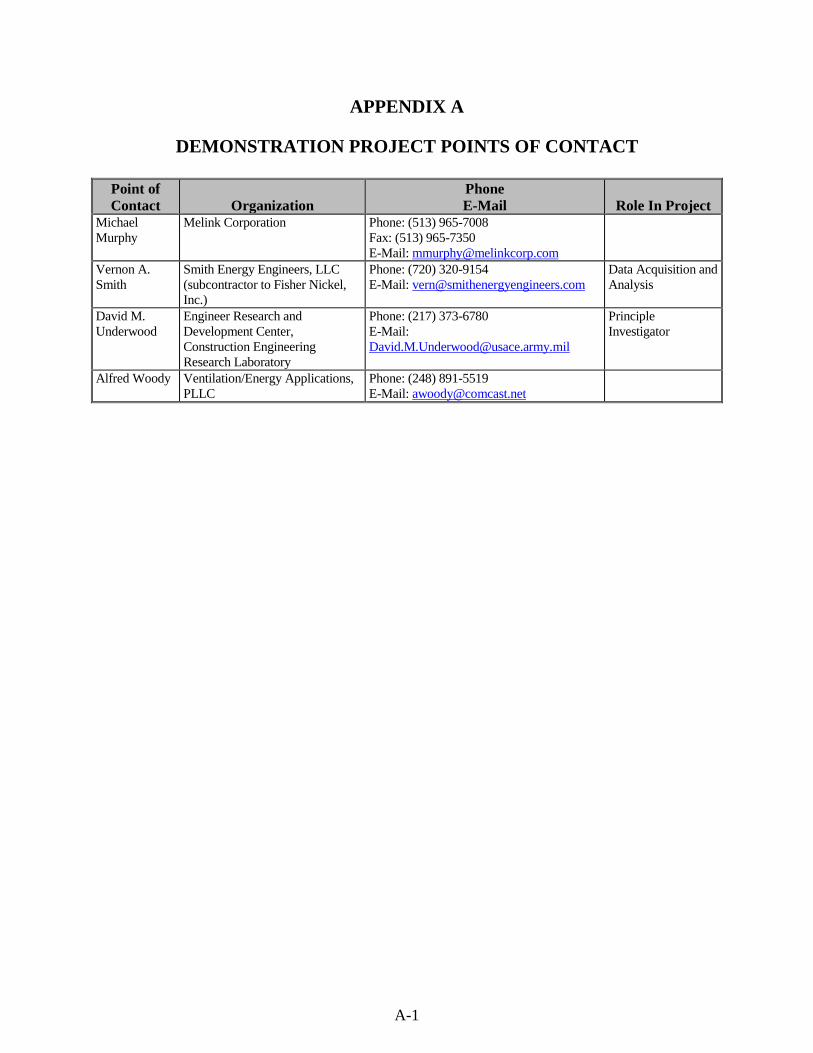
A-1
APPENDIX A
DEMONSTRATION PROJECT POINTS OF CONTACT
Point of Contact Organization
Phone E-Mail Role In Project
Michael Murphy
Melink Corporation
Phone: (513) 965-7008 Fax: (513) 965-7350 E-Mail: [email protected]
Vernon A. Smith
Smith Energy Engineers, LLC (subcontractor to Fisher Nickel, Inc.)
Phone: (720) 320-9154 E-Mail: [email protected]
Data Acquisition and Analysis
David M. Underwood
Engineer Research and Development Center, Construction Engineering Research Laboratory
Phone: (217) 373-6780 E-Mail: [email protected]
Principle Investigator
Alfred Woody Ventilation/Energy Applications, PLLC
Phone: (248) 891-5519 E-Mail: [email protected]

This page left blank intentionally.