final july, 2008 - epa archives · final july, 2008 sri ... reviewed and approved by the greenhouse...
TRANSCRIPT


Final July, 2008
SRI/USEPA-GHG-QAP-45 July, 2008
Test and Quality Assurance Plan
Building Energy Solutions, LLP Tecogen DG / CHP Installation
Prepared by:
Greenhouse Gas Technology Center
Operated by Southern Research Institute
Under a Cooperative Agreement With U.S. Environmental Protection Agency
and
Under Agreement With
New York State Energy Research and Development Authority

Final July, 2008
EPA REVIEW NOTICE
This report has been peer and administratively reviewed by the U.S. Environmental Protection Agency, and approved for publication. Mention of trade names or commercial products does not constitute endorsement or recommendation for use.

Final July, 2008
Greenhouse Gas Technology Center A U.S. EPA Sponsored Environmental Technology Verification ( ) Organization
Test and Quality Assurance Plan Building Energy Solutions, LLP Tecogen DG / CHP Installation
This Test and Quality Assurance Plan has been reviewed and approved by the Greenhouse Gas Technology Center Project Manager and Center Director, the U.S. EPA APPCD Project Officer, and the U.S. EPA APPCD Quality Assurance Manager. Tim A. Hansen 24 July 2008 Lee Beck 15 July 2008 Director APPCD Project Officer Greenhouse Gas Technology Center U.S. EPA Southern Research Institute William Chatterton 24 July 2008 Robert Wright 16 July 2008 Project Manager APPCD Quality Assurance Manager Greenhouse Gas Technology Center U.S. EPA Southern Research Institute Eric Ringler 21 July 2008 Quality Assurance Manager Greenhouse Gas Technology Center Southern Research Institute Test Plan Final: 10 July 2008

Final July, 2008
[Blank Page]

Final July, 2008
TABLE OF CONTENTS Page
LIST OF FIGURES ......................................................................................................................................... i LIST OF TABLES ........................................................................................................................................... i ACRONYMS AND ABBREVIATIONS ........................................................................................................ ii
1.0 INTRODUCTION ................................................................................................................................. 1-1 1.1. PURPOSE ..................................................................................................................................... 1-2 1.2. PARTICIPANTS, ROLES, AND RESPONSIBILITIES ............................................................. 1-2 1.3. TEST SCHEDULE ....................................................................................................................... 1-4
2.0 TEST PROCEDURES .......................................................................................................................... 2-1 2.1. TEST CONCEPTS AND OBJECTIVES ...................................................................................... 2-1
2.1.1. Controlled Test Period ..................................................................................................... 2-1 2.1.2. Long-term Monitoring Period .......................................................................................... 2-2 2.1.3. Instrument Specifications ................................................................................................. 2-4
2.2. SITE-SPECIFIC CONSIDERATIONS ........................................................................................ 2-6
3.0 DATA QUALITY .................................................................................................................................. 3-1 3.1. DATA ACQUISITION ................................................................................................................. 3-1 3.2. DATA QUALITY OBJECTIVES ................................................................................................ 3-1 3.3. DATA REVIEW, VALIDATION, AND VERIFICATION ......................................................... 3-2 3.4. INSPECTION AND ACCEPTANCE OF SUPPLIES, CONSUMABLES, AND
SERVICES .................................................................................................................................... 3-3 3.5. CALIBRATIONS AND PERFORMANCE CHECKS................................................................. 3-3 3.6. AUDITS OF DATA QUALITY ................................................................................................... 3-4 3.7. INDEPENDENT REVIEW .......................................................................................................... 3-4
4.0 ANALYSIS AND REPORTS ............................................................................................................... 4-1 4.1. ELECTRICAL PERFORMANCE ................................................................................................ 4-1 4.2. ELECTRICAL EFFICIENCY ...................................................................................................... 4-2 4.3. CHP THERMAL PERFORMANCE ............................................................................................ 4-2 4.4. ATMOSPHERIC EMISSIONS .................................................................................................... 4-2
5.0 REFERENCES ...................................................................................................................................... 5-1
LIST OF FIGURES Page
Figure 1-1 Test Participants ............................................................................................................. 1-2 Figure 1-2 Test Schedule ................................................................................................................. 1-4 Figure 2-1 Controlled Test Instrument Locations ............................................................................ 2-2 Figure 2-2 Long-Term Monitoring Instrument Locations ............................................................... 2-3
LIST OF TABLES
Page Table 2-1 Instrument and Analysis Accuracy Specifications ......................................................... 2-4 Table 2-2 Instrument Descriptions and Locations .......................................................................... 2-5 Table 3-1 Recommended Calibrations and Performance Checks .................................................. 3-3
i

Final July, 2008
ii
ACRONYMS AND ABBREVIATIONS A ampere APPCD Air Pollution Prevention and Control Division BES Building Energy Solutions, LLC BOCES Board of Cooperative Educa- tional Services Btu/h British thermal units per hour Btu/scf British thermal units per standard cubic foot CHP combined heat and power CLD chemiluminescensce detector CO2 carbon dioxide CO carbon monoxide CT current transformer DG distributed generation DG / CHP distributed generation / combined heat and power DHW domestic hot water DQO data quality objective EPA U. S. Environmental Protection Agency ETV Environmental Technology Verification FID flame ionization detector GHG greenhouse gas gpm gallons per minute HRLHV heat rate, LHV basis, Btu/kWh Hz Hertz IC internal combustion kW kilowatt LHV lower heating value
mmBtu/h million British thermal units per hour MQO measurement quality objective MTG microturbine generator NDIR ` non-dispersive infrared NDUV non-dispersive ultraviolet NMHC non-methane hydrocarbons NIST National Institutes of Standards and Technology NOX nitrogen oxides NYSERDA New York State Energy Research and Development Authority O2 oxygen PEMS portable emissions measurement system ppmv volume parts per million QA / QC quality assurance / quality control RTD resistance temperature device scfh standard cubic feet per hour THC total hydrocarbons THD total harmonic distortion Tr return temperature Ts supply temperature V volt oF degrees Fahrenheit “ H2O inches of water column η efficiency, percent
DISTRIBUTION LIST
New York State Energy Research and Development Authority Jim Foster Building Energy Solutions, LLC Rae H. Butler U.S. EPA Office of Research and Development Lee Beck Robert Wright Southern Research Institute (GHG Center) Tim Hansen William Chatterton Eric Ringler

Final July, 2008
1.0 INTRODUCTION
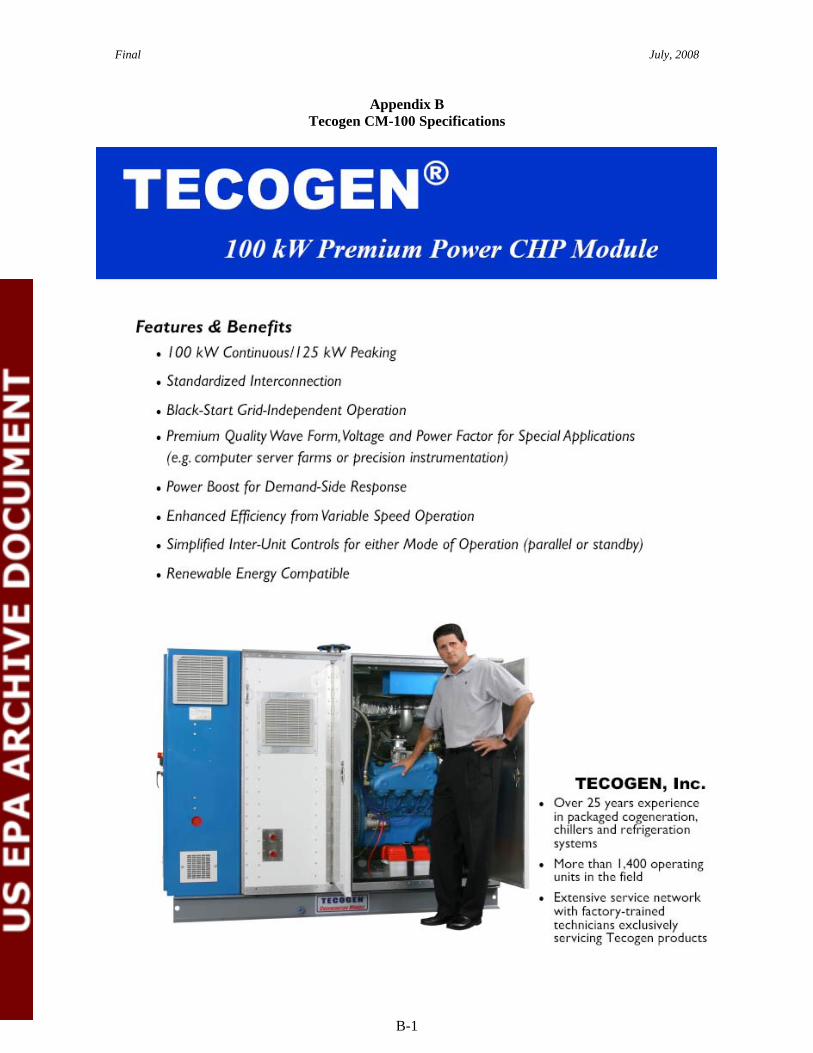
The intent of this Test and Quality Assurance Plan (test plan) is to guide the planning, execution, data analysis, and reporting for performance verification of a Tecogen reciprocating internal combustion (IC) engine distributed electrical generation and combined heat and power (DG / CHP) installation designed and commissioned by Building Energy Solutions, LLP. Building Energy Solutions (BES) has installed six natural gas-fired Tecogen Model CM-100 Premium Power CHP modules as part of a DG / CHP upgrade at the Madison-Oneida Board of Cooperative Educational Services (BOCES) campus located in Verona, NY. Appendix B provides CHP module specifications. The CHP array will operate in response to electrical demand; power will not be exported to the grid. Control of the host facility’s peak demand, as seen by the grid, is a fundamental economic driver for the system. Operators will adjust each module between 40 and 100 percent power, with 110 percent peaking power available for short periods. Operators will be able to dispatch all six units for power demands between 660 kilowatts (kW) (at peak power) and 264 kW. They will take CHP modules offline for lower power demands, down to a minimum of 40 kW with one module in operation. The installation will recover substantial amounts of thermal energy from the IC engine jacket coolant, oil cooler, and exhaust. Design specifications indicate that the recovered energy will supply up to 4.4 million British thermal units per hour (mmBtu/h) to the following district heating and cooling applications:
• year-round domestic hot water (DHW) • heat supply to two 100-ton absorption chillers for air-conditioning during warm
weather • hydronic space heating during cold weather
The facility also incorporates two 7500-gallon insulated thermal storage tanks. Their function is to provide approximately 2.5 mmBtu carry-through capacity for space heating and DHW needs during cold weather periods when electrical demand is low. The CHP heating and cooling applications will displace fuel consumption at five existing natural gas-fired boilers rated at 1.94 mmBtu/h each. Two of the boilers are located adjacent to the CHP installation while the remaining three are located elsewhere on the campus. Hydronic heating, DHW, and chilled water piping is generally located in the ceiling spaces and corridors which connect the various building sections. The electrical generators, panel boards, circulation pumps, and most other parasitic loads are connected to the main service bus located in the building “Section H” mechanical room. The test campaign will determine the emissions performance, electrical performance, and electrical efficiency of one CHP module during a “controlled test period”. Assessment of how the overall BOCES facility uses the CHP heat would likely require at least one year of monitoring, which is beyond this project’s current scope. This is because the system permits dispatching of the CHP heat to five types of loads:
• domestic hot water (year round) • two 100-ton chillers (summer) • hydronic space heating (winter) • thermal storage (primarily winter) • heat rejection (any time CHP heat production exceeds demand or thermal storage)
1-1
Final July, 2008
This test campaign will determine the CHP heat production as it leaves the 6-unit Tecogen system boundary without quantifying its ultimate use. A one-month “long-term monitoring period” will quantify the power production, CHP thermal energy (heat) production, electrical efficiency, thermal efficiency, and total efficiency of the as-dispatched system. The project may be modified to incorporate monitoring of heat and power production and use for a full calendar year should additional funding be secured to do so.
1.1. PURPOSE
The New York State Energy Research and Development Authority (NYSERDA) and the U.S. Environmental Protection Agency (EPA) Environmental Technology Verification (ETV) program have commissioned this test campaign. Test results also are of interest to the ETV program because previous CHP verifications have not included either the Tecogen Model CM-100 Premium Power CHP modules or multi-IC engine arrays. Also, few integrated chiller, hydronic heating, and DHW applications such as those served by this installation have been tested previously.
1.2. PARTICIPANTS, ROLES, AND RESPONSIBILITIES
Southern Research Institute’s (Southern’s) Greenhouse Gas (GHG) Technology Center will manage the test campaign. Responsibilities include:
• test strategy development and documentation • coordination and execution of all field testing, including:
o installation, operation, and removal of emissions testing equipment o providing electrical power monitoring, CHP heat production, and data logging
equipment o subcontract management for installation and removal of electrical power monitors
• inspection of calibrations, performance of crosschecks, and other activities • data validation, quality assurance and quality control (QA / QC), and reporting
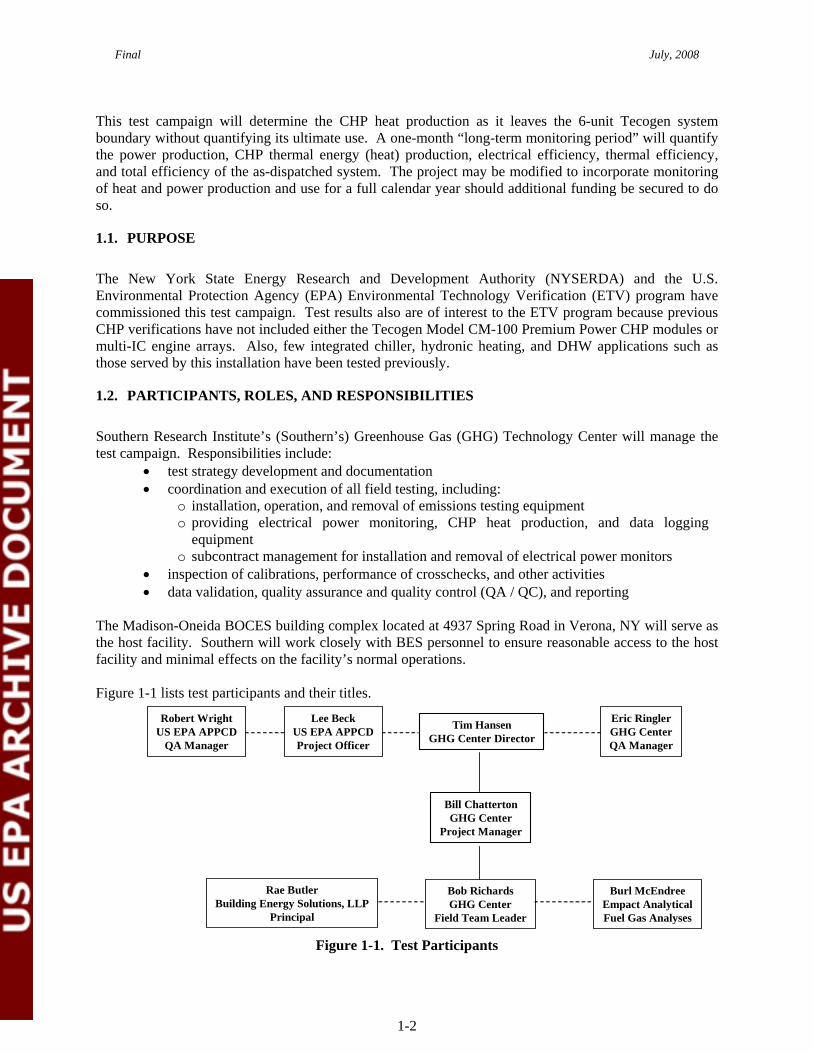
The Madison-Oneida BOCES building complex located at 4937 Spring Road in Verona, NY will serve as the host facility. Southern will work closely with BES personnel to ensure reasonable access to the host facility and minimal effects on the facility’s normal operations. Figure 1-1 lists test participants and their titles.
Tim HansenGHG Center Director
Eric RinglerGHG CenterQA Manager
Robert WrightUS EPA APPCD
QA Manager
Lee BeckUS EPA APPCDProject Officer
Bill ChattertonGHG Center
Project Manager
Bob RichardsGHG Center
Field Team Leader
Burl McEndreeEmpact AnalyticalFuel Gas Analyses
Rae ButlerBuilding Energy Solutions, LLP
Principal
Figure 1-1. Test Participants
1-2

Final July, 2008
Tim Hansen is the GHG Technology Center Director. He will:
• ensure the resources are available to complete this verification • review the test plan and verification report to ensure they conform to ETV principles • oversee GHG Technology Center staff and provide management support where
needed • sign the verification statement, along with the EPA Office of Research and
Development laboratory director. Bill Chatterton will serve as the Project Manager for the GHG Center. He will have authority to suspend testing in response to health or safety issues or if data quality indicator goals are not met. His responsibilities also include:
• drafting the test plan and verification report • overseeing the field team leader’s data collection activities • ensuring that data quality objectives (DQO) are met prior to completion of testing • maintaining effective communications between all test participants
Bob Richards will serve as the Field Team Leader. He will: • provide field support for activities related to all measurements and data collected • install and operate the measurement instruments • collect gas samples and coordinate sample analysis with the laboratory • ensure that QA / QC procedures outlined in this test plan are followed • submit all results to the Project Manager to facilitate his determination that DQOs are
met The GHG Technology Center QA Manager, Eric Ringler, is administratively independent from the GHG Center Director and the field testing staff. Mr. Ringler will:
• ensure that all verification tests are performed in compliance with the QA requirements of the GHG Center quality management plan, the generic protocol [1], and this test plan
• review the verification test results and ensure that applicable internal assessments are conducted as described in the test plan
• reconcile the DQOs at the conclusion of testing • conduct or supervise an audit of data quality • review and validate subcontractor-generated data • report all internal reviews, DQO reconciliation, the audit of data quality, and any
corrective action results directly to the GHG Center Director, who will provide copies to the project manager for corrective action as applicable and citation in the final verification report
• review and approve the final verification report and statement Fuel gas analyses will be conducted by Empact Analytical of Brighton, Colorado under the management of Burl McEndree. EPA Office of Research and Development will provide oversight and QA support for this verification. The Air Pollution Prevention and Control Division (APPCD) Project Officer, Lee Beck, is responsible for obtaining final approval of the Test Plan and Report. The APPCD QA Manager will review this test plan and the final Report to ensure they meet the GHG Center Quality Management Plan requirements and represent sound scientific practices.
1-3

Final July, 2008
1-4
Rae Butler is the principal of BES, which is located at 4133 Griffin Road, Syracuse, NY. She is responsible for the DG / CHP system design and will serve as the primary contact for the host facility. She will also work with the Southern field team leader to coordinate test activities.
1.3. TEST SCHEDULE
The host facility’s electrical design normally requires that the six CHP modules follow the electrical load as it varies throughout the day. The controlled test periods, however, will require operations at only one module. Dispatchers will shut down the other five CHP modules during the controlled test period. Normal dispatching will resume as soon as this test period is finished. All long-term monitoring will occur under normal operating conditions. Southern will install electric power production and parasitic electric load monitoring equipment for use during the controlled test period. Installers will de-energize the electrical feed briefly during installation and removal. Southern will temporarily install heat transfer fluid flow and temperature monitoring equipment for use during the long-term monitoring periods. Figure 1-2 shows the intended test schedule. Building Energy Solutions and Southern will specify the test dates upon completion of the installation and commissioning process.
Figure 1-2. Test Schedule
Day 3Day 2Day 1Arrive at siteConduct orientation, safety, and other
conferencesUnpack Southern’s test equipment,mobilize, and perform preliminary setups
Hoist portable emissions monitoring sys-tem (PEMS), umbilical, calibration gases,and accessory equipment to roof level
Prepare and install electric power produc-tion and parasitic load monitoring equip-ment
Install CHP heat transfer fluid flow andtemperature monitoring equipment
Complete the monitoring equipment installations
Test Schedule
Day 4
Withdraw 5 Tecogen modules from normaldispatching and shut them down
Start selected module, load it at 100 %of capacity, and equilibrate for at least10 minutes
Perform 3 controlled test runs, at least ½hour each at 100 % of capacity
Adjust loading to 75 % of capacity andequilibrate for at least 10 minutes
Perform 3 controlled test runsAdjust loading to 50 % of capacity and
equilibrate for at least 10 minutesPerform 3 controlled test runsReturn all Tecogen modules to operation
and restore normal dispatching
Reconfigure test equipment for long-termmonitoring period
Begin 1-month long term monitoring periodRemove and demobilize PEMS and other
unneeded test equipmentPack for shipping and closeout

Final July, 2008
2.0 TEST PROCEDURES
The ETV program has published the Distributed Generation and Combined Heat and Power Field Testing Protocol [1] (generic protocol). The generic protocol contains detailed test procedures, instrument specifications, analytical methods, and QA / QC procedures. This test campaign will generally conform to the generic protocol specifications, with modifications or special considerations as listed in the following subsections. Appendix A provides field data forms as derived from the generic protocol.
2.1. TEST CONCEPTS AND OBJECTIVES
The test campaign will proceed in two phases: • controlled test period • one-month long-term monitoring period
2.1.1. Controlled Test Period
Southern test personnel will be on-site during the controlled test period to perform the following determinations on the selected Tecogen CHP module:
• electrical performance (see generic protocol §2.0 for parameters and specifications; Appendix D1 for definitions and equations)
• electrical efficiency (see generic protocol §3.0 for parameters and specifications; Appendix D2 for definitions and equations)
• gaseous carbon monoxide (CO), carbon dioxide (CO2), nitrogen oxides (NOX) and total hydrocarbons (THC) emissions performance (see generic protocol §5.0)
The generic protocol recommends testing at 100, 75, 50, and 25 percent of capacity, but Tecogen specifies a minimum 40 percent operating level. Power levels during the controlled test period will therefore be 100, 75, and 50 percent of capacity. The generic protocol recommends 1-hour test runs for internal combustion engines and 30-minute test runs for microturbines. Southern has found that 30-minute test runs provide stable data with narrow confidence intervals for both types of power plants. The controlled test period will therefore consist of three (3) test runs, each 30 minutes long, at each power level. A 10-minute warmup and equilibration period will precede each test run. Southern will coordinate the temporary installation of independent electrical power analyzers on the selected module’s output bus. Figure 2-1 shows the instrument locations for the controlled test period. The analyzers will record the electrical performance parameters at 1-minute intervals or shorter. The configuration of the host facility electrical buses will require that the heat rejection air handling unit, heat rejection pumps, and the CHP circulation pumps to and from the hydronic and DHW heat exchangers be disconnected as shown in Figure 2-1 during the controlled test periods. These instruments will allow proper quantification of the generator and electronics cooling parasitic loads. Southern will determine gaseous emissions as CO, CO2, NOX, and THC concentrations with a Horiba OBS-2200 portable emissions monitoring system (PEMS). The PEMS also measures exhaust gas flow with a stack flow tube. Test personnel will temporarily install the PEMS and flow tube on the selected unit’s exhaust stack. The mean concentration for each gas during each individual test run, integrated with
2-1

Final July, 2008
the mean exhaust gas volumetric flow rate observed during that test run, will yield the run’s gaseous emission rate in pounds per hour. Reported results will consist of the mean of three valid test runs.
Figure 2-1. Controlled Test Instrument Locations
Vol, std
CO, CO2,NOx, THC, O2H2O, Pamb
Vfuel, scfm
M
kW, kVAR,PF, V, A,Hz, THD
kW
M
Qfuel, Btu/scf
kW
MCC-1
MCC-2
Controls Electrical lines
Building water orheat transfer fluid lines
Natural gas lines
CHP hot water linesto / from chiller, hydronic, DHWheat exchangers and thermal storage
CHP heat exchanger
Emissions performance:Horiba OBS-2200portable emissionsmonitoring system (PEMS)
Generator and electronics coolers
Heat rejectionair handling unit
Heat rejectionand standbypumps
Tecogen CM-100Premium PowerCHP Module
Chiller CHP water circulationand standby pumps
DHW heat exchangers and thermal storage watercirculation and standby pumps
MCC-1 Electrical panel ID
Test instrumentation
Southern will log natural gas consumption data directly from the utility revenue meter located in the Section H mechanical room. Appendix A-5 provides a field form. Test personnel will also collect natural gas samples for lower heating value (LHV) analysis.
2.1.2. Long-term Monitoring Period
The long-term monitoring period will provide assessments of the following: • electric power production, net • electrical efficiency • CHP thermal performance (see generic protocol §4.0 for parameters and
specifications, Appendix D3 for definitions and equations) • CHP and total efficiency (see generic protocol Appendix D3 for definitions and
equations)
2-2

Final July, 2008
Southern will coordinate the temporary installation of three independent electrical power monitors as shown in Figure 2-2. The monitors will log the CHP array total generated power and parasitic loads at 1-minute intervals or shorter throughout the long-term monitoring period.
Vfuel, scfm
M
kW
kW
M
Qfuel, Btu/scf
kW
MCC-1
MCC-2
Controls
Ts Vl, 1
Tr
Vl, 2
P-COGEN
Electrical lines
Building water orheat transfer fluid lines
Natural gas lines
CHP hot water lines
Heat rejectionair handling unit
Heat rejectionand standbypumps
Chiller CHP water circulationand standby pumps
DHW heat exchangers and thermal storage watercirculation and standby pumps
Six Tecogen CM-100Premium PowerCHP Modules
Generator and electronics coolers
MCC-1 Electrical panel ID
Test instrumentation
Figure 2-2. Long-term Monitoring Period Instrument Locations Water serves as the CHP heat transfer fluid. Southern will temporarily install supply and return temperature sensors and an ultrasonic fluid flow meter at locations Ts, Tr, and Vl1, as shown in Figure 2-2. The host site has a paddlewheel flow sensor at location Vl2. Southern will monitor this flow meter’s output during the long-term monitoring period as a crosscheck. Electrical efficiency determinations require acquisition of natural gas LHV data. Test personnel will collect a round of gas samples during the controlled test period and a second round at the end of the long-term monitoring period. Analysts will use the mean of all valid samples in the efficiency calculation. Gas consumption will be determined by a datalogger connected to a revenue-grade gas meter. Southern will temporarily install a Dresser brand Roots meter, model 11M175, in the CHP array gas line. This meter will incorporate a high-frequency pulse output for flow rate determinations. Test personnel will
2-3

Final July, 2008
2-4
connect the meter output to the datalogger and record the gas flow rate at least once per minute during all test periods.
2.1.3. Instrument Specifications
The generic protocol provides detailed specifications for all instruments or analyses. Table 2-1 provides a synopsis while Table 2-2 provides additional details.
Table 2-1. Instrument and Analysis Accuracy Specificationsa Parameter Accuracy
Voltage ± 0.5 % Current ± 0.4 % Real Power ± 0.6 % Reactive power ± 1.5 % Frequency ± 0.01 Hertz (Hz) Power Factor ± 2.0 % Voltage total harmonic distortion (THD) ± 5.0 % Current THD ± 4.9 % to 360 Hz Current transformer (CT) ± 0.3 % at 60 Hz CT ± 1.0 % at 360 Hz Temperature ± 1 °F
Barometric pressure ± 0.1 inches of mercury (± 0.05 pounds per square inch, absolute)
Gas flow ± 1.0 %b LHV analysis by ASTM D1945 [2] and D3588 [3] ± 1.0 % Heat transfer fluid flow ± 1.0 % Tsupply, Treturn temperature sensors ± 0.6 oF Gaseous emissions concentrations ± 2.0 % of spanc Method 2 volumetric flow rate ± 5.0 % aAll accuracy specifications are percent of reading unless otherwise noted. bUtility gas meter is temperature- and pressure-compensated. cPEMS conforms to or exceeds Table 1 of Title 40 CFR 1065.915 specifications.

Final July, 2008
Table 2-2. Instrument Descriptions and Locations
Index Ch_ID (channel
identifier)
Parm_ID (parameter identifier)
Description Nominal rating / expected value
Location Sensor manufacturer, model number
1 01 Flow_1 Heat transfer fluid (water) flow rate 180 gallons per minute (gpm)
Outlet of CHP circulation pump and standby pump (P-H-CGD-1, P-H-CGD-2)
Hedland model HTTN large pipe ultrasonic flowmeter
2 02 Flow_2 Heat transfer fluid (water) flow rate 180 gpm Existing: Outlet of CHP circulation pump and standby pump (P-H-CGD-1, P-H-CGD-2)
Onicon model F-1110 paddlewheel flow metera
3 03 Ts Supply temperature 80 - 140 oF Outlet of CHP circulation pump and standby pump (P-H-CGD-1, P-H-CGD-2)b
Omega PR-14-3-100 4-wire resistance temperature device (RTD)
4 04 Tr Return temperature 80 - 140 oF Heat transfer fluid return line to Tecogen arrayb
Omega PR-14-3-100 4-wire RTD
5 05 Chill_kW Chiller CHP pump (P-H-CGD-3) and standby pump (P-H-CGD-4) parasitic load real power
≈ 6 kW, maximum (7.2 A/ph)
MCC-1 40-amp breakersc Flex-Core WL-55 watt meter with (3) Flex-Core 191-151 solid-core CTs
6 06 Fuel Natural gas consumption, 0.025 scf per pulse 111 Hz at 600 kW Revenue gas meter Dresser CEX
7 Fuel_LHV Natural gas lower heating value 910 British thermal units per standard
cubic foot (Btu/scf)
Revenue gas meter Empact Analytical sampling bottles
8 Pwr_Gen Generated real power, reactive power, power factor, voltage, current, frequency, total harmonic distortion
100 kWd - 600 kWe Single module disconnectd P-COGEN buse
Power Logic ION 7500 with (3) Flex-core 606-201 split-core CTsd and (3) Flex-core 19-801 solid-core CTse
9 Pwr_Par Parasitic load real power consumption ≈38 kW, maximum (46 A/ph)
MCC-2 main bus Power Logic ION 7600 with (3) Flex-core 606-401 split-core CTs
aTo be cross-checked against the National Institutes of Standards and Technology (NIST)-traceable ultrasonic flow meter bWill require installation of ¼” inner diameter thermowell for temperature sensor cRoute the A-phase for each motor through the “A” CT, the B-phases through the “B” CT, and the C-phase through the “C” CT (two phase conductors per CT) dControlled test eLong-term monitoring period
2-5

Final July, 2008
2.2. SITE-SPECIFIC CONSIDERATIONS
Section 6.0 of the generic protocol lists step-by-step procedures for the controlled test period. This subsection considers site-specific testing, safety, or other actions which the field team will implement. Appendix A of this test plan provides the necessary field data forms. Emissions testing Southern will coordinate hoisting the PEMS, heated umbilical, calibration gases, and power supply to the roof for the controlled tests. This may require rental of a personnel lift. The 3” diameter exhaust stacks for each CHP module exit the building through the roof. Each stack terminates in a U-bend section located about 24” above the roof surface. Test personnel will temporarily install an elbow, a horizontal 30” stack extension, and the PEMS exhaust flow and sampling tube at the stack mouth of the selected CHP module during the controlled test period. The stack extension will provide 10 upstream diameters to the closest disturbance, as recommended by the PEMS manufacturer. It will rest on metal or brick supports to protect the roof surface from heat. Electrical power monitors Southern will coordinate the temporary installation of the electric power sensors by a qualified electrician. The generic protocol, Figure F-1 of Appendix F2, provides a wiring schematic. Southern will provide the power monitors, shorting switches, current transmitters (CT), and miscellaneous supplies. These tests will employ both split-core and solid-core CTs. The electrician must remove and reinstall the bus conductors for the solid-core CTs. The power meters will require direct voltage connection to each phase. The electrical feeds must be shut down briefly during the connection procedure and while installing the CTs and voltage connections. Natural gas sampling Southern will collect at least three natural gas samples during the controlled test period and three additional samples at the end of the long-term monitoring period. Southern will coordinate installation of sampling petcocks if required. The expected 12 - 20 inches of water column (” H2O) pressure will require the use of Southern’s low pressure gas sampling pump and manifold. Test personnel will temporarily connect the sampling manifold inlet to the petcock. They will connect an evacuated sample bottle to the outlet port and purge the bottle for at least 60 seconds prior to capping and sealing during each sampling event. Analysts will compare the mean LHV between the two sets of samples to evaluate potential changes in the gas supply. They will also use the mean LHV in the electrical and CHP efficiency determinations. Appendices A6 and A7 provide a sampling log and chain of custody form, respectively
2-6

Final July, 2008
3.0 DATA QUALITY
Southern operates the GHG Technology Center for the EPA ETV program. Southern’s analysis and QA / QC procedures conform to the Quality Management Plan, Version 1.4, developed for the GHG Technology Center.
3.1. DATA ACQUISITION
Test personnel will collect the following electronic data files: • power output and power quality parameters
o ION 7500 power meter database • parasitic loads
o ION 7600 power meter database o Flex-Core WL-55 watt meter connected to datalogger o clamp-type real power meter for manual measurements of controls power consumption
• emissions concentrations (controlled test only) o PEMS
• heat transfer fluid temperature and flow rate o datalogger
• long-term monitoring period fuel consumption (if gas meter pulse output is available) The power meters and datalogger will poll their sensors once per second during the controlled test period. The power meters will then calculate and record one-minute averages. The field team leader will download the one-minute power meter and one second datalogger data directly to a laptop computer during the short-term tests. Test personnel will adjust the datalogger logging interval to 10 seconds at the start of the long-term monitoring period. A telephone line or wireless connection will allow Southern to download the data files on a weekly basis from the datalogger and power meters during the long-term monitoring period. Test personnel will record printed or written documentation on the log forms provided in Appendix A, including:
• daily test log, including test run starting and ending times, notes, gas meter readings, etc. • appendix A forms which show the results of QA / QC checks • copies of calibrations and manufacturers’ certificates
The GHG Center will archive all electronic data, paper files, analyses, and reports at their Durham, NC office in accordance with their quality management plan.
3.2. DATA QUALITY OBJECTIVES
The generic protocol [1] provides the basis for the data quality objectives (DQO) to be achieved in this verification. Previous DG / CHP verifications and peer-reviewed input from EPA and other stakeholders contributed to the development of those specifications. Tests which meet the following quantitative DQOs will provide an acceptable level of data quality to meet the needs of technology users and decision-
3-1

Final July, 2008
makers. The DQO specifications are in terms of relative measurement uncertainty. The DQOs do not address sampling variability. Verification Parameter DQO (relative uncertainty) electrical performance as generated power ± 2.0 % electrical efficiency ± 2.5 % CHP thermal efficiency ± 3.5 % Each test measurement that contributes to a verification parameter has stated measurement quality objectives (MQO) which, if met, ensure achievement of that parameter’s DQO. Table 2-2 summarizes the generic protocol MQOs as accuracy specifications for each instrument or measurement. The gaseous emissions DQO is qualitative in that this verification will produce emission rate data that satisfies the QA / QC requirements for EPA Title 40 CFR 1065 field test methods [4]. The verification report will provide sufficient documentation of the QA / QC checks to evaluate whether the qualitative DQO was met. The completeness goal for this verification is to obtain valid data for 90 percent of each controlled test period and 80 percent of the long-term monitoring period. A fundamental component of all verifications is the reconciliation of the collected data with its DQO. The DQO reconciliation will consist of evaluation of whether the stated methods were followed, MQOs achieved, and overall accuracy is as specified in the generic protocol and this test plan. The field team leader and project manager will initially review the collected data to ensure that they are valid and consistent with expectations. They will assess the data’s accuracy and completeness as they relate to the stated QA / QC goals. If review of the test data shows that QA / QC goals were not met, then immediate corrective action may be feasible, and will be considered by the project manager. DQOs will be reconciled after completion of corrective actions. As part of the internal audit of data quality, the GHG Center QA Manager will include an assessment of DQO attainment.
3.3. DATA REVIEW, VALIDATION, AND VERIFICATION
The project manager will initiate the data review, validation, and analysis process. Analysts will employ the QA / QC criteria specified in §3.5 to classify all collected data as valid, suspect, or invalid. In general, valid data results from measurements which:
• meet the specified QA / QC checks • were collected when an instrument was verified as being properly calibrated • are consistent with reasonable expectations, manufacturers’ specifications, and
professional judgment The report will incorporate all valid data. Analysts may or may not consider suspect data, or it may receive special treatment as will be specifically indicated. If the DQO cannot be met, the project manager will decide to continue the test, collect additional data, or terminate the test and report the data obtained. Data review and validation will primarily occur at the following stages:
• on site -- by the field team leader • upon receiving subcontractor or laboratory deliverables
3-2

Final July, 2008
• before writing the draft report -- by the project manager • during draft report QA review and audits -- by the GHG Center QA Manager
3.4. INSPECTION AND ACCEPTANCE OF SUPPLIES, CONSUMABLES, AND SERVICES
Procurement documents shall contain information clearly describing the item or service needed and the associated technical and quality requirements. Consumables for this verification will primarily consist of NIST-traceable calibration gases. Fuel analysis will be the only purchased service. The procurement documents will specify the QA / QC requirements for which the supplier is responsible and how conformance to those requirements will be verified. Procurement documents shall be reviewed for accuracy and completeness by the project manager and QA manager. Appropriate measures will be established to ensure that the procured items and services satisfy all stated requirements and specifications.
3.5. CALIBRATIONS AND PERFORMANCE CHECKS
Sections 7.1 through 7.3 of the generic protocol specify a variety of technical system audits and QA / QC checks for the electrical performance, electrical efficiency, and CHP performance determinations. This test campaign will perform those that are applicable to the host facility. The final test report will cite the results for each QA / QC check. The generic protocol specifies Title 40 CFR 60 Appendix A source test methods to determine gaseous pollutant emissions. This test campaign, however, will employ a Horiba OBS-2200 PEMS that meets Title 40 CFR 1065 [4] specifications. Southern will also deploy a Testo 350 multi-gas combustion analyzer as a backup instrument. Test personnel will conduct the technical system audits, calibrations, performance checks, and cross checks listed in Table 3-1.
Table 3-1. Recommended Calibrations and Performance Checks
System or Parameter Description / Procedure Frequency Meets Spec.?
Date Completed
Pressure transducers Cross-check with NIST-traceablea transfer standard Within 12 months
Temperature transducers (Tintake, Texh, Ts, Tr)
Ice bath / boiling water bath (adjusted for altitude) cross check Within 12 months
CHP heat transfer fluid flow meter NIST-traceablea calibration Within 12 months
All instrumental analyzers 11-point linearity check Within 12 months
CO2 (NDIR detectors)b H2O interference
Within 12 months
CO (NDIR detectors) CO2, H2O interference
Hydrocarbon analyzer (FID)c
Propane (C3H8) calibration FID response optimization C3H8 / methyl radical (CH3) response factor determination
C3H8 / CH3 response factor check O2 interference check
NOX analyzer CO2 and H2O quench (CLD)d
NOX analyzer Non-methane hydrocarbons (NMHC) and H2O interference (NDUV detectors)e
Within 12 months
3-3

Final July, 2008
3-4
Table 3-1. Recommended Calibrations and Performance Checks Meets Date System or Parameter Description / Procedure Frequency Spec.? Completed
Ammonia interference and NO2 response (zirconium dioxide detectors) Within 12 months Chiller NO2 penetration (PEMS NOX analyzer with chillers for sample moisture removal)
Within 6 months or immediately NO2 to NO converter efficiency prior to departure for field tests Comparison against laboratory CVS At purchase / installation; after system major modifications Zero / span analyzers (zero ≤ ± 2.0 Before and after each test run % of span, span ≤ ± 4.0 % of point)
Refer to Perform analyzer drift check (≤ ± Complete PEMS After each test run Appendix 4.0 % of cal gas point) A2, “Test NMHC contamination check (≤ 2.0 Once per test day Run % of expected conc. or ≤ 2 ppmv) Record” 100 ppm CO cal gas crosscheck At least once per test day with Testo Zero / span analyzers (zero ≤ ± 2.0 Before and after each test run % of span, span ≤ ± 4.0 % of point) Perform analyzer drift check (≤ ± Testo (if used) After each test run 4.0 % of cal gas point) 100 ppm CO cal gas crosscheck At least once per test day with PEMS
Exhaust gas or intake Differential pressure line leak check air flow measurement (delta-P stable for 15 seconds at 3 Once per test day device “ H2O) aNational Institutes of Standards and Technology (NIST) bnon-dispersive infrared (NDIR) cflame ionization detector (FID) dchemiluminescence detector (CLD)
enon-dispersive ultraviolet (NDUV)
3.6. AUDITS OF DATA QUALITY
The reported results will include many contributing measurements from numerous sources. Data processing will require different algorithms, formulae, and other procedures. Original datalogger text files, power meter database Excel-format file outputs, signed logbook entries, signed field data forms, and documented laboratory analyses for fuel LHV will be the source for all Excel worksheets used as analysis tools. The GHG Center QA manager will:
• manually check the formulae and results for each data stream from raw data to results • compare the spreadsheet results with data that is reported in the draft report • in the event that errors are found, the auditor will track problems to their source and
resolve the errors.
3.7. INDEPENDENT REVIEW
The GHG Center QA manager will examine this test plan, the report text, and all test results. The analyst or author who produces a result table or text will submit it (and the associated raw data files) to him or to an independent technical or editorial reviewer. Reviewers will be Southern employees with different lines of management supervision and responsibility from those directly involved with test activities.

Final July, 2008
4.0 ANALYSIS AND REPORTS
The test report will summarize field activities and present results. Attachments will include sufficient raw data to support the findings and allow reviewers to assess data trends, completeness, and quality. The report will clearly characterize the test parameters, their results, and supporting measurements as determined during the test campaign. It will present raw data and analyses as tables, charts, or text as is best suited to the data type. The report will group the results separately for the controlled test runs and long-term monitoring period. Reported results will include:
• run-specific mean, maximum, minimum, and standard deviation • run-specific assessment of the permissible variations within the run for the controlled
test period • overall mean, maximum, minimum, and standard deviation for all valid test runs • ambient conditions (temperature, barometric pressure) observed during each
controlled test run • description of measurement instruments and a comparison of their accuracies with
those specified in the generic protocol • summary of data quality procedures, results of QA / QC checks, the achieved
accuracy for each parameter, and the method for citing or calculating achieved accuracy
• copies of fuel analysis and other QA documentation, including calibration data sheets, duplicate analysis results, etc.
• results of data validation procedures including a summary of invalid or suspect data and the reasons for the validation status
• information regarding any variations from the procedures specified in this test plan • narrative description of the DG installation, site operations, and field test activities
including observations of site details that may impact performance. These include thermal insulation presence, quality, mounting methods that may cause parasitic thermal loads etc.
The following subsections itemize the reported parameters. Appendix D of the generic protocol provides the relevant definitions and equations.
4.1. ELECTRICAL PERFORMANCE
The electrical performance test reports will include the mean:
• total real power without external parasitic loads, kW • total reactive power, kilovolt-amperes reactive • total power factor, percent • voltage (for each phase and average of all three phases), volts (V) • current (for each phase and average of all three phases), amperes (A) • frequency, Hertz (Hz) • Voltage total harmonic distortion (THD) (for each phase and average of all three
phases), percent
4-1

Final July, 2008
• Current THD (for each phase and average of all three phases), percent • real power consumption for the external parasitic loads, kW • total real power including debits from all external parasitic loads, kW
4.2. ELECTRICAL EFFICIENCY
Electrical efficiency test reports will include:
• electrical generation efficiency (ηe,LHV) without external parasitic loads • electrical generation efficiency (ηe,LHV) including external parasitic loads • heat rate (HRLHV) without external parasitic loads • heat rate (HRLHV) including external parasitic loads • total kW • heat input, British thermal units per hour (Btu/h) at a given electrical power output • fuel input, standard cubic feet per hour (scfh)
The report will quote all laboratory analyses for the fuel LHV in Btu/scf. Note that electrical generation efficiency uncertainty will be reported in absolute terms. For example, if ηe,LHV for gaseous fuel is 26.0 percent and all measurements meet the accuracy specifications, the relative error is ± 3.0 percent (see generic protocol Table 7-4). The absolute error is 26.0 times 0.030, or ± 0.78 percent. The report, then, will correctly state ηe,LHV as “26.0 ± 0.8 percent”.
4.3. CHP THERMAL PERFORMANCE
The thermal performance report for the CHP system in heating service will include the mean:
• thermal performance (Qout), Btu/h • thermal efficiency (ηth,LHV) • total system efficiency (ηtot,LHV) as the sum of ηth,LHV and ηe,LHV • heat transfer fluid supply and return temperatures, degrees Fahrenheit (oF), and flow
rate, gallons per minute (gpm) The report will cite the achieved accuracies for ηth and ηtot in absolute terms
4.4. ATMOSPHERIC EMISSIONS
Reported parameters for each test run will include the following:
• emission concentrations for CO, NOX, and THC evaluated in volume parts per million (ppmv) corrected to 15 percent oxygen (O2)
• emission concentration for CO2 corrected to 15 percent O2 o Note: the correction equation is: o
⎥⎦
⎤⎢⎣
⎡−−
=2
icorr O9.20159.20cc
4-2

Final July, 2008
Where: ccorr = concentration corrected to 15 percent O2, ppmv or percent ci = mean concentration of the constituent i, ppmv or percent 20.9 = atmospheric O2 content, percent O2 = mean exhaust gas O2 content, percent
• emission rates for CO, CO2, NOX, and THC evaluated as pounds per hour and normalized to generated power as pounds per kilowatt-hour
• exhaust gas dry standard flow rate, actual flow rate, and temperature • exhaust gas composition, moisture content, and molecular weight
4-3

Final July, 2008
4-4
[Blank Page]

Final July, 2008
5.0 REFERENCES
[1] Generic Verification Protocol -- Distributed Generation and Combined Heat and Power Field Testing Protocol, Version 1.0, SRI/USEPA-GHG-GVP-04, Southern Research Institute and US EPA Environmental Technology Verification (ETV) Program, available at: <http://www.epa.gov/etv/pubs/sriusepaghggvp04.pdf>, Washington, DC 2005 [2] ASTM D1945-98—Standard Test Method for Analysis of Natural Gas by Gas Chromatography. American Society for Testing and Materials, West Conshohocken, PA. 2001 [3] ASTM D3588-98—Standard Practice for Calculating Heat Value, Compressibility Factor, and Relative Density of Gaseous Fuels. American Society for Testing and Materials, West Conshohocken, PA. 2001 [4] Engine-Testing Procedures, Title 40 CFR 1065, Environmental Protection Agency, Washington, DC, adopted at 70 FR 40410, 13 July, 2005
5-1

Final July, 2008
5-2
[Blank Page]

Final July, 2008
Appendix A Field Data Forms

Final July, 2008
Appendix A1: Distributed Generator Installation Data
Project Name: NYSERDA Tecogen 12494.02 Date: ____________________
Compiled by: (Company) __________________________ Signature: ______________________________
Site Information
Address 1: _____________________________ Owner Company: _______________________________
Address 2: _____________________________ Contact Person: ________________________________
City, State, Zip: _________________________ Address (if different): ___________________________
Op’r or Technician: ______________________ Company Phone: _______________ Fax: __________
Site Phone: ____________________________ Utility Name: National Grid
Modem Phone (if used): __________________ Contact Person: ________________________________
Altitude 510 (feet) Utility Phone: _________________________________
Installation (check one): Indoor__ Outdoor__ Utility Enclosure__ Other (describe)______________________
Sketch of HVAC systems attached (if Indoor) Controls: Continuous Thermostatic Other
Primary Configuration, Service Mode, and CHP Application (check all that apply; indicate secondary power and CHP application information with
an asterisk, * )
Site Description (Check one)
Fuel (Check one)
Delta Wye Grounded Wye Hospital Nat’l Gas XSingle Phase Three Phase University Biogas Inverter Induction Synchronous Resident’l Landfill G Grid Parallel Grid Independent Peak Shaving Industrial Diesel #2 Demand Management
Prime Power Load Following Utility Other (desc.) Backup Power VAR Support Hotel
Hot water Steam Direct-fired chiller Other (desc.) Indirect chiller Other DG or CHP (describe) Office
building
Generator Nameplate Data Date: _____________Local Time (24-hour): ____________ Hour meter: ___________
Commissioning Date: ___________
Manufacturer: ____________________ Model: __________________ Serial #: __________________
Prime mover (check one): IC generator_____ MTG _____
Range: ____ to ____ (kW; kVA) Adjustable? (y/n) ____Power Factor Range: ___ to ___ Adjustable? (y/n) ____
Nameplate Voltage (phase/phase): ______ Amperes: _____Frequency: _______ Hz
Controller (check one): factory integrated _____ 3rd-party installed _____ custom (describe)_________________
A-1

Final July, 2008
A-2
Appendix A1: Distributed Generator Installation Data (cont.)
CHP Nameplate Data
BoP Heat Transfer Fluid Loop
Describe: _______________________________________________________________________
Nominal Capacity: ________ (Btu/h) Supply Temp. ______ (oF) Return Temp. ______ (oF)
Low Grade Heat loop
Describe: _______________________________________________________________________
Nominal Capacity: ________ (Btu/h) Supply Temp. ______ (oF) Return Temp. ______ (oF)
Chilling loop
Describe: _____________________________________________________________________
Nominal Capacity: ________ (Btu/h) Supply Temp. ______ (oF) Return Temp. ______ (oF)
Other loop(s): Describe: _____________________________________________________
Nominal Capacity: ________ (Btu/h) Supply Temp. ______ (oF) Return Temp. ______ (oF)
Parasitic Loads
Enter nameplate horsepower and estimated power consumption. Check whether internal or external. Internal parasitic loads are on the DG-side of the power meter. External parasitic loads are connected outside the system such that the energy production power meter does not measure their effects on net DG power generation. Additional power meters or procedures are required to quantify external parasitic loads.
Description kW, A, or hp
Internal (b)
External (b)
CHP heat transfer fluid pump, one per CHP module n/a b generator / electronics coolant pump, one per CHP module n/a b
generator / electronics coolant pump, 2 incl. spare 0.5 hp b generator / electronics coolant air handling unit 6.5 A b CHP heat transfer fluid pump to chillers, 2, incl. spare 5 hp b CHP heat transfer fluid pump to DHW and hydronic heating, 2, incl. spare 15 hp b energy rejection circulation pump, 2, incl. spare 3 hp b energy rejection air handling unit 25 hp b control systema 0.5 kW b aTo be manually logged with clamp-type real power meter (see field book). Datalogger or power meters will log all other parasitic loads.

Final July, 2008
Appendix A2. Power Meter Commissioning Procedure
1. Obtain and read the power meter installation and setup manual. It is the source of the items
outlined below and is the reference for detailed information.
2. Verify that the power meter calibration certificate, CT manufacturer’s accuracy certification, supplementary instrument calibration certificates, and supporting data are on hand.
3. Mount the power meter in a well-ventilated location free of moisture, oil, dust, corrosive vapors, and excessive temperatures.
4. Mount the ambient temperature sensor near to but outside the direct air flow to the DG combustion air inlet plenum but in a location that is representative of the inlet air. Shield it from solar and ambient radiation.
5. Mount the ambient pressure sensor near the DG but outside any forced air flows. Note: This test will use the Horiba OBS-2200 ambient pressure sensor.
6. Ensure that the fuel consumption metering scheme is in place and functioning properly.
7. Verify that the power meter supply source is appropriate for the meter (usually 110 VAC) with the DVM and is protected by a switch or circuit breaker.
8. Connect the ground terminal (usually the “Vref” terminal) directly to the switchgear earth ground with a dedicated AWG 12 gauge wire or larger. Refer to the manual for specific instructions.
9. Choose the proper CTs for the application. Install them on the phase conductors and connect them to the power meter through a shorting switch to the proper meter terminals. Be sure to properly tighten the phase conductor or busbar fittings after installing solid-core CTs.
10. Install the voltage sensing leads to each phase in turn. Connect them to the power meter terminals through individual fuses.
11. Trace or color code each CT and voltage circuit to ensure that they go to the proper meter terminals. Each CT must match its corresponding voltage lead. For example, connect the CT for phase A to meter terminals IA1 and IA2 and connect the voltage lead for phase A to meter terminal VA.
12. Energize the power meter and the DG power circuits in turn. Observe the power meter display (if present), datalogger output, and personal computer (PC) display while energizing the DG power circuits.
13. Perform the power meter sensor function checks. Use the DVM to measure each phase voltage and current. Acquire at least five separate voltage and current readings for each phase. Enter the data on the Power Meter Sensor Function Checks form and compare with the power meter output as displayed on the datalogger output (or PC display), power meter display (if present), and logged data files. All power meter voltage readings must be within 2% of the corresponding digital volt meter (DVM) reading. All power meter current readings must be within 3% of the corresponding DVM reading.
14. Verify that the power meter is properly logging and storing data by downloading data to the PC and reviewing it.
A-3

Final July, 2008
Appendix A2a. Power Meter Sensor Function Checks
Project Name: NYSERDA Tecogen 12494.02 Location (city, state): Verona, NY
Date: Signature:
DUT Description: Tecogen CM-100 IC engine CHP Power output
Nameplate kW: 100 Expected max. kW: 100; 110 kVA peaking at unit
Type (delta, wye): Wye Voltage, Line/Line: 480 Line/Neutral: 277
Power Meter Mfr:________________________ Model:__________________ Serial No.: ________________
Last NIST Cal. Date: ____________________
Current (at expected max. kW):121; 130 kVA peaking Conductor type & size: 3/0 ≈0.65” at unit; 600 MCM ≈ 1.14” at bus
Current Transformer (CT) Mfg: FlexCore Model: 606-201 at unit; 606-1000 at bus
CT Accuracy: (0.3 %, other): __________ Ratio (100:5, 200:5, other): 200:5 at unit; 1000:5 at bus
Sensor Function Checks
Note: Acquire at least five separate readings for each phase. All power meter voltage readings must be within 2% of the corresponding digital volt meter (DVM) reading. [ ]( ) 100*1% −= DVMPowerMeterDiff
Voltage
Date Time (24 hr)
Phase A Phase B Phase C Power Meter DVM %Diff Power
Meter DVM %Diff Power Meter DVM %Diff
Note: Acquire at least five separate readings for each phase. All power meter current readings must be within 3% of the corresponding DVM reading.
Current
Date Time (24 hr)
Phase A Phase B Phase C Power Meter DVM %Diff Power
Meter DVM %Diff Power Meter DVM %Diff
A-4

Final July, 2008
Appendix A2b. Power Meter Sensor Function Checks
Project Name: NYSERDA Tecogen 12494.02 Location (city, state): Verona, NY
Date: Signature:
DUT Description: Tecogen CM-100 IC engine CHP Parasitic loads
Nameplate kW: Expected max. kW:
Type (delta, wye): Wye Voltage, Line/Line: 480 Line/Neutral: 277
Power Meter Mfr:________________________ Model:__________________ Serial No.: ________________
Last NIST Cal. Date: ____________________
Current (at expected max. kW): 40 Conductor type & size:_
Current Transformer (CT) Mfg: FlexCore Model: 606-201
CT Accuracy: (0.3 %, other): ___0.2 %_______ Ratio (100:5, 200:5, other): 200:5
Sensor Function Checks
Note: Acquire at least five separate readings for each phase. All power meter voltage readings must be within 2% of the corresponding digital volt meter (DVM) reading. [ ]( ) 100*1% −= DVMPowerMeterDiff
Voltage
Date Time (24 hr)
Phase A Phase B Phase C Power Meter DVM %Diff Power
Meter DVM %Diff Power Meter DVM %Diff
Note: Acquire at least five separate readings for each phase. All power meter current readings must be within 3% of the corresponding DVM reading.
Current
Date Time (24 hr)
Phase A Phase B Phase C Power Meter DVM %Diff Power
Meter DVM %Diff Power Meter DVM %Diff
A-5

Final July, 2008
Appendix A3. Horiba OBS-2200 Test Run Record
Project Name: NYSERDA Tecogen 12494.02 Test_ID: CntrlTest Date: _____________ Site_ID: Madison-Oneida BOCES Equip_ID: ___________ Run_ID: ________
Name (printed): _____________________________ Signature: ______________________________
PEMS S/N:___________ Last 11-point Calibration Date: ___________ Filename: _______________________
Test Run Host facility operator name: ___________________________________
Start time (hh:mm:ss; use 24-hour clock): ______________ End time: _______________
Describe ambient conditions: ____________________________________________________________ Wind speed (estimate): ____________ Direction: ______________ Fair Overcast Precipitation IMPORTANT: Refer to the OBS-2200 “..._b.csv” worksheets after each test run for the following entries. Cell references are provided. Enter “ ” if a parameter is acceptable, “Fail” if it is unacceptable. Discuss all “Fail” entries and indicate whether the run is invalid because of them in the Notes below.
PEMS Zero and Span Drift Checks
Analyte
Cal. Gas Value and
Span (ppmv or %)
2 % of Span
if Zero drift OK
(≤ ± 2 % of span
Cells I3 : I6)
4 % of Span
if Span drift OK
(≤ ± 4 % of span
Cells J3 : J6) CO CO2 THC NOX
Parameter Criteria if OK
Allowable ambient temperature range (see _b.csv worksheet Cells M16 : EOF)
within ± 10 oF (6 oC) for Tamb ≤ 80 oF (27 oC) within ± 5 oF (3 oC) for Tamb > 80 oF (27 oC)
Allowable barometric pressure range (see _b.csv worksheet Cells N16 : EOF) within ± 1” Hg (3.4 kPa)
Allowable “Hangup” (NMHC contamination) (see _b.csv worksheet Cell Z5)
Enter expected THC concentration, ppmv as C Enter 2 % of expected concentration “Hangup must be < 2 % of expected concentration
NMHC contamination and background check ≤ 2ppmv or ≤ 2 % of conc. ΔP line leak check must be stable for 15 seconds at 3” H2O. Mean Pbar within ± 1.0” Hg of mean for all test runs. Mean Tamb within ± 10 oF of mean for all test runs if Tamb is < 80 oF. Mean Tamb within ± 5 oF of mean for all test runs if Tamb is ≥ 80 oF. Drift = (Post-test span minus Pre-test span); must be ≤ 4.0 %. Notes: _____________________________________________________________________________ _______________________________________________________________________________________________________________________________________________________________________________________________________________________________________________________________
A-6

Final July, 2008
Appendix A4: Load Test Run Log Project Name: NYSERDA Tecogen 12494.02 Location (city, state): Verona, NY
Date: Signature:
SUT Description: Tecogen CM-100 IC engine CHP Run ID: Load Setting: %_____ kW_____ Clock synchronization performed (Initials): Run Start Time:_____ End Time:________ Data file names/locations (incl. path): File:_______________________________________________________ IMPORTANT: For ambient temperature and pressure, record one set of readings at the beginning and one at the end of each test run. Also record at least two sets of readings at evenly spaced times throughout the test run.
B3-1. Ambient Temperature and Pressure Time (24-hr) Amb. Temperature,
oF Ambient Pressure
“ Hg PSIA = “ Hg * 0.491
Average
Permissible Variations 1. Each observation of the variables below should differ from the average of all observations by less than the maximum
permissible variation. 2. Acquire kW and Power Factor data from the power meter data file at the end of the test run. Transfer fuel flow data
from the Fuel Flow Log form. Obtain ambient temperature and pressure from Table A3-2 below. Obtain gas temperature and pressure from Appendix B4.
3. Choose the maximum or minimum with the largest difference compared to the average for each value. 4. Use the maximum or minimum to calculate the %Diff for kW, Power Factor, Fuel Flow, and Ambient Pressure:
( 100*% )(Average
AverageMaxorMinDiff −= ) Eqn. B3-1 5. For Ambient Temperature, Difference = (Max or Min)-Average
Variable Average Maximum Minimum %Diff or
Difference Acceptable? (see below)
Ambient air temperature
Ambient pressure Fuel flow Power factor Power output (kW) Gas pressure Gas temperature
Permissible Variations Measured Parameter MTG Allowed Range IC Generator Allowed Range
Ambient air temperature ± 4 oF ± 5 oF Ambient pressure (barometric station pressure)
± 0.5 % ± 1.0 %
Fuel flow ± 2.0 %a n/a Power factor ± 2.0 % n/a Power output (kW) ± 2.0 % ± 5.0 % Gas pressure n/a ± 2.0 %b Gas temperature n/a ± 5 oFb aNot applicable for liquid-fueled applications < 30 kW. bGas-fired units only
A-7

Final July, 2008
Appendix A5: Fuel Consumption Determination
Project Name: NYSERDA Tecogen 12494.02 Location
(city, state): Verona, NY Date: Signature:
Test Description: Tecogen CM-100 CHP Run_ID: Load kW:
Meter A Mfg: Model: S/N: This procedure assumes that the 11M roots meter odometer resolution is 1 scf. This means that the meter reading error will be ± 1 scf. Use the following time durations between each meter reading to ensure that the relative meter reading error will be approximately ± 1.0 % throughout the operating range.
Time duration between each odometer reading depends on the CHP array power setting as follows:
# of CHP modules online
Nom. kW Nom. scfm Minutes between readings
used for this
run 1 50 - 100 11 - 21 8 - 4 2 200 43 3 3 300 64 2 4 400 85 1 5 500 107 1 6 600 128 1
1. Start the test run by logging an initial gas meter reading and the exact time of day to 1 seconds. The initial reading consists of the last 3 or 4 odometer digits. The last digit to the right on the meter reads as “0.01” Ccf. This means that each integer reading amounts to 1 scf. The odometer wheel to the right of the last digit has a hash mark which, when it passes by the window, indicates the exact instant of the integer reading. Log that time of day by holding a timepiece next to the odometer and watching for the hash mark. Try to be as consistent as possible in determining where the hash mark crosses the window. 2. Observe the timepiece according to the interval specified in the table above. Log the exact time of day, to 1 seconds, and the meter integer reading when hash mark crosses the window. 3. Continue until at least 7 complete readings (including the first reading) have been collected. 4. Perform the calculations as indicated.
Ref. (n) Odometer (scf)
Time (mm:ss.s)
Time (decimal minutes)
Gas Used (scf) (Odmn - Odmn-1)
Elapsed Time (Timen - Timen-1)
Rate (scfm) (Gas Used / Elapsed Time)
1 (initial) 2 3 4 5 6 7 8 Average Standard Dev. COV (Std.Dev / Avg)
A-8

Final July, 2008
Appendix A6: Fuel Sampling Log IMPORTANT: Use separate sampling log and Chain of Custody forms for each sample type (gas fuel, liquid fuel, heat transfer fluid). Project Name: NYSERDA Tecogen 12494.02 Location (city, state): Verona, NY
Date: Signature:
SUT Description: IC engine CHP array Run ID: Load Setting: %_____ kW_____
Fuel Source (pipeline, digester): pipeline
Sample Type (gas fuel, liquid fuel, heat transfer fluid): ___________gas fuel________________________ Fuel Type (natural gas, biogas, diesel, etc.):___________________natural gas__________________________ Note: Obtain fuel gas sample pressure and temperature from gas meter pressure and temperature sensors or sampling equipment.
Gas Fuel Samples Date 24-hr
Time Run ID Canister
ID Initial
Vacuum, “ Hg
Sample Pressure (from gas meter
pressure sensor or sampling train pressure gage)
Sample Temperature (from gas meter
temperature sensor or estimated)
A-9

Final July, 2008
Appendix A7: Sample Chain-of-Custody Record
Important: Use separate Chain-of-Custody Record for each laboratory and/or sample type. Project Name: NYSERDA Tecogen 12494.02 Location (city, state): Verona, NY
Test Manager/Contractor____Southern Research Institute Phone:_919.282.1050 Fax:_919.282.1060___ Address: ____5201 International Drive___ City,State / Zip: ___Durham, NC 27712_____________ Originator’s signature: Unit description: MTG array Sample description & type (gas, liquid, other.):
Laboratory: Empact Analytical Phone: 303.637.0150 Fax: 303.637.7512 Address: 365 S. Main City: Brighton State: CO Zip: 80601
Run ID Bottle/Canister ID Sample Pressure Sample Temp. or TAvg, (°F) Analyses Req’d
ASTM D1945, D3588 Relinquished by: Date: Time: Received by: Date: Time: Relinquished by: Date: Time: Received by: Date: Time: Relinquished by: Date: Time: Received by: Date: Time: Notes: (shipper tracking #, other) ____________________________________________________________________________________________________________________________________________________________________________________________________________________________________________________________________________________________________________________________________________________________________________________________________________
A-10

Final July, 2008
A-11
[blank page]
Final July, 2008
Appendix B Tecogen CM-100 Specifications
B-1

Final July, 2008
B-2
Appendix B, Continued Tecogen CM-100 Specifications