final indigenous students in assad 2008 · use of tobacco, alcohol, and over-the-counter and...
TRANSCRIPT
Use of tobacco, alcohol, and over-the-
counter and illicit substances among Indigenous students participating in the Australian Secondary Students Alcohol and Drug Survey 2008
Report
Report prepared for:
Drug Strategy Branch
Australian Government Department of Health and Ageing
Report prepared by:
Geoff Smith
Victoria White
February 2010
Centre for Behavioural Research in Cancer
Cancer Control Research Institute
The Cancer Council Victoria


Acknowledgments:
The Centre for Behavioural Research in Cancer at The Cancer Council Victoria gratefully
acknowledges the cooperation and assistance of the following people and organisations in
the running of this survey:
All of the students who participated in the survey:
Staff of the participating schools
State Departments of Education
State and Diocese Catholic Education Offices
State Associations of Independent Schools
The following organisations helped fund and organise the smooth running of the survey in
their individual States or Territories:
ACT Health, Epidemiology Branch, Population Health Division
Australian Government Department of Health and Ageing
The Cancer Council South Australia
The Cancer Council Tasmania
The Cancer Council Victoria
Drug and Alcohol Services Council, SA
Department of Education, Tasmania
Department of Human Services, Victoria - Drug Treatment Services,
Population Health Unit, Department of Health and Human Services, Tasmania
Premier’s Physical Activity Council, Tasmania,
Health Department of Western Australia – Monitoring, Evaluation and Research Branch,
Drug and Alcohol Office
Northern Territory Government, Department of Health and Community Services-Alcohol
and Other Drugs Program
NSW Health Department, Health Survey Program, Centre for Epidemiology and Research
Queensland Cancer Fund
Queensland Health
The following people co-ordinated the survey in their State or Territory and/or organised
data collection:
Simeon Jones, Samantha Williams, The Cancer Council South Australia
Cathy Baker, Epidemiology Branch, Population Health Division, ACT Health
Margo Barr and Matthew Gorringe, Health Survey Program, Centre for Epidemiology and
Research, NSW Health
Chris Moon and Tania Davison, Alcohol and Other Drugs Program, NT Department of
Health and Community Services
Catherine McGregor and Rachelle Kalic, Monitoring, Evaluation and Research Branch,
Drug and Alcohol Office, Western Australia
Glen Paley and Kay Gunn, The Cancer Council Tasmania
Jenny Madden and David Knobel, Community Solutions, Queensland
Ron Clarke, McNair Ingenuity Research, NSW
Jeanette McQueen, Savant Surveys and Strategies Western Australia
Suzanna Vidmar, Clinical Epidemiology and Biostatistics Unit, Royal Children’s Hospital,
Victoria, advised on all aspects of sampling.
Thanks also to all the research assistants who administered the survey to students
throughout Australia.


Substance use among Indigenous Australian secondary school students 2008
Table of Contents
Executive Summary 1
1. Introduction 4
The Australian Secondary Students’ Alcohol and Drug Survey
(ASSAD): Indigenous Students...................................................... 4
2. Method 5
2.1 Sample selection......................................................................... 5
2.2 Procedure .................................................................................. 6
2.3 Questionnaire............................................................................. 6
2.3.1 Aboriginal and Torres Strait Islander Status..................................... 6
2.3.2 Tobacco Questions ...................................................................... 6
2.3.3 Alcohol Questions........................................................................ 6
2.3.4 Licit and Illicit Drug Questions ....................................................... 7
2.4 Coding and editing of data ............................................................ 7
2.5 Sample size and comparison of the two samples............................... 7
2.6 Data analyses: ........................................................................... 8
2.7 Definitions of substances ............................................................ 10
2.8 Definitions of frequency of use of different substances..................... 11
2.8.1 Tobacco................................................................................... 11
2.8.2 Alcohol use .............................................................................. 11
2.8.3 Drug use ................................................................................. 11
3. Tobacco use by Indigenous students,
participating in ASSAD 2008 13
3.1 Tobacco use among Indigenous students ...................................... 13
3.2 How easy do Indigenous students think it is to purchase
cigarettes?............................................................................... 14
3.3 How likely are Indigenous students to smoke in the next
year? 15
3.4 Indigenous Students’ Ability to Purchase Cigarettes ........................ 16
4. Alcohol use by Indigenous students, participating
in ASSAD 2008 17
4.1 Alcohol use by Indigenous students in 2008................................... 17
4.2 Types of alcohol consumed by current drinkers (drank in past
7 days) ................................................................................... 18
4.3 Indigenous students’ access to Alcohol ......................................... 19
4.4 Where do Indigenous students drink alcohol?................................. 20
4.5 Adult supervision of drinking ....................................................... 20

Substance use among Indigenous Australian secondary school students 2008 ii
5. Use of over the counter and illicit substances
among Indigenous secondary students
participating in ASSAD 2008 21
5.1 Analgesics ............................................................................... 21
5.2 Tranquillisers............................................................................ 24
5.3 Cannabis ................................................................................. 25
5.3.1 Location of cannabis use ............................................................ 26
5.3.2 Method of cannabis use.............................................................. 26
5.3.3 Use of other substances while using cannabis ................................ 27
5.4 Inhalants ................................................................................. 28
5.5 Hallucinogens ........................................................................... 29
5.5.1 Use of other substances while using hallucinogens .......................... 30
5.6 Amphetamines ......................................................................... 31
5.6.1 Use of other substances while using amphetamines ........................ 32
5.7 Steroids................................................................................... 33
5.8 Opiates ................................................................................... 34
5.9 Cocaine ................................................................................... 35
5.10 Ecstasy ................................................................................... 36
5.10.1 Use of other substances while using ecstasy .................................. 37
5.11 Use of Any Illicit Substance......................................................... 38
References 40
Appendix 1: Questionnaire 41
Appendix 2: Data matters 57
Appendix 3: 95% Confidence intervals 58

Substance use among Indigenous Australian secondary school students 2008 1
Executive Summary
Substance use among Indigenous students participating in the
2008 Australian Secondary Students Alcohol and Drug Survey
The 2008 Australian Secondary Students Alcohol and Drug (ASSAD) Survey was conducted
during the academic school year of 2008. The ASSAD survey targets students in
mainstream schools in all states and territories in Australia. Within each state and territory,
schools are randomly selected within the three main education sectors. Around 24,000
secondary students aged between 12 to 17 years from 381 secondary schools completed
the 2008 survey, answering questions about their lifetime and current use of tobacco,
alcohol, analgesics, tranquillisers and illicit substances. Research assistants administered
the survey to the randomly selected students on the school premises and students
answered the questionnaire anonymously.
In 2008, students from an additional 19 schools from rural areas in Western Australia,
Queensland, South Australia and the Northern Territory were also surveyed. From the 400
schools surveyed as part of the 2008 ASSAD and ASSAD Extension, 1317 students aged
between 12 and 15 years identified themselves as Indigenous Australians. This report is
based on data from this combined group of students. Prevalence estimates for the use of
the different substances by Indigenous students are presented for males, females and all
students for the age groups: 12 to 13 years, 14 to 15 years, and 12 to 15 years.
Prevalence estimates found among 12- to 15-year-olds in the main ASSAD sample are also
presented.
Tobacco
In 2008, around 35% of 12- to 15-year-old Indigenous students had smoked in their
lifetime with 15% smoking in the month before the survey and 12% smoking in the week
before the survey (current smokers). Smoking was more common among Indigenous
students than 12- to 15-year-olds in the main ASSAD sample (Never Smoked: Difference =
13.7%; 95% CI = 11.0% to 16.4%).
Seventy percent of all Indigenous students surveyed did not think they would be smoking
in 12 months time. Among Indigenous students who were current smokers, 49% thought it
was likely or certain they would be smoking in 12 months time, a proportion similar to the
46% of current smokers in the main ASSAD sample.
Alcohol
The proportion of Indigenous students aged 12 to 15 years who had never tried alcohol
(27%), was higher than the proportion found for 12- to 15-year-olds (22%) in the main
ASSAD sample (Difference 5.6%; 95% CI = 3.1% to 8.1%).
Over half of the Indigenous students (55%) consumed alcohol in the year prior to the
survey, with 35% consuming alcohol in the previous month. A higher proportion of
Indigenous students (23%) reported consuming alcohol in the week before the survey.
than the proportion found in the main ASSAD sample (17%) (Difference = 5.9%; 95% CI
= 3.6% to 8.2%).

Substance use among Indigenous Australian secondary school students 2008 2
The most commonly consumed drinks among Indigenous students were spirits (44%) and
premixed spirits (29%). These were also the most common drinks among students in the
main ASSAD sample. Drinking spirits was more common among Indigenous current
drinkers than current drinkers in the main ASSAD sample (Difference = 13%; 95%; CI =
7.3% to 18.7%).
Parents and friends were the main source of alcohol for both Indigenous current drinkers
and those in the main ASSAD sample. For Indigenous students, alcohol was mainly
consumed at home (30%) or at a party (29%) again this was a similar finding to that in
the main ASSAD sample.
Over-the-counter and illicit substances
Analgesics: Students were asked about use of analgesics. Analgesics were the most
commonly used substance (licit or illicit) among Indigenous students. Among 12- to 15-
year-olds, 89% of Indigenous students had used an analgesic at some time, lower than the
95% in the main ASSAD sample (Difference = 5.6%; 95% CI = 3.9% to 7.3%). Sixty-
seven percent of Indigenous students had used analgesics in the four weeks prior to the
survey, and 43% had used analgesics in the week prior to the survey. The main reasons
for using analgesics were headaches/migraine, and parents were the most common source
of analgesics for all students.
Tranquillisers: Use of tranquillisers other than for medical reasons among Indigenous
students was low, with 80% never having used tranquillisers. Around 9% of Indigenous
students aged 12 to 15 years had used tranquillisers in the month prior to the survey.
Cannabis: Cannabis was the most commonly used illicit substance among Indigenous
students, with 20% of students aged between 12 and 15 years reporting the use of
cannabis at some time in their life. This was higher than the proportion of 12- to 15-year-
old students in the main ASSAD sample reporting ever having used cannabis (9%)
(Difference = 10.1%; 95% CI = 7.9% to 12.3%). Around 10% of Indigenous students
aged 12 to 15 years had used cannabis in the month before the survey. Cannabis use was
greater among Indigenous 14- to 15-year-olds than Indigenous 12- to 13-year-olds
(p<.01). The main place for consuming cannabis was at a friend’s place and smoking a
bong or a pipe was the most common way of using cannabis.
Inhalants: Around 24% of Indigenous students aged 12 to 15 years had ever used
inhalants with 18% using inhalants in the previous year and 13% in the previous month.
Prevalence of inhalant use was similar among 12- to 13-year-olds and 14- to 15-year-olds.
Hallucinogens: Five percent of Indigenous students aged 12- to 15-years reported some
experience with hallucinogens, compared with 2% of students in the main ASSAD sample
(Difference = 2.7%; 95% CI = 1.5% to 3.9%). Ever use increased with age, rising from
3% of 12- to 13-year-olds to 8% of 14- and 15-year-olds (p<.01).
Amphetamines: The majority (92%) of Indigenous students aged 12- to 15-years had
never used amphetamines. Lifetime use increased with age and among 14- to 15-year-
olds, 12% reported having had some experience with amphetamines. Around 5% of 12- to
15-year-old Indigenous students reported using amphetamines in the month before the
survey.
Steroids: Steroid use without a doctor’s prescription was very uncommon, with only around
7% of Indigenous students aged 12 to 15 years reported having ever used these
substances.
Substance use among Indigenous Australian secondary school students 2008 3
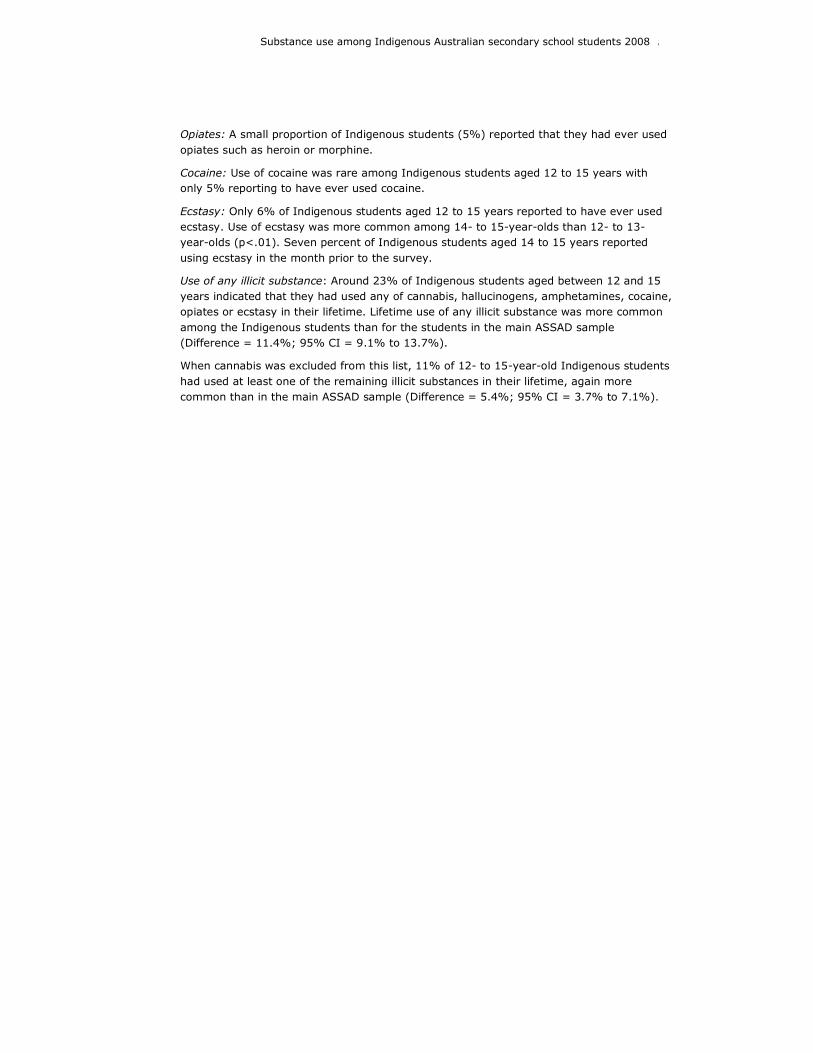
Opiates: A small proportion of Indigenous students (5%) reported that they had ever used
opiates such as heroin or morphine.
Cocaine: Use of cocaine was rare among Indigenous students aged 12 to 15 years with
only 5% reporting to have ever used cocaine.
Ecstasy: Only 6% of Indigenous students aged 12 to 15 years reported to have ever used
ecstasy. Use of ecstasy was more common among 14- to 15-year-olds than 12- to 13-
year-olds (p<.01). Seven percent of Indigenous students aged 14 to 15 years reported
using ecstasy in the month prior to the survey.
Use of any illicit substance: Around 23% of Indigenous students aged between 12 and 15
years indicated that they had used any of cannabis, hallucinogens, amphetamines, cocaine,
opiates or ecstasy in their lifetime. Lifetime use of any illicit substance was more common
among the Indigenous students than for the students in the main ASSAD sample
(Difference = 11.4%; 95% CI = 9.1% to 13.7%).
When cannabis was excluded from this list, 11% of 12- to 15-year-old Indigenous students
had used at least one of the remaining illicit substances in their lifetime, again more
common than in the main ASSAD sample (Difference = 5.4%; 95% CI = 3.7% to 7.1%).

Substance use among Indigenous Australian secondary school students 2008 4
1. Introduction
The Australian Secondary Students’ Alcohol and Drug Survey
(ASSAD): Indigenous Students
The 2008 Australian Secondary Students’ Alcohol and Drug Survey (ASSAD) is the ninth in
a series of triennial national surveys of secondary school students’ use of tobacco and
alcohol conducted since 1984. In 1996, the survey was expanded to include questions on
the use of illicit substances and federal, state and territory health departments became
collaborators in the project. The ASSAD study was designed to provide estimates of the
current prevalence of use of tobacco, alcohol and illicit substances among Australian
secondary school students and to examine trends in substance use among this group.
The design of the 2008 ASSAD survey was the same as that used in previous ASSAD
studies. The study sampled secondary schools throughout Australia and within these
schools surveyed a sample of students. Students from the three main education sectors
participated in the survey. As schools were used to sample adolescents, those who have
left school are not included in the survey. About 24,000 secondary students aged 12 to 17
completed the survey in 2008.
The numbers of students surveyed in the ASSAD study are sufficient to allow age-and
gender-specific estimates at a national and state level. As the student population in each
state or territory is largely concentrated around the capital city, most students currently
surveyed are drawn from schools in metropolitan areas. This means that the study is less
able to determine reliable estimates of substance use among groups of students that
predominantly reside in rural areas of Australia. To address this, funding was received from
the Commonwealth Department of Health and Ageing in the middle of 2008 to increase the
number of students aged 12 to 15 years from rural areas in Australia participating in the
ASSAD survey. The schools and students surveyed as part of this extra funding are
referred to as the ASSAD extension sample.
As the ASSAD study has surveyed a random sample of students from a random sample of
school students, Indigenous students at secondary schools may be selected to be part of
the study sample. Around 3-4% of students participating in previous ASSAD surveys have
self-identified as being of Aboriginal or Torres Straight Islander descent. This is similar to
the proportion of Indigenous students in secondary schools throughout Australia (ABS,
2009). As a consequence of increasing the number of students from rural communities in
the ASSAD survey, the number of Indigenous students participating in the survey also
increased. This increase enables a greater exploration of substance use among Indigenous
students participating in the ASSAD study.
In this report we combine data from the main ASSAD sample and the ASSAD extension
sample to examine the prevalence of use of tobacco, alcohol, over the counter and illicit
substances among Indigenous students aged 12 to 15 years participating in the national
ASSAD study.

Substance use among Indigenous Australian secondary school students 2008 5
2. Method
2.1 Sample selection
As indicated, the data reported here are drawn from the main ASSAD survey and the
ASSAD extension survey. Details of the sampling procedures for the main ASSAD survey
are reported in detail elsewhere (White and Smith, 2009). In brief, the basic sampling
design was a stratified two-stage probability sample, with schools selected at the first
stage and students at the second. Sampling occurred at the beginning of the year in which
the survey was conducted. Schools were randomly sampled from the three main education
sectors within each Australian state and territory to ensure proportional representation.
Principals of selected schools gave permission to conduct the survey. When a school
refused participation, the school located nearest to it, within the same education sector,
replaced it. In general researchers randomly selected a total of 80 students from across
predetermined Year levels for survey participation. Sampling was conducted using the
school rolls for the targeted year levels (either Years 7-10) or Years 11 and 12). In New
South Wales and in a small number of schools in other states and territories, rather than
selecting a random sample of students, intact classes of students were randomly selected
within the required year levels. Only classes where students were not selected on any
ability or performance measures were included in this process. A total of 381 secondary
schools participated in the main ASSAD survey and students from year levels 7 to 12 were
surveyed.
Sample selection for the ASSAD Extension survey occurred in the second half of the 2008
school year. Due to this later timing Tasmania and NSW declined to participate in the
ASSAD Extension sample. The ACT did not participate in the ASSAD extension survey as all
schools had been previously selected for the main ASSAD study or another national study
that was in the field in 2008.
The target population for the ASSAD Extension survey was all students in Years 7 to 10 in
secondary schools from the three main education sectors in Victoria, Queensland, Western
Australia, South Australia and Northern Territory. Within each jurisdiction, schools catering
for special populations, schools with fewer than 50 students and schools in very remote
regions according to the Australian Bureau of Statistics Accessibility/Remoteness Index of
Australia (ABS, 2001) were ineligible for study participation. Student population estimates
were based on the most up-to-date figures available from state and federal education
departments at the time.
Principals of selected schools were contacted and gave permission to conduct the survey
within their school. To maximize the number of students participating in the ASSAD
extension study, schools were asked to allow surveying of two classes from each year level
(Years 7 to 10). In these schools only classes where students were not grouped by any
measure of ability were selected for surveying forty-eight secondary schools and relevant
feeder primary schools (to survey Year 7 students in Western Australia, South Australia,
and Queensland) were approached to take part in the study at the beginning of the 4th
school term. Nineteen schools (and four feeder primary schools) agreed to allow
participation by one or two classes from each year level rather than all students. The most
common reasons for not participating were the late timing of the invitation or the school
having participated in previous surveys in that school year.
All surveying took place in the 2008 academic school year.
Substance use among Indigenous Australian secondary school students 2008 6
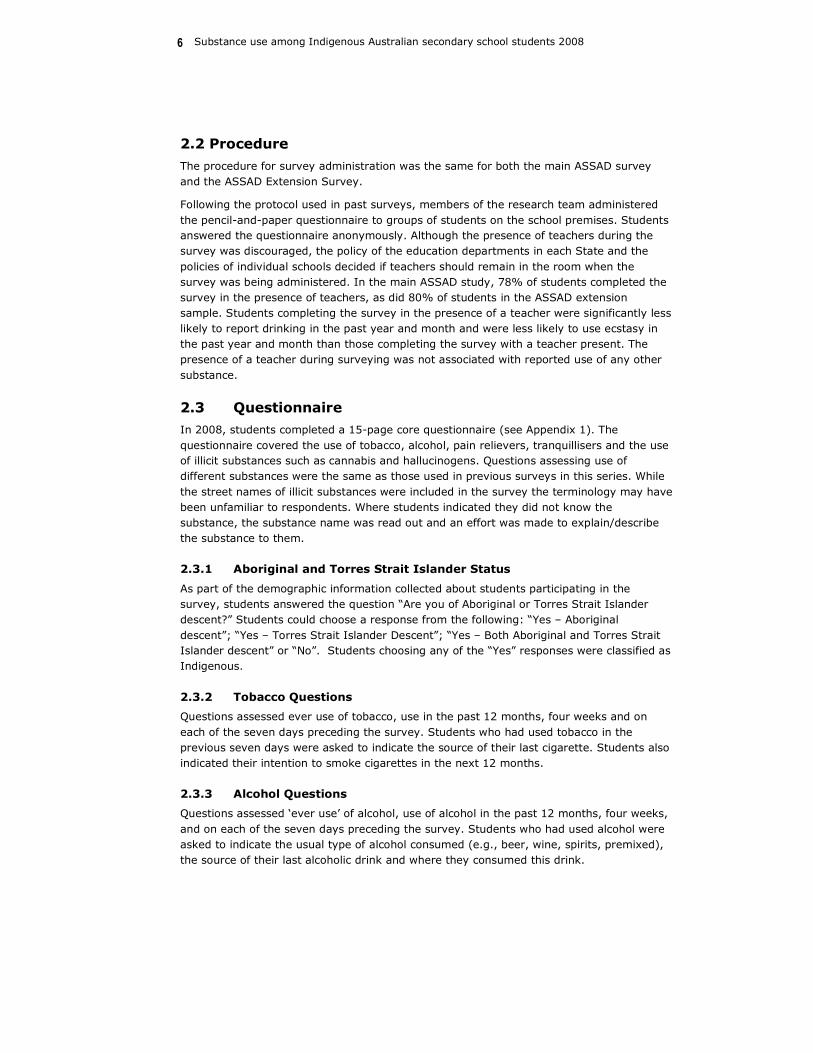
2.2 Procedure
The procedure for survey administration was the same for both the main ASSAD survey
and the ASSAD Extension Survey.
Following the protocol used in past surveys, members of the research team administered
the pencil-and-paper questionnaire to groups of students on the school premises. Students
answered the questionnaire anonymously. Although the presence of teachers during the
survey was discouraged, the policy of the education departments in each State and the
policies of individual schools decided if teachers should remain in the room when the
survey was being administered. In the main ASSAD study, 78% of students completed the
survey in the presence of teachers, as did 80% of students in the ASSAD extension
sample. Students completing the survey in the presence of a teacher were significantly less
likely to report drinking in the past year and month and were less likely to use ecstasy in
the past year and month than those completing the survey with a teacher present. The
presence of a teacher during surveying was not associated with reported use of any other
substance.
2.3 Questionnaire
In 2008, students completed a 15-page core questionnaire (see Appendix 1). The
questionnaire covered the use of tobacco, alcohol, pain relievers, tranquillisers and the use
of illicit substances such as cannabis and hallucinogens. Questions assessing use of
different substances were the same as those used in previous surveys in this series. While
the street names of illicit substances were included in the survey the terminology may have
been unfamiliar to respondents. Where students indicated they did not know the
substance, the substance name was read out and an effort was made to explain/describe
the substance to them.
2.3.1 Aboriginal and Torres Strait Islander Status
As part of the demographic information collected about students participating in the
survey, students answered the question “Are you of Aboriginal or Torres Strait Islander
descent?” Students could choose a response from the following: “Yes – Aboriginal
descent”; “Yes – Torres Strait Islander Descent”; “Yes – Both Aboriginal and Torres Strait
Islander descent” or “No”. Students choosing any of the “Yes” responses were classified as
Indigenous.
2.3.2 Tobacco Questions
Questions assessed ever use of tobacco, use in the past 12 months, four weeks and on
each of the seven days preceding the survey. Students who had used tobacco in the
previous seven days were asked to indicate the source of their last cigarette. Students also
indicated their intention to smoke cigarettes in the next 12 months.
2.3.3 Alcohol Questions
Questions assessed ‘ever use’ of alcohol, use of alcohol in the past 12 months, four weeks,
and on each of the seven days preceding the survey. Students who had used alcohol were
asked to indicate the usual type of alcohol consumed (e.g., beer, wine, spirits, premixed),
the source of their last alcoholic drink and where they consumed this drink.

Substance use among Indigenous Australian secondary school students 2008 7
2.3.4 Licit and Illicit Drug Questions
A wide range of licit and illicit drugs represented in the questionnaire, includes analgesics,
tranquillisers, cannabis, amphetamines, inhalants and steroids for each substance, the
technical name was used in the question and was accompanied by explanations, examples
and alternative terminology to clarify what substance was included in that category. The
substances covered were analgesics, sedatives, cannabis, steroids, inhalants,
amphetamines, ecstasy, cocaine, opiates and hallucinogens.
For each substance, students were asked to indicate the number of times, if ever, they had
used or taken the substance in four time periods: the past week, the past four weeks, the
past year, and their lifetime. Students could choose from seven response categories
ranging from ‘None’ to ‘40 or more times’. The questions concerning the use of sedatives,
steroids, amphetamines and opiates explicitly asked about the non-medical use of these
substances.
Students were asked to indicate the reasons for using their last analgesic and how they
obtained this analgesic. Students who had used cannabis, amphetamines, ecstasy and
hallucinogens in the past year were asked if they had used any other substance(s) on the
same occasion as using these substances. Students indicated the substances they had used
from a list that included alcohol, tobacco, analgesics, cannabis, amphetamines and
hallucinogens. Students who had not used any other substances could indicate this
response from the list.
Students who had used cannabis in the 12 months preceding the survey were asked to
indicate where they usually used cannabis and how it was usually used (eg, joint, bong, as
food or other).
To reduce order effects, two versions of the questionnaire were used. The first version had
alcohol-related questions first; the second had smoking-related questions first. Questions
regarding other drug use always followed both the alcohol and tobacco sections.
2.4 Coding and editing of data
For both the main ASSAD study and the ASSAD Extension sample, the Centre for
Behavioural Research in Cancer at The Cancer Council Victoria catalogued questionnaires
from all States. Questionnaires were scanned and converted into a data file, and a
commercial market research firm cleaned data according to rules established by the
researchers and employed for previous ASSAD surveys. Students with a large amount of
missing data, or whose responses were wildly exaggerated, were removed from the data
set before analyses started.
Details regarding the cleaning procedures followed are given in Appendix 2.
2.5 Sample size and comparison of the two samples
The students self-identifying as being of Aboriginal or Torres Straight Islander descent in
the ASSAD Extension Survey were combined with those self-identifying as being of
Aboriginal or Torres Straight Islander descent from the main ASSAD study for this report. A
total of 1468 Indigenous students in Year levels 7 to 10 participated in the two ASSAD
surveys in 2008, and comprise the combined Indigenous sample. Where this report refers
to ‘Indigenous students’ it is the combined Indigenous sample being considered. Results
from the combined Indigenous sample are compared with findings from students
participating in only the main ASSAD study. Students aged 12 to 15 years who were
surveyed as part of the main ASSAD study are referred to as the main ASSAD sample.

Substance use among Indigenous Australian secondary school students 2008 8
Table 2.1 presents the number of Indigenous students in each gender and age group
between 12 and 15 years. Data from 159 students outside this age range were excluded
from analyses. Of the 12- to 15-year-old students in the combined Indigenous sample,
1010 were from the main ASSAD sample and 307 were from the ASSAD Extension survey.
Table 2.1: Number of Indigenous students participating in the combined Indigenous sample
in 2008, by age and gender
Age
12 13 14 15 12–15
Male 90 179 200 175 644
Female 97 213 205 158 673
Total 187 392 405 333 1317
Given the aim of the ASSAD Extension survey was to survey more students from rural
areas of Australia, 96% of the Indigenous students in the ASSAD Extension survey resided
in rural areas. In the main ASSAD sample 66% of students identifying as Indigenous
indicated they resided in rural areas of Australia. We compared the socio-economic level of
Indigenous students from rural areas participating in the main ASSAD sample and the
ASSAD Extension using the area-based Index of Relative Socio-Economic Disadvantage
(IRSD) (ABS, 2003). The Australian Bureau of Statistics determines the IRSD from 20
direct or indirect indicators of disadvantage obtained from census data. Indicators include
the proportion of: unemployed males and females, one-parent families with dependent
children, people over 15 with no qualifications, households renting etc. A score reflecting
the degree to which that area is disadvantaged is given to each area. High scores reflect
higher levels of disadvantage. A score for each postcode area in Australia has been
developed using data from the 2006 census and we matched this score to the postcode
each student reported residing in. The average IRSD for rural students aged 12 to 15
years in the main ASSAD sample and the ASSAD Extension survey are shown in Table 2.2.
Table 2.2: Mean IRSD (Index of Relative Socio-economic Disadvantage) scores for Indigenous students residing in rural areas by survey
ASSAD
Main Extension All
Rural 925.4 937.9 929.3
While Indigenous students in the ASSAD Extension study had slightly higher mean scores
on the measure of disadvantage than Indigenous students from rural areas in the main
ASSAD sample, this difference was not statistically significant.
2.6 Data analyses:
As not all states participated in the ASSAD Extension study, the proportion of Indigenous
students from each state and territory in the combined sample is unlikely to reflect the
distribution of Indigenous students throughout Australia. To address this, data were
weighted to bring the achieved sample into line with the distribution of the population of
12- to 15-year-olds Indigenous students in secondary schools in each state and territory
throughout Australia. The prevalence estimates reported here are based on these weighted
data. Information regarding enrolment numbers of male and female Indigenous students in

Substance use among Indigenous Australian secondary school students 2008 9
each age group in the three education sectors was obtained from the Australian Bureau of
Statistics.
In this report we present the proportion of male, female and all Indigenous students in age
groups 12 to 13 years, 14 to 15 years and 12 to 15 years that have used substances in
different time periods (see section 2.8).
Respondents were not included in the analysis for a specific question if they gave
contradictory or multiple responses or did not answer the question. However, these
respondents were included in the analysis of other questions if these had been validly
completed.
As this report is based on data from a sample, it is necessary to allow for sampling error.
Prevalence estimates are provided for information, regardless of their levels of statistical
reliability for percentages or proportions, the sampling error is generally indicated by the
95% confidence interval. The 95% confidence interval is based on both the number of
students in the specific group examined (i.e. 12- to 13-year-old boys) and the percentage
reported (i.e., 15%). The confidence interval is larger when the sample size is small and
the estimate is around 50%. For this report, the largest confidence interval will be found
for 12- to 13-year-old boys as this group has the smallest sample size (n=269). The 95%
confidence interval for 12- to 13-year-old boys around an estimate of 50% is ±6.0%,
meaning that the actual percentage will be between 44.0% and 56.0%. The smallest
confidence intervals will be found for estimates among all Indigenous students aged 12 to
15 years. With a sample size of 1317, 95% confidence intervals range from ±2.7% for
estimates around 50% to ±1.6% for estimates around 10%. When interpreting results,
readers should refer to the table of confidence intervals associated with the sample size
achieved for each age and gender group (Appendix 3). The reader should be aware that
some results may be statistically indistinguishable from zero based on the 95% Confidence
Interval associated with the estimate.
In addition, caution should be used when interpreting the reported findings as they are
based on self-reported data and not empirical testing of the substance(s) used.
Given the sample size only those results associated with a p value of p<.05 were taken to
be statistically significant.
In the tables presented in Sections 3 to 5, in addition to presenting findings for the
combined Indigenous students sample, the findings from the main ASSAD sample
regarding the proportion of 12- to 15-year-old students using the different substances are
also presented. This information is presented to provide the background level of substance
use among all 12- to 15-year-old Australian secondary students in 2008. Where
proportions from the main ASSAD sample and the combined Indigenous sample are
compared, the difference in proportions and the 95% confidence intervals (95% CI) around
this difference is presented. When the 95% CIs around the difference in proportions do not
include zero, the difference is considered statistically significant at the p<.05 level.

Substance use among Indigenous Australian secondary school students 2008 10
2.7 Definitions of substances
The substance categories used in this report were identical to the categories used in the
questionnaire and follow the descriptions and examples provided to students, as follows:
Alcohol: Ordinary beer, low alcohol beer, wine, wine cooler, champagne
or sparkling wine, alcoholic apple cider, alcoholic sodas,
premixed spirits, spirits, or liqueurs.
Amphetamines: Amphetamines or speed, uppers, MDA, goey, dex, dexies,
dexamphetamine, ox blood, methamphetamine or ice, other
than for medical reasons.
Analgesics: Painkillers/analgesics such as ‘Disprin’, ‘Panadol’ or ‘Aspro’.
Cannabis: Marijuana, grass, hash, cannabis, dope, weed, mull, yarndi,
ganga, pot, a bong, or a joint.
Cocaine: Cocaine.
Ecstasy: Ecstasy or XTC, E, MDMA, ecci, X, bickies.
Hallucinogens: LSD, acid, trips, Magic Mushrooms, Datura, Angel’s Trumpet.
Inhalants: Deliberately sniffed (inhaled) from spray cans or sniffed things
like glue, paint, petrol or thinners in order to get high or for the
way it makes you feel.
Opiates: Heroin, smack, horse, skag, hammer, H, or other opiates
(narcotics) such as methadone, morphine or pethidine other
than for medical reasons.
Tobacco: Cigarettes,
Tranquillisers: Sleeping tablets, tranquillisers or sedatives such as ‘Rohies’,
‘Rohypnol’, ‘Barbs’, ‘Valium’ or ‘Serepax’, for non-medical
reasons.
Steroids: Steroids, muscle, roids or gear without a doctor’s prescription to
make you better at sport, to increase muscle size or to improve
your general appearance.

Substance use among Indigenous Australian secondary school students 2008 11
2.8 Definitions of frequency of use of different substances
2.8.1 Tobacco
Students were asked if they had smoked cigarettes in their lifetime, in the past year and
month, and were then asked to indicate the number of cigarettes smoked on each of the
seven days preceding the day of the survey.
The categories of tobacco use are:
Never: Those who had not had even a puff of a cigarette.
Year: Those who had smoked cigarettes within the past year.
Month: Those who had smoked cigarettes within the four weeks prior to
completing the survey.
Current
smokers:
Those who had smoked cigarettes within the seven days prior to
completing the survey.
2.8.2 Alcohol use
Students were asked if they had consumed alcohol in their lifetime, in the past year and
past month. They were then asked to indicate the number of alcoholic drinks they
consumed on each of the seven days preceding the day of the survey.
The categories of alcohol use are:
Never: Those who had not had even a sip of an alcoholic drink.
Year: Those who had consumed an alcoholic drink within the past year.
Month: Those who had consumed an alcoholic drink within the four
weeks prior to completing the survey.
Current
drinkers:
Those who had consumed an alcoholic drink on any of the seven
days prior to completing the survey.
2.8.3 Drug use
Students were asked how many times they had used a particular drug within specified time
periods for each substance the prevalence of use within the time periods asked about (past
week, past month, past year and lifetime) is reported.
The categories of use reported are:
Never: Those who had never used the substance.
Ever: Those who indicated any use of the substance, either in their
lifetime, the past month, or past week (ever use).
Year: Those who had used the substance within the past year.
Month: Those who had used the substance within the four weeks prior to
completing the survey.
For analgesics, tranquillisers and cannabis
Week: Those who had used the substance within the seven days prior to
completing the survey.

Substance use among Indigenous Australian secondary school students 2008 12
For all substances, these frequency of use categories are not mutually exclusive but rather
overlap so that a student who reported having used a substance in the past week was
included in the estimates of use in all other time periods, that is, in estimates for lifetime
use, use in the past year and use in the past month.

Substance use among Indigenous Australian secondary school students 2008 13
3. Tobacco use by Indigenous students,
participating in ASSAD 2008
3.1 Tobacco use among Indigenous students
Table 3.1 shows the prevalence of smoking among Indigenous secondary school students
participating in ASSAD 2008.
Table 3.1: Tobacco: Percentage of Indigenous students in each age group by gender using
tobacco in each recency category, Australia 2008
Indigenous ASSAD
12-13# %
14-15^ %
12-15† %
12-15 %
Never smoked
Male 76.8 54.4 66.0 78.2
Female 74.0 52.7 64.1 79.5
Total 75.4 53.6 65.1 78.8
Smoked in past year
Male 12.2 29.0 20.2 12.2
Female 16.3 35.6 25.4 13.7
Total 14.2 32.2 22.8 12.9
Smoked in past month
Male 7.4 20.6 13.7 6.6
Female 8.4 26.8 17.0 8.1
Total 7.9 23.6 15.3 7.3
Smoked in past week (current
smoker)
Male 4.6 19.1 11.5 4.8
Female 6.0 19.9 12.5 5.8
Total 5.3 19.5 12.0 5.3
#95% CI for Indigenous students aged 12-13 years range from a high of ± 3.5% for never smoked to a low of
±1.8% for smoking in the past week
^95% CI for Indigenous students aged 14-15 years range from a high of ± 3.6% for never smoked to a low of
±2.9% for smoking in the past week
†95% CI for Indigenous students aged 12-15 years = range from a high of ± 2.6% for never smoked to a low
of ±1.8% for smoking in the past week
See Appendix 3 for 95% Confidence Intervals estimates for different proportions for each age and gender
group.
In 2008, among 12- to 13-year-old Indigenous students, 75% had never smoked
compared with 54% among Indigenous 14- and 15-year-olds.
In all time periods, smoking was more common among Indigenous 14- to 15-year-olds
than Indigenous 12- to 13-year-olds (all p<.01).
There were no significant gender differences among Indigenous students in smoking
prevalence for any of the time periods.
The proportion of all 12- to 15-year-old Indigenous students (65%) who had never smoked
was lower than the proportion (79%) of all 12- to 15-year-olds in the main ASSAD sample
(Difference = 13.7%; 95% CI = 11.0% to 16.4%).

Substance use among Indigenous Australian secondary school students 2008 14
3.2 How easy do Indigenous students think it is to purchase
cigarettes?
All students in the ASSAD studies were asked to indicate how easy they thought it would
be for them to purchase cigarettes themselves or to get someone else to buy cigarettes for
them.
Table 3.2: Percentage of Indigenous students in each age group believing it would be easy
or very easy for them to purchase cigarettes themselves or get someone else to buy
cigarettes for them, Australia, 2008.
Indigenous ASSAD
12-13
%
14-15
%
12-15
%
12-15
%
Buy cigarettes themselves
Male 17.9 27.5 22.6 16.4
Female 11.3 16.7 13.9 12.5
Total 14.6 22.2 18.3 14.5
Get others to buy
cigarettes
Male 29.5 59.8 44.4 41.8
Female 38.1 56.6 47.0 42.9
Total 33.9 58.2 45.7 42.3
Table 3.2 shows that 18% of Indigenous students aged 12 to 15 years thought it would be
easy for them to buy cigarettes. Male Indigenous students were more likely to report that it
would be easy for them to buy cigarettes themselves than females (p<.01).
A greater proportion of Indigenous students believed it would be easy for them to buy
cigarettes, than found for all 12- to 15-year-olds in the main ASSAD sample (15%)
(Difference = 3.8%; 95% CI = 1.6% to 6.0%).
Around 46% of Indigenous students aged 12 to 15 years thought it would be very easy for
them to get someone else to buy cigarettes for them, compared with 42% of all students
aged 12 to 15 years in the main ASSAD sample (Difference = 3.4%; 95% CI = 0.6% to
6.2%).

Substance use among Indigenous Australian secondary school students 2008 15
3.3 How likely are Indigenous students to smoke in the next
year?
Students were asked ‘Do you think you will be smoking this time next year?’ and chose a
response from those listed in Table 3.3.
Table 3.3: Intention to smoke in the next 12 months among Indigenous students
participating in ASSAD, Australia, 2008#
Indigenous ASSAD
12-13
%
13-14
%
12-15
%
12-15
%
Certain not to smoke
Males 78.0 66.1 72.3 80.1
Females 73.6 61.9 68.2 76.6
Total 75.8 64.1 70.2 78.4
Unlikely/Very unlikely to smoke
Males 14.9 17.9 16.3 13.3
Females 18.0 16.9 17.5 14.8
Total 16.4 17.4 16.9 14.0
Undecided
Males 3.9 4.9 4.4 3.7
Females 4.8 10.0 7.2 4.9
Total 4.3 7.4 5.8 4.3
Likely/Very likely to smoke
Males 2.7 4.7 3.7 1.9
Females 3.1 7.7 5.2 3.2
Total 2.9 6.1 4.4 2.5
Certain to smoke
Males 0.6 6.4 3.4 1.0
Females 0.4 3.5 1.8 0.5
Total 0.5 5.0 2.6 0.8
# Percentage of students in each age group indicating each response category.
The majority of Indigenous students surveyed were certain they would not be smokers in
12 months time. More male (72%) than female (68%) students were certain they would
not be smokers in 12 months time (p<.01).
More older Indigenous students (5%) than younger Indigenous students (0.5%) were
certain they would be smokers in 12 months.

Substance use among Indigenous Australian secondary school students 2008 16
Table 3.4: Indigenous students’ intention to smoke in the next 12 months among current
smokers, Australia, 2008#
Indigenous ASSAD
12-15
%
12-15
%
Current smokers
Certain not to smoke 14.0 9.2
Unlikely/Very unlikely to smoke 18.0 19.3
Undecided 18.7 25.9
Likely/Very likely 29.4 33.5
Certain to smoke 19.9 12.1
#Base: Students who smoked in past week.
For students who smoked in the week before the survey (current smokers), Table 3.4
shows that, 14% of Indigenous current smokers reported they were certain they would not
to be smoking in 12 months time. Although this proportion was higher than that (9%)
found for current smokers in the main ASSAD sample, this difference was not statistically
significant.
The proportion of 12- to 15-year-old Indigenous students who were current smokers
reporting they were certain to be smoking (20%) in 12 months time was higher than the
proportion (12%) of all current smokers aged 12 to 15 years in the main ASSAD sample
(Difference = 7.8%; 95% CI = 1.5% to 14.1%).
3.4 Indigenous Students’ Ability to Purchase Cigarettes
Students who were current smokers were asked to report how they accessed their last
cigarette (Table 3.5).
Table 3.5: Percentage of current smokers who bought their last cigarette among 12- to 15-year-olds, 2008 (%)#
Indigenous ASSAD
12-15
%
12-15
%
Bought cigarettes
Male 13.4 12.7
Female 4.7 10.7
Total 8.8 11.6
#Base: Students who smoked in past week.
Male Indigenous students (13%) were more likely than females (5%) to report buying their
last cigarette (p<.01).
Only 9% of Indigenous students aged 12 to 15 years who were current smokers bought
their last cigarette. While this is lower than the 12% of all current smokers aged 12 to 15
years in the main ASSAD sample, this difference was not statistically significant.

Substance use among Indigenous Australian secondary school students 2008 17
4. Alcohol use by Indigenous students,
participating in ASSAD 2008
4.1 Alcohol use by Indigenous students in 2008
In this section we examine the prevalence of alcohol consumption among Indigenous
students participating in ASSAD in 2008. Table 4.1 shows the proportion of 12- to 13-year-
old, and 14- to 15-year-old Indigenous students that had never consumed alcohol, had
consumed alcohol in the past year, month and in the past week.
Table 4.1: Alcohol: Percentage of Indigenous students in each age group by gender using
alcohol in each recency category, Australia 2008
Indigenous ASSAD
12-13# %
14-15^ %
12-15† %
12-15 %
Never consumed alcohol
Male 30.8 16.2 23.8 21.4
Female 39.9 20.0 30.6 21.8
Total 35.4 18.1 27.2 21.6
Consumed alcohol in past year
Male 44.7 72.6 58.2 53.2
Female 34.1 71.5 51.5 50.8
Total 39.4 72.1 54.9 52.0
Consumed alcohol in past
month
Male 24.1 51.2 37.1 28.9
Female 18.5 47.8 32.2 27.5
Total 21.3 49.5 34.7 28.2
Consumed alcohol in past week (current drinker)
Male 15.4 30.0 22.4 17.1
Female 11.4 35.4 22.6 16.1
Total 13.4 32.6 22.5 16.6
#95% CI for Indigenous students aged 12-13 years range from a high of ± 4.0% for consumed alcohol in the
past month to a low of ±2.8% for consumed alcohol in the past week
^95% CI for Indigenous students aged 14-15 years range from a high of ± 3.6% for consumed alcohol in the
past month to a low of ±2.8% for never consumed alcohol
†95% CI for Indigenous students aged 12-15 years = range from a high of ± 2.7% for consumed alcohol in
the past year to a low of ±2.3% for consumed alcohol in the past week
See Appendix 3 for 95% Confidence Intervals estimates for different proportions for each age and gender
group.
Younger Indigenous students (35%) were significantly more likely to have never consumed
alcohol than Indigenous 14- to 15-year-olds (18%) (p<.01). Among Indigenous students
males in both age groups were more likely than females to have consumed alcohol at some
time in their life (p<.01).
Students aged 14- to 15-years were more likely than 12- to 13-year-olds to have
consumed alcohol in the past year and past month (both p<.01).
A greater proportion of older students (33%) than younger students (13%) had consumed
alcohol in the week before the survey (defined as current drinkers) (p<.01).
Table 4.1 indicates that a greater proportion of Indigenous students aged 12 to 15 years
(27%) reported never consuming alcohol, compared to the proportion of students aged 12
to 15 years in the main ASSAD sample (22%) (Difference 5.6%; 95% CI = 3.1% to 8.1%).

Substance use among Indigenous Australian secondary school students 2008 18
The proportion of Indigenous students aged 12 to 15 years who drank alcohol in the past
month (35%) was greater than the proportion (28%) of students aged 12 to 15 years in
the main ASSAD sample (Difference = 6.5%; 95% CI = 3.8% to 9.2%). Similarly a larger
proportion of Indigenous 12- to 15-year-olds reported drinking in the past week (23%)
than the proportion (17%) of 12- to 15-year-olds in the main ASSAD sample (Difference =
5.9%; 95% CI = 3.6% to 8.2%).
4.2 Types of alcohol consumed by current drinkers (drank in
past 7 days)
Table 4.2 shows the main types of alcoholic beverages Indigenous students who were
current drinkers consumed.
Table 4.2: Drink types most commonly consumed by Indigenous students who were
current drinkers, Australia, 2008#.
Beverage type
Indigenous
12-15
%
ASSAD
12-15
%
Beer (ordinary)
Male 17.3 29.2
Female 2.6 6.5
Total 10.0 18.5
Wine
Male 3.2 7.0
Female 4.4 7.0
Total 3.8 7.0
Premixed spirits
Male 19.5 16.0
Female 39.1 46.9
Total 29.3 30.6
Spirits
Male 48.2 35.6
Female 39.7 25.7
Total 43.9 30.9
# Base: Students who consumed alcohol in past week. Percentages exclude responses from students who gave more than one type of drink, and percentages do not add to 100 as only the most frequent responses are
listed.
The most common drinks consumed by Indigenous students aged 12 to 15 years were
spirits and premixed spirits, followed by beer, few Indigenous students reported consuming
wine.
The consumption of premixed spirits was significantly more common for female than male
Indigenous students (p<.01). Males were more likely than female current drinkers to have
consumed spirits and beer (both p<.01).
Around 30% of Indigenous students aged 12 to 15 years who were current drinkers
consumed premixed spirits. This proportion is very similar to that found in the main ASSAD
sample (31%). Drinking spirits was more common among Indigenous current drinkers
aged 12 to 15 years (44%) than it was among current drinkers aged 12 to 15 years in the
main ASSAD sample (31%) (Difference = 13%; 95%; CI = 7.3% to 18.7%). However
drinking beer was more common among 12 to 15 year old current drinkers in the main
ASSAD sample (19%) than current drinkers in the combined Indigenous sample (10%)
(Difference = 8.5%; 95%; CI = 4.9% to 12.1%).

Substance use among Indigenous Australian secondary school students 2008 19
4.3 Indigenous students’ access to Alcohol
Table 4.3 shows how Indigenous students who consumed alcohol in the previous week
accessed their alcohol.
Table 4.3: Most common sources of alcohol for current drinkers (drank alcohol in the past
week) Australia, 2008#
Indigenous 12-15
%
ASSAD 12-15
%
Did not buy, supplied by:
Parents
Male 32.1 36.1
Female 27.3 34.3
Total 29.6 35.3
Siblings
Male 17.8 11.8
Female 7.6 8.2
Total 12.7 10.1
Other Relative
Male 2.4 2.0
Female 4.8 2.3
Total 3.7 2.1
Took from home
Male 8.8 8.3
Female 2.2 7.8
Total 5.5 8.1
Friends
Male 21.9 21.9
Female 29.4 24.6
Total 25.7 23.2
Someone else
bought
Male 14.0 13.4
Female 23.2 18.0
Total 18.6 15.6
# Base: Students who consumed alcohol in past week.
Similar to findings for 12- to 15-year-old current drinkers in the main ASSAD sample,
among 12- to 15-year-old Indigenous students who were current drinkers the single most
common source of alcohol was a parent. However the proportion of 12- to 15-year-old
Indigenous students who were current drinkers accessing alcohol from parents was lower
(30%) than that found among 12- to 15-year-old current drinkers in the main ASSAD
sample (35%) (Difference = 5.7%; 95% CI = 0.4% to 11.0%).
Similar proportions of Indigenous current drinkers (19%) and current drinkers in the main
ASSAD sample (16%) accessed alcohol by someone else buying it.
Only 5% of all Indigenous students surveyed aged 12 to 15 years who were current
drinkers reported buying their own alcohol.

Substance use among Indigenous Australian secondary school students 2008 20
4.4 Where do Indigenous students drink alcohol?
The most commonly reported places for consuming alcohol among 12- to 15-year-old
Indigenous students who drank in the past week were at home (30%), at a party (29%)
and at a friend’s house (19%) (see Table 4.4). These proportions are similar to those from
the main ASSAD sample.
Table 4.4: Most usual places for drinking by Indigenous current drinkers (students who had
consumed alcohol in the previous week), Australia, 2008#
Indigenous 12-15 %
ASSAD 12-15 %
At home
Male 30.9 35.3
Female 29.3 32.4
Total 30.1 33.9
Party
Male 34.6 28.6
Female 24.3 28.5
Total 29.3 28.6
Friend’s house
Male 15.9 16.1
Female 22.7 20.0
Total 19.4 18.0
#Base: Students who consumed alcohol in past week.
4.5 Adult supervision of drinking
Students were asked if an adult was supervising them (and/or their friends) when they
consumed their last alcoholic drink.
Table 4.5: Percentage of Indigenous students who were current drinkers consuming their
last alcoholic drink reporting an adult was supervising them, Australia, 2008#
Indigenous
12-15
%
ASSAD
12-15
%
Adult supervising
when consumed last drink
Male 59.0 61.1
Female 61.9 59.0
Total 60.4 60.1
#Base: Students who consumed alcohol in past week.
The majority of Indigenous students aged 12 to 15 years who were current drinkers
reported that an adult was supervising when they had consumed their last drink. This
proportion is similar to that found in the main ASSAD sample.

Substance use among Indigenous Australian secondary school students 2008 21
5. Use of over the counter and illicit
substances among Indigenous secondary
students participating in ASSAD 2008
5.1 Analgesics
Table 5.1 shows the use of analgesics by Indigenous students participating in ASSAD 2008.
Table 5.1: Analgesics: Percentage of Indigenous students in each age group by gender
using analgesics in each recency category, Australia 2008
Indigenous ASSAD
12-13#
%
14-15^
%
12-15†
%
12-15
%
Never used
Male 15.7 11.5 13.6 6.7
Female 7.8 7.8 7.8 3.5
Total 11.7 9.7 10.7 5.1
Ever used
Male 84.3 88.5 86.4 93.3
Female 92.2 92.2 92.2 96.5
Total 88.3 90.3 89.3 94.9
Used in past year
Male 80.9 84.1 82.4 88.8
Female 89.4 90.5 89.9 94.2
Total 85.2 87.2 86.2 91.5
Used in past month
Male 61.1 61.4 61.2 63.0
Female 69.0 75.4 72.0 74.2
Total 65.0 68.3 66.6 68.5
Used in past week
Male 39.0 43.0 40.8 34.6
Female 44.8 46.1 45.4 44.8
Total 41.9 44.5 43.2 39.6
#95% CI for Indigenous students aged 12-13 years range from a high of ± 4.0% for used analgesics in the
past week to a low of ±2.6% for never used analgesics
^95% CI for Indigenous students aged 14-15 years range from a high of ± 3.6% for used analgesics in the
past week to a low of ±2.1% for never used analgesics
†95% CI for Indigenous students aged 12-15 years = range from a high of ± 2.7% for used analgesics in the
past week to a low of ±1.7% for never used analgesics
See Appendix 3 for 95% Confidence Intervals estimates for different proportions for each age and gender
group.
Around 43% of the Indigenous students participating in ASSAD reported using analgesics
in the past week. Around two-thirds of the Indigenous students had used analgesics in the
past month, and around 86% had used them in the past year.
Reported lifetime use of analgesics among 12- to 15-year-old Indigenous students (89%)
was lower than reported analgesic use (95%) by students in the main ASSAD sample
(Difference = 5.6%; 95% CI = 3.9% to 7.3%).
Significantly fewer Indigenous students than students in the main ASSAD sample reported
using analgesics in the past year (Difference = 5.3%; 95% CI =3.4% to 7.2%). However a
greater proportion of Indigenous students aged 12 to 15 years than students in the main
Substance use among Indigenous Australian secondary school students 2008 22
ASSAD sample reported using analgesics in the week before the survey (Difference =
3.6%; 95% CI = 0.8% to 6.4%).
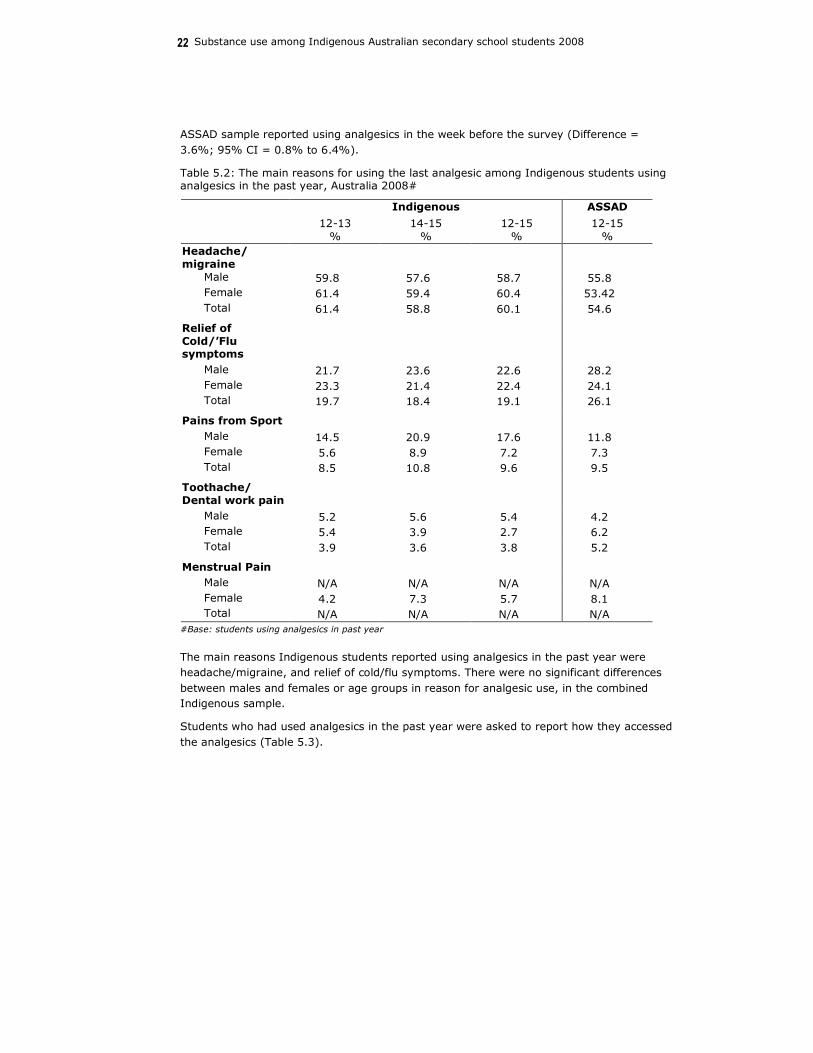
Table 5.2: The main reasons for using the last analgesic among Indigenous students using analgesics in the past year, Australia 2008#
Indigenous ASSAD
12-13
%
14-15
%
12-15
%
12-15
%
Headache/ migraine
Male 59.8 57.6 58.7 55.8
Female 61.4 59.4 60.4 53.42
Total 61.4 58.8 60.1 54.6
Relief of Cold/’Flu symptoms
Male 21.7 23.6 22.6 28.2
Female 23.3 21.4 22.4 24.1
Total 19.7 18.4 19.1 26.1
Pains from Sport
Male 14.5 20.9 17.6 11.8
Female 5.6 8.9 7.2 7.3
Total 8.5 10.8 9.6 9.5
Toothache/
Dental work pain
Male 5.2 5.6 5.4 4.2
Female 5.4 3.9 2.7 6.2
Total 3.9 3.6 3.8 5.2
Menstrual Pain
Male N/A N/A N/A N/A
Female 4.2 7.3 5.7 8.1
Total N/A N/A N/A N/A
#Base: students using analgesics in past year
The main reasons Indigenous students reported using analgesics in the past year were
headache/migraine, and relief of cold/flu symptoms. There were no significant differences
between males and females or age groups in reason for analgesic use, in the combined
Indigenous sample.
Students who had used analgesics in the past year were asked to report how they accessed
the analgesics (Table 5.3).

Substance use among Indigenous Australian secondary school students 2008 23
Table 5.3: Most common sources of analgesic among Indigenous students using analgesics
in the past year, Australia 2008#
Indigenous ASSAD
12-13
%
14-15
%
12-15
%
12-15
%
Parents
Male 89.2 82.8 86.0 90.2
Female 90.5 78.5 84.8 88.9
Total 89.9 80.6 85.5 89.6
Took from home
Male 0.0 1.9 1.0 2.9
Female 0.4 6.1 3.1 3.7
Total 0.2 4.1 2.0 3.3
I bought it
Male 1.4 2.2 2.8 0.9
Female 1.3 3.4 2.3 2.0
Total 1.4 2.8 2.1 1.5
Staff at school
Male 1.2 2.4 1.8 1.6
Female 2.6 2.0 2.3 1.0
Total 1.9 2.2 2.1 1.3
#Base: students using analgesics in past year
Younger Indigenous students aged 12 to 13 years (90%) were more likely than older
students aged 14 to 15 years (81%) to report getting analgesics from their parents
(p<.01).
Sources of analgesics for 12- to 15-year-old Indigenous students were similar to those
found in the main ASSAD sample, with parents the most common source of analgesics for
both groups.

Substance use among Indigenous Australian secondary school students 2008 24
5.2 Tranquillisers
Table 5.4 shows the use of analgesics by Indigenous students participating in ASSAD 2008.
Table 5.4: Tranquillisers: Percentage of Indigenous students in each gender and age group
using tranquillisers in each recency category, Australia 2008
Indigenous ASSAD
12-13# %
14-15^ %
12-15† %
12-15 %
Never used
Male 81.2 75.6 78.4 84.6
Female 85.4 77.5 81.7 83.0
Total 83.4 76.5 80.1 83.8
Ever used
Male 18.8 24.4 21.6 15.4
Female 14.6 22.5 18.3 17.0
Total 16.6 23.5 19.9 16.2
Used in past year
Male 14.0 19.3 16.6 8.5
Female 10.7 17.5 13.9 9.8
Total 12.3 18.4 15.2 9.1
Used in past month
Male 7.8 13.4 10.5 4.0
Female 5.7 7.7 6.6 3.8
Total 6.7 10.6 8.6 3.9
Used in past week
Male 5.8 9.0 7.4 2.5
Female 3.5 6.0 4.7 2.1
Total 4.6 7.5 6.0 2.3
#95% CI for Indigenous students aged 12-13 years range from a high of ± 3.0% for never used tranquillisers
to a low of ±1.7% for used tranquillisers in the past week
^95% CI for Indigenous students aged 14-15 years range from a high of ± 3.1% for never used tranquillisers
to a low of ±2.0% for used tranquillisers in the past week
†95% CI for Indigenous students aged 12-15 years range from a high of ± 2.2% for never used tranquillisers
to a low of ±1.3% for used tranquillisers in the past week
See Appendix 3 for 95% Confidence Intervals estimates for different proportions for each age and gender
group.
The majority of Indigenous students surveyed aged 12 to 15 years had never used
tranquillisers.
A greater proportion of Indigenous students than students from the main ASSAD sample
reported lifetime use of tranquillisers (Difference =3.7%; 95% CI = 1.5% to 5.9%). A
greater proportion of Indigenous students aged 12 to 15 years than students this age in
the main ASSAD sample reported using tranquillisers in the past year (Difference = 6.1;
95% CI = 4.1% to 8.1%), month (Difference = 4.7%; 95% CI = 3.2 to 6.2%), and week
(Difference = 3.7%; 95% CI = 2.4% to 5.0%).

Substance use among Indigenous Australian secondary school students 2008 25
5.3 Cannabis
Table 5.5 shows the use of cannabis by Indigenous students participating in ASSAD 2008.
Table 5.5: Cannabis: Percentage of Indigenous students in each age group by gender using
cannabis in each recency category, Australia 2008
Indigenous ASSAD
12-13# %
14-15^ %
12-15† %
12-15 %
Never used
Male 89.3 67.1 78.6 90.1
Female 90.2 73.7 82.4 91.1
Total 89.7 70.4 80.5 90.6
Ever used
Male 10.7 32.9 21.4 9.9
Female 9.8 26.3 17.6 8.9
Total 10.3 29.6 19.5 9.4
Used in past year
Male 8.0 26.5 16.9 8.0
Female 7.2 24.1 15.2 7.5
Total 7.6 25.3 16.0 7.8
Used in past month
Male 4.6 18.8 11.5 4.7
Female 4.3 14.8 9.3 3.9
Total 4.5 16.8 10.4 4.3
Used in past week
Male 3.5 15.7 9.4 3.2
Female 4.2 7.5 5.7 2.0
Total 3.8 11.7 7.6 2.6
#95% CI for Indigenous students aged 12-13 years range from a high of ±2.5% for never used cannabis to a
low of ±1.6% for used cannabis in the past week
^95% CI for Indigenous students aged 14-15 years range from a high of ± 3.3% for never used cannabis to a
low of ±2.3% for used cannabis in the past week
†95% CI for Indigenous students aged 12-15 years range from a high of ± 2.1% for never used cannabis to a
low of ±1.4% for used cannabis in the past week
See Appendix 3 for 95% Confidence Intervals estimates for different proportions for each age and gender
group.
As was the case for all 12- to 15-year-old students in the main ASSAD sample, cannabis
was the most commonly used illicit substance among Indigenous students, with 20%
reporting to have used it in their lifetime. Cannabis use was greater among Indigenous 14-
to 15-year-olds than Indigenous 12- to 13-year-olds in all recency periods (all p<.01).
The proportion reporting ever having used cannabis (20%) among 12- to 15-year-old
Indigenous students was higher than the proportion for all 12- to 15-year-olds in the main
ASSAD sample (9%) (Difference 10.1%; 95% CI = 7.9% to 12.3%). A greater proportion
(16%) of Indigenous students aged 12 to 15 years than students of this age in the main
ASSAD sample (8%) reported using cannabis in the past year (Difference = 8.2%; 95% CI
= 6.2% to 10.2%), month (Difference = 6.1%; 95% CI = 4.4% to 7.8%), and week
(Difference = 5.0%; 95% CI = 3.5% to 6.5%).

Substance use among Indigenous Australian secondary school students 2008 26
5.3.1 Location of cannabis use
Students who had used cannabis in the past year were asked to indicate where they had
used cannabis.
Table 5.6: Most usual places for cannabis use by Indigenous students who had used
cannabis in the past year, Australia, 2008#
Indigenous 12-15
%
ASSAD 12-15
%
At home
Male 8.2 10.1
Female 14.4 12.5
Total 10.9 11.2
Party
Male 25.5 23.2
Female 17.4 22.7
Total 21.9 22.9
Friend’s house
Male 41.4 36.2
Female 45.0 38.4
Total 43.0 37.2
# Students who had used cannabis in the past year and provided information about location of use.
For Indigenous students, using cannabis at home or at a friend’s house was slightly more
common among females, with more males reporting using at a party. However these
differences did not reach significance.
Findings for the combined Indigenous sample did not differ from those for the main ASSAD
sample. Among Indigenous students the most frequently reported location for cannabis use
was a friend’s house (43%), followed by a party (22%) and then home (11%).
5.3.2 Method of cannabis use
Students who had used cannabis in the past year were asked to indicate how they used
cannabis (Table 5.7).

Substance use among Indigenous Australian secondary school students 2008 27
Table 5.7: Method of cannabis use by students who had used cannabis in the past year,
Australia, 2008#
Indigenous 12-15
%
ASSAD 12-15
%
Smoke it as a joint
Male 25.0 38.2
Female 31.7 39.6
Total 28.1 38.8
Smoke bong/pipe
Male 66.1 58.3
Female 63.0 56.8
Total 64.6 57.6
Eat it
Male 8.9 2.6
Female 5.3 3.1
Total 7.3 2.8
# Students who had used cannabis in the past year and provided information about method of use.
Among Indigenous students who had used cannabis in the past year the most popular
method of use was a bong or pipe (65%). This was also the most common method of use
found among students in the main ASSAD sample (58%). The proportions of students
reporting smoking cannabis as a joint or in a bong or pipe did not differ significantly
between the combined Indigenous sample and the main ASSAD sample.
Indigenous students (7%) wore more likely to report eating cannabis than students in the
main ASSAD sample (3%) (Difference = 4.5%; 95% CI = 0.8% to 8.2%).
5.3.3 Use of other substances while using cannabis
Students who used cannabis in the past year were asked to indicate which other
substances they had used at the same time as they used cannabis.
Table 5.8: Percentage of Indigenous students who had used cannabis in the past 12
months indicating they had used other substances on the same occasion#, 2008
Substance used on same
occasion
Indigenous 12-15
%
ASSAD 12-15
%
Alcohol 58.1 57.5
Tobacco 42.1 43.1
Hallucinogens 6.6 4.9
Amphetamines 3.6 5.8
Ecstasy 12.9 8.8
Analgesics 11.5 9.4
No other substance used 29.0 29.1
Other 0.9 1.4
# Students who had used cannabis in the past year.
For Indigenous students aged 12 to 15 years, use of other substances while using cannabis
was similar to that found in the main ASSAD sample. Alcohol (58%) and tobacco (42%)
were the substances most frequently used with cannabis. Twenty-nine percent of students
did not use any other substance when using cannabis in the previous year.

Substance use among Indigenous Australian secondary school students 2008 28
5.4 Inhalants
Table 5.9 shows the use of inhalants by Indigenous students participating in ASSAD 2008.
Table 5.9: Inhalants: Percentage of Indigenous students in each age group by gender
using inhalants in each recency category, Australia 2008
Indigenous ASSAD
12-13# %
14-15^ %
12-15† %
12-15 %
Never used
Male 73.5 78.0 75.7 80.5
Female 78.4 74.1 76.3 78.6
Total 76.0 76.1 76.0 79.6
Ever used
Male 26.5 21.9 24.3 19.5
Female 21.6 25.9 23.7 21.4
Total 24.0 23.9 24.0 20.4
Used in past year
Male 19.9 16.1 18.1 13.9
Female 15.8 19.6 17.6 16.0
Total 17.8 17.8 17.8 15.0
Used in past month
Male 13.9 12.3 13.2 8.6
Female 10.4 13.3 11.8 9.8
Total 12.2 12.8 12.5 9.2
#95% CI for Indigenous students aged 12-13 years range from a high of ± 3.5% for never used inhalants to
a low of ±2.7% for used inhalants in the past month
^95% CI for Indigenous students aged 14-15 years range from a high of ± 3.1% for never used inhalants to
a low of ±2.4% for used inhalants in the past month
†95% CI for Indigenous students aged 12-15 years range from a high of ± 2.3% for never used inhalants to a
low of ±1.8% for used inhalants in the past month
See Appendix 3 for 95% Confidence Intervals estimates for different proportions for each age and gender
group.
Twenty-four percent of Indigenous students reported having ever used inhalants in their
lifetime.
Where 18% of Indigenous students had used inhalants in the past year, 13% had used
inhalants in the past month.
There was little difference in reported use of inhalants between 12- to 13-year-old and 14-
to 15-year-old Indigenous students.
The proportion of Indigenous students (24%) reporting that they had ever used inhalants
was higher than the proportion found in the main ASSAD sample (20%) (Difference =
3.6%; 95% CI = 1.2% to 6.0%). A higher proportion (16%) of Indigenous students aged
12 to 15 years than students this age in the main ASSAD sample (8%) reported using
inhalants in the past year (Difference = 2.8%; 95% CI = 0.7% to 4.9%), and month
(Difference = 3.3%; 95% CI = 1.5% to 5.1%).

Substance use among Indigenous Australian secondary school students 2008 29
5.5 Hallucinogens
Table 5.10 shows the use of hallucinogens by Indigenous students participating in ASSAD
2008.
Table 5.10: Hallucinogens: Percentage of Indigenous students in each age group by
gender using hallucinogens in each recency category, Australia 2008
Indigenous ASSAD
12-13# %
14-15^ %
12-15† %
12-15 %
Never used
Male 96.1 91.6 94.0 97.4
Female 98.8 92.9 96.0 98.1
Total 97.5 92.3 95.0 97.7
Ever used
Male 3.9 8.4 6.0 2.6
Female 1.2 7.1 4.0 1.9
Total 2.5 7.7 5.0 2.3
Used in past year
Male 2.0 7.1 6.4 2.0
Female 0.9 5.8 3.2 1.5
Total 1.4 6.4 3.8 1.7
Used in past month
Male 2.0 6.4 4.1 1.3
Female 0.5 3.1 1.7 0.7
Total 1.2 4.8 2.9 1.0
#95% CI for Indigenous students aged 12-13 years range from a high of ± 1.3% for never used hallucinogens
to a low of ±0.9% for used hallucinogens in the past month
^95% CI for Indigenous students aged 14-15 years range from a high of ± 1.9% for never used hallucinogens
to a low of ±1.5% for used hallucinogens in the past month
†95% CI for Indigenous students aged 12-15 years range from a high of ± 1.2% for never used hallucinogens
to a low of ±0.9% for used hallucinogens in the past month
See Appendix 3 for 95% Confidence Intervals estimates for different proportions for each age and gender
group.
Lifetime use of hallucinogens among 12- to 15-year-old Indigenous students was rare.
Among Indigenous students for each recency period, reported use of hallucinogens was
higher among 14- to 15-year-old students than among 12- to 13-year-old students
(p<.01).
Reported lifetime use of hallucinogens by Indigenous students was higher than among 12-
to 15-year-olds in the main ASSAD sample (Difference = 2.7%; 95% CI = 1.5% to 3.9%).
Similarly the proportion of Indigenous students reporting use of hallucinogens in the past
year (4%) was higher than the proportion (2%) found in the main ASSAD sample
(Difference = 2.1%: 95% CI = 1.0% to 3.2%). Also, recent use of hallucinogens by
Indigenous students aged 12 to 15 years (3% in past month) was more common than for
students aged 12 to 15 years in the main ASSAD sample (1% in past month) (Difference =
1.9%; 95% CI = 1.0% to 2.8%).

Substance use among Indigenous Australian secondary school students 2008 30
5.5.1 Use of other substances while using hallucinogens
Students who used hallucinogens in the past year were asked to indicate which other
substances they had used at the same time as they used hallucinogens.
Table 5.11:Percentage of Indigenous students who had used hallucinogens in the past 12 months indicating they had used other substances on the same occasion, 2008#
Substance used on same
occasion
Indigenous 12-15
%
ASSAD 12-15
%
Alcohol 61.4 46.6
Tobacco 48.9 28.7
Cannabis 36.4 26.1
Amphetamines 13.5 7.4
Ecstasy 40.0 17.0
Analgesics 21.3 6.3
No other substance used 12.4 35.1
Other 3.8 0
# Students who used hallucinogens in the past year
Alcohol, tobacco, cannabis and ecstasy were reported as the substances most commonly
used at the same time as hallucinogens by 12- to 15 –year-old students who had used
hallucinogens in the past year. The proportion indicating use of tobacco was significantly
greater among the combined Indigenous sample (49%) than in the main ASSAD sample
(29%) (Difference = 20.2%; 95% CI 5.0% to 35.4%). The proportion of Indigenous
students who used ecstasy at the same time as hallucinogens (40%) was higher than that
in the main ASSAD sample (17%) (Difference = 23%; 95% CI 8.4% to 37.6%).
Substance use among Indigenous Australian secondary school students 2008 31
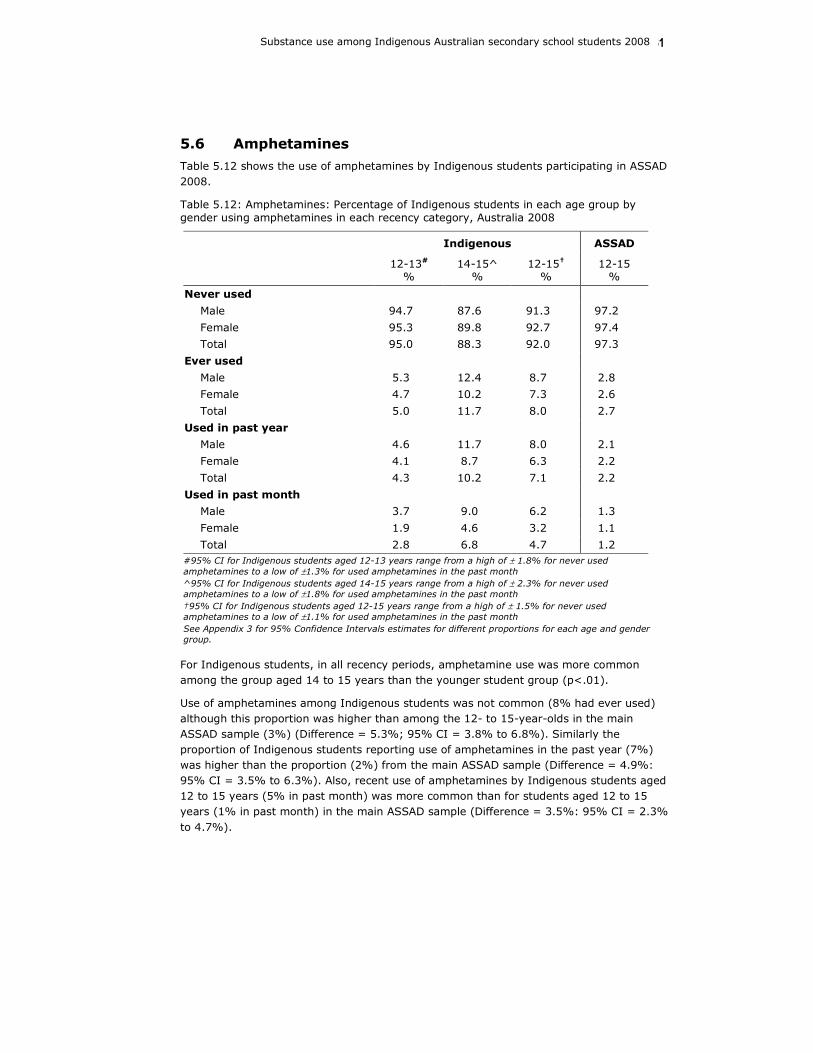
5.6 Amphetamines
Table 5.12 shows the use of amphetamines by Indigenous students participating in ASSAD
2008.
Table 5.12: Amphetamines: Percentage of Indigenous students in each age group by
gender using amphetamines in each recency category, Australia 2008
Indigenous ASSAD
12-13# %
14-15^ %
12-15† %
12-15 %
Never used
Male 94.7 87.6 91.3 97.2
Female 95.3 89.8 92.7 97.4
Total 95.0 88.3 92.0 97.3
Ever used
Male 5.3 12.4 8.7 2.8
Female 4.7 10.2 7.3 2.6
Total 5.0 11.7 8.0 2.7
Used in past year
Male 4.6 11.7 8.0 2.1
Female 4.1 8.7 6.3 2.2
Total 4.3 10.2 7.1 2.2
Used in past month
Male 3.7 9.0 6.2 1.3
Female 1.9 4.6 3.2 1.1
Total 2.8 6.8 4.7 1.2
#95% CI for Indigenous students aged 12-13 years range from a high of ± 1.8% for never used
amphetamines to a low of ±1.3% for used amphetamines in the past month
^95% CI for Indigenous students aged 14-15 years range from a high of ± 2.3% for never used
amphetamines to a low of ±1.8% for used amphetamines in the past month
†95% CI for Indigenous students aged 12-15 years range from a high of ± 1.5% for never used
amphetamines to a low of ±1.1% for used amphetamines in the past month
See Appendix 3 for 95% Confidence Intervals estimates for different proportions for each age and gender
group.
For Indigenous students, in all recency periods, amphetamine use was more common
among the group aged 14 to 15 years than the younger student group (p<.01).
Use of amphetamines among Indigenous students was not common (8% had ever used)
although this proportion was higher than among the 12- to 15-year-olds in the main
ASSAD sample (3%) (Difference = 5.3%; 95% CI = 3.8% to 6.8%). Similarly the
proportion of Indigenous students reporting use of amphetamines in the past year (7%)
was higher than the proportion (2%) from the main ASSAD sample (Difference = 4.9%:
95% CI = 3.5% to 6.3%). Also, recent use of amphetamines by Indigenous students aged
12 to 15 years (5% in past month) was more common than for students aged 12 to 15
years (1% in past month) in the main ASSAD sample (Difference = 3.5%: 95% CI = 2.3%
to 4.7%).

Substance use among Indigenous Australian secondary school students 2008 32
5.6.1 Use of other substances while using amphetamines
Students who used amphetamines in the past year were asked to indicate which other
substances they had used at the same time as they used amphetamines.
Table 5.13: Percentage of Indigenous students who had used amphetamines in the past 12
months indicating they had used other substances on the same occasion, 2008#
Substance used on same
occasion
Indigenous 12-15
%
ASSAD 12-15
%
Alcohol 52.0 48.3
Tobacco 34.9 34.0
Cannabis 40.3 32.1
Hallucinogens 17.0 10.1
Ecstasy 25.8 15.2
Analgesics 19.1 7.3
No other substance used 21.1 28.5
Other 0.7 1.3
# Students who had used amphetamines in the past year.
Alcohol (52%), cannabis (40%), and tobacco (35%) were the substances most commonly
used at the same time as amphetamines among Indigenous students aged 12 to 15 years.
These levels were not significantly different from those found in the main ASSAD sample.

Substance use among Indigenous Australian secondary school students 2008 33
5.7 Steroids
Table 5.14 shows the use of amphetamines by Indigenous students participating in ASSAD
2008.
Table 5.14: Steroids: Percentage of Indigenous students in each age group by gender
reporting use of steroids without a doctor’s prescription in an attempt to improve sporting
ability, increase muscle size or improve appearance, Australia 2008
Indigenous ASSAD
12-13# %
14-15^ %
12-15† %
12-15 %
Never used
Male 92.8 88.1 90.5 96.9
Female 96.0 94.9 95.5 98.2
Total 94.4 91.5 93.0 97.5
Ever used
Male 7.2 11.9 9.5 3.1
Female 4.4 5.1 4.5 1.8
Total 5.6 8.5 7.0 2.5
Used in past year
Male 3.5 9.6 6.4 2.2
Female 3.1 4.1 3.6 1.2
Total 3.3 6.9 5.0 1.7
Used in past month
Male 3.5 8.5 5.9 1.6
Female 1.4 1.7 1.6 0.6
Total 2.4 5.1 3.7 1.1
#95% CI for Indigenous students aged 12-13 years range from a high of ± 1.9% for never used steroids to a
low of ±1.3% for used steroids in the past month
^95% CI for Indigenous students aged 14-15 years range from a high of ± 2.0% for never used steroids to a low of ±1.6% for used steroids in the past month
†95% CI for Indigenous students aged 12-15 years range from a high of ± 1.4% for never used steroids to a
low of ±1.0% for used steroids in the past month
See Appendix 3 for 95% Confidence Intervals estimates for different proportions for each age and gender
group.
The use of steroids without prescription among Indigenous students was low.
Across all Indigenous 12- to 15-year-olds, more males than females reported using non-
prescription steroids in all recency periods and this difference was significant for monthly
use (p<.01).
Ever use of steroids was more common among 12- to 15-year-olds in the combined
Indigenous sample (7%) than among 12- to 15-year-old students in the main ASSAD
sample (3%) (Difference = 4.5%; 95% CI = 3.1% to 5.9%). Similarly more Indigenous
students reported use of steroids in the past year (5%) than in the main ASSAD sample
(2%) (Difference = 3.3%; 95% CI = 2.1% to 4.5%). Also a higher proportion of
Indigenous students (4%) reported steroid use in the past month than in the main ASSAD
sample (1%) (Difference = 2.6%; 95% CI = 1.6% to 3.6%).

Substance use among Indigenous Australian secondary school students 2008 34
5.8 Opiates
Table 5.15 shows the use of opiates by Indigenous students participating in ASSAD 2008.
Table 5.15: Opiates: Percentage of Indigenous students in each age group by gender using
opiates in each recency category, Australia 2008
Indigenous ASSAD
12-13# %
14-15^ %
12-15† %
12-15 %
Never used
Male 96.3 92.3 94.4 97.9
Female 98.1 92.2 95.3 98.1
Total 97.2 92.3 94.9 98.0
Ever used
Male 3.7 7.7 5.6 2.1
Female 1.9 7.8 4.7 1.9
Total 2.8 7.7 5.1 2.0
Used in past year
Male 2.4 5.8 4.0 1.4
Female 1.4 6.0 3.6 1.3
Total 1.9 5.9 3.8 1.4
Used in past month
Male 1.6 5.1 3.3 1.0
Female 1.0 4.1 2.5 0.6
Total 1.3 4.6 2.9 0.8
#95% CI for Indigenous students aged 12-13 years range from a high of ± 1.3% for never used opiates to a
low of ±0.9% for used opiates in the past month
^95% CI for Indigenous students aged 14-15 years range from a high of ± 1.9% for never used opiates to a
low of ±1.5% for used opiates in the past month
†95% CI for Indigenous students aged 12-15 years range from a high of ± 1.2% for never used opiates to a
low of ±0.9% for used opiates in the past month
See Appendix 3 for 95% Confidence Intervals estimates for different proportions for each age and gender
group.
The use of opiates among Indigenous students was rare.
In each recency period reported opiate use was more common among 14- and 15-year-old
Indigenous students than younger students. .
The proportion of Indigenous students aged 12 to 15 years who reported ever having used
opiates (5%) was higher than the proportion found among 12- to 15-year-old students in
the main ASSAD sample (2%) (Difference = 3.1%; 95% CI = 1.9% to 4.3%). Similarly
more Indigenous students reported use of opiates in the past year (4%) than in the main
ASSAD sample (1%) (Difference = 2.4%; 95% CI = 1.4% to 3.4%). Also a higher
proportion of Indigenous students reported opiate use in the past month (3%) than
students in the main ASSAD sample (1%) (Difference = 2.1%; 95% CI = 1.2% to 3.0%).

Substance use among Indigenous Australian secondary school students 2008 35
5.9 Cocaine
Table 5.16 shows the use of cocaine by Indigenous students participating in ASSAD 2008.
Table 5.16: Cocaine: Percentage of Indigenous students in each age group by gender using
cocaine for each recency category, Australia 2008
Indigenous ASSAD
12-13# %
14-15^ %
12-15† %
12-15 %
Never used
Male 96.6 90.6 93.7 97.9
Female 98.3 92.4 95.5 98.3
Total 97.5 91.5 94.6 98.1
Ever used
Male 3.4 9.4 6.3 2.1
Female 1.7 7.6 4.5 1.7
Total 2.5 8.5 5.4 1.9
Used in past year
Male 1.4 7.5 4.4 1.7
Female 1.7 6.4 4.0 1.3
Total 1.6 6.9 4.2 1.5
Used in past month
Male 1.4 6.8 4.4 1.2
Female 1.0 4.3 2.5 0.7
Total 1.2 5.5 3.3 1.0
#95% CI for Indigenous students aged 12-13 years range from a high of ± 1.3% for never used cocaine to a
low of ±0.9% for used cocaine in the past month
^95% CI for Indigenous students aged 14-15 years range from a high of ± 2.0% for never used cocaine to a
low of ±1.6% for used cocaine in the past month
†95% CI for Indigenous students aged 12-15 years range from a high of ± 1.2% for never used cocaine to a
low of ±1.0% for used cocaine in the past month
See Appendix 3 for 95% Confidence Intervals estimates for different proportions for each age and gender
group.
Among Indigenous students, use of cocaine was more common in the older group for each
time period (p<.01).
The small proportion (5%) of the combined Indigenous sample that reported ever using
cocaine was higher than the proportion in the main ASSAD sample (2%) (Difference =
3.5%; 95% CI = 2.3% to 4.7%). Also a higher proportion of Indigenous students reported
use of opiates in the past year (4%) than in the main ASSAD sample (2%) (Difference =
2.7%; 95% CI = 1.6% to 3.8%). The proportion of Indigenous students who reported
cocaine use in the past month (3%) was higher than the proportion of students from the
main ASSAD sample (1%) (Difference = 2.3%; 95% CI = 1.3% to 3.3%).

Substance use among Indigenous Australian secondary school students 2008 36
5.10 Ecstasy
Table 5.17 shows the use of ecstasy by Indigenous students participating in ASSAD 2008.
Table 5.17: Ecstasy: Percentage of Indigenous students in each age group by gender using
ecstasy in each recency category, Australia 2008
Indigenous ASSAD
12-13# %
14-15^ %
12-15† %
12-15 %
Never used
Male 97.4 89.6 93.7 97.3
Female 97.6 90.2 94.1 97.6
Total 97.5# 89.9^ 93.9† 97.4
Ever used
Male 2.6 10.4 6.3 2.7
Female 2.4 9.8 5.9 2.4
Total 2.5 10.1 6.1 2.6
Used in past year
Male 2.5 9.7 6.0 2.4
Female 2.4 8.4 5.2 2.0
Total 2.4 9.1 5.6 2.2
Used in past month
Male 1.5 8.3 4.8 1.5
Female 0.8 4.1 2.4 0.9
Total 1.1 6.8 3.6 1.2
#95% CI for Indigenous students aged 12-13 years range from a high of ± 1.3% for never used ecstasy to a
low of ±0.9% for used ecstasy in the past month
^95% CI for Indigenous students aged 14-15 years range from a high of ± 2.2% for never used ecstasy to a
low of ±1.8% for used ecstasy in the past month
†95% CI for Indigenous students aged 12-15 years range from a high of ± 1.3% for never used ecstasy to a
low of ±1.0% for used ecstasy in the past month
See Appendix 3 for 95% Confidence Intervals estimates for different proportions for each age and gender
group.
Reported use of ecstasy was more common among older Indigenous students than younger
Indigenous students for each time period (all p<.01). While more males than females
reported using ecstasy in each recency period, these differences were not significant.
Lifetime ecstasy use (6%) was more common among the 12- to 15- year old Indigenous
students, than among the main 12- to 15- year old ASSAD sample (3%) (Difference =
3.5%; 95% CI = 2.2% to 4.8%). The proportion of the combined Indigenous sample using
ecstasy in the past year (6%) was higher than the proportion in the main ASSAD sample
(2%) (Difference = 3.4%; 95% CI = 2.1% to 4.7%). Also the proportion of Indigenous
students who reported ecstasy use in the past month (4%) was higher than the proportion
in the main ASSAD sample (1%) (Difference = 2.4%; 95% CI = 1.4% to 3.4%).

Substance use among Indigenous Australian secondary school students 2008 37
5.10.1 Use of other substances while using ecstasy
Students who used ecstasy in the past year were asked to indicate which other substances
they had used at the same time as they used ecstasy.
Table 5.18: Percentage of Indigenous students who had used ecstasy in the past 12 months indicating they had used other substances on the same occasion, 2008#
Substance used on same occasion
Indigenous 12-15
%
ASSAD 12-15
%
Alcohol 54.6 61.2
Tobacco 35.8 41.7
Cannabis 54.3 39.2
Hallucinogens 14.4 14.8
Amphetamines 24.4 13.6
Analgesics 10.2 9.7
No other substance used 12.3 19.2
Other 2.6 0.8
# Students who used ecstasy in the past year
Alcohol (55%), cannabis (54%), and tobacco (36%) were reported as the substances most
commonly used at the same time as ecstasy among Indigenous students who had used
ecstasy in the past year. While this pattern was similar to that found in the main ASSAD
sample, a greater proportion of Indigenous students using ecstasy reported using cannabis
(54%) on the same occasion than in the main ASSAD sample (39%) (Difference = 15.1%;
95% CI = 1.0% to 29.2%).

Substance use among Indigenous Australian secondary school students 2008 38
5.11 Use of Any Illicit Substance
The proportion of students who had used cannabis, hallucinogens, amphetamines, cocaine,
opiates or ecstasy in their lifetime, past year and past month is shown in Table 5.19.
Table 5.19:Percentage of Indigenous students who had used any illicit substance, or any
illicit substance excluding cannabis, in their lifetime, in the past year or in the past month
2008, Australia
Substance
Recency
period
Gender
12-13#
%
Indigenous
14-15^
%
12-15†
%
ASSAD 12-15
%
Life Male 14.2 34.3 23.8 11.9
Female 13.3 30.5 21.3 10.6
Total 13.7 32.5 22.6 11.2
Any illicit substance Year Male 10.3 28.4 19.0 9.3
Female 10.3 26.5 17.9 8.7
Total 10.6 27.7 19.1 9.0
Month Male 7.1 20.1 13.9 5.7
Female 6.5 16.2 11.1 4.7
Total 6.8 18.2 12.5 5.2
Life Male 7.5 14.6 11.2 5.8
Female 5.9 15.6 10.5 5.0
Total 6.7 15.1 10.8 5.4
Year Male 5.3 13.1 9.4 4.3
Female 5.0 12.4 8.5 4.0
Total 5.1 12.8 8.9 4.1
Month Male 4.7 10.6 7.8 2.8
Any illicit
substance
excluding
cannabis
Female 3.0 6.2 4.5 2.0
Total 3.8 8.5 6.1 2.4
# 95% CI for Indigenous students aged 12-13 years range from a high of ± 2.8% for used any substance
including cannabis (± 2.0% excluding cannabis) in lifetime to a low of ± 2.1% used any substance including
cannabis (± 1.6% excluding cannabis) in the past month
^ 95% CI for Indigenous students aged 14-15 years range from a high of ± 3.4% for used any substance
including cannabis (± 2.6% excluding cannabis) in lifetime to a low of ± 2.8% used any substance including cannabis (± 2.0% excluding cannabis) in the past month
† 95% CI for Indigenous students aged 12-15 years range from a high of ± 2.3% for used any substance including cannabis (± 1.7% excluding cannabis) in lifetime to a low of ± 1.8% used any substance including
cannabis (± 1.3% excluding cannabis) in the past month
See Appendix 3 for 95% Confidence Intervals estimates for different proportions for each age and gender
group.
Among the Indigenous students, older students were more likely to have used any illicit
substance than younger students.
Around 23% of Indigenous students aged 12 to 15 years had used an illicit substance in
their lifetime, this was higher than the 11% from the main ASSAD sample (Difference =
11.4%; 95% CI = 9.1% to 13.7%). Nineteen percent of Indigenous students aged 12 to 15
reported use of an illicit substance in the past year, again higher than the proportion from
the main ASSAD sample (9%) (Difference = 10.1%; 95% CI = 7.9% to 12.3%). Also 13%
of the combined Indigenous sample had used an illicit substance in the past month, this
was higher than the proportion from the main ASSAD sample (5%) (Difference = 7.3%;
95% CI = 5.5 to 9.1%).

Substance use among Indigenous Australian secondary school students 2008 39
As cannabis use was more common than use of other illicit substances, analyses were
repeated using an index of illicit substance use that excluded cannabis. The proportion of
Indigenous students who had used any illicit drug other than cannabis in their lifetime, past
year or past month are also shown in Table 5.19.
The proportions of students using any illicit drug other than cannabis were lower than when
the index of drug use included cannabis.
The proportion of Indigenous students aged 12 to 15 years that had used an illicit
substance excluding cannabis in their lifetime (11%), was higher than the proportion from
the main ASSAD sample (5%) (Difference = 5.4%; 95% CI = 3.7% to 7.1%) for the
previous year, 9% percent of Indigenous students reported use of an illicit substance
excluding cannabis, which was higher than the proportion from the main ASSAD sample
(4%) (Difference = 4.8%; 95% CI = 3.2% to 6.4%). Also 6% of the combined Indigenous
sample had used an illicit substance other than cannabis in the past month, and this was
higher than the proportion from the main ASSAD sample (2%) (Difference = 3.7%; 95%
CI = 2.4% to 5.0%).

Substance use among Indigenous Australian secondary school students 2008 40
References
Australian Bureau of Statistics (2001) Information Paper: Outcomes of ABS, Views on
Remoteness Classification, Australia 2001 (cat. no. 1244.0.00.001). Canberra, Australian Bureau
of Statistics, 2001.
Australian Bureau of Statistics (2003) Information Paper: Census of Population and Housing:
Socio–Economic Indexes for Areas, Australia 2001. Catalogue No. 2039.0. Canberra, Australian
Bureau of Statistics, 2003.
Australian Bureau of Statistics (2009). Schools, Australia, Data Cubes, 2008 (Catalogue No.
4221.0) viewed 01 July 2009,
http://www.abs.gov.au/AUSSTATS/[email protected]/DetailsPage/4221.02008?OpenDocument
White V, Smith G, ‘Australian secondary school students’ use of tobacco, alcohol, and over-the-
counter and illicit substances in 2008’, report submitted to Australian Government Department of
Health and Ageing, June 2009.

Substance use among Indigenous Australian secondary school students 2008 41
Appendix 1: Questionnaire

Substance use among Indigenous Australian secondary school students 2008 42

Substance use among Indigenous Australian secondary school students 2008 43

Substance use among Indigenous Australian secondary school students 2008 44

Substance use among Indigenous Australian secondary school students 2008 45

Substance use among Indigenous Australian secondary school students 2008 46

Substance use among Indigenous Australian secondary school students 2008 47

Substance use among Indigenous Australian secondary school students 2008 48

Substance use among Indigenous Australian secondary school students 2008 49

Substance use among Indigenous Australian secondary school students 2008 50

Substance use among Indigenous Australian secondary school students 2008 51

Substance use among Indigenous Australian secondary school students 2008 52

Substance use among Indigenous Australian secondary school students 2008 53

Substance use among Indigenous Australian secondary school students 2008 54

Substance use among Indigenous Australian secondary school students 2008 55

Substance use among Indigenous Australian secondary school students 2008 56

Substance use among Indigenous Australian secondary school students 2008 57
Appendix 2: Data matters
The procedures for processing and cleaning data for the main ASSAD study and the ASSAD
Extension study were the same and are detailed below.
Coding and editing of data
Following procedures established for the earlier ASSAD surveys, cleaning of data relating to
all substance use questions involved checking for inconsistencies in reported use of
substances across time periods (lifetime, year, month and week). This cleaning procedure
ensured maximum use of the data and operated on the principle that the subject's
response about personal use in the most recent time period was accurate. Cleaning
involved checking that the response for the most recent time period was consistent with
the response for subsequent time periods. If responses for other time periods were missing
or inconsistent with the most recent response, responses were coded to indicate use in that
time period for example, if students indicated they had used a substance in the past week
and in the past month but indicated that they had not used it in the past year or, if the
response to this question was missing, the response for the past year was recoded to
indicate that the substance had been used within this time period. This change was
considered appropriate as using a substance in the past week and month necessitates that
it was used in the past year. However, if respondents indicated that they did not use a
substance in the past week and the response for this in the past month was missing or yes,
these responses were not changed, as it is possible for someone who did not use a
substance in the past week to have used it in the past month. The missing response was
retained, as it could not be determined if the student had used the substance or not. If
students indicated that they had used it in the past week, month or year, but indicated
later that they had not in their lifetime, the response to this latter question was changed to
‘invalid’. Regardless of the students’ reported substance use, no change was made to their
response indicating how they see their own substance use behaviour, as this question was
aimed to assess self-perception only. As in previous survey years, the impact of these sorts
of recodes on the data set was minimal, with around 2-3% of data recoded.
Data Analyses Details
Because this study used a two-stage sampling procedure, the sample was less efficient
than a simple random sample of the same size. As students within the sample were
clustered by school, standard errors for prevalence estimates may have been
underestimated. Procedures within the statistical package STATA accommodate complex
sample designs within analytic procedures by adjusting for the clustering of observations.

Substance use among Indigenous Australian secondary school students 2008 58
Appendix 3: 95% Confidence intervals
95% Confidence intervals associated with different estimates for gender and age group
sample sizes achieved for Indigenous students participating in the 2008 ASSAD study.
Table 3A.1: 95% Confidence intervals for sample sizes achieved in
Indigenous students in ASSAD 2008 for males, females and people in each age group for proportions: 90%/10%; 80%/20%; 70%/30%; 60%/40%; 50%/50%.
Males
Age N 90% / 10% 80% / 20% 70% / 30% 60% / 40% 50% / 50%
12-13 269 ±3.6 ±4.8 ±5.5 ±5.9 ±6.0
14-15 375 ±3.0 ±4.0 ±4.6 ±5.0 ±5.1
12-15 644 ±2.3 ±3.1 ±3.5 ±3.8 ±3.9
Females
Age N 90% / 10% 80% / 20% 70% / 30% 60% / 40% 50% / 50%
12-13 310 ±3.36 ±4.5 ±5.1 ±5.5 ±5.6
14-15 363 ±3.1 ±4.1 ±4.7 ±5.0 ±5.1
12-15 673 ±2.3 ±3.0 ±3.5 ±3.7 ±3.8
People
Age N 90% / 10% 80% / 20% 70% / 30% 60% / 40% 50% / 50%
12-13 579 ±2.4 ±3.3 ±3.7 ±4.0 ±4.1
14-15 738 ±2.2 ±2.9 ±3.3 ±3.5 ±3.6
12-15 1317 ±1.6 ±2.2 ±2.5 ±2.6 ±2.7