final iba lecture 6
TRANSCRIPT

8/3/2019 Final IBA Lecture 6
http://slidepdf.com/reader/full/final-iba-lecture-6 1/36
1
Financial Accounting
LECTURE 6
LECTURER: MD. REZAUL KABIR
E-MAIL: [email protected]

8/3/2019 Final IBA Lecture 6
http://slidepdf.com/reader/full/final-iba-lecture-6 2/36
2
Learning objectives
After this lecture you should be able to:
A. Under stand the natur e and purpose of income statement
B. Under stand the implications of main profit measur ement
issues
C. Interpr et the information contained within a income statement.
Reading
Atrill & McLaney (2005) Financial Accounting for Decision Makers, Chapter 3.

8/3/2019 Final IBA Lecture 6
http://slidepdf.com/reader/full/final-iba-lecture-6 3/36
3
Objective 1
EXAMINE THE NATURE AND PURPOSE OF
INCOME STATEMENT

8/3/2019 Final IBA Lecture 6
http://slidepdf.com/reader/full/final-iba-lecture-6 4/36
4
A. UNDERSTAND THE NATURE AND PURPOSE OF
INCOME STATEMENT
1. What is
income stat
ement?
± to measure and report the profit or loss
± during a particular accounting period.
2. Relationship between Income Statement andBalance Sheet
± B/S shows financial position at a particular moment intime
± P & L statement shows the flow of wealth over an
accounting period.

8/3/2019 Final IBA Lecture 6
http://slidepdf.com/reader/full/final-iba-lecture-6 5/36
5
2. Relationship between Income
Statement and Balance Sheet
The following equations better explain the
relationship:
Assets - Liabilities = Capital + (Revenues ± Expenses) «« (1)
Assets - Liabilities = Capital + (-) Profit (Loss) «« (2)

8/3/2019 Final IBA Lecture 6
http://slidepdf.com/reader/full/final-iba-lecture-6 6/36
6
3. Format of income statementXYZ Limited
Income Statement for the year ended 30th September 2007.
£ £Sales 7000
Cost of goods sold:
Opening stock 2000
Purchases 4000
6000
Less: Closing stock 10005000_
Gross profit 2000
Less: Expenses:
Salaries and wages 700
Rent and rates 500Heat and light 200
Loan interest 100
Depreciation 100
1600
Net profit

8/3/2019 Final IBA Lecture 6
http://slidepdf.com/reader/full/final-iba-lecture-6 7/36
7
Objective 2
UNDERSTAND THE IMPLICATIONS OF MAIN
PROFIT MEASUREMENT ISSUES

8/3/2019 Final IBA Lecture 6
http://slidepdf.com/reader/full/final-iba-lecture-6 8/36
8
1. Revenue Recognition
Revenues are recognised:
± when the goods or services are delivered to,
and accepted by, the customer.
± not until the realisation of revenue in cash.
However , revenue recognition criteria
could vary from business to business. For example, construction business.

8/3/2019 Final IBA Lecture 6
http://slidepdf.com/reader/full/final-iba-lecture-6 9/36
9
2. Accruals and Pr epayments
The general rule is:
All expenses of a particular accounting period must be matched with the
relevant income of that period
± irrespective of the matter whether they¶re
paid or received in cash.

8/3/2019 Final IBA Lecture 6
http://slidepdf.com/reader/full/final-iba-lecture-6 10/36
10
Accrued Expenses
Outstanding expenses at the end of accountingperiod.
Example: ± outstanding rent £100
± already paid rent £900.
Treatment: ± P&L: £1000 (900+100)
± B/S: current liability £100.

8/3/2019 Final IBA Lecture 6
http://slidepdf.com/reader/full/final-iba-lecture-6 11/36
11
Pr epaid Expenses
Expenses paid in the current year for thenext year.
Example: Annual rent is £1200. But £1400 is paid in the current year.
Treatment: ± P&L: £1200 as current year¶s expenses
± B/S: £200 as current asset.

8/3/2019 Final IBA Lecture 6
http://slidepdf.com/reader/full/final-iba-lecture-6 12/36
12
Outstanding Income
Income earned but not received within thecurrent period.
Example: ± fees outstanding £200.
± fees already received £1800
Treatment: ± P& L: under income (1800+200=£2000)
± B/S: outstanding fees £200 under current asset.

8/3/2019 Final IBA Lecture 6
http://slidepdf.com/reader/full/final-iba-lecture-6 13/36
13
Income r eceived in advance
You received next year¶s revenue in this
year.
Example: ± You¶ve received both current (£2000) and
next year¶s fees (£2000) together.
Treatment:
± P& L: Only £2000 as current year¶s income.
± B/S: The balance £2000 as current liability.

8/3/2019 Final IBA Lecture 6
http://slidepdf.com/reader/full/final-iba-lecture-6 14/36
14
Progress Check 1
For the accounting period 1st January to
31st December 2006 a trader paid £2800 as
r ent. The trader¶s monthly r ent is £200 only.
Calculate how much r ent should be shownin the P& L Statement for the year ended
31st December, 2006.
a. £2800
b. £2400
c. £2600
d. £3000
8/3/2019 Final IBA Lecture 6
http://slidepdf.com/reader/full/final-iba-lecture-6 15/36
15
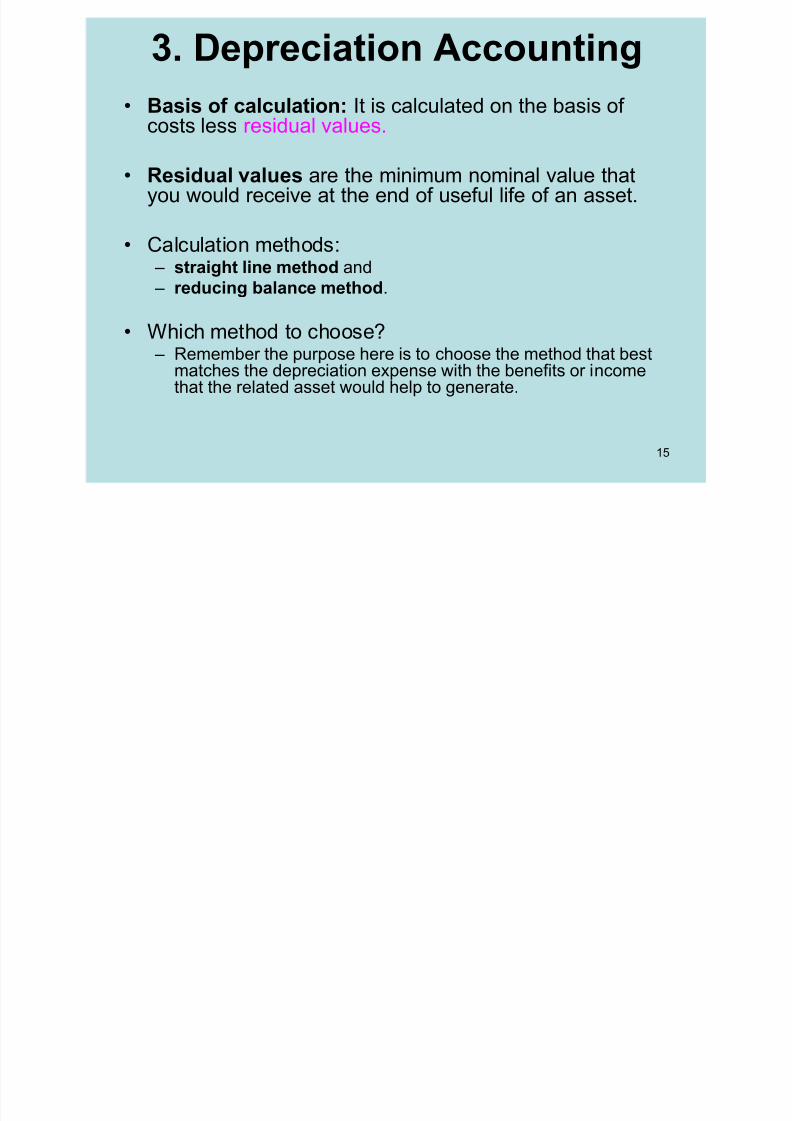
3. Depr eciation Accounting
Basis
of calculation: It is calculated on the basis of costs less residual values.
Residual values are the minimum nominal value thatyou would receive at the end of useful life of an asset.
Calculation methods: ± straight line method and
± r educing balance method.
Which method to choose? ± Remember the purpose here is to choose the method that best
matches the depreciation expense with the benefits or incomethat the related asset would help to generate.
8/3/2019 Final IBA Lecture 6
http://slidepdf.com/reader/full/final-iba-lecture-6 16/36
16
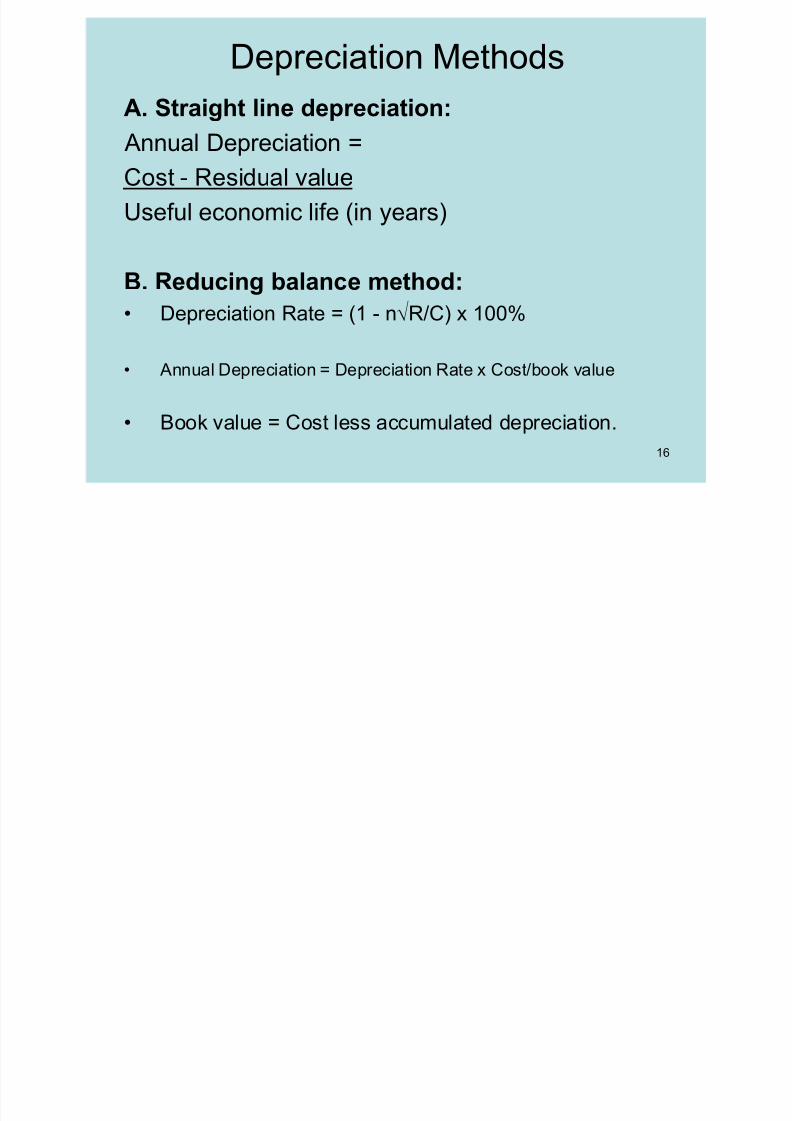
Depreciation Methods
A. Straight line depr eciation: Annual Depreciation =
Cost - Residual value
Useful economic life (in years)
B. Reducing balance method:
Depreciation Rate = (1 - nR/C) x 100%
Annual Depreciation = Depreciation Rate x Cost/book value
Book value = Cost less accumulated depreciation.

8/3/2019 Final IBA Lecture 6
http://slidepdf.com/reader/full/final-iba-lecture-6 17/36
17
Example
Plant and machinery was bought on the 1
January 2007
Cost: £1,000 Expected useful economic life of 3 years
Estimated residual value of £343.

8/3/2019 Final IBA Lecture 6
http://slidepdf.com/reader/full/final-iba-lecture-6 18/36
18
Example
1. Straight line method:
(£1,000 - £343) z 3 = £219 p.a.
2. Reducing balance method:
____
Rate = (1 - 3£343 z £1,000) x 100 = 30%2007: 30% x £1,000 = £300
2008: 30% x (£1,000 - £300) = £210
2009: 30% x (£1,000 - [£300 + £210]) = £147
Under this method book value/written down value of the asset at the end of 2007 would be £700 (1000-300).

8/3/2019 Final IBA Lecture 6
http://slidepdf.com/reader/full/final-iba-lecture-6 19/36
19
Example of Corporate Practice
Tangible fixed assets are stated at costless a provision for depreciation.Depreciation is calculated to write off the
cost of tangible fixed assets, excludingfreehold land, in equal annual instalmentsover their expected useful lives.
(Extract from Glaxo Annual Report, 2002, P.84)

8/3/2019 Final IBA Lecture 6
http://slidepdf.com/reader/full/final-iba-lecture-6 20/36
20
Progress Check 2
A machinery was purchased on 1st Jan.
2005 at a cost of £10,000. Depr eciation was
charged @ 10% following the r educing
balance method. What will be the annualdepr eciation charge for the year ended 31st
December, 2006?
a. £1000
b. £900
c. £810
d. £100

8/3/2019 Final IBA Lecture 6
http://slidepdf.com/reader/full/final-iba-lecture-6 21/36
21
4. Stock Valuation 1 C ost of Goods Sold = Opening Stock + Purchases ±
C losing Stock.
Main Valuation Rule: ± It is normally valued at cost or net realisable value (NRV)
whichever is lower.
± It needs to be done on an item by item basis
Example: if cost of stock is £100 and NRV is £80 it¶ll bevalued at £80.
NRV = estimated selling price less estimatedexpenditures required to complete and sell the stockitem.

8/3/2019 Final IBA Lecture 6
http://slidepdf.com/reader/full/final-iba-lecture-6 22/36
22
Progress Check 3The stock of Cher Ltd at the end of its accounting year was composed of the following
three items:
Cost Net realizable value
£ £
Product A 1,000 1,200
Product B 2,000 2,300
Product C 3,000 2,400
6,000 5,900
This stock would be shown in the balance sheet at an amount of:
A. £5,400B. £5,900
C. £6,000
D. £6,500

8/3/2019 Final IBA Lecture 6
http://slidepdf.com/reader/full/final-iba-lecture-6 23/36
23
Stock Valuation 2
Determination of cost depends on the
following assumptions:
± First in, first out (FIFO) - earlier stocks held
are the first to be sold.
± Last in, first out (LIFO) ± the latest stocks held
are the first to be sold.
± Weighted average ± under this method newunit price are calculated every time a new
stock item arrives in the store.

8/3/2019 Final IBA Lecture 6
http://slidepdf.com/reader/full/final-iba-lecture-6 24/36
24
Example (Atrill & McLaney, 2005)
1 October opening stock 1000 units @ £10
2 October purchased 5000 units @ £11
3 October purchased 8000 units @ £126 October sold 9000 units @ £20
R equired: Find the value of closing stock.

8/3/2019 Final IBA Lecture 6
http://slidepdf.com/reader/full/final-iba-lecture-6 25/36
25
FIFO
£
1000X10 = 10000
5000X11 = 550003000X12 = 36000
101,000 Cost of sales
5000x12 = 60,000 Closing Stock

8/3/2019 Final IBA Lecture 6
http://slidepdf.com/reader/full/final-iba-lecture-6 26/36
26
LIFO
£
1000X11 = 11000
8000X12 = 96000107,000 Cost of sales
4000x11 = 44,000
1000x10 = 10,00054,000 Closing Stock

8/3/2019 Final IBA Lecture 6
http://slidepdf.com/reader/full/final-iba-lecture-6 27/36
27
WEIGHTED AVERAGE
1000X10 = 10000
5000X11 = 55000
8000X12 = 9600014,000 £161,000 / 14,000 = £11.5 per unit
9000x£11.5 = £103,500 Cost of sales
5000x£11.5 = £57,500 Closing stock

8/3/2019 Final IBA Lecture 6
http://slidepdf.com/reader/full/final-iba-lecture-6 28/36
28
Impact on Profits
FIFO LIFO WA
Sales (9000x£20) 180,000 180,000 180,000
Cost of goods sold 101,000 107,000 103,000
Gross Profit 79,000 73,000 76,500
Impact on balance sheet
Closing stock 60,000 54,000 57,500

8/3/2019 Final IBA Lecture 6
http://slidepdf.com/reader/full/final-iba-lecture-6 29/36
29
Corporate Practice
Stocks ar e included in the financialstatements at the lower of cost
(including manufacturing overheads,
wher e appropriate) and net r ealisable value. Cost is generally determined ona fir st in, fir st out basis.
(Extract from Glaxo Annual Report, 2002, P.85)

8/3/2019 Final IBA Lecture 6
http://slidepdf.com/reader/full/final-iba-lecture-6 30/36
30
5. Provision for bad and
doubtful debts Not all customers to whom you sell on
credit will pay.
You¶re required to make some provisionsfor bad and doubtful debts.
Realistically we can assume that aproportion of them will default.

8/3/2019 Final IBA Lecture 6
http://slidepdf.com/reader/full/final-iba-lecture-6 31/36
31
Example
Trade debtors £300,000 at 30th June,
2003.
Out of them £10,000 was found to beirrecoverable (bad) on investigation.
To be on the safer side, management
decided to make another provision for
doubtful debts at 10%.

8/3/2019 Final IBA Lecture 6
http://slidepdf.com/reader/full/final-iba-lecture-6 32/36
32
Solution to Example
Profit and Loss
Bad debts written off 10,000
Provision for doubtful debts (300,000 ± 10,000) x 10% 29,000
Balance Sheet
Trade debtors 300,000
Less: Bad debts written off 10,000
Recoverable debt 290,000
Less: Provision for doubtful debts 29,000261,000
======

8/3/2019 Final IBA Lecture 6
http://slidepdf.com/reader/full/final-iba-lecture-6 33/36
33
6. Capital and Revenue Expenditur e
Capital Expenditures: ± The benefits go beyond one accounting year.
± It is long-term in nature and non-recurrent.
± Examples: fixed assets ± Treatment: balance sheet.
Revenue expenditures: ± are incurred to run day to day business.
± short-term and recurrent in nature.
± Example: heating and lighting.
± Treatment: income statement.

8/3/2019 Final IBA Lecture 6
http://slidepdf.com/reader/full/final-iba-lecture-6 34/36
34
Objective 3
INTERPRET THE INFORMATION CONTAINED
WITHIN AN INCOME STATEMENT

8/3/2019 Final IBA Lecture 6
http://slidepdf.com/reader/full/final-iba-lecture-6 35/36
35
P & L Analysis 1
Comparisons:
±Yearly
±with budget
±with competitor ± industry average.

8/3/2019 Final IBA Lecture 6
http://slidepdf.com/reader/full/final-iba-lecture-6 36/36
36
P & L Analysis 2
Gross Profit Ratio = Gross Profit/Sales x
100.
± XYZ limited: 28.5% (2000/7000 x100).
Net Profit Ratio = Net Profit/Sales x100.
± XYZ: 5.7% (400/7000 x 100).