final corporate plan 2012-2017 - uprvunl plan 2012-2017.pdf · projected power consumption in 2010...
TRANSCRIPT

UTTAR PRADESH RAJYA VIDYUT UTPADAN NIGAM LIMITED
2011
Final Corporate Plan 2012-2017
M. Akbar
INDIAN INSTITUTE OF MANAGEMENT LUCKNOW
P R A B A N D H N A G A R O F F S I T A P U R R A O D L U C K N O W - 2 2 6 1 0 1 3

2
Contents Acknowledgments ................................................................................................................................... 4
Executive Summary (Corporate Plan 2017) .............................................................................................. 5
Employee Welfare ............................................................................................................................... 8
Corporate Social Responsibility ............................................................................................................ 8
Methodology ................................................................................................................................... 10
Table1: Demand Pattern from 2000-2010 (MU) ............................................................................. 10
Table2: Demand Projections 2010-17............................................................................................. 12
Projected Power consumption in 2010-11 & 2016-17 ........................................................................ 12
Graph: Projections based on linear trend ............................................................................................... 13
Graph showing regression based on lead indicators ........................................................................... 14
Table 4: Capacity Required in MU and MW in UP ........................................................................... 15
Supply Projections ................................................................................................................................. 15
Estimating Supply of power in UP .......................................................................................................... 15
Methodology ......................................................................................................................................... 16
Table 5: Assumptions ..................................................................................................................... 16
Table 6: showing average cost/MW by different Project Process ....................................................... 17
Table 7: NPV of Investment in different Project processes ................................................................. 17
Conclusion ......................................................................................................................................... 17
Table 8: Existing Projects ............................................................................................................... 18
Table 9: Sector and Raw material wise availability in 2009-10 ........................................................ 18
Table 10: Ongoing up rating of UPRVUNL Plants ............................................................................ 19
Table 11: Expected project completion dates of UPRVUNL Projects (As on March, 2011) .............. 19
Table12: 11th five year Plant availability of power with UPRVUNL................................................... 20
Table 13: Total power availability in 12th Plan in MW ..................................................................... 20
Table 14: Projected Demand and supply 2012-17 .............................................................................. 21
Table 15: Demand- supply gap in Up .............................................................................................. 21
Table 16: Details of New Entrants in BTG ....................................................................................... 24
Table 17: Main vendors for BOP ........................................................................................................ 25
Table 18: Capacities across BOP Packages .......................................................................................... 25
Coal Supply: ....................................................................................................................................... 25
Progress on captive blocks hit by forest clearance, land acquisition hurdles ....................................... 27

3
Captive blocks in forest land face maximum delay in commissioning .................................................. 28
Captive coal supply to rise significantly from 2012-13 ........................................................................ 30
Private sector to dominate production, Jharkhand to top supplier states ............................................ 32
Strategic Intent...................................................................................................................................... 33
Vision .................................................................................................................................................... 34
Mission.................................................................................................................................................. 34
Mission Statement ................................................................................................................................ 37
Corporate Values ............................................................................................................................... 37
Corporate Objectives ......................................................................................................................... 37
SWOT Analysis ................................................................................................................................... 38
Strengths ............................................................................................................................................... 38
Weaknesses .......................................................................................................................................... 39
Opportunities ........................................................................................................................................ 41
Threats .................................................................................................................................................. 43
Corporate & Business Strategies ............................................................................................................ 44
Managing Dynamic Environment ........................................................................................................... 45
Business Portfolio .................................................................................................................................. 46
Smoothening Supply Chain .................................................................................................................... 47
Operations including project management ............................................................................................ 48
Human resource management .............................................................................................................. 50
Organizational Restructuring ................................................................................................................. 52
Board of Directors ................................................................................................................................. 54
Board of Directors ................................................................................................................................. 55
Investment management ................................................................................................................... 57
Financial projections .......................................................................................................................... 57
Table 19: Estimated cost of investments ............................................................................................ 58
Table 20: Total cost projections ......................................................................................................... 58
Table21: ROE and Liquidity projections .............................................................................................. 59
Employee Welfare ............................................................................................................................. 59
Corporate Social Responsibility .............................................................................................................. 59
WAY FORWARD ..................................................................................................................................... 62
Table 6: showing average cost/MW by different Project Process ....................................................... 67

4
Table 7: NPV of Investment in different Project processes ................................................................. 67
Table 3 .............................................................................................................................................. 72
Table 4: Nigam Manpower: An Overall View .................................................................................. 73
Table 5: ................................................................................................................................................. 74
Table -6 ................................................................................................................................................. 75
Annexure III: Organizational Structure (Copyright E&Y) ...................................................................... 79
Acknowledgments
Let me take this opportunity to acknowledge all those who have contributed to the
understanding and support to the study carried for developing the corporate Plan 2017 for
Uttar Pradesh Rajya Vidyut Utpadan Nigam Ltd., UPRVUNL or Nigam in short. The cooperation
received from the top management which includes the CMD, Mr Alok Tandon, the functional
and plant managers who have participated in the open meeting at the very stage of the project.
In particular the support received from Mr. Rajiv Goyal, Chief Engineer (HR) , Mr. Dileep Kumar
and Vijay Kumar Gupta who have continuously worked and prodded me to bring in the report
to a respectable level. Many consultants from E&Y who had cooperated and shared their
insights and work with me. My thanks to all of them
At IIM Lucknow I have received help from Research Assistant, Mr. Ashish Hajela , my FPM
student and four of my very bright PGP students- Ashutosh Singh Chandel, Siddhrath Shankar
Choudhary and Siddrath Srivastava- who worked tirelessly for my study along with their course
commitment. There had been many other innumerable people who made this study possible
deserve our sincere thanks. Even after so much cooperation if anything has gone wrong or
missing, I am entirely responsible for those failings.
M. Akbar
Professor, IIM Lucknow
April 19, 2011

5
Executive Summary (Corporate Plan 2017)
The environment for UPRVUNL looks good because of very high demand for electricity for which
deficit would last for next 6-7 years. Managing ongoing and new projects is critical to benefit
from the market demand. The corporation has enough experience in implementing the projects,
but the equipment supplies and receivables had been major concerns.
One of the strongest point is the established business and early mover advantage for UPRVUNL
in the State of Uttar Pradesh with deeper technical processes like the design and development,
erection and commissioning with very experienced people and 5 major plants with about 4000
MW capacity.
The very strengths are converting into debilitating liabilities. The plants are ageing, the people
have become somewhat complacent with obsolescing skills with increasing burden of wages
and inefficiencies resulting into not so good financial performance. The non-cooperative
suppliers, increasing competition are threatening the financial health of the corporation.
In the review report 2005-12 it became clear as in corporate plan 2012-17 that the corporation
needs to handle some of these critical problems. We suggest that to reduce monopoly power of
suppliers like BHEL, the corporation needs to diversify BTG supplier base with internationally
recognized and cheaper vendors especially from China. The coal supply chain needs to be further
smoothened and internal project teams are constituted with capable/ well trained people in
project management skills and technical capabilities. Sadly the experienced managers and the
top management in spite of being highly committed to the physical and financial progress have
not been able to reach performance levels that were targeted.
6
Therefore the whole organization needs to be revamped : corporate and plant structures,
organizational cadres, re-allocation of employees to right jobs , strengthening project
management and building new capabilities for larger sized projects, get off from up rating
projects to new projects at the same premises, except those projects which can give services at
least for next 15 years with PLF above 60%, benchmarked auxiliary consumption, reduced
outages, SHR, cost per unit. The regulator cannot perpetually fund the inefficiently generated
power by compensating with higher tariffs. The competitive pressure will be felt immediately
after the supply deficit is overcome.
Each of the ten areas recommended must be worked upon if the corporation needs to reach its
desired vision and meet it mission commitments: Managing dynamic environment, balancing
business portfolio, smoothening supply chain, operations including project management,
Human resource management, organizational restructuring, Board of Directors, and investment
management , Employee welfare and corporate social responsibility .
Managing dynamic environment
There is need to establish the environmental intelligence group assisting both in operations,
strategic areas like new investment, divestment, closure etc to help make more discipline
decisions
Balancing business portfolio
Although O&M, R&M and refurbishment will remain important areas given more than average
aging plants, however the investment should shift towards new projects due to better economy
and better market control. Retirement of many aging units may be a wise strategy
Smoothening Supply chain
The most critical aspect here is the BTG and BOP timely supplies. Diversified vendor base will
help timely commissioning of projects. In case of contractual failures penalty clause should be
enforced on undue delays. The coal and oil supply chains must be studied for better efficiencies
and environmental compliance perspective.

7
Operations including project management
Here the most critical area is to build critical project management competencies and
empowered structural positions of project management teams. Operational benchmarks as
targets be pursued vigorously through well designed organizational structures, clear
accountability and incentive systems. ERP and IT project should be implemented at faster speed
to derive returns from this investment.
Human resource management
This being the only source of competitive advantage enough resources must be diverted
towards training and development with at 3% budget of revenue dedicated to training and
development for the employees. The cadre restructuring should be done keeping in mind that
the internal environment is enabling and empowering with adequate responsibility and
accountability
Organizational Restructuring
The PRAGATI team’s proposed organizational structure (draft) appears to meet the new
requirements of the organizations. However, a concept of executive teams is proposed at the
corporate and each plant levels. The strategy and project management should be given higher
emphasis. The divisional structure ( with profit responsibility) will un-clutter information
overload as well as more effective operations because of clear accountability.
Board of Director
We suggest that board of directors should also be restructured by bringing in more independent
directors and create more transparency so that in future it could be listed on stock exchanges.
In some critical areas board committees should be constituted
Investment management
Emphasis should be placed on profitability and more internal generation of funds for investment
in future projects, without perpetually depending on the UP Government. This is necessary

8
especially in future if capital markets were to be tapped. By 2017 it should acquire financial
autonomy. It is necessary the government continue funding until then and it should issue bonds
to fund investment against receivables from its customers.
It is suggested that if the above areas are successfully navigated the corporation has the
potential to meet its vision and mission spirit.
Employee Welfare
Employees are the greatest resource of any organization, especially if they are considered the
source of competitive advantage. The developmental needs of employees on the job must be
seriously considered and their socio-psychological needs beside physical comfort. The working
environment should have hazard free and physically comfortable working ambience especially
in plants. Medical facilities, recreation needs and religious and social needs may be considered
with very clear policy and programmes.
Corporate Social Responsibility
It is essential to build a focus of CSR activity to have impact. Beside R&R guidelines, which are
very well elaborated by NTPC, which can be modified as per Nigam needs and vision, the
corporation should focus on an impact area like education, especially scholarship scheme for
higher education. The other important are to which Nigam can look into is the construction of
electricity distribution network around 5 Kms. radii around each of the plants for the local
communities. A mobile health van can provide assistance through an NGO engaged in health
sector in the proximity of each plant. Finally drinking water facilities can be provided to the
local communities.

9
Introduction Energy is the most important building block of every civilization. Most of the modern day war in
fact is, overtly or covertly fought over energy security. Much of the past slow social-economic
development can directly or indirectly be attributed to lack of energy resources specially
electricity. To power the growth of the country to gain and sustain 10% growth in GDP will raise
more energy demands, including hydrocarbons and electricity. The later still the cheapest
source and possibly one of the cleanest sources of energy, notwithstanding the polluting supply
side of generation if oil or coal is used. UPRVUNL represents the pride place in electricity
generation in the state of Uttar Pradesh. The common man and the government look at it with
considerable expectations to solve the problem of energy needs in the State. It is therefore
imperative that UPRVUNL go beyond what it is doing today in meeting these expectations or it
will be dumped by its stakeholders. It is the onus on its managers to make it a more vibrant ,
responsive and responsible organization to all its stakeholders and thus it needs to review its
functioning and improve management systems in order to meet the expectations raised by its
stakeholders: common man, immediate customers, suppliers, owners , managers and many
thousand employees, regulators, lenders and supporters . But before we begin with articulating
its strategic intent in the form of vision, mission and objectives, we need to analyze the demand
and supply scenario.
Demand Projection
Business forecasting can be done by:
1. Trend projection method

10
This methodology is quantitative in nature and gives us figures based on regressing the
past time series data.
2. Barometric method
The government has an ambitious program “Power all by 2012” (a lead indicator) which
indicates higher demand prospects for electricity in coming years. Uttar Pradesh being
the second largest state-economy of India contributes 8.17% to India’s GDP. Given the
fact that Uttar Pradesh’s economy has grown by 7% in last 5 years we expect that this
will continue leading to higher demand of manpower, capital, and infrastructure
including electricity (coincidental indicators).
We have used the trend projection method to forecast the demand for the next seven years viz.
2011-2017.
Methodology The time series forecasting can be done using the trend of past years. These trends can be
captured as linear, exponential functions. Following the demand breakup in previous years, we
feel that a linear estimation will be a better indicator. The past data has been taken from the
power census done by central government. Data for some years was not available and has been
interpolated from the other years.
Table1: Demand Pattern from 2000-2010 (MU)
Sector
Industrial (I)
Domestic (D)
Utilities (U)
Agricultural (A)
Total
2000-01 7177 7513 752 4473 22865 2001-02 7301.4 9265.8 928.5 4986.6 25238.4 2002-03 7286.77 9245.96 926.51 4974.92 25184.36 2003-04 7374 9311 1861 5814 26907 2004-05 7686.89 9668.2 1932.39 6037.05 27989.25 2005-06 8801.5 12567.1 2082.48 5321.8 30109.3 2006-07 10097.77 14406.48 2389.19 6105.53 34543.73 2007-08 10971.26 15682.69 2596.86 6633.74 37531.88 2008-09 11446.75 16329.66 2708.13 6920.64 39155.1 2009-10 11111.28 18578.06 2786.2 7774.65 40283.86

11
Looking closely we can observe that the trend was different before 2003 where it was relatively
flatter. Demand has grown at a higher rate in last 6 years. Hence we will forecast the total
demand using linear regression over last 6 years. The sector-wise demand in following years
will be done on the basis of current (2009-10) sector-wise allocation.
By 2015, the state will require about 54211 MU of power, an increase of about 14000 MU
over current demand. The projections for different sectors for the next five years using this
technique are:

12
Table2: Demand Projections 2010-17
Sector
Industrial (I)
Domestic (D)
Utilities (U)
Agricultural (A)
Total (in MU)
2010-11 12184
20371.97 3055.2 8525.4 44174
2011-12 12876
21529.21 3228.8 9009.7 46683
2012-13 13568
22686.44 3402.3 9494 49192
2013-14 14261
23843.68 3575.9 9978.2 51702
2014-15 14953
25000.91 3749.5 10463 54211
2015-16 15645
26214.10 3923 10947 56720
2016-17 16337
27487.20 4096.6 11431 59485.20
Projected Power consumption in 2010-11 & 2016-17
13
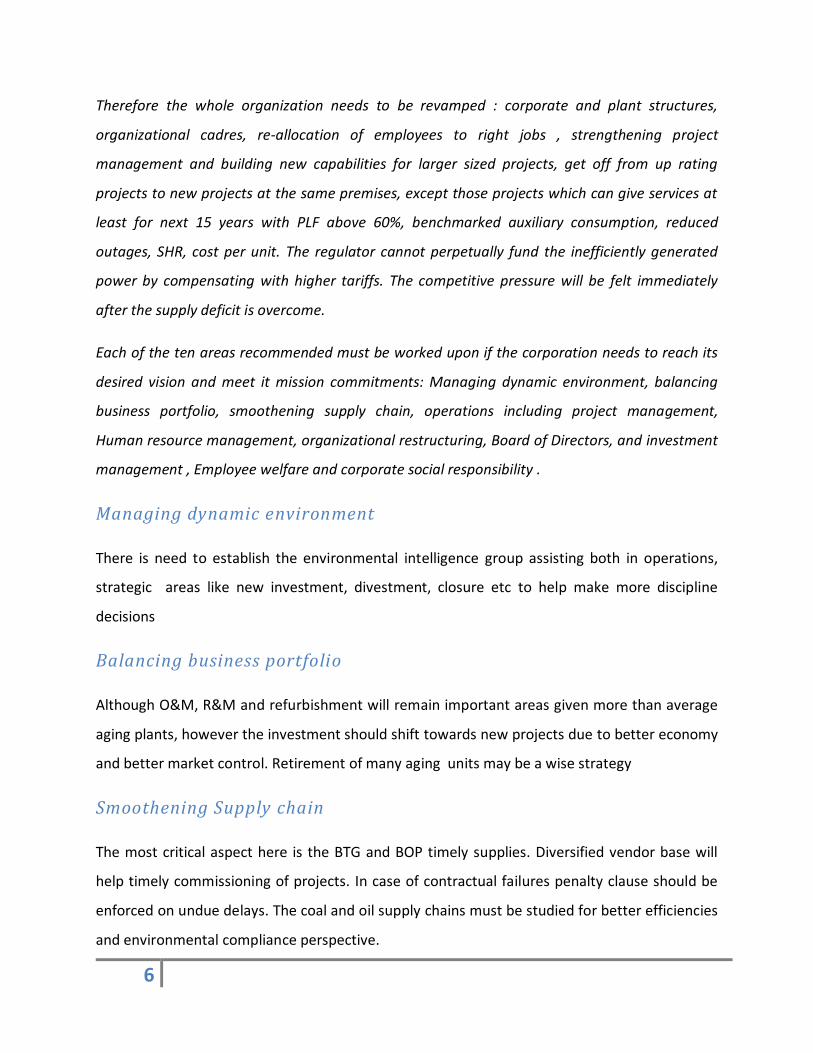
Graph: Projections based on linear trend
From the past data and the projections, we can observe that the growth rate in industrial,
utilities and agricultural sector have been almost half that of the domestic consumption. Much
of the rural areas were not electrified earlier but now are slowly being covered by the grid
leading to increased demand in this sector.
The “demand” data is very close to “consumption” data from 2000-2010(refer to “Category
Wise Energy Sold in UP” data). This is indicative of the fact that demand estimation has only
been done for cities, towns and villages which have been covered by grid in their respective
years. This means that the demand from un-electrified regions of Uttar Pradesh is not a part of
these projections. Besides there is unmet demand due to roistering and non-supply of
electricity especially during peak hours. To achieve a more holistic projection of demand, we
have used the population and GDP of Uttar Pradesh and compared it with other states. The
scatter plot below shows the Per capita GDP vs. Per capita electricity demanded for various
states.
14
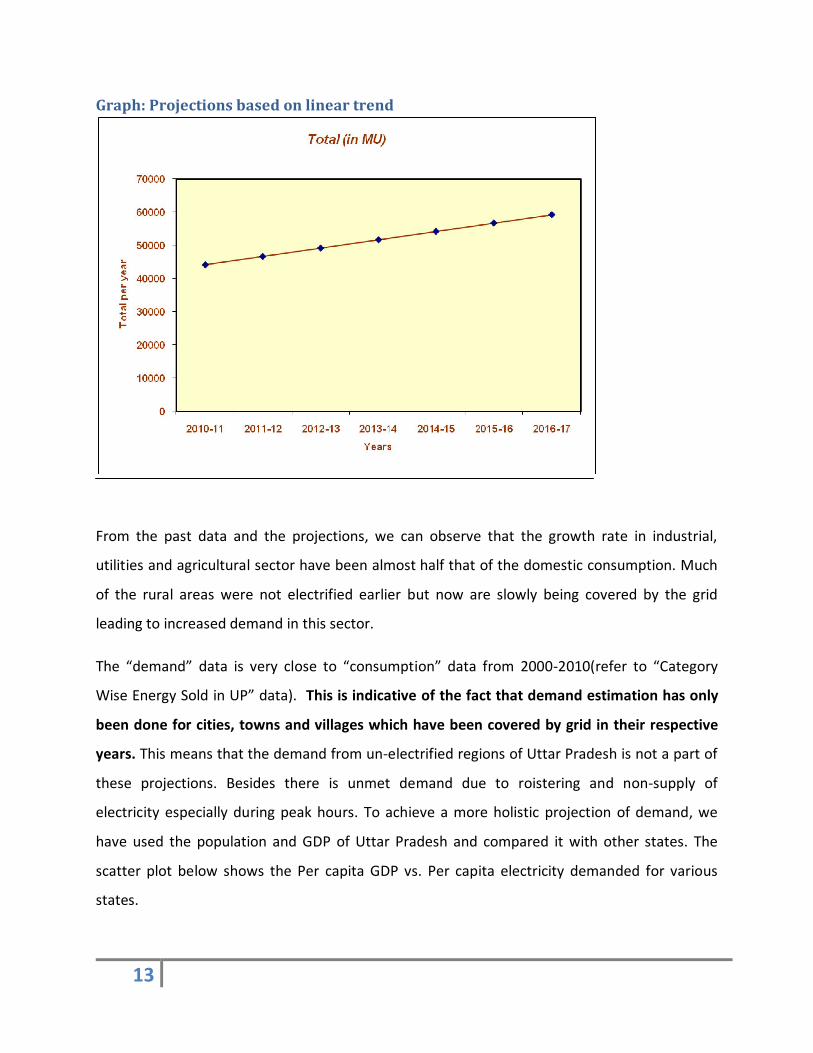
Graph showing regression based on lead indicators
The above graph denotes that SDP and electricity consumption fit a linear regression line with
61% predictability, and SDP can be considered as a good predictor of electricity consumption
per capita.
Using the values obtained from this regression and the annual growth rate of GDP and
population, we are able to project the demand in Uttar Pradesh.
Assumptions: GDP Growth Rate 10%
Population Growth Rate 2.16%
Availability factor 0.66
15
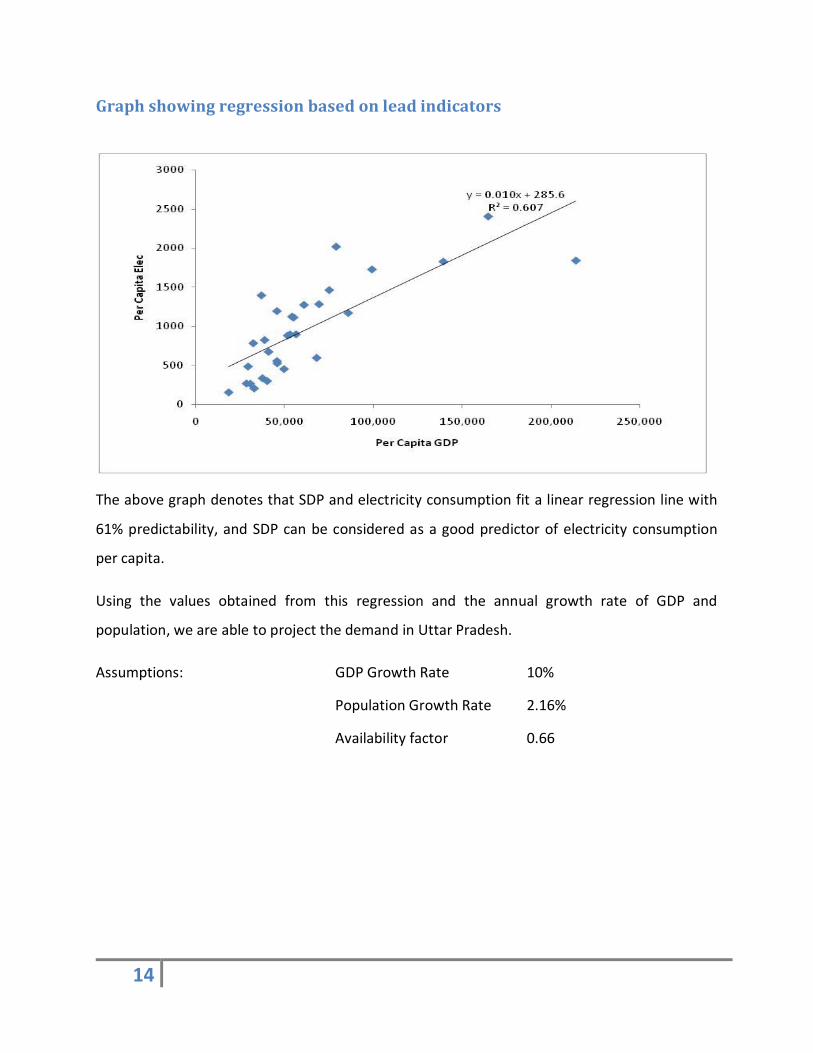
Table 4: Capacity Required in MU and MW in UP
Year GDP (in Crores) Population
Per Capita GDP
Per Capita Energy (kwh)
Total Requirement ( MU)
Capacity Required ( MW)
2010 491,302 199,636,280 29,587 600 103,212 17,596 2011 530,606 199,636,280 31,279 620 105,221 18,199 2012 573,055 203,948,423 33,068 641 111,088 19,214 2013 618,899 208,353,709 34,959 663 117,369 20,300 2014 668,411 212,854,149 36,958 686 124,096 21,464 2015 721,884 217,451,799 39,071 711 131,303 22,711 2016 779,635 222,148,758 41,306 737 139,029 24,047 2017 842,005 226,947,171 43,668 764 147,312 25,480 2018 909,366 231,849,230 46,165 793 156,197 27,016 2019 982,115 236,857,173 48,805 824 165,731 28,665 2020 1,060,684 241,973,288 51,596 856 175,963 30,435 2021 1,145,539 247,199,911 54,547 890 186,948 32,335
The results obtained from this regression reveal that the demand severely exceeds the
estimates from preceding method. However, these results are more accurate as the net
demand is directly linked to the population and electricity consumption per person.
Supply Projections
Estimating Supply of power in UP
In order to increase the power generations there are two alternatives available. One is
obviously to increase the installed capacity by building new plants. This is a long term solution
but this will take a lot of time and investment. On the other hand there are quick fix solutions
like renovation and modernization (R&M), refurbishment, up rating and life extension. These
R&M and refurbishment increase power generation by improving the operating condition of
the plant in terms of PLF and availability. Up rating on the other hand is a small capacity

16
addition to existing plants. Life extension increases the life of the plant, which otherwise is 25
years. These solutions require less investment compared to new plant and can be implemented
quickly. However their benefits are limited in terms of useful life and the power output.
Methodology We have compared refurbishment and uprating to new plant in terms of Net Present Value of
the Capex required for a 1MW capacity and the additional revenues generated. The detailed
calculations and the assumptions taken can be seen in the excel sheet attached as Annexure IV
All the inputs and assumptions to the model are kept in a separate tab “Assumptions and
Inputs” of table 5 bellow. In case of any disagreement with any of the assumptions/values or to
carry any sensitivity analysis the value can be changed in the assumptions sheet. All the related
changes will get reflected in the calculations and results.
Table 5: Assumptions Assumptions
Per Mega Watt cost of establishment of new plant = 5 Crore Economic viable life of new plant = 25 Years
Average PLF ove life of a plant = 85 % Percentage increase in PLF due to refurbishment = 25 %
Time after which new plant will require R&M = 10 Years Yearly R&M expenses as percentage of gross block = 3.5 %
Per Mega Watt cost of refurbishment = 1.8 crore Number of years of benefit from refurbishment = 15 Years
Per Mega Watt cost of uprating = 3 Crore Number of years of benefit from uprating = 15 Years
Discount rate for finding present value of benefits = 7 % Approved tariff = 1.8 Rs/unit
Auxiliary Power consumption = 8 % Outage = 7 %
Variable operating costs are assumed to be same for new and refurbished plants In case of refurbishment or upration R&M expenses will continue to occur at the
same rate as in 10yr old plant
In fact the Operating costs will be lower thus improving NPV.

17
The excel sheet is provided as Annexure IV separately in electronic form. However, the result
summary is presented below:
Table 6: showing average cost/MW by different Project Process Average Cost/MW
Row Labels Average of cost/MW
R&M 0.806 Refurbishment 1.879 uprating 3.015 Grand Total 1.484
Table 7: NPV of Investment in different Project processes
Project Process
NPV in Crores
New Plant 7.47 Refurbishment -0.80 Uprating 5.78
Conclusion From the calculation it was seen that a new plant would be most beneficial followed by
uprating in terms of the net present value. Refurbishment was not found profitable for the
given set of benefits it is expected to provide. Therefore it is not recommendable to carry out
refurbishment unless it is the only possibility due to resource crunch or pressure from demand
side. However other than financial criteria should be considered, which may temper the above
conclusion.
Other major issue discovered in case of refurbishment and R&M is the delay of supplies from EPC
contractor. This has caused delay in repair and maintenance activities and caused permanent damage to
facilities besides decreasing efficiency. A penalty clause for delay should be incorporated in EPC
contracts to account for any delay.

18
Table 8: Existing Projects
Plant Age of Plant
Unit Nature Capacity Capacity Addition
(MW) cost/MW
Obra 43 1,2 Refurbishment 100 20 1.72 Harduaganj 33 5 R&M 60 0 0.34 Obra B (5*200) 30 Refurbishment 1000 80 1.51
Anpara A 23 R&M 630 0 1.25
Harduaganj 32 7 uprating 120 10 3.02 Obra A 35 7,8 R&M 188 0 0.95
Anpara B (2*500) 30 R&M 1000 0 0.69
Parichha 25 1,2 Refurbishment 220 0 2.40
Capacity Projection Uttar Pradesh Currently has 10369 MW of installed power generation capacity of which 4082 MW comes from UPRVUNL. Following is the breakup of the current capacity in UP.
Table 9: Sector and Raw material wise availability in 2009-10
Current Capacity (till 2009)
Uttar
Pradesh
Installed Capacity of Power Plants in UP (in MW)
Thermal
Total
Terms
Nuclear
Hydro
(Renew-
able)
RES
(MNRE)
Grand
Total
Coal Gas Diesel
State 4082 0 0 4082 0 524.1 25.1 4621.2
Private 0 0 0 0 0 0 545.5 545.5
Central 2540.84 549.97 0 3090.81 203.72 1073.32 0 4367.85
Sub-Total 6612.84 549.97 0 7162.81 203.72 1597.42 570.6 9534.55

19
In addition to this UPRVUNL has undertaken/ proposed uprating of its existing plants which will
enhance its capacity by another 110 MW.
Table 10: Ongoing up rating of UPRVUNL Plants
UPRVUNL also has some ongoing projects which will come up in the near future increasing the
UPRVUNL’s capacity by 2000 MW. Following are the details of UPRVUNL’s projects:
Table 11: Expected project completion dates of UPRVUNL Projects (As on March, 2011)
Name of the Project
Ownership Capacity Status Schedule for synchronization
Paricha TPS Stage II
UPRVUNL 500 Under construction Expected by the Nov, 2011 and Dec, 2011
Harduaganj TPS Extn (Stage II)
UPRVUNL 500 Under construction Expected by May,11 and Jul, 2011
Anpara D TPS Unit I
UPRVUNL 500 Under construction Expected by the Dec,2011
Anpara D TPS Unit II
UPRVUNL 500 Under construction Expected in 12th plan
Four private sector/NTPC projects are also in progress in UP, which will give varying share of
their output to the state:
Plant Age of Plant
Unit Nature Status Life Exp Capacity Addition (MW)
Obra 43 1,2 Refurbishment Completed 15 20 Obra B (5*200) 30 Refurbishment Ongoing 15 80 Harduaganj 32 7 uprating Ongoing 15 10

20
Table12: 11th five year Plant availability of power with UPRVUNL 11th Five Year Plan (in MW)
Private Sector 1530
MOUs 450
Central Govt. 1571
Total 3551
In addition there have been several MOU’s signed by UPPCL in the recent past with the various
power producers to setup their facilities in the state, and there are several other projects in the
pipeline including a few from UPRVUNL (Panki Extn, Harduaganaj Extn Stage II, Obra C, Anapara
E). Following are the details for the 12th Five year plan.
Table 13: Total power availability in 12th Plan in MW
Source: UPRVUNL
For these projects a conversion rate of 50% can be assumed considering the various hurdles
they may face.
Considering these capacity addition plans in UP, the total available power to UP is given in table
12
12th Five Year Plan (in MW)UPRVUNL 3550Joint Ventures 3300Private Sector (Competetive Bidding) 8600Private Sector (MOUs) 10940Case -1 (Planned) 5000From Central Govt. 5040Total 36430
21
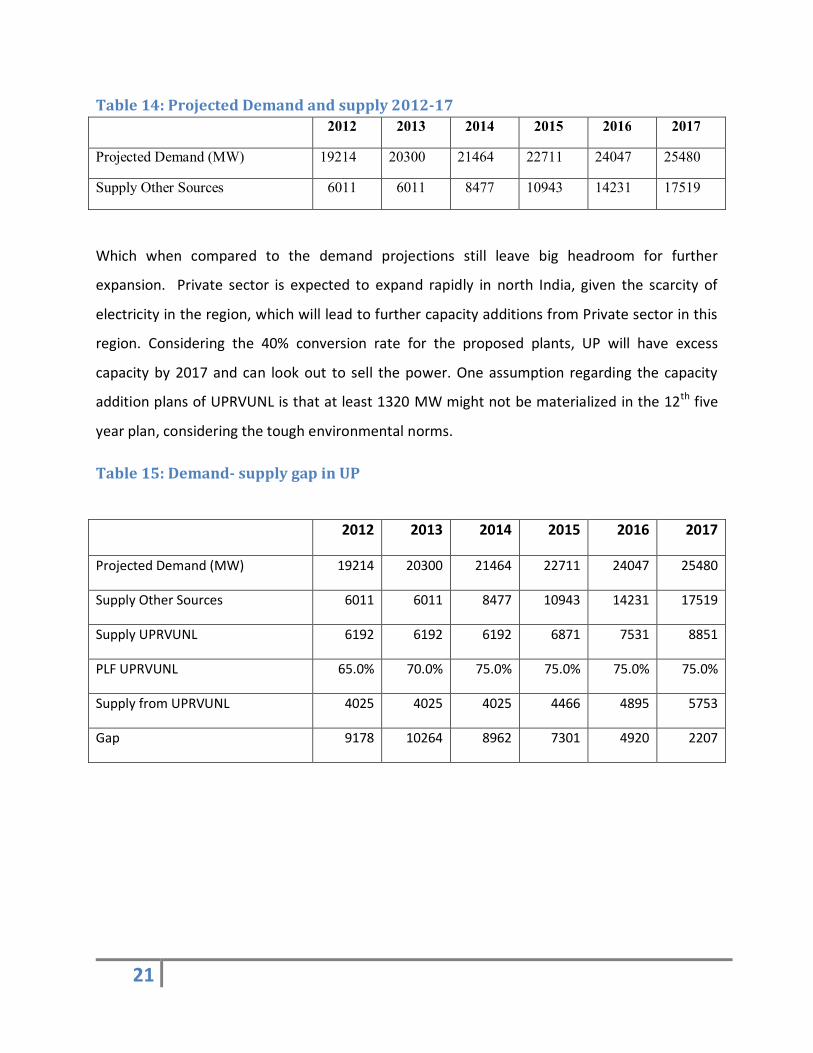
Table 14: Projected Demand and supply 2012-17 2012 2013 2014 2015 2016 2017
Projected Demand (MW) 19214 20300 21464 22711 24047 25480
Supply Other Sources 6011 6011 8477 10943 14231 17519
Which when compared to the demand projections still leave big headroom for further
expansion. Private sector is expected to expand rapidly in north India, given the scarcity of
electricity in the region, which will lead to further capacity additions from Private sector in this
region. Considering the 40% conversion rate for the proposed plants, UP will have excess
capacity by 2017 and can look out to sell the power. One assumption regarding the capacity
addition plans of UPRVUNL is that at least 1320 MW might not be materialized in the 12th five
year plan, considering the tough environmental norms.
Table 15: Demand- supply gap in UP
2012 2013 2014 2015 2016 2017
Projected Demand (MW) 19214 20300 21464 22711 24047 25480
Supply Other Sources 6011 6011 8477 10943 14231 17519
Supply UPRVUNL 6192 6192 6192 6871 7531 8851
PLF UPRVUNL 65.0% 70.0% 75.0% 75.0% 75.0% 75.0%
Supply from UPRVUNL 4025 4025 4025 4466 4895 5753
Gap 9178 10264 8962 7301 4920 2207
22
Resource Analysis
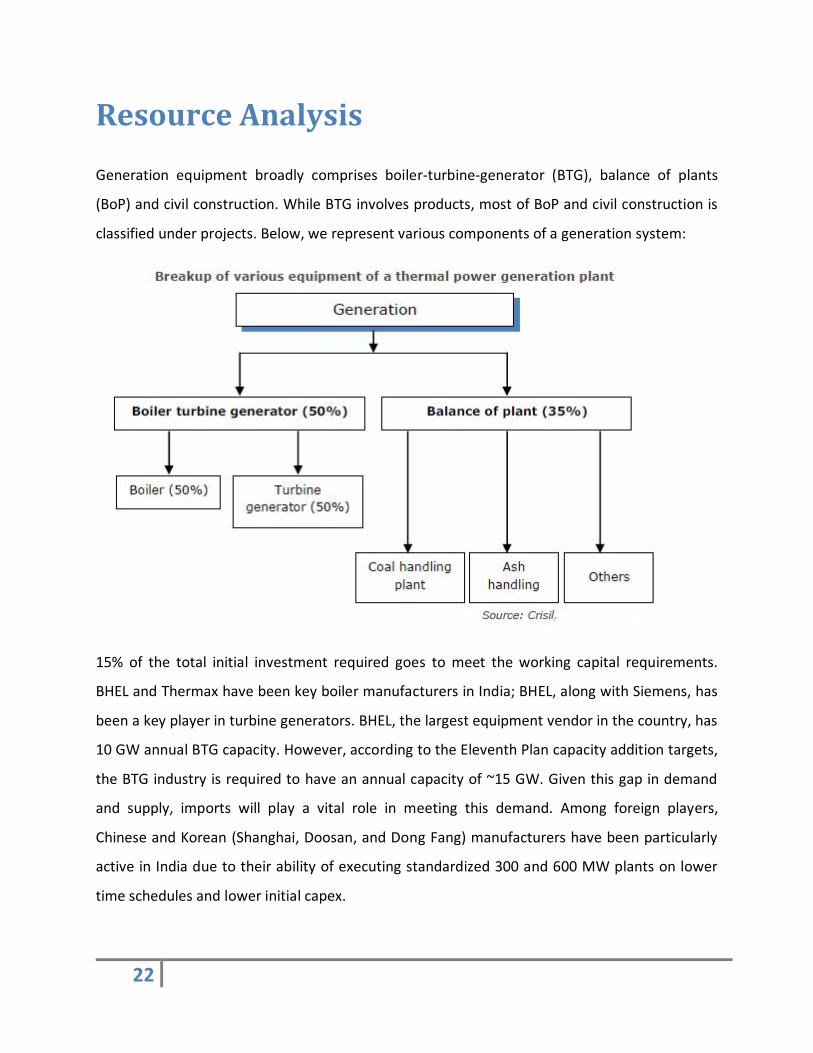
Generation equipment broadly comprises boiler-turbine-generator (BTG), balance of plants
(BoP) and civil construction. While BTG involves products, most of BoP and civil construction is
classified under projects. Below, we represent various components of a generation system:
15% of the total initial investment required goes to meet the working capital requirements.
BHEL and Thermax have been key boiler manufacturers in India; BHEL, along with Siemens, has
been a key player in turbine generators. BHEL, the largest equipment vendor in the country, has
10 GW annual BTG capacity. However, according to the Eleventh Plan capacity addition targets,
the BTG industry is required to have an annual capacity of ~15 GW. Given this gap in demand
and supply, imports will play a vital role in meeting this demand. Among foreign players,
Chinese and Korean (Shanghai, Doosan, and Dong Fang) manufacturers have been particularly
active in India due to their ability of executing standardized 300 and 600 MW plants on lower
time schedules and lower initial capex.
23
All plants commissioned after 2017 shall have to be supercritical (e.g. 660MW and above) and
to have a coal linkage. Chinese and Korean manufacturers have the capabilities to produce
supercritical.
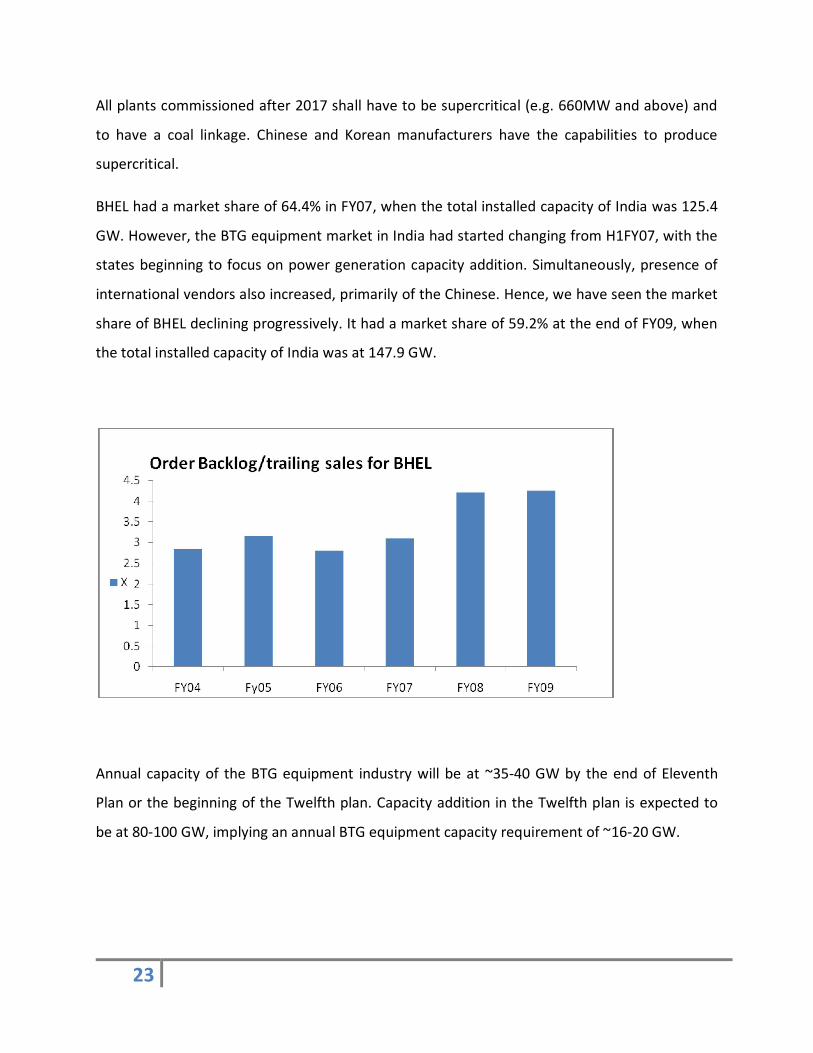
BHEL had a market share of 64.4% in FY07, when the total installed capacity of India was 125.4
GW. However, the BTG equipment market in India had started changing from H1FY07, with the
states beginning to focus on power generation capacity addition. Simultaneously, presence of
international vendors also increased, primarily of the Chinese. Hence, we have seen the market
share of BHEL declining progressively. It had a market share of 59.2% at the end of FY09, when
the total installed capacity of India was at 147.9 GW.
Annual capacity of the BTG equipment industry will be at ~35-40 GW by the end of Eleventh
Plan or the beginning of the Twelfth plan. Capacity addition in the Twelfth plan is expected to
be at 80-100 GW, implying an annual BTG equipment capacity requirement of ~16-20 GW.
24
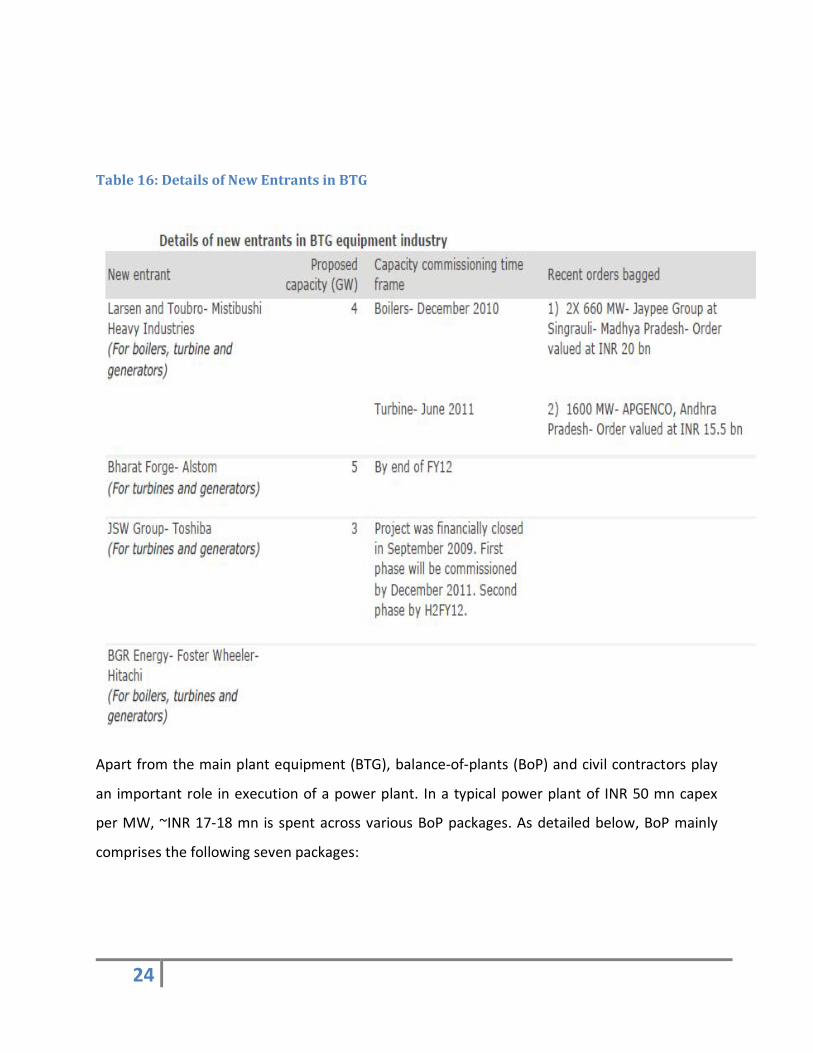
Table 16: Details of New Entrants in BTG
Apart from the main plant equipment (BTG), balance-of-plants (BoP) and civil contractors play
an important role in execution of a power plant. In a typical power plant of INR 50 mn capex
per MW, ~INR 17-18 mn is spent across various BoP packages. As detailed below, BoP mainly
comprises the following seven packages:
25
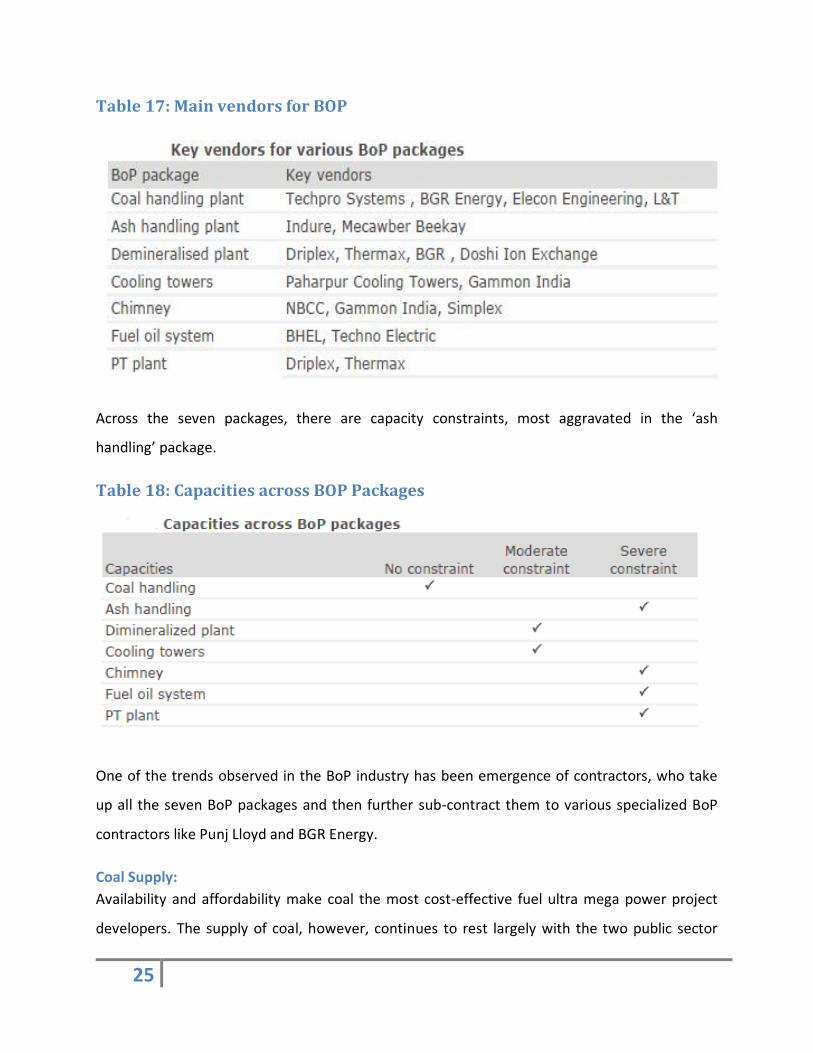
Table 17: Main vendors for BOP
Across the seven packages, there are capacity constraints, most aggravated in the ‘ash
handling’ package.
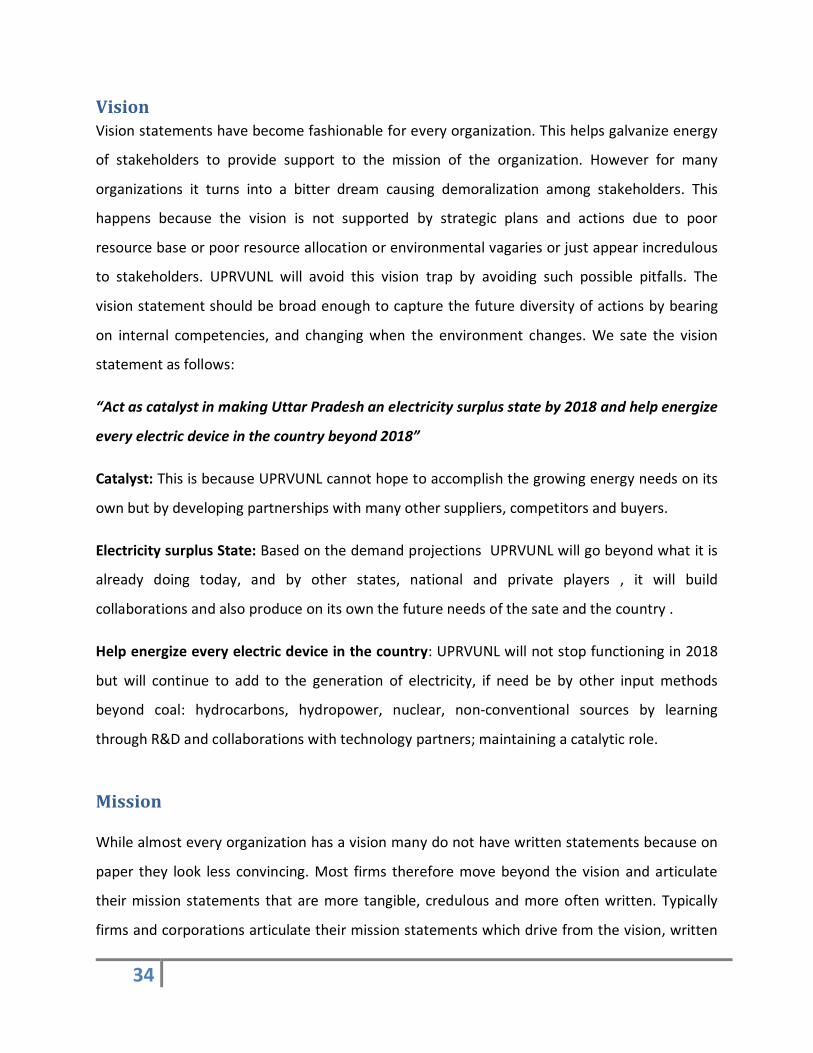
Table 18: Capacities across BOP Packages
One of the trends observed in the BoP industry has been emergence of contractors, who take
up all the seven BoP packages and then further sub-contract them to various specialized BoP
contractors like Punj Lloyd and BGR Energy.
Coal Supply: Availability and affordability make coal the most cost-effective fuel ultra mega power project
developers. The supply of coal, however, continues to rest largely with the two public sector

26
coal mining companies - Coal India Ltd and Singareni Collieries Company Ltd, which together
meet over 80 per cent of the country's coal demand. Imported coal bridges the demand-supply
gap to some extent, but at prices which are at premiums in excess of 30-35 per cent even after
adjusting for its higher calorific value.
Though the public sector miners sell coal at regulated prices, which are at a substantial discount
to market determined (e-auction) prices and prices of comparable imported coal, the supply of
cheap domestic coal via this route is not assured. Public Sector Undertaking (PSU) miners are
obligated to supply coal to the extent of the Annual Contracted Quantity (ACQ) set in the Fuel
Supply Agreement (FSA), but are free to make up for any short-fall in ACQ by supplying
imported coal paid for by the buyer. The newly formulated FSA which PSU miners will sign with
all future consumers (except those opting for Central Electricity Authority (CEA) allocated ACQ),
has lowered the committed fuel supply from 90 per cent of the ACQ for power utilities (60 per
cent of ACQ for non-power sector industries) earlier to 50 per cent of ACQ, indicating that PSU
miners do not expect their production to catch up with demand, going forward. In such a
scenario, captive coal blocks play a crucial role in addressing the fuel security concerns of
consumers.
However, the development of captive blocks is a challenging and time-consuming process, with
a whole host of issues slowing down the timely commissioning of mines.

27
Progress on captive blocks hit by forest clearance, land acquisition hurdles Captive Blocks allotment since 1993
Source: Ministry of Coal, CRISIL Research
Progress on Captive Blocks allotted since 1993 Coal block allotment was initiated in 1993 when the Sarshatoli coal block was allotted to
Integrated Coal Mining Ltd, an RPG group company, for power generation. Coal block allocation
then picked up only in 2003 when 21 coal blocks with geological reserves of more than 1.4
billion tonnes were allotted. The period 2003 to 2008 saw a surge in block allotment with 179
blocks allotted during this period. Of all the captive coal blocks in the country, 26 currently
produce coal, nine of which are legacy blocks. However, out of the 208 coal blocks allotted
since 1993, only 17 have commenced production as of 2009-10, reflecting the dismal state of
progress on captive block development by allocatees. The principle reasons for the slow pace of

28
development are the inordinate delays in land acquisition and in obtaining environmental and
forest clearances.
Source: Ministry of Coal, CRISIL Research
Captive blocks in forest land face maximum delay in commissioning Actual mine development time (Months from date of allocation)

29
Source: Ministry of Coal, CRISIL Research Captive blocks take an average of 76 months to begin production as against the norm of 3-4
years laid down by the government. Forest clearance is the single biggest hurdle as it requires
multi-level clearances - at district, state, and union government levels. It is estimated that an
application for forest clearance has to pass through anywhere between 50-60 desks, before
approval is granted. As a result, blocks located in forest areas average 83 months to begin
production as against 72 months for non-forest blocks. Land acquisition is the second biggest
hurdle in timely commissioning of mines. Land can be acquired by a block allocatee either
through the state government or by direct negotiation with the land owners. Direct negotiation
can speed up the acquisition process as acquisition by the state government is a lengthy
process involving multiple rounds of public hearings with land owners before the land transfer
is officially notified. Underground mines commence production up to 10 months faster than

30
opencast mines, mainly because mining can commence in patches even before the entire land
earmarked for the project is acquired.
Captive coal supply to rise significantly from 2012-13 Production by captive coal mines
P: Provisional, F: forecasted Source: Ministry of Coal, CRISIL Research Blocks starting production, reserves thereof

31
P: Provisional, F: forecasted Source: Ministry of Coal, CRISIL Research
Captive production has grown at a CAGR of 16.3 per cent from 2005-06 to 2009-10 (including
production by legacy mines and in Meghalaya) reflecting the poor progress in block
development. However, expected captive production is a CAGR of 21.6 per cent from 2010-11
to 2014-15, primarily due to a quantum shift in production in 2012-13 as many of the blocks
allocated during 2003 to 2007 will commence production. Also 60 of the 208 blocks that
currently stand allocated are expected to start production by 2014-15 even after factoring in
the slow pace of captive block development.
Over the next 5 years (2010-11 to 2014-15), over 80 per cent of captive coal production will be
non-coking coal with power generation and sponge iron being the biggest beneficiaries. Within
non-coking coal, ‘E' and ‘F' grades will account for over 70 per cent of captive non-coking coal
production.

32
Private sector to dominate production, Jharkhand to top supplier states Production outlook - by sector
Source: CRISIL Research .

33
Production outlook -state wise distribution
Source: CRISIL Research
The vendor list is provided in Appendix at the end of the report.
Having given the analysis of the Electricity generation and supplier industry we are in a position
to draft the Strategic Intent of the Nigam, SWOT Analysis and strategy recommendations.
Strategic Intent Strategic intent is the hierarchy of objectives which moves from broad to narrow objectives and from long-term to short-term; this includes corporation vision, mission and corporate objectives.
34
Vision Vision statements have become fashionable for every organization. This helps galvanize energy
of stakeholders to provide support to the mission of the organization. However for many
organizations it turns into a bitter dream causing demoralization among stakeholders. This
happens because the vision is not supported by strategic plans and actions due to poor
resource base or poor resource allocation or environmental vagaries or just appear incredulous
to stakeholders. UPRVUNL will avoid this vision trap by avoiding such possible pitfalls. The
vision statement should be broad enough to capture the future diversity of actions by bearing
on internal competencies, and changing when the environment changes. We sate the vision
statement as follows:
“Act as catalyst in making Uttar Pradesh an electricity surplus state by 2018 and help energize
every electric device in the country beyond 2018”
Catalyst: This is because UPRVUNL cannot hope to accomplish the growing energy needs on its
own but by developing partnerships with many other suppliers, competitors and buyers.
Electricity surplus State: Based on the demand projections UPRVUNL will go beyond what it is
already doing today, and by other states, national and private players , it will build
collaborations and also produce on its own the future needs of the sate and the country .
Help energize every electric device in the country: UPRVUNL will not stop functioning in 2018
but will continue to add to the generation of electricity, if need be by other input methods
beyond coal: hydrocarbons, hydropower, nuclear, non-conventional sources by learning
through R&D and collaborations with technology partners; maintaining a catalytic role.
Mission
While almost every organization has a vision many do not have written statements because on
paper they look less convincing. Most firms therefore move beyond the vision and articulate
their mission statements that are more tangible, credulous and more often written. Typically
firms and corporations articulate their mission statements which drive from the vision, written
35
or unwritten. While visions are futuristic intensions, aspirations and dreams , mission seem to
reflect of either short term future direction or the businesses they operate in. The key elements
that mission statements contain are obligations to stakeholders, scope of business, sources of
competitive advantage and view of the future consistent with the long-term vision. In general
they contain the role that the company wishes to adopt for itself, a description of what the
company hopes to accomplish, a definition of the business and means to gauge the future
success. Base on these guidelines we develop below the components of the mission statements
and then a more integrative mission statement.
Obligation to stakeholders
There are many stakeholders who have stake in the business of UPRVUNL: Shareholders,
lenders, the UP Government , business partners, customers both intermediaries and
consumers, the employees of all cadres- managers, engineers, ministerial, support staff and
labor contractors, regulators, environmental groups, broad communities, and society in
general. It is important to recognize that these stakeholders benefit or get impacted by the
operation of UPRVUNL who may have conflicting interest and degree of power and may
demand management to pay more attention to the specific stakeholders group at the expense
of others. It is the role of the managers to minimize these conflicts so that their positive
energies are utilized to realize the sated vision. Obviously it must address their emotions and
their interests. We may state “we will serve each of our stakeholders amicably through a
democratic process”
Scope of Business
This defines the boundaries of the business. It is necessary to maintain focus on the business. It
should not be too narrow to miss future energy trends nor should be too broad that it loses its
direction. While it should maintain its focus on electricity generation but it cannot lose sight of
opportunities in transmission, distribution on the value chain nor could the other sources of
energy.

36
UPRVUNL will remain in the generation activity through thermal power stations using
predominantly coal and gas with oil as auxiliary feed. However it may get involved with the
generation by using other raw material like LNG and hydro electric generation as and when the
need so arises, besides working with partners in non-conventional/ renewable sources of
energy in the very long term. In the short run however, it will focus on generating energy by
using coal, which is its area of competence. Any other ventures beyond the thermal power
based on coal feed it will explore the joint venture route as and when the opportunity arises.
Thus, “UPRVUNL strives to produce and supply electric energy in the most efficient manner”
Sources of Competitive advantage
No business survives in the long-run without any competitive advantage or uniqueness.
Although electricity generation is the commodity business but the way it is supplied or
generated at the right frequency can have distinct impact on the performance, which implies
least cost production among its peer group. Since UPRVUL is still the largest producer of
electricity it would continue to do so , even better, what it is doing by building operational
excellence by encouraging, motivating and incentivizing its technical people which are
engineers of high quality, which most competitors do not have access to. This can define its
distinctiveness if it builds enabling systems for engineers to deliver their best. Therefore
smoothening the operating systems which can provide it the distinctive competence that it
needs to compete in the future competitive environment. Therefore” it will compete on the
basis of its technical core”
View of the future
“UPRVUNL will be the most efficient and one of the most responsive electric energy supplying
utility in the country with a pride in its technical core” with a leadership role in the state of
Uttar Pradesh where it will be leader in catalyzing the resources for the development of the
State .
37
Mission Statement
UPRVUNL will be leader in generating, transmitting and distributing electric energy most
efficiently through collaborations with its partners by using its technical people as its
competitive advantage while balancing and serving the interest of all of its stakeholders.
Corporate Values 1. Excellence in everything it does
2. Respectful and fair to each employee
3. Committed to nurturing of its technical talent
4. Fair to its partners
5. Will remain environmentally and socially responsible
Corporate Objectives
1. Build a strong competence in customer responsiveness by leveraging human resources through training, development and motivation
2. Expansion and growth by improving the efficiency of existing plants and adding new generation capacities
3. Reducing supply chain bottlenecks and operating costs
4. Diversifying both into vertical chain activities and diversifying the input base that lead to the leading market share
5. By taking advantage of economies of scale becoming the lowest cost generator of electricity in the state and the country
6. Partnering with other entities to minimize investment needs and reducing the investment risk
7. Becoming one of the leaders in environmental management and socially responsible citizenship in its peer group

38
In order to meet the objectives, mission, vision of the corporation, UPRVUNL needs to take
stock of its Strengths and weaknesses and assess the environmental future threats and
opportunities in order to allocate resources judiciously. There we attempt the SWOT Analysis
SWOT Analysis
Strengths 1. Ownership is with state government that reduces the risk of liquidation who can make
investment in public interest should the things turn hostile
2. It has R&D support from Central Electricity Authority keeping the research and
development costs almost zero.
3. It is easy to get land and environmental clearances from respective authority without
suspecting foul play
4. It has top management who very competent and committed who work for the
government as well as for the corporation- facilitating government support as and when
required
5. UPRVUNL has a rich history and competence of generating electricity through coal and
oil, water with priority allocation of inputs
6. The input costs are cushioned against market price vagaries and thus helps in realizing
costs through regulated tariff system
7. It has access to large real estate which is now free of cost and does not require fresh
investment with all the facilities required for a TPS like water, transport access.
8. It has the largest market share of about 50% of capacity in generation business as
compared to its competitors. The actual capacity for generation is 3933 MW as on 31st
March, 2011 after excluding unit 6 of Obra and unit no. 3 of Harduaganj

39
9. Assured market reducing the cost of marketing because of historical relationships and
scarcity of electricity. Demand is not an issue for next 10 years.
10. Most of the plants are depreciated leading to less strain on the balance sheet
11. It has the largest number of technical manpower in the state and one of the largest in
the country that is well experienced.
12. The percentage of youngsters is growing beyond 50% (about 750 out of 1450) at
executive (technical) level which are well educated , getting good training and are very
motivated
13. Corporate values are already articulated and are in place
14. Security of employment provides stability to the knowledge base which does not migrate
continuously and good compensation policy.
Weaknesses 1. Being state owned organization it suffers from slow decision making process and dealing
with less risky but expensive suppliers and buyers which also limit speed of decision
making
2. Because of SOE employees do not have commercial mindset
3. The top management comes from Government which also has its negative side: the
commitment levels are not very high because of uncertain tenure
4. Cost, quality, and schedules for “works” lowers efficiency in O&M and Project
management
5. Has already adequate input linkages
6. Three Full time directors’ positions are vacant, substituted by part time director finance,
and former technical director serving as advisor. Post of Director Personnel is vacant.

40
7. Disputes on seniority are quite frequent which delays the promotion on senior positions
since last many years lowering motivation
8. Promotions are not based on competence but other politically determined criteria
9. Old organization continue which is not consistent with today’s ground realities
10. Induction on compassionate ground has resulted in work inefficiencies and high cost
work force, which UP Government has already stopped in its own departments.
11. Roles and responsibilities are not commensurate with compensation, which are needed
to be defined and refined.
12. Deferred or partial payments by customers adversely affect the cash cycle
13. It is difficult to mobilize equity and thereby loans due to profit/loss account losses and
because government also takes very long time in implementing financial
recommendations
14. Supply of coal comes from distantly located pit heads increasing input transportation
costs.
15. Government ownership provides cushion against inefficient working resulting in lower
efficiencies.
16. Very high age of plants keeps the breakdowns as frequent resulting in lower PLF and
high input costs
17. Project implementation is a very serious drawback for lack of project management skills
and bureaucratic procedures
18. Poor contract reinforcement with equipment suppliers like the virtual monopolist BHEL
resulting into high cost and time overruns
19. Coal linkages for plants are inadequate for future needs

41
20. Aging work force has acted as a drain for long time which is addressed only recently
21. Coordination and communication processes are very slow
22. Technology enablers such as IT has only been addressed recently whose implementation
is moving at a slow pace
23. Inadequate focus on regulatory affairs. Handled at plant level instead of corporate level.
24. Auxiliary consumptions are very high compared to its competitors like NTPC
25. Political interference at the level of supplies (favored), operations- lack of proper
allocation of manpower at right jobs/ place, sub-contractors, and employees (transfers/
promotions)
26. Lower PLF compared to competitors and national average makes operations expensive.
27. It is estimated that the balance sheet may have the losses until 31st March 2010 to the
tune of Rs. 585.7 crore as per provisional balance sheet, whereas we have repayments
from customer of the same tune, therefore the interest cost without any benefits to
corporation.
Opportunities 1. BOP and BTG can be awarded through bidding system instead of single supplier as is
given to BHEL which do not adhere to timelines of the contract who do not pay
penalties for project time over runs
2. Possibility of increasing revenues through CDM, PAT( Perform, Achieve and Trade)
mechanism of BEE (Bureau of Energy Efficiency)
3. There is a good opportunity to increase the PLF close to national average of 75% thereby
raising higher generation of electricity
4. Revenues can further increased by gains from UI provisions through disciplined
management of its resources
42
5. There is going to be about 10-20% gap until 2017 in the demand and supply which will
ensure that whatever is produced is consumed- no demand risk.
6. Fuel security through JVs with mining companies
7. Productivity improvements through usage of IT applications
8. Improving financial health by setting outstanding receivables from UPPCL through inter-
department coordination
9. New projects can improve the PLF, and higher energy generation which will have
positive impact on the financial health
10. Automated equipments / super critical plants can produce higher levels of energy at
reduced prices
11. Renewable sources especially solar energy can be a good opportunity in future
especially in UP which eventually translate into more energy with lower costs.
12. Availability of land from ash ponds, which can be utilized for further expansion by
converting that land planting Jatropha plants which can be converted into diesel, and
we can earn carbon credits too.
13. Scrapping the non-functional units that are officially deleted. They can be sold out in
market and vacated land can be used for new plants eg. Obra and Harduaganj units. The
scrapped units can be sold through MMTC.
14. Scope for Joint venture exist today more because private sector has already moved in
generation and many are willing to join the business who normally do not have
experienced manpower
15. Value chain partners and competitors are willing to join forces to produce electricity like
NTPC, Coal India limited, even transmission and distribution companies.
43
16. The distribution sector is opened for participation by generation companies improving
scope for vertical integration.
17. Government, including SERC is very responsive and accommodating if willing to improve
electricity generation.
Threats 1. BTG had be given without tender to BHEL, which has become a liability because of non-
compliance of the agreement- non competitive rates and late completion of the projects
against DPR/Work Order
2. BHEL has taken advance money for R&M but may not start work even in future. which
may result in closure notice from Central Pollution Control Board and other regulatory
authorities, which may cause higher penalties and closure of old plants draining
production capacity and profitability
3. Integrity of employees, suppliers as mafias with political linkage are a serious threat to
the functioning of UPRVUNL.
4. The deregulated generation sector may see more competition in future which may
threaten the leadership position of UPRVUNL Operations.
5. New plants have long gestation periods making the progress slow towards leadership
position.
6. The aging plants underperform but maintenance cannot be done on schedule because
of demand pressure
7. Pollution control regulation is becoming more stringent under international guidelines
whose compliance can threaten closure of many units, if not acted upon in time
8. Coal mafia continues to exert pressure on the prices, quality and quantity of coal.
44
9. The constant pressure on input prices may build pressure on energy prices which
because of more competitive output may force regulator to reduce prices which may
adversely affect the expansion plans
10. Government is rather reluctant to provide additional equity required for expansion of
capacities and thus affecting expansion plans
11. The skill gap appeared because of attrition due to retirement or lack of training in ABT
regime
12. Continuing government mindset may result in serious lag in financial viability of future
investments
13. The state of monopoly has already been threatened by larger firms with adequate
investment capacity which is likely to threaten the leadership position of Nigam.
14. At some point in time the UP State may get trifurcated reducing the power of the Nigam
as happened in case of Uttrakhand
15. The stranglehold of politician may become worsen in future in curbing the freedom of
the professionally managed corporation, because of 100% ownership.
16. Increasing inflation may lead to higher interest rates, wages and cost of electricity
unless competition bring in commensurate reduction in operating costs
17. The continuous changes in the business environment makes it difficult for companies to
keep environmental knowledge undated regularly which calls for continuous learning to
which old timers are ill-equipped to handle.
Corporate & Business Strategies
We classify our recommendations into Ten broad categories: managing dynamic environment,
business portfolio, Smoothening supply chain, Operations including project management,

45
Organizational restructuring, Human Resource management, Board of Directors, Investment
management, Employee welfare and Corporate Social responsibility.
Managing Dynamic Environment
1. There is a need for a business planning Department to collect, generate and collate data
so that informed decision can be made. This unit can scan information regarding
customers, suppliers, regulatory changes, business opportunities, partnership
opportunities, Human resource related practices, new technologies, competitor
activities, political changes, social changes, economic and financial matters , pollution,
energy audit reports , related technologies , issues of sustainability.
2. This department can be headed by a Director Corporate Strategy (25-30 years
experience) trained or experienced enough in strategic Planning who may be supported
by other managers (see corporate structure) and young business analysts (2-3 years
experience with MBA degree) with some specialization in economics , statistics,
environmental engineering/ pollution control , business development, with skills in
competitor and customer analysis , a financial manager, an electrical technologist,
3. The roles will be to analyze related issues through different disciplinary perspectives and
build a comprehensive view of the issue at the planning levels. They will also be
responsible to continuously review the current business environment and suggest
future trends with respect to new emerging trends. They will assist the operating
managers on various issues including the related data/ information availability. Some of
the hard data will be stored in the computers which will be accessible to anyone who
want any relevant information. They will help set up monthly, quarterly targets, annual
targets and plans and 20 years rolling plan. They will also alert respective operating
managers about any significant changes that might affect their functions.
We have recommended this entity on environmental intelligence because the future leaders
will compete on the basis of superior knowledge and information and also we think the high
46
quality manpower is going to be the basis of competition at least for UPRVUNL as we have
recommended in the mission statement. This unit will work as a brain of the corporation.
Needless to mention that highly qualified people should be brought in or developed through
extensive training in their respective areas. It will help identify future threats and opportunities
and at the same deepen the organized and disciplined decision making which is right now in a
very ad hoc and rudimentary form.
Business Portfolio
1. The capacity additions through R&M, up rating and new capacity additions are projected
in tables 7-10 in the report.
2. Consider continuous evaluations of each generating unit which can perform above 60%
PLF with low maintenance, otherwise scrapped. We have analyzed below that the new
capacity additions are more beneficial than renovation & modernization beyond certain
performance point.
3. Any future generating unit should not be below 500 MW as the new entrants will come
with super critical plants who will threaten the leadership position of UPRVUNL. The
larger plants have higher fixed costs but lower running expenses and thus making
smaller plants or less capacity plants as unviable in 10-15 years time period.
4. Since most places land and utilities are already developed and there is ample scope of
putting up new plants which may not face demand crunch and it should help UPRVUNL
to maintain its leadership profitably at least until 2017. We need to explore new plot of
land for future expansion
5. We can consider LNG based thermal plants if the LNG linkages could be tied up in the
medium term.
6. In the meantime we also explore the nonconventional energy sources for which we can
create a new cell and recruit experienced engineers for experimentation. The special

47
interest areas could be solar energy, Jatropha plant based fuel. This may help in getting
renewable sources of energy. The technological Institutes may be made partner in R&D
beside exploring R&D based small firms or joint partners for exploring newer
technologies (0.5% of sales could be allocated to this unit on new product or process
development). They pay offs could be long-term
7. In addition we put up at least limited resources (1%of sales) in R&D and get external
consultants to assist in R&D lab to find ways and means of improving operational
efficiencies in plant which look for reduction in auxiliary consumption in operations
and examine the whole input supply chain.
8. Also the planning unit can explore possible partners who can work as partners in joint
ventures which will ease input supplies, or bring in much needed equity into new plants.
Part of employees could be shifted to the joint venture. This will give a chance to bring
in efficiencies in our own plant as the JVs can work and learn in less bureaucratic
environment away from political interference or operational fire fighting.
Smoothening Supply Chain
1. There had been major problems in getting BTG Equipment because BHEL had been a
sole supplier, which had not delivered equipments in time whether related to R&M or
new turbines, which is the major cause of concern at UPRVUNL as many projects are
delayed because of BHEL. It is suggested that both BTG and BOP supplier base must by
necessity be diversified and the tendering process strengthened. There are now
international vendors in these areas which are allowed by the government to sell
equipments in the county. We have provided some vendor addresses in the report in
the Appendix.
2. On oil supply there are not many problems as we source material from Sate owned oil
enterprises, although adulteration issues can be more rigorously monitored. However
coal supplies that reach the plants are either underweight, or of poor quality. The

48
corporation has taken many effective steps like the management has appointed agents
who can procure the coal in right quantity and quality. The supplies come from distant
places and thus reducing the quantity reached. Some coal reaches in the form of mud
due to open wagons and some reach with big stones. The corporation should further
look into the ways and means to further reduce any losses either because of quality,
quantity or transportation issues. It is recommended that a committee of procurement
managers/ engineers representing each plant is constituted which will make further
recommendations on the issue.
Operations including project management
1. Barring a few plants, there is more focus on administration by the engineers than on
engineering work resulting into poor operations management. There are multiple
vendors in the same plant and across different plants. It is suggested that this function
be centralized and engineers are relieved from administrative functions as much as
possible. There must be a single vendor development department for “works” at the
plant level under the direct supervision of the Chief of the plant. The tender must be
invited through UPRVUNL website in order to reduce the impact of local political
influence. The vendor should also be empanelled. There should also be a head office
representative in the vendor selection committee at the plant level
2. Inventory and store systems should be computerized and proper system established so
that the items can be identified easily. This can be automated with the help of inventory
order system available from many vendors. Physical verification each year should be
carried out regularly and physical stock reconciled with the database.
3. ERP needs to be implemented urgently so that data is available for informed decision
making. It calls for an experienced vendor especially with organizations in electricity
generation. The store/purchase employees should be trained in IT applications for store
and purchase.

49
4. Ash disposal is a major concern around the plants. It is suggested that like NTPC regular
auction be carried out. The neighborhood cement manufacturing companies/ road
construction companies should be invited to submit tenders/ bids.
5. The major concern as witnessed during plant visits and also the review of performance
of plants indicate that the project management is the weakest link in spite of the fact
many managers are interested in getting job posting in these departments., resulting
into delays and higher costs. Since the corporation is expanding operations there is a
need to create a special group properly experienced in electricity generation and project
management techniques in order to keep good control on cost and time over runs. Since
projects are left to operating managers who are busy firefighting operational glitches
especially in the light of aging plants, cannot pay adequate attention to the progress of
projects and thus it must be separated.
6. Although utilities maintenance is found to be reasonably all right except ash disposal,
There is need for continuous improvements after setting standards for each activity,
including, water, land, roads, electrification, hospitals. Schools etc in proper form.
7. The bench mark studies against CEA norms and/or NTPC comparable plants indicate
that most of UPRVUNL plants are underperforming: PLF, availability factor, Station Heat
Exchange Ratio, Auxiliary consumption, outages; which have adverse impact on the
cost/ MU and also the profitability of the corporation. The reasons of course are old
plants, poor execution of R&M, O&M and delayed projects for up rating or new capacity
additions. The targets must be revised upward. As a thumb rule there ought to be at
least 2-3% improvement in each operational parameter with 2010-11 as base year. We
expect until 2017 an improvement of 12-15% over the base year. The same can be
translated into each plant and unit so that disaggregated targets can be set. Needless to
mention that in addition to enabling corporate environment, including, restructuring of
organization, cadres, smoothening supply chain; monetary incentives be linked with the
weighted average of PLF, Auxiliary consumption, SHR, Outages with 40%, 30%, 20%,

50
30%. If the savings are indeed achieved which may have impact of 8-10% every year.
The cash incentives of 1-2% of the savings or growth may be passed on to employees
8. The main reasons of lower performance are the aging plants, lower machine loads,
forced outages, high auxiliary consumption, Station Heat Rate, and also because of slow
progress of R&M due to lack of structural focus and non-supply of equipments by BHEL,
who go scot free without penalties . Serious competition among vendors be introduced
by inviting tenders from international suppliers
9. Energy accounting and billing are still weak areas and there is something to learn from
NTPC. That is why beside organizational and cadre restructuring, training and
development are emerging key thrust areas especially Strategic management, HR,
financial and project planning and implementation.
Human resource management
The analyses carried out by the HR department of the Nigam (the tables are placed in Annexure II) indicate excess manpower by any standard. The major concerns indicated are
1. Many units are deleted (Panki 2 units, Harduaganj 4 units, and Obra 3 units) but the
positions have not been scrapped. Contrarily some of the new units are established: 2
units are Paricha and 2 units at Hurduaganj. The new positions are not created inducing
murkiness in the manpower allocation. This notwithstanding the CEA norms are
available beside NTPC benchmarks (see Annexure II)
2. Similarly positions required for new tasks have not been articulated: HR, Fuel, R&M,
Environment, IT and commercial. These entities are working against positions
sanctioned under PPMM, thermal operations and plants which are needed to be
regularized. The commissioning staff required for new projects has not been provided
with new positions sanctioned.
51
3. There are shortages in technical cadres as against the support staff. Although there
appears to be shortage against the sanctioned staff across board but many units have
been closed down.
4. There is a lack of role clarity at different levels some of which is caused by the number
of employees working against the sanctioned strength drawing salaries with lower level
designations, known as Resultant Seniority concept . There is lack of specialization. No
clear cut policy exists besides the relative disliking for operational jobs as against project
jobs. This requires job restructuring of work which is being currently carried out by E&Y
Consultants
5. Engineering staff is dominated by non-degree holders due to promotions.
6. The appraisal system does not reflect the actual performance which is more driven by
human concerns and relationships rather than contributions, partly affected by internal
political influences.
7. There is a need to redesign the cadres followed by role analysis and competence
mapping study to find gaps and transfer employees after retraining for right jobs. To
minimize discontent among educationally well qualified personnel the assessment of
educational background and promotions linked to proper appraisal based on
competence mapping profile and actual performance should be introduced.
Introduction of a block/ cadre system like E-1,E-2, E-3, E-4 AND E-7 and E-8 and above,
to provide flexibility in promotions. Cadre restructuring can be inspired by the system
implemented at NTPC
8. Training programmes should be organized according to the competence assessment and
training gap thereof with respect to hard and soft skills, including leadership
development programmes Executive Engineer levels and above . The lower level
employees should also be given substantial training in domain areas.
9. At least 3% of revenue must be allocated to training/ education and development
purposes of staff, officers and management
52
10. Looking at scarcity of educated and trained manpower it is extremely urgent to begin
recruitment at AE level.
11. There is a necessity to set up examination system before promoting offices from lower
to SE level. Thereafter it may be based on personal interviews with selection committee
dominated by independent experts. In fact a one-year MBA degree from A-rated
institutions is must for SE level and above which can be sponsored by the Nigam with a
bond of 3 years post-sponsorship of MBA. Those already with MBA from C-grade
institutions should also be sent for A-rated MBA programmes. Those with A-rated MBA s
may be sent to foreign universities for short duration courses of the length of 15 days to
3 months, which are likely to be specialized in project management, operations
management, HR management, Strategic management and financial management .
These recommendations are specifically relevant because UPRVUNL is expected to
compete on the basis of human resources.
12. Any personnel whose skills have been rendered redundant may be re-skilled through
training on jobs that are needed and fit the individual psycho graphical profile or must
be offered voluntary retirement at reasonably attractive terms.
Organizational Restructuring
1. Organizational structure is designed keeping in mind how to divide the overall
organizational task into subcomponents and then reintegrating so that there is forward
movement towards accomplishment of the vision and mission and corporate objectives.
In sum it helps multiple people work in cooperative manner rather than working at cross
purposes. The functional structure creates high level of specialization and provides the
basis of competence on the functional axis of the organization like supply chain,
operations, marketing & sales and customer service. The staff functions like, HR, R&D,
procurement and strategy provides the support to functional line managers. However it
results in functional silos and very high information overload at the staff functions.

53
2. The divisional structure helps reduce the information overload and treats the divisional
heads as CEOs of their own business. Strategic & financial responsibility rests with the
divisional heads who report to the corporate CEO and consults the corporate top
functional experts. This structure provides for every division all the functional expertise
as is the case with functional structure. There is duplicity of functions in this structure
and thus raises the cost of organizational structure. However the benefits overweigh the
costs because of clear accountability and profit responsibility. In sum , each plant should
be converted into a profit centre with Profit and loss responsibilities .
3. So far UPRVUNL had been following the functional structure and speed of decision
making was hampered, reducing the strategic thinking time for top executives. It is
important to mention that many of the top management’s positions were not filled up
because of logjam in the promotion policy. The operating role and project roles were
almost confounded resulting in poor accountability, slow speed of decision making and
poor monitoring creating poor economic performance. Director technical was looking
after the whole technical areas and Director HR looking after the whole organization
along with director finance and three of them reporting to CMD. It was a deceptively
simple structure but the study reveals that speed of action had been very slow derailing
the project work beyond any expected time periods. Some functions were under-
emphasized in the structure like vigilance & Audit, Commercial and regulatory which in
the E&Y proposed corporate structure capture the importance from Governance
perspective.
4. The Head Corporate strategy should also have to be designated as Director –Strategy to
highlight the importance and quantum of work involved and likely to be involved in
assisting the divisions (plants) in strategy formulation. The subunits below director
should have an environment scanning/ intelligence group which collect internal and
external information and which should report to the Director Strategy. It should have
committee members drawn from PRAGATI, Business Excellence Initiatives, and IT,

54
beside two members from Corporate and Business Strategy areas. Similarly all other
corporate functions should be headed by Directors (Projects, Operations, Finance and
HR). These functions should have committees in each area drawn from sub-units
reporting to them. These committees meet every bi-weekly to appraise the progress in
each area. Besides, it is proposed to have top executive cross-functional team consisting
of 4 corporate Directors and 5 Plant directors each representing the plants. This
committee should meet every month to monitor the progress, trouble shoot difficulties
and bottlenecks.
5. We also propose a replica of the executive team at the plant level involving officials of
various specializations at plant level. The Business strategies & plant level operational
strategies should be developed at plant level under the leadership of Director of each
plant.
6. The decision of unit closer in the plant, R&M and up rating or diversification will vest
with the CMD of Nigam assisted by the top executive team. However the proposal can
be mooted by plant directors, which can be reviewed, whetted by the corporate
executive team. Finally these proposals could be submitted to the BOD. This committee
can have special invitees from audit/vigilance etc if the need so arise. The Directors of
the Plants likewise have top plant management team representing functional plant
heads.
Board of Directors
1. The role of Board of Directors is to provide the direction and guidance to the top
management, whet investment decisions (closure, sell off, joint ventures, new plant/
unit additions), and ensure transparent operations, monitor statutory obligation
compliance, and maintain ethical standards so that the shareholder interests and other
stakeholder interests are protected and equity is maintained. The two main areas of
55
concern in the BOD are the composition of Board members representing different
interests and maintaining strategic direction of the corporation. Since the BODs have
less time to look into the details of each decision the Board Committees become
essential toll for governance of the corporation.
Board of Directors
Currently there are 10 members of the Board as given below:
1. CMD, UPRVUNL
2. DIRECTOR TECHNICAL, UPRVUNL
3. DIRECTOR FINANCE, UPRVUNL
4. JMD, UPPCL
5. ED (NR) NTPC
6. PRINCIPLE SECRETARY (ENERGY), GoUP
7. SECRETARY (FINANCE), GoUP
8. PRINCIPLE SECRETARY (LAW), GoUP
9. PRINCIPLE SECRETARY (BUREAU OF PUBLIC ENTERPRISES), GoUP
10. PRINCIPLE SECRETARY (PLANNING), GoUP
2. It is clear that consistent with the UP Government ownership most of the Board members
are from the government of Uttar Pradesh. However, it can become counter productive as
many of these members are repreneted on large number of Boards and do not have
adeqaute time , inclination and expertise to guide the future direction of the corporation
notwithstanding how brialliant the persons may have been. Often representataives are
sent for Board meetings with little value addition from the real board members which are

56
ex-offcio members. The board memebrs also bring with them relatioships with the outside
world beside the variagated expertise. Besides, to bring more tarnsparency it is suggessted
that outside independent board memebrs be brought into the Board, consdering that the
corporation may go public in future and market will accept less government role at the
baord level and more tarnsparency in operations. We propose the following Board
constituion.
1. CMD UPRVUNL
2. Director Opeartions, UPRVUNL
3. Director Finance, UPRVUNL
4. Director Strategy, UPRVUNL
5. Director HR, UPRVUNL
6. JMD, UPPCL
7. Secretary (Finance), GOUP
8. Principal Secretary (Energy), GOUP
9. ED (NR) NTPC
10. Independent Director- Nominee of the GOUP (Could be from IIM)
11. Independent Director – Chairman Nominee ( could be from IIT with electrical engineering)
12. Independent Director- Chairman Nominee (Private individual as an expert in Thermal
Energy)
3. The board should follow company law based governance practices about meetings,
reporting etc. Since it is expected that government of UP may be less willing to put equity,
the outside sources like capital markets , beside tapping PFC and banks, it is imperative that
57
disclosue and transparency norms be followed based on world-wide good governance
perspectives. There fore there is a need to consitute following Board level committees.
1. Four member Board audit committee – examines probity of fiancial deison making
2. Four member committee on Compensation of top managment
3. Three member Human Resource Management Committee
4. Four member Committee on Ethics, Social responsibilty and Environment
These committes by necessity should have senior executive from inside and one expert from
outside (independent director).
Investment management
The investment management require that the per unit revenue is higher than per unit cost and
cover the cost of capital. In the past the corporations and been making losses with
accumulative losses amounting to almost Rs. 585.7 crore as on 31st March 2010 and almost 360
days receivables incurring severe interest losses besides operational losses. Both these losses
must be brought under control. In addition the corporation has to worry about the funding
required for sustainability and growth.
Financial projections
Considering the costs incurred in the current projects of UPRVUNL, the average cost per
megawatt for UPRVUNL is calculated.
1. However this cost is significantly higher than those incurred by private sector and other
governments. Adani’s super critical power plant (Mundra TPS Kutch) in Gujarat has an
estimated cost of Rs. 4.35 Cr/ MW whereas Essar has been able to achieve Rs. 4.04 Cr/
MW for Salaya TPP (Jamnagar) by procuring BTG from Harbin Power Equipment
company, China. We make below the financial projections required for future
investments
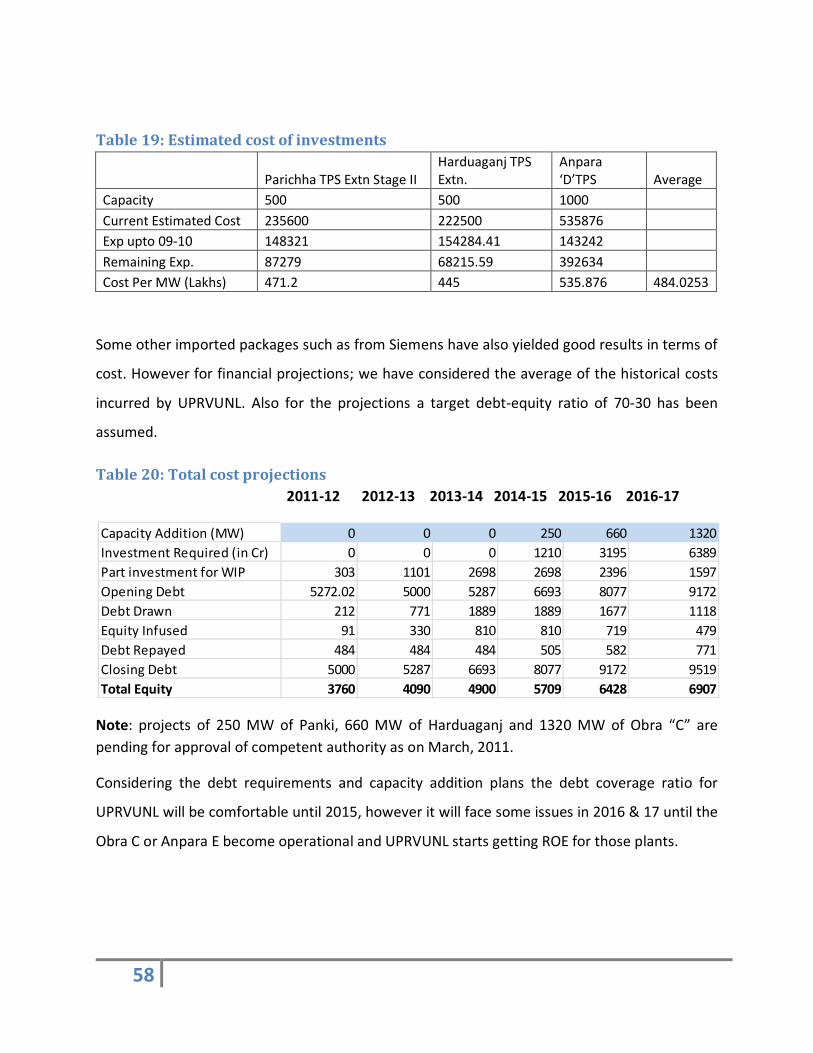
58
Table 19: Estimated cost of investments
Parichha TPS Extn Stage II Harduaganj TPS Extn.
Anpara ‘D’TPS Average
Capacity 500 500 1000 Current Estimated Cost 235600 222500 535876 Exp upto 09-10 148321 154284.41 143242 Remaining Exp. 87279 68215.59 392634 Cost Per MW (Lakhs) 471.2 445 535.876 484.0253
Some other imported packages such as from Siemens have also yielded good results in terms of
cost. However for financial projections; we have considered the average of the historical costs
incurred by UPRVUNL. Also for the projections a target debt-equity ratio of 70-30 has been
assumed.
Table 20: Total cost projections 2011-12 2012-13 2013-14 2014-15 2015-16 2016-17
Note: projects of 250 MW of Panki, 660 MW of Harduaganj and 1320 MW of Obra “C” are pending for approval of competent authority as on March, 2011.
Considering the debt requirements and capacity addition plans the debt coverage ratio for
UPRVUNL will be comfortable until 2015, however it will face some issues in 2016 & 17 until the
Obra C or Anpara E become operational and UPRVUNL starts getting ROE for those plants.
Capacity Addition (MW) 0 0 0 250 660 1320Investment Required (in Cr) 0 0 0 1210 3195 6389Part investment for WIP 303 1101 2698 2698 2396 1597Opening Debt 5272.02 5000 5287 6693 8077 9172Debt Drawn 212 771 1889 1889 1677 1118Equity Infused 91 330 810 810 719 479Debt Repayed 484 484 484 505 582 771Closing Debt 5000 5287 6693 8077 9172 9519Total Equity 3760 4090 4900 5709 6428 6907

59
Table21: ROE and Liquidity projections
Column 1 2012 2013 2014 2015 2016 2017
ROE (15.5%) 568.74 568.74 568.74 568.74 606.26 705.29
Depreciation 482.28 482.28 482.28 482.28 525.12 638.20
Debt Payback Obligation 483.64 568.74 568.74 504.82 581.90 770.79
Debt Coverage Ratio 2.17 2.17 2017 2.08 1.94 1.74
Employee Welfare
Employees are the greatest resource of any organization, especially if they are considered the
source of competitive advantage. The developmental needs of employees on the job must be
seriously considered and their socio-psychological needs beside physical comfort. The working
environment should have hazard free and physically comfortable working ambience especially
in plants. Medical facilities, recreation needs and religious and social needs may be considered
with very clear policy and programmes.
Corporate Social Responsibility
1. Most organizations including power utilities have incorporated some polices and
programmes to respond to stakeholders other than those directly involved in business
and the physical environment. UPRVUNL does not seem to have any explicit policy or
programme or at the most reactive response. There is a need to be pro-active in this
important area of corporate involvement. One issue is the displacement of people due
to acquisition of land or water accessibility to the plant or railway line to carry raw
material and waste. The other is the impact of operations on the quality of air and water
and on the lives of the people , their institutions, social and physical infrastrcutre. The
third is the yawning gap between the national objectives in the areas of education,
health and employment.
60
2. Since governments cannot hope to meet all societal needs the business organizations
are exhorted to contribute to these important national priorities. Many a times the
social welfare measures for employees are included in this section of corporate strategy.
However according to international thinking corporate giving is not enough. Nor it is
done to get cheap popularity. Many organizations are criticized for being too publicity
seeking. Such activities are not sustainable in the long run. We suggest below broad
policy directions, as undertaken by NTPC which fit into the corporate strategy well
without causing undue pressure on the balance sheet or seeking cheap publicity. What
sticks is the genuine desire to help the society by integrating business and social
responsibility.
3. NPRR 2003, that is, National policy on Resettlement and Rehabilitation has already
elaborate policy guidelines, which capture the essence of rehabilitation of affected
people and families and how to compensate for the disruptions these stakeholders have
gone through. Need leas to mention that they should be compensated and then
supported to make a living which comparable before the project of the corporations
have displaced them within the framework under local applicable laws, including land
acquisition laws and those applicable to SC/ST categories.
4. Most corporations followed a reactive practice but many have managed these issues
very pro-actively. We have NTPC from electricity generation sector and have Tata
business group which had been managing the affected people very proactively by
working with people even before the law was created or the project was put up. They
did it in very transparent fashion by involving local public and institutions like village
panchayats and NGOs. UPRVUNL has to put in place the budget, polices, and
organizational structure in place to execute these policies. It is advised that NTPC
Policies in this regard can be adopted. The document is available at
http://www.ntpc.co.in/images/content/corporate_citizenship/NTPC_R&R_Policy_2005.
61
5. In fact since NTPC is in similar business the polices on environment, R&R, Community
Development , scholarship programmes , people empowerment can be modified and
adopted with scale and skills of URVUNL . These policies are available at
http://www.ntpc.co.in/index.php?option=com_content&view=article&id=19&Itemid=2
7&lang=en
6. The most critical issue is “Do harm to environment and community while engaging in
business and go that extra mile”. This motto and the above polices should be reviewed
by an internal group who can study and present modified version to the board. Once
approved it can be assigned to the structural entity devoted to good corporate citizen in
the structure proposed by E&Y. These initiatives should also be hosted on the UPRVUNL
website.
7. While it would be difficult to provide jobs to everyone in the community, early
constructions work can provide some succor on this front, But creating community
hospital and school education at affordable price to community will create good will and
support for the operations at the nearby plant locations can work very well and certainly
doable. . Besides, 30 scholarships for ITI (Rs. 1 lakh each), 10 engineering undergrad (Rs
3 lakhs each) and 5 post grad scholarships (Rs 5 lakhs each) another international
scholarship for Rs. 15 lakhs, can be instituted by creating a corpus which can generate
about Rs. 1 crore for all eligible plant locations. The corpus could receive additional
funding for neutralizing cost index of education. The candidates could be toppers from
the community around plants. For other activities mentioned above the money should
be budgeted as part of the project. The total scholarship budget is Rs. 1 crore per year
for all 5 locations or any new additional locations that might come up.
8. The other important are to which Niagam can look into is the construction of electricity
distribution network around 5 Kms. radii around each of the plants for the local
communities. A mobile health van can provide assistance through an NGO engaged in
health sector in the proximity of each plant. Finally drinking water facilities can be
provided to the local communities
62
9. These investments in short run can create excellent goodwill but bring future support
from the scholarship alumni directly or indirectly.
WAY FORWARD
We list below most critical recommendations based on our analysis and recommendations
Environmentally, the corporation faces competitive and regulatory challenges but in
general the climate for electricity Generation Company is extremely positive: lot of
opportunities.
It should immediately change its BTG and BOP suppliers for any future contract. Put
pressure on current vendors to expedite supply and project implementation. Put sever
penalties on project delays.
Immediately infuse additional equity for future projects and raise debts further to
expedite the tempo of capacity additions
Put capable project management team one for each project beside the overall planning
and monitoring team in order the get delayed projects on stream
Put up the new structure in place, first corporate then plants within a period of six
months
Plan for training senior executives/ engineers to assume the roles envisaged into the
corporate structure
Immediately devise and apply the incentive system
Expedite PRAGATI initiative, including ERP and complete all components within a year’s
time.
Create new product development and process improvements labs within 2 years
63
Develop a strong monitoring system
Create the new structure for Board of Directors within one-year time
Finally create health and educational facilities in communities, beside R&R activities.
What will give more visibility is the scholarship scheme to be provided in the focused
region of 30 kms or so radius in the vicinity of each plant. These are corporate level
initiatives and the scholarships proposed are for all plant locations with a single budget
of Rs. 1 crore per year.
10. The other important area to which Nigam can look into is the construction of electricity
distribution network around 5 Kms. radii around each of the plants for the local
communities. Finally a mobile health van can provide assistance through an NGO
engaged in health sector in the proximity of each plant. Finally drinking water facilities
can be provided to the local communities

64
Annexure I
TABLE 1: Assumptions for comparing investment options Assumptions
Per Mega Watt cost of establishment of new plant = 5 Crore Economic viable life of new plant = 25 Years
Average PLF ove life of a plant = 85 % Percentage increase in PLF due to refurbishment = 25 %
Time after which new plant will require R&M = 10 Years Yearly R&M expenses as percentage of gross block = 3.5 %
Per Mega Watt cost of refurbishment = 1.8 crore Number of years of benefit from refurbishment = 15 Years
Per Mega Watt cost of uprating = 3 Crore Number of years of benefit from uprating = 15 Years
Discount rate for finding present value of benefits = 7 %
Approved tariff = 1.8 Rs/unit
Auxiliary Power consumption = 8 % Outage = 7 %
Variable operating costs are assumed to be same for new and refurbished plants
In case of refurbishment or upration R&M expenses will continue to occur at the same rate as in 10yr old plant

65
Table 2: Cost/MW for R& M Projects
Plant Age of
Plant Unit Nature Status
Capacity
Agency Cost Life Exp
Increase in PLF
Capacity Addition
(MW)
cost/MW
Obra 43 1,2 Refurbish
ment Completed 100 TPE 189.39 15 Yes 20 1.72
Harduaganj 33 5 R&M Completed 165 BHEL 55.34 0 Yes 0 0.34
Obra B (5*200)
30 Refurbish
ment Ongoing 1000 BHEL 1635.00 15 Yes 80 1.51
Anpara A 23 R&M Ongoing 630 BHEL 787.50 0 Yes (keep
stable) 0 1.25
Harduaganj 32 7 uprating Ongoing 120 BHEL 392.00 15 Yes 10 3.02
Obra A 35 7,8 R&M Ongoing 188 BHEL 178.00 0 Yes 0 0.95
Anpara B (2*500)
30 R&M Ongoing 1000 BHEL 691.97 0 yes
(stabilize) 0 0.69
Parichha 25 1,2 Refurbish
ment Proposed 220 BHEL 528.00 15 yes 0 2.40
Table3: Power Consumption in different sectors in UP (MU) Years Industrial Domestic Utilities Agricultural Total 2000-01 7177.00 7513.00 752.00 4473.00 22855.00 2001-02 7301.40 9265.80 928.50 4985.60 25238.40 2002-03 7285.77 9245.96 926.51 4974.92 25184.36 2003-04 7374.00 9311.00 1861.00 5814.00 26907.00 2004-05 7656.89 9668.20 1932.39 6037.05 27939.25 2005-06 8801.50 12557.10 2082.48 5321.80 30109.30 2006-07 10097.77 14406.48 2389.19 6105.58 34543.73 2007-08 10971.26 15652.69 2595.86 6633.74 37531.88 2008-09 11445.75 16329.66 2708.13 6920.64 39155.10 2009-10 11111.28 18578.06 2786.20 7774.65 40283.86 2010-11 12184.19 20371.97 3055.24 8525.38 44173.70 2011-12 12876.32 21529.21 3228.79 9009.66 46683.00 2012-13 13568.45 22686.44 3402.34 9493.95 49192.30 2013-14 14260.57 23843.68 3575.90 9978.24 51701.60 2014-15 14952.70 25000.91 3749.45 10462.52 54210.90

66
Graph2: Regression model

67
Table 5: Demand of Power in UP
Year GDP (in Crores) Population
Per Capita GDP
Per Capita Energy (kwh)
Total Requirement (MU)
Capacity Required ( MW)
2010 491,302 199,636,280 29,587 600 103,212 17,596 2011 530,606 199,636,280 31,279 620 105,221 18,199 2012 573,055 203,948,423 33,068 641 111,088 19,214 2013 618,899 208,353,709 34,959 663 117,369 20,300 2014 668,411 212,854,149 36,958 686 124,096 21,464 2015 721,884 217,451,799 39,071 711 131,303 22,711 2016 779,635 222,148,758 41,306 737 139,029 24,047 2017 842,005 226,947,171 43,668 764 147,312 25,480 2018 909,366 231,849,230 46,165 793 156,197 27,016 2019 982,115 236,857,173 48,805 824 165,731 28,665 2020 1,060,684 241,973,288 51,596 856 175,963 30,435 2021 1,145,539 247,199,911 54,547 890 186,948 32,335
Table 6: showing average cost/MW by different Project Process Average Cost/MW
Row Labels Average of cost/MW
R&M 0.806 Refurbishment 1.879 uprating 3.015 Grand Total 1.484
Table 7: NPV of Investment in different Project processes
Project Process
NPV in Crores
New Plant 7.47 Refurbishment -0.80 Uprating 5.78

68
Table 8: Status of capacity Additions in Nigam
Name of the Project
Ownership Capacity Status Schedule for synchronization
Paricha TPS Stage II
UPRVUNL 500 Under construction Expected by the Nov, 2011 and Dec, 2011
Harduaganj TPS Extn (Stage II)
UPRVUNL 500 Under construction Expected by May,11 and Jul, 2011
Anpara D TPS Unit I
UPRVUNL 500 Under construction Expected by the Dec,2011
Anpara D TPS Unit II
UPRVUNL 500 Under construction Expected in 12th plan
Table 9: Distribution by Ownership in 11th Plan (MW)
Private Sector 1530 MOUs 450 Central Govt 1571 Total 3551
Table 10: Distribution by Ownership in 12th Plan (MW)
UPRVUNL 3550 Joint Ventures 3300 Private Sector (Competitive Bidding) 8600 Private Sector (MOUs) 10940 Case -1 (Planned) 5000 From Central Govt. 5040 Total 36430

69
Table 11: Projected Demand and Supply 2012-17
2012 2013 2014 2015 2016 2017
Projected Demand (MW) 19214 20300 21464 22711 24047 25480
Supply Other Sources 6011 6011 8477 10943 14231 17519
Supply UPRVUNL 6192 6192 6192 6871 7531 8851
PLF UPRVUNL 65.0% 70.0% 75.0% 75.0% 75.0% 75.0%
Supply from UPRVUNL 4025 4025 4025 4466 4895 5753
Gap 9178 10264 8962 7301 4920 2207
Table 12: Nigam Status up to March, 2010
Year
Parichha TPS Extn Stage II
Harduaganj TPS Extn.
Anpara ‘D’TPS Average
Capacity 500 500 1000 Current Estimated Cost 235600 222500 535876 Exp upto 09-10 148321 154284.41 143242 Remaining Exp. 87279 68215.59 392634 Cost in Lakhs Per MW 471.2 445 535.876 484.025

70
Table13: Financial Requirements
YEAR 2011-12 2012-13 2013-14 2014-15 2015-16 2016-17 Capacity Addition (MW) 0 0 0 250 660 1320 Investment Required (in Cr) 0 0 0 1210 3195 6389 Part investment for WIP 303 1101 2698 2698 2396 1597 Opening Debt 5272.02 5000 5287 6693 8077 9172 Debt Drawn 212 771 1889 1889 1677 1118 Equity Infused 91 330 810 810 719 479 Debt Repaided 484 484 484 505 582 771 Closing Debt 5000 5287 6693 8077 9172 9519 Total Equity 3760 4090 4900 5709 6428 6907
Table14: Debt-service coverage Ratio
Column1 2012 2013 2014 2015 2016 2017 ROE (15.5%) 568.74 568.74 568.74 568.74 606.26 705.29 Depreciation 482.28 482.28 482.28 482.28 525.12 638.20 Debt payback obligation 483.64 483.64 483.64 504.82 581.90 770.79 Debt Coverage Ratio 2.17 2.17 2.17 2.08 1.94 1.74
Table 15: Demand and Capacity Requirements 2011-21
Year Total Requirement
(MU) Capacity Required
(MW) 2010 2011 105,221 18,199 2012 111,088 19,214 2013 117,369 20,300 2014 124,096 21,464 2015 131,303 22,711 2016 139,029 24,047 2017 147,312 25,480 2018 156,197 27,016 2019 165,731 28,665 2020 175,963 30,435 2021 186,948 32,335

71
Annexure II: HR DATA
Table- 1
Group Sanctioned Posts
Working Numbers
Vacancies Percentage Vacancies/ Sanctioned
A 449 304 145 32.29
B 1088 695 393 36.12
C 8307 5372 2935 35.33
D 4582 2487 2095 45.72
Total 14426 8858 5568 38.59
Manpower on roll per MW 2.17 About 350 numbers as muster roll employees in addition About 6500 employees engaged by contractors for outsourced works Overall manpower engaged per MW 3.85 Data for Group C and D is as on 01-12-2010
Nigam Manpower: An Overall View

72
Table 2
Electrical and Mechanical
Post Anpara Obra Parichha Panki Harduaganj Lucknow Total % Shortage
S W S W S W S W S W S W S W
CE-1 2 0 1 0 1 0 0 0 0 0 2 0 6 0 100.0
CE-2 6 1 3 1 2 1 1 0 2 1 5 2 19 6 68.42
SE 16 5 14 4 9 2 4 3 7 2 9 5 59 22 62.71
EE 67 38 72 48 40 41 15 15 39 23 21 30 254 195 23.22
AE 262 168 296 135 122 141 66 46 100 59 26 32 872 581 33.37
Total 353 212 386 188 174 185 86 64 148 85 63 69 1210 804 33.55
JE 264 198 576 305 167 108 152 107 229 92 38 11 1426 821 42.42
Data for JEs are as on 01-12-2010 S- Sanctioned W- Working Nigam Manpower: An Overall View
Table 3
Civil
Post Anpara Obra Parichha Panki Harduaganj Lucknow Total % Shortage
S W S W S W S W S W S W S W
CE-2 2 0 0 0 0 0 0 0 0 0 1 1 3 1 66.70
SE 6 2 2 1 3 0 0 0 1 2 2 0 14 5 64.28
EE 17 9 6 6 7 7 1 2 6 9 9 12 46 45 2.20
AE 38 9 13 9 20 10 3 4 14 10 14 0 102 42 58.82
Total 63 20 21 16 30 17 4 6 21 21 26 13 165 93 43.64
JE 46 27 33 21 9 8 8 6 14 11 1 0 111 73 34.20
Data for JEs are as on 01-12-2010 Nigam Manpower: An Overall View
S- Sanctioned W- Working
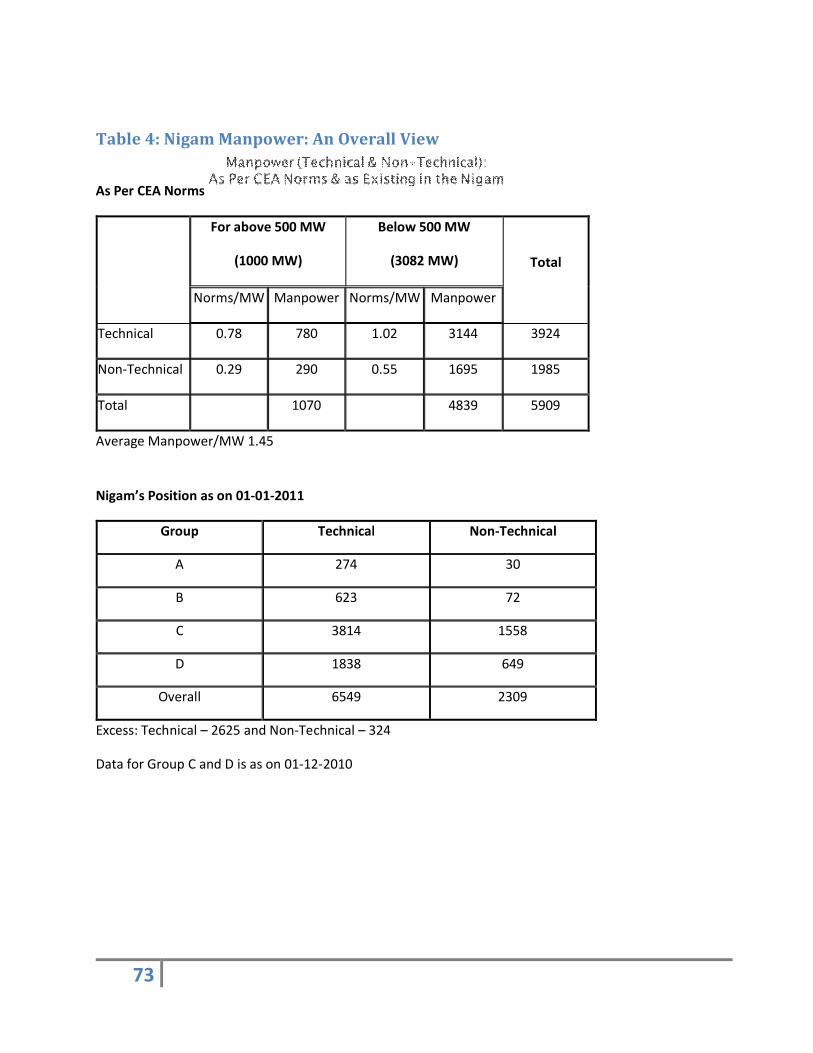
73
Table 4: Nigam Manpower: An Overall View
As Per CEA Norms
For above 500 MW
(1000 MW)
Below 500 MW
(3082 MW) Total
Norms/MW Manpower Norms/MW Manpower
Technical 0.78 780 1.02 3144 3924
Non-Technical 0.29 290 0.55 1695 1985
Total 1070 4839 5909
Average Manpower/MW 1.45
Nigam’s Position as on 01-01-2011
Group Technical Non-Technical
A 274 30
B 623 72
C 3814 1558
D 1838 649
Overall 6549 2309
Excess: Technical – 2625 and Non-Technical – 324
Data for Group C and D is as on 01-12-2010

74
Table 5:
* There are 1611 employees working on outsourced works. Total Employee/MW being 1.322
** Includes staff at Corporate office, construction of new projects, non-core activities like school and hospitals also
Data for Non-Executives is as on 01-12-2010
Name of Project
Plant
Capacity
(MW)
No. of Executive
No. of
Non-
Executive
Ratios
Employee per MW
Executive
to Non-
Executive
Executive to
total Manpower
Executive to
Installed
capacity
Singrauli 2000 479 1166 0.822 0.41 0.29 0.24
Rihand 2000 437 606 0.521 0.72 0.42 0.22
Unchahar 1050 382 692 1.02 0.55 0.36 0.36
Tanda 440 231 336 1.288 0.68 0.41 0.53
VindhyaNagar* 3260 602 994 0.49 0.60 0.18 0.185
Total 8750 2131 3794 0.68 0.56 0.36 0.24
Utpadan Nigam** 4082 1114 7859 2.20 0.14 0.12 0.27
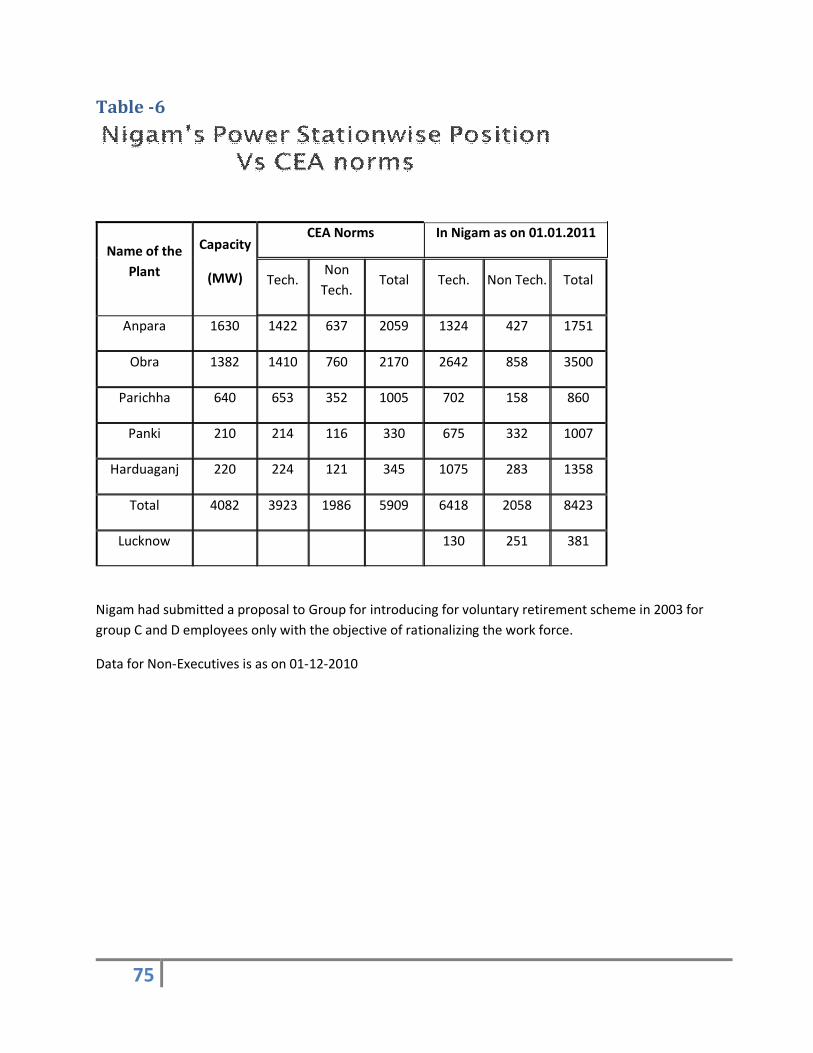
75
Table -6
Name of the Plant
Capacity
(MW)
CEA Norms In Nigam as on 01.01.2011
Tech. Non
Tech. Total Tech. Non Tech. Total
Anpara 1630 1422 637 2059 1324 427 1751
Obra 1382 1410 760 2170 2642 858 3500
Parichha 640 653 352 1005 702 158 860
Panki 210 214 116 330 675 332 1007
Harduaganj 220 224 121 345 1075 283 1358
Total 4082 3923 1986 5909 6418 2058 8423
Lucknow 130 251 381
Nigam had submitted a proposal to Group for introducing for voluntary retirement scheme in 2003 for group C and D employees only with the objective of rationalizing the work force.
Data for Non-Executives is as on 01-12-2010
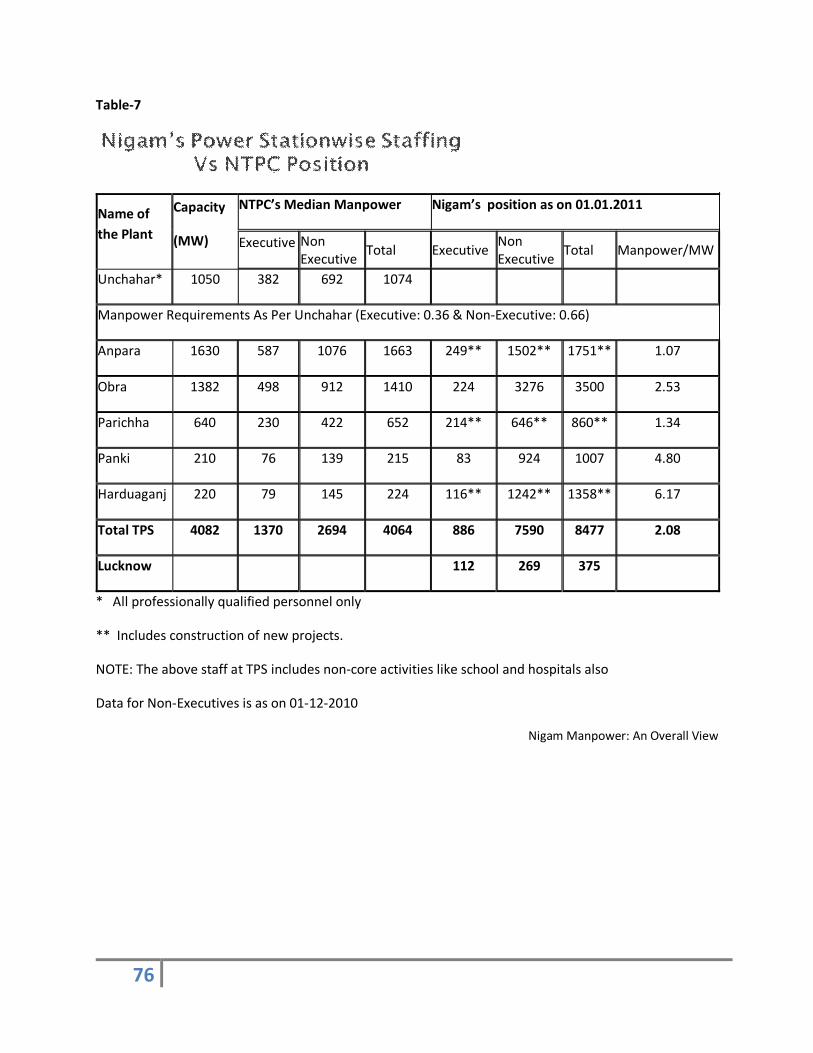
76
Table-7
Name of the Plant
Capacity
(MW)
NTPC’s Median Manpower Nigam’s position as on 01.01.2011
Executive Non Executive
Total Executive Non Executive
Total Manpower/MW
Unchahar* 1050 382 692 1074
Manpower Requirements As Per Unchahar (Executive: 0.36 & Non-Executive: 0.66)
Anpara 1630 587 1076 1663 249** 1502** 1751** 1.07
Obra 1382 498 912 1410 224 3276 3500 2.53
Parichha 640 230 422 652 214** 646** 860** 1.34
Panki 210 76 139 215 83 924 1007 4.80
Harduaganj 220 79 145 224 116** 1242** 1358** 6.17
Total TPS 4082 1370 2694 4064 886 7590 8477 2.08
Lucknow 112 269 375
* All professionally qualified personnel only
** Includes construction of new projects.
NOTE: The above staff at TPS includes non-core activities like school and hospitals also
Data for Non-Executives is as on 01-12-2010
Nigam Manpower: An Overall View
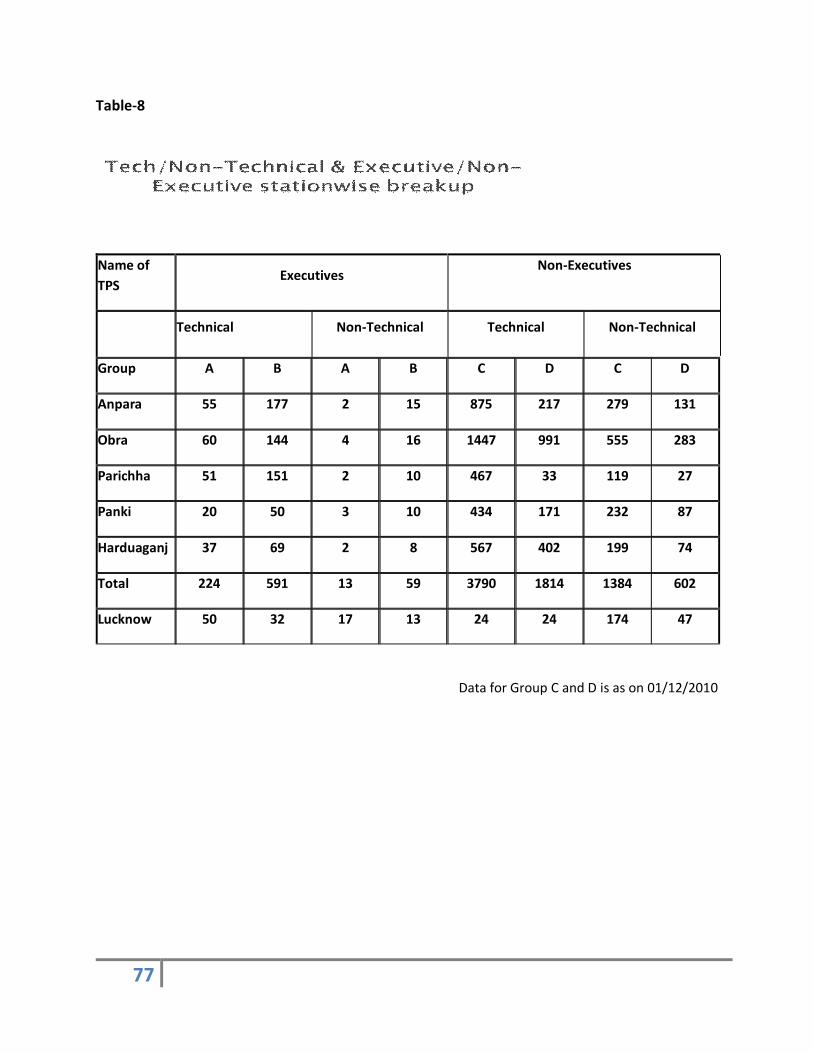
77
Table-8
Name of TPS
Executives Non-Executives
Technical Non-Technical Technical Non-Technical
Group A B A B C D C D
Anpara 55 177 2 15 875 217 279 131
Obra 60 144 4 16 1447 991 555 283
Parichha 51 151 2 10 467 33 119 27
Panki 20 50 3 10 434 171 232 87
Harduaganj 37 69 2 8 567 402 199 74
Total 224 591 13 59 3790 1814 1384 602
Lucknow 50 32 17 13 24 24 174 47
Data for Group C and D is as on 01/12/2010
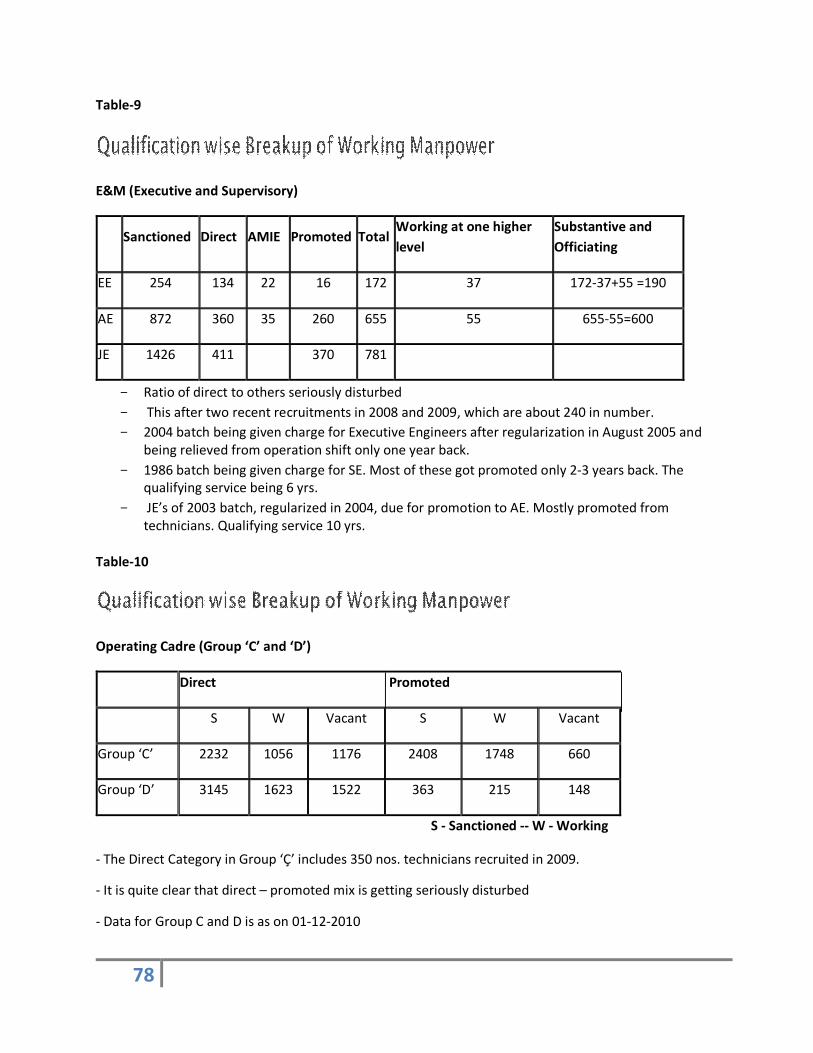
78
Table-9
E&M (Executive and Supervisory)
Sanctioned Direct AMIE Promoted Total Working at one higher level
Substantive and Officiating
EE 254 134 22 16 172 37 172-37+55 =190
AE 872 360 35 260 655 55 655-55=600
JE 1426 411 370 781
- Ratio of direct to others seriously disturbed - This after two recent recruitments in 2008 and 2009, which are about 240 in number. - 2004 batch being given charge for Executive Engineers after regularization in August 2005 and
being relieved from operation shift only one year back. - 1986 batch being given charge for SE. Most of these got promoted only 2-3 years back. The
qualifying service being 6 yrs. - JE’s of 2003 batch, regularized in 2004, due for promotion to AE. Mostly promoted from
technicians. Qualifying service 10 yrs.
Table-10
Operating Cadre (Group ‘C’ and ‘D’)
Direct Promoted
S W Vacant S W Vacant
Group ‘C’ 2232 1056 1176 2408 1748 660
Group ‘D’ 3145 1623 1522 363 215 148
S - Sanctioned -- W - Working
- The Direct Category in Group ‘Ç’ includes 350 nos. technicians recruited in 2009.
- It is quite clear that direct – promoted mix is getting seriously disturbed
- Data for Group C and D is as on 01-12-2010

79
Annexure III: Organizational Structure (Copyright E&Y)
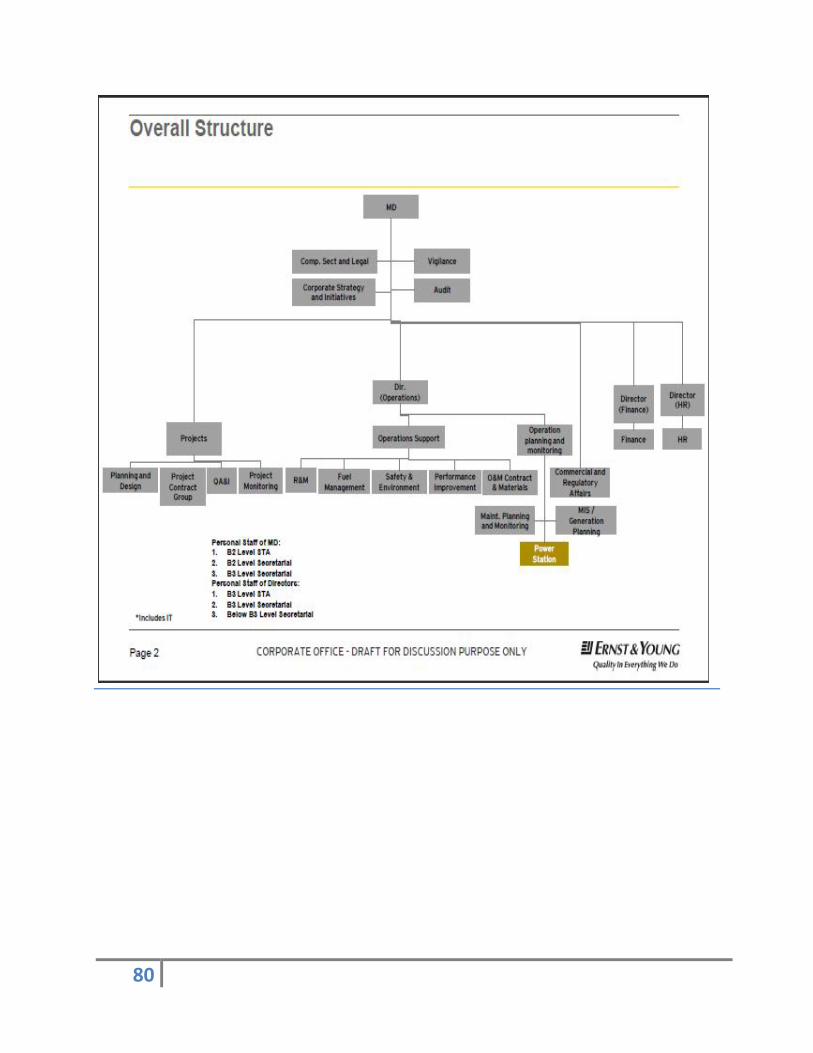
80

81
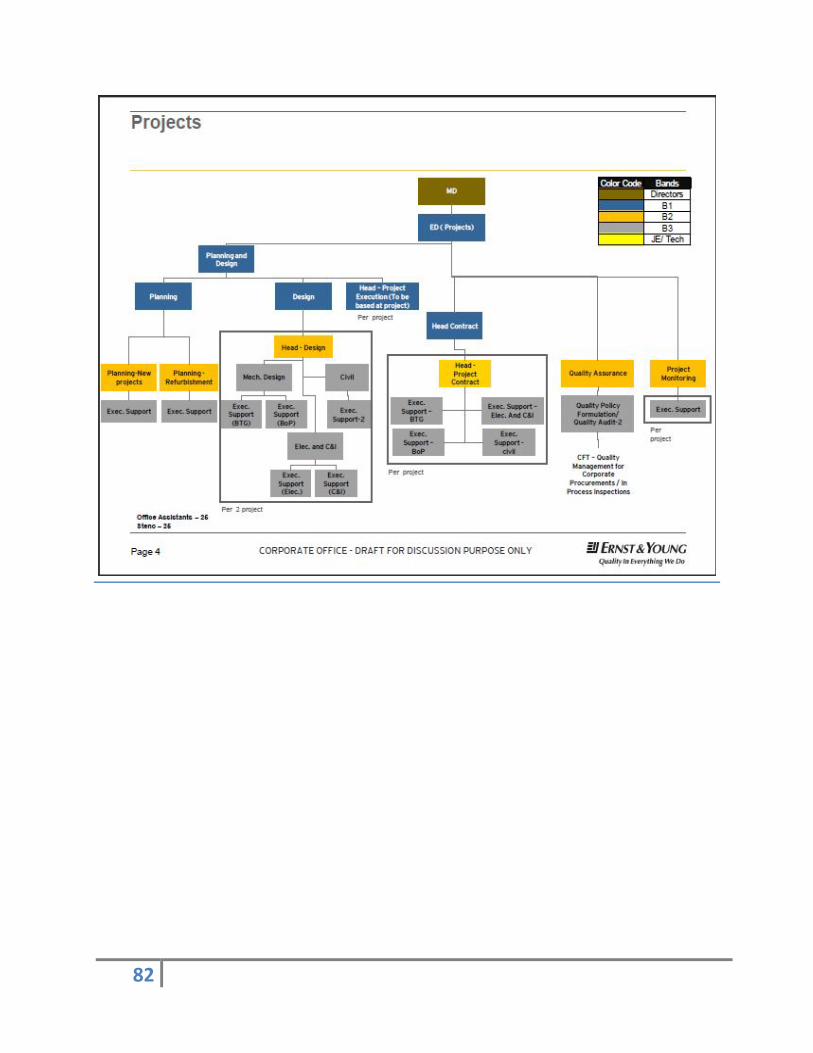
82
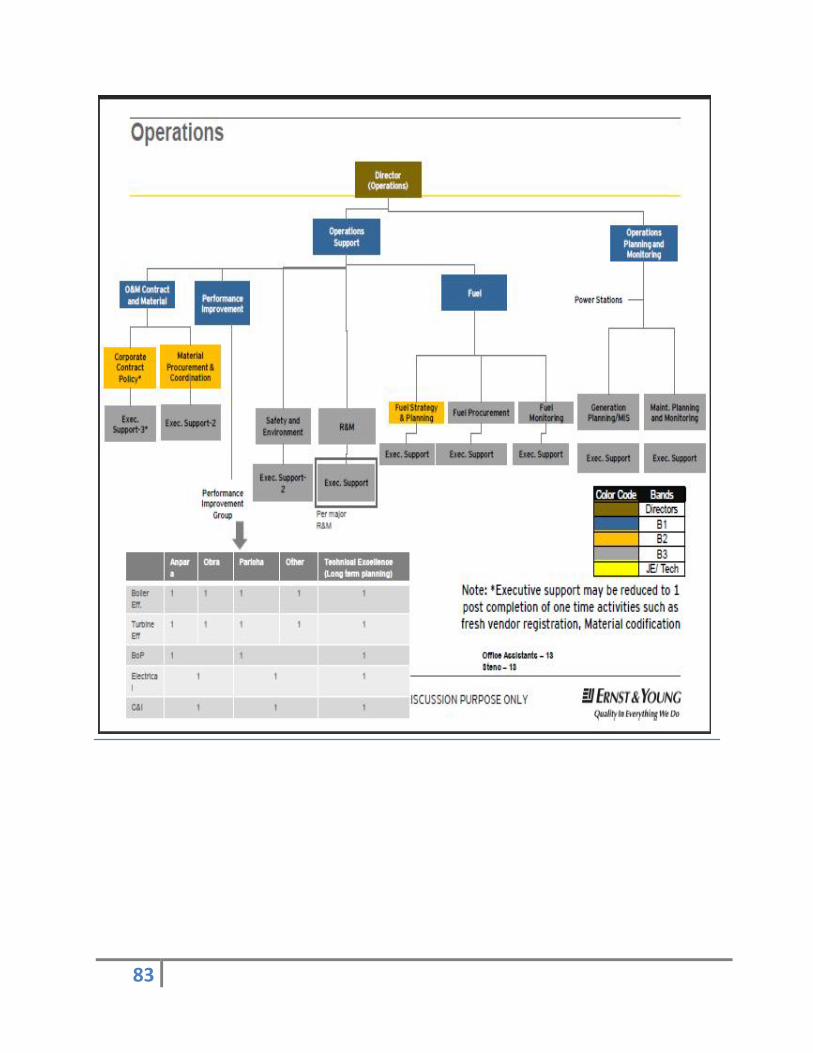
83

84

85
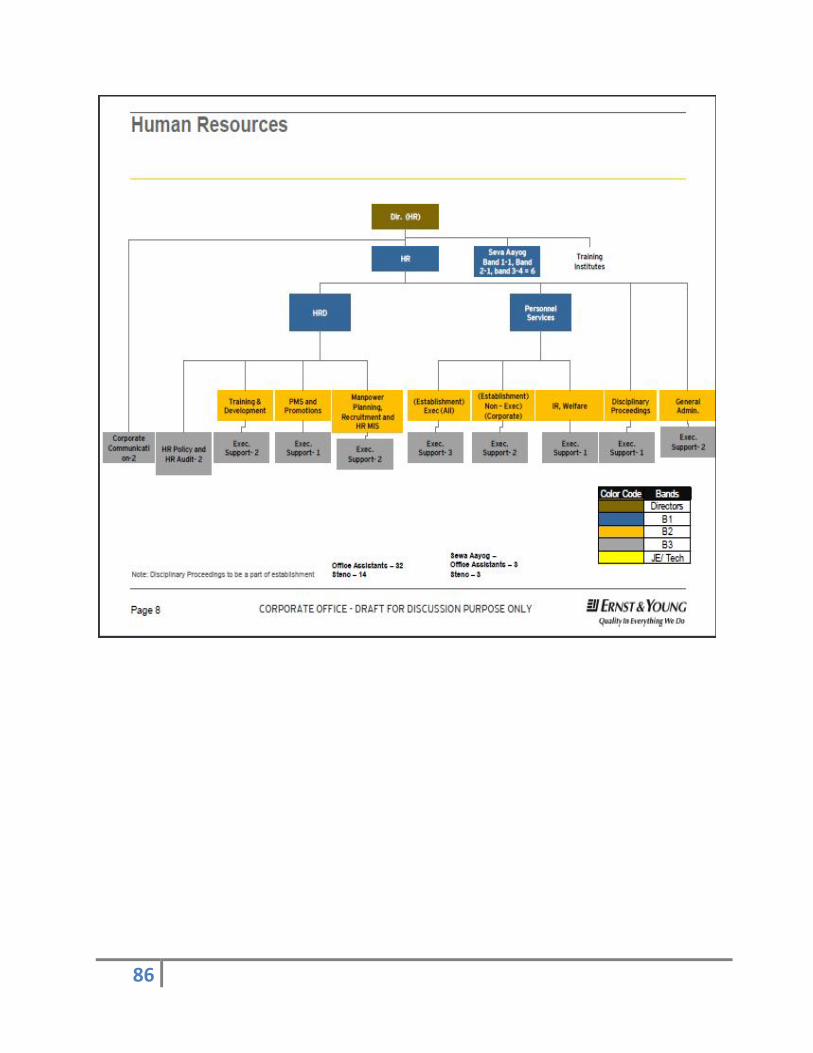
86

87
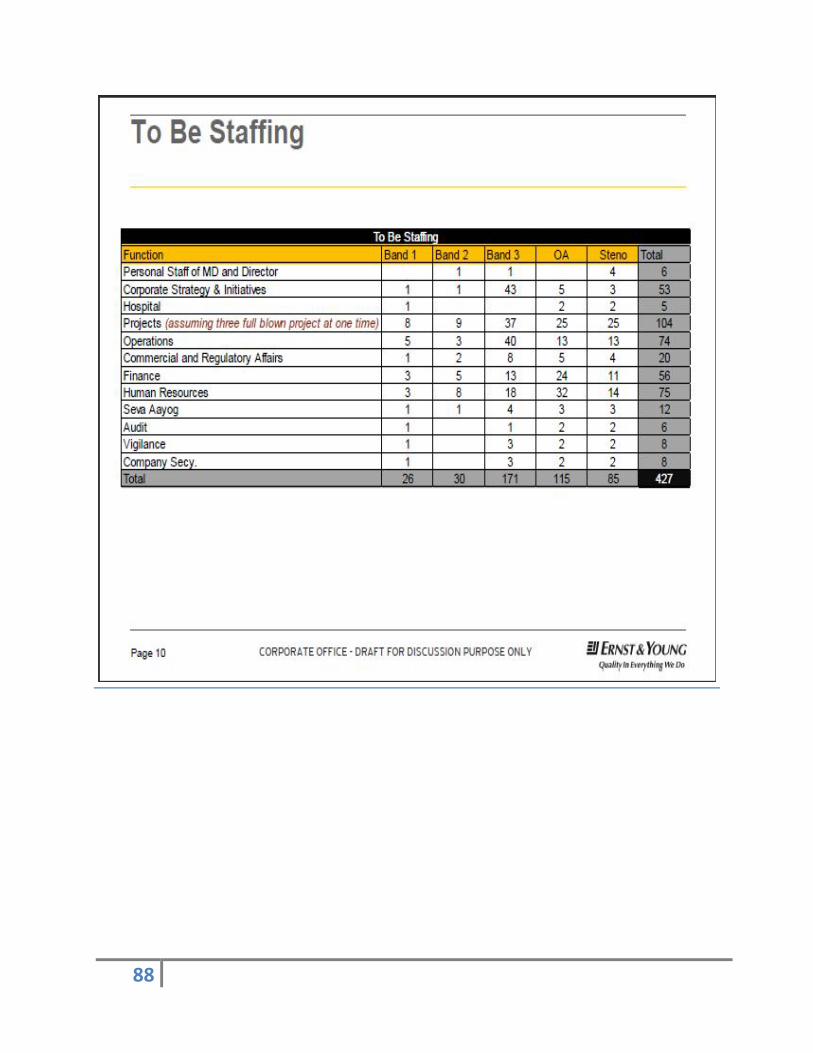
88
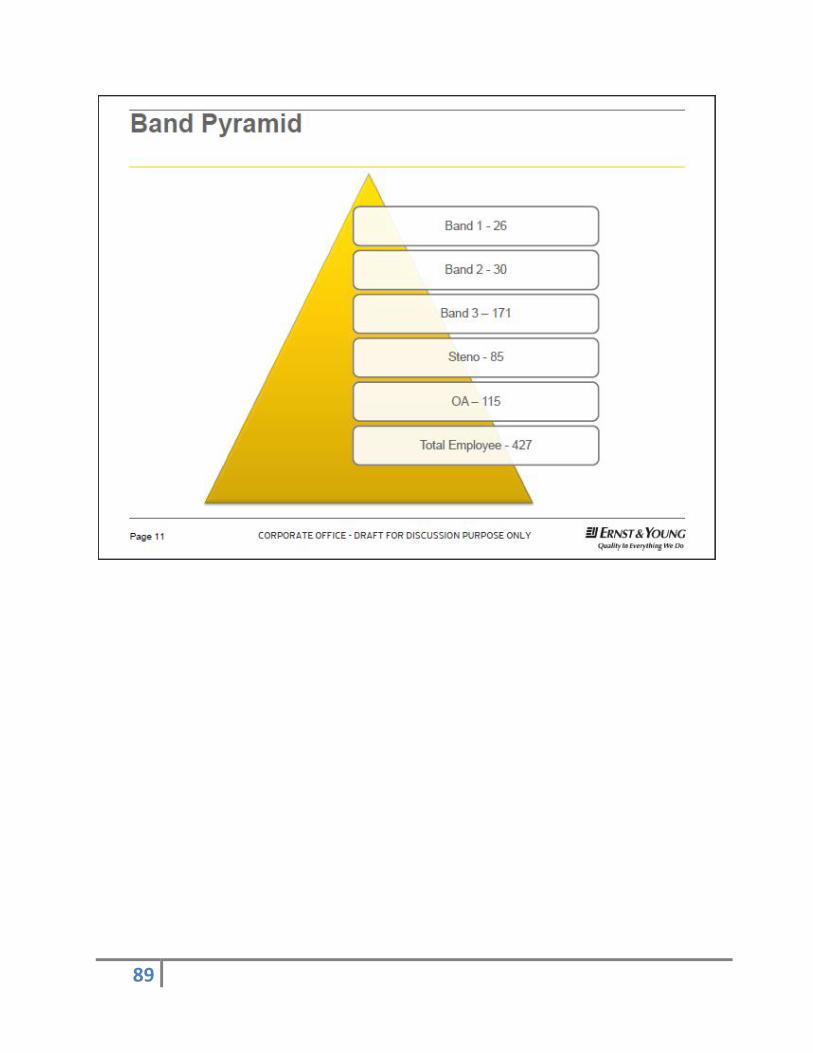
89
90
Appendix
BTG:
600 MW- Shanghai Metallurgy Import and Export Co., Ltd. No. 428, Jintian, Jinqian Village, Liantang Town, Qingpu, Shanghai, China. Telephone: 0086-13-661467786 Mobile Phone: 0086 13661649038 Fax: 0086-21-59191323 Website: http://www.semcgroup.com
Shanghai Electric Group Co.,Ltd.- Supplied to Reliance Rosa 30F,Shanghai Maxdo Center,No. 8 Xing Yi Road,PRC(200336) Tel: +86(21)52082266 Fax: +86(21)52082103 Contacts: [email protected] [email protected]
Siemens Energy Solutions: Phone: +49 (0)180 524 70 00, [email protected]
Harbin Power Equipment Company Ltd-Spplied to Salaya TPP Essar Jamnagar Block B, 39 Sanda Dongli Rd, Dongli District, Harbin, 066206, China 335-5089003 email [email protected]
BOP Coal Handling plant: Techpro systems: Tecpro Towers, Plot No. 11-A17, 5th Cross Road, SIPCOT IT Park, Siruseri - 603 103, Chennai, India. Phone : (+91 44) 3747 4747 Fax : (+91 44) 3744 3011
BGR Energy Systems India Limited – Provides Turnkey BOP Packages No. 443, Anna Salai, 7th Floor, Guna Building, Teynampet, Chennai – 600 011 Phone : +91 44 2435 2436 Fax : +91 44 24315678 Elecon Engineering Company Ltd. Anand Sojitra Road Vallabh Vidyanagar - 388120 Gujarat India. 91-2692-237016/17, 236521, 236590

91
Ash Handling Plant
INDURE HOUSE, GREATER KAILASH-II, NEW DELHI NEW DELHI-110048 Phone 911141891400/29213762 Macawber Beekay Beekay House C-450, Sector -10, Noida U.P. - 201 301, India. Tel.: +91-120-4507700, 3007700 Fax : +91-120-4507777, 300777
Demineralized plant Driplex Water Engineering Pvt. Ltd Driplex House 1, Panchsheel Community Centre New Delhi - 110017, India Tel: +91-11-26499 - 625 / 698 / 699 / 701 +91-11-49007 - 700 Fax: +91- 11- 26496427 E-mail: [email protected] Thermax – Takes turnkey contracts Thermax House,14 Mumbai-Pune Road Wakdewadi, Pune 411 003 Tel: 91-20-66051200/25542122 Fax: 91-20-25542242
Cooling towers PAHARPUR COOLING TOWERS LTD. Paharpur House 8/1/B Diamond Harbour Road Kolkata 700027 INDIA Phone : +91-33-40133000 Fax : +91-33-40133499 E-Mail : [email protected]

92
Gammon India Limited Veer Savarkar Marg, Prabhadevi, Mumbai 400025 India Tel: +91-22-61114000 Fax: +91-22-2430 0221 E-mail: [email protected]
Chimney NBCC Limited, NBCC Bhawan, Lodhi Road, New Dehli – 110003 India Telephone No : 011 - 24367314 - 17, 24367022 Fax : 011 - 24366995 E-Mail : [email protected] Gammon India Simplex Infrastructures Limited ‘Vaikunth’, 82-83, Nehru Place, New Delhi – 110 019 Tel: (91 11) 2643 2515 /6818, 2467-3330, 2621 9636 Fax: (91 11) 2646 5869 Email: [email protected]
Fuel Oil System TECHNO ELECTRIC & ENGINEERING CO. LTD. 3F, Park Plaza, North Block 71, Park Street Kolkata - 700 016 Telephone :033-30213000/3100,22498090, 983185661720 Fax No.: 033-22171167