final baseline human health risk assessment … baseline human health risk assessment eureka mills -...
TRANSCRIPT

FINAL
BASELINE HUMAN HEALTH RISK ASSESSMENT
EUREKA MILLS - EUREKA, UTAH
September 2002
Prepared for:
US Environmental Protection Agency
Region 8
999 18th Street, Suite 500
Denver, CO 80202
Prepared by:
Syracuse Research Corporation
Environmental Science Center - Denver
999 18th Street, Suite 1975
Denver, CO 80202
Baseline Human Health Risk Assessment - Eureka Mills, Utah FINAL
I:\Eureka\RA Report\Sept 2002 Final\Eureka HHRA.wpd i
TABLE OF CONTENTS
EXECUTIVE SUMMARY . . . . . . . . . . . . . . . . . . . . . . . . . . . . . . . . . . . . . . . . . . . . . . . . . ES-1
1.0 INTRODUCTION . . . . . . . . . . . . . . . . . . . . . . . . . . . . . . . . . . . . . . . . . . . . . . . . . . . . . . . . . 1
1.1 Site Description and History . . . . . . . . . . . . . . . . . . . . . . . . . . . . . . . . . . . . . . . . 1
1.2 Basis for Potential Health Concern . . . . . . . . . . . . . . . . . . . . . . . . . . . . . . . . . . 1
1.3 Purpose and Scope of this Risk Assessment . . . . . . . . . . . . . . . . . . . . . . . . . . . 1
1.4 Organization of This Document . . . . . . . . . . . . . . . . . . . . . . . . . . . . . . . . . . . . . 2
2.0 DATA SUMMARY AND SELECTION OF CHEMICALS OF POTENTIAL CONCERN . . . . . . . 3
2.1 Soil Data . . . . . . . . . . . . . . . . . . . . . . . . . . . . . . . . . . . . . . . . . . . . . . . . . . . . . . . . 3
2.1.1 Data Set 1 (Residential Soils) . . . . . . . . . . . . . . . . . . . . . . . . . . . . . . . . . . 32.1.2 Data Set 2 (Soils from Non-Residential Areas) . . . . . . . . . . . . . . . . . . . . . 3
2.2 Indoor Dust . . . . . . . . . . . . . . . . . . . . . . . . . . . . . . . . . . . . . . . . . . . . . . . . . . . . . 4
2.3 Basement Soils . . . . . . . . . . . . . . . . . . . . . . . . . . . . . . . . . . . . . . . . . . . . . . . . . . . 5
2.4 Paint . . . . . . . . . . . . . . . . . . . . . . . . . . . . . . . . . . . . . . . . . . . . . . . . . . . . . . . . . . . 5
2.5 Tap Water . . . . . . . . . . . . . . . . . . . . . . . . . . . . . . . . . . . . . . . . . . . . . . . . . . . . . . . 5
2.6 Physical-Chemical Characterization of Site Soils . . . . . . . . . . . . . . . . . . . . . . . 6
2.6.1 Speciation of Arsenic and Lead . . . . . . . . . . . . . . . . . . . . . . . . . . . . . . . . . 62.6.2 In Vitro Bioaccessability . . . . . . . . . . . . . . . . . . . . . . . . . . . . . . . . . . . . . . 7
2.7 Selection of Chemicals of Potential Concern . . . . . . . . . . . . . . . . . . . . . . . . . . . 7
3.0 EXPOSURE ASSESSMENT . . . . . . . . . . . . . . . . . . . . . . . . . . . . . . . . . . . . . . . . . . . . . . . . . 11
3.1 Conceptual Site Model . . . . . . . . . . . . . . . . . . . . . . . . . . . . . . . . . . . . . . . . . . . . 11
3.1.1 Potential Sources . . . . . . . . . . . . . . . . . . . . . . . . . . . . . . . . . . . . . . . . . . . 113.1.2 Migration Pathways . . . . . . . . . . . . . . . . . . . . . . . . . . . . . . . . . . . . . . . . . 113.1.3 Exposed Populations and Potential Exposure Scenarios . . . . . . . . . . . . 11
3.2 Pathway Screening . . . . . . . . . . . . . . . . . . . . . . . . . . . . . . . . . . . . . . . . . . . . . . . 12
3.2.1 Residential Exposures . . . . . . . . . . . . . . . . . . . . . . . . . . . . . . . . . . . . . . . 123.2.2 Recreational Exposures . . . . . . . . . . . . . . . . . . . . . . . . . . . . . . . . . . . . . 14
3.3 Summary of Pathways of Principal Concern . . . . . . . . . . . . . . . . . . . . . . . . . 14
4.0 QUANTIFICATION OF EXPOSURE AND RISK FROM NON-LEAD CONTAMINANTS . . . . 16
4.1 Quantification of Exposure . . . . . . . . . . . . . . . . . . . . . . . . . . . . . . . . . . . . . . . . 16
4.1.1 Basic Equation . . . . . . . . . . . . . . . . . . . . . . . . . . . . . . . . . . . . . . . . . . . . . 164.1.2 Exposure Parameters . . . . . . . . . . . . . . . . . . . . . . . . . . . . . . . . . . . . . . . . 174.1.3 Concentration of Non-Lead COPCs (C) . . . . . . . . . . . . . . . . . . . . . . . . . 244.1.4 Relative Bioavailability (RBA) . . . . . . . . . . . . . . . . . . . . . . . . . . . . . . . . . 26
4.2 Toxicity Assessment . . . . . . . . . . . . . . . . . . . . . . . . . . . . . . . . . . . . . . . . . . . . . . 28
4.3 Risk Characterization . . . . . . . . . . . . . . . . . . . . . . . . . . . . . . . . . . . . . . . . . . . . 30
Baseline Human Health Risk Assessment - Eureka Mills, Utah FINAL
I:\Eureka\RA Report\Sept 2002 Final\Eureka HHRA.wpd ii
4.3.1 Overview . . . . . . . . . . . . . . . . . . . . . . . . . . . . . . . . . . . . . . . . . . . . . . . . . 304.3.2 Noncancer Risk . . . . . . . . . . . . . . . . . . . . . . . . . . . . . . . . . . . . . . . . . . . . 304.3.3 Cancer Risk . . . . . . . . . . . . . . . . . . . . . . . . . . . . . . . . . . . . . . . . . . . . . . . 314.3.4 Results . . . . . . . . . . . . . . . . . . . . . . . . . . . . . . . . . . . . . . . . . . . . . . . . . . . 32
4.4 Uncertainties . . . . . . . . . . . . . . . . . . . . . . . . . . . . . . . . . . . . . . . . . . . . . . . . . . . . 32
4.4.1 Uncertainties in Concentration Estimates . . . . . . . . . . . . . . . . . . . . . . . . 334.4.2 Uncertainties in Human Intake . . . . . . . . . . . . . . . . . . . . . . . . . . . . . . . . 334.4.3 Uncertainties in Toxicity Values . . . . . . . . . . . . . . . . . . . . . . . . . . . . . . . 344.4.4 Uncertainties in Absorption from Soil . . . . . . . . . . . . . . . . . . . . . . . . . . . 344.4.5 Uncertainties from Pathways Not Evaluated . . . . . . . . . . . . . . . . . . . . . . 34
5.0 RISKS FROM LEAD . . . . . . . . . . . . . . . . . . . . . . . . . . . . . . . . . . . . . . . . . . . . . . . . . . . . . 36
5.1 Adverse Effects of Lead Exposure . . . . . . . . . . . . . . . . . . . . . . . . . . . . . . . . . . 36
5.1.1 Neurological Effects . . . . . . . . . . . . . . . . . . . . . . . . . . . . . . . . . . . . . . . . 365.1.2 Effects on Pregnancy and Fetal Development . . . . . . . . . . . . . . . . . . . . . 375.1.3 Effects on Heme Synthesis . . . . . . . . . . . . . . . . . . . . . . . . . . . . . . . . . . . . 375.1.4 Cancer Effects . . . . . . . . . . . . . . . . . . . . . . . . . . . . . . . . . . . . . . . . . . . . . 375.1.5 Current Guidelines for Protecting Children from Lead . . . . . . . . . . . . . 37
5.2 Methods for Assessing Lead Risks in a Community . . . . . . . . . . . . . . . . . . . 38
5.2.1 Blood Lead Monitoring . . . . . . . . . . . . . . . . . . . . . . . . . . . . . . . . . . . . . . 385.2.2 Modeling Approaches . . . . . . . . . . . . . . . . . . . . . . . . . . . . . . . . . . . . . . . 395.2.3 Weight-of-Evidence Evaluation . . . . . . . . . . . . . . . . . . . . . . . . . . . . . . . . 40
5.3 Modeling of Lead Risk . . . . . . . . . . . . . . . . . . . . . . . . . . . . . . . . . . . . . . . . . . . 40
5.3.1 Evaluation of Lead Risks to Current and Future Residents . . . . . . . . . . 405.3.2 Evaluation of Lead Risks to Recreational Teenagers . . . . . . . . . . . . . . . 44
5.4 Direct Blood Lead Observations . . . . . . . . . . . . . . . . . . . . . . . . . . . . . . . . . . . 47
5.4.1 Overview of Available Data . . . . . . . . . . . . . . . . . . . . . . . . . . . . . . . . . . . 475.4.2 Correlation of Blood Lead Values with Environmental Lead . . . . . . . . . 485.4.3 Other Potential Determinants of Blood Lead . . . . . . . . . . . . . . . . . . . . . 485.4.4 Uncertainties Regarding Associations with Blood Lead Levels . . . . . . . 49
5.5 Weight of Evidence Evaluation . . . . . . . . . . . . . . . . . . . . . . . . . . . . . . . . . . . . 49
5.6 Uncertainties . . . . . . . . . . . . . . . . . . . . . . . . . . . . . . . . . . . . . . . . . . . . . . . . . . . . 50
5.6.1 Uncertainty in Lead Concentration Estimates . . . . . . . . . . . . . . . . . . . . . 505.6.2 Uncertainty in Lead Absorption from Soil . . . . . . . . . . . . . . . . . . . . . . . . 515.6.3 Uncertainty in Modeling Approach . . . . . . . . . . . . . . . . . . . . . . . . . . . . . 51
6.0 SUMMARY AND CONCLUSIONS . . . . . . . . . . . . . . . . . . . . . . . . . . . . . . . . . . . . . . . . . . . . 53
6.1 Risks from Non-Lead COPCs . . . . . . . . . . . . . . . . . . . . . . . . . . . . . . . . . . . . . . 53
6.2 Risks from Lead . . . . . . . . . . . . . . . . . . . . . . . . . . . . . . . . . . . . . . . . . . . . . . . . . 55
7.0 REFERENCES . . . . . . . . . . . . . . . . . . . . . . . . . . . . . . . . . . . . . . . . . . . . . . . . . . . . . . . . . . 57

Baseline Human Health Risk Assessment - Eureka Mills, Utah FINAL
I:\Eureka\RA Report\Sept 2002 Final\Eureka HHRA.wpd iii
LIST OF TABLES
Table 2-1 Summary Statistics for Data Set #1
Table 2-2 Summary Statistics for Data Set #2
Table 2-3 Summary Statistics for Indoor Dust Analyzed via ICP
Table 2-4 Summary Statistics for Basement Soils Analyzed via ICP
Table 2-5 Summary Statistics for Eureka Paint Stratified by Condition
Table 2-6 Summary Statistics for Tap Water Analyzed via ICP
Table 2-7 Comparison of Detection Limits in Tap Water to RBCs
Table 2-8 As Bioaccessibility Results for Eureka
Table 2-9 Pb Bioaccessibility Results for Eureka
Table 2-10 Evaluation of Beneficial and Essential Minerals in Soil and Water
Table 2-11 Maximum and Average Chemical Concentrations in Soil and Background
Concentrations in the United States
Table 2-12 Maximum Chemical Concentrations in Soil and Water and Region 3 RBC
Standards
Table 4-1 Summary Statistics for Residential Surface Soils
Table 4-2 Summary Statistics for Indoor Dust
Table 4-3 Summary Statistics for Residential Tap Water
Table 4-4 Summary Statistics for Non-Residential Surface Soils
Table 4-5 Risk Estimates for Residential Soil Ingestion
Table 4-6 Risk Estimates for Residential Consumption of Tap Water
Table 4-7 Risk Estimates at Non-Residential Areas
Table 5-1 Summary Statistics for Lead in Surface Soils Collected from Non-Residential
Areas
Table 5-2 Relative Lead Mass of Mineral Phases for Test Materials Evaluated for In Vivo
Bioavailability
Table 5-3 Summary Statistics for the IEUBK Model (All Residential Properties)
Table 5-4 IEUBK Results for Future Residential Children at Non-Residential Areas
Table 5-5 Bower’s Model Predictions for Recreational Visitors
Table 5-6 Eureka Blood Lead Study Summary Statistics
Table 5-7 Summary of Survey Parameter Significance Testing
Table 5-8 Observed and Predicted Blood Lead in Children
Baseline Human Health Risk Assessment - Eureka Mills, Utah FINAL
I:\Eureka\RA Report\Sept 2002 Final\Eureka HHRA.wpd iv
LIST OF FIGURES
Figure 1-1 Eureka Site Location
Figure 2-1 Eureka Mills Sample Locations
Figure 2-2 Eureka Residential Exposure Areas
Figure 2-3 Eureka Mine Waste Areas
Figure 2-4 Sampling locations for Speciation Analyses
Figure 2-5 Distribution of Arsenic Mass by Phase
Figure 2-6 Distribution of Lead Mass by Phase
Figure 3-1 Conceptual Site Model for Residential Exposure to COPCs
Figure 3-2 Residential Soils Depth Profile for Lead
Figure 4-1 Risk Estimates for Residential Areas
Figure 4-2 Risk Estimates for Recreational Users at Non-Residential Areas
Figure 4-3 Risk Estimates for Future Residents at Non-Residential Areas
Figure 5-1 Lead Comparison Between ICP and XRF Analyses
Figure 5-2 Site-Specific Soil-Dust Relationship for Lead
Figure 5-3 Summary Statistics for Predicted Residential Blood Leads
Figure 5-4 Blood Lead versus Soil Lead Concentrations
Figure 5-5 Blood Lead versus Soil Lead Concentrations by Exposure Areas
Figure 5-6 Blood Lead versus Dust Lead
Figure 5-7 Blood Lead versus Paint Lead Concentrations Analyzed via Pb L Line
Figure 5-8 Blood Lead versus Paint Lead Concentrations Analyzed via Pb K Line
Figure 5-9 Eureka Blood Lead Stratified by Age
Figure 5-10 Observed vs Predicted Pb for Children (0-6 yrs.)
Figure 5-11 Lead Residuals

Baseline Human Health Risk Assessment - Eureka Mills, Utah FINAL
I:\Eureka\RA Report\Sept 2002 Final\Eureka HHRA.wpd v
LIST OF APPENDICES
Appendix A Analysis of XRF Data Quality for Soils from Data Sets 1 and 2
Appendix B Physical-Chemical Data for Eureka Soils
Appendix C Screening Calculations for Dermal, Inhalation and Homegrown Vegetable
Exposure
Appendix D IEUBK Model Inputs and Results
Appendix E ISE Model Inputs
Baseline Human Health Risk Assessment - Eureka Mills, Utah FINAL
I:\Eureka\RA Report\Sept 2002 Final\Eureka HHRA.wpd vi
LIST OF ABBREVIATIONS AND ACRONYMS
ATSDR Agency for Toxic Substances and Disease Registry
BOR Bureau of Reclamation
CDC Centers for Disease Control
COPC Chemical of Potential Concern
CTE Central Tendency Exposure
CUPHD Central Utah Public Health Department
DERR Division of Environmental Response and Remediation
DI Daily Intake
DL Detection Limit
EDF Empirical Continuous Distribution Function
EPC Exposure Point Concentration
GM Geometric Mean
GSD Geometric Standard Deviation
HI Hazard Index
HIF Human Intake Factor
HQ Hazard Quotient
ICP Inductively Coupled Plasma
IEUBK Integrated Exposure, Uptake, and Biokinetic Model
IRsd Soil and Dust Ingestion Rate
ISE Integrated Stochastic Exposure Model
P10 Probability of a Blood Lead Value over 10 g/dL
PbB Blood Lead
PDF Probability Density Function
PRA Probabilistic Risk Assessment
RBA Relative Bioavailability
RBC Risk Based Concentration
RfD Reference Dose
RME Reasonable Maximum Exposure
SF Slope Factor
USEPA US Environmental Protection Agency
UCL Upper Confidence Limit
UDEQ Utah Department of Environmental Quality
XRF X-ray Fluorescence
Baseline Human Health Risk Assessment - Eureka Mills, Utah FINAL
I:\Eureka\RA Report\Sept 2002 Final\Executive Summary.wpd ES-1
EXECUTIVE SUMMARY
Site Description and Background
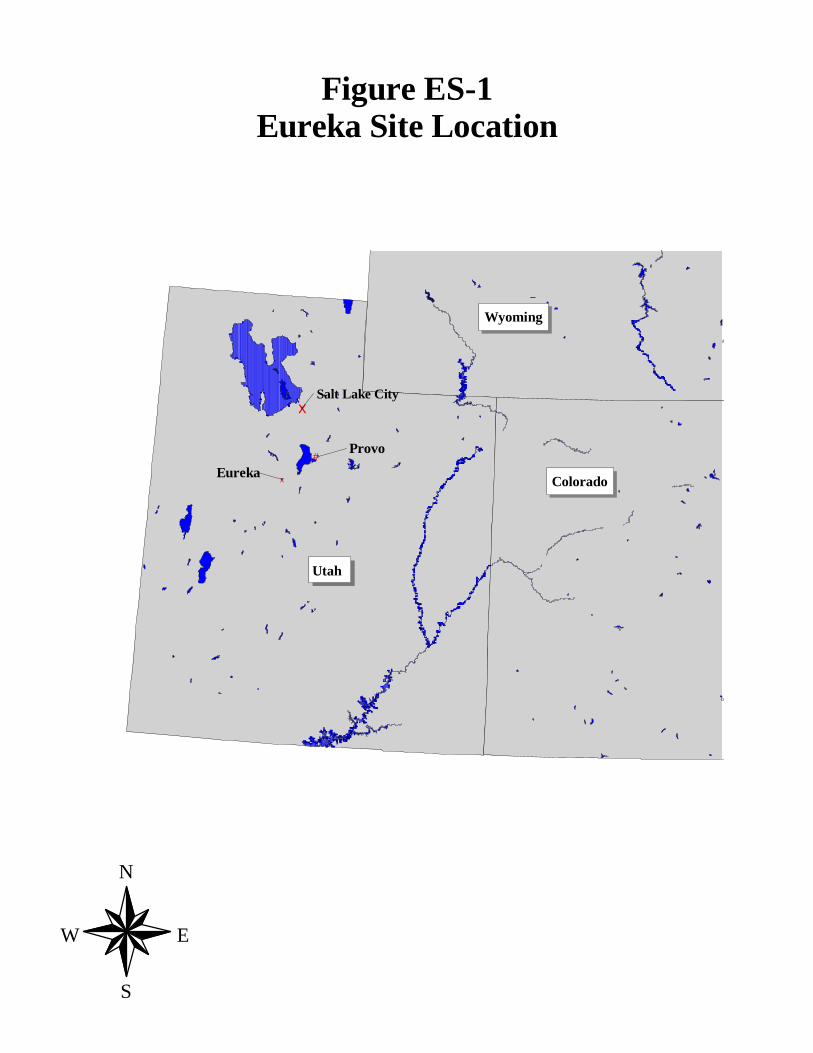
The town of Eureka, Utah, is located in the East Tintic Mountains approximately 70 miles
southwest of Salt Lake City and 40 miles southwest of Provo (Figure ES-1). The Tintic district is
the second-most productive base- and precious-metal mining district in Utah (Morris and
Mogensen 1978). In July 2000, the Utah Department of Environmental Quality Division of
Evironmental Response and Remediation (UDEQ/DERR) observed elevated concentrations of
lead (ranging up to 47,800 ppm) in site soils. Because these values are well above the U.S.
Environmental Protection Agency’s (USEPA’s) default level of concern for residents (400 ppm),
and because these elevations occur in close proximity to residents of Eureka, it was determined
that a threat to human health and the environment was present at this site. As a result, EPA began
a Removal Evaluation at this site on August 28, 2000.
The purpose of this document is to utilize data collected during this Removal Evaluation to
characterize the nature and magnitude of risks which mining-related wastes pose to humans who
may be exposed in the vicinity of the site.
Data Summary
Soil Data
Two data sets were obtained for soils from this site. Data set #1 contains analytical results for
soil samples (N= 4,211) collected from residential properties. Data set #2 contains results for
soils (N=265) collected from background locations and non-residential (primarily mine-waste)
areas surrounding Eureka. All of these soil samples were analyzed via X-ray Fluorescence (XRF)
and approximately 10% of these samples were also analyzed via Inductively Coupled Plasma
(ICP) methods. Each data set underwent a data quality evaluation consisting of a two-step
process to determine if the data were adequate for use in this risk assessment.
Numerous data issues were identified with the XRF data sets. Several chemicals were found to
have inadequate XRF detection limits, and others did not correlate with results obtained using
ICP. Therefore, only data sets deemed reliable for use in the risk assessment were used.
Summary statistics for the data sets deemed reliable are shown in Tables ES-1 and ES-2.
Baseline Human Health Risk Assessment - Eureka Mills, Utah FINAL
I:\Eureka\RA Report\Sept 2002 Final\Executive Summary.wpd ES-2
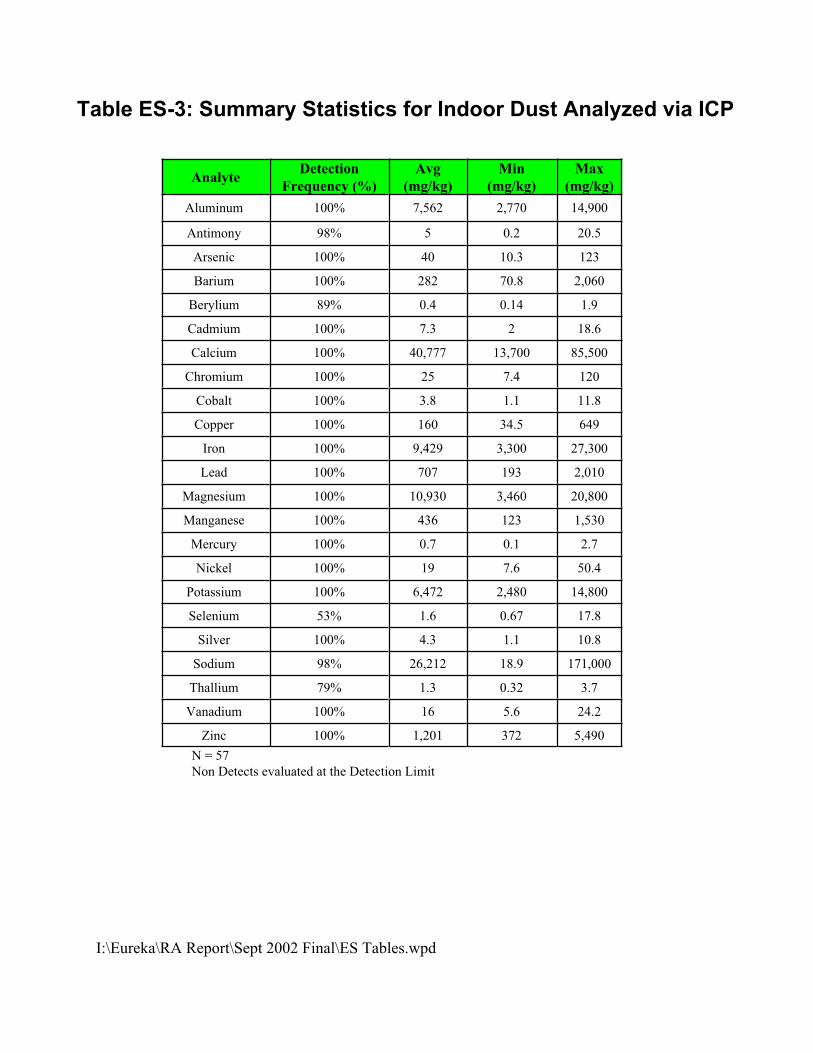
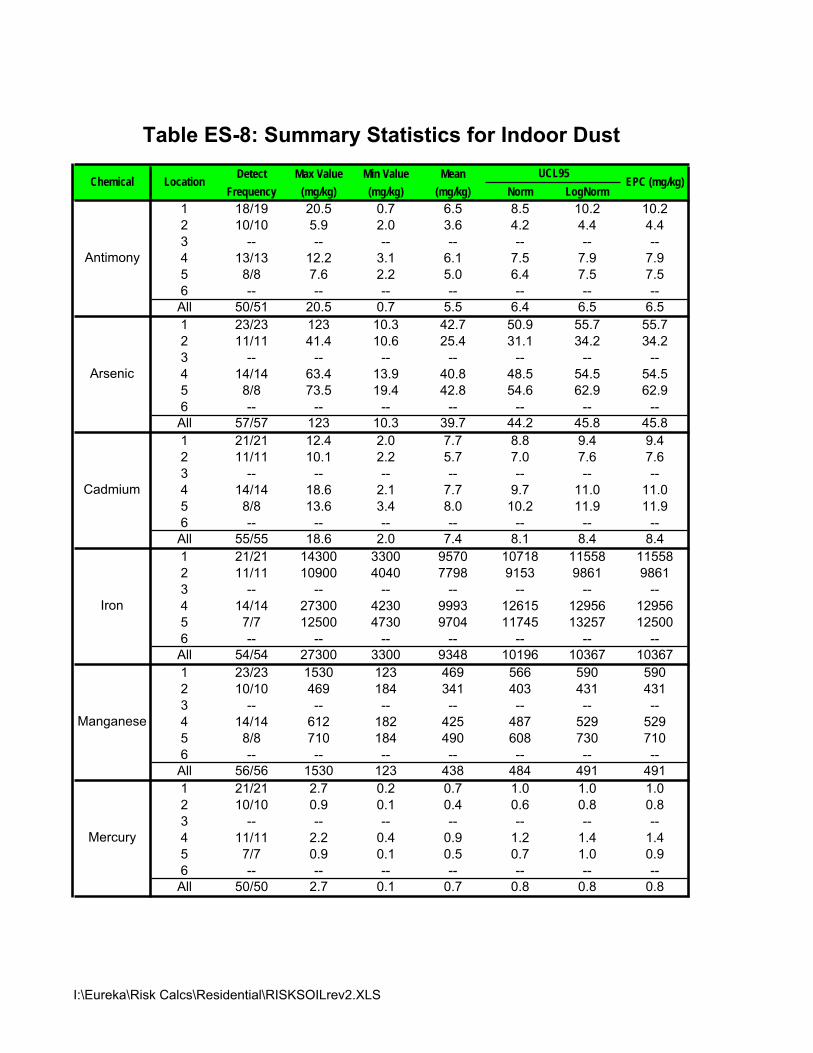
Dust Data
Indoor dust samples were obtained from a total of 57 residences within the study area and
analyzed via ICP for 23 metals. No data quality issues were identified with this data set.
Summary statistics are provided in Table ES-3.
Basement Soil Data
Composite soil samples (0-2") were collected from 7 homes which were observed to have earthen
basements. Summary statistics for metals (analyzed via ICP) are presented in Table ES-4. No
data quality issues were identified with this data set.
Paint Data
Analysis of lead levels in paint was conducted at 23 homes within Eureka. Table ES-5 provides
summary statistics for both interior and exterior paint measurements stratified by observed
condition. Overall, the mean detected value in all interior samples was 0.20 mg/cm2, with a range
of 0.01 to 1.7 mg/cm2. For exterior samples, the mean was 0.44 mg/cm2, with a range of 0.01 to
1.4 mg/cm2.
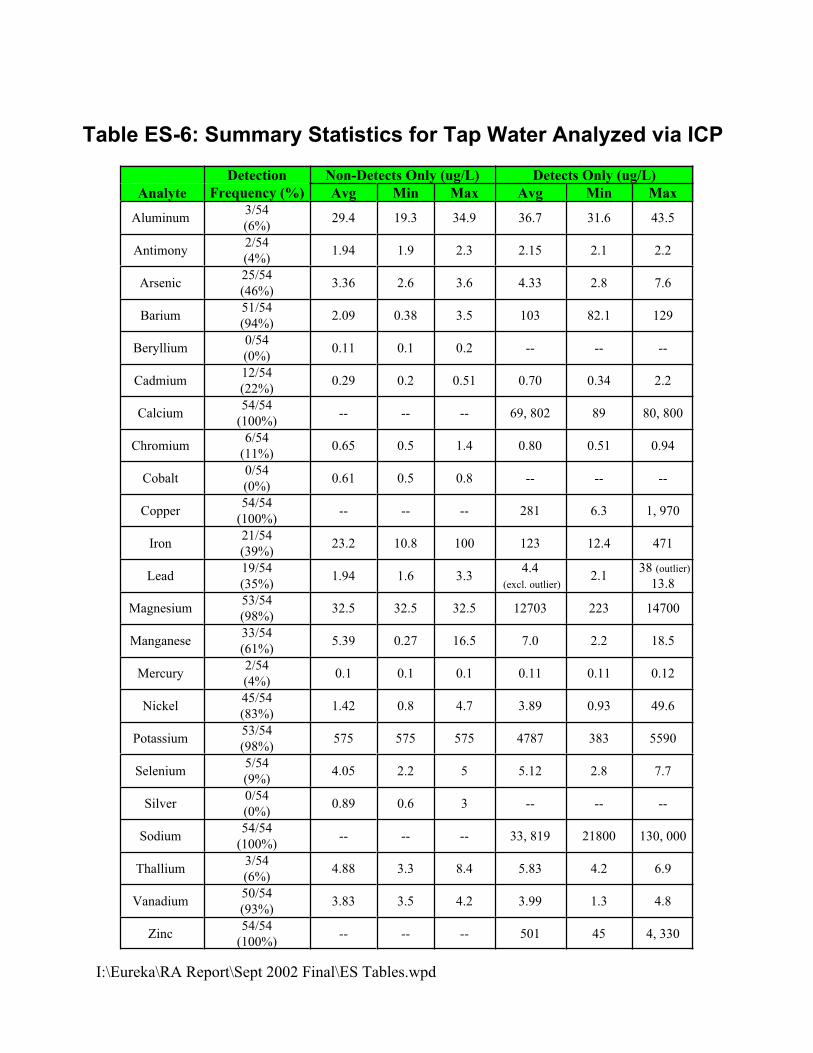
Tap Water
First draw tap water samples were collected from a total of 54 households and were analyzed via
ICP for 23 metals. Summary statistics are provided in Table ES-6. Due to concerns over
thallium, additional tap water samples were collected and analyzed using a lower specified
detection limit. Based on this analysis, thallium was not detected in any sample at a detection
limit of 1 ug/L.
Physical-Chemical Characterization of Site Soils
A set of 17 site soils collect from the Eureka area (Figure ES-2) were submitted for physical-
chemical characterization. This characterization consisted of speciation analysis, evaluation of
size distributions, and in vitro testing for bioaccessability.
Arsenic in site samples was found to occur mainly in the iron oxide and lead-arsenic oxide phases,
with a smaller fraction present in iron sulfate. The majority of all arsenic-bearing particles are
<100 um in diameter. Lead occurs primarily as cerussite. In most samples, the majority of lead-
bearing particles are 5-100 um in diameter. Bioaccessability for arsenic in these samples ranged
from 4 to 42%. The bioaccessability for lead in these samples was observed to range from 60 to
89%.
Baseline Human Health Risk Assessment - Eureka Mills, Utah FINAL
I:\Eureka\RA Report\Sept 2002 Final\Executive Summary.wpd ES-3
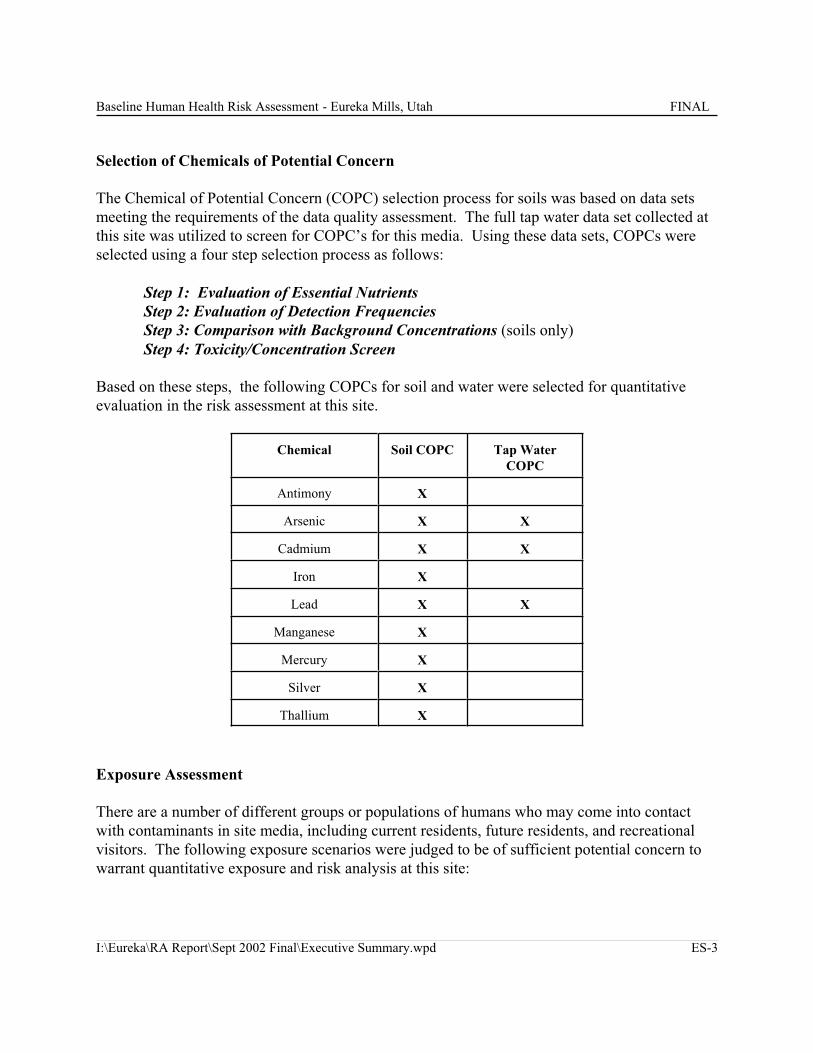
Selection of Chemicals of Potential Concern
The Chemical of Potential Concern (COPC) selection process for soils was based on data sets
meeting the requirements of the data quality assessment. The full tap water data set collected at
this site was utilized to screen for COPC’s for this media. Using these data sets, COPCs were
selected using a four step selection process as follows:
Step 1: Evaluation of Essential NutrientsStep 2: Evaluation of Detection FrequenciesStep 3: Comparison with Background Concentrations (soils only)
Step 4: Toxicity/Concentration Screen
Based on these steps, the following COPCs for soil and water were selected for quantitative
evaluation in the risk assessment at this site.
Chemical Soil COPC Tap Water
COPC
Antimony X
Arsenic X X
Cadmium X X
Iron X
Lead X X
Manganese X
Mercury X
Silver X
Thallium X
Exposure Assessment
There are a number of different groups or populations of humans who may come into contact
with contaminants in site media, including current residents, future residents, and recreational
visitors. The following exposure scenarios were judged to be of sufficient potential concern to
warrant quantitative exposure and risk analysis at this site:
Baseline Human Health Risk Assessment - Eureka Mills, Utah FINAL
I:\Eureka\RA Report\Sept 2002 Final\Executive Summary.wpd ES-4
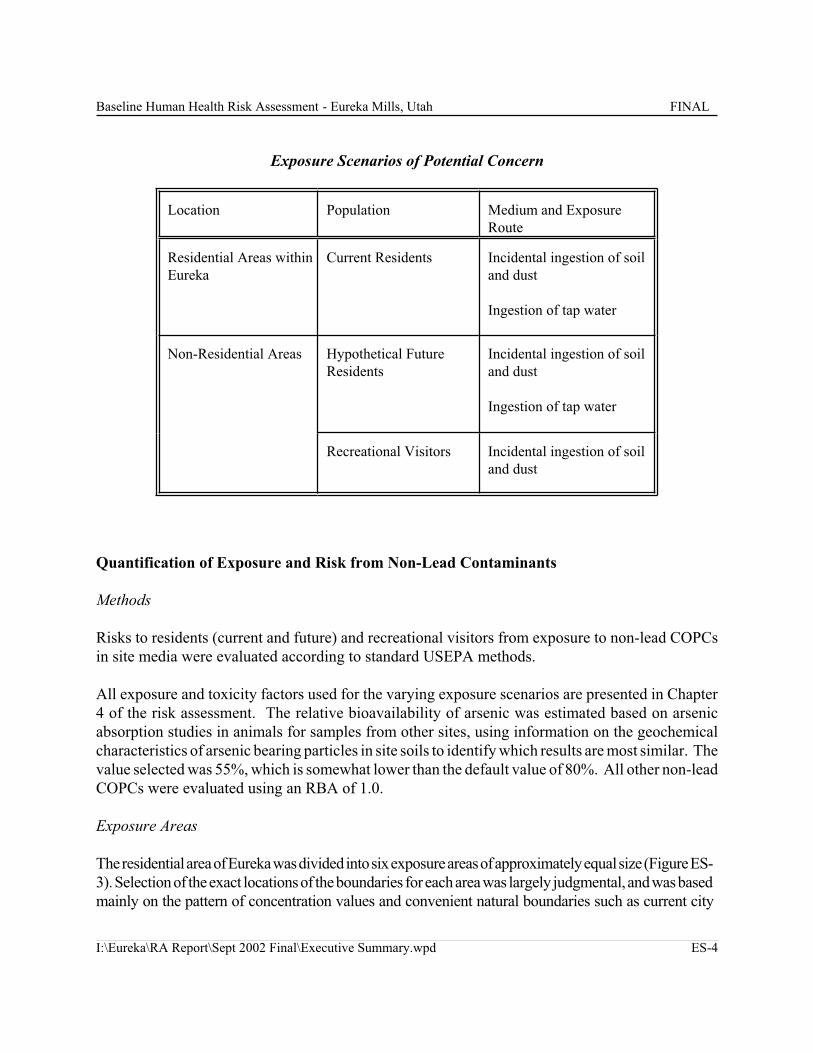
Exposure Scenarios of Potential Concern
Location Population Medium and Exposure
Route
Residential Areas within
Eureka
Current Residents Incidental ingestion of soil
and dust
Ingestion of tap water
Non-Residential Areas Hypothetical Future
Residents
Incidental ingestion of soil
and dust
Ingestion of tap water
Recreational Visitors Incidental ingestion of soil
and dust
Quantification of Exposure and Risk from Non-Lead Contaminants
Methods
Risks to residents (current and future) and recreational visitors from exposure to non-lead COPCs
in site media were evaluated according to standard USEPA methods.
All exposure and toxicity factors used for the varying exposure scenarios are presented in Chapter
4 of the risk assessment. The relative bioavailability of arsenic was estimated based on arsenic
absorption studies in animals for samples from other sites, using information on the geochemical
characteristics of arsenic bearing particles in site soils to identify which results are most similar. The
value selected was 55%, which is somewhat lower than the default value of 80%. All other non-lead
COPCs were evaluated using an RBA of 1.0.
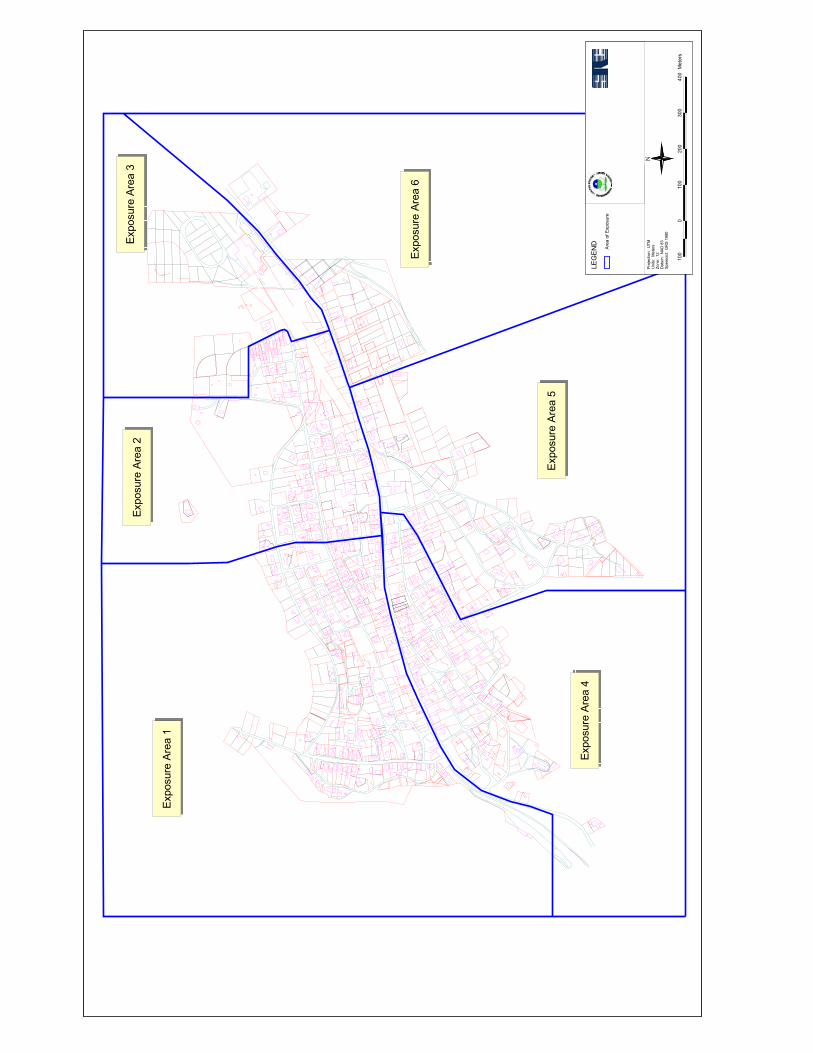
Exposure Areas
The residential area of Eureka was divided into six exposure areas of approximately equal size (Figure ES-
3). Selection of the exact locations of the boundaries for each area was largely judgmental, and was based
mainly on the pattern of concentration values and convenient natural boundaries such as current city
Baseline Human Health Risk Assessment - Eureka Mills, Utah FINAL
I:\Eureka\RA Report\Sept 2002 Final\Executive Summary.wpd ES-5
streets. Risks from exposure to soil and dust were evaluated within these six areas as well as across the
site as a whole. Because the city of Eureka is supplied by a municipal water system, no exposure areas
were designated for this media.
The non-residential areas were divided into 7 exposure areas based primarily on geographic location in
order to represent potential exposure areas for recreational activities.
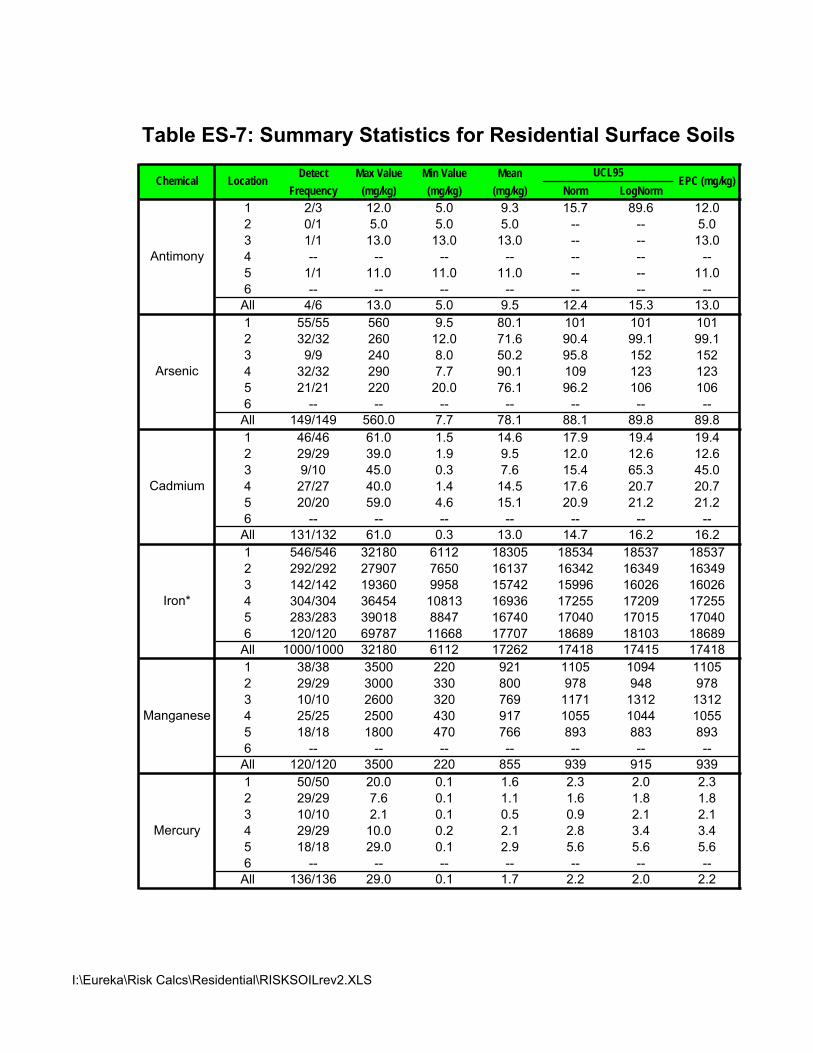
Concentrations of Non-Lead COPCs
Because the true mean concentration of a chemical within an Exposure Point cannot be calculated with
certainty from a limited set of measurements, the USEPA recommends that the upper 95th confidence limit
(UCL) of the arithmetic mean concentration be used as the Exposure Point Concentration (EPC) in
calculating exposure and risk (USEPA 1992a). If the calculated UCL is higher than the highest measured
value, then the maximum value is used as the EPC instead of the UCL (USEPA 1992a). In accord with
this policy, EPCs were calculated for each of the COPCs and exposure areas identified at this site. These
values are summarized in Tables ES-7 to ES-10.
Noncancer and Cancer Risks
Noncancer risks are described in terms of the ratio of the dose at the site divided by a dose that is believed
to be safe. This ratio is referred to as the Hazard Quotient (HQ). If the HQ is equal to or less than a value
of 1, it is believed that there is no appreciable risk that noncancer health effects will occur. If an HQ
exceeds 1, there is some possibility that noncancer effects may occur, although an HQ above 1 does not
indicate an effect will definitely occur. However, the larger the HQ value, the more likely it is that an
adverse health effect may occur.
Arsenic was the only COPC at this site listed by EPA as an oral carcinogen. Risk of cancer from
exposure to arsenic is described in terms of the probability that an exposed individual will develop
cancer because of that exposure by age 70. The level of cancer risk that is of concern is a matter of
individual, community and regulatory judgement. However, the USEPA typically considers risks
below 1 in a million to be so small as to be negligible, and risks above 100 per million to be
sufficiently large that some sort of action or intervention is usually needed.
Results
Risks to Current Residents
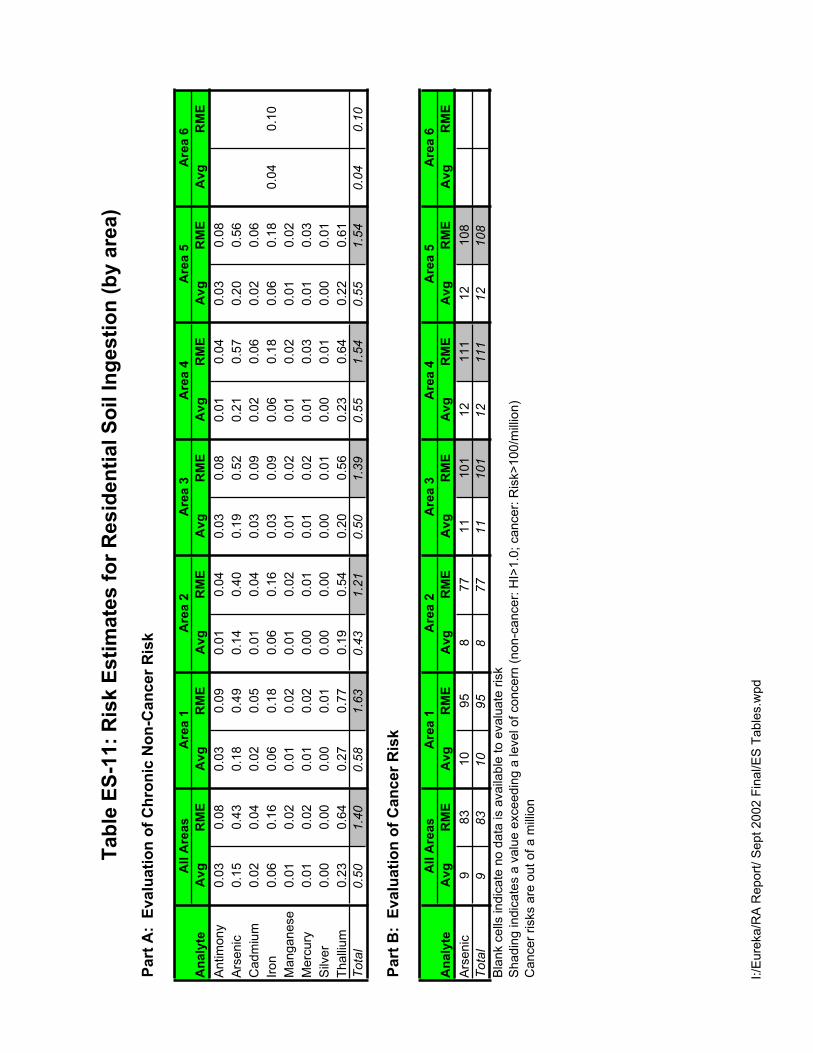
As shown Table ES-11, summed risks for Reasonable Maximum Exposure (RME) scenarios
exceed an HI value of 1.0 in areas 1, 2, 3, 4 and 5, with the majority of the risk attributable to
arsenic and thallium. However, contributions from each individual chemical did not exceed an
HQ of 1.0. Across the site as a whole (all areas) RME values exceed the 1.0 level of concern, but
Baseline Human Health Risk Assessment - Eureka Mills, Utah FINAL
I:\Eureka\RA Report\Sept 2002 Final\Executive Summary.wpd ES-6
average exposures are below this level of concern. With respect to excess cancer risk to
residents, exposure to arsenic resulted in exceedances of a one hundred per million level of
concern in exposure areas 3, 4, and 5 (range 101 to 111 per million) under RME exposure
scenarios.
Table ES-12 shows risk estimates based on residential consumption of tap water. As seen,
summed risks do not exceed a value of 1E+00 under either CTE or RME exposure assumptions.
Excess cancer risk does not exceed a value of 1E-04, even under RME exposure assumptions.
Risks to Recreational Visitors and Hypothetical Future Residents
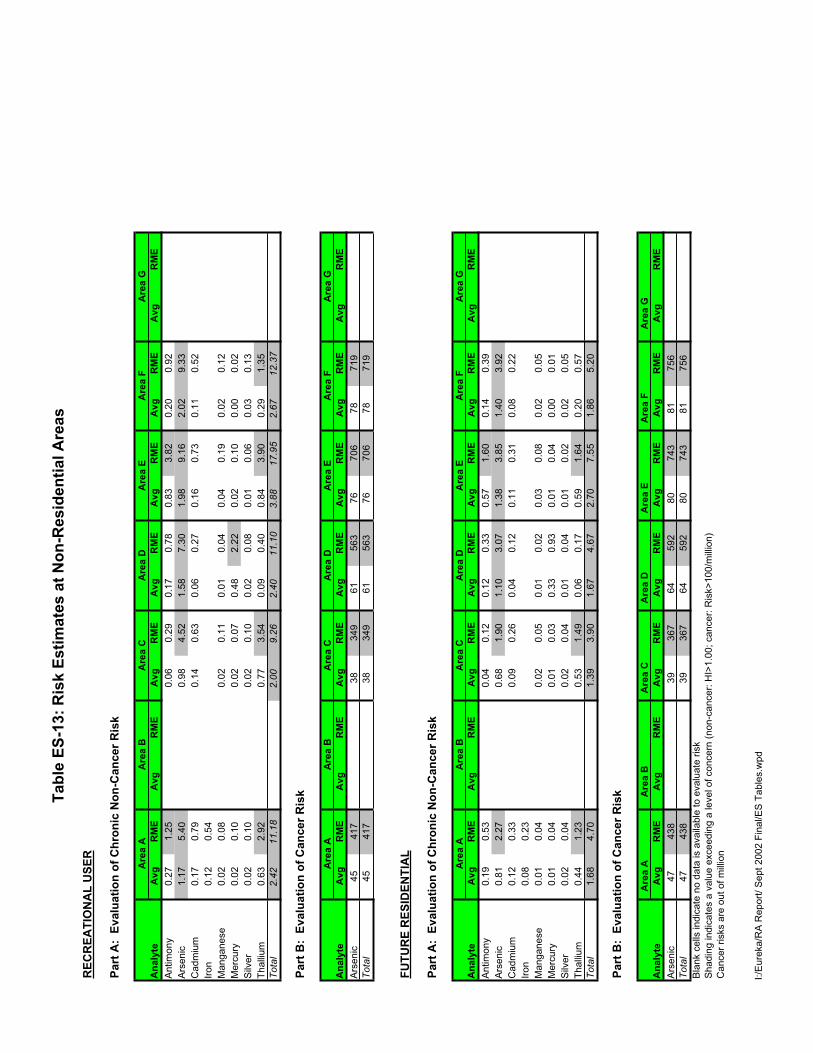
Table ES-13 present risks for exposure (recreational and future residential) at current non-
residential areas. For recreational visitors, summed risks exceed a value of 1.0 at all evaluated
exposure areas under both average and RME exposure assumptions. As shown in Table ES-13,
this elevated risk is primarily attributable to arsenic. However, at some locations, risks from
antimony, mercury, and thallium were also elevated. Excess cancer risks were not found to
exceed 100 cases per million for average recreational users at any of the non-residential exposure
areas. However, under RME exposure assumptions, excess risks were elevated at all locations
(range = 349 to 719 per million).
For potential future residents, chemicals in all of the evaluated exposure areas have summed non-
cancer and cancer risks exceeding a level of concern under both average and RME exposure
scenarios. Risks in the majority of these areas are attributable to arsenic, however in some
instances, risks from antimony and thallium also exceed an HQ of 1.0.
Uncertainties
Several assumptions used in the evaluation of risks from non-lead COPCs at this site may
introduce uncertainty into the presented findings. Although in most cases, assumptions employed
in the risk assessment process to deal with uncertainties are intentionally conservative; that is, they
are more likely to lead to an overestimate rather than an underestimate of risk, it is nevertheless
important for risk managers and the public to take these uncertainties into account when
interpreting the risk conclusions derived for this site.
Uncertainties presented in the risk assessment include: uncertainty in concentration estimates,
uncertainty in human intakes, uncertainty in toxicity values, uncertainty in absorption from soil
and uncertainty from pathways not evaluated.

Baseline Human Health Risk Assessment - Eureka Mills, Utah FINAL
I:\Eureka\RA Report\Sept 2002 Final\Executive Summary.wpd ES-7
Quantification of Exposure and Risk from Lead
Methods
Risks from lead are usually evaluated by estimation of the blood lead levels in exposed individuals and
comparison of those blood lead values to an appropriate health-based guideline. In the case of
residential exposure, the population of chief concern is young children (age 0-84 months). The
USEPA and CDC have set as a goal that there should be no more than a 5% chance that a child
should have a blood lead value over 10 ug/dL. For convenience, the probability of exceeding a blood
lead value of 10 ug/dL is referred to as P10.
Blood lead levels in an exposed population of children may either be measured directly, or may be
calculated using a mathematical model. Each of these approaches has strengths and weaknesses, so
both of these approaches were employed at this site, as described below.
Modeling of Lead Risk
Current and Future Residents
The USEPA has developed an integrated exposure, uptake and biokinetic (IEUBK) model to assess
the risks of lead exposure in residential children. This model requires as input point estimates of the
average concentration of lead in various environmental media in residential properties at the site, and
the average amount of these media contacted by a child living at the site. These data are used to
estimate the average blood lead value in an exposed child. Then, a distribution of blood lead values
is estimated by assuming a lognormal distribution and applying an estimated geometric standard
deviation (GSD).
This model was used to evaluate the distribution of blood lead values that would be expected in a
population of children living at a specific location, in order to judge whether the risks to any random
child living at that location are within health based goals. The model was run for each residence
within Eureka (N=505) and for each non-residential property (N=25) for which environmental data
were collected.
All of the exposure parameters used as inputs to the IEUBK model were either site-specific
concentration values (soil, dust, water) or were the standard EPA-recommended default values,
except as follows:
· The concentration of lead in the diet was adjusted downwards by 30%, based on recent
dietary survey data
Baseline Human Health Risk Assessment - Eureka Mills, Utah FINAL
I:\Eureka\RA Report\Sept 2002 Final\Executive Summary.wpd ES-8
· The relative bioavailability of lead in soil was assumed to be 70%. This value was selected
by comparing the geochemical characteristics of lead in Eureka soils to a series of soil samples from
other sites for which relative bioavailability had been measured in animals.
The resulting predictions of the IEUBK model for current residential children, stratified by exposure
area, are shown in Table ES-14. As seen, geometric mean blood lead values for residential
properties are predicted to range from 5.1 to 47 ug/dL, with relatively little difference observed
across exposure areas. Based on a GSD of 1.6 (default), PbB95 values (95th Percentile Blood Lead)
(middle panel) are predicted to range from 11 to 101 ug/dL, with a community wide average of 33
ug/dL. Based on this, 100% of all properties are above EPA’s health-based goal (P10 < 5%), and
the predicted incidence of children with blood lead levels greater than 10 ug/dL is 69%. Even if a
lower GSD (1.4) is assumed, the risks of elevated blood lead levels still exceed EPA’s target at most
properties, with a predicted incidence of 99%. These results indicate that current risks to children
from lead is likely to be well above EPA’s health-based goal in nearly all locations at this site.
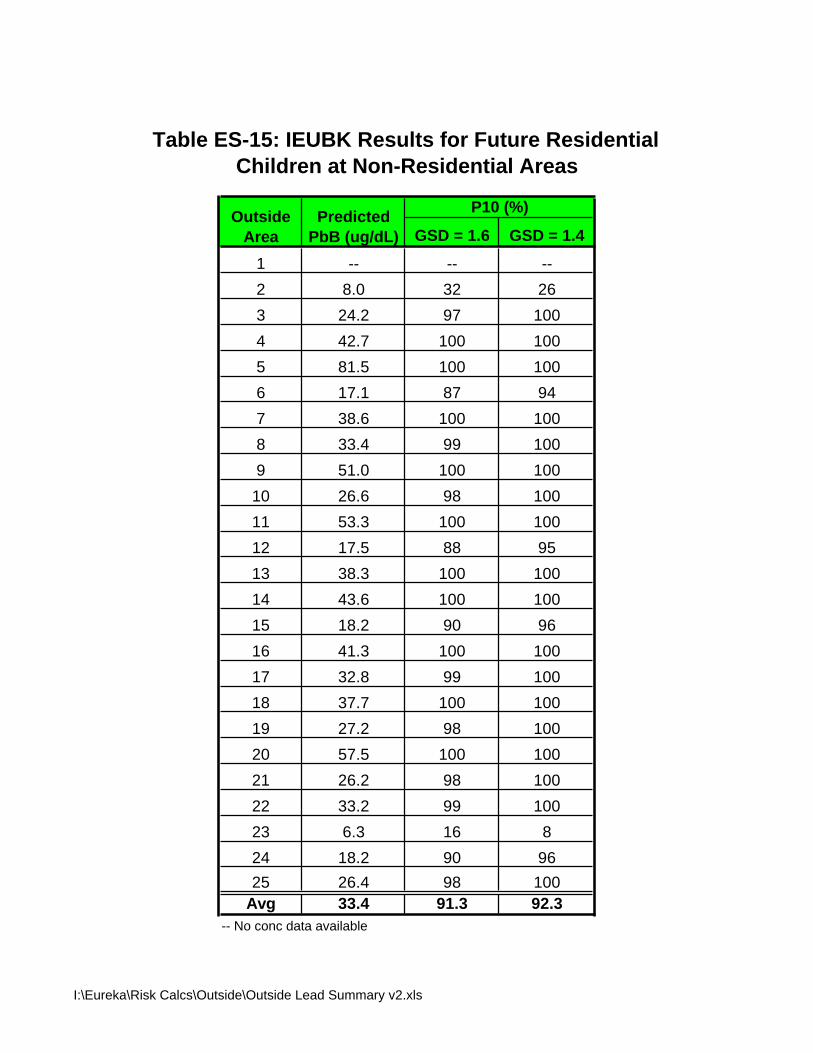
The resulting predictions of the IEUBK model for hypothetical future residential children are
presented in Table ES-15. As shown, the average predicted geometric mean blood lead
concentration across all properties was 33.4 ug/dL (range 6 - 81.5 ug/dL). Regardless of the GSD
used (1.4 or 1.6), all properties (100%) were found to have P10 values exceeding 5%, including those
properties targeted for potential future development (Properties 6 & 25). Using a GSD of 1.6, these
P10 values ranged from 16% to 100% (average 91%), whereas with a GSD of 1.4 a range of 8% to
100% (average 92%) was observed.
Recreational Visitors
The risk to teenage recreational visitors from exposure to lead in site media was evaluated using the
Bower’s model. This model predicts the blood lead level in an adult exposed to lead by summing the
"baseline" blood lead level (PbB0) (that which would occur in the absence of any above-average site-
related exposures) with the increment in blood lead that is expected as a result of increased exposure
due to contact with a lead-contaminated site medium. This model was run in accord with guidance
developed by EPA’s Technical Workgroup for Lead (USEPA, 1996).
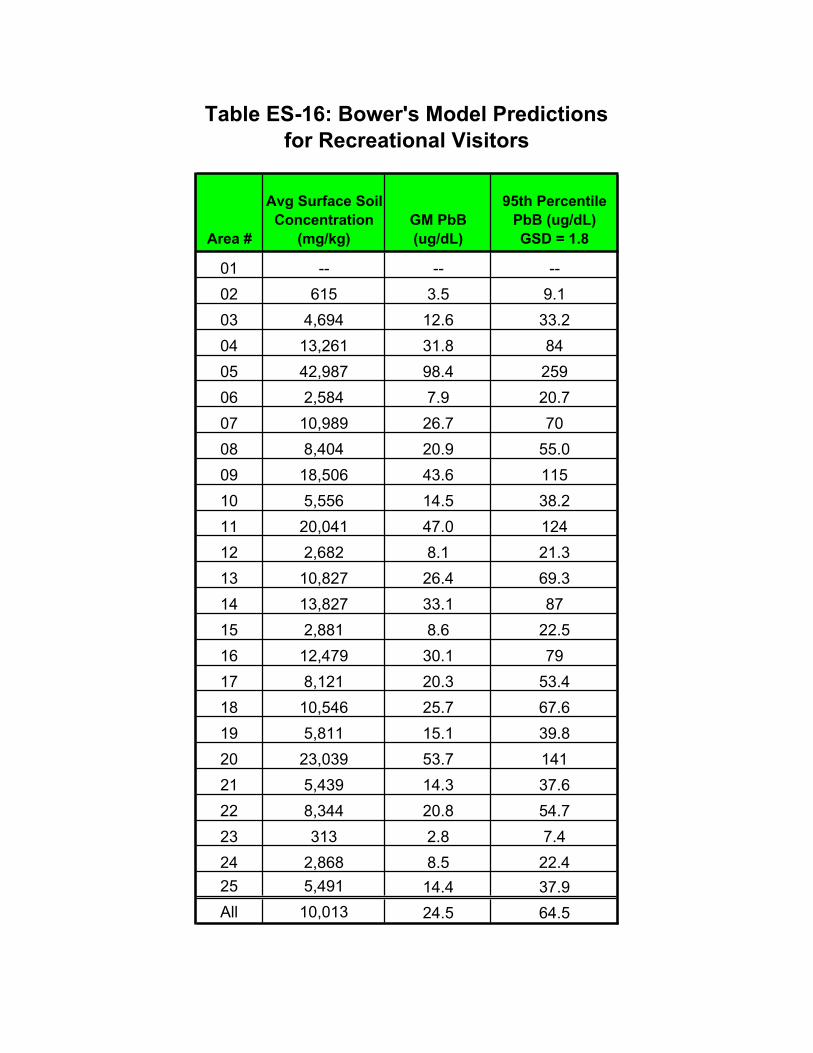
The predicted geometric mean blood leads and PbB95's for recreational visitors exposed at different
locations are summarized in Table ES-16. As seen, predicted geometric mean blood lead
concentrations range from 2.8 to 98 ug/dL (average 24 ug/dL) and PbB95 values range from 7 to 259
ug/dL (average 64 ug/dL). The USEPA has not yet issued formal guidance on the blood lead level
that is considered appropriate for protecting the health of pregnant women or other adults. Therefore,
these results can be interpreted using a health criterion that there should be no more than a 5% chance
that the blood level of a fetus will be above 10 ug/dL. This is equivalent to a blood lead
concentration of 11.1 ug/dL in the pregnant adult. A comparison of the 95th percentile blood lead
levels predicted for site visitors shows that recreational use at 22 of the 24 properties which were
Baseline Human Health Risk Assessment - Eureka Mills, Utah FINAL
I:\Eureka\RA Report\Sept 2002 Final\Executive Summary.wpd ES-9
evaluated may result in blood lead levels which exceed a target concentration of 11.1 ug/dL. This
shows that the majority of these areas could pose a risk of elevated blood lead levels to teenage
recreational visitors.
Measured Blood Lead Values
During the year 2000, a total of 227 Eureka residents participated in a blood lead monitoring study.
Table ES-17 presents blood lead summary statistics for the study participants, stratified by age. As
seen observed blood lead concentrations ranged from 0.9 to 42.4 ug/dL with a geometric mean of
4.4 ug/dL. Of these participants, thirty-five (~15%) were found to have elevated blood lead levels
(> 10 ug/dL). A comparison of site blood concentrations to nationwide statistics shows that
geometric mean blood lead levels in children (0 - 19 years) in Eureka (3.1 to 9.1 ug/dL) are higher
than the corresponding national geometric mean blood lead values (1.6 to 4.1 ug/dL) for this age
bracket.
A total of 174 individuals who participated in this biomonitoring study consented to the release of
their blood lead data to investigate the relationship between measured blood lead levels and
environmental factors. As a result, data sets were available for 59 children ranging in age from 0-84
months Of these children, 20 (34%) were observed to have blood lead levels exceeding a
concentration of 10 ug/dL. No clear trend was observed at this site between blood lead and
environmental lead concentrations in residential soils, dust or paint. This suggests that at this site,
soil lead concentrations alone are not the principle determinant of blood lead concentrations.
A review of demographic surveys for each participating child (47 respondents) found a significant
difference (P<0.05) in blood lead levels of respondents for 7 survey question parameters: family
member participating in lead battery work or ceramic painting activities, household tobacco use, and
symptoms of weight loss, constipation and trouble sleeping in children. However, for all parameters
except household tobacco use, this finding is based on a relatively small sample size (N= 2 to 4) for
positive respondents. In contrast, the difference observed based on household tobacco use had a
larger comparison population (N = 12), suggesting that exposure to tobacco smoke in the home may
be an important influence on child blood lead levels.
Weight of Evidence
Evaluation of lead risks can be performed using either a modeling approach or direct observations.
Because both of these approaches have advantages and limitations, it is important to compare and
contrast the results of each approach.
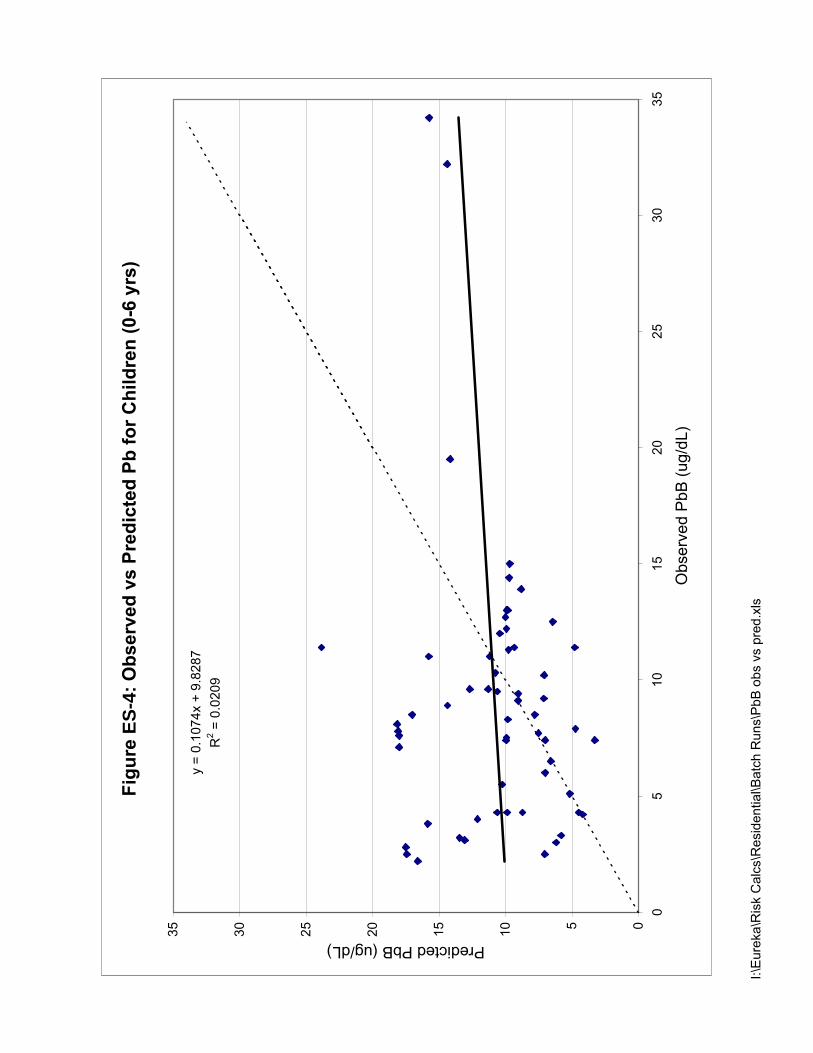
In order to evaluate the agreement between the IEUBK results and the observed blood lead values,
the IEUBK model was used to calculate a predicted blood lead value for each participating child
(with known environmental concentrations) less than 72 months of age (N=59). Results are shown
Baseline Human Health Risk Assessment - Eureka Mills, Utah FINAL
I:\Eureka\RA Report\Sept 2002 Final\Executive Summary.wpd ES-10
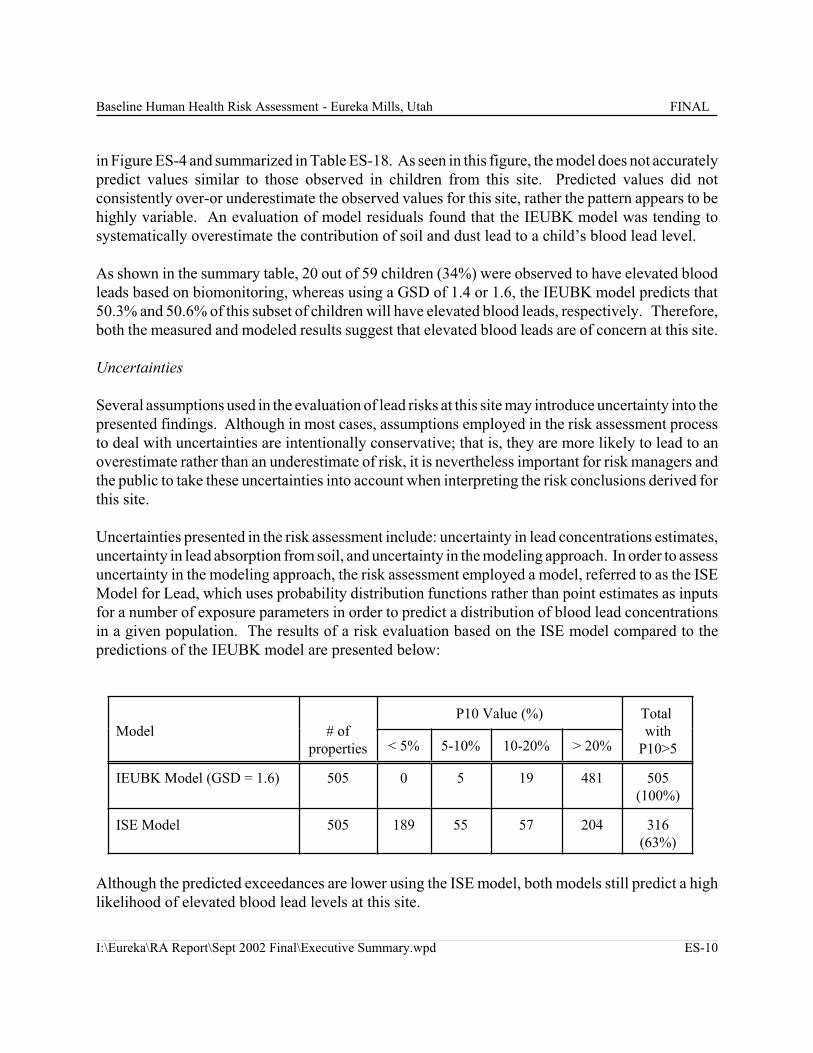
in Figure ES-4 and summarized in Table ES-18. As seen in this figure, the model does not accurately
predict values similar to those observed in children from this site. Predicted values did not
consistently over-or underestimate the observed values for this site, rather the pattern appears to be
highly variable. An evaluation of model residuals found that the IEUBK model was tending to
systematically overestimate the contribution of soil and dust lead to a child’s blood lead level.
As shown in the summary table, 20 out of 59 children (34%) were observed to have elevated blood
leads based on biomonitoring, whereas using a GSD of 1.4 or 1.6, the IEUBK model predicts that
50.3% and 50.6% of this subset of children will have elevated blood leads, respectively. Therefore,
both the measured and modeled results suggest that elevated blood leads are of concern at this site.
Uncertainties
Several assumptions used in the evaluation of lead risks at this site may introduce uncertainty into the
presented findings. Although in most cases, assumptions employed in the risk assessment process
to deal with uncertainties are intentionally conservative; that is, they are more likely to lead to an
overestimate rather than an underestimate of risk, it is nevertheless important for risk managers and
the public to take these uncertainties into account when interpreting the risk conclusions derived for
this site.
Uncertainties presented in the risk assessment include: uncertainty in lead concentrations estimates,
uncertainty in lead absorption from soil, and uncertainty in the modeling approach. In order to assess
uncertainty in the modeling approach, the risk assessment employed a model, referred to as the ISE
Model for Lead, which uses probability distribution functions rather than point estimates as inputs
for a number of exposure parameters in order to predict a distribution of blood lead concentrations
in a given population. The results of a risk evaluation based on the ISE model compared to the
predictions of the IEUBK model are presented below:
Model # of
properties
P10 Value (%) Total
with
P10>5< 5% 5-10% 10-20% > 20%
IEUBK Model (GSD = 1.6) 505 0 5 19 481 505
(100%)
ISE Model 505 189 55 57 204 316
(63%)
Although the predicted exceedances are lower using the ISE model, both models still predict a high
likelihood of elevated blood lead levels at this site.
Baseline Human Health Risk Assessment - Eureka Mills, Utah FINAL
I:\Eureka\RA Report\Sept 2002 Final\Executive Summary.wpd ES-11
Conclusions
Non-lead COPCs
Interpretation of risk characterization results is a matter of judgement by the risk manager. In
general, USEPA considers that acceptable level of excess risk under RME assumptions is an HI equal
to or less than one (1.0) for non-cancer risks. In this case, it is believed that there is no appreciable
risk that noncancer health effects will occur. For cancer risks, it is the policy of the USEPA that
remedial action is not warranted where excess cancer risks to the RME individual do not exceed a
level of 100 excess cancer cases per one million people (USEPA 1991b).
The results of risk calculations presented in this report suggest that excess cancer or non-cancer risks
to current residents may occur under RME exposure scenarios to soil, but are below a level of
concern based on exposure to non-lead COPCs in drinking water. Risks to recreational users from
exposure to non-lead COPCs in soils at non-residential areas are above a level of concern at all areas
that were evaluated. For non-cancer, HI values for recreational visitors ranged from 2.0 to3.9 under
average exposure assumptions and from 9.3 to 17.9 under RME assumptions. For cancer risks under
average exposure assumptions, no values were found to exceed a risk level of 100 per million.
However, using RME assumptions these cancer risks ranged from 349 to 719 per million. Overall,
these risks are primarily attributable to elevated concentrations of arsenic.
Elevated risks were predicted for hypothetical future residents at all evaluated exposure areas,
indicating that adverse effects could occur to future residents of these current non-residential
properties. For non-cancer, HI values for future residents ranged from 1.4 to 2.7 under average
exposure assumptions and from 3.9 to 7.5 under RME assumptions. For cancer risks under average
exposure assumptions, no values were found to exceed a risk level of 100 per million. However,
using RME assumptions these cancer risks ranged from 367 to 756 per million. Overall, these risks
are primarily attributable to elevated concentrations of arsenic.
Lead
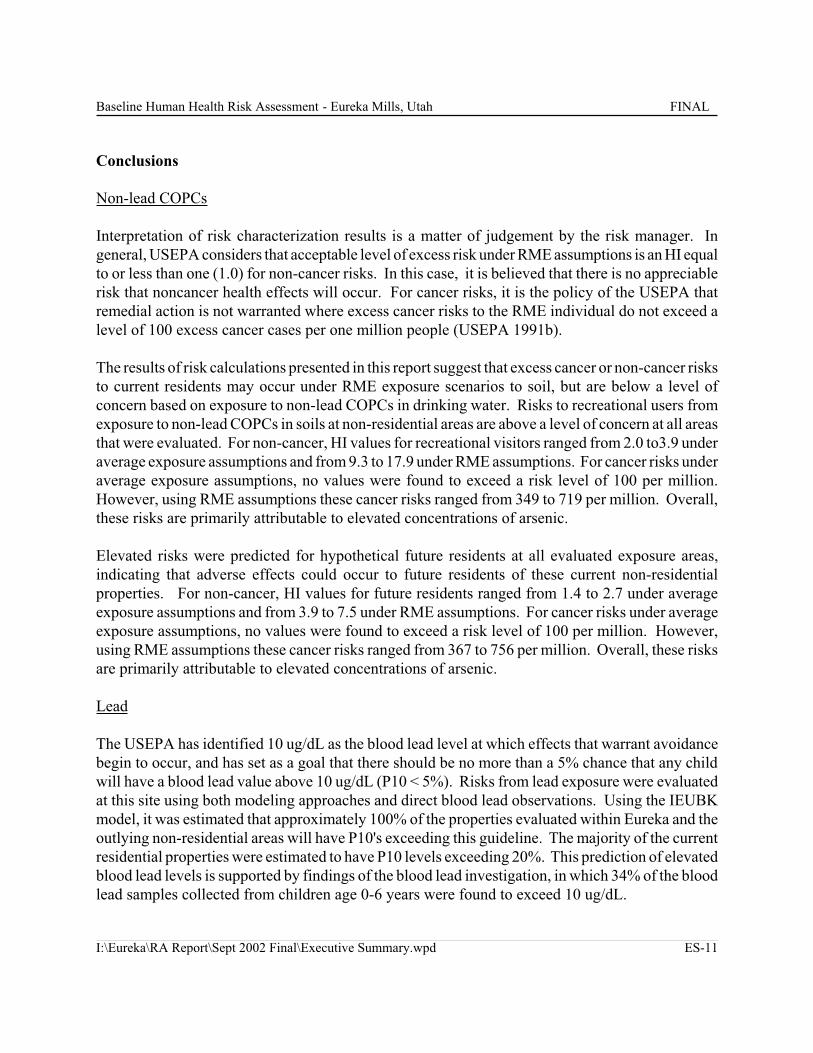
The USEPA has identified 10 ug/dL as the blood lead level at which effects that warrant avoidance
begin to occur, and has set as a goal that there should be no more than a 5% chance that any child
will have a blood lead value above 10 ug/dL (P10 < 5%). Risks from lead exposure were evaluated
at this site using both modeling approaches and direct blood lead observations. Using the IEUBK
model, it was estimated that approximately 100% of the properties evaluated within Eureka and the
outlying non-residential areas will have P10's exceeding this guideline. The majority of the current
residential properties were estimated to have P10 levels exceeding 20%. This prediction of elevated
blood lead levels is supported by findings of the blood lead investigation, in which 34% of the blood
lead samples collected from children age 0-6 years were found to exceed 10 ug/dL.
Baseline Human Health Risk Assessment - Eureka Mills, Utah FINAL
I:\Eureka\RA Report\Sept 2002 Final\Executive Summary.wpd ES-12
An alternate model used to evaluate lead risks at this site, supports the prediction of the IEUBK
model for elevated blood lead, but to a lesser extent. This model, known as the ISE model for lead,
predicts that 63% of the current residential properties evaluated within Eureka will exceed EPA’s
guidelines.
I:\Eureka\RA Report\Sept 2002 Final\ES Tables.wpd
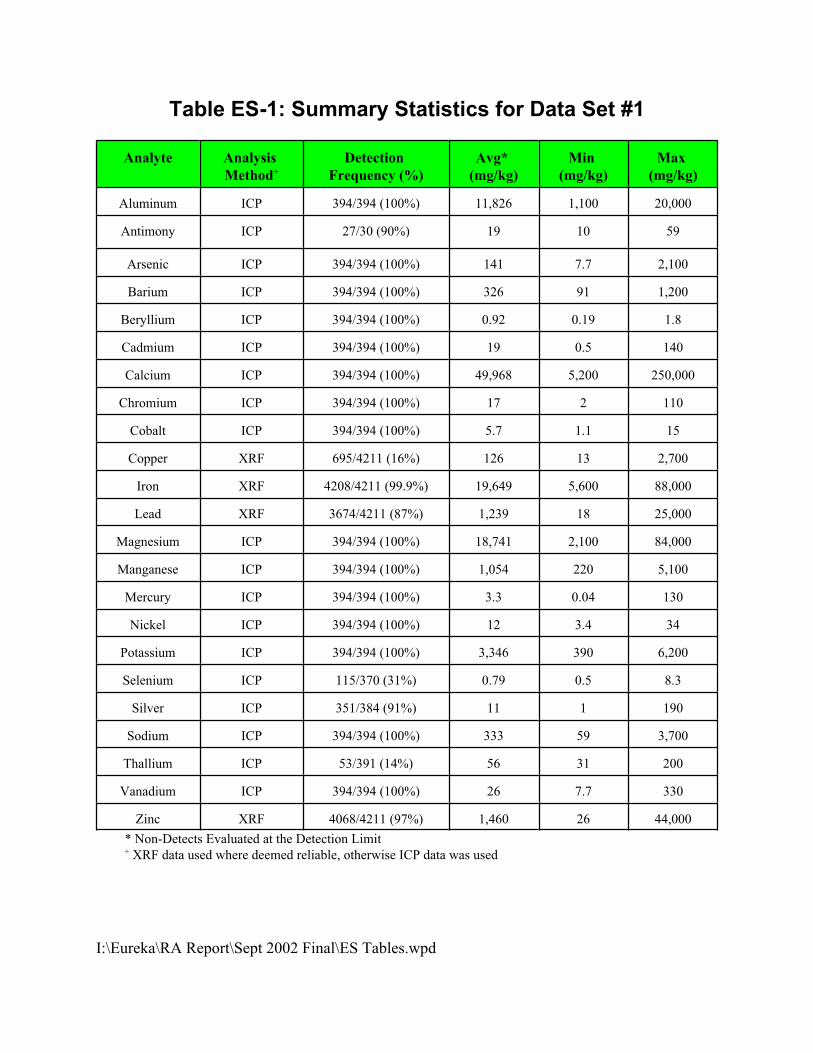
Table ES-1: Summary Statistics for Data Set #1
Analyte Analysis
Method+
Detection
Frequency (%)
Avg*
(mg/kg)
Min
(mg/kg)
Max
(mg/kg)
Aluminum ICP 394/394 (100%) 11,826 1,100 20,000
Antimony ICP 27/30 (90%) 19 10 59
Arsenic ICP 394/394 (100%) 141 7.7 2,100
Barium ICP 394/394 (100%) 326 91 1,200
Beryllium ICP 394/394 (100%) 0.92 0.19 1.8
Cadmium ICP 394/394 (100%) 19 0.5 140
Calcium ICP 394/394 (100%) 49,968 5,200 250,000
Chromium ICP 394/394 (100%) 17 2 110
Cobalt ICP 394/394 (100%) 5.7 1.1 15
Copper XRF 695/4211 (16%) 126 13 2,700
Iron XRF 4208/4211 (99.9%) 19,649 5,600 88,000
Lead XRF 3674/4211 (87%) 1,239 18 25,000
Magnesium ICP 394/394 (100%) 18,741 2,100 84,000
Manganese ICP 394/394 (100%) 1,054 220 5,100
Mercury ICP 394/394 (100%) 3.3 0.04 130
Nickel ICP 394/394 (100%) 12 3.4 34
Potassium ICP 394/394 (100%) 3,346 390 6,200
Selenium ICP 115/370 (31%) 0.79 0.5 8.3
Silver ICP 351/384 (91%) 11 1 190
Sodium ICP 394/394 (100%) 333 59 3,700
Thallium ICP 53/391 (14%) 56 31 200
Vanadium ICP 394/394 (100%) 26 7.7 330
Zinc XRF 4068/4211 (97%) 1,460 26 44,000
* Non-Detects Evaluated at the Detection Limit+ XRF data used where deemed reliable, otherwise ICP data was used

I:\Eureka\RA Report\Sept 2002 Final\ES Tables.wpd
Table ES-2: Summary Statistics for Data Set #2
Non-Residential Background
Analyte Analysis
Method+
Detection
Frequency (%)
Avg*
(mg/kg)
Min
(mg/kg)
Max
(mg/kg)
Detection
Frequency (%)
Avg*
(mg/kg)
Min
(mg/kg)
Max
(mg/kg)
Aluminum ICP 36/36 (100%) 4,807 88 12,800 3/3 (100%) 9,583 7,240 11,700
Antimony ICP 30/36 (83%) 43 0.5 330 0/3 (0%) 0.7 0.5 1.1
Arsenic ICP 35/36 (97%) 414 0.4 1,100 3/3 (100%) 9.5 4.2 13.4
Barium XRF 265/265 (100%) 622 57 3,600 18/18 (100%) 555 58 1,800
Beryllium ICP 36/36 (100%) 0.56 0.1 1.4 3/3 (100%) 0.66 0.61 0.7
Cadmium ICP 35/36 (97%) 60 0.2 171 3/3 (100%) 0.38 0.21 0.56
Calcium XRF 265/265 (100%) 56,147 1,200 250,000 18/18 (100%) 41,295 1,200 132,000
Chromium ICP 35/36 (97%) 14 0.3 220 3/3 (100%) 7.9 2.5 12.3
Cobalt ICP 35/36 (97%) 5.65 0.2 17 3/3 (100%) 5.7 4.5 7.3
Copper XRF 144/266 (54%) 279 74 2,200 0/18 (0%) 76 74 77
Iron ICP 36/36 (100%) 21,774 61 48,500 3/3 (100%) 12,800 11,100 14,000
Lead XRF 258/265 (97%) 4,065 32 51,000 17/18 (94%) 148 32 930
Magnesium ICP 35/36 (97%) 22,950 23 79,000 3/3 (100%) 14,390 3,230 34,700
Manganese ICP 36/36 (100%) 1,759 1 5,750 3/3 (100%) 441 117 710
Mercury ICP 34/36 (94%) 10.2 0.05 144 2/3 (67%) 0.06 0.05 0.066
Nickel ICP 34/36 (94%) 18 0.3 111 3/3 (100%) 9.5 1.9 16.9
Potassium XRF 264/265 (99.6%) 16,277 2,200 35,000 18/18 (100%) 18,724 2,200 24,000
Selenium ICP 35/36 (97%) 3.86 0.4 18 3/3 (100%) 0.97 0.8 1.2
Silver ICP 32/36 (89%) 49 0.2 165 1/3 (33%) 0.2 0.2 0.2
Sodium ICP 33/36 (92%) 758 42 1,830 0/3 (0%) 41.6 41.6 41.6
Thallium ICP 27/36 (75%) 16 0.6 68 1/3 (33%) 0.77 0.6 1.1
Vanadium ICP 35/36 (97%) 26 0.3 238 3/3 (100%) 23.2 15.6 31.8
Zinc XRF 265/265 (100%) 4,198 54 26,000 16/18 (89%) 191 91 790
* Non-Detects Evaluated at the Detection Limit+ XRF data used where deemed reliable, otherwise ICP data was used
I:\Eureka\RA Report\Sept 2002 Final\ES Tables.wpd
Table ES-3: Summary Statistics for Indoor Dust Analyzed via ICP
AnalyteDetection
Frequency (%)
Avg
(mg/kg)
Min
(mg/kg)
Max
(mg/kg)
Aluminum 100% 7,562 2,770 14,900
Antimony 98% 5 0.2 20.5
Arsenic 100% 40 10.3 123
Barium 100% 282 70.8 2,060
Berylium 89% 0.4 0.14 1.9
Cadmium 100% 7.3 2 18.6
Calcium 100% 40,777 13,700 85,500
Chromium 100% 25 7.4 120
Cobalt 100% 3.8 1.1 11.8
Copper 100% 160 34.5 649
Iron 100% 9,429 3,300 27,300
Lead 100% 707 193 2,010
Magnesium 100% 10,930 3,460 20,800
Manganese 100% 436 123 1,530
Mercury 100% 0.7 0.1 2.7
Nickel 100% 19 7.6 50.4
Potassium 100% 6,472 2,480 14,800
Selenium 53% 1.6 0.67 17.8
Silver 100% 4.3 1.1 10.8
Sodium 98% 26,212 18.9 171,000
Thallium 79% 1.3 0.32 3.7
Vanadium 100% 16 5.6 24.2
Zinc 100% 1,201 372 5,490
N = 57
Non Detects evaluated at the Detection Limit

I:\Eureka\RA Report\Sept 2002 Final\ES Tables.wpd
Table ES-4: Summary Statistics for Basement Soils Analyzed via ICP
Analyte Detection
Frequency
(%)
Avg
(mg/kg)
Min
(mg/kg)
Max
(mg/kg)
Aluminum7/7
(100%)10,919 7,900 17,800
Antimony1/7
(14%)1.6 0.2 7.4
Arsenic7/7
(100%)29 6.8 131
Barium7/7
(100%)231 169 328
Beryllium 7/7
(100%)0.7 0.61 0.87
Cadmium7/7
(100%)7.4 1.2 39.2
Calcium 7/7
(100%)21,891 7,440 47,000
Chromium7/7
(100%)10 4.1 14.7
Cobalt7/7
(100%)5 3.4 6.4
Copper7/7
(100%)96 6.3 536
Iron7/7
(100%)15,843 10,100 29,200
Lead7/7
(100%)1,000 122 5,330
Magnesium7/7
(100%)5,234 3,090 8,990
Manganese7/7
(100%)481 282 732
Mercury7/7
(100%)2 0.14 10.3
Nickel7/7
(100%)11.5 5.1 17.9
Potassium7/7
(100%)2,763 1,970 3,680
Selenium7/7
(100%)1.3 0.28 4.9
Silver7/7
(100%)5.6 0.57 28
Sodium6/7
(86%)371 17.7 869
Thallium 5/7
(71%)1.7 0.34 6.6
Vanadium7/7
(100%)20 14.9 26.9
Zinc7/7
(100%)1,293 147 5,730
Non Detects Evaluated at the Detection Limit

Exterior
Condition Min Max Avg
cracking 1/1(100%) 0.15 0.15 0.15
loose 1/1(100%) 0.01 0.01 0.01
NA 1/1(100%) 0.12 0.12 0.12
non-painted -- -- -- --
peeling 4/17(24%) 0.01 1.4 0.515
tight 4/8(50%) 0.01 1.4 0.463
All 11/28(39%) 0.01 1.4 0.252
Interior
Condition Min Max Avg
cracking 1/1(100%) 0.03 0.03 0.03
loose 4/6(67%) 0.01 0.04 0.023
NA 0/1(0%) -- -- --
non-painted 0/3(0%) -- -- --
peeling 7/16(44%) 0.01 1.7 0.371
tight 30/91(33%) 0.01 1.7 0.184
All 42/118(36%) 0.01 1.7 0.152
Analysis method is Pb L Line (measured at the paint surface)Analyzed via XRFNA refers to sites where the paint condition was not recorded in the field log book
Table ES-5: Summary Statistics for Eureka Paint Stratified by Condition
DetectionFreq.
Detects (mg/cm2)
Detects (mg/cm2)DetectionFreq.
I: Eureka\Final Data\Summary Stats\Table 2-5.xls
I:\Eureka\RA Report\Sept 2002 Final\ES Tables.wpd
Table ES-6: Summary Statistics for Tap Water Analyzed via ICP
Analyte
Detection
Frequency (%)
Non-Detects Only (ug/L) Detects Only (ug/L)
Avg Min Max Avg Min Max
Aluminum3/54
(6%)29.4 19.3 34.9 36.7 31.6 43.5
Antimony2/54
(4%)1.94 1.9 2.3 2.15 2.1 2.2
Arsenic25/54
(46%)3.36 2.6 3.6 4.33 2.8 7.6
Barium51/54
(94%)2.09 0.38 3.5 103 82.1 129
Beryllium 0/54
(0%)0.11 0.1 0.2 -- -- --
Cadmium12/54
(22%)0.29 0.2 0.51 0.70 0.34 2.2
Calcium 54/54
(100%)-- -- -- 69, 802 89 80, 800
Chromium6/54
(11%)0.65 0.5 1.4 0.80 0.51 0.94
Cobalt0/54
(0%)0.61 0.5 0.8 -- -- --
Copper54/54
(100%)-- -- -- 281 6.3 1, 970
Iron21/54
(39%)23.2 10.8 100 123 12.4 471
Lead19/54
(35%)1.94 1.6 3.3
4.4
(excl. outlier)2.1
38 (outlier)
13.8
Magnesium53/54
(98%)32.5 32.5 32.5 12703 223 14700
Manganese33/54
(61%)5.39 0.27 16.5 7.0 2.2 18.5
Mercury2/54
(4%)0.1 0.1 0.1 0.11 0.11 0.12
Nickel45/54
(83%)1.42 0.8 4.7 3.89 0.93 49.6
Potassium53/54
(98%)575 575 575 4787 383 5590
Selenium5/54
(9%)4.05 2.2 5 5.12 2.8 7.7
Silver0/54
(0%)0.89 0.6 3 -- -- --
Sodium54/54
(100%)-- -- -- 33, 819 21800 130, 000
Thallium 3/54
(6%)4.88 3.3 8.4 5.83 4.2 6.9
Vanadium50/54
(93%)3.83 3.5 4.2 3.99 1.3 4.8
Zinc54/54
(100%)-- -- -- 501 45 4, 330
Detect Max Value Min Value MeanFrequency (mg/kg) (mg/kg) (mg/kg) Norm LogNorm
1 2/3 12.0 5.0 9.3 15.7 89.6 12.0
2 0/1 5.0 5.0 5.0 -- -- 5.0
3 1/1 13.0 13.0 13.0 -- -- 13.0
4 -- -- -- -- -- -- --
5 1/1 11.0 11.0 11.0 -- -- 11.0
6 -- -- -- -- -- -- --
All 4/6 13.0 5.0 9.5 12.4 15.3 13.0
1 55/55 560 9.5 80.1 101 101 101
2 32/32 260 12.0 71.6 90.4 99.1 99.1
3 9/9 240 8.0 50.2 95.8 152 152
4 32/32 290 7.7 90.1 109 123 123
5 21/21 220 20.0 76.1 96.2 106 106
6 -- -- -- -- -- -- --
All 149/149 560.0 7.7 78.1 88.1 89.8 89.8
1 46/46 61.0 1.5 14.6 17.9 19.4 19.4
2 29/29 39.0 1.9 9.5 12.0 12.6 12.6
3 9/10 45.0 0.3 7.6 15.4 65.3 45.0
4 27/27 40.0 1.4 14.5 17.6 20.7 20.7
5 20/20 59.0 4.6 15.1 20.9 21.2 21.2
6 -- -- -- -- -- -- --
All 131/132 61.0 0.3 13.0 14.7 16.2 16.2
1 546/546 32180 6112 18305 18534 18537 18537
2 292/292 27907 7650 16137 16342 16349 16349
3 142/142 19360 9958 15742 15996 16026 16026
4 304/304 36454 10813 16936 17255 17209 17255
5 283/283 39018 8847 16740 17040 17015 17040
6 120/120 69787 11668 17707 18689 18103 18689
All 1000/1000 32180 6112 17262 17418 17415 17418
1 38/38 3500 220 921 1105 1094 1105
2 29/29 3000 330 800 978 948 978
3 10/10 2600 320 769 1171 1312 1312
4 25/25 2500 430 917 1055 1044 1055
5 18/18 1800 470 766 893 883 893
6 -- -- -- -- -- -- --
All 120/120 3500 220 855 939 915 939
1 50/50 20.0 0.1 1.6 2.3 2.0 2.3
2 29/29 7.6 0.1 1.1 1.6 1.8 1.8
3 10/10 2.1 0.1 0.5 0.9 2.1 2.1
4 29/29 10.0 0.2 2.1 2.8 3.4 3.4
5 18/18 29.0 0.1 2.9 5.6 5.6 5.6
6 -- -- -- -- -- -- --
All 136/136 29.0 0.1 1.7 2.2 2.0 2.2
Table ES-7: Summary Statistics for Residential Surface Soils
Chemical LocationUCL95
EPC (mg/kg)
Antimony
Arsenic
Cadmium
Iron*
Manganese
Mercury
I:\Eureka\Risk Calcs\Residential\RISKSOILrev2.XLS

Detect Max Value Min Value MeanFrequency (mg/kg) (mg/kg) (mg/kg) Norm LogNorm
Chemical LocationUCL95
EPC (mg/kg)
1 46/48 29.0 0.5 6.6 8.2 9.1 9.1
2 27/29 8.8 0.5 3.8 4.6 5.6 5.6
3 4/5 13.0 0.5 4.2 9.1 221 13.0
4 28/29 19.0 0.5 6.2 7.6 9.3 9.3
5 22/22 56.0 1.5 10.3 15.3 17.2 17.2
6 -- -- -- -- -- -- --
All 127/133 56.0 0.5 6.4 7.5 7.6 7.6
1 5/6 150 25.0 83.5 118 183 150
2 0/2 25.0 25.0 25.0 25.0 25.0 25.0
3 0/2 25.0 25.0 25.0 25.0 25.0 25.0
4 1/3 54.0 25.0 34.7 62.9 184 54.0
5 0/2 25.0 25.0 25.0 25.0 25.0 25.0
6 -- -- -- -- -- -- --
All 6/15 150 25.0 50.3 67.7 72.9 72.9
-- No data available
UCL = 95% upper confidence limit of the mean
EPC = Exposure Point Concentration, defined as the UCL or the maximum, whichever is lower
* Iron data is based on adjusted XRF dataset
Thallium
Silver
I:\Eureka\Risk Calcs\Residential\RISKSOILrev2.XLS
Detect Max Value Min Value MeanFrequency (mg/kg) (mg/kg) (mg/kg) Norm LogNorm
1 18/19 20.5 0.7 6.5 8.5 10.2 10.2
2 10/10 5.9 2.0 3.6 4.2 4.4 4.4
3 -- -- -- -- -- -- --
4 13/13 12.2 3.1 6.1 7.5 7.9 7.9
5 8/8 7.6 2.2 5.0 6.4 7.5 7.5
6 -- -- -- -- -- -- --
All 50/51 20.5 0.7 5.5 6.4 6.5 6.5
1 23/23 123 10.3 42.7 50.9 55.7 55.7
2 11/11 41.4 10.6 25.4 31.1 34.2 34.2
3 -- -- -- -- -- -- --
4 14/14 63.4 13.9 40.8 48.5 54.5 54.5
5 8/8 73.5 19.4 42.8 54.6 62.9 62.9
6 -- -- -- -- -- -- --
All 57/57 123 10.3 39.7 44.2 45.8 45.8
1 21/21 12.4 2.0 7.7 8.8 9.4 9.4
2 11/11 10.1 2.2 5.7 7.0 7.6 7.6
3 -- -- -- -- -- -- --
4 14/14 18.6 2.1 7.7 9.7 11.0 11.0
5 8/8 13.6 3.4 8.0 10.2 11.9 11.9
6 -- -- -- -- -- -- --
All 55/55 18.6 2.0 7.4 8.1 8.4 8.4
1 21/21 14300 3300 9570 10718 11558 11558
2 11/11 10900 4040 7798 9153 9861 9861
3 -- -- -- -- -- -- --
4 14/14 27300 4230 9993 12615 12956 12956
5 7/7 12500 4730 9704 11745 13257 12500
6 -- -- -- -- -- -- --
All 54/54 27300 3300 9348 10196 10367 10367
1 23/23 1530 123 469 566 590 590
2 10/10 469 184 341 403 431 431
3 -- -- -- -- -- -- --
4 14/14 612 182 425 487 529 529
5 8/8 710 184 490 608 730 710
6 -- -- -- -- -- -- --
All 56/56 1530 123 438 484 491 491
1 21/21 2.7 0.2 0.7 1.0 1.0 1.0
2 10/10 0.9 0.1 0.4 0.6 0.8 0.8
3 -- -- -- -- -- -- --
4 11/11 2.2 0.4 0.9 1.2 1.4 1.4
5 7/7 0.9 0.1 0.5 0.7 1.0 0.9
6 -- -- -- -- -- -- --
All 50/50 2.7 0.1 0.7 0.8 0.8 0.8
Table ES-8: Summary Statistics for Indoor Dust
Chemical LocationUCL95
EPC (mg/kg)
Antimony
Arsenic
Cadmium
Iron
Manganese
Mercury
I:\Eureka\Risk Calcs\Residential\RISKSOILrev2.XLS
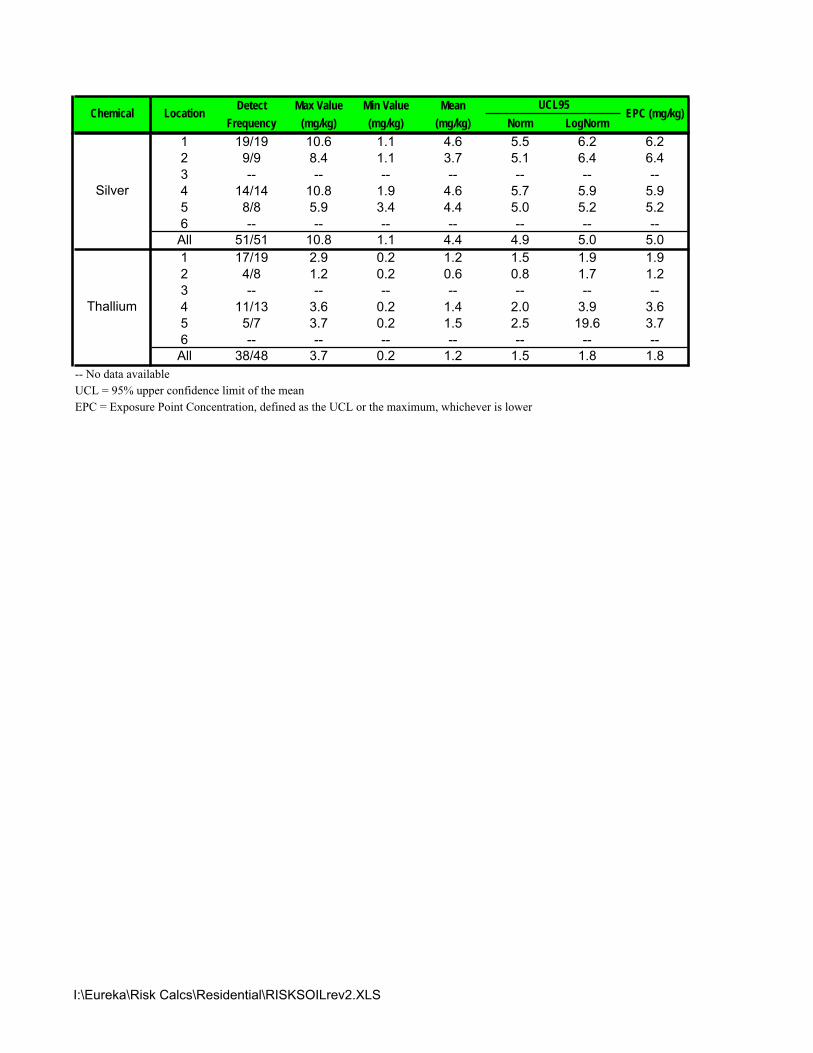
Detect Max Value Min Value MeanFrequency (mg/kg) (mg/kg) (mg/kg) Norm LogNorm
Chemical LocationUCL95
EPC (mg/kg)
1 19/19 10.6 1.1 4.6 5.5 6.2 6.2
2 9/9 8.4 1.1 3.7 5.1 6.4 6.4
3 -- -- -- -- -- -- --
4 14/14 10.8 1.9 4.6 5.7 5.9 5.9
5 8/8 5.9 3.4 4.4 5.0 5.2 5.2
6 -- -- -- -- -- -- --
All 51/51 10.8 1.1 4.4 4.9 5.0 5.0
1 17/19 2.9 0.2 1.2 1.5 1.9 1.9
2 4/8 1.2 0.2 0.6 0.8 1.7 1.2
3 -- -- -- -- -- -- --
4 11/13 3.6 0.2 1.4 2.0 3.9 3.6
5 5/7 3.7 0.2 1.5 2.5 19.6 3.7
6 -- -- -- -- -- -- --
All 38/48 3.7 0.2 1.2 1.5 1.8 1.8
-- No data available
UCL = 95% upper confidence limit of the mean
EPC = Exposure Point Concentration, defined as the UCL or the maximum, whichever is lower
Silver
Thallium
I:\Eureka\Risk Calcs\Residential\RISKSOILrev2.XLS

Detection Max Min
Frequency Value (ppb) Value (ppb) Norm LogNorm
Arsenic All Tap Water 25/54 7.6 1.3 2.9 3.3 3.3 3.3
Cadmium All Tap Water 12/54 2.2 0.1 0.3 0.3 0.3 0.3
Table ES-9: Summary Statistics for Residential Tap Water
Chemical Location Medium Mean (ppb)UCL95
EPC (ppb)
Detect Max Value Min Value MeanFrequency (mg/kg) (mg/kg) (mg/kg) Norm LogNorm
A 4/4 108 27.8 58.4 99.0 174 108
B -- -- -- -- -- -- --
C 5/5 24.8 1.0 15.7 24.6 1422 24.8
D 3/3 67.8 8.6 41.5 92.3 1.5E+06 67.8
E 5/5 330 27.0 112 231 1220 330
F 6/6 79.2 13.2 46.3 70.0 146 79.2
G -- -- -- -- -- -- --
All 23/23 330 1.0 55.4 79.3 130 130
A 4/4 637 200 382 629 1181 637
B -- -- -- -- -- -- --
C 5/5 533 2.4 273 488 7.0E+08 533
D 3/3 861 78.7 468 1128 1.2E+09 861
E 5/5 1080 246 788 1106 2290 1080
F 6/6 1100 256 653 925 1358 1100
G -- -- -- -- -- -- --
All 23/23 1100 2.4 529 649 1931 1100
A 4/4 171 38.6 75.0 151 346 171
B -- -- -- -- -- -- --
C 5/5 136 0.2 53.4 118 2.9E+09 136
D 3/3 59 29.2 42.6 68.4 162 59.3
E 5/5 157 25.8 108 159 473 157
F 6/6 120 39.8 75.1 98.0 112 112
G -- -- -- -- -- -- --
All 23/23 171 0.2 73.3 91.6 396 171
A 4/4 34800 14700 26375 37368 49694 34800
B -- -- -- -- -- -- --
C 5/5 31400 12800 23040 30693 39329 31400
D 3/3 18800 15400 17333 20279 21219 18800
E 5/5 39500 20300 28860 36320 40129 39500
F 6/6 25600 16400 21200 23763 24297 24297
G -- -- -- -- -- -- --
All 23/23 39500 12800 23661 26246 26703 26703
A 4/4 2530 1400 1835 2420 2640 2530
B -- -- -- -- -- -- --
C 5/5 3350 14.8 1389 2686 1.3.E+08 3350
D 3/3 1230 492 874 1498 7739 1230
E 5/5 5750 1920 4430 5895 8302 5750
F 6/6 4050 1350 2108 3005 3498 3498
G -- -- -- -- -- -- --
All 23/23 5750 15 2248 2829 6861 5750
A 4/4 6.2 1.2 3.2 5.8 15.8 6.2
B -- -- -- -- -- -- --
C 5/5 4.7 0.6 2.6 4.2 20.0 4.7
D 3/3 144 1.7 71.5 192 3.3E+26 144
E 5/5 6.3 2.7 4.3 5.6 6.3 6.3
F 6/6 1.2 0.3 0.7 1.0 1.4 1.2
G -- -- -- -- -- -- --
All 23/23 144 0.3 11.6 23.1 21.3 23.1
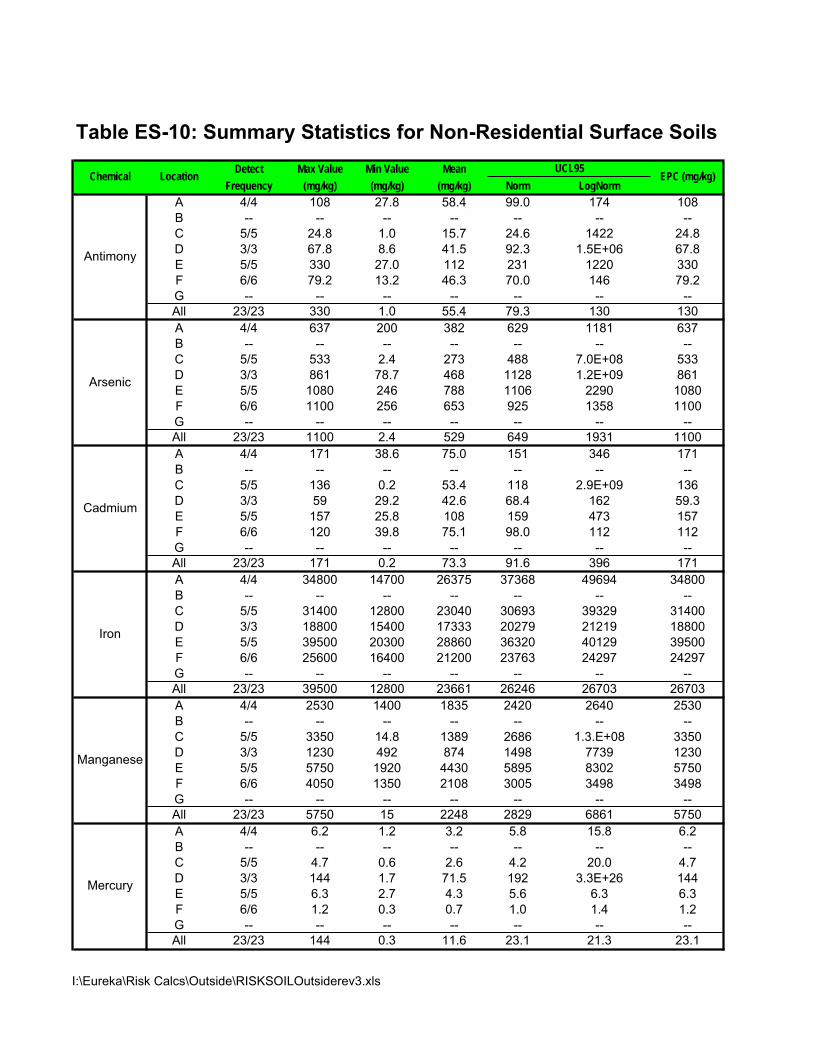
Table ES-10: Summary Statistics for Non-Residential Surface Soils
Chemical LocationUCL95
EPC (mg/kg)
Antimony
Arsenic
Cadmium
Iron
Manganese
Mercury
I:\Eureka\Risk Calcs\Outside\RISKSOILOutsiderev3.xls

Detect Max Value Min Value MeanFrequency (mg/kg) (mg/kg) (mg/kg) Norm LogNorm
Chemical LocationUCL95
EPC (mg/kg)
A 4/4 109 6.2 44.4 96.9 3327 109
B -- -- -- -- -- -- --
C 4/5 110 0.1 42.1 94.9 3.6E+11 110
D 3/3 90.4 27.1 57.5 111 1744 90.4
E 5/5 63.2 26.9 42.9 55.5 62.7 62.7
F 6/6 138 14.9 75.9 116 275 138
G -- -- -- -- -- -- --
All 22/23 138 0.1 53.5 68.3 428 138
A 4/4 50.5 10.7 25.7 46.2 107 50.5
B -- -- -- -- -- -- --
C 4/5 61.3 0.3 20.4 42.9 6.7E+05 61.3
D 2/3 6.9 1.6 4.6 9.3 1956 6.9
E 5/5 67.5 8.1 47.8 70.2 414 67.5
F 6/6 27.0 6.8 12.9 19.2 23.3 23.3
G -- -- -- -- -- -- --
All 21/23 67.5 0.3 23.3 31.1 66.4 66.4
-- No data available
UCL = 95% upper confidence limit of the mean
EPC = Exposure Point Concentration, defined as the UCL or the maximum, whichever is lower
Thallium
Silver
I:\Eureka\Risk Calcs\Outside\RISKSOILOutsiderev3.xls
Part
A:
Evalu
ati
on
of
Ch
ron
ic N
on
-Can
cer
Ris
k
All
Are
as
Are
a 1
Are
a 2
Are
a 3
Are
a 4
Are
a 5
Are
a 6
An
aly
teA
vg
RM
EA
vg
RM
EA
vg
RM
EA
vg
RM
EA
vg
RM
EA
vg
RM
EA
vg
RM
E
An
tim
on
y0
.03
0.0
80
.03
0.0
90
.01
0.0
40
.03
0.0
80
.01
0.0
40
.03
0.0
80
.00
0.0
0
Ars
en
ic0
.15
0.4
30
.18
0.4
90
.14
0.4
00
.19
0.5
20
.21
0.5
70
.20
0.5
60
.00
0.0
0
Ca
dm
ium
0.0
20
.04
0.0
20
.05
0.0
10
.04
0.0
30
.09
0.0
20
.06
0.0
20
.06
0.0
00
.00
Iro
n0
.06
0.1
60
.06
0.1
80
.06
0.1
60
.03
0.0
90
.06
0.1
80
.06
0.1
80
.04
0.1
0
Ma
ng
an
ese
0.0
10
.02
0.0
10
.02
0.0
10
.02
0.0
10
.02
0.0
10
.02
0.0
10
.02
0.0
00
.00
Me
rcu
ry0
.01
0.0
20
.01
0.0
20
.00
0.0
10
.01
0.0
20
.01
0.0
30
.01
0.0
30
.00
0.0
0
Silv
er
0.0
00
.00
0.0
00
.01
0.0
00
.00
0.0
00
.01
0.0
00
.01
0.0
00
.01
0.0
00
.00
Th
alli
um
0.2
30
.64
0.2
70
.77
0.1
90
.54
0.2
00
.56
0.2
30
.64
0.2
20
.61
0.0
00
.00
Total
0.50
1.40
0.58
1.63
0.43
1.21
0.50
1.39
0.55
1.54
0.55
1.54
0.04
0.10
Part
B:
Evalu
ati
on
of
Can
cer
Ris
k
All
Are
as
Are
a 1
Are
a 2
Are
a 3
Are
a 4
Are
a 5
Are
a 6
An
aly
teA
vg
RM
EA
vg
RM
EA
vg
RM
EA
vg
RM
EA
vg
RM
EA
vg
RM
EA
vg
RM
E
Ars
en
ic9
83
10
95
87
71
11
01
12
11
11
21
08
00
Total
983
1095
877
11101
12111
12108
00
Bla
nk c
ells
in
dic
ate
no
da
ta is a
va
ilab
le t
o e
va
lua
te r
isk
Sh
ad
ing
in
dic
ate
s a
va
lue
exce
ed
ing
a le
ve
l o
f co
nce
rn (
no
n-c
an
ce
r: H
I>1
.0;
ca
nce
r: R
isk>
10
0/m
illio
n)
Ca
nce
r risks a
re o
ut
of
a m
illio
n
Ta
ble
ES
-11
: R
isk
Es
tim
ate
s f
or
Re
sid
en
tia
l S
oil
In
ge
sti
on
(b
y a
rea
)
I:/E
ure
ka
/RA
Re
po
rt/
Se
pt
20
02
Fin
al/E
S T
ab
les.w
pd

Part A: Evaluation of Chronic Non-Cancer Risk
All Areas
Analyte Avg RME
Arsenic 0.18 0.38
Cadmium 0.01 0.02
Total 0.19 0.40
Part B: Evaluation of Cancer Risk
All Areas
Analyte Avg RME
Arsenic 11 73
Total 11 73Cancer risks are out of a million
Table ES-12: Risk Estimates for Residential
Consumption of Tap Water
I:/Eureka/RA Report/ Sept 2002 Final/ES Tables.wpd
RE
CR
EA
TIO
NA
L U
SE
R
Part
A:
Evalu
ati
on
of
Ch
ron
ic N
on
-Can
cer
Ris
k
Are
a A
Are
a B
Are
a C
Are
a D
Are
a E
Are
a F
Are
a G
An
aly
teA
vg
RM
EA
vg
RM
EA
vg
RM
EA
vg
RM
EA
vg
RM
EA
vg
RM
EA
vg
RM
E
Antim
ony
0.2
71.2
50.0
00.0
00.0
60.2
90.1
70.7
80.8
33.8
20.2
00.9
20.0
00.0
0
Ars
enic
1.1
75.4
00.0
00.0
00.9
84.5
21.5
87.3
01.9
89.1
62.0
29.3
30.0
00.0
0
Cadm
ium
0.1
70.7
90.0
00.0
00.1
40.6
30.0
60.2
70.1
60.7
30.1
10.5
20.0
00.0
0
Iron
0.1
20.5
40.0
00.0
00.0
00.0
00.0
00.0
00.0
00.0
00.0
00.0
00.0
00.0
0
Manganese
0.0
20.0
80.0
00.0
00.0
20.1
10.0
10.0
40.0
40.1
90.0
20.1
20.0
00.0
0
Merc
ury
0.0
20.1
00.0
00.0
00.0
20.0
70.4
82.2
20.0
20.1
00.0
00.0
20.0
00.0
0
Silv
er
0.0
20.1
00.0
00.0
00.0
20.1
00.0
20.0
80.0
10.0
60.0
30.1
30.0
00.0
0
Thalli
um
0.6
32.9
20.0
00.0
00.7
73.5
40.0
90.4
00.8
43.9
00.2
91.3
50.0
00.0
0
Total
2.42
11.18
0.00
0.00
2.00
9.26
2.40
11.10
3.88
17.95
2.67
12.37
0.00
0.00
Part
B:
Evalu
ati
on
of
Can
cer
Ris
k
Are
a A
Are
a B
Are
a C
Are
a D
Are
a E
Are
a F
Are
a G
An
aly
teA
vg
RM
EA
vg
RM
EA
vg
RM
EA
vg
RM
EA
vg
RM
EA
vg
RM
EA
vg
RM
E
Ars
enic
45
417
00
38
349
61
563
76
706
78
719
00
Total
45
417
00
38
349
61
563
76
706
78
719
00
FU
TU
RE
RE
SID
EN
TIA
L
Part
A:
Evalu
ati
on
of
Ch
ron
ic N
on
-Can
cer
Ris
k
Are
a A
Are
a B
Are
a C
Are
a D
Are
a E
Are
a F
Are
a G
An
aly
t eA
vg
RM
EA
vg
RM
EA
vg
RM
EA
vg
RM
EA
vg
RM
EA
vg
RM
EA
vg
RM
E
Antim
ony
0.1
90.5
30.0
00.0
00.0
40.1
20.1
20.3
30.5
71.6
00.1
40.3
90.0
00.0
0
Ars
enic
0.8
12.2
70.0
00.0
00.6
81.9
01.1
03.0
71.3
83.8
51.4
03.9
20.0
00.0
0
Cadm
ium
0.1
20.3
30.0
00.0
00.0
90.2
60.0
40.1
20.1
10.3
10.0
80.2
20.0
00.0
0
Iron
0.0
80.2
30.0
00.0
00.0
00.0
00.0
00.0
00.0
00.0
00.0
00.0
00.0
00.0
0
Manganese
0.0
10.0
40.0
00.0
00.0
20.0
50.0
10.0
20.0
30.0
80.0
20.0
50.0
00.0
0
Merc
ury
0.0
10.0
40.0
00.0
00.0
10.0
30.3
30.9
30.0
10.0
40.0
00.0
10.0
00.0
0
Silv
er
0.0
20.0
40.0
00.0
00.0
20.0
40.0
10.0
40.0
10.0
20.0
20.0
50.0
00.0
0
Thalli
um
0.4
41.2
30.0
00.0
00.5
31.4
90.0
60.1
70.5
91.6
40.2
00.5
70.0
00.0
0
Total
1.6
84.7
00.0
00.0
01.3
93.9
01.6
74.6
72.7
07.5
51.8
65.2
00.0
00.0
0
Part
B:
Evalu
ati
on
of
Can
cer
Ris
k
Are
a A
Are
a B
Are
a C
Are
a D
Are
a E
Are
a F
Are
a G
An
aly
teA
vg
RM
EA
vg
RM
EA
vg
RM
EA
vg
RM
EA
vg
RM
EA
vg
RM
EA
vg
RM
E
Ars
enic
47
438
00
39
367
64
592
80
743
81
756
00
Total
47
438
00
39
367
64
592
80
743
81
756
00
Bla
nk c
ells
indic
ate
no d
ata
is a
vaila
ble
to e
valu
ate
ris
k
Shadin
g indic
ate
s a
valu
e e
xceedin
g a
level of concern
(non-c
ancer:
HI>
1.0
0; cancer:
Ris
k>
100/m
illio
n)
Cancer
risks a
re o
ut of m
illio
n
Tab
le E
S-1
3:
Ris
k E
sti
mate
s a
t N
on
-Resid
en
tial A
reas
I:/E
ure
ka/R
A R
eport
/ S
ept 2002 F
inal/E
S T
able
s.w
pd
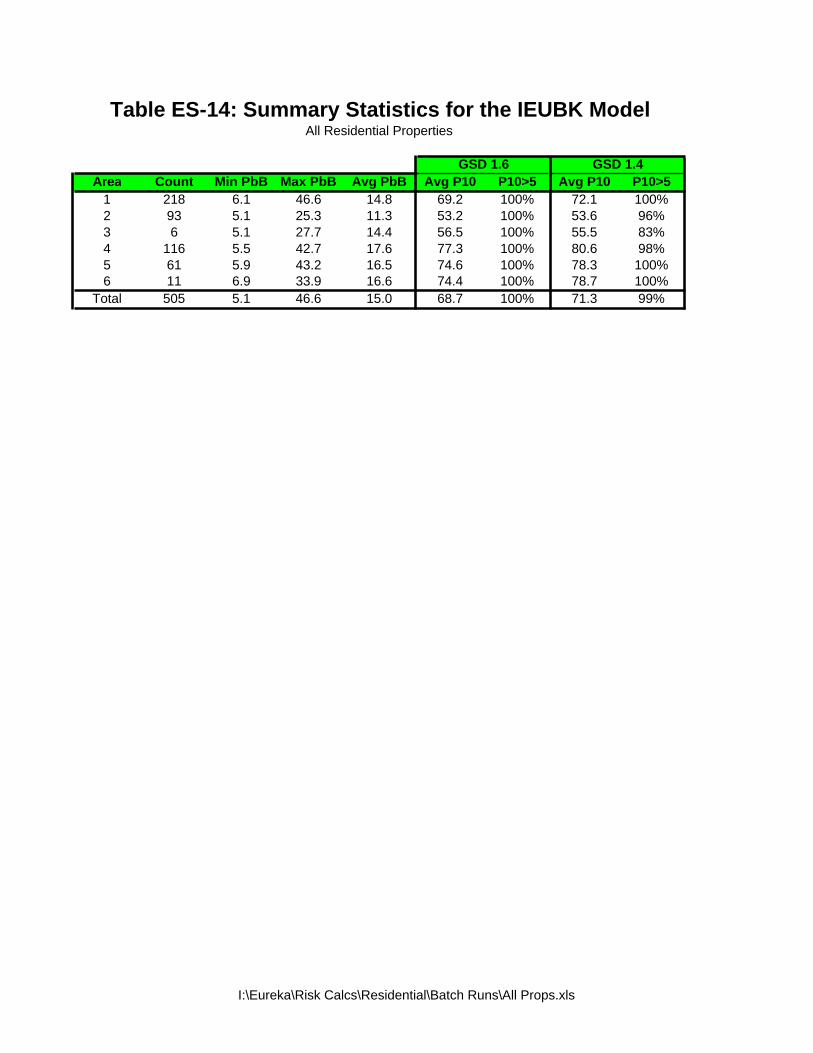
Area Count Min PbB Max PbB Avg PbB Avg P10 P10>5 Avg P10 P10>51 218 6.1 46.6 14.8 69.2 100% 72.1 100%2 93 5.1 25.3 11.3 53.2 100% 53.6 96%3 6 5.1 27.7 14.4 56.5 100% 55.5 83%4 116 5.5 42.7 17.6 77.3 100% 80.6 98%5 61 5.9 43.2 16.5 74.6 100% 78.3 100%6 11 6.9 33.9 16.6 74.4 100% 78.7 100%
Total 505 5.1 46.6 15.0 68.7 100% 71.3 99%
GSD 1.6 GSD 1.4
Table ES-14: Summary Statistics for the IEUBK ModelAll Residential Properties
I:\Eureka\Risk Calcs\Residential\Batch Runs\All Props.xls
GSD = 1.6 GSD = 1.4
1 -- -- --2 8.0 32 263 24.2 97 1004 42.7 100 1005 81.5 100 1006 17.1 87 947 38.6 100 1008 33.4 99 1009 51.0 100 100
10 26.6 98 10011 53.3 100 10012 17.5 88 9513 38.3 100 10014 43.6 100 10015 18.2 90 9616 41.3 100 10017 32.8 99 10018 37.7 100 10019 27.2 98 10020 57.5 100 10021 26.2 98 10022 33.2 99 10023 6.3 16 824 18.2 90 9625 26.4 98 100
Avg 33.4 91.3 92.3-- No conc data available
Table ES-15: IEUBK Results for Future Residential Children at Non-Residential Areas
PredictedPbB (ug/dL)
OutsideArea
P10 (%)
I:\Eureka\Risk Calcs\Outside\Outside Lead Summary v2.xls
Area #
Avg Surface Soil
Concentration
(mg/kg)
GM PbB
(ug/dL)
95th Percentile
PbB (ug/dL)
GSD = 1.8
01 -- -- --
02 615 3.5 9.1
03 4,694 12.6 33.2
04 13,261 31.8 84
05 42,987 98.4 259
06 2,584 7.9 20.7
07 10,989 26.7 70
08 8,404 20.9 55.0
09 18,506 43.6 115
10 5,556 14.5 38.2
11 20,041 47.0 124
12 2,682 8.1 21.3
13 10,827 26.4 69.3
14 13,827 33.1 87
15 2,881 8.6 22.5
16 12,479 30.1 79
17 8,121 20.3 53.4
18 10,546 25.7 67.6
19 5,811 15.1 39.8
20 23,039 53.7 141
21 5,439 14.3 37.6
22 8,344 20.8 54.7
23 313 2.8 7.4
24 2,868 8.5 22.4
25 5,491 14.4 37.9
All 10,013 24.5 64.5
Table ES-16: Bower's Model Predictions
for Recreational Visitors
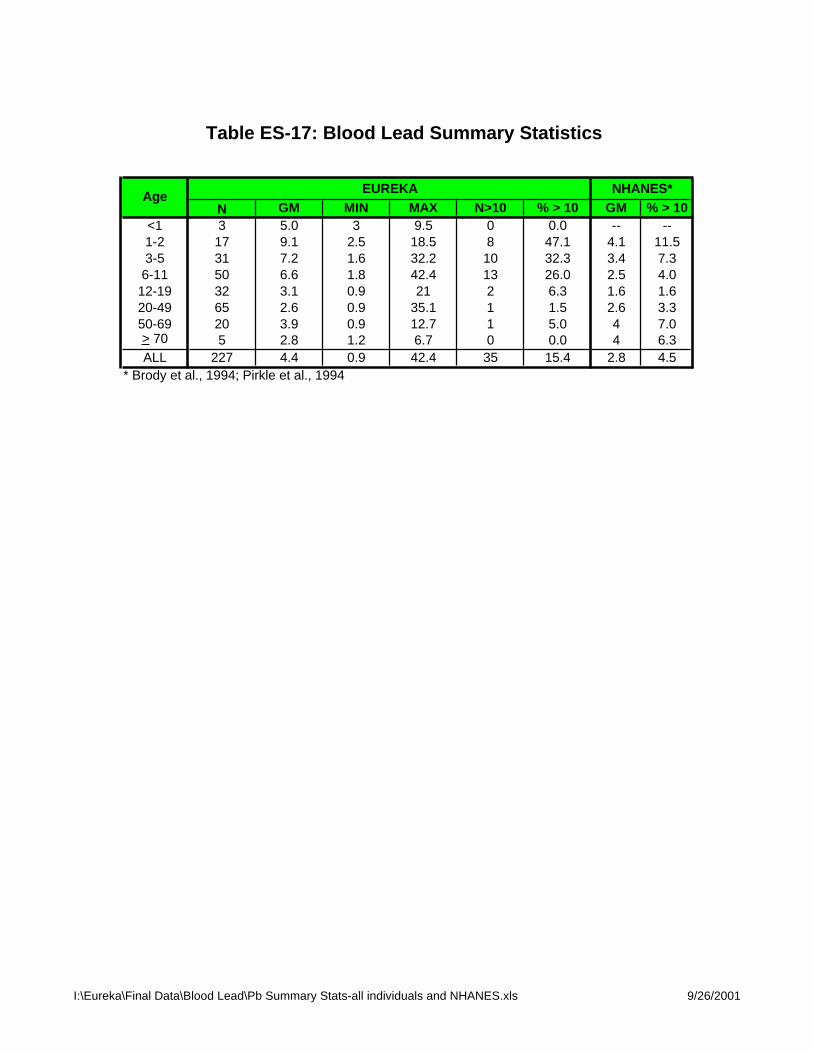
N GM MIN MAX N>10 % > 10 GM % > 10<1 3 5.0 3 9.5 0 0.0 -- --1-2 17 9.1 2.5 18.5 8 47.1 4.1 11.53-5 31 7.2 1.6 32.2 10 32.3 3.4 7.36-11 50 6.6 1.8 42.4 13 26.0 2.5 4.012-19 32 3.1 0.9 21 2 6.3 1.6 1.620-49 65 2.6 0.9 35.1 1 1.5 2.6 3.350-69 20 3.9 0.9 12.7 1 5.0 4 7.0> 70 5 2.8 1.2 6.7 0 0.0 4 6.3ALL 227 4.4 0.9 42.4 35 15.4 2.8 4.5
* Brody et al., 1994; Pirkle et al., 1994
NHANES*EUREKAAge
Table ES-17: Blood Lead Summary Statistics
I:\Eureka\Final Data\Blood Lead\Pb Summary Stats-all individuals and NHANES.xls 9/26/2001
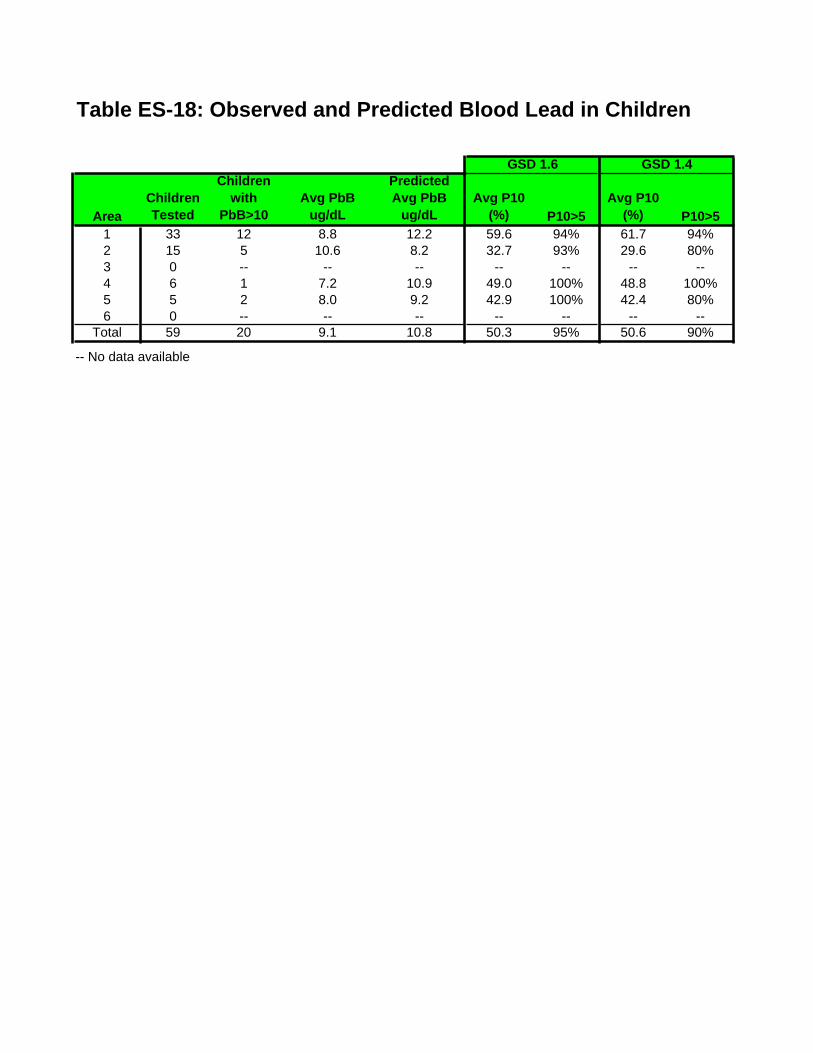
Table ES-18: Observed and Predicted Blood Lead in Children
AreaChildrenTested
Childrenwith
PbB>10Avg PbB
ug/dL
PredictedAvg PbB
ug/dLAvg P10
(%) P10>5Avg P10
(%) P10>51 33 12 8.8 12.2 59.6 94% 61.7 94%2 15 5 10.6 8.2 32.7 93% 29.6 80%3 0 -- -- -- -- -- -- --4 6 1 7.2 10.9 49.0 100% 48.8 100%5 5 2 8.0 9.2 42.9 100% 42.4 80%6 0 -- -- -- -- -- -- --
Total 59 20 9.1 10.8 50.3 95% 50.6 90%
-- No data available
GSD 1.6 GSD 1.4
x
x
#
#
Salt Lake City
Utah
#Eureka
Wyoming
Colorado
#Provo
N
EW
S
Figure ES-1Eureka Site Location

I:\E
ure
ka
\Ris
k C
alc
s\R
esid
en
tia
l\B
atc
h R
un
s\P
bB
ob
s v
s p
red
.xls
Fig
ure
ES
-4:
Ob
serv
ed
vs P
red
icte
d P
b f
or
Ch
ild
ren
(0-6
yrs
)
y =
0.1
07
4x +
9.8
28
7
R2 =
0.0
20
9
05
10
15
20
25
30
35
05
10
15
20
25
30
35
Observ
ed P
bB
(ug/d
L)
Predicted PbB (ug/dL)
Baseline Human Health Risk Assessment - Eureka Mills, Utah FINAL
I:\Eureka\RA Report\Sept 2002 Final\Eureka HHRA.wpd 1
1.0 INTRODUCTION
1.1 Site Description and History
The town of Eureka, Utah, is located in the East Tintic Mountains approximately 70 miles south of
Salt Lake City and 40 miles west of Provo (Figure 1-1). The Tintic district is the second-most
productive base- and precious-metal mining district in Utah (Morris and Mogensen 1978). The
district was discovered in 1869, and a smelter as well as a number of mills were built between 1871
and 1902. The Bullion Beck, Eureka Hill, Chief Consolidated, May Day, Godiva, and Uncle Sam
were the most important mines in the area (UDEQ 2000). Milling and mining activities were
conducted in the area until 1965, and large waste piles resulting from these operations are common
landscape attributes in and around the town of Eureka. Only sporadic mining activity has occurred
at the site since 1965 (Morris and Mogensen 1978; UDEQ 2000).
1.2 Basis for Potential Health Concern
In July 2000, the Utah Department of Environmental Quality Division of Environmental Response
and Remediation (UDEQ/DERR) collected a limited number (N=49)of soil and sediment samples
from multiple locations around the Eureka Mills Site (UDEQ 2000). Elevated concentrations of lead
(ranging up to 47,800 ppm) were observed in site soils. Because these values are well above the U.S.
Environmental Protection Agency’s (USEPA’s) default level of concern for residents (400 ppm), and
because these elevations occur in close proximity to residents of Eureka, it was determined that a
threat to human health and the environment is present at this site. As a result, EPA began a Removal
Evaluation at this site on August 28, 2000.
1.3 Purpose and Scope of this Risk Assessment
The purpose of this document is to utilize data collected during the Removal Evaluation to
characterize the nature and magnitude of risks which mining-related wastes pose to humans who may
be exposed in the vicinity of the site.
This risk assessment focuses on residents (current and future) and recreational visitors to the site.
Based on experience at numerous other mining and smelting sites in the western United States, the
chemicals of chief health concern to humans at mining sites are metals, so this evaluation focuses on
the potential risks from these contaminants. The environmental medium of chief concern is
contaminated area soils, as well as other media (e.g., indoor dust, home-grown vegetables) that may
have become contaminated from the soil.
Information from this report will be used by risk managers to help make decisions as to whether the
level of health risk posed by the mining/smelting related wastes is above acceptable limits, and if so,
to help decide what actions are needed to protect public health.
Baseline Human Health Risk Assessment - Eureka Mills, Utah FINAL
I:\Eureka\RA Report\Sept 2002 Final\Eureka HHRA.wpd 2
1.4 Organization of This Document
In addition to this introduction, this report is organized into the following sections:
Section 2 This section provides a summary of the available data on the levels of chemical
contaminants (metals) in site soils, and identifies which of these chemicals are of
potential health concern to area residents.
Section 3 This section discusses how residents may be exposed to site-related chemicals, now
or in the future, and identifies exposure scenarios that are considered to be of
potential concern.
Section 4 This section assesses the level of exposure and risk to humans from non-lead
chemicals of potential concern at this site. This includes 1) a description of methods
used to quantify exposure to these chemicals, 2) data on the toxicity of these
chemicals to humans, 3) calculation of the level of noncancer and cancer risk that may
occur as a result of exposure to these chemicals in site soils, and 4) a discussion of the
uncertainties which limit confidence in the assessment.
Section 5 This section assesses the level of exposure and risk to area residents from lead in site
soils. This includes 1) a description of the toxic effects of lead, 2) a summary of the
method used by USEPA to evaluate risks from lead, 3) a summary of the estimated
risks at this site attributable to lead in site soils, and 4) a discussion of the
uncertainties which limit confidence in the assessment.
Section 6 This section summarizes the overall findings presented in Sections 4 and 5.
Section 7 This section provides full citations for USEPA guidance documents, site-specific
studies, and scientific publications referenced in the risk assessment.
Baseline Human Health Risk Assessment - Eureka Mills, Utah FINAL
I:\Eureka\RA Report\Sept 2002 Final\Eureka HHRA.wpd 3
2.0 DATA SUMMARY AND SELECTION OF CHEMICALS OF POTENTIAL CONCERN
As part of the Removal Assessment conducted at this site (URS 2000), a variety of environmental
samples were collected from locations within Eureka during August and September 2000. These
samples included soils (residential and mine waste areas), indoor dust, earthen basement soils, interior
and exterior paint, and tap water. All data are provided in the electronic disk attached to this report.
2.1 Soil Data
Soil data collected during the Removal Assessment were obtained in two data sets that differed in
location, analytes, and laboratories. Data set #1 contains analytical results for soil samples collected
from residential properties. Data set #2 contains results for soils collected from background locations
and non-residential (primarily mine-waste) areas surrounding Eureka. These two sets are described
and evaluated separately below. Figure 2-1 shows sampling locations for both residential and non-
residential soils.
2.1.1 Data Set 1 (Residential Soils)
This sampling effort is described in the site sampling and analysis plan (URS 2000). In brief, the
Bureau of Reclamation (BOR) collected soil samples from over 500 residential properties within
Eureka (Figure 2-2). Prior to soil collection, each residential property was divided into zones no
greater than 15,000 square-feet (ft2) in size. Properties smaller than this were treated as one zone,
whereas larger properties were divided into two or more zones based upon local site conditions and
remedial design considerations. Two composite surface samples (0-2") and three discrete depth
samples (2-6", 6-12", 12-18") were collected from within each zone. A total of 4,211 residential soils
were collected at this site. All samples were analyzed for 13 metals by X-ray Fluorescence
Spectroscopy (XRF), and approximately 10% (N= 394) of these samples were also analyzed by
Inductively Coupled Plasma Spectroscopy (ICP) for 23 metals. Summary statistics for these analyses
are shown in Appendix A.
These XRF data underwent a data quality assessment (presented in Appendix A). In brief, the
detection limits (DLs) obtained by XRF were compared to levels needed for risk assessment
purposes. Additionally, a comparison of XRF vs ICP data was performed. In order for a data set
to be judged reliable for use in the risk assessment, both the DL and correlation with ICP had to be
listed as adequate. Further details of the data quality assessment can be found in Appendix A.
Summary statistics for data carried through to COPC selection are shown in Table 2-1.
2.1.2 Data Set 2 (Soils from Non-Residential Areas)
This sampling effort is described in the site sampling and analysis plan (URS 2000). In brief, URS
Operating Services, Inc. (UOS) collected soil samples from 7 nearby background locations and 25
non-residential (primarily mine-waste) areas around the perimeter of Eureka. Background locations
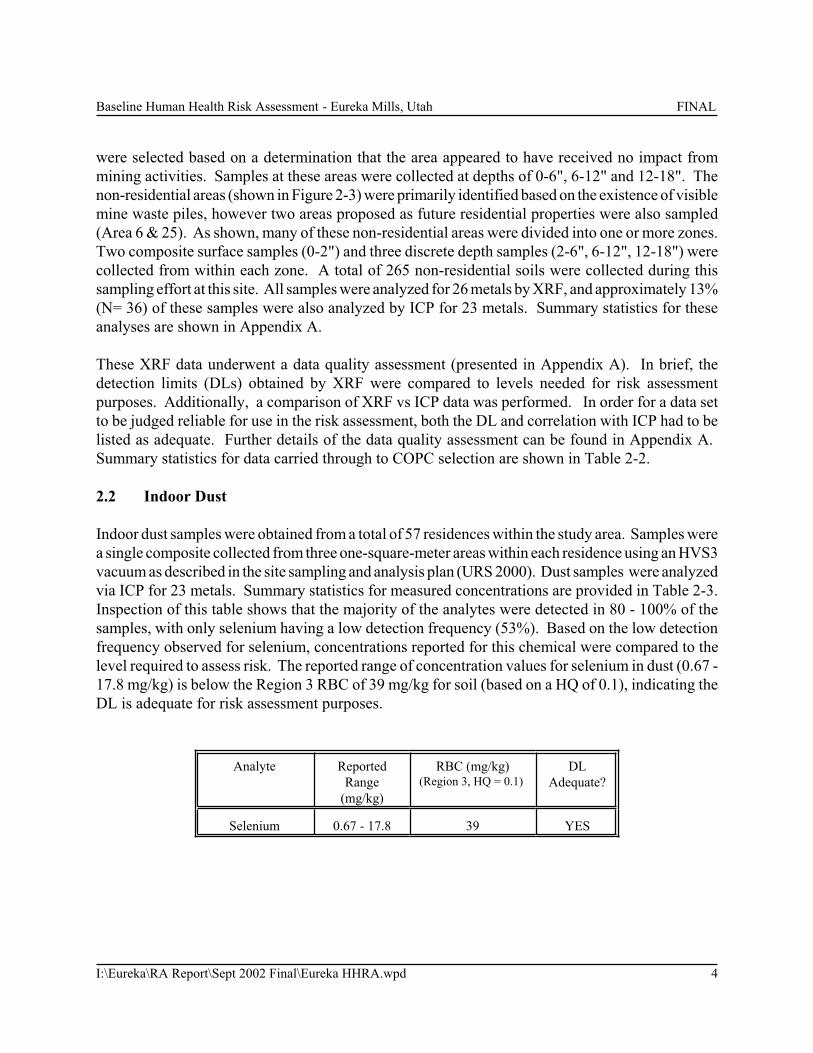
Baseline Human Health Risk Assessment - Eureka Mills, Utah FINAL
I:\Eureka\RA Report\Sept 2002 Final\Eureka HHRA.wpd 4
were selected based on a determination that the area appeared to have received no impact from
mining activities. Samples at these areas were collected at depths of 0-6", 6-12" and 12-18". The
non-residential areas (shown in Figure 2-3) were primarily identified based on the existence of visible
mine waste piles, however two areas proposed as future residential properties were also sampled
(Area 6 & 25). As shown, many of these non-residential areas were divided into one or more zones.
Two composite surface samples (0-2") and three discrete depth samples (2-6", 6-12", 12-18") were
collected from within each zone. A total of 265 non-residential soils were collected during this
sampling effort at this site. All samples were analyzed for 26 metals by XRF, and approximately 13%
(N= 36) of these samples were also analyzed by ICP for 23 metals. Summary statistics for these
analyses are shown in Appendix A.
These XRF data underwent a data quality assessment (presented in Appendix A). In brief, the
detection limits (DLs) obtained by XRF were compared to levels needed for risk assessment
purposes. Additionally, a comparison of XRF vs ICP data was performed. In order for a data set
to be judged reliable for use in the risk assessment, both the DL and correlation with ICP had to be
listed as adequate. Further details of the data quality assessment can be found in Appendix A.
Summary statistics for data carried through to COPC selection are shown in Table 2-2.
2.2 Indoor Dust
Indoor dust samples were obtained from a total of 57 residences within the study area. Samples were
a single composite collected from three one-square-meter areas within each residence using an HVS3
vacuum as described in the site sampling and analysis plan (URS 2000). Dust samples were analyzed
via ICP for 23 metals. Summary statistics for measured concentrations are provided in Table 2-3.
Inspection of this table shows that the majority of the analytes were detected in 80 - 100% of the
samples, with only selenium having a low detection frequency (53%). Based on the low detection
frequency observed for selenium, concentrations reported for this chemical were compared to the
level required to assess risk. The reported range of concentration values for selenium in dust (0.67 -
17.8 mg/kg) is below the Region 3 RBC of 39 mg/kg for soil (based on a HQ of 0.1), indicating the
DL is adequate for risk assessment purposes.
Analyte Reported
Range
(mg/kg)
RBC (mg/kg)(Region 3, HQ = 0.1)
DL
Adequate?
Selenium 0.67 - 17.8 39 YES
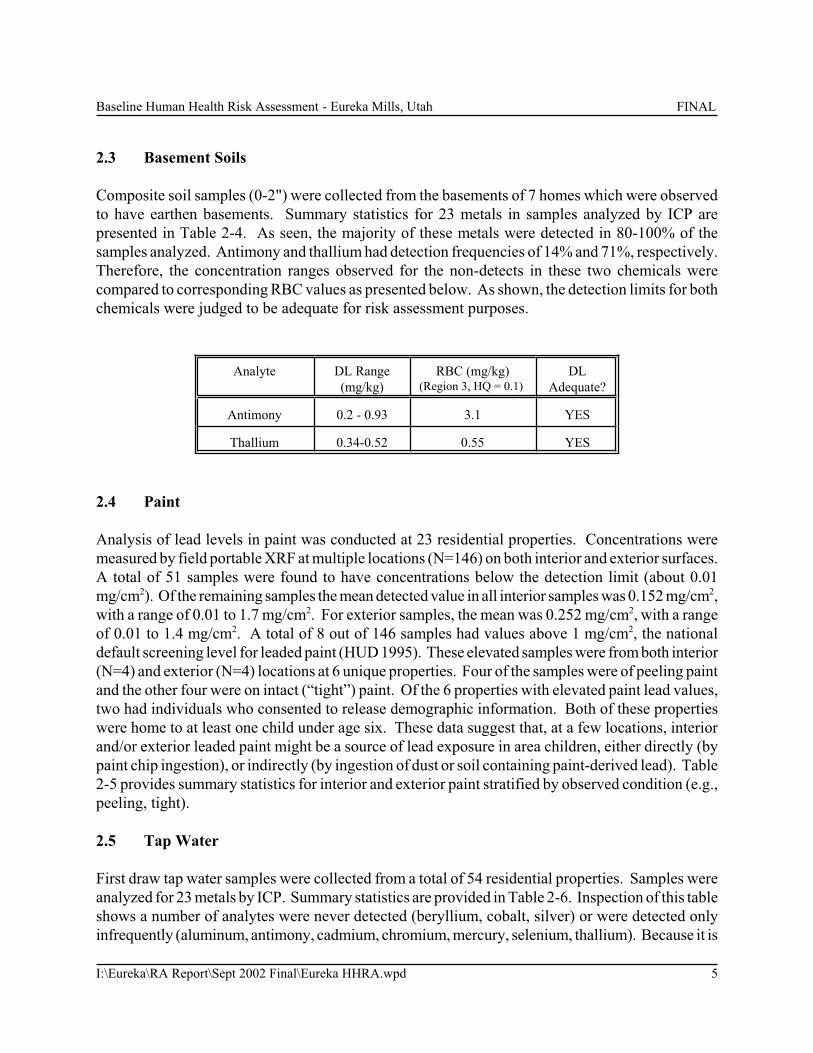
Baseline Human Health Risk Assessment - Eureka Mills, Utah FINAL
I:\Eureka\RA Report\Sept 2002 Final\Eureka HHRA.wpd 5
2.3 Basement Soils
Composite soil samples (0-2") were collected from the basements of 7 homes which were observed
to have earthen basements. Summary statistics for 23 metals in samples analyzed by ICP are
presented in Table 2-4. As seen, the majority of these metals were detected in 80-100% of the
samples analyzed. Antimony and thallium had detection frequencies of 14% and 71%, respectively.
Therefore, the concentration ranges observed for the non-detects in these two chemicals were
compared to corresponding RBC values as presented below. As shown, the detection limits for both
chemicals were judged to be adequate for risk assessment purposes.
Analyte DL Range
(mg/kg)
RBC (mg/kg)(Region 3, HQ = 0.1)
DL
Adequate?
Antimony 0.2 - 0.93 3.1 YES
Thallium 0.34-0.52 0.55 YES
2.4 Paint
Analysis of lead levels in paint was conducted at 23 residential properties. Concentrations were
measured by field portable XRF at multiple locations (N=146) on both interior and exterior surfaces.
A total of 51 samples were found to have concentrations below the detection limit (about 0.01
mg/cm2). Of the remaining samples the mean detected value in all interior samples was 0.152 mg/cm2,
with a range of 0.01 to 1.7 mg/cm2. For exterior samples, the mean was 0.252 mg/cm2, with a range
of 0.01 to 1.4 mg/cm2. A total of 8 out of 146 samples had values above 1 mg/cm2, the national
default screening level for leaded paint (HUD 1995). These elevated samples were from both interior
(N=4) and exterior (N=4) locations at 6 unique properties. Four of the samples were of peeling paint
and the other four were on intact (“tight”) paint. Of the 6 properties with elevated paint lead values,
two had individuals who consented to release demographic information. Both of these properties
were home to at least one child under age six. These data suggest that, at a few locations, interior
and/or exterior leaded paint might be a source of lead exposure in area children, either directly (by
paint chip ingestion), or indirectly (by ingestion of dust or soil containing paint-derived lead). Table
2-5 provides summary statistics for interior and exterior paint stratified by observed condition (e.g.,
peeling, tight).
2.5 Tap Water
First draw tap water samples were collected from a total of 54 residential properties. Samples were
analyzed for 23 metals by ICP. Summary statistics are provided in Table 2-6. Inspection of this table
shows a number of analytes were never detected (beryllium, cobalt, silver) or were detected only
infrequently (aluminum, antimony, cadmium, chromium, mercury, selenium, thallium). Because it is
Baseline Human Health Risk Assessment - Eureka Mills, Utah FINAL
I:\Eureka\RA Report\Sept 2002 Final\Eureka HHRA.wpd 6
possible that the detection limit obtained in this analysis may have been too high for some analytes,
the DL ranges were compared to levels needed for risk assessment purposes. This comparison is
presented in Table 2-7. As shown, of the 23 chemicals, all were found to have DLs acceptable for
risk assessment except arsenic and thallium. The detection limit for antimony was judged to be
marginally acceptable, since 96% of the samples were non-detects and the DL range was close to the
RBC based on an HQ of 0.1.
Due to concerns over the high detection limit for thallium, USEPA collected 10 additional tap water
samples from Eureka households and submitted these for analysis at a lower detection limit. Thallium
was not detected in any sample at a detection limit of 1 ug/L. Although this concentration is above
the RBC value of 0.26 ug/L shown in Table 2-7 (based on HQ = 0.1), all samples were below a value
of 2.6 ug/L, which is equivalent to an HQ of 1.0.
2.6 Physical-Chemical Characterization of Site Soils
In addition to the environmental sampling program described above, USEPA also undertook a study
to characterize the physical and chemical attributes of lead and arsenic contamination in site soils. The
main findings are summarized below. Full results for these analyses are provided in Appendix B.
2.6.1 Speciation of Arsenic and Lead
Most metals, including arsenic and lead, can occur in a variety of different chemical and physical
forms. These differences are of potential significance not only because they may help identify the
source of contamination, but also because the toxicity of the metals may differ between different
chemical forms. Therefore, USEPA undertook a study to obtain data on the chemical forms of
arsenic and lead present in site soils.
In brief, a set of 17 site soils were chosen for analysis, spanning a range of arsenic and lead
concentration values. Locations for each sample are shown in Figure 2-4. Each sample was analyzed
by electron microprobe analysis (EMPA), and the number and size of different chemical forms
(“phases”) of arsenic and lead-bearing particles were measured. From these data, the fraction of the
total mass of arsenic and lead present in each phase was calculated.
The results are shown in Figures 2-5 and 2-6. As shown, arsenic occurs mainly in the iron oxide and
lead-arsenic oxide phases, with a smaller fraction present in iron sulfate. In most samples, the
majority of all arsenic-bearing particles were found to be <100 um in diameter. Lead occurs primarily
as cerussite. The concentration of lead in this phase tends to increase as the total concentration of
lead increases, suggesting this is the predominant form accounting for elevated lead levels. In most
samples, the majority of lead-bearing particles are 5-100 um in diameter.

Baseline Human Health Risk Assessment - Eureka Mills, Utah FINAL
I:\Eureka\RA Report\Sept 2002 Final\Eureka HHRA.wpd 7
2.6.2 In Vitro Bioaccessability
Bioaccessability testing for lead and arsenic was also performed on the same soils selected for
speciation analysis. Bioaccessability tests are performed in glass vessels (“in vitro”) in the laboratory,
and are designed to measure the relative solubility of a chemical under specified laboratory test
conditions. Thus, in vitro solubility may not be equal to absorption observed in vivo. Preliminary
results have shown that the results obtained using in vitro methods for lead bioaccessability can be
correlated with results observed in vivo. Because a clear quantitative relationship between in vitroand in vivo values for arsenic has not yet been established, the in vitro results should not be assumed
to be equivalent to a direct estimate of bioavailability in animals. However, chemicals that are not
readily dissolved from soil in vitro are also likely to be absorbed relatively slowly in vivo. Results are
shown in Tables 2-8 (arsenic) and 2-9 (lead). As shown, bioaccessability for arsenic in these samples
ranged from 4 to 42%. The bioaccessability for lead in these samples was observed to range from
60 to 89%.
2.7 Selection of Chemicals of Potential Concern
Chemicals of potential concern (COPCs) are chemicals which a) are present at a site, b) occur at
concentrations which are or might be of health concern to exposed humans, and c) are or might be
due to releases from a Superfund site. USEPA has derived a standard method for selecting
COPCs at a site, as detailed in Risk Assessment Guidance for Superfund: Human HealthEvaluation Manual (Part A) (USEPA 1989a). Additionally, regional-specific guidance has been
developed by USEPA Region 8 (1994) for use in the selection of COPCs. In brief, USEPA
assumes that any chemical detected at a site is a candidate for selection as a COPC, but identifies
a number of methods that may be used for determining when a chemical is not of concern and may
be eliminated from further consideration. Each risk assessment may choose to apply some or all
of the methods identified by USEPA to select COPCs, as appropriate.
Data collected during the preliminary sampling at the site clearly indicated that lead was a
chemical of potential concern. However, at that time no systematic evaluation had been
performed to determine whether or not any other chemicals might also be of potential concern.
For this reason, a careful review of the available data was undertaken to determine if other
chemicals should be added to the list. This review is summarized below.
Soils
As noted in Appendix A, the XRF data from Data Sets #1 and #2 are not reliable for a number of
analytes, and not all chemicals were analyzed by this method. Therefore, the majority of the
COPC selection process for soils was based on ICP data. However, in the cases where chemicals
were only analyzed via XRF, the XRF data were used in the COPC selection process. Even
though the ICP data sets include only 10% of all sample locations, this approach still incorporates
values from 430 samples (394 from Data Set 1 and 36 from Data Set 2). Thus, this set is
Baseline Human Health Risk Assessment - Eureka Mills, Utah FINAL
I:\Eureka\RA Report\Sept 2002 Final\Eureka HHRA.wpd 8
considered reliable for identifying chemicals requiring evaluation in this risk assessment.
Additionally, due to the conservatism built into the COPC screening process, it is not thought that
any chemical posing a true health risk at this site would be inappropriately eliminated using the
ICP subset of data. As discussed previously, these ICP data sets contain analytical results for a
total of 23 chemicals.
Tap Water
The full tap water data set collected at this site was utilized to screen for COPC’s. This data set
contains analytical results for a total of 23 chemicals.
Step 1. Evaluation of Essential Nutrients
In accord with USEPA guidance (1989a, 1994), chemicals that are normal constituents of the
body and the diet and are required for good health may be eliminated unless there is evidence that
site-specific releases have elevated concentrations into a range where intakes would be potentially
toxic. Of the chemicals analyzed in soils and water at this site, 11 are classified as essential
nutrients (calcium, cobalt, chromium, copper, iron, magnesium, manganese, potassium, selenium,
sodium, and zinc). Therefore, the assumed intakes of these 11 constituents in site soils were
compared to their corresponding toxicity value or safe nutritive level as provided in USEPA 1994.
For soil, ingestion of 200 mg/d for 6 years (as child) and 100 mg/d for 24 years (as adult) for 350
days/yr was assumed. For water, ingestion of 1 L/d for 6 years (as child) and 2 L/d for 24 years
(as adult) for 350 days/yr was assumed. This resulted in intake factors of 3.7E-06 mg/kg-day and
3.5E-02 L/kg-day for soil and water intake, respectively. These values were then multiplied by
the maximum detected concentration of a chemical in each media to obtain a daily intake for that
chemical. This intake was then divided by the screening value provided by USEPA (1994) to
determine if the chemical could be eliminated from further analysis based on an observed ratio of
less than 1.0 (ie., predicted intake does not exceed safe level).
Results are summarized in Table 2-10. As shown, of the 11 essential nutrients analyzed in site
soils, 9 may be eliminated from further analysis. Iron and manganese in soils will be evaluated
further in the COPC selection process. For water, ten of these 11 chemicals were found to be
below a level of concern and were therefore eliminated from further consideration. Copper in
water will be evaluated further in the COPC selection process.
Step 2: Evaluation of Detection Frequencies
A contaminant with a detection frequency of >5% is carried through the toxicity/concentration
screening process (Step 3). Chemicals having detection frequencies of <5% are usually assumed
to be non-site related and are generally not evaluated as COPCs. However, it is important to
ensure that the detection limit for such chemicals would have been adequate to detect the
chemical if it were present at levels of human health concern. Of the chemicals analyzed via ICP in
Baseline Human Health Risk Assessment - Eureka Mills, Utah FINAL
I:\Eureka\RA Report\Sept 2002 Final\Eureka HHRA.wpd 9
site soils, the majority had detection frequencies >5%. Of the chemicals analyzed via XRF only
(molybdenum, rubidium, strontium, thorium, tin, titanium, uranium, and zinc), three were
observed in soils with a detection frequency below 5% (shown in Appendix A): molybdenum, tin,
and uranium. Appendix A shows that the detection limits for these chemicals were adequate for
risk assessment purposes. Additionally, the range of values detected in non-residential areas were
similar to the ranges detected in soils from background areas, suggesting that any molybdenum,
tin, or uranium detected on-site was due to natural background concentrations. Thus,
molybdenum, tin and uranium were eliminated as COPCs in soil.
The chemicals with detection frequencies less than 5% observed in tap water (shown previously in
Table 2-7) are antimony, beryllium, cobalt, mercury, and silver. As seen in Table 2-7, a review of
the detection limits for these five infrequently detected chemicals revealed that the reported
detection limits were adequate for risk assessment purposes. Additionally, reevaluation of
thallium in tap water found no detected concentrations. Therefore, these five chemicals may be
eliminated as COPCs in water due to their low detection frequency at this site.
Step 3: Comparison with Background Concentrations
Concentrations of analyzed metals in site soils were compared to their published background
ranges (Dragun, 1988; Shacklette and Boerngen, 1984; ATSDR, 1997). This comparison is
presented in Table 2-11. As shown, both the average and maximum concentrations of eight
chemicals (aluminum, barium, beryllium, nickel, rubidium, strontium, vanadium, zirconium) fall
squarely within the ranges reported for the United States. Therefore, these eight chemicals were
eliminated from further analysis as COPCs at this site. The other chemicals were either clearly
higher or not obviously within the reported background levels, and were carried further through
the COPC selection process.
Step 4: Toxicity/Concentration Screen
The final step used to evaluate COPCs at this site was a toxicity/concentration screen conducted in
accord with USEPA (1994) guidance. This step involves comparing the maximum reported
concentration of a chemical in a medium to an appropriate Risk-Based Concentration (RBC). RBCs
are media-specific health-based levels which if exceeded, could indicate that there is a potential for
adverse health effects to occur as a result of exposure. If the maximum concentration value is less
than the RBC, the chemical does not pose an unacceptable health risk and can be eliminated as a
COPC. [Note: This is true providing that the chemical does not exceed any relevant ARAR values.]
The RBCs used in this evaluation were taken from USEPA’s Region 3 Risk-Based Concentration
(RBC) table for residential soil (USEPA 1999). The value of each RBC depends on the specified
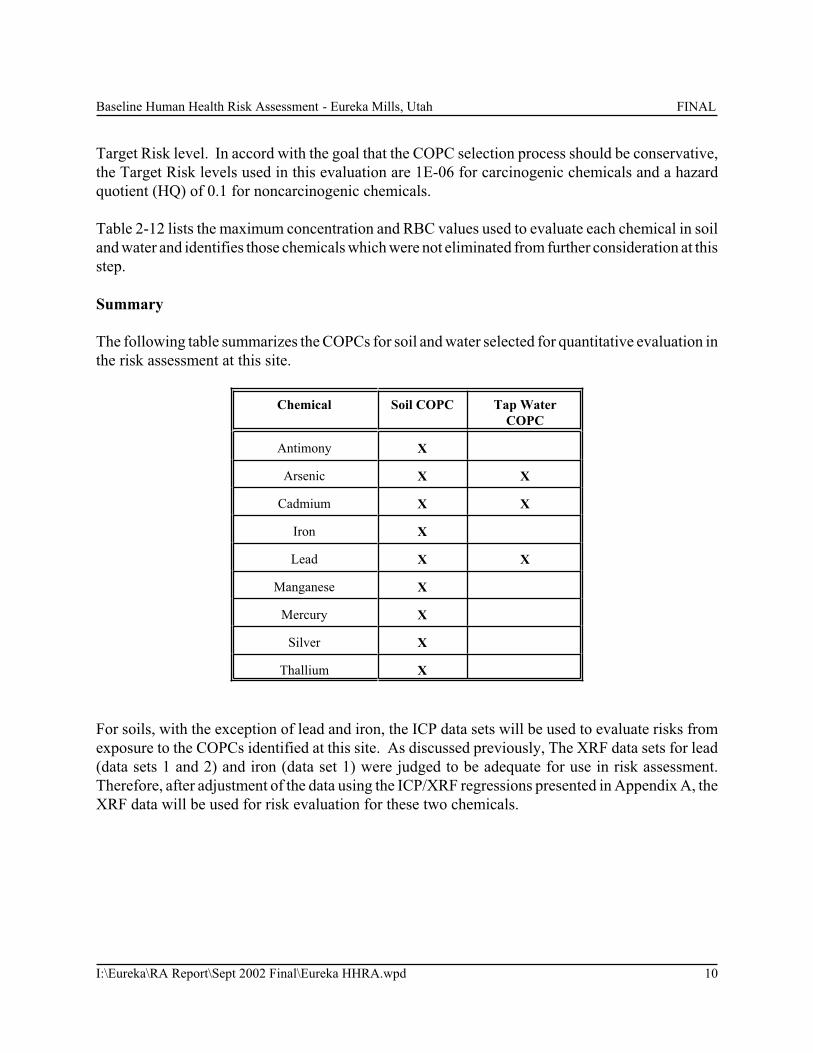
Baseline Human Health Risk Assessment - Eureka Mills, Utah FINAL
I:\Eureka\RA Report\Sept 2002 Final\Eureka HHRA.wpd 10
Target Risk level. In accord with the goal that the COPC selection process should be conservative,
the Target Risk levels used in this evaluation are 1E-06 for carcinogenic chemicals and a hazard
quotient (HQ) of 0.1 for noncarcinogenic chemicals.
Table 2-12 lists the maximum concentration and RBC values used to evaluate each chemical in soil
and water and identifies those chemicals which were not eliminated from further consideration at this
step.
Summary
The following table summarizes the COPCs for soil and water selected for quantitative evaluation in
the risk assessment at this site.
Chemical Soil COPC Tap Water
COPC
Antimony X
Arsenic X X
Cadmium X X
Iron X
Lead X X
Manganese X
Mercury X
Silver X
Thallium X
For soils, with the exception of lead and iron, the ICP data sets will be used to evaluate risks from
exposure to the COPCs identified at this site. As discussed previously, The XRF data sets for lead
(data sets 1 and 2) and iron (data set 1) were judged to be adequate for use in risk assessment.
Therefore, after adjustment of the data using the ICP/XRF regressions presented in Appendix A, the
XRF data will be used for risk evaluation for these two chemicals.

Baseline Human Health Risk Assessment - Eureka Mills, Utah FINAL
I:\Eureka\RA Report\Sept 2002 Final\Eureka HHRA.wpd 11
3.0 EXPOSURE ASSESSMENT
Exposure is the process by which humans come into contact with chemicals in the environment. In
general, humans can be exposed to chemicals in a variety of environmental media (e.g., soil, dust,
water, air, food), and these exposures can occur through one or more of several pathways (ingestion,
dermal contact, inhalation). Section 3.2 provides a discussion of possible pathways by which area
residents and recreational users might come into contact with contaminants present in site media.
Sections 4 and 5 describe the basic methods used to estimate the amount of chemical exposure (non-
lead and lead) which humans may receive from direct and indirect contact with contaminants derived
from outdoor soil.
3.1 Conceptual Site Model
Figure 3-1 presents a generalized conceptual site model showing the main pathways by which
contaminants from current or former mining activities and other sources might come into contact with
people who live or recreate within the Eureka Mills site boundary. Exposure scenarios that are
considered most likely to be of concern are shown in Figure 3-1 by boxes containing a solid circle,
while pathways which are judged to contribute only minor exposures are shown by boxes with a
cross-hatched circle. Incomplete pathways (i.e., those which are not thought to occur) are shown
by open circles.
3.1.1 Potential Sources
Soil contamination in and about the community of Eureka is a result of historic mining practices
which occurred in the area. Numerous mine waste piles exist in close proximity to current residential
areas.
3.1.2 Migration Pathways
The current medium of chief concern is soil. Metals in soil tend to have relatively low mobility and
are most likely to move by wind-blown transport of suspended soil particles in air, surface run-off
from nearby piles, or by hauling of bulk material from one location to another.
3.1.3 Exposed Populations and Potential Exposure Scenarios
There are a number of different groups or populations of humans who may come into contact with
contaminants in area soils, including current residents, future residents and recreational visitors. The
following text describes the scenarios which are considered plausible for each population, and
identifies which are likely to be most important and which are sufficiently minor that they need not
be evaluated quantitatively.
Baseline Human Health Risk Assessment - Eureka Mills, Utah FINAL
I:\Eureka\RA Report\Sept 2002 Final\Eureka HHRA.wpd 12
3.2 Pathway Screening
3.2.1 Residential Exposures
Incidental Ingestion of Soil/Dust
Few people intentionally ingest soil. However, it is believed that most people (especially children)
do ingest small amounts of soil that adhere to the hands or other objects placed in the mouth. In
addition, outdoor soil can enter the home and mix with indoor dust, which may also be ingested
during meals or during hand-to-mouth activities. This exposure pathway is often one of the most
important routes of human intake, so it was selected for quantitative evaluation.
There are three soil categories for which data exist at this site: surface, subsurface and earthen
basement. Quantitative evaluation of soil risk was based on exposure to surface soils only. This was
based on a review of the depth profile of soils at this site. Because the XRF data for non-lead COPCs
was deemed inadequate, and due to the fact that sufficient paired data from the ICP confirmation set
were unavailable, this judgement was based on the XRF data set for lead for which paired surface and
subsurface data are available for 505 residential properties. Figure 3-2 shows the distribution of the
ratio of lead concentrations in depth samples to those in surface samples. As shown, as depth
increases, the concentration of lead in soils tends to decrease. Because insufficient data were
available for the non-lead contaminants, this pattern was assumed to apply to all site COPCs. On this
basis, it is concluded that contaminant levels in surface soils are likely to be higher than levels in
subsurface soils. If subsurface soils were ever excavated and brought to the surface, risks would be
similar to or less than those for surface soils.
Several properties at this site were identified as having earthen basements. Samples from 7 homes
were collected and analyzed. Although it is possible that individuals residing in properties with
earthen basements have intermittent contact with those soils, the concentrations of contaminants in
basements are generally lower than those observed in outdoor soil. Therefore, exposure to basement
soil was not evaluated separately.
Dermal Contact with Soil
Residents can get contaminated soil on their skin while working or playing in their yard. Even though
information is limited on the rate and extent of dermal absorption of metals in soil across the skin,
most scientists consider that this pathway is likely to be minor in comparison to the amount of
exposure that occurs by soil and dust ingestion. This view is based on the following concepts: 1)
most people do not have extensive and frequent direct contact with soil, 2) most metals tend to bind
to soils, reducing the likelihood that they would dissociate from the soil and cross the skin, and 3)
ionic species such as metals have a relatively low tendency to cross the skin even when contact does
occur. Screening calculations (presented in Appendix C) support the conclusion that dermal
absorption of metals from dermal contact with soil is likely to be relatively minor compared to the
Baseline Human Health Risk Assessment - Eureka Mills, Utah FINAL
I:\Eureka\RA Report\Sept 2002 Final\Eureka HHRA.wpd 13
oral pathway, and omission of this pathway is not likely to lead to a substantial underestimate of
exposure or risk. Based on these considerations, along with a lack of data to allow reliable estimation
of dermal uptake of metals from soil, Region 8 generally recommends that dermal exposure to metals
in soils not be evaluated quantitatively (USEPA 1995). Therefore, this pathway was not evaluated
quantitatively in this risk assessment.
Inhalation of Soil/Dust in Air
Particles of contaminated soil or dust may become resuspended in air, and residents may breathe
those particles both inside and outside their house. However, screening level calculations (presented
in Appendix C) based on conservative estimates of soil release to air indicate that for residents,
inhalation of particles is likely to be a small source of risk (less than 0.2%) compared to incidental
ingestion of soil. Based on this, it was concluded that inhalation exposure is a sufficiently minor
contributor to exposure and that it need not be included in the quantitative evaluation of residential
exposure.
Ingestion of Home-Grown Vegetables
Area residents could be indirectly exposed to soil contaminants via consumption of vegetables grown
in contaminated soil. Evaluation of this pathway can be conducted by use of site-specific data (i.e.,
measured concentrations of contaminants in locally-grown produce), or through use of mathematical
models that predict uptake of a contaminant from soil into vegetables. No site-specific data are
currently available for concentrations in local vegetables, so evaluation would require use of a
mathematical model to estimate the concentration of COPCs which might occur in locally-grown
vegetables. However, use of mathematical uptake models are generally quite uncertain and typically
tend to overestimate actual uptake levels.
Although the use of simple mathematical models to predict uptake of metals into garden vegetables
is thought to be highly inaccurate, often tending to over-predict risks due to their inability to account
for non-linear uptake kinetics, a screening set of these calculations was performed for this site.
Screening level calculations (presented in Appendix C) reveal that the summed non-cancer risks from
ingestion of COPCs in garden vegetables are low (HI < 1) for both average and RME individuals.
Additionally, cancer risks for both exposure assumptions were below 1E-04. It should be noted that
these risks are likely to be higher than actual, due to limitations of the mathematical modeling.
The potential for low risk is supported by studies conducted at other sites within Utah. For example
a 1995 study at the Kennecott Mining site found no significant uptake of lead and arsenic into fruit
or leafy and root vegetables. Furthermore, the study concluded that “no substantial degree of either
cancer or non-cancer risk due to arsenic or lead is expected to result from the consumption of garden
vegetables”. Additionally, a 1996 study at the Murray Smelter site concluded that the exposure to
arsenic from leafy and root vegetables, legumes, and garden fruits was two orders of magnitude less
than that from soil and indoor dust (URS 2001). However, due to gaps in our understanding of metal
Baseline Human Health Risk Assessment - Eureka Mills, Utah FINAL
I:\Eureka\RA Report\Sept 2002 Final\Eureka HHRA.wpd 14
uptake into garden vegetables specific to Eureka, a more reliable quantitative assessment pertaining
to the magnitude of this overestimation can not be presented. Therefore, this pathway is not
evaluated further in the risk assessment for this site.
Ingestion of Tap Water
The town of Eureka is supplied by a municipal water system, originating from wells located on the
eastern flank of the Tintic Mountains. Some elevated levels of chemicals were found in tap water
samples collected during the removal assessment. Because individuals at this site may be exposed
to chemicals via ingestion of tap water at their residences, quantitative evaluation of this pathway was
performed, even through the source of the metals in tap water is not thought to be site related.
Although future residents may be exposed via this pathway, risks were calculated only for current
residents based on the available data set.
3.2.2 Recreational Exposures
Certain individuals may be exposed to contaminated soils while participating in recreational activities
at this site. Anecdotal reports have noted the presence of children and teenagers using the non-
residential site areas for bike riding and general play activities. A survey of 31 youths (2 - 15 years)
was conducted in order to assess how often the non-residential areas are used for recreational
purposes. Of the respondents, only 2 children were found to frequent these areas for recreational
activities, suggesting that this is a relatively uncommon activity that may apply to only a small subset
of residents. However, because recreational activities were found to occur at this site, risks from
recreational exposures were evaluated in this risk assessment. Individuals who engage in recreational
activities may be exposed to contaminants by incidental ingestion, inhalation of particulates and/or
dermal contact. Of these routes of exposure, ingestion exposure was assumed to be the most
important and was evaluated in this report.
3.3 Summary of Pathways of Principal Concern
Based on the evaluations above, the following exposure scenarios are judged to be of sufficient
potential concern to warrant quantitative exposure and risk analysis:

Baseline Human Health Risk Assessment - Eureka Mills, Utah FINAL
I:\Eureka\RA Report\Sept 2002 Final\Eureka HHRA.wpd 15
Exposure Scenarios of Potential Concern
Location Population Medium and Exposure
Route
Residential Areas within
Eureka
Current Residents Incidental ingestion of soil
and dust
Ingestion of tap water
Non-Residential Areas Hypothetical Future
Residents
Incidental ingestion of soil
and dust
Ingestion of tap water
Recreational Visitors Incidental ingestion of soil
and dust
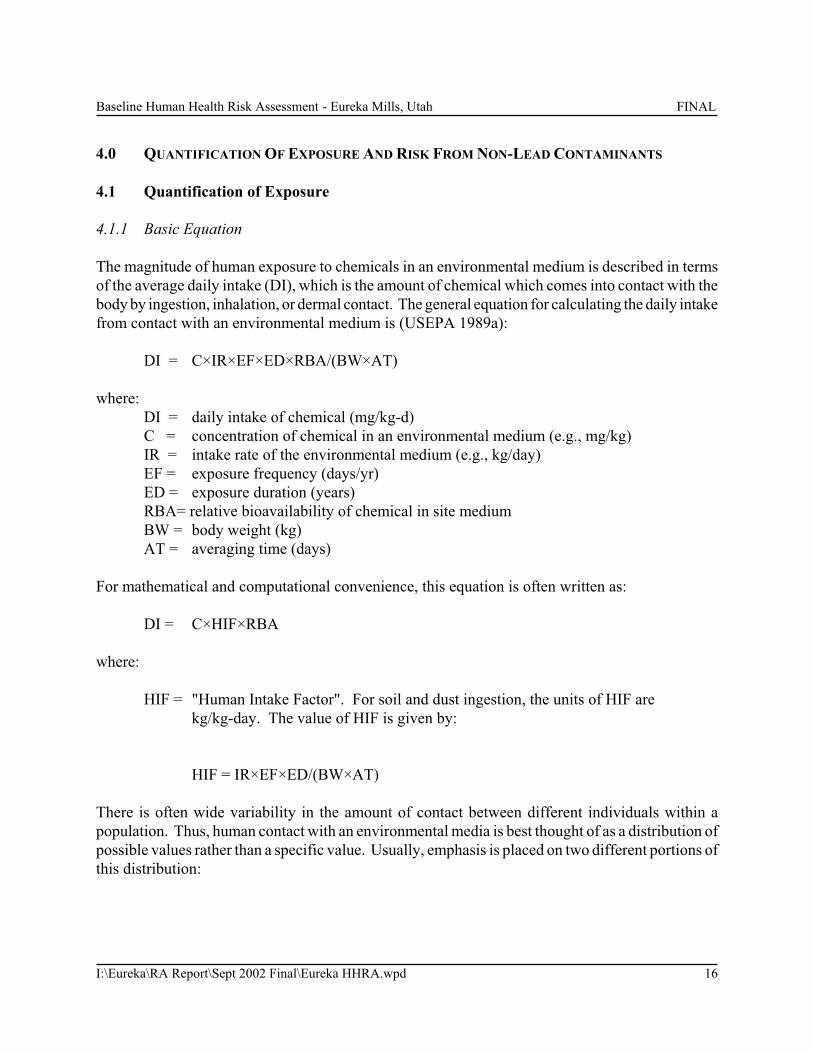
Baseline Human Health Risk Assessment - Eureka Mills, Utah FINAL
I:\Eureka\RA Report\Sept 2002 Final\Eureka HHRA.wpd 16
4.0 QUANTIFICATION OF EXPOSURE AND RISK FROM NON-LEAD CONTAMINANTS
4.1 Quantification of Exposure
4.1.1 Basic Equation
The magnitude of human exposure to chemicals in an environmental medium is described in terms
of the average daily intake (DI), which is the amount of chemical which comes into contact with the
body by ingestion, inhalation, or dermal contact. The general equation for calculating the daily intake
from contact with an environmental medium is (USEPA 1989a):
DI = C×IR×EF×ED×RBA/(BW×AT)
where:
DI = daily intake of chemical (mg/kg-d)
C = concentration of chemical in an environmental medium (e.g., mg/kg)
IR = intake rate of the environmental medium (e.g., kg/day)
EF = exposure frequency (days/yr)
ED = exposure duration (years)
RBA= relative bioavailability of chemical in site medium
BW = body weight (kg)
AT = averaging time (days)
For mathematical and computational convenience, this equation is often written as:
DI = C×HIF×RBA
where:
HIF = "Human Intake Factor". For soil and dust ingestion, the units of HIF are
kg/kg-day. The value of HIF is given by:
HIF = IR×EF×ED/(BW×AT)
There is often wide variability in the amount of contact between different individuals within a
population. Thus, human contact with an environmental media is best thought of as a distribution of
possible values rather than a specific value. Usually, emphasis is placed on two different portions of
this distribution:

Baseline Human Health Risk Assessment - Eureka Mills, Utah FINAL
I:\Eureka\RA Report\Sept 2002 Final\Eureka HHRA.wpd 17
• Average or Central Tendency Exposure (CTE) refers to individuals who have average
or typical intake of environmental media.
• Upper Bound or Reasonable Maximum Exposure (RME) refers to people who are at
the high end of the exposure distribution (approximately the 95th percentile). The
RME scenario is intended to assess exposures that are higher than average, but are
still within a realistic range of exposure.
4.1.2 Exposure Parameters
Soil and Dust Ingestion by Residents
Based on the assumption that the concentration of contaminants is approximately equal in outdoor
yard soil and indoor house dust, the EPA usually evaluates residential exposure to soil and dust in a
single step. The basic equation is as follows:
Both chronic and lifetime average intake rates are time-weighted to account for the possibility that
an adult may begin exposure as a child (USEPA 1989a, 1991a, 1993), as follows:
where:
TWA-DIsd = Time-weighted Daily Intake from ingestion of soil and dust (mg/kg-d)
Csd = Concentration of chemical in soil and dust (mg/kg)
RBA = relative bioavailability of chemical (unitless)
IR = Intake rate (kg/day) when a child (IRc) or an adult (IRa)
BW = Body weight (kg) when a child (BWc) or an adult (BWa)
EF = Exposure frequency (days/yr) when a child (EFc) or an adult (EFa)
ED = Exposure duration (years) when a child (EDc) or an adult (EDa)
AT = Averaging time (days) while a child (ATc) or an adult (Ata)
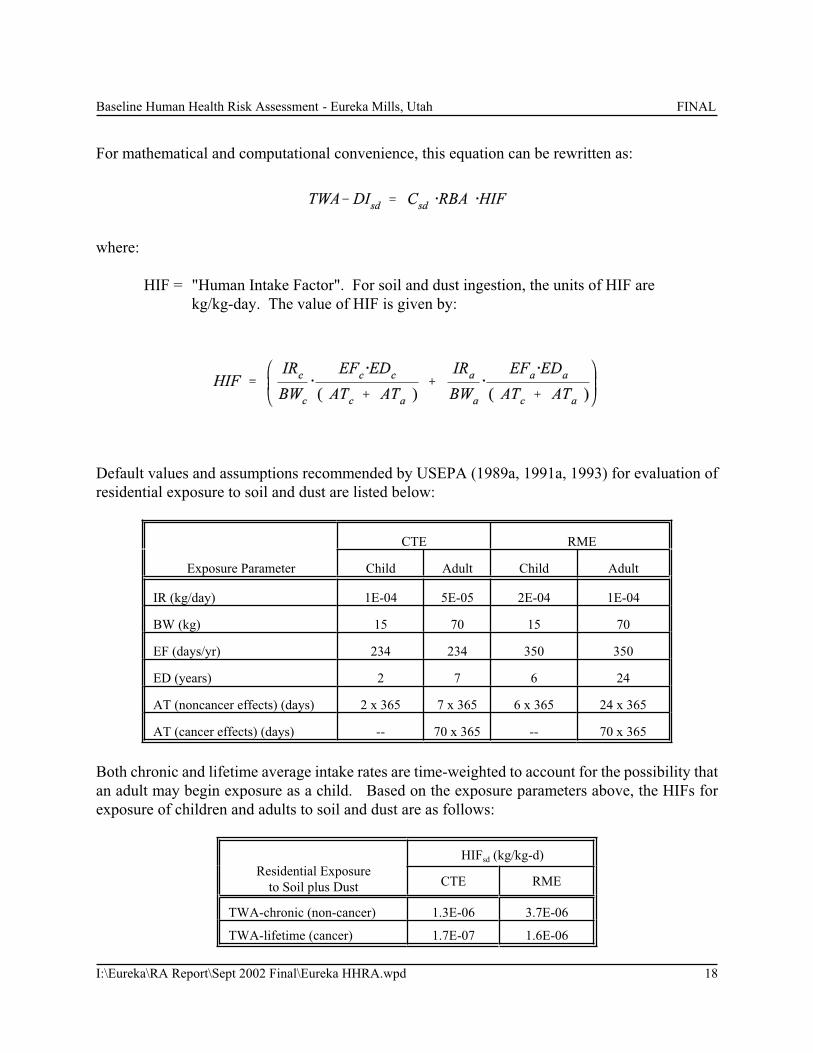
Baseline Human Health Risk Assessment - Eureka Mills, Utah FINAL
I:\Eureka\RA Report\Sept 2002 Final\Eureka HHRA.wpd 18
For mathematical and computational convenience, this equation can be rewritten as:
where:
HIF = "Human Intake Factor". For soil and dust ingestion, the units of HIF are
kg/kg-day. The value of HIF is given by:
Default values and assumptions recommended by USEPA (1989a, 1991a, 1993) for evaluation of
residential exposure to soil and dust are listed below:
Exposure Parameter
CTE RME
Child Adult Child Adult
IR (kg/day) 1E-04 5E-05 2E-04 1E-04
BW (kg) 15 70 15 70
EF (days/yr) 234 234 350 350
ED (years) 2 7 6 24
AT (noncancer effects) (days) 2 x 365 7 x 365 6 x 365 24 x 365
AT (cancer effects) (days) -- 70 x 365 -- 70 x 365
Both chronic and lifetime average intake rates are time-weighted to account for the possibility that
an adult may begin exposure as a child. Based on the exposure parameters above, the HIFs for
exposure of children and adults to soil and dust are as follows:
Residential Exposure
to Soil plus Dust
HIFsd (kg/kg-d)
CTE RME
TWA-chronic (non-cancer) 1.3E-06 3.7E-06
TWA-lifetime (cancer) 1.7E-07 1.6E-06
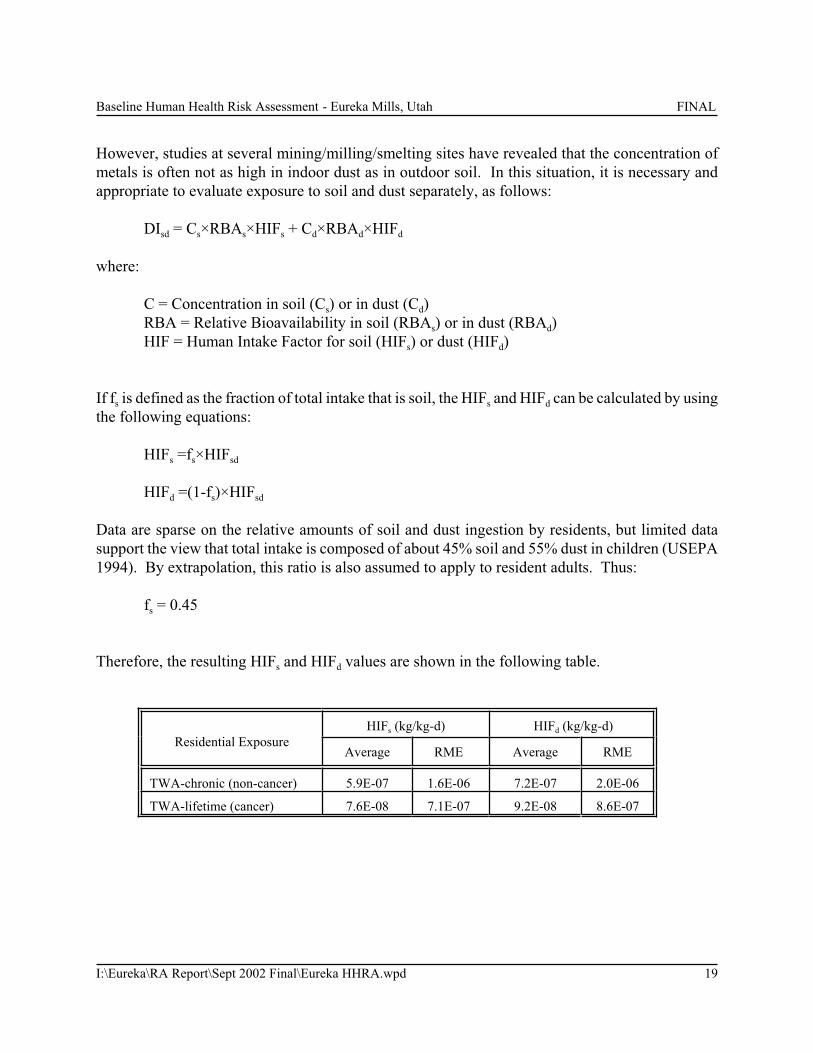
Baseline Human Health Risk Assessment - Eureka Mills, Utah FINAL
I:\Eureka\RA Report\Sept 2002 Final\Eureka HHRA.wpd 19
However, studies at several mining/milling/smelting sites have revealed that the concentration of
metals is often not as high in indoor dust as in outdoor soil. In this situation, it is necessary and
appropriate to evaluate exposure to soil and dust separately, as follows:
DIsd = Cs×RBAs×HIFs + Cd×RBAd×HIFd
where:
C = Concentration in soil (Cs) or in dust (Cd)
RBA = Relative Bioavailability in soil (RBAs) or in dust (RBAd)
HIF = Human Intake Factor for soil (HIFs) or dust (HIFd)
If fs is defined as the fraction of total intake that is soil, the HIFs and HIFd can be calculated by using
the following equations:
HIFs =fs×HIFsd
HIFd =(1-fs)×HIFsd
Data are sparse on the relative amounts of soil and dust ingestion by residents, but limited data
support the view that total intake is composed of about 45% soil and 55% dust in children (USEPA
1994). By extrapolation, this ratio is also assumed to apply to resident adults. Thus:
fs = 0.45
Therefore, the resulting HIFs and HIFd values are shown in the following table.
Residential Exposure
HIFs (kg/kg-d) HIFd (kg/kg-d)
Average RME Average RME
TWA-chronic (non-cancer) 5.9E-07 1.6E-06 7.2E-07 2.0E-06
TWA-lifetime (cancer) 7.6E-08 7.1E-07 9.2E-08 8.6E-07

Baseline Human Health Risk Assessment - Eureka Mills, Utah FINAL
I:\Eureka\RA Report\Sept 2002 Final\Eureka HHRA.wpd 20
Water Ingestion by Residents
The basic equation for evaluation of exposure from groundwater ingestion is as follows:
where:
DIw = Average daily intake of chemical from drinking water (mg/kg-day)
Cw = Concentration in drinking water (mg/L)
RBA = Relative Bioavailability of chemical in water (unitless)
IRw = Intake rate of water (L/day)
BW = Body weight (kg)
EFw = Exposure frequency to drinking water (days/yr)
ED = Exposure duration (years)
AT = Averaging time (days)
For mathematical and computational convenience, this equation can be rewritten as:
where:
HIF = "Human Intake Factor". For soil and dust ingestion, the units of HIF are
kg/kg-day. The value of HIF is given by:
Standard EPA defaults (USEPA 1989a, 1991a, 1993) for evaluation of water ingestion by residents
are as follows:
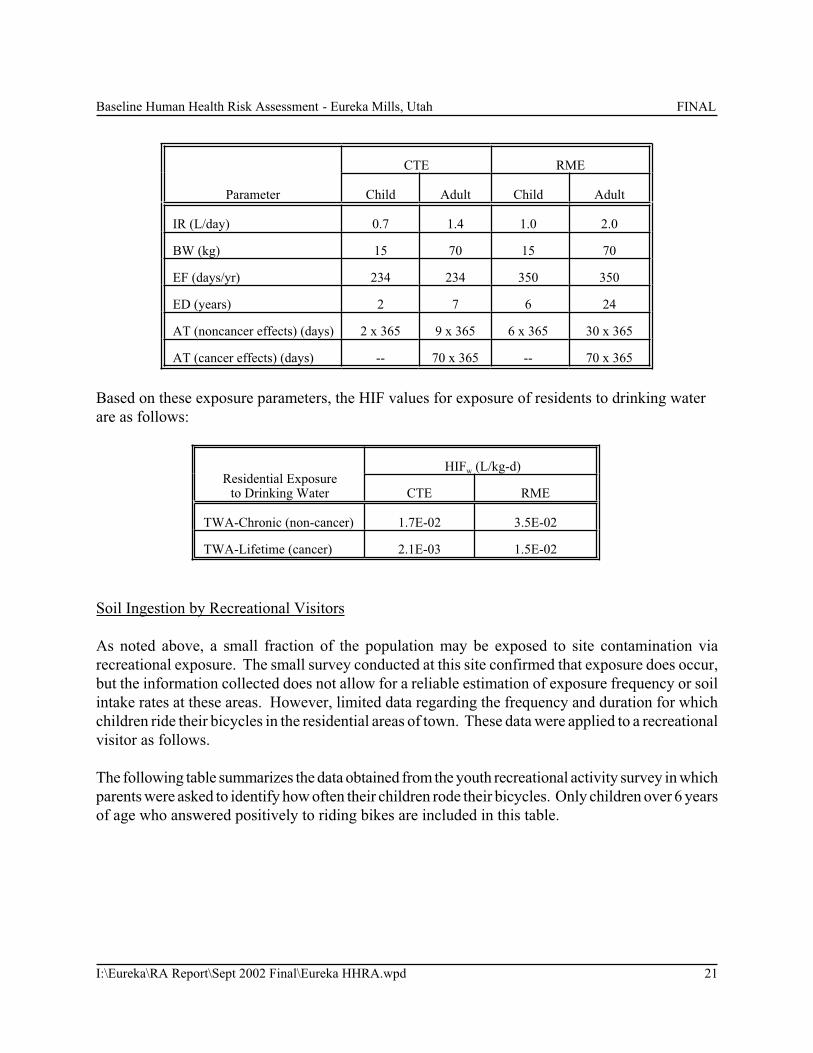
Baseline Human Health Risk Assessment - Eureka Mills, Utah FINAL
I:\Eureka\RA Report\Sept 2002 Final\Eureka HHRA.wpd 21
Parameter
CTE RME
Child Adult Child Adult
IR (L/day) 0.7 1.4 1.0 2.0
BW (kg) 15 70 15 70
EF (days/yr) 234 234 350 350
ED (years) 2 7 6 24
AT (noncancer effects) (days) 2 x 365 9 x 365 6 x 365 30 x 365
AT (cancer effects) (days) -- 70 x 365 -- 70 x 365
Based on these exposure parameters, the HIF values for exposure of residents to drinking water
are as follows:
Residential Exposureto Drinking Water
HIFw (L/kg-d)
CTE RME
TWA-Chronic (non-cancer) 1.7E-02 3.5E-02
TWA-Lifetime (cancer) 2.1E-03 1.5E-02
Soil Ingestion by Recreational Visitors
As noted above, a small fraction of the population may be exposed to site contamination via
recreational exposure. The small survey conducted at this site confirmed that exposure does occur,
but the information collected does not allow for a reliable estimation of exposure frequency or soil
intake rates at these areas. However, limited data regarding the frequency and duration for which
children ride their bicycles in the residential areas of town. These data were applied to a recreational
visitor as follows.
The following table summarizes the data obtained from the youth recreational activity survey in which
parents were asked to identify how often their children rode their bicycles. Only children over 6 years
of age who answered positively to riding bikes are included in this table.
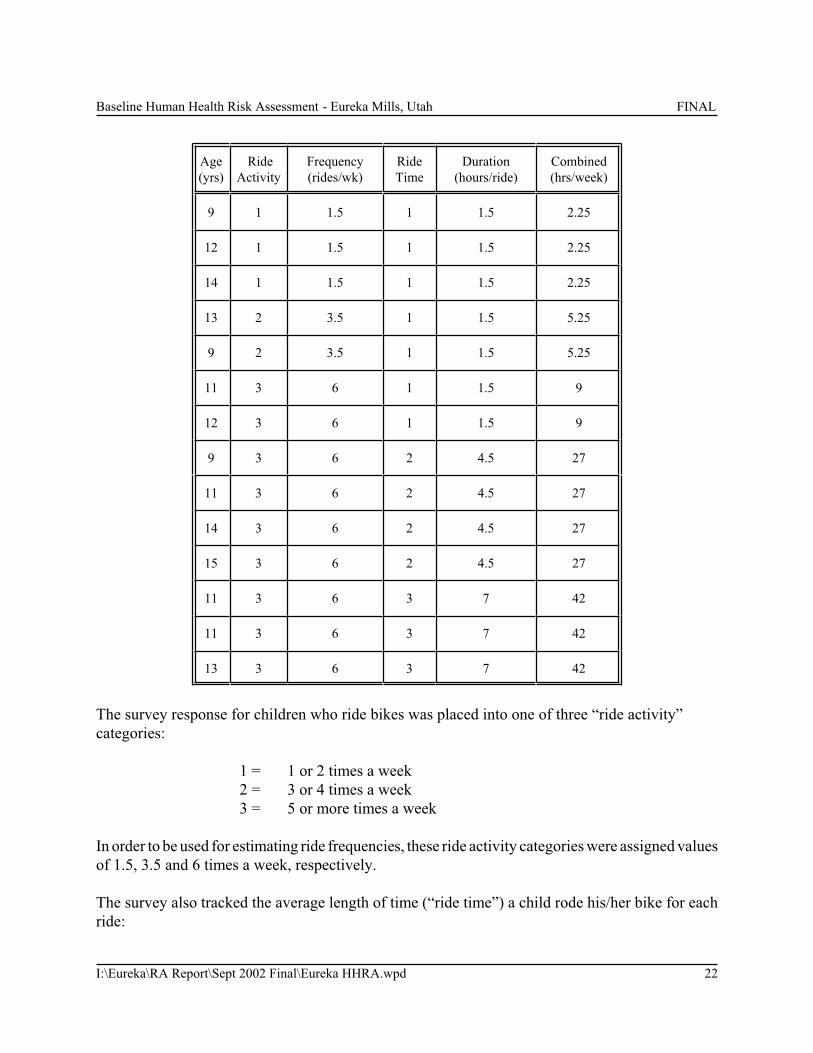
Baseline Human Health Risk Assessment - Eureka Mills, Utah FINAL
I:\Eureka\RA Report\Sept 2002 Final\Eureka HHRA.wpd 22
Age
(yrs)
Ride
Activity
Frequency
(rides/wk)
Ride
Time
Duration
(hours/ride)
Combined
(hrs/week)
9 1 1.5 1 1.5 2.25
12 1 1.5 1 1.5 2.25
14 1 1.5 1 1.5 2.25
13 2 3.5 1 1.5 5.25
9 2 3.5 1 1.5 5.25
11 3 6 1 1.5 9
12 3 6 1 1.5 9
9 3 6 2 4.5 27
11 3 6 2 4.5 27
14 3 6 2 4.5 27
15 3 6 2 4.5 27
11 3 6 3 7 42
11 3 6 3 7 42
13 3 6 3 7 42
The survey response for children who ride bikes was placed into one of three “ride activity”
categories:
1 = 1 or 2 times a week
2 = 3 or 4 times a week
3 = 5 or more times a week
In order to be used for estimating ride frequencies, these ride activity categories were assigned values
of 1.5, 3.5 and 6 times a week, respectively.
The survey also tracked the average length of time (“ride time”) a child rode his/her bike for each
ride:

Baseline Human Health Risk Assessment - Eureka Mills, Utah FINAL
I:\Eureka\RA Report\Sept 2002 Final\Eureka HHRA.wpd 23
1 = 1 or 2 hours
2 = 3 or 5 hours
3 = 6 or more hours
These categories were also assigned a value in order to be used to estimate exposure parameters
(shown in Duration Hours/Ride). The following values were assigned ( 1 = 1.5 hours; 2 = 4.5 hours;
3 = 7 hours).
The frequency value for each child was multiplied by the duration in order to obtain a value for each
child equivalent to the number of hours of ride time each week. These values are shown in the above
table under the heading “Combined hrs/week”. Summary statistics were then obtained using this
“combined information”.
The following table summarizes the 50th and 95th percentile values for hours/week riding. These
values were converted to hours per year by assuming that the riding year was 8 months long (32
weeks) in Eureka. This value was then divided by 365 days in order to obtain estimates of the
average hours/day riding for both the 50th and 95th percentile of the respondents.
%tile hrs/wk hrs/yr* hrs/day
50th 18 576 1.6
95th 42 1344 3.7
*Assumes that year is equivalent to 4 wks/month for 8 months
The values and assumptions used for evaluation of recreational exposure to soil are listed below:
Exposure Parameter CTE RME
IR (mg/hr) 25 50
BW (kg) 40 40
Time (hr/day) 1.6 3.7
EF (days/yr) 365 365
ED (years) 6 12
AT (noncancer effects) (days) 6 x 365 12 x 365
AT (cancer effects) (days) 70 x 365 70 x 365

Baseline Human Health Risk Assessment - Eureka Mills, Utah FINAL
I:\Eureka\RA Report\Sept 2002 Final\Eureka HHRA.wpd 24
The intake rate parameter was estimated using the default child soil ingestion rates of 100 mg/day and
200 mg/day for CTE and RME scenarios, respectively. If it was assumed that each recreational visit
lasted 4 hours, the hourly rate of ingestion would be 25 mg/hr and 50 mg/hr for these two scenarios.
It should be noted that the adult residential intake is based on a 16 hour day, therefore use of these
values in the recreational exposure assumes an intake 4 times greater than that of an adult resident.
As described above, the estimation of hours/day spent riding was based on a year-long average.
Therefore, the exposure frequency (EF) shown above is 365 days/yr. The exposure duration
assumption was set at 6 and 12 years for CTE and RME exposure scenarios, respectively, based on
a maximum possible exposure of 12 years for a target population ranging in age from 6 to 18 years.
Based on the exposure parameters above, the HIFs for exposure of teenagers to soil are as follows:
Recreational Exposure
to Soil
HIFs (kg/kg-d)
CTE RME
Chronic (non-cancer) 1.00E-06 4.63E-06
Lifetime (cancer) 8.57E-08 7.93E-07
4.1.3 Concentration of Non-Lead COPCs (C)
Residential Surface Soil
The concentration term in the basic equation above (see Section 4.1.1) is the arithmetic mean
concentration of a contaminant, averaged over the location (Exposure Point) where exposure is
presumed to occur during a specified time interval (USEPA 1989a). The location and size of the
Exposure Point depends in part on human activity patterns and in part on the length of time that is
required for a chemical to cause adverse effects. In this case, arsenic is of concern for chronic
(long-term) exposures, so the appropriate exposure unit is the area over which a resident is exposed
over the course of many years. Based on this concept, the residential area was divided into 6 exposure
areas as shown in Figure 2-2.
Because the true mean concentration of a chemical within an Exposure Area cannot be calculated
with certainty from a limited set of measurements, the USEPA recommends that the upper 95th
confidence limit (UCL) of the arithmetic mean concentration be used as the Exposure Point
Concentration (EPC) in calculating exposure and risk (USEPA 1992). If the calculated UCL is
higher than the highest measured value, then the maximum value is used as the EPC instead of the
UCL (USEPA 1992).

Baseline Human Health Risk Assessment - Eureka Mills, Utah FINAL
I:\Eureka\RA Report\Sept 2002 Final\Eureka HHRA.wpd 25
In accord with this policy, EPCs were calculated using all surface soil results analyzed by ICP (except
for iron, for which XRF was used) for each of the COPCs identified at this site. As discussed earlier,
the XRF data were judged unreliable for use in risk assessment. Table 4-1 presents summary
statistics for antimony, arsenic, cadmium, iron, manganese, mercury, silver and thallium stratified by
exposure area. As shown, no surficial soil data by ICP were available for Area #6 , therefore risks
at this area were not evaluated.
Indoor Dust
Current Residential Areas
The COPCs selected for evaluation in indoor dust were the same as those identified for soil
(antimony, arsenic, cadmium, iron, manganese, mercury, silver and thallium). In some assessments,
indoor dust concentrations are evaluated using a site-specific soil-dust regression model that predicts
dust concentrations from yard soil concentrations. However, at this site, no suitable correlation
between the COPCs in dust and their paired ICP soil data could be established. The lack of an
observable correlation does not necessarily indicate that soil does not contribute to indoor dust
concentrations. It is possible that the data set utilized for the analysis was too limited to establish a
reliable relationship. Therefore, EPCs for the COPCs in dust within each exposure area were
calculated using the measured data set for that area. Table 4-2 presents summary statistics for the
dust COPCs stratified by exposure area. Because there were no dust data available for Exposure
Area #3, the EPC value for dust obtained across the site (all) was assumed to apply to this area in
order to evaluate potential risks to residents.
Future Residential Areas
Because no residential structures exist in the non-residential areas to be evaluated for future
residential exposures, no data for indoor dust samples were available. Therefore, in order to assess
risks to residents who may reside at these locations in the future, the concentration of indoor dust was
estimated using the following equation.
Cd = ks*Cs
where:
Cd = Concentration in indoor dust (mg/kg)
ks = mass fraction of yard soil in indoor dust (unitless)
Cs = Concentration in yard soil (mg/kg)
Ideally, the value of ks for each chemical would be based on a site-specific relationship between dust and
soil at current residential properties. However, as discussed above, no reliable relationship was observed
for the non-lead COPCs in these media. Therefore the site specific ks observed for lead (0.15 - discussed
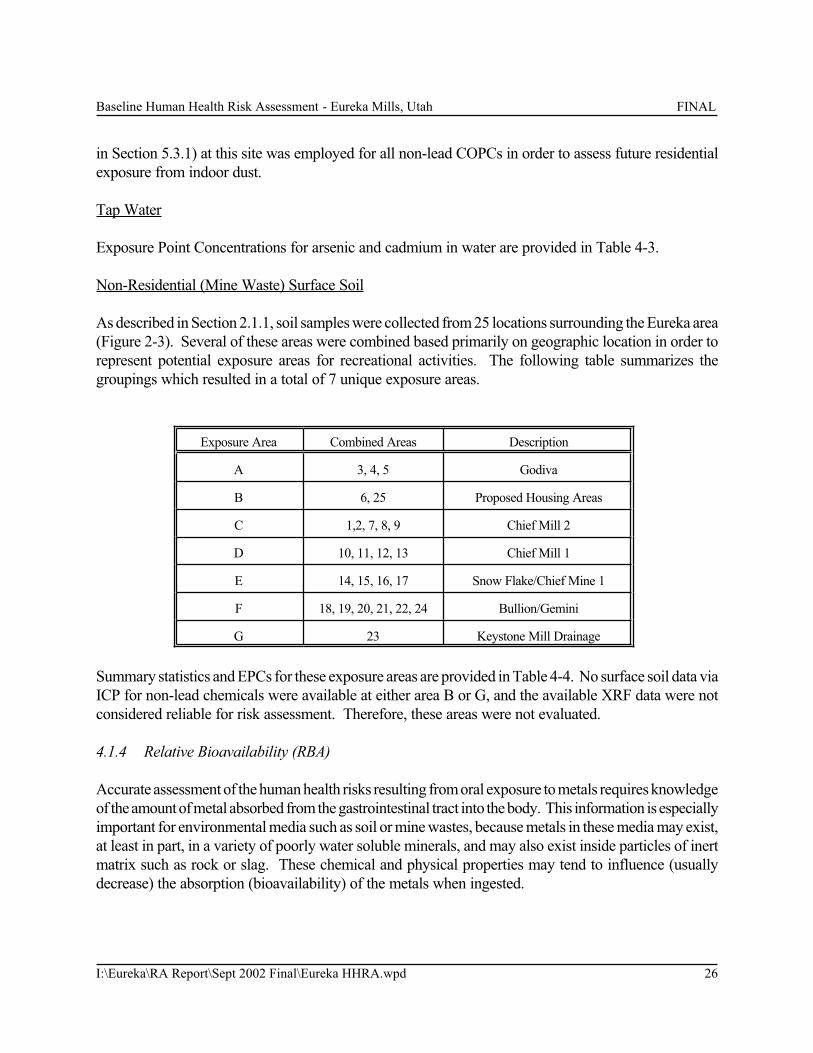
Baseline Human Health Risk Assessment - Eureka Mills, Utah FINAL
I:\Eureka\RA Report\Sept 2002 Final\Eureka HHRA.wpd 26
in Section 5.3.1) at this site was employed for all non-lead COPCs in order to assess future residential
exposure from indoor dust.
Tap Water
Exposure Point Concentrations for arsenic and cadmium in water are provided in Table 4-3.
Non-Residential (Mine Waste) Surface Soil
As described in Section 2.1.1, soil samples were collected from 25 locations surrounding the Eureka area
(Figure 2-3). Several of these areas were combined based primarily on geographic location in order to
represent potential exposure areas for recreational activities. The following table summarizes the
groupings which resulted in a total of 7 unique exposure areas.
Exposure Area Combined Areas Description
A 3, 4, 5 Godiva
B 6, 25 Proposed Housing Areas
C 1,2, 7, 8, 9 Chief Mill 2
D 10, 11, 12, 13 Chief Mill 1
E 14, 15, 16, 17 Snow Flake/Chief Mine 1
F 18, 19, 20, 21, 22, 24 Bullion/Gemini
G 23 Keystone Mill Drainage
Summary statistics and EPCs for these exposure areas are provided in Table 4-4. No surface soil data via
ICP for non-lead chemicals were available at either area B or G, and the available XRF data were not
considered reliable for risk assessment. Therefore, these areas were not evaluated.
4.1.4 Relative Bioavailability (RBA)
Accurate assessment of the human health risks resulting from oral exposure to metals requires knowledge
of the amount of metal absorbed from the gastrointestinal tract into the body. This information is especially
important for environmental media such as soil or mine wastes, because metals in these media may exist,
at least in part, in a variety of poorly water soluble minerals, and may also exist inside particles of inert
matrix such as rock or slag. These chemical and physical properties may tend to influence (usually
decrease) the absorption (bioavailability) of the metals when ingested.
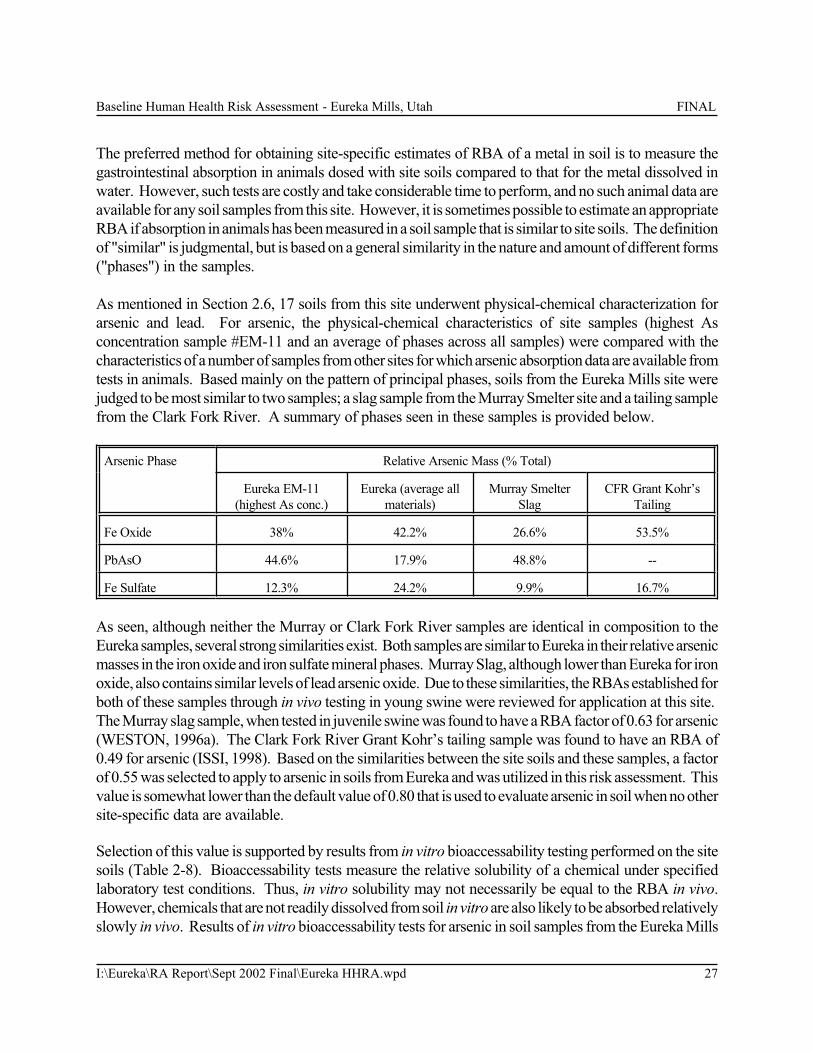
Baseline Human Health Risk Assessment - Eureka Mills, Utah FINAL
I:\Eureka\RA Report\Sept 2002 Final\Eureka HHRA.wpd 27
The preferred method for obtaining site-specific estimates of RBA of a metal in soil is to measure the
gastrointestinal absorption in animals dosed with site soils compared to that for the metal dissolved in
water. However, such tests are costly and take considerable time to perform, and no such animal data are
available for any soil samples from this site. However, it is sometimes possible to estimate an appropriate
RBA if absorption in animals has been measured in a soil sample that is similar to site soils. The definition
of "similar" is judgmental, but is based on a general similarity in the nature and amount of different forms
("phases") in the samples.
As mentioned in Section 2.6, 17 soils from this site underwent physical-chemical characterization for
arsenic and lead. For arsenic, the physical-chemical characteristics of site samples (highest As
concentration sample #EM-11 and an average of phases across all samples) were compared with the
characteristics of a number of samples from other sites for which arsenic absorption data are available from
tests in animals. Based mainly on the pattern of principal phases, soils from the Eureka Mills site were
judged to be most similar to two samples; a slag sample from the Murray Smelter site and a tailing sample
from the Clark Fork River. A summary of phases seen in these samples is provided below.
Arsenic Phase Relative Arsenic Mass (% Total)
Eureka EM-11
(highest As conc.)
Eureka (average all
materials)
Murray Smelter
Slag
CFR Grant Kohr’s
Tailing
Fe Oxide 38% 42.2% 26.6% 53.5%
PbAsO 44.6% 17.9% 48.8% --
Fe Sulfate 12.3% 24.2% 9.9% 16.7%
As seen, although neither the Murray or Clark Fork River samples are identical in composition to the
Eureka samples, several strong similarities exist. Both samples are similar to Eureka in their relative arsenic
masses in the iron oxide and iron sulfate mineral phases. Murray Slag, although lower than Eureka for iron
oxide, also contains similar levels of lead arsenic oxide. Due to these similarities, the RBAs established for
both of these samples through in vivo testing in young swine were reviewed for application at this site.
The Murray slag sample, when tested in juvenile swine was found to have a RBA factor of 0.63 for arsenic
(WESTON, 1996a). The Clark Fork River Grant Kohr’s tailing sample was found to have an RBA of
0.49 for arsenic (ISSI, 1998). Based on the similarities between the site soils and these samples, a factor
of 0.55 was selected to apply to arsenic in soils from Eureka and was utilized in this risk assessment. This
value is somewhat lower than the default value of 0.80 that is used to evaluate arsenic in soil when no other
site-specific data are available.
Selection of this value is supported by results from in vitro bioaccessability testing performed on the site
soils (Table 2-8). Bioaccessability tests measure the relative solubility of a chemical under specified
laboratory test conditions. Thus, in vitro solubility may not necessarily be equal to the RBA in vivo.
However, chemicals that are not readily dissolved from soil in vitro are also likely to be absorbed relatively
slowly in vivo. Results of in vitro bioaccessability tests for arsenic in soil samples from the Eureka Mills
Baseline Human Health Risk Assessment - Eureka Mills, Utah FINAL
I:\Eureka\RA Report\Sept 2002 Final\Eureka HHRA.wpd 28
site had a tremendous amount of variability, with a range of 0.04 to 0.42 and an average value of 0.13
(excluding the result for EM-9 which was eliminated due to a low arsenic concentration). Due to the
variability in this dataset, the range and average presented above may have little use in estimating the RBA.
However, the in vitro data do support the view that arsenic in the soil is not all readily soluble and indicate
that the RBA value of 0.55 selected for use at this site is likely to be reasonable.
Due to a lack of information regarding the bioavailability of the other COPCs, an RBA value of 1.0 was
used for each of these chemicals. For water, all COPCs were evaluated using an RBA value of 1.0. The
selection of an RBA value of 1.0 is protective because it assumes that 100% of the ingested chemicals are
absorbed. Although these chemicals may, in fact, have absorption values of less than 100%, insufficient
information is available to justify selection of a lower value.
4.2 Toxicity Assessment
The toxic effects of a chemical generally depend not only upon the inherent toxicity of the compounds and
the level of exposure (dose), but also on the route of exposure (oral, inhalation, dermal) and the duration
of exposure (subchronic, chronic or lifetime). Thus, a full description of the toxic effects of a chemical
includes a listing of what adverse health effects the chemical may cause, and how the occurrence of these
effects depend upon dose, route, and duration of exposure.
The toxicity assessment process is usually divided into two parts: the first characterizes and quantifies the
non-cancer effects of the chemical, while the second addresses the cancer effects of the chemical. This
two-part approach is employed because there are typically major differences in the time-course of action
and the shape of the dose-response curve for cancer and non-cancer effects.
Non-Cancer Effects
Essentially all chemicals can cause adverse health effects if given at a high enough dose. However, when
the dose is sufficiently low, typically no adverse effect is observed. Thus, in characterizing the non-cancer
effects of a chemical, the key parameter is the threshold dose at which an adverse effect first becomes
evident. Doses below the threshold are considered to be safe, while doses above the threshold are likely
to cause an effect.
The threshold dose is typically estimated from toxicological data (derived from studies of humans and/or
animals) by finding the highest dose that does not produce an observable adverse effect, and the lowest
dose which does produce an effect. These are referred to as the "No-observed-adverse-effect-level"
(NOAEL) and the "Lowest-observed-adverse-effect-level" (LOAEL), respectively. The threshold is
presumed to lie in the interval between the NOAEL and the LOAEL. However, in order to be
conservative (protective), non-cancer risk evaluations are not based directly on the threshold exposure
level, but on a value referred to as the Reference Dose (RfD). The RfD is an estimate (with uncertainty
spanning perhaps an order of magnitude) of a daily exposure to the human population (including sensitive
subgroups) that is likely to be without an appreciable risk of deleterious effects during a lifetime.
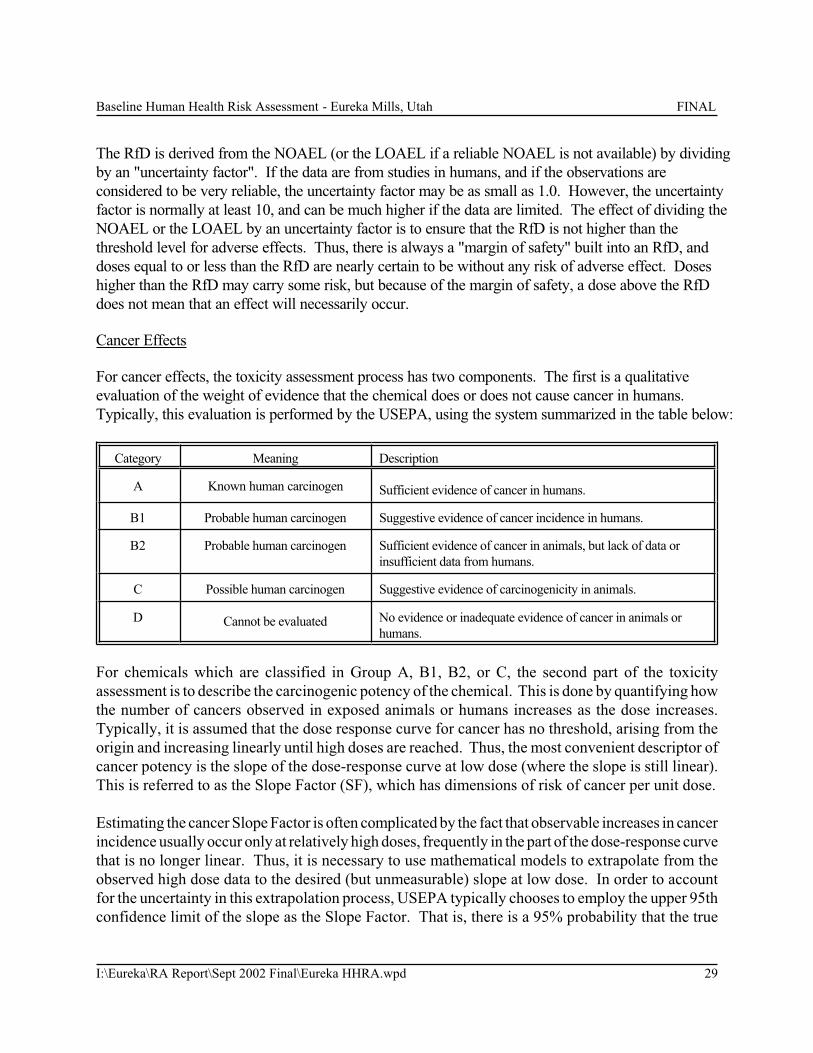
Baseline Human Health Risk Assessment - Eureka Mills, Utah FINAL
I:\Eureka\RA Report\Sept 2002 Final\Eureka HHRA.wpd 29
The RfD is derived from the NOAEL (or the LOAEL if a reliable NOAEL is not available) by dividing
by an "uncertainty factor". If the data are from studies in humans, and if the observations are
considered to be very reliable, the uncertainty factor may be as small as 1.0. However, the uncertainty
factor is normally at least 10, and can be much higher if the data are limited. The effect of dividing the
NOAEL or the LOAEL by an uncertainty factor is to ensure that the RfD is not higher than the
threshold level for adverse effects. Thus, there is always a "margin of safety" built into an RfD, and
doses equal to or less than the RfD are nearly certain to be without any risk of adverse effect. Doses
higher than the RfD may carry some risk, but because of the margin of safety, a dose above the RfD
does not mean that an effect will necessarily occur.
Cancer Effects
For cancer effects, the toxicity assessment process has two components. The first is a qualitative
evaluation of the weight of evidence that the chemical does or does not cause cancer in humans.
Typically, this evaluation is performed by the USEPA, using the system summarized in the table below:
Category Meaning Description
A Known human carcinogen Sufficient evidence of cancer in humans.
B1 Probable human carcinogen Suggestive evidence of cancer incidence in humans.
B2 Probable human carcinogen Sufficient evidence of cancer in animals, but lack of data or
insufficient data from humans.
C Possible human carcinogen Suggestive evidence of carcinogenicity in animals.
D Cannot be evaluated No evidence or inadequate evidence of cancer in animals or
humans.
For chemicals which are classified in Group A, B1, B2, or C, the second part of the toxicity
assessment is to describe the carcinogenic potency of the chemical. This is done by quantifying how
the number of cancers observed in exposed animals or humans increases as the dose increases.
Typically, it is assumed that the dose response curve for cancer has no threshold, arising from the
origin and increasing linearly until high doses are reached. Thus, the most convenient descriptor of
cancer potency is the slope of the dose-response curve at low dose (where the slope is still linear).
This is referred to as the Slope Factor (SF), which has dimensions of risk of cancer per unit dose.
Estimating the cancer Slope Factor is often complicated by the fact that observable increases in cancer
incidence usually occur only at relatively high doses, frequently in the part of the dose-response curve
that is no longer linear. Thus, it is necessary to use mathematical models to extrapolate from the
observed high dose data to the desired (but unmeasurable) slope at low dose. In order to account
for the uncertainty in this extrapolation process, USEPA typically chooses to employ the upper 95th
confidence limit of the slope as the Slope Factor. That is, there is a 95% probability that the true
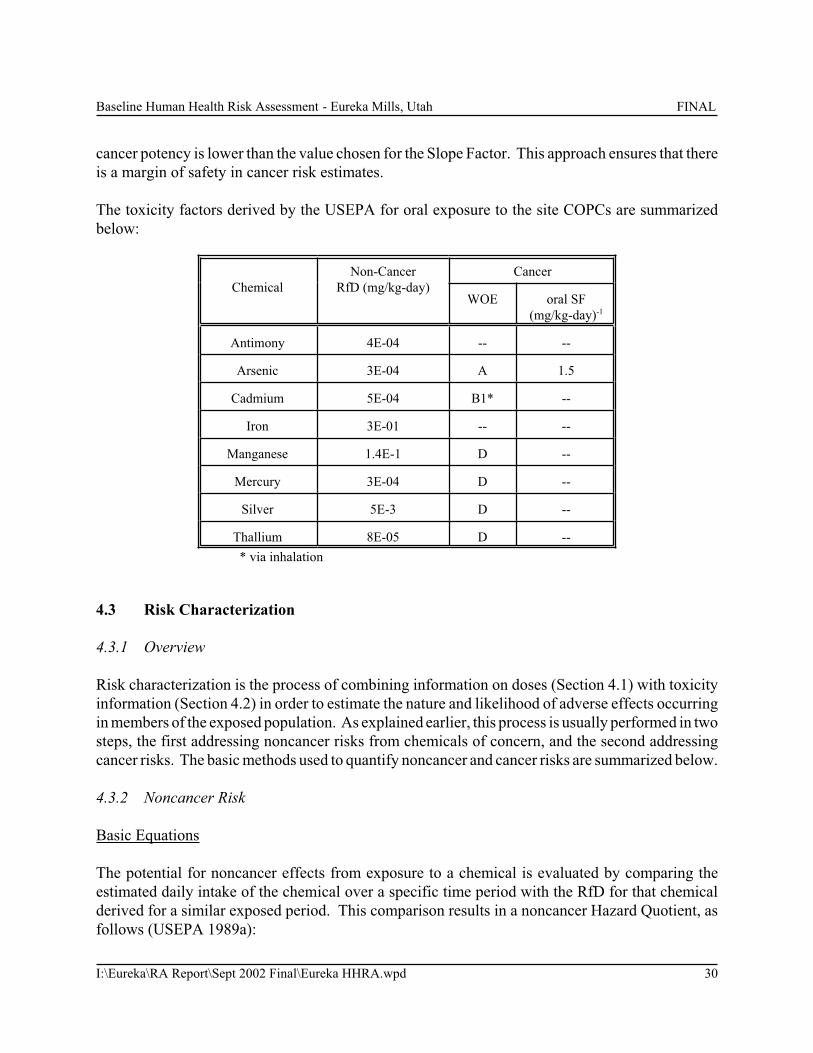
Baseline Human Health Risk Assessment - Eureka Mills, Utah FINAL
I:\Eureka\RA Report\Sept 2002 Final\Eureka HHRA.wpd 30
cancer potency is lower than the value chosen for the Slope Factor. This approach ensures that there
is a margin of safety in cancer risk estimates.
The toxicity factors derived by the USEPA for oral exposure to the site COPCs are summarized
below:
Chemical
Non-Cancer
RfD (mg/kg-day)
Cancer
WOE oral SF
(mg/kg-day)-1
Antimony 4E-04 -- --
Arsenic 3E-04 A 1.5
Cadmium 5E-04 B1* --
Iron 3E-01 -- --
Manganese 1.4E-1 D --
Mercury 3E-04 D --
Silver 5E-3 D --
Thallium 8E-05 D --
* via inhalation
4.3 Risk Characterization
4.3.1 Overview
Risk characterization is the process of combining information on doses (Section 4.1) with toxicity
information (Section 4.2) in order to estimate the nature and likelihood of adverse effects occurring
in members of the exposed population. As explained earlier, this process is usually performed in two
steps, the first addressing noncancer risks from chemicals of concern, and the second addressing
cancer risks. The basic methods used to quantify noncancer and cancer risks are summarized below.
4.3.2 Noncancer Risk
Basic Equations
The potential for noncancer effects from exposure to a chemical is evaluated by comparing the
estimated daily intake of the chemical over a specific time period with the RfD for that chemical
derived for a similar exposed period. This comparison results in a noncancer Hazard Quotient, as
follows (USEPA 1989a):
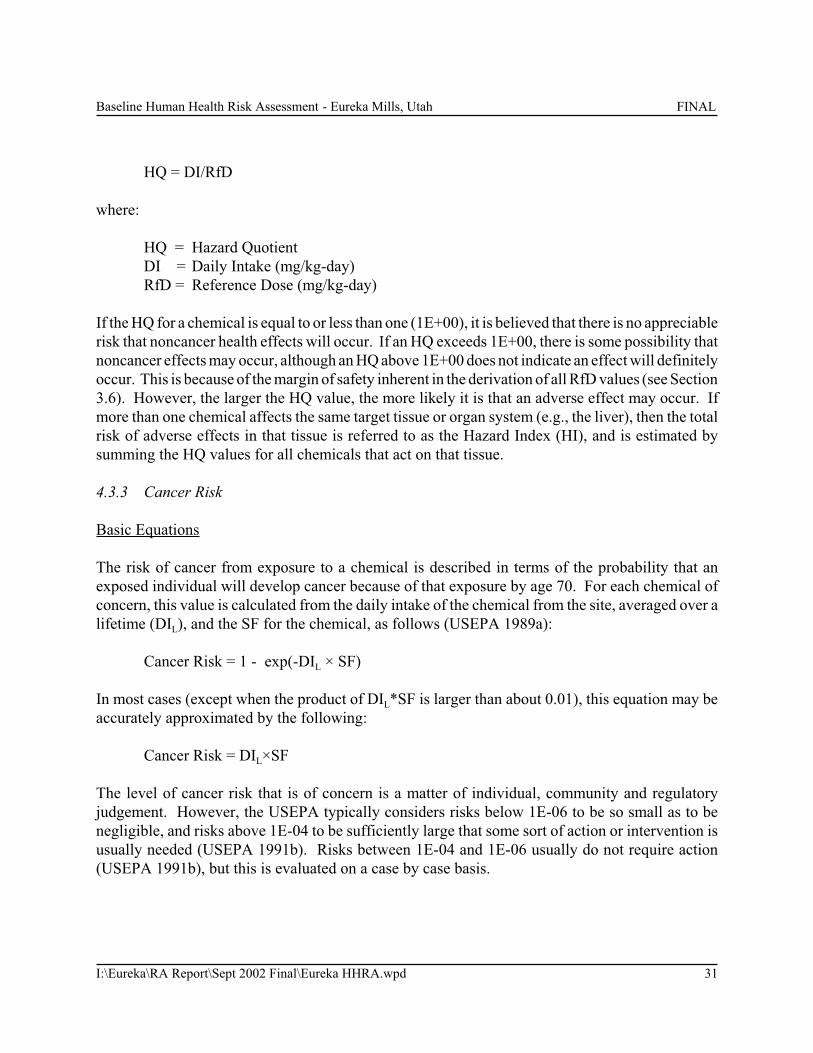
Baseline Human Health Risk Assessment - Eureka Mills, Utah FINAL
I:\Eureka\RA Report\Sept 2002 Final\Eureka HHRA.wpd 31
HQ = DI/RfD
where:
HQ = Hazard Quotient
DI = Daily Intake (mg/kg-day)
RfD = Reference Dose (mg/kg-day)
If the HQ for a chemical is equal to or less than one (1E+00), it is believed that there is no appreciable
risk that noncancer health effects will occur. If an HQ exceeds 1E+00, there is some possibility that
noncancer effects may occur, although an HQ above 1E+00 does not indicate an effect will definitely
occur. This is because of the margin of safety inherent in the derivation of all RfD values (see Section
3.6). However, the larger the HQ value, the more likely it is that an adverse effect may occur. If
more than one chemical affects the same target tissue or organ system (e.g., the liver), then the total
risk of adverse effects in that tissue is referred to as the Hazard Index (HI), and is estimated by
summing the HQ values for all chemicals that act on that tissue.
4.3.3 Cancer Risk
Basic Equations
The risk of cancer from exposure to a chemical is described in terms of the probability that an
exposed individual will develop cancer because of that exposure by age 70. For each chemical of
concern, this value is calculated from the daily intake of the chemical from the site, averaged over a
lifetime (DIL), and the SF for the chemical, as follows (USEPA 1989a):
Cancer Risk = 1 - exp(-DIL × SF)
In most cases (except when the product of DIL*SF is larger than about 0.01), this equation may be
accurately approximated by the following:
Cancer Risk = DIL×SF
The level of cancer risk that is of concern is a matter of individual, community and regulatory
judgement. However, the USEPA typically considers risks below 1E-06 to be so small as to be
negligible, and risks above 1E-04 to be sufficiently large that some sort of action or intervention is
usually needed (USEPA 1991b). Risks between 1E-04 and 1E-06 usually do not require action
(USEPA 1991b), but this is evaluated on a case by case basis.
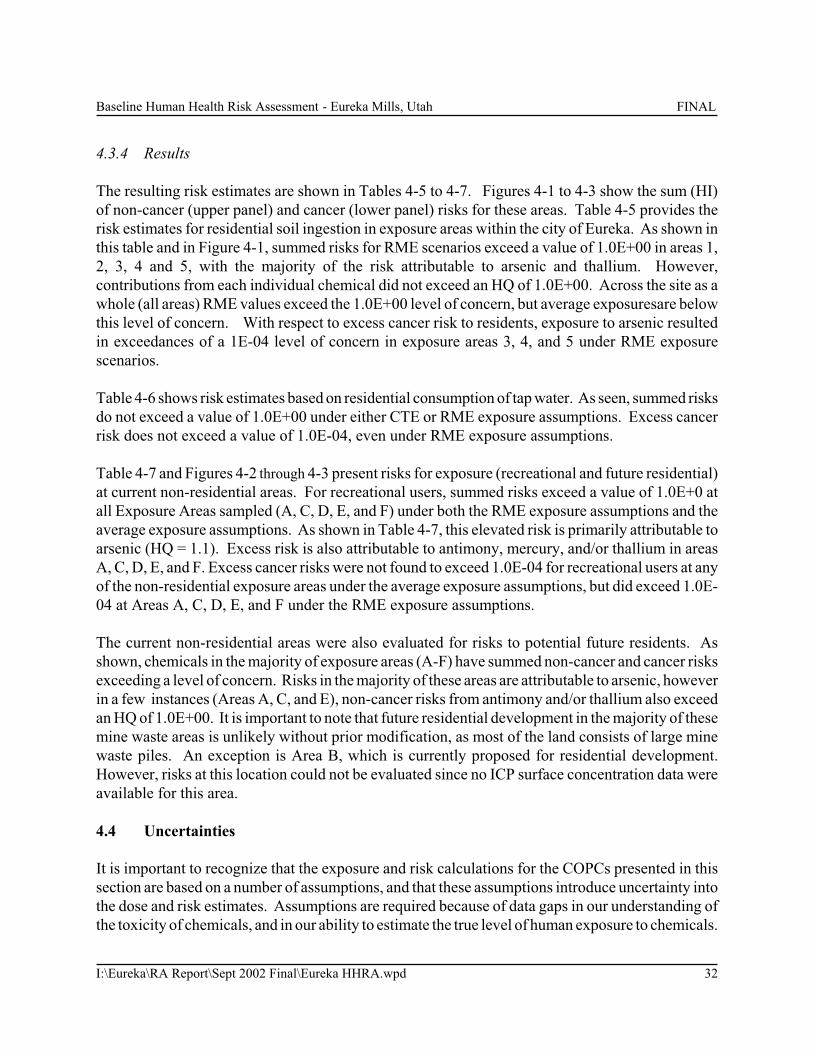
Baseline Human Health Risk Assessment - Eureka Mills, Utah FINAL
I:\Eureka\RA Report\Sept 2002 Final\Eureka HHRA.wpd 32
4.3.4 Results
The resulting risk estimates are shown in Tables 4-5 to 4-7. Figures 4-1 to 4-3 show the sum (HI)
of non-cancer (upper panel) and cancer (lower panel) risks for these areas. Table 4-5 provides the
risk estimates for residential soil ingestion in exposure areas within the city of Eureka. As shown in
this table and in Figure 4-1, summed risks for RME scenarios exceed a value of 1.0E+00 in areas 1,
2, 3, 4 and 5, with the majority of the risk attributable to arsenic and thallium. However,
contributions from each individual chemical did not exceed an HQ of 1.0E+00. Across the site as a
whole (all areas) RME values exceed the 1.0E+00 level of concern, but average exposuresare below
this level of concern. With respect to excess cancer risk to residents, exposure to arsenic resulted
in exceedances of a 1E-04 level of concern in exposure areas 3, 4, and 5 under RME exposure
scenarios.
Table 4-6 shows risk estimates based on residential consumption of tap water. As seen, summed risks
do not exceed a value of 1.0E+00 under either CTE or RME exposure assumptions. Excess cancer
risk does not exceed a value of 1.0E-04, even under RME exposure assumptions.
Table 4-7 and Figures 4-2 through 4-3 present risks for exposure (recreational and future residential)
at current non-residential areas. For recreational users, summed risks exceed a value of 1.0E+0 at
all Exposure Areas sampled (A, C, D, E, and F) under both the RME exposure assumptions and the
average exposure assumptions. As shown in Table 4-7, this elevated risk is primarily attributable to
arsenic (HQ = 1.1). Excess risk is also attributable to antimony, mercury, and/or thallium in areas
A, C, D, E, and F. Excess cancer risks were not found to exceed 1.0E-04 for recreational users at any
of the non-residential exposure areas under the average exposure assumptions, but did exceed 1.0E-
04 at Areas A, C, D, E, and F under the RME exposure assumptions.
The current non-residential areas were also evaluated for risks to potential future residents. As
shown, chemicals in the majority of exposure areas (A-F) have summed non-cancer and cancer risks
exceeding a level of concern. Risks in the majority of these areas are attributable to arsenic, however
in a few instances (Areas A, C, and E), non-cancer risks from antimony and/or thallium also exceed
an HQ of 1.0E+00. It is important to note that future residential development in the majority of these
mine waste areas is unlikely without prior modification, as most of the land consists of large mine
waste piles. An exception is Area B, which is currently proposed for residential development.
However, risks at this location could not be evaluated since no ICP surface concentration data were
available for this area.
4.4 Uncertainties
It is important to recognize that the exposure and risk calculations for the COPCs presented in this
section are based on a number of assumptions, and that these assumptions introduce uncertainty into
the dose and risk estimates. Assumptions are required because of data gaps in our understanding of
the toxicity of chemicals, and in our ability to estimate the true level of human exposure to chemicals.
Baseline Human Health Risk Assessment - Eureka Mills, Utah FINAL
I:\Eureka\RA Report\Sept 2002 Final\Eureka HHRA.wpd 33
In most cases, assumptions employed in the risk assessment process to deal with uncertainties are
intentionally conservative; that is, they are more likely to lead to an overestimate than an
underestimate of risk. It is important for risk managers and the public to take these uncertainties into
account when interpreting the risk conclusions derived for this site.
4.4.1 Uncertainties in Concentration Estimates
Evaluation of human health risk at any particular location requires accurate information on the
average concentration level of a COPC at that location. However, concentration values may vary
from sample to sample, so the USEPA recommends that the 95% upper confidence limit of the mean
be used in evaluation of both average and RME exposure and risk. This approach typically ensures
that all of the risk estimates are more likely to be high than low.
The data collected for use at this site was subject to a great deal of uncertainty surrounding true
concentration values. Based on a review of data adequacy for soils, it was determined that the XRF
data collected for non-lead COPCs (with the exception of iron) was not suitable for use in the risk
assessment. Therefore, results for the subset of samples submitted for confirmation analysis by ICP
was utilized. Although, ICP is considered to be reliable and accurate, these data represent only a
subset of the site samples. Therefore, it is possible that some locations are not adequately represented
in the risk assessment. In fact, some areas at this site could not be evaluated due to a lack of data.
Risks from exposure to non-lead COPCs were evaluated based on surficial soil data. As discussed
in Section 3.2.1, this decision was based on the depth profile observed for lead, since data for the
other analytes were insufficient to assess depth profiles. If the depth distribution for the non-lead
COPCs does in fact mimic that observed for lead, risks from exposure to subsurface soils will be
similar or less than those observed for surface soils. However, if concentrations for these analytes
are found to increase as a function of depth, the risks based on surface soil exposure will
underestimate risks for exposure to buried materials.
For dust, the future residential areas were evaluated using a ks value of 0.15, based on the ks value
for lead observed at this site. Although the true ks value for any given chemical at Eureka may fall
between a range of 0 - 1.0, it is more likely to fall on the lower end of this range. This is supported
by the lack of an observable soil-dust relationship in the current site data.
4.4.2 Uncertainties in Human Intake
As discussed in Section 3.2, there is usually wide variation between different individuals with respect
to the level of contact they may have to chemicals in the environment. This introduces uncertainty
into the most appropriate values to use for exposure parameters such as soil and dust intake rates,
number of years at the residence, etc. Because of the uncertainty in the most appropriate values for
these parameters, the USEPA generally recommends default values that are more likely to
overestimate than underestimate exposure and risk.

Baseline Human Health Risk Assessment - Eureka Mills, Utah FINAL
I:\Eureka\RA Report\Sept 2002 Final\Eureka HHRA.wpd 34
4.4.3 Uncertainties in Toxicity Values
One of the most important sources of uncertainty in a risk assessment is in the RfD values used to
evaluate noncancer risk and in the slope factors used to quantify cancer risk. In many cases, these
values are derived from a limited toxicity database, and this can result in substantial uncertainty, both
quantitatively and qualitatively. For example, there is continuing scientific debate on the accuracy
of the oral slope factor and the oral Reference Dose for arsenic and whether or not they are accurate
and appropriate for predicting hazards from relatively low dose exposures. In order to account for
these and other uncertainties associated with the evaluation of toxicity data, both RfDs and SFs are
derived by the USEPA in a way that is intentionally conservative; that is, risk estimates based on these
RfDs and SFs are more likely to be high than low.
4.4.4 Uncertainties in Absorption from Soil
Another important source of uncertainty regarding the toxicity of arsenic is the degree to which it is
absorbed into the body after ingestion of soil. Toxicity factors (RfD, oSF) for arsenic are based on
observed dose response relationships when exposure occurs by ingestion of arsenic dissolved in
water. If arsenic in soil is not absorbed as well as arsenic in water, use of unadjusted toxicity factors
will tend to overestimate risk. At this site, a relative bioavailability factor for arsenic of 0.55 was
estimated based on data from samples tested in juvenile swine that appeared to be similar in metal-
phase composition. However, use of this factor is uncertain because of possible differences between
the samples. Results of in vitro bioaccessability testing on site materials, which showed an average
value of 0.13, supported the use of a value less than the USEPA default of 0.80 for arsenic in soil.
However, this value was over three-fold lower than the value used in the risk assessment, indicating
that the true risk from arsenic at this site may be lower than estimated. If the true RBA of arsenic in
soil were 0.13, all of the risks presented in this assessment would be reduced by a factor of 0.55/0.13.
Based on this adjustment, current residential risks from arsenic would not exceed an HQ of 1E+00
or a risk level of 1E-04 at any area. Additionally, risks to recreational users in mine waste areas
would not exceed an HQ of 1E+00 or a risk level of 1E-04 at any area. Excess non-cancer risks
under a future residential scenario at the mine waste areas would be seen for average individuals at
Area E (HI = 2E+00) and for RME individuals at all areas evaluated (HI = 2E+00 to 5E+00). A
review of these non-cancer risks shows that the majority of this excess risk is attributable to arsenic,
antimony and/or thallium. Excess cancer risks (~2E-04) for hypothetical future residents from
exposure to arsenic were observed at Areas D, E and F, based on the adjustment in RBA.
4.4.5 Uncertainties from Pathways Not Evaluated
As discussed in Section 3, not all possible pathways of human exposure to site COPCs were evaluated
quantitatively in this risk assessment, and omission of these pathways presumably leads to some degree of
underestimation of total risk. For some of these pathways (inhalation of airborne dust, dermal absorption
from soil on the skin), the underestimation of risk is believed to be minimal (see Appendix C). In the case
Baseline Human Health Risk Assessment - Eureka Mills, Utah FINAL
I:\Eureka\RA Report\Sept 2002 Final\Eureka HHRA.wpd 35
of ingestion from home-grown garden vegetables, the magnitude of the underestimation is less certain.
Studies at other sites (Sverdrup, 1995) suggest that exposure by this pathways is probably not as large as
by oral exposure, but that the contribution is not completely negligible. Screening level calculations
(presented in Appendix C) reveal that the non-cancer risk from ingestion of COPCs in garden vegetables
is low (HI < 1) for both average and RME individuals. As mentioned above, these estimated risks are
likely to be higher than actual, due to limitations of the mathematical modelling. However, the magnitude
of this risk contributed by pathway is expected to vary widely from site to site, depending on the amount
of uptake from soil into plants and the amount and type of produce actually grown and consumed by area
residents.
Baseline Human Health Risk Assessment - Eureka Mills, Utah FINAL
I:\Eureka\RA Report\Sept 2002 Final\Eureka HHRA.wpd 36
5.0 RISKS FROM LEAD
As noted earlier, risks from lead are evaluated using a somewhat different approach than for most other
metals. First, because lead is widespread in the environment, exposure can occur by many different
pathways. Thus, lead risks are usually based on consideration of total exposure (all pathways) rather than
just to site-related exposures. Second, because studies of lead exposures and resultant health effects in
humans have traditionally been described in terms of blood lead level (PbB, expressed in units of ug/dL),
lead exposures and risks are typically assessed using an uptake-biokinetic model rather than an RfD
approach. Therefore, calculating the level of exposure and risk from lead in soil also requires assumptions
about the level of lead in other media, and also requires use of pharmacokinetic parameters and
assumptions that are not needed in traditional methods.
For residential land use, the sub-population of chief concern is young children. This is because young
children 1) tend to have higher exposures to lead in soil, dust and paint, 2) tend to have a higher absorption
fraction for ingested lead, and 3) are more sensitive to the toxic effects of lead than are older children or
adults. For non-residential exposures (e.g., recreation, occupational) the population of chief concern are
older children and young adults. When adults are exposed, the sub-population of chief concern is pregnant
women and women of child-bearing age, since the blood lead level of a fetus is nearly equal to the blood
lead level of the mother (Goyer 1990).
5.1 Adverse Effects of Lead Exposure
Excess exposure to lead can result in a wide variety of adverse effects in humans. Chronic low-level
exposure is usually of greater concern for young children than older children or adults. There are several
reasons for this focus on young children, including the following: 1) young children typically have higher
exposures to lead-contaminated media per unit body weight than adults, 2) young children typically have
higher lead absorption rates than adults, and 3) young children are more susceptible to effects of lead than
are adults. The following sections summarize the most characteristic and significant of the adverse effects
of lead on children, and current guidelines for classifying exposures as acceptable or unacceptable.
5.1.1 Neurological Effects
The effect of lead that is usually considered to be of greatest concern in children is impairment of the
nervous system. Many studies have shown that animals and humans are most sensitive to the effects of
lead during the time of nervous system development, and because of this, the fetus, infants and young
children (0-6 years of age) are particularly vulnerable. The effects of chronic low-level exposure on the
nervous system are subtle, and normally cannot be detected in individuals, but only in studies of groups
of children. Common measurement endpoints include various types of tests of intelligence, attention span,
hand-eye coordination, etc. Most studies observe effects in such tests at blood lead levels of 20-30 ug/dL,
and some report effects at levels as low as 10 g/dL and even lower. Such effects on the nervous system
are long-lasting and may be permanent.
Baseline Human Health Risk Assessment - Eureka Mills, Utah FINAL
I:\Eureka\RA Report\Sept 2002 Final\Eureka HHRA.wpd 37
5.1.2 Effects on Pregnancy and Fetal Development
Studies in animals reveal that high blood lead levels during pregnancy can cause fetotoxic and teratogenic
effects. Some epidemiologic studies in humans have detected an association between elevated blood lead
levels and endpoints such as decreased fetal size or weight, shortened gestation period, decreased birth
weight, congenital abnormalities, spontaneous abortion and stillbirth (USEPA 1986). However, these
effects are not detected consistently in different studies, and some researchers have detected no significant
association between blood lead levels and signs of fetotoxicity. On balance, these data provide suggestive
evidence that blood lead levels in the range of 10-15 ug/dL may cause small increases in the risk of
undesirable prenatal as well as postnatal effects, but the evidence is not definitive.
5.1.3 Effects on Heme Synthesis
A characteristic effect of chronic high lead exposure is anemia stemming from lead-induced inhibition of
heme synthesis and a decrease in red blood cell life span. ACGIH (1995) concluded that decreases in
ALA-D activity (a key early enzyme involved in heme synthesis) can be detected at blood lead levels below
10 ug/dL. Heme synthesis is inhibited not only in red blood cells but in other tissues. Several key enzymes
that contain heme, including those needed to form vitamin D, also show decreased activity following lead
exposure (USEPA 1986). The CDC (1991) reviewed studies on the synthesis of an active metabolite of
vitamin D and found that impairment was detectable at blood lead levels of 10 - 15 ug/dL.
5.1.4 Cancer Effects
Studies in animals indicate that chronic oral exposure to very high doses of lead salts may cause an
increased frequency of tumors of the kidney (USEPA 1989b, ACGIH 1995). However, there is only
limited evidence suggesting that lead may be carcinogenic in humans, and the noncarcinogenic effects on
the nervous system are usually considered to be the most important and sensitive endpoints of lead toxicity
(USEPA 1988). ACGIH (1995) states that there is insufficient evidence to classify lead as a human
carcinogen.
5.1.5 Current Guidelines for Protecting Children from Lead
It is currently difficult to identify what degree of lead exposure, if any, can be considered safe for infants
and children. As discussed above, some studies report subtle signs of lead-induced effects in children and
perhaps adults beginning at around 10 ug/dL or even lower, with population effects becoming clearer and
more definite in the range of 30-40 ug/dL. Of special concern are the claims by some researchers that
effects of lead on neurobehavioral performance, heme synthesis, and fetal development may not have a
threshold value, and that the effects are long-lasting (USEPA 1986). On the other hand, some researchers
and clinicians believe the effects that occur in children at low blood lead levels are so minor that they need
not be cause for concern.
Baseline Human Health Risk Assessment - Eureka Mills, Utah FINAL
I:\Eureka\RA Report\Sept 2002 Final\Eureka HHRA.wpd 38
After a thorough review of all the data, the USEPA identified 10 ug/dL as the concentration level at which
effects begin to occur that warrant avoidance, and has set as a goal that there should be no more than a
5% chance that a child will have a blood lead value above 10 ug/dL (USEPA 1991b). Likewise, the
Centers for Disease Control (CDC) has established a guideline of 10 ug/dL in preschool children which
is believed to prevent or minimize lead-associated cognitive deficits (CDC 1991).
5.2 Methods for Assessing Lead Risks in a Community
The health risks which lead poses to a residential population can often be investigated in two different
ways:
• Direct measurement of blood lead values in members of the population of concern.
• Measurement of lead in environmental media, and calculation of the range of risks those levels of
lead could pose to individuals or populations.
As discussed below, each of these approaches has some advantages and some limitations, and the best
assessment of lead risks incorporates the results of both types of approaches.
5.2.1 Blood Lead Monitoring
One way to investigate human health risks from lead in the environment is to measure the concentration
of lead in the blood (PbB) in randomly-selected members of the population of concern. Such data allow
comparison of site statistics (mean blood lead, percent of the population above 10 ug/dL, etc.) with
corresponding national average statistics, in order to obtain a general sense of how much impact site
contamination may have caused in the population. Further, the site statistics can be compared with health-
based objectives and guidelines in order to determine if population-based health goals are being exceeded.
In addition, blood lead studies which include reliable data on lead levels in various environmental media
(soil, dust, paint, water, food) and which obtain reliable demographics data (age, sex, race, mouthing
frequency, dietary status, etc.) can provide valuable insights into the media and exposure pathways that
are the primary sources of concern in a population. For example, an analysis of the relationship between
blood lead and lead levels in soil can help reveal how important soil is as a source of blood lead.
However, there are some important limitations to the use of blood lead measurements as the only index
of lead risk. First, care must be taken to ensure that a sufficient number of people are studied, and that
these people are a representative subset of the population of concern. Second, blood lead values in an
individual may vary as a function of time, so a single measurement may not be representative of the long-
term average value in that individual. Third, because of the variability between people in contact rates for
various media, it is expected that blood lead values will differ (either lower or higher) between individuals,
even when they are exposed under the same environmental conditions. Thus, a blood lead level that is
below a level of concern in one child living at a specific residence does not necessarily mean that some
other child who might be exposed at the same location might not have a higher (and possibly unacceptable)
blood lead level. Fourth, population-based studies are not well-suited for detecting the occurrence of
Baseline Human Health Risk Assessment - Eureka Mills, Utah FINAL
I:\Eureka\RA Report\Sept 2002 Final\Eureka HHRA.wpd 39
occasional sub-locations where risk is elevated, even if average risks are not above a level of concern.
Finally, blood lead measurements reflect exposures and risks under current site conditions and population
characteristics, which may not always be representative of past or future site conditions. For these reasons,
results from blood lead studies may not provide a complete description of the range of risks which different
members of a population might experience.
5.2.2 Modeling Approaches
Because of the limitations in the direct measurement approach, it is often useful to employ mathematical
models as well as empirical methods for evaluation of lead risk. These models can then be used to assess
the risks from lead under conditions which cannot be measured (e.g., risks to hypothetical future people
in areas where there are no current exposures), to identify which exposure pathways are likely to be
contributing the largest risk to a population, and to evaluate the likely efficacy of various remedial
alternatives.
The standard model developed by the USEPA to assess the risks of lead exposure in residential children
is referred to as the Integrated Exposure Uptake and Biokinetic (IEUBK) model. This model requires as
input data on the levels of lead in various environmental media at a specific location, and on the amount
of these media contacted by a child living at that location. The inputs to the IEUBK model are selected
to reflect estimates of central tendency values (i.e., arithmetic means or medians). These estimated inputs
are used to calculate an estimate of the central tendency (the geometric mean) of the distribution of blood
lead values that might occur in a population of children exposed to the specified conditions. Assuming the
distribution is lognormal, and given (as input) an estimate of the variability between different children (this
is specified by the geometric standard deviation or GSD), the model calculates the expected distribution
of blood lead values, and estimates the probability that any random child might have a blood lead value
over 10 ug/dL.
USEPA Region 8 has been working to develop a variation of the IEUBK model in which variability in
exposure between people and between locations is accounted for by using Probability Density Functions
(PDFs) to specify inputs (rather than point estimates). This probabilistic model is referred to as the
Integrated Stochastic Exposure (ISE) model for lead (SRC 1999). Because the model has not undergone
a full peer review or validation, it is considered to be only an investigative tool. Nevertheless, the ISE
model does offer an alternative means of assessing exposure and risk from lead at the site, as discussed in
the uncertainty section of this chapter.
Limitations to Modeling
All predictive models, including the IEUBK model and the ISE model, are subject to a number of
limitations. First, there is inherent difficulty in providing the models with reliable estimates of human
exposure to lead-contaminated media. For example, exposure to soil and dust is difficult to quantify
because human intake of these media is likely to be highly variable, and it is very difficult to derive accurate
measurements of actual intake rates. Second, it is often difficult to obtain reliable estimates of key
Baseline Human Health Risk Assessment - Eureka Mills, Utah FINAL
I:\Eureka\RA Report\Sept 2002 Final\Eureka HHRA.wpd 40
pharmacokinetic parameters in humans (e.g., absorption fraction, distribution and clearance rates), since
direct observations in humans are limited. Finally, the absorption, distribution and clearance of lead in the
human body is an extremely complicated process, and any mathematical model intended to simulate the
actual processes is likely to be an over-simplification. Consequently, model calculations and predictions
are generally rather uncertain.
5.2.3 Weight-of-Evidence Evaluation
As the discussions above make clear, there are advantages and limitations to both the direct blood
measurement approach and the predictive (mathematical modeling) approach. Therefore, when data are
available to perform both types of analysis, the most appropriate means for evaluating risks from lead is
to weigh the results of both analyses, taking into account the uncertainties and limitations of each. Final
conclusions regarding current and future risk should thus be based on a balanced assessment of information
from all sources.
5.3 Modeling of Lead Risk
5.3.1 Evaluation of Lead Risks to Current and Future Residents
The IEUBK model is recommended by the USEPA for use in the evaluation of risks from lead exposure
in children on a property-by-property basis. A detailed printout of the input values used to evaluate lead
risks at each property is presented in Appendix D. The following sections summarize the input parameters
used for these calculations.
Lead Concentration in Soil
The XRF data sets (Data set #1 and #2) were used to evaluate risks from lead in surface soils. Prior to
use, these data sets required adjustment to account for the discrepancy between reported XRF and ICP
analyses. Based on the best-fit linear regression for the combined data sets (Figure 5-1), the following
equation was used to adjust the data.
Adj[Pb] = 1.49*XRF[Pb] (R2 = 0.942)
Lead concentrations in yard soils were evaluated by calculating the average surface soil concentration at
each unique residential property using the adjusted lead data set. A total of 505 properties were evaluated.
In addition to the current residential properties, lead concentrations at 25 non-residential properties (see
Figure 2-3) were evaluated for risks to hypothetical future children residing in these areas. Lead
concentrations averaged at each of these mine waste properties are summarized in Table 5-1.
Baseline Human Health Risk Assessment - Eureka Mills, Utah FINAL
I:\Eureka\RA Report\Sept 2002 Final\Eureka HHRA.wpd 41
Lead Concentration in Indoor Dust
Concentrations of lead in dust at a property can be estimated from the measured level of lead in soil at the
property using a site-specific soil-dust relationship. To obtain this relationship, the average soil
concentration (based on the adjusted XRF data) for a property was plotted against the average dust
concentration (measured by ICP) at that same property fit to an equation of the format:
Cd = slope*Cs + intercept
Where:
Cd = Average Concentration in Dust (mg/kg)
Cs = Average Concentration in Soil (mg/kg)
Figure 5-2 presents the site-specific soil-dust relationship for lead at this site, as described by the following
equation:
Cd = 0.15*Cs + 458 (R2 = 0.229)
This relationship was also assumed to apply to evaluation of the current non-residential areas for future
residential exposures. According to this equation, approximately 458 milligrams of lead per kilogram of
indoor dust is coming from sources other than the yard. This indicates that an additional source of lead
(e.g., paint) at these residences could be contributing significantly to indoor lead concentrations. However,
due to the relatively poor fit (R2 = 0.229) of the soil/dust relationship, the true intercept of this regression
is uncertain.
Water and Air
For this analysis, lead concentrations in water at each property were assigned a value of 2.8 ug/L. This
is equivalent to the average lead concentration measured in tap water at this site. Lead values for air were
kept at the IEUBK default value of 0.1 ug/m3.
Diet
The default values of lead intake from the diet in the IEUBK model are based on dietary data from 1982
- 1988. Recent FDA data provide strong evidence that concentrations of lead in food have continued to
decline since 1988. Based on interpretations of the data, and an extrapolation from the downward trend
observed in the 1980's, it has been estimated that the average lead intake from food by children has
declined by approximately 30% (Griffin et al., 1999b). Therefore the dietary values were obtained by
multiplying the model default values by a factor of 0.70. The resulting values are presented below:
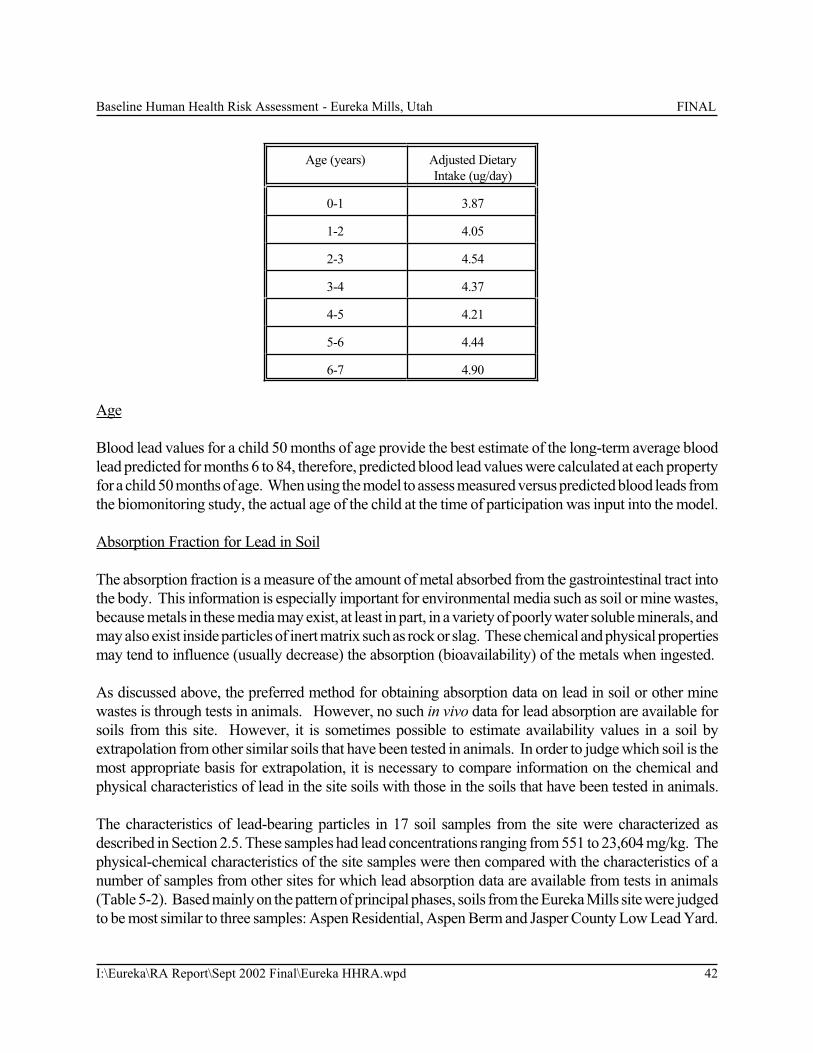
Baseline Human Health Risk Assessment - Eureka Mills, Utah FINAL
I:\Eureka\RA Report\Sept 2002 Final\Eureka HHRA.wpd 42
Age (years) Adjusted Dietary
Intake (ug/day)
0-1 3.87
1-2 4.05
2-3 4.54
3-4 4.37
4-5 4.21
5-6 4.44
6-7 4.90
Age
Blood lead values for a child 50 months of age provide the best estimate of the long-term average blood
lead predicted for months 6 to 84, therefore, predicted blood lead values were calculated at each property
for a child 50 months of age. When using the model to assess measured versus predicted blood leads from
the biomonitoring study, the actual age of the child at the time of participation was input into the model.
Absorption Fraction for Lead in Soil
The absorption fraction is a measure of the amount of metal absorbed from the gastrointestinal tract into
the body. This information is especially important for environmental media such as soil or mine wastes,
because metals in these media may exist, at least in part, in a variety of poorly water soluble minerals, and
may also exist inside particles of inert matrix such as rock or slag. These chemical and physical properties
may tend to influence (usually decrease) the absorption (bioavailability) of the metals when ingested.
As discussed above, the preferred method for obtaining absorption data on lead in soil or other mine
wastes is through tests in animals. However, no such in vivo data for lead absorption are available for
soils from this site. However, it is sometimes possible to estimate availability values in a soil by
extrapolation from other similar soils that have been tested in animals. In order to judge which soil is the
most appropriate basis for extrapolation, it is necessary to compare information on the chemical and
physical characteristics of lead in the site soils with those in the soils that have been tested in animals.
The characteristics of lead-bearing particles in 17 soil samples from the site were characterized as
described in Section 2.5. These samples had lead concentrations ranging from 551 to 23,604 mg/kg. The
physical-chemical characteristics of the site samples were then compared with the characteristics of a
number of samples from other sites for which lead absorption data are available from tests in animals
(Table 5-2). Based mainly on the pattern of principal phases, soils from the Eureka Mills site were judged
to be most similar to three samples: Aspen Residential, Aspen Berm and Jasper County Low Lead Yard.
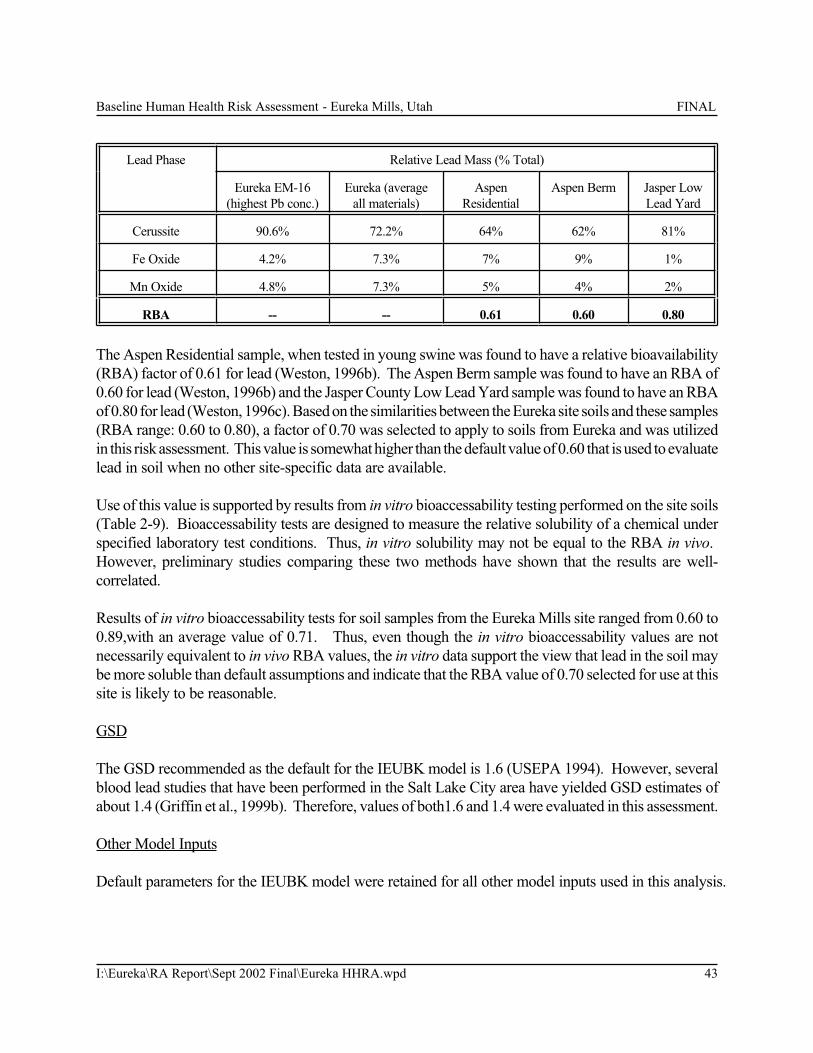
Baseline Human Health Risk Assessment - Eureka Mills, Utah FINAL
I:\Eureka\RA Report\Sept 2002 Final\Eureka HHRA.wpd 43
Lead Phase Relative Lead Mass (% Total)
Eureka EM-16
(highest Pb conc.)
Eureka (average
all materials)
Aspen
Residential
Aspen Berm Jasper Low
Lead Yard
Cerussite 90.6% 72.2% 64% 62% 81%
Fe Oxide 4.2% 7.3% 7% 9% 1%
Mn Oxide 4.8% 7.3% 5% 4% 2%
RBA -- -- 0.61 0.60 0.80
The Aspen Residential sample, when tested in young swine was found to have a relative bioavailability
(RBA) factor of 0.61 for lead (Weston, 1996b). The Aspen Berm sample was found to have an RBA of
0.60 for lead (Weston, 1996b) and the Jasper County Low Lead Yard sample was found to have an RBA
of 0.80 for lead (Weston, 1996c). Based on the similarities between the Eureka site soils and these samples
(RBA range: 0.60 to 0.80), a factor of 0.70 was selected to apply to soils from Eureka and was utilized
in this risk assessment. This value is somewhat higher than the default value of 0.60 that is used to evaluate
lead in soil when no other site-specific data are available.
Use of this value is supported by results from in vitro bioaccessability testing performed on the site soils
(Table 2-9). Bioaccessability tests are designed to measure the relative solubility of a chemical under
specified laboratory test conditions. Thus, in vitro solubility may not be equal to the RBA in vivo.
However, preliminary studies comparing these two methods have shown that the results are well-
correlated.
Results of in vitro bioaccessability tests for soil samples from the Eureka Mills site ranged from 0.60 to
0.89,with an average value of 0.71. Thus, even though the in vitro bioaccessability values are not
necessarily equivalent to in vivo RBA values, the in vitro data support the view that lead in the soil may
be more soluble than default assumptions and indicate that the RBA value of 0.70 selected for use at this
site is likely to be reasonable.
GSD
The GSD recommended as the default for the IEUBK model is 1.6 (USEPA 1994). However, several
blood lead studies that have been performed in the Salt Lake City area have yielded GSD estimates of
about 1.4 (Griffin et al., 1999b). Therefore, values of both1.6 and 1.4 were evaluated in this assessment.
Other Model Inputs
Default parameters for the IEUBK model were retained for all other model inputs used in this analysis.
Baseline Human Health Risk Assessment - Eureka Mills, Utah FINAL
I:\Eureka\RA Report\Sept 2002 Final\Eureka HHRA.wpd 44
Results - Current Residential Risk Evaluation
The IEUBK model was used to evaluate the distribution of blood lead values that would be expected in
a population of children living at a specific location, in order to judge whether the risks to any random child
living at that location are within health based goals. This model was run for each residence within Eureka
for which environmental data were collected (N=505) to estimate a predicted geometric mean (GM) blood
lead level and the probability of exceeding a blood lead value of 10 ug/dL. For convenience, the
probability of exceeding 10 ug/dL is referred to as “P10".
The results are shown in Figure 5-3, and summary statistics are presented in Table 5-3. Inspection of
Figure 5-3 (upper panel) reveals that GM values are predicted to range from 5.1 to 47 ug/dL, with
relatively little difference observed across exposure areas. Based on a GSD of 1.6 (default), PbB95 values
(95th Percentile Blood Lead) (middle panel) are predicted to range from 11 to 101 ug/dL, with a
community wide average of 33 ug/dL. Based on this, 100% of all properties are above EPA’s health-based
goal (P10 < 5%), and the predicted incidence of children with blood lead levels greater than 10 ug/dL is
69%. Even if a lower GSD of 1.4 is assumed (lower panel), the risks of elevated blood lead levels still
exceed EPA’s target at most properties, with a predicted incidence of 99%. These results indicate that risk
to children from lead is likely to be well above EPA’s health-based goal in nearly all locations at this site.
Results - Future Residential Risk Evaluation
Using the average soil lead concentrations presented in Table 5-1, the IEUBK model was run to determine
predicted geometric mean blood lead levels for future residential children who might reside at one of the
non-residential areas. Findings for this evaluation are presented in Table 5-4. Across all areas, the average
predicted geometric mean blood lead concentration was 33.4 ug/dL (range 6 - 81.5 ug/dL). Regardless
of the GSD used (1.4 or 1.6), all properties (100%) were found to have P10 values exceeding 5%,
including those areas targeted for potential future development (Areas 6 & 25). Using a GSD of 1.6, these
P10 values ranged from 16% to 100% (average 91%), whereas with a GSD of 1.4 a range of 8% to 100%
(average 92%) was observed.
5.3.2 Evaluation of Lead Risks to Recreational Teenagers
The IEUBK model developed by EPA is intended for evaluation of lead risks to residential children, and
is not appropriate for evaluation of lead risks to older children or adults exposed during recreational
activities. However, there are several mathematical models which have been proposed for evaluating lead
exposure in adults, including those developed by Bowers et al. (1994), O'Flaherty (1993), Leggett (1993),
and the State of California (CEPA 1992). Of these, the biokinetic slope factor approach described by
Bowers et al. has been identified by EPA's Technical Workgroup for Lead (USEPA 1996) as a reasonable
interim methodology for assessing risks to adults from exposure to lead and for establishing risk-based
concentration goals that will protect older children and adults from lead. For this reason, this method was
used for estimating soil lead and tailings lead levels that could be of concern to older children and adults
at this site.
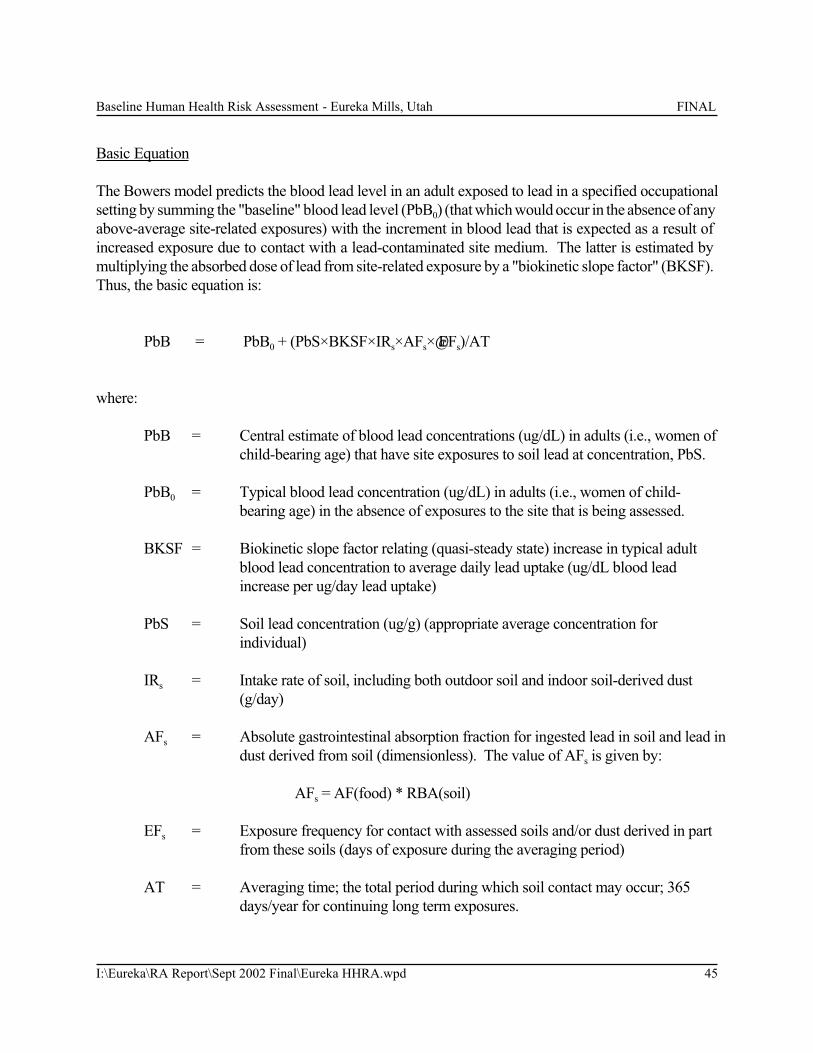
Baseline Human Health Risk Assessment - Eureka Mills, Utah FINAL
I:\Eureka\RA Report\Sept 2002 Final\Eureka HHRA.wpd 45
Basic Equation
The Bowers model predicts the blood lead level in an adult exposed to lead in a specified occupational
setting by summing the "baseline" blood lead level (PbB0) (that which would occur in the absence of any
above-average site-related exposures) with the increment in blood lead that is expected as a result of
increased exposure due to contact with a lead-contaminated site medium. The latter is estimated by
multiplying the absorbed dose of lead from site-related exposure by a "biokinetic slope factor" (BKSF).
Thus, the basic equation is:
PbB = PbB0 + (PbS×BKSF×IRs×AFs× EFs)/AT
where:
PbB = Central estimate of blood lead concentrations (ug/dL) in adults (i.e., women of
child-bearing age) that have site exposures to soil lead at concentration, PbS.
PbB0 = Typical blood lead concentration (ug/dL) in adults (i.e., women of child-
bearing age) in the absence of exposures to the site that is being assessed.
BKSF = Biokinetic slope factor relating (quasi-steady state) increase in typical adult
blood lead concentration to average daily lead uptake (ug/dL blood lead
increase per ug/day lead uptake)
PbS = Soil lead concentration (ug/g) (appropriate average concentration for
individual)
IRs = Intake rate of soil, including both outdoor soil and indoor soil-derived dust
(g/day)
AFs = Absolute gastrointestinal absorption fraction for ingested lead in soil and lead in
dust derived from soil (dimensionless). The value of AFs is given by:
AFs = AF(food) * RBA(soil)
EFs = Exposure frequency for contact with assessed soils and/or dust derived in part
from these soils (days of exposure during the averaging period)
AT = Averaging time; the total period during which soil contact may occur; 365
days/year for continuing long term exposures.
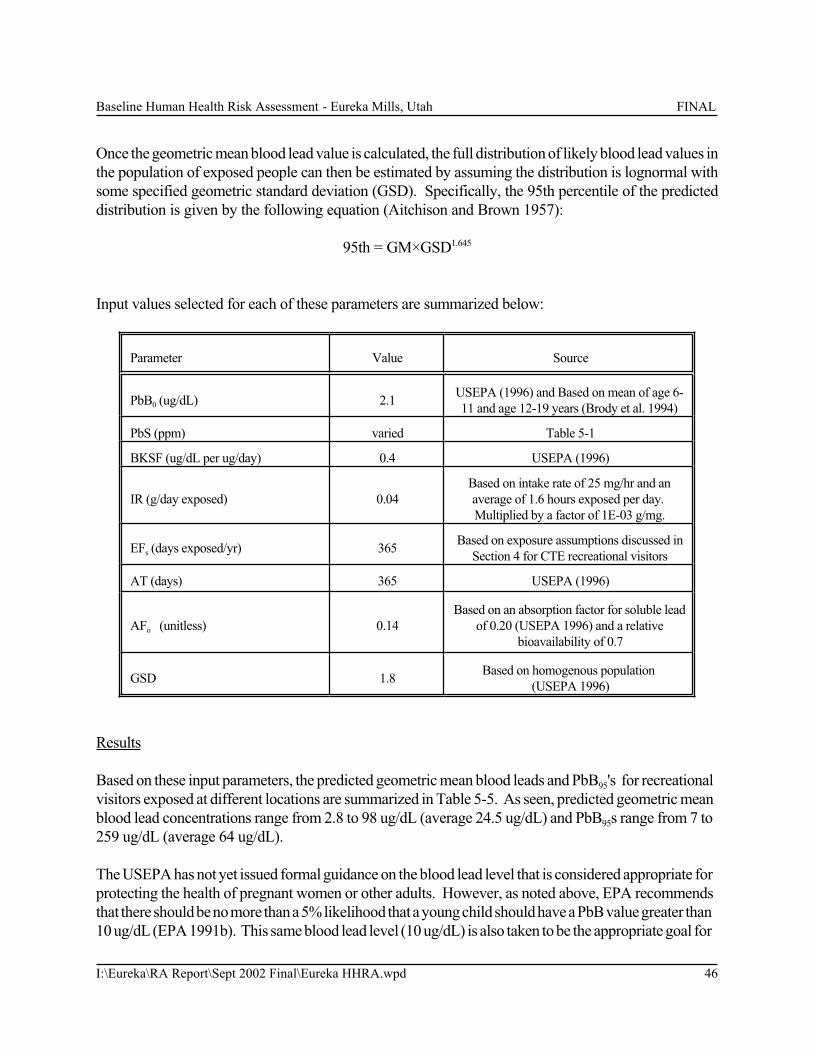
Baseline Human Health Risk Assessment - Eureka Mills, Utah FINAL
I:\Eureka\RA Report\Sept 2002 Final\Eureka HHRA.wpd 46
Once the geometric mean blood lead value is calculated, the full distribution of likely blood lead values in
the population of exposed people can then be estimated by assuming the distribution is lognormal with
some specified geometric standard deviation (GSD). Specifically, the 95th percentile of the predicted
distribution is given by the following equation (Aitchison and Brown 1957):
95th = GM×GSD1.645
Input values selected for each of these parameters are summarized below:
Parameter Value Source
PbB0 (ug/dL) 2.1USEPA (1996) and Based on mean of age 6-
11 and age 12-19 years (Brody et al. 1994)
PbS (ppm) varied Table 5-1
BKSF (ug/dL per ug/day) 0.4 USEPA (1996)
IR (g/day exposed) 0.04
Based on intake rate of 25 mg/hr and an
average of 1.6 hours exposed per day.
Multiplied by a factor of 1E-03 g/mg.
EFs (days exposed/yr) 365Based on exposure assumptions discussed in
Section 4 for CTE recreational visitors
AT (days) 365 USEPA (1996)
AFo (unitless) 0.14
Based on an absorption factor for soluble lead
of 0.20 (USEPA 1996) and a relative
bioavailability of 0.7
GSD 1.8Based on homogenous population
(USEPA 1996)
Results
Based on these input parameters, the predicted geometric mean blood leads and PbB95's for recreational
visitors exposed at different locations are summarized in Table 5-5. As seen, predicted geometric mean
blood lead concentrations range from 2.8 to 98 ug/dL (average 24.5 ug/dL) and PbB95s range from 7 to
259 ug/dL (average 64 ug/dL).
The USEPA has not yet issued formal guidance on the blood lead level that is considered appropriate for
protecting the health of pregnant women or other adults. However, as noted above, EPA recommends
that there should be no more than a 5% likelihood that a young child should have a PbB value greater than
10 ug/dL (EPA 1991b). This same blood lead level (10 ug/dL) is also taken to be the appropriate goal for
Baseline Human Health Risk Assessment - Eureka Mills, Utah FINAL
I:\Eureka\RA Report\Sept 2002 Final\Eureka HHRA.wpd 47
blood lead levels in the fetus, and hence in pregnant women and women of child-bearing age. Therefore,
the health criterion selected for use in this evaluation is that there should be no more than a 5% chance that
the blood level of a fetus will be above 10 ug/dL. This health goal is equivalent to specifying that the 95th
percentile of the PbB distribution in fetuses does not exceed 10 ug/dL:
PbB95fetal 10 ug/dL
The relationship between fetal and maternal blood lead concentration has been investigated in a number
of studies. Goyer (1990) reviewed a number of these studies, and concluded that there was no significant
placental/fetal barrier for lead, with fetal blood lead values being equal to or just slightly less than maternal
blood lead values. The mean ratio of fetal PbB to maternal PbB in three recent studies cited by Goyer was
0.90. Based on this, the 95th percentile PbB in the mother is then:
PbB95maternal = 10/0.90 = 11.1 ug/dL.
That is, the target blood lead level for pregnant women is estimated to be 11.1 ug/dL. Even though
individuals in the recreational population are assumed to be mainly age 9-15, it is possible that women of
child-bearing age may also be included in this group, so the same target blood lead value is assumed to
apply to this population as well.
A comparison of the 95th percentile blood lead levels predicted for site visitors shows that recreational use
at 22 of 24 properties may result in blood lead levels which exceed a target concentration of 11.1 ug/dL.
This shows that several of these areas could pose a risk of elevated blood lead levels to teenage
recreational visitors.
5.4 Direct Blood Lead Observations
5.4.1 Overview of Available Data
In June and July of 2000, the Central Utah Public Health Department (CUPHD) offered blood lead testing
to children living in Eureka. Nineteen children under age 18 participated. Of these, 11 were found to have
blood lead levels greater than 10 ug/dL. Based on these findings, the Environmental Epidemiology
Program (EEP) at the Utah Department of Health petitioned ATSDR to fund an exposure investigation
in Eureka. This study was performed in September and October of 2000 and blood lead testing was
offered to all residents of Eureka. Participants were asked to complete surveys designed to identify
potential sources of lead exposure.
During the year 2000, a total of blood samples were collected from Eureka residents. Of these
participants, thirty-five (~15%) were found to have elevated blood lead levels (> 10 ug/dL). The results
are summarized in Table 5-6, stratified by age. In most cases, only one blood lead value is available for
each child. When more than one blood lead value was available, the first value was employed to calculate
the statistics.
Baseline Human Health Risk Assessment - Eureka Mills, Utah FINAL
I:\Eureka\RA Report\Sept 2002 Final\Eureka HHRA.wpd 48
Follow up blood lead samples were collected from 32 of the 35 residents with elevated PbB values. These
follow-up samples were collected 1-4 months after they were initially sampled. Overall, blood lead levels
were found to decrease in the follow up sampling, however, levels remained elevated (>10 ug/dL) for 16
(50%) of these individuals.
Table 5-6 also compares the blood lead statistics for children living in Eureka with those for children across
the United States who were studied in the third National Health and Nutrition Examination Study
(NHANES III) over the time period 1988-1991 (Brody et al. 1994, Pirkle et al. 1994). In general, it is
important to use caution in comparing national statistics with observations at a particular site. This is
because there are so many independent variables that influence blood lead (age, race, sex, diet,
socioeconomic status, environmental levels, time trends, etc.) that it is difficult to properly control for all
fo the confounders. Nevertheless, comparisons of site data with national data do allow for a rough
evaluation of site exposure levels with those in approximately similar groups of people across the nation.
As seen, geometric mean blood lead levels in children (0 - 19 years) in Eureka in 2000 (3.1 to 9.1 ug/dL)
are higher than the corresponding national geometric mean blood lead values (1.6 to 4.1 ug/dL).
5.4.2 Correlation of Blood Lead Values with Environmental Lead
During this study, 174 individuals consented to the use of their blood lead data to investigate the
relationship between measured blood lead levels and the occurrence of lead in soil and other media. This
relationship was investigated by plotting blood lead versus lead levels in soil and other potential sources,
and calculating the best fit linear regression. Figure 5-4 shows the relationship between blood lead and soil
lead concentrations in residential soil for all participants and for children 0-6 years of age. In addition to
comparing blood lead to yard soils, this measurement was compared graphically to larger exposure areas
(Figure 5-5). Figure 5-6 shows the comparison between dust concentration and blood lead as well as the
comparison between dust loading and blood lead for all participants and for children 0-6 years of age. A
comparison of paint concentration to blood lead for all participants and for children 0-6 years of age is
shown in Figures 5-7 to 5-8.
Inspection of these figures reveals that there is no clear trend between blood lead and environmental lead
concentrations or loading in residential soils, dust or paint. There appears to be substantial variability in
blood lead values. High blood lead concentrations occur at both low and high environmental lead levels
and low blood lead concentrations occur at both low and high environmental lead levels. This emphasizes
that blood lead is a complex function of many variables, and soil lead concentrations alone are not the
principle determinant.
5.4.3 Other Potential Determinants of Blood Lead
In addition to site-specific lead levels (i.e., soil, dust, paint, etc.), there are a number of other independent
variables that may be important determinants of blood lead, including age, sex, mouthing habits, diet,
socioeconomic status, exposure to tobacco smoke, etc. Limited data on some of these parameters were
collected as part of surveys completed by study participants. A total of 174 of the 227 individuals in the
Baseline Human Health Risk Assessment - Eureka Mills, Utah FINAL
I:\Eureka\RA Report\Sept 2002 Final\Eureka HHRA.wpd 49
blood lead study consented to have identifying information released to USEPA for analysis of demographic
and behavioral factors which could contribute to elevated blood lead levels. Forty-seven of these
individuals were children ages 0-6. This data set was analyzed to determine if any other factors could be
identified as being important determinants of blood lead levels in children. The resulting numbers presented
in this report may not be equal to those summarized in the report prepared by UDOH, due to different data
access agreements.
Figure 5-9 shows a plot of blood lead versus age for all study participants and for children, 0-6 years. As
seen, there appears to be a slight decreasing trend in blood lead concentrations with age over all
participants. The majority of the individuals with elevated blood leads (blood lead concentrations > 10
ug/dL) appear to be children, 0-13 years. A separate graph examines the blood lead versus age for
children, 0-6 years. Based on this plot, there does not appear to be any trend in blood lead levels for
children in this age bracket.
Other potential determinants of blood lead were investigated by evaluating the differences in blood lead
levels between individuals based on their responses for each of the survey question parameters that might
be important. The results are shown in Table 5-7. As seen, there was a significant difference (P<0.05) in
blood lead levels of respondents for 7 survey question parameters: family member participating in lead
battery work or ceramic painting activities, household tobacco use, and symptoms of weight loss,
constipation and trouble sleeping in children. However, for all parameters except household tobacco use,
this finding is based on a relatively small sample size (N= 2 to 4) for positive respondents. In contrast,
the difference observed based on household tobacco use had a larger comparison population (N = 12),
suggesting that exposure to tobacco smoke in the home may be an important influence on child blood lead
levels.
5.4.4 Uncertainties Regarding Associations with Blood Lead Levels
The lack of statistically significant correlations between environmental media and blood lead levels does
not imply that the lead in soil is not associated with the elevated blood lead levels seen in Eureka.
Individual behavioral factors may strongly influence exposure to contaminated media, such as soil, resulting
in differential intakes and blood lead levels. The existing data may not adequately allow us to understand
those interactions and resulting consequences.
5.5 Weight of Evidence Evaluation
As noted above, evaluation of lead risks can be performed using either a modeling approach or direct
observations. Because both of these approaches have advantages and limitations, it is important to
compare and contrast the results of each approach.
One way to determine if the IEUBK model and measured blood lead concentrations are in agreement is
to compare predicted blood lead values with measured values for individuals who participated in the
biomonitoring study. To this end, the IEUBK model was used to calculate a predicted blood lead value
Baseline Human Health Risk Assessment - Eureka Mills, Utah FINAL
I:\Eureka\RA Report\Sept 2002 Final\Eureka HHRA.wpd 50
for each participating child less than 72 months of age (N=59), based on the IEUBK model input
parameters described above, with the exception of using measured ages and environmental data where
available. Results are shown in Figure 5-10 and summarized in Table 5-8. As seen in this figure, the model
does not accurately predict values similar to those observed in children from this site. Predicted values did
not consistently over-or underestimate the observed values for this site, rather the pattern appears to be
highly variable.
In order to investigate the discrepancy between the observed blood lead concentrations in children and the
values predicted by the IEUBK model, the residuals (the observed value subtracted from the value
predicted by the model) was plotted against the lead concentrations in soil and dust to determine if the
model accurately accounted for these variables. Figure 5-11 shows the resulting plots. As seen by the
graphs, the IEUBK model appears to be systematically overestimating the contribution of soil and dust lead
to a child’s blood lead level.
Although the risks to lead are calculated on a property by property basis, for comparison purposes the
summary table also provides statistics based on the exposure areas used to evaluate the non-lead COPC’s.
As shown in the summary table, 20 out of 59 children (34%) were observed to have elevated blood leads
based on biomonitoring, whereas using a GSD of 1.4 or 1.6, the IEUBK model predicts that 50.3% and
50.6% of this subset of children will have elevated blood leads, respectively. Therefore, both the
measured and modeled results suggest that elevated blood leads are of concern at this site.
5.6 Uncertainties
It is important to recognize that the exposure and risk calculations presented in this document are based
on a number of assumptions, and that these assumptions introduce uncertainty into the exposure and risk
estimates. Assumptions are required because of data gaps in our understanding of the toxicity of
chemicals, and in our ability to estimate the true level of human exposure to chemicals. In most cases,
assumptions employed in the risk assessment process to deal with uncertainties are intentionally
conservative; that is, they are more likely to lead to an overestimate rather than an underestimate of risk.
It is important for risk managers and the public to take these uncertainties into account when interpreting
the risk conclusions derived for this site.
5.6.1 Uncertainty in Lead Concentration Estimates
Evaluation of human health risk at any particular location requires accurate information on the average
concentration level of a chemical present at that location. As discussed previously, soil lead concentrations
measured by XRF at each property required adjustment in order to reflect the discrepancy observed
between XRF and ICP analyses. This adjustment resulted in an increase in overall lead concentrations by
a factor of 49%. Although this adjustment introduces uncertainty into the concentration term, it is thought
that the resulting risks are more representative of true lead exposures at this site.
Baseline Human Health Risk Assessment - Eureka Mills, Utah FINAL
I:\Eureka\RA Report\Sept 2002 Final\Eureka HHRA.wpd 51
5.6.2 Uncertainty in Lead Absorption from Soil
Another important source of uncertainty regarding the risk from lead in soil is the degree of absorption
(RBA) within the gastrointestinal tract. For this risk assessment, a site-specific relative bioavailability
factor for lead of 0.70 has been applied. However, this value is not based on direct measurements, but
rather is extrapolated based on a comparison of lead phases in site soils with phases in other soils that have
been previously tested for bioavailability. This introduces uncertainty because the selected value is not
based on actual measurements for site soils. Soils are complex by nature and may have numerous
attributes which influence overall absorptions characteristics. The selection process was based on mineral
phase alone, and did not account for any other of these inherent properties. However, selection of this
value is supported by data from Eureka samples tested for in vitro bioaccessability in which the average
percent bioaccessability was estimated at 71%.
5.6.3 Uncertainty in Modeling Approach
As discussed in Section 5.2, the USEPA relies mainly on the IEUBK model to assess risks to children from
lead exposure. One of the potential limitations to this model is that the distribution of blood lead values
is based on an assumed GSD, rather than a direct evaluation of variability in exposure among different
children. As discussed in Section 5.3, in order to address this potential limitation, USEPA Region 8 has
been developing a modified version of the IEUBK model, referred to as the ISE Model for Lead. This
approach uses the same basic equations and algorithms for calculating exposure and blood lead values as
the IEUBK model, except that it uses probability distribution functions rather than point estimates as inputs
for a number of exposure parameters. These distributions are combined using Monte Carlo simulation
techniques to yield a predicted distribution of absorbed lead doses (ug/day) for different members of the
exposed population. These doses are then used as input to the biokinetic portion of the IEUBK model in
order to generate the predicted distribution of blood lead values in the population. Thus, the variability
between children is evaluated in the ISE model based on the variability in environmental and exposure
parameters, rather than by application of an assumed or estimated GSD value as in the IEUBK model.
Because this model has not yet undergone peer review or validation, it is considered to be only an
investigative tool. However, this model does provide useful information, and so it was used to help
characterize uncertainty at this site.
The input distributions used in the ISE model runs are summarized in Appendix E. The basis of most of
these distributions is provided in Goodrum et al. (1996). It is important to note that most of these
distributions are screening-level only. In many cases a distribution is assumed to be lognormal, even
though the true shape is not known. Likewise, the mean value of the distribution is selected to match the
mean value used by the IEUBK model, but the estimate of the standard deviation is often an estimate based
mainly on professional judgement. However, the single most important distribution (that for soil ingestion)
is based on reliable data and a well-characterized empirical distribution function (EDF) reported by Stanek
and Calabrese (1995). The mean soil intake value assumed by the IEUBK model (about 109 mg/day) is
located between the 75th and 80th percentile of the EDF reported by Stanek and Calabrese (1995).
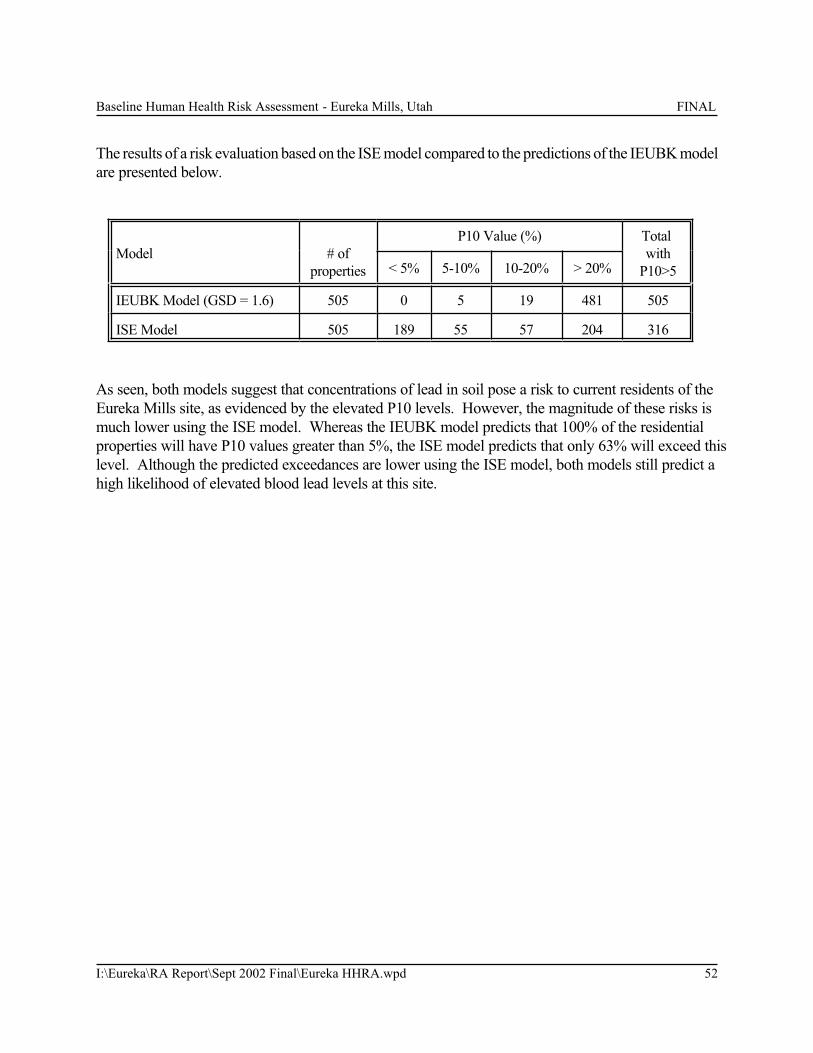
Baseline Human Health Risk Assessment - Eureka Mills, Utah FINAL
I:\Eureka\RA Report\Sept 2002 Final\Eureka HHRA.wpd 52
The results of a risk evaluation based on the ISE model compared to the predictions of the IEUBK model
are presented below.
Model # of
properties
P10 Value (%) Total
with
P10>5< 5% 5-10% 10-20% > 20%
IEUBK Model (GSD = 1.6) 505 0 5 19 481 505
ISE Model 505 189 55 57 204 316
As seen, both models suggest that concentrations of lead in soil pose a risk to current residents of the
Eureka Mills site, as evidenced by the elevated P10 levels. However, the magnitude of these risks is
much lower using the ISE model. Whereas the IEUBK model predicts that 100% of the residential
properties will have P10 values greater than 5%, the ISE model predicts that only 63% will exceed this
level. Although the predicted exceedances are lower using the ISE model, both models still predict a
high likelihood of elevated blood lead levels at this site.
Baseline Human Health Risk Assessment - Eureka Mills, Utah FINAL
I:\Eureka\RA Report\Sept 2002 Final\Eureka HHRA.wpd 53
6.0 SUMMARY AND CONCLUSIONS
6.1 Risks from Non-Lead COPCs
Interpretation of risk characterization results is a matter of judgement by the risk manager. The measure
used to describe the potential for noncarcinogenic toxicity to occur in an individual is expressed by
comparing an exposure level over a specified time period with a reference dose derived for a similar
exposure period. This ratio of exposure to toxicity is referred to as a hazard quotient. To assess the
overall potential for noncarcinogenic effects posed by more than one chemical, these HQs are summed to
obtain a hazard index. In general , USEPA considers that acceptable level of excess risk under RME
assumptions is an HI equal to or less than one (1E+00) for non-cancer risks. In this case, it is believed
that there is no appreciable risk that noncancer health effects will occur. If an HI exceeds 1E+00, there
is some possibility that noncancer effects may occur, although an HI above 1E+00 does not indicate an
effect will definitely occur. In this instance, it is important to review the contribution of risks from the
individual chemicals which were evaluated in the risk assessment.
In evaluating carcinogens, risks are estimated as the incremental probability of an individual developing
cancer over a lifetime as a result of exposure to the potential carcinogen. The level of total cancer risk that
is of concern is a matter of personal, community and regulatory judgement. In general, it is the policy of
the USEPA that remedial action is not warranted where excess cancer risks to the RME individual do not
exceed a level of 1E-04 (USEPA 1991b). It should be noted that, the upper boundary of the risk range
is not a discrete line at 1E-04. This risk level may be considered acceptable if justified based on site-
specific conditions. However, a risk manager may also decide that a lower level of risk to human health
is unacceptable and that remedial action is warranted where, for example, there are uncertainties in the risk
assessment results.
A summary of the estimated non-cancer and cancer risks resulting from exposure to non-lead COPCs at
this site is presented below. As discussed in Section 2, the following non-lead chemicals were selected for
evaluation at this site.
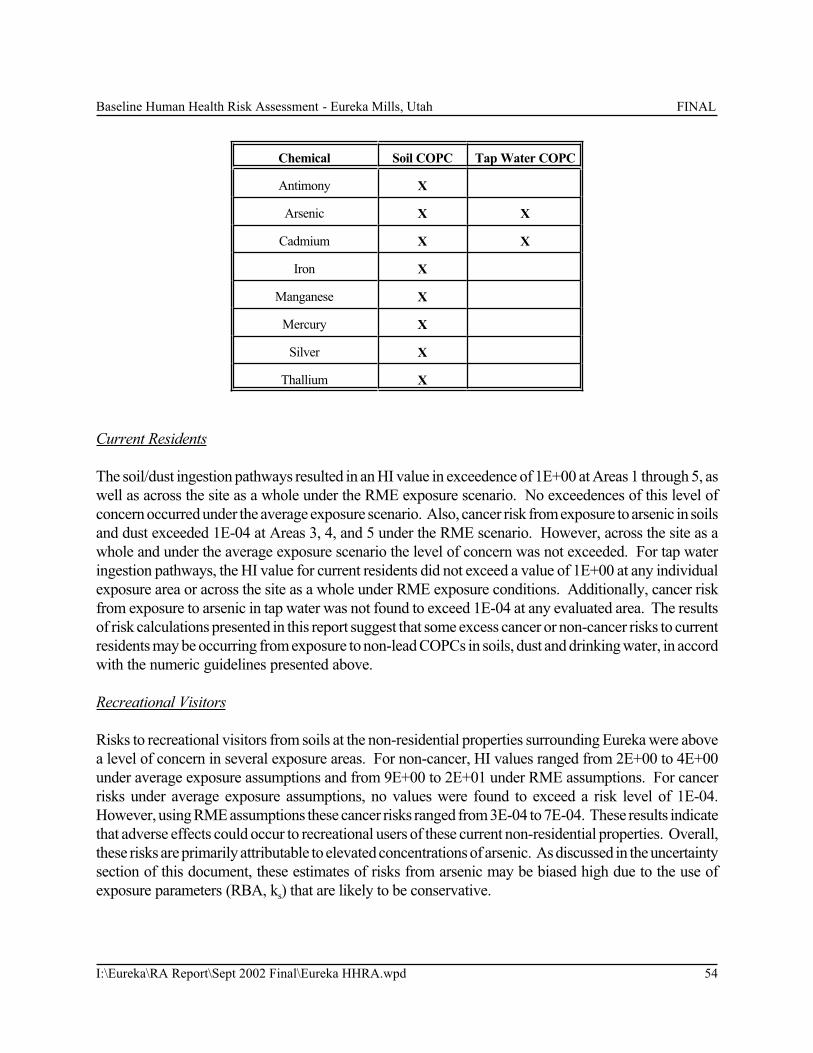
Baseline Human Health Risk Assessment - Eureka Mills, Utah FINAL
I:\Eureka\RA Report\Sept 2002 Final\Eureka HHRA.wpd 54
Chemical Soil COPC Tap Water COPC
Antimony X
Arsenic X X
Cadmium X X
Iron X
Manganese X
Mercury X
Silver X
Thallium X
Current Residents
The soil/dust ingestion pathways resulted in an HI value in exceedence of 1E+00 at Areas 1 through 5, as
well as across the site as a whole under the RME exposure scenario. No exceedences of this level of
concern occurred under the average exposure scenario. Also, cancer risk from exposure to arsenic in soils
and dust exceeded 1E-04 at Areas 3, 4, and 5 under the RME scenario. However, across the site as a
whole and under the average exposure scenario the level of concern was not exceeded. For tap water
ingestion pathways, the HI value for current residents did not exceed a value of 1E+00 at any individual
exposure area or across the site as a whole under RME exposure conditions. Additionally, cancer risk
from exposure to arsenic in tap water was not found to exceed 1E-04 at any evaluated area. The results
of risk calculations presented in this report suggest that some excess cancer or non-cancer risks to current
residents may be occurring from exposure to non-lead COPCs in soils, dust and drinking water, in accord
with the numeric guidelines presented above.
Recreational Visitors
Risks to recreational visitors from soils at the non-residential properties surrounding Eureka were above
a level of concern in several exposure areas. For non-cancer, HI values ranged from 2E+00 to 4E+00
under average exposure assumptions and from 9E+00 to 2E+01 under RME assumptions. For cancer
risks under average exposure assumptions, no values were found to exceed a risk level of 1E-04.
However, using RME assumptions these cancer risks ranged from 3E-04 to 7E-04. These results indicate
that adverse effects could occur to recreational users of these current non-residential properties. Overall,
these risks are primarily attributable to elevated concentrations of arsenic. As discussed in the uncertainty
section of this document, these estimates of risks from arsenic may be biased high due to the use of
exposure parameters (RBA, ks) that are likely to be conservative.

Baseline Human Health Risk Assessment - Eureka Mills, Utah FINAL
I:\Eureka\RA Report\Sept 2002 Final\Eureka HHRA.wpd 55
Future Residents
Risks to future residents from soils at the non-residential properties surrounding Eureka were above
general guidelines in several exposure areas. For non-cancer, HI values ranged from 1E+0 to 3E+0 under
average exposure assumptions and from 4E+0 to 8E+00 under RME assumptions. For cancer risks under
average exposure assumptions, no values were found to exceed a risk level of 1E-04. However, using
RME assumptions these cancer risks ranged from 4E-04 to 8E-04. These results indicate that adverse
effects could occur to future residents of these current non-residential properties. Overall, these risks are
primarily attributable to elevated concentrations of arsenic. As discussed in the uncertainty section of this
document, these estimates of risks from arsenic may be biased high due to the use of exposure parameters
(RBA, ks) that are likely to be conservative.
6.2 Risks from Lead
As discussed above, the USEPA has identified 10 ug/dL as the blood lead level at which effects that
warrant avoidance begin to occur, and has set as a goal that there should be no more than a 5% chance
that any child will have a blood lead value above 10 ug/dL (P10 < 5%) (USEPA 1994). This approach
focuses on the risks to a child at the upper bound (about the 95th percentile) of the exposure distribution,
very much the same way that the approach used for other chemicals focuses on risks to the RME
individual.
Risks from lead exposure were evaluated at this site using both modeling approaches and direct blood lead
observations. A summary of the estimated risks resulting from exposure to lead at this site is presented
below. Risks were evaluated to current residential and hypothetical future residential children, as well as
to teenage recreational visitors.
Current Residents
Using a GSD of 1.6 in the IEUBK model, 100% of children (age 0-6 years) residing at any of the 505
evaluated properties within Eureka are predicted to have blood lead P10 values exceeding 5%. Across
these properties, the predicted P10 values were found to range from 7.3 to 99.9% with an average of
68.7%. When a GSD value of 1.4 was used in the model, P10 values were found to range from 2.1 to
100% (average 70.1%) with 99% of all exposures predicted to have a greater than 5% probability of
exceeding a blood lead level of 10 ug/dL.
This predicted risk is supported by findings of a blood lead study conducted in Eureka in which 59 samples
from children (<84 months in age) were assessed. Measured blood lead values were found to range from
2.2 to 34.2 ug/dL. A total of 20 (34%) of these blood lead levels were greater than 10 ug/dL.
Although both approaches show that elevated blood lead concentrations are present or likely to occur at
this site, the IEUBK model failed to accurately predict blood lead concentrations in study participants,
Baseline Human Health Risk Assessment - Eureka Mills, Utah FINAL
I:\Eureka\RA Report\Sept 2002 Final\Eureka HHRA.wpd 56
suggesting that the model may not be accurately evaluating source exposures. Predicted values did not
consistently over- or underestimate the observed values at this site, but rather the pattern appeared to be
highly variable. A review of the model residuals showed that the IEUBK model had a tendency to
systematically overestimate the contribution of soil and dust lead to a child’s blood lead level. This
indicates that additional factors may be contributing to the actual elevated blood lead levels observed in
area children.
However, both the IEUBK model and the direct measurements support the conclusion that elevated blood
lead levels are of concern to current residential children at this site. An alternate model known as the ISE
model for lead, also supports this conclusion. This model was run in order to evaluate uncertainty in the
modeling process as discussed in Section 5.6.3 of this report. Using this model, 63% of the evaluated
properties are predicted to have P10 levels exceeding 5%.
Therefore, regardless of the evaluation approach for current residential children, exposure to lead at this
site is expected to result in P10 values exceeding USEPA’s established guidelines.
Future Residents
The IEUBK model was also used to predict blood lead levels in hypothetical future residential children
living in the outlying areas of Eureka. A total of 24 outlying properties were evaluated. Predicted
geometric mean blood lead concentrations were found to range from 6.3 to 82 ug/dL (average 33.4
ug/dL). This range exceeds that predicted by this model for the current residential properties. All of the
evaluated properties were predicted to exceed a P10 value of 5%, regardless of the GSD value (1.6 or 1.4)
utilized in the model. This indicates that if young children were to reside at these currently undeveloped
properties, without reducing environmental lead concentrations, the risks of developing a blood lead value
exceeding 10 ug/dL are suggested by the model to be quite likely.
Recreational Visitors
The Bowers model was utilized to predict the 95th Percentile blood lead concentration (PbB95) in teenagers
who may frequent non-residential areas for recreational purposes. The predicted blood lead values at the
24 evaluated properties were found to range from 2.8 to 98 ug/dL, with the maximum predicted value
being seen in Area 5 (Upper Godiva Shaft). The PbB95 concentrations were found to exceed a level of
concern (11.1 ug/dL) at 22 properties, suggesting that recreational activities at the majority of the sampled
properties may result in elevated blood lead levels.
Baseline Human Health Risk Assessment - Eureka Mills, Utah FINAL
I:\Eureka\RA Report\Sept 2002 Final\Eureka HHRA.wpd 57
7.0 REFERENCES
ACGIH. 1995. American Conference of Governmental Industrial Hygenists, Inc. Lead, inorganic
dust and fumes. Recommended BEI (7/24/95 draft).
Aitchison, J., Brown, J.A.C. 1957. The Lognormal Distribution - University of Cambridge
Department of Applied Economics Monograph. Cambridge University Press.
ATSDR. 1997. Agency for Toxic Substances and Disease Registry. Toxicological Profiles on CD-
ROM. Boca Raton, FL: CRC Press, Inc.
Bowers, T.S., Beck, B.D., Karam, H.S. 1994. Assessing the Relationship Between Environmental
Lead Concentrations and Adult Blood Lead Levels. Risk Analysis 14:183-189.
Brody, D.J., Pirkle, J.L., Kramer, R.A., Flegal, K.M., Matte, T.D., Gunter, E.W., Paschal, D.C. 1994.
Blood Lead Levels in the US Population. Phase 1 of the Third National Health and Nutrition
Examination Survey (NHANES III, 1988 to 1991). JAMA 272:277-283.
CDC. 1991. Centers for Disease Control. Preventing lead poisoning in young children. A statement
by the Centers of Disease Control - October. U.S. Department of Health and Human Services. Public
Health Service.
CEPA. 1992. California Environmental Protection Agency, Department of Toxic Substances Control.
Supplemental Guidance for Human Health Multimedia Risk Assessment of Hazardous Waste Sites and
Permitted Facilities. Sacramento, California.
Dragun, J. 1988. The Soil Chemistry of Hazardous Materials. Hazardous Materials Control Research
Institute. New York: Amherst Scientific Publishers.
Goodrum PE, Diamond GL, Hassett JM and Johnson DL. 1996. Monte Carlo Modeling of
Childhood Lead Exposure: Development of a Probabilistic Methodology for Use with the USEPA
IEUBK Model for Lead in Children. Human and Ecological Risk Assessment. 2(4): 681-708.
Goyer, R.A. 1990. Transplacental Transport of Lead. Environ. Health Perspect. 89:101-105.
Griffin S, Marcus A, Schulz T and Walker S. 1999b. Calculating the Inter-individual Geometric
Standard Deviation for use in the Integrated Exposure Uptake Biokinetic Model for Lead in Children.
Environmental Health Perspectives. 107(6):481-487.
HUD. 1995. Guidelines for the Evaluation and Control of Lead-Based Paint Hazards in Housing.
U.S. Department of Housing and Urban Development, Washington DC. June 1995.
Baseline Human Health Risk Assessment - Eureka Mills, Utah FINAL
I:\Eureka\RA Report\Sept 2002 Final\Eureka HHRA.wpd 58
ISSI. 1998. Bioavailability of Lead in Soil and Mine Waste from the California Gulch NPL Site,
Leadville, CO. Prepared for U.S. Environmental Protection Agency, Region 8. June 1998.
Leggett. 1993. An Age-Specific Kinetic Model of Lead Metabolism in Humans. Environ. Health
Perspectives 101:598.
Morris, HT and AP Mogensen. 1978. Tintic Mining District, Utah. Brigham Young Geology Series.
Volume 25. Pages 33-45. April 1978.
O'Flaherty, E.J. 1993. Physiologically Based Models for Bone-Seeking Elements. IV. Kinetics of
Lead Disposition in Humans. Toxicol. Appl. Pharmacol. 118:16-29.
Pirkle, J.L., Brody, D.J., Gunter, E.W., Kramer, R.A., Paschal, D.C., Flegal, K.M., Matte, T.D. 1994.
The Decline in Blood Lead Levels in the United States. The National Health and Nutrition
Examination Surveys. JAMA 272:284-291.
Shacklette, H.T., and J.G. Boerngen. 1984. Element concentrations in soils and other surficialmaterials of the conterminous United States. USGS Professional Paper 1270. Washington, D.C.: U.S.
Geological Survey.
SRC. 1999. Syracuse Research Corporation. User's Guide for the Integrated Stochastic Exposure
(ISE) Model for Lead. Prepared for ISSI Consulting Group, Inc. and USEPA Region VIII, June 30,
1999.
Stanek EJ and Calabrese EJ. 1995. Daily estimates of soil ingestion in children. Environ. Health
Perpect. 103:176-285.
Sverdup Corporation. 1995. Uptake of Lead and Arsenic by Garden Vegetables, Study Report for
the Kennecott Site. Prepared for USEPA. February 3, 1995. EPA Contract No. 68-W9-0032.
Work Assignment No. 20-8BT8.
UDEQ. 2000. Utah Department of Environmental Quality, Division of Environmental Response and
Remediation. Site Inspection Analytical Results Report. Eureka Mills, Juab County, Utah
UT0002240158
URS. 2000. Sampling and Analysis Plan. Eureka Mills, Eureka, Utah. Prepared for the U.S.
Environmental Protection Agency on September 13, 2000.
URS. 2001. Draft Human Health Risk Assessment. Walkerville Residential Site, Walkerville,
Montana. Prepared for U.S. Environmental Protection Agency in July, 2001.
Baseline Human Health Risk Assessment - Eureka Mills, Utah FINAL
I:\Eureka\RA Report\Sept 2002 Final\Eureka HHRA.wpd 59
USEPA. 1986. U.S. Environmental Protection Agency, Office of Health and Environmental
Assessment. Air Quality Criteria for Lead. June, 1986, and Addendum, September, 1986. Research
Triangle Park, NC: U.S. Environmental Protection Agency. EPA 600/8-83-028F.
USEPA. 1988. U.S. Environmental Protection Agency, Office of Health and Environmental
Assessment. Special Report of Ingested Inorganic Arsenic: Skin Cancer; Nutritional Essentiality.
Washington, DC: U.S. Environmental Protection Agency. EPA/625/3-87/013.
USEPA. 1989a. U.S. Environmental Protection Agency, Office of Emergency and Remedial
Response. Risk Assessment Guidance for Superfund. Volume I. Human Health Evaluation Manual
(Part A). EPA Document EPA/540/1-89/002.
USEPA. 1989b. U.S. Environmental Protection Agency, Office of Health and Environmental
Assessment. Evaluation of the Potential Carcinogenicity of Lead and Lead Compounds.
EPA/60/8-89/045A.
USEPA. 1991a. U.S. Environmental Protection Agency, Office of Solid Waste and Emergency
Response. Human Health Evaluation Manual, Supplemental Guidance: "Standard Default Exposure
Factors". Washington, D.C. OSWER Directive 9285.6-03.
USEPA. 1991b. U.S. Environmental Protection Agency, Office of Solid Waste and Emergency
Response. Role of the Baseline Risk Assessment in Superfund Remedy Selection Decisions.
Washington, D.C. OSWER Directive 9355.0-30.
USEPA. 1992. U.S. Environmental Protection Agency, Office of Solid Waste and Emergency
Response. Supplemental Guidance to RAGS: Calculating the Concentration Term. EPA Publication
No. 9285.7-081.
USEPA. 1993. U.S. Environmental Protection Agency. Superfund's Standard Default Exposure
Factors for the Central Tendency and Reasonable Maximum Exposure. Draft, dated 11/04/93.
USEPA. 1994. U.S. Environmental Protection Agency, Office of Emergency and Remedial
Response. Guidance Manual for the Integrated Exposure Uptake Biokinetic Model for Lead in
Children. EPA Publication No. 9285.7-15-1.
USEPA. 1995. USEPA Region VIII Standard Operating Procedure. Dermal Absorption from Water
or Soil. Draft Document prepared for Region VIII by Roy F. Weston, Inc.
USEPA. 1996. U.S. Environmental Protection Agency. Recommendations of the Technical Review
Workgroup for Lead for an Interim Approach to Assessing Risks Associated with Adult Exposures to
Lead in Soil. December 1996.

Baseline Human Health Risk Assessment - Eureka Mills, Utah FINAL
I:\Eureka\RA Report\Sept 2002 Final\Eureka HHRA.wpd 60
USEPA. 1999. U.S. Environmental Protection Agency. Region III Risk-Based Concentration Table.
Philadelphia, PA. April 12.
USEPA. 2001. U.S. Environmental Protection Agency. 40 CFR Part 745. Lead; Identification of
Dangerous Levels of Lead; Final Rule. Friday, January 5, 2001.
WESTON. 1996a. Bioavailability of Lead in Slag and Soil Samples from the Murray Smelter
Superfund Site. Prepared for U.S. Environmental Protection Agency, Region 8. June 1996.
WESTON. 1996b. Bioavailability of Lead in Slag and Soil Samples from the Smuggler Mountain
NPL Site, Aspen, Colorado. Prepared for U.S. Environmental Protection Agency, Region 8. May
1996.
WESTON. 1996c. Bioavailability of Lead in Slag and Soil Samples from the Jasper County, Missouri
Superfund Site. Prepared for U.S. Environmental Protection Agency, Region 8. May 1996.

TABLES

I:\Eureka\RA Report\Sept 2002 Final\Chapter 2 Tables.wpd
Table 2-1: Summary Statistics for Data Set #1
Analyte Analysis
Method+
Detection
Frequency (%)
Avg*
(mg/kg)
Min
(mg/kg)
Max
(mg/kg)
Aluminum ICP 394/394 (100%) 11,826 1,100 20,000
Antimony ICP 27/30 (90%) 19 10 59
Arsenic ICP 394/394 (100%) 141 7.7 2,100
Barium ICP 394/394 (100%) 326 91 1,200
Beryllium ICP 394/394 (100%) 0.92 0.19 1.8
Cadmium ICP 394/394 (100%) 19 0.5 140
Calcium ICP 394/394 (100%) 49,968 5,200 250,000
Chromium ICP 394/394 (100%) 17 2 110
Cobalt ICP 394/394 (100%) 5.7 1.1 15
Copper XRF 695/4211 (16%) 126 13 2,700
Iron XRF 4208/4211 (99.9%) 19,649 5,600 88,000
Lead XRF 3674/4211 (87%) 1,239 18 25,000
Magnesium ICP 394/394 (100%) 18,741 2,100 84,000
Manganese ICP 394/394 (100%) 1,054 220 5,100
Mercury ICP 394/394 (100%) 3.3 0.04 130
Nickel ICP 394/394 (100%) 12 3.4 34
Potassium ICP 394/394 (100%) 3,346 390 6,200
Selenium ICP 115/370 (31%) 0.79 0.5 8.3
Silver ICP 351/384 (91%) 11 1 190
Sodium ICP 394/394 (100%) 333 59 3,700
Thallium ICP 53/391 (14%) 56 31 200
Vanadium ICP 394/394 (100%) 26 7.7 330
Zinc XRF 4068/4211 (97%) 1,460 26 44,000
* Non-Detects Evaluated at the Detection Limit+ XRF data used where deemed reliable, otherwise ICP data was used
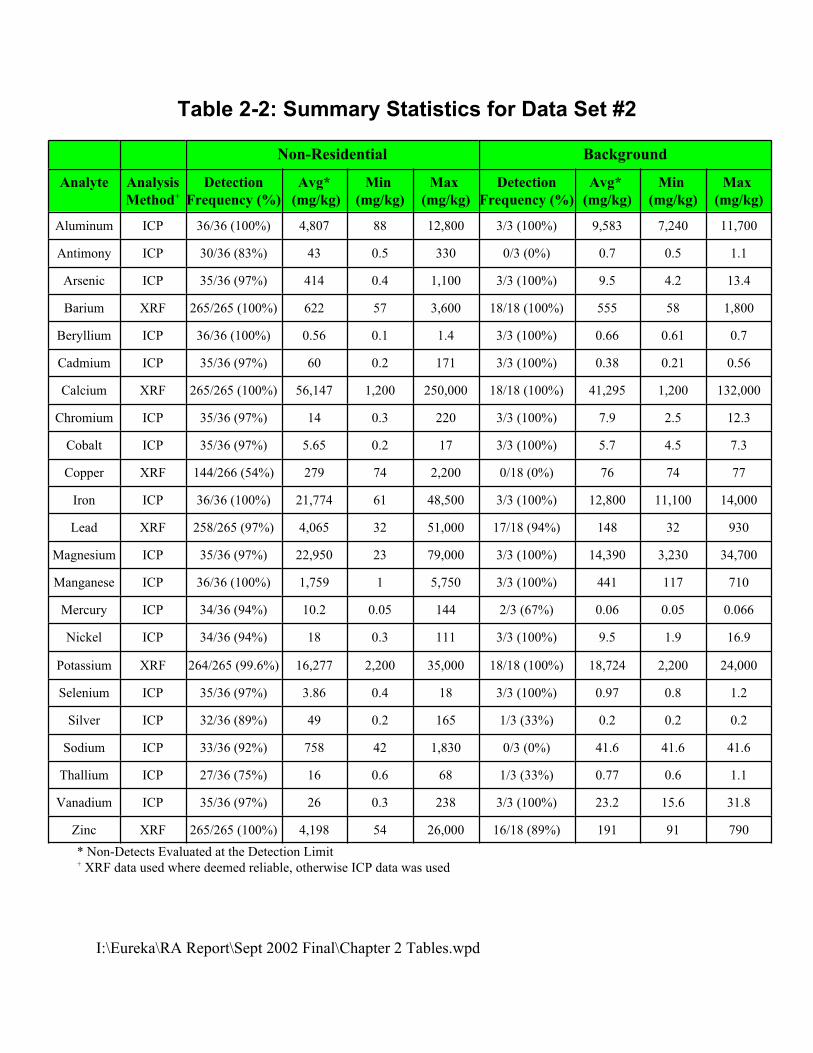
I:\Eureka\RA Report\Sept 2002 Final\Chapter 2 Tables.wpd
Table 2-2: Summary Statistics for Data Set #2
Non-Residential Background
Analyte Analysis
Method+
Detection
Frequency (%)
Avg*
(mg/kg)
Min
(mg/kg)
Max
(mg/kg)
Detection
Frequency (%)
Avg*
(mg/kg)
Min
(mg/kg)
Max
(mg/kg)
Aluminum ICP 36/36 (100%) 4,807 88 12,800 3/3 (100%) 9,583 7,240 11,700
Antimony ICP 30/36 (83%) 43 0.5 330 0/3 (0%) 0.7 0.5 1.1
Arsenic ICP 35/36 (97%) 414 0.4 1,100 3/3 (100%) 9.5 4.2 13.4
Barium XRF 265/265 (100%) 622 57 3,600 18/18 (100%) 555 58 1,800
Beryllium ICP 36/36 (100%) 0.56 0.1 1.4 3/3 (100%) 0.66 0.61 0.7
Cadmium ICP 35/36 (97%) 60 0.2 171 3/3 (100%) 0.38 0.21 0.56
Calcium XRF 265/265 (100%) 56,147 1,200 250,000 18/18 (100%) 41,295 1,200 132,000
Chromium ICP 35/36 (97%) 14 0.3 220 3/3 (100%) 7.9 2.5 12.3
Cobalt ICP 35/36 (97%) 5.65 0.2 17 3/3 (100%) 5.7 4.5 7.3
Copper XRF 144/266 (54%) 279 74 2,200 0/18 (0%) 76 74 77
Iron ICP 36/36 (100%) 21,774 61 48,500 3/3 (100%) 12,800 11,100 14,000
Lead XRF 258/265 (97%) 4,065 32 51,000 17/18 (94%) 148 32 930
Magnesium ICP 35/36 (97%) 22,950 23 79,000 3/3 (100%) 14,390 3,230 34,700
Manganese ICP 36/36 (100%) 1,759 1 5,750 3/3 (100%) 441 117 710
Mercury ICP 34/36 (94%) 10.2 0.05 144 2/3 (67%) 0.06 0.05 0.066
Nickel ICP 34/36 (94%) 18 0.3 111 3/3 (100%) 9.5 1.9 16.9
Potassium XRF 264/265 (99.6%) 16,277 2,200 35,000 18/18 (100%) 18,724 2,200 24,000
Selenium ICP 35/36 (97%) 3.86 0.4 18 3/3 (100%) 0.97 0.8 1.2
Silver ICP 32/36 (89%) 49 0.2 165 1/3 (33%) 0.2 0.2 0.2
Sodium ICP 33/36 (92%) 758 42 1,830 0/3 (0%) 41.6 41.6 41.6
Thallium ICP 27/36 (75%) 16 0.6 68 1/3 (33%) 0.77 0.6 1.1
Vanadium ICP 35/36 (97%) 26 0.3 238 3/3 (100%) 23.2 15.6 31.8
Zinc XRF 265/265 (100%) 4,198 54 26,000 16/18 (89%) 191 91 790
* Non-Detects Evaluated at the Detection Limit+ XRF data used where deemed reliable, otherwise ICP data was used
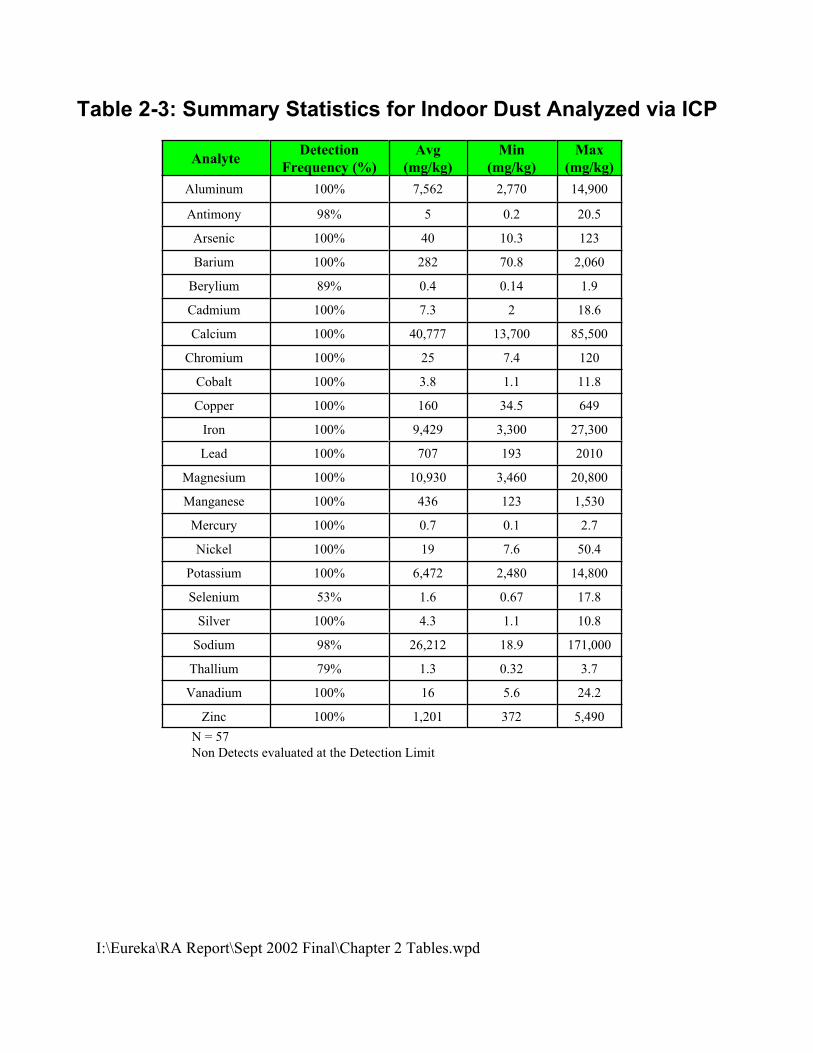
I:\Eureka\RA Report\Sept 2002 Final\Chapter 2 Tables.wpd
Table 2-3: Summary Statistics for Indoor Dust Analyzed via ICP
AnalyteDetection
Frequency (%)
Avg
(mg/kg)
Min
(mg/kg)
Max
(mg/kg)
Aluminum 100% 7,562 2,770 14,900
Antimony 98% 5 0.2 20.5
Arsenic 100% 40 10.3 123
Barium 100% 282 70.8 2,060
Berylium 89% 0.4 0.14 1.9
Cadmium 100% 7.3 2 18.6
Calcium 100% 40,777 13,700 85,500
Chromium 100% 25 7.4 120
Cobalt 100% 3.8 1.1 11.8
Copper 100% 160 34.5 649
Iron 100% 9,429 3,300 27,300
Lead 100% 707 193 2010
Magnesium 100% 10,930 3,460 20,800
Manganese 100% 436 123 1,530
Mercury 100% 0.7 0.1 2.7
Nickel 100% 19 7.6 50.4
Potassium 100% 6,472 2,480 14,800
Selenium 53% 1.6 0.67 17.8
Silver 100% 4.3 1.1 10.8
Sodium 98% 26,212 18.9 171,000
Thallium 79% 1.3 0.32 3.7
Vanadium 100% 16 5.6 24.2
Zinc 100% 1,201 372 5,490
N = 57
Non Detects evaluated at the Detection Limit
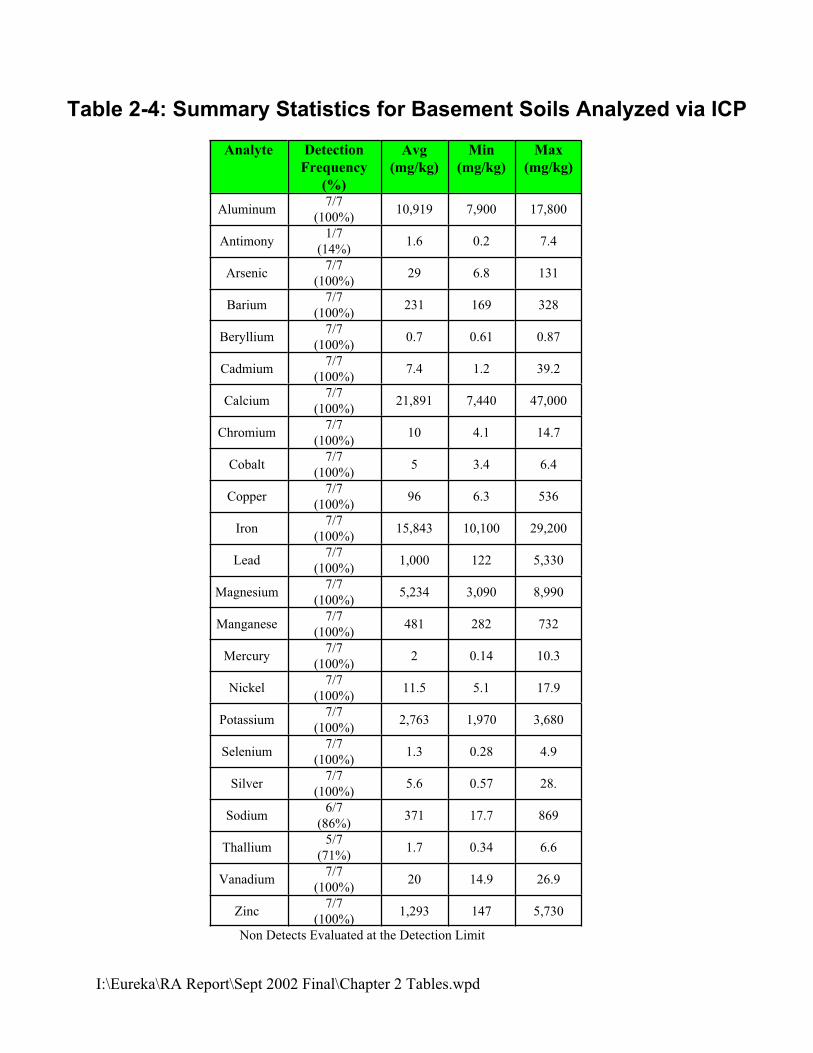
I:\Eureka\RA Report\Sept 2002 Final\Chapter 2 Tables.wpd
Table 2-4: Summary Statistics for Basement Soils Analyzed via ICP
Analyte Detection
Frequency
(%)
Avg
(mg/kg)
Min
(mg/kg)
Max
(mg/kg)
Aluminum7/7
(100%)10,919 7,900 17,800
Antimony1/7
(14%)1.6 0.2 7.4
Arsenic7/7
(100%)29 6.8 131
Barium7/7
(100%)231 169 328
Beryllium 7/7
(100%)0.7 0.61 0.87
Cadmium7/7
(100%)7.4 1.2 39.2
Calcium 7/7
(100%)21,891 7,440 47,000
Chromium7/7
(100%)10 4.1 14.7
Cobalt7/7
(100%)5 3.4 6.4
Copper7/7
(100%)96 6.3 536
Iron7/7
(100%)15,843 10,100 29,200
Lead7/7
(100%)1,000 122 5,330
Magnesium7/7
(100%)5,234 3,090 8,990
Manganese7/7
(100%)481 282 732
Mercury7/7
(100%)2 0.14 10.3
Nickel7/7
(100%)11.5 5.1 17.9
Potassium7/7
(100%)2,763 1,970 3,680
Selenium7/7
(100%)1.3 0.28 4.9
Silver7/7
(100%)5.6 0.57 28.
Sodium6/7
(86%)371 17.7 869
Thallium 5/7
(71%)1.7 0.34 6.6
Vanadium7/7
(100%)20 14.9 26.9
Zinc7/7
(100%)1,293 147 5,730
Non Detects Evaluated at the Detection Limit
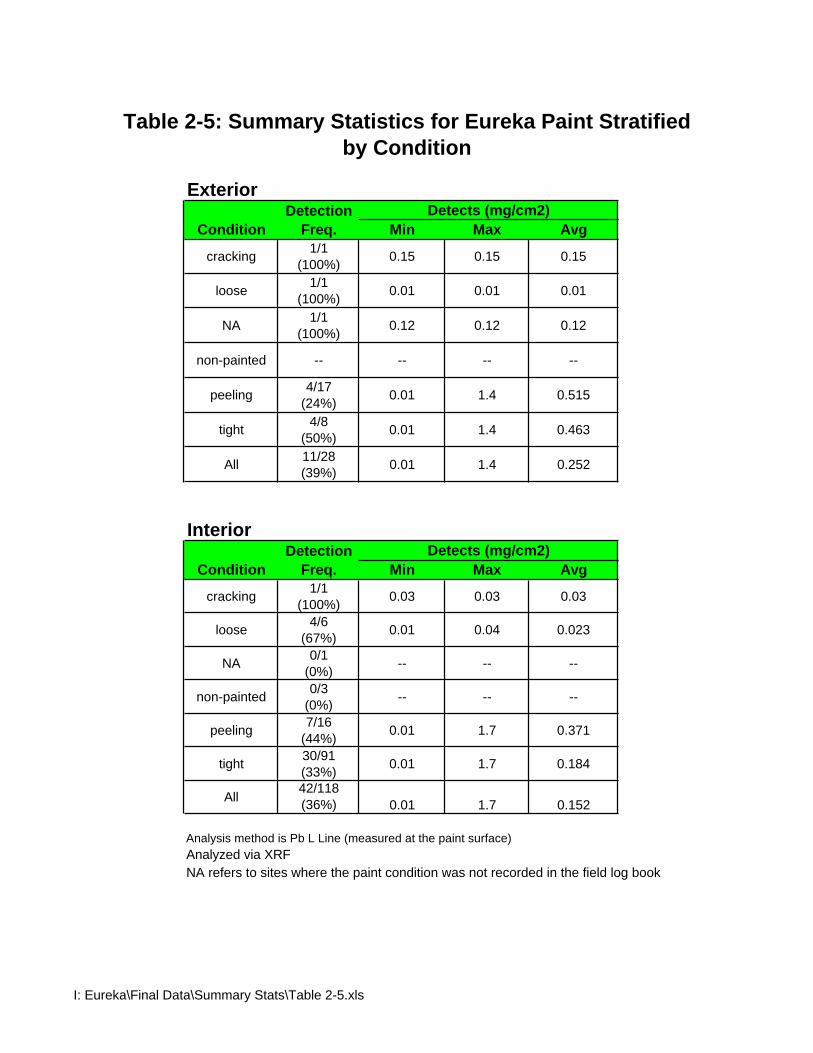
Exterior
Condition Min Max Avg
cracking 1/1(100%) 0.15 0.15 0.15
loose 1/1(100%) 0.01 0.01 0.01
NA 1/1(100%) 0.12 0.12 0.12
non-painted -- -- -- --
peeling 4/17(24%) 0.01 1.4 0.515
tight 4/8(50%) 0.01 1.4 0.463
All 11/28(39%) 0.01 1.4 0.252
Interior
Condition Min Max Avg
cracking 1/1(100%) 0.03 0.03 0.03
loose 4/6(67%) 0.01 0.04 0.023
NA 0/1(0%) -- -- --
non-painted 0/3(0%) -- -- --
peeling 7/16(44%) 0.01 1.7 0.371
tight 30/91(33%) 0.01 1.7 0.184
All 42/118(36%) 0.01 1.7 0.152
Analysis method is Pb L Line (measured at the paint surface)Analyzed via XRFNA refers to sites where the paint condition was not recorded in the field log book
Table 2-5: Summary Statistics for Eureka Paint Stratified by Condition
DetectionFreq.
Detects (mg/cm2)
Detects (mg/cm2)DetectionFreq.
I: Eureka\Final Data\Summary Stats\Table 2-5.xls
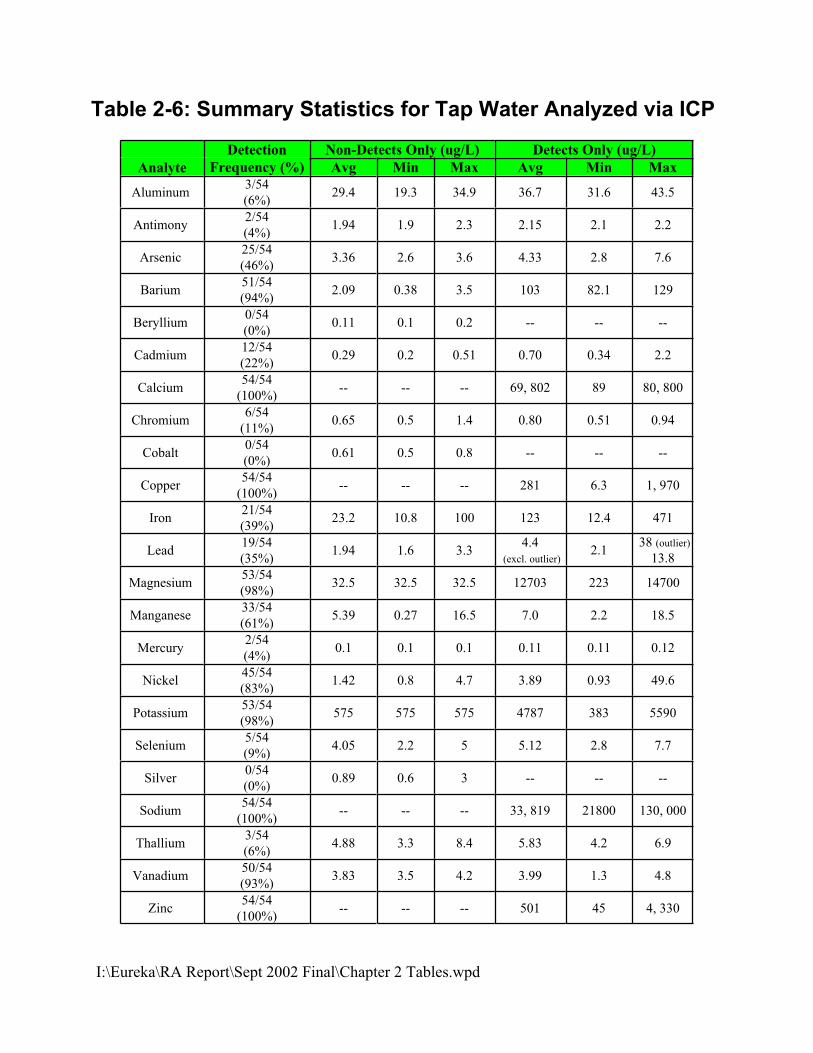
I:\Eureka\RA Report\Sept 2002 Final\Chapter 2 Tables.wpd
Table 2-6: Summary Statistics for Tap Water Analyzed via ICP
Analyte
Detection
Frequency (%)
Non-Detects Only (ug/L) Detects Only (ug/L)
Avg Min Max Avg Min Max
Aluminum3/54
(6%)29.4 19.3 34.9 36.7 31.6 43.5
Antimony2/54
(4%)1.94 1.9 2.3 2.15 2.1 2.2
Arsenic25/54
(46%)3.36 2.6 3.6 4.33 2.8 7.6
Barium51/54
(94%)2.09 0.38 3.5 103 82.1 129
Beryllium 0/54
(0%)0.11 0.1 0.2 -- -- --
Cadmium12/54
(22%)0.29 0.2 0.51 0.70 0.34 2.2
Calcium 54/54
(100%)-- -- -- 69, 802 89 80, 800
Chromium6/54
(11%)0.65 0.5 1.4 0.80 0.51 0.94
Cobalt0/54
(0%)0.61 0.5 0.8 -- -- --
Copper54/54
(100%)-- -- -- 281 6.3 1, 970
Iron21/54
(39%)23.2 10.8 100 123 12.4 471
Lead19/54
(35%)1.94 1.6 3.3
4.4
(excl. outlier)2.1
38 (outlier)
13.8
Magnesium53/54
(98%)32.5 32.5 32.5 12703 223 14700
Manganese33/54
(61%)5.39 0.27 16.5 7.0 2.2 18.5
Mercury2/54
(4%)0.1 0.1 0.1 0.11 0.11 0.12
Nickel45/54
(83%)1.42 0.8 4.7 3.89 0.93 49.6
Potassium53/54
(98%)575 575 575 4787 383 5590
Selenium5/54
(9%)4.05 2.2 5 5.12 2.8 7.7
Silver0/54
(0%)0.89 0.6 3 -- -- --
Sodium54/54
(100%)-- -- -- 33, 819 21800 130, 000
Thallium 3/54
(6%)4.88 3.3 8.4 5.83 4.2 6.9
Vanadium50/54
(93%)3.83 3.5 4.2 3.99 1.3 4.8
Zinc54/54
(100%)-- -- -- 501 45 4, 330
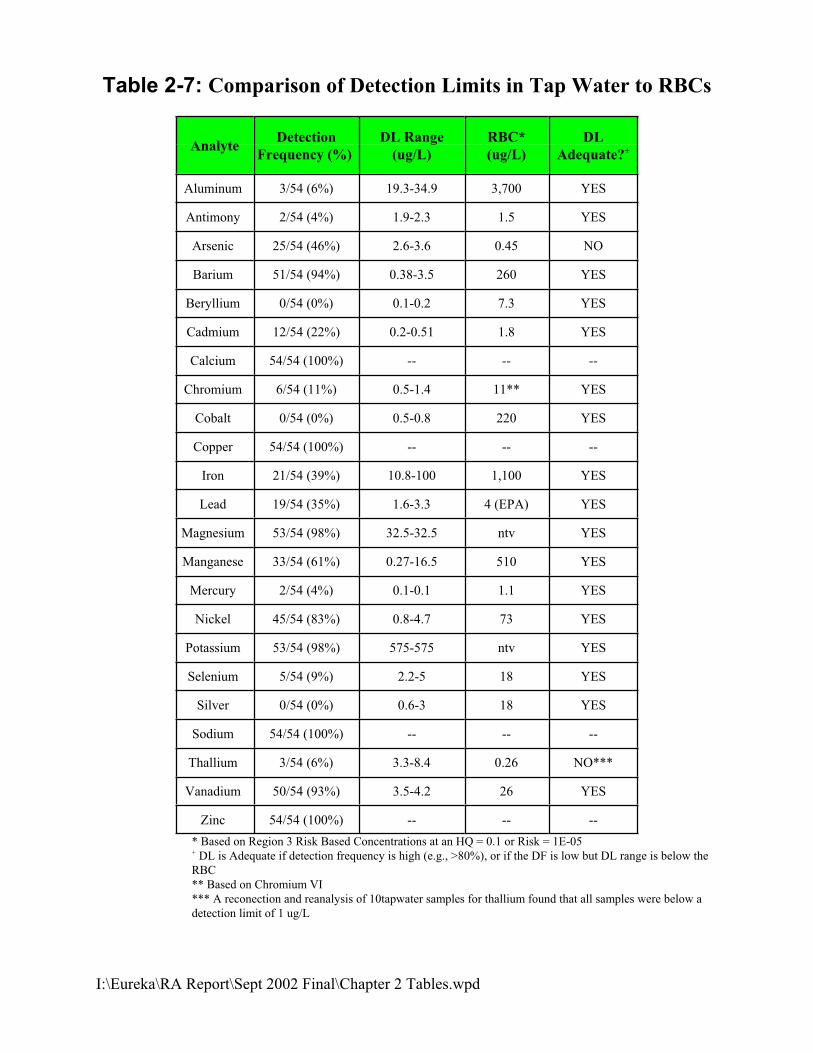
I:\Eureka\RA Report\Sept 2002 Final\Chapter 2 Tables.wpd
Table 2-7: Comparison of Detection Limits in Tap Water to RBCs
AnalyteDetection
Frequency (%)
DL Range
(ug/L)
RBC*
(ug/L)
DL
Adequate?+
Aluminum 3/54 (6%) 19.3-34.9 3,700 YES
Antimony 2/54 (4%) 1.9-2.3 1.5 YES
Arsenic 25/54 (46%) 2.6-3.6 0.45 NO
Barium 51/54 (94%) 0.38-3.5 260 YES
Beryllium 0/54 (0%) 0.1-0.2 7.3 YES
Cadmium 12/54 (22%) 0.2-0.51 1.8 YES
Calcium 54/54 (100%) -- -- --
Chromium 6/54 (11%) 0.5-1.4 11** YES
Cobalt 0/54 (0%) 0.5-0.8 220 YES
Copper 54/54 (100%) -- -- --
Iron 21/54 (39%) 10.8-100 1,100 YES
Lead 19/54 (35%) 1.6-3.3 4 (EPA) YES
Magnesium 53/54 (98%) 32.5-32.5 ntv YES
Manganese 33/54 (61%) 0.27-16.5 510 YES
Mercury 2/54 (4%) 0.1-0.1 1.1 YES
Nickel 45/54 (83%) 0.8-4.7 73 YES
Potassium 53/54 (98%) 575-575 ntv YES
Selenium 5/54 (9%) 2.2-5 18 YES
Silver 0/54 (0%) 0.6-3 18 YES
Sodium 54/54 (100%) -- -- --
Thallium 3/54 (6%) 3.3-8.4 0.26 NO***
Vanadium 50/54 (93%) 3.5-4.2 26 YES
Zinc 54/54 (100%) -- -- --
* Based on Region 3 Risk Based Concentrations at an HQ = 0.1 or Risk = 1E-05+ DL is Adequate if detection frequency is high (e.g., >80%), or if the DF is low but DL range is below the
RBC
** Based on Chromium VI
*** A reconection and reanalysis of 10tapwater samples for thallium found that all samples were below a
detection limit of 1 ug/L

As In Bulk Soil (ppm)
Mass in Bulk Soil (g)
CalculatedAs #1
ICP As (mg/l)
SolutionAmount (l)
As % Bioaccessable
pH Stop
EM-1 449 1.0022 0.45 0.489 0.1 10.9 1.617EM-2 920 1.0035 0.92 0.611 0.1 6.6 1.875EM-3 275 1.0042 0.28 0.115 0.1 4.2* 1.56EM-4 189 1.0032 0.19 0.156 0.1 8.2* 1.74EM-5 148 1.0063 0.15 0.062 0.1 4.2* 1.718EM-6 287 1.0077 0.29 0.240 0.1 8.3 1.572EM-7 1301 1.0076 1.31 1.042 0.1 8.0 1.641EM-8 54 1.0038 0.05 0.166 0.1 30.7* 1.585EM-9 3 1.0036 0 0.00 0.1 0* 1.526EM-10 29 1.007 0.03 0.052 0.1 17.9* 1.629EM-11 1440 1.0013 1.44 0.955 0.1 6.6 1.734EM-12 99 1.0068 0.1 0.255 0.1 25.6 1.665EM-13 363 1.0022 0.36 0.241 0.1 6.6 1.69EM-14 385 1.0032 0.39 0.183 0.1 4.7* 1.565EM-15 650 1.0043 0.65 0.252 0.1 3.9 2.017EM-16 696 1.0035 0.7 1.603 0.1 22.9 1.687EM-17 506 1.0045 0.51 2.141 0.1 42.1 1.668
*The bioaccessibility values for this sample may not be meaningful because the total Asin the bulk soil and/or the As in the invitro solution are below or near the detection limit of therespective analytical equipment.
Shading indicates the bioaccessibility column
Table 2-8: As Bioaccessibility Results for Eureka(run at 1.5pH for 1 hour at 39 C)
DetectionLimit
17 0.230
I:Eureka/Bioaccessibility results for Eureka.xls 9/26/2001
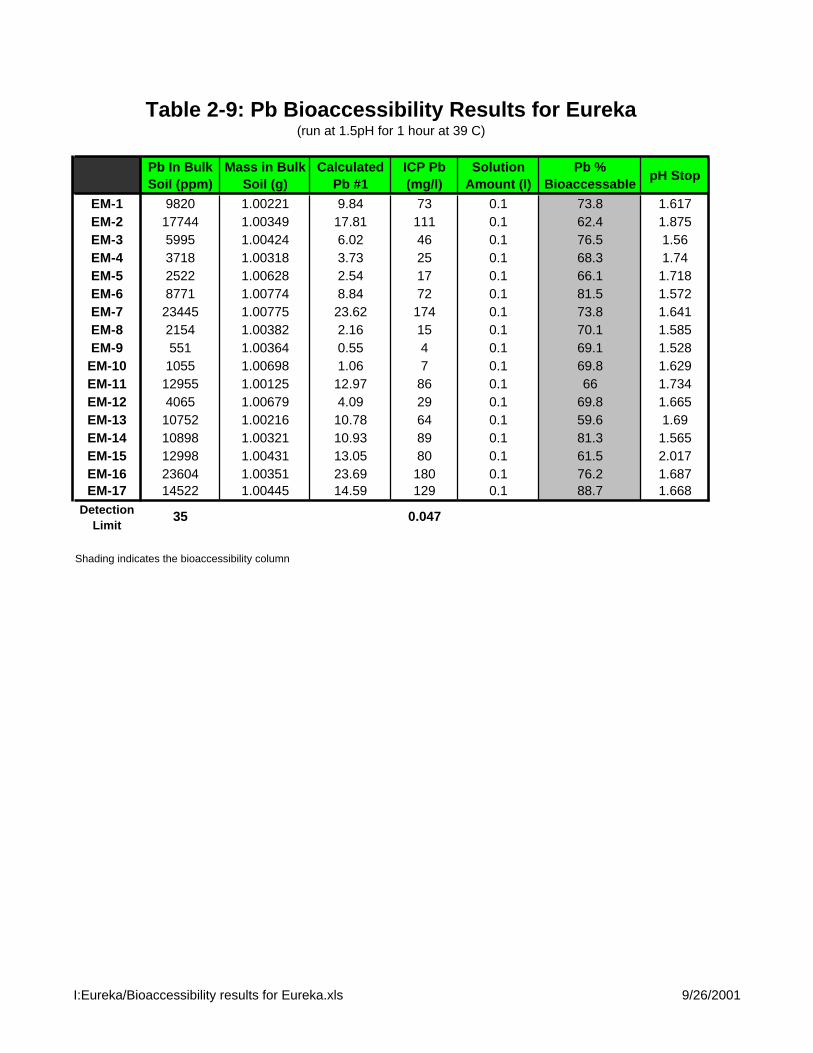
Pb In Bulk Soil (ppm)
Mass in Bulk Soil (g)
CalculatedPb #1
ICP Pb (mg/l)
SolutionAmount (l)
Pb % Bioaccessable
pH Stop
EM-1 9820 1.00221 9.84 73 0.1 73.8 1.617EM-2 17744 1.00349 17.81 111 0.1 62.4 1.875EM-3 5995 1.00424 6.02 46 0.1 76.5 1.56EM-4 3718 1.00318 3.73 25 0.1 68.3 1.74EM-5 2522 1.00628 2.54 17 0.1 66.1 1.718EM-6 8771 1.00774 8.84 72 0.1 81.5 1.572EM-7 23445 1.00775 23.62 174 0.1 73.8 1.641EM-8 2154 1.00382 2.16 15 0.1 70.1 1.585EM-9 551 1.00364 0.55 4 0.1 69.1 1.528EM-10 1055 1.00698 1.06 7 0.1 69.8 1.629EM-11 12955 1.00125 12.97 86 0.1 66 1.734EM-12 4065 1.00679 4.09 29 0.1 69.8 1.665EM-13 10752 1.00216 10.78 64 0.1 59.6 1.69EM-14 10898 1.00321 10.93 89 0.1 81.3 1.565EM-15 12998 1.00431 13.05 80 0.1 61.5 2.017EM-16 23604 1.00351 23.69 180 0.1 76.2 1.687EM-17 14522 1.00445 14.59 129 0.1 88.7 1.668
Shading indicates the bioaccessibility column
Table 2-9: Pb Bioaccessibility Results for Eureka(run at 1.5pH for 1 hour at 39 C)
DetectionLimit
35 0.047
I:Eureka/Bioaccessibility results for Eureka.xls 9/26/2001
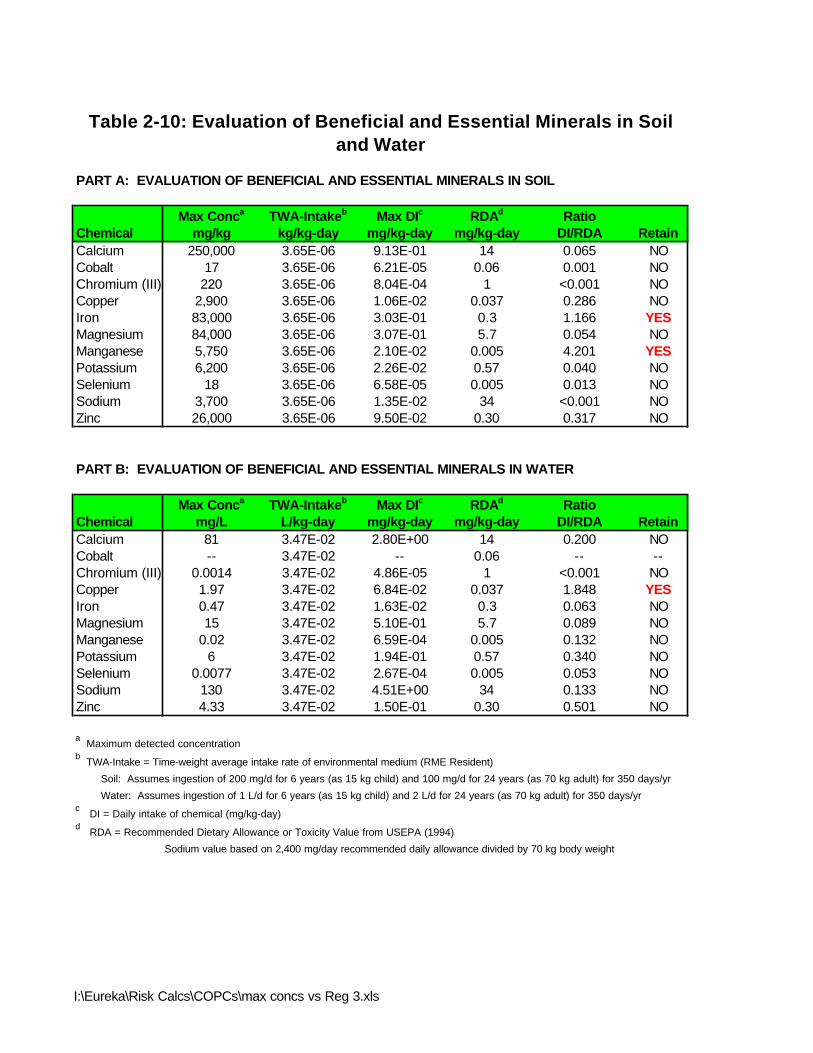
PART A: EVALUATION OF BENEFICIAL AND ESSENTIAL MINERALS IN SOIL
Max Conca TWA-Intakeb Max DIc RDAd RatioChemical mg/kg kg/kg-day mg/kg-day mg/kg-day DI/RDA RetainCalcium 250,000 3.65E-06 9.13E-01 14 0.065 NOCobalt 17 3.65E-06 6.21E-05 0.06 0.001 NOChromium (III) 220 3.65E-06 8.04E-04 1 <0.001 NOCopper 2,900 3.65E-06 1.06E-02 0.037 0.286 NOIron 83,000 3.65E-06 3.03E-01 0.3 1.166 YESMagnesium 84,000 3.65E-06 3.07E-01 5.7 0.054 NOManganese 5,750 3.65E-06 2.10E-02 0.005 4.201 YESPotassium 6,200 3.65E-06 2.26E-02 0.57 0.040 NOSelenium 18 3.65E-06 6.58E-05 0.005 0.013 NOSodium 3,700 3.65E-06 1.35E-02 34 <0.001 NOZinc 26,000 3.65E-06 9.50E-02 0.30 0.317 NO
PART B: EVALUATION OF BENEFICIAL AND ESSENTIAL MINERALS IN WATER
Max Conca TWA-Intakeb Max DIc RDAd RatioChemical mg/L L/kg-day mg/kg-day mg/kg-day DI/RDA RetainCalcium 81 3.47E-02 2.80E+00 14 0.200 NOCobalt -- 3.47E-02 -- 0.06 -- --Chromium (III) 0.0014 3.47E-02 4.86E-05 1 <0.001 NOCopper 1.97 3.47E-02 6.84E-02 0.037 1.848 YESIron 0.47 3.47E-02 1.63E-02 0.3 0.063 NOMagnesium 15 3.47E-02 5.10E-01 5.7 0.089 NOManganese 0.02 3.47E-02 6.59E-04 0.005 0.132 NOPotassium 6 3.47E-02 1.94E-01 0.57 0.340 NOSelenium 0.0077 3.47E-02 2.67E-04 0.005 0.053 NOSodium 130 3.47E-02 4.51E+00 34 0.133 NOZinc 4.33 3.47E-02 1.50E-01 0.30 0.501 NO
a Maximum detected concentrationb TWA-Intake = Time-weight average intake rate of environmental medium (RME Resident) Soil: Assumes ingestion of 200 mg/d for 6 years (as 15 kg child) and 100 mg/d for 24 years (as 70 kg adult) for 350 days/yr Water: Assumes ingestion of 1 L/d for 6 years (as 15 kg child) and 2 L/d for 24 years (as 70 kg adult) for 350 days/yrc DI = Daily intake of chemical (mg/kg-day)d RDA = Recommended Dietary Allowance or Toxicity Value from USEPA (1994)
Sodium value based on 2,400 mg/day recommended daily allowance divided by 70 kg body weight
Table 2-10: Evaluation of Beneficial and Essential Minerals in Soil and Water
I:\Eureka\Risk Calcs\COPCs\max concs vs Reg 3.xls
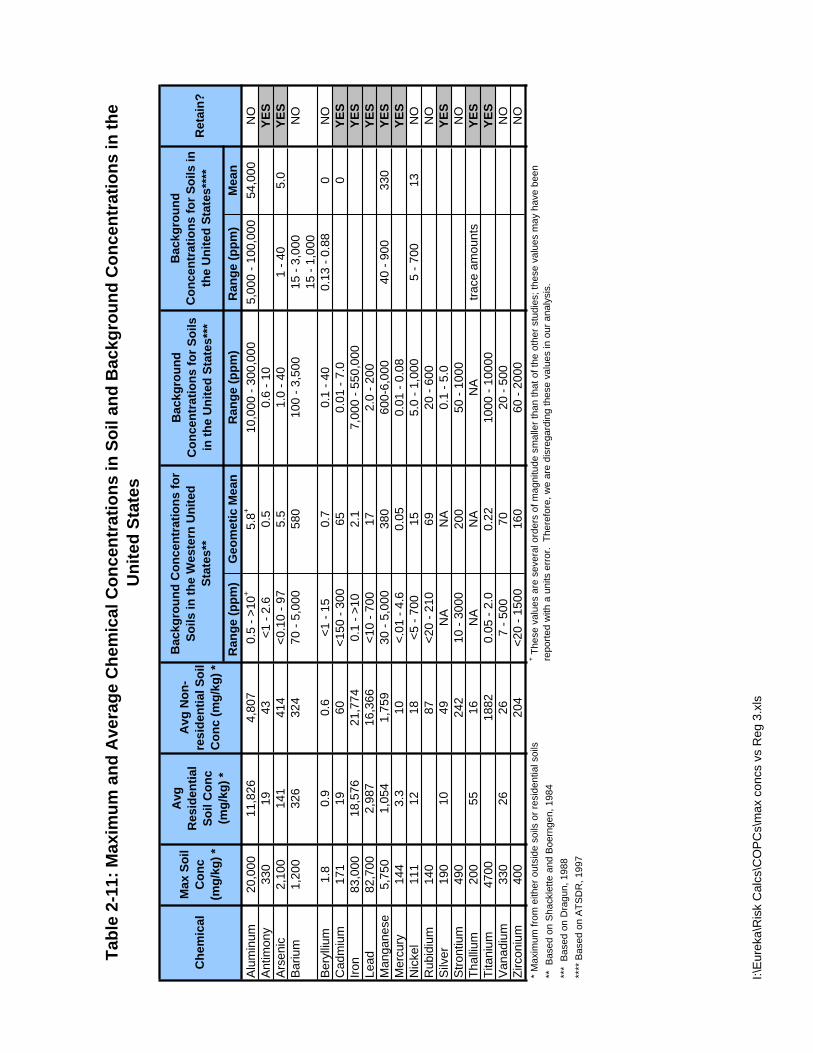
Bac
kgro
un
dC
on
cen
trat
ion
s fo
r S
oils
in
th
e U
nit
ed S
tate
s***
Ran
ge
(pp
m)
Geo
met
ic M
ean
Ran
ge
(pp
m)
Ran
ge
(pp
m)
Mea
n
Alum
inum
20,0
0011
,826
4,80
70.
5 - >
10+
5.8+
10,0
00 -
300,
000
5,00
0 - 1
00,0
0054
,000
NO
Antim
ony
330
1943
<1 -
2.6
0.5
0.6
- 10
YE
SAr
seni
c2,
100
141
414
<0.1
0 - 9
75.
51.
0 - 4
01
- 40
5.0
YE
SBa
rium
1,20
032
632
470
- 5,
000
580
100
- 3,5
0015
- 3,
000
NO
15 -
1,00
0Be
rylliu
m1.
80.
90.
6<1
- 15
0.7
0.1
- 40
0.13
- 0.
880
NO
Cad
miu
m17
119
60<1
50 -
300
650.
01 -
7.0
0Y
ES
Iron
83,0
0018
,576
21,7
740.
1 - >
102.
17,
000
- 550
,000
YE
SLe
ad82
,700
2,98
716
,366
<10
- 700
172.
0 - 2
00Y
ES
Man
gane
se5,
750
1,05
41,
759
30 -
5,00
038
060
0-6,
000
40 -
900
330
YE
SM
ercu
ry14
43.
310
<.01
- 4.
60.
050.
01 -
0.08
YE
SN
icke
l11
112
18<5
- 70
015
5.0
- 1,0
005
- 700
13N
OR
ubid
ium
140
87<2
0 - 2
1069
20 -
600
NO
Silv
er19
010
49N
AN
A0.
1 - 5
.0Y
ES
Stro
ntiu
m49
024
210
- 30
0020
050
- 10
00N
OTh
alliu
m20
055
16N
AN
AN
Atra
ce a
mou
nts
YE
STi
tani
um47
0018
820.
05 -
2.0
0.22
1000
- 10
000
YE
SVa
nadi
um33
026
267
- 500
7020
- 50
0N
OZi
rcon
ium
400
204
<20
- 150
016
060
- 20
00N
O*
Max
imum
from
eith
er o
utsi
de s
oils
or r
esid
entia
l soi
ls**
Bas
ed o
n S
hack
lette
and
Boe
rnge
n, 1
984
***
Bas
ed o
n D
ragu
n, 1
988
****
Bas
ed o
n A
TSD
R, 1
997
+ The
se v
alue
s ar
e se
vera
l ord
ers
of m
agni
tude
sm
alle
r tha
n th
at o
f the
oth
er s
tudi
es; t
hese
val
ues
may
hav
e be
en
repo
rted
with
a u
nits
err
or.
Ther
efor
e, w
e ar
e di
sreg
ardi
ng th
ese
valu
es in
our
ana
lysi
s.
Tab
le 2
-11:
Max
imu
m a
nd
Ave
rag
e C
hem
ical
Co
nce
ntr
atio
ns
in S
oil
and
Bac
kgro
un
d C
on
cen
trat
ion
s in
th
e U
nit
ed S
tate
s
Bac
kgro
un
d C
on
cen
trat
ion
s fo
r S
oils
in t
he
Wes
tern
Un
ited
S
tate
s**
Ch
emic
alM
ax S
oil
Co
nc
(mg
/kg
) *
Ret
ain
?
Avg
Res
iden
tial
So
il C
on
c (m
g/k
g)
*
Avg
No
n-
resi
den
tial
So
il C
on
c (m
g/k
g)
*
Bac
kgro
un
dC
on
cen
trat
ion
s fo
r S
oils
in
the
Un
ited
Sta
tes*
***
I:\E
urek
a\R
isk
Cal
cs\C
OP
Cs\
max
con
cs v
s R
eg 3
.xls
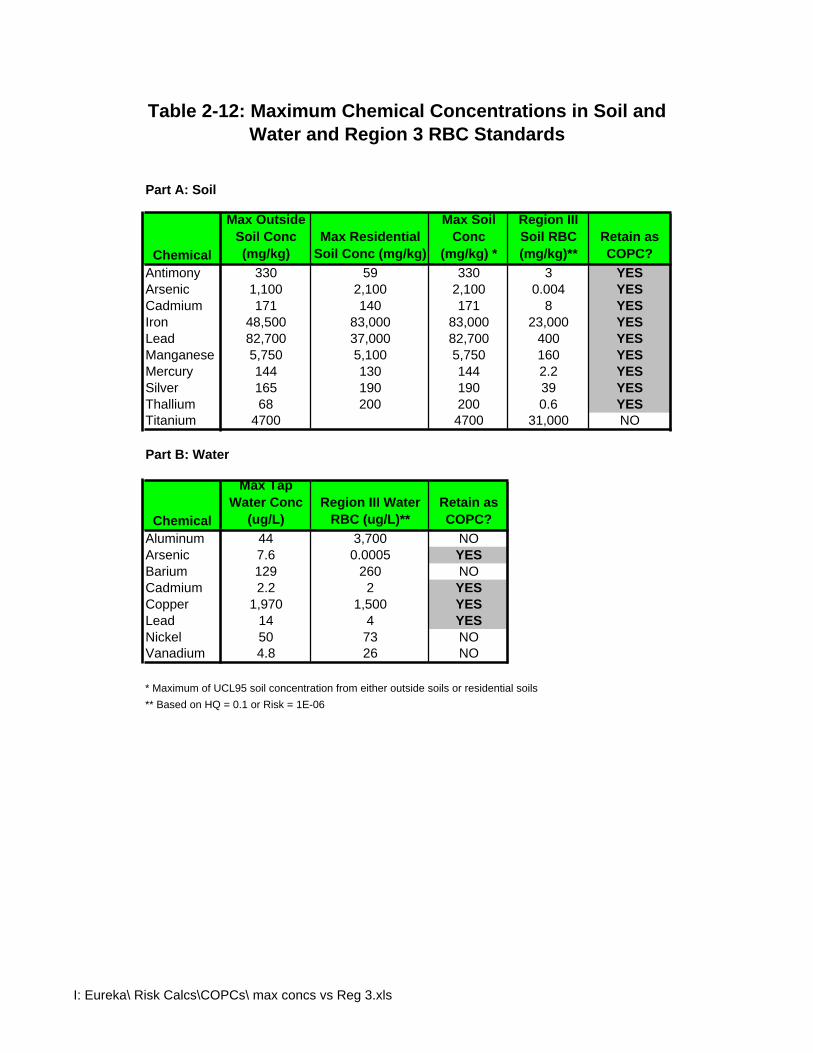
Part A: Soil
Chemical
Max Outside Soil Conc (mg/kg)
Max Residential Soil Conc (mg/kg)
Max Soil Conc
(mg/kg) *
Region III Soil RBC (mg/kg)**
Retain as COPC?
Antimony 330 59 330 3 YESArsenic 1,100 2,100 2,100 0.004 YESCadmium 171 140 171 8 YESIron 48,500 83,000 83,000 23,000 YESLead 82,700 37,000 82,700 400 YESManganese 5,750 5,100 5,750 160 YESMercury 144 130 144 2.2 YESSilver 165 190 190 39 YESThallium 68 200 200 0.6 YESTitanium 4700 4700 31,000 NO
Part B: Water
Chemical
Max Tap Water Conc
(ug/L)Region III Water
RBC (ug/L)**Retain as COPC?
Aluminum 44 3,700 NOArsenic 7.6 0.0005 YESBarium 129 260 NOCadmium 2.2 2 YESCopper 1,970 1,500 YESLead 14 4 YESNickel 50 73 NOVanadium 4.8 26 NO
* Maximum of UCL95 soil concentration from either outside soils or residential soils** Based on HQ = 0.1 or Risk = 1E-06
Table 2-12: Maximum Chemical Concentrations in Soil and Water and Region 3 RBC Standards
I: Eureka\ Risk Calcs\COPCs\ max concs vs Reg 3.xls
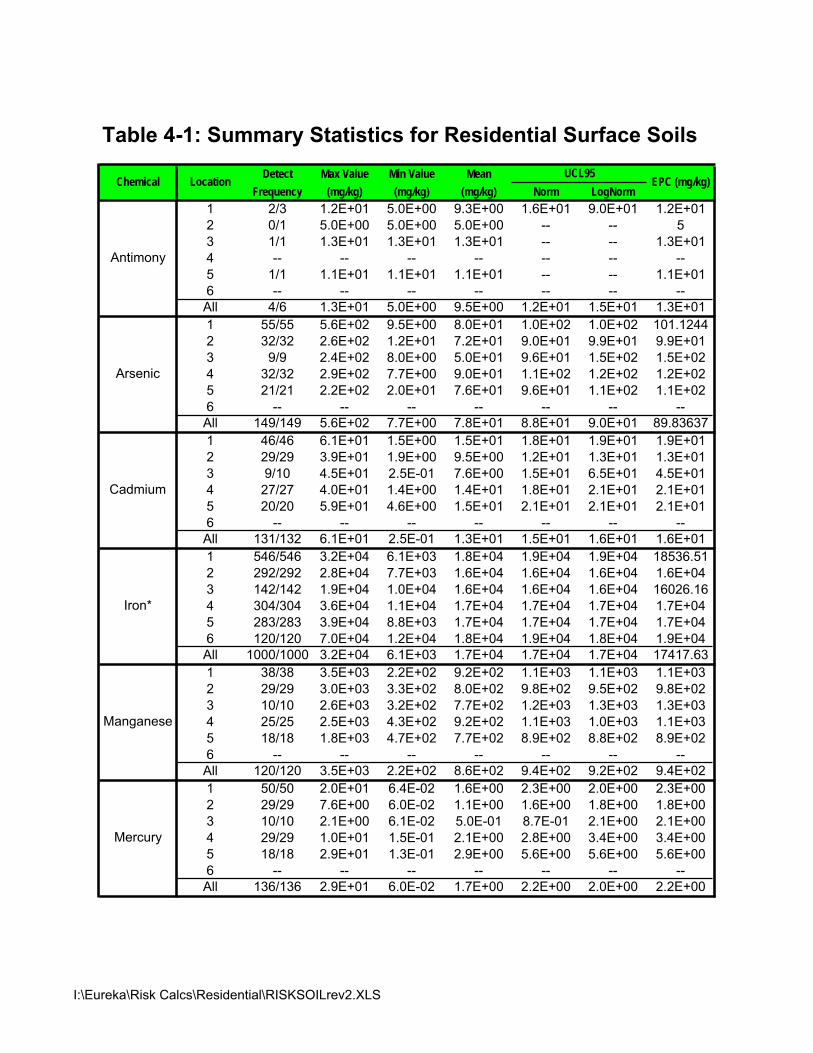
Detect Max Value Min Value MeanFrequency (mg/kg) (mg/kg) (mg/kg) Norm LogNorm
1 2/3 1.2E+01 5.0E+00 9.3E+00 1.6E+01 9.0E+01 1.2E+01
2 0/1 5.0E+00 5.0E+00 5.0E+00 -- -- 5
3 1/1 1.3E+01 1.3E+01 1.3E+01 -- -- 1.3E+01
4 -- -- -- -- -- -- --
5 1/1 1.1E+01 1.1E+01 1.1E+01 -- -- 1.1E+01
6 -- -- -- -- -- -- --
All 4/6 1.3E+01 5.0E+00 9.5E+00 1.2E+01 1.5E+01 1.3E+01
1 55/55 5.6E+02 9.5E+00 8.0E+01 1.0E+02 1.0E+02 101.1244
2 32/32 2.6E+02 1.2E+01 7.2E+01 9.0E+01 9.9E+01 9.9E+01
3 9/9 2.4E+02 8.0E+00 5.0E+01 9.6E+01 1.5E+02 1.5E+02
4 32/32 2.9E+02 7.7E+00 9.0E+01 1.1E+02 1.2E+02 1.2E+02
5 21/21 2.2E+02 2.0E+01 7.6E+01 9.6E+01 1.1E+02 1.1E+02
6 -- -- -- -- -- -- --
All 149/149 5.6E+02 7.7E+00 7.8E+01 8.8E+01 9.0E+01 89.83637
1 46/46 6.1E+01 1.5E+00 1.5E+01 1.8E+01 1.9E+01 1.9E+01
2 29/29 3.9E+01 1.9E+00 9.5E+00 1.2E+01 1.3E+01 1.3E+01
3 9/10 4.5E+01 2.5E-01 7.6E+00 1.5E+01 6.5E+01 4.5E+01
4 27/27 4.0E+01 1.4E+00 1.4E+01 1.8E+01 2.1E+01 2.1E+01
5 20/20 5.9E+01 4.6E+00 1.5E+01 2.1E+01 2.1E+01 2.1E+01
6 -- -- -- -- -- -- --
All 131/132 6.1E+01 2.5E-01 1.3E+01 1.5E+01 1.6E+01 1.6E+01
1 546/546 3.2E+04 6.1E+03 1.8E+04 1.9E+04 1.9E+04 18536.51
2 292/292 2.8E+04 7.7E+03 1.6E+04 1.6E+04 1.6E+04 1.6E+04
3 142/142 1.9E+04 1.0E+04 1.6E+04 1.6E+04 1.6E+04 16026.16
4 304/304 3.6E+04 1.1E+04 1.7E+04 1.7E+04 1.7E+04 1.7E+04
5 283/283 3.9E+04 8.8E+03 1.7E+04 1.7E+04 1.7E+04 1.7E+04
6 120/120 7.0E+04 1.2E+04 1.8E+04 1.9E+04 1.8E+04 1.9E+04
All 1000/1000 3.2E+04 6.1E+03 1.7E+04 1.7E+04 1.7E+04 17417.63
1 38/38 3.5E+03 2.2E+02 9.2E+02 1.1E+03 1.1E+03 1.1E+03
2 29/29 3.0E+03 3.3E+02 8.0E+02 9.8E+02 9.5E+02 9.8E+02
3 10/10 2.6E+03 3.2E+02 7.7E+02 1.2E+03 1.3E+03 1.3E+03
4 25/25 2.5E+03 4.3E+02 9.2E+02 1.1E+03 1.0E+03 1.1E+03
5 18/18 1.8E+03 4.7E+02 7.7E+02 8.9E+02 8.8E+02 8.9E+02
6 -- -- -- -- -- -- --
All 120/120 3.5E+03 2.2E+02 8.6E+02 9.4E+02 9.2E+02 9.4E+02
1 50/50 2.0E+01 6.4E-02 1.6E+00 2.3E+00 2.0E+00 2.3E+00
2 29/29 7.6E+00 6.0E-02 1.1E+00 1.6E+00 1.8E+00 1.8E+00
3 10/10 2.1E+00 6.1E-02 5.0E-01 8.7E-01 2.1E+00 2.1E+00
4 29/29 1.0E+01 1.5E-01 2.1E+00 2.8E+00 3.4E+00 3.4E+00
5 18/18 2.9E+01 1.3E-01 2.9E+00 5.6E+00 5.6E+00 5.6E+00
6 -- -- -- -- -- -- --
All 136/136 2.9E+01 6.0E-02 1.7E+00 2.2E+00 2.0E+00 2.2E+00
LocationChemicalUCL95
Iron*
Table 4-1: Summary Statistics for Residential Surface Soils
Manganese
Mercury
Antimony
Arsenic
EPC (mg/kg)
Cadmium
I:\Eureka\Risk Calcs\Residential\RISKSOILrev2.XLS

Detect Max Value Min Value MeanFrequency (mg/kg) (mg/kg) (mg/kg) Norm LogNorm
LocationChemicalUCL95
EPC (mg/kg)
1 46/48 2.9E+01 5.0E-01 6.6E+00 8.2E+00 9.1E+00 9.1E+00
2 27/29 8.8E+00 5.0E-01 3.8E+00 4.6E+00 5.6E+00 5.6E+00
3 4/5 1.3E+01 5.0E-01 4.2E+00 9.1E+00 2.2E+02 1.3E+01
4 28/29 1.9E+01 5.0E-01 6.2E+00 7.6E+00 9.3E+00 9.3E+00
5 22/22 5.6E+01 1.5E+00 1.0E+01 1.5E+01 1.7E+01 1.7E+01
6 -- -- -- -- -- -- --
All 127/133 5.6E+01 5.0E-01 6.4E+00 7.5E+00 7.6E+00 7.6E+00
1 5/6 1.5E+02 2.5E+01 8.4E+01 1.2E+02 1.8E+02 1.5E+02
2 0/2 2.5E+01 2.5E+01 2.5E+01 2.5E+01 2.5E+01 2.5E+01
3 0/2 2.5E+01 2.5E+01 2.5E+01 2.5E+01 2.5E+01 2.5E+01
4 1/3 5.4E+01 2.5E+01 3.5E+01 6.3E+01 1.8E+02 5.4E+01
5 0/2 2.5E+01 2.5E+01 2.5E+01 2.5E+01 2.5E+01 2.5E+01
6 -- -- -- -- -- -- --
All 6/15 1.5E+02 2.5E+01 5.0E+01 6.8E+01 7.3E+01 7.3E+01
-- No data available
UCL = 95% upper confidence limit of the mean
EPC = Exposure Point Concentration, defined as the UCL or the maximum, whichever is lower
* Iron data is based on adjusted XRF dataset
Silver
Thallium
I:\Eureka\Risk Calcs\Residential\RISKSOILrev2.XLS

Detect Max Value Min Value MeanFrequency (mg/kg) (mg/kg) (mg/kg) Norm LogNorm
1 18/19 2.1E+01 7.0E-01 6.5E+00 8.5E+00 1.0E+01 10.23387
2 10/10 5.9E+00 2.0E+00 3.6E+00 4.2E+00 4.4E+00 4.4E+00
3 -- -- -- -- -- -- --
4 13/13 1.2E+01 3.1E+00 6.1E+00 7.5E+00 7.9E+00 7.9E+00
5 8/8 7.6E+00 2.2E+00 5.0E+00 6.4E+00 7.5E+00 7.5E+00
6 -- -- -- -- -- -- --
All 50/51 2.1E+01 7.0E-01 5.5E+00 6.4E+00 6.5E+00 6.5E+00
1 23/23 1.2E+02 1.0E+01 4.3E+01 5.1E+01 5.6E+01 5.6E+01
2 11/11 4.1E+01 1.1E+01 2.5E+01 3.1E+01 3.4E+01 3.4E+01
3 -- -- -- -- -- -- --
4 14/14 6.3E+01 1.4E+01 4.1E+01 4.9E+01 5.4E+01 5.4E+01
5 8/8 7.4E+01 1.9E+01 4.3E+01 5.5E+01 6.3E+01 6.3E+01
6 -- -- -- -- -- -- --
All 57/57 1.2E+02 1.0E+01 4.0E+01 4.4E+01 4.6E+01 45.84195
1 21/21 1.2E+01 2.0E+00 7.7E+00 8.8E+00 9.4E+00 9.4E+00
2 11/11 1.0E+01 2.2E+00 5.7E+00 7.0E+00 7.6E+00 7.6E+00
3 -- -- -- -- -- -- --
4 14/14 1.9E+01 2.1E+00 7.7E+00 9.7E+00 1.1E+01 1.1E+01
5 8/8 1.4E+01 3.4E+00 8.0E+00 1.0E+01 1.2E+01 1.2E+01
6 -- -- -- -- -- -- --
All 55/55 1.9E+01 2.0E+00 7.4E+00 8.1E+00 8.4E+00 8.4E+00
1 21/21 1.4E+04 3.3E+03 9.6E+03 1.1E+04 1.2E+04 1.2E+04
2 11/11 1.1E+04 4.0E+03 7.8E+03 9.2E+03 9.9E+03 9.9E+03
3
4 14/14 2.7E+04 4.2E+03 1.0E+04 1.3E+04 1.3E+04 1.3E+04
5 7/7 1.3E+04 4.7E+03 9.7E+03 1.2E+04 1.3E+04 1.3E+04
6 -- -- -- -- -- -- --
All 54/54 2.7E+04 3.3E+03 9.3E+03 1.0E+04 1.0E+04 1.0E+04
1 23/23 1.5E+03 1.2E+02 4.7E+02 5.7E+02 5.9E+02 5.9E+02
2 10/10 4.7E+02 1.8E+02 3.4E+02 4.0E+02 4.3E+02 4.3E+02
3 -- -- -- -- -- -- --
4 14/14 6.1E+02 1.8E+02 4.3E+02 4.9E+02 5.3E+02 5.3E+02
5 8/8 7.1E+02 1.8E+02 4.9E+02 6.1E+02 7.3E+02 7.1E+02
6 -- -- -- -- -- -- --
All 56/56 1.5E+03 1.2E+02 4.4E+02 4.8E+02 4.9E+02 4.9E+02
1 21/21 2.7E+00 1.6E-01 7.4E-01 9.6E-01 1.0E+00 1.0E+00
2 10/10 9.4E-01 1.0E-01 4.0E-01 5.8E-01 8.2E-01 8.2E-01
3 -- -- -- -- -- -- --
4 11/11 2.2E+00 4.0E-01 9.4E-01 1.2E+00 1.4E+00 1.4E+00
5 7/7 9.4E-01 1.2E-01 4.8E-01 6.7E-01 1.0E+00 9.4E-01
6
All 50/50 2.7E+00 1.0E-01 6.7E-01 7.9E-01 8.4E-01 8.4E-01
Table 4-2: Summary Statistics for Indoor Dust
Manganese
Mercury
Antimony
Arsenic
EPC (mg/kg)
Cadmium
Location
Iron
ChemicalUCL95
I:\Eureka\Risk Calcs\Residential\RISKSOILrev2.XLS
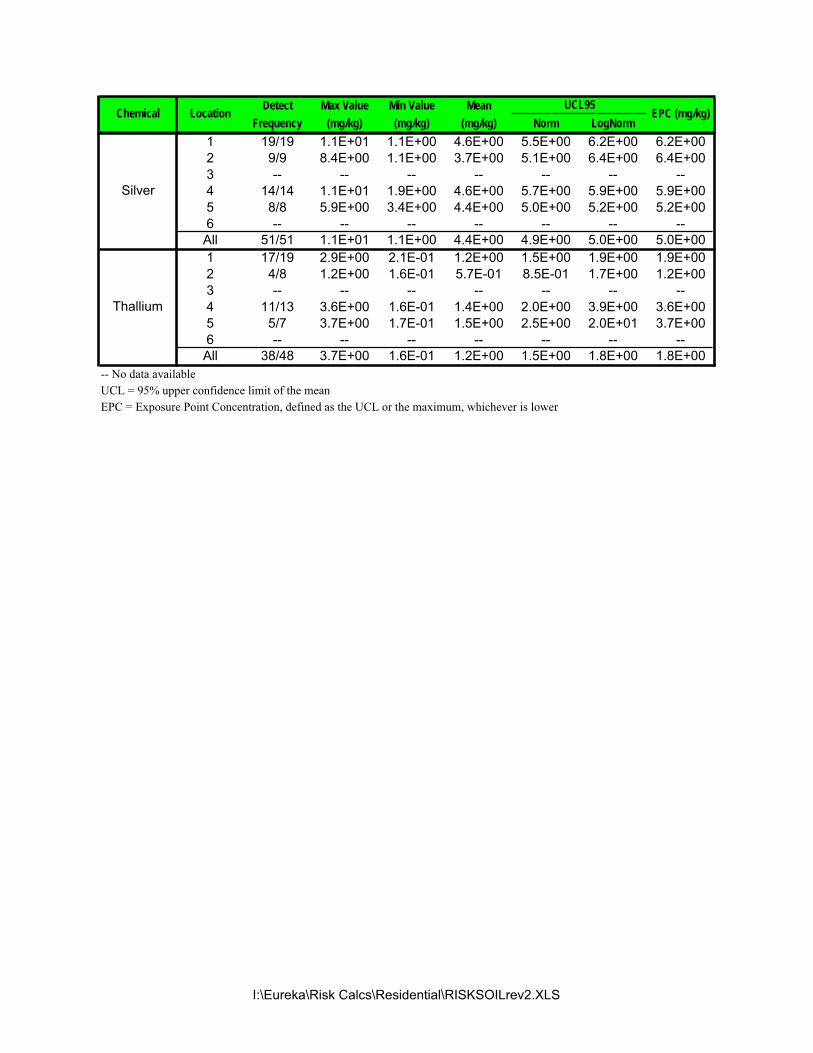
Detect Max Value Min Value MeanFrequency (mg/kg) (mg/kg) (mg/kg) Norm LogNorm
EPC (mg/kg)LocationChemicalUCL95
1 19/19 1.1E+01 1.1E+00 4.6E+00 5.5E+00 6.2E+00 6.2E+00
2 9/9 8.4E+00 1.1E+00 3.7E+00 5.1E+00 6.4E+00 6.4E+00
3 -- -- -- -- -- -- --
4 14/14 1.1E+01 1.9E+00 4.6E+00 5.7E+00 5.9E+00 5.9E+00
5 8/8 5.9E+00 3.4E+00 4.4E+00 5.0E+00 5.2E+00 5.2E+00
6 -- -- -- -- -- -- --
All 51/51 1.1E+01 1.1E+00 4.4E+00 4.9E+00 5.0E+00 5.0E+00
1 17/19 2.9E+00 2.1E-01 1.2E+00 1.5E+00 1.9E+00 1.9E+00
2 4/8 1.2E+00 1.6E-01 5.7E-01 8.5E-01 1.7E+00 1.2E+00
3 -- -- -- -- -- -- --
4 11/13 3.6E+00 1.6E-01 1.4E+00 2.0E+00 3.9E+00 3.6E+00
5 5/7 3.7E+00 1.7E-01 1.5E+00 2.5E+00 2.0E+01 3.7E+00
6 -- -- -- -- -- -- --
All 38/48 3.7E+00 1.6E-01 1.2E+00 1.5E+00 1.8E+00 1.8E+00
-- No data available
UCL = 95% upper confidence limit of the mean
EPC = Exposure Point Concentration, defined as the UCL or the maximum, whichever is lower
Thallium
Silver
I:\Eureka\Risk Calcs\Residential\RISKSOILrev2.XLS

Detection Max Min
Frequency Value (ppb) Value (ppb) Norm LogNorm
Arsenic All Tap Water 25/54 7.6 1.3 2.9 3.3 3.3 3.3
Cadmium All Tap Water 12/54 2.2 0.1 0.3 0.3 0.3 0.3
Table 4-3: Summary Statistics for Residential Tap Water
UCL95EPC (ppb)Chemical Location Medium Mean (ppb)
I:\Eureka\Risk Calcs\Residential\RISKH2O.xls
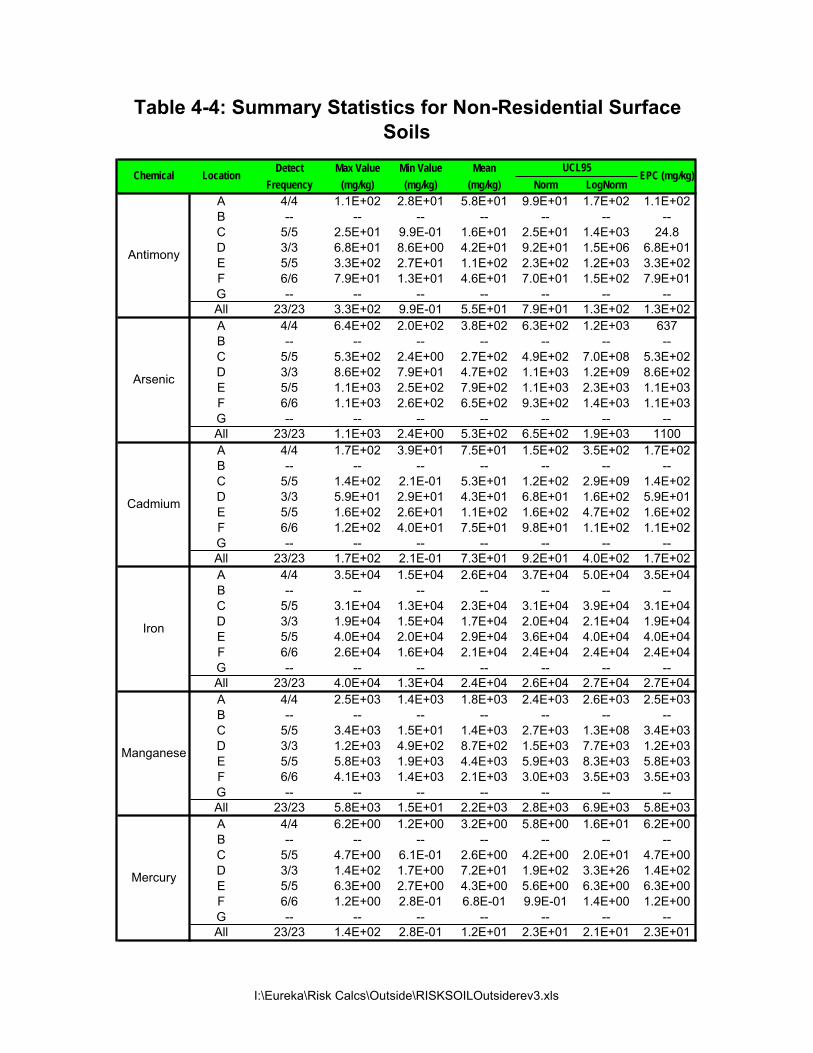
Detect Max Value Min Value MeanFrequency (mg/kg) (mg/kg) (mg/kg) Norm LogNorm
A 4/4 1.1E+02 2.8E+01 5.8E+01 9.9E+01 1.7E+02 1.1E+02
B -- -- -- -- -- -- --
C 5/5 2.5E+01 9.9E-01 1.6E+01 2.5E+01 1.4E+03 24.8
D 3/3 6.8E+01 8.6E+00 4.2E+01 9.2E+01 1.5E+06 6.8E+01
E 5/5 3.3E+02 2.7E+01 1.1E+02 2.3E+02 1.2E+03 3.3E+02
F 6/6 7.9E+01 1.3E+01 4.6E+01 7.0E+01 1.5E+02 7.9E+01
G -- -- -- -- -- -- --
All 23/23 3.3E+02 9.9E-01 5.5E+01 7.9E+01 1.3E+02 1.3E+02
A 4/4 6.4E+02 2.0E+02 3.8E+02 6.3E+02 1.2E+03 637
B -- -- -- -- -- -- --
C 5/5 5.3E+02 2.4E+00 2.7E+02 4.9E+02 7.0E+08 5.3E+02
D 3/3 8.6E+02 7.9E+01 4.7E+02 1.1E+03 1.2E+09 8.6E+02
E 5/5 1.1E+03 2.5E+02 7.9E+02 1.1E+03 2.3E+03 1.1E+03
F 6/6 1.1E+03 2.6E+02 6.5E+02 9.3E+02 1.4E+03 1.1E+03
G -- -- -- -- -- -- --
All 23/23 1.1E+03 2.4E+00 5.3E+02 6.5E+02 1.9E+03 1100
A 4/4 1.7E+02 3.9E+01 7.5E+01 1.5E+02 3.5E+02 1.7E+02
B -- -- -- -- -- -- --
C 5/5 1.4E+02 2.1E-01 5.3E+01 1.2E+02 2.9E+09 1.4E+02
D 3/3 5.9E+01 2.9E+01 4.3E+01 6.8E+01 1.6E+02 5.9E+01
E 5/5 1.6E+02 2.6E+01 1.1E+02 1.6E+02 4.7E+02 1.6E+02
F 6/6 1.2E+02 4.0E+01 7.5E+01 9.8E+01 1.1E+02 1.1E+02
G -- -- -- -- -- -- --
All 23/23 1.7E+02 2.1E-01 7.3E+01 9.2E+01 4.0E+02 1.7E+02
A 4/4 3.5E+04 1.5E+04 2.6E+04 3.7E+04 5.0E+04 3.5E+04
B -- -- -- -- -- -- --
C 5/5 3.1E+04 1.3E+04 2.3E+04 3.1E+04 3.9E+04 3.1E+04
D 3/3 1.9E+04 1.5E+04 1.7E+04 2.0E+04 2.1E+04 1.9E+04
E 5/5 4.0E+04 2.0E+04 2.9E+04 3.6E+04 4.0E+04 4.0E+04
F 6/6 2.6E+04 1.6E+04 2.1E+04 2.4E+04 2.4E+04 2.4E+04
G -- -- -- -- -- -- --
All 23/23 4.0E+04 1.3E+04 2.4E+04 2.6E+04 2.7E+04 2.7E+04
A 4/4 2.5E+03 1.4E+03 1.8E+03 2.4E+03 2.6E+03 2.5E+03
B -- -- -- -- -- -- --
C 5/5 3.4E+03 1.5E+01 1.4E+03 2.7E+03 1.3E+08 3.4E+03
D 3/3 1.2E+03 4.9E+02 8.7E+02 1.5E+03 7.7E+03 1.2E+03
E 5/5 5.8E+03 1.9E+03 4.4E+03 5.9E+03 8.3E+03 5.8E+03
F 6/6 4.1E+03 1.4E+03 2.1E+03 3.0E+03 3.5E+03 3.5E+03
G -- -- -- -- -- -- --
All 23/23 5.8E+03 1.5E+01 2.2E+03 2.8E+03 6.9E+03 5.8E+03
A 4/4 6.2E+00 1.2E+00 3.2E+00 5.8E+00 1.6E+01 6.2E+00
B -- -- -- -- -- -- --
C 5/5 4.7E+00 6.1E-01 2.6E+00 4.2E+00 2.0E+01 4.7E+00
D 3/3 1.4E+02 1.7E+00 7.2E+01 1.9E+02 3.3E+26 1.4E+02
E 5/5 6.3E+00 2.7E+00 4.3E+00 5.6E+00 6.3E+00 6.3E+00
F 6/6 1.2E+00 2.8E-01 6.8E-01 9.9E-01 1.4E+00 1.2E+00
G -- -- -- -- -- -- --
All 23/23 1.4E+02 2.8E-01 1.2E+01 2.3E+01 2.1E+01 2.3E+01
Table 4-4: Summary Statistics for Non-Residential Surface
Soils
Arsenic
EPC (mg/kg)
Antimony
UCL95Chemical Location
Manganese
Cadmium
Mercury
Iron
I:\Eureka\Risk Calcs\Outside\RISKSOILOutsiderev3.xls
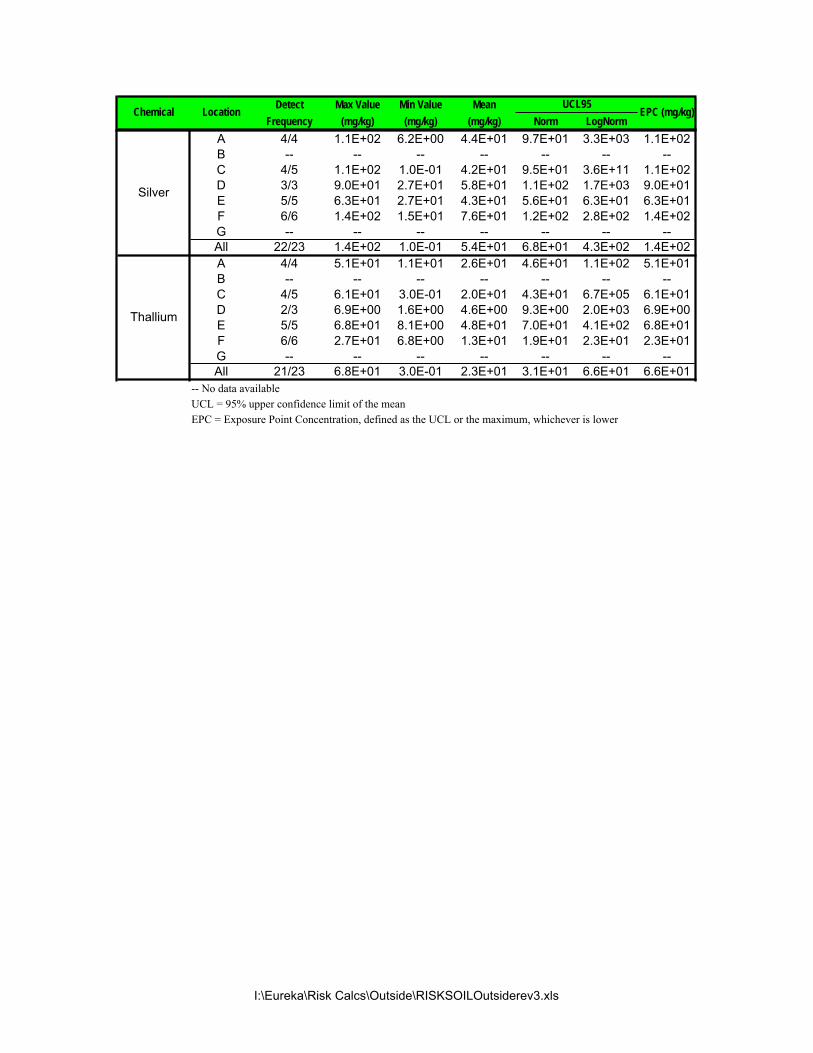
Detect Max Value Min Value MeanFrequency (mg/kg) (mg/kg) (mg/kg) Norm LogNorm
EPC (mg/kg)UCL95
Chemical Location
A 4/4 1.1E+02 6.2E+00 4.4E+01 9.7E+01 3.3E+03 1.1E+02
B -- -- -- -- -- -- --
C 4/5 1.1E+02 1.0E-01 4.2E+01 9.5E+01 3.6E+11 1.1E+02
D 3/3 9.0E+01 2.7E+01 5.8E+01 1.1E+02 1.7E+03 9.0E+01
E 5/5 6.3E+01 2.7E+01 4.3E+01 5.6E+01 6.3E+01 6.3E+01
F 6/6 1.4E+02 1.5E+01 7.6E+01 1.2E+02 2.8E+02 1.4E+02
G -- -- -- -- -- -- --
All 22/23 1.4E+02 1.0E-01 5.4E+01 6.8E+01 4.3E+02 1.4E+02
A 4/4 5.1E+01 1.1E+01 2.6E+01 4.6E+01 1.1E+02 5.1E+01
B -- -- -- -- -- -- --
C 4/5 6.1E+01 3.0E-01 2.0E+01 4.3E+01 6.7E+05 6.1E+01
D 2/3 6.9E+00 1.6E+00 4.6E+00 9.3E+00 2.0E+03 6.9E+00
E 5/5 6.8E+01 8.1E+00 4.8E+01 7.0E+01 4.1E+02 6.8E+01
F 6/6 2.7E+01 6.8E+00 1.3E+01 1.9E+01 2.3E+01 2.3E+01
G -- -- -- -- -- -- --
All 21/23 6.8E+01 3.0E-01 2.3E+01 3.1E+01 6.6E+01 6.6E+01
-- No data available
UCL = 95% upper confidence limit of the mean
EPC = Exposure Point Concentration, defined as the UCL or the maximum, whichever is lower
Silver
Thallium
I:\Eureka\Risk Calcs\Outside\RISKSOILOutsiderev3.xls
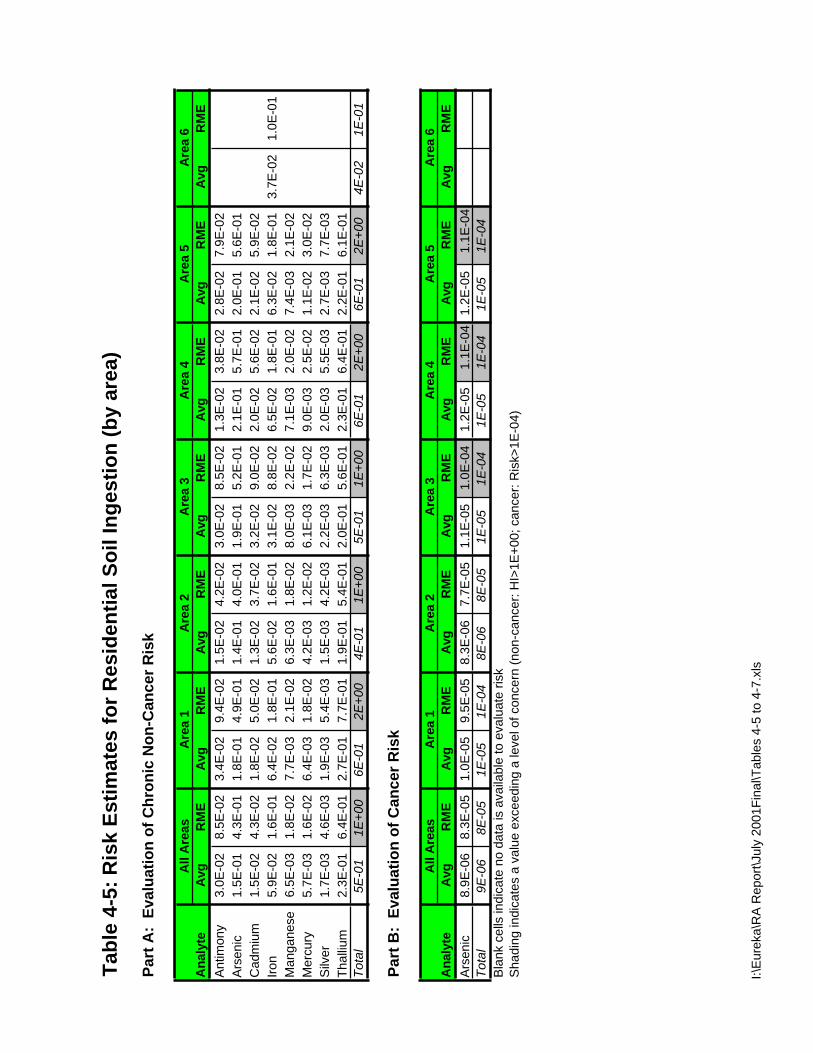
Tab
le 4
-5:
Ris
k E
stim
ates
fo
r R
esid
enti
al S
oil
Ing
esti
on
(b
y ar
ea)
Par
t A
: E
valu
atio
n o
f C
hro
nic
No
n-C
ance
r R
isk
All
Are
asA
rea
1A
rea
2A
rea
3A
rea
4A
rea
5A
rea
6A
nal
yte
Avg
RM
EA
vgR
ME
Avg
RM
EA
vgR
ME
Avg
RM
EA
vgR
ME
Avg
RM
EAn
timon
y3.
0E-0
28.
5E-0
23.
4E-0
29.
4E-0
21.
5E-0
24.
2E-0
23.
0E-0
28.
5E-0
21.
3E-0
23.
8E-0
22.
8E-0
27.
9E-0
20.
0E+0
00.
0E+0
0Ar
seni
c1.
5E-0
14.
3E-0
11.
8E-0
14.
9E-0
11.
4E-0
14.
0E-0
11.
9E-0
15.
2E-0
12.
1E-0
15.
7E-0
12.
0E-0
15.
6E-0
10.
0E+0
00.
0E+0
0C
adm
ium
1.5E
-02
4.3E
-02
1.8E
-02
5.0E
-02
1.3E
-02
3.7E
-02
3.2E
-02
9.0E
-02
2.0E
-02
5.6E
-02
2.1E
-02
5.9E
-02
0.0E
+00
0.0E
+00
Iron
5.9E
-02
1.6E
-01
6.4E
-02
1.8E
-01
5.6E
-02
1.6E
-01
3.1E
-02
8.8E
-02
6.5E
-02
1.8E
-01
6.3E
-02
1.8E
-01
3.7E
-02
1.0E
-01
Man
gane
se6.
5E-0
31.
8E-0
27.
7E-0
32.
1E-0
26.
3E-0
31.
8E-0
28.
0E-0
32.
2E-0
27.
1E-0
32.
0E-0
27.
4E-0
32.
1E-0
20.
0E+0
00.
0E+0
0M
ercu
ry5.
7E-0
31.
6E-0
26.
4E-0
31.
8E-0
24.
2E-0
31.
2E-0
26.
1E-0
31.
7E-0
29.
0E-0
32.
5E-0
21.
1E-0
23.
0E-0
20.
0E+0
00.
0E+0
0Si
lver
1.7E
-03
4.6E
-03
1.9E
-03
5.4E
-03
1.5E
-03
4.2E
-03
2.2E
-03
6.3E
-03
2.0E
-03
5.5E
-03
2.7E
-03
7.7E
-03
0.0E
+00
0.0E
+00
Thal
lium
2.3E
-01
6.4E
-01
2.7E
-01
7.7E
-01
1.9E
-01
5.4E
-01
2.0E
-01
5.6E
-01
2.3E
-01
6.4E
-01
2.2E
-01
6.1E
-01
0.0E
+00
0.0E
+00
Tota
l5E
-01
1E+0
06E
-01
2E+0
04E
-01
1E+0
05E
-01
1E+0
06E
-01
2E+0
06E
-01
2E+0
04E
-02
1E-0
1
Par
t B
: E
valu
atio
n o
f C
ance
r R
isk
All
Are
asA
rea
1A
rea
2A
rea
3A
rea
4A
rea
5A
rea
6A
nal
yte
Avg
RM
EA
vgR
ME
Avg
RM
EA
vgR
ME
Avg
RM
EA
vgR
ME
Avg
RM
EAr
seni
c8.
9E-0
68.
3E-0
51.
0E-0
59.
5E-0
58.
3E-0
67.
7E-0
51.
1E-0
51.
0E-0
41.
2E-0
51.
1E-0
41.
2E-0
51.
1E-0
40.
0E+0
00.
0E+0
0To
tal
9E-0
68E
-05
1E-0
51E
-04
8E-0
68E
-05
1E-0
51E
-04
1E-0
51E
-04
1E-0
51E
-04
0E+0
00E
+00
Blan
k ce
lls in
dica
te n
o da
ta is
ava
ilabl
e to
eva
luat
e ris
kSh
adin
g in
dica
tes
a va
lue
exce
edin
g a
leve
l of c
once
rn (n
on-c
ance
r: H
I>1E
+00;
can
cer:
Ris
k>1E
-04)
I:\Eu
reka
\RA
Rep
ort\J
uly
2001
Fina
l\Tab
les
4-5
to 4
-7.x
ls
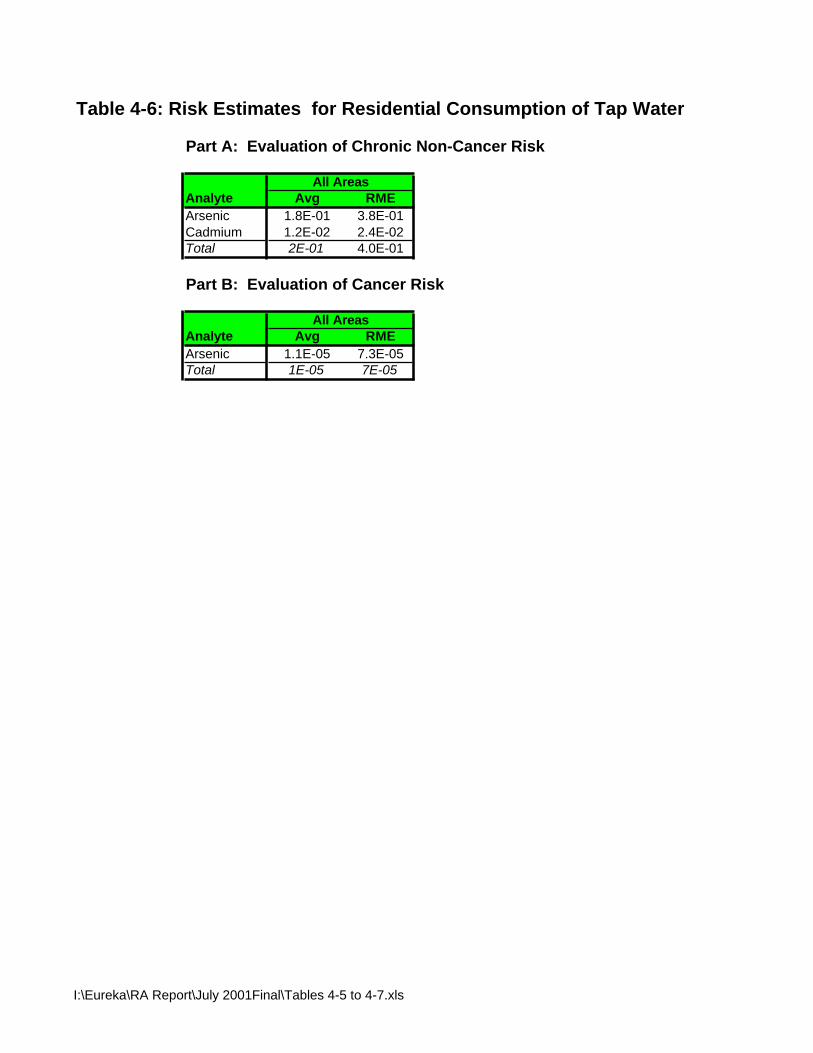
Table 4-6: Risk Estimates for Residential Consumption of Tap Water
Part A: Evaluation of Chronic Non-Cancer Risk
All AreasAnalyte Avg RMEArsenic 1.8E-01 3.8E-01Cadmium 1.2E-02 2.4E-02Total 2E-01 4.0E-01
Part B: Evaluation of Cancer Risk
All AreasAnalyte Avg RMEArsenic 1.1E-05 7.3E-05Total 1E-05 7E-05
I:\Eureka\RA Report\July 2001Final\Tables 4-5 to 4-7.xls

Tab
le 4
-7:
Ris
k E
stim
ates
at
No
n-R
esid
enti
al A
reas
RE
CR
EA
TIO
NA
L U
SE
R
Par
t A
: E
valu
atio
n o
f C
hro
nic
No
n-C
ance
r R
isk
Are
a A
Are
a B
Are
a C
Are
a D
Are
a E
Are
a F
Are
a G
An
alyt
eA
vgR
ME
Avg
RM
EA
vgR
ME
Avg
RM
EA
vgR
ME
Avg
RM
EA
vgR
ME
Ant
imon
y3E
-01
1E+0
00E
+00
0E+0
06E
-02
3E-0
12E
-01
8E-0
18E
-01
4E+0
02E
-01
9E-0
10.
0E+0
00.
0E+0
0A
rsen
ic1E
+00
5E+0
00E
+00
0E+0
01E
+00
5E+0
02E
+00
7E+0
02E
+00
9E+0
02E
+00
9E+0
00.
0E+0
00.
0E+0
0C
adm
ium
2E-0
18E
-01
0E+0
00E
+00
1E-0
16E
-01
6E-0
23E
-01
2E-0
17E
-01
1E-0
15E
-01
0.0E
+00
0.0E
+00
Iron
1E-0
15E
-01
0E+0
00E
+00
0E+0
00E
+00
0E+0
00E
+00
0E+0
00E
+00
0E+0
00E
+00
0.0E
+00
0.0E
+00
Man
gane
se2E
-02
8E-0
20E
+00
0E+0
02E
-02
1E-0
19E
-03
4E-0
24E
-02
2E-0
12E
-02
1E-0
10.
0E+0
00.
0E+0
0M
ercu
ry2E
-02
1E-0
10E
+00
0E+0
02E
-02
7E-0
25E
-01
2E+0
02E
-02
1E-0
14E
-03
2E-0
20.
0E+0
00.
0E+0
0S
ilver
2E-0
21E
-01
0E+0
00E
+00
2E-0
21E
-01
2E-0
28E
-02
1E-0
26E
-02
3E-0
21E
-01
0.0E
+00
0.0E
+00
Thal
lium
6E-0
13E
+00
0E+0
00E
+00
8E-0
14E
+00
9E-0
24E
-01
8E-0
14E
+00
3E-0
11E
+00
0.0E
+00
0.0E
+00
Tota
l2E
+00
1E+0
10E
+00
0E+0
02E
+00
9E+0
02E
+00
1E+0
14E
+00
2E+0
13E
+00
1E+0
10E
+00
0E+0
0
Par
t B
: E
valu
atio
n o
f C
ance
r R
isk
Are
a A
Are
a B
Are
a C
Are
a D
Are
a E
Are
a F
Are
a G
An
alyt
eA
vgR
ME
Avg
RM
EA
vgR
ME
Avg
RM
EA
vgR
ME
Avg
RM
EA
vgR
ME
Ars
enic
5E-0
54E
-04
0E+0
00E
+00
4E-0
53E
-04
6E-0
56E
-04
8E-0
57E
-04
8E-0
57E
-04
0.0E
+00
0.0E
+00
Tota
l5E
-05
4E-0
40E
+00
0E+0
04E
-05
3E-0
46E
-05
6E-0
48E
-05
7E-0
48E
-05
7E-0
40E
+00
0E+0
0
FU
TU
RE
RE
SID
EN
TIA
L
Par
t A
: E
valu
atio
n o
f C
hro
nic
No
n-C
ance
r R
isk
Are
a A
Are
a B
Are
a C
Are
a D
Are
a E
Are
a F
Are
a G
An
alyt
eA
vgR
ME
Avg
RM
EA
vgR
ME
Avg
RM
EA
vgR
ME
Avg
RM
EA
vgR
ME
Ant
imon
y2E
-01
5E-0
10E
+00
0E+0
04E
-02
1E-0
11E
-01
3E-0
16E
-01
2E+0
01E
-01
4E-0
10E
+00
0E+0
0A
rsen
ic8E
-01
2E+0
00E
+00
0E+0
07E
-01
2E+0
01E
+00
3E+0
01E
+00
4E+0
01E
+00
4E+0
00E
+00
0E+0
0C
adm
ium
1E-0
13E
-01
0E+0
00E
+00
9E-0
23E
-01
4E-0
21E
-01
1E-0
13E
-01
8E-0
22E
-01
0E+0
00E
+00
Iron
8E-0
22E
-01
0E+0
00E
+00
0E+0
00E
+00
0E+0
00E
+00
0E+0
00E
+00
0E+0
00E
+00
0E+0
00E
+00
Man
gane
se1E
-02
4E-0
20E
+00
0E+0
02E
-02
5E-0
26E
-03
2E-0
23E
-02
8E-0
22E
-02
5E-0
20E
+00
0E+0
0M
ercu
ry1E
-02
4E-0
20E
+00
0E+0
01E
-02
3E-0
23E
-01
9E-0
11E
-02
4E-0
23E
-03
8E-0
30E
+00
0E+0
0S
ilver
2E-0
24E
-02
0E+0
00E
+00
2E-0
24E
-02
1E-0
24E
-02
9E-0
32E
-02
2E-0
25E
-02
0E+0
00E
+00
Thal
lium
4E-0
11E
+00
0E+0
00E
+00
5E-0
11E
+00
6E-0
22E
-01
6E-0
12E
+00
2E-0
16E
-01
0E+0
00E
+00
Tota
l2E
+00
5E+0
00E
+00
0E+0
01E
+00
4E+0
02E
+00
5E+0
03E
+00
8E+0
02E
+00
5E+0
00E
+00
0E+0
0
Par
t B
: E
valu
atio
n o
f C
ance
r R
isk
Are
a A
Are
a B
Are
a C
Are
a D
Are
a E
Are
a F
Are
a G
An
alyt
eA
vgR
ME
Avg
RM
EA
vgR
ME
Avg
RM
EA
vgR
ME
Avg
RM
EA
vgR
ME
Ars
enic
4.7E
-05
4.4E
-04
0.0E
+00
0.0E
+00
3.9E
-05
3.7E
-04
6.4E
-05
5.9E
-04
8.0E
-05
7.4E
-04
8.1E
-05
7.6E
-04
0.0E
+00
0.0E
+00
Tota
l5E
-05
4E-0
40E
+00
0.0E
+00
4E-0
54E
-04
6E-0
56E
-04
8E-0
57E
-04
8E-0
58E
-04
0E+0
00E
+00
Bla
nk c
ells
indi
cate
no
data
is a
vaila
ble
to e
valu
ate
risk
Sha
ding
indi
cate
s a
valu
e ex
ceed
ing
a le
vel o
f con
cern
(non
-can
cer:
HI>
1E+0
0; c
ance
r: R
isk>
1E-0
4)
I:\E
urek
a\R
A R
epor
t\Jul
y 20
01Fi
nal\T
able
s 4-
5 to
4-7
.xls

Area* Count Min (mg/kg) Max (mg/kg) Avg (mg/kg)
01 0 -- -- --
02 7 55 2,384 615
03 2 1,490 7,897 4,694
04 2 5,662 20,860 13,261
05 2 9,983 75,990 42,987
06 28 462 6,407 2,584
07 4 9,834 11,771 10,989
08 5 7,003 9,536 8,404
09 5 12,516 22,350 18,506
10 7 2,235 8,791 5,556
11 4 2,682 31,290 20,041
12 2 2,533 2,831 2,682
13 3 8,046 12,218 10,827
14 5 7,003 37,250 13,827
15 9 2,086 3,427 2,881
16 12 5,513 20,860 12,479
17 2 5,662 10,579 8,121
18 9 1,639 22,350 10,546
19 10 2,533 14,900 5,811
20 8 12,218 44,700 23,039
21 2 3,278 7,599 5,439
22 2 6,556 10,132 8,344
23 2 253 373 313
24 4 2,533 3,129 2,868
25 20 2,980 10,132 5,491 Based on adjusted XRF data set * See Figure 2-4 for map location
Table 5-1: Summary Statistics for Lead in Surface Soils Collected From Non-Residential Areas
I:\Eureka\Risk Calcs\Outside\Outside Lead Summary v2.xls
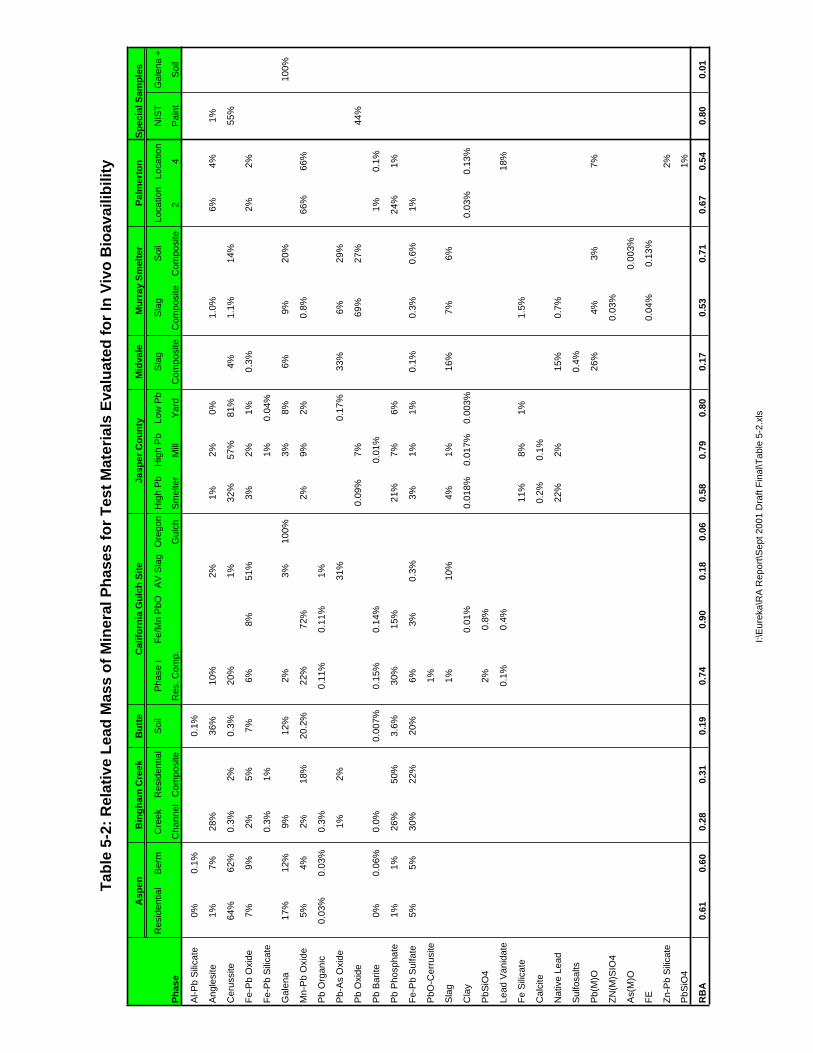
Tab
le 5
-2:
Rel
ativ
e L
ead
Mas
s o
f M
iner
al P
has
es f
or
Tes
t M
ater
ials
Eva
luat
ed f
or
In V
ivo
Bio
avai
libili
ty
Asp
enB
ing
ham
Cre
ekB
utt
eC
alif
orn
ia G
ulc
h S
ite
Jasp
er C
ou
nty
Mid
vale
Mu
rray
Sm
elte
rP
alm
erto
nS
pec
ial S
amp
les
Res
iden
tial
Ber
mC
reek
Res
iden
tial
Soi
lP
hase
IFe
/Mn
PbO
AV
Sla
gO
rego
nH
igh
Pb
Hig
h P
bLo
w P
bS
lag
Sla
gS
oil
Loca
tion
Loca
tion
NIS
TG
alen
a +
Ph
ase
Cha
nnel
Com
posi
teR
es. C
omp.
Gul
chS
mel
ter
Mill
Yar
dC
ompo
site
Com
posi
teC
ompo
site
24
Pai
ntS
oil
Al-P
b S
ilicat
e0%
0.1%
0.1%
Ang
lesi
te1%
7%28
%36
%10
%2%
1%2%
0%1.
0%6%
4%1%
Cer
ussi
te64
%62
%0.
3%2%
0.3%
20%
1%32
%57
%81
%4%
1.1%
14%
55%
Fe-P
b O
xide
7%9%
2%5%
7%6%
8%51
%3%
2%1%
0.3%
2%2%
Fe-P
b S
ilicat
e0.
3%1%
1%0.
04%
Gal
ena
17%
12%
9%12
%2%
3%10
0%3%
8%6%
9%20
%10
0%
Mn-
Pb
Oxi
de5%
4%2%
18%
20.2
%22
%72
%2%
9%2%
0.8%
66%
66%
Pb
Org
anic
0.03
%0.
03%
0.3%
0.11
%0.
11%
1%
Pb-
As
Oxi
de1%
2%31
%0.
17%
33%
6%29
%
Pb
Oxi
de0.
09%
7%69
%27
%44
%
Pb
Bar
ite0%
0.06
%0.
0%0.
007%
0.15
%0.
14%
0.01
%1%
0.1%
Pb
Pho
spha
te1%
1%26
%50
%3.
6%30
%15
%21
%7%
6%24
%1%
Fe-P
b S
ulfa
te5%
5%30
%22
%20
%6%
3%0.
3%3%
1%1%
0.1%
0.3%
0.6%
1%
PbO
-Cer
rusi
te1%
Sla
g1%
10%
4%1%
16%
7%6%
Cla
y0.
01%
0.01
8%0.
017%
0.00
3%0.
03%
0.13
%
PbS
iO4
2%0.
8%
Lead
Van
idat
e0.
1%0.
4%18
%
Fe S
ilicat
e11
%8%
1%1.
5%
Cal
cite
0.2%
0.1%
Nat
ive
Lead
22%
2%15
%0.
7%
Sul
fosa
lts0.
4%
Pb(
M)O
26%
4%3%
7%
ZN(M
)SIO
40.
03%
As(
M)O
0.00
3%
FE0.
04%
0.13
%
Zn-P
b S
ilicat
e2%
PbS
iO4
1%
RB
A0.
610.
600.
280.
310.
190.
740.
900.
180.
060.
580.
790.
800.
170.
530.
710.
670.
540.
800.
01
I:\E
urek
a\R
A R
epor
t\Sep
t 200
1 D
raft
Fina
l\Tab
le 5
-2.x
ls

Area Count Min PbB Max PbB Avg PbB Avg P10 P10>5 Avg P10 P10>51 218 6.1 46.6 14.8 69.2 100% 72.1 100%2 93 5.1 25.3 11.3 53.2 100% 53.6 96%3 6 5.1 27.7 14.4 56.5 100% 55.5 83%4 116 5.5 42.7 17.6 77.3 100% 80.6 98%5 61 5.9 43.2 16.5 74.6 100% 78.3 100%6 11 6.9 33.9 16.6 74.4 100% 78.7 100%
Total 505 5.1 46.6 15.0 68.7 100% 71.3 99%
GSD 1.6 GSD 1.4
Table 5-3: Summary Statistics for the IEUBK ModelAll Residential Properties
I:\Eureka\Risk Calcs\Residential\Batch Runs\All Props.xls
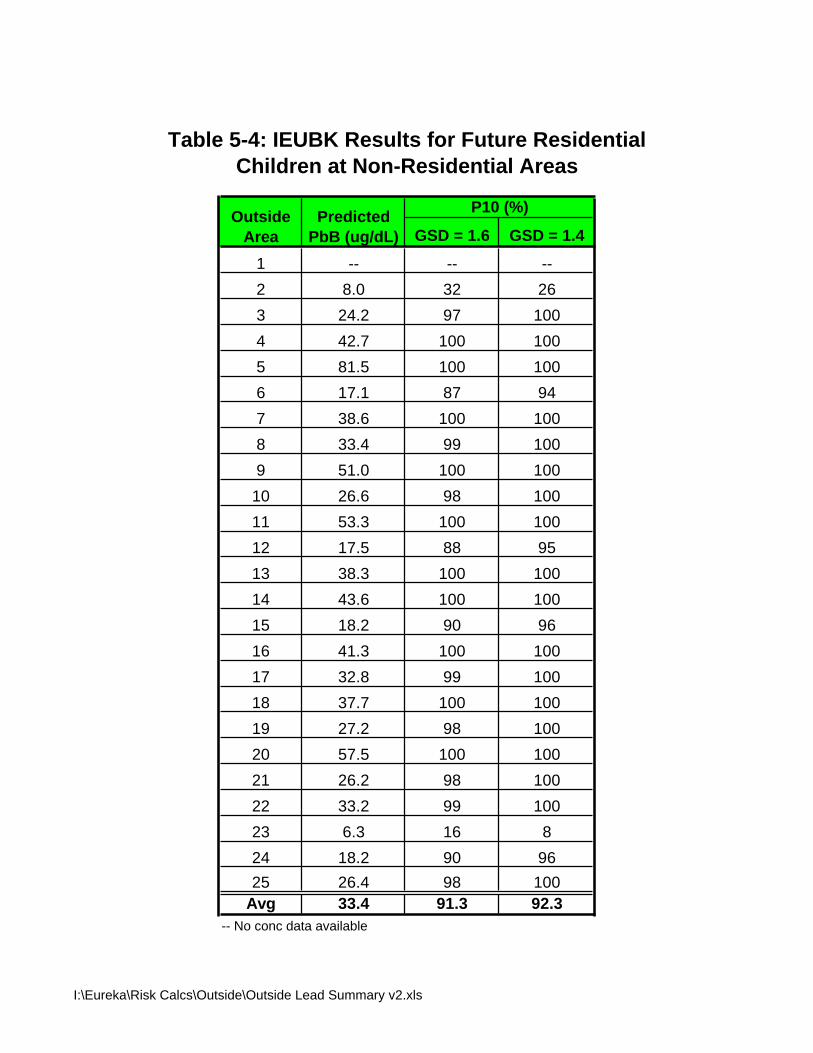
GSD = 1.6 GSD = 1.4
1 -- -- --2 8.0 32 263 24.2 97 1004 42.7 100 1005 81.5 100 1006 17.1 87 947 38.6 100 1008 33.4 99 1009 51.0 100 100
10 26.6 98 10011 53.3 100 10012 17.5 88 9513 38.3 100 10014 43.6 100 10015 18.2 90 9616 41.3 100 10017 32.8 99 10018 37.7 100 10019 27.2 98 10020 57.5 100 10021 26.2 98 10022 33.2 99 10023 6.3 16 824 18.2 90 9625 26.4 98 100
Avg 33.4 91.3 92.3-- No conc data available
Table 5-4: IEUBK Results for Future Residential Children at Non-Residential Areas
PredictedPbB (ug/dL)
OutsideArea
P10 (%)
I:\Eureka\Risk Calcs\Outside\Outside Lead Summary v2.xls
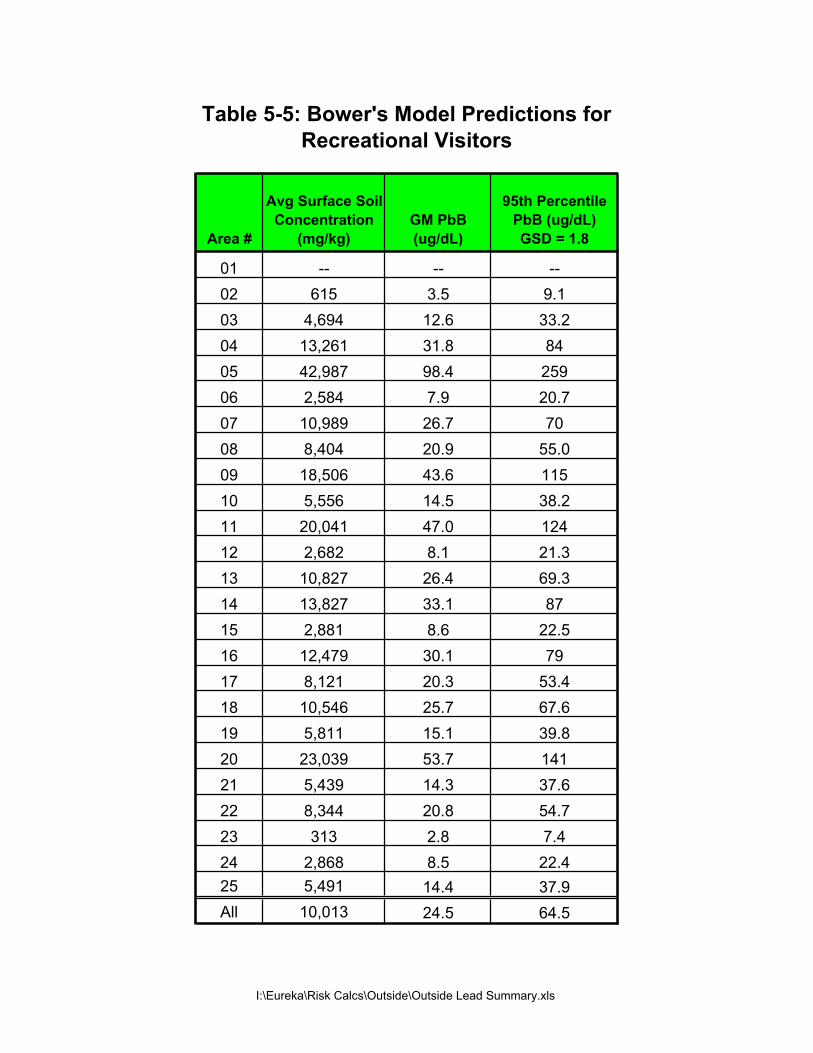
Area #
Avg Surface Soil
Concentration
(mg/kg)
GM PbB
(ug/dL)
95th Percentile
PbB (ug/dL)
GSD = 1.8
01 -- -- --
02 615 3.5 9.1
03 4,694 12.6 33.2
04 13,261 31.8 84
05 42,987 98.4 259
06 2,584 7.9 20.7
07 10,989 26.7 70
08 8,404 20.9 55.0
09 18,506 43.6 115
10 5,556 14.5 38.2
11 20,041 47.0 124
12 2,682 8.1 21.3
13 10,827 26.4 69.3
14 13,827 33.1 87
15 2,881 8.6 22.5
16 12,479 30.1 79
17 8,121 20.3 53.4
18 10,546 25.7 67.6
19 5,811 15.1 39.8
20 23,039 53.7 141
21 5,439 14.3 37.6
22 8,344 20.8 54.7
23 313 2.8 7.4
24 2,868 8.5 22.4
25 5,491 14.4 37.9
All 10,013 24.5 64.5
Table 5-5: Bower's Model Predictions for
Recreational Visitors
I:\Eureka\Risk Calcs\Outside\Outside Lead Summary.xls
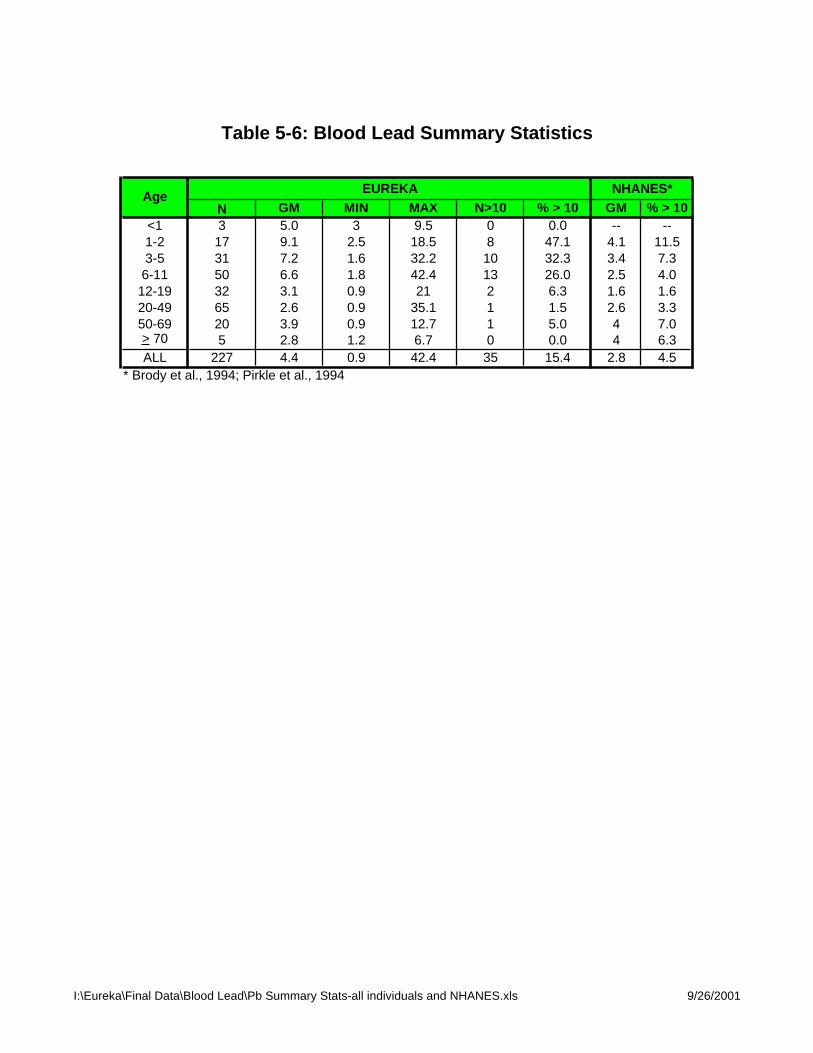
N GM MIN MAX N>10 % > 10 GM % > 10<1 3 5.0 3 9.5 0 0.0 -- --1-2 17 9.1 2.5 18.5 8 47.1 4.1 11.53-5 31 7.2 1.6 32.2 10 32.3 3.4 7.36-11 50 6.6 1.8 42.4 13 26.0 2.5 4.012-19 32 3.1 0.9 21 2 6.3 1.6 1.620-49 65 2.6 0.9 35.1 1 1.5 2.6 3.350-69 20 3.9 0.9 12.7 1 5.0 4 7.0> 70 5 2.8 1.2 6.7 0 0.0 4 6.3ALL 227 4.4 0.9 42.4 35 15.4 2.8 4.5
* Brody et al., 1994; Pirkle et al., 1994
NHANES*EUREKAAge
Table 5-6: Blood Lead Summary Statistics
I:\Eureka\Final Data\Blood Lead\Pb Summary Stats-all individuals and NHANES.xls 9/26/2001
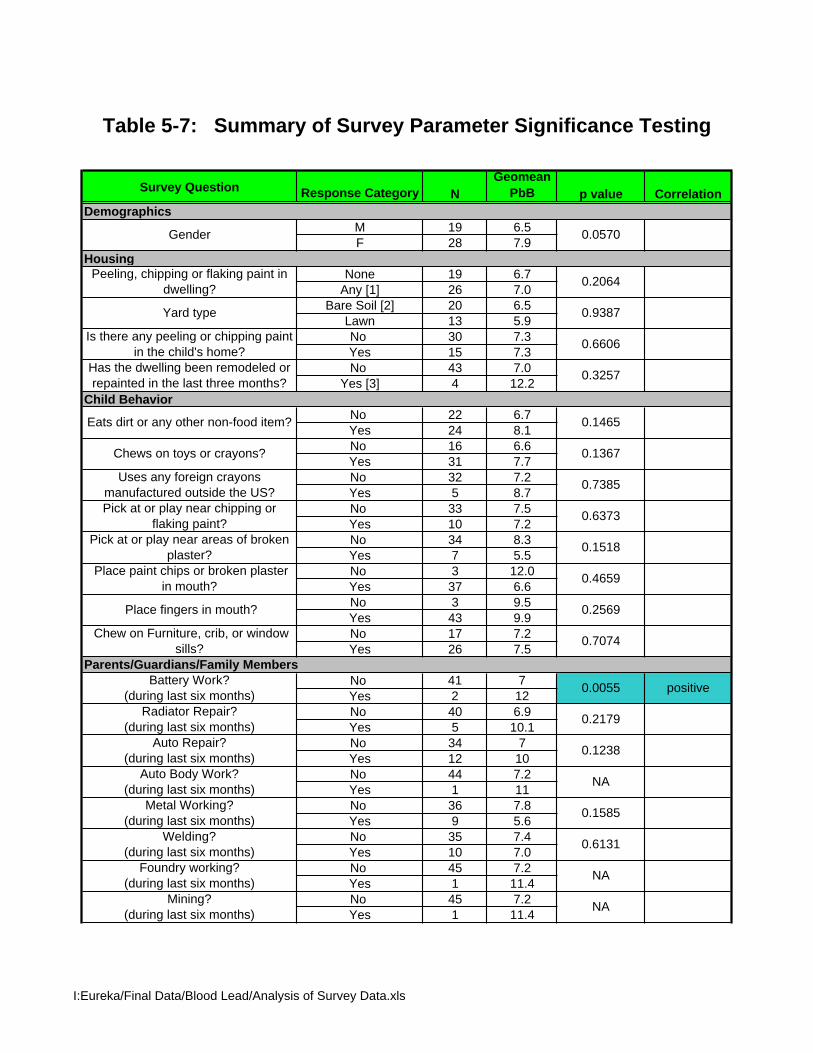
Survey Question Response Category NGeomean
PbB p value CorrelationDemographics
M 19 6.5F 28 7.9
HousingNone 19 6.7
Any [1] 26 7.0Bare Soil [2] 20 6.5
Lawn 13 5.9No 30 7.3Yes 15 7.3No 43 7.0
Yes [3] 4 12.2Child Behavior
No 22 6.7Yes 24 8.1No 16 6.6Yes 31 7.7No 32 7.2Yes 5 8.7No 33 7.5Yes 10 7.2No 34 8.3Yes 7 5.5No 3 12.0Yes 37 6.6No 3 9.5Yes 43 9.9No 17 7.2Yes 26 7.5
No 41 7Yes 2 12No 40 6.9Yes 5 10.1No 34 7Yes 12 10No 44 7.2Yes 1 11No 36 7.8Yes 9 5.6No 35 7.4Yes 10 7.0No 45 7.2Yes 1 11.4No 45 7.2Yes 1 11.4
Table 5-7: Summary of Survey Parameter Significance Testing
Mining?(during last six months) NA
Welding?(during last six months) 0.6131
Auto Body Work?(during last six months) NA
Metal Working?(during last six months) 0.1585
Auto Repair?(during last six months) 0.1238
Radiator Repair?(during last six months) 0.2179
positive0.0055
Is there any peeling or chipping paint in the child's home?
Has the dwelling been remodeled or repainted in the last three months?
Battery Work?(during last six months)
Pick at or play near areas of broken plaster?
Chew on Furniture, crib, or window sills?
Place paint chips or broken plaster in mouth?
Place fingers in mouth?
Eats dirt or any other non-food item?
Chews on toys or crayons?
Uses any foreign crayons manufactured outside the US?
0.2569
0.7074
Foundry working?(during last six months) NA
Gender
Peeling, chipping or flaking paint in dwelling?
Yard type
0.0570
0.2064
0.9387
0.6606
0.3257
Parents/Guardians/Family Members
0.1465
0.1367
0.7385
0.6373
0.1518
0.4659
Pick at or play near chipping or flaking paint?
I:Eureka/Final Data/Blood Lead/Analysis of Survey Data.xls
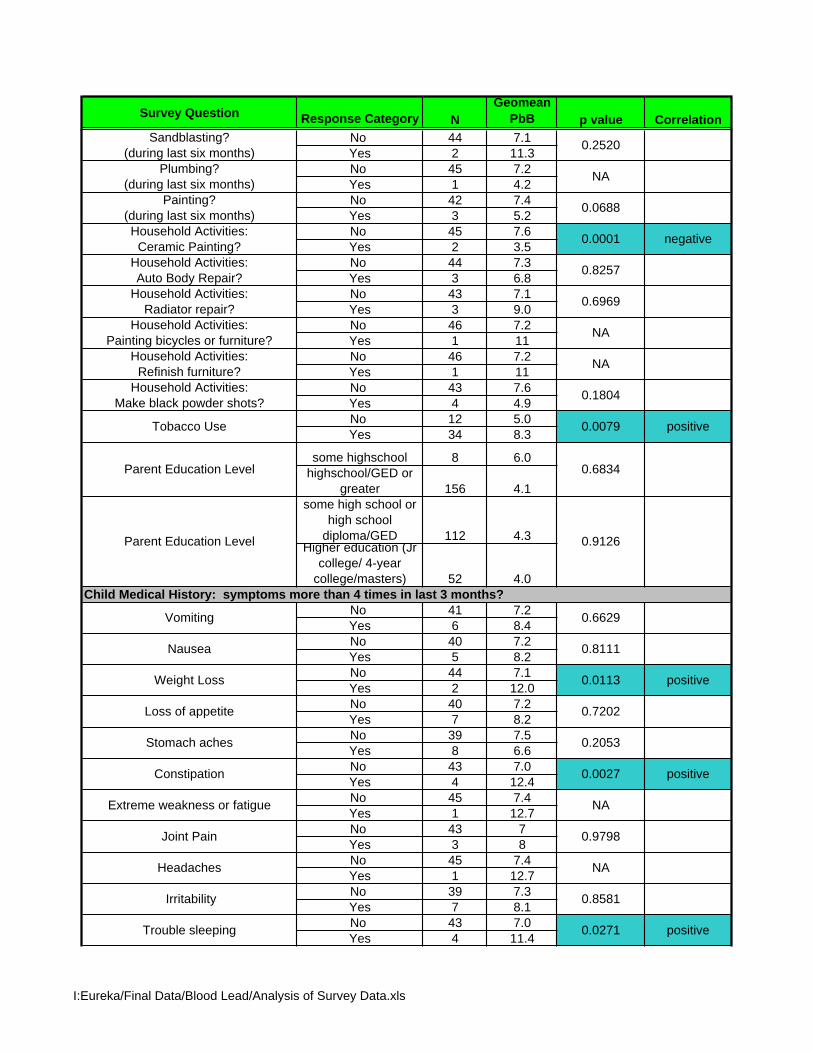
Survey Question Response Category NGeomean
PbB p value CorrelationNo 44 7.1Yes 2 11.3No 45 7.2Yes 1 4.2No 42 7.4Yes 3 5.2No 45 7.6Yes 2 3.5No 44 7.3Yes 3 6.8No 43 7.1Yes 3 9.0No 46 7.2Yes 1 11No 46 7.2Yes 1 11No 43 7.6Yes 4 4.9No 12 5.0Yes 34 8.3
some highschool 8 6.0highschool/GED or
greater 156 4.1some high school or
high school diploma/GED 112 4.3
Higher education (Jr college/ 4-year
college/masters) 52 4.0
No 41 7.2Yes 6 8.4No 40 7.2Yes 5 8.2No 44 7.1Yes 2 12.0No 40 7.2Yes 7 8.2No 39 7.5Yes 8 6.6No 43 7.0Yes 4 12.4No 45 7.4Yes 1 12.7No 43 7Yes 3 8No 45 7.4Yes 1 12.7No 39 7.3Yes 7 8.1No 43 7.0Yes 4 11.4
negative
positive
positive
Vomiting 0.6629
0.8257
Household Activities:Radiator repair? 0.6969
Painting?(during last six months)
positive
Trouble sleeping 0.0271
Irritability 0.8581
positive
Joint Pain 0.9798
Headaches NA
Constipation 0.0027
Extreme weakness or fatigue NA
Loss of appetite 0.7202
Stomach aches 0.2053
Nausea 0.8111
Weight Loss 0.0113
Tobacco Use 0.0079
Household Activities:Make black powder shots? 0.1804
Household Activities:Painting bicycles or furniture? NA
Household Activities:Refinish furniture? NA
Household Activities:Auto Body Repair?
0.0688
Household Activities:Ceramic Painting? 0.0001
Sandblasting?(during last six months) 0.2520
Plumbing?(during last six months) NA
Child Medical History: symptoms more than 4 times in last 3 months?
Parent Education Level 0.6834
Parent Education Level 0.9126
I:Eureka/Final Data/Blood Lead/Analysis of Survey Data.xls
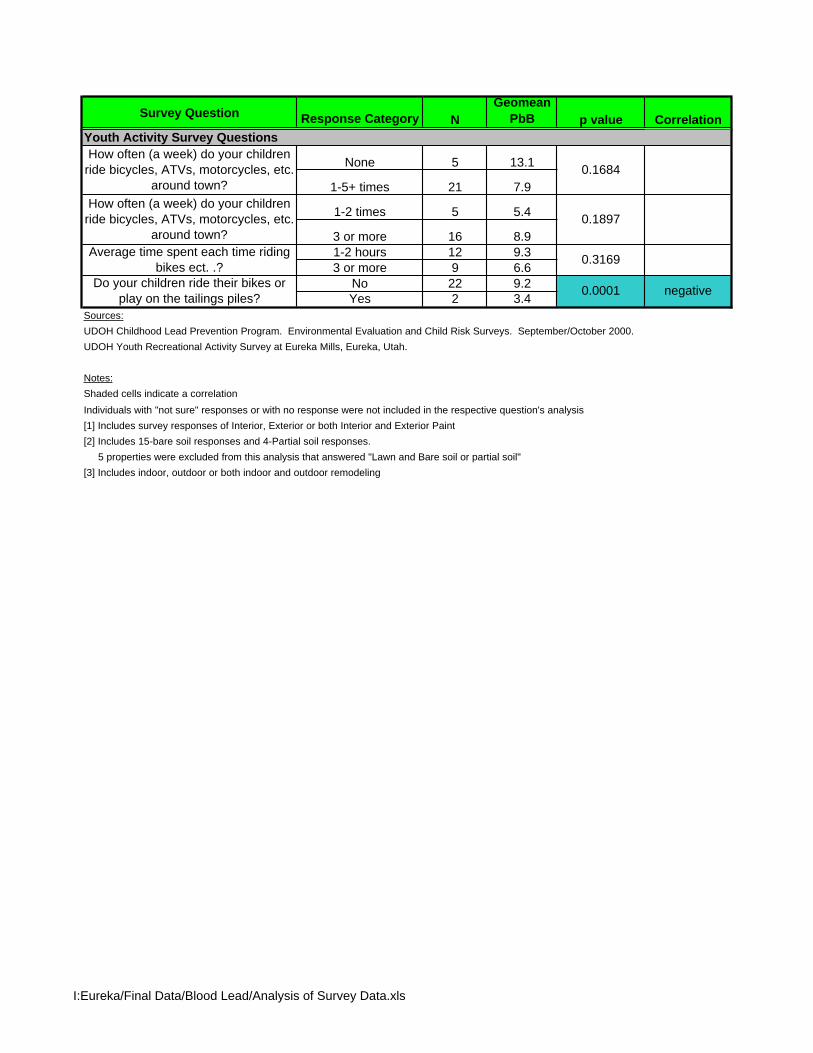
Survey Question Response Category NGeomean
PbB p value Correlation
None 5 13.1
1-5+ times 21 7.9
1-2 times 5 5.4
3 or more 16 8.91-2 hours 12 9.33 or more 9 6.6
No 22 9.2Yes 2 3.4
Sources:UDOH Childhood Lead Prevention Program. Environmental Evaluation and Child Risk Surveys. September/October 2000.UDOH Youth Recreational Activity Survey at Eureka Mills, Eureka, Utah.
Notes:Shaded cells indicate a correlationIndividuals with "not sure" responses or with no response were not included in the respective question's analysis[1] Includes survey responses of Interior, Exterior or both Interior and Exterior Paint [2] Includes 15-bare soil responses and 4-Partial soil responses. 5 properties were excluded from this analysis that answered "Lawn and Bare soil or partial soil"[3] Includes indoor, outdoor or both indoor and outdoor remodeling
Average time spent each time riding bikes ect. .? 0.3169
How often (a week) do your children ride bicycles, ATVs, motorcycles, etc.
around town?0.1897
Do your children ride their bikes or play on the tailings piles? 0.0001 negative
How often (a week) do your children ride bicycles, ATVs, motorcycles, etc.
around town?0.1684
Youth Activity Survey Questions
I:Eureka/Final Data/Blood Lead/Analysis of Survey Data.xls
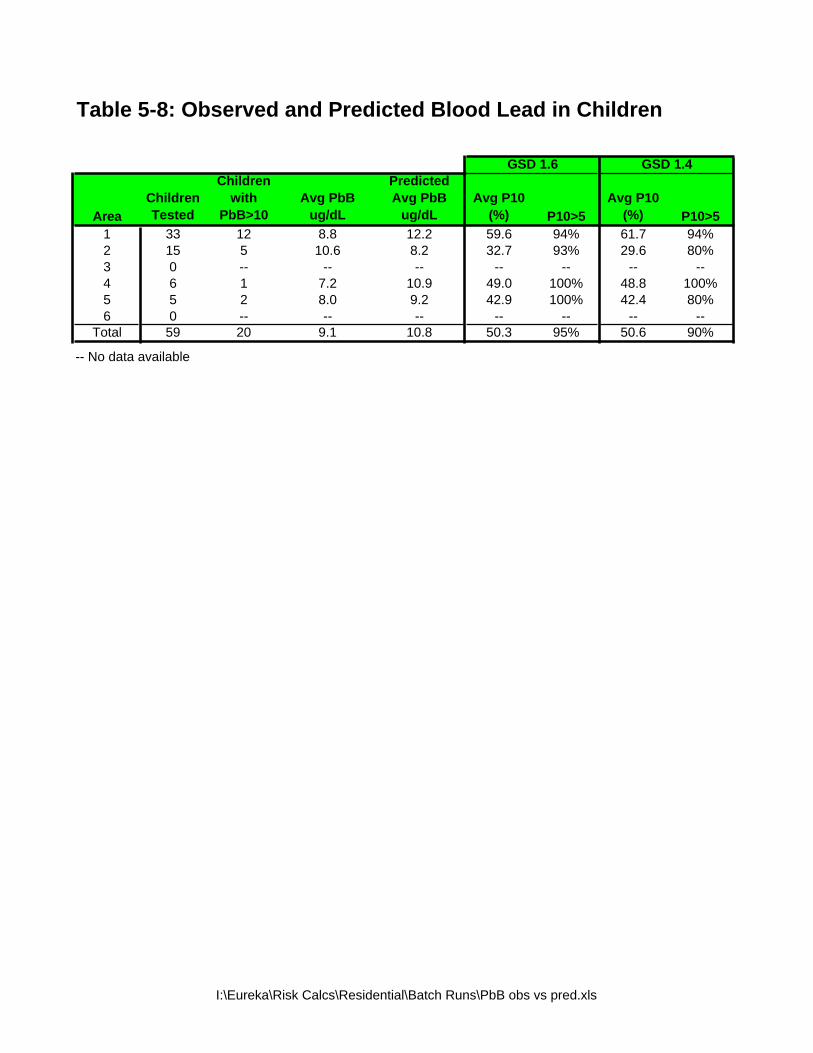
Table 5-8: Observed and Predicted Blood Lead in Children
AreaChildrenTested
Childrenwith
PbB>10Avg PbB
ug/dL
PredictedAvg PbB
ug/dLAvg P10
(%) P10>5Avg P10
(%) P10>51 33 12 8.8 12.2 59.6 94% 61.7 94%2 15 5 10.6 8.2 32.7 93% 29.6 80%3 0 -- -- -- -- -- -- --4 6 1 7.2 10.9 49.0 100% 48.8 100%5 5 2 8.0 9.2 42.9 100% 42.4 80%6 0 -- -- -- -- -- -- --
Total 59 20 9.1 10.8 50.3 95% 50.6 90%
-- No data available
GSD 1.6 GSD 1.4
I:\Eureka\Risk Calcs\Residential\Batch Runs\PbB obs vs pred.xls

FIGURES
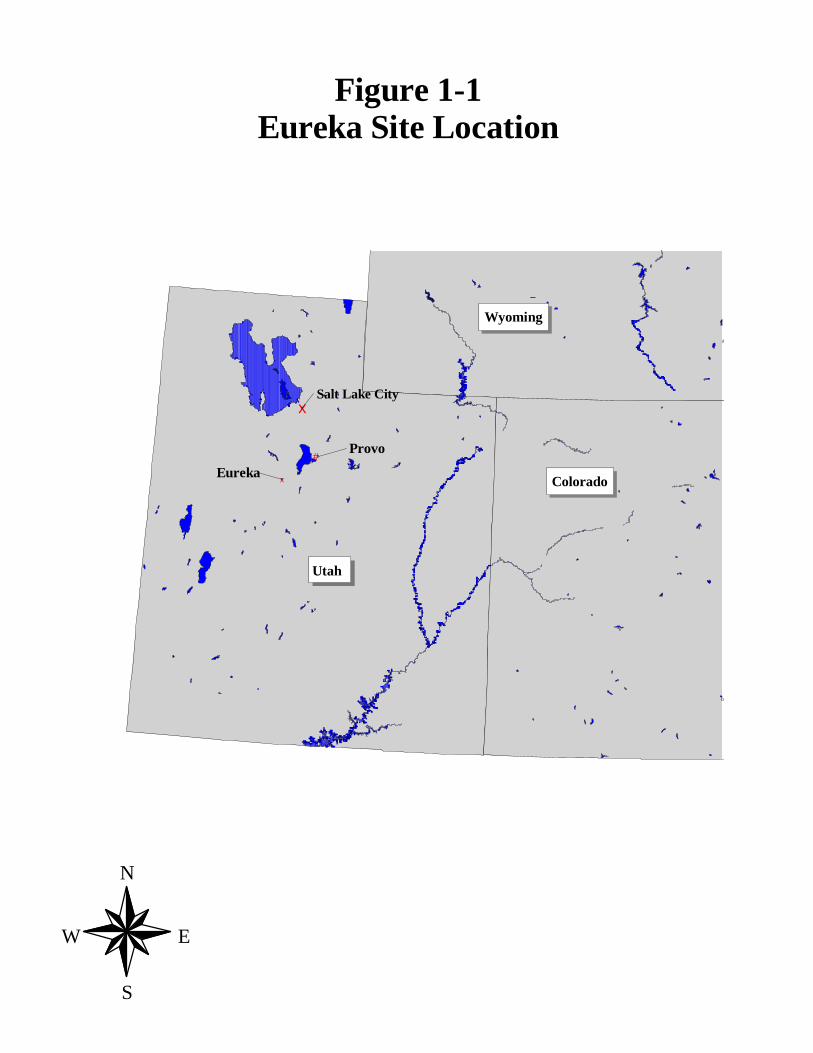
x
x
#
#
Salt Lake City
Utah
#Eureka
Wyoming
Colorado
#Provo
N
EW
S
Figure 1-1Eureka Site Location
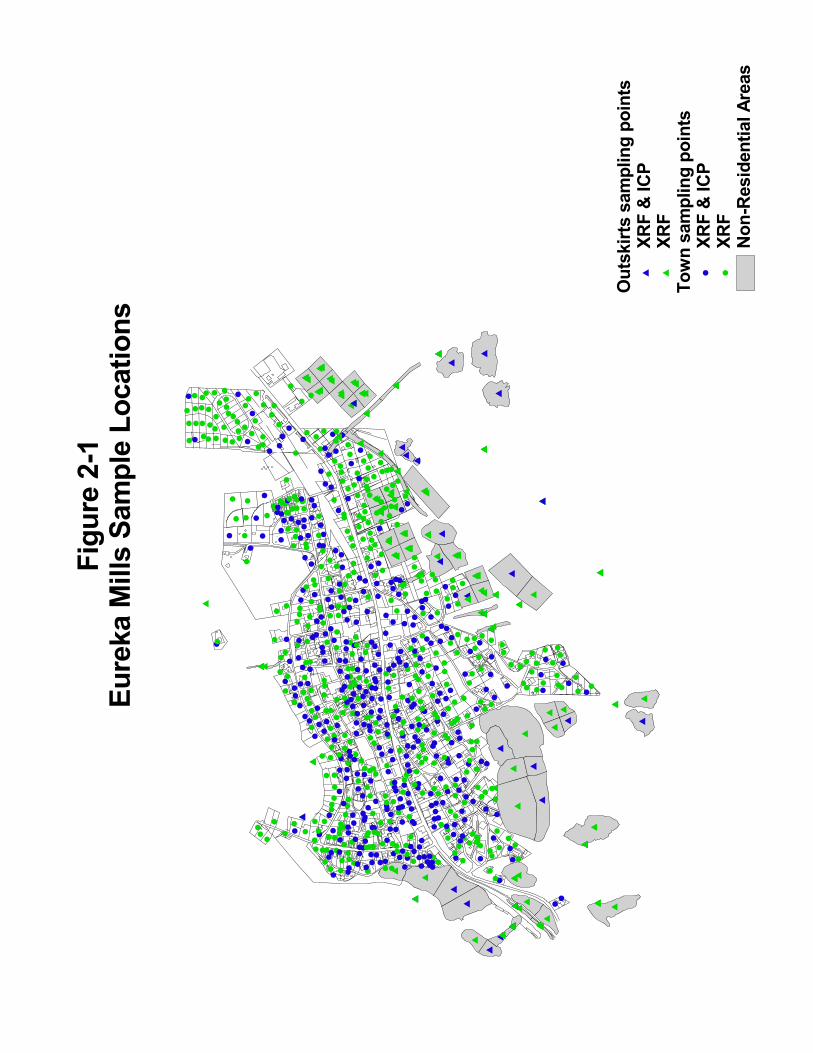
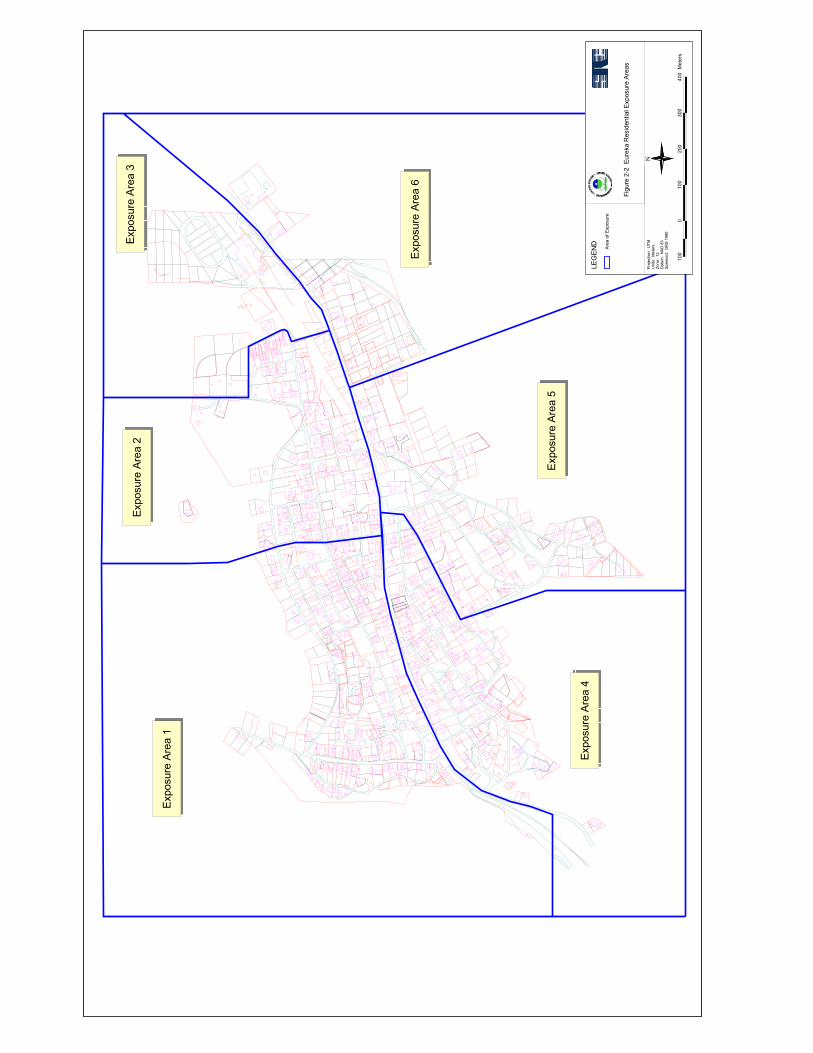

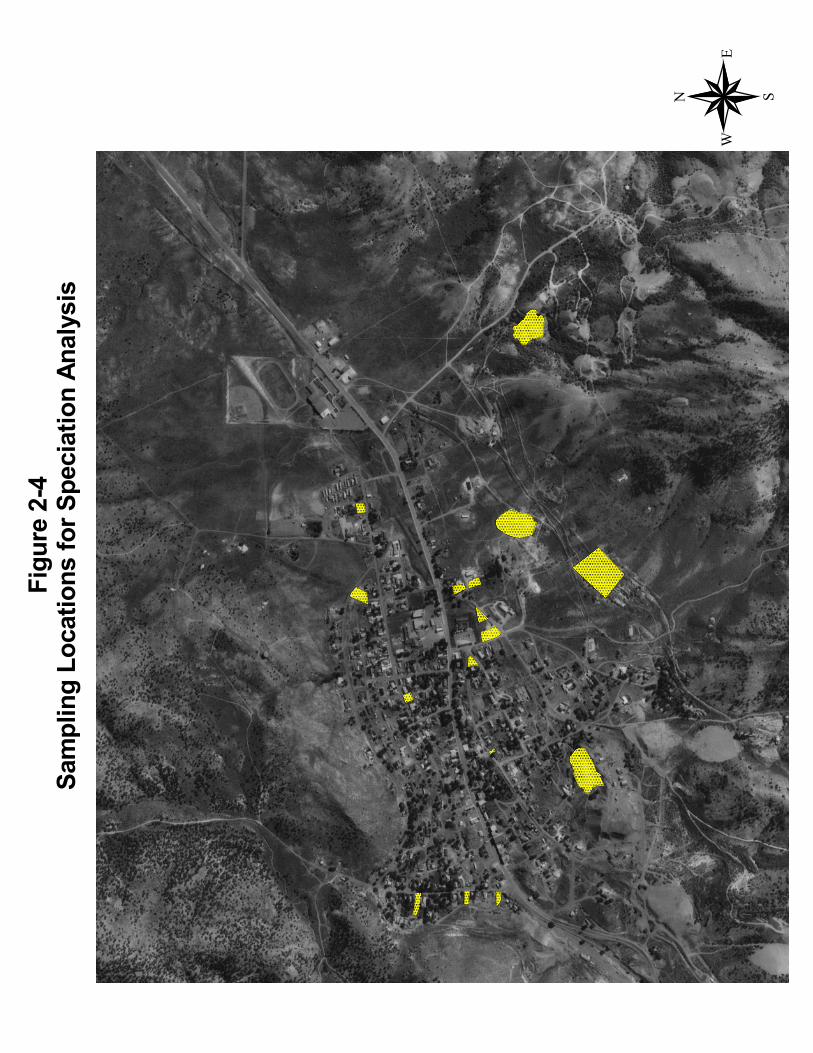
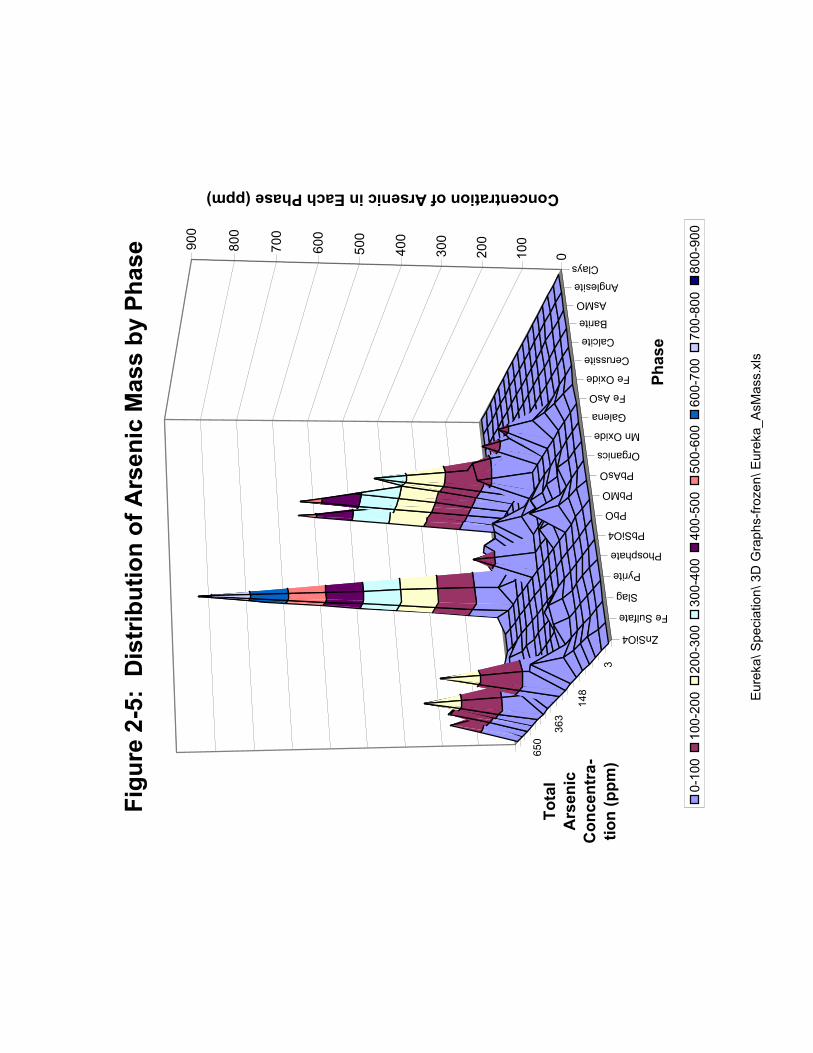
Eu
reka
\ S
pe
cia
tio
n\
3D
Gra
ph
s-f
roze
n\
Eu
reka
_A
sM
ass.x
ls
3
148
363
650
Clays
Anglesite
AsMO
Barite
Calcite
Cerussite
Fe Oxide
Fe AsO
Galena
Mn Oxide
Organics
PbAsO
PbMO
PbO
PbSiO4
Phosphate
Pyrite
Slag
Fe Sulfate
ZnSiO4
010
0
20
0
30
0
40
0
50
0
60
0
70
0
80
0
90
0
Concentration of Arsenic in Each Phase (ppm)
To
tal
Ars
en
ic
Co
ncen
tra-
tio
n (
pp
m)
Ph
ase
Fig
ure
2-5
: D
istr
ibu
tio
n o
f A
rsen
ic M
ass b
y P
hase
0-1
00
10
0-2
00
20
0-3
00
30
0-4
00
40
0-5
00
50
0-6
00
60
0-7
00
70
0-8
00
80
0-9
00
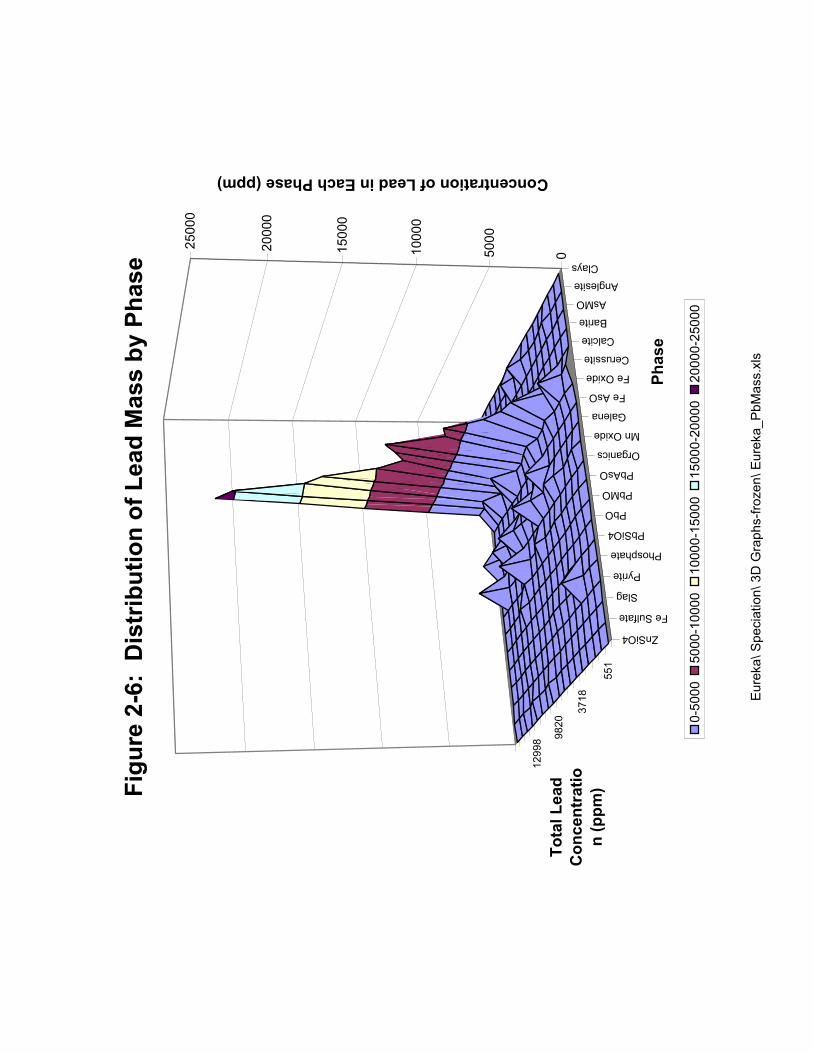
Eu
reka
\ S
pe
cia
tio
n\
3D
Gra
ph
s-f
roze
n\
Eu
reka
_P
bM
ass.x
ls
551
3718
9820
12998
Clays
Anglesite
AsMO
Barite
Calcite
Cerussite
Fe Oxide
Fe AsO
Galena
Mn Oxide
Organics
PbAsO
PbMO
PbO
PbSiO4
Phosphate
Pyrite
Slag
Fe Sulfate
ZnSiO4
050
00
10
00
0
15
00
0
20
00
0
25
00
0
Concentration of Lead in Each Phase (ppm)
To
tal L
ead
Co
ncen
trati
o
n (
pp
m)
Ph
ase
Fig
ure
2-6
: D
istr
ibu
tio
n o
f L
ead
Mass b
y P
hase
0-5
00
05
00
0-1
00
00
10
00
0-1
50
00
15
00
0-2
00
00
20
00
0-2
50
00
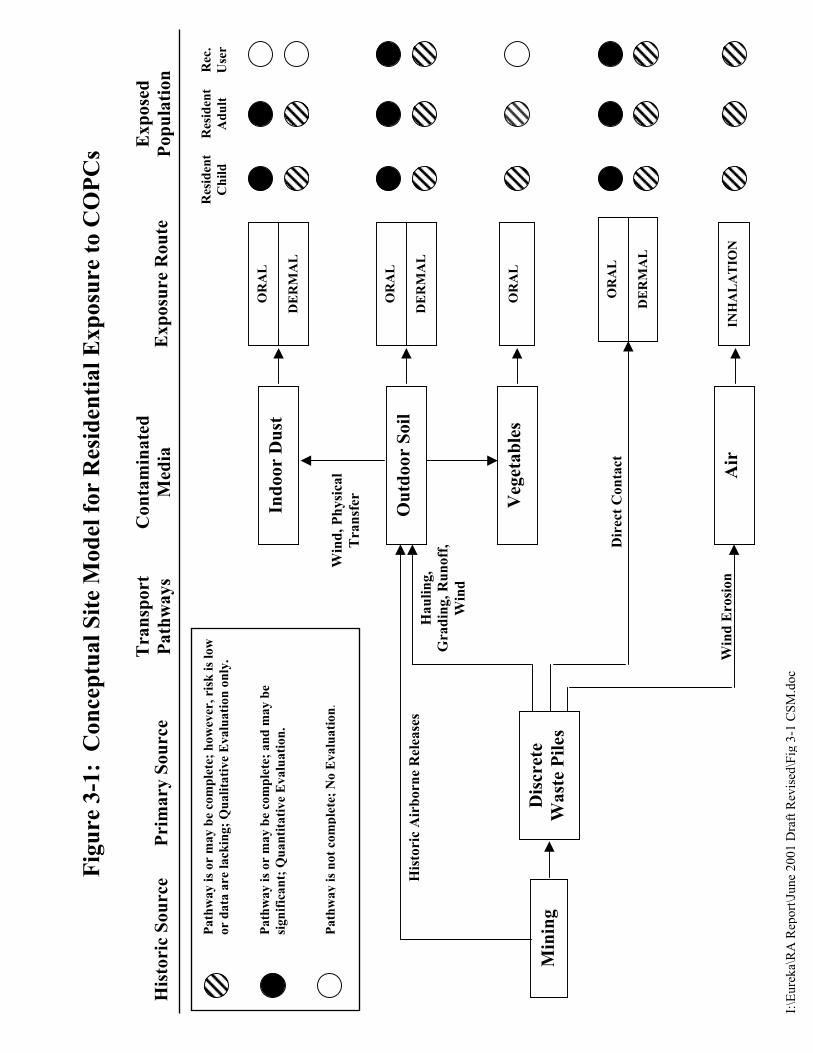
Fig
ure
3-1
: C
on
cep
tual
Sit
e M
od
el f
or
Res
iden
tial
Exp
osu
re t
o C
OP
Cs
Min
ing
Dis
cret
e
Wa
ste
Pil
es
Ind
oo
r D
ust
Veg
eta
ble
s
Air
Win
d E
rosi
on
Win
d,
Ph
ysi
cal
Tra
nsf
er
Dir
ect
Co
nta
ct
Ha
uli
ng
,
Gra
din
g,
Ru
no
ff,
Win
d
OR
AL
DE
RM
AL
OR
AL
DE
RM
AL
OR
AL
INH
AL
AT
ION
Ex
po
sed
Po
pu
lati
on
His
tori
c S
ou
rce
Pri
ma
ry S
ou
rce
Tra
nsp
ort
Pa
thw
ay
s
Co
nta
min
ate
d
Med
iaE
xp
osu
re R
ou
te
Ou
tdo
or
So
il
Pa
thw
ay
is
or
ma
y b
e co
mp
lete
; a
nd
may
be
sig
nif
ica
nt;
Qu
an
tita
tiv
e E
va
lua
tio
n.
Path
way i
s or
may b
e co
mp
lete
; h
ow
ever
, ri
sk i
s lo
w
or
data
are
lack
ing;
Qu
ali
tati
ve
Evalu
ati
on
on
ly.
Path
way
is
not
com
ple
te;
No
Ev
alu
ati
on
.
Res
iden
t
Ch
ild
Res
iden
t
Ad
ult
Rec
.
Use
r
OR
AL
DE
RM
AL
His
tori
c A
irb
orn
e R
elea
ses
I:\E
ure
ka\
RA
Rep
ort
\June
2001 D
raft
Rev
ised
\Fig
3-1
CS
M.d
oc
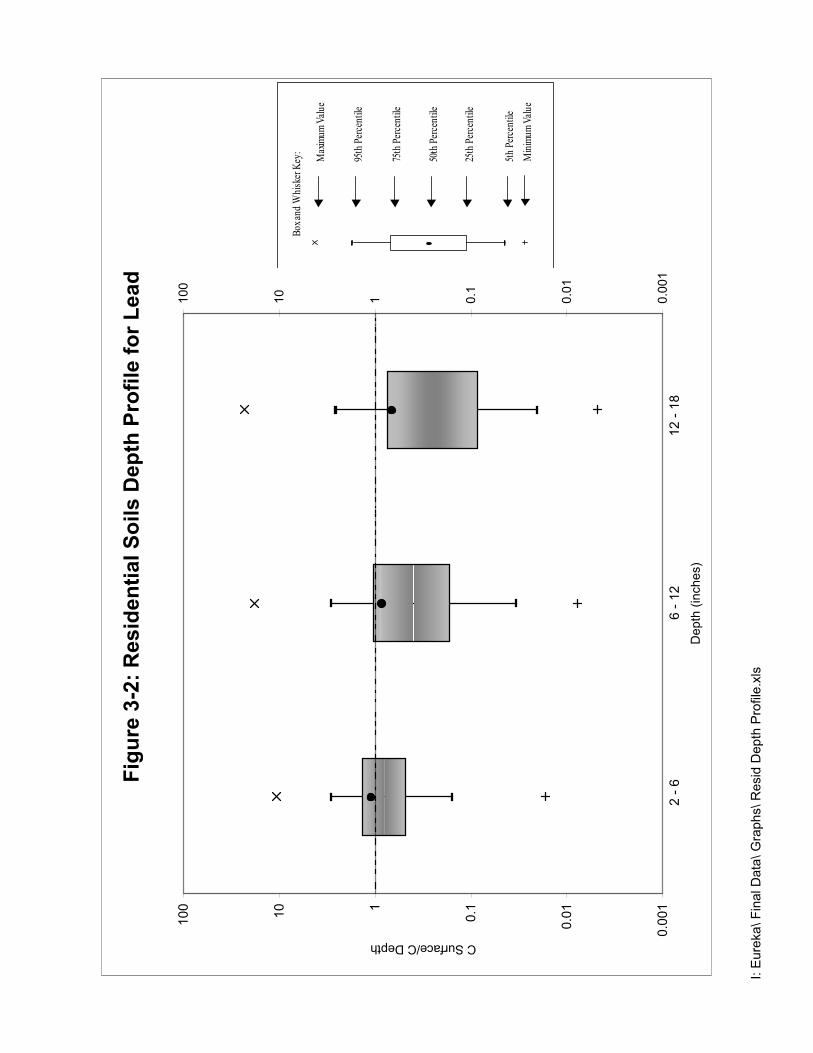
I: E
ure
ka
\ F
ina
l D
ata
\ G
rap
hs\
Re
sid
De
pth
Pro
file
.xls
Fig
ure
3-2
: R
esid
en
tial S
oils D
ep
th P
rofi
le f
or
Lead
0.0
01
0.0
1
0.11
10
10
0
Depth
(in
ches)
C Surface/C Depth
0.0
01
0.0
1
0.1
110
100
2 -
66
- 1
21
2 -
18
Min
imu
m V
alu
e
Max
imum
Val
ue
95th
Per
cent
ile
25th
Per
cent
ile
50th
Per
cent
ile
75th
Per
cent
ile
5th
Perc
entil
e
Box
and
Whi
sker
Key
:
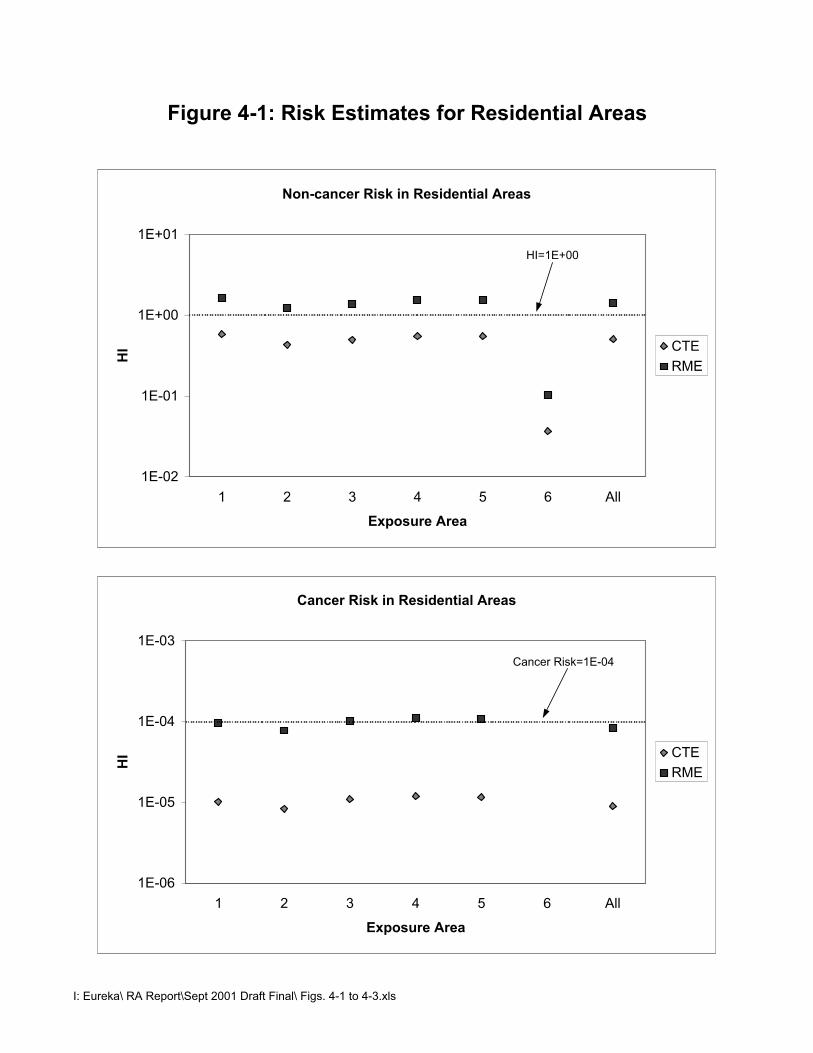
Figure 4-1: Risk Estimates for Residential Areas
Non-cancer Risk in Residential Areas
1E-02
1E-01
1E+00
1E+01
1 2 3 4 5 6 All
Exposure Area
HI CTE
RME
HI=1E+00
Cancer Risk in Residential Areas
1E-06
1E-05
1E-04
1E-03
1 2 3 4 5 6 All
Exposure Area
HI CTE
RME
Cancer Risk=1E-04
I: Eureka\ RA Report\Sept 2001 Draft Final\ Figs. 4-1 to 4-3.xls
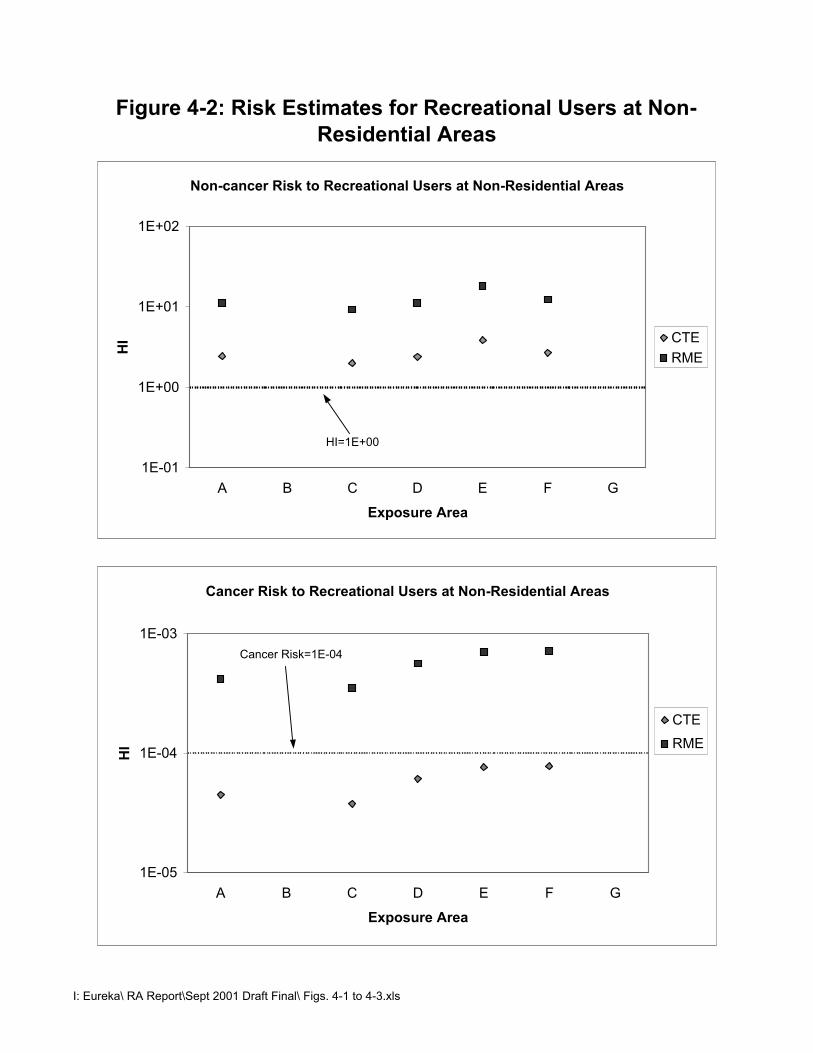
Figure 4-2: Risk Estimates for Recreational Users at Non-
Residential Areas
Non-cancer Risk to Recreational Users at Non-Residential Areas
1E-01
1E+00
1E+01
1E+02
A B C D E F G
Exposure Area
HI CTE
RME
HI=1E+00
Cancer Risk to Recreational Users at Non-Residential Areas
1E-05
1E-04
1E-03
A B C D E F G
Exposure Area
HI
CTE
RME
Cancer Risk=1E-04
I: Eureka\ RA Report\Sept 2001 Draft Final\ Figs. 4-1 to 4-3.xls
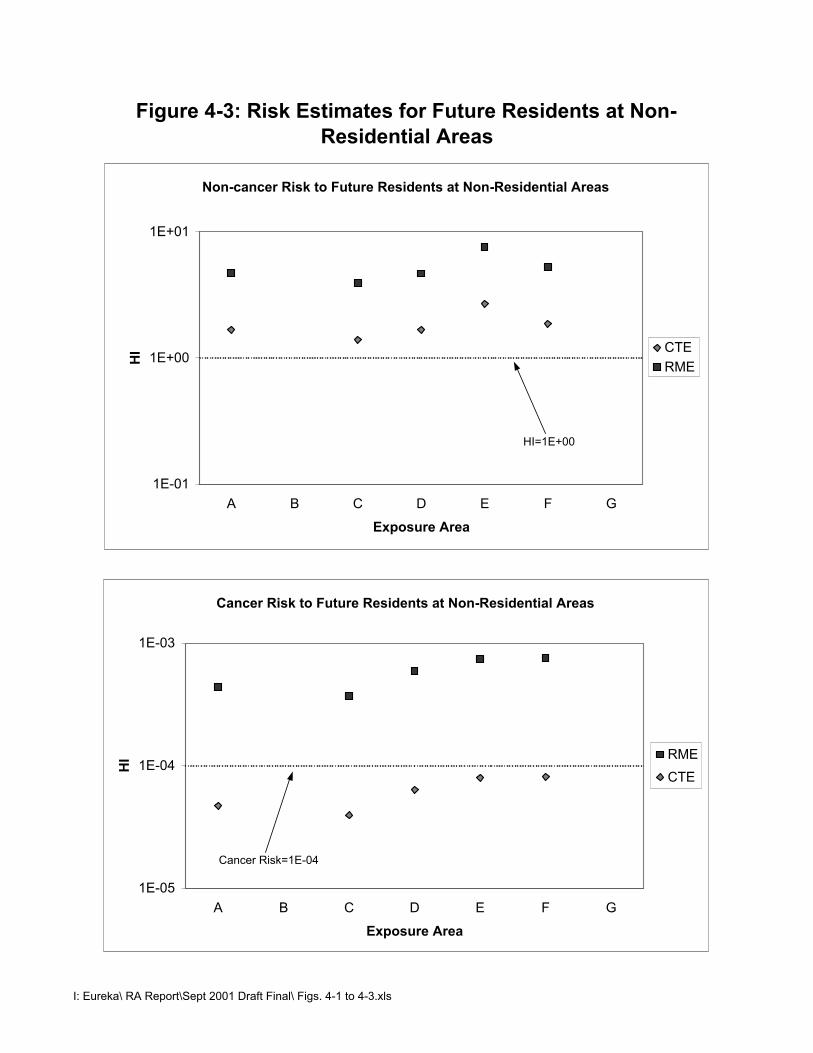
Figure 4-3: Risk Estimates for Future Residents at Non-
Residential Areas
Non-cancer Risk to Future Residents at Non-Residential Areas
1E-01
1E+00
1E+01
A B C D E F G
Exposure Area
HI CTE
RME
HI=1E+00
Cancer Risk to Future Residents at Non-Residential Areas
1E-05
1E-04
1E-03
A B C D E F G
Exposure Area
HI RME
CTE
Cancer Risk=1E-04
I: Eureka\ RA Report\Sept 2001 Draft Final\ Figs. 4-1 to 4-3.xls
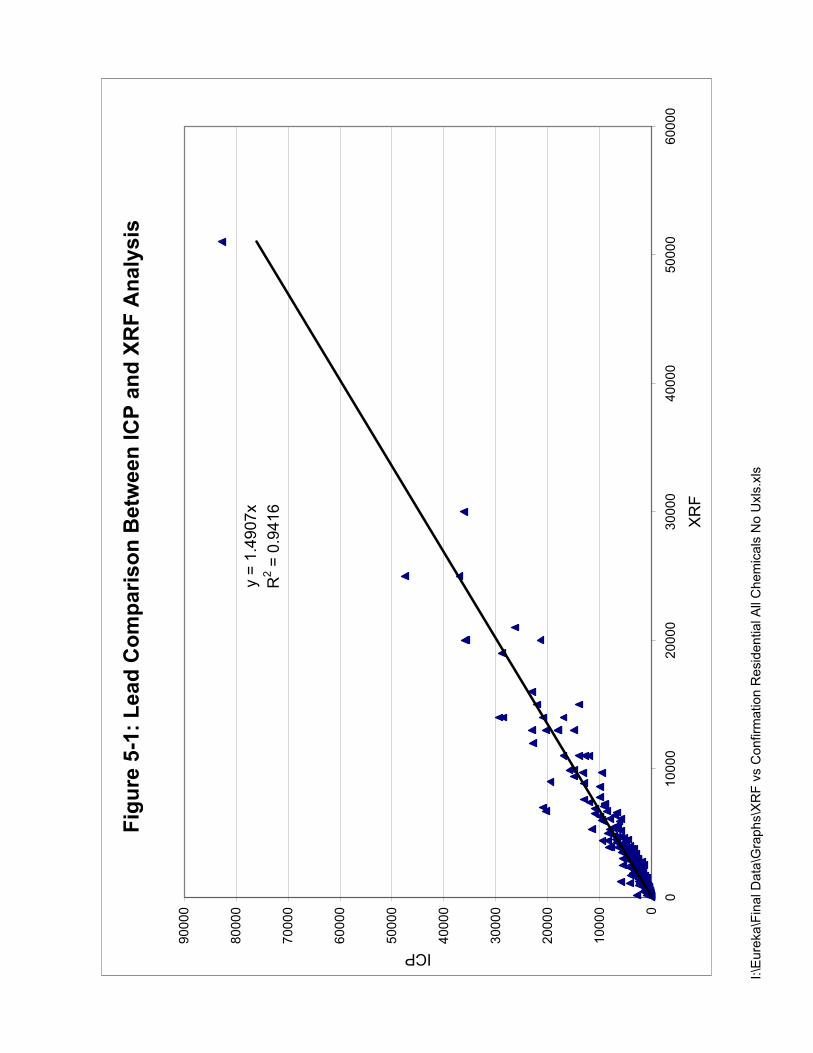
I:\E
ure
ka
\Fin
al D
ata
\Gra
ph
s\X
RF
vs C
on
firm
atio
n R
esid
en
tia
l A
ll C
he
mic
als
No
Uxls
.xls
Fig
ure
5-1
: L
ead
Co
mp
ari
so
n B
etw
een
IC
P a
nd
XR
F A
naly
sis
y =
1.4
907x
R2 =
0.9
416
0
10
00
0
20
00
0
30
00
0
40
00
0
50
00
0
60
00
0
70
00
0
80
00
0
90
00
0
01
00
00
20
00
03
00
00
40
00
05
00
00
60
00
0
XR
F
ICP

I:\E
ure
ka
\Fin
al D
ata
\Gra
ph
s\S
oilD
ustR
ela
tio
nsh
ip.x
ls
Fig
ure
5-2
: S
ite-S
pecif
ic S
oil-D
ust
Rela
tio
nsh
ip f
or
Lead
y =
0.1
53
7x +
45
7.8
6
R2 =
0.2
29
4
0
500
1000
1500
2000
2500
0500
1000
1500
2000
2500
3000
3500
4000
4500
5000
Soil
(non d
ete
cts
rem
oved, 0 inte
rcept adju
stm
ent)
Dust
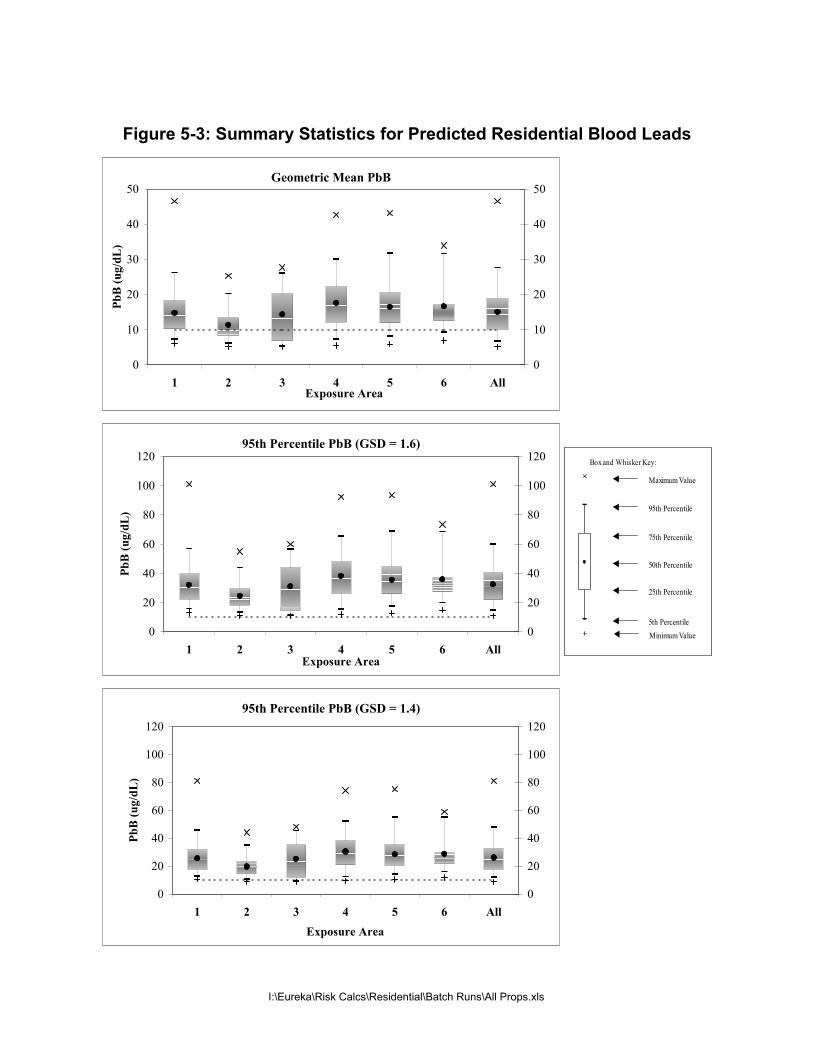
Figure 5-3: Summary Statistics for Predicted Residential Blood Leads
Geometric Mean PbB
0
10
20
30
40
50
1 2 3 4 5 6 All
Pb
B (
ug
/dL
)
0
10
20
30
40
50
Exposure Area
95th Percentile PbB (GSD = 1.6)
0
20
40
60
80
100
120
1 2 3 4 5 6 AllExposure Area
Pb
B (
ug
/dL
)
0
20
40
60
80
100
120
95th Percentile PbB (GSD = 1.4)
0
20
40
60
80
100
120
1 2 3 4 5 6 All
Exposure Area
Pb
B (
ug
/dL
)
0
20
40
60
80
100
120
Minimum Value
Maximum Value
95th Percentile
25th Percentile
50th Percentile
75th Percentile
5th Percentile
Box and Whisker Key:
I:\Eureka\Risk Calcs\Residential\Batch Runs\All Props.xls
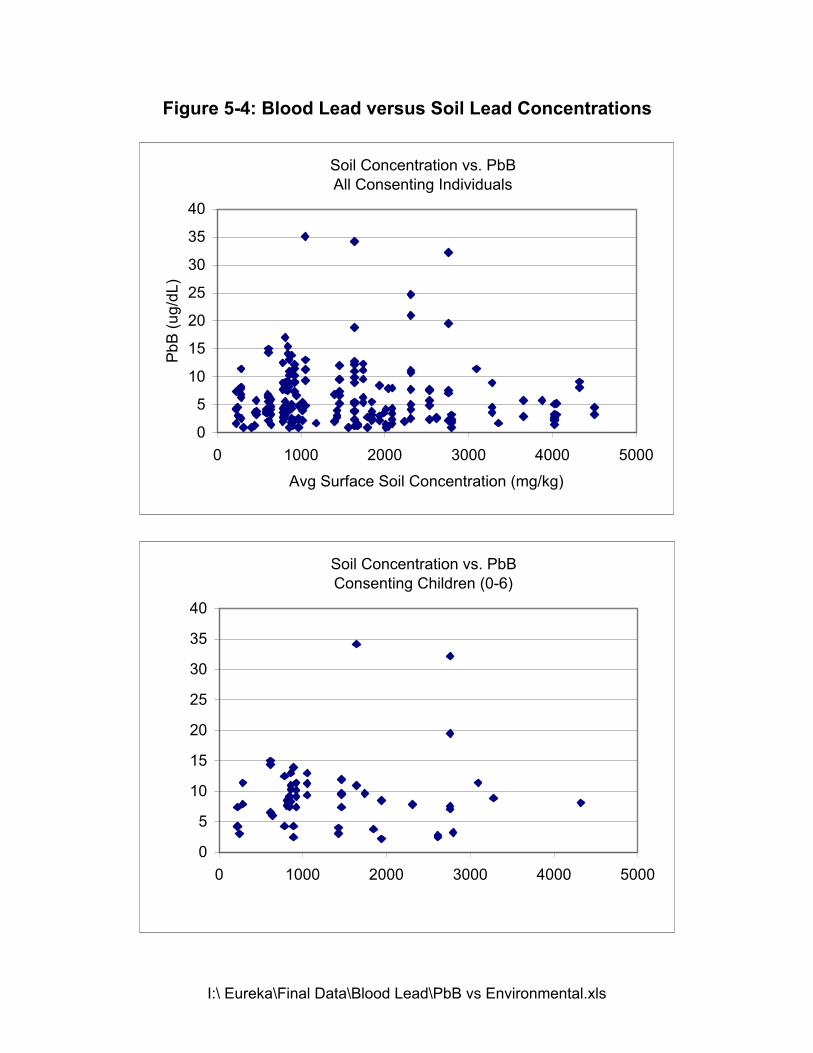
Figure 5-4: Blood Lead versus Soil Lead Concentrations
Soil Concentration vs. PbB
All Consenting Individuals
0
5
10
15
20
25
30
35
40
0 1000 2000 3000 4000 5000
Avg Surface Soil Concentration (mg/kg)
Pb
B (
ug
/dL
)
Soil Concentration vs. PbB
Consenting Children (0-6)
0
5
10
15
20
25
30
35
40
0 1000 2000 3000 4000 5000
I:\ Eureka\Final Data\Blood Lead\PbB vs Environmental.xls
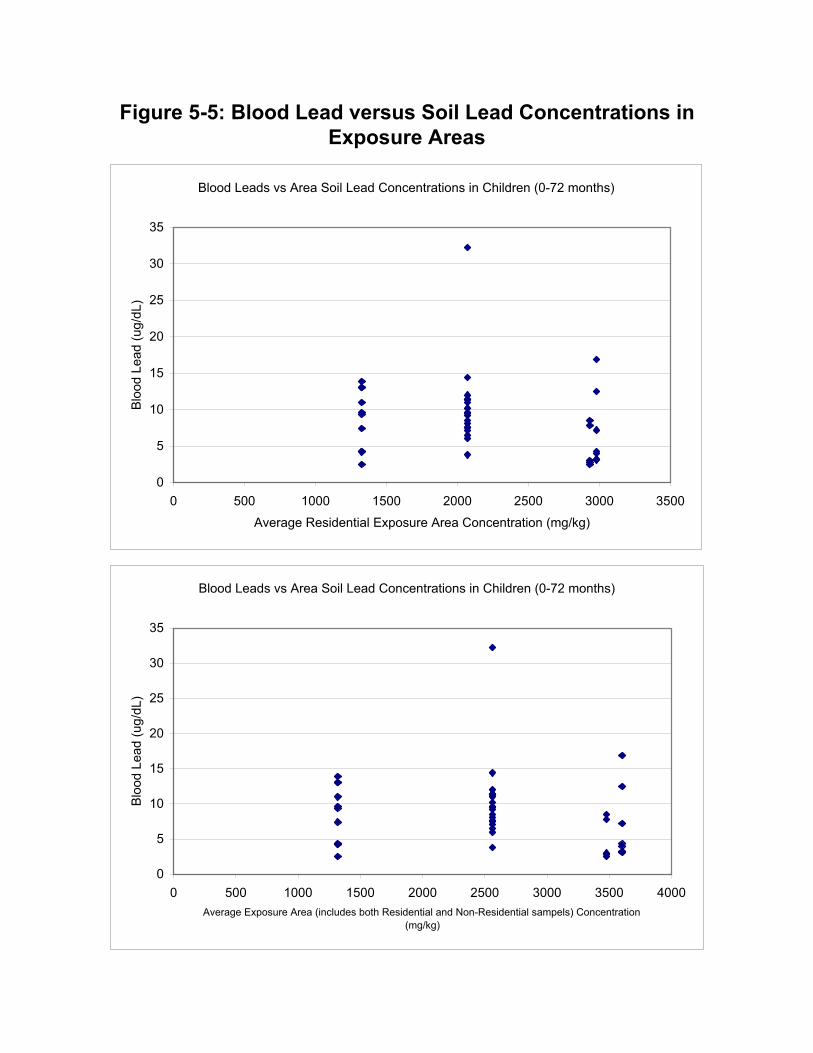
Figure 5-5: Blood Lead versus Soil Lead Concentrations in
Exposure Areas
Blood Leads vs Area Soil Lead Concentrations in Children (0-72 months)
0
5
10
15
20
25
30
35
0 500 1000 1500 2000 2500 3000 3500
Average Residential Exposure Area Concentration (mg/kg)
Blo
od L
ead (
ug/d
L)
Blood Leads vs Area Soil Lead Concentrations in Children (0-72 months)
0
5
10
15
20
25
30
35
0 500 1000 1500 2000 2500 3000 3500 4000
Average Exposure Area (includes both Residential and Non-Residential sampels) Concentration
(mg/kg)
Blo
od L
ead (
ug/d
L)
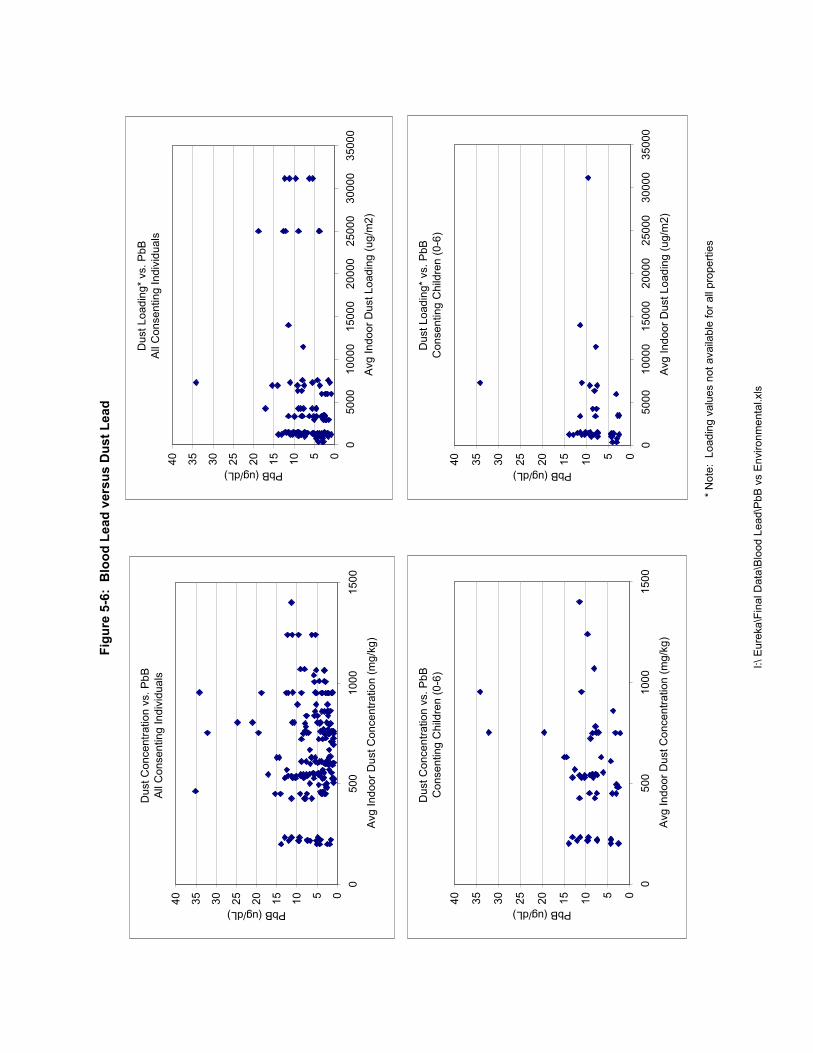
* N
ote
: L
oa
din
g v
alu
es n
ot
ava
ilab
le f
or
all
pro
pe
rtie
s
Fig
ure
5-6
: B
loo
d L
ead
vers
us D
ust
Lead
Dust C
oncentr
ation v
s. P
bB
All
Consenting Indiv
iduals
05
10
15
20
25
30
35
40
0500
1000
1500
Avg Indoor
Dust C
oncentr
ation (
mg/k
g)
PbB (ug/dL)
Dust C
oncentr
ation v
s. P
bB
Consenting C
hild
ren (
0-6
)
05
10
15
20
25
30
35
40
0500
1000
1500
Avg Indoor
Dust C
oncentr
ation (
mg/k
g)
PbB (ug/dL)D
ust Loadin
g*
vs. P
bB
All
Consenting Indiv
iduals
05
10
15
20
25
30
35
40
05000
10000
15000
20000
25000
30000
35000
Avg Indoor
Dust Loadin
g (
ug/m
2)
PbB (ug/dL)
Dust Loadin
g*
vs. P
bB
Consenting C
hild
ren (
0-6
)
05
10
15
20
25
30
35
40
05000
10000
15000
20000
25000
30000
35000
Avg Indoor
Dust Loadin
g (
ug/m
2)
PbB (ug/dL)
I:\
Eu
reka
\Fin
al D
ata
\Blo
od
Le
ad
\Pb
B v
s E
nviro
nm
en
tal.xls
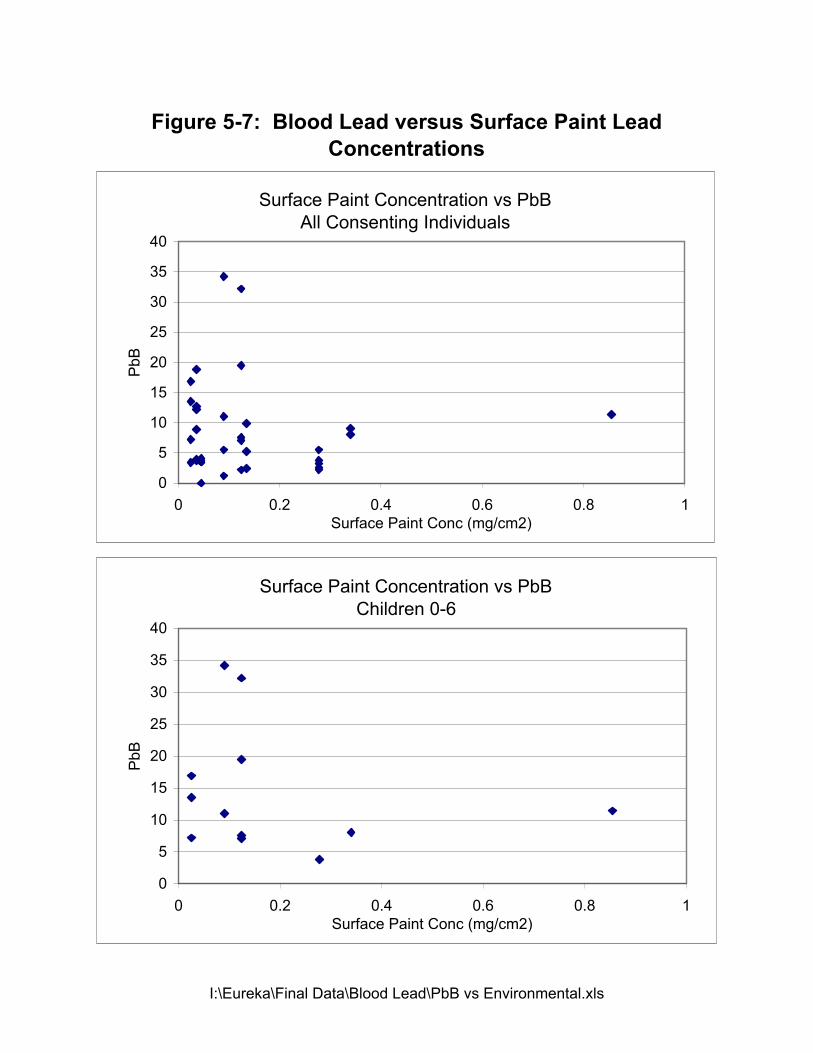
Figure 5-7: Blood Lead versus Surface Paint Lead
Concentrations
Surface Paint Concentration vs PbB
All Consenting Individuals
0
5
10
15
20
25
30
35
40
0 0.2 0.4 0.6 0.8 1
Surface Paint Conc (mg/cm2)
PbB
Surface Paint Concentration vs PbB
Children 0-6
0
5
10
15
20
25
30
35
40
0 0.2 0.4 0.6 0.8 1
Surface Paint Conc (mg/cm2)
PbB
I:\Eureka\Final Data\Blood Lead\PbB vs Environmental.xls

Figure 5-8: Total Blood Lead versus Surface Paint Lead
Concentrations
Total Paint Concentration vs PbB
All Consenting Individuals
0
5
10
15
20
25
30
35
40
0 2 4 6 8 10 12 14
Total Paint Conc (mg/cm2)
PbB
Total Paint Concentration vs PbB
Children (0-6)
0
5
10
15
20
25
30
35
40
0 2 4 6 8 10 12 14
Total Paint Conc (mg/cm2)
PbB
I:\Eureka\Final Data\Blood Lead\PbB vs Environmental.xls
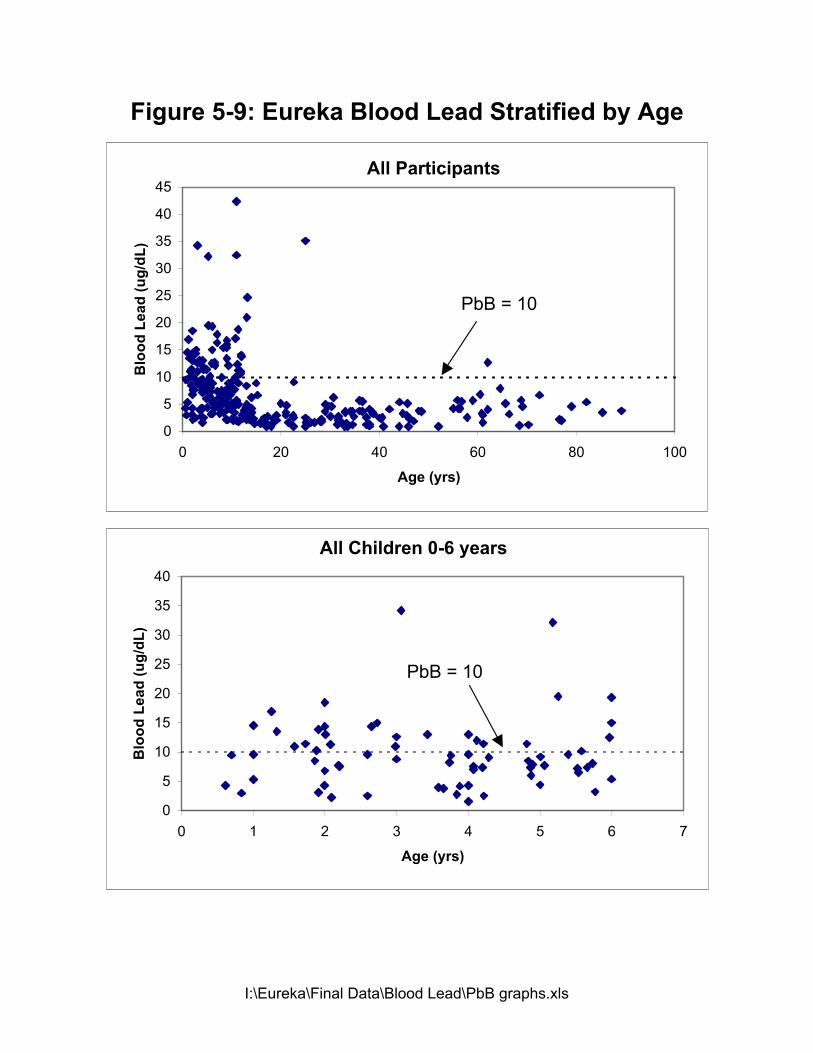
Figure 5-9: Eureka Blood Lead Stratified by Age
0
5
10
15
20
25
30
35
40
0 1 2 3 4 5 6 7
Age (yrs)
Blo
od
Le
ad
(u
g/d
L)
All Children 0-6 years
PbB = 10
0
5
10
15
20
25
30
35
40
45
0 20 40 60 80 100
Age (yrs)
Blo
od
Le
ad
(u
g/d
L)
All Participants
PbB = 10
I:\Eureka\Final Data\Blood Lead\PbB graphs.xls
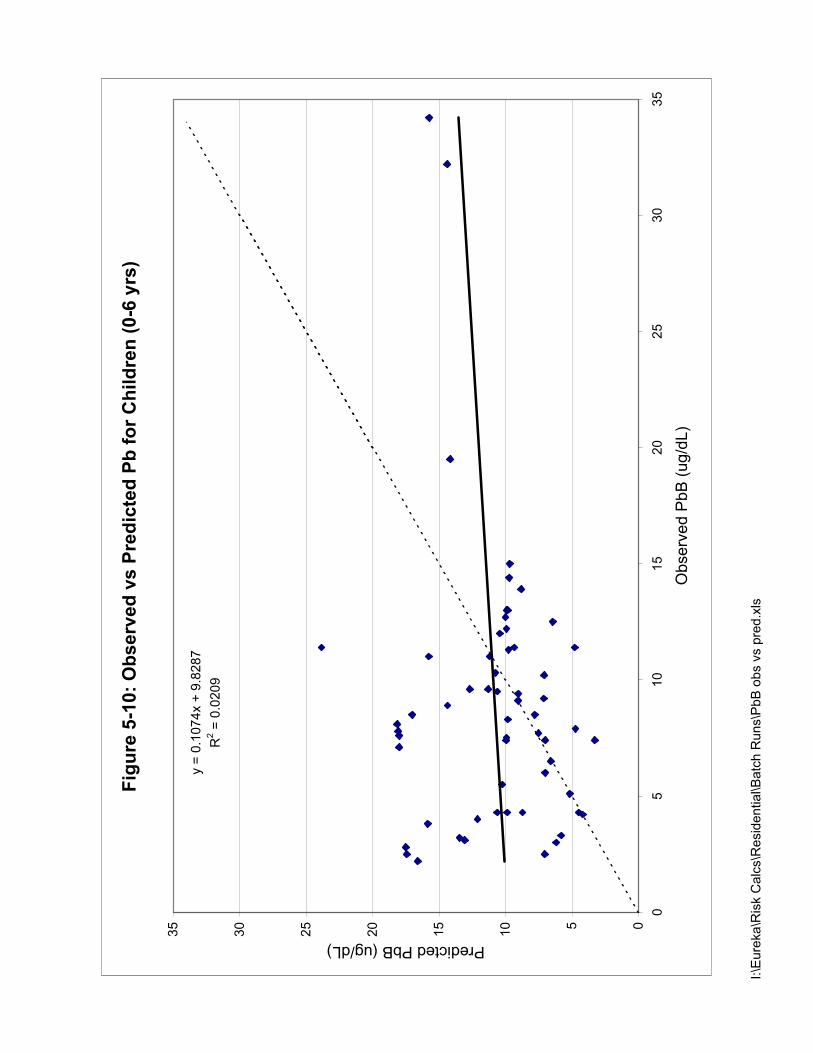
I:\E
ure
ka
\Ris
k C
alc
s\R
esid
en
tia
l\B
atc
h R
un
s\P
bB
ob
s v
s p
red
.xls
Fig
ure
5-1
0:
Ob
serv
ed
vs P
red
icte
d P
b f
or
Ch
ild
ren
(0-6
yrs
)
y =
0.1
07
4x +
9.8
28
7
R2 =
0.0
20
9
05
10
15
20
25
30
35
05
10
15
20
25
30
35
Observ
ed P
bB
(ug/d
L)
Predicted PbB (ug/dL)
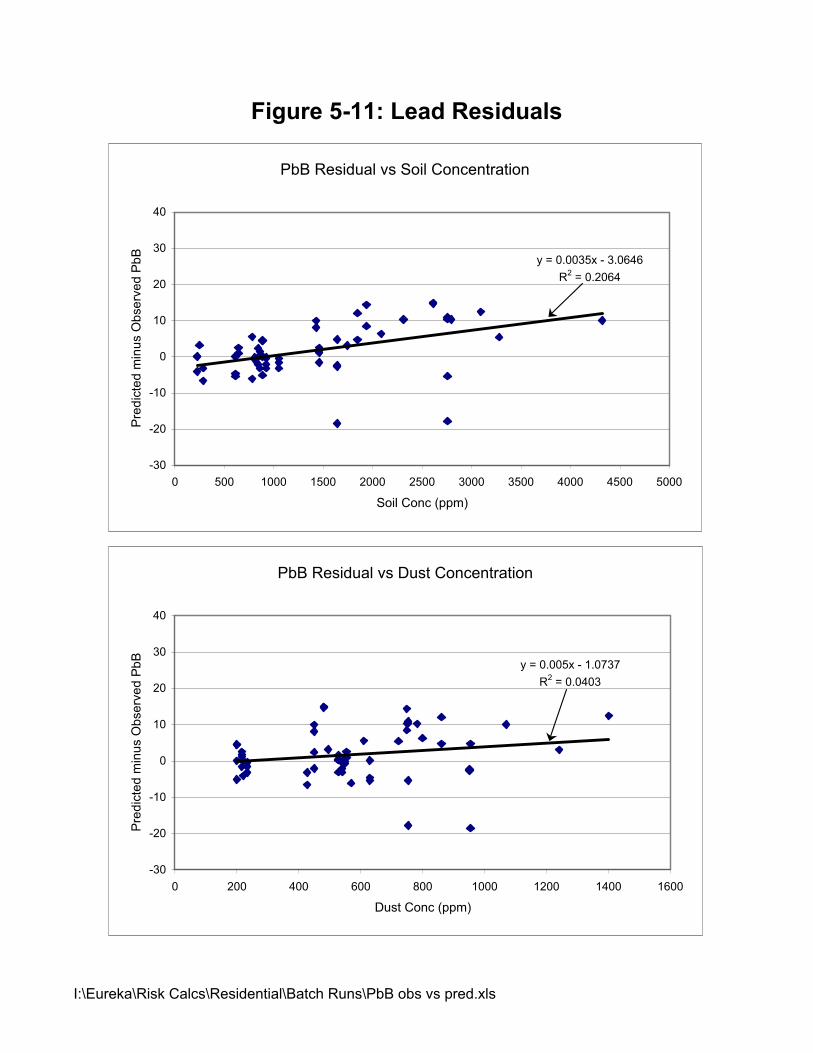
Figure 5-11: Lead Residuals
PbB Residual vs Soil Concentration
y = 0.0035x - 3.0646
R2 = 0.2064
-30
-20
-10
0
10
20
30
40
0 500 1000 1500 2000 2500 3000 3500 4000 4500 5000
Soil Conc (ppm)
Pre
dic
ted
min
us O
bse
rve
d P
bB
PbB Residual vs Dust Concentration
y = 0.005x - 1.0737
R2 = 0.0403
-30
-20
-10
0
10
20
30
40
0 200 400 600 800 1000 1200 1400 1600
Dust Conc (ppm)
Pre
dic
ted
min
us O
bse
rve
d P
bB
I:\Eureka\Risk Calcs\Residential\Batch Runs\PbB obs vs pred.xls

APPENDIX AANALYSIS OF XRF DATA QUALITY FOR SOILS FROM DATA SETS 1 AND 2
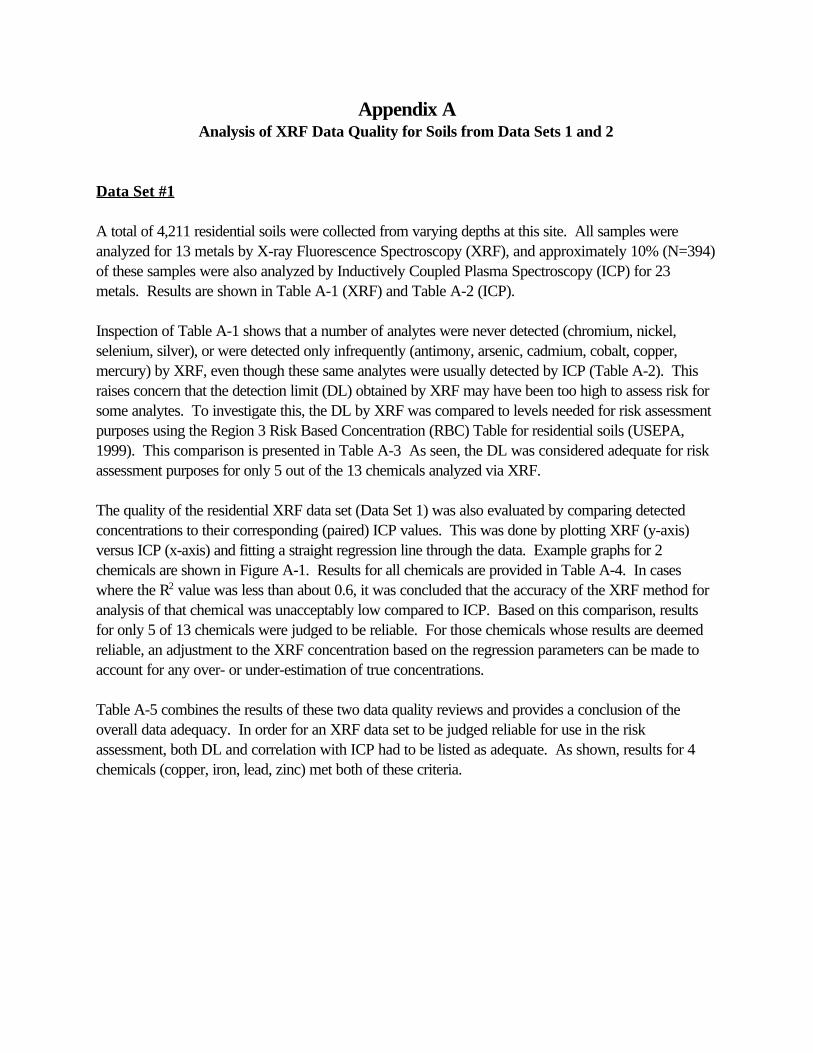
Appendix AAnalysis of XRF Data Quality for Soils from Data Sets 1 and 2
Data Set #1
A total of 4,211 residential soils were collected from varying depths at this site. All samples wereanalyzed for 13 metals by X-ray Fluorescence Spectroscopy (XRF), and approximately 10% (N=394)of these samples were also analyzed by Inductively Coupled Plasma Spectroscopy (ICP) for 23metals. Results are shown in Table A-1 (XRF) and Table A-2 (ICP).
Inspection of Table A-1 shows that a number of analytes were never detected (chromium, nickel,selenium, silver), or were detected only infrequently (antimony, arsenic, cadmium, cobalt, copper,mercury) by XRF, even though these same analytes were usually detected by ICP (Table A-2). Thisraises concern that the detection limit (DL) obtained by XRF may have been too high to assess risk forsome analytes. To investigate this, the DL by XRF was compared to levels needed for risk assessmentpurposes using the Region 3 Risk Based Concentration (RBC) Table for residential soils (USEPA,1999). This comparison is presented in Table A-3 As seen, the DL was considered adequate for riskassessment purposes for only 5 out of the 13 chemicals analyzed via XRF.
The quality of the residential XRF data set (Data Set 1) was also evaluated by comparing detectedconcentrations to their corresponding (paired) ICP values. This was done by plotting XRF (y-axis)versus ICP (x-axis) and fitting a straight regression line through the data. Example graphs for 2chemicals are shown in Figure A-1. Results for all chemicals are provided in Table A-4. In caseswhere the R2 value was less than about 0.6, it was concluded that the accuracy of the XRF method foranalysis of that chemical was unacceptably low compared to ICP. Based on this comparison, resultsfor only 5 of 13 chemicals were judged to be reliable. For those chemicals whose results are deemedreliable, an adjustment to the XRF concentration based on the regression parameters can be made toaccount for any over- or under-estimation of true concentrations.
Table A-5 combines the results of these two data quality reviews and provides a conclusion of theoverall data adequacy. In order for an XRF data set to be judged reliable for use in the riskassessment, both DL and correlation with ICP had to be listed as adequate. As shown, results for 4chemicals (copper, iron, lead, zinc) met both of these criteria.

Table A-1: Summary Statistics for Data Set #1 Analyzed via XRF
Analyte DetectionFrequency
(%)
Non Detects (mg/kg) Detects Only (mg/kg)
Avg Min Max Avg Min Max
antimony 1415/4211 (34%)
43 15 260 257 34 790
arsenic 57/4211 (1%)
89 15 2,500 361 15 2,800
barium 4205/4211(99.8%)
112 100 140 830 85 8,300
cadmium 323/4211 (8%)
43 8 110 73 29 250
chromium 0/4211 (0%)
-- -- -- ND ND ND
cobalt 170/4211 (4%)
447 81 1,500 601 250 1,800
copper 695/4211 (16%)
58 13 160 294 57 2700
iron 4208/4211 (99.9%)
-- -- -- 19,649 5,600 88,000
lead 3674/4211 (87%)
68 18 190 1,410 21 25,000
manganese 3223/4211 (77%)
2,340 180 4,900 1,413 360 8,500
mercury 158/4211(4%)
33 10 120 48 14 290
nickel 0/4211(0%)
94 15 260 ND ND ND
selenium 0/4211(0%)
-- -- -- ND ND ND
silver 0/4211(0%)
-- -- -- ND ND ND
zinc 4068/4211 (97%)
58 26 96 1,509 34 44,000
ND - analyte was not detected– no numeric values were provided, values were listed as ND in the data tables

Table A-2 Summary Statistics for Data Set #1 Analyzed by ICP
Analyte DetectionFrequency (%)
Avg*(mg/kg)
Min(mg/kg)
Max(mg/kg)
Aluminum394/394(100%)
11,826 1,100 20,000
Antimony27/30(90%)
19 10 59
Arsenic394/394(100%)
141 7.7 2,100
Barium394/394(100%)
326 91 1,200
Berylium394/394(100%)
0.92 0.19 1.8
Cadmium394/394(100%)
19 0.5 140
Calcium394/394(100%)
49,968 5,200 250,000
Chromium394/394(100%)
17 2 110
Cobalt394/394(100%)
5.7 1.1 15
Copper394/394(100%)
169 12 2,900
Iron394/394(100%)
18,576 9,000 83,000
Lead394/394(100%)
2,987 110 37,000
Magnesium394/394(100%)
18,741 2,100 84,000
Manganese394/394(100%)
1,054 220 5,100
Mercury394/394(100%)
3.3 0.04 130
Nickel394/394(100%)
12 3.4 34
Potassium394/394(100%)
3,346 390 6,200
Selenium115/370(31%)
0.79 0.5 8.3
Silver351/384(91%)
11 1 190
Sodium394/394(100%)
333 59 3,700
Thallium53/391(14%)
56 31 200
Vanadium394/394(100%)
26 7.7 330
Zinc394/394(100%)
2,687 120 26,000
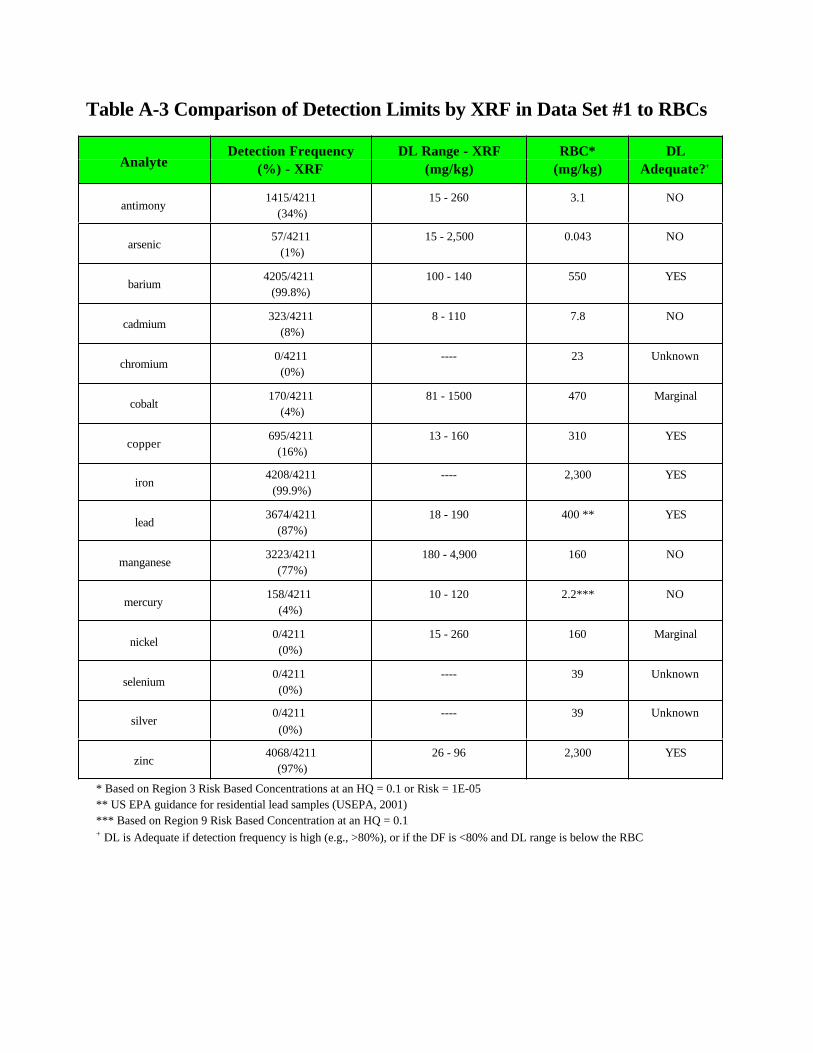
Table A-3 Comparison of Detection Limits by XRF in Data Set #1 to RBCs
AnalyteDetection Frequency
(%) - XRFDL Range - XRF
(mg/kg)RBC*
(mg/kg)DL
Adequate?+
antimony1415/4211
(34%)15 - 260 3.1 NO
arsenic57/4211
(1%)15 - 2,500 0.043 NO
barium4205/4211
(99.8%)100 - 140 550 YES
cadmium323/4211
(8%)8 - 110 7.8 NO
chromium0/4211 (0%)
---- 23 Unknown
cobalt170/4211
(4%)81 - 1500 470 Marginal
copper695/4211
(16%)13 - 160 310 YES
iron4208/4211 (99.9%)
---- 2,300 YES
lead3674/4211
(87%)18 - 190 400 ** YES
manganese3223/4211
(77%)180 - 4,900 160 NO
mercury158/4211
(4%)10 - 120 2.2*** NO
nickel0/4211
(0%)15 - 260 160 Marginal
selenium0/4211
(0%)---- 39 Unknown
silver0/4211
(0%)---- 39 Unknown
zinc4068/4211
(97%)26 - 96 2,300 YES
* Based on Region 3 Risk Based Concentrations at an HQ = 0.1 or Risk = 1E-05 ** US EPA guidance for residential lead samples (USEPA, 2001) *** Based on Region 9 Risk Based Concentration at an HQ = 0.1
+ DL is Adequate if detection frequency is high (e.g., >80%), or if the DF is <80% and DL range is below the RBC
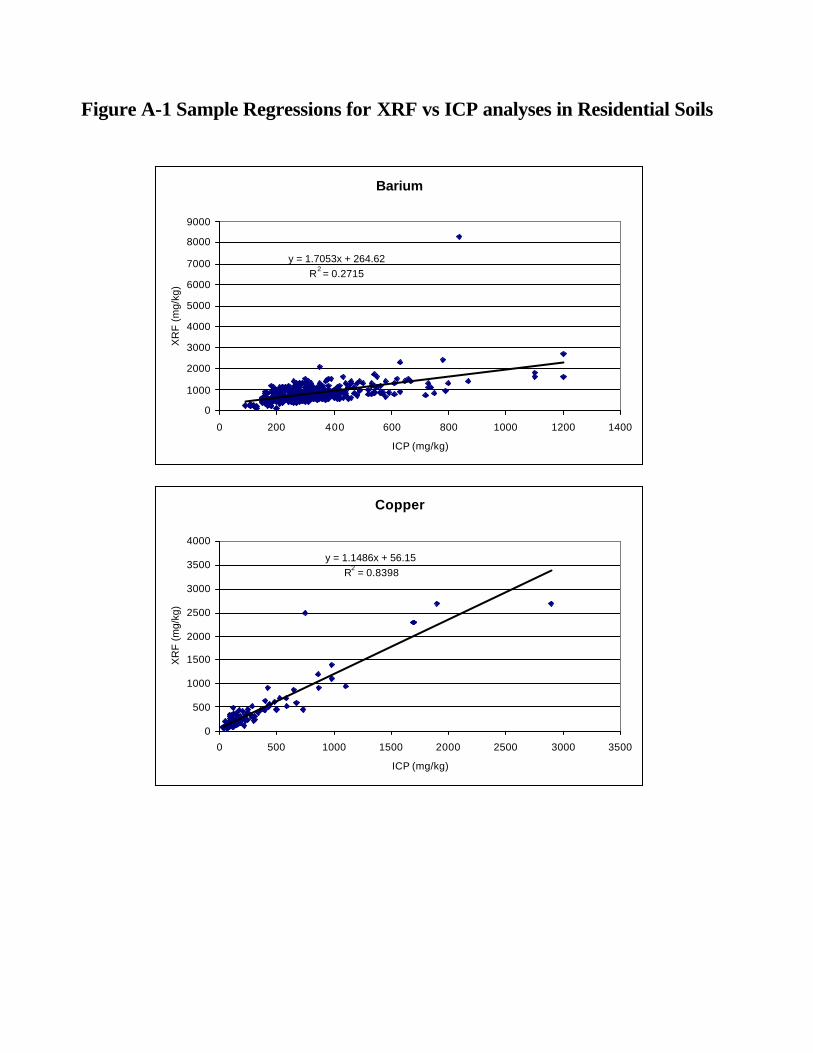
Barium
y = 1.7053x + 264.62R2 = 0.2715
0
1000
2000
3000
4000
5000
6000
7000
8000
9000
0 200 400 600 800 1000 1200 1400
ICP (mg/kg)
XR
F (m
g/kg
)
Copper
y = 1.1486x + 56.15R2 = 0.8398
0
500
1000
1500
2000
2500
3000
3500
4000
0 500 1000 1500 2000 2500 3000 3500
ICP (mg/kg)
XR
F (m
g/kg
)
Figure A-1 Sample Regressions for XRF vs ICP analyses in Residential Soils
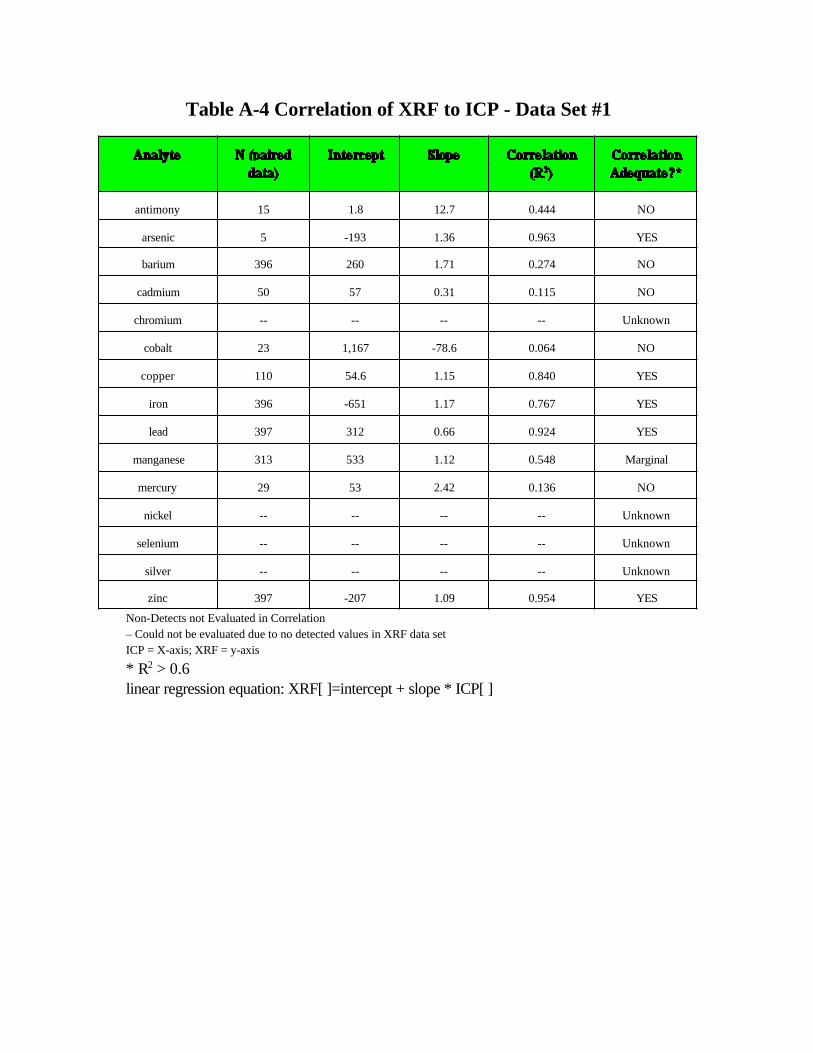
Table A-4 Correlation of XRF to ICP - Data Set #1
antimony 15 1.8 12.7 0.444 NO
arsenic 5 -193 1.36 0.963 YES
barium 396 260 1.71 0.274 NO
cadmium 50 57 0.31 0.115 NO
chromium -- -- -- -- Unknown
cobalt 23 1,167 -78.6 0.064 NO
copper 110 54.6 1.15 0.840 YES
iron 396 -651 1.17 0.767 YES
lead 397 312 0.66 0.924 YES
manganese 313 533 1.12 0.548 Marginal
mercury 29 53 2.42 0.136 NO
nickel -- -- -- -- Unknown
selenium -- -- -- -- Unknown
silver -- -- -- -- Unknown
zinc 397 -207 1.09 0.954 YES
Non-Detects not Evaluated in Correlation– Could not be evaluated due to no detected values in XRF data setICP = X-axis; XRF = y-axis
* R2 > 0.6linear regression equation: XRF[ ]=intercept + slope * ICP[ ]
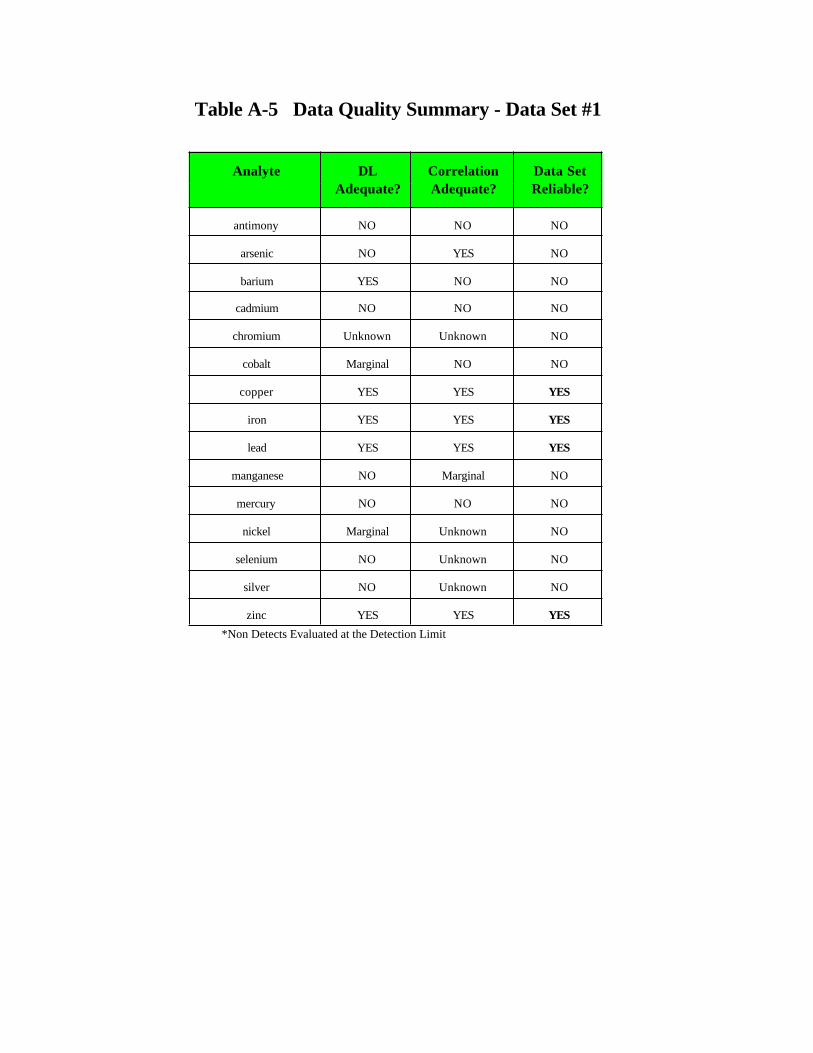
Table A-5 Data Quality Summary - Data Set #1
Analyte DLAdequate?
CorrelationAdequate?
Data SetReliable?
antimony NO NO NO
arsenic NO YES NO
barium YES NO NO
cadmium NO NO NO
chromium Unknown Unknown NO
cobalt Marginal NO NO
copper YES YES YES
iron YES YES YES
lead YES YES YES
manganese NO Marginal NO
mercury NO NO NO
nickel Marginal Unknown NO
selenium NO Unknown NO
silver NO Unknown NO
zinc YES YES YES*Non Detects Evaluated at the Detection Limit
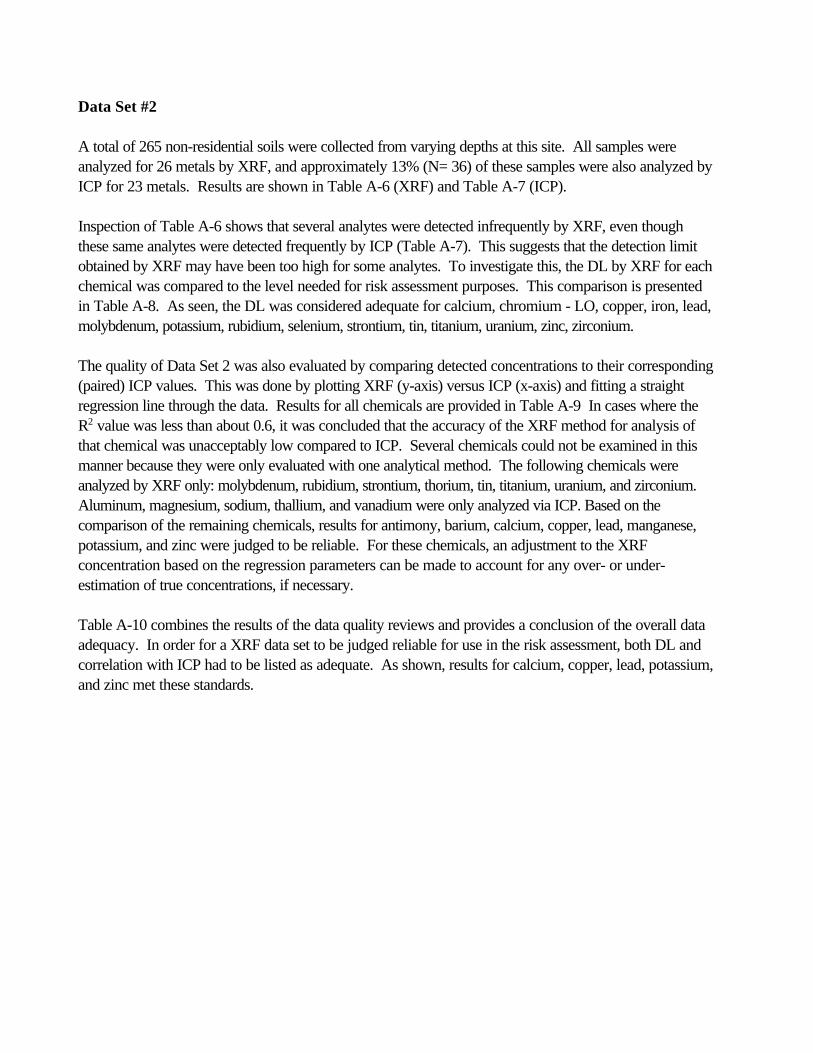
Data Set #2
A total of 265 non-residential soils were collected from varying depths at this site. All samples wereanalyzed for 26 metals by XRF, and approximately 13% (N= 36) of these samples were also analyzed byICP for 23 metals. Results are shown in Table A-6 (XRF) and Table A-7 (ICP).
Inspection of Table A-6 shows that several analytes were detected infrequently by XRF, even thoughthese same analytes were detected frequently by ICP (Table A-7). This suggests that the detection limitobtained by XRF may have been too high for some analytes. To investigate this, the DL by XRF for eachchemical was compared to the level needed for risk assessment purposes. This comparison is presentedin Table A-8. As seen, the DL was considered adequate for calcium, chromium - LO, copper, iron, lead,molybdenum, potassium, rubidium, selenium, strontium, tin, titanium, uranium, zinc, zirconium.
The quality of Data Set 2 was also evaluated by comparing detected concentrations to their corresponding(paired) ICP values. This was done by plotting XRF (y-axis) versus ICP (x-axis) and fitting a straightregression line through the data. Results for all chemicals are provided in Table A-9 In cases where theR2 value was less than about 0.6, it was concluded that the accuracy of the XRF method for analysis ofthat chemical was unacceptably low compared to ICP. Several chemicals could not be examined in thismanner because they were only evaluated with one analytical method. The following chemicals wereanalyzed by XRF only: molybdenum, rubidium, strontium, thorium, tin, titanium, uranium, and zirconium. Aluminum, magnesium, sodium, thallium, and vanadium were only analyzed via ICP. Based on thecomparison of the remaining chemicals, results for antimony, barium, calcium, copper, lead, manganese,potassium, and zinc were judged to be reliable. For these chemicals, an adjustment to the XRFconcentration based on the regression parameters can be made to account for any over- or under-estimation of true concentrations, if necessary.
Table A-10 combines the results of the data quality reviews and provides a conclusion of the overall dataadequacy. In order for a XRF data set to be judged reliable for use in the risk assessment, both DL andcorrelation with ICP had to be listed as adequate. As shown, results for calcium, copper, lead, potassium,and zinc met these standards.
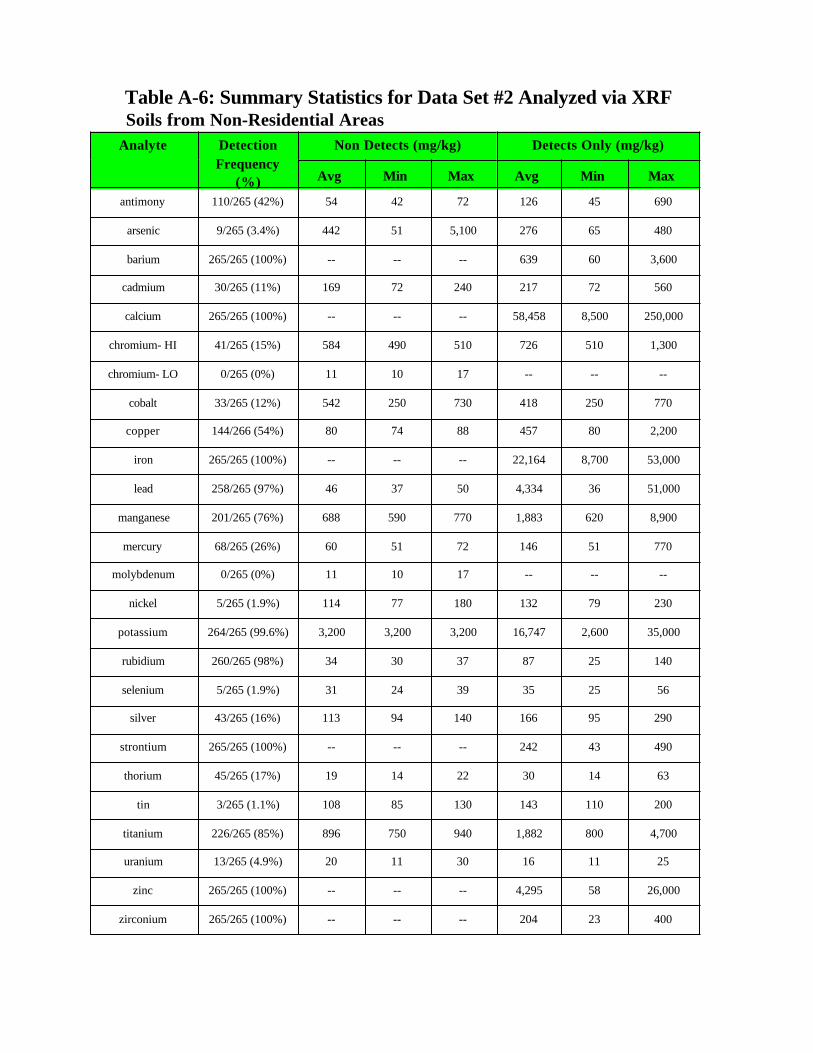
Table A-6: Summary Statistics for Data Set #2 Analyzed via XRFSoils from Non-Residential Areas
Analyte DetectionFrequency
(%)
Non Detects (mg/kg) Detects Only (mg/kg)
Avg Min Max Avg Min Max
antimony 110/265 (42%) 54 42 72 126 45 690
arsenic 9/265 (3.4%) 442 51 5,100 276 65 480
barium 265/265 (100%) -- -- -- 639 60 3,600
cadmium 30/265 (11%) 169 72 240 217 72 560
calcium 265/265 (100%) -- -- -- 58,458 8,500 250,000
chromium- HI 41/265 (15%) 584 490 510 726 510 1,300
chromium- LO 0/265 (0%) 11 10 17 -- -- --
cobalt 33/265 (12%) 542 250 730 418 250 770
copper 144/266 (54%) 80 74 88 457 80 2,200
iron 265/265 (100%) -- -- -- 22,164 8,700 53,000
lead 258/265 (97%) 46 37 50 4,334 36 51,000
manganese 201/265 (76%) 688 590 770 1,883 620 8,900
mercury 68/265 (26%) 60 51 72 146 51 770
molybdenum 0/265 (0%) 11 10 17 -- -- --
nickel 5/265 (1.9%) 114 77 180 132 79 230
potassium 264/265 (99.6%) 3,200 3,200 3,200 16,747 2,600 35,000
rubidium 260/265 (98%) 34 30 37 87 25 140
selenium 5/265 (1.9%) 31 24 39 35 25 56
silver 43/265 (16%) 113 94 140 166 95 290
strontium 265/265 (100%) -- -- -- 242 43 490
thorium 45/265 (17%) 19 14 22 30 14 63
tin 3/265 (1.1%) 108 85 130 143 110 200
titanium 226/265 (85%) 896 750 940 1,882 800 4,700
uranium 13/265 (4.9%) 20 11 30 16 11 25
zinc 265/265 (100%) -- -- -- 4,295 58 26,000
zirconium 265/265 (100%) -- -- -- 204 23 400
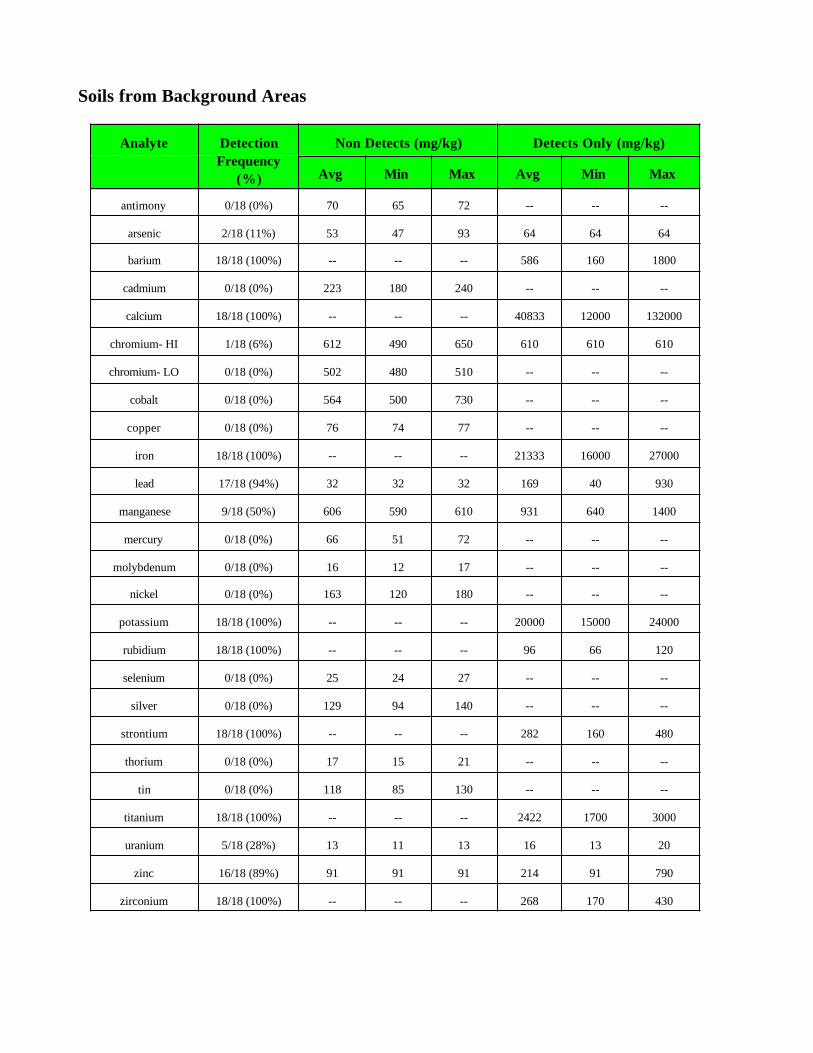
Soils from Background Areas
Analyte DetectionFrequency
(%)
Non Detects (mg/kg) Detects Only (mg/kg)
Avg Min Max Avg Min Max
antimony 0/18 (0%) 70 65 72 -- -- --
arsenic 2/18 (11%) 53 47 93 64 64 64
barium 18/18 (100%) -- -- -- 586 160 1800
cadmium 0/18 (0%) 223 180 240 -- -- --
calcium 18/18 (100%) -- -- -- 40833 12000 132000
chromium- HI 1/18 (6%) 612 490 650 610 610 610
chromium- LO 0/18 (0%) 502 480 510 -- -- --
cobalt 0/18 (0%) 564 500 730 -- -- --
copper 0/18 (0%) 76 74 77 -- -- --
iron 18/18 (100%) -- -- -- 21333 16000 27000
lead 17/18 (94%) 32 32 32 169 40 930
manganese 9/18 (50%) 606 590 610 931 640 1400
mercury 0/18 (0%) 66 51 72 -- -- --
molybdenum 0/18 (0%) 16 12 17 -- -- --
nickel 0/18 (0%) 163 120 180 -- -- --
potassium 18/18 (100%) -- -- -- 20000 15000 24000
rubidium 18/18 (100%) -- -- -- 96 66 120
selenium 0/18 (0%) 25 24 27 -- -- --
silver 0/18 (0%) 129 94 140 -- -- --
strontium 18/18 (100%) -- -- -- 282 160 480
thorium 0/18 (0%) 17 15 21 -- -- --
tin 0/18 (0%) 118 85 130 -- -- --
titanium 18/18 (100%) -- -- -- 2422 1700 3000
uranium 5/18 (28%) 13 11 13 16 13 20
zinc 16/18 (89%) 91 91 91 214 91 790
zirconium 18/18 (100%) -- -- -- 268 170 430
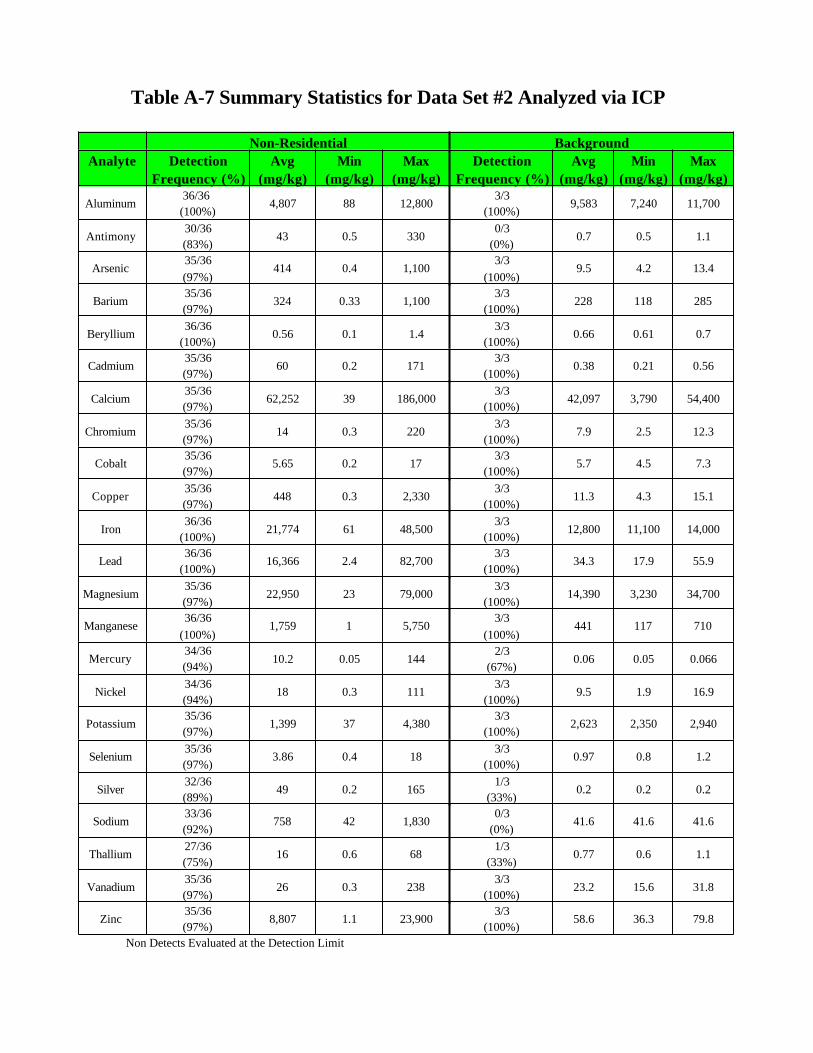
Table A-7 Summary Statistics for Data Set #2 Analyzed via ICP
Non-Residential BackgroundAnalyte Detection
Frequency (%)Avg
(mg/kg)Min
(mg/kg)Max
(mg/kg)Detection
Frequency (%)Avg
(mg/kg)Min
(mg/kg)Max
(mg/kg)
Aluminum36/36
(100%)4,807 88 12,800
3/3(100%)
9,583 7,240 11,700
Antimony30/36(83%)
43 0.5 3300/3
(0%)0.7 0.5 1.1
Arsenic35/36(97%)
414 0.4 1,1003/3
(100%)9.5 4.2 13.4
Barium35/36(97%)
324 0.33 1,1003/3
(100%)228 118 285
Beryllium36/36
(100%)0.56 0.1 1.4
3/3(100%)
0.66 0.61 0.7
Cadmium35/36(97%)
60 0.2 1713/3
(100%)0.38 0.21 0.56
Calcium35/36(97%)
62,252 39 186,0003/3
(100%)42,097 3,790 54,400
Chromium35/36(97%)
14 0.3 2203/3
(100%)7.9 2.5 12.3
Cobalt35/36(97%)
5.65 0.2 173/3
(100%)5.7 4.5 7.3
Copper35/36(97%)
448 0.3 2,3303/3
(100%)11.3 4.3 15.1
Iron36/36
(100%)21,774 61 48,500
3/3(100%)
12,800 11,100 14,000
Lead36/36
(100%)16,366 2.4 82,700
3/3(100%)
34.3 17.9 55.9
Magnesium35/36(97%)
22,950 23 79,0003/3
(100%)14,390 3,230 34,700
Manganese36/36
(100%)1,759 1 5,750
3/3(100%)
441 117 710
Mercury34/36(94%) 10.2 0.05 144
2/3(67%)
0.06 0.05 0.066
Nickel34/36(94%)
18 0.3 1113/3
(100%)9.5 1.9 16.9
Potassium35/36(97%)
1,399 37 4,3803/3
(100%)2,623 2,350 2,940
Selenium35/36(97%)
3.86 0.4 183/3
(100%)0.97 0.8 1.2
Silver32/36(89%)
49 0.2 1651/3
(33%)0.2 0.2 0.2
Sodium33/36(92%)
758 42 1,8300/3
(0%)41.6 41.6 41.6
Thallium27/36(75%)
16 0.6 681/3
(33%)0.77 0.6 1.1
Vanadium35/36(97%)
26 0.3 2383/3
(100%)23.2 15.6 31.8
Zinc35/36(97%)
8,807 1.1 23,9003/3
(100%)58.6 36.3 79.8
Non Detects Evaluated at the Detection Limit
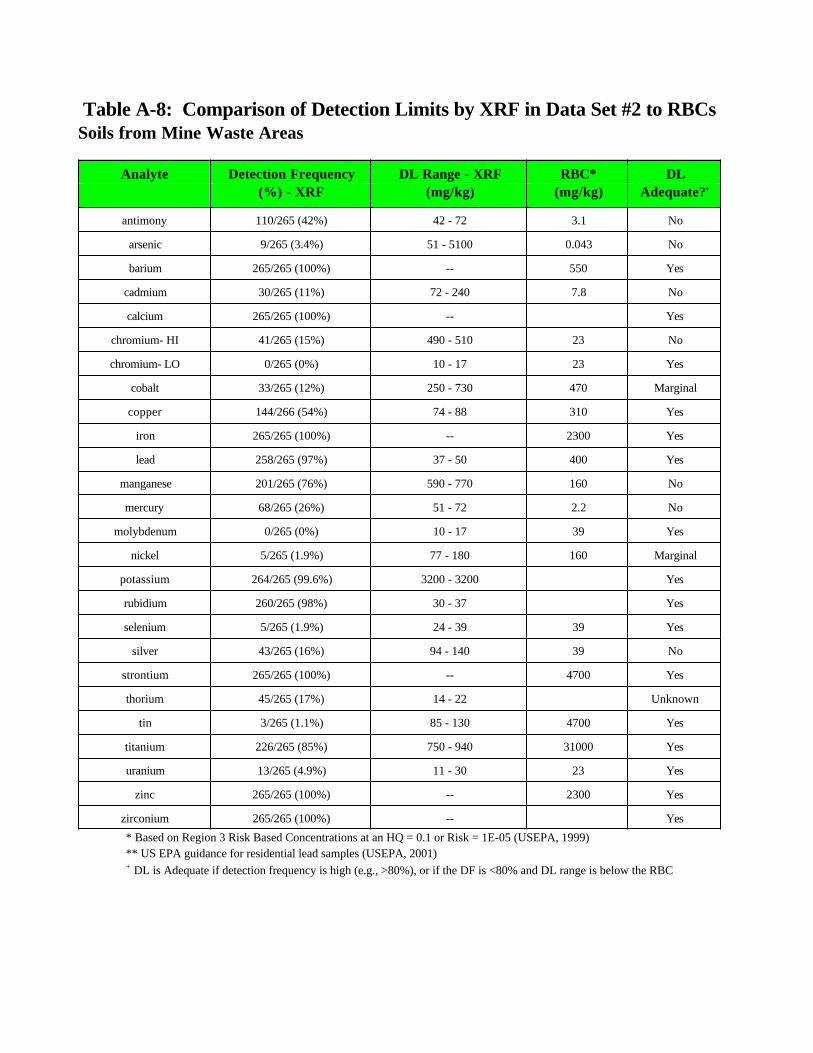
Table A-8: Comparison of Detection Limits by XRF in Data Set #2 to RBCsSoils from Mine Waste Areas
Analyte Detection Frequency(%) - XRF
DL Range - XRF(mg/kg)
RBC*(mg/kg)
DLAdequate?+
antimony 110/265 (42%) 42 - 72 3.1 No
arsenic 9/265 (3.4%) 51 - 5100 0.043 No
barium 265/265 (100%) -- 550 Yes
cadmium 30/265 (11%) 72 - 240 7.8 No
calcium 265/265 (100%) -- Yes
chromium- HI 41/265 (15%) 490 - 510 23 No
chromium- LO 0/265 (0%) 10 - 17 23 Yes
cobalt 33/265 (12%) 250 - 730 470 Marginal
copper 144/266 (54%) 74 - 88 310 Yes
iron 265/265 (100%) -- 2300 Yes
lead 258/265 (97%) 37 - 50 400 Yes
manganese 201/265 (76%) 590 - 770 160 No
mercury 68/265 (26%) 51 - 72 2.2 No
molybdenum 0/265 (0%) 10 - 17 39 Yes
nickel 5/265 (1.9%) 77 - 180 160 Marginal
potassium 264/265 (99.6%) 3200 - 3200 Yes
rubidium 260/265 (98%) 30 - 37 Yes
selenium 5/265 (1.9%) 24 - 39 39 Yes
silver 43/265 (16%) 94 - 140 39 No
strontium 265/265 (100%) -- 4700 Yes
thorium 45/265 (17%) 14 - 22 Unknown
tin 3/265 (1.1%) 85 - 130 4700 Yes
titanium 226/265 (85%) 750 - 940 31000 Yes
uranium 13/265 (4.9%) 11 - 30 23 Yes
zinc 265/265 (100%) -- 2300 Yes
zirconium 265/265 (100%) -- Yes* Based on Region 3 Risk Based Concentrations at an HQ = 0.1 or Risk = 1E-05 (USEPA, 1999)** US EPA guidance for residential lead samples (USEPA, 2001)+ DL is Adequate if detection frequency is high (e.g., >80%), or if the DF is <80% and DL range is below the RBC

Soils from Background Areas
AnalyteDetection Frequency
(%) - XRFDL Range - XRF
(mg/kg)RBC*
(mg/kg)DL
Adequate?+
antimony 0/18 (0%) 65 - 72 3.1 No
arsenic 2/18 (11%) 47 - 93 0.043 No
barium 18/18 (100%) -- 550 Yes
cadmium 0/18 (0%) 180 - 240 7.8 No
calcium 18/18 (100%) -- Yes
chromium- HI 1/18 (6%) 490 - 650 23 No
chromium- LO 0/18 (0%) 480 - 510 23 No
cobalt 0/18 (0%) 500 - 730 470 No
copper 0/18 (0%) 74 - 77 310 Yes
iron 18/18 (100%) -- 2300 Yes
lead 17/18 (94%) 32 - 32 400 Yes
manganese 9/18 (50%) 590 - 610 160 No
mercury 0/18 (0%) 51 - 72 2.2 No
molybdenum 0/18 (0%) 12 - 17 39 Yes
nickel 0/18 (0%) 120 - 180 160 Marginal
potassium 18/18 (100%) -- Yes
rubidium 18/18 (100%) -- Yes
selenium 0/18 (0%) 24 - 27 39 Yes
silver 0/18 (0%) 94 - 140 39 No
strontium 18/18 (100%) -- 4700 Yes
thorium 0/18 (0%) 15 - 21 Unknown
tin 0/18 (0%) 85 - 130 4700 Yes
titanium 18/18 (100%) -- 31000 Yes
uranium 5/18 (28%) 11 - 13 23 Yes
zinc 16/18 (89%) 91 - 91 2300 Yes
zirconium 18/18 (100%) -- Yes
* Based on Region 3 Risk Based Concentrations at an HQ = 0.1 or Risk = 1E-05** US EPA guidance for residential lead samples (USEPA, 2001)+ DL is Adequate if detection frequency is high (e.g., >80%), or if the DF is <80% and DL range is below the RBC
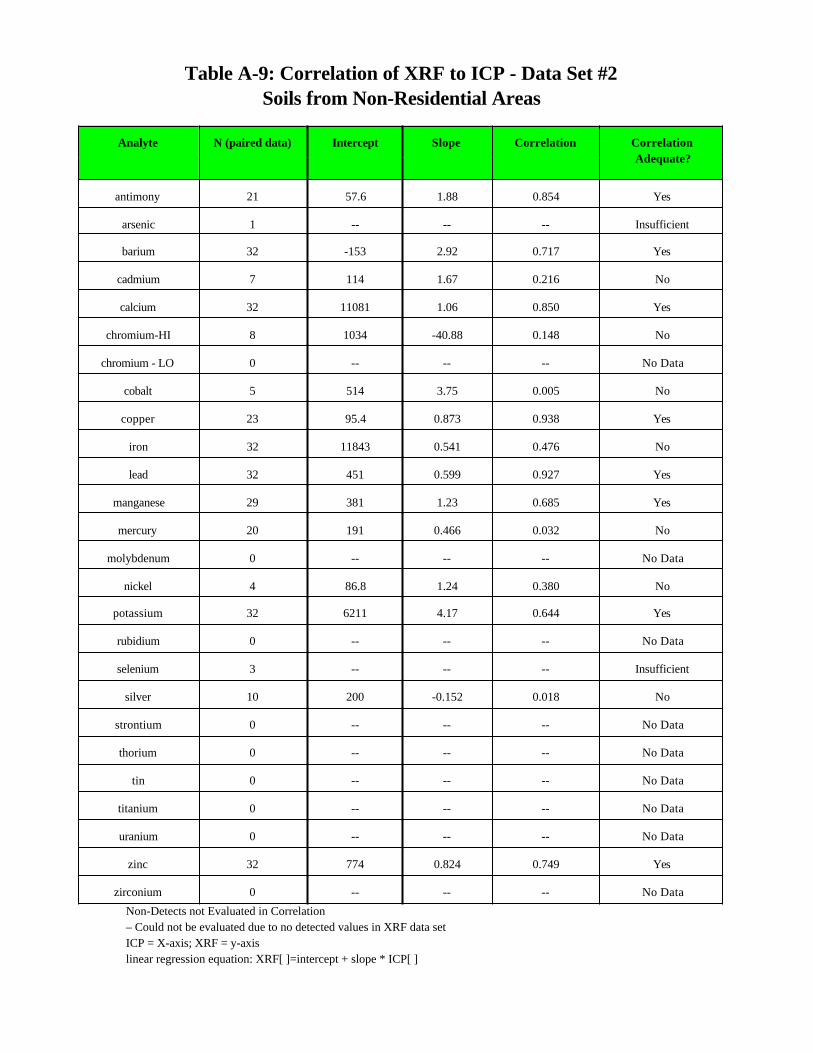
Table A-9: Correlation of XRF to ICP - Data Set #2Soils from Non-Residential Areas
Analyte N (paired data) Intercept Slope Correlation CorrelationAdequate?
antimony 21 57.6 1.88 0.854 Yes
arsenic 1 -- -- -- Insufficient
barium 32 -153 2.92 0.717 Yes
cadmium 7 114 1.67 0.216 No
calcium 32 11081 1.06 0.850 Yes
chromium-HI 8 1034 -40.88 0.148 No
chromium - LO 0 -- -- -- No Data
cobalt 5 514 3.75 0.005 No
copper 23 95.4 0.873 0.938 Yes
iron 32 11843 0.541 0.476 No
lead 32 451 0.599 0.927 Yes
manganese 29 381 1.23 0.685 Yes
mercury 20 191 0.466 0.032 No
molybdenum 0 -- -- -- No Data
nickel 4 86.8 1.24 0.380 No
potassium 32 6211 4.17 0.644 Yes
rubidium 0 -- -- -- No Data
selenium 3 -- -- -- Insufficient
silver 10 200 -0.152 0.018 No
strontium 0 -- -- -- No Data
thorium 0 -- -- -- No Data
tin 0 -- -- -- No Data
titanium 0 -- -- -- No Data
uranium 0 -- -- -- No Data
zinc 32 774 0.824 0.749 Yes
zirconium 0 -- -- -- No DataNon-Detects not Evaluated in Correlation– Could not be evaluated due to no detected values in XRF data setICP = X-axis; XRF = y-axislinear regression equation: XRF[ ]=intercept + slope * ICP[ ]

Table A-10: Data Quality Summary - Data Set #2
Soils from Non-Residential AreasAnalyte DL
Adequate?CorrelationAdequate?
Data SetReliable?
antimony No Yes No
arsenic No Insufficient No
barium Yes Yes Yes
cadmium No No No
calcium Yes Yes Yes
chromium-HI No No No
chromium - LO Yes No Data No
cobalt Marginal No No
copper Yes Yes Yes
iron Yes No No
lead Yes Yes Yes
manganese No Yes No
mercury No No No
molybdenum Yes No Data No
nickel Marginal No No
potassium Yes Yes Yes
rubidium Yes No Data No
selenium Yes Insufficient No
silver No No No
strontium Yes No Data No
thorium Unknown No Data No
tin Yes No Data No
titanium Yes No Data No
uranium Yes No Data No
zinc Yes Yes Yes
zirconium Yes No Data NoSoils from background areas were not evaluated for correlation to ICP data due to insufficient data. Therefore, the reliability of these data will be based on the evaluations of non-residential area soils.

APPENDIX BPHYSICAL-CHEMICAL DATA FOR EUREKA SOILS

SAMPLE ID EM-01
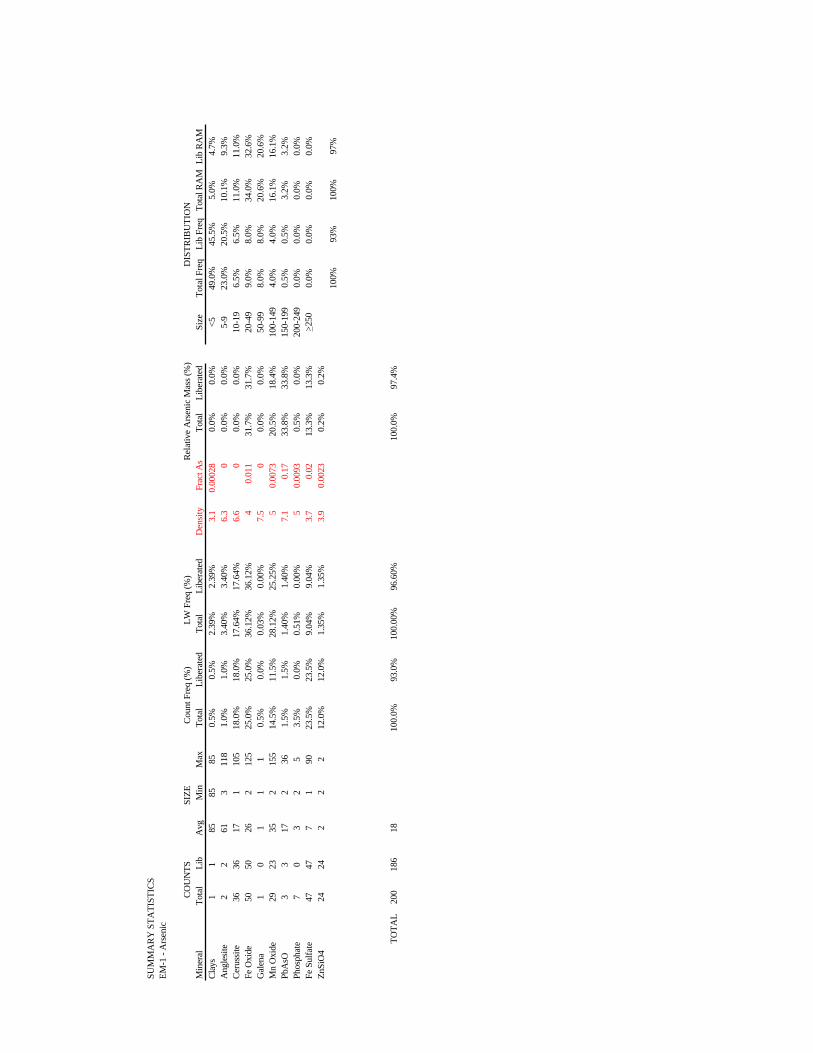
SUM
MA
RY
STA
TIST
ICS
EM-1
- A
rsen
ic
CO
UN
TSSI
ZEC
ount
Fre
q (%
)LW
Fre
q (%
)R
elat
ive
Ars
enic
Mas
s (%
)D
ISTR
IBU
TIO
NM
iner
alTo
tal
Lib
Avg
Min
Max
Tota
lLi
bera
ted
Tota
lLi
bera
ted
Den
sity
Frac
t As
Tota
lLi
bera
ted
Size
Tota
l Fre
qLi
b Fr
eqTo
tal R
AM
Lib
RAM
Clay
s1
185
8585
0.5%
0.5%
2.39
%2.
39%
3.1
0.00
028
0.0%
0.0%
<549
.0%
45.5
%5.
0%4.
7%A
ngle
site
22
613
118
1.0%
1.0%
3.40
%3.
40%
6.3
00.
0%0.
0%5-
923
.0%
20.5
%10
.1%
9.3%
Cer
ussit
e36
3617
110
518
.0%
18.0
%17
.64%
17.6
4%6.
60
0.0%
0.0%
10-1
96.
5%6.
5%11
.0%
11.0
%Fe
Oxi
de50
5026
212
525
.0%
25.0
%36
.12%
36.1
2%4
0.01
131
.7%
31.7
%20
-49
9.0%
8.0%
34.0
%32
.6%
Gal
ena
10
11
10.
5%0.
0%0.
03%
0.00
%7.
50
0.0%
0.0%
50-9
98.
0%8.
0%20
.6%
20.6
%M
n O
xide
2923
352
155
14.5
%11
.5%
28.1
2%25
.25%
50.
0073
20.5
%18
.4%
100-
149
4.0%
4.0%
16.1
%16
.1%
PbA
sO3
317
236
1.5%
1.5%
1.40
%1.
40%
7.1
0.17
33.8
%33
.8%
150-
199
0.5%
0.5%
3.2%
3.2%
Phos
phat
e7
03
25
3.5%
0.0%
0.51
%0.
00%
50.
0093
0.5%
0.0%
200-
249
0.0%
0.0%
0.0%
0.0%
Fe S
ulfa
te47
477
190
23.5
%23
.5%
9.04
%9.
04%
3.7
0.02
13.3
%13
.3%
> 250
0.0%
0.0%
0.0%
0.0%
ZnSi
O4
2424
22
212
.0%
12.0
%1.
35%
1.35
%3.
90.
0023
0.2%
0.2%
100%
93%
100%
97%
TOTA
L20
018
618
100.
0%93
.0%
100.
00%
96.6
0%10
0.0%
97.4
%
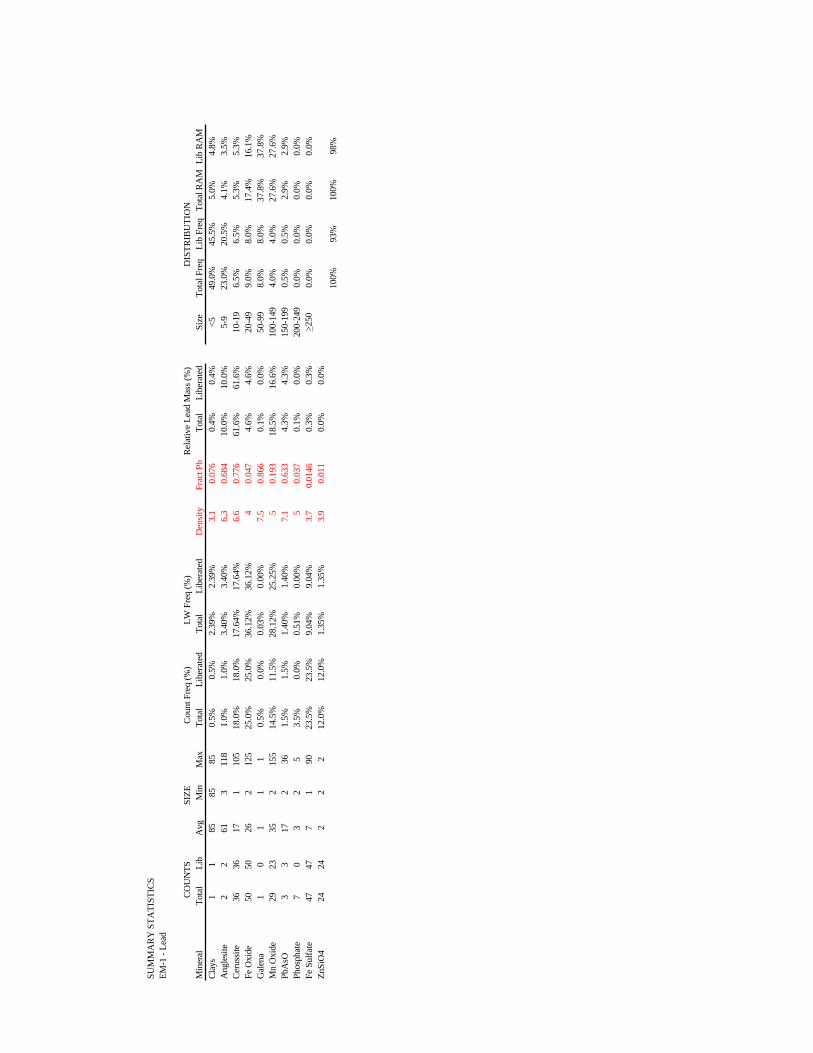
SUM
MA
RY
STA
TIST
ICS
EM-1
- Le
ad
CO
UN
TSSI
ZEC
ount
Fre
q (%
)LW
Fre
q (%
)R
elat
ive
Lead
Mas
s (%
)D
ISTR
IBU
TIO
NM
iner
alTo
tal
Lib
Avg
Min
Max
Tota
lLi
bera
ted
Tota
lLi
bera
ted
Den
sity
Frac
t Pb
Tota
lLi
bera
ted
Size
Tota
l Fre
qLi
b Fr
eqTo
tal R
AM
Lib
RAM
Clay
s1
185
8585
0.5%
0.5%
2.39
%2.
39%
3.1
0.07
60.
4%0.
4%<5
49.0
%45
.5%
5.0%
4.8%
Ang
lesit
e2
261
311
81.
0%1.
0%3.
40%
3.40
%6.
30.
684
10.0
%10
.0%
5-9
23.0
%20
.5%
4.1%
3.5%
Cer
ussit
e36
3617
110
518
.0%
18.0
%17
.64%
17.6
4%6.
60.
776
61.6
%61
.6%
10-1
96.
5%6.
5%5.
3%5.
3%Fe
Oxi
de50
5026
212
525
.0%
25.0
%36
.12%
36.1
2%4
0.04
74.
6%4.
6%20
-49
9.0%
8.0%
17.4
%16
.1%
Gal
ena
10
11
10.
5%0.
0%0.
03%
0.00
%7.
50.
866
0.1%
0.0%
50-9
98.
0%8.
0%37
.8%
37.8
%M
n O
xide
2923
352
155
14.5
%11
.5%
28.1
2%25
.25%
50.
193
18.5
%16
.6%
100-
149
4.0%
4.0%
27.6
%27
.6%
PbA
sO3
317
236
1.5%
1.5%
1.40
%1.
40%
7.1
0.63
34.
3%4.
3%15
0-19
90.
5%0.
5%2.
9%2.
9%Ph
osph
ate
70
32
53.
5%0.
0%0.
51%
0.00
%5
0.03
70.
1%0.
0%20
0-24
90.
0%0.
0%0.
0%0.
0%Fe
Sul
fate
4747
71
9023
.5%
23.5
%9.
04%
9.04
%3.
70.
0146
0.3%
0.3%
> 250
0.0%
0.0%
0.0%
0.0%
ZnSi
O4
2424
22
212
.0%
12.0
%1.
35%
1.35
%3.
90.
011
0.0%
0.0%
100%
93%
100%
98%
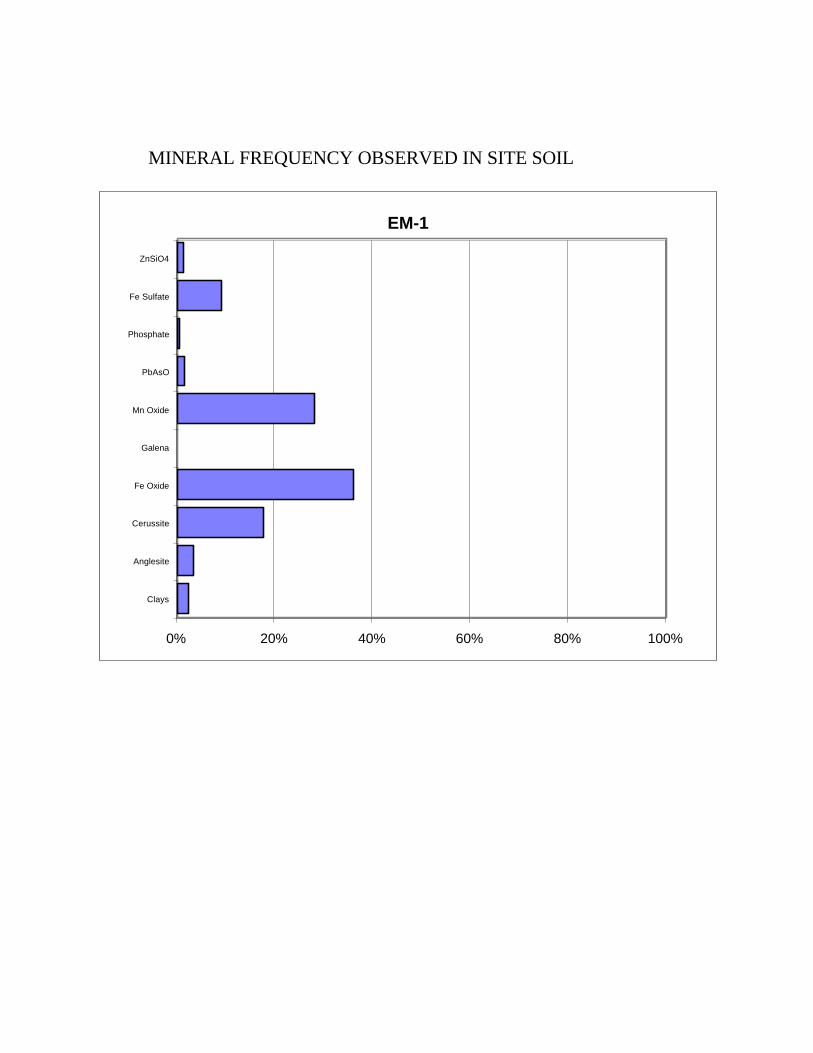
MINERAL FREQUENCY OBSERVED IN SITE SOIL
EM-1
0% 20% 40% 60% 80% 100%
Clays
Anglesite
Cerussite
Fe Oxide
Galena
Mn Oxide
PbAsO
Phosphate
Fe Sulfate
ZnSiO4
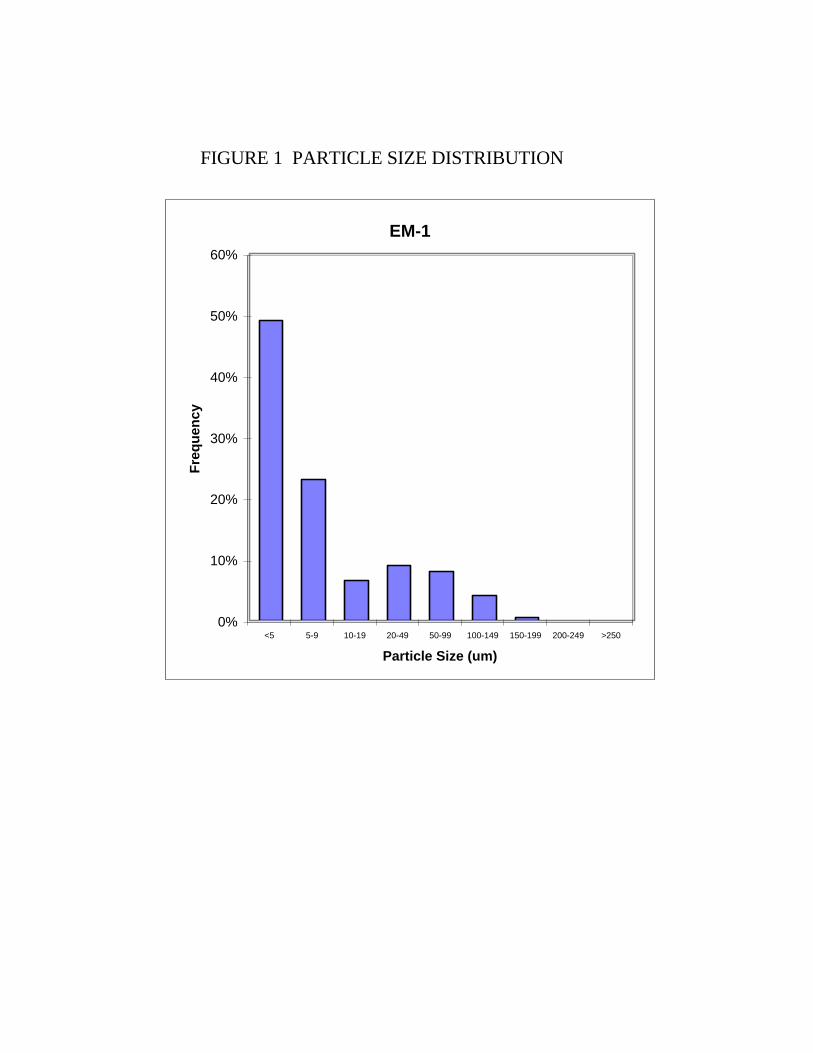
FIGURE 1 PARTICLE SIZE DISTRIBUTION
EM-1
0%
10%
20%
30%
40%
50%
60%
<5 5-9 10-19 20-49 50-99 100-149 150-199 200-249 >250
Particle Size (um)
Fre
qu
ency

RELATIVE ARSENIC MASS
EM-1
0% 20% 40% 60% 80% 100%
Clays
Anglesite
Cerussite
Fe Oxide
Galena
Mn Oxide
PbAsO
Phosphate
Fe Sulfate
ZnSiO4
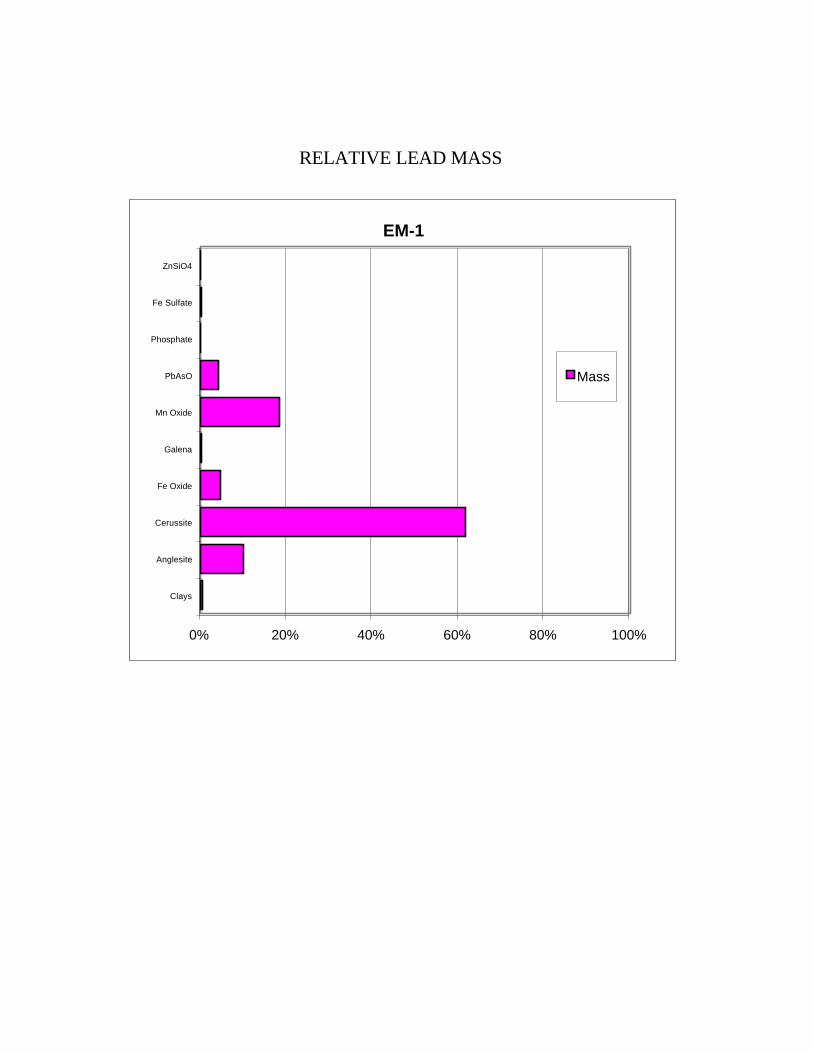
RELATIVE LEAD MASS
EM-1
0% 20% 40% 60% 80% 100%
Clays
Anglesite
Cerussite
Fe Oxide
Galena
Mn Oxide
PbAsO
Phosphate
Fe Sulfate
ZnSiO4
Mass
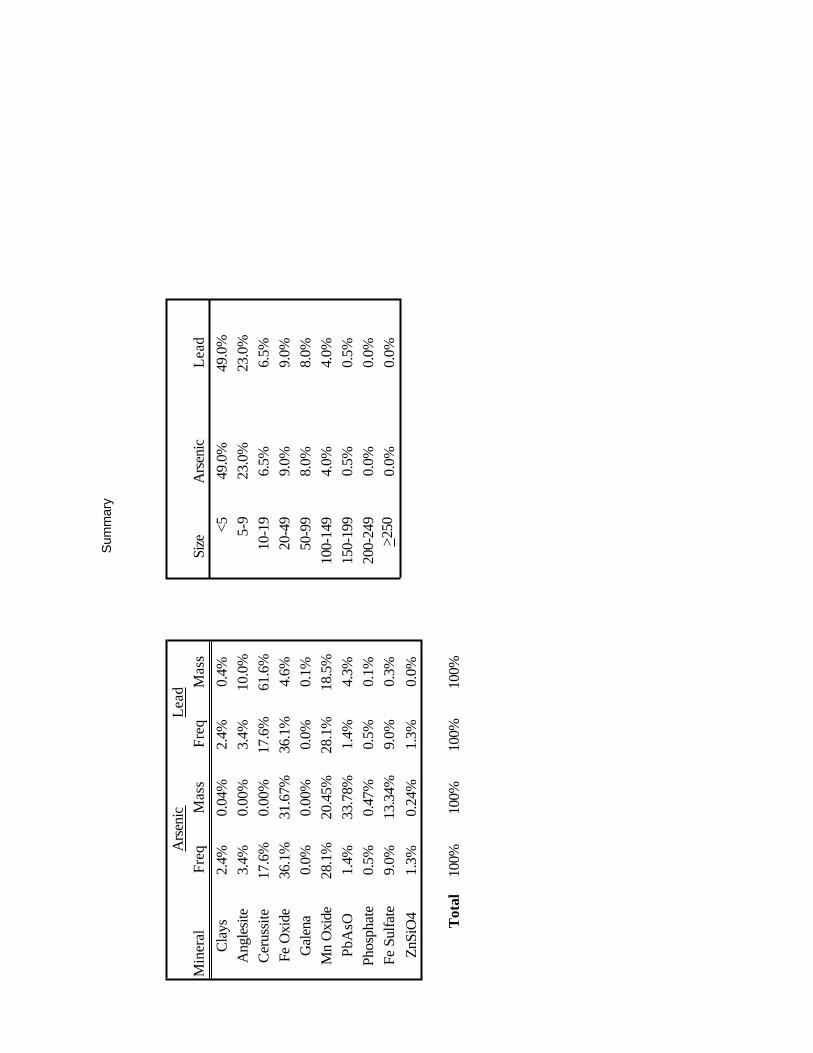
Sum
mar
y
Ars
enic
Lead
Min
eral
Freq
Mas
sFr
eqM
ass
Size
Ars
enic
Lead
Clay
s2.
4%0.
04%
2.4%
0.4%
<549
.0%
49.0
%A
ngle
site
3.4%
0.00
%3.
4%10
.0%
5-9
23.0
%23
.0%
Ceru
ssite
17.6
%0.
00%
17.6
%61
.6%
10-1
96.
5%6.
5%Fe
Oxi
de36
.1%
31.6
7%36
.1%
4.6%
20-4
99.
0%9.
0%G
alen
a0.
0%0.
00%
0.0%
0.1%
50-9
98.
0%8.
0%M
n O
xide
28.1
%20
.45%
28.1
%18
.5%
100-
149
4.0%
4.0%
PbA
sO1.
4%33
.78%
1.4%
4.3%
150-
199
0.5%
0.5%
Phos
phat
e0.
5%0.
47%
0.5%
0.1%
200-
249
0.0%
0.0%
Fe S
ulfa
te9.
0%13
.34%
9.0%
0.3%
>250
0.0%
0.0%
ZnSi
O4
1.3%
0.24
%1.
3%0.
0%
Tot
al10
0%10
0%10
0%10
0%

SAMPLE ID EM-02
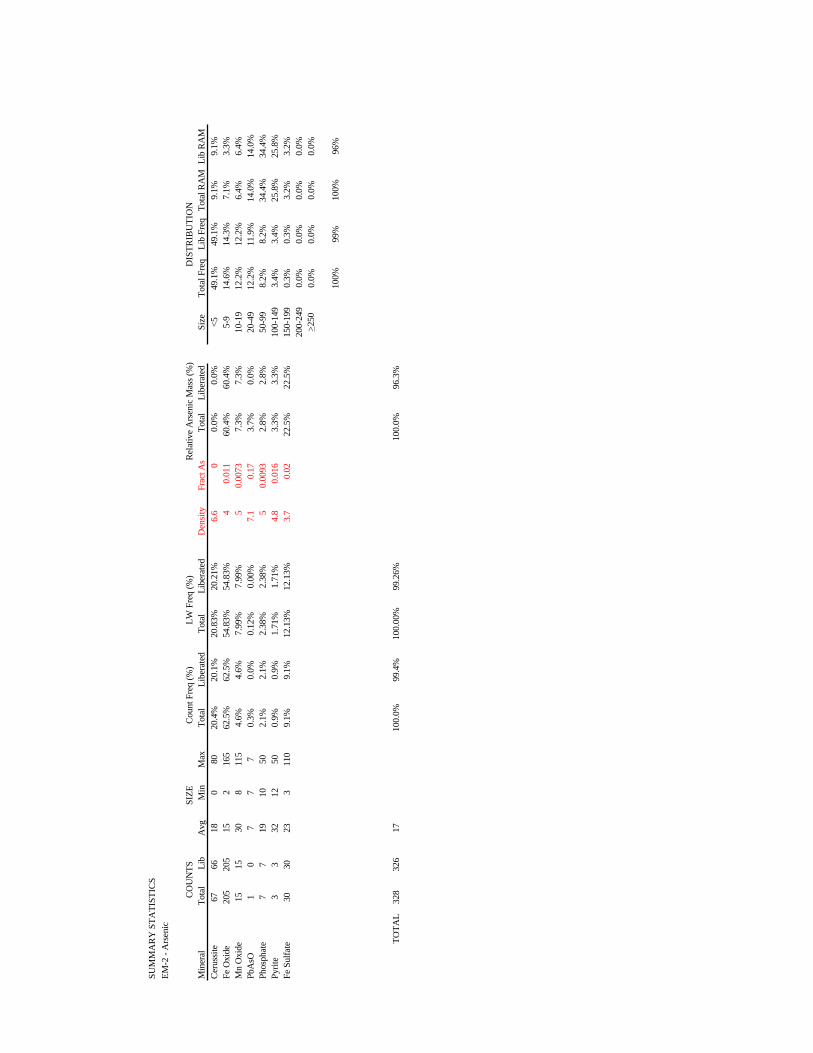
SUM
MA
RY
STA
TIST
ICS
EM-2
- A
rsen
ic
CO
UN
TSSI
ZEC
ount
Fre
q (%
)LW
Fre
q (%
)R
elat
ive
Ars
enic
Mas
s (%
)D
ISTR
IBU
TIO
NM
iner
alTo
tal
Lib
Avg
Min
Max
Tota
lLi
bera
ted
Tota
lLi
bera
ted
Den
sity
Frac
t As
Tota
lLi
bera
ted
Size
Tota
l Fre
qLi
b Fr
eqTo
tal R
AM
Lib
RAM
Cer
ussit
e67
6618
080
20.4
%20
.1%
20.8
3%20
.21%
6.6
00.
0%0.
0%<5
49.1
%49
.1%
9.1%
9.1%
Fe O
xide
205
205
152
165
62.5
%62
.5%
54.8
3%54
.83%
40.
011
60.4
%60
.4%
5-9
14.6
%14
.3%
7.1%
3.3%
Mn
Oxi
de15
1530
811
54.
6%4.
6%7.
99%
7.99
%5
0.00
737.
3%7.
3%10
-19
12.2
%12
.2%
6.4%
6.4%
PbA
sO1
07
77
0.3%
0.0%
0.12
%0.
00%
7.1
0.17
3.7%
0.0%
20-4
912
.2%
11.9
%14
.0%
14.0
%Ph
osph
ate
77
1910
502.
1%2.
1%2.
38%
2.38
%5
0.00
932.
8%2.
8%50
-99
8.2%
8.2%
34.4
%34
.4%
Pyrit
e3
332
1250
0.9%
0.9%
1.71
%1.
71%
4.8
0.01
63.
3%3.
3%10
0-14
93.
4%3.
4%25
.8%
25.8
%Fe
Sul
fate
3030
233
110
9.1%
9.1%
12.1
3%12
.13%
3.7
0.02
22.5
%22
.5%
150-
199
0.3%
0.3%
3.2%
3.2%
200-
249
0.0%
0.0%
0.0%
0.0%
> 250
0.0%
0.0%
0.0%
0.0%
100%
99%
100%
96%
TOTA
L32
832
617
100.
0%99
.4%
100.
00%
99.2
6%10
0.0%
96.3
%

SUM
MA
RY
STA
TIST
ICS
EM-2
- Le
ad
CO
UN
TSSI
ZEC
ount
Fre
q (%
)LW
Fre
q (%
)R
elat
ive
Lead
Mas
s (%
)D
ISTR
IBU
TIO
NM
iner
alTo
tal
Lib
Avg
Min
Max
Tota
lLi
bera
ted
Tota
lLi
bera
ted
Den
sity
Frac
t Pb
Tota
lLi
bera
ted
Size
Tota
l Fre
qLi
b Fr
eqTo
tal R
AM
Lib
RAM
Cer
ussit
e67
6618
080
20.4
%20
.1%
20.8
3%20
.21%
6.6
0.77
684
.4%
81.9
%<5
49.1
%49
.1%
2.1%
2.1%
Fe O
xide
205
205
152
165
62.5
%62
.5%
54.8
3%54
.83%
40.
047
8.2%
8.2%
5-9
14.6
%14
.3%
10.3
%9.
9%M
n O
xide
1515
308
115
4.6%
4.6%
7.99
%7.
99%
50.
193
6.1%
6.1%
10-1
912
.2%
12.2
%14
.9%
14.9
%Pb
AsO
10
77
70.
3%0.
0%0.
12%
0.00
%7.
10.
633
0.4%
0.0%
20-4
912
.2%
11.9
%45
.6%
43.1
%Ph
osph
ate
77
1910
502.
1%2.
1%2.
38%
2.38
%5
0.03
70.
3%0.
3%50
-99
8.2%
8.2%
22.6
%22
.6%
Pyrit
e3
332
1250
0.9%
0.9%
1.71
%1.
71%
4.8
0.00
007
0.0%
0.0%
100-
149
3.4%
3.4%
4.0%
4.0%
Fe S
ulfa
te30
3023
311
09.
1%9.
1%12
.13%
12.1
3%3.
70.
0146
0.5%
0.5%
150-
199
0.3%
0.3%
0.4%
0.4%
200-
249
0.0%
0.0%
0.0%
0.0%
> 250
0.0%
0.0%
0.0%
0.0%
100%
99%
100%
97%
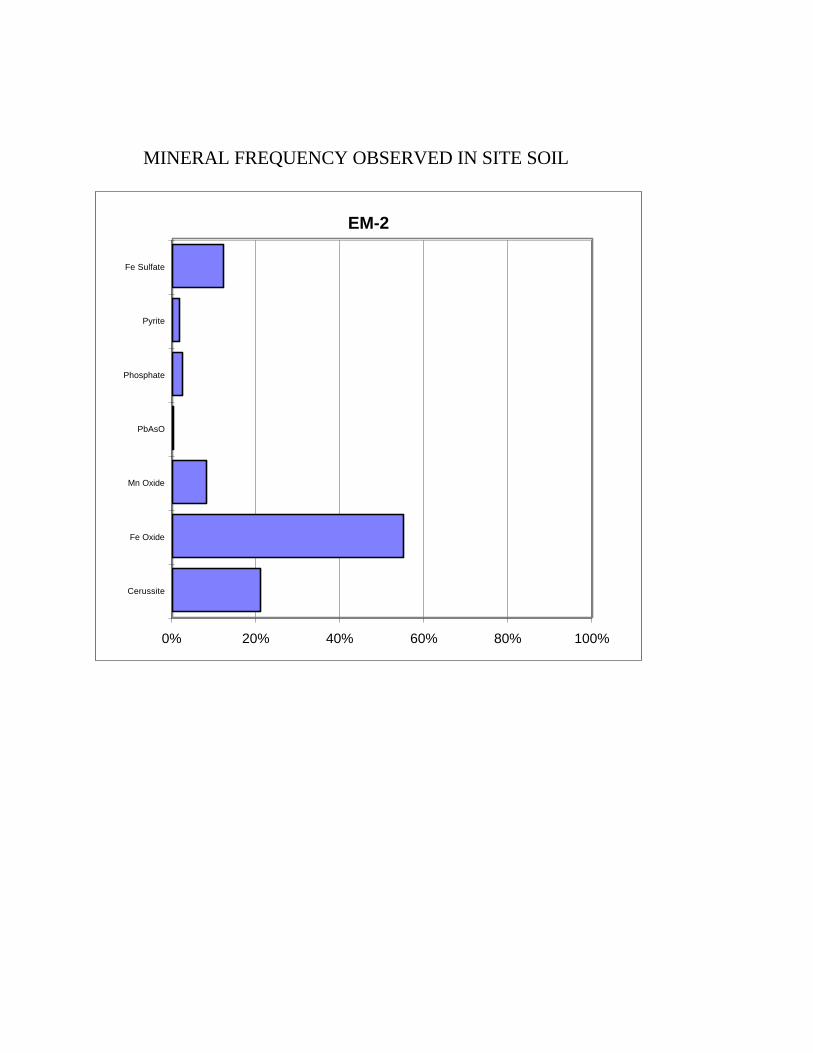
MINERAL FREQUENCY OBSERVED IN SITE SOIL
EM-2
0% 20% 40% 60% 80% 100%
Cerussite
Fe Oxide
Mn Oxide
PbAsO
Phosphate
Pyrite
Fe Sulfate

FIGURE 1 PARTICLE SIZE DISTRIBUTION
EM-2
0%
10%
20%
30%
40%
50%
60%
<5 5-9 10-19 20-49 50-99 100-149 150-199 200-249 >250
Particle Size (um)
Fre
qu
ency
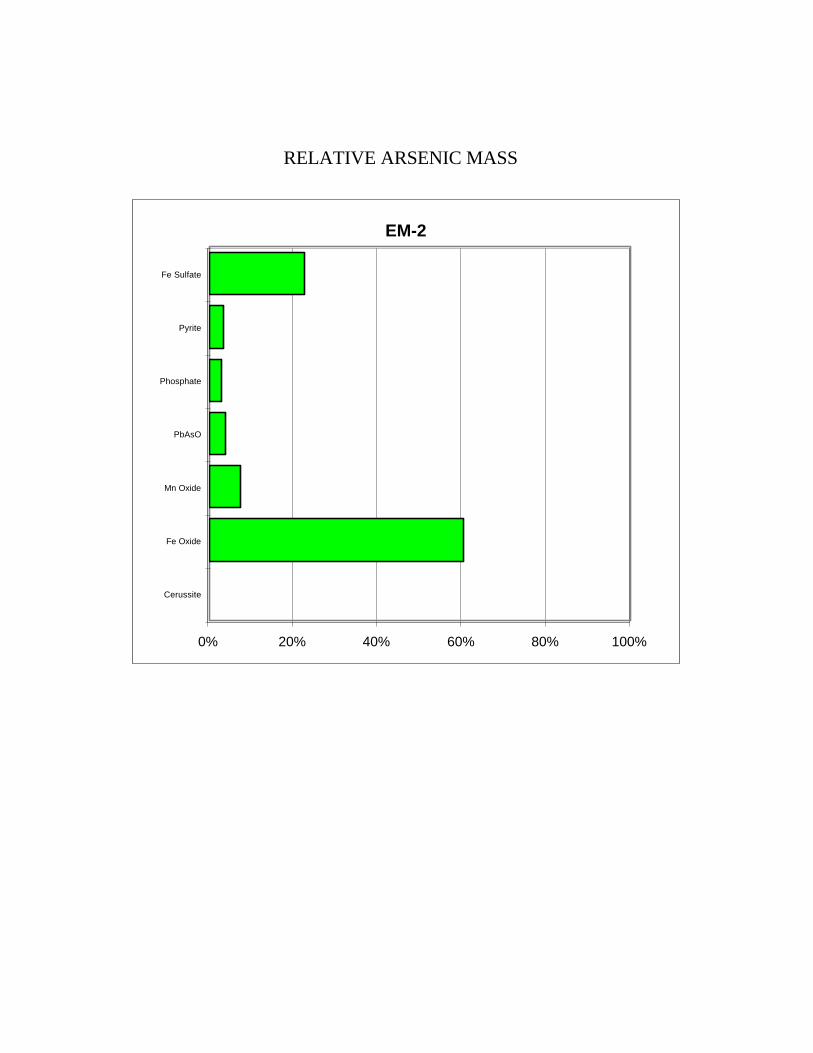
RELATIVE ARSENIC MASS
EM-2
0% 20% 40% 60% 80% 100%
Cerussite
Fe Oxide
Mn Oxide
PbAsO
Phosphate
Pyrite
Fe Sulfate

RELATIVE LEAD MASS
EM-2
0% 20% 40% 60% 80% 100%
Cerussite
Fe Oxide
Mn Oxide
PbAsO
Phosphate
Pyrite
Fe Sulfate
Mass

Sum
mar
y
EM
-2
Ars
enic
Lead
Min
eral
Freq
Mas
sFr
eqM
ass
Size
Ars
enic
Lead
Ceru
ssite
20.8
%0.
00%
20.8
%84
.4%
<549
.1%
49.1
%Fe
Oxi
de54
.8%
60.4
2%54
.8%
8.2%
5-9
14.6
%14
.6%
Mn
Oxi
de8.
0%7.
30%
8.0%
6.1%
10-1
912
.2%
12.2
%Pb
AsO
0.1%
3.73
%0.
1%0.
4%20
-49
12.2
%12
.2%
Phos
phat
e2.
4%2.
77%
2.4%
0.3%
50-9
98.
2%8.
2%Py
rite
1.7%
3.29
%1.
7%0.
0%10
0-14
93.
4%3.
4%Fe
Sul
fate
12.1
%22
.49%
12.1
%0.
5%15
0-19
90.
3%0.
3%20
0-24
90.
0%0.
0%T
otal
100%
100%
100%
100%
>250
0.0%
0.0%

SAMPLE ID EM-03
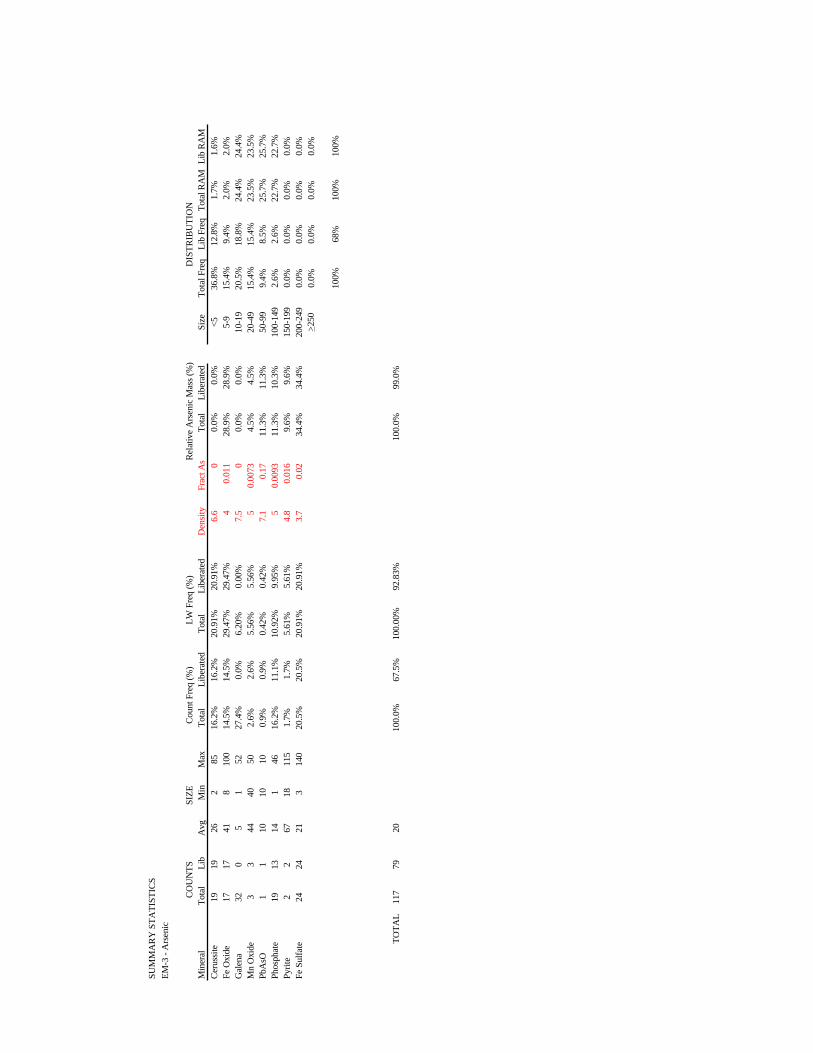
SUM
MA
RY
STA
TIST
ICS
EM-3
- A
rsen
ic
CO
UN
TSSI
ZEC
ount
Fre
q (%
)LW
Fre
q (%
)R
elat
ive
Ars
enic
Mas
s (%
)D
ISTR
IBU
TIO
NM
iner
alTo
tal
Lib
Avg
Min
Max
Tota
lLi
bera
ted
Tota
lLi
bera
ted
Den
sity
Frac
t As
Tota
lLi
bera
ted
Size
Tota
l Fre
qLi
b Fr
eqTo
tal R
AM
Lib
RAM
Cer
ussit
e19
1926
285
16.2
%16
.2%
20.9
1%20
.91%
6.6
00.
0%0.
0%<5
36.8
%12
.8%
1.7%
1.6%
Fe O
xide
1717
418
100
14.5
%14
.5%
29.4
7%29
.47%
40.
011
28.9
%28
.9%
5-9
15.4
%9.
4%2.
0%2.
0%G
alen
a32
05
152
27.4
%0.
0%6.
20%
0.00
%7.
50
0.0%
0.0%
10-1
920
.5%
18.8
%24
.4%
24.4
%M
n O
xide
33
4440
502.
6%2.
6%5.
56%
5.56
%5
0.00
734.
5%4.
5%20
-49
15.4
%15
.4%
23.5
%23
.5%
PbA
sO1
110
1010
0.9%
0.9%
0.42
%0.
42%
7.1
0.17
11.3
%11
.3%
50-9
99.
4%8.
5%25
.7%
25.7
%Ph
osph
ate
1913
141
4616
.2%
11.1
%10
.92%
9.95
%5
0.00
9311
.3%
10.3
%10
0-14
92.
6%2.
6%22
.7%
22.7
%Py
rite
22
6718
115
1.7%
1.7%
5.61
%5.
61%
4.8
0.01
69.
6%9.
6%15
0-19
90.
0%0.
0%0.
0%0.
0%Fe
Sul
fate
2424
213
140
20.5
%20
.5%
20.9
1%20
.91%
3.7
0.02
34.4
%34
.4%
200-
249
0.0%
0.0%
0.0%
0.0%
> 250
0.0%
0.0%
0.0%
0.0%
100%
68%
100%
100%
TOTA
L11
779
2010
0.0%
67.5
%10
0.00
%92
.83%
100.
0%99
.0%

SUM
MA
RY
STA
TIST
ICS
EM-3
- Le
ad
CO
UN
TSSI
ZEC
ount
Fre
q (%
)LW
Fre
q (%
)R
elat
ive
Lead
Mas
s (%
)D
ISTR
IBU
TIO
NM
iner
alTo
tal
Lib
Avg
Min
Max
Tota
lLi
bera
ted
Tota
lLi
bera
ted
Den
sity
Frac
t Pb
Tota
lLi
bera
ted
Size
Tota
l Fre
qLi
b Fr
eqTo
tal R
AM
Lib
RAM
Cer
ussit
e19
1926
285
16.2
%16
.2%
20.9
1%20
.91%
6.6
0.77
665
.6%
65.6
%<5
36.8
%12
.8%
7.6%
0.5%
Fe O
xide
1717
418
100
14.5
%14
.5%
29.4
7%29
.47%
40.
047
3.4%
3.4%
5-9
15.4
%9.
4%9.
2%3.
8%G
alen
a32
05
152
27.4
%0.
0%6.
20%
0.00
%7.
50.
866
24.6
%0.
0%10
-19
20.5
%18
.8%
18.7
%15
.2%
Mn
Oxi
de3
344
4050
2.6%
2.6%
5.56
%5.
56%
50.
193
3.3%
3.3%
20-4
915
.4%
15.4
%24
.0%
24.0
%Pb
AsO
11
1010
100.
9%0.
9%0.
42%
0.42
%7.
10.
633
1.2%
1.2%
50-9
99.
4%8.
5%40
.0%
31.7
%Ph
osph
ate
1913
141
4616
.2%
11.1
%10
.92%
9.95
%5
0.03
71.
2%1.
1%10
0-14
92.
6%2.
6%0.
6%0.
6%Py
rite
22
6718
115
1.7%
1.7%
5.61
%5.
61%
4.8
0.00
007
0.0%
0.0%
150-
199
0.0%
0.0%
0.0%
0.0%
Fe S
ulfa
te24
2421
314
020
.5%
20.5
%20
.91%
20.9
1%3.
70.
0146
0.7%
0.7%
200-
249
0.0%
0.0%
0.0%
0.0%
> 250
0.0%
0.0%
0.0%
0.0%
100%
68%
100%
76%
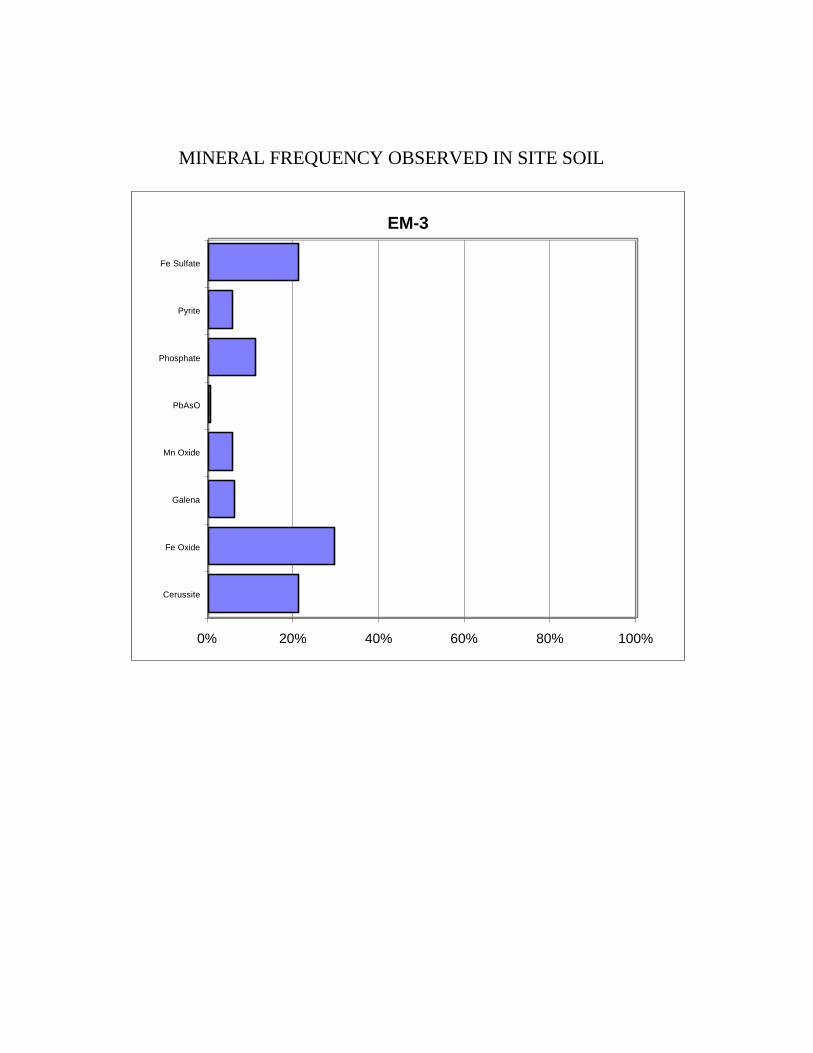
MINERAL FREQUENCY OBSERVED IN SITE SOIL
EM-3
0% 20% 40% 60% 80% 100%
Cerussite
Fe Oxide
Galena
Mn Oxide
PbAsO
Phosphate
Pyrite
Fe Sulfate
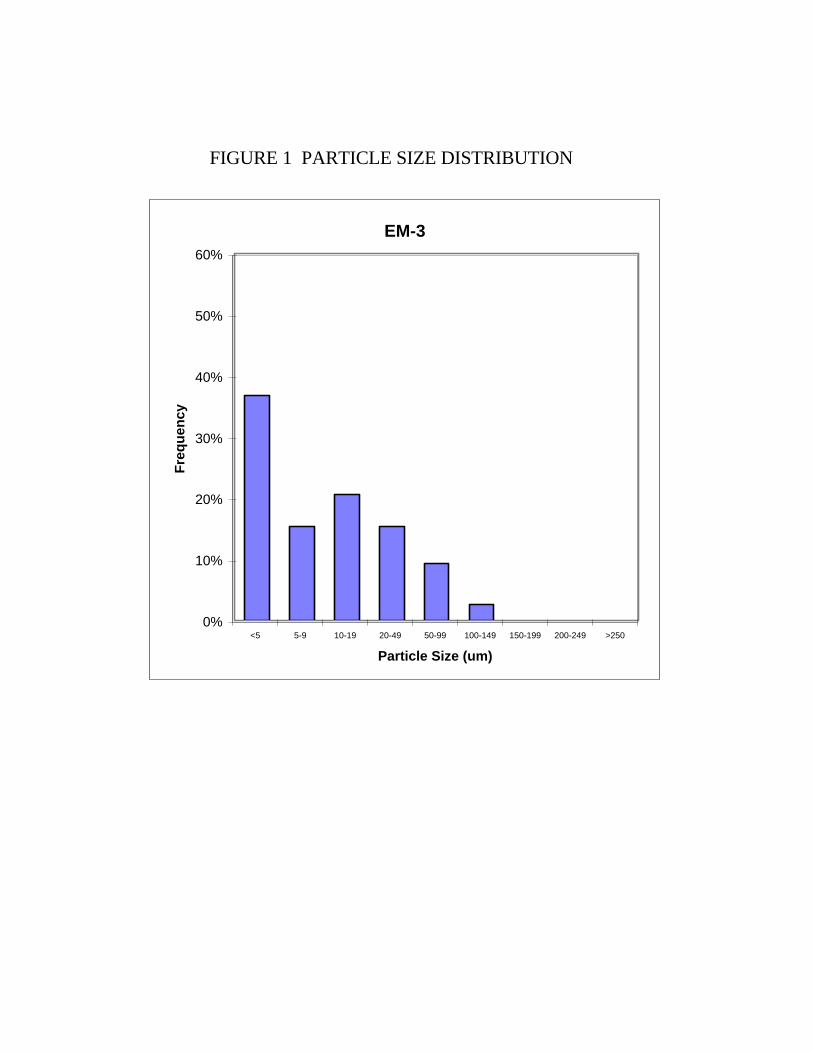
FIGURE 1 PARTICLE SIZE DISTRIBUTION
EM-3
0%
10%
20%
30%
40%
50%
60%
<5 5-9 10-19 20-49 50-99 100-149 150-199 200-249 >250
Particle Size (um)
Fre
qu
ency

RELATIVE ARSENIC MASS
EM-3
0% 20% 40% 60% 80% 100%
Cerussite
Fe Oxide
Galena
Mn Oxide
PbAsO
Phosphate
Pyrite
Fe Sulfate
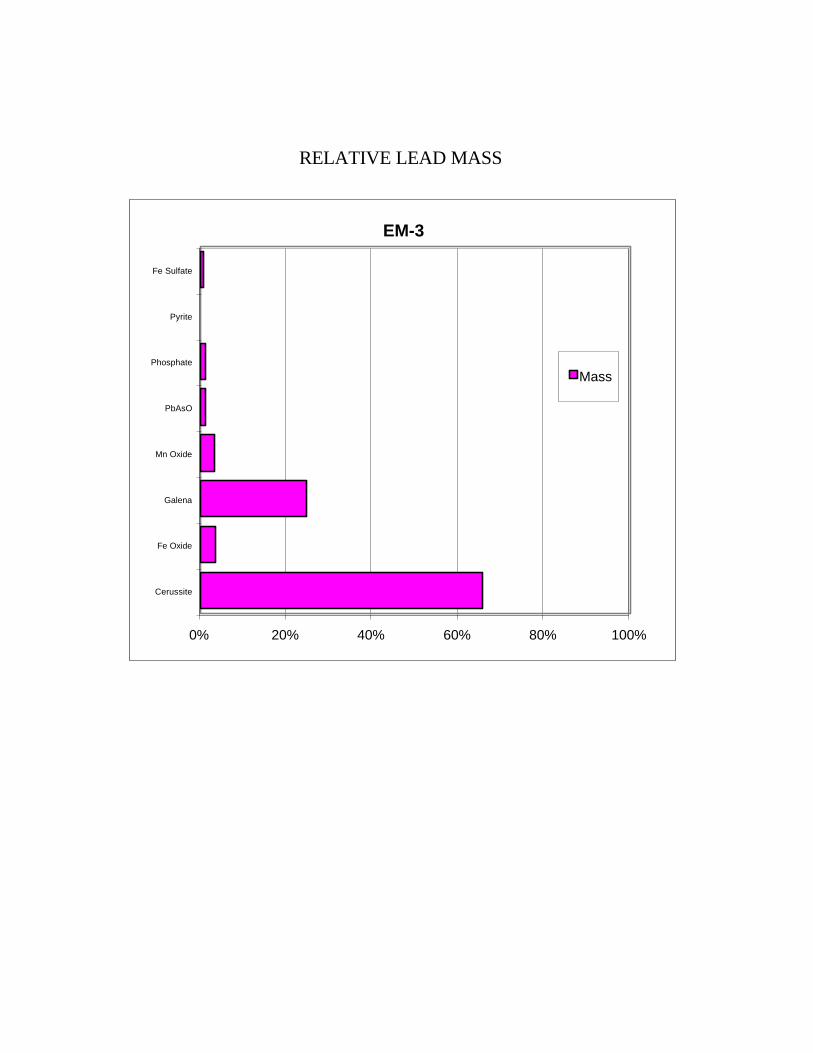
RELATIVE LEAD MASS
EM-3
0% 20% 40% 60% 80% 100%
Cerussite
Fe Oxide
Galena
Mn Oxide
PbAsO
Phosphate
Pyrite
Fe Sulfate
Mass
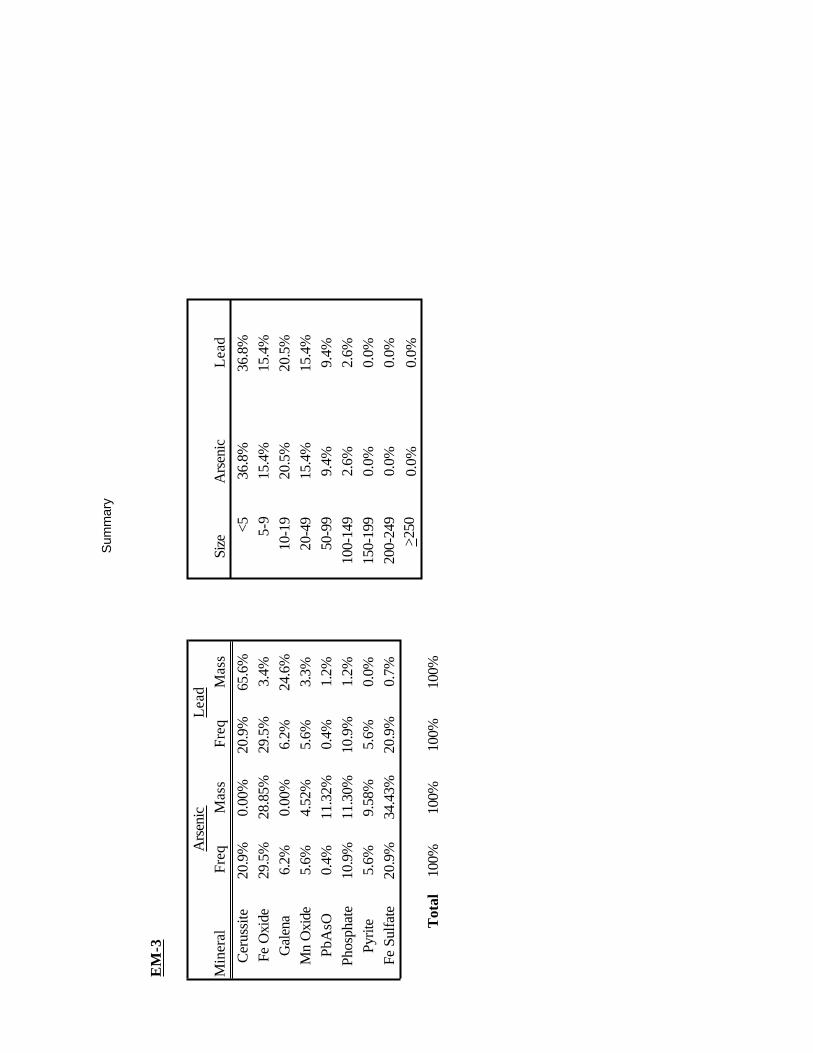
Sum
mar
y
EM
-3
Ars
enic
Lead
Min
eral
Freq
Mas
sFr
eqM
ass
Size
Ars
enic
Lead
Ceru
ssite
20.9
%0.
00%
20.9
%65
.6%
<536
.8%
36.8
%Fe
Oxi
de29
.5%
28.8
5%29
.5%
3.4%
5-9
15.4
%15
.4%
Gal
ena
6.2%
0.00
%6.
2%24
.6%
10-1
920
.5%
20.5
%M
n O
xide
5.6%
4.52
%5.
6%3.
3%20
-49
15.4
%15
.4%
PbA
sO0.
4%11
.32%
0.4%
1.2%
50-9
99.
4%9.
4%Ph
osph
ate
10.9
%11
.30%
10.9
%1.
2%10
0-14
92.
6%2.
6%Py
rite
5.6%
9.58
%5.
6%0.
0%15
0-19
90.
0%0.
0%Fe
Sul
fate
20.9
%34
.43%
20.9
%0.
7%20
0-24
90.
0%0.
0%> 2
500.
0%0.
0%T
otal
100%
100%
100%
100%

SAMPLE ID EM-04
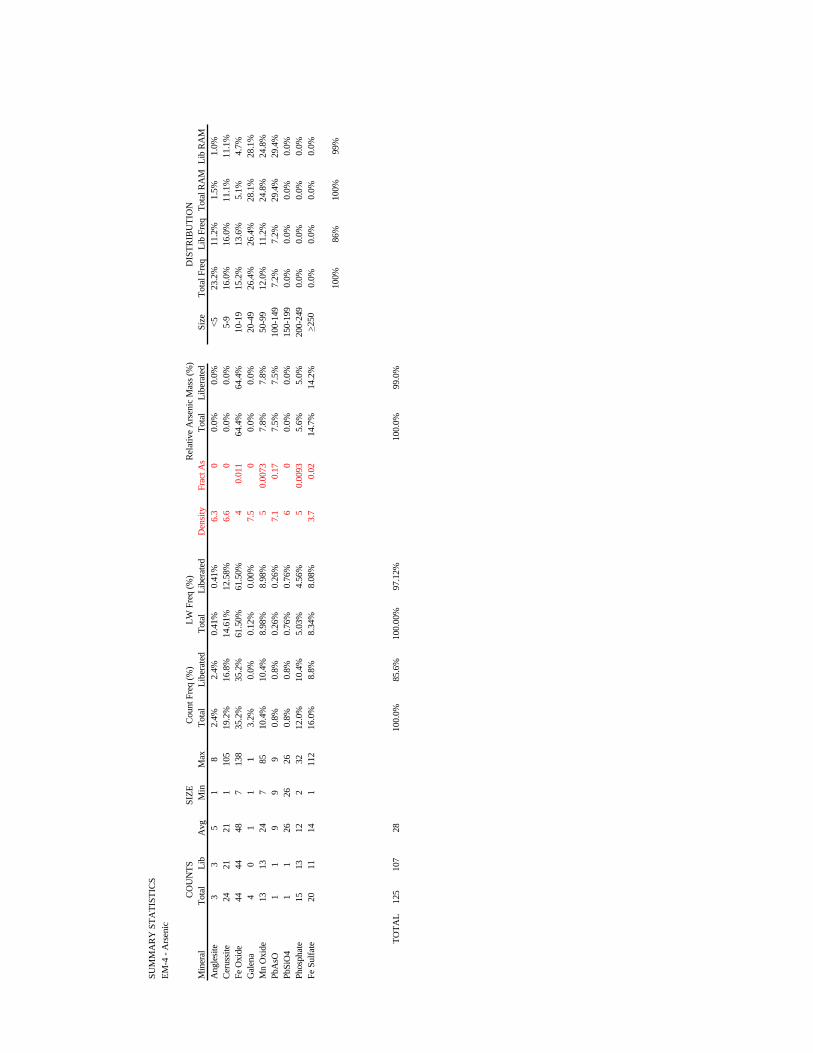
SUM
MA
RY
STA
TIST
ICS
EM-4
- A
rsen
ic
CO
UN
TSSI
ZEC
ount
Fre
q (%
)LW
Fre
q (%
)R
elat
ive
Ars
enic
Mas
s (%
)D
ISTR
IBU
TIO
NM
iner
alTo
tal
Lib
Avg
Min
Max
Tota
lLi
bera
ted
Tota
lLi
bera
ted
Den
sity
Frac
t As
Tota
lLi
bera
ted
Size
Tota
l Fre
qLi
b Fr
eqTo
tal R
AM
Lib
RAM
Ang
lesit
e3
35
18
2.4%
2.4%
0.41
%0.
41%
6.3
00.
0%0.
0%<5
23.2
%11
.2%
1.5%
1.0%
Cer
ussit
e24
2121
110
519
.2%
16.8
%14
.61%
12.5
8%6.
60
0.0%
0.0%
5-9
16.0
%16
.0%
11.1
%11
.1%
Fe O
xide
4444
487
138
35.2
%35
.2%
61.5
0%61
.50%
40.
011
64.4
%64
.4%
10-1
915
.2%
13.6
%5.
1%4.
7%G
alen
a4
01
11
3.2%
0.0%
0.12
%0.
00%
7.5
00.
0%0.
0%20
-49
26.4
%26
.4%
28.1
%28
.1%
Mn
Oxi
de13
1324
785
10.4
%10
.4%
8.98
%8.
98%
50.
0073
7.8%
7.8%
50-9
912
.0%
11.2
%24
.8%
24.8
%Pb
AsO
11
99
90.
8%0.
8%0.
26%
0.26
%7.
10.
177.
5%7.
5%10
0-14
97.
2%7.
2%29
.4%
29.4
%Pb
SiO
41
126
2626
0.8%
0.8%
0.76
%0.
76%
60
0.0%
0.0%
150-
199
0.0%
0.0%
0.0%
0.0%
Phos
phat
e15
1312
232
12.0
%10
.4%
5.03
%4.
56%
50.
0093
5.6%
5.0%
200-
249
0.0%
0.0%
0.0%
0.0%
Fe S
ulfa
te20
1114
111
216
.0%
8.8%
8.34
%8.
08%
3.7
0.02
14.7
%14
.2%
> 250
0.0%
0.0%
0.0%
0.0%
100%
86%
100%
99%
TOTA
L12
510
728
100.
0%85
.6%
100.
00%
97.1
2%10
0.0%
99.0
%
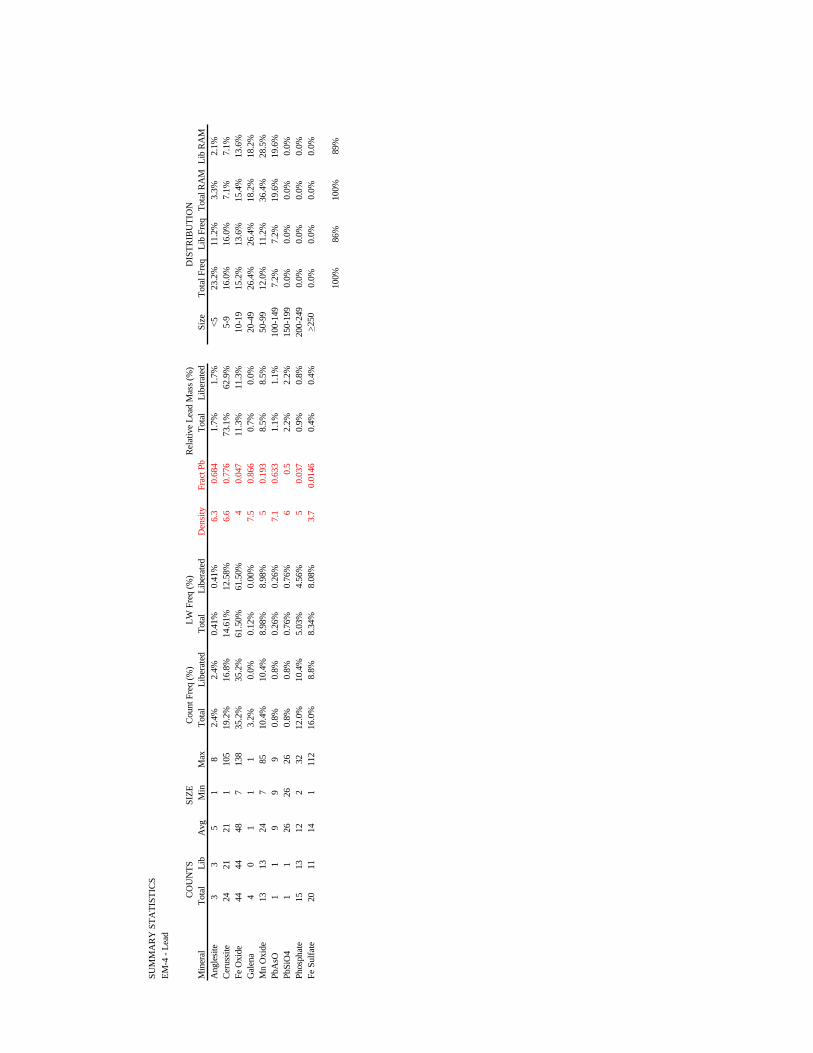
SUM
MA
RY
STA
TIST
ICS
EM-4
- Le
ad
CO
UN
TSSI
ZEC
ount
Fre
q (%
)LW
Fre
q (%
)R
elat
ive
Lead
Mas
s (%
)D
ISTR
IBU
TIO
NM
iner
alTo
tal
Lib
Avg
Min
Max
Tota
lLi
bera
ted
Tota
lLi
bera
ted
Den
sity
Frac
t Pb
Tota
lLi
bera
ted
Size
Tota
l Fre
qLi
b Fr
eqTo
tal R
AM
Lib
RAM
Ang
lesit
e3
35
18
2.4%
2.4%
0.41
%0.
41%
6.3
0.68
41.
7%1.
7%<5
23.2
%11
.2%
3.3%
2.1%
Cer
ussit
e24
2121
110
519
.2%
16.8
%14
.61%
12.5
8%6.
60.
776
73.1
%62
.9%
5-9
16.0
%16
.0%
7.1%
7.1%
Fe O
xide
4444
487
138
35.2
%35
.2%
61.5
0%61
.50%
40.
047
11.3
%11
.3%
10-1
915
.2%
13.6
%15
.4%
13.6
%G
alen
a4
01
11
3.2%
0.0%
0.12
%0.
00%
7.5
0.86
60.
7%0.
0%20
-49
26.4
%26
.4%
18.2
%18
.2%
Mn
Oxi
de13
1324
785
10.4
%10
.4%
8.98
%8.
98%
50.
193
8.5%
8.5%
50-9
912
.0%
11.2
%36
.4%
28.5
%Pb
AsO
11
99
90.
8%0.
8%0.
26%
0.26
%7.
10.
633
1.1%
1.1%
100-
149
7.2%
7.2%
19.6
%19
.6%
PbSi
O4
11
2626
260.
8%0.
8%0.
76%
0.76
%6
0.5
2.2%
2.2%
150-
199
0.0%
0.0%
0.0%
0.0%
Phos
phat
e15
1312
232
12.0
%10
.4%
5.03
%4.
56%
50.
037
0.9%
0.8%
200-
249
0.0%
0.0%
0.0%
0.0%
Fe S
ulfa
te20
1114
111
216
.0%
8.8%
8.34
%8.
08%
3.7
0.01
460.
4%0.
4%> 2
500.
0%0.
0%0.
0%0.
0%
100%
86%
100%
89%

MINERAL FREQUENCY OBSERVED IN SITE SOIL
EM-4
0% 20% 40% 60% 80% 100%
Anglesite
Cerussite
Fe Oxide
Galena
Mn Oxide
PbAsO
PbSiO4
Phosphate
Fe Sulfate
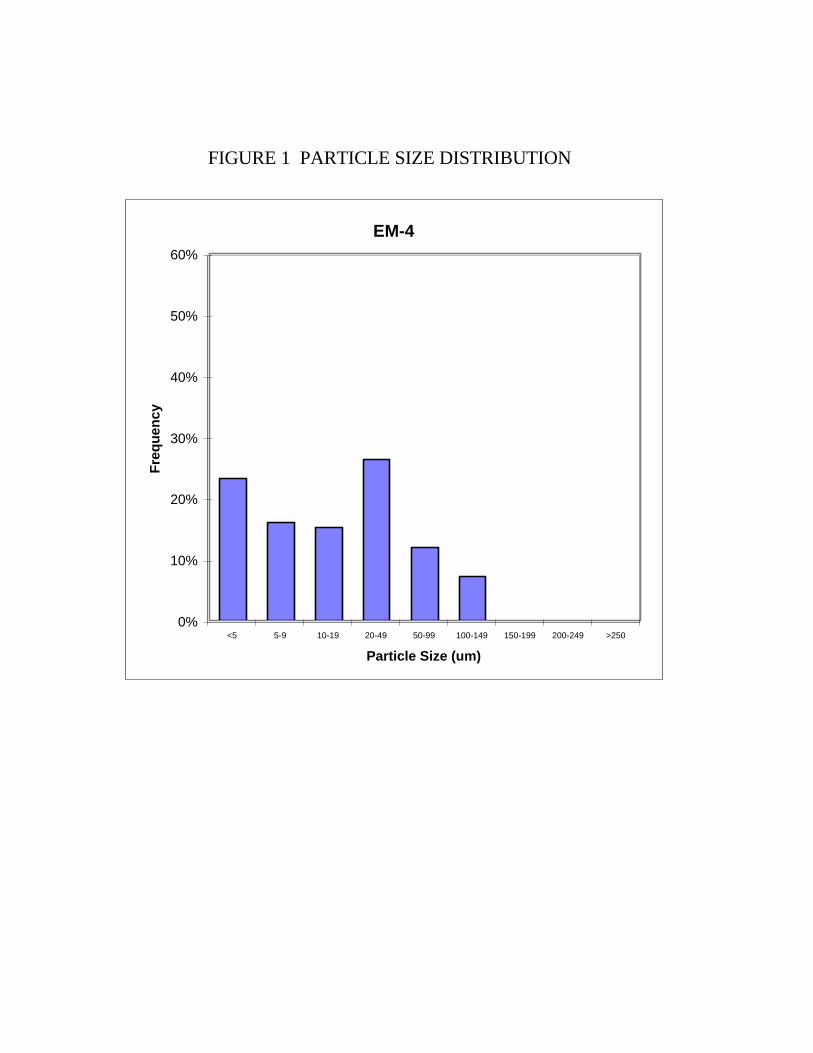
FIGURE 1 PARTICLE SIZE DISTRIBUTION
EM-4
0%
10%
20%
30%
40%
50%
60%
<5 5-9 10-19 20-49 50-99 100-149 150-199 200-249 >250
Particle Size (um)
Fre
qu
ency
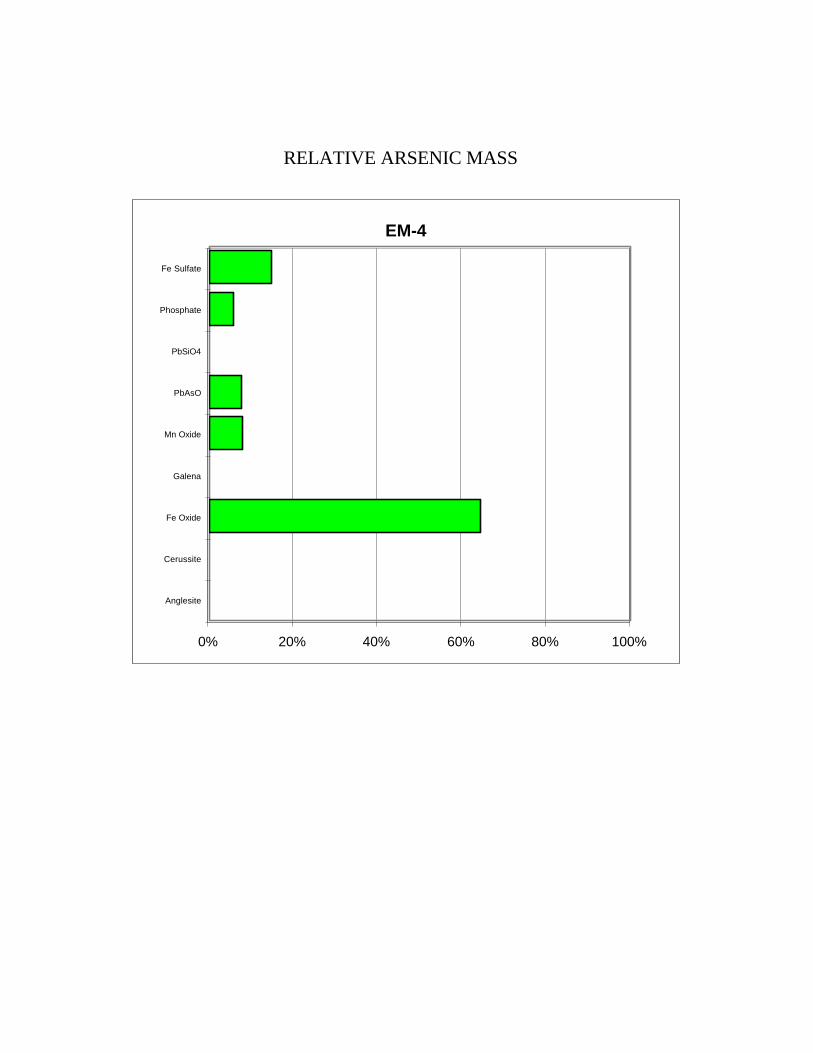
RELATIVE ARSENIC MASS
EM-4
0% 20% 40% 60% 80% 100%
Anglesite
Cerussite
Fe Oxide
Galena
Mn Oxide
PbAsO
PbSiO4
Phosphate
Fe Sulfate

RELATIVE LEAD MASS
EM-4
0% 20% 40% 60% 80% 100%
Anglesite
Cerussite
Fe Oxide
Galena
Mn Oxide
PbAsO
PbSiO4
Phosphate
Fe Sulfate
Mass

Sum
mar
y
EM
-4
Ars
enic
Lead
Min
eral
Freq
Mas
sFr
eqM
ass
Size
Ars
enic
Lead
Ang
lesit
e0.
4%0.
00%
0.4%
1.7%
<523
.2%
23.2
%Ce
russ
ite14
.6%
0.00
%14
.6%
73.1
%5-
916
.0%
16.0
%Fe
Oxi
de61
.5%
64.4
3%61
.5%
11.3
%10
-19
15.2
%15
.2%
Gal
ena
0.1%
0.00
%0.
1%0.
7%20
-49
26.4
%26
.4%
Mn
Oxi
de9.
0%7.
80%
9.0%
8.5%
50-9
912
.0%
12.0
%Pb
AsO
0.3%
7.51
%0.
3%1.
1%10
0-14
97.
2%7.
2%Pb
SiO
40.
8%0.
00%
0.8%
2.2%
150-
199
0.0%
0.0%
Phos
phat
e5.
0%5.
56%
5.0%
0.9%
200-
249
0.0%
0.0%
Fe S
ulfa
te8.
3%14
.69%
8.3%
0.4%
>250
0.0%
0.0%
Tot
al10
0%10
0%10
0%10
0%

SAMPLE ID EM-05

SUM
MA
RY
STA
TIST
ICS
EM-5
- A
rsen
ic
CO
UN
TSSI
ZEC
ount
Fre
q (%
)LW
Fre
q (%
)R
elat
ive
Ars
enic
Mas
s (%
)D
ISTR
IBU
TIO
NM
iner
alTo
tal
Lib
Avg
Min
Max
Tota
lLi
bera
ted
Tota
lLi
bera
ted
Den
sity
Frac
t As
Tota
lLi
bera
ted
Size
Tota
l Fre
qLi
b Fr
eqTo
tal R
AM
Lib
RAM
Ang
lesit
e3
335
1170
2.4%
2.4%
4.02
%4.
02%
6.3
00.
0%0.
0%<5
39.8
%25
.2%
#DIV
/0!
#DIV
/0!
Cer
ussit
e25
2212
175
20.3
%17
.9%
11.3
2%8.
34%
6.6
00.
0%0.
0%5-
912
.2%
11.4
%#D
IV/0
!#D
IV/0
!Fe
Oxi
de25
2541
311
020
.3%
20.3
%38
.83%
38.8
3%4
0.01
132
.3%
32.3
%10
-19
11.4
%11
.4%
#DIV
/0!
#DIV
/0!
Gal
ena
141
11
211
.4%
0.8%
0.73
%0.
08%
7.5
00.
0%0.
0%20
-49
20.3
%15
.4%
#DIV
/0!
#DIV
/0!
Mn
Oxi
de2
213
916
1.6%
1.6%
0.96
%0.
96%
50.
0073
0.7%
0.7%
50-9
913
.8%
13.0
%#D
IV/0
!#D
IV/0
!Pb
AsO
55
133
294.
1%4.
1%2.
45%
2.45
%7.
10.
1755
.9%
55.9
%10
0-14
92.
4%2.
4%#D
IV/0
!#D
IV/0
!Ph
osph
ate
3424
223
105
27.6
%19
.5%
29.0
4%23
.79%
60
0.0%
0.0%
150-
199
0.0%
0.0%
0.0%
0.0%
Fe S
ulfa
te15
1522
275
12.2
%12
.2%
12.6
6%12
.66%
50.
0093
11.1
%11
.1%
200-
249
0.0%
0.0%
0.0%
0.0%
> 250
0.0%
0.0%
0.0%
0.0%
100%
79%
#DIV
/0!
#DIV
/0!
TOTA
L12
397
2110
0.0%
78.9
%10
0.00
%91
.12%
100.
0%10
0.0%

SUM
MA
RY
STA
TIST
ICS
EM-5
- Le
ad
CO
UN
TSSI
ZEC
ount
Fre
q (%
)LW
Fre
q (%
)R
elat
ive
Lead
Mas
s (%
)D
ISTR
IBU
TIO
NM
iner
alTo
tal
Lib
Avg
Min
Max
Tota
lLi
bera
ted
Tota
lLi
bera
ted
Den
sity
Frac
t Pb
Tota
lLi
bera
ted
Size
Tota
l Fre
qLi
b Fr
eqTo
tal R
AM
Lib
RAM
Ang
lesit
e3
335
1170
2.4%
2.4%
4.02
%4.
02%
6.3
0.68
49.
2%9.
2%<5
39.8
%25
.2%
4.5%
3.3%
Cer
ussit
e25
2212
175
20.3
%17
.9%
11.3
2%8.
34%
6.6
0.77
630
.7%
22.6
%5-
912
.2%
11.4
%4.
1%3.
8%Fe
Oxi
de25
2541
311
020
.3%
20.3
%38
.83%
38.8
3%4
0.04
73.
9%3.
9%10
-19
11.4
%11
.4%
6.3%
6.3%
Gal
ena
141
11
211
.4%
0.8%
0.73
%0.
08%
7.5
0.86
62.
5%0.
3%20
-49
20.3
%15
.4%
26.6
%21
.8%
Mn
Oxi
de2
213
916
1.6%
1.6%
0.96
%0.
96%
50.
193
0.5%
0.5%
50-9
913
.8%
13.0
%46
.3%
43.6
%Pb
AsO
55
133
294.
1%4.
1%2.
45%
2.45
%7.
10.
633
5.8%
5.8%
100-
149
2.4%
2.4%
12.2
%12
.2%
Phos
phat
e34
2422
310
527
.6%
19.5
%29
.04%
23.7
9%6
0.5
46.2
%37
.8%
150-
199
0.0%
0.0%
0.0%
0.0%
Fe S
ulfa
te15
1522
275
12.2
%12
.2%
12.6
6%12
.66%
50.
037
1.2%
1.2%
200-
249
0.0%
0.0%
0.0%
0.0%
> 250
0.0%
0.0%
0.0%
0.0%
100%
79%
100%
91%
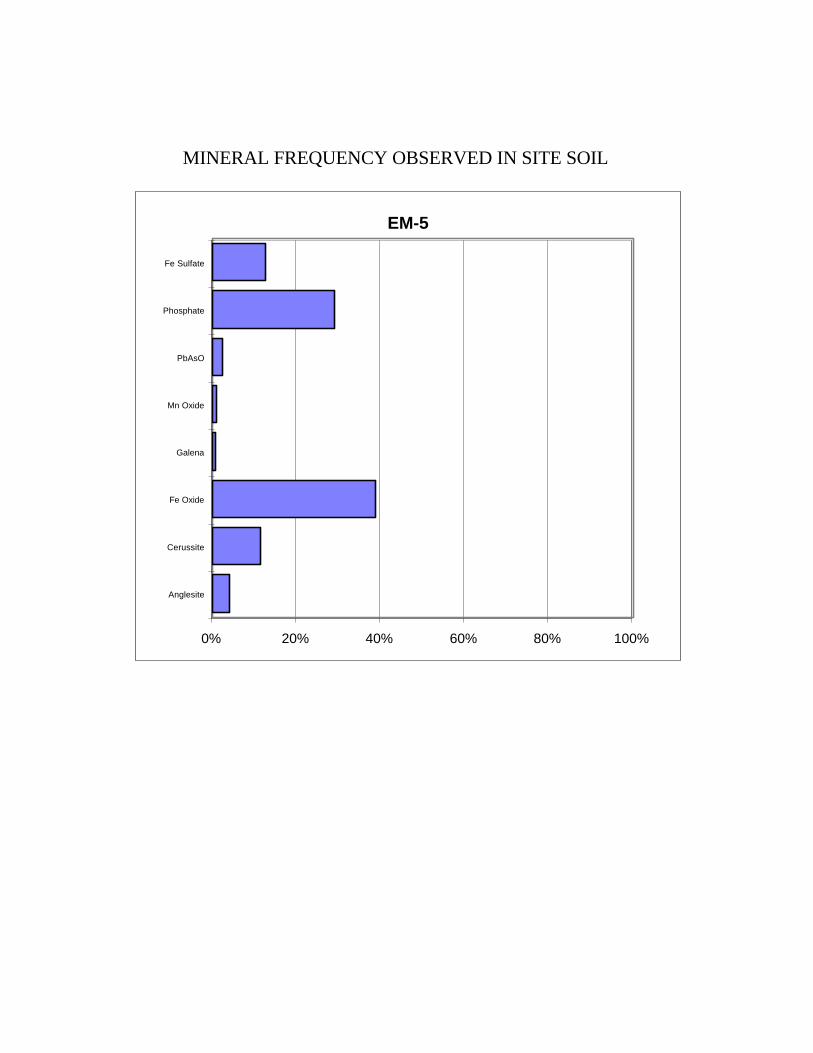
MINERAL FREQUENCY OBSERVED IN SITE SOIL
EM-5
0% 20% 40% 60% 80% 100%
Anglesite
Cerussite
Fe Oxide
Galena
Mn Oxide
PbAsO
Phosphate
Fe Sulfate
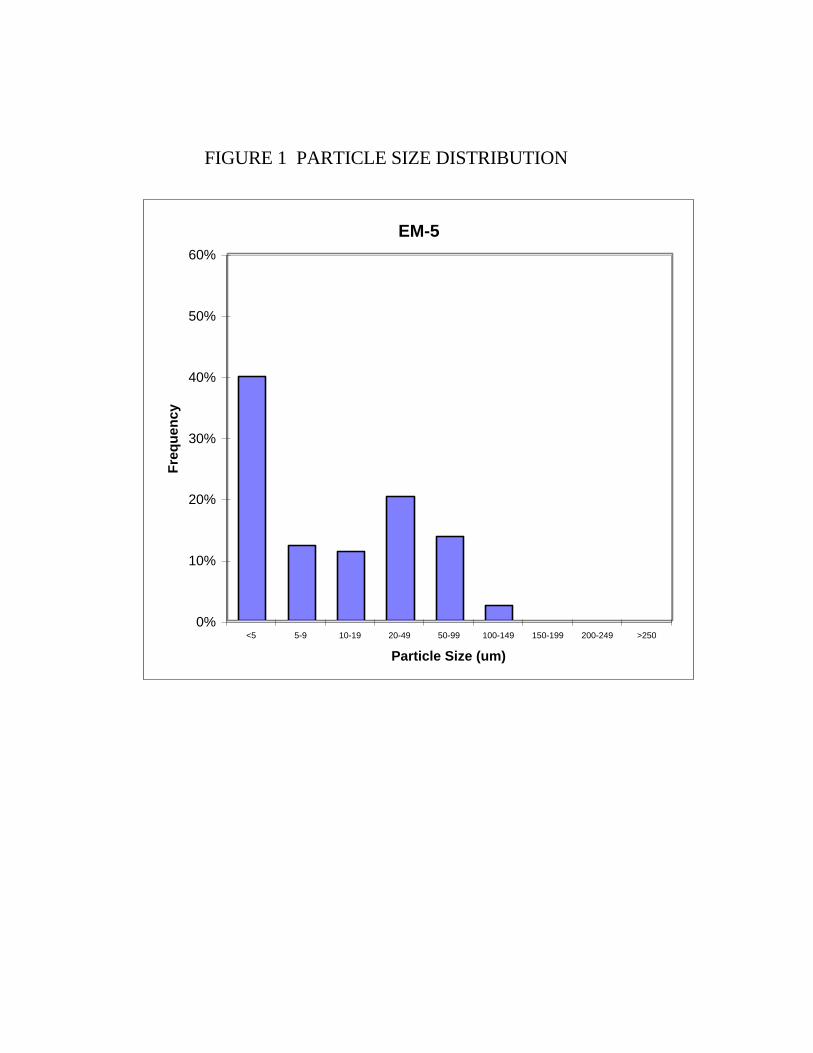
FIGURE 1 PARTICLE SIZE DISTRIBUTION
EM-5
0%
10%
20%
30%
40%
50%
60%
<5 5-9 10-19 20-49 50-99 100-149 150-199 200-249 >250
Particle Size (um)
Fre
qu
ency
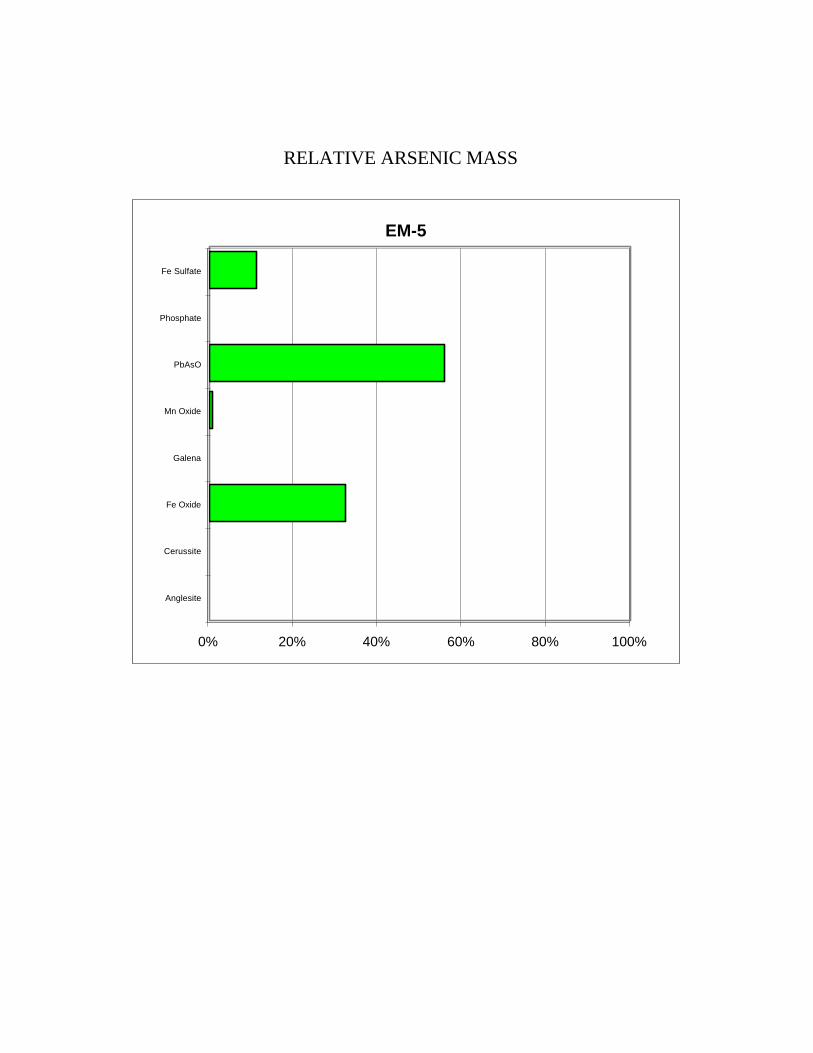
RELATIVE ARSENIC MASS
EM-5
0% 20% 40% 60% 80% 100%
Anglesite
Cerussite
Fe Oxide
Galena
Mn Oxide
PbAsO
Phosphate
Fe Sulfate
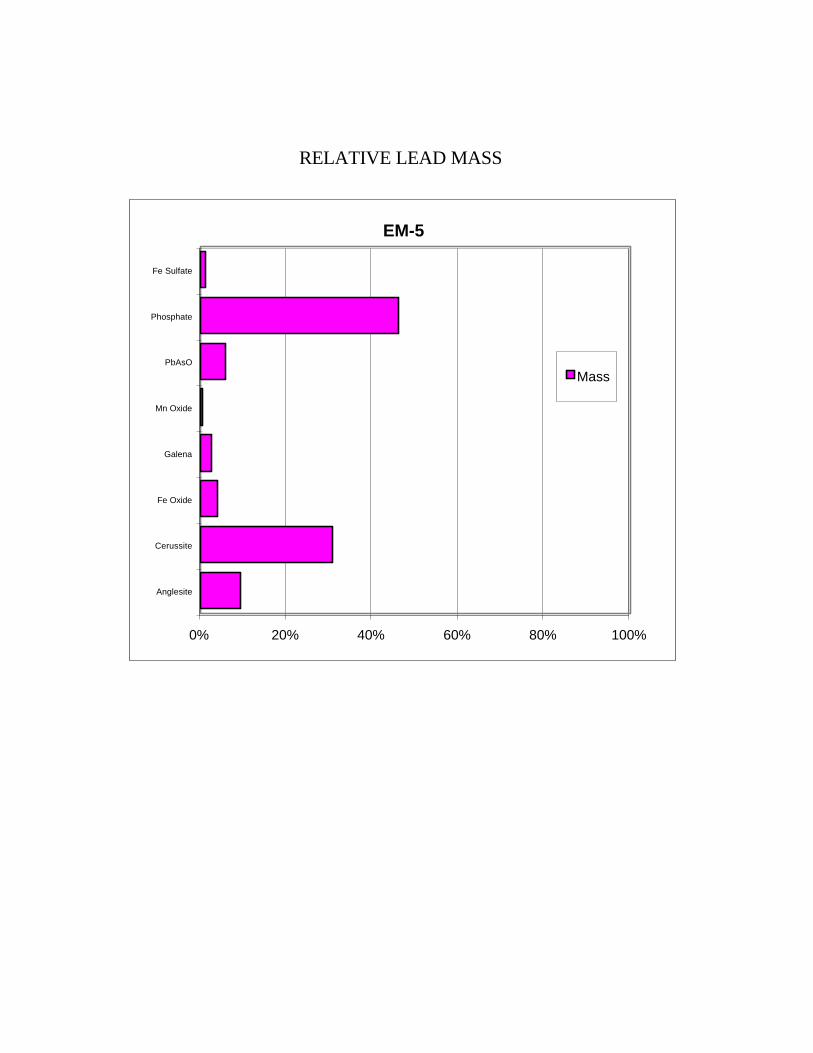
RELATIVE LEAD MASS
EM-5
0% 20% 40% 60% 80% 100%
Anglesite
Cerussite
Fe Oxide
Galena
Mn Oxide
PbAsO
Phosphate
Fe Sulfate
Mass

Sum
mar
y
EM
-5
Ars
enic
Lead
Min
eral
Freq
Mas
sFr
eqM
ass
Size
Ars
enic
Lead
Ang
lesit
e4.
0%0.
00%
4.0%
9.2%
<539
.8%
39.8
%Ce
russ
ite11
.3%
0.00
%11
.3%
30.7
%5-
912
.2%
12.2
%Fe
Oxi
de38
.8%
32.3
1%38
.8%
3.9%
10-1
911
.4%
11.4
%G
alen
a0.
7%0.
00%
0.7%
2.5%
20-4
920
.3%
20.3
%M
n O
xide
1.0%
0.66
%1.
0%0.
5%50
-99
13.8
%13
.8%
PbA
sO2.
4%55
.89%
2.4%
5.8%
100-
149
2.4%
2.4%
Phos
phat
e29
.0%
0.00
%29
.0%
46.2
%15
0-19
90.
0%0.
0%Fe
Sul
fate
12.7
%11
.14%
12.7
%1.
2%20
0-24
90.
0%0.
0%> 2
500.
0%0.
0%
Tot
al10
0%10
0%10
0%10
0%

SAMPLE ID EM-06

SUM
MA
RY
STA
TIST
ICS
EM-6
- A
rsen
ic
CO
UN
TSSI
ZEC
ount
Fre
q (%
)LW
Fre
q (%
)R
elat
ive
Ars
enic
Mas
s (%
)D
ISTR
IBU
TIO
NM
iner
alTo
tal
Lib
Avg
Min
Max
Tota
lLi
bera
ted
Tota
lLi
bera
ted
Den
sity
Frac
t As
Tota
lLi
bera
ted
Size
Tota
l Fre
qLi
b Fr
eqTo
tal R
AM
Lib
RAM
Clay
s2
244
4048
1.4%
1.4%
2.92
%2.
92%
3.1
0.00
028
0.1%
0.1%
<526
.9%
24.8
%1.
3%1.
3%A
ngle
site
55
54
103.
4%3.
4%0.
86%
0.86
%6.
30
0.0%
0.0%
5-9
17.9
%17
.9%
3.0%
3.0%
Barit
e1
110
1010
0.7%
0.7%
0.33
%0.
33%
4.5
00.
0%0.
0%10
-19
21.4
%21
.4%
9.4%
9.4%
Cer
ussit
e61
598
138
42.1
%40
.7%
16.8
9%16
.82%
6.6
00.
0%0.
0%20
-49
24.1
%23
.4%
33.6
%33
.6%
Fe O
xide
4141
314
205
28.3
%28
.3%
42.6
0%42
.60%
40.
011
48.1
%48
.1%
50-9
97.
6%7.
6%36
.2%
36.2
%G
alen
a2
011
120
1.4%
0.0%
0.70
%0.
00%
7.5
00.
0%0.
0%10
0-14
91.
4%1.
4%8.
8%8.
8%M
n O
xide
99
3611
806.
2%6.
2%10
.78%
10.7
8%5
0.00
7310
.1%
10.1
%15
0-19
90.
0%0.
0%0.
0%0.
0%Ph
osph
ate
66
406
105
4.1%
4.1%
7.93
%7.
93%
50.
0093
9.5%
9.5%
200-
249
0.7%
0.7%
7.7%
7.7%
Pyrit
e4
413
620
2.8%
2.8%
1.66
%1.
66%
4.8
0.01
63.
3%3.
3%> 2
500.
0%0.
0%0.
0%0.
0%Fe
Sul
fate
1414
331
969.
7%9.
7%15
.33%
15.3
3%3.
70.
0229
.1%
29.1
%10
0%97
%10
0%10
0%
TOTA
L14
514
121
100.
0%97
.2%
100.
00%
99.2
4%10
0.0%
100.
0%
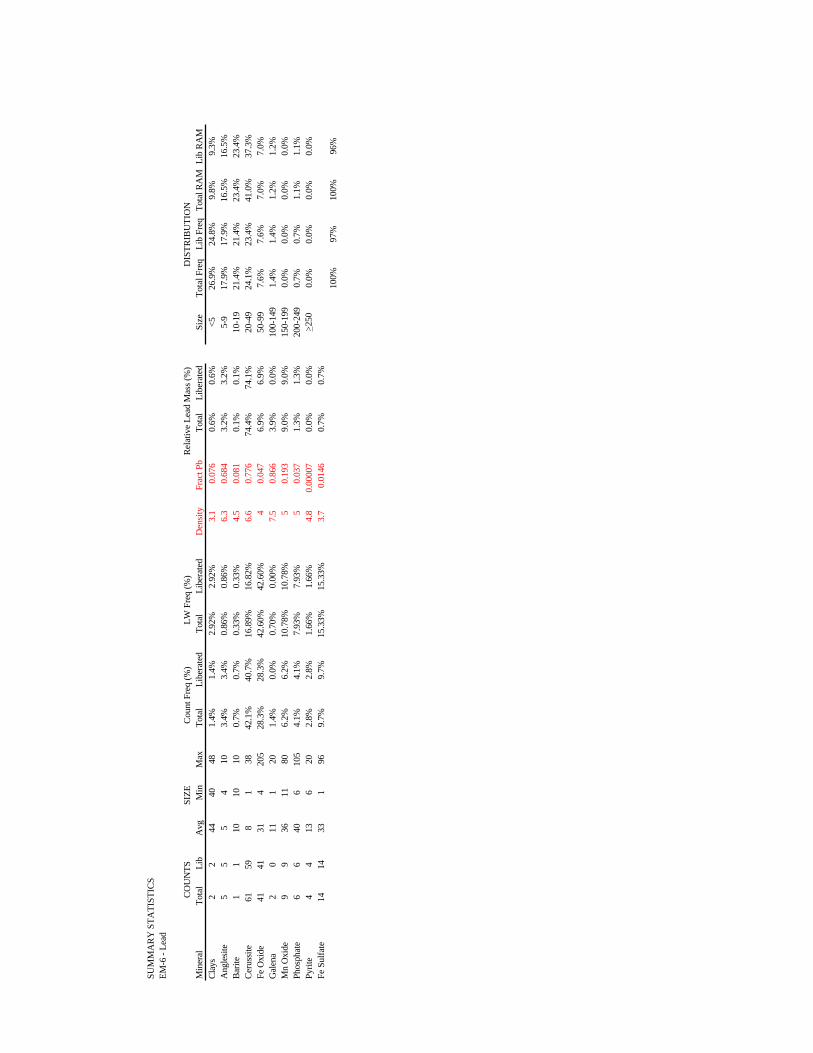
SUM
MA
RY
STA
TIST
ICS
EM-6
- Le
ad
CO
UN
TSSI
ZEC
ount
Fre
q (%
)LW
Fre
q (%
)R
elat
ive
Lead
Mas
s (%
)D
ISTR
IBU
TIO
NM
iner
alTo
tal
Lib
Avg
Min
Max
Tota
lLi
bera
ted
Tota
lLi
bera
ted
Den
sity
Frac
t Pb
Tota
lLi
bera
ted
Size
Tota
l Fre
qLi
b Fr
eqTo
tal R
AM
Lib
RAM
Clay
s2
244
4048
1.4%
1.4%
2.92
%2.
92%
3.1
0.07
60.
6%0.
6%<5
26.9
%24
.8%
9.8%
9.3%
Ang
lesit
e5
55
410
3.4%
3.4%
0.86
%0.
86%
6.3
0.68
43.
2%3.
2%5-
917
.9%
17.9
%16
.5%
16.5
%Ba
rite
11
1010
100.
7%0.
7%0.
33%
0.33
%4.
50.
081
0.1%
0.1%
10-1
921
.4%
21.4
%23
.4%
23.4
%C
erus
site
6159
81
3842
.1%
40.7
%16
.89%
16.8
2%6.
60.
776
74.4
%74
.1%
20-4
924
.1%
23.4
%41
.0%
37.3
%Fe
Oxi
de41
4131
420
528
.3%
28.3
%42
.60%
42.6
0%4
0.04
76.
9%6.
9%50
-99
7.6%
7.6%
7.0%
7.0%
Gal
ena
20
111
201.
4%0.
0%0.
70%
0.00
%7.
50.
866
3.9%
0.0%
100-
149
1.4%
1.4%
1.2%
1.2%
Mn
Oxi
de9
936
1180
6.2%
6.2%
10.7
8%10
.78%
50.
193
9.0%
9.0%
150-
199
0.0%
0.0%
0.0%
0.0%
Phos
phat
e6
640
610
54.
1%4.
1%7.
93%
7.93
%5
0.03
71.
3%1.
3%20
0-24
90.
7%0.
7%1.
1%1.
1%Py
rite
44
136
202.
8%2.
8%1.
66%
1.66
%4.
80.
0000
70.
0%0.
0%> 2
500.
0%0.
0%0.
0%0.
0%Fe
Sul
fate
1414
331
969.
7%9.
7%15
.33%
15.3
3%3.
70.
0146
0.7%
0.7%
100%
97%
100%
96%
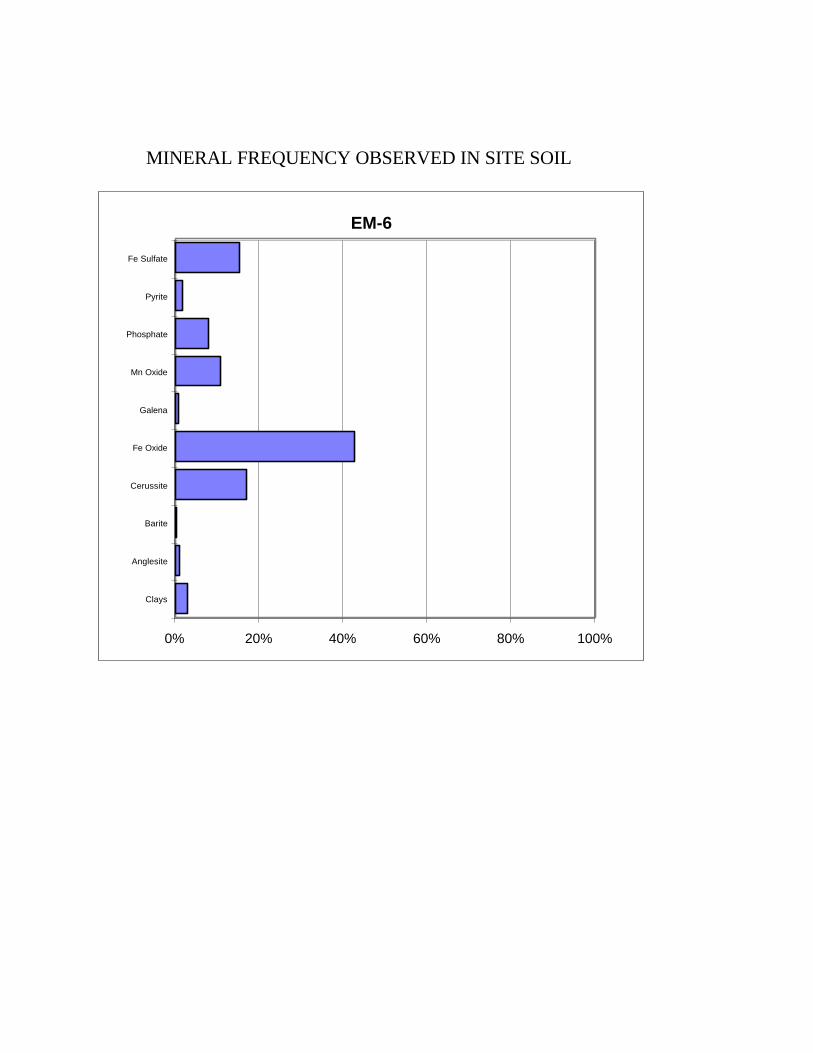
MINERAL FREQUENCY OBSERVED IN SITE SOIL
EM-6
0% 20% 40% 60% 80% 100%
Clays
Anglesite
Barite
Cerussite
Fe Oxide
Galena
Mn Oxide
Phosphate
Pyrite
Fe Sulfate
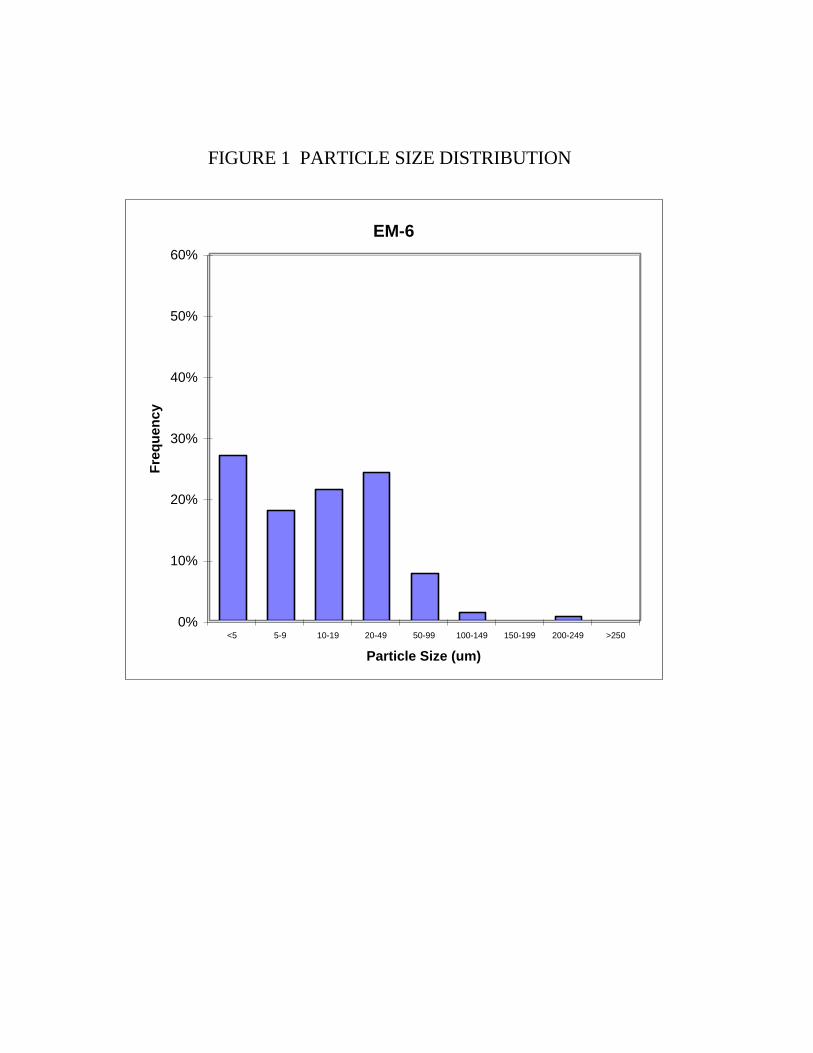
FIGURE 1 PARTICLE SIZE DISTRIBUTION
EM-6
0%
10%
20%
30%
40%
50%
60%
<5 5-9 10-19 20-49 50-99 100-149 150-199 200-249 >250
Particle Size (um)
Fre
qu
ency
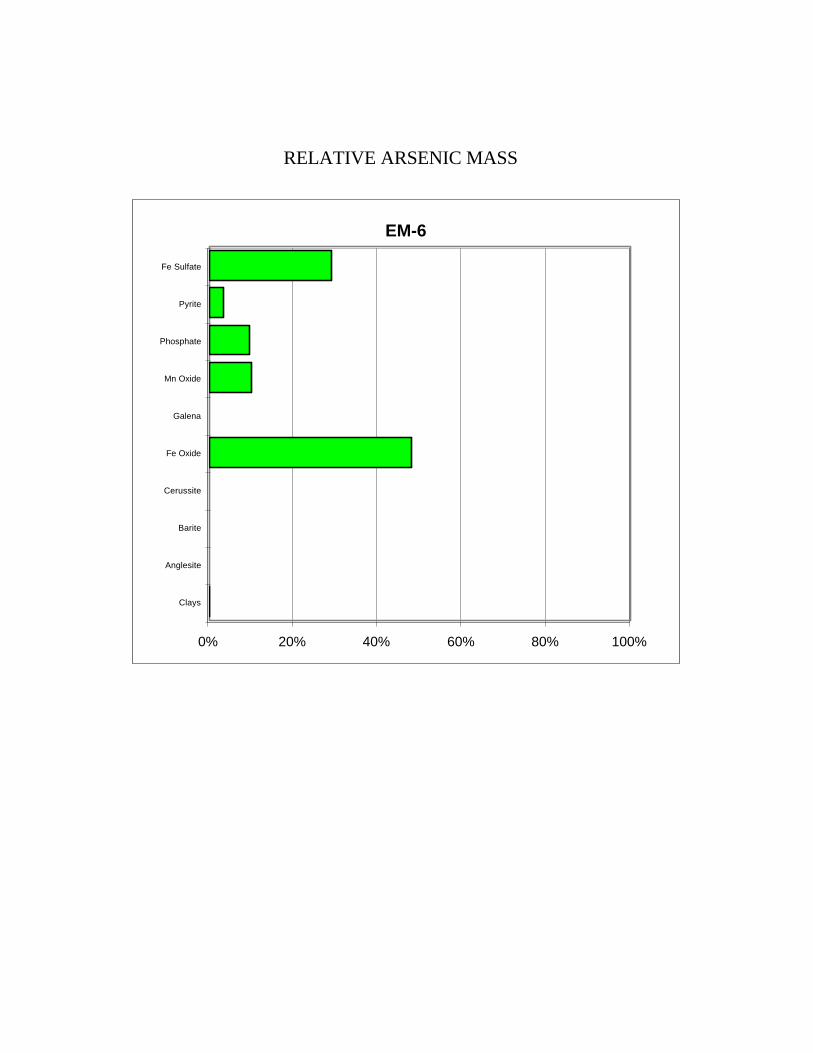
RELATIVE ARSENIC MASS
EM-6
0% 20% 40% 60% 80% 100%
Clays
Anglesite
Barite
Cerussite
Fe Oxide
Galena
Mn Oxide
Phosphate
Pyrite
Fe Sulfate
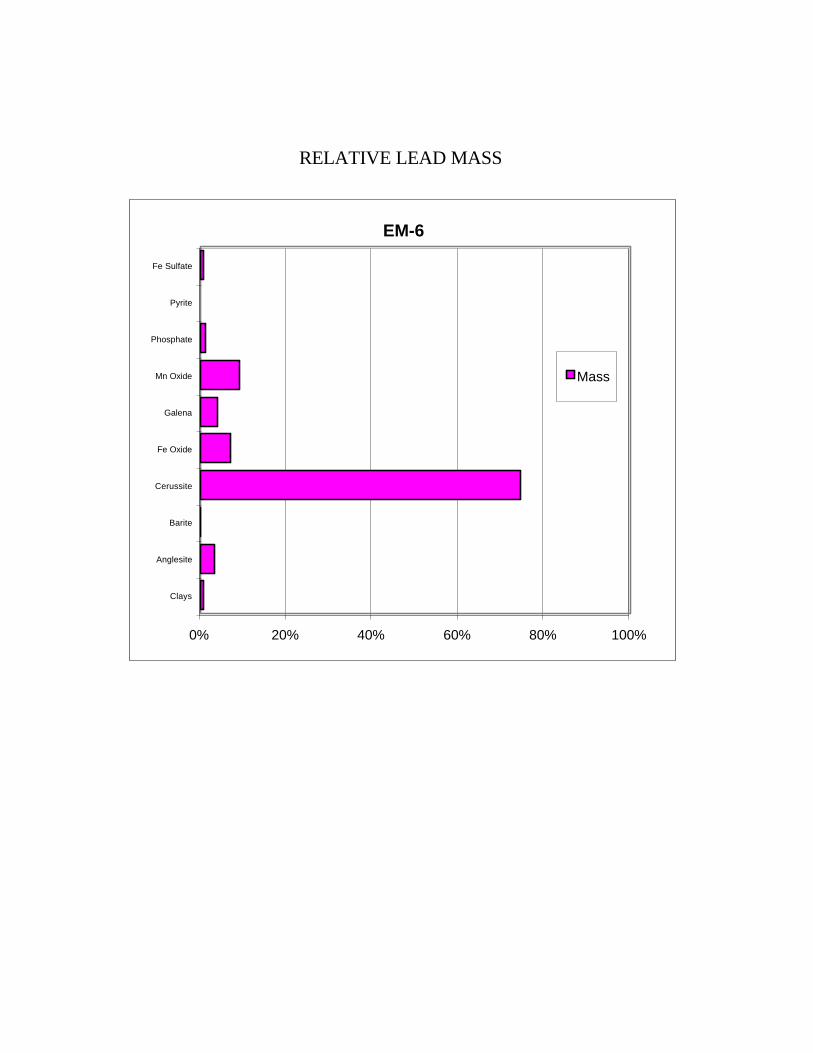
RELATIVE LEAD MASS
EM-6
0% 20% 40% 60% 80% 100%
Clays
Anglesite
Barite
Cerussite
Fe Oxide
Galena
Mn Oxide
Phosphate
Pyrite
Fe Sulfate
Mass
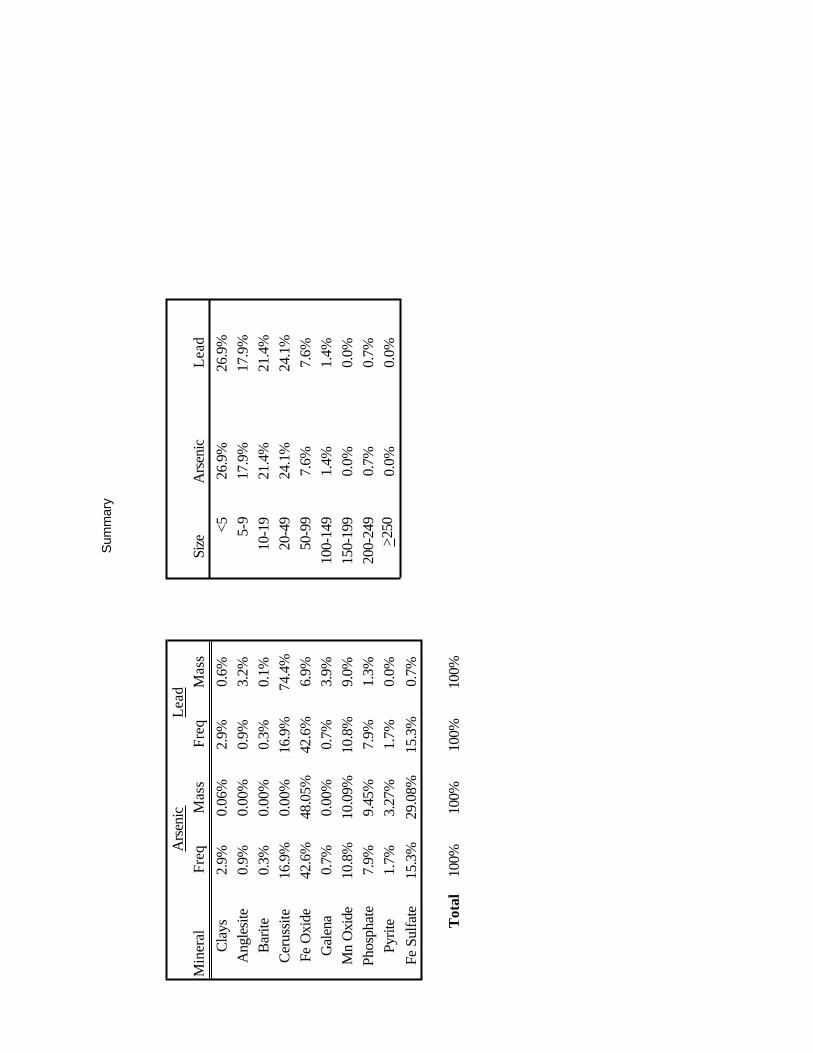
Sum
mar
y
Ars
enic
Lead
Min
eral
Freq
Mas
sFr
eqM
ass
Size
Ars
enic
Lead
Clay
s2.
9%0.
06%
2.9%
0.6%
<526
.9%
26.9
%A
ngle
site
0.9%
0.00
%0.
9%3.
2%5-
917
.9%
17.9
%Ba
rite
0.3%
0.00
%0.
3%0.
1%10
-19
21.4
%21
.4%
Ceru
ssite
16.9
%0.
00%
16.9
%74
.4%
20-4
924
.1%
24.1
%Fe
Oxi
de42
.6%
48.0
5%42
.6%
6.9%
50-9
97.
6%7.
6%G
alen
a0.
7%0.
00%
0.7%
3.9%
100-
149
1.4%
1.4%
Mn
Oxi
de10
.8%
10.0
9%10
.8%
9.0%
150-
199
0.0%
0.0%
Phos
phat
e7.
9%9.
45%
7.9%
1.3%
200-
249
0.7%
0.7%
Pyrit
e1.
7%3.
27%
1.7%
0.0%
>250
0.0%
0.0%
Fe S
ulfa
te15
.3%
29.0
8%15
.3%
0.7%
Tot
al10
0%10
0%10
0%10
0%

SAMPLE ID EM-07
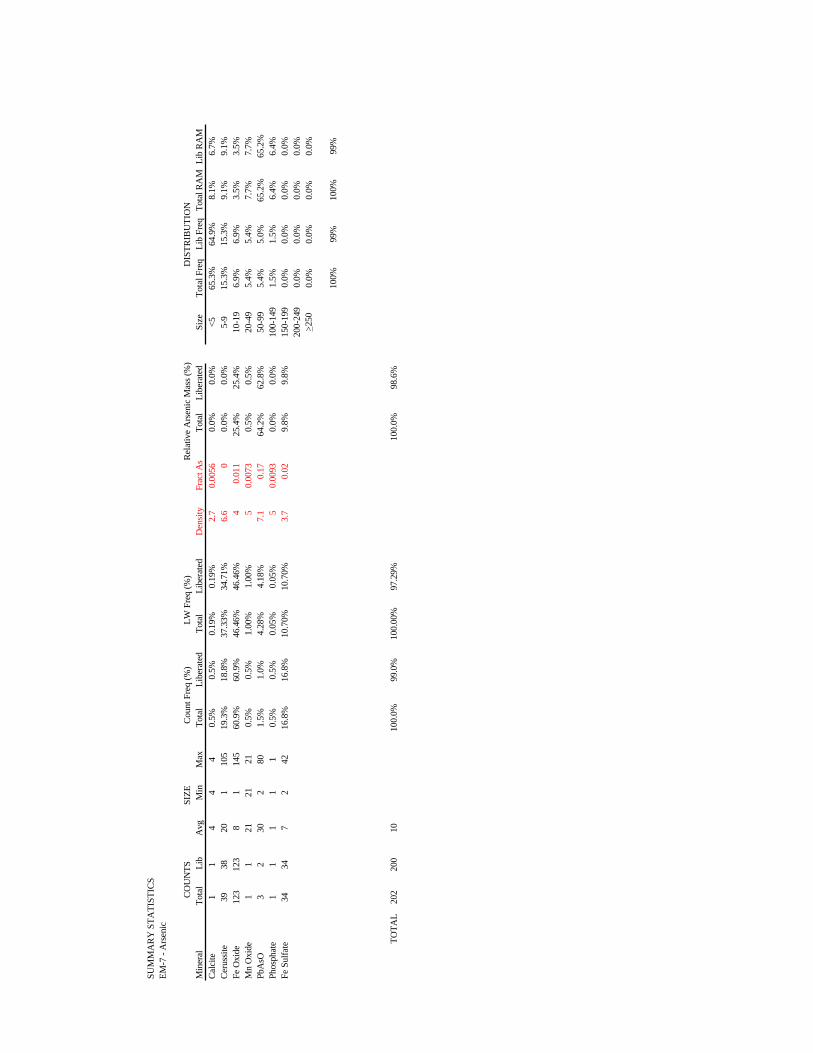
SUM
MA
RY
STA
TIST
ICS
EM-7
- A
rsen
ic
CO
UN
TSSI
ZEC
ount
Fre
q (%
)LW
Fre
q (%
)R
elat
ive
Ars
enic
Mas
s (%
)D
ISTR
IBU
TIO
NM
iner
alTo
tal
Lib
Avg
Min
Max
Tota
lLi
bera
ted
Tota
lLi
bera
ted
Den
sity
Frac
t As
Tota
lLi
bera
ted
Size
Tota
l Fre
qLi
b Fr
eqTo
tal R
AM
Lib
RAM
Calc
ite1
14
44
0.5%
0.5%
0.19
%0.
19%
2.7
0.00
560.
0%0.
0%<5
65.3
%64
.9%
8.1%
6.7%
Cer
ussit
e39
3820
110
519
.3%
18.8
%37
.33%
34.7
1%6.
60
0.0%
0.0%
5-9
15.3
%15
.3%
9.1%
9.1%
Fe O
xide
123
123
81
145
60.9
%60
.9%
46.4
6%46
.46%
40.
011
25.4
%25
.4%
10-1
96.
9%6.
9%3.
5%3.
5%M
n O
xide
11
2121
210.
5%0.
5%1.
00%
1.00
%5
0.00
730.
5%0.
5%20
-49
5.4%
5.4%
7.7%
7.7%
PbA
sO3
230
280
1.5%
1.0%
4.28
%4.
18%
7.1
0.17
64.2
%62
.8%
50-9
95.
4%5.
0%65
.2%
65.2
%Ph
osph
ate
11
11
10.
5%0.
5%0.
05%
0.05
%5
0.00
930.
0%0.
0%10
0-14
91.
5%1.
5%6.
4%6.
4%Fe
Sul
fate
3434
72
4216
.8%
16.8
%10
.70%
10.7
0%3.
70.
029.
8%9.
8%15
0-19
90.
0%0.
0%0.
0%0.
0%20
0-24
90.
0%0.
0%0.
0%0.
0%> 2
500.
0%0.
0%0.
0%0.
0%
100%
99%
100%
99%
TOTA
L20
220
010
100.
0%99
.0%
100.
00%
97.2
9%10
0.0%
98.6
%
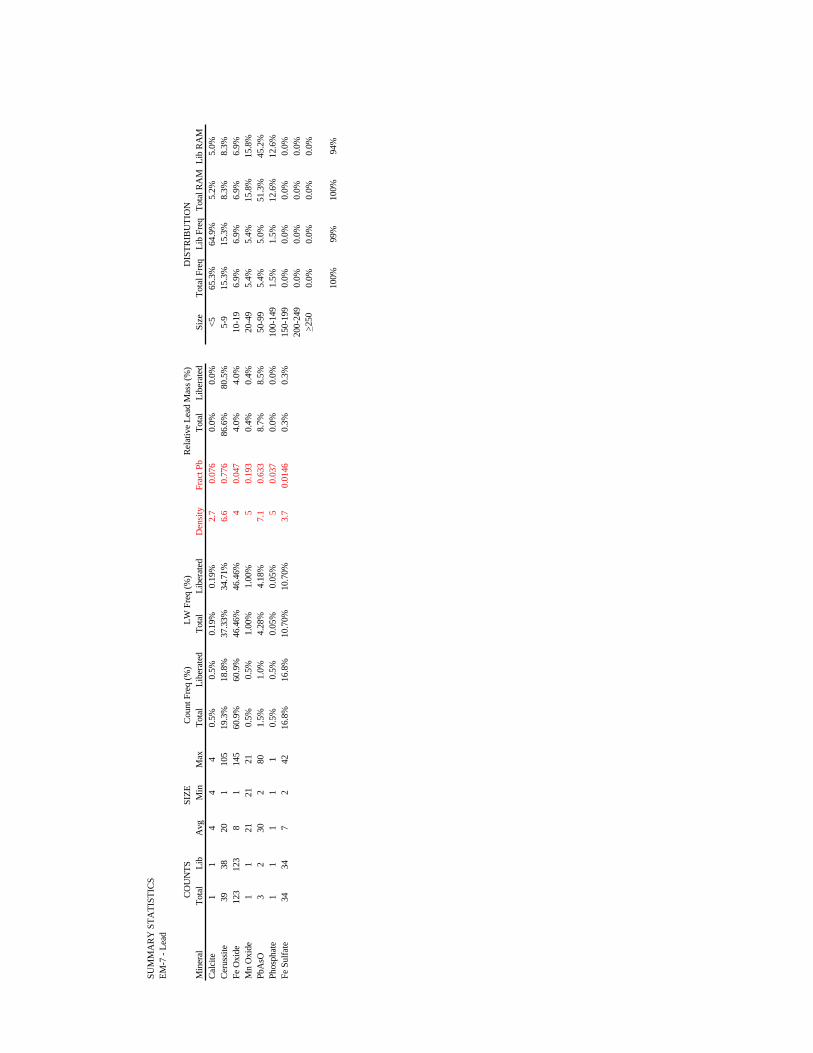
SUM
MA
RY
STA
TIST
ICS
EM-7
- Le
ad
CO
UN
TSSI
ZEC
ount
Fre
q (%
)LW
Fre
q (%
)R
elat
ive
Lead
Mas
s (%
)D
ISTR
IBU
TIO
NM
iner
alTo
tal
Lib
Avg
Min
Max
Tota
lLi
bera
ted
Tota
lLi
bera
ted
Den
sity
Frac
t Pb
Tota
lLi
bera
ted
Size
Tota
l Fre
qLi
b Fr
eqTo
tal R
AM
Lib
RAM
Calc
ite1
14
44
0.5%
0.5%
0.19
%0.
19%
2.7
0.07
60.
0%0.
0%<5
65.3
%64
.9%
5.2%
5.0%
Cer
ussit
e39
3820
110
519
.3%
18.8
%37
.33%
34.7
1%6.
60.
776
86.6
%80
.5%
5-9
15.3
%15
.3%
8.3%
8.3%
Fe O
xide
123
123
81
145
60.9
%60
.9%
46.4
6%46
.46%
40.
047
4.0%
4.0%
10-1
96.
9%6.
9%6.
9%6.
9%M
n O
xide
11
2121
210.
5%0.
5%1.
00%
1.00
%5
0.19
30.
4%0.
4%20
-49
5.4%
5.4%
15.8
%15
.8%
PbA
sO3
230
280
1.5%
1.0%
4.28
%4.
18%
7.1
0.63
38.
7%8.
5%50
-99
5.4%
5.0%
51.3
%45
.2%
Phos
phat
e1
11
11
0.5%
0.5%
0.05
%0.
05%
50.
037
0.0%
0.0%
100-
149
1.5%
1.5%
12.6
%12
.6%
Fe S
ulfa
te34
347
242
16.8
%16
.8%
10.7
0%10
.70%
3.7
0.01
460.
3%0.
3%15
0-19
90.
0%0.
0%0.
0%0.
0%20
0-24
90.
0%0.
0%0.
0%0.
0%> 2
500.
0%0.
0%0.
0%0.
0%
100%
99%
100%
94%
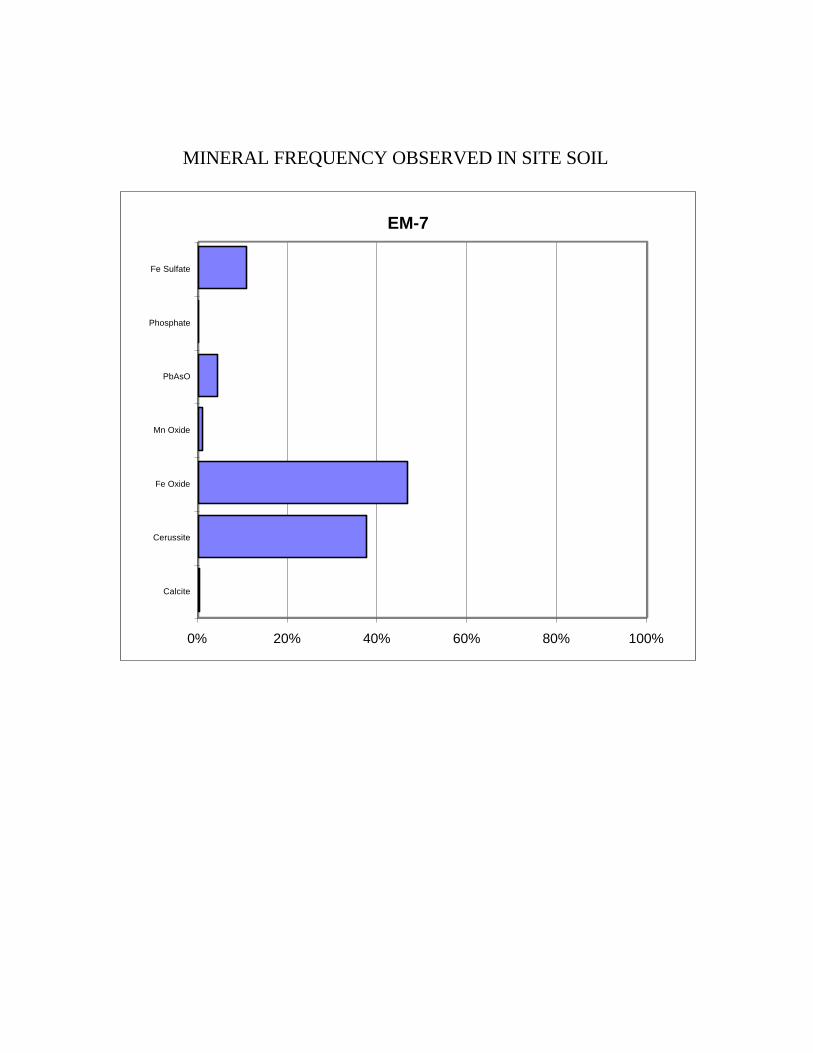
MINERAL FREQUENCY OBSERVED IN SITE SOIL
EM-7
0% 20% 40% 60% 80% 100%
Calcite
Cerussite
Fe Oxide
Mn Oxide
PbAsO
Phosphate
Fe Sulfate
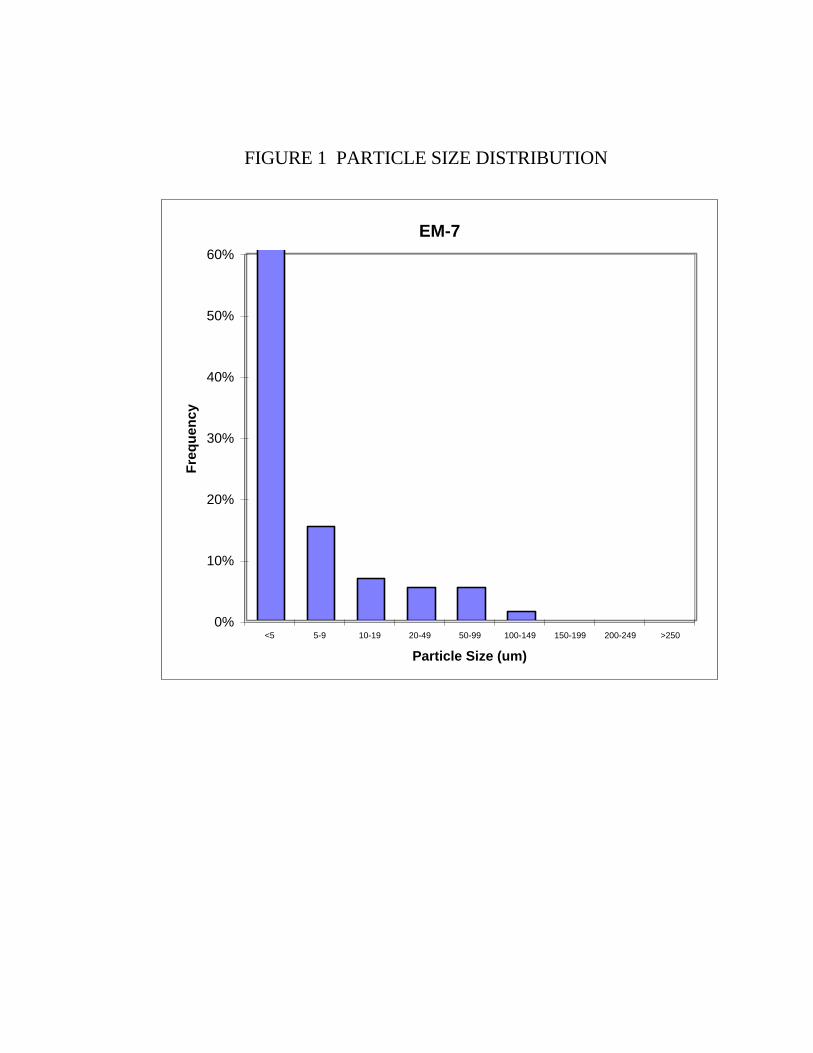
FIGURE 1 PARTICLE SIZE DISTRIBUTION
EM-7
0%
10%
20%
30%
40%
50%
60%
<5 5-9 10-19 20-49 50-99 100-149 150-199 200-249 >250
Particle Size (um)
Fre
qu
ency
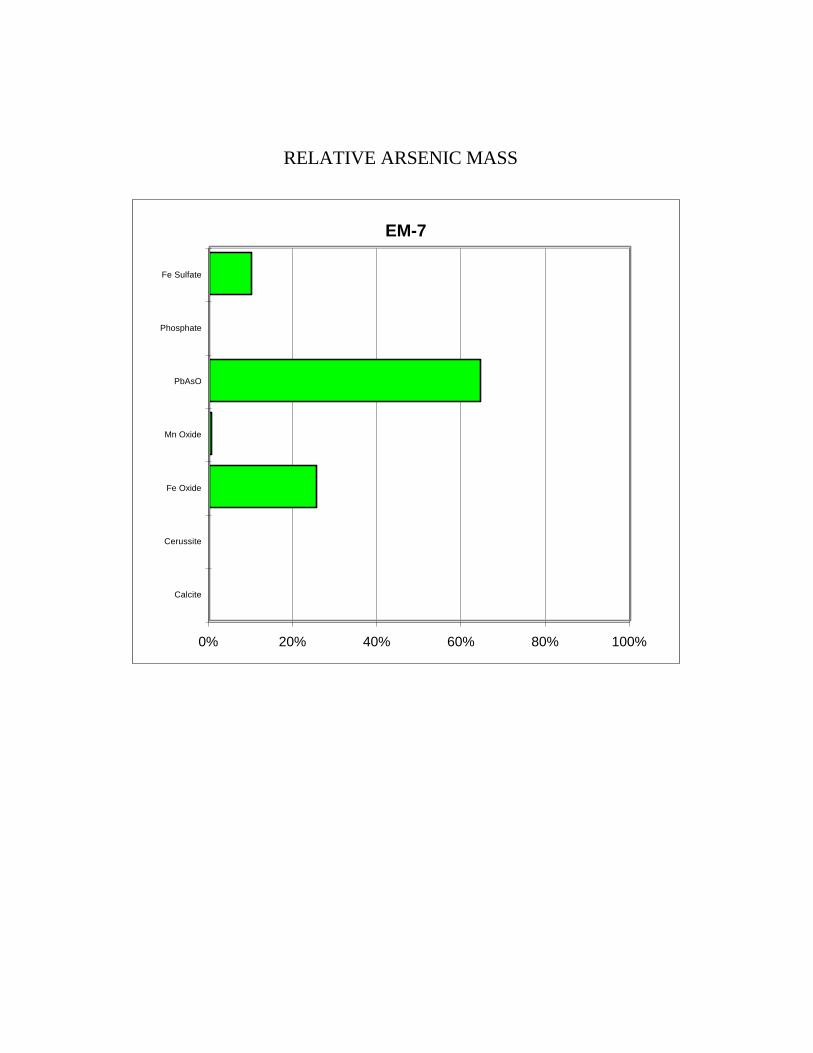
RELATIVE ARSENIC MASS
EM-7
0% 20% 40% 60% 80% 100%
Calcite
Cerussite
Fe Oxide
Mn Oxide
PbAsO
Phosphate
Fe Sulfate
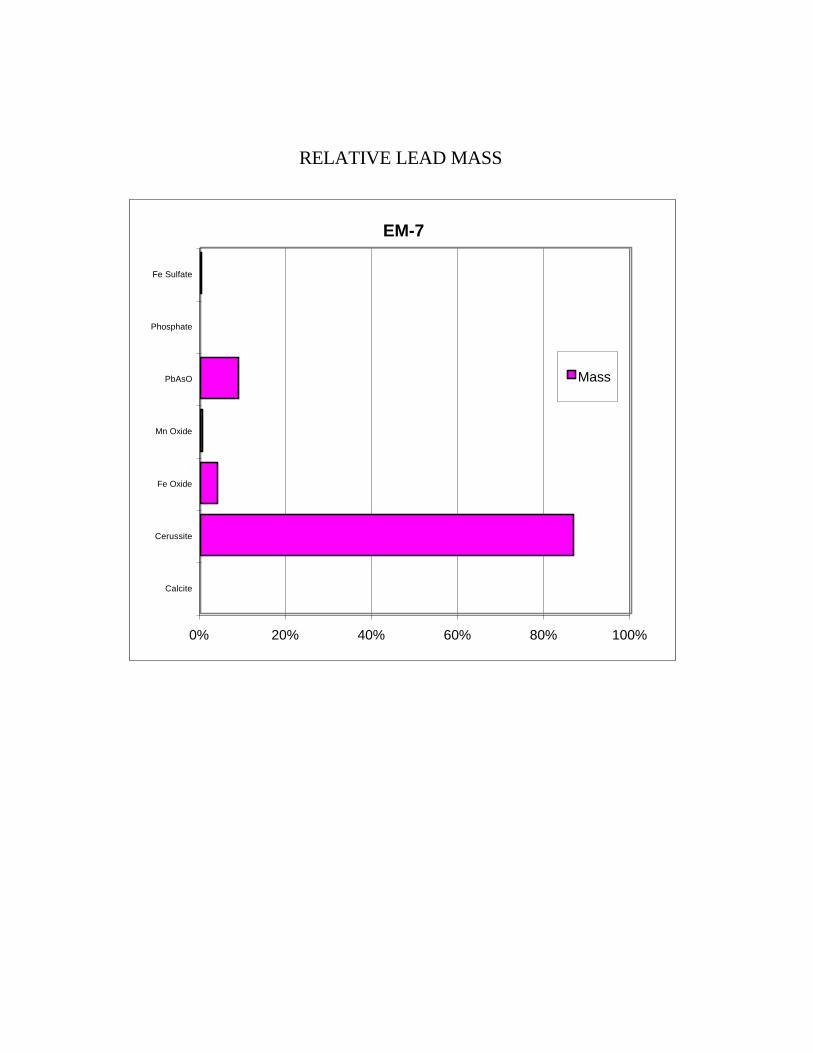
RELATIVE LEAD MASS
EM-7
0% 20% 40% 60% 80% 100%
Calcite
Cerussite
Fe Oxide
Mn Oxide
PbAsO
Phosphate
Fe Sulfate
Mass
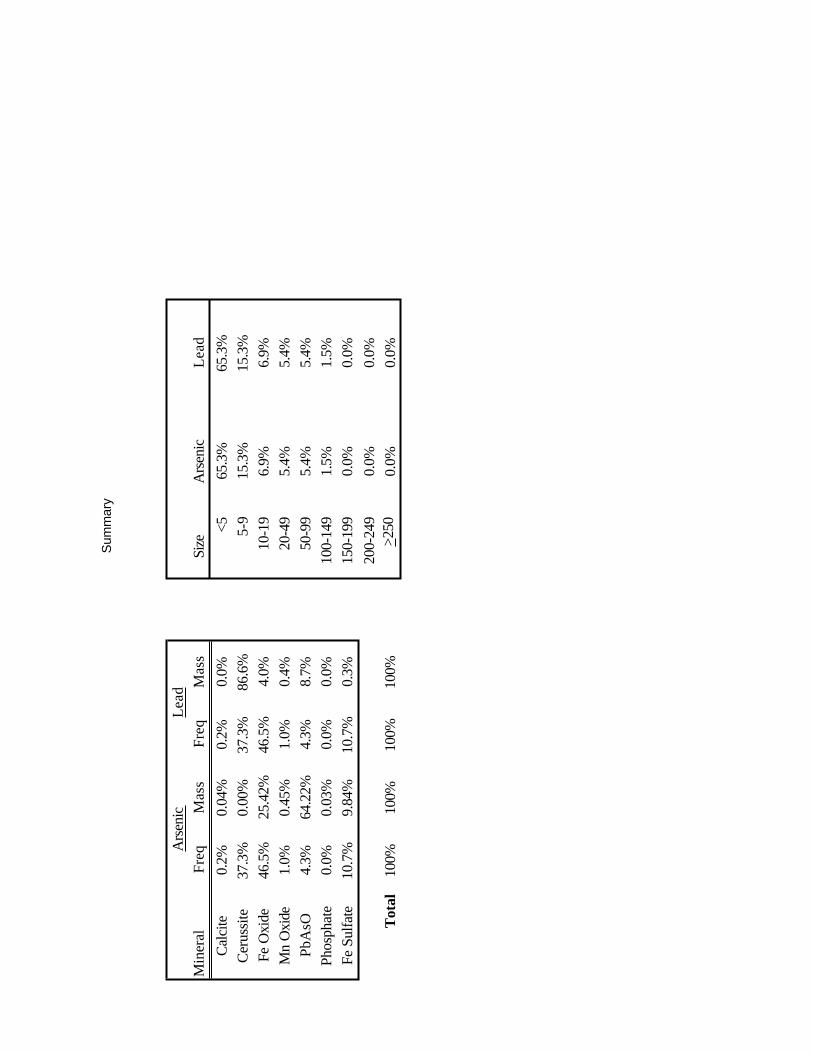
Sum
mar
y
Ars
enic
Lead
Min
eral
Freq
Mas
sFr
eqM
ass
Size
Ars
enic
Lead
Calc
ite0.
2%0.
04%
0.2%
0.0%
<565
.3%
65.3
%Ce
russ
ite37
.3%
0.00
%37
.3%
86.6
%5-
915
.3%
15.3
%Fe
Oxi
de46
.5%
25.4
2%46
.5%
4.0%
10-1
96.
9%6.
9%M
n O
xide
1.0%
0.45
%1.
0%0.
4%20
-49
5.4%
5.4%
PbA
sO4.
3%64
.22%
4.3%
8.7%
50-9
95.
4%5.
4%Ph
osph
ate
0.0%
0.03
%0.
0%0.
0%10
0-14
91.
5%1.
5%Fe
Sul
fate
10.7
%9.
84%
10.7
%0.
3%15
0-19
90.
0%0.
0%20
0-24
90.
0%0.
0%T
otal
100%
100%
100%
100%
>250
0.0%
0.0%

SAMPLE ID EM-08
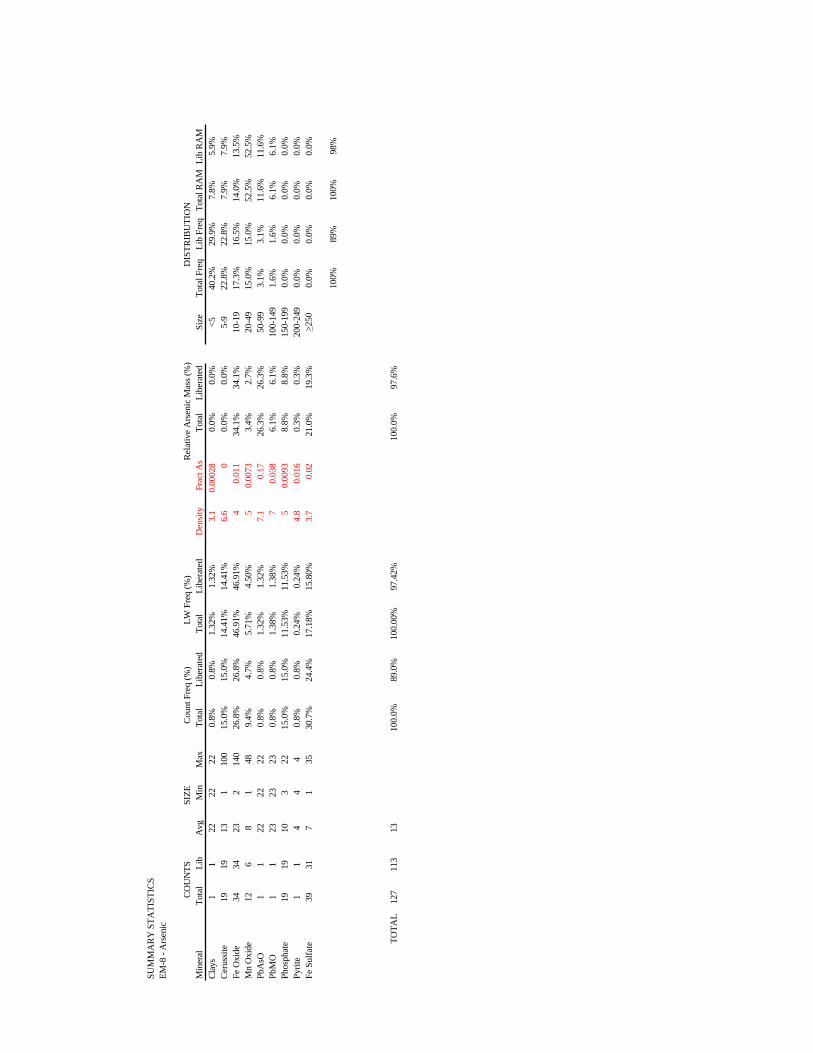
SUM
MA
RY
STA
TIST
ICS
EM-8
- A
rsen
ic
CO
UN
TSSI
ZEC
ount
Fre
q (%
)LW
Fre
q (%
)R
elat
ive
Ars
enic
Mas
s (%
)D
ISTR
IBU
TIO
NM
iner
alTo
tal
Lib
Avg
Min
Max
Tota
lLi
bera
ted
Tota
lLi
bera
ted
Den
sity
Frac
t As
Tota
lLi
bera
ted
Size
Tota
l Fre
qLi
b Fr
eqTo
tal R
AM
Lib
RAM
Clay
s1
122
2222
0.8%
0.8%
1.32
%1.
32%
3.1
0.00
028
0.0%
0.0%
<540
.2%
29.9
%7.
8%5.
9%C
erus
site
1919
131
100
15.0
%15
.0%
14.4
1%14
.41%
6.6
00.
0%0.
0%5-
922
.8%
22.8
%7.
9%7.
9%Fe
Oxi
de34
3423
214
026
.8%
26.8
%46
.91%
46.9
1%4
0.01
134
.1%
34.1
%10
-19
17.3
%16
.5%
14.0
%13
.5%
Mn
Oxi
de12
68
148
9.4%
4.7%
5.71
%4.
50%
50.
0073
3.4%
2.7%
20-4
915
.0%
15.0
%52
.5%
52.5
%Pb
AsO
11
2222
220.
8%0.
8%1.
32%
1.32
%7.
10.
1726
.3%
26.3
%50
-99
3.1%
3.1%
11.6
%11
.6%
PbM
O1
123
2323
0.8%
0.8%
1.38
%1.
38%
70.
038
6.1%
6.1%
100-
149
1.6%
1.6%
6.1%
6.1%
Phos
phat
e19
1910
322
15.0
%15
.0%
11.5
3%11
.53%
50.
0093
8.8%
8.8%
150-
199
0.0%
0.0%
0.0%
0.0%
Pyrit
e1
14
44
0.8%
0.8%
0.24
%0.
24%
4.8
0.01
60.
3%0.
3%20
0-24
90.
0%0.
0%0.
0%0.
0%Fe
Sul
fate
3931
71
3530
.7%
24.4
%17
.18%
15.8
0%3.
70.
0221
.0%
19.3
%> 2
500.
0%0.
0%0.
0%0.
0%
100%
89%
100%
98%
TOTA
L12
711
313
100.
0%89
.0%
100.
00%
97.4
2%10
0.0%
97.6
%
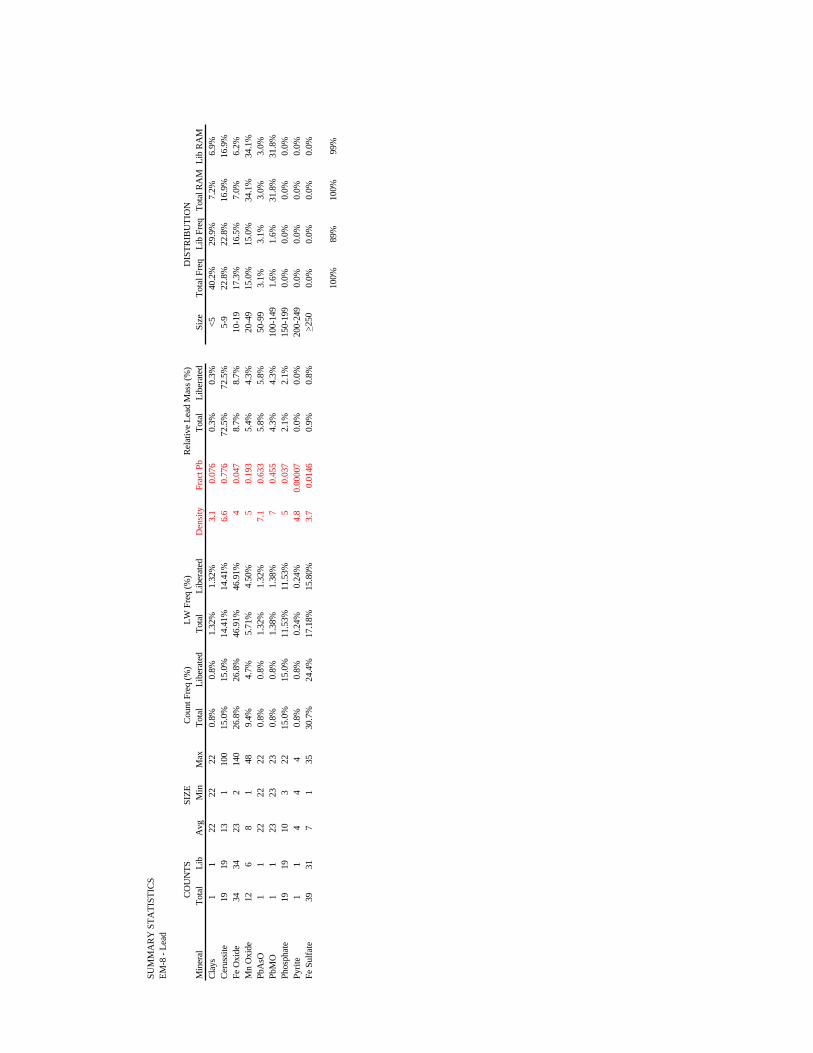
SUM
MA
RY
STA
TIST
ICS
EM-8
- Le
ad
CO
UN
TSSI
ZEC
ount
Fre
q (%
)LW
Fre
q (%
)R
elat
ive
Lead
Mas
s (%
)D
ISTR
IBU
TIO
NM
iner
alTo
tal
Lib
Avg
Min
Max
Tota
lLi
bera
ted
Tota
lLi
bera
ted
Den
sity
Frac
t Pb
Tota
lLi
bera
ted
Size
Tota
l Fre
qLi
b Fr
eqTo
tal R
AM
Lib
RAM
Clay
s1
122
2222
0.8%
0.8%
1.32
%1.
32%
3.1
0.07
60.
3%0.
3%<5
40.2
%29
.9%
7.2%
6.9%
Cer
ussit
e19
1913
110
015
.0%
15.0
%14
.41%
14.4
1%6.
60.
776
72.5
%72
.5%
5-9
22.8
%22
.8%
16.9
%16
.9%
Fe O
xide
3434
232
140
26.8
%26
.8%
46.9
1%46
.91%
40.
047
8.7%
8.7%
10-1
917
.3%
16.5
%7.
0%6.
2%M
n O
xide
126
81
489.
4%4.
7%5.
71%
4.50
%5
0.19
35.
4%4.
3%20
-49
15.0
%15
.0%
34.1
%34
.1%
PbA
sO1
122
2222
0.8%
0.8%
1.32
%1.
32%
7.1
0.63
35.
8%5.
8%50
-99
3.1%
3.1%
3.0%
3.0%
PbM
O1
123
2323
0.8%
0.8%
1.38
%1.
38%
70.
455
4.3%
4.3%
100-
149
1.6%
1.6%
31.8
%31
.8%
Phos
phat
e19
1910
322
15.0
%15
.0%
11.5
3%11
.53%
50.
037
2.1%
2.1%
150-
199
0.0%
0.0%
0.0%
0.0%
Pyrit
e1
14
44
0.8%
0.8%
0.24
%0.
24%
4.8
0.00
007
0.0%
0.0%
200-
249
0.0%
0.0%
0.0%
0.0%
Fe S
ulfa
te39
317
135
30.7
%24
.4%
17.1
8%15
.80%
3.7
0.01
460.
9%0.
8%> 2
500.
0%0.
0%0.
0%0.
0%
100%
89%
100%
99%
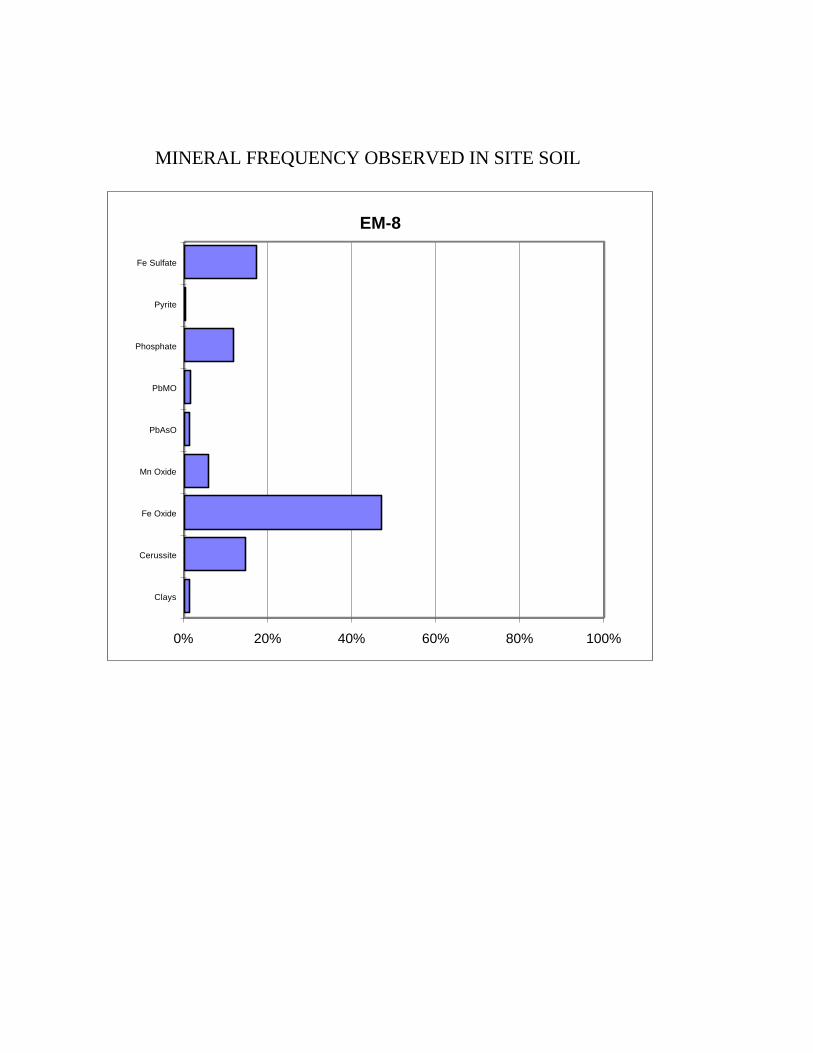
MINERAL FREQUENCY OBSERVED IN SITE SOIL
EM-8
0% 20% 40% 60% 80% 100%
Clays
Cerussite
Fe Oxide
Mn Oxide
PbAsO
PbMO
Phosphate
Pyrite
Fe Sulfate
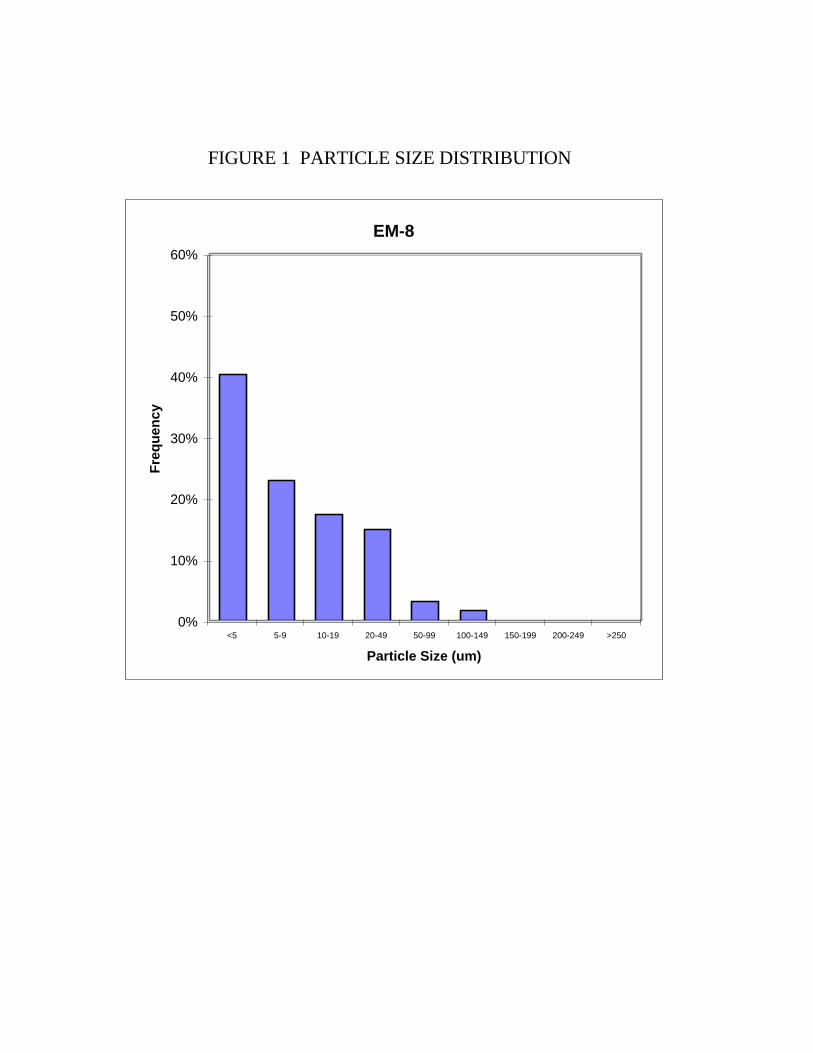
FIGURE 1 PARTICLE SIZE DISTRIBUTION
EM-8
0%
10%
20%
30%
40%
50%
60%
<5 5-9 10-19 20-49 50-99 100-149 150-199 200-249 >250
Particle Size (um)
Fre
qu
ency
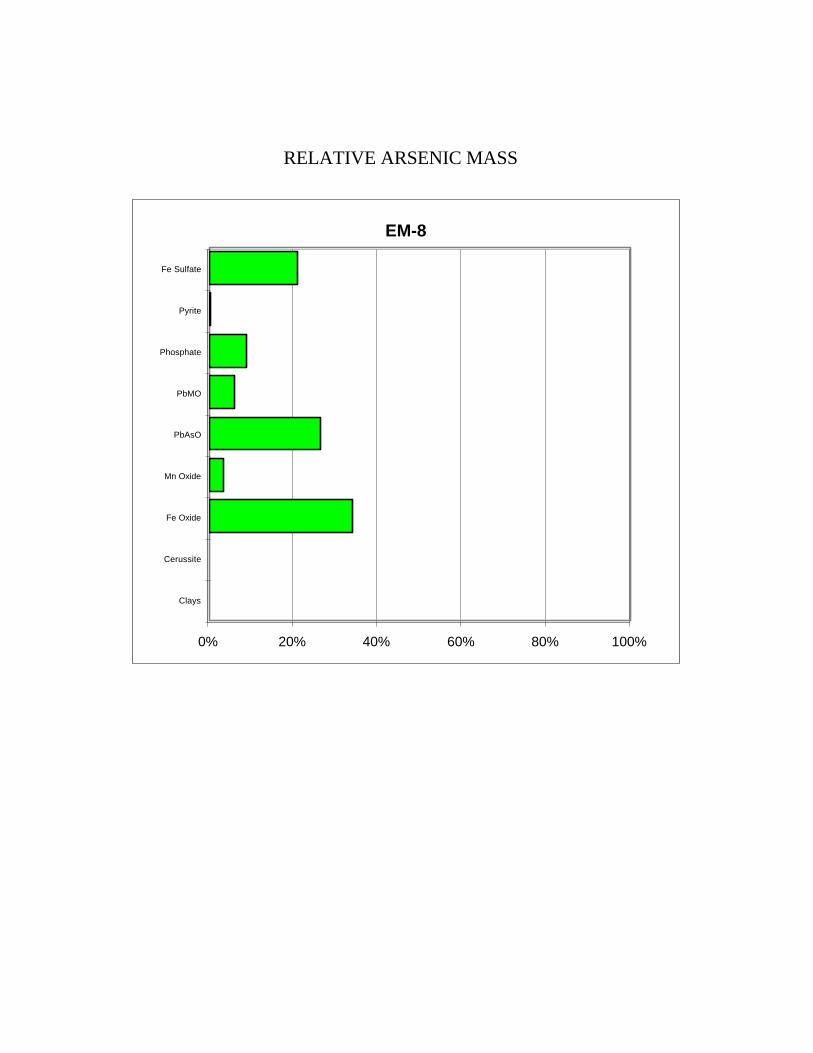
RELATIVE ARSENIC MASS
EM-8
0% 20% 40% 60% 80% 100%
Clays
Cerussite
Fe Oxide
Mn Oxide
PbAsO
PbMO
Phosphate
Pyrite
Fe Sulfate
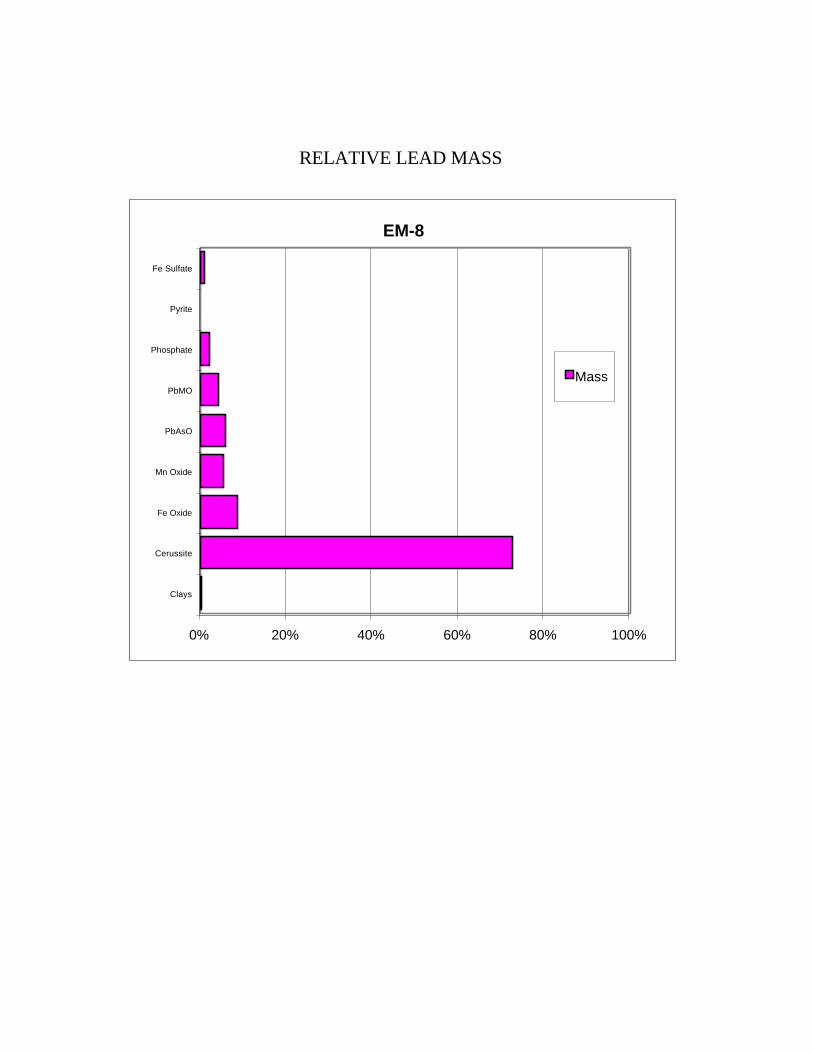
RELATIVE LEAD MASS
EM-8
0% 20% 40% 60% 80% 100%
Clays
Cerussite
Fe Oxide
Mn Oxide
PbAsO
PbMO
Phosphate
Pyrite
Fe Sulfate
Mass
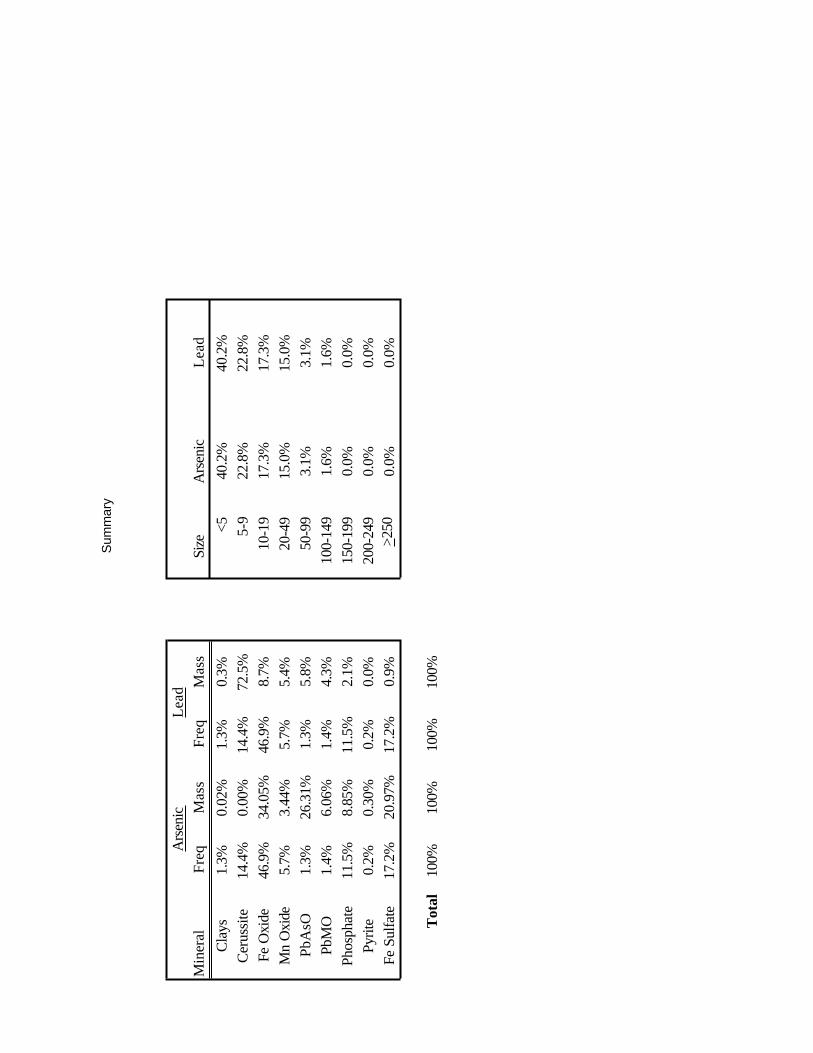
Sum
mar
y
Ars
enic
Lead
Min
eral
Freq
Mas
sFr
eqM
ass
Size
Ars
enic
Lead
Clay
s1.
3%0.
02%
1.3%
0.3%
<540
.2%
40.2
%Ce
russ
ite14
.4%
0.00
%14
.4%
72.5
%5-
922
.8%
22.8
%Fe
Oxi
de46
.9%
34.0
5%46
.9%
8.7%
10-1
917
.3%
17.3
%M
n O
xide
5.7%
3.44
%5.
7%5.
4%20
-49
15.0
%15
.0%
PbA
sO1.
3%26
.31%
1.3%
5.8%
50-9
93.
1%3.
1%Pb
MO
1.4%
6.06
%1.
4%4.
3%10
0-14
91.
6%1.
6%Ph
osph
ate
11.5
%8.
85%
11.5
%2.
1%15
0-19
90.
0%0.
0%Py
rite
0.2%
0.30
%0.
2%0.
0%20
0-24
90.
0%0.
0%Fe
Sul
fate
17.2
%20
.97%
17.2
%0.
9%>2
500.
0%0.
0%
Tot
al10
0%10
0%10
0%10
0%

SAMPLE ID EM-09

SUM
MA
RY
STA
TIST
ICS
EM-9
- A
rsen
ic
CO
UN
TSSI
ZEC
ount
Fre
q (%
)LW
Fre
q (%
)R
elat
ive
Ars
enic
Mas
s (%
)D
ISTR
IBU
TIO
NM
iner
alTo
tal
Lib
Avg
Min
Max
Tota
lLi
bera
ted
Tota
lLi
bera
ted
Den
sity
Frac
t As
Tota
lLi
bera
ted
Size
Tota
l Fre
qLi
b Fr
eqTo
tal R
AM
Lib
RAM
Cer
ussit
e9
915
165
9.8%
9.8%
11.4
6%11
.46%
6.6
00.
0%0.
0%<5
25.0
%23
.9%
8.1%
7.9%
Fe O
xide
4140
162
8544
.6%
43.5
%58
.42%
58.2
5%4
0.01
155
.0%
54.9
%5-
933
.7%
33.7
%17
.3%
17.3
%M
n O
xide
44
153
334.
3%4.
3%5.
12%
5.12
%5
0.00
734.
0%4.
0%10
-19
25.0
%25
.0%
26.8
%26
.8%
PbA
sO1
11
11
1.1%
1.1%
0.09
%0.
09%
7.1
0.17
2.2%
2.2%
20-4
913
.0%
13.0
%34
.3%
34.3
%Pb
MO
11
22
21.
1%1.
1%0.
17%
0.17
%7
0.03
81.
0%1.
0%50
-99
3.3%
3.3%
13.5
%13
.5%
Phos
phat
e6
65
28
6.5%
6.5%
2.43
%2.
43%
50.
0093
2.4%
2.4%
100-
149
0.0%
0.0%
0.0%
0.0%
Fe S
ulfa
te30
309
234
32.6
%32
.6%
22.3
1%22
.31%
3.7
0.02
35.3
%35
.3%
150-
199
0.0%
0.0%
0.0%
0.0%
200-
249
0.0%
0.0%
0.0%
0.0%
> 250
0.0%
0.0%
0.0%
0.0%
100%
99%
100%
100%
TOTA
L92
9113
100.
0%98
.9%
100.
00%
99.8
3%10
0.0%
99.8
%

SUM
MA
RY
STA
TIST
ICS
EM-9
- Le
ad
CO
UN
TSSI
ZEC
ount
Fre
q (%
)LW
Fre
q (%
)R
elat
ive
Lead
Mas
s (%
)D
ISTR
IBU
TIO
NM
iner
alTo
tal
Lib
Avg
Min
Max
Tota
lLi
bera
ted
Tota
lLi
bera
ted
Den
sity
Frac
t Pb
Tota
lLi
bera
ted
Size
Tota
l Fre
qLi
b Fr
eqTo
tal R
AM
Lib
RAM
Cer
ussit
e9
915
165
9.8%
9.8%
11.4
6%11
.46%
6.6
0.77
676
.0%
76.0
%<5
25.0
%23
.9%
3.0%
3.0%
Fe O
xide
4140
162
8544
.6%
43.5
%58
.42%
58.2
5%4
0.04
714
.2%
14.2
%5-
933
.7%
33.7
%24
.1%
24.1
%M
n O
xide
44
153
334.
3%4.
3%5.
12%
5.12
%5
0.19
36.
4%6.
4%10
-19
25.0
%25
.0%
22.5
%22
.5%
PbA
sO1
11
11
1.1%
1.1%
0.09
%0.
09%
7.1
0.63
30.
5%0.
5%20
-49
13.0
%13
.0%
9.4%
9.4%
PbM
O1
12
22
1.1%
1.1%
0.17
%0.
17%
70.
455
0.7%
0.7%
50-9
93.
3%3.
3%40
.9%
40.9
%Ph
osph
ate
66
52
86.
5%6.
5%2.
43%
2.43
%5
0.03
70.
6%0.
6%10
0-14
90.
0%0.
0%0.
0%0.
0%Fe
Sul
fate
3030
92
3432
.6%
32.6
%22
.31%
22.3
1%3.
70.
0146
1.6%
1.6%
150-
199
0.0%
0.0%
0.0%
0.0%
200-
249
0.0%
0.0%
0.0%
0.0%
> 250
0.0%
0.0%
0.0%
0.0%
100%
99%
100%
100%
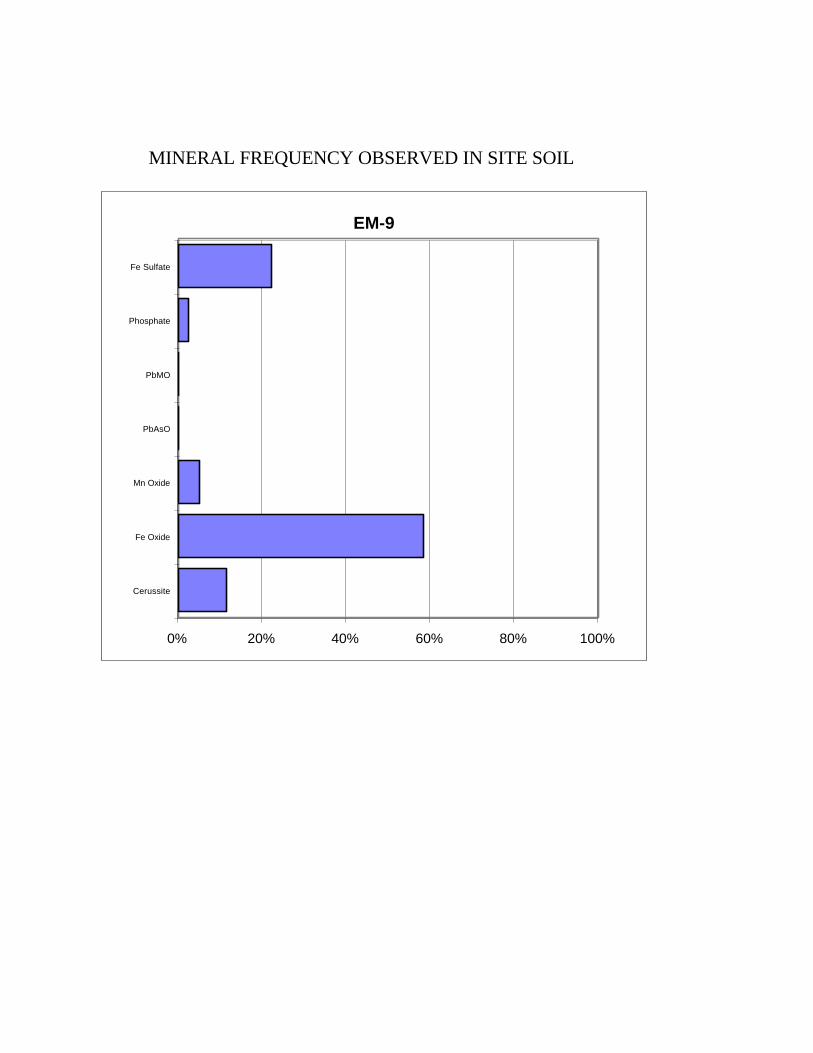
MINERAL FREQUENCY OBSERVED IN SITE SOIL
EM-9
0% 20% 40% 60% 80% 100%
Cerussite
Fe Oxide
Mn Oxide
PbAsO
PbMO
Phosphate
Fe Sulfate

FIGURE 1 PARTICLE SIZE DISTRIBUTION
EM-9
0%
10%
20%
30%
40%
50%
60%
<5 5-9 10-19 20-49 50-99 100-149 150-199 200-249 >250
Particle Size (um)
Fre
qu
ency
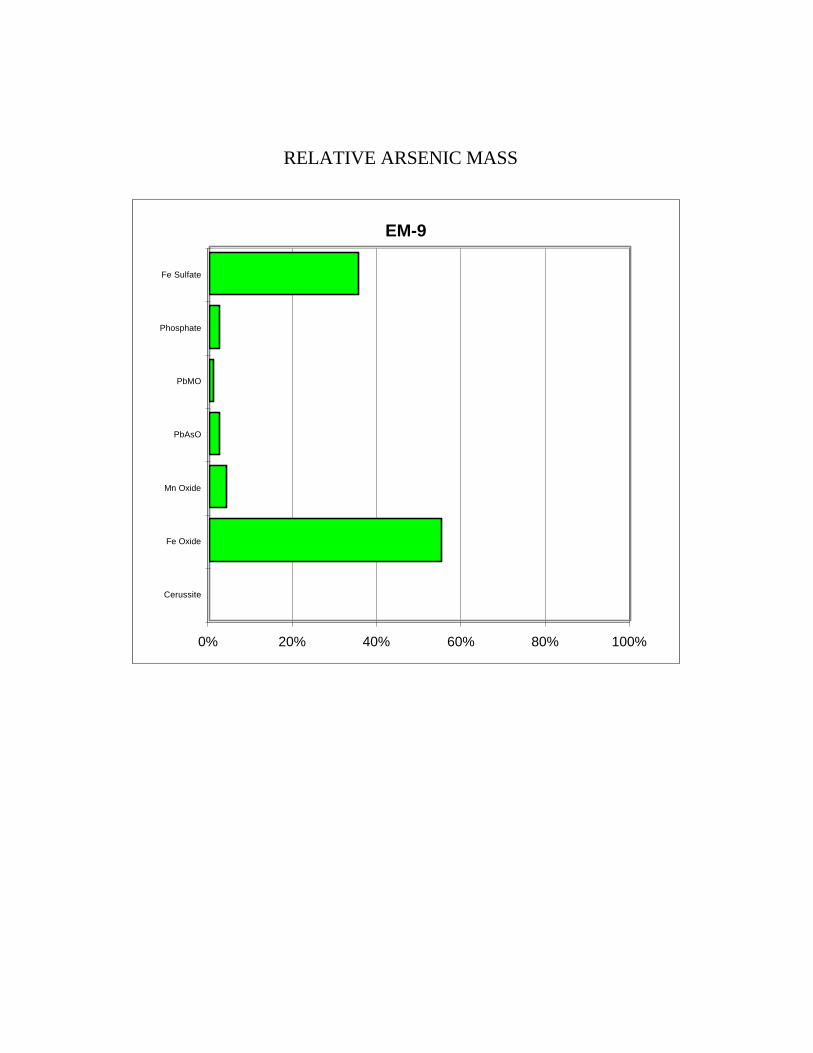
RELATIVE ARSENIC MASS
EM-9
0% 20% 40% 60% 80% 100%
Cerussite
Fe Oxide
Mn Oxide
PbAsO
PbMO
Phosphate
Fe Sulfate
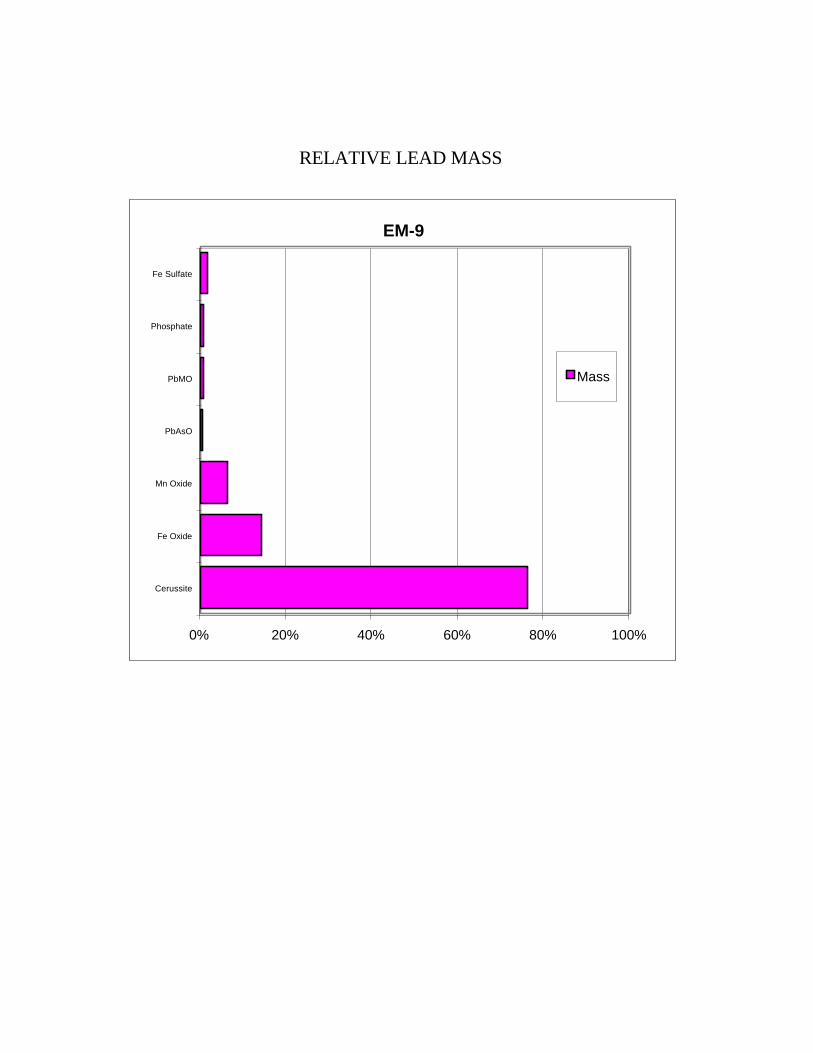
RELATIVE LEAD MASS
EM-9
0% 20% 40% 60% 80% 100%
Cerussite
Fe Oxide
Mn Oxide
PbAsO
PbMO
Phosphate
Fe Sulfate
Mass

Sum
mar
y
Ars
enic
Lead
Min
eral
Freq
Mas
sFr
eqM
ass
Size
Ars
enic
Lead
Ceru
ssite
11.5
%0.
00%
11.5
%76
.0%
<525
.0%
25.0
%Fe
Oxi
de58
.4%
55.0
2%58
.4%
14.2
%5-
933
.7%
33.7
%M
n O
xide
5.1%
4.00
%5.
1%6.
4%10
-19
25.0
%25
.0%
PbA
sO0.
1%2.
24%
0.1%
0.5%
20-4
913
.0%
13.0
%Pb
MO
0.2%
0.99
%0.
2%0.
7%50
-99
3.3%
3.3%
Phos
phat
e2.
4%2.
42%
2.4%
0.6%
100-
149
0.0%
0.0%
Fe S
ulfa
te22
.3%
35.3
3%22
.3%
1.6%
150-
199
0.0%
0.0%
200-
249
0.0%
0.0%
Tot
al10
0%10
0%10
0%10
0%>2
500.
0%0.
0%

SAMPLE ID EM-10
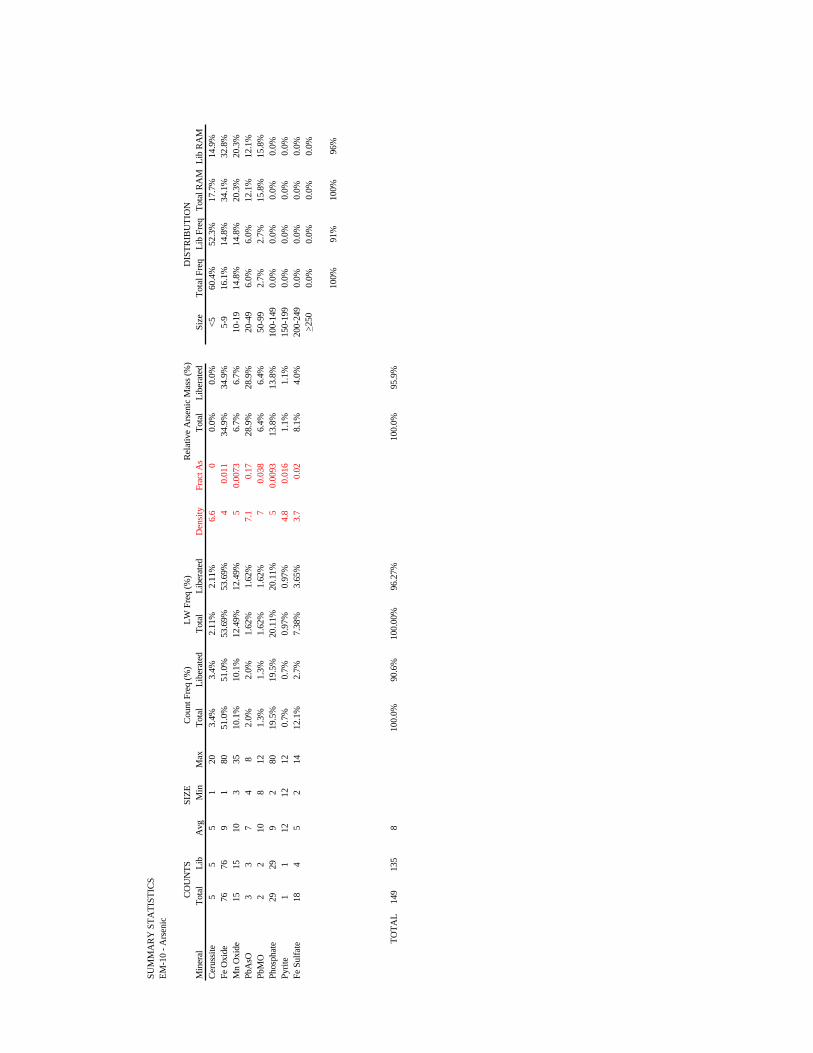
SUM
MA
RY
STA
TIST
ICS
EM-1
0 - A
rsen
ic
CO
UN
TSSI
ZEC
ount
Fre
q (%
)LW
Fre
q (%
)R
elat
ive
Ars
enic
Mas
s (%
)D
ISTR
IBU
TIO
NM
iner
alTo
tal
Lib
Avg
Min
Max
Tota
lLi
bera
ted
Tota
lLi
bera
ted
Den
sity
Frac
t As
Tota
lLi
bera
ted
Size
Tota
l Fre
qLi
b Fr
eqTo
tal R
AM
Lib
RAM
Cer
ussit
e5
55
120
3.4%
3.4%
2.11
%2.
11%
6.6
00.
0%0.
0%<5
60.4
%52
.3%
17.7
%14
.9%
Fe O
xide
7676
91
8051
.0%
51.0
%53
.69%
53.6
9%4
0.01
134
.9%
34.9
%5-
916
.1%
14.8
%34
.1%
32.8
%M
n O
xide
1515
103
3510
.1%
10.1
%12
.49%
12.4
9%5
0.00
736.
7%6.
7%10
-19
14.8
%14
.8%
20.3
%20
.3%
PbA
sO3
37
48
2.0%
2.0%
1.62
%1.
62%
7.1
0.17
28.9
%28
.9%
20-4
96.
0%6.
0%12
.1%
12.1
%Pb
MO
22
108
121.
3%1.
3%1.
62%
1.62
%7
0.03
86.
4%6.
4%50
-99
2.7%
2.7%
15.8
%15
.8%
Phos
phat
e29
299
280
19.5
%19
.5%
20.1
1%20
.11%
50.
0093
13.8
%13
.8%
100-
149
0.0%
0.0%
0.0%
0.0%
Pyrit
e1
112
1212
0.7%
0.7%
0.97
%0.
97%
4.8
0.01
61.
1%1.
1%15
0-19
90.
0%0.
0%0.
0%0.
0%Fe
Sul
fate
184
52
1412
.1%
2.7%
7.38
%3.
65%
3.7
0.02
8.1%
4.0%
200-
249
0.0%
0.0%
0.0%
0.0%
> 250
0.0%
0.0%
0.0%
0.0%
100%
91%
100%
96%
TOTA
L14
913
58
100.
0%90
.6%
100.
00%
96.2
7%10
0.0%
95.9
%

SUM
MA
RY
STA
TIST
ICS
EM-1
0 - L
ead
CO
UN
TSSI
ZEC
ount
Fre
q (%
)LW
Fre
q (%
)R
elat
ive
Lead
Mas
s (%
)D
ISTR
IBU
TIO
NM
iner
alTo
tal
Lib
Avg
Min
Max
Tota
lLi
bera
ted
Tota
lLi
bera
ted
Den
sity
Frac
t Pb
Tota
lLi
bera
ted
Size
Tota
l Fre
qLi
b Fr
eqTo
tal R
AM
Lib
RAM
Cer
ussit
e5
55
120
3.4%
3.4%
2.11
%2.
11%
6.6
0.77
621
.8%
21.8
%<5
60.4
%52
.3%
15.2
%14
.9%
Fe O
xide
7676
91
8051
.0%
51.0
%53
.69%
53.6
9%4
0.04
720
.4%
20.4
%5-
916
.1%
14.8
%24
.8%
24.6
%M
n O
xide
1515
103
3510
.1%
10.1
%12
.49%
12.4
9%5
0.19
324
.3%
24.3
%10
-19
14.8
%14
.8%
22.7
%22
.7%
PbA
sO3
37
48
2.0%
2.0%
1.62
%1.
62%
7.1
0.63
314
.7%
14.7
%20
-49
6.0%
6.0%
28.3
%28
.3%
PbM
O2
210
812
1.3%
1.3%
1.62
%1.
62%
70.
455
10.4
%10
.4%
50-9
92.
7%2.
7%9.
0%9.
0%Ph
osph
ate
2929
92
8019
.5%
19.5
%20
.11%
20.1
1%5
0.03
77.
5%7.
5%10
0-14
90.
0%0.
0%0.
0%0.
0%Py
rite
11
1212
120.
7%0.
7%0.
97%
0.97
%4.
80.
0000
70.
0%0.
0%15
0-19
90.
0%0.
0%0.
0%0.
0%Fe
Sul
fate
184
52
1412
.1%
2.7%
7.38
%3.
65%
3.7
0.01
460.
8%0.
4%20
0-24
90.
0%0.
0%0.
0%0.
0%> 2
500.
0%0.
0%0.
0%0.
0%
100%
91%
100%
100%
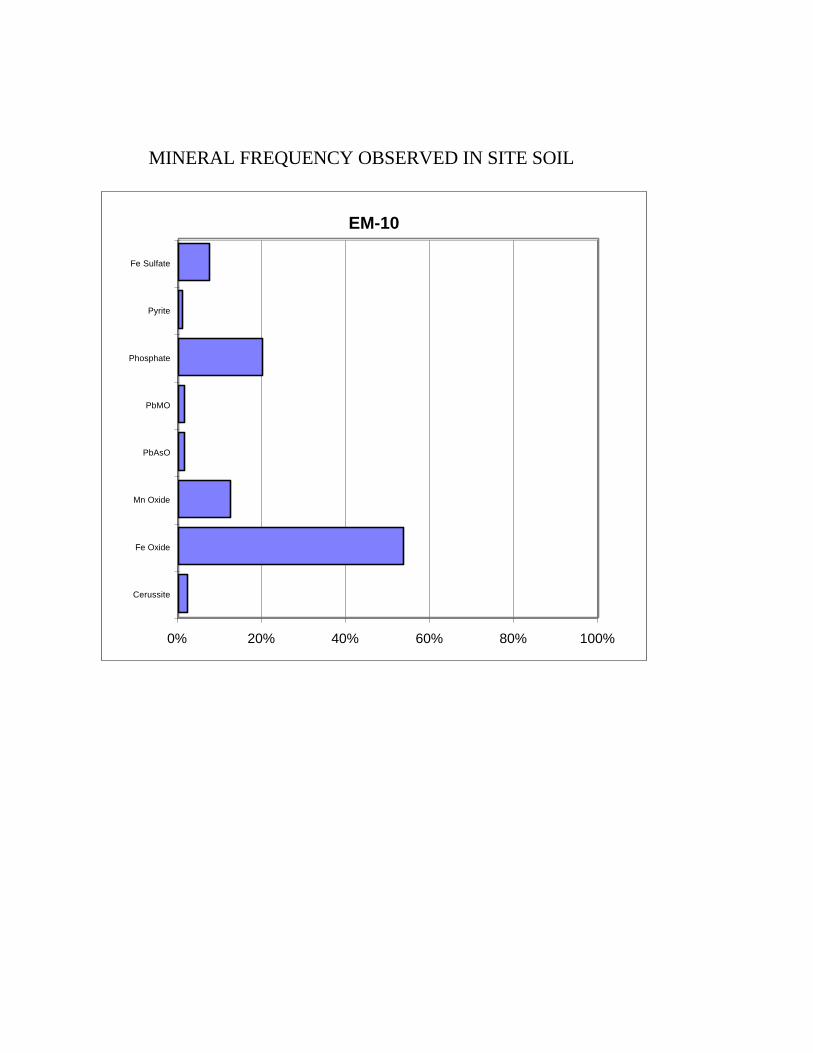
MINERAL FREQUENCY OBSERVED IN SITE SOIL
EM-10
0% 20% 40% 60% 80% 100%
Cerussite
Fe Oxide
Mn Oxide
PbAsO
PbMO
Phosphate
Pyrite
Fe Sulfate

FIGURE 1 PARTICLE SIZE DISTRIBUTION
EM-10
0%
10%
20%
30%
40%
50%
60%
<5 5-9 10-19 20-49 50-99 100-149 150-199 200-249 >250
Particle Size (um)
Fre
qu
ency
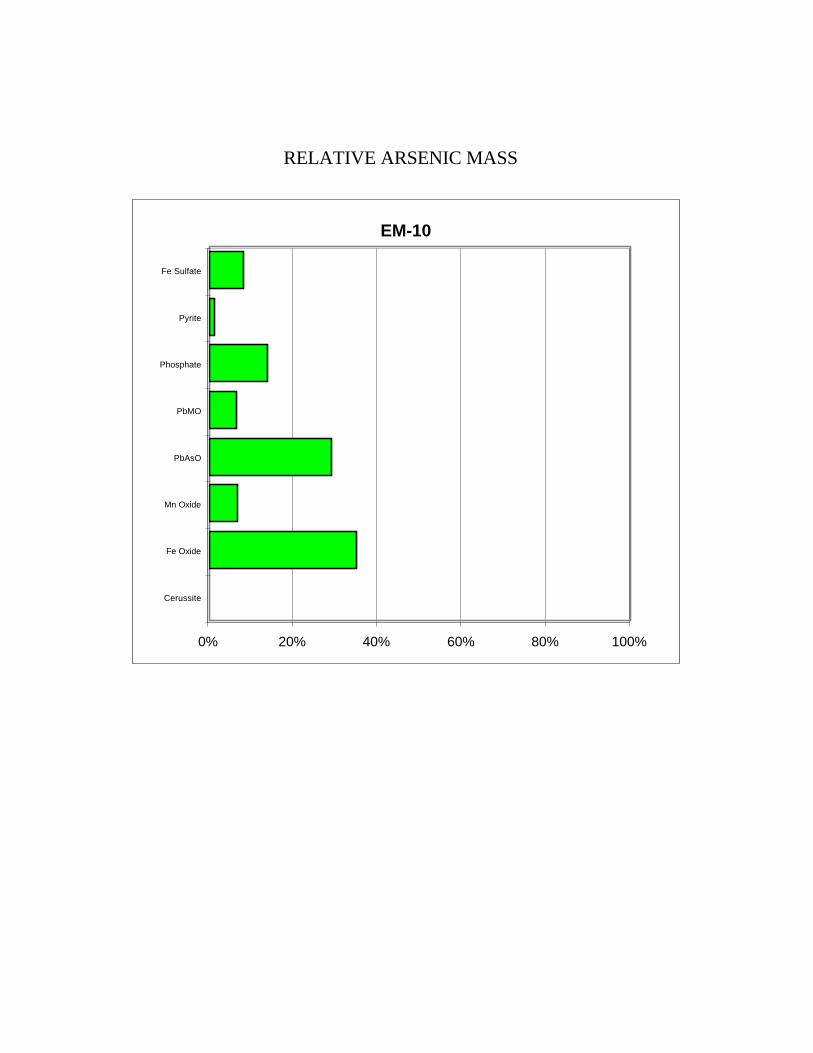
RELATIVE ARSENIC MASS
EM-10
0% 20% 40% 60% 80% 100%
Cerussite
Fe Oxide
Mn Oxide
PbAsO
PbMO
Phosphate
Pyrite
Fe Sulfate
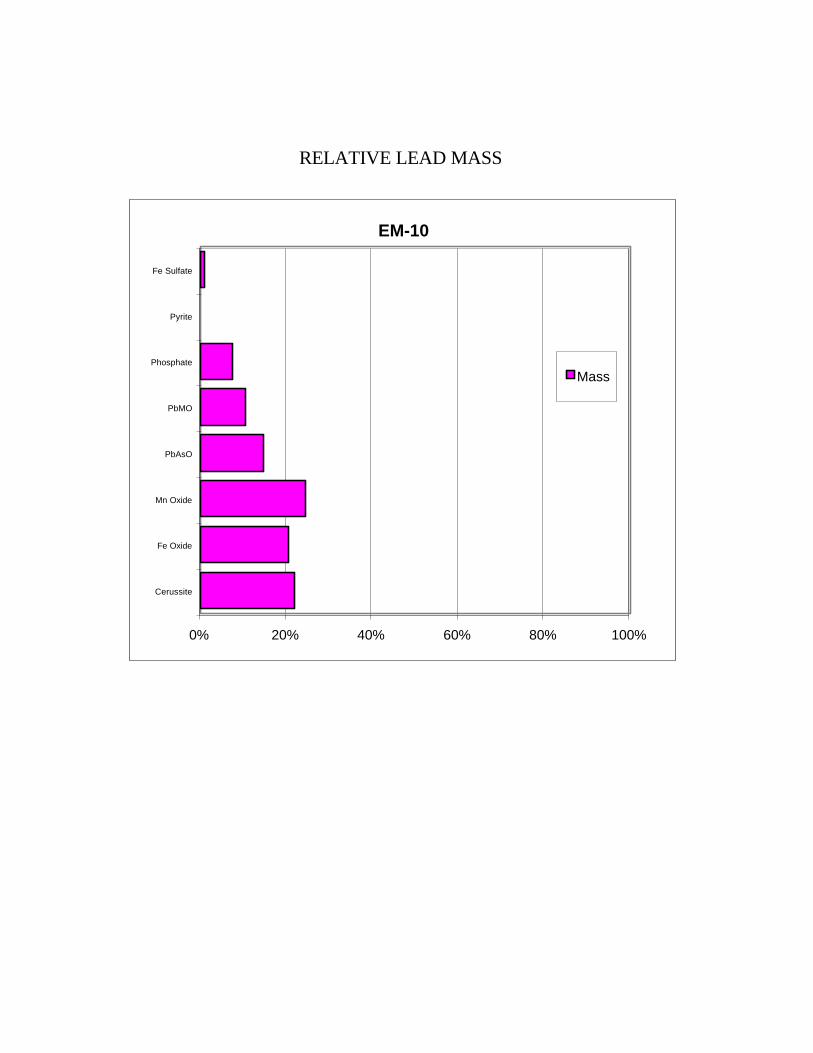
RELATIVE LEAD MASS
EM-10
0% 20% 40% 60% 80% 100%
Cerussite
Fe Oxide
Mn Oxide
PbAsO
PbMO
Phosphate
Pyrite
Fe Sulfate
Mass
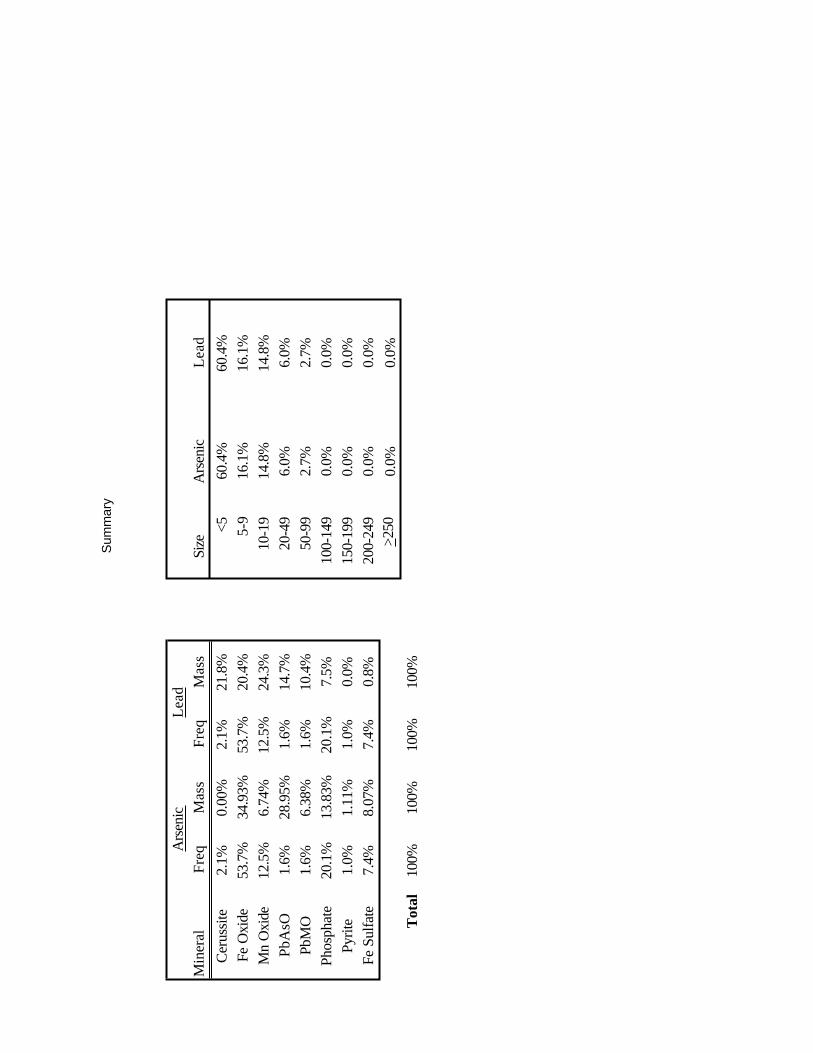
Sum
mar
y
Ars
enic
Lead
Min
eral
Freq
Mas
sFr
eqM
ass
Size
Ars
enic
Lead
Ceru
ssite
2.1%
0.00
%2.
1%21
.8%
<560
.4%
60.4
%Fe
Oxi
de53
.7%
34.9
3%53
.7%
20.4
%5-
916
.1%
16.1
%M
n O
xide
12.5
%6.
74%
12.5
%24
.3%
10-1
914
.8%
14.8
%Pb
AsO
1.6%
28.9
5%1.
6%14
.7%
20-4
96.
0%6.
0%Pb
MO
1.6%
6.38
%1.
6%10
.4%
50-9
92.
7%2.
7%Ph
osph
ate
20.1
%13
.83%
20.1
%7.
5%10
0-14
90.
0%0.
0%Py
rite
1.0%
1.11
%1.
0%0.
0%15
0-19
90.
0%0.
0%Fe
Sul
fate
7.4%
8.07
%7.
4%0.
8%20
0-24
90.
0%0.
0%> 2
500.
0%0.
0%T
otal
100%
100%
100%
100%

SAMPLE ID EM-11
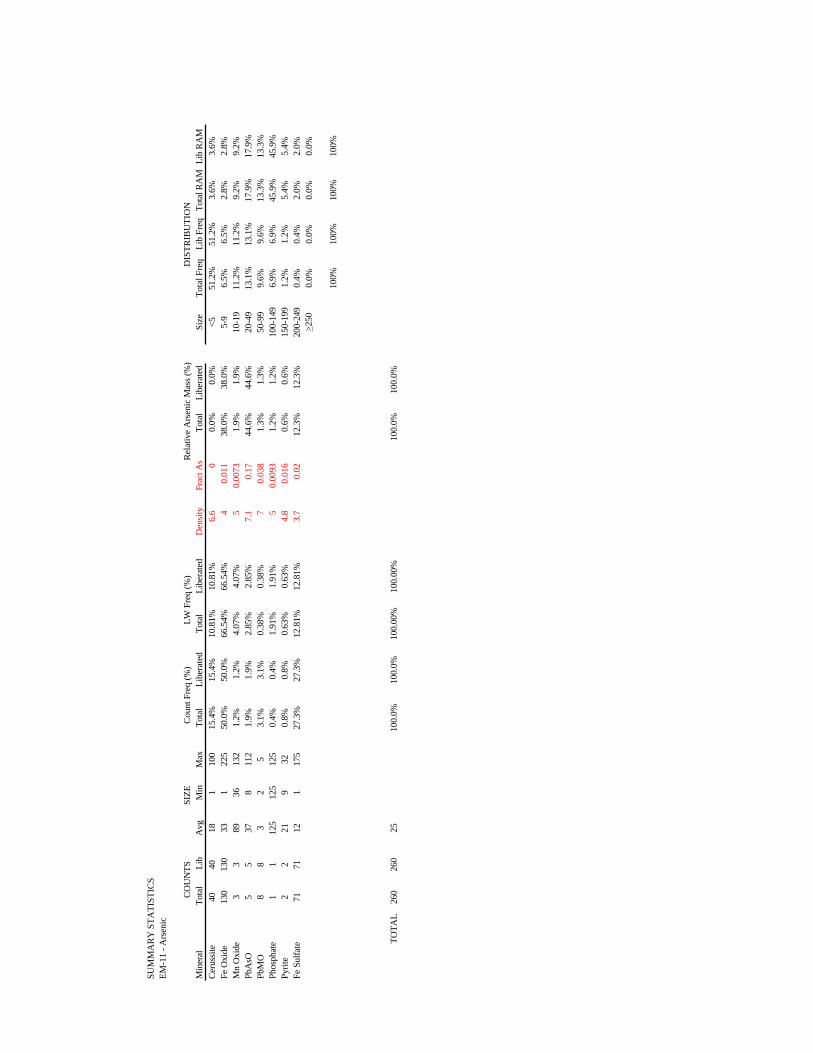
SUM
MA
RY
STA
TIST
ICS
EM-1
1 - A
rsen
ic
CO
UN
TSSI
ZEC
ount
Fre
q (%
)LW
Fre
q (%
)R
elat
ive
Ars
enic
Mas
s (%
)D
ISTR
IBU
TIO
NM
iner
alTo
tal
Lib
Avg
Min
Max
Tota
lLi
bera
ted
Tota
lLi
bera
ted
Den
sity
Frac
t As
Tota
lLi
bera
ted
Size
Tota
l Fre
qLi
b Fr
eqTo
tal R
AM
Lib
RAM
Cer
ussit
e40
4018
110
015
.4%
15.4
%10
.81%
10.8
1%6.
60
0.0%
0.0%
<551
.2%
51.2
%3.
6%3.
6%Fe
Oxi
de13
013
033
122
550
.0%
50.0
%66
.54%
66.5
4%4
0.01
138
.0%
38.0
%5-
96.
5%6.
5%2.
8%2.
8%M
n O
xide
33
8936
132
1.2%
1.2%
4.07
%4.
07%
50.
0073
1.9%
1.9%
10-1
911
.2%
11.2
%9.
2%9.
2%Pb
AsO
55
378
112
1.9%
1.9%
2.85
%2.
85%
7.1
0.17
44.6
%44
.6%
20-4
913
.1%
13.1
%17
.9%
17.9
%Pb
MO
88
32
53.
1%3.
1%0.
38%
0.38
%7
0.03
81.
3%1.
3%50
-99
9.6%
9.6%
13.3
%13
.3%
Phos
phat
e1
112
512
512
50.
4%0.
4%1.
91%
1.91
%5
0.00
931.
2%1.
2%10
0-14
96.
9%6.
9%45
.9%
45.9
%Py
rite
22
219
320.
8%0.
8%0.
63%
0.63
%4.
80.
016
0.6%
0.6%
150-
199
1.2%
1.2%
5.4%
5.4%
Fe S
ulfa
te71
7112
117
527
.3%
27.3
%12
.81%
12.8
1%3.
70.
0212
.3%
12.3
%20
0-24
90.
4%0.
4%2.
0%2.
0%> 2
500.
0%0.
0%0.
0%0.
0%
100%
100%
100%
100%
TOTA
L26
026
025
100.
0%10
0.0%
100.
00%
100.
00%
100.
0%10
0.0%
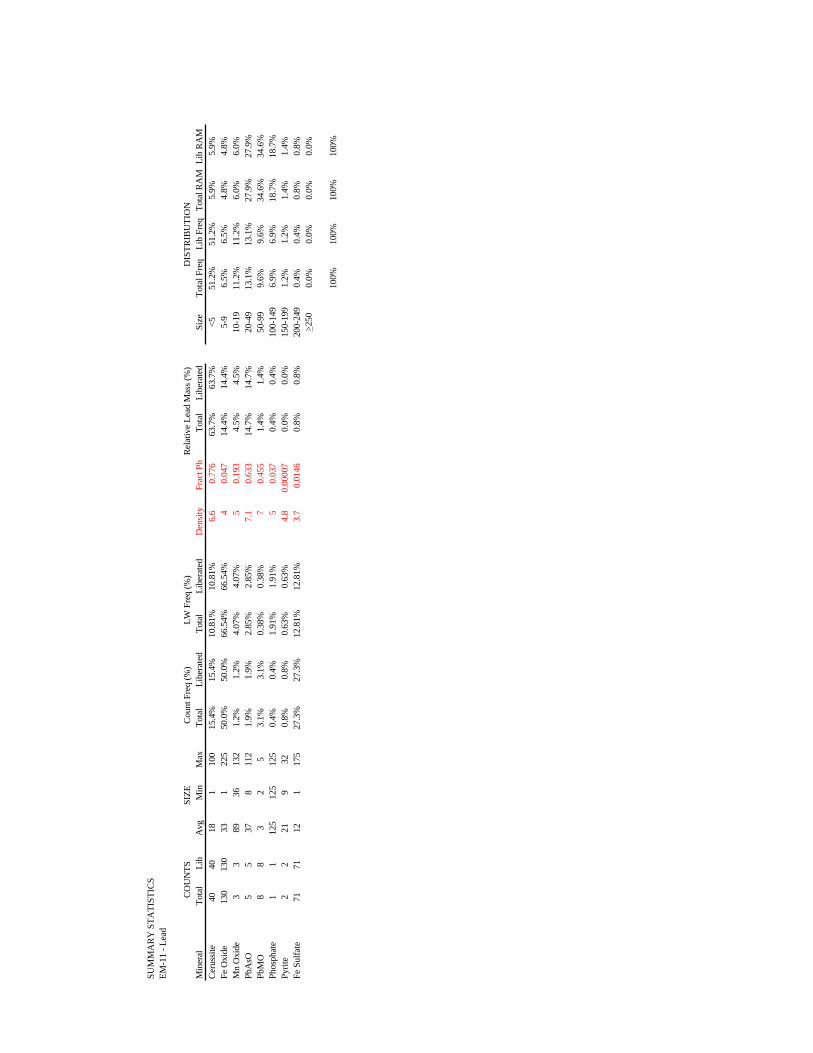
SUM
MA
RY
STA
TIST
ICS
EM-1
1 - L
ead
CO
UN
TSSI
ZEC
ount
Fre
q (%
)LW
Fre
q (%
)R
elat
ive
Lead
Mas
s (%
)D
ISTR
IBU
TIO
NM
iner
alTo
tal
Lib
Avg
Min
Max
Tota
lLi
bera
ted
Tota
lLi
bera
ted
Den
sity
Frac
t Pb
Tota
lLi
bera
ted
Size
Tota
l Fre
qLi
b Fr
eqTo
tal R
AM
Lib
RAM
Cer
ussit
e40
4018
110
015
.4%
15.4
%10
.81%
10.8
1%6.
60.
776
63.7
%63
.7%
<551
.2%
51.2
%5.
9%5.
9%Fe
Oxi
de13
013
033
122
550
.0%
50.0
%66
.54%
66.5
4%4
0.04
714
.4%
14.4
%5-
96.
5%6.
5%4.
8%4.
8%M
n O
xide
33
8936
132
1.2%
1.2%
4.07
%4.
07%
50.
193
4.5%
4.5%
10-1
911
.2%
11.2
%6.
0%6.
0%Pb
AsO
55
378
112
1.9%
1.9%
2.85
%2.
85%
7.1
0.63
314
.7%
14.7
%20
-49
13.1
%13
.1%
27.9
%27
.9%
PbM
O8
83
25
3.1%
3.1%
0.38
%0.
38%
70.
455
1.4%
1.4%
50-9
99.
6%9.
6%34
.6%
34.6
%Ph
osph
ate
11
125
125
125
0.4%
0.4%
1.91
%1.
91%
50.
037
0.4%
0.4%
100-
149
6.9%
6.9%
18.7
%18
.7%
Pyrit
e2
221
932
0.8%
0.8%
0.63
%0.
63%
4.8
0.00
007
0.0%
0.0%
150-
199
1.2%
1.2%
1.4%
1.4%
Fe S
ulfa
te71
7112
117
527
.3%
27.3
%12
.81%
12.8
1%3.
70.
0146
0.8%
0.8%
200-
249
0.4%
0.4%
0.8%
0.8%
> 250
0.0%
0.0%
0.0%
0.0%
100%
100%
100%
100%
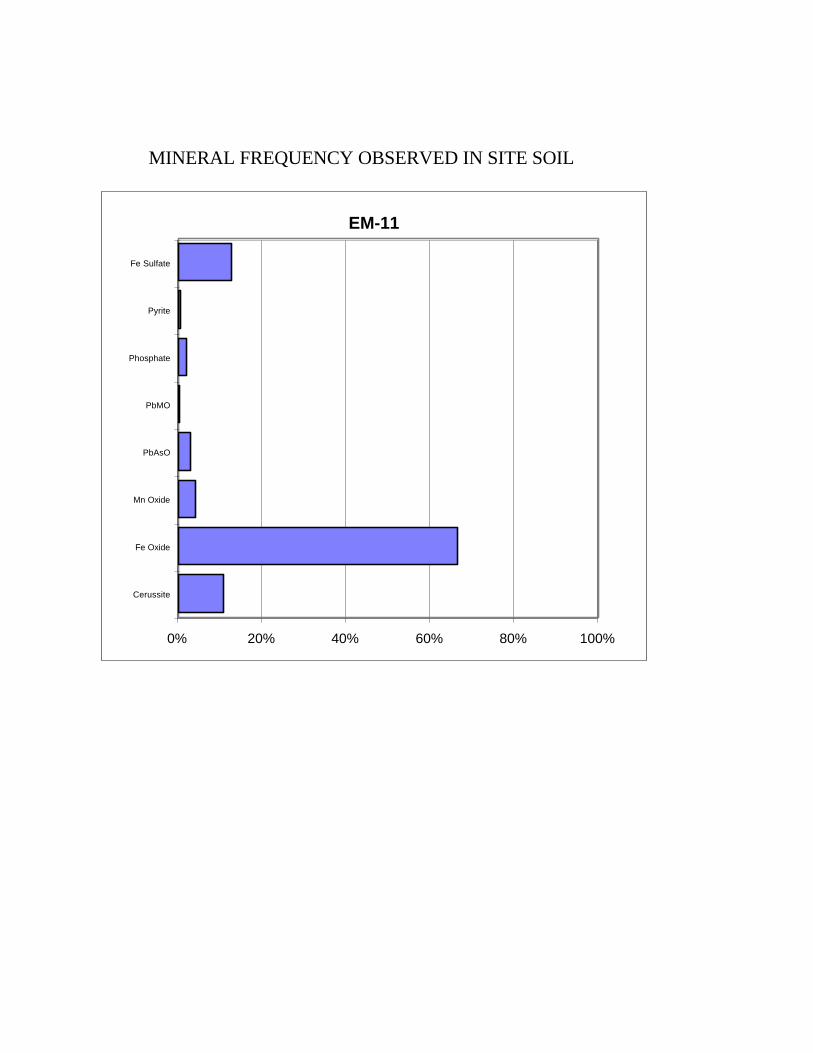
MINERAL FREQUENCY OBSERVED IN SITE SOIL
EM-11
0% 20% 40% 60% 80% 100%
Cerussite
Fe Oxide
Mn Oxide
PbAsO
PbMO
Phosphate
Pyrite
Fe Sulfate

FIGURE 1 PARTICLE SIZE DISTRIBUTION
EM-11
0%
10%
20%
30%
40%
50%
60%
<5 5-9 10-19 20-49 50-99 100-149 150-199 200-249 >250
Particle Size (um)
Fre
qu
ency
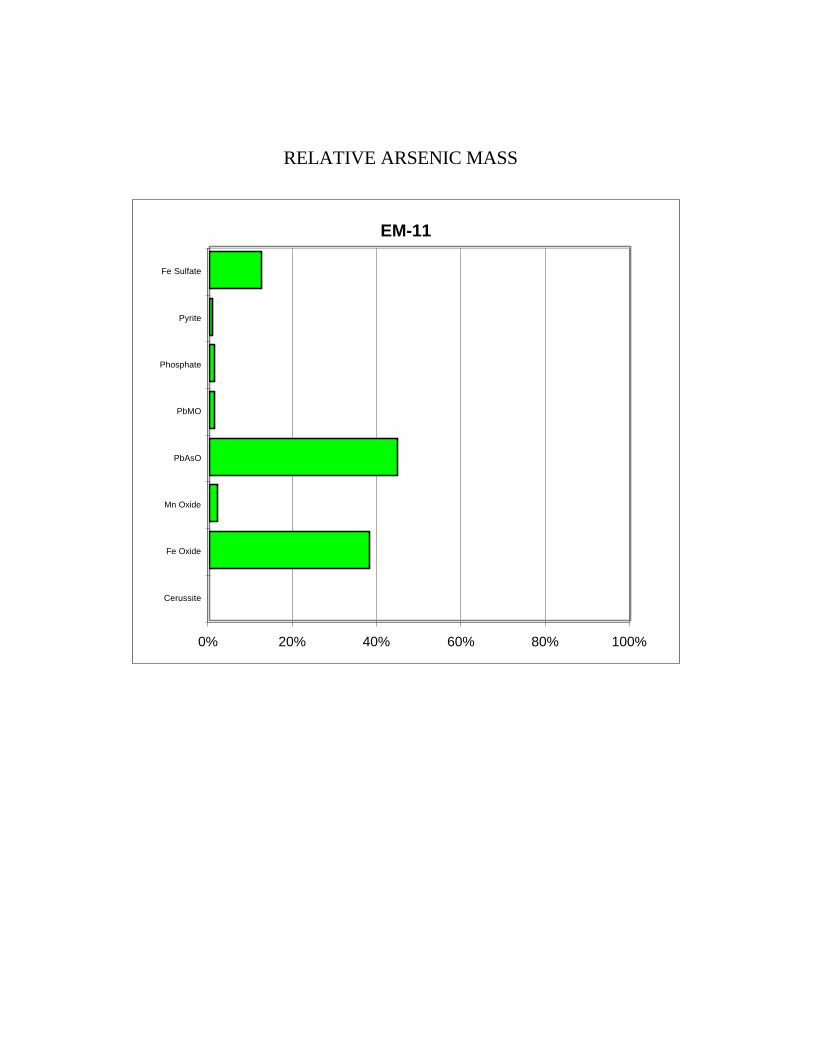
RELATIVE ARSENIC MASS
EM-11
0% 20% 40% 60% 80% 100%
Cerussite
Fe Oxide
Mn Oxide
PbAsO
PbMO
Phosphate
Pyrite
Fe Sulfate
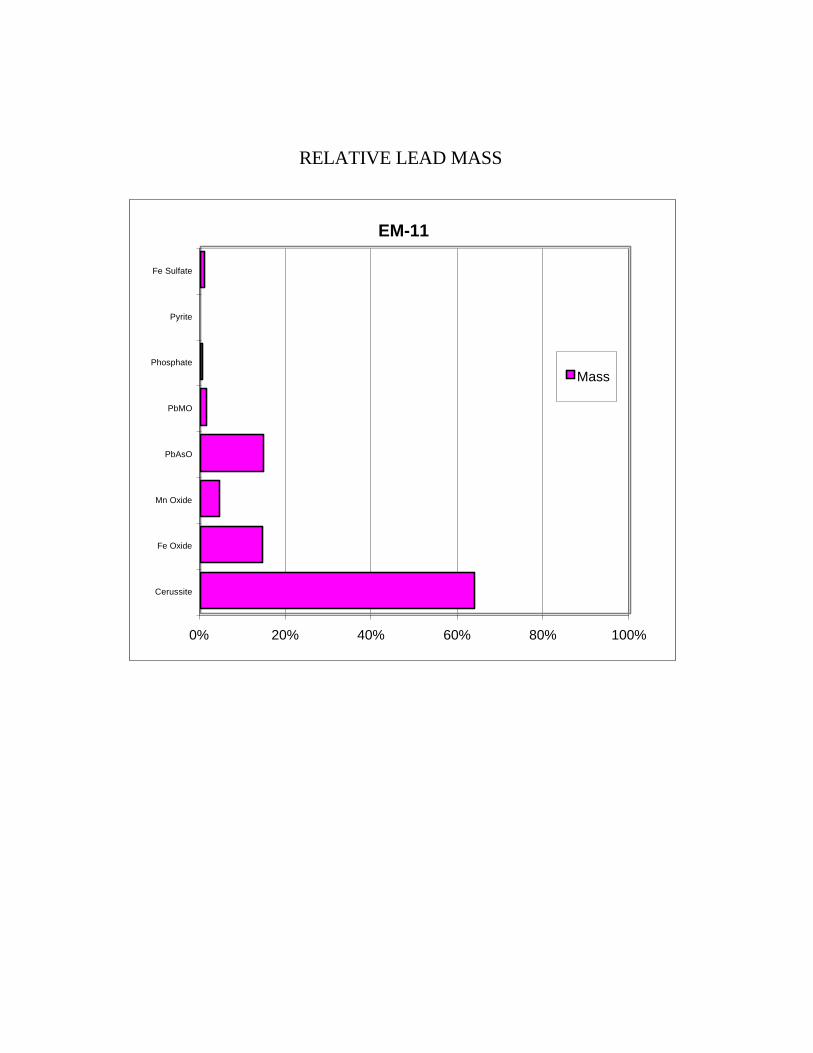
RELATIVE LEAD MASS
EM-11
0% 20% 40% 60% 80% 100%
Cerussite
Fe Oxide
Mn Oxide
PbAsO
PbMO
Phosphate
Pyrite
Fe Sulfate
Mass
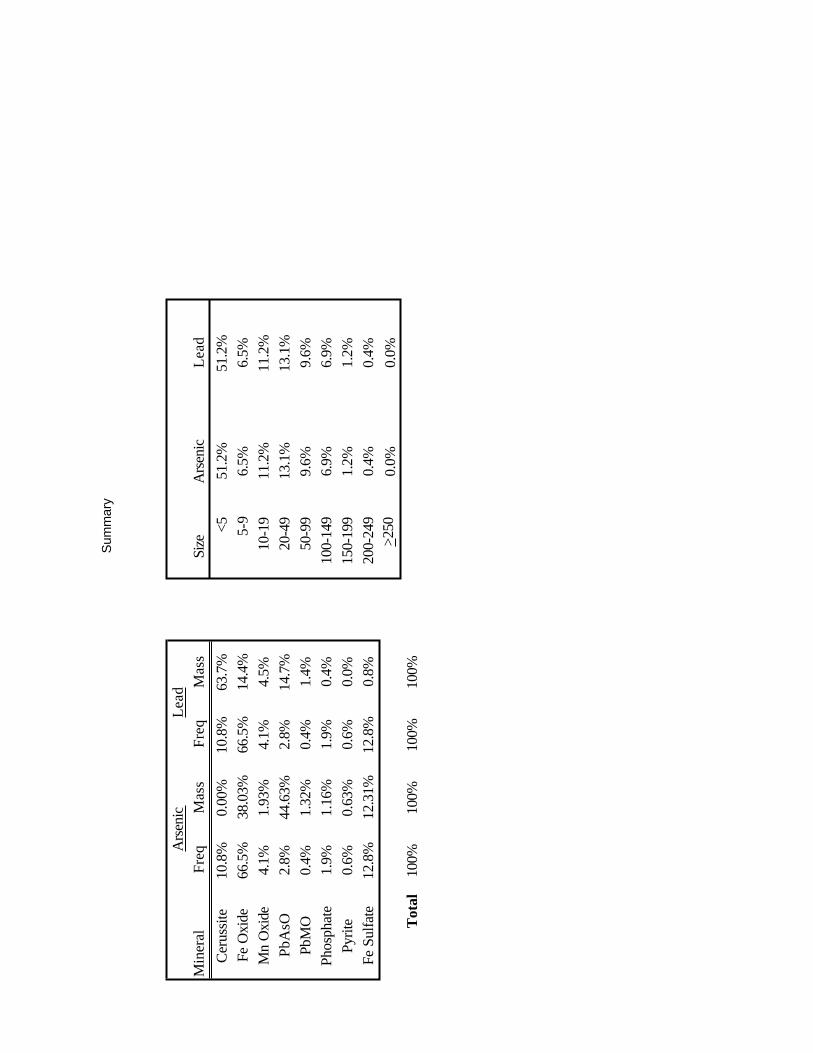
Sum
mar
y
Ars
enic
Lead
Min
eral
Freq
Mas
sFr
eqM
ass
Size
Ars
enic
Lead
Ceru
ssite
10.8
%0.
00%
10.8
%63
.7%
<551
.2%
51.2
%Fe
Oxi
de66
.5%
38.0
3%66
.5%
14.4
%5-
96.
5%6.
5%M
n O
xide
4.1%
1.93
%4.
1%4.
5%10
-19
11.2
%11
.2%
PbA
sO2.
8%44
.63%
2.8%
14.7
%20
-49
13.1
%13
.1%
PbM
O0.
4%1.
32%
0.4%
1.4%
50-9
99.
6%9.
6%Ph
osph
ate
1.9%
1.16
%1.
9%0.
4%10
0-14
96.
9%6.
9%Py
rite
0.6%
0.63
%0.
6%0.
0%15
0-19
91.
2%1.
2%Fe
Sul
fate
12.8
%12
.31%
12.8
%0.
8%20
0-24
90.
4%0.
4%> 2
500.
0%0.
0%T
otal
100%
100%
100%
100%

SAMPLE ID EM-12
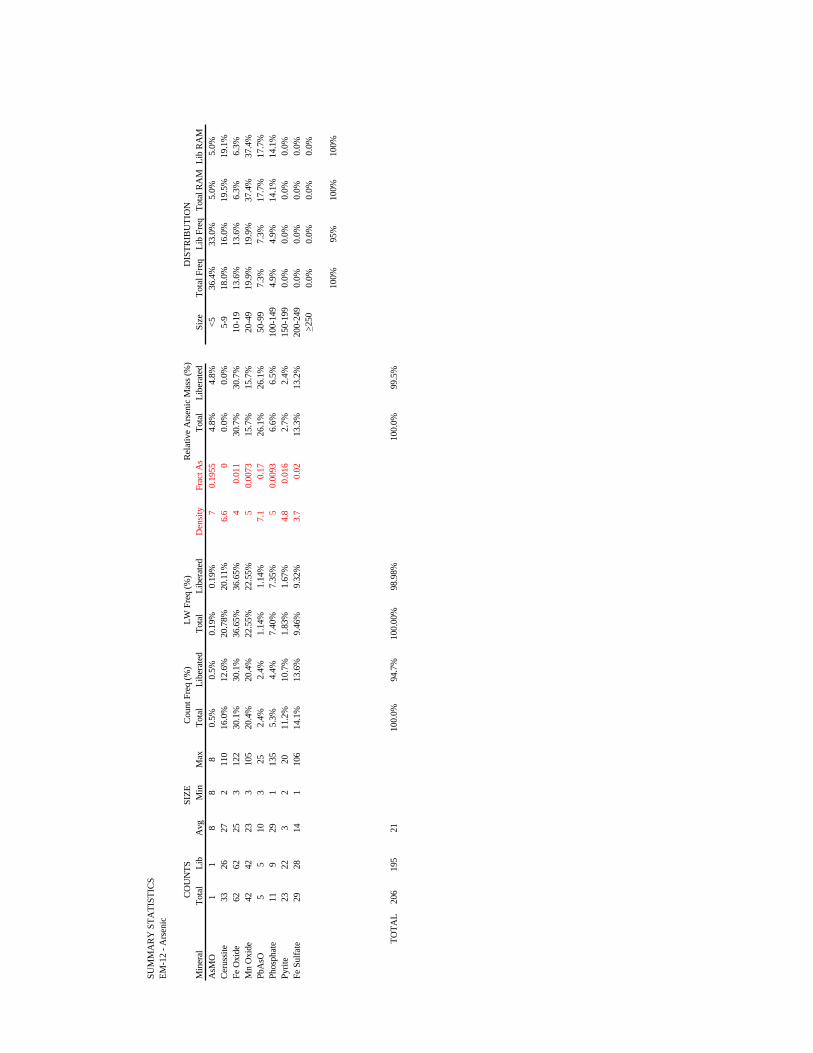
SUM
MA
RY
STA
TIST
ICS
EM-1
2 - A
rsen
ic
CO
UN
TSSI
ZEC
ount
Fre
q (%
)LW
Fre
q (%
)R
elat
ive
Ars
enic
Mas
s (%
)D
ISTR
IBU
TIO
NM
iner
alTo
tal
Lib
Avg
Min
Max
Tota
lLi
bera
ted
Tota
lLi
bera
ted
Den
sity
Frac
t As
Tota
lLi
bera
ted
Size
Tota
l Fre
qLi
b Fr
eqTo
tal R
AM
Lib
RAM
AsM
O1
18
88
0.5%
0.5%
0.19
%0.
19%
70.
1955
4.8%
4.8%
<536
.4%
33.0
%5.
0%5.
0%C
erus
site
3326
272
110
16.0
%12
.6%
20.7
8%20
.11%
6.6
00.
0%0.
0%5-
918
.0%
16.0
%19
.5%
19.1
%Fe
Oxi
de62
6225
312
230
.1%
30.1
%36
.65%
36.6
5%4
0.01
130
.7%
30.7
%10
-19
13.6
%13
.6%
6.3%
6.3%
Mn
Oxi
de42
4223
310
520
.4%
20.4
%22
.55%
22.5
5%5
0.00
7315
.7%
15.7
%20
-49
19.9
%19
.9%
37.4
%37
.4%
PbA
sO5
510
325
2.4%
2.4%
1.14
%1.
14%
7.1
0.17
26.1
%26
.1%
50-9
97.
3%7.
3%17
.7%
17.7
%Ph
osph
ate
119
291
135
5.3%
4.4%
7.40
%7.
35%
50.
0093
6.6%
6.5%
100-
149
4.9%
4.9%
14.1
%14
.1%
Pyrit
e23
223
220
11.2
%10
.7%
1.83
%1.
67%
4.8
0.01
62.
7%2.
4%15
0-19
90.
0%0.
0%0.
0%0.
0%Fe
Sul
fate
2928
141
106
14.1
%13
.6%
9.46
%9.
32%
3.7
0.02
13.3
%13
.2%
200-
249
0.0%
0.0%
0.0%
0.0%
> 250
0.0%
0.0%
0.0%
0.0%
100%
95%
100%
100%
TOTA
L20
619
521
100.
0%94
.7%
100.
00%
98.9
8%10
0.0%
99.5
%

SUM
MA
RY
STA
TIST
ICS
EM-1
2 - L
ead
CO
UN
TSSI
ZEC
ount
Fre
q (%
)LW
Fre
q (%
)R
elat
ive
Lead
Mas
s (%
)D
ISTR
IBU
TIO
NM
iner
alTo
tal
Lib
Avg
Min
Max
Tota
lLi
bera
ted
Tota
lLi
bera
ted
Den
sity
Frac
t Pb
Tota
lLi
bera
ted
Size
Tota
l Fre
qLi
b Fr
eqTo
tal R
AM
Lib
RAM
AsM
O1
18
88
0.5%
0.5%
0.19
%0.
19%
70.
30.
3%0.
3%<5
36.4
%33
.0%
3.1%
1.8%
Cer
ussit
e33
2627
211
016
.0%
12.6
%20
.78%
20.1
1%6.
60.
776
74.7
%72
.3%
5-9
18.0
%16
.0%
7.9%
6.8%
Fe O
xide
6262
253
122
30.1
%30
.1%
36.6
5%36
.65%
40.
047
4.8%
4.8%
10-1
913
.6%
13.6
%5.
9%5.
9%M
n O
xide
4242
233
105
20.4
%20
.4%
22.5
5%22
.55%
50.
193
15.3
%15
.3%
20-4
919
.9%
19.9
%18
.3%
18.3
%Pb
AsO
55
103
252.
4%2.
4%1.
14%
1.14
%7.
10.
633
3.6%
3.6%
50-9
97.
3%7.
3%25
.6%
25.6
%Ph
osph
ate
119
291
135
5.3%
4.4%
7.40
%7.
35%
50.
037
1.0%
1.0%
100-
149
4.9%
4.9%
39.2
%39
.2%
Pyrit
e23
223
220
11.2
%10
.7%
1.83
%1.
67%
4.8
0.00
007
0.0%
0.0%
150-
199
0.0%
0.0%
0.0%
0.0%
Fe S
ulfa
te29
2814
110
614
.1%
13.6
%9.
46%
9.32
%3.
70.
0146
0.4%
0.4%
200-
249
0.0%
0.0%
0.0%
0.0%
> 250
0.0%
0.0%
0.0%
0.0%
100%
95%
100%
98%
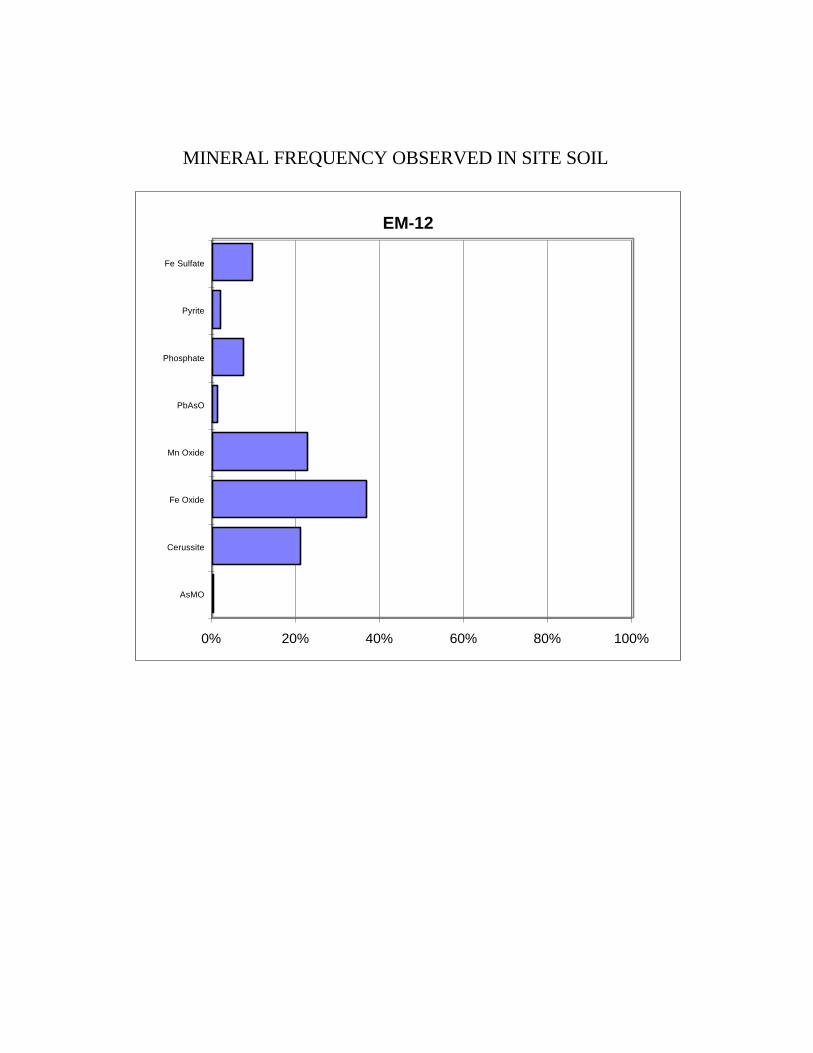
MINERAL FREQUENCY OBSERVED IN SITE SOIL
EM-12
0% 20% 40% 60% 80% 100%
AsMO
Cerussite
Fe Oxide
Mn Oxide
PbAsO
Phosphate
Pyrite
Fe Sulfate

FIGURE 1 PARTICLE SIZE DISTRIBUTION
EM-12
0%
10%
20%
30%
40%
50%
60%
<5 5-9 10-19 20-49 50-99 100-149 150-199 200-249 >250
Particle Size (um)
Fre
qu
ency

RELATIVE ARSENIC MASS
EM-12
0% 20% 40% 60% 80% 100%
AsMO
Cerussite
Fe Oxide
Mn Oxide
PbAsO
Phosphate
Pyrite
Fe Sulfate
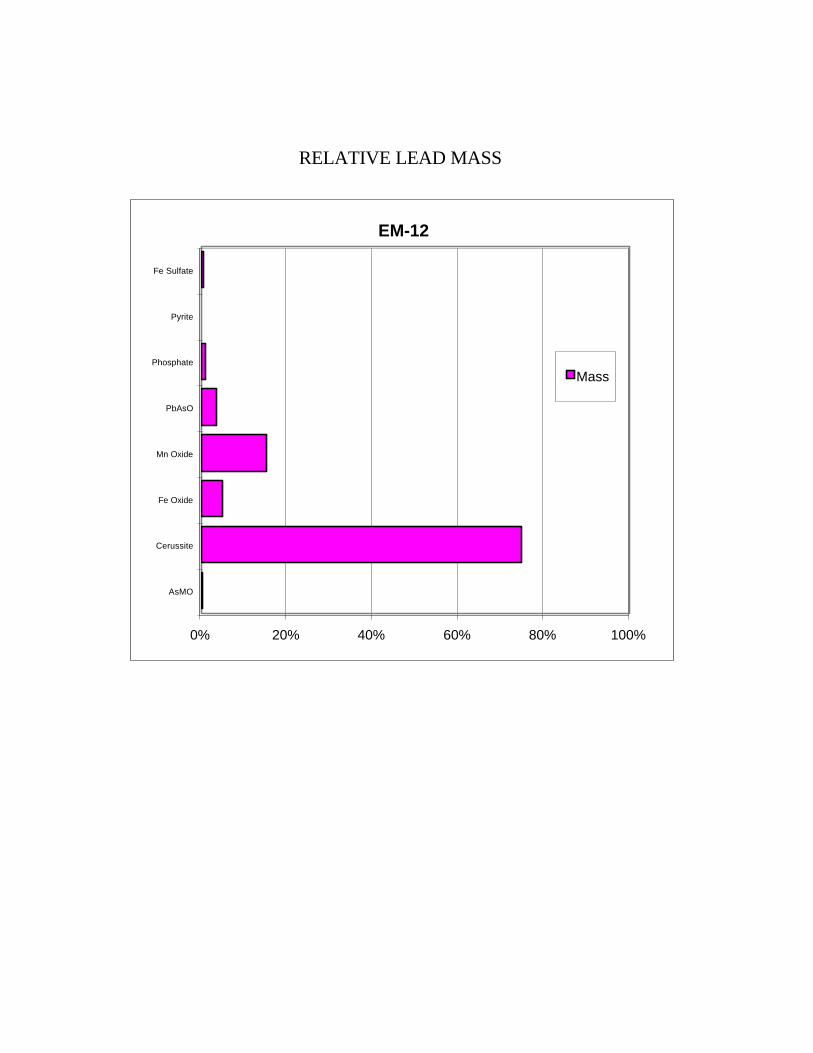
RELATIVE LEAD MASS
EM-12
0% 20% 40% 60% 80% 100%
AsMO
Cerussite
Fe Oxide
Mn Oxide
PbAsO
Phosphate
Pyrite
Fe Sulfate
Mass
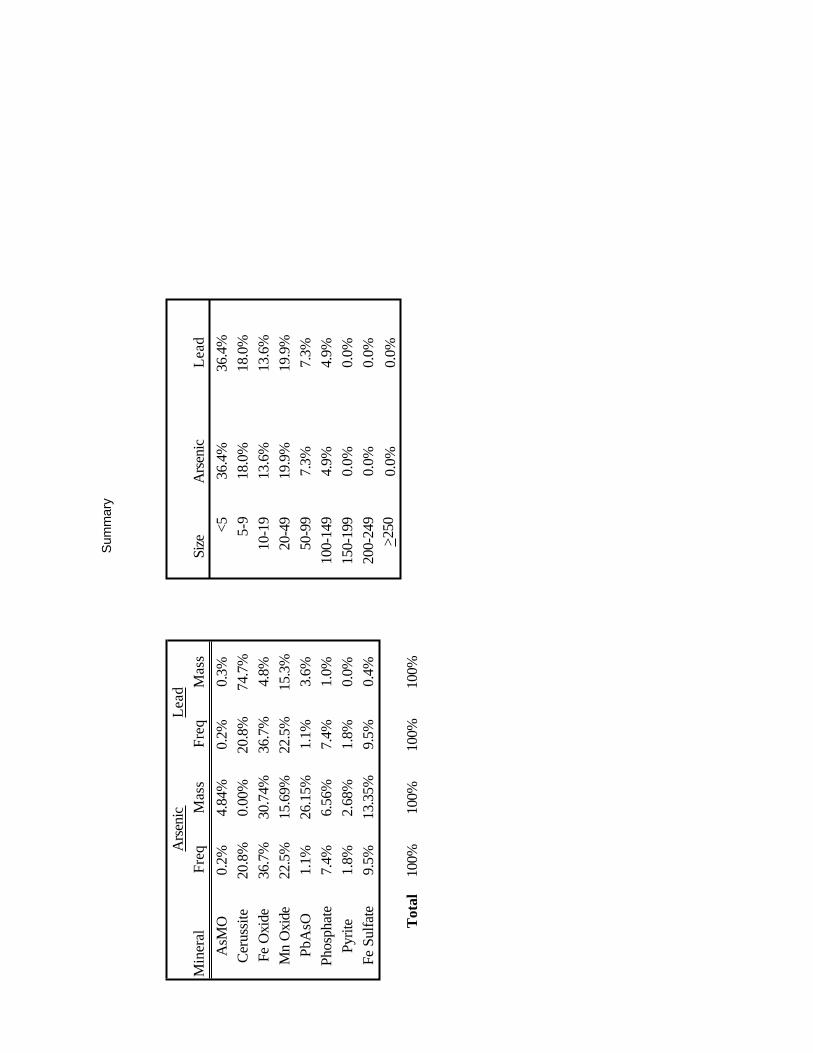
Sum
mar
y
Ars
enic
Lead
Min
eral
Freq
Mas
sFr
eqM
ass
Size
Ars
enic
Lead
AsM
O0.
2%4.
84%
0.2%
0.3%
<536
.4%
36.4
%Ce
russ
ite20
.8%
0.00
%20
.8%
74.7
%5-
918
.0%
18.0
%Fe
Oxi
de36
.7%
30.7
4%36
.7%
4.8%
10-1
913
.6%
13.6
%M
n O
xide
22.5
%15
.69%
22.5
%15
.3%
20-4
919
.9%
19.9
%Pb
AsO
1.1%
26.1
5%1.
1%3.
6%50
-99
7.3%
7.3%
Phos
phat
e7.
4%6.
56%
7.4%
1.0%
100-
149
4.9%
4.9%
Pyrit
e1.
8%2.
68%
1.8%
0.0%
150-
199
0.0%
0.0%
Fe S
ulfa
te9.
5%13
.35%
9.5%
0.4%
200-
249
0.0%
0.0%
> 250
0.0%
0.0%
Tot
al10
0%10
0%10
0%10
0%

SAMPLE ID EM-13
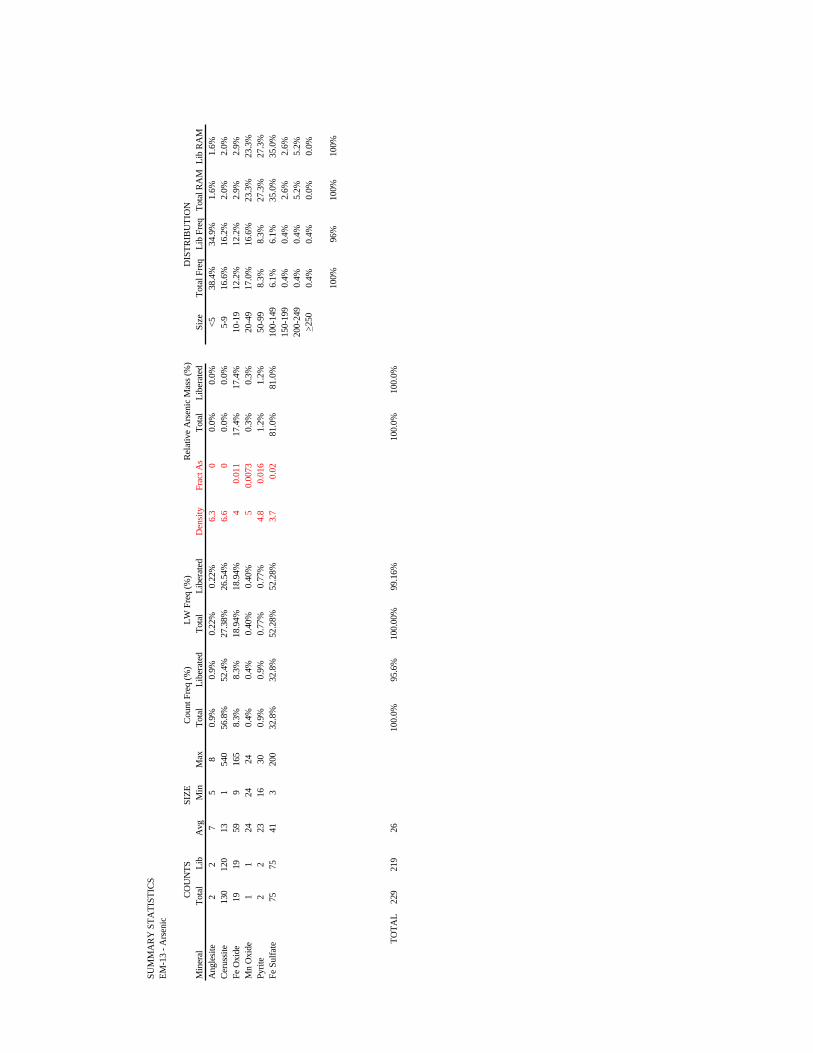
SUM
MA
RY
STA
TIST
ICS
EM-1
3 - A
rsen
ic
CO
UN
TSSI
ZEC
ount
Fre
q (%
)LW
Fre
q (%
)R
elat
ive
Ars
enic
Mas
s (%
)D
ISTR
IBU
TIO
NM
iner
alTo
tal
Lib
Avg
Min
Max
Tota
lLi
bera
ted
Tota
lLi
bera
ted
Den
sity
Frac
t As
Tota
lLi
bera
ted
Size
Tota
l Fre
qLi
b Fr
eqTo
tal R
AM
Lib
RAM
Ang
lesit
e2
27
58
0.9%
0.9%
0.22
%0.
22%
6.3
00.
0%0.
0%<5
38.4
%34
.9%
1.6%
1.6%
Cer
ussit
e13
012
013
154
056
.8%
52.4
%27
.38%
26.5
4%6.
60
0.0%
0.0%
5-9
16.6
%16
.2%
2.0%
2.0%
Fe O
xide
1919
599
165
8.3%
8.3%
18.9
4%18
.94%
40.
011
17.4
%17
.4%
10-1
912
.2%
12.2
%2.
9%2.
9%M
n O
xide
11
2424
240.
4%0.
4%0.
40%
0.40
%5
0.00
730.
3%0.
3%20
-49
17.0
%16
.6%
23.3
%23
.3%
Pyrit
e2
223
1630
0.9%
0.9%
0.77
%0.
77%
4.8
0.01
61.
2%1.
2%50
-99
8.3%
8.3%
27.3
%27
.3%
Fe S
ulfa
te75
7541
320
032
.8%
32.8
%52
.28%
52.2
8%3.
70.
0281
.0%
81.0
%10
0-14
96.
1%6.
1%35
.0%
35.0
%15
0-19
90.
4%0.
4%2.
6%2.
6%20
0-24
90.
4%0.
4%5.
2%5.
2%> 2
500.
4%0.
4%0.
0%0.
0%
100%
96%
100%
100%
TOTA
L22
921
926
100.
0%95
.6%
100.
00%
99.1
6%10
0.0%
100.
0%
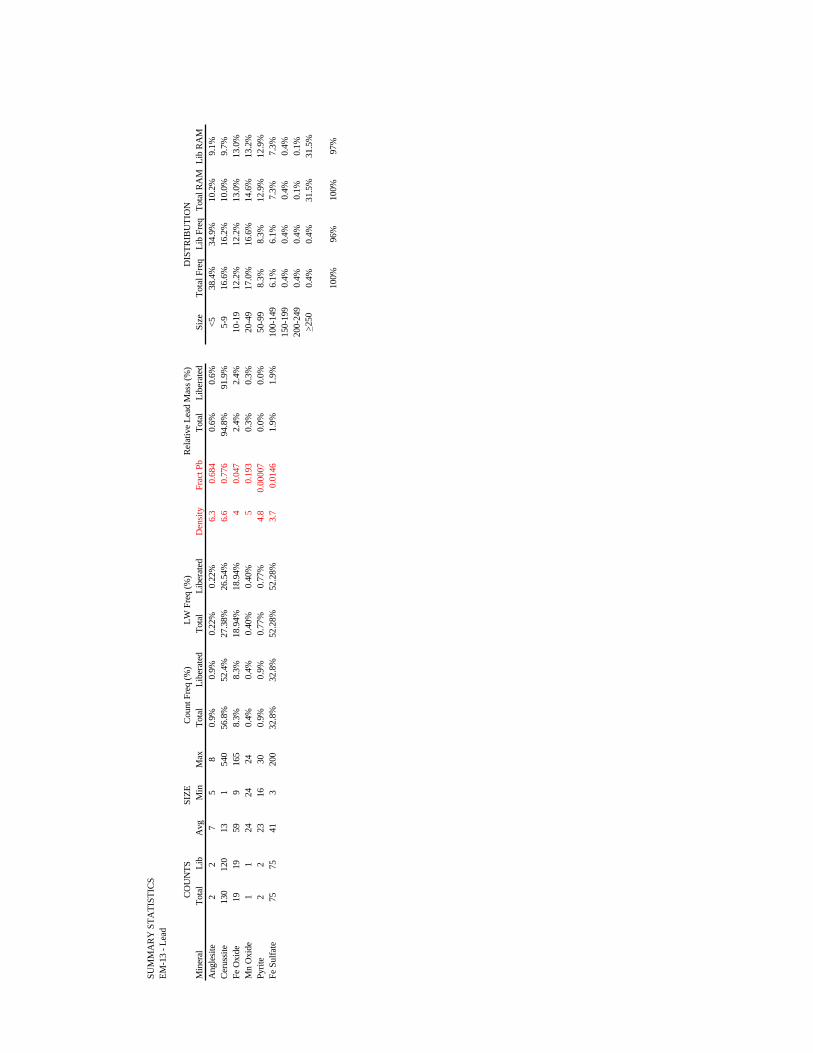
SUM
MA
RY
STA
TIST
ICS
EM-1
3 - L
ead
CO
UN
TSSI
ZEC
ount
Fre
q (%
)LW
Fre
q (%
)R
elat
ive
Lead
Mas
s (%
)D
ISTR
IBU
TIO
NM
iner
alTo
tal
Lib
Avg
Min
Max
Tota
lLi
bera
ted
Tota
lLi
bera
ted
Den
sity
Frac
t Pb
Tota
lLi
bera
ted
Size
Tota
l Fre
qLi
b Fr
eqTo
tal R
AM
Lib
RAM
Ang
lesit
e2
27
58
0.9%
0.9%
0.22
%0.
22%
6.3
0.68
40.
6%0.
6%<5
38.4
%34
.9%
10.2
%9.
1%C
erus
site
130
120
131
540
56.8
%52
.4%
27.3
8%26
.54%
6.6
0.77
694
.8%
91.9
%5-
916
.6%
16.2
%10
.0%
9.7%
Fe O
xide
1919
599
165
8.3%
8.3%
18.9
4%18
.94%
40.
047
2.4%
2.4%
10-1
912
.2%
12.2
%13
.0%
13.0
%M
n O
xide
11
2424
240.
4%0.
4%0.
40%
0.40
%5
0.19
30.
3%0.
3%20
-49
17.0
%16
.6%
14.6
%13
.2%
Pyrit
e2
223
1630
0.9%
0.9%
0.77
%0.
77%
4.8
0.00
007
0.0%
0.0%
50-9
98.
3%8.
3%12
.9%
12.9
%Fe
Sul
fate
7575
413
200
32.8
%32
.8%
52.2
8%52
.28%
3.7
0.01
461.
9%1.
9%10
0-14
96.
1%6.
1%7.
3%7.
3%15
0-19
90.
4%0.
4%0.
4%0.
4%20
0-24
90.
4%0.
4%0.
1%0.
1%> 2
500.
4%0.
4%31
.5%
31.5
%
100%
96%
100%
97%
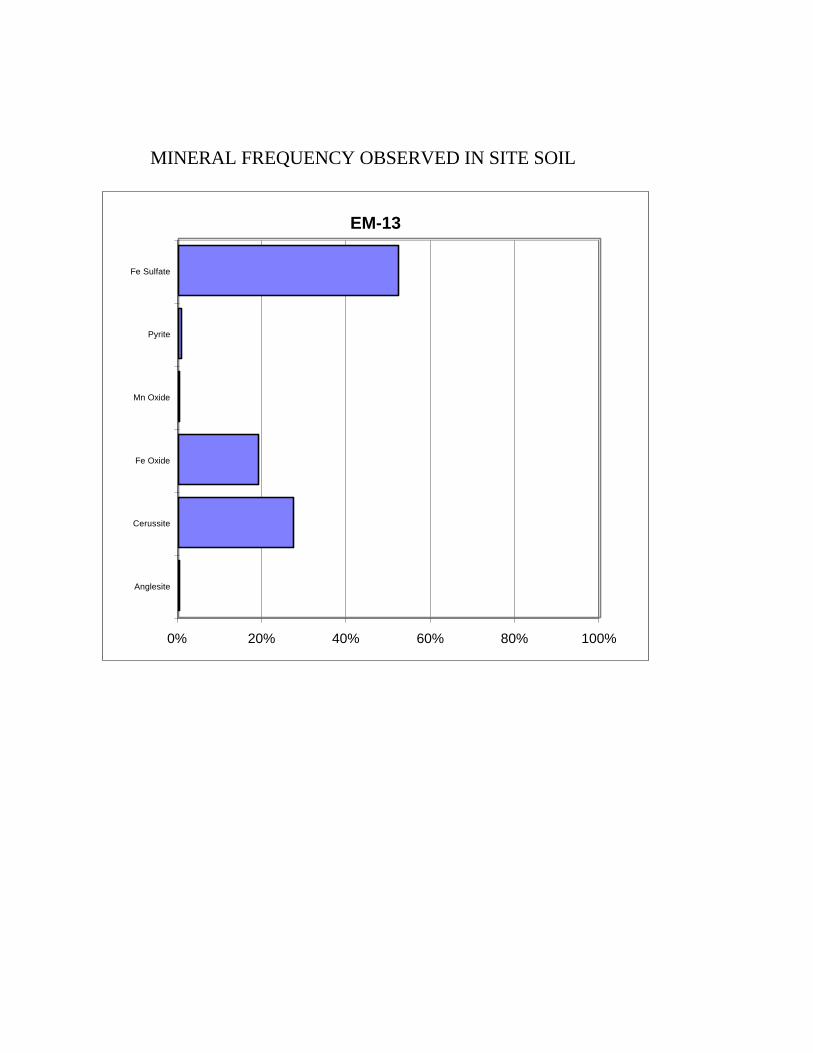
MINERAL FREQUENCY OBSERVED IN SITE SOIL
EM-13
0% 20% 40% 60% 80% 100%
Anglesite
Cerussite
Fe Oxide
Mn Oxide
Pyrite
Fe Sulfate
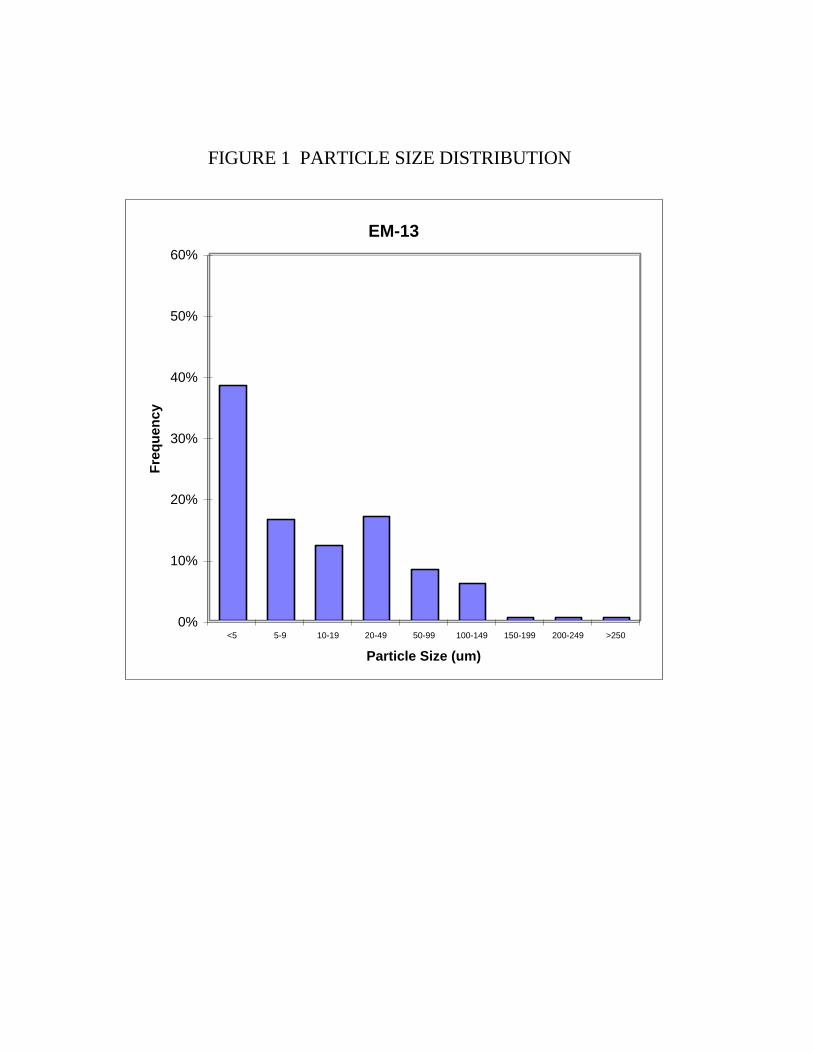
FIGURE 1 PARTICLE SIZE DISTRIBUTION
EM-13
0%
10%
20%
30%
40%
50%
60%
<5 5-9 10-19 20-49 50-99 100-149 150-199 200-249 >250
Particle Size (um)
Fre
qu
ency
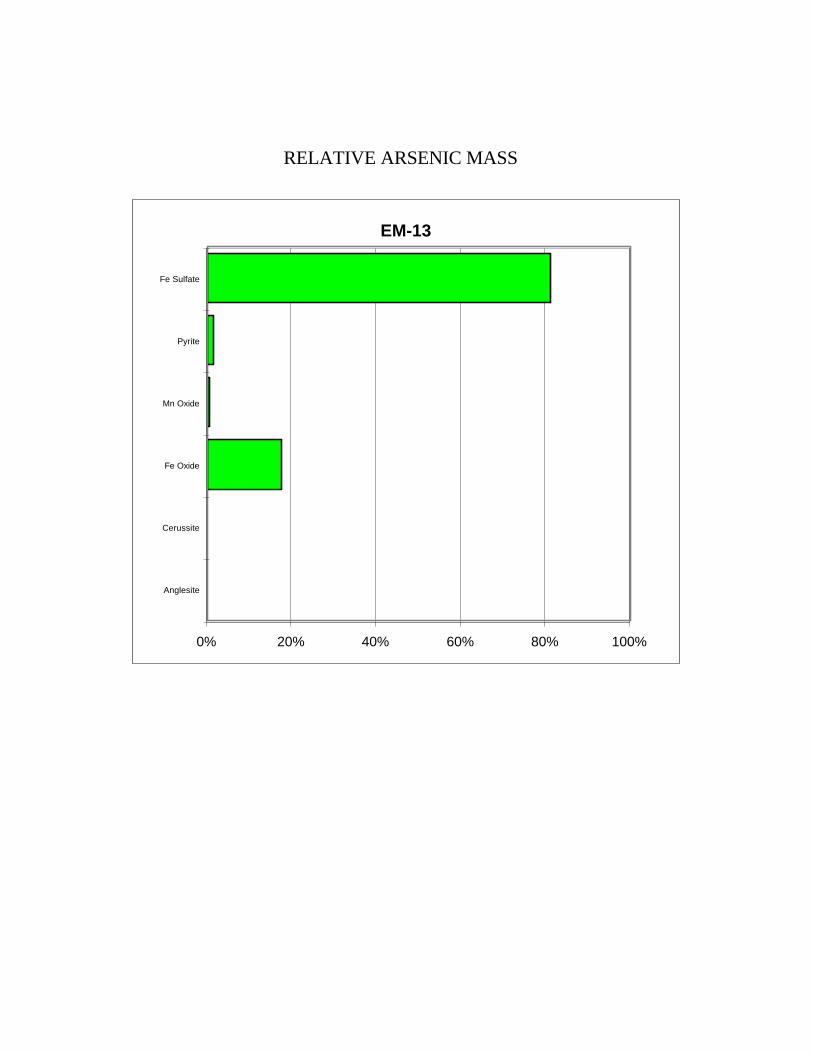
RELATIVE ARSENIC MASS
EM-13
0% 20% 40% 60% 80% 100%
Anglesite
Cerussite
Fe Oxide
Mn Oxide
Pyrite
Fe Sulfate
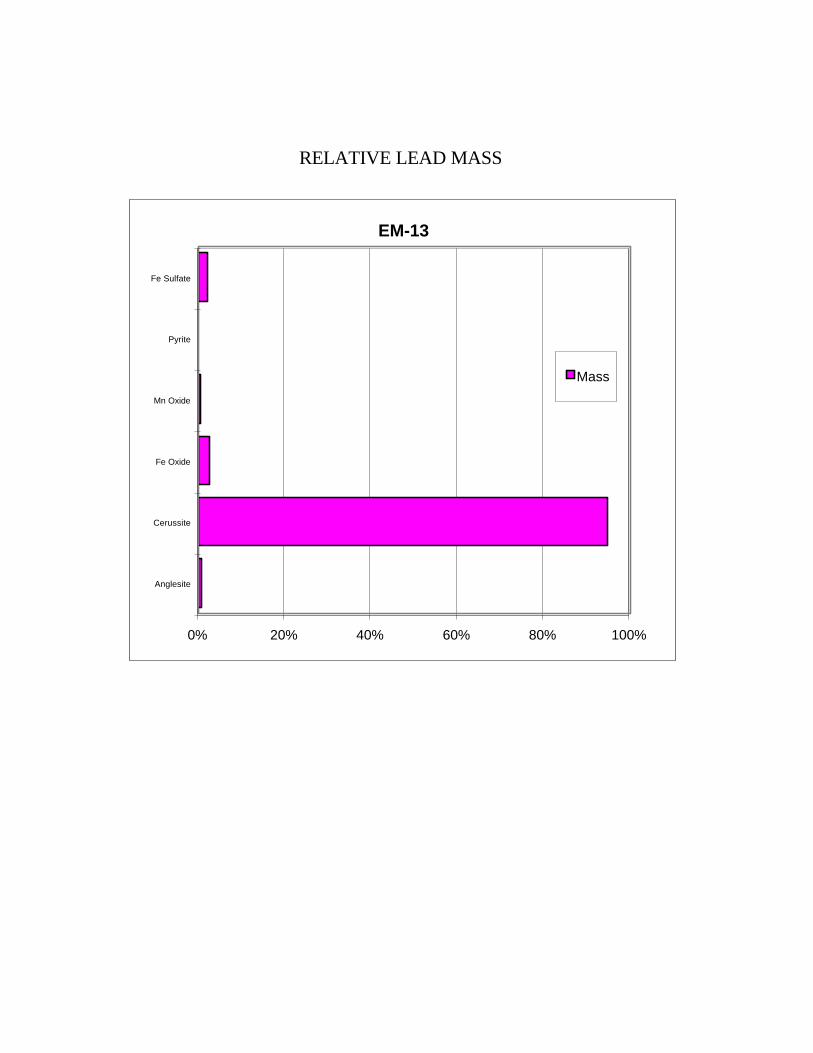
RELATIVE LEAD MASS
EM-13
0% 20% 40% 60% 80% 100%
Anglesite
Cerussite
Fe Oxide
Mn Oxide
Pyrite
Fe Sulfate
Mass
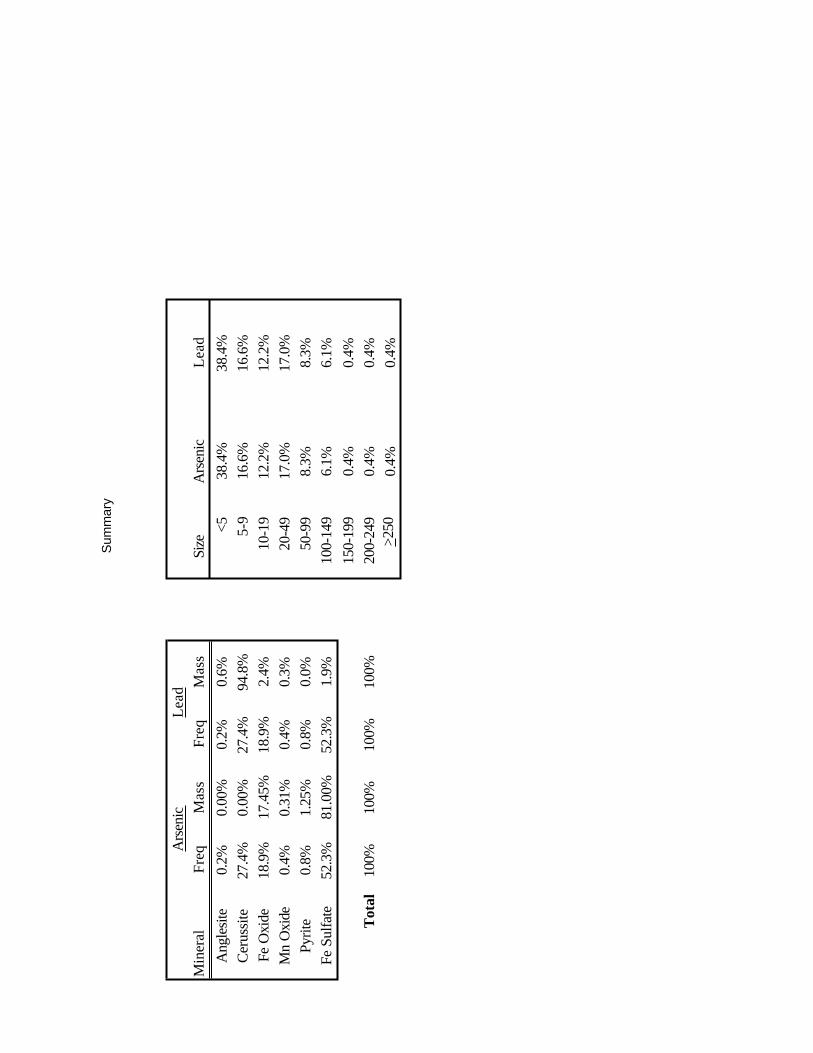
Sum
mar
y
Ars
enic
Lead
Min
eral
Freq
Mas
sFr
eqM
ass
Size
Ars
enic
Lead
Ang
lesit
e0.
2%0.
00%
0.2%
0.6%
<538
.4%
38.4
%Ce
russ
ite27
.4%
0.00
%27
.4%
94.8
%5-
916
.6%
16.6
%Fe
Oxi
de18
.9%
17.4
5%18
.9%
2.4%
10-1
912
.2%
12.2
%M
n O
xide
0.4%
0.31
%0.
4%0.
3%20
-49
17.0
%17
.0%
Pyrit
e0.
8%1.
25%
0.8%
0.0%
50-9
98.
3%8.
3%Fe
Sul
fate
52.3
%81
.00%
52.3
%1.
9%10
0-14
96.
1%6.
1%15
0-19
90.
4%0.
4%T
otal
100%
100%
100%
100%
200-
249
0.4%
0.4%
>250
0.4%
0.4%

SAMPLE ID EM-14

SUM
MA
RY
STA
TIST
ICS
EM-1
4 - A
rsen
ic
CO
UN
TSSI
ZEC
ount
Fre
q (%
)LW
Fre
q (%
)R
elat
ive
Ars
enic
Mas
s (%
)D
ISTR
IBU
TIO
NM
iner
alTo
tal
Lib
Avg
Min
Max
Tota
lLi
bera
ted
Tota
lLi
bera
ted
Den
sity
Frac
t As
Tota
lLi
bera
ted
Size
Tota
l Fre
qLi
b Fr
eqTo
tal R
AM
Lib
RAM
Clay
s2
213
912
815
01.
9%1.
9%8.
66%
8.66
%3.
10.
0002
80.
2%0.
2%<5
23.1
%11
.1%
0.0%
0.0%
Ang
lesit
e4
426
1240
3.7%
3.7%
3.21
%3.
21%
6.3
00.
0%0.
0%5-
910
.2%
10.2
%0.
3%0.
3%C
erus
site
5752
201
105
52.8
%48
.1%
35.1
3%33
.95%
6.6
00.
0%0.
0%10
-19
15.7
%14
.8%
2.7%
2.7%
Fe O
xide
1919
498
136
17.6
%17
.6%
29.2
4%29
.24%
40.
011
36.4
%36
.4%
20-4
930
.6%
29.6
%52
.6%
52.6
%Fe
AsO
11
2626
260.
9%0.
9%0.
81%
0.81
%4.
50.
338
34.8
%34
.8%
50-9
913
.9%
13.9
%34
.5%
34.5
%G
alen
a10
02
14
9.3%
0.0%
0.72
%0.
00%
7.5
00.
0%0.
0%10
0-14
95.
6%5.
6%9.
8%9.
8%M
n O
xide
44
5530
903.
7%3.
7%6.
85%
6.85
%5
0.00
737.
1%7.
1%15
0-19
90.
9%0.
9%0.
1%0.
1%O
rgan
ics
22
2722
321.
9%1.
9%1.
68%
1.68
%1.
30
0.0%
0.0%
200-
249
0.0%
0.0%
0.0%
0.0%
Slag
11
115
115
115
0.9%
0.9%
3.58
%3.
58%
3.65
0.00
10.
4%0.
4%> 2
500.
0%0.
0%0.
0%0.
0%Fe
Sul
fate
88
4110
857.
4%7.
4%10
.12%
10.1
2%3.
70.
0221
.2%
21.2
%10
0%86
%10
0%10
0%
TOTA
L10
893
3010
0.0%
86.1
%10
0.00
%98
.10%
100.
0%10
0.0%

SUM
MA
RY
STA
TIST
ICS
EM-1
4 - L
ead
CO
UN
TSSI
ZEC
ount
Fre
q (%
)LW
Fre
q (%
)R
elat
ive
Lead
Mas
s (%
)D
ISTR
IBU
TIO
NM
iner
alTo
tal
Lib
Avg
Min
Max
Tota
lLi
bera
ted
Tota
lLi
bera
ted
Den
sity
Frac
t Pb
Tota
lLi
bera
ted
Size
Tota
l Fre
qLi
b Fr
eqTo
tal R
AM
Lib
RAM
Clay
s2
213
912
815
01.
9%1.
9%8.
66%
8.66
%3.
10.
076
1.0%
1.0%
<523
.1%
11.1
%4.
5%1.
9%A
ngle
site
44
2612
403.
7%3.
7%3.
21%
3.21
%6.
30.
684
6.5%
6.5%
5-9
10.2
%10
.2%
5.5%
5.5%
Cer
ussit
e57
5220
110
552
.8%
48.1
%35
.13%
33.9
5%6.
60.
776
84.3
%81
.4%
10-1
915
.7%
14.8
%11
.1%
10.2
%Fe
Oxi
de19
1949
813
617
.6%
17.6
%29
.24%
29.2
4%4
0.04
72.
6%2.
6%20
-49
30.6
%29
.6%
43.2
%41
.7%
Fe A
sO1
126
2626
0.9%
0.9%
0.81
%0.
81%
4.5
0.00
10.
0%0.
0%50
-99
13.9
%13
.9%
18.7
%18
.7%
Gal
ena
100
21
49.
3%0.
0%0.
72%
0.00
%7.
50.
866
2.2%
0.0%
100-
149
5.6%
5.6%
16.5
%16
.5%
Mn
Oxi
de4
455
3090
3.7%
3.7%
6.85
%6.
85%
50.
193
3.1%
3.1%
150-
199
0.9%
0.9%
0.5%
0.5%
Org
anic
s2
227
2232
1.9%
1.9%
1.68
%1.
68%
1.3
0.11
70.
1%0.
1%20
0-24
90.
0%0.
0%0.
0%0.
0%Sl
ag1
111
511
511
50.
9%0.
9%3.
58%
3.58
%3.
650.
014
0.1%
0.1%
> 250
0.0%
0.0%
0.0%
0.0%
Fe S
ulfa
te8
841
1085
7.4%
7.4%
10.1
2%10
.12%
3.7
0.01
460.
3%0.
3%10
0%86
%10
0%95
%
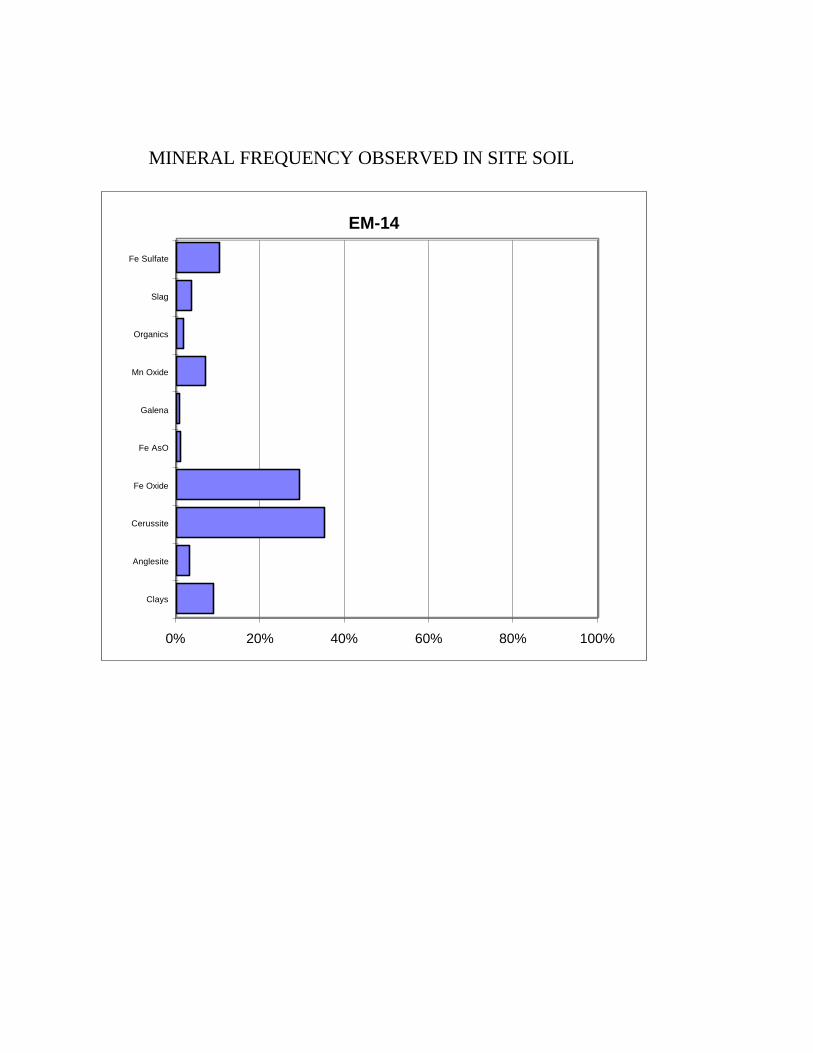
MINERAL FREQUENCY OBSERVED IN SITE SOIL
EM-14
0% 20% 40% 60% 80% 100%
Clays
Anglesite
Cerussite
Fe Oxide
Fe AsO
Galena
Mn Oxide
Organics
Slag
Fe Sulfate
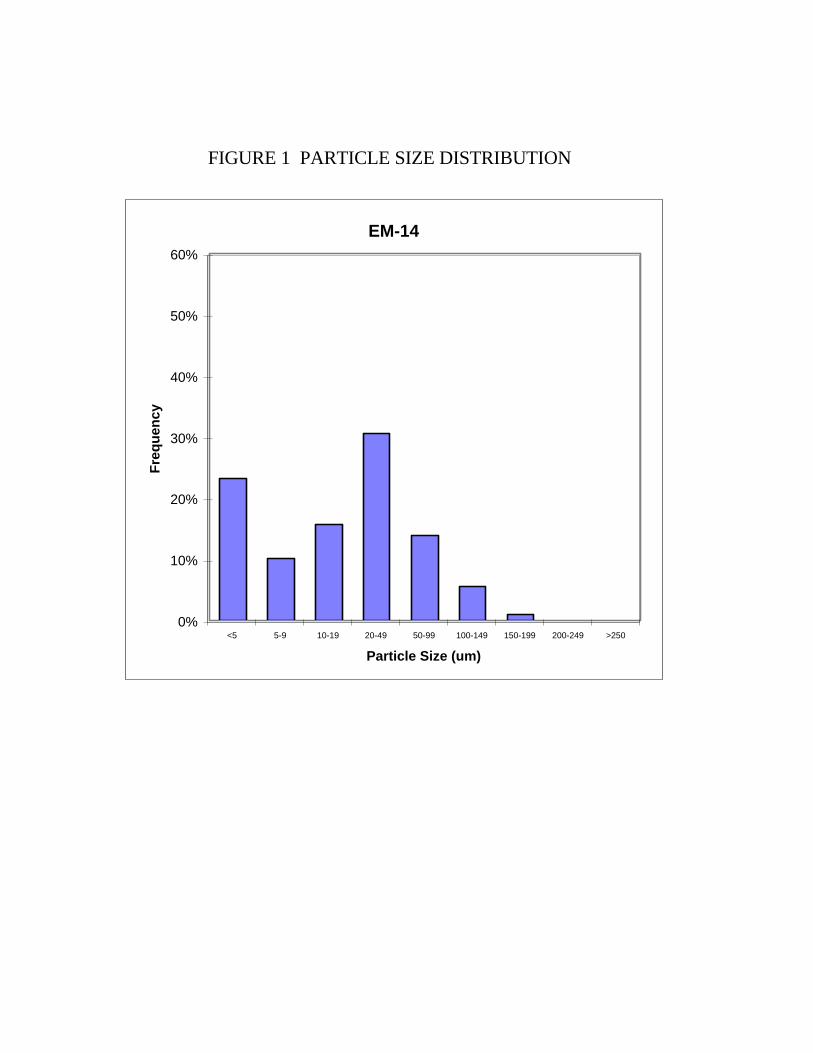
FIGURE 1 PARTICLE SIZE DISTRIBUTION
EM-14
0%
10%
20%
30%
40%
50%
60%
<5 5-9 10-19 20-49 50-99 100-149 150-199 200-249 >250
Particle Size (um)
Fre
qu
ency
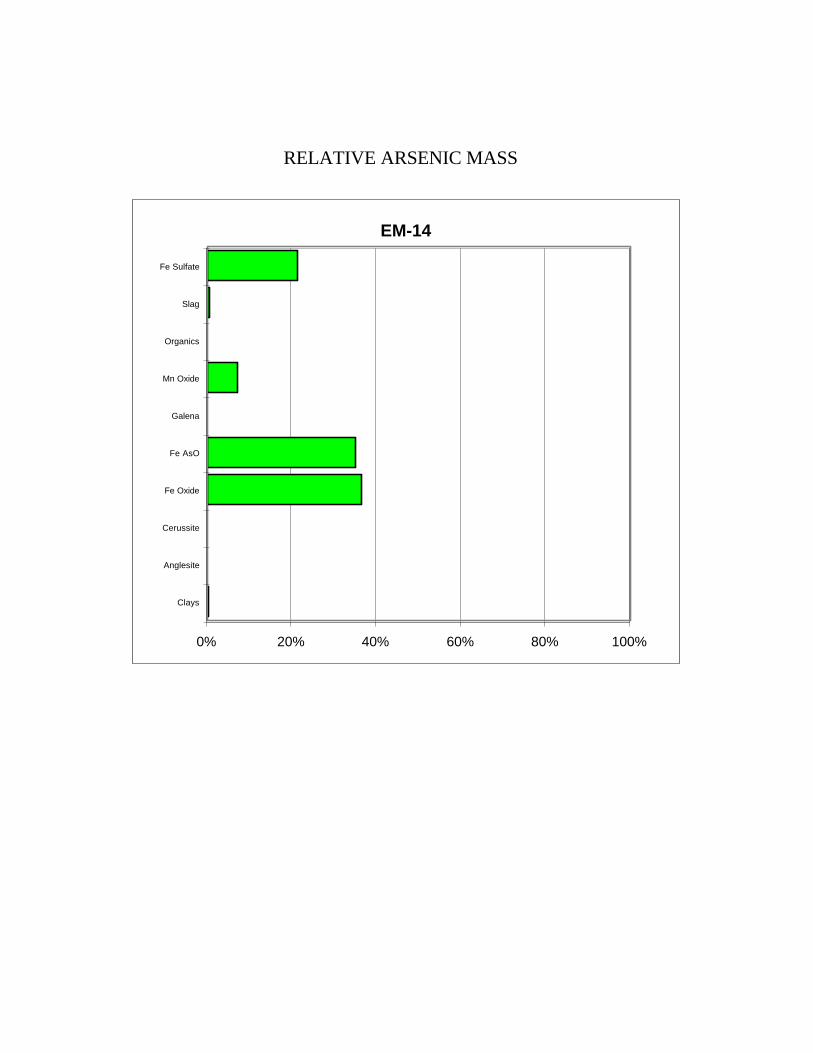
RELATIVE ARSENIC MASS
EM-14
0% 20% 40% 60% 80% 100%
Clays
Anglesite
Cerussite
Fe Oxide
Fe AsO
Galena
Mn Oxide
Organics
Slag
Fe Sulfate
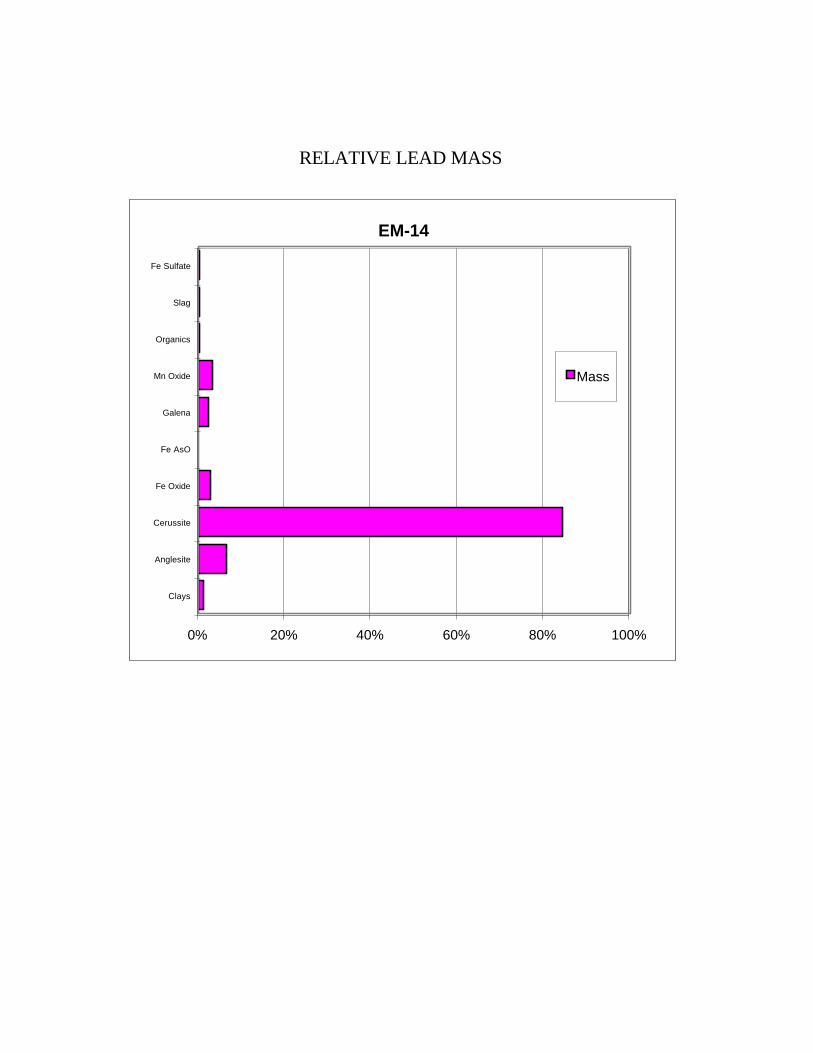
RELATIVE LEAD MASS
EM-14
0% 20% 40% 60% 80% 100%
Clays
Anglesite
Cerussite
Fe Oxide
Fe AsO
Galena
Mn Oxide
Organics
Slag
Fe Sulfate
Mass
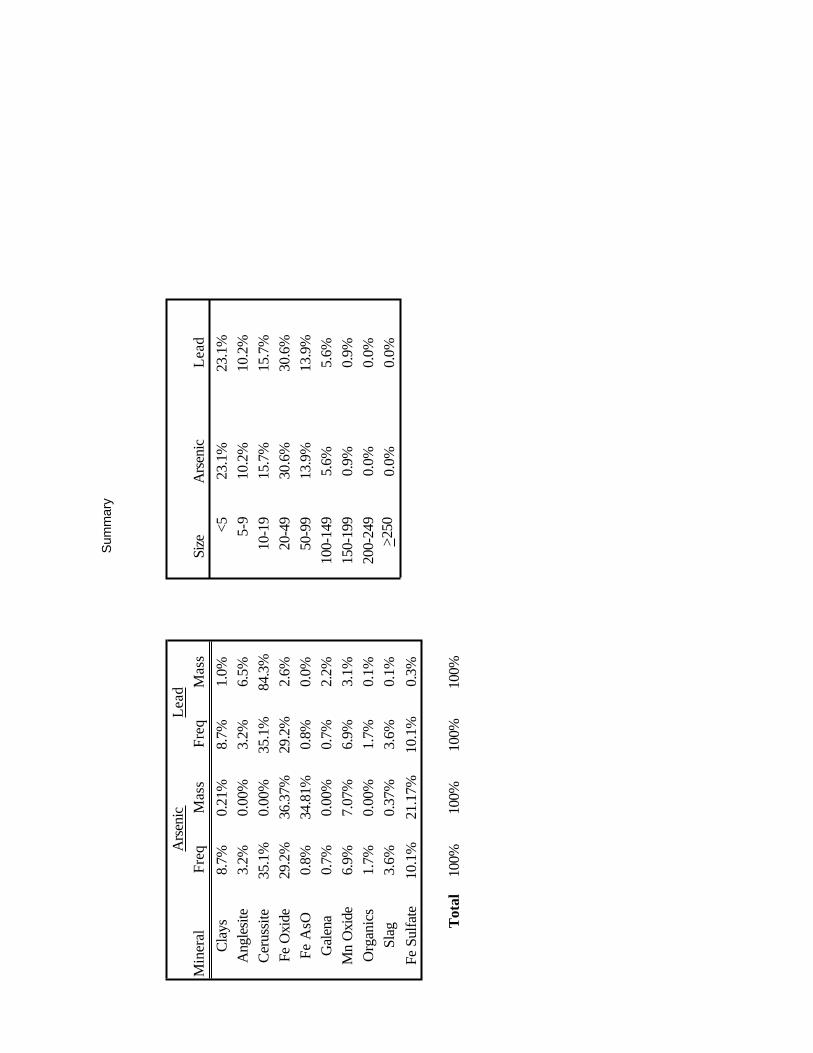
Sum
mar
y
Ars
enic
Lead
Min
eral
Freq
Mas
sFr
eqM
ass
Size
Ars
enic
Lead
Clay
s8.
7%0.
21%
8.7%
1.0%
<523
.1%
23.1
%A
ngle
site
3.2%
0.00
%3.
2%6.
5%5-
910
.2%
10.2
%Ce
russ
ite35
.1%
0.00
%35
.1%
84.3
%10
-19
15.7
%15
.7%
Fe O
xide
29.2
%36
.37%
29.2
%2.
6%20
-49
30.6
%30
.6%
Fe A
sO0.
8%34
.81%
0.8%
0.0%
50-9
913
.9%
13.9
%G
alen
a0.
7%0.
00%
0.7%
2.2%
100-
149
5.6%
5.6%
Mn
Oxi
de6.
9%7.
07%
6.9%
3.1%
150-
199
0.9%
0.9%
Org
anic
s1.
7%0.
00%
1.7%
0.1%
200-
249
0.0%
0.0%
Slag
3.6%
0.37
%3.
6%0.
1%>2
500.
0%0.
0%Fe
Sul
fate
10.1
%21
.17%
10.1
%0.
3%
Tot
al10
0%10
0%10
0%10
0%

SAMPLE ID EM-15

SUM
MA
RY
STA
TIST
ICS
EM-1
5 - A
rsen
ic
CO
UN
TSSI
ZEC
ount
Fre
q (%
)LW
Fre
q (%
)R
elat
ive
Ars
enic
Mas
s (%
)D
ISTR
IBU
TIO
NM
iner
alTo
tal
Lib
Avg
Min
Max
Tota
lLi
bera
ted
Tota
lLi
bera
ted
Den
sity
Frac
t As
Tota
lLi
bera
ted
Size
Tota
l Fre
qLi
b Fr
eqTo
tal R
AM
Lib
RAM
Cer
ussit
e33
2918
175
12.5
%11
.0%
15.0
0%14
.90%
6.6
00.
0%0.
0%<5
73.9
%72
.3%
12.3
%12
.3%
Fe O
xide
127
127
141
125
48.1
%48
.1%
45.6
0%45
.60%
40.
011
45.0
%45
.0%
5-9
5.3%
5.3%
1.5%
1.5%
Mn
Oxi
de7
761
911
22.
7%2.
7%11
.10%
11.1
0%5
0.00
739.
1%9.
1%10
-19
3.4%
3.4%
1.0%
1.0%
PbO
22
62
90.
8%0.
8%0.
28%
0.28
%9.
50
0.0%
0.0%
20-4
95.
7%5.
7%6.
1%6.
1%Ph
osph
ate
33
149
221.
1%1.
1%1.
06%
1.06
%5
0.00
931.
1%1.
1%50
-99
6.4%
6.4%
31.4
%31
.4%
Fe S
ulfa
te92
9211
111
834
.8%
34.8
%26
.96%
26.9
6%3.
70.
0244
.8%
44.8
%10
0-14
95.
3%5.
3%47
.7%
47.7
%15
0-19
90.
0%0.
0%0.
0%0.
0%20
0-24
90.
0%0.
0%0.
0%0.
0%> 2
500.
0%0.
0%0.
0%0.
0%
100%
98%
100%
100%
TOTA
L26
426
015
100.
0%98
.5%
100.
00%
99.9
0%10
0.0%
100.
0%
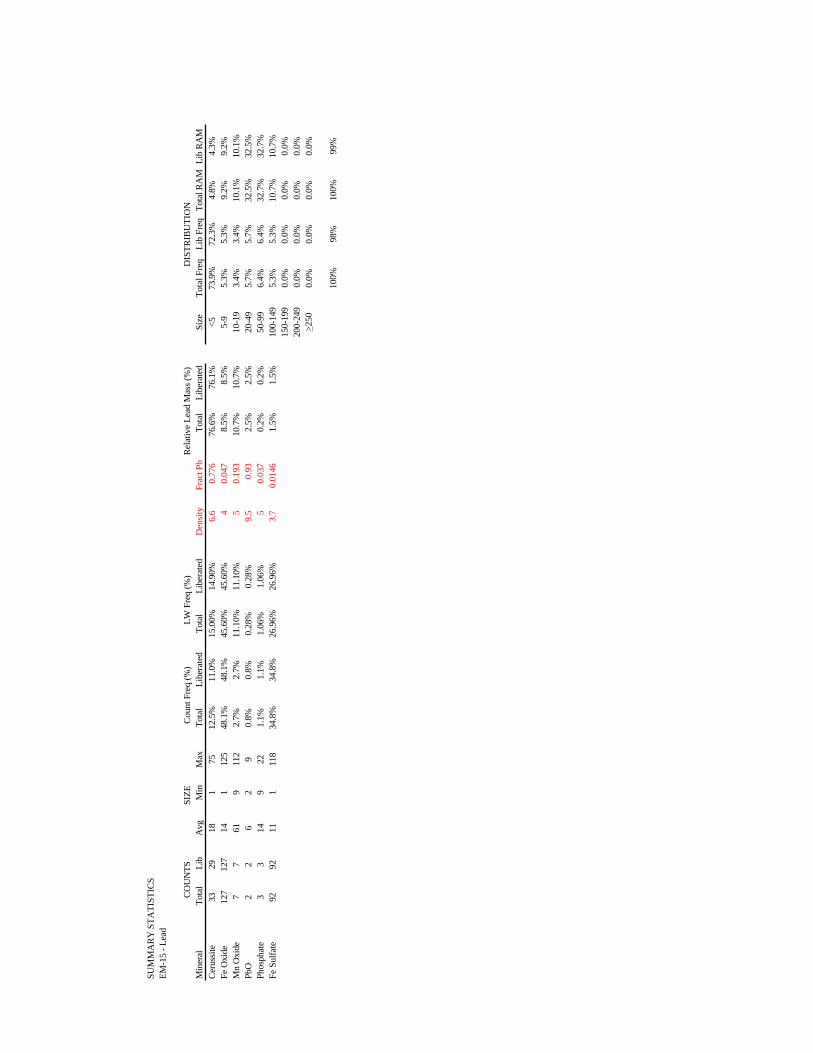
SUM
MA
RY
STA
TIST
ICS
EM-1
5 - L
ead
CO
UN
TSSI
ZEC
ount
Fre
q (%
)LW
Fre
q (%
)R
elat
ive
Lead
Mas
s (%
)D
ISTR
IBU
TIO
NM
iner
alTo
tal
Lib
Avg
Min
Max
Tota
lLi
bera
ted
Tota
lLi
bera
ted
Den
sity
Frac
t Pb
Tota
lLi
bera
ted
Size
Tota
l Fre
qLi
b Fr
eqTo
tal R
AM
Lib
RAM
Cer
ussit
e33
2918
175
12.5
%11
.0%
15.0
0%14
.90%
6.6
0.77
676
.6%
76.1
%<5
73.9
%72
.3%
4.8%
4.3%
Fe O
xide
127
127
141
125
48.1
%48
.1%
45.6
0%45
.60%
40.
047
8.5%
8.5%
5-9
5.3%
5.3%
9.2%
9.2%
Mn
Oxi
de7
761
911
22.
7%2.
7%11
.10%
11.1
0%5
0.19
310
.7%
10.7
%10
-19
3.4%
3.4%
10.1
%10
.1%
PbO
22
62
90.
8%0.
8%0.
28%
0.28
%9.
50.
932.
5%2.
5%20
-49
5.7%
5.7%
32.5
%32
.5%
Phos
phat
e3
314
922
1.1%
1.1%
1.06
%1.
06%
50.
037
0.2%
0.2%
50-9
96.
4%6.
4%32
.7%
32.7
%Fe
Sul
fate
9292
111
118
34.8
%34
.8%
26.9
6%26
.96%
3.7
0.01
461.
5%1.
5%10
0-14
95.
3%5.
3%10
.7%
10.7
%15
0-19
90.
0%0.
0%0.
0%0.
0%20
0-24
90.
0%0.
0%0.
0%0.
0%> 2
500.
0%0.
0%0.
0%0.
0%
100%
98%
100%
99%
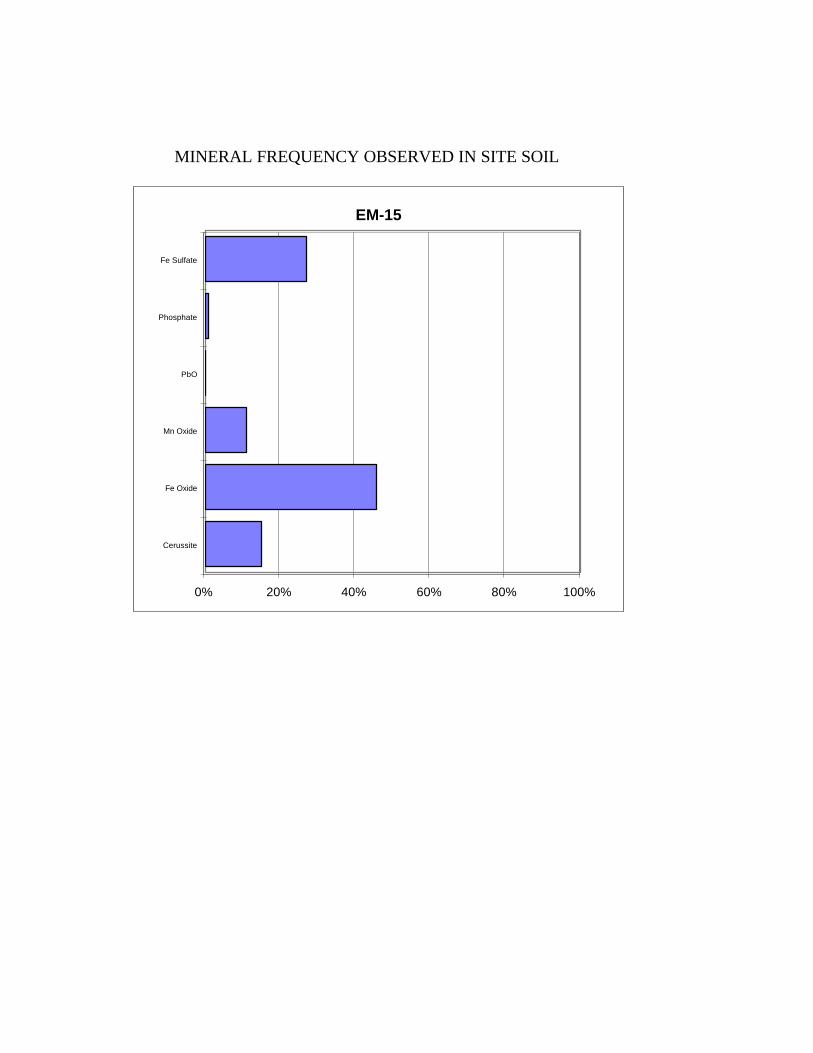
MINERAL FREQUENCY OBSERVED IN SITE SOIL
EM-15
0% 20% 40% 60% 80% 100%
Cerussite
Fe Oxide
Mn Oxide
PbO
Phosphate
Fe Sulfate
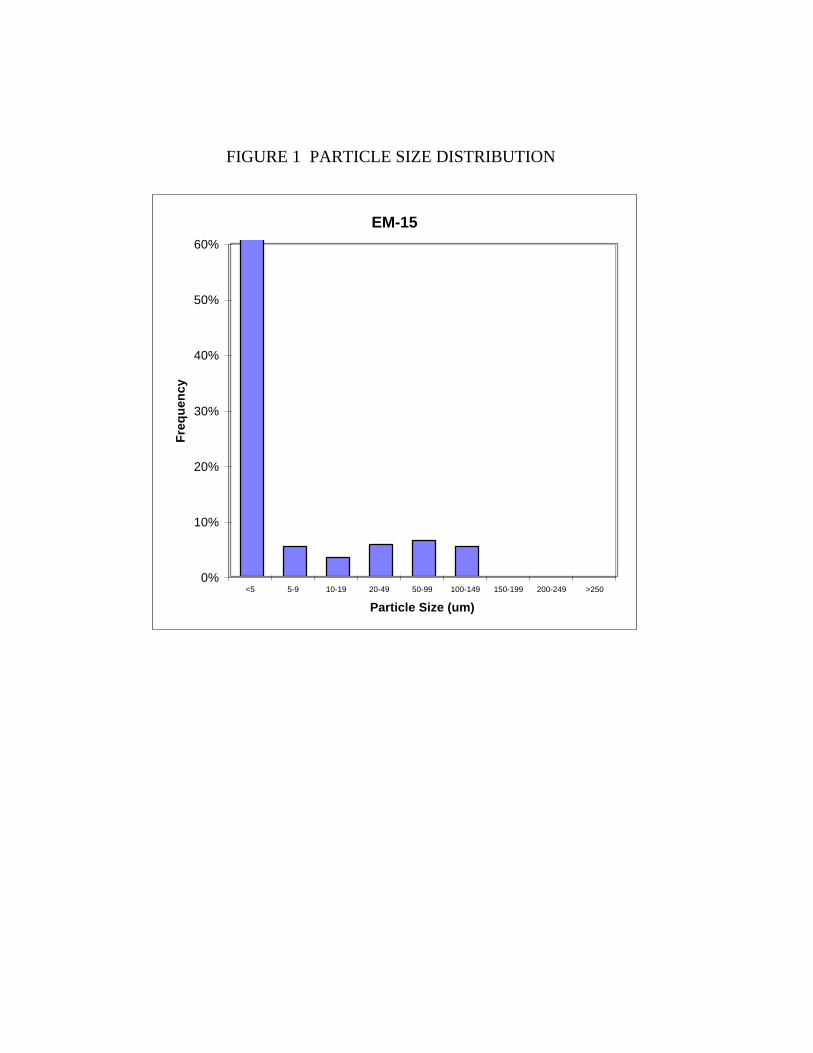
FIGURE 1 PARTICLE SIZE DISTRIBUTION
EM-15
0%
10%
20%
30%
40%
50%
60%
<5 5-9 10-19 20-49 50-99 100-149 150-199 200-249 >250
Particle Size (um)
Fre
qu
ency
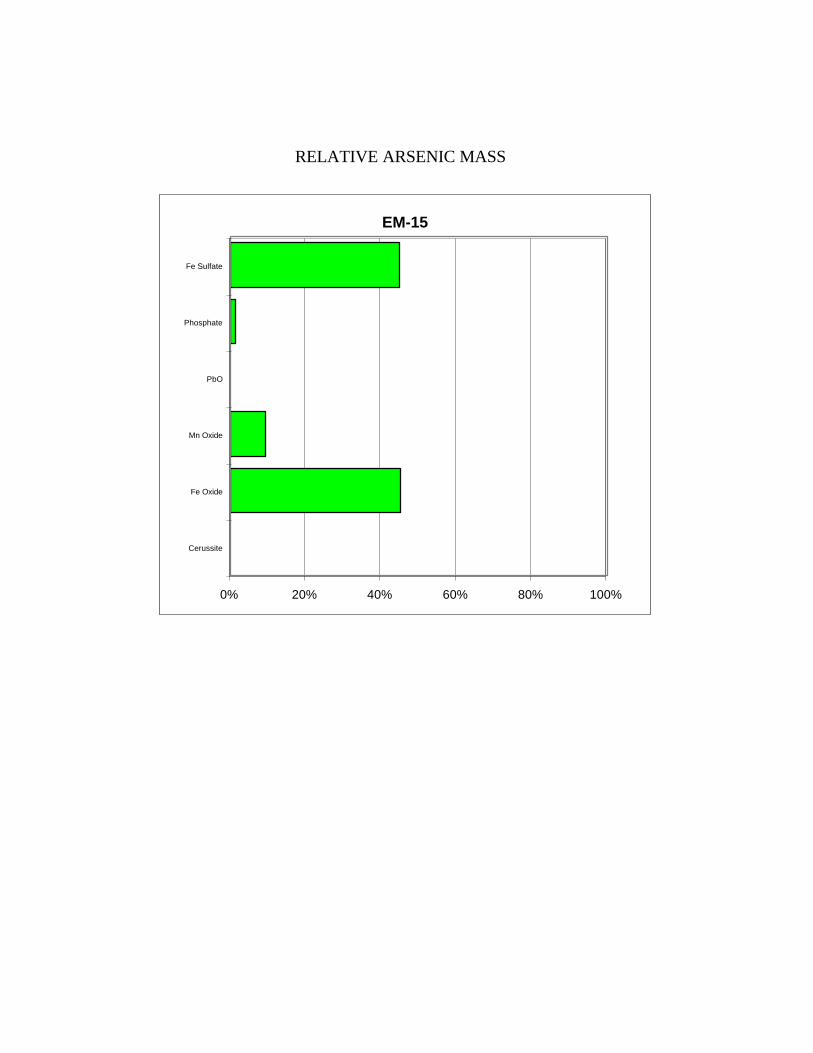
RELATIVE ARSENIC MASS
EM-15
0% 20% 40% 60% 80% 100%
Cerussite
Fe Oxide
Mn Oxide
PbO
Phosphate
Fe Sulfate

RELATIVE LEAD MASS
EM-15
0% 20% 40% 60% 80% 100%
Cerussite
Fe Oxide
Mn Oxide
PbO
Phosphate
Fe Sulfate
Mass

Sum
mar
y
Ars
enic
Lead
Min
eral
Freq
Mas
sFr
eqM
ass
Size
Ars
enic
Lead
Ceru
ssite
15.0
%0.
00%
15.0
%76
.6%
<573
.9%
73.9
%Fe
Oxi
de45
.6%
45.0
3%45
.6%
8.5%
5-9
5.3%
5.3%
Mn
Oxi
de11
.1%
9.10
%11
.1%
10.7
%10
-19
3.4%
3.4%
PbO
0.3%
0.0%
0.3%
2.5%
20-4
95.
7%5.
7%Ph
osph
ate
1.1%
1.1%
1.1%
0.2%
50-9
96.
4%6.
4%Fe
Sul
fate
27.0
%44
.77%
27.0
%1.
5%10
0-14
95.
3%5.
3%15
0-19
90.
0%0.
0%T
otal
100%
100%
100%
100%
200-
249
0.0%
0.0%
>250
0.0%
0.0%

SAMPLE ID EM-16

SUM
MA
RY
STA
TIST
ICS
EM-1
6 - A
rsen
ic
CO
UN
TSSI
ZEC
ount
Fre
q (%
)LW
Fre
q (%
)R
elat
ive
Ars
enic
Mas
s (%
)D
ISTR
IBU
TIO
NM
iner
alTo
tal
Lib
Avg
Min
Max
Tota
lLi
bera
ted
Tota
lLi
bera
ted
Den
sity
Frac
t As
Tota
lLi
bera
ted
Size
Tota
l Fre
qLi
b Fr
eqTo
tal R
AM
Lib
RAM
Cer
ussit
e20
120
07
110
072
.6%
72.2
%34
.23%
34.0
0%6.
60
0.0%
0.0%
<567
.1%
67.1
%3.
4%3.
4%Fe
Oxi
de60
6028
214
521
.7%
21.7
%43
.29%
43.2
9%4
0.01
159
.6%
59.6
%5-
97.
9%7.
6%2.
1%2.
1%M
n O
xide
55
7513
170
1.8%
1.8%
9.68
%9.
68%
50.
0073
11.1
%11
.1%
10-1
910
.8%
10.8
%5.
4%5.
4%Ph
osph
ate
22
77
70.
7%0.
7%0.
36%
0.36
%5
0.00
930.
5%0.
5%20
-49
4.0%
3.6%
6.0%
4.1%
Fe S
ulfa
te9
853
714
53.
2%2.
9%12
.45%
11.6
2%3.
70.
0228
.8%
26.9
%50
-99
6.5%
6.5%
36.4
%36
.4%
100-
149
3.2%
3.2%
41.6
%41
.6%
150-
199
0.4%
0.4%
5.0%
5.0%
200-
249
0.0%
0.0%
0.0%
0.0%
> 250
0.0%
0.0%
0.0%
0.0%
100%
99%
100%
98%
TOTA
L27
727
514
100.
0%99
.3%
100.
00%
98.9
4%10
0.0%
98.1
%

SUM
MA
RY
STA
TIST
ICS
EM-1
6 - L
ead
CO
UN
TSSI
ZEC
ount
Fre
q (%
)LW
Fre
q (%
)R
elat
ive
Lead
Mas
s (%
)D
ISTR
IBU
TIO
NM
iner
alTo
tal
Lib
Avg
Min
Max
Tota
lLi
bera
ted
Tota
lLi
bera
ted
Den
sity
Frac
t Pb
Tota
lLi
bera
ted
Size
Tota
l Fre
qLi
b Fr
eqTo
tal R
AM
Lib
RAM
Cer
ussit
e20
120
07
110
072
.6%
72.2
%34
.23%
34.0
0%6.
60.
776
90.6
%90
.0%
<567
.1%
67.1
%23
.8%
23.8
%Fe
Oxi
de60
6028
214
521
.7%
21.7
%43
.29%
43.2
9%4
0.04
74.
2%4.
2%5-
97.
9%7.
6%7.
1%6.
5%M
n O
xide
55
7513
170
1.8%
1.8%
9.68
%9.
68%
50.
193
4.8%
4.8%
10-1
910
.8%
10.8
%18
.4%
18.4
%Ph
osph
ate
22
77
70.
7%0.
7%0.
36%
0.36
%5
0.03
70.
0%0.
0%20
-49
4.0%
3.6%
13.2
%13
.2%
Fe S
ulfa
te9
853
714
53.
2%2.
9%12
.45%
11.6
2%3.
70.
0146
0.3%
0.3%
50-9
96.
5%6.
5%26
.4%
26.4
%10
0-14
93.
2%3.
2%8.
9%8.
9%15
0-19
90.
4%0.
4%2.
2%2.
2%20
0-24
90.
0%0.
0%0.
0%0.
0%> 2
500.
0%0.
0%0.
0%0.
0%
100%
99%
100%
99%
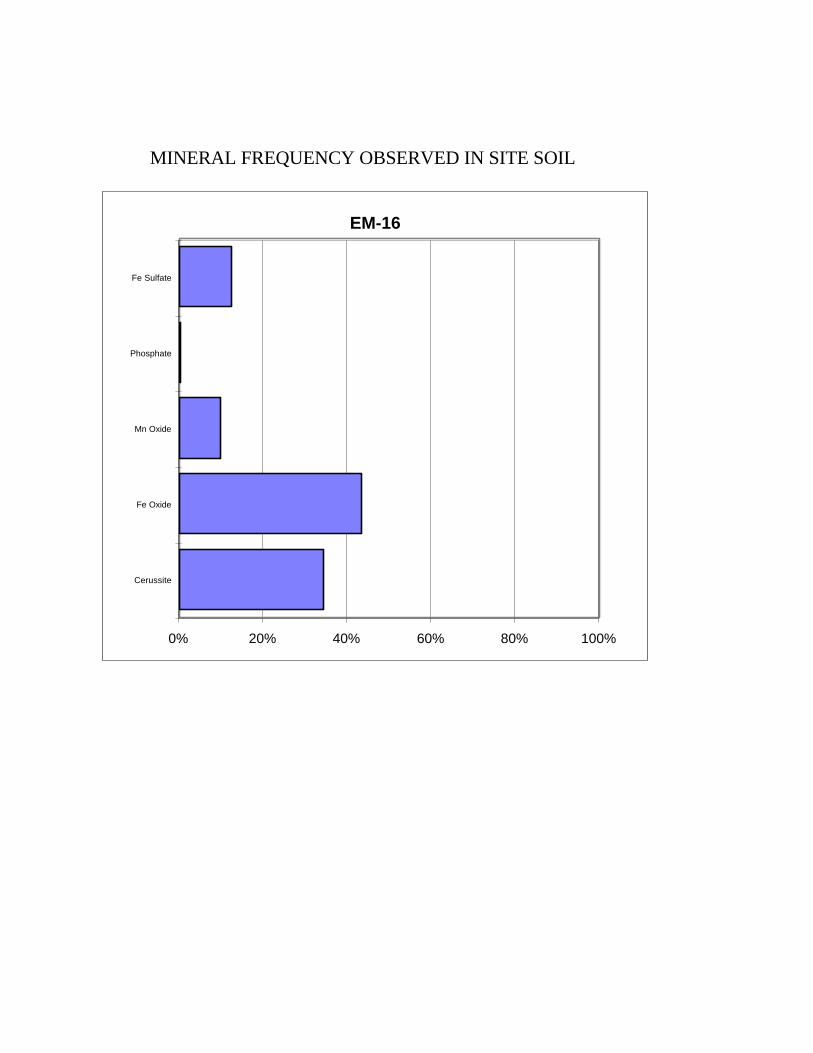
MINERAL FREQUENCY OBSERVED IN SITE SOIL
EM-16
0% 20% 40% 60% 80% 100%
Cerussite
Fe Oxide
Mn Oxide
Phosphate
Fe Sulfate

FIGURE 1 PARTICLE SIZE DISTRIBUTION
EM-16
0%
10%
20%
30%
40%
50%
60%
<5 5-9 10-19 20-49 50-99 100-149 150-199 200-249 >250
Particle Size (um)
Fre
qu
ency
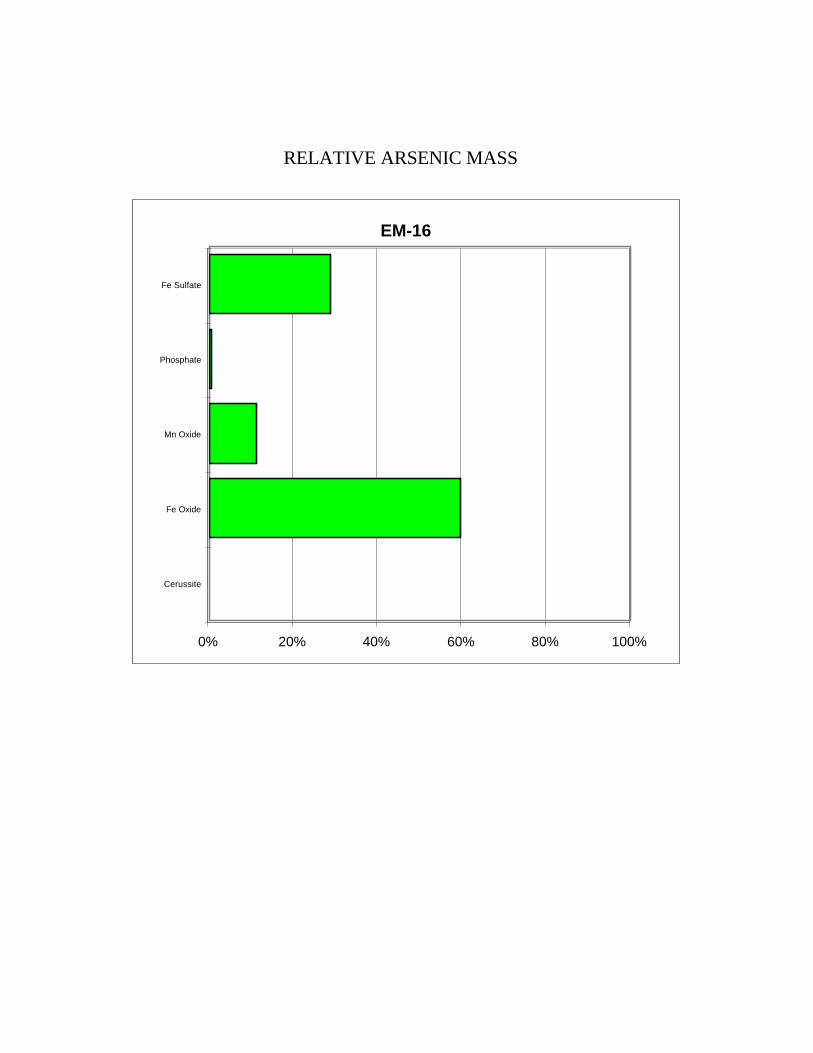
RELATIVE ARSENIC MASS
EM-16
0% 20% 40% 60% 80% 100%
Cerussite
Fe Oxide
Mn Oxide
Phosphate
Fe Sulfate

RELATIVE LEAD MASS
EM-16
0% 20% 40% 60% 80% 100%
Cerussite
Fe Oxide
Mn Oxide
Phosphate
Fe Sulfate
Mass
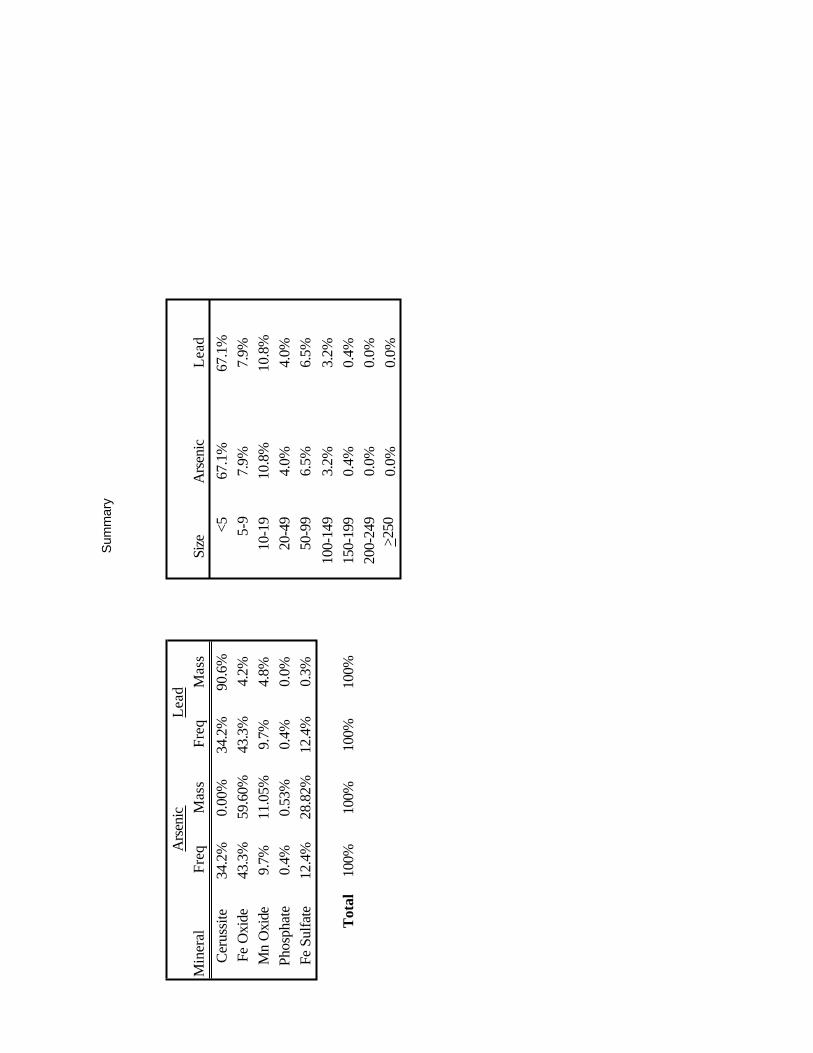
Sum
mar
y
Ars
enic
Lead
Min
eral
Freq
Mas
sFr
eqM
ass
Size
Ars
enic
Lead
Ceru
ssite
34.2
%0.
00%
34.2
%90
.6%
<567
.1%
67.1
%Fe
Oxi
de43
.3%
59.6
0%43
.3%
4.2%
5-9
7.9%
7.9%
Mn
Oxi
de9.
7%11
.05%
9.7%
4.8%
10-1
910
.8%
10.8
%Ph
osph
ate
0.4%
0.53
%0.
4%0.
0%20
-49
4.0%
4.0%
Fe S
ulfa
te12
.4%
28.8
2%12
.4%
0.3%
50-9
96.
5%6.
5%10
0-14
93.
2%3.
2%T
otal
100%
100%
100%
100%
150-
199
0.4%
0.4%
200-
249
0.0%
0.0%
>250
0.0%
0.0%

SAMPLE ID EM-17
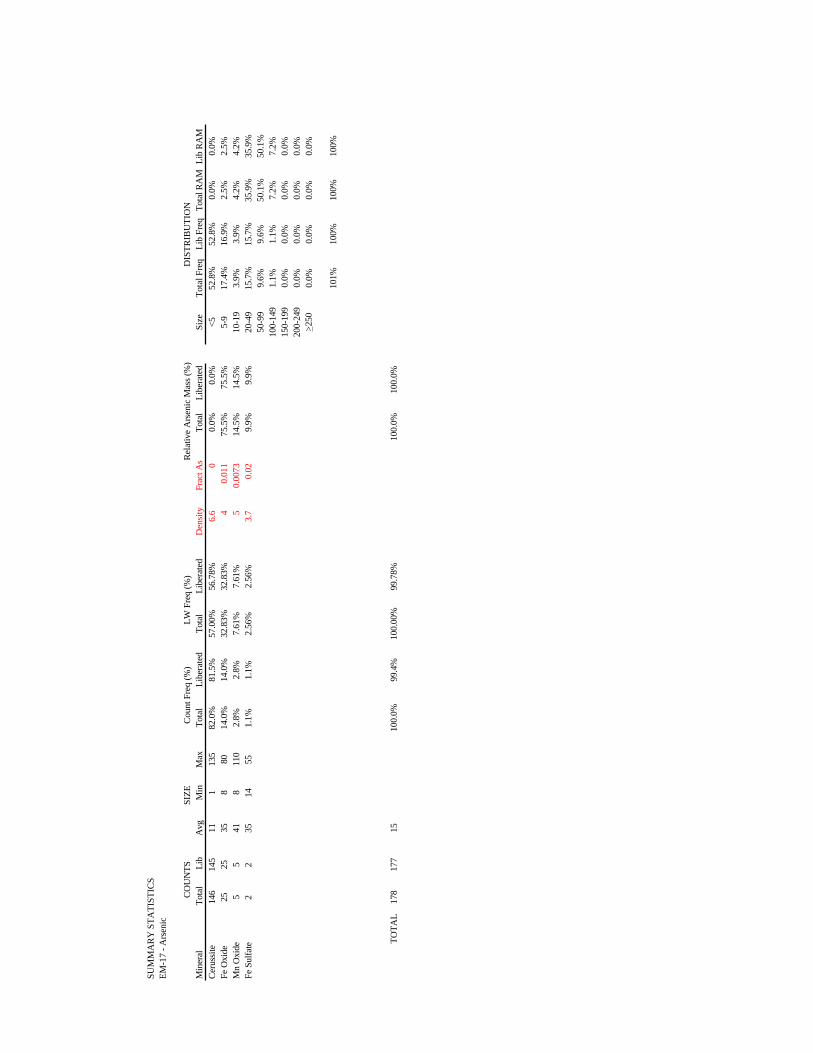
SUM
MA
RY
STA
TIST
ICS
EM-1
7 - A
rsen
ic
CO
UN
TSSI
ZEC
ount
Fre
q (%
)LW
Fre
q (%
)R
elat
ive
Ars
enic
Mas
s (%
)D
ISTR
IBU
TIO
NM
iner
alTo
tal
Lib
Avg
Min
Max
Tota
lLi
bera
ted
Tota
lLi
bera
ted
Den
sity
Frac
t As
Tota
lLi
bera
ted
Size
Tota
l Fre
qLi
b Fr
eqTo
tal R
AM
Lib
RAM
Cer
ussit
e14
614
511
113
582
.0%
81.5
%57
.00%
56.7
8%6.
60
0.0%
0.0%
<552
.8%
52.8
%0.
0%0.
0%Fe
Oxi
de25
2535
880
14.0
%14
.0%
32.8
3%32
.83%
40.
011
75.5
%75
.5%
5-9
17.4
%16
.9%
2.5%
2.5%
Mn
Oxi
de5
541
811
02.
8%2.
8%7.
61%
7.61
%5
0.00
7314
.5%
14.5
%10
-19
3.9%
3.9%
4.2%
4.2%
Fe S
ulfa
te2
235
1455
1.1%
1.1%
2.56
%2.
56%
3.7
0.02
9.9%
9.9%
20-4
915
.7%
15.7
%35
.9%
35.9
%50
-99
9.6%
9.6%
50.1
%50
.1%
100-
149
1.1%
1.1%
7.2%
7.2%
150-
199
0.0%
0.0%
0.0%
0.0%
200-
249
0.0%
0.0%
0.0%
0.0%
> 250
0.0%
0.0%
0.0%
0.0%
101%
100%
100%
100%
TOTA
L17
817
715
100.
0%99
.4%
100.
00%
99.7
8%10
0.0%
100.
0%
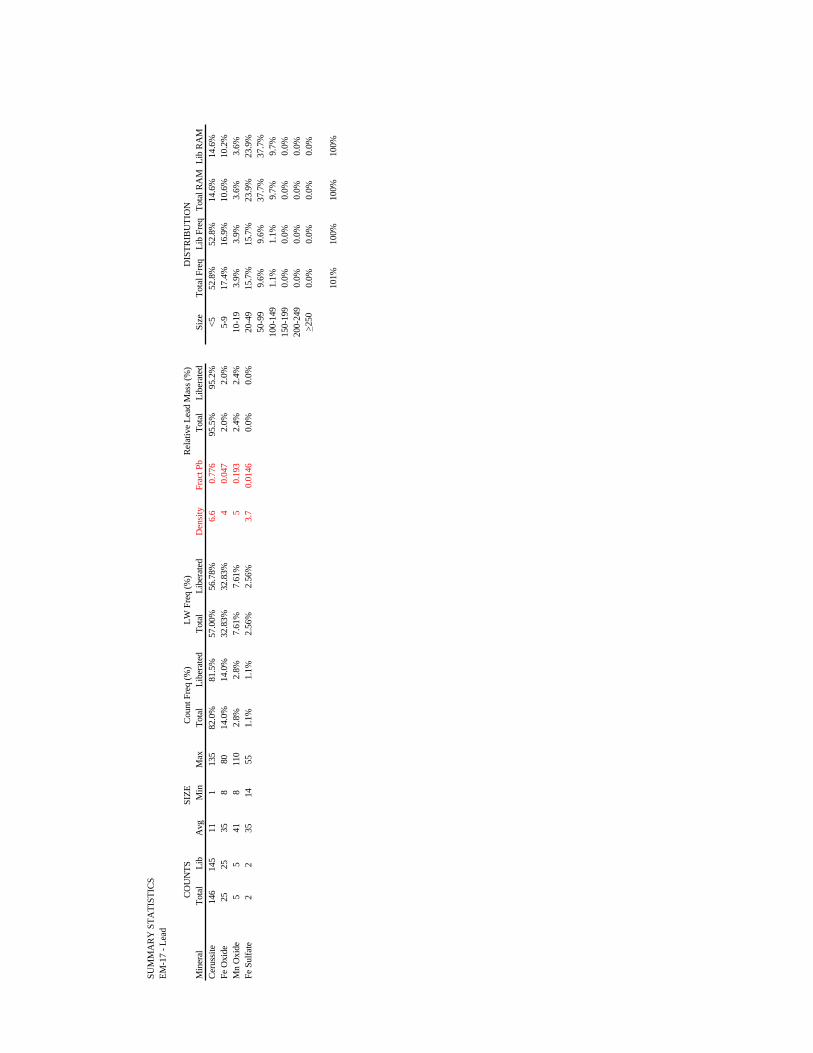
SUM
MA
RY
STA
TIST
ICS
EM-1
7 - L
ead
CO
UN
TSSI
ZEC
ount
Fre
q (%
)LW
Fre
q (%
)R
elat
ive
Lead
Mas
s (%
)D
ISTR
IBU
TIO
NM
iner
alTo
tal
Lib
Avg
Min
Max
Tota
lLi
bera
ted
Tota
lLi
bera
ted
Den
sity
Frac
t Pb
Tota
lLi
bera
ted
Size
Tota
l Fre
qLi
b Fr
eqTo
tal R
AM
Lib
RAM
Cer
ussit
e14
614
511
113
582
.0%
81.5
%57
.00%
56.7
8%6.
60.
776
95.5
%95
.2%
<552
.8%
52.8
%14
.6%
14.6
%Fe
Oxi
de25
2535
880
14.0
%14
.0%
32.8
3%32
.83%
40.
047
2.0%
2.0%
5-9
17.4
%16
.9%
10.6
%10
.2%
Mn
Oxi
de5
541
811
02.
8%2.
8%7.
61%
7.61
%5
0.19
32.
4%2.
4%10
-19
3.9%
3.9%
3.6%
3.6%
Fe S
ulfa
te2
235
1455
1.1%
1.1%
2.56
%2.
56%
3.7
0.01
460.
0%0.
0%20
-49
15.7
%15
.7%
23.9
%23
.9%
50-9
99.
6%9.
6%37
.7%
37.7
%10
0-14
91.
1%1.
1%9.
7%9.
7%15
0-19
90.
0%0.
0%0.
0%0.
0%20
0-24
90.
0%0.
0%0.
0%0.
0%> 2
500.
0%0.
0%0.
0%0.
0%
101%
100%
100%
100%

MINERAL FREQUENCY OBSERVED IN SITE SOIL
EM-17
0% 20% 40% 60% 80% 100%
Cerussite
Fe Oxide
Mn Oxide
Fe Sulfate
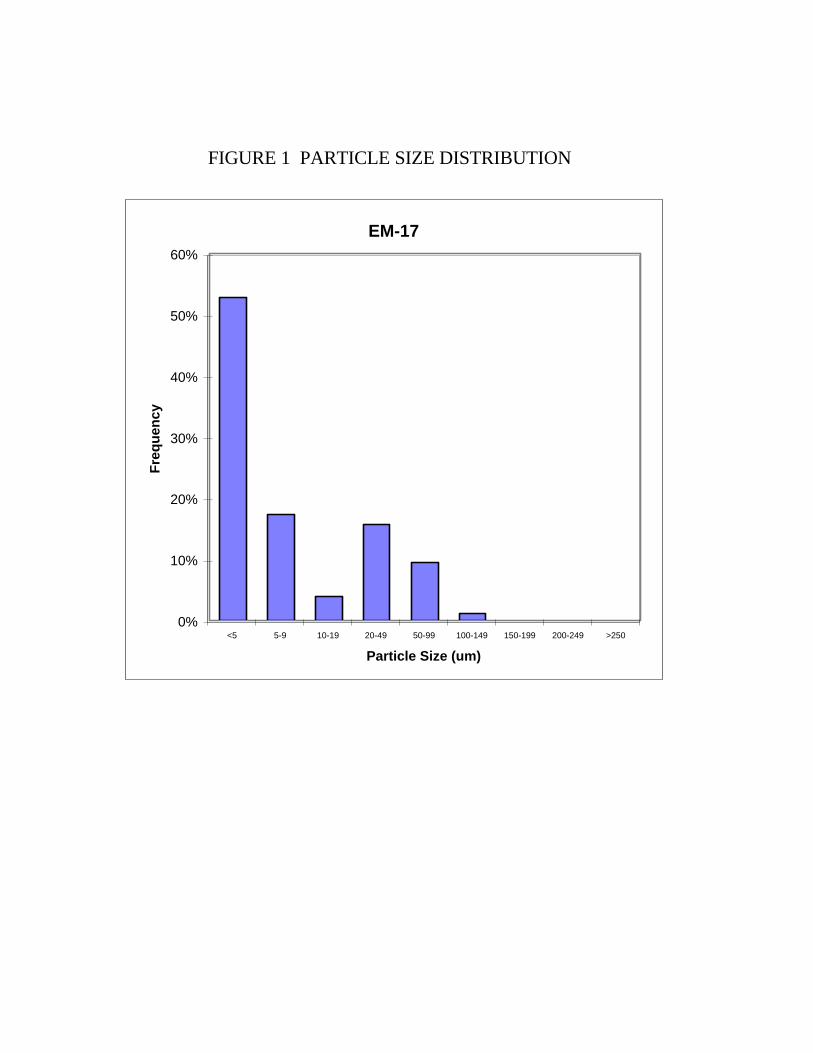
FIGURE 1 PARTICLE SIZE DISTRIBUTION
EM-17
0%
10%
20%
30%
40%
50%
60%
<5 5-9 10-19 20-49 50-99 100-149 150-199 200-249 >250
Particle Size (um)
Fre
qu
ency
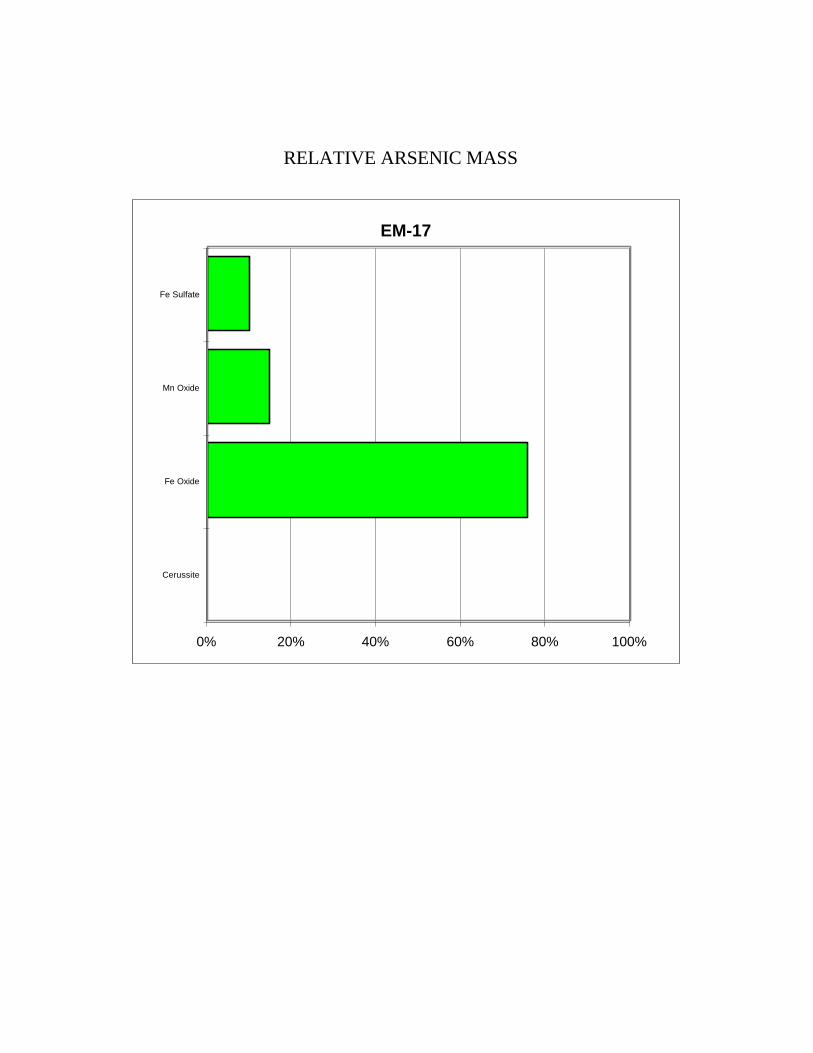
RELATIVE ARSENIC MASS
EM-17
0% 20% 40% 60% 80% 100%
Cerussite
Fe Oxide
Mn Oxide
Fe Sulfate

RELATIVE LEAD MASS
EM-17
0% 20% 40% 60% 80% 100%
Cerussite
Fe Oxide
Mn Oxide
Fe Sulfate
Mass
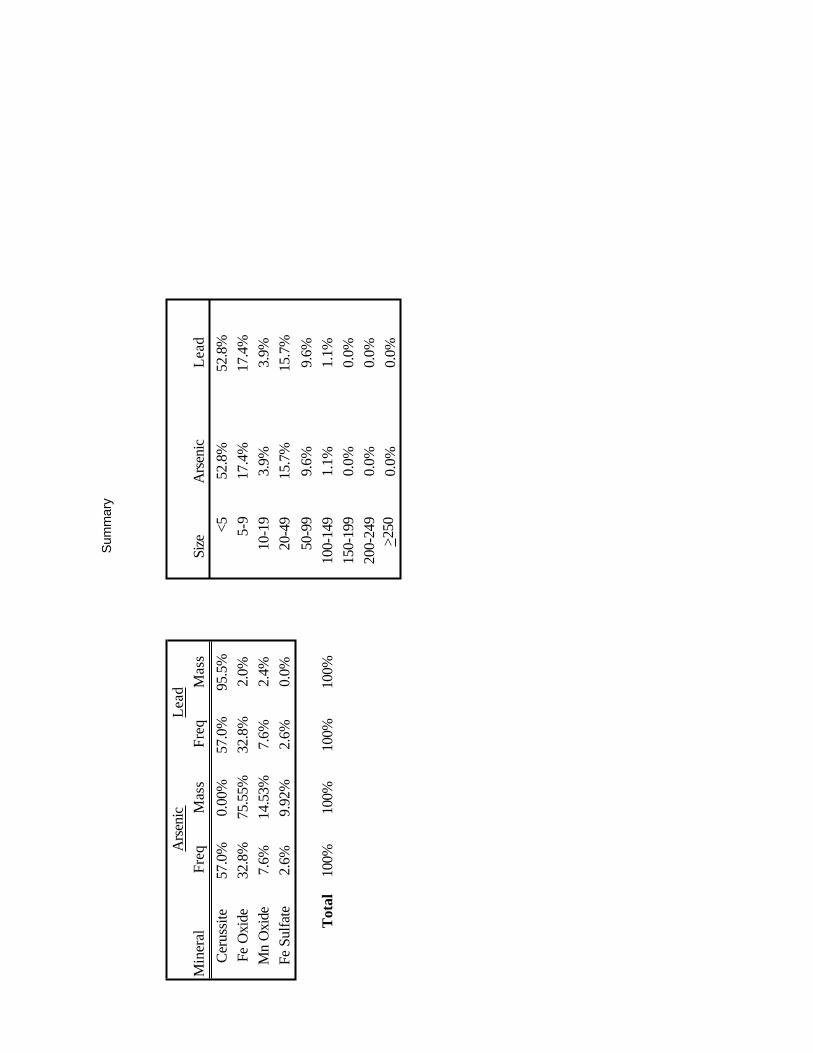
Sum
mar
y
Ars
enic
Lead
Min
eral
Freq
Mas
sFr
eqM
ass
Size
Ars
enic
Lead
Ceru
ssite
57.0
%0.
00%
57.0
%95
.5%
<552
.8%
52.8
%Fe
Oxi
de32
.8%
75.5
5%32
.8%
2.0%
5-9
17.4
%17
.4%
Mn
Oxi
de7.
6%14
.53%
7.6%
2.4%
10-1
93.
9%3.
9%Fe
Sul
fate
2.6%
9.92
%2.
6%0.
0%20
-49
15.7
%15
.7%
50-9
99.
6%9.
6%T
otal
100%
100%
100%
100%
100-
149
1.1%
1.1%
150-
199
0.0%
0.0%
200-
249
0.0%
0.0%
>250
0.0%
0.0%

APPENDIX CSCREENING CALCULATIONS FOR DERMAL,
INHALATION, AND HOMEGROWN VEGETABLE EXPOSURES
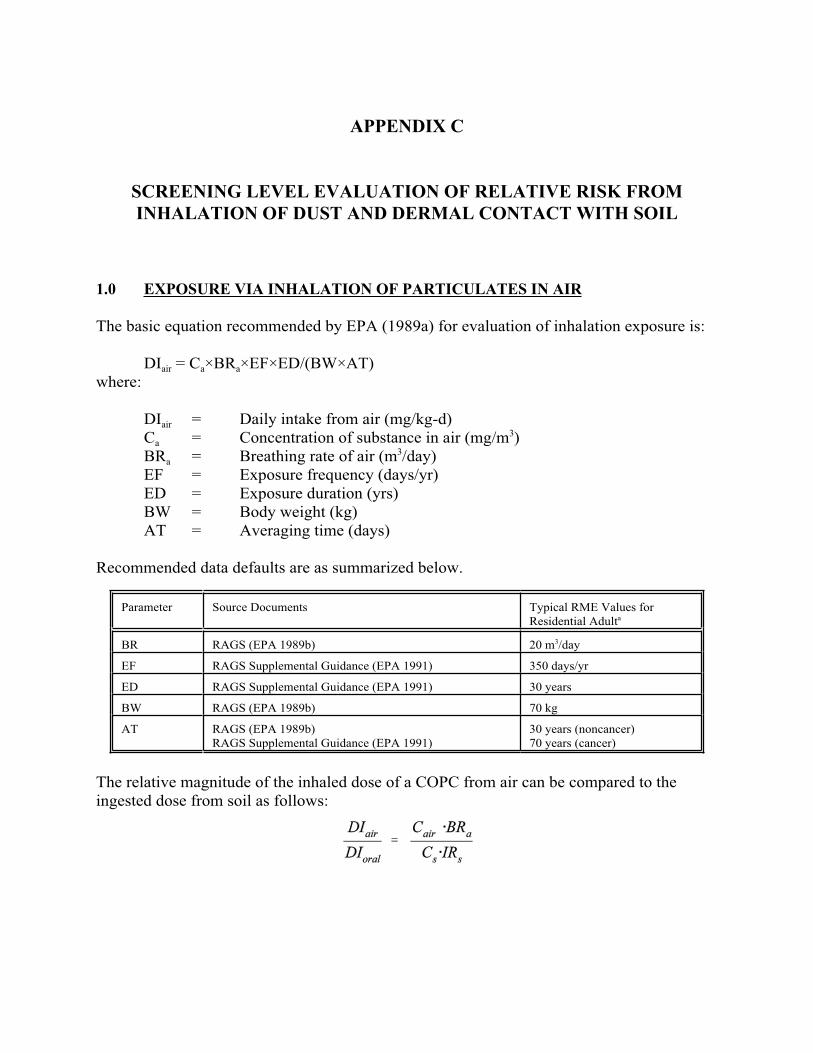
APPENDIX C
SCREENING LEVEL EVALUATION OF RELATIVE RISK FROM
INHALATION OF DUST AND DERMAL CONTACT WITH SOIL
1.0 EXPOSURE VIA INHALATION OF PARTICULATES IN AIR
The basic equation recommended by EPA (1989a) for evaluation of inhalation exposure is:
DIair = Ca×BRa×EF×ED/(BW×AT)
where:
DIair = Daily intake from air (mg/kg-d)
Ca = Concentration of substance in air (mg/m3)
BRa = Breathing rate of air (m3/day)
EF = Exposure frequency (days/yr)
ED = Exposure duration (yrs)
BW = Body weight (kg)
AT = Averaging time (days)
Recommended data defaults are as summarized below.
Parameter Source Documents Typical RME Values for
Residential Adulta
BR RAGS (EPA 1989b) 20 m3/day
EF RAGS Supplemental Guidance (EPA 1991) 350 days/yr
ED RAGS Supplemental Guidance (EPA 1991) 30 years
BW RAGS (EPA 1989b) 70 kg
AT RAGS (EPA 1989b)
RAGS Supplemental Guidance (EPA 1991)
30 years (noncancer)
70 years (cancer)
The relative magnitude of the inhaled dose of a COPC from air can be compared to the
ingested dose from soil as follows:
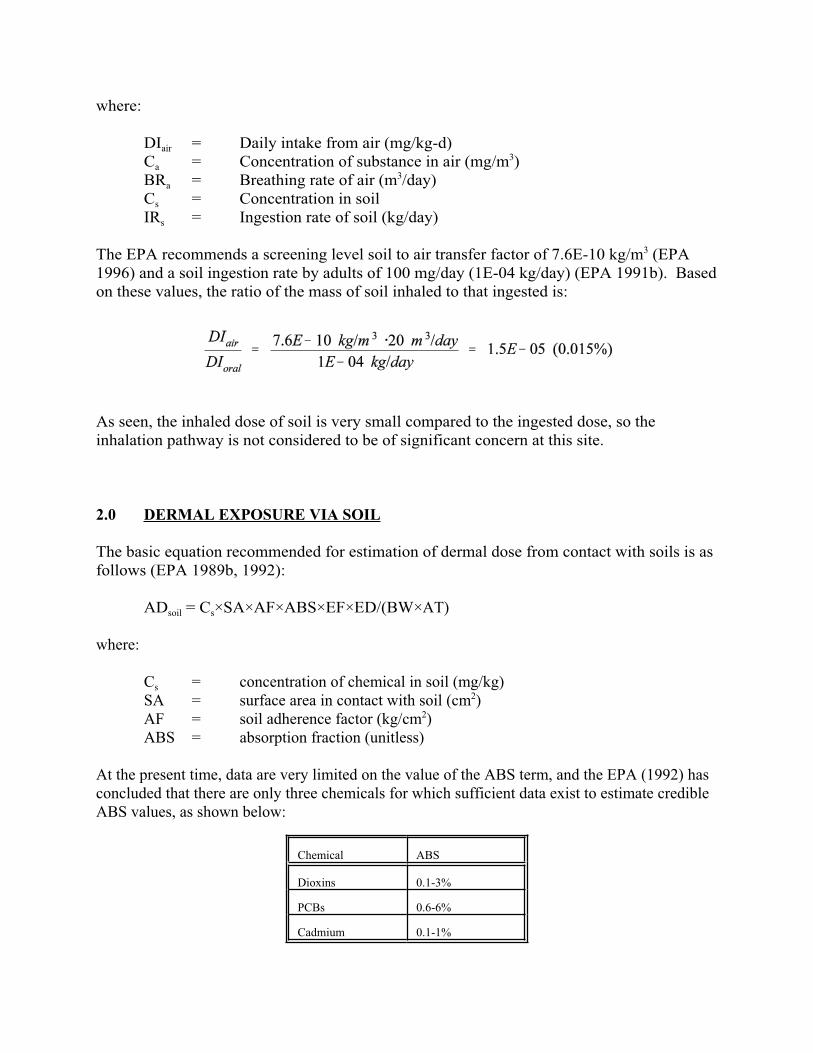
where:
DIair = Daily intake from air (mg/kg-d)
Ca = Concentration of substance in air (mg/m3)
BRa = Breathing rate of air (m3/day)
Cs = Concentration in soil
IRs = Ingestion rate of soil (kg/day)
The EPA recommends a screening level soil to air transfer factor of 7.6E-10 kg/m3 (EPA
1996) and a soil ingestion rate by adults of 100 mg/day (1E-04 kg/day) (EPA 1991b). Based
on these values, the ratio of the mass of soil inhaled to that ingested is:
As seen, the inhaled dose of soil is very small compared to the ingested dose, so the
inhalation pathway is not considered to be of significant concern at this site.
2.0 DERMAL EXPOSURE VIA SOIL
The basic equation recommended for estimation of dermal dose from contact with soils is as
follows (EPA 1989b, 1992):
ADsoil = Cs×SA×AF×ABS×EF×ED/(BW×AT)
where:
Cs = concentration of chemical in soil (mg/kg)
SA = surface area in contact with soil (cm2)
AF = soil adherence factor (kg/cm2)
ABS = absorption fraction (unitless)
At the present time, data are very limited on the value of the ABS term, and the EPA (1992) has
concluded that there are only three chemicals for which sufficient data exist to estimate credible
ABS values, as shown below:
Chemical ABS
Dioxins 0.1-3%
PCBs 0.6-6%
Cadmium 0.1-1%
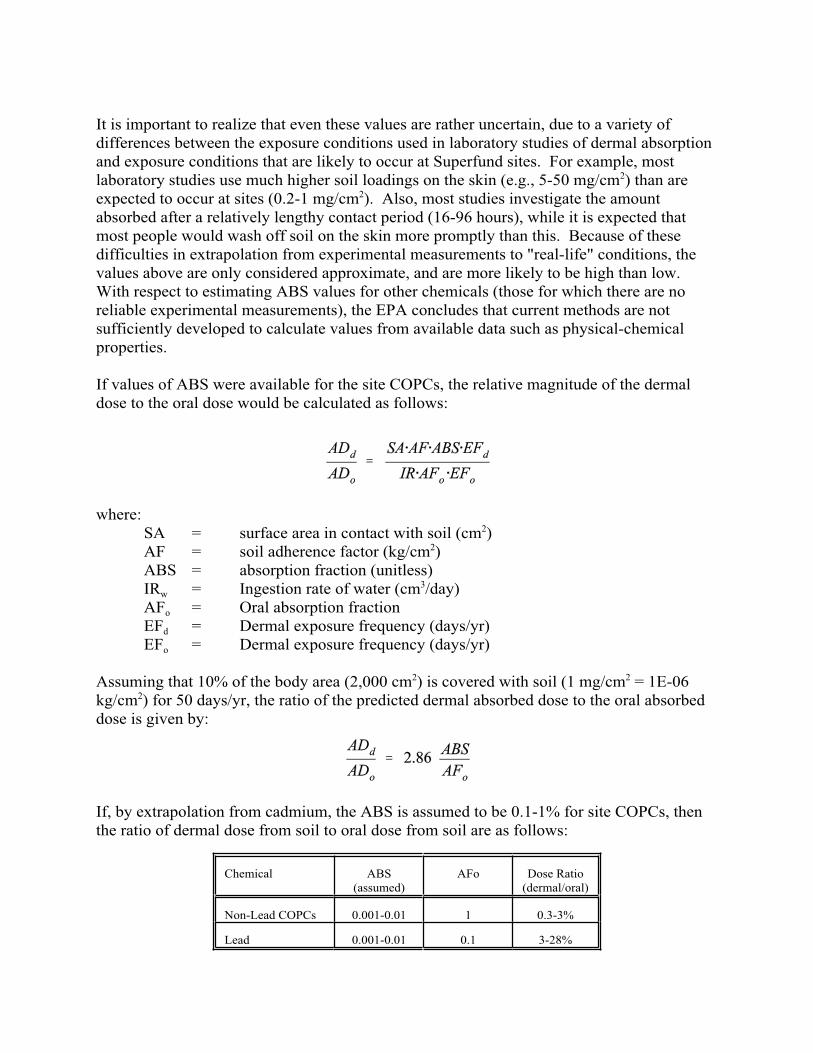
It is important to realize that even these values are rather uncertain, due to a variety of
differences between the exposure conditions used in laboratory studies of dermal absorption
and exposure conditions that are likely to occur at Superfund sites. For example, most
laboratory studies use much higher soil loadings on the skin (e.g., 5-50 mg/cm2) than are
expected to occur at sites (0.2-1 mg/cm2). Also, most studies investigate the amount
absorbed after a relatively lengthy contact period (16-96 hours), while it is expected that
most people would wash off soil on the skin more promptly than this. Because of these
difficulties in extrapolation from experimental measurements to "real-life" conditions, the
values above are only considered approximate, and are more likely to be high than low.
With respect to estimating ABS values for other chemicals (those for which there are no
reliable experimental measurements), the EPA concludes that current methods are not
sufficiently developed to calculate values from available data such as physical-chemical
properties.
If values of ABS were available for the site COPCs, the relative magnitude of the dermal
dose to the oral dose would be calculated as follows:
where:
SA = surface area in contact with soil (cm2)
AF = soil adherence factor (kg/cm2)
ABS = absorption fraction (unitless)
IRw = Ingestion rate of water (cm3/day)
AFo = Oral absorption fraction
EFd = Dermal exposure frequency (days/yr)
EFo = Dermal exposure frequency (days/yr)
Assuming that 10% of the body area (2,000 cm2) is covered with soil (1 mg/cm2 = 1E-06
kg/cm2) for 50 days/yr, the ratio of the predicted dermal absorbed dose to the oral absorbed
dose is given by:
If, by extrapolation from cadmium, the ABS is assumed to be 0.1-1% for site COPCs, then
the ratio of dermal dose from soil to oral dose from soil are as follows:
Chemical ABS
(assumed)
AFo Dose Ratio
(dermal/oral)
Non-Lead COPCs 0.001-0.01 1 0.3-3%
Lead 0.001-0.01 0.1 3-28%

Because the value of ABS is not available for the site COPCs, these values should not be
considered to be reliable. However, this calculation does support the conclusion that dermal
absorption of metals from dermal contact with soil is likely to be relatively minor compared
to the oral pathway, and omission of this pathway is not likely to lead to a substantial
underestimate of exposure or risk.

4.0 REFERENCES
EPA. 1989a. Exposure Factors Handbook. Office of Health and Environmental Assessment,
Washington, DC. EPA/600/8-89/043.
EPA. 1989b. Risk Assessment Guidance for Superfund. Volume I: Human Health
Evaluation Manual Part A. Interim Final. Office of Solid Waste and Emergency
Response (OSWER), Washington, DC. OSWER Directive 9285.701A.
EPA. 1991a. Risk Assessment Guidance for Superfund. Volume I: Human Health
Evaluation Manual (Part B, Development of Risk-Based Preliminary remediation
Goals). Interim. Office of Research and Development, Washington, DC.
EPA/540/R-92-003.
EPA. 1991b. "Standard Default Exposure Factors." Supplemental Guidance for Risk
Assessment Guidance for Superfund, Volume I: Human Health Evaluation Manual.
OERR, Washington, DC. OSWER Directive 9285.6-03.
EPA. 1992. Dermal Exposure Assessment: Principles and Applications. Interim Report.
Office of Research and Development, Washington, DC. EPA/600/8-91/011B.
EPA. 1996. Soil Screening Guidance: User’s Guide. Office of Solid Waste and Emergency
Response, Washington DC. Publication 9355.4-23. July 1996.
Owen BA. 1990. Literature-derived Absorption Coefficients for 39 Chemicals via Oral and
Inhalation Routes of Exposure. Reg. Toxicol. Pharmacol. 11:237-252.

APPENDIX DIEUBK MODEL INPUTS AND RESULTS
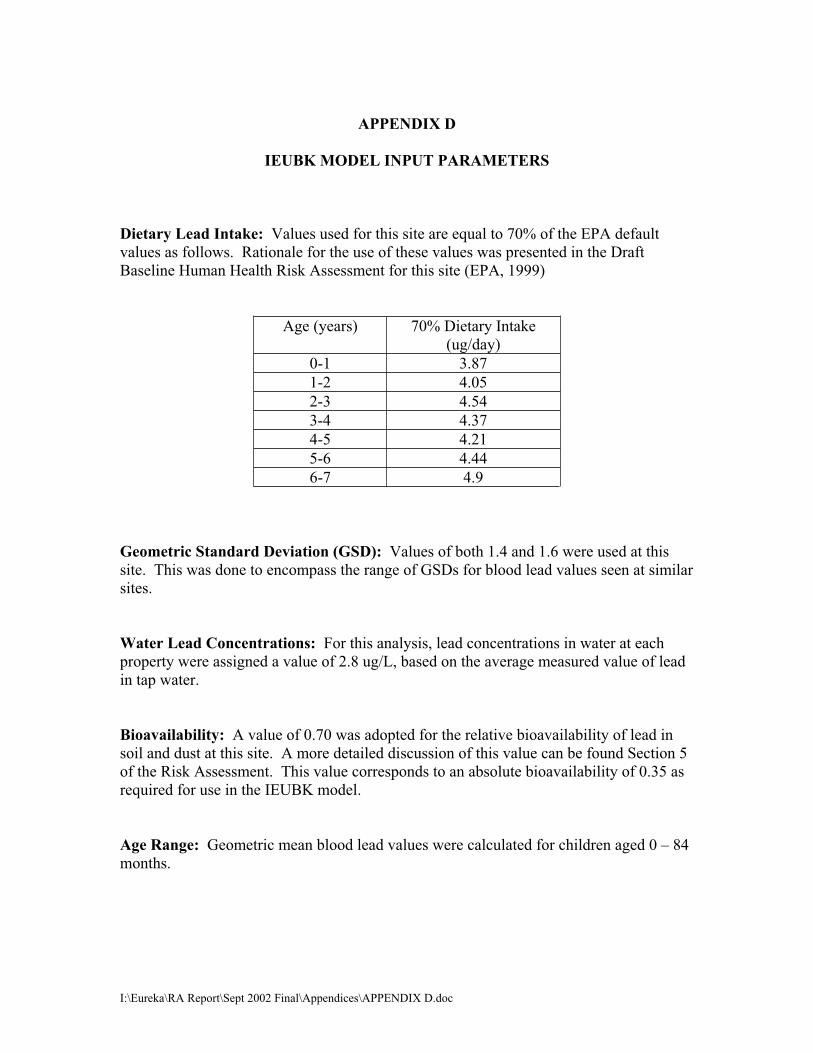
I:\Eureka\RA Report\Sept 2002 Final\Appendices\APPENDIX D.doc
APPENDIX D
IEUBK MODEL INPUT PARAMETERS
Dietary Lead Intake: Values used for this site are equal to 70% of the EPA default
values as follows. Rationale for the use of these values was presented in the Draft
Baseline Human Health Risk Assessment for this site (EPA, 1999)
Age (years) 70% Dietary Intake
(ug/day)
0-1 3.87
1-2 4.05
2-3 4.54
3-4 4.37
4-5 4.21
5-6 4.44
6-7 4.9
Geometric Standard Deviation (GSD): Values of both 1.4 and 1.6 were used at this
site. This was done to encompass the range of GSDs for blood lead values seen at similar
sites.
Water Lead Concentrations: For this analysis, lead concentrations in water at each
property were assigned a value of 2.8 ug/L, based on the average measured value of lead
in tap water.
Bioavailability: A value of 0.70 was adopted for the relative bioavailability of lead in
soil and dust at this site. A more detailed discussion of this value can be found Section 5
of the Risk Assessment. This value corresponds to an absolute bioavailability of 0.35 as
required for use in the IEUBK model.
Age Range: Geometric mean blood lead values were calculated for children aged 0 – 84
months.
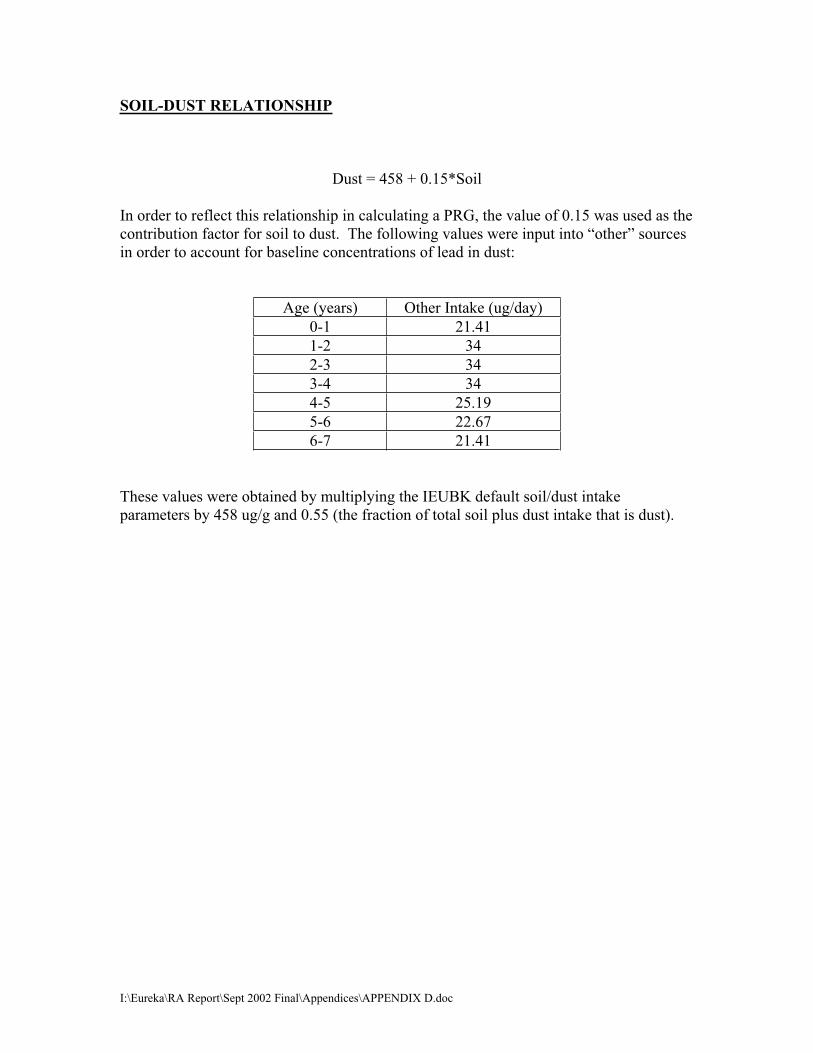
I:\Eureka\RA Report\Sept 2002 Final\Appendices\APPENDIX D.doc
SOIL-DUST RELATIONSHIP
Dust = 458 + 0.15*Soil
In order to reflect this relationship in calculating a PRG, the value of 0.15 was used as the
contribution factor for soil to dust. The following values were input into “other” sources
in order to account for baseline concentrations of lead in dust:
Age (years) Other Intake (ug/day)
0-1 21.41
1-2 34
2-3 34
3-4 34
4-5 25.19
5-6 22.67
6-7 21.41
These values were obtained by multiplying the IEUBK default soil/dust intake
parameters by 458 ug/g and 0.55 (the fraction of total soil plus dust intake that is dust).

APPENDIX EISE MODEL INPUTS
I:\Eureka\RA Report\Sept 2002 Final\Appendices\Appendix E.doc
APPENDIX E
APPLICATION OF THE ISE MODEL AT THE EUREKA MILLS SITE
1.0 Introduction
Recently, a variation to the IEUBK model has been under development by USEPA
Region 8. This model, referred to as the Integrated Stochastic Exposure (ISE) Model for
Lead is similar to the IEUBK model, except that it uses probability density functions
(PDFs) rather than point estimates as inputs for most concentration and exposure
parameters. These distributions are combined using Monte Carlo simulation techniques
to yield a predicted distribution of absorbed lead doses (ug/day) for different members of
the exposed population. These doses are then used as input to the biokinetic portion of
the IEUBK model in order to generate the predicted distribution of blood lead values in
the population. Thus, the variability between children is evaluated in the ISE model
based on the variability in environmental and exposure parameters, rather than by
application of an assumed or estimated GSD value as in the IEUBK model. A more
complete description of the model and of the input parameters can be found in Goodrum
et al. (1996). Because this model has not yet undergone peer review or validation, it is
considered to be only an investigative tool.
This model was used at the Eureka Mills Site in order to assess risks to children from
exposure to lead in site media. This Appendix details the methods and input parameters
used in this analysis. A brief discussion of the results is provided in the main text of the
risk assessment in Section 5.6.3 – Uncertainty in Modeling Approach.
1.1 Model Inputs
All of the inputs used in the ISE model are based on the same data as were used in the
IEUBK model analysis, except that distributions rather than point estimates were used for
twelve model variables. These parameters are: soil/dust intake rate, fraction ingested as
soil, environmental (dust, water, air) concentrations, dietary intake, absorption (soil, dust,
water, and dietary), and air ventilation rate. These variables were selected for modeling
as distributions because sensitivity analysis reveals that the output of the ISE model is
especially sensitive to several of these terms (Griffin et al. 1999b). The basis for each of
the distributions is summarized below.
Concentration of Lead in Soil
The ISE model was run using several different nominal soil concentrations ranging from
0 to 16,000 mg/kg. Observed site soil lead concentrations are within this selected range.
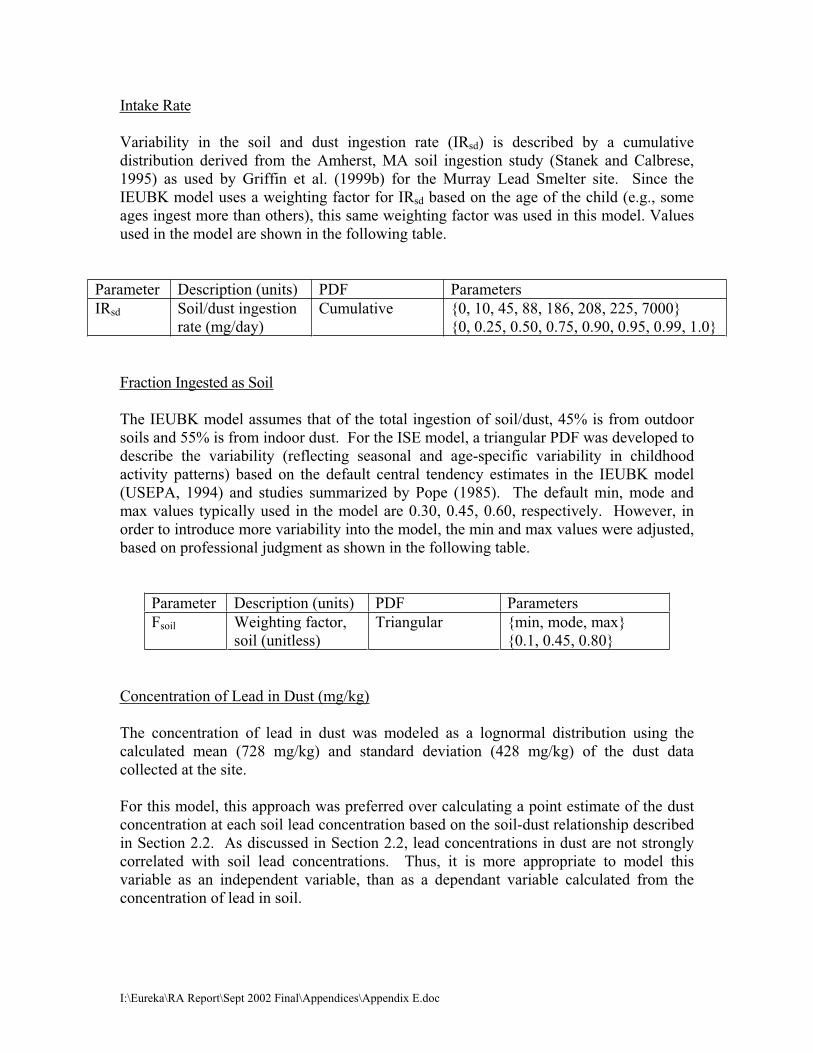
I:\Eureka\RA Report\Sept 2002 Final\Appendices\Appendix E.doc
Intake Rate
Variability in the soil and dust ingestion rate (IRsd) is described by a cumulative
distribution derived from the Amherst, MA soil ingestion study (Stanek and Calbrese,
1995) as used by Griffin et al. (1999b) for the Murray Lead Smelter site. Since the
IEUBK model uses a weighting factor for IRsd based on the age of the child (e.g., some
ages ingest more than others), this same weighting factor was used in this model. Values
used in the model are shown in the following table.
Parameter Description (units) PDF Parameters
IRsd Soil/dust ingestion
rate (mg/day)
Cumulative {0, 10, 45, 88, 186, 208, 225, 7000}
{0, 0.25, 0.50, 0.75, 0.90, 0.95, 0.99, 1.0}
Fraction Ingested as Soil
The IEUBK model assumes that of the total ingestion of soil/dust, 45% is from outdoor
soils and 55% is from indoor dust. For the ISE model, a triangular PDF was developed to
describe the variability (reflecting seasonal and age-specific variability in childhood
activity patterns) based on the default central tendency estimates in the IEUBK model
(USEPA, 1994) and studies summarized by Pope (1985). The default min, mode and
max values typically used in the model are 0.30, 0.45, 0.60, respectively. However, in
order to introduce more variability into the model, the min and max values were adjusted,
based on professional judgment as shown in the following table.
Parameter Description (units) PDF Parameters
Fsoil Weighting factor,
soil (unitless)
Triangular {min, mode, max}
{0.1, 0.45, 0.80}
Concentration of Lead in Dust (mg/kg)
The concentration of lead in dust was modeled as a lognormal distribution using the
calculated mean (728 mg/kg) and standard deviation (428 mg/kg) of the dust data
collected at the site.
For this model, this approach was preferred over calculating a point estimate of the dust
concentration at each soil lead concentration based on the soil-dust relationship described
in Section 2.2. As discussed in Section 2.2, lead concentrations in dust are not strongly
correlated with soil lead concentrations. Thus, it is more appropriate to model this
variable as an independent variable, than as a dependant variable calculated from the
concentration of lead in soil.
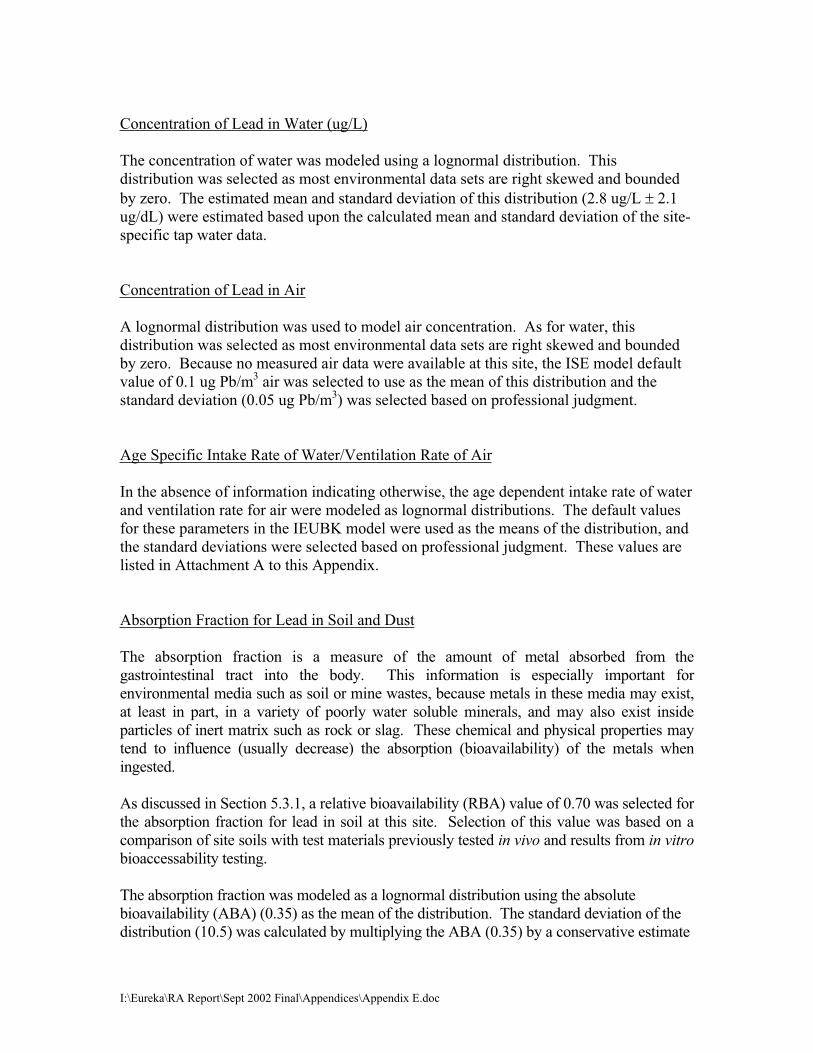
I:\Eureka\RA Report\Sept 2002 Final\Appendices\Appendix E.doc
Concentration of Lead in Water (ug/L)
The concentration of water was modeled using a lognormal distribution. This
distribution was selected as most environmental data sets are right skewed and bounded
by zero. The estimated mean and standard deviation of this distribution (2.8 ug/L 2.1
ug/dL) were estimated based upon the calculated mean and standard deviation of the site-
specific tap water data.
Concentration of Lead in Air
A lognormal distribution was used to model air concentration. As for water, this
distribution was selected as most environmental data sets are right skewed and bounded
by zero. Because no measured air data were available at this site, the ISE model default
value of 0.1 ug Pb/m3 air was selected to use as the mean of this distribution and the
standard deviation (0.05 ug Pb/m3) was selected based on professional judgment.
Age Specific Intake Rate of Water/Ventilation Rate of Air
In the absence of information indicating otherwise, the age dependent intake rate of water
and ventilation rate for air were modeled as lognormal distributions. The default values
for these parameters in the IEUBK model were used as the means of the distribution, and
the standard deviations were selected based on professional judgment. These values are
listed in Attachment A to this Appendix.
Absorption Fraction for Lead in Soil and Dust
The absorption fraction is a measure of the amount of metal absorbed from the
gastrointestinal tract into the body. This information is especially important for
environmental media such as soil or mine wastes, because metals in these media may exist,
at least in part, in a variety of poorly water soluble minerals, and may also exist inside
particles of inert matrix such as rock or slag. These chemical and physical properties may
tend to influence (usually decrease) the absorption (bioavailability) of the metals when
ingested.
As discussed in Section 5.3.1, a relative bioavailability (RBA) value of 0.70 was selected for
the absorption fraction for lead in soil at this site. Selection of this value was based on a
comparison of site soils with test materials previously tested in vivo and results from in vitrobioaccessability testing.
The absorption fraction was modeled as a lognormal distribution using the absolute
bioavailability (ABA) (0.35) as the mean of the distribution. The standard deviation of the
distribution (10.5) was calculated by multiplying the ABA (0.35) by a conservative estimate
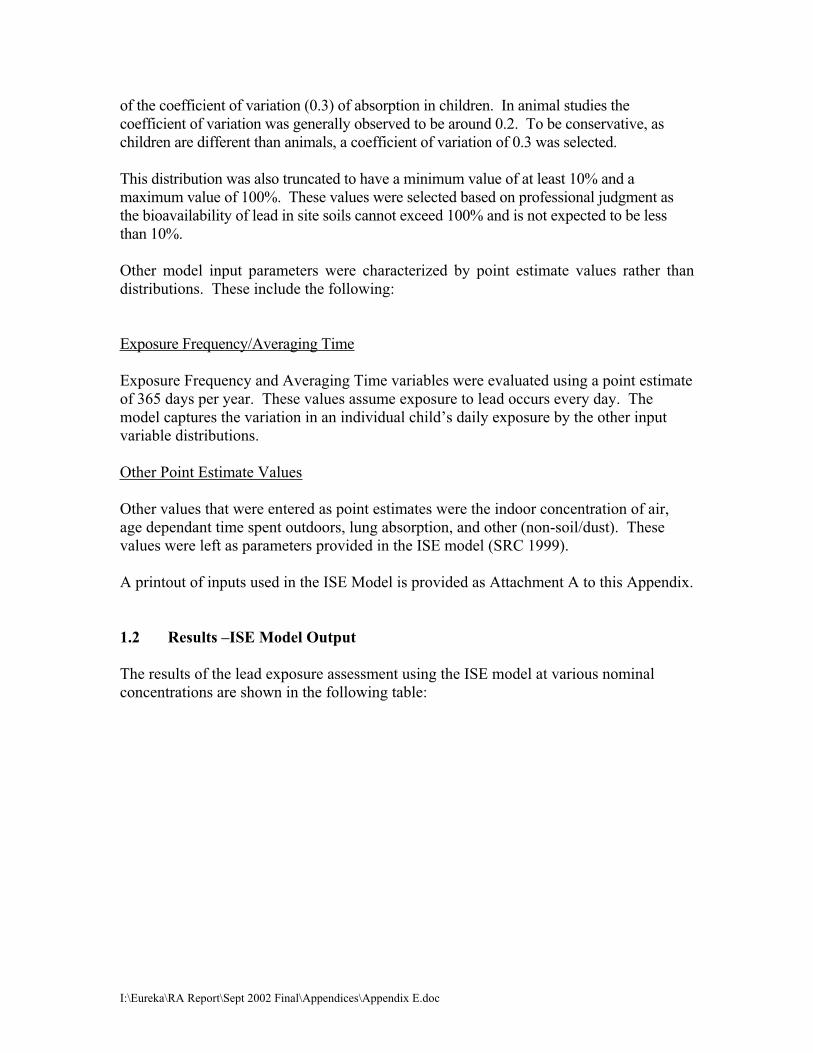
I:\Eureka\RA Report\Sept 2002 Final\Appendices\Appendix E.doc
of the coefficient of variation (0.3) of absorption in children. In animal studies the
coefficient of variation was generally observed to be around 0.2. To be conservative, as
children are different than animals, a coefficient of variation of 0.3 was selected.
This distribution was also truncated to have a minimum value of at least 10% and a
maximum value of 100%. These values were selected based on professional judgment as
the bioavailability of lead in site soils cannot exceed 100% and is not expected to be less
than 10%.
Other model input parameters were characterized by point estimate values rather than
distributions. These include the following:
Exposure Frequency/Averaging Time
Exposure Frequency and Averaging Time variables were evaluated using a point estimate
of 365 days per year. These values assume exposure to lead occurs every day. The
model captures the variation in an individual child’s daily exposure by the other input
variable distributions.
Other Point Estimate Values
Other values that were entered as point estimates were the indoor concentration of air,
age dependant time spent outdoors, lung absorption, and other (non-soil/dust). These
values were left as parameters provided in the ISE model (SRC 1999).
A printout of inputs used in the ISE Model is provided as Attachment A to this Appendix.
1.2 Results –ISE Model Output
The results of the lead exposure assessment using the ISE model at various nominal
concentrations are shown in the following table:
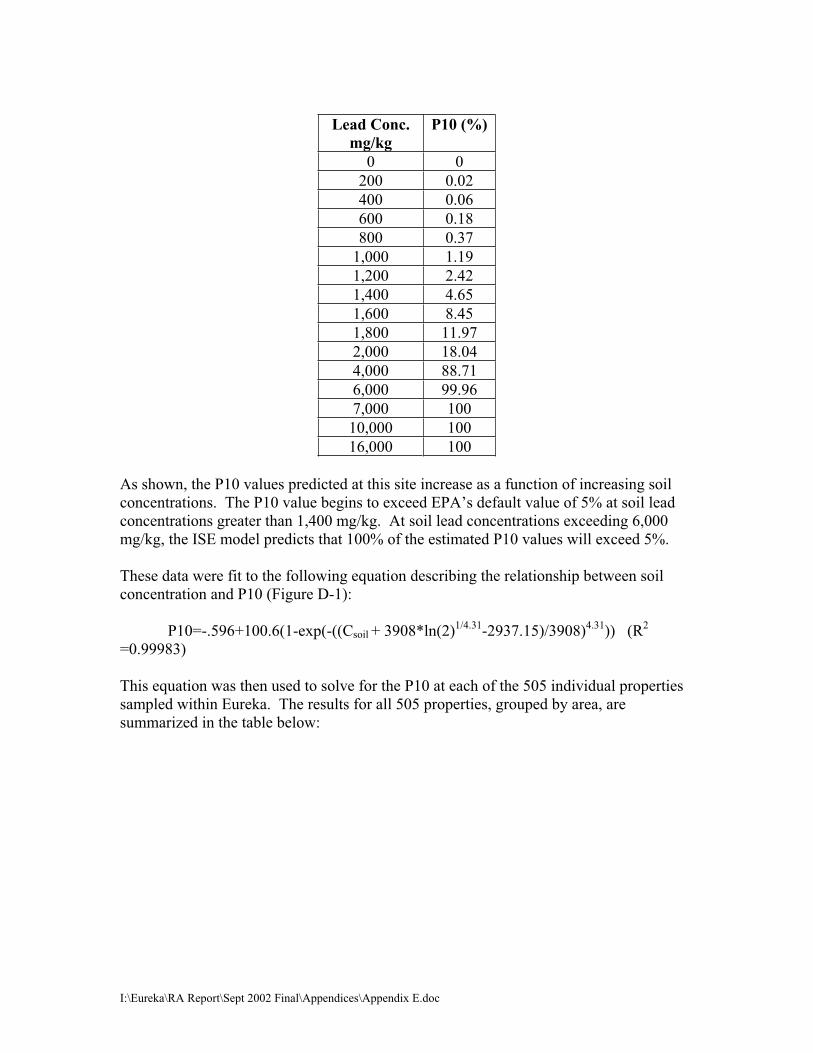
I:\Eureka\RA Report\Sept 2002 Final\Appendices\Appendix E.doc
Lead Conc.
mg/kg
P10 (%)
0 0
200 0.02
400 0.06
600 0.18
800 0.37
1,000 1.19
1,200 2.42
1,400 4.65
1,600 8.45
1,800 11.97
2,000 18.04
4,000 88.71
6,000 99.96
7,000 100
10,000 100
16,000 100
As shown, the P10 values predicted at this site increase as a function of increasing soil
concentrations. The P10 value begins to exceed EPA’s default value of 5% at soil lead
concentrations greater than 1,400 mg/kg. At soil lead concentrations exceeding 6,000
mg/kg, the ISE model predicts that 100% of the estimated P10 values will exceed 5%.
These data were fit to the following equation describing the relationship between soil
concentration and P10 (Figure D-1):
P10=-.596+100.6(1-exp(-((Csoil + 3908*ln(2)1/4.31
-2937.15)/3908)4.31
)) (R2
=0.99983)
This equation was then used to solve for the P10 at each of the 505 individual properties
sampled within Eureka. The results for all 505 properties, grouped by area, are
summarized in the table below:
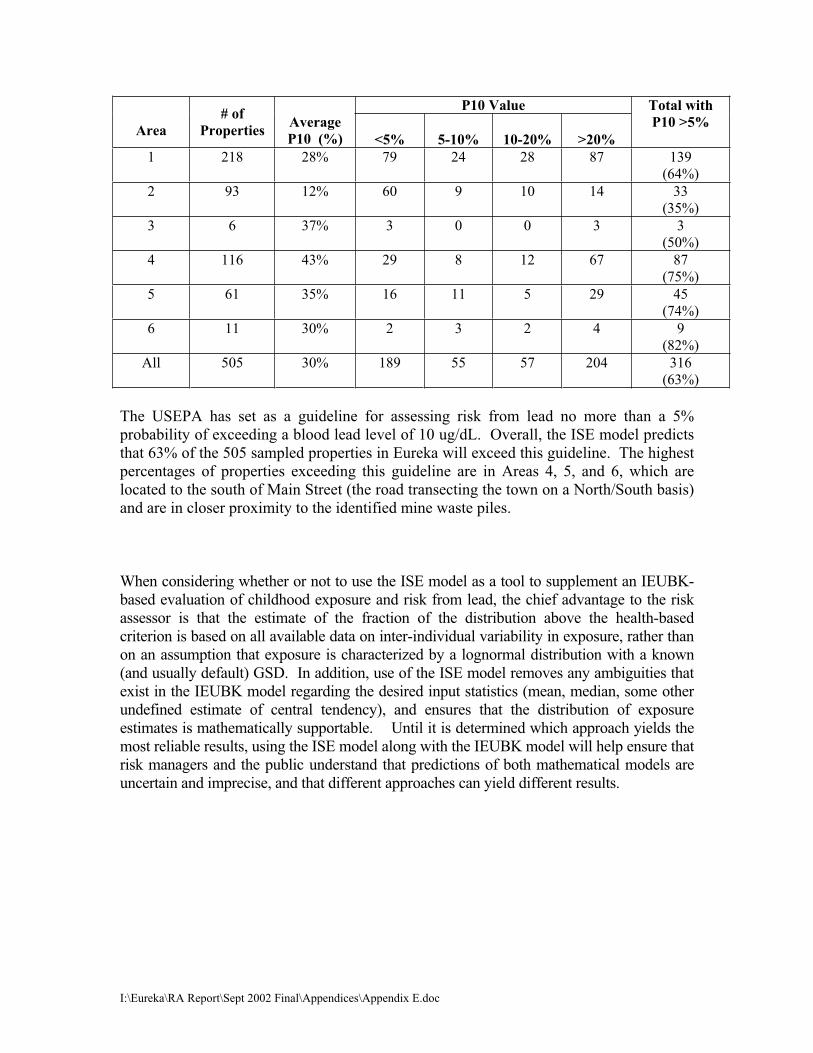
I:\Eureka\RA Report\Sept 2002 Final\Appendices\Appendix E.doc
P10 Value
Area
# of
PropertiesAverage
P10 (%) <5% 5-10% 10-20% >20%
Total with
P10 >5%
1 218 28% 79 24 28 87 139
(64%)
2 93 12% 60 9 10 14 33
(35%)
3 6 37% 3 0 0 3 3
(50%)
4 116 43% 29 8 12 67 87
(75%)
5 61 35% 16 11 5 29 45
(74%)
6 11 30% 2 3 2 4 9
(82%)
All 505 30% 189 55 57 204 316
(63%)
The USEPA has set as a guideline for assessing risk from lead no more than a 5%
probability of exceeding a blood lead level of 10 ug/dL. Overall, the ISE model predicts
that 63% of the 505 sampled properties in Eureka will exceed this guideline. The highest
percentages of properties exceeding this guideline are in Areas 4, 5, and 6, which are
located to the south of Main Street (the road transecting the town on a North/South basis)
and are in closer proximity to the identified mine waste piles.
When considering whether or not to use the ISE model as a tool to supplement an IEUBK-
based evaluation of childhood exposure and risk from lead, the chief advantage to the risk
assessor is that the estimate of the fraction of the distribution above the health-based
criterion is based on all available data on inter-individual variability in exposure, rather than
on an assumption that exposure is characterized by a lognormal distribution with a known
(and usually default) GSD. In addition, use of the ISE model removes any ambiguities that
exist in the IEUBK model regarding the desired input statistics (mean, median, some other
undefined estimate of central tendency), and ensures that the distribution of exposure
estimates is mathematically supportable. Until it is determined which approach yields the
most reliable results, using the ISE model along with the IEUBK model will help ensure that
risk managers and the public understand that predictions of both mathematical models are
uncertain and imprecise, and that different approaches can yield different results.

I:\Eureka\RA Report\Sept 2002 Final\Appendices\Appendix E.doc
ATTACHMENT A
ISE MODEL INPUTS
AT/EF:
=====
Exposure Frequency Point 365.00 days/yr
Averaging Time Point 365.00 days/yr
SOIL:
====
C_soil (soil Pb conc) Point 600 ug Pb/g
IRsd (soil+dust IR) PDF-Cumulative -------------- mg/day
Number: 8 Min: 0 Max: 7000
Values: {0,10,45,88,186,208,225,7000}
Percen: {0,0.25,0.5,0.75,0.9,0.95,0.99,1}
Age: 0-1 IR scale factor Point 0.6296
Age: 1-2 IR scale factor Point 1
Age: 2-3 IR scale factor Point 1
Age: 3-4 IR scale factor Point 1
Age: 4-5 IR scale factor Point 0.7407
Age: 5-6 IR scale factor Point 0.6666
Age: 6-7 IR scale factor Point 0.6296
Fs (frac ingest as soil) PDF-Triangular (0.1,0.45,0.8)
DUST:
====
C_dust (dust Pb conc) PDF-Log Normal (728, 428) ug Pb/g soil
WATER:
=====
C_water (water Pb Conc) PDF-Log Normal (2.8, 2.1) ug Pb/L
Age: 0-1 IR Water PDF-Log Normal (0.2, 0.2) L/day
Age: 1-2 IR Water PDF-Log Normal (0.5, 0.4) L/day
Age: 2-3 IR Water PDF-Log Normal (0.52, 0.4) L/day
Age: 3-4 IR Water PDF-Log Normal (0.53, 0.4) L/day
Age: 4-5 IR Water PDF-Log Normal (0.55, 0.4) L/day
Age: 5-6 IR Water PDF-Log Normal (0.58, 0.4) L/day
Age: 6-7 IR Water PDF-Log Normal (0.59, 0.4) L/day
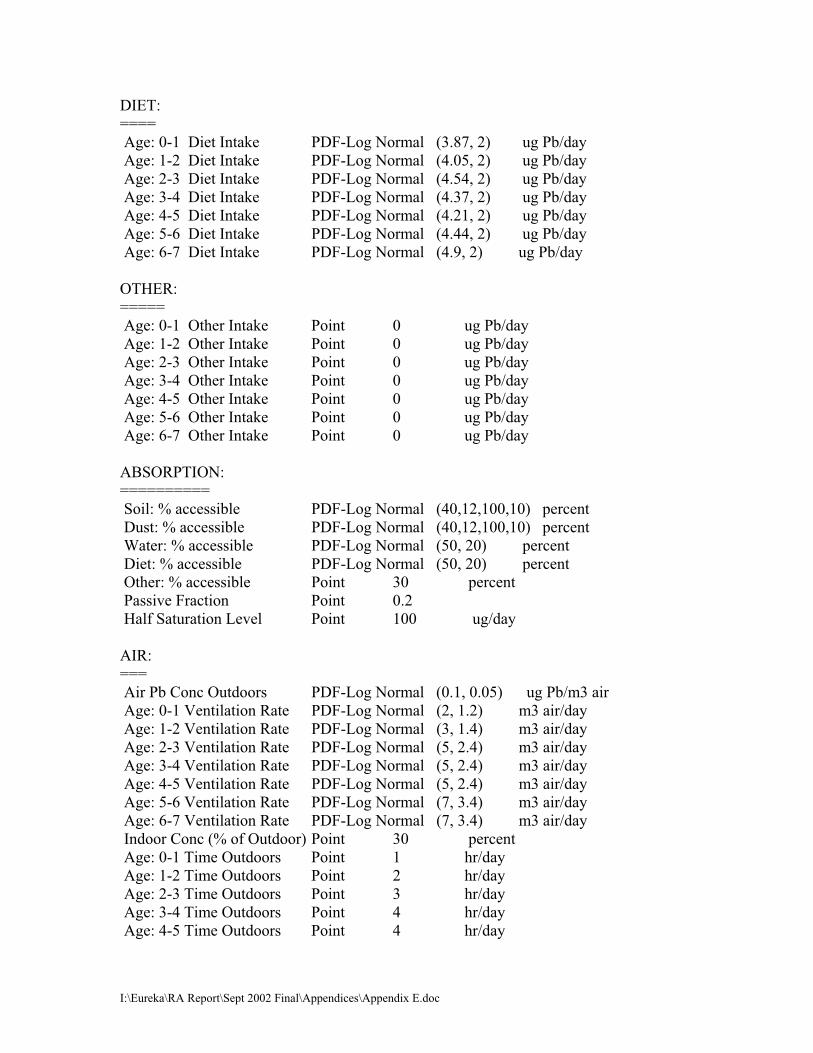
I:\Eureka\RA Report\Sept 2002 Final\Appendices\Appendix E.doc
DIET:
====
Age: 0-1 Diet Intake PDF-Log Normal (3.87, 2) ug Pb/day
Age: 1-2 Diet Intake PDF-Log Normal (4.05, 2) ug Pb/day
Age: 2-3 Diet Intake PDF-Log Normal (4.54, 2) ug Pb/day
Age: 3-4 Diet Intake PDF-Log Normal (4.37, 2) ug Pb/day
Age: 4-5 Diet Intake PDF-Log Normal (4.21, 2) ug Pb/day
Age: 5-6 Diet Intake PDF-Log Normal (4.44, 2) ug Pb/day
Age: 6-7 Diet Intake PDF-Log Normal (4.9, 2) ug Pb/day
OTHER:
=====
Age: 0-1 Other Intake Point 0 ug Pb/day
Age: 1-2 Other Intake Point 0 ug Pb/day
Age: 2-3 Other Intake Point 0 ug Pb/day
Age: 3-4 Other Intake Point 0 ug Pb/day
Age: 4-5 Other Intake Point 0 ug Pb/day
Age: 5-6 Other Intake Point 0 ug Pb/day
Age: 6-7 Other Intake Point 0 ug Pb/day
ABSORPTION:
==========
Soil: % accessible PDF-Log Normal (40,12,100,10) percent
Dust: % accessible PDF-Log Normal (40,12,100,10) percent
Water: % accessible PDF-Log Normal (50, 20) percent
Diet: % accessible PDF-Log Normal (50, 20) percent
Other: % accessible Point 30 percent
Passive Fraction Point 0.2
Half Saturation Level Point 100 ug/day
AIR:
===
Air Pb Conc Outdoors PDF-Log Normal (0.1, 0.05) ug Pb/m3 air
Age: 0-1 Ventilation Rate PDF-Log Normal (2, 1.2) m3 air/day
Age: 1-2 Ventilation Rate PDF-Log Normal (3, 1.4) m3 air/day
Age: 2-3 Ventilation Rate PDF-Log Normal (5, 2.4) m3 air/day
Age: 3-4 Ventilation Rate PDF-Log Normal (5, 2.4) m3 air/day
Age: 4-5 Ventilation Rate PDF-Log Normal (5, 2.4) m3 air/day
Age: 5-6 Ventilation Rate PDF-Log Normal (7, 3.4) m3 air/day
Age: 6-7 Ventilation Rate PDF-Log Normal (7, 3.4) m3 air/day
Indoor Conc (% of Outdoor) Point 30 percent
Age: 0-1 Time Outdoors Point 1 hr/day
Age: 1-2 Time Outdoors Point 2 hr/day
Age: 2-3 Time Outdoors Point 3 hr/day
Age: 3-4 Time Outdoors Point 4 hr/day
Age: 4-5 Time Outdoors Point 4 hr/day
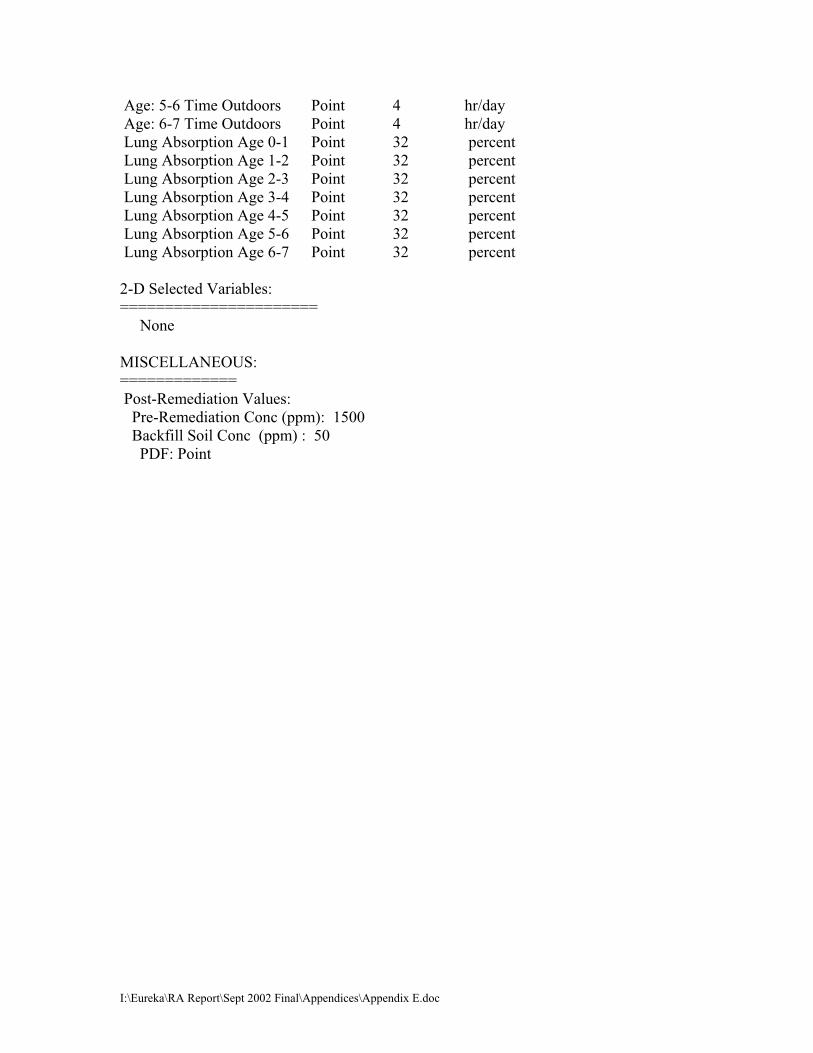
I:\Eureka\RA Report\Sept 2002 Final\Appendices\Appendix E.doc
Age: 5-6 Time Outdoors Point 4 hr/day
Age: 6-7 Time Outdoors Point 4 hr/day
Lung Absorption Age 0-1 Point 32 percent
Lung Absorption Age 1-2 Point 32 percent
Lung Absorption Age 2-3 Point 32 percent
Lung Absorption Age 3-4 Point 32 percent
Lung Absorption Age 4-5 Point 32 percent
Lung Absorption Age 5-6 Point 32 percent
Lung Absorption Age 6-7 Point 32 percent
2-D Selected Variables:
======================
None
MISCELLANEOUS:
=============
Post-Remediation Values:
Pre-Remediation Conc (ppm): 1500
Backfill Soil Conc (ppm) : 50
PDF: Point