filled glass composites for sealing of solid oxide fuel cells
TRANSCRIPT

SANDIA REPORT SAND2009-2255 Unlimited Release Distributed April 2009
Filled Glass Composites for Sealing of Solid Oxide Fuel Cells
Ronald E. Loehman, Terry Garino, Rajan Tandon, Erica Corral, Mathieu Brochu, Bryan Gauntt and Scarlett Widgeon Prepared by Sandia National Laboratories Albuquerque, New Mexico 87185 and Livermore, California 94550
Sandia is a multiprogram laboratory operated by Sandia Corporation, a Lockheed Martin Company, for the United States Department of Energy’s National Nuclear Security Administration under Contract DE-AC04-94AL85000.
Approved for public release; further dissemination unlimited.

Issued by Sandia National Laboratories, operated for the United States Department of Energy by Sandia Corporation. NOTICE: This report was prepared as an account of work sponsored by an agency of the United States Government. Neither the United States Government, nor any agency thereof, nor any of their employees, nor any of their contractors, subcontractors, or their employees, make any warranty, express or implied, or assume any legal liability or responsibility for the accuracy, completeness, or usefulness of any information, apparatus, product, or process disclosed, or represent that its use would not infringe privately owned rights. Reference herein to any specific commercial product, process, or service by trade name, trademark, manufacturer, or otherwise, does not necessarily constitute or imply its endorsement, recommendation, or favoring by the United States Government, any agency thereof, or any of their contractors or subcontractors. The views and opinions expressed herein do not necessarily state or reflect those of the United States Government, any agency thereof, or any of their contractors. Printed in the United States of America. This report has been reproduced directly from the best available copy. Available to DOE and DOE contractors from U.S. Department of Energy Office of Scientific and Technical Information P.O. Box 62 Oak Ridge, TN 37831 Telephone: (865) 576-8401 Facsimile: (865) 576-5728 E-Mail: [email protected] Online ordering: http://www.osti.gov/bridge Available to the public from U.S. Department of Commerce National Technical Information Service 5285 Port Royal Rd. Springfield, VA 22161 Telephone: (800) 553-6847 Facsimile: (703) 605-6900 E-Mail: [email protected] Online order: http://www.ntis.gov/help/ordermethods.asp?loc=7-4-0#online

3
SAND2009-2255 Unlimited Release
Distributed April 2009
Filled Glass Composites for Sealing of Solid Oxide Fuel Cells
Ronald E. Loehman, Terry Garino, Rajan Tandon, Erica Corral, Mathieu Brochu,
Bryan Gauntt and Scarlett Widgeon,
Ceramic Processing and Inorganic Materials Dept. Electronic and Nanostructured Materials Dept.
Materials Reliability Dept. Sandia National Laboratories
P.O. Box 5800 Albuquerque, NM 87185
Abstract
Glasses filled with ceramic or metallic powders have been developed for use as seals for solid oxide fuel cells (SOFC’s) as part of the U.S. Department of Energy’s Solid State Energy Conversion Alliance (SECA) Program. The composites of glass (alkaline earth-alumina-borate) and powders (~20 vol% of yttria-stabilized zirconia or silver) were shown to form seals with SOFC materials at or below 900°C. The type and amount of powder were adjusted to optimize thermal expansion to match the SOFC materials and viscosity. Wetting studies indicated good wetting was achieved on the micro-scale and reaction studies indicated that the degree of reaction between the filled glasses and SOFC materials, including spinel-coated 441 stainless steel, at 750˚C is acceptable. A test rig was developed for measuring strengths of seals cycled between room temperature and typical SOFC operating temperatures. Our measurements showed that many of the 410 SS to 410 SS seals, made using silver-filled glass composites, were hermetic at 0.2 MPa (2 atm.) of pressure and that seals that leaked could be resealed by briefly heating them to 900°C. Seal strength measurements at elevated temperature (up to 950°C), measured using a second apparatus that we developed, indicated that seals maintained 0.02 MPa (0.2 atm.) overpressures for 30 min at 750°C with no leakage. Finally, the volatility of the borate component of sealing glasses under SOFC operational conditions was studied using weight loss measurements and found by extrapolation to be less than 5% for the projected SOFC lifetime.

4
DISCLAIMER
“This report was prepared as an account of work sponsored by an agency of the United States Government. Neither the United States Government nor any agency thereof, nor any of their employees, makes any warranty, express or implied, or assumes any legal liability or responsibility for the accuracy, completeness, or usefulness of any information, apparatus, product, or process disclosed, or represents that its use would not infringe privately owned rights. Reference herein to any specific commercial product, process, or service by trade name, trademark, manufacturer, or otherwise does not necessarily constitute or imply its endorsement, recommendation, or favoring by the United States Government or any agency thereof. The views and opinions of authors expressed herein do not necessarily state or reflect those of the United States Government or any agency thereof.”

5
TABLE OF CONTENTS Title Page .............................................................................................................................3 Abstract ................................................................................................................................3 Disclaimer ............................................................................................................................4 Executive Summary.............................................................................................................6 I INTRODUCTION ...................................................................................................7 II RESULTS AND DISCUSSION............................................................................10
II-1 Initial Screening Studies ............................................................................10 II-2 Viscosity Measurements on Composites ...................................................13 II-3 Wetting Studies on Composites .................................................................18 II-4 Reactivity Studies ......................................................................................20 II-5 Seal Strength Tests at Room and Elevated Temperatures .........................22 II-6 Long-term Stability Studies .......................................................................27
III SUMMARY...........................................................................................................32 IV FUTURE WORK...................................................................................................33 V REFERENCES ......................................................................................................34 APPENDIX........................................................................................................................35

6
EXECUTIVE SUMMARY
This report summarizes the development of glasses filled with ceramic or metallic particles for hermetic seals for solid oxide fuel cells (SOFCs) that was performed at Sandia National Laboratories as part of the Department of Energy’s Solid State Energy Conversion Alliance Program. The composite approach to solving this most challenging sealing problem has the advantage of flexibility in designing and controlling seal properties through the choice of filler composition, amount and particle size. We have demonstrated the feasibility of this approach using alkaline earth alumina-borate glasses with silver or yttria-stabilized zirconia fillers present at ~20 vol%. Properties such as coefficient of thermal expansion (CTE), glass transition temperature (Tg) and viscosity were measured and this data allowed us to choose the most suitable glasses and fillers to, for example, match the CTE of SOFC materials. The preferred compositions flow and bond to other SOFC components at temperatures generally below 900°C and wetting experiments indicated excellent wetting on the micro-scale. The interfacial interactions between the glasses and candidate interconnect stainless steels including spinel-coated 441 stainless steel showed that at 750°C, the extent of reaction was acceptably low. The strengths of seals were characterized both at room temperature and at SOFC use temperatures using gas overpressure techniques. The seals in general had adequate strength and, moreover, those that leaked could be resealed by reheating to the sealing temperature. Finally, volatilization of components, particularly B2O3, from glass surfaces was monitored by weight loss experiments and shown to be of minimal concern over the estimated SOFC lifetime. In conclusion, we have demonstrated that powder-filled glass composites provide a promising and flexible solution to the challenging problem of sealing planar SOFCs.

7
I. INTRODUCTION
Solid Oxide Fuel Cells (SOFCs) are multi-material structures formed primarily from high-purity metal oxide components that generate electricity directly from the electrochemical oxidation of a fuel. Since electricity is generated directly from the fuel, higher efficiency can be achieved compared to standard generating methods where the fuel is combusted. Because of their high efficiency and low emissions of pollutants, SOFCs have been identified as important alternative energy sources.[1,2] SOFCs also have several advantages over other types of fuel cells. Due to their relatively higher operating temperature, SOFCs do not need the expensive catalysts required by most types of low temperature fuel cells. Also because of the high temperatures, fuels can be internally reformed within the anode unlike low temperature fuel cells where, for example, catalyst poisoning by carbon monoxide will occur. This allows SOFCs to operate on a wide variety of fuels such as methane, propane, butane, natural gas, fermentation gas, gasified biomass and even paint fumes. Much of the early work on SOFCs was based on a tubular geometry, whereas recent interest has been on planar SOFC designs because they require simpler manufacturing processes, have relatively short current paths and produce higher power densities and efficiencies than tubular designs.[2,3] Planar SOFCs consist of a sandwich-like structure of an ionic oxygen-conducting electrolyte layer (typically yttria-stabilized zirconia, YSZ), an anode (typically nickel mixed with YSZ) that is exposed to the gaseous fuel, a cathode (typically lanthanum strontium magnetite, LSM) that is exposed to air, and an interconnect material. The interconnect layer sits between each individual cell made up of an anode, electrolyte and cathode, connecting them in series so that the electricity each cell generates can be combined. Since planar SOFC’s can operate at relatively low temperatures (600-800°C) compared to tubular designs, low cost ferritic stainless steel-based alloys are the interconnect materials of choice. In order to ensure efficient operation of a planar SOFC, a suitable sealant is required to prevent the fuel gas and air from mixing. Developing reliable methods for sealing solid oxide fuel cell stacks presents one of the most challenging set of performance requirements in the field of ceramic joining. For SOFC applications, the requirements on the sealing method for lifetimes up to 40,000 hr include [4]:
• adhesion of the sealing material to fuel cell components between room temperature and temperatures as high as 1000°C
• ability to provide a leak-tight seal at the SOFC operating temperature
• ability to maintain a seal while accommodating strains from SOFC components with different coefficients of thermal expansion (CTEs)
• no adverse reaction between the sealing material(s) and the fuel cell components at temperatures up to 1000°C
• chemical and physical stability of the sealant at temperatures up to 1000°C in oxidizing and reducing atmospheres
• thermal shock tolerance
• electrically insulating for some SOFC designs

8
Note also that the requirements may be contradictory. For example, being leak-tight and adherent at high temperatures suggests a refractory, stiff sealant, which may work against the requirement for thermal strain accommodation. Such situations are common, and seal developers know that seal design is specific to a particular component geometry and requires compromises among competing requirements. In many ways, the seal performance will control the structural integrity and mechanical stability of the SOFC stack, and could also determine the overall stack performance.[2] Accommodation of thermal expansion mismatch stresses will require SOFC seals to incorporate either a ductile metal or a high-viscosity glass that can relieve stresses through viscous creep. Of these, oxide glasses have been the most investigated. There have been many reports on the development of a variety of compositional systems to form suitable glass and glass-ceramics seals for SOFCs, including silicates, aluminosilicates, borosilicates, and aluminophosphates; i.e., see references [5-7] and references therein. Many of these sealing glasses have property or performance shortcomings, such as failure to remain thermomechanically stable under SOFC operational conditions, or the occurrence of deleterious interfacial reactions with other SOFC components. Moreover, the glass-only approach depends on finding a glass that has a high viscosity at the SOFC operating temperature and a weak viscosity-temperature function. In glass technology parlance, those are “long” glasses. Since stresses develop as the glass is cooled below its set point, one desires as low a set point as possible; however, glasses with low set points generally will be too fluid at SOFC operating temperatures to maintain a seal. Another approach that has been investigated utilizes glass-ceramics, materials that are processed initially as glass and then crystallized by appropriate heat treatment. This approach also suffers from some disadvantages. With glass-ceramics one is limited to the compositions and crystal morphologies allowed by the thermodynamic phase equilibrium relations. Also, generally in glass-ceramics it is difficult to control the microstructure or the eventual phase assemblage. To avoid these shortcomings of glasses and glass-ceramics and to provide maximum flexibility in controlling CTE and viscosity, we have investigated a powder-filled glass composite approach. The powder-filled glass composite method developed at Sandia National Laboratories has similar objectives to the glass and glass-ceramic approaches being pursued by other groups, but has the major advantage of far more flexibility in designing and controlling seal properties. This is because the composition of the glass and the filler are chosen independently and because further control of properties can be achieved by optimizing the amount of the filler, and by adjusting its particle size distribution. One is still constrained by the system thermodynamics, but wider ranges of compositions and microstructures are possible than with single glasses or with glass-ceramics.[8,9] In the work described here, we have demonstrated control of properties such as glass transition temperature and thermal expansion coefficient, by varying the compositions, amounts, and microstructures of the different phases. The choices were guided by thermochemical and composite microstructural models that allowed us to target specific seal properties for a given design.

9
This report summarizes a multi-year research and development project on SOFC seals performed at Sandia with funding from the DOE/SECA program. The salient accomplishments include:
• Synthesis of candidate glasses and measurement of their properties such as Tg and CTE.
• Fabrication of both ceramic and metal powder-filled glass seals.
• Characterization of viscosity and wetting behavior of composite sealing materials.
• Studies of the reactivity of seal glasses with SOFC materials.
• Determination of the strength of glass composite seals at room temperature and at the service temperature.
• Determination of the long-term stability of the glasses with respect to weight loss.
• Collaboration with other SECA program researchers on properties measurements, specimen exchange, and design information.

10
II RESULTS AND DISCUSSION
II-1 Initial Screening Studies
Over 30 different glass compositions in the Mg-Ca-Ba-La-Al-Si-B-O family, with potential for the filled glass composite seal approach, were made and their glass transition temperatures (Tg, by Differential Thermal Analysis) and coefficients of thermal expansion (CTE, by dilatometry) were measured. The original group of compositions did not contain any silicon because of concern at that time that reaction with silicates would lower the ionic conductivity of the YSZ electrolyte. Later in the program silicon was considered not to be as detrimental as believed earlier, so we included some borosilicate glasses in our matrix of compositions. Figure 1 shows some of the initial thirty glasses on a plot of Tg as a function of CTE. The plot shows that the general correlation of high Tg with low CTE does not hold and that these glasses have a wide range of property combinations. The closer the glass CTEs are to the values for the YSZ electrolyte, 10.5 x 10⁻⁶/˚C, the lower the mismatch stresses will be. Although most glasses had CTE values well below that of YSZ, several had values that were close and these had Tg values that ranged from 550˚ to 750˚C. Glasses with Tgs between about 550° and 625°C seemed to best fit the flow constraints.
Figure 1. Glass compositions plotted as a function of Tg and CTE. Blue diamonds were glasses selected for further development, red squares were glasses provided by Prof. R. Brow, Missouri University of Science & Technology, and the green triangles were other glasses not studied further.
To verify the viability of making filled glass composite seals, a number of ceramic and metal powders, including, YSZ, Al2O3, Ni, Cr, and Ag, were added to the candidate glasses and then these were sealed to various SOFC materials. For example, Figure 2 shows two micrographs of a seal to YSZ that comprises a composite layer with 70 vol% YSZ powder and 30 vol% of one of our earlier sealing glasses bonded with a thin layer of the same glass. The composite CTE has been adjusted to 10.2 x 10⁻⁶/°C. The seal adheres tightly to the YSZ and survived multiple
550
600
650
700
750
800
850
5 6 7 8 9 10 11
Reported here
Brow
Other
Tg
CTE (x 10-6/˚C)
YSZ

11
thermal cycles up to 850°C. Later work showed that the presence of the pure glass layer was not needed as the composites formed good seals without the pure glass layer, as shown below. Based on initial tests of this kind, we selected several promising candidate glasses for further investigation. These high-B2O3 glasses (see Table 1) have Tg’s from 569˚ to 595˚C and CTE’s from 7 to 10 x 10-6/˚C. Composites made with these glasses and ceramic or metal powders can match the CTE of YSZ. Metal powders such as silver (CTE = 19 x 10-6/°C) are more effective than ceramics at increasing the CTE of the glasses.
YSZ
Glass sealing layer
Composite interlayer
Composite interlayer:70vol% YSZ – 30vol% GlassNote: no pressure applied
• Ceramic: 70 vol% YSZ• Glass: Tg=703oC , CTE=9.7x10⁻⁶/oC• Composite CTE= 10.2x10⁻⁶/oC (200-700oC)
YSZ
Glass sealing layer
Composite interlayer
YSZ
Glass sealing layer
Composite interlayer
Composite interlayer:70vol% YSZ – 30vol% GlassNote: no pressure applied
• Ceramic: 70 vol% YSZ• Glass: Tg=703oC , CTE=9.7x10⁻⁶/oC• Composite CTE= 10.2x10⁻⁶/oC (200-700oC)
Figure 2. Glass - ceramic seal bonded to YSZ substrate with thin layer of the same glass as in the composite. This early design was later replaced by the simpler all composite seal.
Table 1. Compositions and properties of glasses selected as the best candidates for SOFC sealing. (Note that composition is in mol%, Tg is in ˚C and CTE is 1/˚C x 106.)
105690030106039
9.4575202010104014a
7595151510204010
CTETgCaOMgOBaOAl2O3B2O3Glass ID
105690030106039
9.4575202010104014a
7595151510204010
CTETgCaOMgOBaOAl2O3B2O3Glass ID
Glass composite seals incorporating a ductile metal accommodate the CTE mismatch stresses through deformation of the metal. Figure 3 is an example with 20 vol% Ag and 80 vol% of glass #14a. This composition is electrically conductive because the Ag is just above the percolation limit. We can obtain an insulating seal with similar mechanical properties by reducing slightly the amount of Ag. These initial studies proved that the concept of using powder-filled glass composites to seal SOFCs warranted further investigation.

12
2mmYSZ
Mount
Seallayer
Compositecore
Metallicphase
Crystals
Glass
•Glass: Tg = 575oC , CTE = 9.4X10⁻⁶/oC•Filler metal: 20 vol% Ag•Composite: Tg = 566oC, CTE = 10.5X10⁻⁶/oC•Resistance: <0.1 ohm
2mmYSZ
Mount
Seallayer
Compositecore
Metallicphase
Crystals
Glass
•Glass: Tg = 575oC , CTE = 9.4X10⁻⁶/oC•Filler metal: 20 vol% Ag•Composite: Tg = 566oC, CTE = 10.5X10⁻⁶/oC•Resistance: <0.1 ohm
2mm2mm2mmYSZ
Mount
Seallayer
Compositecore
YSZ
Mount
Seallayer
Compositecore
Metallicphase
Crystals
Glass
MetallicphaseMetallicphase
CrystalsCrystals
GlassGlass
•Glass: Tg = 575oC , CTE = 9.4X10⁻⁶/oC•Filler metal: 20 vol% Ag•Composite: Tg = 566oC, CTE = 10.5X10⁻⁶/oC•Resistance: <0.1 ohm
2mmYSZ
Mount
Seallayer
Compositecore
Metallicphase
Crystals
Glass
•Glass: Tg = 575oC , CTE = 9.4X10⁻⁶/oC•Filler metal: 20 vol% Ag•Composite: Tg = 566oC, CTE = 10.5X10⁻⁶/oC•Resistance: <0.1 ohm
2mmYSZ
Mount
Seallayer
Compositecore
Metallicphase
Crystals
Glass
•Glass: Tg = 575oC , CTE = 9.4X10⁻⁶/oC•Filler metal: 20 vol% Ag•Composite: Tg = 566oC, CTE = 10.5X10⁻⁶/oC•Resistance: <0.1 ohm
2mm2mm2mmYSZ
Mount
Seallayer
Compositecore
YSZ
Mount
Seallayer
Compositecore
Metallicphase
Crystals
Glass
MetallicphaseMetallicphase
CrystalsCrystals
GlassGlass
•Glass: Tg = 575oC , CTE = 9.4X10⁻⁶/oC•Filler metal: 20 vol% Ag•Composite: Tg = 566oC, CTE = 10.5X10⁻⁶/oC•Resistance: <0.1 ohm
Figure 3. Micrographs of glass-Ag composite showing that an electrically conductive seal can be obtained by adjusting the amount of the Ag.
Availability of manufacturable processes is always an issue in materials joining. Figure 4 illustrates that ceramic-filled glass composite seal materials can be formed by tape casting, a technique common to microelectronic packaging multi-layer capacitor manufacturing. The green (unfired) tape, with a solids loading of 65%, can be cut to the shape required for the bond area and stacked so that the whole assembly is sealed and otherwise processed in a co-fire operation.
Pure glass
Glass-ceramic composite
Glass-metal composite
Type of cast
YSZ / 30vol%
N/A
Additive / vol%
Ni / 30vol%
65%
65%
Vol% Solid
65%
Typical volume% solid of common tape cast
is ~65%
Tape cast thicknesses0.56 to 0.85mm (green)
Pure glass
Glass-ceramic composite
Glass-metal composite
Type of cast
YSZ / 30vol%
N/A
Additive / vol%
Ni / 30vol%
65%
65%
Vol% Solid
65%
Pure glass
Glass-ceramic composite
Glass-metal composite
Type of cast
YSZ / 30vol%
N/A
Additive / vol%
Ni / 30vol%
65%
65%
Vol% Solid
65%
Typical volume% solid of common tape cast
is ~65%
Tape cast thicknesses0.56 to 0.85mm (green)
Figure 4. Glass-powder composites can be prepared as green tapes similar to those used in microelectronic packaging. This approach allows more processing options.

13
II-2. Viscosity Measurements on Composites
Once the viability of using filled glass composites was established, we began further investigation and characterization of these materials. The first parameter we investigated was viscosity. Data on the variation of viscosity as a function of composition, relative volume fraction of glass and filler, and temperature allowed us to assess the performance of different composites and to choose the best combinations of materials for the expected operating conditions. Viscosity controls the flow of seal materials at temperature. If the viscosity is too high the sealant will not flow enough to make the seal and it also will not be able to dissipate thermal expansion mismatch stresses. If the viscosity is too low, the sealant will not stay in the joint and the seal may leak and be too weak. In typical glass seal development efforts, the flow and sealing properties are determined by laborious trial and error experiments with little or no quantitative data. We used an apparatus, described below, that allowed us to observe and video record glass flow and wetting on different substrates as a function of temperature and then to measure the glass viscosity under those same conditions. These measurements allowed much more rapid determination of optimum processing conditions and correlated those results with quantitative viscosity data. Measurements of composite viscosities were made using the parallel plate method in our TOMMI apparatus (Thermo Optical Mechanical Measuring Instrument, Fraunhofer Gesellschaft, Wurtsburg, Germany, see Figure 5), a high temperature optical dimension measuring apparatus that allows in situ video recording of specimens up to a temperature of 1700oC. A parallel plate viscometer setup (Figure 6) was used to measure viscosity of the candidate glasses and to determine the effect of additive powder composition, size, and aspect ratio on composite seal flow and adhesion. The viscosity, η, is determined from the measured rate of sample thickness change, dh/dt, at a given applied load, M, using the following equation:
Eq. 1
where g = gravity acceleration, h = sample height, V = sample volume, a = CTE of the sample,
and DT = temperature change compared to room temperature.
Figure 5. A photo of the Thermo Optical Mechanical Measuring Instrument (TOMMI) that was used to measure viscosity of glasses and composites at elevated temperatures.
) 1 )(2 )(/(303
5
T V h D t D h V
Mgh
a D p + + ) 1 )(2 )(/(30
23
5
T V h V
Mgh
a D p h
+ + = p

14
a. b. Figure 6. (a) A schematic of the parallel plate geometry used to measure viscosity in the TOMMI and (b) an image from the TOMMI showing initial sample arrangement.
The viscosities of the base candidate glasses as a function of temperature are shown in Figure 7. Glass #10, which had the highest Al2O3 content, also had the highest viscosity, ~10x that of the other glasses, whereas the glass with the most B2O3, #39, had the lowest viscosity. Between 680˚ and 760˚C, the viscosity decreased by about 2 orders of magnitude. For example, for glass #10 the viscosity decreased from 10 to ~0.1 MPa s over this temperature range.
680 700 720 740 760
0
2
4
6
8
10
12
Vis
cosity (
MP
a s
)
Temperature (°C)
Pure 10
Pure 39
Pure 14a
Figure 7. The measured viscosity of the three candidate glasses without any additives.
M
h

15
Composite viscosity increased with increasing volume fraction of either metal or ceramic particles. This well-known effect was modeled using the Euler equation, where ηr is the normalized viscosity, Φ is the volume fraction of the particle phase and k and Φc are constants for a given filler particle size distribution:
Eq. 2
Additionally, the particles increase the available surface area for wetting by the glass and therefore keep the glass contained in the composite seal material. The effect of additions of various volume fractions of YSZ powder (particle size 25 to 37 µm) on the viscosity of glass #14a as a function of temperature is shown in Figure 8. Figure 9 indicates that the data in Figure 8 can be accurately fit by Eq. 2 thus allowing prediction of viscosity at other loading levels. Figure 10 shows that the viscosity behavior is very similar, as expected, when the additive to glass #14a is zirconia or silver. Even though the data appear to converge at higher temperatures on this linear plot, the powder-filled glasses maintain higher viscosity even at higher temperature as is illustrated in Figure 11. This figure shows that after 10 min at 850˚C, an initially rectangular sample of glass #14a forms a sessile drop shape, whereas the same glass loaded with 30% YSZ maintains its original shape, indicating that it has a much higher viscosity. As these data indicate, a wide range of temperature-viscosity behavior can be attained using the glass composite approach, and the design limitations imposed by a pure glass seal approach can be overcome with the selective addition of a solid particle phase.
650 660 670 680 690 700 710 720
0
20
40
60
80
100
120
Vis
co
sity (
MP
a s
)
Temperature (°C)
Pure glass 14a
14a + 05 vol% ZrO2
14a + 10 vol% ZrO2
14a + 20 vol% ZrO2
14a + 30 vol% ZrO2
14a + 40 vol% ZrO2
Figure 8. The measured viscosity of zirconia/glass #14a composites as a function of temperature at various loading levels.
( )
2
/11
-+=
c
r
k
ff
fh

16
Figure 9. The viscosity data for zirconia/glass #14a composites fit to the Euler equation for temperatures of 650˚, 675˚ and 700˚C.
660 680 700 720 740 760
0
5
10
15
20
25
14a + 20 vol% Ag 14a + 5 vol% Ag Pure glass 14a 14a + 5 vol% ZrO2
14a + 20 vol% ZrO2
Vis
co
sity (
MP
a s
)
Temperature (°C)
Figure 10. Measured viscosity of composites of glass #14a and either zirconia or silver showing that amount of additive is much more important than the additive composition.
0 % 10 % 30 %
Ebrite
0 % 10 % 30 %
Ebrite
0 % 10 % 30 %
Ebrite
0 % 10 % 30 %
Ebrite
0 % 10 % 30 %
Ebrite
0 % 10 % 30 %
Ebrite
0 % 10 % 30 %
Ebrite
Figure 11. Glass #14a - YSZ powder mixtures (0, 10 and 30% YSZ) heated on Ebrite stainless steel for 10 min at 850°C. The red rectangles indicate the original sample size.

17
Two other aspects of the increase in viscosity of glass upon addition of ceramic and metal powders are important for composite performance. First, as shown in Figure 12, the particle size of the filler phase has a significant effect on the viscosity. In this case, the expected increase in viscosity was only seen for relatively small (4 to 7 µm) silver particles. The second issue is the effect of the filler on the crystallization behavior of the glass. The addition of ceramic particles can alter the glass crystallization behavior by providing nuclei for crystallization. As more of the glass crystallizes, the composite viscosity will rapidly increase. The crystallization kinetics of the pure glass and the metal and ceramic composites were studied using differential thermal analysis. It was found that the ceramic particles had a much greater effect on the crystallization of the glass than the metal additives, resulting in a higher volume fraction of particles in the glassy seal and a corresponding increase in the seal viscosity beginning at the onset of the crystallization. This increased viscosity can improve seal performance by increasing its strength.
0
5 106
1 107
1.5 107
2 107
2.5 107
3 107
620 630 640 650 660 670 680 690 700
14a with 38-44 mmmmm Ag particles
14a-20 vol% Ag
14a-5 vol% Ag14a-10 vol% Ag
Vis
co
sity,
MP
a s
Temperature, °C
Tg=576 °C
Figure 12. The effect of addition of silver powder on the viscosity of glass #14a for two different sizes of silver particles.
0
5 106
1 107
1.5 107
2 107
2.5 107
3 107
620 630 640 650 660 670 680 690 700
14a with 4-7 mmmmm particles of Ag
14a-5 vol% Ag14a-10 vol% Ag14a-15 vol% Ag14a-20 vol% Ag
Vis
co
sity,
Pa
s
Temperature, °C
Tg=576 °C

18
II-3. Wetting Studies on Composites
We also measured spreading rates and contact angles of composite sealants on different SOFC materials at temperature in the TOMMI instrument. These properties depend on both viscosities and surface energies of the seal constituents. A low contact angle indicates good wetting. Contact angles and spreading rates are needed to specify heating schedules for seal formation and to determine adhesion and compatibility of the seal materials with different substrates. For example, Figure 13a shows that glass #10, the higher alumina, higher viscosity glass, does not wet (high contact angle) a polycrystalline alumina substrate even when heated to 900˚C, whereas the other two glasses start to wet between 750˚ and 850˚C. Figure 13b shows that for glass #14a, the wetting behavior is little changed when up to 10 vol% zirconia is added, but that at 20 vol%, wetting does not occur even at 900˚C. (The wetting experiments were carried out on Coors alumina microelectronic substrates that early experiments determined gave the same results as the tape cast YSZ substrates.) Figure 14 shows that the wetting on the microscopic level is good for seals made with zirconia content up to 40%, as evidenced by the low contact angle that formed. In conclusion, even composites that did not appear to wet on the macro-scale did indeed have good wetting since the glasses wet the substrate on the micro-scale.
650 700 750 800 850 900
0
20
40
60
80
100
120
140
160
180
Co
nta
ct A
ng
le
Temperature (°C)
Pure 14a
14a + 5vol% ZrO2
14a + 10vol% ZrO2
14a + 20vol% ZrO2
a. b.
Figure 13. The measured contact angle as a function of temperature for a.) the pure glasses and b.) for glass #14a with 3 levels of added zirconia.

19
glass 14a 14a + 5vol% ZrO2 14a + 10vol% ZrO2
14a + 20vol% ZrO2 14a + 40vol% ZrO2
glass 14a 14a + 5vol% ZrO2 14a + 10vol% ZrO2
14a + 20vol% ZrO2 14a + 40vol% ZrO2
The addition of ZrO2 does
not adversely affect the ability of the glass to wet
the substrate.
Microscopic contact angles arecontrolled by surface energies.
substrate
glass seal
contact angle
substrate
glass seal
contact angle
Figure 14. Micrographs of glass and powder-filled glass composite seals showing good wetting in all cases on the microscopic level.

20
II-4. Reactivity Studies
Having determined and measured the viscosity and wetting parameters for the three glasses of interest, we proceeded to address the reactivity and long-term stability of the powder-filled glass composites. As with all joining, the sealing materials for SOFCs must not react adversely with the materials being joined. Adverse reactions are thought to be most likely between the sealing glasses and either the candidate anode material or the stainless steel interconnect materials. To investigate this possibility, a series of 2000 hr. tests at 750°C in air of two ceramic powder-filled glass compositions (glass #14a and glass #14a +10% YSZ) on two ferritic SS alloys (Ebrite and Crofer) and on anode material (Ni-YSZ) were performed. Microprobe analyses of the samples were conducted to determine the long-term stability of the composite seal and the substrates. Complex borate, Ca/Al, and Mg phases were identified in both glass compositions on the three different substrates. Ni diffusion was not observed along the interface in any case. The absence of adverse reactions and Ni diffusion provides evidence of the long-term stability of the materials at 750°C. Glass #14a was also studied for reactivity with SS alloys (Crofer and 410 SS) at 850oC for 5 min and for 5 hrs. Microprobe analysis of the 850°/5 hr specimen showed the formation of a Cr2O3 layer along the glass/metal interface, the occurrence of complex borate phases in the bulk glass, and Fe migration into the glass. This result suggests that the #14a glass-ceramic/SS combination is not stable for longer exposure time at higher temperatures. After these studies were performed, the SECA program identified 441SS as a more cost effective interconnect option. However, this grade of steel is known to be more reactive. Therefore, coating 441SS with a protective spinel coating (10-20 µm of Mn1.5Co1.5O4) was developed at PNNL to minimize reactions between the glasses and the steel interconnects. The spinel coating was designed, in part, to provide a barrier to Cr migration from the 441SS that might degrade seal performance. The reactivity of two borate-based sealing glass compositions with the spinel-coated 441SS interconnect material was evaluated. Seals between either glass #14a or the borosilicate glass #17 (same composition as #14a but with half of the boron replaced by silicon to lower boron volatilization) and the coated 441SS were fabricated and then heated for up to 500 hr at 750°C. Cross sections of the resulting interfaces were then analyzed using electron probe microanalysis to measure the elemental diffusion profiles for constituents of the glass, coating, and 441SS with a particular focus on Cr diffusion. Microprobe line scans taken across the interfaces between the coated 441SS and either of the two sealing glasses show that the MnCo spinel is an effective barrier to Cr diffusion and that it does not react adversely with the sealing glasses. Figure 15 is representative of the 500 hr/750°C tests of both glass #14a and glass #17 on spinel coated 441SS. The results that are common to all the reaction experiments at 750˚C are:
1. The coating with the nominal composition Mn1.5Co1.5O4 as deposited on the 441SS, both as-received and after sealing, contains a moderate amount of Fe, probably as a substituent in the spinel structure because no separate Fe phases were seen in XRD analysis.
2. There is no microstructural evidence in the SEM images for formation of any new interfacial reaction phases.

21
3. There is very slight diffusion of Mn, Co, and Fe from the coating into either the #14a or
the #17 sealing glass, at most to a depth of 2-3 mm. 4. The glass constituents do not diffuse into the coating to any significant extent. 5. There is a small buildup of Ti at the 441SS-coating interface, but none diffuses through
the coating into the sealing glass. 6. The sealing glasses tightly bond to the spinel coating, but the thicker coatings fracture on
cooling from the sealing temperature. This suggests that the coating is the weakest link in the 441 SS-coating-sealing glass trilayer.
Figure 15. Line scans of Ca (dark blue), B (gray), Cr (red), O (blue), Ti (purple), Fe (brown), Al orange), Mn (magenta), Co (dark green) and Si (light green) and SEM image of glass 17 on Mn1.5Co1.5O4-coated 441SS heat treated to 750˚C after 500 hours.

22
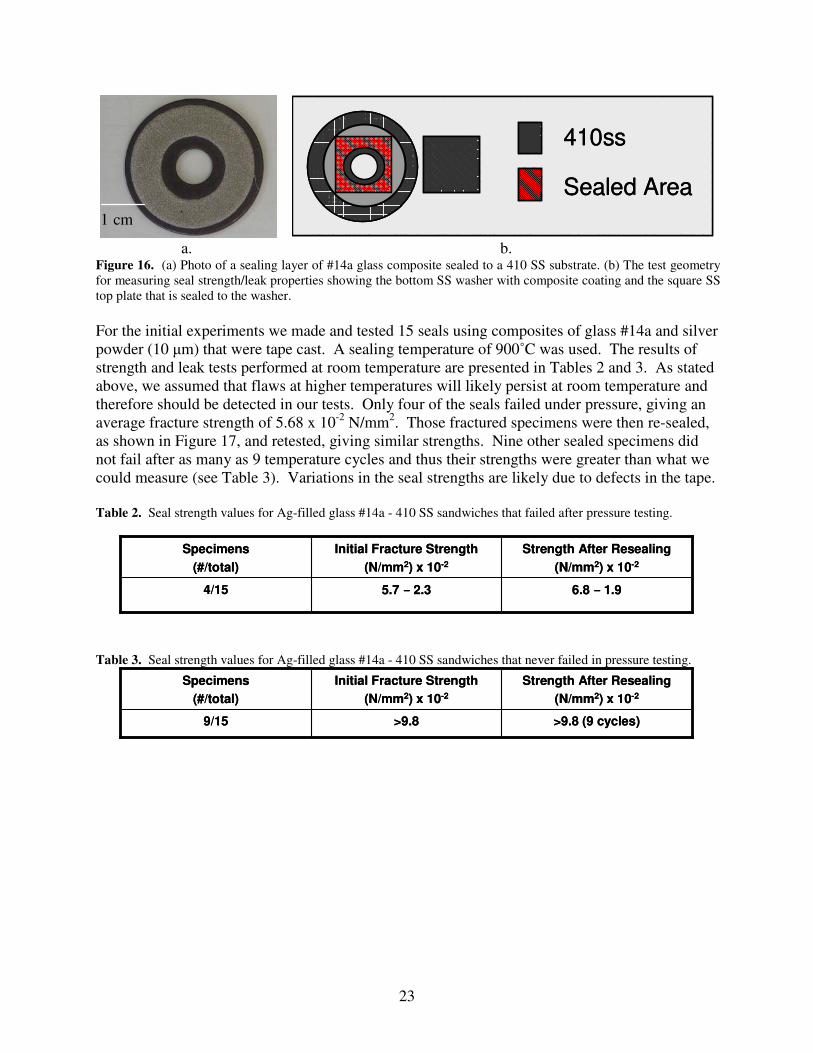
II-5. Seal Strength Tests at Room and Elevated Temperature The measurement of brittle strengths of joints that are independent of geometry and representative of the loading that is likely to be encountered in a SOFC is difficult. One common technique to measure seal strengths is to make butt seals in test bars (typically 3x4x40 mm with the seal in the 3x4 mm plane at the 20 mm point) that are then loaded in four point flexure. The load at failure is recorded and the fracture surface is analyzed to determine the fracture origin and to assess whether the failure should be counted as a good data point. Because brittle fracture is stochastic, data on 30 specimens of each condition are typically necessary to evaluate the statistics. Using the measured flexure strength to predict failure in some other geometry requires the determination of the stress state using the finite element method. This approach can give reliable results but it is labor intensive and it is not very efficient method for screening different process variables. The other approach to determining seal strengths is proof tests either of samples of the actual device or simplified versions that embody the essential features of the design. The data are not materials properties in any sense, but they provide relative levels of performance. We have followed this latter method in designing a strength test apparatus in which an annular seal creates a small interior volume that can be pressurized with air. Discs and washers of the desired materials were sealed with different composite sealants. The assembly was immersed in water at room temperature and the pressure slowly increased until either the seal leaked and air bubbles were detected or 0.2 MPa (2 atm) pressure was reached. This amount of over pressure is much greater than any pressure differential that has ever been suggested for SOFC operation. Testing strength at room temperature is not a drawback since any leaks at high temperature will likely be worse at room temperature. Leakers were resealed at the normal process temperature and retested. Seals that did not leak were heated to 750° – 850°C, typical of SOFC operating temperature, cooled to room temperature, and retested in the pressure apparatus. We recorded the number of cycles to seal failure as a function of materials variables and process conditions and determined if the leakers could be resealed. For the strength tests we used a #14a glass-Ag composite sealing composition that was formulated as a matched CTE seal to 410 SS. The rule of mixtures was used to calculate the volume fraction of Ag (~20 vol%) needed in the glass to adjust its CTE to that of the 410 SS. Composite preforms were made using conventional tape casting techniques. Wetting studies on 410 SS showed the optimum sealing temperature to be 900°C. Seal strengths were determined using a 410 SS to 410 SS sandwich geometry as shown in Figure 16. The crosshatched area in the figure is the actual sealed area tested.
23
1 cm1 cm
a. b. Figure 16. (a) Photo of a sealing layer of #14a glass composite sealed to a 410 SS substrate. (b) The test geometry for measuring seal strength/leak properties showing the bottom SS washer with composite coating and the square SS top plate that is sealed to the washer.
For the initial experiments we made and tested 15 seals using composites of glass #14a and silver powder (10 µm) that were tape cast. A sealing temperature of 900˚C was used. The results of strength and leak tests performed at room temperature are presented in Tables 2 and 3. As stated above, we assumed that flaws at higher temperatures will likely persist at room temperature and therefore should be detected in our tests. Only four of the seals failed under pressure, giving an average fracture strength of 5.68 x 10⁻² N/mm2. Those fractured specimens were then re-sealed, as shown in Figure 17, and retested, giving similar strengths. Nine other sealed specimens did not fail after as many as 9 temperature cycles and thus their strengths were greater than what we could measure (see Table 3). Variations in the seal strengths are likely due to defects in the tape.
Table 2. Seal strength values for Ag-filled glass #14a - 410 SS sandwiches that failed after pressure testing.
6.8 –––– 1.95.7 –––– 2.34/15
Strength After Resealing
(N/mm2) x 10-2
Initial Fracture Strength
(N/mm2) x 10-2
Specimens
(#/total)
6.8 –––– 1.95.7 –––– 2.34/15
Strength After Resealing
(N/mm2) x 10-2
Initial Fracture Strength
(N/mm2) x 10-2
Specimens
(#/total)
Table 3. Seal strength values for Ag-filled glass #14a - 410 SS sandwiches that never failed in pressure testing.
>9.8 (9 cycles)>9.89/15
Strength After Resealing
(N/mm2) x 10-2
Initial Fracture Strength
(N/mm2) x 10-2
Specimens
(#/total)
>9.8 (9 cycles)>9.89/15
Strength After Resealing
(N/mm2) x 10-2
Initial Fracture Strength
(N/mm2) x 10-2
Specimens
(#/total)
410ss
Sealed Area
410ss
Sealed Area
410ss
Sealed Area

24
Reheated to
sealing temperature
850°C for 10 min.
410/Glass-Ag/410 ss 410/Glass-Ag/410 ss
Figure 17. Illustration of the resealing of a 410SS/Glass #14a-Ag/410SS seal structure by reheating to 850˚C for 10 min.
Strength data from other room temperature experiments are presented in Table 4. The same composition was used, glass #14a and fine silver powder. The seals were cycled to 750˚C up to 10 times. One significant result is that seal strengths are much higher if the stainless steel is given an acid etch prior to being sealed. In fact, none of the etched seals failed even at the highest pressure that we could achieve.
Table 4. Strengths of glass #14a to 410 stainless steel sandwich seals at room temperature after cycling to 750°C.
No. of samples
Bond thickness
(mm)
Avg Pressure kPa (psi)
No. heat cycles ea.
Avg Strength#
N/mm2 x 10
-2 (psi)
2*
0.22
>413.7 (60)
10
8.4 (12.2)
5*
0.22
>413.7 (60)
9
12.6 (18.3)
1*
0.22
>413.7 (60)
3
12.9 (18.8)
1*
0.53
>413.7 (60)
3
12.6 (18.8)
1*
1.02
>413.7 (60)
3
12.4 (18.0)
3
0.46
39.3 (5.7)
1
1.0 (1.5)
3
0.22
34.9 (5.1)
1
0.88 (1.3)
* Metal etched before sealing # failure load/bond area

25
We also constructed an apparatus to test seals at temperature, typically at 750°C. Figure 18 is a photograph of the apparatus. The bottom part is an open ended, hollow cylinder made of 410 stainless steel that can be pressurized to about 4 atm with an arbitrary gas. A disk of 410 stainless steel or other fuel cell material is sealed over the open end of the cylinder and the furnace is lowered over the assembly. The cylinder volume enclosed by the seal is brought to the desired pressure and the temperature is raised to the set point. Leaks are detected by a drop in the applied pressure. The apparatus allowed us to test a variety of seal operating conditions, such as the time to failure for fixed temperature and pressure, or pressure at which leaks occur at fixed temperature. Table 5 gives some results for glass #17 with 20vol% Ag. Since these conditions are an over-test for SOFC operation, as regards to pressure, they show that the composite sealants are hermetic under representative operating conditions. The next step is to test them in the standard SOFC test cell that is being designed by PNNL.
Figure 18. Photograph of high temperature seal test apparatus. Here a sheet of 410 stainless steel is sealed to a hollow 410 stainless steel cylinder that can be internally pressurized. The vertical tube furnace is lowered over the seal and brought to the desired test temperature.

26
Table 5. Strengths of seals of 410 to 410 stainless steel tested at 750°C.
2.0 97.2 ±10.6 (14.1 ±1.5) 3*
Did not fail Held 3 psi for 30 min at 750 ° C 3*
1.2 52.4 ±2.9 (7.6 ± .85) 2
Avg. Failure Strength @
N/mm 2 x 10 - 2 Avg. Failure Pressure
kPa (psi)
No. of samples
2.0 97.2 ±10.6 (14.1 ±1.5) 3*
Did not fail Held 3 psi for 30 min at 750 ° C 3*
1.2 52.4 ±2.9 (7.6 ± .85) 2
Avg. Failure Strength @
N/mm 2 x 10 - 2 Avg. Failure Pressure
kPa (psi)
No. of samples
* Etched 410ss @ load/bond area

27
II-6. Long-term Stability Studies Concern about vaporization of glass constituents in long-term use of glass sealants was raised at various SECA reviews and workshops. Possible preferential loss of boron from borate glasses in different SOFC atmospheres has been the focus of these concerns. The SECA design lifetime is 40,000 hr, which is too long an interval to test in an iterative materials development program. To address this issue, both the pure seal materials and seal materials in combination with different substrates were tested for stability for extended times at temperature. The test rigs were comprised of airtight ceramic muffle tubes inside resistance-heated tube furnaces. The ceramic tubes were sealed with end caps that allowed gas to be passed through them at temperature. For the steam tests, Ar-3%H2 was bubbled through a 62°C water bath to create a 30% simulated steam atmosphere. Weighed samples were heated in the center of the hot zone under flowing wet hydrogen or air, depending on the specific test. Standard tests lasted 2000 hr. with the specimens cooled to room temperature at intervals and then weighed. For tests of stability of the seal materials by themselves, specimens were supported on alumina wafers that contributed no weight change since they are inert to the test conditions. For tests of stability of sealants on component materials, the seals were placed on coupons of the specific material; e.g., 410 stainless steel or YSZ and then tested as described. The measured mass changes are plotted as a function of time at temperature. The seal stability experiments have concentrated on glasses #14a and #17, whose as-cast compositions contain 40 mol% B2O3 and 25 mol% B2O3, respectively. Bulk sections of glass cast from the melt were cut to pieces of standard size large enough to give measurable mass losses in our experiments. Both the #14a and #17 glasses were tested with and without a pre-crystallization heat treatment. For pre-crystallization specimens were heated up to 900°C, which is well above the glass Tg, (Tg of glass #14a = 576°C, Tg of glass #17 = 632°C) and the targeted SOFC operating temperature of 750°C. Figure 19 shows the 2,000 hr mass loss measurements for glasses #14a and #17 in air at 750°C. The glass with less boron (#17) gave a lower mass loss. The observed mass loss in air for both glass compositions was not affected by the pre-crystallization heat treatment. The mass loss for glass #14a near the end of the 2,000 hr experiment was ~0.2 wt%. Glass #17 was even more stable with less than 0.05% mass loss over the entire 2,000 hr. heating period. After a higher rate of loss for an initial 200 hours (see Figure 20) at 750°C, glass #14a settled down to a long period of linear mass loss with time. The mass loss for glass #17 increased for the first 400 hr and then maintained a constant mass loss for the rest of the 2,000 hr. However, all the mass losses were very low, so these differences in rates are small.

28
In AIR at 750oC
-0.2
-0.15
-0.1
-0.05
0
0.05
0.1
0.15
0.2
0.25
0 200 400 600 800 1000 1200 1400 1600 1800 2000
time (hr)
14a pre-x
14a melt
17 pre-x
17 melt
Mass L
oss
(%
)
In AIR at 750oC
-0.2
-0.15
-0.1
-0.05
0
0.05
0.1
0.15
0.2
0.25
0 200 400 600 800 1000 1200 1400 1600 1800 2000
time (hr)
14a pre-x
14a melt
17 pre-x
17 melt
Mass L
oss
(%
)
Figure 19. Long term weight loss for glasses #14a and #17 in air at 750°C.
In AIR at 750oC
0
0.01
0.02
0.03
0.04
0.05
0.06
0.07
0.08
0.09
0.1
0 50 100 150 200 250 300 350 400 450 500
time (hr)
14a pre-x
14a melt
17 pre-x
17 mel t
Ma
ss L
oss (
%)
In AIR at 750oC
0
0.01
0.02
0.03
0.04
0.05
0.06
0.07
0.08
0.09
0.1
0 50 100 150 200 250 300 350 400 450 500
time (hr)
14a pre-x
14a melt
17 pre-x
17 mel t
Ma
ss L
oss (
%)
Figure 20. Early stage weight losses in air of glasses #14a and #17 show that glass #17 is more stable than glass #14a in air at 750°C.
Mass loss data in air for the glass #14a, both pure and with 10% powder additives, was fit to two different mass loss models, one with a linear time dependence and the other with parabolic time dependence. This is shown in Figure 21 where both models are shown with a 5% total mass loss when extrapolated to 40,000 hr, which we believe is a tolerable level. In all cases, the actual data lie well below parabolic model and, except for the Ni-containing glass, they are also below the linear model. This further indicates that the boron-containing seal glass will remain stable over the SOFC lifetime. This is further confirmed by the XPS data shown in Figure 22 that shows that no depletion of boron from the surface of glass #14a was detected even after 2000 hr at 750˚C.

29
0 1 0 0 2 0 0 3 0 0 4 0 0 5 0 0 6 0 0 7 0 0 8 0 0
0 .0
0 .1
0 .2
0 .3
0 .4
0 .5
0 .6
0 .7
0 .8
14A14A + 10vol% Ag14A + 10vol% Ni14A + 10vol% YSZ
t1/2 behavior assuming 5%
wt loss at 40,000 hrs.
Linear behavior assuming 5%
wt loss at
40,000 hrs.
Time [hr]
Perc
ent
weig
ht
loss [
%]
0 1 0 0 2 0 0 3 0 0 4 0 0 5 0 0 6 0 0 7 0 0 8 0 0
0 .0
0 .1
0 .2
0 .3
0 .4
0 .5
0 .6
0 .7
0 .8
14A14A + 10vol% Ag14A + 10vol% Ni14A + 10vol% YSZ
14A14A + 10vol% Ag14A + 10vol% Ni14A + 10vol% YSZ
t1/2 behavior assuming 5%
wt loss at 40,000 hrs.
Linear behavior assuming 5%
wt loss at
40,000 hrs.
Time [hr]
Perc
ent
weig
ht
loss [
%]
Figure 21. Mass loss data for glass #14a by itself and with powder additives compared to linear and parabolic mass loss models gauged for 5% total loss after 40,000 hr.
0
10
20
30
40
50
60
70
80
0 200 400 600 800 1000 1200 1400 1600
Sputter Depth (A)
Ato
mic
Co
ncen
trati
on
Al 2s %
B 1s %
Ba 3d5/2 %
C 1s %
Ca 2p3/2 %
Mg KLL %
O 1s %
Free surface Glass interior
Glass 14a heated for 2000 hr at 750°C in air
300x700 mm area analyzed
0
10
20
30
40
50
60
70
80
0 200 400 600 800 1000 1200 1400 1600
Sputter Depth (A)
Ato
mic
Co
ncen
trati
on
Al 2s %
B 1s %
Ba 3d5/2 %
C 1s %
Ca 2p3/2 %
Mg KLL %
O 1s %
Free surface Glass interior
Glass 14a heated for 2000 hr at 750°C in air
300x700 mm area analyzed
Figure 22. XPS sputter depth profiles Glass #14a heated for 2000 hr at 750°C in air showing no boron depletion near the free surface.
Figure 23 shows the data from our measurements of long-term weight loss for glasses #14a and #17 in a wet-H2, simulated steam environment. Unlike the results for heating in air, the data for simulated steam did not give smooth weight loss curves for heat treatments longer than 500 hr. Figure 24 is a plot of the data in Figure 23 for only the first 500 hr of heating where the data appear well behaved. During this initial 500 hr period both glasses exhibit a constant weight loss over time, independent of glass composition or pre-crystallization treatment. After 500hr, the data indicate that for glass #14a, some type of reaction leading to mass gain may have occurred.

30
The pre-crystallized glasses appear to be more stable than the as-cast glass specimens once they have been heated for 300 hr. Our experiments show that there is higher weight loss in air than in simulated steam initially, as shown in Figure 20. Microprobe analyses of these samples, shown in Figure 25, indicate that neither glass has a surface region depleted of boron.
In WET H2 at 75 0oC
-0 .2
-0.15
-0 .1
-0.05
0
0.05
0.1
0.15
0.2
0.25
0 200 400 600 800 1000 1200 1400 1600 1800 2000
time (hr)
14a pre-x
14a mel t
17 pre-x
17 melt
Ma
ss L
oss (
%)
In WET H2 at 75 0oC
-0 .2
-0.15
-0 .1
-0.05
0
0.05
0.1
0.15
0.2
0.25
0 200 400 600 800 1000 1200 1400 1600 1800 2000
time (hr)
14a pre-x
14a mel t
17 pre-x
17 melt
Ma
ss L
oss (
%)
Figure 23. Weight loss for 1800 hr for glasses #14a and #17 in wet-H2 at 750°C.
In WET H 2 at 750oC
0
0.01
0.02
0.03
0.04
0.05
0.06
0.07
0.08
0.09
0.1
0 50 100 150 200 250 300 350 400 450 500
time (hr)
14a pre-x
14a me lt
17 pre-x
17 mel t
Ma
ss L
oss (
%)
In WET H 2 at 750oC
0
0.01
0.02
0.03
0.04
0.05
0.06
0.07
0.08
0.09
0.1
0 50 100 150 200 250 300 350 400 450 500
time (hr)
14a pre-x
14a me lt
17 pre-x
17 mel t
Ma
ss L
oss (
%)
Figure 24. Weight loss over 500 hr for glasses #14a and #17 in wet-H2 at 750°C.
14a borate glass
Si
B
17 borosilicate glass
Si
B
1 mm1 mm
14a borate glass
Si
B
17 borosilicate glass
Si
B
1 mm1 mm
Figure 25. Microprobe profiles of glasses #14a and #17 after 2000 hr at 750˚C in simulated steam

31
To further investigate the stability of our sealing glasses under SOFC operating conditions, we collaborated with Professor R. Brow of the Missouri University of Science and Technology in which his group measured weight loss of two of our glasses (glasses #14a and #17) at 750°C in wet forming gas and collected the species that vaporized for subsequent compositional analysis. The weight loss data presented in Figure 26 are normalized to sample area and were collected up to 7 days. According to Figure 26, the average evaporation rate for glass #14a, which has the highest boron content, was 1.2x10⁻⁶ g/cm2hr. Extrapolating that weight loss to 40,000 hr gives a total weight loss of 0.048 g/cm2 of glass surface exposed to the wet steam atmosphere. The corresponding loss for glass #17 is 0.029 g/cm2. The weight loss experienced by a given seal obviously depends on how it is configured, since evaporation would occur only from the exposed edges. However, as an example, free evaporation from a 1 cm3 sphere would give mass losses of about 8 and 4%, respectively, for glasses #14a and #17. These values are close to the losses predicted by extrapolation of our previous weight loss data and confirm our conclusions that seals based on our borate and borosilicate glasses should exhibit acceptable stability in SOFC operating environments.
0 1 2 3 4 5 6 7 80.20
0.16
0.12
0.08
0.04
0.00
(-0.18)
(-0.11)(-0.10)
(-0.05)
Time (days)
G14 G17
We
igh
t C
ha
ng
e (
mg
/cm
Weig
htcha
ng
e (
mg
/cm
2)
-
-
0
0
0 1 2 3 4 5 6 7 80.20
0.16
0.12
0.08
0.04
0.00
(-0.18)
(-0.11)(-0.10)
(-0.05)
Time (days)
G14 G17
We
igh
t C
ha
ng
e (
mg
/cm
Weig
htcha
ng
e (
mg
/cm
2)
-
-
0
0
Figure 26. The weight change of glasses #14a and #17 in forming gas with 30-vol% water vapor at 750°C.

32
III. SUMMARY
We have demonstrated the feasibility of using powder-filled glass composites to make robust seals in planar SOFCs. We chose suitable glasses based on measurements of CTE and Tg, as well as glass chemistry and then characterized the viscosity of these glasses with and without ceramic or metallic powder fillers as a function of temperature up to 850°C. The two best compositions based on these properties were selected for further SOFC seal development. Wetting and reaction studies showed that the composites gave good wetting without deleterious reactions at 750°C. We developed a pressure test rig for measuring strengths of seals cycled between room temperature and typical SOFC operating temperatures. Our measurements showed many of the 410 SS to 410 SS seals were hermetic at 0.2 MPa (2 atm) of pressure and that seals that leaked could be resealed by briefly heating them to 900°C. We developed an apparatus for measuring strengths of seals at elevated temperature (up to 950°C) and found that seals maintained 0.02 MPa (0.2 atm) overpressures for 30 min at 750°C with no leakage. Finally, long term testing of glass compositions in air and simulated steam, coupled with weight loss projections according to two models, lead us to predict that none of our glass composite sealing compositions would experience more than 5% mass loss in 40,000 hr operation in typical SOFCs. In conclusion, we have shown that powder-filled glass composites appear to be promising candidates to meet all the stringent planar SOFC sealing requirements.

33
IV. FUTURE WORK
Based on our understanding of program needs, and of the materials and capabilities developed at SNL, we propose the following path forward:
1. Glasses #14a and #17 with a variety of additives have been shown to have promising characteristics for sealing to SOFC materials. Batches of these glasses could be supplied to PNNL and/or other facility for independent testing.
2. Using the sealing test set-up developed by PNNL, we should perform seal lifetime tests at
SNL using one or both these glasses. In particular, seals made to aluminized and spinel coated S441 should be tested. This would be a good option as we will be able to characterize microstructure as a function of time, temperature and spatial gradients, measure properties, and understand seal performance.
3. A set-up to pressurize and test the seal strength at room and elevated temperatures is
available at SNL, but for small seal sizes. For relating lab results to real stacks, glasses (from SNL and other labs/research groups) need to be tested at large sealing areas. Our seal strength testing set-up can be modified for larger sealing areas, and seal strength should be tested, as a function of exposure to SOFC environments. Analysis to identify failure origins and mechanisms would help us identify weaknesses in these formulations/designs.
4. Interfacial adhesions between various stack layers, and seal and other stack components
should be measured as a function of exposure to environments, and at temperature in environment. A good understanding of this degradation will help model the expected lifetimes of these components, and more importantly, will lead to better designs and materials to meet program goals
.

34
V. References
1. S. Singhal “Ceramic fuel cells for stationary and mobile applications”, Am. Ceram. Soc. Bulletin, 82 (11), 9601-9610 (2003). 2. N. Q. Minh, “Ceramic fuel cells”, J. Am. Ceram. Soc., 76, 563-588 (1993).
3. P. Singh and N.Q. Minh, “Solid oxide fuel cells: technology status,” Int. J. Appl. Ceram.
Technol., 1[1] 5-15 (2004).
4. M.C. Williams, J.P. Strakey, and W.A. Surdoval, “US Department of Energy’s Solid Oxide Fuel Cells: Technical Advances,” Int. J. Appl. Ceram. Technol., 2[4] 295-300 (2005).
5. J. W. Fergus, “Sealants for solid oxide fuel cells”, Journal of Power Sources, 147 46-57 (2005). 6. P. A. Lessing, “A review of sealing technologies applicable to solid oxide electrolysis cells,” J. Mater. Sci., 42, 3465 –3476 (2007). 7. Z. Yang, J. W. Stevenson and K. D. Meinhardt, “Chemical interactions of barium calcium- aluminosilicate-based sealing glasses with oxidation resistant alloys”, Solid State
Ionics, 160, 213-225 (2003).
8. K. G. Ewsuk and L. W. Harrison “Processes for Manufacturing Tailored Property Ceramic Composites,” in Design for Manufacturability and Manufacture of Ceramic Components, Ceramic Transactions Vol. 49, The American Ceramic Society,
Westerville, OH, 1995 pp197-219 (the Proceedings of the 96th
Annual Meeting of the American Ceramic Society, Indianapolis, IN April 24-28, 1994).
9. K. G. Ewsuk, “Thermal Conductivity of Glass-Filled Ceramic Composites,” E. I. du Pont de Nemours & Company, Inc. Central Research and Development Report CRD 87-25, Wilmington, DE (1987).

35
APPENDIX I
Journal Articles, Conference Papers and Proceedings Generated
1. E. Corral, B. Gauntt, R. Loehman, “Controlling Seal Material Properties for Reliable Seal Performance
Using Glass-Ceramic Composites,” 30th International Conference on Advanced Ceramics and Composites, Daytona Beach, FL, January 21-26, 2007 (invited).
2. E. Corral, S. J. Widgeon, and R.E. Loehman, “Electron Microprobe Analysis of Glass-to-Metal Seals For Use in Solid-Oxide Fuel Cells,” Microscopy Techniques for Ceramics and Composites, Proceedings of the Microscopy & Microanalysis Meeting 2008, Albuquerque, New Mexico, August 3-7, 2008.
3. M. Brochu and R.E. Loehman, “Hermetic Sealing of Solid Oxide Fuel Cells”, in Microjoining and
Nanojoining, Y. Zhou, ed., Woodhead Publishing, Ltd., Cambridge, England (2008) pp. 718-740.
4. S. Widgeon, E. Corral, Erica, M. Spilde, and R.E. Loehman, “Glass-to-Metal Seal Interfacial Analysis using Electron Probe Microscopy for Reliable Solid Oxide Fuel Cells,” Submitted to The J. of the Am.
Ceram. Soc. (2008).
Conference Presentations
1. R.E. Loehman, B. Gauntt, A. Ayala, and E. Corral, “Development of glass-ceramic composites for sealing solid oxide fuel cells”, Invited speaker, 30th Meeting of the American Ceramic Society (Cocoa Beach), January 25, 2006.
2. R.E. Loehman, A. Ayala, M. Brochu, and B. Gauntt, "Sealing Solid Oxide Fuel Cells with Glass-Matrix Composites," 3rd International Brazing & Soldering Conference (IBSC) (ASM International), April 23-26, 2006, San Antonio, TX.
3. E. Corral, B. Gauntt and R. Loehman, “Sealing SOFCs with Glass Matrix Composites,” SECA Glass Sealing Workshop, National Energy Technology Laboratory, Morgantown, WV, September 20-21, 2006.
4. E. Corral, B. Gauntt and R. Loehman, “Glass Composites for Sealing Solid Oxide Fuel Cells: A Science Based Engineering Approach,” Rio Grande Symposium on Advanced Materials, October 10, 2006, Embassy Suites Hotel, Albuquerque, NM.
5. E. Corral, A. Ayala, B. Gauntt, and R. Loehman, “Long-Term Evaluation of Engineered Glass-Ceramic Composites for Solid Oxide Fuel Cell Applications,” Materials Science & Technology 2006 Conference and Exhibition (MS&T 06), October 15-19, 2006, Cincinnati, OH.
6. E. Corral, A. Ayala, B. Gauntt, and R. Loehman, “Properties of Engineering Glass Composites for Sealing Solid Oxide Fuel Cells,” Materials Science & Technology 2006 Conference and Exhibition (MS&T 06), October 15-19, 2006, Cincinnati, OH.
7. E. Corral, B. Gauntt, R. Loehman, “Glass Composites as Sealing Materials for Solid Oxide Fuel Cells”, The American Ceramic Society’s 2007 Glass & Optical Materials Division Meeting & 18th University Conference on Glass, May 20-23, 2007, Rochester, New York (invited).
8. E. Corral, and R. Loehman, “Viscosity Properties of Glass Composites Engineered As Sealing
Materials For Solid Oxide Fuel Cells,” Ceramics & Glasses Session, The Seventeenth Annual Rio Grande Symposium on Advanced Materials, The University of New Mexico, Albuquerque, NM, October 9, 2007.

36
9. E. Corral and R. Loehman, “Glass Composites as Reliable Seals for Solid Oxide Fuel Cells,” Fuel
Cells: Materials, Processing, Manufacturing, and Power Management Technologies: Sealing, Contact, Stack Manufacturing, and Balance of Plants of SOFC, Materials Science & Technology 2007 Conference and Exposition, Detroit, MI, September 16-20, 2007.

37
Distribution 1 Technical Library Electronic Copy [email protected] 1 Terry Garino Electronic Copy [email protected] 1 Jill Glass Electronic Copy [email protected] 1 Bill Hammetter Electronic Copy [email protected] 1 Raj Tandon Electronic Copy [email protected] 1 Jim Voigt Electronic Copy [email protected] 1 Ron Loehman Electronic Copy [email protected]
1 Erica Corral Electronic Copy [email protected]
