filing at a glance - pennsylvania insurance … at a glance company: nationwide affinity insurance...
TRANSCRIPT

Filing at a Glance
Company: Nationwide Affinity Insurance Company of America.
Product Name: Private Passenger Auto
State: Pennsylvania
TOI: 19.0 Personal Auto
Sub-TOI: 19.0001 Private Passenger Auto (PPA)
Filing Type: Rate
Date Submitted: 07/18/2016
SERFF Tr Num: NWPC-130643437
SERFF Status: Assigned
State Tr Num:
State Status: Received Review in Progress
Co Tr Num: 16A-10916PA-RRE (NAICOA)
Effective DateRequested (New):
Effective DateRequested (Renewal):
12/22/2016
Author(s): Lori Sabatino, Teresa Herderick
Reviewer(s): Xiaofeng Lu (primary), Michael McKenney
Disposition Date:
Disposition Status:
Effective Date (New):
Effective Date (Renewal):
State Filing Description:
SERFF Tracking #: NWPC-130643437 State Tracking #: Company Tracking #: 16A-10916PA-RRE (NAICOA)
State: Pennsylvania Filing Company: Nationwide Affinity Insurance Company of America.
TOI/Sub-TOI: 19.0 Personal Auto/19.0001 Private Passenger Auto (PPA)
Product Name: Private Passenger Auto
Project Name/Number: PA Rate Change (NAICOA)/16A-10916PA-RRE (NAICOA)
PDF Pipeline for SERFF Tracking Number NWPC-130643437 Generated 07/19/2016 03:23 PM

General Information
Company and Contact
Filing Fees
State Specific
Project Name: PA Rate Change (NAICOA) Status of Filing in Domicile: Not Filed
Project Number: 16A-10916PA-RRE (NAICOA) Domicile Status Comments:
Reference Organization: Reference Number:
Reference Title: Advisory Org. Circular:
Filing Status Changed: 07/18/2016
State Status Changed: 07/18/2016 Deemer Date:
Created By: Lori Sabatino Submitted By: Lori Sabatino
Corresponding Filing Tracking Number:
Filing Description:
We are making the following changes to the Pennsylvania Private Passenger Automobiles written in the Nationwide AffinityInsurance Company of America, effective December 22, 2016 for renewal business. This company does not write newbusiness. We are filing for uniform changes to the territory base rates and miscellaneous coverage rates. The overall ratelevel change is 4.8 percent.
Filing Contact InformationTeresa Herderick, Pricing Director [email protected]
One Nationwide Plaza
1-17-401
Columbus, OH 43215
614-249-3965 [Phone]
Filing Company InformationNationwide Affinity InsuranceCompany of America.
One Nationwide Plaza
Columbus, OH 43215
(614) 249-7022 ext. [Phone]
CoCode: 26093
Group Code: 140
Group Name: NationwideInsurance
FEIN Number: 48-0470690
State of Domicile: Ohio
Company Type: Property andCasualty
State ID Number:
Fee Required? Yes
Fee Amount: $50.00
Retaliatory? Yes
Fee Explanation: $50 = Nationwide Affinity Insurance Company of America
Per Company: Yes
Company Amount Date Processed Transaction #Nationwide Affinity Insurance Company ofAmerica.
$50.00 07/18/2016 111418952
*Filing Fee Amount: 50.00*Date Filing Fee Mailed: Via EFT*Filing Fee Check Number: Via EFT
SERFF Tracking #: NWPC-130643437 State Tracking #: Company Tracking #: 16A-10916PA-RRE (NAICOA)
State: Pennsylvania Filing Company: Nationwide Affinity Insurance Company of America.
TOI/Sub-TOI: 19.0 Personal Auto/19.0001 Private Passenger Auto (PPA)
Product Name: Private Passenger Auto
Project Name/Number: PA Rate Change (NAICOA)/16A-10916PA-RRE (NAICOA)
PDF Pipeline for SERFF Tracking Number NWPC-130643437 Generated 07/19/2016 03:23 PM

*Filing Fee Check Date: Via EFT*NAIC Number: 26093
SERFF Tracking #: NWPC-130643437 State Tracking #: Company Tracking #: 16A-10916PA-RRE (NAICOA)
State: Pennsylvania Filing Company: Nationwide Affinity Insurance Company of America.
TOI/Sub-TOI: 19.0 Personal Auto/19.0001 Private Passenger Auto (PPA)
Product Name: Private Passenger Auto
Project Name/Number: PA Rate Change (NAICOA)/16A-10916PA-RRE (NAICOA)
PDF Pipeline for SERFF Tracking Number NWPC-130643437 Generated 07/19/2016 03:23 PM

Rate Information Rate data applies to filing.
Filing Method: Prior Approval
Rate Change Type: Increase
Overall Percentage of Last Rate Revision: 6.300%
Effective Date of Last Rate Revision: 06/22/2016
Filing Method of Last Filing: Prior Approval
Company Rate Information
Company
Name:
Overall %
Indicated
Change:
Overall %
Rate
Impact:
Written Premium
Change for
this Program:
Number of Policy
Holders Affected
for this Program:
Written
Premium for
this Program:
Maximum %
Change
(where req'd):
Minimum %
Change
(where req'd):Nationwide AffinityInsurance Company ofAmerica.
4.800% 4.800% $9,769,895 114,009 $203,539,470 10.000% 0.000%
SERFF Tracking #: NWPC-130643437 State Tracking #: Company Tracking #: 16A-10916PA-RRE (NAICOA)
State: Pennsylvania Filing Company: Nationwide Affinity Insurance Company of America.
TOI/Sub-TOI: 19.0 Personal Auto/19.0001 Private Passenger Auto (PPA)
Product Name: Private Passenger Auto
Project Name/Number: PA Rate Change (NAICOA)/16A-10916PA-RRE (NAICOA)
PDF Pipeline for SERFF Tracking Number NWPC-130643437 Generated 07/19/2016 03:23 PM
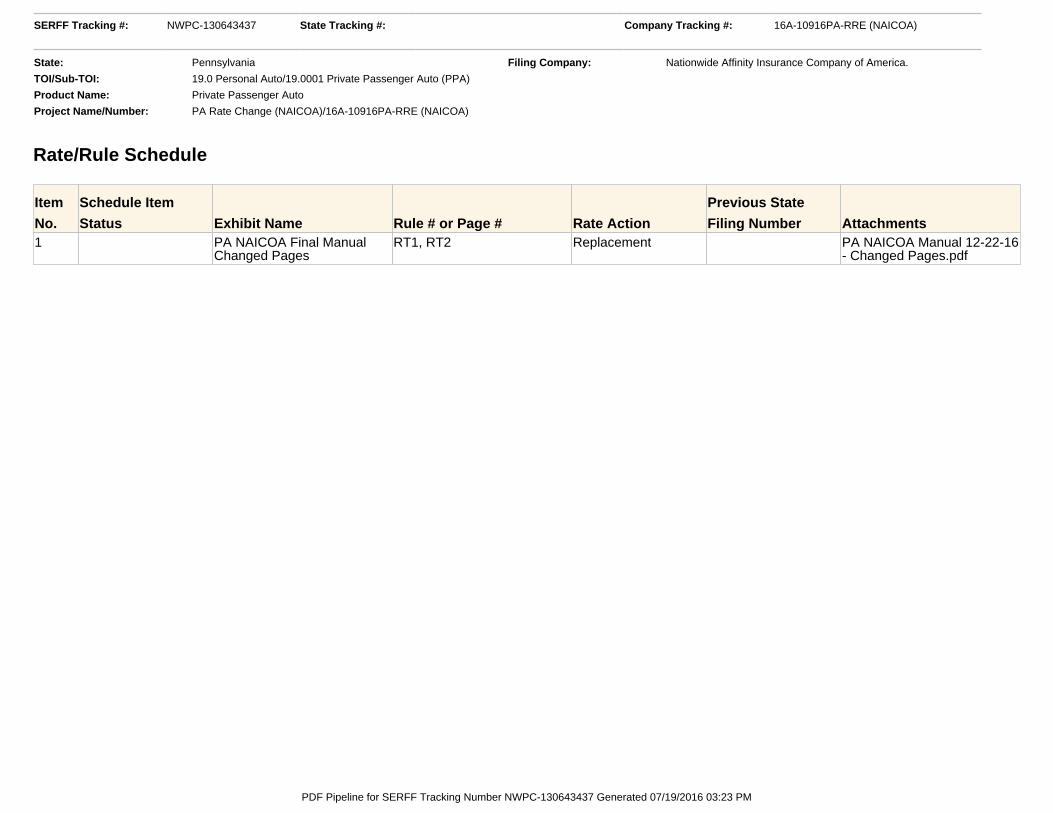
Rate/Rule Schedule
Item
No.
Schedule Item
Status Exhibit Name Rule # or Page # Rate Action
Previous State
Filing Number Attachments1 PA NAICOA Final Manual
Changed PagesRT1, RT2 Replacement PA NAICOA Manual 12-22-16
- Changed Pages.pdf
SERFF Tracking #: NWPC-130643437 State Tracking #: Company Tracking #: 16A-10916PA-RRE (NAICOA)
State: Pennsylvania Filing Company: Nationwide Affinity Insurance Company of America.
TOI/Sub-TOI: 19.0 Personal Auto/19.0001 Private Passenger Auto (PPA)
Product Name: Private Passenger Auto
Project Name/Number: PA Rate Change (NAICOA)/16A-10916PA-RRE (NAICOA)
PDF Pipeline for SERFF Tracking Number NWPC-130643437 Generated 07/19/2016 03:23 PM

Pennsylvania Private Passenger Auto TOC Nationwide Affinity Insurance Company of America
© 2007-2016, Nationwide
Rating TablesTable of Contents
Rate Calculation TablesPrivate Passenger Auto Rate Calculation RC 1Gap (Loan/Lease) Premium Rate Calculation RC 2New Car Replacement Premium Rate Calculation RC 2Vehicle Value Upgrade Premium Rate Calculation RC 2Supplemental Vehicle Rate Calculation RC 3Named Non-Owner Rate Calculation RC 3Rating Territory Schedule TS 1Base Rates:Territory Base Rates: BI,PD,MDCL,LOI,AD,FUNRL,COMBL,COMP,COLL, UMBI, UIMBI** RT 1Loss of Use Base Rates** RT 2Roadside Assistance Base Rates RT 2Towing and Labor Base Rates RT 2Excess Medical Benefit Base Rates** RT 2Additional Coverage for Sound, Picture and Data Devices RT 2Factors and Discounts:Nationwide Affinity Discount RT 3Nationwide Associate Discount RT 3Tier Factor RT 4Farm Bureau Discount RT 5New Vehicle Discount RT 5OEM Loss Settlement Endorsement RT 5Vehicle Use Factor RT 5Household Composition Factor RT 6Anti-Theft Device Discount RT 7Driver Improvement Course Discount RT 7No Prior Insurance Surcharge RT 7Passive Occupant Restraint Discount RT 8Matrix Factor RT 8Terms with Prior Carrier Factors RT 8Select Rating Factor RT 9Prior Nationwide Non-Standard Auto Factor RT 10Premier Intra-Agency Transfer Discount RT 10Advance Quote Discount RT 10New Business Homeownership Discount RT 10Home and Car Discount RT 10Auto Financial Discount RT 11Paperless Policy Discount RT 11Accident Forgiveness RT 11Additional Coverage for Customization RT 11Vanishing Deductible Credit RT 12Total Loss Deductible Waiver RT 12GAP (Loan/Lease) Coverage RT 13New Car Replacement Plus Coverage RT 13Vehicle Value Upgrade Coverage RT 13Limited Tort Option Reduction RT 13Easy Pay Sign-up Discount RT 14Preferred Discount RT 14Preferred Bundle Discount RT 14Rate Stability RT 14Identity Theft or Identity Fraud Expense Coverage RT 14Driver Classification Factors - Adult RT 15

Pennsylvania Private Passenger Auto TOC Nationwide Affinity Insurance Company of America
© 2007-2016, Nationwide
Rating TablesTable of Contents
Rate Calculation TablesDriver Classification Factors - Youthful RT 16Violation Surcharges RT 17Additional Violations Additive RT 18Violations Time Since Factor RT 18Chargeable Accidents Additive RT 18Accidents Time Since Factor RT 18Accident Free Discount RT 19Safe Driver Discount RT 19Unverifiable Driver Record Surcharge RT 19Rate Symbols - Liability RT 20Rate Symbols - Physical Damage RT 21Model Year Factors RT 22Bodily Injury Limit Factors RT 23Property Damage Limit Factors RT 23Uninsured/ Underinsured Motorists Coverage Limit Factors RT 23Medical Benefits Limit Factors RT 24Combined Loss Benefit Limit Factor RT 24Accidental Death Benefit Limit Factor RT 24Income Loss Benefit Limit Factor RT 24Funeral Benefit Limit Factor RT 24Comprehensive Deductible Factors RT 25Collision Deductible Factors RT 25Expense Fees RT 25Miscellaneous Risks and Vehicles: Miscellaneous Vehicles Base Rate Adjustment Factors-- NNO RT 26Personal Effects Base Rates RT 26Trailer Base Rates--COMP and COLL RT 27Use of Other Automobile RT 28

Pennsylvania Private Passenger Auto RT 1 Nationwide Affinity Insurance Company of America
© 2007-2016, Nationwide
Territory Base Rates**Eff. 12-22-16
BI PD MDCL MDCLRating BI Rating PD Rating MDCL Rating
Territory 50/100 Territory 25,000 Territory 25,000 Territory LOI001 $251.00 001 $178.60 001 $298.30 001 $25.00002 261.00 002 188.30 002 321.50 002 27.20003 269.00 003 193.30 003 370.70 003 31.50004 273.10 004 200.50 004 388.90 004 32.80005 281.50 005 203.90 005 394.00 005 33.20006 283.50 006 207.80 006 399.10 006 33.70007 285.80 007 216.00 007 429.80 007 36.30008 289.80 008 219.30 008 432.40 008 36.40009 291.50 009 221.30 009 451.60 009 38.10010 293.90 010 226.10 010 447.40 010 37.80011 314.40 011 226.70 011 458.30 011 38.70012 316.10 012 230.30 012 461.20 012 38.90013 326.20 013 232.80 013 489.30 013 41.40014 367.30 014 237.60 014 507.10 014 42.60015 387.50 015 255.20 015 586.00 015 49.50016 389.70 016 260.10 016 624.00 016 52.70017 440.50 017 261.90 017 597.00 017 50.30018 473.30 018 273.60 018 682.70 018 57.60019 487.60 019 280.20 019 675.60 019 57.30020 597.90 020 285.10 020 714.80 020 60.40021 773.90 021 294.80 021 787.10 021 66.30022 789.20 022 303.60 022 1,262.30 022 106.80023 903.70 023 315.60 023 1,469.30 023 124.10024 938.50 024 349.50 024 1,477.40 024 124.90025 969.40 025 338.80 025 1,539.40 025 130.00999 366.30 026 350.40 999 506.40 999 42.60
999 238.40

Pennsylvania Private Passenger Auto RT 1 Nationwide Affinity Insurance Company of America
© 2007-2016, Nationwide
Territory Base Rates**Eff. 12-22-16
MDCL MDCL MDCLRating Rating Rating
Territory AD Territory FUNRL Territory COMBL001 $7.30 001 $1.30 001 $397.70002 8.20 002 1.50 002 427.70003 9.10 003 1.70 003 493.20004 9.40 004 1.70 004 518.00005 9.50 005 1.70 005 524.40006 9.50 006 1.70 006 531.10007 10.70 007 1.70 007 572.50008 10.80 008 1.80 008 575.80009 11.20 009 1.80 009 600.80010 11.10 010 1.80 010 596.00011 11.30 011 1.80 011 610.00012 11.40 012 1.80 012 613.40013 11.80 013 1.90 013 650.90014 12.50 014 2.00 014 674.60015 14.30 015 2.40 015 780.00016 15.40 016 2.50 016 830.50017 14.80 017 2.40 017 795.00018 16.80 018 2.70 018 908.80019 16.70 019 2.70 019 899.10020 17.60 020 2.70 020 950.90021 19.30 021 3.00 021 1,047.70022 31.00 022 4.90 022 1,680.00023 36.00 023 5.90 023 1,955.30024 36.10 024 6.00 024 1,966.10025 37.80 025 6.30 025 2,048.50999 12.50 999 2.00 999 674.00

Pennsylvania Private Passenger Auto RT 1 Nationwide Affinity Insurance Company of America
© 2007-2016, Nationwide
Territory Base Rates**Eff. 12-22-16
COMP COLL UMC UMBI UMC UIMBIRating COMP Rating COLL Rating 50/100 Rating 50/100
Territory Full Cov. Territory $100 Ded. Territory Unstacked Territory Unstacked001 $86.10 001 $295.50 001 $14.20 001 $67.30002 92.10 002 306.40 002 14.30 002 64.00003 94.40 003 313.70 003 13.90 003 58.50004 100.80 004 322.10 004 14.20 004 61.00005 109.30 005 323.30 005 13.90 005 57.10006 114.70 006 324.80 006 26.70 006 88.10007 112.70 007 331.60 007 13.90 007 52.60008 121.00 008 328.90 008 16.00 008 59.00009 118.90 009 335.00 009 14.30 009 67.60010 123.80 010 336.50 010 19.50 010 56.90011 129.50 011 346.40 011 38.70 011 107.40012 139.20 012 344.70 012 58.60 012 152.90013 130.50 013 350.30 013 26.00 013 67.60014 137.20 014 353.70 014 14.30 014 58.60015 146.20 015 369.70 015 22.30 015 127.60016 141.70 016 370.30 016 20.20 016 94.60017 159.40 017 383.00 017 22.30 017 94.60018 179.30 018 391.00 018 22.30 018 94.60019 168.80 019 391.90 019 151.50 019 271.40020 190.20 020 418.10 020 16.90 020 74.50021 201.90 021 421.10 021 19.40 021 89.00022 205.20 022 424.70 022 14.20 022 61.70023 201.20 023 446.40 023 14.20 023 64.90024 210.30 024 455.60 024 14.20 024 56.20025 213.60 025 408.30 025 27.60 025 87.20026 176.80 026 457.20 026 35.70 026 105.50027 192.30 027 435.70 027 54.80 027 143.10028 224.80 028 481.40 028 21.00 028 94.60029 192.30 029 496.40 999 25.40 999 80.30030 207.10 030 532.90031 230.40 031 517.50032 214.70 032 566.70033 269.90 033 549.80034 253.90 999 362.10035 221.40036 257.50037 269.40038 270.40999 132.90

Pennsylvania Private Passenger Auto RT 2 Nationwide Affinity Insurance Company of America
© 2007-2016, Nationwide
LOU Base Rates**Eff. 12-22-16
Rental Limit per Day Aggregate Limit Base Rate30 900 $36.1040 1,200 $46.8050 1,500 $57.3060 1,800 $67.7075 2,250 $81.10100 3,000 $104.70
Roadside Assistance Base RatesEff. 12-22-15
Coverage RateBasic $11.00Plus $21.00
TL Base RateEff 12-22-15
Limit Base Rate50 $2.00
EXMDCL Base Rate**Eff. 12-22-16
Aggregate Per Claimant Limit
Limit Per Person Per Year Base Rate
$1M $50,000 $23.70
Additional Coverage for Sound, Picture and Data Devices
Limit
Vehicles without OEM Loss Settlement
Provision
Vehicles with OEM Loss Settlement
Provision500 $14.30 $17.201000 $28.60 $34.301500 $42.90 $51.502000 $57.20 $68.602500 $71.50 $85.803000 $85.80 $102.903500 $100.10 $120.104000 $114.40 $137.304500 $128.70 $154.405000 $143.00 $171.60
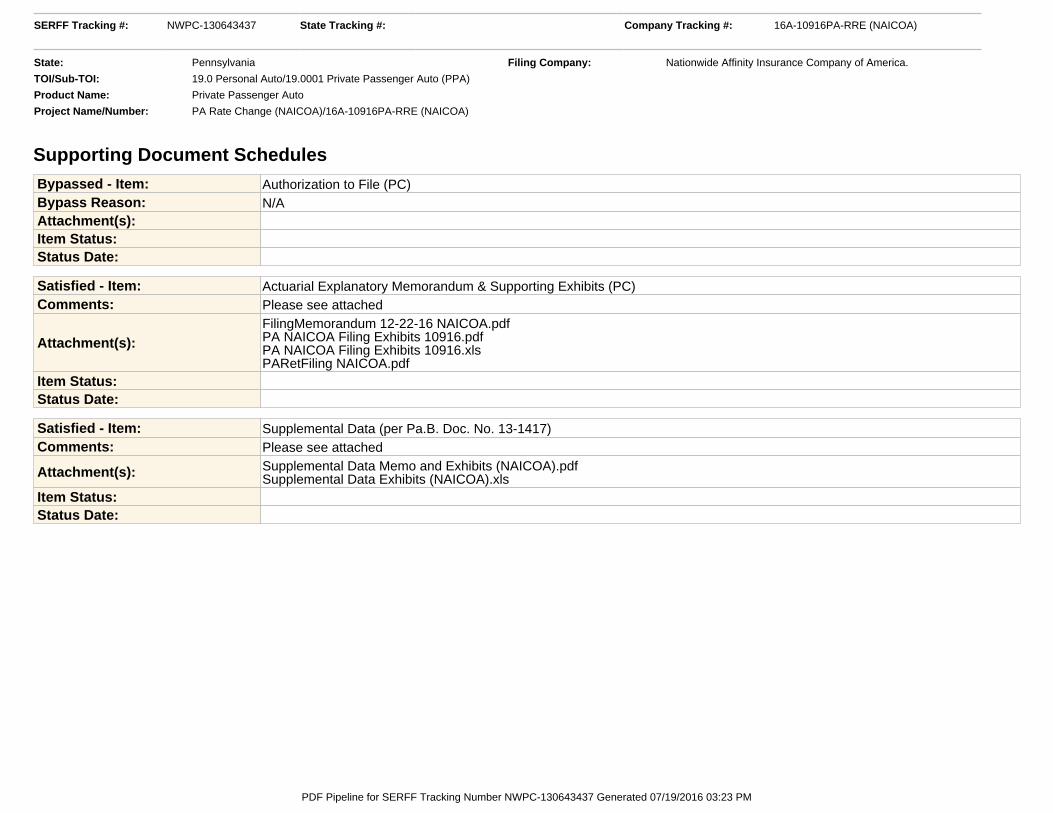
Supporting Document Schedules Bypassed - Item: Authorization to File (PC)Bypass Reason: N/AAttachment(s):Item Status:Status Date:
Satisfied - Item: Actuarial Explanatory Memorandum & Supporting Exhibits (PC)Comments: Please see attached
Attachment(s):FilingMemorandum 12-22-16 NAICOA.pdfPA NAICOA Filing Exhibits 10916.pdfPA NAICOA Filing Exhibits 10916.xlsPARetFiling NAICOA.pdf
Item Status:Status Date:
Satisfied - Item: Supplemental Data (per Pa.B. Doc. No. 13-1417)Comments: Please see attached
Attachment(s): Supplemental Data Memo and Exhibits (NAICOA).pdfSupplemental Data Exhibits (NAICOA).xls
Item Status:Status Date:
SERFF Tracking #: NWPC-130643437 State Tracking #: Company Tracking #: 16A-10916PA-RRE (NAICOA)
State: Pennsylvania Filing Company: Nationwide Affinity Insurance Company of America.
TOI/Sub-TOI: 19.0 Personal Auto/19.0001 Private Passenger Auto (PPA)
Product Name: Private Passenger Auto
Project Name/Number: PA Rate Change (NAICOA)/16A-10916PA-RRE (NAICOA)
PDF Pipeline for SERFF Tracking Number NWPC-130643437 Generated 07/19/2016 03:23 PM

Attachment PA NAICOA Filing Exhibits 10916.xls is not a PDF document and cannot be reproducedhere.
Attachment Supplemental Data Exhibits (NAICOA).xls is not a PDF document and cannot bereproduced here.
SERFF Tracking #: NWPC-130643437 State Tracking #: Company Tracking #: 16A-10916PA-RRE (NAICOA)
State: Pennsylvania Filing Company: Nationwide Affinity Insurance Company of America.
TOI/Sub-TOI: 19.0 Personal Auto/19.0001 Private Passenger Auto (PPA)
Product Name: Private Passenger Auto
Project Name/Number: PA Rate Change (NAICOA)/16A-10916PA-RRE (NAICOA)
PDF Pipeline for SERFF Tracking Number NWPC-130643437 Generated 07/19/2016 03:23 PM

FILING MEMORANDUM Pennsylvania Private Passenger Automobile
Outlined herein are details and supporting data relating to changes in Pennsylvania Private Passenger Automobile rates written in the Nationwide Affinity Insurance Company of America. Our proposed effective date for this filing is December 22, 2016 for renewal business. This company does not write new business. OVERALL RATE LEVEL CHANGES The indications developed in this filing are based on an assumed effective date of December 22, 2016. Exhibit I shows three years of Private Passenger Automobile experience by coverage for the Nationwide Affinity Insurance Company of America ending September 30, 2015. Earned premiums are adjusted to current rate levels and projected to the effective period of the new rates, and losses are on an accident year basis, developed to ultimate, and projected to the average date of loss during the effective period of the new rates. Exhibit II displays the premium trend analysis. Exhibit III provides the selected Past-to-Present and Present-to-Future premium trends by coverage. Exhibit I, row (6), shows the resulting premium projection factors. Accident year losses for the period ending September 30, 2015, were evaluated as of December 31, 2015. Allocated loss adjustment expenses were included with paid or incurred losses. Ultimate loss levels were calculated using historical loss development for Pennsylvania as provided on Exhibit IV. Large Losses We have adjusted Bodily Injury, Uninsured Motorists-Bodily Injury and Underinsured Motorists-Bodily Injury coverages’ ultimate losses by removing large losses over $500,000, developing the remaining losses to ultimate and then adding the large losses back into the estimated ultimate losses. Comprehensive Catastrophe Adjustment The random occurrence of catastrophes distorts actual underwriting results for the Comprehensive coverage. In order to account for expected catastrophes yet maintain stability in our rates, we remove actual catastrophe losses and replace them with a provision for expected catastrophe losses based on a 10-year experience period. Our Comprehensive indication contains a total catastrophe provision of 8.0 percent of non-catastrophe losses to reflect catastrophe exposure. The calculation of the catastrophe provision is provided in Exhibit V. Projection of Losses Exhibit VI shows Average Paid Cost Trend data and Incurred Claim Frequency by coverage for Pennsylvania Voluntary Standard Auto business and Companywide, respectively, for the past 24 quarters. The data is on a four-quarter-ending basis. Our projection of losses to anticipated future levels is primarily based on historical claim cost trends. We have also considered accident year trends, industry trends, and credibility measures. Exhibit VII shows the calculated loss trend percentages and provides support for the loss trend selections. We are incorporating the use of both retrospective and prospective trends, as shown on Exhibit VIII. Historical losses are trended first to the average date of the current accident year using retrospective trends. Then these "current" losses are trended to the future effective period using prospective trends.
© 2016 Nationwide
1

This two-step process allows for recognition of the fact that actual loss cost changes that occurred during the experience period may not always be consistent with what we expect will happen in the future. The selected trends were projected from the average date of loss for the experience period to the future average date of loss under the revised rates, based on an assumed effective date of December 22, 2016. The resulting loss projection factors, reflecting both severity and frequency by coverage, are shown on Exhibit I row (12) for Bodily Injury, Uninsured/Underinsured Motorists – Bodily Injury, First Party Benefits, and Collision; row (13) for Property Damage and Loss of Use; and row (14) for Comprehensive coverage. Projected Expense Adjustments We have projected expenses that are not directly related to premiums separately in determining the indicated rate need. These amounts differ for liability and physical damage coverages. Fixed Expenses, which include General Expense, Other Acquisition, and Adjusting and Other LAE, are calculated as a percentage of Earned Premium and projected to the effective period. Liability Physical Damage
Fixed Expenses 24.3% 23.9% Financial Needs Model Exhibit IX is the Company's Financial Needs Model, which demonstrates the need for a 2.0 percent underwriting profit provision for Liability coverages and a 3.5 percent underwriting profit provision for Physical Damage coverages, considering total investment income from all sources. Permissible Loss, Loss Adjustment, and Fixed Expense Ratio The permissible loss, loss adjustment, and fixed expense ratios of 84.5 percent for Liability coverages and 83.0 percent for Physical Damage coverages are derived using a 13.5 percent variable expense ratio, which includes the average commission and brokerage ratio for all agency states, the state premium tax rate, plus an allowance for miscellaneous taxes, licenses, and fees based on Companywide data.
Permissible Loss, Loss Adjustment, and Fixed Expense Ratio
Liability (100% – 13.5% Variable Expenses – 2.0% Profit) = 84.5%
Physical Damage (100% – 13.5% Variable Expenses – 3.5% Profit) = 83.0% Trended Permissible Loss and ALAE Ratio The complement of credibility is applied to the change indicated by the Trended Permissible Loss and ALAE Ratio. The calculation of the Trended Permissible Loss and ALAE Ratio is described in Exhibit X.
© 2016 Nationwide
2
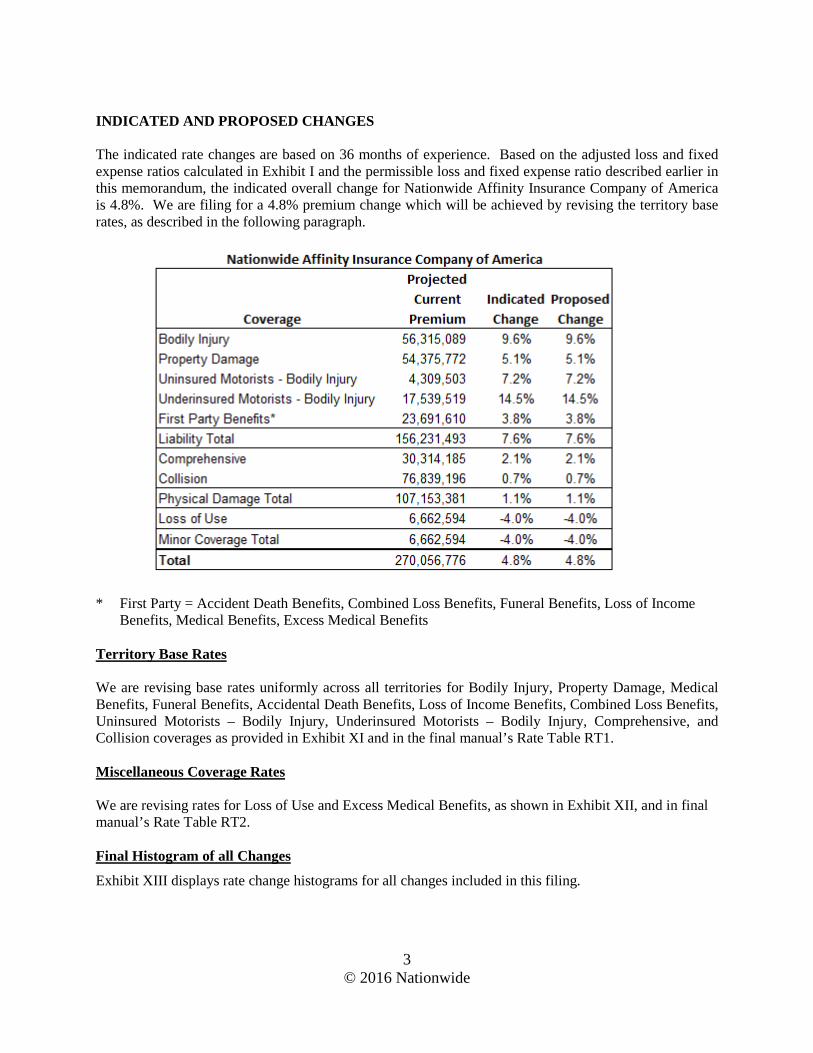
INDICATED AND PROPOSED CHANGES The indicated rate changes are based on 36 months of experience. Based on the adjusted loss and fixed expense ratios calculated in Exhibit I and the permissible loss and fixed expense ratio described earlier in this memorandum, the indicated overall change for Nationwide Affinity Insurance Company of America is 4.8%. We are filing for a 4.8% premium change which will be achieved by revising the territory base rates, as described in the following paragraph.
* First Party = Accident Death Benefits, Combined Loss Benefits, Funeral Benefits, Loss of Income Benefits, Medical Benefits, Excess Medical Benefits
Territory Base Rates We are revising base rates uniformly across all territories for Bodily Injury, Property Damage, Medical Benefits, Funeral Benefits, Accidental Death Benefits, Loss of Income Benefits, Combined Loss Benefits, Uninsured Motorists – Bodily Injury, Underinsured Motorists – Bodily Injury, Comprehensive, and Collision coverages as provided in Exhibit XI and in the final manual’s Rate Table RT1. Miscellaneous Coverage Rates We are revising rates for Loss of Use and Excess Medical Benefits, as shown in Exhibit XII, and in final manual’s Rate Table RT2. Final Histogram of all Changes
Exhibit XIII displays rate change histograms for all changes included in this filing.
© 2016 Nationwide
3

© 2016 Nationwide
Pennsylvania Private Passenger AutomobileNationwide Affinity Insurance Company of America
Summary of Exhibits
Exhibit I IndicationsExhibit II Premium Trend SummariesExhibit III Determination of Premium Projection FactorsExhibit IV Loss DevelopmentExhibit V Determination of Catastrophe LoadExhibit VI Loss Trend DataExhibit VII Loss Trend SummariesExhibit VIII Determination of Loss Projection FactorsExhibit IX Financial Needs ModelExhibit X Determination of Trended Permissible Loss and ALAE RatioExhibit XI Territory Base Rates Exhibit XII Miscellaneous Coverage RatesExhibit XIII Histogram

Exhibit IPage 1
© 2016 Nationwide
Pennsylvania Personal AutomobileNationwide Affinity Insurance Company of America
Calculation of Indicated Rate-Level Change Assumed Effective December 22, 2016Bodily Injury
Fiscal Accident Year Ending 2013/3 2014/3 2015/3 2-Year 3-Year
Premium1. Earned Exposures 363,680 302,936 241,178 544,114 907,7942. Historical Earned Premium 67,625,453 57,739,065 47,257,8673. Current Level Earned Premium 100,046,613 79,973,566 61,278,6604. Selected Retrospective Premium Trend -3.8% -3.8% -3.8%5. Selected Prospective Premium Trend -3.7% -3.7% -3.7%6. Premium Projection Factor 0.850 0.884 0.9197. Projected Current Level Earned Premium = (3) × (6) 85,039,621 70,696,632 56,315,089 127,011,721 212,051,342
Experience Losses and Defense and Cost Containment Expenses8. Estimated Ultimate Losses and DCC Expenses 52,797,463 41,477,779 30,122,7469. Adjusted Estimated Ultimate Losses and DCC Expenses = (8) 52,797,463 41,477,779 30,122,74610. Selected Retrospective Loss Cost Trend 6.0% 6.0% 6.0%11. Selected Prospective Loss Cost Trend 8.4% 8.4% 8.4%12. Loss Projection Factor 1.345 1.269 1.19713. Projected Estimated Ultimate Losses and DCC Expenses = (9) x (12) 71,012,588 52,635,302 36,056,927 87,257,052 153,949,27414. Projected Loss and DCC Expense Ratio = (13) ÷ (7) 83.5% 74.5% 64.0% 68.7% 72.6%15. Experience Year Weights Used Above 45/55 25/35/4016. Credibility Assigned to Experience 59.3% 54.8% 49.1% 68.5% 78.4%17. Trended Permissible Loss and DCC Expense Ratio 66.8% 66.8% 66.8% 66.8% 66.8%18. Credibility-Weighted Loss and DCC Expense Ratio = (16) × (14) + [1 - (16)] × (1 76.7% 71.0% 65.4% 68.1% 71.3%19. Credibility-Weighted Losses and DCC Expenses = (7) × (18) 65,225,389 50,194,609 36,830,068 86,494,982 151,192,607
Fixed Expenses20. Est. General & Other Acquisition = 2015/3 Avg Hist Prem×(1)×(15.7%) 11,188,078 9,319,379 7,419,48521. Est. Adjusting and Other Loss Adjustment = 2015/3 Avg Hist Prem×(1)×(8.6%) 6,128,502 5,104,883 4,064,17722. Selected Fixed Expense Trend 2.0% 2.0% 2.0%23. Fixed Expense Projection Factor 1.045 1.045 1.04524. Projected Total Fixed Expenses 18,095,827 15,073,354 12,000,427 27,073,781 45,169,608
Indication25. Credibility-Weighted Losses, DCC and Fixed Expenses = (19) + (24) 83,321,216 65,267,963 48,830,495 113,568,763 196,362,21526. Permissible Loss, DCC and Fixed Expense Ratio 84.5% 84.5% 84.5% 84.5% 84.5%27. Required Premium = (25) ÷ (26) 98,604,989 77,240,193 57,787,568 134,400,903 232,381,32028. Credibility-Weighted Indicated Rate Level Change = (27) ÷ (7) - 1 16.0% 9.3% 2.6% 5.8% 9.6%

Exhibit IPage 2
© 2016 Nationwide
Pennsylvania Personal AutomobileNationwide Affinity Insurance Company of America
Calculation of Indicated Rate-Level Change Assumed Effective December 22, 2016Property Damage
Fiscal Accident Year Ending 2013/3 2014/3 2015/3 2-Year 3-Year
Premium1. Earned Exposures 363,768 302,960 241,239 544,199 907,9672. Historical Earned Premium 62,134,916 54,106,959 45,227,8763. Current Level Earned Premium 93,244,369 75,174,926 58,093,7744. Selected Retrospective Premium Trend -3.0% -3.0% -3.0%5. Selected Prospective Premium Trend -2.9% -2.9% -2.9%6. Premium Projection Factor 0.881 0.908 0.9367. Projected Current Level Earned Premium = (3) × (6) 82,148,289 68,258,833 54,375,772 122,634,605 204,782,894
Experience Losses and Defense and Cost Containment Expenses8. Estimated Ultimate Losses and DCC Expenses 48,165,320 38,200,089 31,922,5529. Current Coverage Adjustment 1.001 1.001 1.00010. Adjusted Estimated Ultimate Losses and DCC Expenses = (8) × (9) 48,213,485 38,238,289 31,922,55211. Selected Retrospective Loss Cost Trend 2.8% 2.8% 2.8%12. Selected Prospective Loss Cost Trend 6.3% 6.3% 6.3%13. Loss Projection Factor 1.211 1.178 1.14614. Projected Estimated Ultimate Losses and DCC Expenses = (10) x (13) 58,386,530 45,044,704 36,583,245 81,797,282 138,842,80215. Projected Loss and DCC Expense Ratio = (14) ÷ (7) 71.1% 66.0% 67.3% 66.7% 67.8%16. Experience Year Weights Used Above 45/55 25/35/4017. Credibility Assigned to Experience 92.4% 91.0% 88.9% 94.8% 96.8%18. Trended Permissible Loss and DCC Expense Ratio 65.9% 65.9% 65.9% 65.9% 65.9%19. Credibility-Weighted Loss and DCC Expense Ratio = (17) × (15) + [1 - (17)] × (1 70.7% 66.0% 67.1% 66.7% 67.7%20. Credibility-Weighted Losses and DCC Expenses = (7) × (19) 58,078,840 45,050,830 36,486,143 81,797,282 138,638,019
Fixed Expenses21. Est. General & Other Acquisition = 2015/3 Avg Hist Prem×(1)×(15.7%) 10,707,371 8,917,511 7,100,77722. Est. Adjusting and Other Loss Adjustment = 2015/3 Avg Hist Prem×(1)×(8.6%) 5,865,183 4,884,750 3,889,59723. Selected Fixed Expense Trend 2.0% 2.0% 2.0%24. Fixed Expense Projection Factor 1.045 1.045 1.04525. Projected Total Fixed Expenses 17,318,319 14,423,363 11,484,941 25,908,304 43,226,623
Indication26. Credibility-Weighted Losses, DCC and Fixed Expenses = (20) + (25) 75,397,159 59,474,193 47,971,084 107,705,586 181,864,64227. Permissible Loss, DCC and Fixed Expense Ratio 84.5% 84.5% 84.5% 84.5% 84.5%28. Required Premium = (26) ÷ (27) 89,227,407 70,383,660 56,770,514 127,462,232 215,224,42829. Credibility-Weighted Indicated Rate Level Change = (28) ÷ (7) - 1 8.6% 3.1% 4.4% 3.9% 5.1%
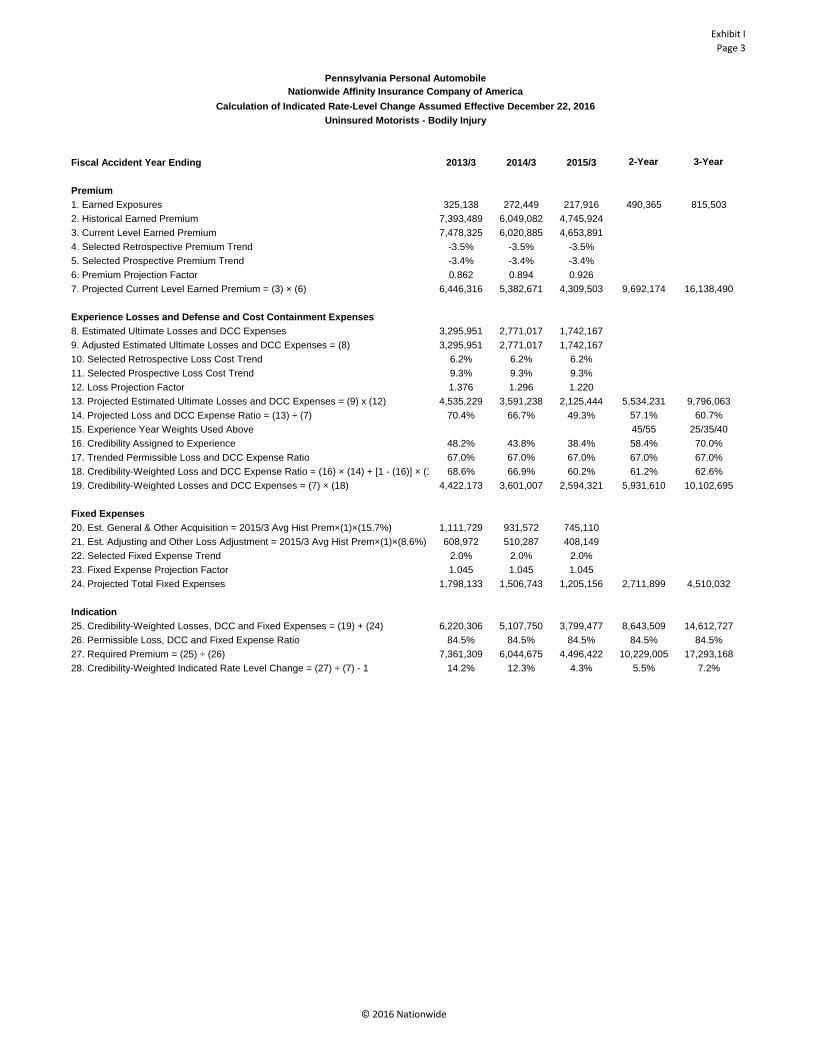
Exhibit IPage 3
© 2016 Nationwide
Pennsylvania Personal AutomobileNationwide Affinity Insurance Company of America
Calculation of Indicated Rate-Level Change Assumed Effective December 22, 2016Uninsured Motorists - Bodily Injury
Fiscal Accident Year Ending 2013/3 2014/3 2015/3 2-Year 3-Year
Premium1. Earned Exposures 325,138 272,449 217,916 490,365 815,5032. Historical Earned Premium 7,393,489 6,049,082 4,745,9243. Current Level Earned Premium 7,478,325 6,020,885 4,653,8914. Selected Retrospective Premium Trend -3.5% -3.5% -3.5%5. Selected Prospective Premium Trend -3.4% -3.4% -3.4%6. Premium Projection Factor 0.862 0.894 0.9267. Projected Current Level Earned Premium = (3) × (6) 6,446,316 5,382,671 4,309,503 9,692,174 16,138,490
Experience Losses and Defense and Cost Containment Expenses8. Estimated Ultimate Losses and DCC Expenses 3,295,951 2,771,017 1,742,1679. Adjusted Estimated Ultimate Losses and DCC Expenses = (8) 3,295,951 2,771,017 1,742,16710. Selected Retrospective Loss Cost Trend 6.2% 6.2% 6.2%11. Selected Prospective Loss Cost Trend 9.3% 9.3% 9.3%12. Loss Projection Factor 1.376 1.296 1.22013. Projected Estimated Ultimate Losses and DCC Expenses = (9) x (12) 4,535,229 3,591,238 2,125,444 5,534,231 9,796,06314. Projected Loss and DCC Expense Ratio = (13) ÷ (7) 70.4% 66.7% 49.3% 57.1% 60.7%15. Experience Year Weights Used Above 45/55 25/35/4016. Credibility Assigned to Experience 48.2% 43.8% 38.4% 58.4% 70.0%17. Trended Permissible Loss and DCC Expense Ratio 67.0% 67.0% 67.0% 67.0% 67.0%18. Credibility-Weighted Loss and DCC Expense Ratio = (16) × (14) + [1 - (16)] × (1 68.6% 66.9% 60.2% 61.2% 62.6%19. Credibility-Weighted Losses and DCC Expenses = (7) × (18) 4,422,173 3,601,007 2,594,321 5,931,610 10,102,695
Fixed Expenses20. Est. General & Other Acquisition = 2015/3 Avg Hist Prem×(1)×(15.7%) 1,111,729 931,572 745,11021. Est. Adjusting and Other Loss Adjustment = 2015/3 Avg Hist Prem×(1)×(8.6%) 608,972 510,287 408,14922. Selected Fixed Expense Trend 2.0% 2.0% 2.0%23. Fixed Expense Projection Factor 1.045 1.045 1.04524. Projected Total Fixed Expenses 1,798,133 1,506,743 1,205,156 2,711,899 4,510,032
Indication25. Credibility-Weighted Losses, DCC and Fixed Expenses = (19) + (24) 6,220,306 5,107,750 3,799,477 8,643,509 14,612,72726. Permissible Loss, DCC and Fixed Expense Ratio 84.5% 84.5% 84.5% 84.5% 84.5%27. Required Premium = (25) ÷ (26) 7,361,309 6,044,675 4,496,422 10,229,005 17,293,16828. Credibility-Weighted Indicated Rate Level Change = (27) ÷ (7) - 1 14.2% 12.3% 4.3% 5.5% 7.2%

Exhibit IPage 4
© 2016 Nationwide
Pennsylvania Personal AutomobileNationwide Affinity Insurance Company of America
Calculation of Indicated Rate-Level Change Assumed Effective December 22, 2016Underinsured Motorists - Bodily Injury
Fiscal Accident Year Ending 2013/3 2014/3 2015/3 2-Year 3-Year
Premium1. Earned Exposures 321,773 269,720 215,873 485,593 807,3662. Historical Earned Premium 26,822,434 22,418,971 17,946,5423. Current Level Earned Premium 27,532,775 22,804,271 18,026,2274. Selected Retrospective Premium Trend -1.2% -1.2% -1.2%5. Selected Prospective Premium Trend -1.2% -1.2% -1.2%6. Premium Projection Factor 0.950 0.961 0.9737. Projected Current Level Earned Premium = (3) × (6) 26,156,136 21,914,904 17,539,519 39,454,423 65,610,559
Experience Losses and Defense and Cost Containment Expenses8. Estimated Ultimate Losses and DCC Expenses 14,066,683 12,253,288 10,798,8319. Adjusted Estimated Ultimate Losses and DCC Expenses = (8) 14,066,683 12,253,288 10,798,83110. Selected Retrospective Loss Cost Trend 8.0% 8.0% 8.0%11. Selected Prospective Loss Cost Trend 8.0% 8.0% 8.0%12. Loss Projection Factor 1.384 1.282 1.18713. Projected Estimated Ultimate Losses and DCC Expenses = (9) x (12) 19,468,289 15,708,715 12,818,212 28,604,457 47,830,09814. Projected Loss and DCC Expense Ratio = (13) ÷ (7) 74.4% 71.7% 73.1% 72.5% 72.9%15. Experience Year Weights Used Above 45/55 25/35/4016. Credibility Assigned to Experience 47.9% 43.5% 38.1% 58.1% 69.8%17. Trended Permissible Loss and DCC Expense Ratio 65.9% 65.9% 65.9% 65.9% 65.9%18. Credibility-Weighted Loss and DCC Expense Ratio = (16) × (14) + [1 - (16)] × (1 70.0% 68.4% 68.6% 69.7% 70.8%19. Credibility-Weighted Losses and DCC Expenses = (7) × (18) 18,309,295 14,989,794 12,032,110 27,499,733 46,452,276
Fixed Expenses20. Est. General & Other Acquisition = 2015/3 Avg Hist Prem×(1)×(15.7%) 4,199,830 3,520,426 2,817,60721. Est. Adjusting and Other Loss Adjustment = 2015/3 Avg Hist Prem×(1)×(8.6%) 2,300,544 1,928,387 1,543,40322. Selected Fixed Expense Trend 2.0% 2.0% 2.0%23. Fixed Expense Projection Factor 1.045 1.045 1.04524. Projected Total Fixed Expenses 6,792,890 5,694,009 4,557,255 10,251,264 17,044,154
Indication25. Credibility-Weighted Losses, DCC and Fixed Expenses = (19) + (24) 25,102,185 20,683,803 16,589,365 37,750,997 63,496,43026. Permissible Loss, DCC and Fixed Expense Ratio 84.5% 84.5% 84.5% 84.5% 84.5%27. Required Premium = (25) ÷ (26) 29,706,728 24,477,873 19,632,385 44,675,736 75,143,70428. Credibility-Weighted Indicated Rate Level Change = (27) ÷ (7) - 1 13.6% 11.7% 11.9% 13.2% 14.5%

Exhibit IPage 5
© 2016 Nationwide
Pennsylvania Personal AutomobileNationwide Affinity Insurance Company of America
Calculation of Indicated Rate-Level Change Assumed Effective December 22, 2016
Accidental Death Benefits, Combined Loss Benefits, Funeral Benefits, Loss of Income Benefits, Medical Benefits, Excess Medical Benefits
Fiscal Accident Year Ending 2013/3 2014/3 2015/3 2-Year 3-Year
Premium1. Earned Exposures 963,999 811,190 651,508 1,462,698 2,426,6972. Historical Earned Premium 32,915,529 29,174,751 24,023,1733. Current Level Earned Premium 44,707,517 35,329,425 26,830,8154. Selected Retrospective Premium Trend -5.5% -5.5% -5.5%5. Selected Prospective Premium Trend -5.4% -5.4% -5.4%6. Premium Projection Factor 0.789 0.834 0.8837. Projected Current Level Earned Premium = (3) × (6) 35,274,231 29,464,740 23,691,610 53,156,350 88,430,581
Experience Losses and Defense and Cost Containment Expenses8. Estimated Ultimate Losses and DCC Expenses 26,927,326 20,454,595 15,383,4389. Adjusted Estimated Ultimate Losses and DCC Expenses = (8) 26,927,326 20,454,595 15,383,43810. Selected Retrospective Loss Cost Trend -6.2% -6.2% -6.2%11. Selected Prospective Loss Cost Trend -2.7% -2.7% -2.7%12. Loss Projection Factor 0.828 0.883 0.94113. Projected Estimated Ultimate Losses and DCC Expenses = (9) x (12) 22,295,826 18,061,407 14,475,815 32,531,686 54,561,66814. Projected Loss and DCC Expense Ratio = (13) ÷ (7) 63.2% 61.3% 61.1% 61.2% 61.7%15. Experience Year Weights Used Above 45/55 25/35/4016. Credibility Assigned to Experience 73.4% 69.9% 65.1% 80.7% 87.4%17. Trended Permissible Loss and DCC Expense Ratio 63.9% 63.9% 63.9% 63.9% 63.9%18. Credibility-Weighted Loss and DCC Expense Ratio = (16) × (14) + [1 - (16)] × (1 63.4% 62.1% 62.1% 61.7% 62.0%19. Credibility-Weighted Losses and DCC Expenses = (7) × (18) 22,363,862 18,297,604 14,712,490 32,797,468 54,826,960
Fixed Expenses20. Est. General & Other Acquisition = 2015/3 Avg Hist Prem×(1)×(15.7%) 5,580,676 4,696,051 3,771,63821. Est. Adjusting and Other Loss Adjustment = 2015/3 Avg Hist Prem×(1)×(8.6%) 3,056,931 2,572,360 2,065,99322. Selected Fixed Expense Trend 2.0% 2.0% 2.0%23. Fixed Expense Projection Factor 1.045 1.045 1.04524. Projected Total Fixed Expenses 9,026,299 7,595,489 6,100,325 13,695,814 22,722,113
Indication25. Credibility-Weighted Losses, DCC and Fixed Expenses = (19) + (24) 31,390,161 25,893,093 20,812,815 46,493,282 77,549,07326. Permissible Loss, DCC and Fixed Expense Ratio 84.5% 84.5% 84.5% 84.5% 84.5%27. Required Premium = (25) ÷ (26) 37,148,120 30,642,714 24,630,550 55,021,636 91,774,05128. Credibility-Weighted Indicated Rate Level Change = (27) ÷ (7) - 1 5.3% 4.0% 4.0% 3.5% 3.8%

Exhibit IPage 6
© 2016 Nationwide
Pennsylvania Personal AutomobileNationwide Affinity Insurance Company of America
Calculation of Indicated Rate-Level Change Assumed Effective December 22, 2016Comprehensive
Fiscal Accident Year Ending 2013/3 2014/3 2015/3 2-Year 3-Year
Premium1. Earned Exposures 299,819 252,833 203,274 456,107 755,9262. Historical Earned Premium 34,236,544 30,366,140 25,566,6153. Current Level Earned Premium 45,964,516 38,315,150 30,869,8424. Selected Retrospective Premium Trend -0.7% -0.7% -0.7%5. Selected Prospective Premium Trend -0.8% -0.8% -0.8%6. Premium Projection Factor 0.968 0.975 0.9827. Projected Current Level Earned Premium = (3) × (6) 44,493,651 37,357,271 30,314,185 67,671,456 112,165,107
Experience Losses and Defense and Cost Containment Expenses8. Estimated Ultimate Losses and DCC Expenses 25,331,740 22,612,423 17,068,4989. Catastrophe Load 1.080 1.080 1.08010. Current Coverage Adjustment 0.993 0.993 0.99711. Adjusted Estimated Ultimate Losses and DCC Expenses = (8) × (9) × (10) 27,166,771 24,250,467 18,378,67612. Selected Retrospective Loss Cost Trend 0.4% 0.4% 0.4%13. Selected Prospective Loss Cost Trend 0.9% 0.9% 0.9%14. Loss Projection Factor 1.028 1.024 1.02015. Projected Estimated Ultimate Losses and DCC Expenses = (11) x (14) 27,927,441 24,832,478 18,746,250 43,242,060 71,449,17316. Projected Loss and DCC Expense Ratio = (15) ÷ (7) 62.8% 66.5% 61.8% 63.9% 63.7%17. Experience Year Weights Used Above 45/55 25/35/4018. Credibility Assigned to Experience 85.7% 83.5% 80.3% 90.1% 93.8%19. Trended Permissible Loss and DCC Expense Ratio 62.2% 62.2% 62.2% 62.2% 62.2%20. Credibility-Weighted Loss and DCC Expense Ratio = (18) × (16) + [1 - (18)] × (1 62.7% 65.8% 61.9% 63.7% 63.6%21. Credibility-Weighted Losses and DCC Expenses = (7) × (20) 27,897,519 24,581,084 18,764,481 43,106,717 71,337,008
Fixed Expenses22. Est. General & Other Acquisition = 2015/3 Avg Hist Prem×(1)×(15.9%) 5,995,808 5,056,177 4,065,09223. Est. Adjusting and Other Loss Adjustment = 2015/3 Avg Hist Prem×(1)×(8.0%) 3,016,758 2,543,988 2,045,32924. Selected Fixed Expense Trend 2.0% 2.0% 2.0%25. Fixed Expense Projection Factor 1.045 1.045 1.04526. Projected Total Fixed Expenses 9,418,131 7,942,172 6,385,390 14,327,562 23,745,693
Indication27. Credibility-Weighted Losses, DCC and Fixed Expenses = (21) + (26) 37,315,650 32,523,256 25,149,871 57,434,279 95,082,70128. Permissible Loss, DCC and Fixed Expense Ratio 83.0% 83.0% 83.0% 83.0% 83.0%29. Required Premium = (27) ÷ (28) 44,958,614 39,184,646 30,301,049 69,197,927 114,557,47130. Credibility-Weighted Indicated Rate Level Change = (29) ÷ (7) - 1 1.0% 4.9% 0.0% 2.3% 2.1%

Exhibit IPage 7
© 2016 Nationwide
Pennsylvania Personal AutomobileNationwide Affinity Insurance Company of America
Calculation of Indicated Rate-Level Change Assumed Effective December 22, 2016Collision
Fiscal Accident Year Ending 2013/3 2014/3 2015/3 2-Year 3-Year
Premium1. Earned Exposures 277,482 233,992 188,083 422,075 699,5572. Historical Earned Premium 93,196,131 79,298,672 66,136,7583. Current Level Earned Premium 115,766,691 97,373,203 78,407,3434. Selected Retrospective Premium Trend -0.8% -0.8% -0.8%5. Selected Prospective Premium Trend -0.9% -0.9% -0.9%6. Premium Projection Factor 0.964 0.972 0.9807. Projected Current Level Earned Premium = (3) × (6) 111,599,090 94,646,753 76,839,196 171,485,949 283,085,039
Experience Losses and Defense and Cost Containment Expenses8. Estimated Ultimate Losses and DCC Expenses 68,464,003 58,108,210 46,171,0889. Adjusted Estimated Ultimate Losses and DCC Expenses = (8) 68,464,003 58,108,210 46,171,08810. Selected Retrospective Loss Cost Trend -0.6% -0.6% -0.6%11. Selected Prospective Loss Cost Trend 1.0% 1.0% 1.0%12. Loss Projection Factor 1.010 1.016 1.02213. Projected Estimated Ultimate Losses and DCC Expenses = (9) x (12) 69,148,643 59,037,941 47,186,852 106,149,802 175,229,63914. Projected Loss and DCC Expense Ratio = (13) ÷ (7) 62.0% 62.4% 61.4% 61.9% 61.9%15. Experience Year Weights Used Above 45/55 25/35/4016. Credibility Assigned to Experience 90.2% 88.6% 86.2% 93.4% 95.9%17. Trended Permissible Loss and DCC Expense Ratio 62.2% 62.2% 62.2% 62.2% 62.2%18. Credibility-Weighted Loss and DCC Expense Ratio = (16) × (14) + [1 - (16)] × (1 62.0% 62.4% 61.5% 61.9% 61.9%19. Credibility-Weighted Losses and DCC Expenses = (7) × (18) 69,191,436 59,059,574 47,256,106 106,149,802 175,229,639
Fixed Expenses20. Est. General & Other Acquisition = 2015/3 Avg Hist Prem×(1)×(15.9%) 15,514,055 13,082,523 10,515,74521. Est. Adjusting and Other Loss Adjustment = 2015/3 Avg Hist Prem×(1)×(8.0%) 7,805,814 6,582,402 5,290,94122. Selected Fixed Expense Trend 2.0% 2.0% 2.0%23. Fixed Expense Projection Factor 1.045 1.045 1.04524. Projected Total Fixed Expenses 24,369,263 20,549,847 16,517,987 37,067,834 61,437,097
Indication25. Credibility-Weighted Losses, DCC and Fixed Expenses = (19) + (24) 93,560,699 79,609,421 63,774,093 143,217,636 236,666,73626. Permissible Loss, DCC and Fixed Expense Ratio 83.0% 83.0% 83.0% 83.0% 83.0%27. Required Premium = (25) ÷ (26) 112,723,734 95,914,965 76,836,257 172,551,369 285,140,64628. Credibility-Weighted Indicated Rate Level Change = (27) ÷ (7) - 1 1.0% 1.3% 0.0% 0.6% 0.7%

Exhibit IPage 8
© 2016 Nationwide
Pennsylvania Personal AutomobileNationwide Affinity Insurance Company of America
Calculation of Indicated Rate-Level Change Assumed Effective December 22, 2016Loss of Use
Fiscal Accident Year Ending 2013/3 2014/3 2015/3 2-Year 3-Year
Premium1. Earned Exposures 179,847 149,706 119,671 269,377 449,2242. Historical Earned Premium 7,707,183 6,960,644 5,715,8353. Current Level Earned Premium 10,335,416 8,530,650 6,770,9294. Selected Retrospective Premium Trend -0.7% -0.7% -0.7%5. Selected Prospective Premium Trend -0.7% -0.7% -0.7%6. Premium Projection Factor 0.970 0.977 0.9847. Projected Current Level Earned Premium = (3) × (6) 10,025,354 8,334,445 6,662,594 14,997,039 25,022,393
Experience Losses and Defense and Cost Containment Expenses8. Estimated Ultimate Losses and DCC Expenses 5,746,797 5,237,277 3,591,7799. Current Coverage Adjustment 1.009 1.009 1.00410. Adjusted Estimated Ultimate Losses and DCC Expenses = (8) × (9) 5,798,518 5,284,412 3,606,14611. Selected Retrospective Loss Cost Trend 0.0% 0.0% 0.0%12. Selected Prospective Loss Cost Trend 0.0% 0.0% 0.0%13. Loss Projection Factor 1.000 1.000 1.00014. Projected Estimated Ultimate Losses and DCC Expenses = (10) x (13) 5,798,518 5,284,412 3,606,146 8,743,274 14,588,05515. Projected Loss and DCC Expense Ratio = (14) ÷ (7) 57.8% 63.4% 54.1% 58.3% 58.3%16. Experience Year Weights Used Above 45/55 25/35/4017. Credibility Assigned to Experience 97.6% 97.1% 96.5% 98.4% 99.0%18. Trended Permissible Loss and DCC Expense Ratio 61.8% 61.8% 61.8% 61.8% 61.8%19. Credibility-Weighted Loss and DCC Expense Ratio = (17) × (15) + [1 - (17)] × (1 57.9% 63.4% 54.4% 58.4% 58.3%20. Credibility-Weighted Losses and DCC Expenses = (7) × (19) 5,804,680 5,284,038 3,624,451 8,758,271 14,588,055
Fixed Expenses21. Est. General & Other Acquisition = 2015/3 Avg Hist Prem×(1)×(15.9%) 1,365,813 1,136,913 908,81822. Est. Adjusting and Other Loss Adjustment = 2015/3 Avg Hist Prem×(1)×(8.0%) 687,202 572,032 457,26723. Selected Fixed Expense Trend 2.0% 2.0% 2.0%24. Fixed Expense Projection Factor 1.045 1.045 1.04525. Projected Total Fixed Expenses 2,145,401 1,785,847 1,427,559 3,213,406 5,358,807
Indication26. Credibility-Weighted Losses, DCC and Fixed Expenses = (20) + (25) 7,950,081 7,069,885 5,052,010 11,971,677 19,946,86227. Permissible Loss, DCC and Fixed Expense Ratio 83.0% 83.0% 83.0% 83.0% 83.0%28. Required Premium = (26) ÷ (27) 9,578,411 8,517,934 6,086,759 14,423,707 24,032,36429. Credibility-Weighted Indicated Rate Level Change = (28) ÷ (7) - 1 -4.5% 2.2% -8.6% -3.8% -4.0%

Exhibit IIPage 1
© 2016 Nationwide
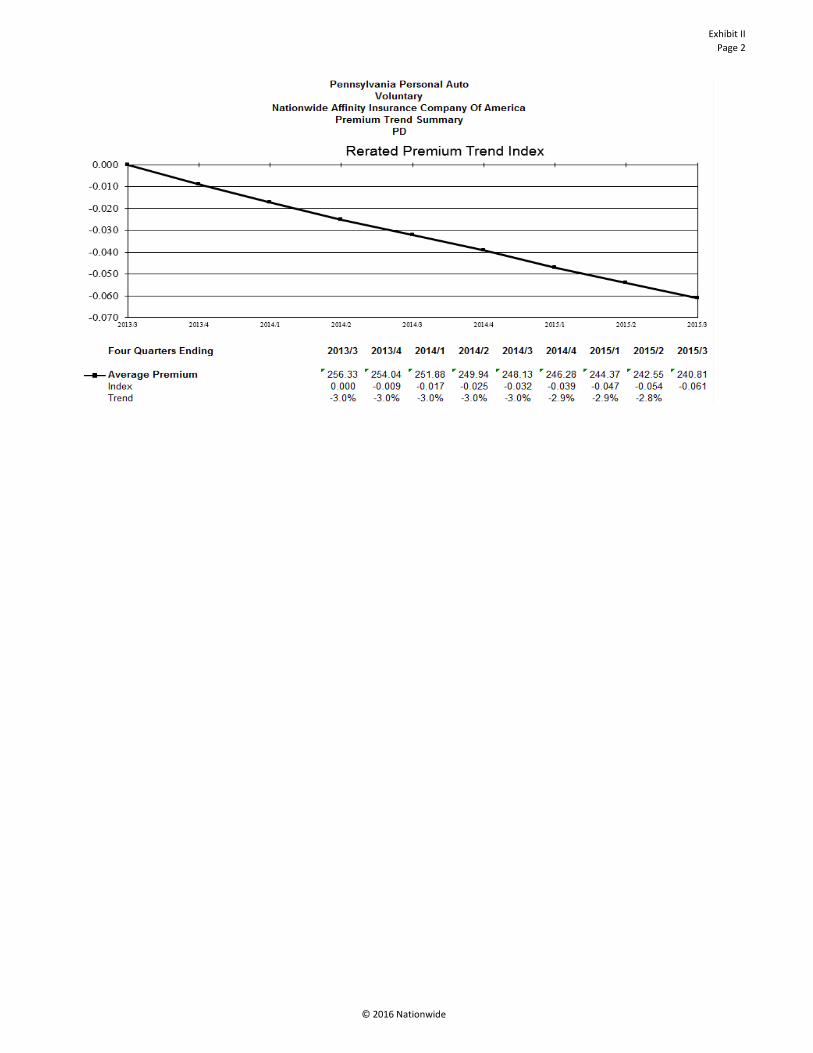
Exhibit IIPage 2
© 2016 Nationwide

Exhibit IIPage 3
© 2016 Nationwide
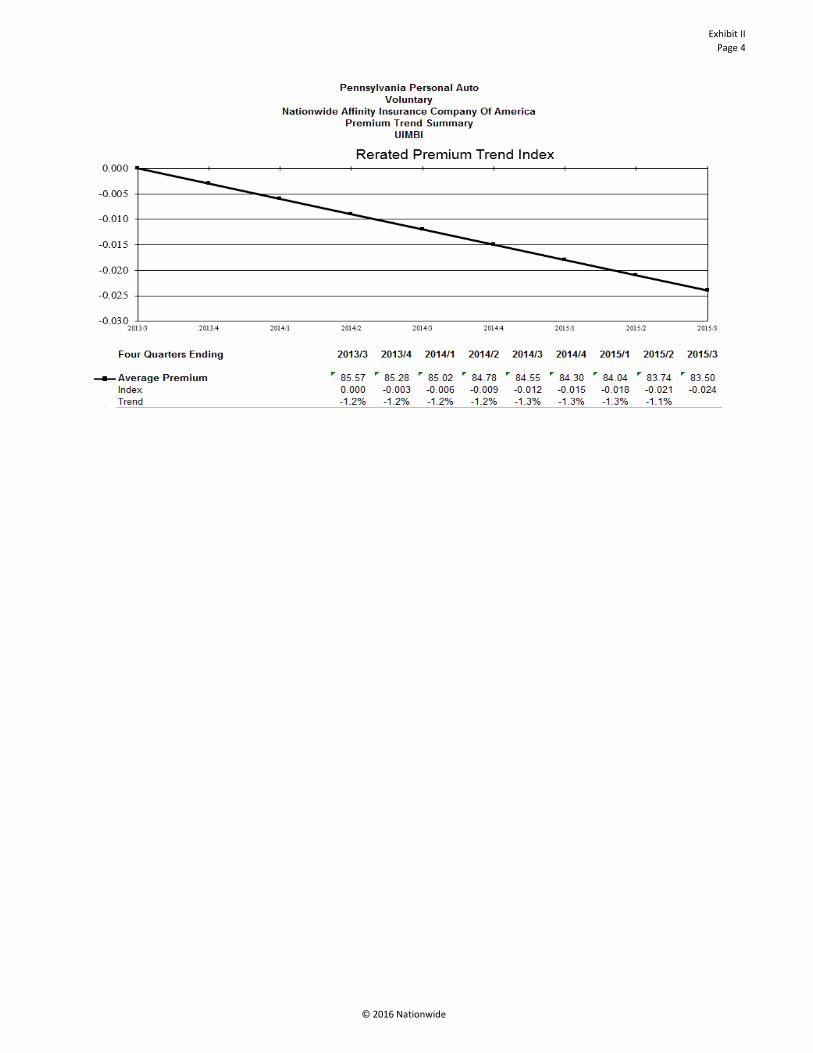
Exhibit IIPage 4
© 2016 Nationwide

Exhibit IIPage 5
© 2016 Nationwide

Exhibit IIPage 6
© 2016 Nationwide

Exhibit IIPage 7
© 2016 Nationwide
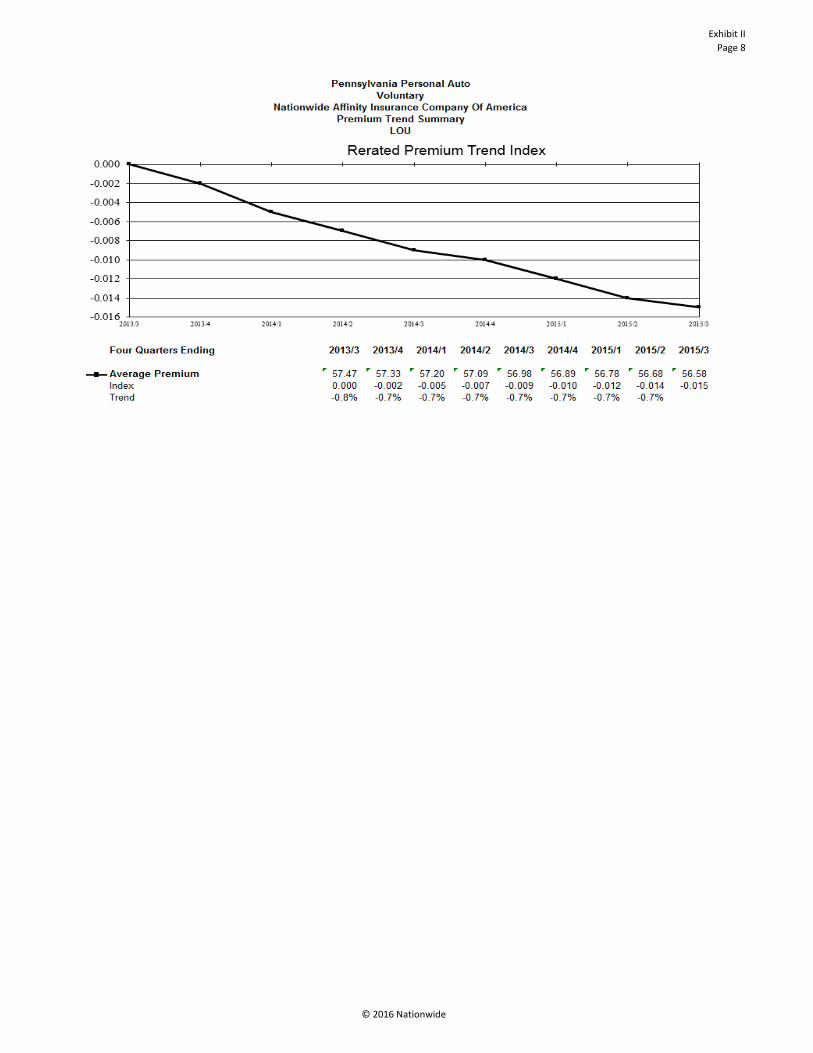
Exhibit IIPage 8
© 2016 Nationwide

Exhibit IIIPage 1
© 2016 Nationwide
Pennsylvania Personal AutomobileNationwide Affinity Insurance Company of America
Determination of Premium Projection FactorsBodily Injury
Fiscal Calendar Year Ending2013/3 2014/3 2015/3
Past-to-Present Adjustments1. Average Earned Date for Fiscal Calendar Year 3/31/2013 3/31/2014 3/31/20152. Average Earned Date for Latest Fiscal Calendar Year 3/31/2015 3/31/2015 3/31/20153. Years of Trend = (2) - (1) 2.000 1.000 0.0004. Selected Premium Trend -3.8% -3.8% -3.8%5. Past-to-Present Factor = [1+(4)](3) 0.925 0.962 1.000
Present-to-Future Adjustments6. Average Earned Date for Latest Fiscal Calendar Year 3/31/2015 3/31/2015 3/31/20157. Average Earned Date for Assumed Effective Period 6/22/2017 6/22/2017 6/22/20178. Years of Trend = (7) - (6) 2.232 2.232 2.2329. Selected Premium Trend -3.7% -3.7% -3.7%10. Present-to-Future Factor = [1+(9)](8) 0.919 0.919 0.919
Past-to-Future Adjustments11. Premium Projection Factor = (5) × (10) 0.850 0.884 0.919

Exhibit IIIPage 2
© 2016 Nationwide
Pennsylvania Personal AutomobileNationwide Affinity Insurance Company of America
Determination of Premium Projection FactorsProperty Damage
Fiscal Calendar Year Ending2013/3 2014/3 2015/3
Past-to-Present Adjustments1. Average Earned Date for Fiscal Calendar Year 3/31/2013 3/31/2014 3/31/20152. Average Earned Date for Latest Fiscal Calendar Year 3/31/2015 3/31/2015 3/31/20153. Years of Trend = (2) - (1) 2.000 1.000 0.0004. Selected Premium Trend -3.0% -3.0% -3.0%5. Past-to-Present Factor = [1+(4)](3) 0.941 0.970 1.000
Present-to-Future Adjustments6. Average Earned Date for Latest Fiscal Calendar Year 3/31/2015 3/31/2015 3/31/20157. Average Earned Date for Assumed Effective Period 6/22/2017 6/22/2017 6/22/20178. Years of Trend = (7) - (6) 2.232 2.232 2.2329. Selected Premium Trend -2.9% -2.9% -2.9%10. Present-to-Future Factor = [1+(9)](8) 0.936 0.936 0.936
Past-to-Future Adjustments11. Premium Projection Factor = (5) × (10) 0.881 0.908 0.936

Exhibit IIIPage 3
© 2016 Nationwide
Pennsylvania Personal AutomobileNationwide Affinity Insurance Company of America
Determination of Premium Projection FactorsUninsured Motorists - Bodily Injury
Fiscal Calendar Year Ending2013/3 2014/3 2015/3
Past-to-Present Adjustments1. Average Earned Date for Fiscal Calendar Year 3/31/2013 3/31/2014 3/31/20152. Average Earned Date for Latest Fiscal Calendar Year 3/31/2015 3/31/2015 3/31/20153. Years of Trend = (2) - (1) 2.000 1.000 0.0004. Selected Premium Trend -3.5% -3.5% -3.5%5. Past-to-Present Factor = [1+(4)](3) 0.931 0.965 1.000
Present-to-Future Adjustments6. Average Earned Date for Latest Fiscal Calendar Year 3/31/2015 3/31/2015 3/31/20157. Average Earned Date for Assumed Effective Period 6/22/2017 6/22/2017 6/22/20178. Years of Trend = (7) - (6) 2.232 2.232 2.2329. Selected Premium Trend -3.4% -3.4% -3.4%10. Present-to-Future Factor = [1+(9)](8) 0.926 0.926 0.926
Past-to-Future Adjustments11. Premium Projection Factor = (5) × (10) 0.862 0.894 0.926

Exhibit IIIPage 4
© 2016 Nationwide
Pennsylvania Personal AutomobileNationwide Affinity Insurance Company of America
Determination of Premium Projection FactorsUnderinsured Motorists - Bodily Injury
Fiscal Calendar Year Ending2013/3 2014/3 2015/3
Past-to-Present Adjustments1. Average Earned Date for Fiscal Calendar Year 3/31/2013 3/31/2014 3/31/20152. Average Earned Date for Latest Fiscal Calendar Year 3/31/2015 3/31/2015 3/31/20153. Years of Trend = (2) - (1) 2.000 1.000 0.0004. Selected Premium Trend -1.2% -1.2% -1.2%5. Past-to-Present Factor = [1+(4)](3) 0.976 0.988 1.000
Present-to-Future Adjustments6. Average Earned Date for Latest Fiscal Calendar Year 3/31/2015 3/31/2015 3/31/20157. Average Earned Date for Assumed Effective Period 6/22/2017 6/22/2017 6/22/20178. Years of Trend = (7) - (6) 2.232 2.232 2.2329. Selected Premium Trend -1.2% -1.2% -1.2%10. Present-to-Future Factor = [1+(9)](8) 0.973 0.973 0.973
Past-to-Future Adjustments11. Premium Projection Factor = (5) × (10) 0.950 0.961 0.973

Exhibit IIIPage 5
© 2016 Nationwide
Pennsylvania Personal AutomobileNationwide Affinity Insurance Company of America
Determination of Premium Projection FactorsAccidental Death Benefits, Combined Loss Benefits, Funeral Benefits, Loss of Income Benefits,
Medical Benefits, Excess Medical Benefits
Fiscal Calendar Year Ending2013/3 2014/3 2015/3
Past-to-Present Adjustments1. Average Earned Date for Fiscal Calendar Year 3/31/2013 3/31/2014 3/31/20152. Average Earned Date for Latest Fiscal Calendar Year 3/31/2015 3/31/2015 3/31/20153. Years of Trend = (2) - (1) 2.000 1.000 0.0004. Selected Premium Trend -5.5% -5.5% -5.5%5. Past-to-Present Factor = [1+(4)](3) 0.893 0.945 1.000
Present-to-Future Adjustments6. Average Earned Date for Latest Fiscal Calendar Year 3/31/2015 3/31/2015 3/31/20157. Average Earned Date for Assumed Effective Period 6/22/2017 6/22/2017 6/22/20178. Years of Trend = (7) - (6) 2.232 2.232 2.2329. Selected Premium Trend -5.4% -5.4% -5.4%10. Present-to-Future Factor = [1+(9)](8) 0.883 0.883 0.883
Past-to-Future Adjustments11. Premium Projection Factor = (5) × (10) 0.789 0.834 0.883
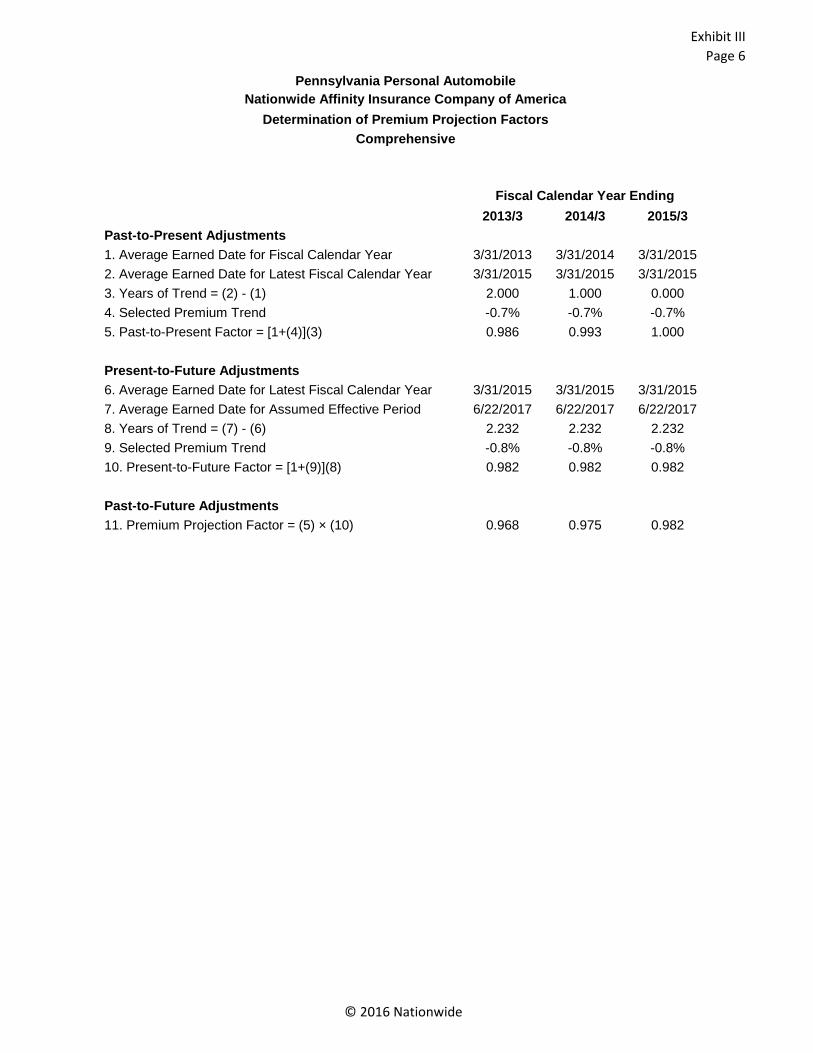
Exhibit IIIPage 6
© 2016 Nationwide
Pennsylvania Personal AutomobileNationwide Affinity Insurance Company of America
Determination of Premium Projection FactorsComprehensive
Fiscal Calendar Year Ending2013/3 2014/3 2015/3
Past-to-Present Adjustments1. Average Earned Date for Fiscal Calendar Year 3/31/2013 3/31/2014 3/31/20152. Average Earned Date for Latest Fiscal Calendar Year 3/31/2015 3/31/2015 3/31/20153. Years of Trend = (2) - (1) 2.000 1.000 0.0004. Selected Premium Trend -0.7% -0.7% -0.7%5. Past-to-Present Factor = [1+(4)](3) 0.986 0.993 1.000
Present-to-Future Adjustments6. Average Earned Date for Latest Fiscal Calendar Year 3/31/2015 3/31/2015 3/31/20157. Average Earned Date for Assumed Effective Period 6/22/2017 6/22/2017 6/22/20178. Years of Trend = (7) - (6) 2.232 2.232 2.2329. Selected Premium Trend -0.8% -0.8% -0.8%10. Present-to-Future Factor = [1+(9)](8) 0.982 0.982 0.982
Past-to-Future Adjustments11. Premium Projection Factor = (5) × (10) 0.968 0.975 0.982

Exhibit IIIPage 7
© 2016 Nationwide
Pennsylvania Personal AutomobileNationwide Affinity Insurance Company of America
Determination of Premium Projection FactorsCollision
Fiscal Calendar Year Ending2013/3 2014/3 2015/3
Past-to-Present Adjustments1. Average Earned Date for Fiscal Calendar Year 3/31/2013 3/31/2014 3/31/20152. Average Earned Date for Latest Fiscal Calendar Year 3/31/2015 3/31/2015 3/31/20153. Years of Trend = (2) - (1) 2.000 1.000 0.0004. Selected Premium Trend -0.8% -0.8% -0.8%5. Past-to-Present Factor = [1+(4)](3) 0.984 0.992 1.000
Present-to-Future Adjustments6. Average Earned Date for Latest Fiscal Calendar Year 3/31/2015 3/31/2015 3/31/20157. Average Earned Date for Assumed Effective Period 6/22/2017 6/22/2017 6/22/20178. Years of Trend = (7) - (6) 2.232 2.232 2.2329. Selected Premium Trend -0.9% -0.9% -0.9%10. Present-to-Future Factor = [1+(9)](8) 0.980 0.980 0.980
Past-to-Future Adjustments11. Premium Projection Factor = (5) × (10) 0.964 0.972 0.980

Exhibit IIIPage 8
© 2016 Nationwide
Pennsylvania Personal AutomobileNationwide Affinity Insurance Company of America
Determination of Premium Projection FactorsLoss of Use
Fiscal Calendar Year Ending2013/3 2014/3 2015/3
Past-to-Present Adjustments1. Average Earned Date for Fiscal Calendar Year 3/31/2013 3/31/2014 3/31/20152. Average Earned Date for Latest Fiscal Calendar Year 3/31/2015 3/31/2015 3/31/20153. Years of Trend = (2) - (1) 2.000 1.000 0.0004. Selected Premium Trend -0.7% -0.7% -0.7%5. Past-to-Present Factor = [1+(4)](3) 0.986 0.993 1.000
Present-to-Future Adjustments6. Average Earned Date for Latest Fiscal Calendar Year 3/31/2015 3/31/2015 3/31/20157. Average Earned Date for Assumed Effective Period 6/22/2017 6/22/2017 6/22/20178. Years of Trend = (7) - (6) 2.232 2.232 2.2329. Selected Premium Trend -0.7% -0.7% -0.7%10. Present-to-Future Factor = [1+(9)](8) 0.984 0.984 0.984
Past-to-Future Adjustments11. Premium Projection Factor = (5) × (10) 0.970 0.977 0.984

Exhibit IVPage 1
© 2016 Nationwide
Pennsylvania Personal AutomobileNationwide Affinity Insurance Company of America
Loss Development for Accident Years Ending September 30, 2015With 5 Quarters of Development as of December 31, 2015
Bodily Injury
Incurred Losses
Incurred Cost (No Supp) + DCC Expense Amount, Excluding Losses Over NA/500000Accident Age in Months
Year Ending 15 27 39 51 63 75 87 99 111 123 1352005/3 0 0 0 0 0 0 0 0 0 0 02006/3 0 0 0 0 0 0 0 0 0 02007/3 0 0 0 0 0 0 0 0 02008/3 4,142,111 4,485,330 5,050,219 5,064,310 5,058,907 5,069,871 5,069,871 5,069,8712009/3 17,492,798 19,857,845 21,725,627 22,095,180 22,237,312 22,332,199 22,308,4672010/3 28,703,194 33,798,116 35,781,961 36,612,267 36,695,627 36,993,2322011/3 38,502,650 41,430,924 44,048,132 45,503,569 45,708,3562012/3 45,298,026 51,035,521 55,287,188 56,610,0722013/3 40,093,766 45,521,298 50,353,2902014/3 31,030,370 35,419,9472015/3 23,285,982
Age-to-Age Development FactorsAccident Development Interval
Year Ending 15 - 27 27 - 39 39 - 51 51 - 63 63 - 75 75 - 87 87 - 99 99 - 111 111 - 123 123 - 1352005/32006/32007/32008/3 1.0829 1.1259 1.0028 0.9989 1.0022 1.0000 1.00002009/3 1.1352 1.0941 1.0170 1.0064 1.0043 0.99892010/3 1.1775 1.0587 1.0232 1.0023 1.00812011/3 1.0761 1.0632 1.0330 1.00452012/3 1.1267 1.0833 1.02392013/3 1.1354 1.10612014/3 1.1415
Average and Selected FactorsAlgorithm 15 - 27 27 - 39 39 - 51 51 - 63 63 - 75 75 - 87 87 - 99 99 - 111 111 - 123 123 - 135
Latest Year 1.1415 1.1061 1.0239 1.0045 1.0081 0.9989 1.0000 1.0000 1.0000 1.0000Age-to-Ult 1.3077 1.1456 1.0357 1.0115 1.0070 0.9989 1.0000 1.0000 1.0000 1.00002-Year Avg 1.1385 1.0947 1.0285 1.0034 1.0062 0.9995 1.0000 1.0000 1.0000 1.0000Age-to-Ult 1.2936 1.1362 1.0379 1.0091 1.0057 0.9995 1.0000 1.0000 1.0000 1.00003-Year Avg 1.1345 1.0842 1.0267 1.0044 1.0049 0.9995 1.0000 1.0000 1.0000 1.0000Age-to-Ult 1.2739 1.1229 1.0357 1.0088 1.0044 0.9995 1.0000 1.0000 1.0000 1.00004-Year Avg 1.1199 1.0778 1.0243 1.0030 1.0049 0.9995 1.0000 1.0000 1.0000 1.0000Age-to-Ult 1.2456 1.1122 1.0319 1.0074 1.0044 0.9995 1.0000 1.0000 1.0000 1.0000
All-Year Avg 1.1250 1.0886 1.0200 1.0030 1.0049 0.9995 1.0000 1.0000 1.0000 1.0000Age-to-Ult 1.2583 1.1185 1.0275 1.0074 1.0044 0.9995 1.0000 1.0000 1.0000 1.0000M3 of L5 1.1345 1.0802 1.0214 1.0030 1.0049 0.9995 1.0000 1.0000 1.0000 1.0000
Age-to-Ult 1.2610 1.1115 1.0290 1.0074 1.0044 0.9995 1.0000 1.0000 1.0000 1.00002-Year LWA 1.1380 1.0941 1.0280 1.0035 1.0067 0.9991 1.0000 1.0000 1.0000 1.0000Age-to-Ult 1.2919 1.1352 1.0376 1.0093 1.0058 0.9991 1.0000 1.0000 1.0000 1.0000
3-Year LWA 1.1336 1.0848 1.0267 1.0041 1.0063 0.9991 1.0000 1.0000 1.0000 1.0000Age-to-Ult 1.2746 1.1244 1.0365 1.0095 1.0054 0.9991 1.0000 1.0000 1.0000 1.0000
4-Year LWA 1.1193 1.0797 1.0254 1.0039 1.0063 0.9991 1.0000 1.0000 1.0000 1.0000Age-to-Ult 1.2507 1.1174 1.0349 1.0093 1.0054 0.9991 1.0000 1.0000 1.0000 1.0000
All-Year LWA 1.1281 1.0822 1.0247 1.0039 1.0063 0.9991 1.0000 1.0000 1.0000 1.0000Age-to-Ult 1.2626 1.1192 1.0342 1.0093 1.0054 0.9991 1.0000 1.0000 1.0000 1.0000Selected 1.1385 1.0947 1.0285 1.0034 1.0062 0.9995 1.0000 1.0000 1.0000 1.0000 Tail Factor
Age-to-Ult 1.2936 1.1362 1.0379 1.0091 1.0057 0.9995 1.0000 1.0000 1.0000 1.0000 1.0000
Estimated Ultimates Under Each AlgorithmAccident Year
EndingLosses as of 12/31/2015 Latest Year 2-Year Avg 3-Year Avg 4-Year Avg All-Year Avg M3 of L5 2-Year LWA 3-Year LWA 4-Year LWA All-Year LWA
2005/3 0 0 0 0 0 0 0 0 0 0 02006/3 0 0 0 0 0 0 0 0 0 0 02007/3 0 0 0 0 0 0 0 0 0 0 02008/3 5,069,871 5,069,871 5,069,871 5,069,871 5,069,871 5,069,871 5,069,871 5,069,871 5,069,871 5,069,871 5,069,8712009/3 22,308,467 22,816,002 22,816,002 22,816,002 22,816,002 22,816,002 22,816,002 22,816,002 22,816,002 22,816,002 22,816,0022010/3 36,993,232 37,452,589 37,474,785 37,474,785 37,474,785 37,474,785 37,474,785 37,459,988 37,459,988 37,459,988 37,459,9882011/3 45,708,356 46,667,459 46,608,039 46,548,618 46,548,618 46,548,618 46,548,618 46,612,609 46,594,326 46,594,326 46,594,3262012/3 56,610,072 57,261,088 57,125,224 57,108,241 57,028,987 57,028,987 57,028,987 57,136,546 57,147,868 57,136,546 57,136,5462013/3 50,353,290 52,686,685 52,797,463 52,686,685 52,495,343 52,273,788 52,349,318 52,782,357 52,726,968 52,646,403 52,611,1562014/3 35,419,947 41,810,726 41,477,779 41,006,693 40,627,700 40,850,846 40,602,906 41,442,359 41,059,823 40,811,884 40,875,6402015/3 23,285,982 30,451,079 30,122,746 29,664,012 29,005,019 29,300,751 29,363,623 30,083,160 29,680,313 29,123,778 29,400,881
Summary Results Based on Selected Development FactorsAccident Year
EndingLosses as of 12/31/2015
Age-to-Ult Factor
Losses Not Developed
Ultimate Losses
Ultimate Count
Earned Premium
Earned Exposures
Ultimate Severity
Ultimate Frequency
Ultimate Loss Cost
Ultimate Loss Ratio
2005/3 0 1.0000 02006/3 0 1.0000 02007/3 0 1.0000 02008/3 5,069,871 1.0000 0 5,069,871 289 5,554,091 32,632 17,543 8.856 155.37 91.3%2009/3 22,308,467 1.0000 507,535 22,816,002 1,237 23,781,454 139,902 18,445 8.842 163.09 95.9%2010/3 36,993,232 0.9995 500,050 37,474,785 1,982 40,302,958 232,302 18,908 8.532 161.32 93.0%2011/3 45,708,356 1.0057 639,145 46,608,039 2,382 52,237,819 304,356 19,567 7.826 153.14 89.2%2012/3 56,610,072 1.0091 0 57,125,224 2,807 63,180,442 354,193 20,351 7.925 161.28 90.4%2013/3 50,353,290 1.0379 535,783 52,797,463 2,516 67,625,453 363,680 20,985 6.918 145.18 78.1%2014/3 35,419,947 1.1362 1,233,635 41,477,779 1,804 57,739,065 302,936 22,992 5.955 136.92 71.8%2015/3 23,285,982 1.2936 0 30,122,746 1,523 47,257,867 241,178 19,779 6.315 124.90 63.7%

Exhibit IVPage 2
© 2016 Nationwide
Pennsylvania Personal AutomobileNationwide Affinity Insurance Company of America
Loss Development for Accident Years Ending September 30, 2015With 5 Quarters of Development as of December 31, 2015
Property Damage
Paid Losses
Paid Cost and DCC Expense AmountAccident Age in Months
Year Ending 15 27 39 51 63 75 87 99 111 123 1352005/3 0 0 0 0 0 0 0 0 0 0 02006/3 0 0 0 0 0 0 0 0 0 02007/3 0 0 0 0 0 0 0 0 02008/3 3,754,932 4,335,122 4,401,125 4,457,237 4,457,772 4,457,772 4,457,772 4,457,7722009/3 16,732,539 18,284,772 18,404,256 18,423,703 18,426,303 18,426,395 18,426,3952010/3 29,020,166 31,058,251 31,290,029 31,358,564 31,455,692 31,459,0382011/3 37,554,037 40,835,547 41,078,956 41,214,714 41,224,2842012/3 44,255,932 47,994,286 48,294,287 48,365,3482013/3 44,175,949 47,543,772 47,963,8722014/3 34,396,248 37,754,5852015/3 29,028,419
Age-to-Age Development FactorsAccident Development Interval
Year Ending 15 - 27 27 - 39 39 - 51 51 - 63 63 - 75 75 - 87 87 - 99 99 - 111 111 - 123 123 - 1352005/32006/32007/32008/3 1.1545 1.0152 1.0127 1.0001 1.0000 1.0000 1.00002009/3 1.0928 1.0065 1.0011 1.0001 1.0000 1.00002010/3 1.0702 1.0075 1.0022 1.0031 1.00012011/3 1.0874 1.0060 1.0033 1.00022012/3 1.0845 1.0063 1.00152013/3 1.0762 1.00882014/3 1.0976
Average and Selected FactorsAlgorithm 15 - 27 27 - 39 39 - 51 51 - 63 63 - 75 75 - 87 87 - 99 99 - 111 111 - 123 123 - 135
Latest Year 1.0976 1.0088 1.0015 1.0002 1.0001 1.0000 1.0000 1.0000 1.0000 1.0000Age-to-Ult 1.1092 1.0106 1.0018 1.0003 1.0001 1.0000 1.0000 1.0000 1.0000 1.00002-Year Avg 1.0869 1.0076 1.0024 1.0017 1.0001 1.0000 1.0000 1.0000 1.0000 1.0000Age-to-Ult 1.0997 1.0118 1.0042 1.0018 1.0001 1.0000 1.0000 1.0000 1.0000 1.00003-Year Avg 1.0861 1.0070 1.0023 1.0011 1.0000 1.0000 1.0000 1.0000 1.0000 1.0000Age-to-Ult 1.0974 1.0104 1.0034 1.0011 1.0000 1.0000 1.0000 1.0000 1.0000 1.00004-Year Avg 1.0864 1.0072 1.0020 1.0009 1.0000 1.0000 1.0000 1.0000 1.0000 1.0000Age-to-Ult 1.0974 1.0101 1.0029 1.0009 1.0000 1.0000 1.0000 1.0000 1.0000 1.0000
All-Year Avg 1.0947 1.0084 1.0042 1.0009 1.0000 1.0000 1.0000 1.0000 1.0000 1.0000Age-to-Ult 1.1095 1.0135 1.0051 1.0009 1.0000 1.0000 1.0000 1.0000 1.0000 1.0000M3 of L5 1.0827 1.0068 1.0023 1.0009 1.0000 1.0000 1.0000 1.0000 1.0000 1.0000
Age-to-Ult 1.0935 1.0100 1.0032 1.0009 1.0000 1.0000 1.0000 1.0000 1.0000 1.00002-Year LWA 1.0856 1.0075 1.0023 1.0015 1.0001 1.0000 1.0000 1.0000 1.0000 1.0000Age-to-Ult 1.0980 1.0114 1.0039 1.0016 1.0001 1.0000 1.0000 1.0000 1.0000 1.0000
3-Year LWA 1.0852 1.0071 1.0023 1.0012 1.0001 1.0000 1.0000 1.0000 1.0000 1.0000Age-to-Ult 1.0968 1.0107 1.0036 1.0013 1.0001 1.0000 1.0000 1.0000 1.0000 1.0000
4-Year LWA 1.0857 1.0071 1.0021 1.0012 1.0001 1.0000 1.0000 1.0000 1.0000 1.0000Age-to-Ult 1.0971 1.0105 1.0034 1.0013 1.0001 1.0000 1.0000 1.0000 1.0000 1.0000
All-Year LWA 1.0854 1.0073 1.0024 1.0012 1.0001 1.0000 1.0000 1.0000 1.0000 1.0000Age-to-Ult 1.0973 1.0110 1.0037 1.0013 1.0001 1.0000 1.0000 1.0000 1.0000 1.0000Selected 1.0869 1.0076 1.0024 1.0017 1.0001 1.0000 1.0000 1.0000 1.0000 1.0000 Tail Factor
Age-to-Ult 1.0997 1.0118 1.0042 1.0018 1.0001 1.0000 1.0000 1.0000 1.0000 1.0000 1.0000
Estimated Ultimates Under Each AlgorithmAccident Year
EndingLosses as of 12/31/2015 Latest Year 2-Year Avg 3-Year Avg 4-Year Avg All-Year Avg M3 of L5 2-Year LWA 3-Year LWA 4-Year LWA All-Year LWA
2005/3 0 0 0 0 0 0 0 0 0 0 02006/3 0 0 0 0 0 0 0 0 0 0 02007/3 0 0 0 0 0 0 0 0 0 0 02008/3 4,457,772 4,457,772 4,457,772 4,457,772 4,457,772 4,457,772 4,457,772 4,457,772 4,457,772 4,457,772 4,457,7722009/3 18,426,395 18,426,395 18,426,395 18,426,395 18,426,395 18,426,395 18,426,395 18,426,395 18,426,395 18,426,395 18,426,3952010/3 31,459,038 31,459,038 31,459,038 31,459,038 31,459,038 31,459,038 31,459,038 31,459,038 31,459,038 31,459,038 31,459,0382011/3 41,224,284 41,228,406 41,228,406 41,224,284 41,224,284 41,224,284 41,224,284 41,228,406 41,228,406 41,228,406 41,228,4062012/3 48,365,348 48,379,858 48,452,406 48,418,550 48,408,877 48,408,877 48,408,877 48,442,733 48,428,223 48,428,223 48,428,2232013/3 47,963,872 48,050,207 48,165,320 48,126,949 48,102,967 48,208,488 48,117,356 48,150,931 48,136,542 48,126,949 48,141,3382014/3 37,754,585 38,154,784 38,200,089 38,147,233 38,135,906 38,264,272 38,132,131 38,184,987 38,158,559 38,151,008 38,169,8852015/3 29,028,419 32,198,322 31,922,552 31,855,787 31,855,787 32,207,031 31,742,576 31,873,204 31,838,370 31,847,078 31,852,884
Summary Results Based on Selected Development FactorsAccident Year
EndingLosses as of 12/31/2015
Age-to-Ult Factor
Losses Not Developed
Ultimate Losses
Ultimate Count
Earned Premium
Earned Exposures
Ultimate Severity
Ultimate Frequency
Ultimate Loss Cost
Ultimate Loss Ratio
2005/3 0 1.0000 02006/3 0 1.0000 02007/3 0 1.0000 02008/3 4,457,772 1.0000 0 4,457,772 1,582 4,689,295 32,658 2,818 48.441 136.50 95.1%2009/3 18,426,395 1.0000 0 18,426,395 6,588 20,147,503 139,973 2,797 47.066 131.64 91.5%2010/3 31,459,038 1.0000 0 31,459,038 11,073 34,784,997 232,395 2,841 47.647 135.37 90.4%2011/3 41,224,284 1.0001 0 41,228,406 14,113 45,965,526 304,440 2,921 46.357 135.42 89.7%2012/3 48,365,348 1.0018 0 48,452,406 15,670 56,441,145 354,313 3,092 44.226 136.75 85.8%2013/3 47,963,872 1.0042 0 48,165,320 15,231 62,134,916 363,768 3,162 41.870 132.41 77.5%2014/3 37,754,585 1.0118 0 38,200,089 10,908 54,106,959 302,960 3,502 36.005 126.09 70.6%2015/3 29,028,419 1.0997 0 31,922,552 7,463 45,227,876 241,239 4,277 30.936 132.33 70.6%

Exhibit IVPage 3
© 2016 Nationwide
Pennsylvania Personal AutomobileNationwide Affinity Insurance Company of America
Loss Development for Accident Years Ending September 30, 2015With 5 Quarters of Development as of December 31, 2015
Uninsured Motorists - Bodily Injury
Incurred Losses
Incurred Cost (No Supp) + DCC Expense Amount, Excluding Losses Over NA/500000Accident Age in Months
Year Ending 15 27 39 51 63 75 87 99 111 123 1352005/3 0 0 0 0 0 0 0 0 0 0 02006/3 0 0 0 0 0 0 0 0 0 02007/3 0 0 0 0 0 0 0 0 02008/3 398,607 452,722 526,616 505,170 505,892 505,892 505,892 505,8922009/3 1,269,931 1,518,039 1,716,591 1,665,302 1,619,679 1,628,515 1,628,5152010/3 2,202,135 2,846,217 2,876,967 2,958,507 2,973,770 2,977,7262011/3 3,279,160 3,232,934 3,485,678 3,853,446 3,852,9312012/3 3,200,829 3,752,207 4,273,911 4,273,2172013/3 2,223,010 2,894,125 3,112,3242014/3 2,036,903 2,363,3412015/3 1,141,282
Age-to-Age Development FactorsAccident Development Interval
Year Ending 15 - 27 27 - 39 39 - 51 51 - 63 63 - 75 75 - 87 87 - 99 99 - 111 111 - 123 123 - 1352005/32006/32007/32008/3 1.1358 1.1632 0.9593 1.0014 1.0000 1.0000 1.00002009/3 1.1954 1.1308 0.9701 0.9726 1.0055 1.00002010/3 1.2925 1.0108 1.0283 1.0052 1.00132011/3 0.9859 1.0782 1.1055 0.99992012/3 1.1723 1.1390 0.99982013/3 1.3019 1.07542014/3 1.1603
Average and Selected FactorsAlgorithm 15 - 27 27 - 39 39 - 51 51 - 63 63 - 75 75 - 87 87 - 99 99 - 111 111 - 123 123 - 135
Latest Year 1.1603 1.0754 0.9998 0.9999 1.0013 1.0000 1.0000 1.0000 1.0000 1.0000Age-to-Ult 1.2491 1.0765 1.0010 1.0012 1.0013 1.0000 1.0000 1.0000 1.0000 1.00002-Year Avg 1.2311 1.1072 1.0527 1.0026 1.0034 1.0000 1.0000 1.0000 1.0000 1.0000Age-to-Ult 1.4435 1.1725 1.0590 1.0060 1.0034 1.0000 1.0000 1.0000 1.0000 1.00003-Year Avg 1.2115 1.0975 1.0445 0.9926 1.0023 1.0000 1.0000 1.0000 1.0000 1.0000Age-to-Ult 1.3817 1.1405 1.0392 0.9949 1.0023 1.0000 1.0000 1.0000 1.0000 1.00004-Year Avg 1.1551 1.0759 1.0259 0.9948 1.0023 1.0000 1.0000 1.0000 1.0000 1.0000Age-to-Ult 1.2712 1.1005 1.0229 0.9971 1.0023 1.0000 1.0000 1.0000 1.0000 1.0000
All-Year Avg 1.1777 1.0996 1.0126 0.9948 1.0023 1.0000 1.0000 1.0000 1.0000 1.0000Age-to-Ult 1.3076 1.1103 1.0097 0.9971 1.0023 1.0000 1.0000 1.0000 1.0000 1.0000M3 of L5 1.2084 1.0948 0.9994 0.9948 1.0023 1.0000 1.0000 1.0000 1.0000 1.0000
Age-to-Ult 1.3184 1.0910 0.9965 0.9971 1.0023 1.0000 1.0000 1.0000 1.0000 1.00002-Year LWA 1.2342 1.1113 1.0473 1.0022 1.0028 1.0000 1.0000 1.0000 1.0000 1.0000Age-to-Ult 1.4435 1.1696 1.0525 1.0050 1.0028 1.0000 1.0000 1.0000 1.0000 1.0000
3-Year LWA 1.2076 1.1005 1.0422 0.9964 1.0025 1.0000 1.0000 1.0000 1.0000 1.0000Age-to-Ult 1.3835 1.1457 1.0411 0.9989 1.0025 1.0000 1.0000 1.0000 1.0000 1.0000
4-Year LWA 1.1399 1.0804 1.0322 0.9966 1.0025 1.0000 1.0000 1.0000 1.0000 1.0000Age-to-Ult 1.2701 1.1142 1.0313 0.9991 1.0025 1.0000 1.0000 1.0000 1.0000 1.0000
All-Year LWA 1.1676 1.0882 1.0292 0.9966 1.0025 1.0000 1.0000 1.0000 1.0000 1.0000Age-to-Ult 1.3065 1.1190 1.0283 0.9991 1.0025 1.0000 1.0000 1.0000 1.0000 1.0000Selected 1.3019 1.1072 1.0527 1.0026 1.0034 1.0000 1.0000 1.0000 1.0000 1.0000 Tail Factor
Age-to-Ult 1.5265 1.1725 1.0590 1.0060 1.0034 1.0000 1.0000 1.0000 1.0000 1.0000 1.0000
Estimated Ultimates Under Each AlgorithmAccident Year
EndingLosses as of 12/31/2015 Latest Year 2-Year Avg 3-Year Avg 4-Year Avg All-Year Avg M3 of L5 2-Year LWA 3-Year LWA 4-Year LWA All-Year LWA
2005/3 0 0 0 0 0 0 0 0 0 0 02006/3 0 0 0 0 0 0 0 0 0 0 02007/3 0 0 0 0 0 0 0 0 0 0 02008/3 505,892 505,892 505,892 505,892 505,892 505,892 505,892 505,892 505,892 505,892 505,8922009/3 1,628,515 1,628,515 1,628,515 1,628,515 1,628,515 1,628,515 1,628,515 1,628,515 1,628,515 1,628,515 1,628,5152010/3 2,977,726 2,977,726 2,977,726 2,977,726 2,977,726 2,977,726 2,977,726 2,977,726 2,977,726 2,977,726 2,977,7262011/3 3,852,931 3,857,940 3,866,031 3,861,793 3,861,793 3,861,793 3,861,793 3,863,719 3,862,563 3,862,563 3,862,5632012/3 4,273,217 4,278,345 4,298,856 4,251,424 4,260,825 4,260,825 4,260,825 4,294,583 4,268,516 4,269,371 4,269,3712013/3 3,112,324 3,115,436 3,295,951 3,234,327 3,183,596 3,142,514 3,101,431 3,275,721 3,240,241 3,209,740 3,200,4032014/3 2,363,341 2,544,137 2,771,017 2,695,390 2,600,857 2,624,018 2,578,405 2,764,164 2,707,680 2,633,235 2,644,5792015/3 1,141,282 1,425,575 1,647,441 1,576,909 1,450,798 1,492,340 1,504,666 1,647,441 1,578,964 1,449,542 1,491,085
Summary Results Based on Selected Development FactorsAccident Year
EndingLosses as of 12/31/2015
Age-to-Ult Factor
Losses Not Developed
Ultimate Losses
Ultimate Count
Earned Premium
Earned Exposures
Ultimate Severity
Ultimate Frequency
Ultimate Loss Cost
Ultimate Loss Ratio
2005/3 0 1.0000 02006/3 0 1.0000 02007/3 0 1.0000 02008/3 505,892 1.0000 0 505,892 28 831,032 28,330 18,068 0.988 17.86 60.9%2009/3 1,628,515 1.0000 0 1,628,515 138 3,483,874 122,266 11,801 1.129 13.32 46.7%2010/3 2,977,726 1.0000 0 2,977,726 222 5,584,354 204,706 13,413 1.084 14.55 53.3%2011/3 3,852,931 1.0034 0 3,866,031 284 6,937,615 269,206 13,613 1.055 14.36 55.7%2012/3 4,273,217 1.0060 0 4,298,856 285 7,425,684 314,777 15,084 0.905 13.66 57.9%2013/3 3,112,324 1.0590 0 3,295,951 188 7,393,489 325,138 17,532 0.578 10.14 44.6%2014/3 2,363,341 1.1725 0 2,771,017 147 6,049,082 272,449 18,850 0.540 10.17 45.8%2015/3 1,141,282 1.5265 0 1,742,167 91 4,745,924 217,916 19,145 0.418 7.99 36.7%

Exhibit IVPage 4
© 2016 Nationwide
Pennsylvania Personal AutomobileNationwide Affinity Insurance Company of America
Loss Development for Accident Years Ending September 30, 2015With 5 Quarters of Development as of December 31, 2015
Underinsured Motorists - Bodily Injury
Incurred Losses
Incurred Cost (No Supp) + DCC Expense Amount, Excluding Losses Over NA/500000Accident Age in Months
Year Ending 15 27 39 51 63 75 87 99 111 123 1352005/3 0 0 0 0 0 0 0 0 0 0 02006/3 0 0 0 0 0 0 0 0 0 02007/3 0 0 0 0 0 0 0 0 02008/3 835,409 1,015,204 1,046,898 1,014,856 1,024,117 1,027,689 1,038,394 1,062,2042009/3 3,800,687 4,532,416 5,612,508 5,706,964 5,884,137 5,840,348 5,902,2052010/3 5,532,894 8,545,615 10,270,278 10,274,911 10,546,347 10,628,4612011/3 6,699,925 9,599,595 10,782,432 10,828,435 10,907,1822012/3 8,158,010 12,698,205 15,861,894 17,755,8502013/3 6,674,754 10,608,294 12,587,6362014/3 5,752,894 8,635,7742015/3 5,134,965
Age-to-Age Development FactorsAccident Development Interval
Year Ending 15 - 27 27 - 39 39 - 51 51 - 63 63 - 75 75 - 87 87 - 99 99 - 111 111 - 123 123 - 1352005/32006/32007/32008/3 1.2152 1.0312 0.9694 1.0091 1.0035 1.0104 1.02292009/3 1.1925 1.2383 1.0168 1.0310 0.9926 1.01062010/3 1.5445 1.2018 1.0005 1.0264 1.00782011/3 1.4328 1.1232 1.0043 1.00732012/3 1.5565 1.2491 1.11942013/3 1.5893 1.18662014/3 1.5011
Average and Selected FactorsAlgorithm 15 - 27 27 - 39 39 - 51 51 - 63 63 - 75 75 - 87 87 - 99 99 - 111 111 - 123 123 - 135
Latest Year 1.5011 1.1866 1.1194 1.0073 1.0078 1.0106 1.0229 1.0000 1.0000 1.0000Age-to-Ult 2.0924 1.3939 1.1747 1.0494 1.0418 1.0337 1.0229 1.0000 1.0000 1.00002-Year Avg 1.5452 1.2179 1.0619 1.0169 1.0002 1.0105 1.0229 1.0000 1.0000 1.0000Age-to-Ult 2.1010 1.3597 1.1164 1.0513 1.0338 1.0336 1.0229 1.0000 1.0000 1.00003-Year Avg 1.5490 1.1863 1.0414 1.0216 1.0013 1.0105 1.0229 1.0000 1.0000 1.0000Age-to-Ult 2.0233 1.3062 1.1011 1.0573 1.0349 1.0336 1.0229 1.0000 1.0000 1.00004-Year Avg 1.5199 1.1902 1.0353 1.0185 1.0013 1.0105 1.0229 1.0000 1.0000 1.0000Age-to-Ult 1.9739 1.2987 1.0912 1.0540 1.0349 1.0336 1.0229 1.0000 1.0000 1.0000
All-Year Avg 1.4331 1.1717 1.0221 1.0185 1.0013 1.0105 1.0229 1.0000 1.0000 1.0000Age-to-Ult 1.8090 1.2623 1.0773 1.0540 1.0349 1.0336 1.0229 1.0000 1.0000 1.0000M3 of L5 1.5340 1.2089 1.0072 1.0185 1.0013 1.0105 1.0229 1.0000 1.0000 1.0000
Age-to-Ult 1.9687 1.2834 1.0616 1.0540 1.0349 1.0336 1.0229 1.0000 1.0000 1.00002-Year LWA 1.5485 1.2207 1.0728 1.0166 1.0023 1.0106 1.0229 1.0000 1.0000 1.0000Age-to-Ult 2.1360 1.3794 1.1300 1.0533 1.0361 1.0337 1.0229 1.0000 1.0000 1.0000
3-Year LWA 1.5517 1.1922 1.0527 1.0197 1.0024 1.0106 1.0229 1.0000 1.0000 1.0000Age-to-Ult 2.0577 1.3261 1.1123 1.0566 1.0362 1.0337 1.0229 1.0000 1.0000 1.0000
4-Year LWA 1.5225 1.1942 1.0479 1.0193 1.0024 1.0106 1.0229 1.0000 1.0000 1.0000Age-to-Ult 2.0123 1.3217 1.1068 1.0562 1.0362 1.0337 1.0229 1.0000 1.0000 1.0000
All-Year LWA 1.4854 1.1949 1.0461 1.0193 1.0024 1.0106 1.0229 1.0000 1.0000 1.0000Age-to-Ult 1.9610 1.3202 1.1049 1.0562 1.0362 1.0337 1.0229 1.0000 1.0000 1.0000Selected 1.5452 1.2179 1.0619 1.0169 1.0013 1.0105 1.0229 1.0000 1.0000 1.0000 Tail Factor
Age-to-Ult 2.1030 1.3610 1.1175 1.0524 1.0349 1.0336 1.0229 1.0000 1.0000 1.0000 1.0000
Estimated Ultimates Under Each AlgorithmAccident Year
EndingLosses as of 12/31/2015 Latest Year 2-Year Avg 3-Year Avg 4-Year Avg All-Year Avg M3 of L5 2-Year LWA 3-Year LWA 4-Year LWA All-Year LWA
2005/3 0 0 0 0 0 0 0 0 0 0 02006/3 0 0 0 0 0 0 0 0 0 0 02007/3 0 0 0 0 0 0 0 0 0 0 02008/3 1,062,204 1,062,204 1,062,204 1,062,204 1,062,204 1,062,204 1,062,204 1,062,204 1,062,204 1,062,204 1,062,2042009/3 5,902,205 6,037,365 6,037,365 6,037,365 6,037,365 6,037,365 6,037,365 6,037,365 6,037,365 6,037,365 6,037,3652010/3 10,628,461 10,986,640 10,985,577 10,985,577 10,985,577 10,985,577 10,985,577 10,986,640 10,986,640 10,986,640 10,986,6402011/3 10,907,182 11,363,102 11,275,845 11,287,843 11,287,843 11,287,843 11,287,843 11,300,931 11,302,022 11,302,022 11,302,0222012/3 17,755,850 18,632,989 18,666,725 18,773,260 18,714,666 18,714,666 18,714,666 18,702,237 18,760,831 18,753,729 18,753,7292013/3 12,587,636 14,786,696 14,052,837 13,860,246 13,735,628 13,560,660 13,363,034 14,224,029 14,001,228 13,931,996 13,908,0792014/3 8,635,774 12,537,405 12,242,062 11,780,048 11,715,280 11,400,938 11,583,152 12,412,187 11,951,900 11,913,902 11,900,9492015/3 5,134,965 10,744,401 10,788,561 10,389,575 10,135,907 9,289,152 10,109,206 10,968,285 10,566,217 10,333,090 10,069,666
Summary Results Based on Selected Development FactorsAccident Year
EndingLosses as of 12/31/2015
Age-to-Ult Factor
Losses Not Developed
Ultimate Losses
Ultimate Count
Earned Premium
Earned Exposures
Ultimate Severity
Ultimate Frequency
Ultimate Loss Cost
Ultimate Loss Ratio
2005/3 0 1.0000 02006/3 0 1.0000 02007/3 0 1.0000 02008/3 1,062,204 1.0000 0 1,062,204 32 2,654,600 28,043 33,194 1.141 37.88 40.0%2009/3 5,902,205 1.0229 0 6,037,365 152 11,296,611 120,984 39,720 1.256 49.90 53.4%2010/3 10,628,461 1.0336 0 10,985,577 264 18,574,724 202,558 41,612 1.303 54.23 59.1%2011/3 10,907,182 1.0349 0 11,287,843 318 23,685,106 266,305 35,496 1.194 42.39 47.7%2012/3 17,755,850 1.0524 0 18,686,257 381 26,922,574 311,460 49,045 1.223 60.00 69.4%2013/3 12,587,636 1.1175 0 14,066,683 321 26,822,434 321,773 43,821 0.998 43.72 52.4%2014/3 8,635,774 1.3610 500,000 12,253,288 216 22,418,971 269,720 56,728 0.801 45.43 54.7%2015/3 5,134,965 2.1030 0 10,798,831 244 17,946,542 215,873 44,258 1.130 50.02 60.2%

Exhibit IVPage 5
© 2016 Nationwide
Pennsylvania Personal AutomobileNationwide Affinity Insurance Company of America
Loss Development for Accident Years Ending September 30, 2015With 5 Quarters of Development as of December 31, 2015
Accidental Death Benefits, Combined Loss Benefits, Funeral Benefits, Loss of Income Benefits, Medical Benefits, Excess Medical Benefits
Incurred Losses
Incurred Cost (No Supp) + DCC Expense AmountAccident Age in Months
Year Ending 15 27 39 51 63 75 87 99 111 123 1352005/3 0 0 0 0 0 0 0 0 0 0 02006/3 0 0 0 0 0 0 0 0 0 02007/3 0 0 0 0 0 0 0 0 02008/3 3,153,612 3,189,907 3,246,383 3,276,305 3,291,333 3,273,630 3,274,209 3,274,8532009/3 13,032,021 12,877,496 13,152,473 13,271,857 13,368,783 13,341,287 13,365,8362010/3 22,198,659 22,392,480 22,655,170 22,517,336 22,531,940 22,545,3462011/3 25,891,845 26,302,369 26,668,506 26,872,766 26,882,0862012/3 28,178,307 28,758,058 29,151,204 29,267,7182013/3 25,773,329 26,328,718 26,742,8012014/3 19,031,395 20,020,1582015/3 14,522,268
Age-to-Age Development FactorsAccident Development Interval
Year Ending 15 - 27 27 - 39 39 - 51 51 - 63 63 - 75 75 - 87 87 - 99 99 - 111 111 - 123 123 - 1352005/32006/32007/32008/3 1.0115 1.0177 1.0092 1.0046 0.9946 1.0002 1.00022009/3 0.9881 1.0214 1.0091 1.0073 0.9979 1.00182010/3 1.0087 1.0117 0.9939 1.0006 1.00062011/3 1.0159 1.0139 1.0077 1.00032012/3 1.0206 1.0137 1.00402013/3 1.0215 1.01572014/3 1.0520
Average and Selected FactorsAlgorithm 15 - 27 27 - 39 39 - 51 51 - 63 63 - 75 75 - 87 87 - 99 99 - 111 111 - 123 123 - 135
Latest Year 1.0520 1.0157 1.0040 1.0003 1.0006 1.0018 1.0002 1.0000 1.0000 1.0000Age-to-Ult 1.0759 1.0227 1.0069 1.0029 1.0026 1.0020 1.0002 1.0000 1.0000 1.00002-Year Avg 1.0368 1.0147 1.0059 1.0005 0.9993 1.0010 1.0002 1.0000 1.0000 1.0000Age-to-Ult 1.0593 1.0217 1.0069 1.0010 1.0005 1.0012 1.0002 1.0000 1.0000 1.00003-Year Avg 1.0314 1.0144 1.0019 1.0027 0.9977 1.0010 1.0002 1.0000 1.0000 1.0000Age-to-Ult 1.0500 1.0180 1.0035 1.0016 0.9989 1.0012 1.0002 1.0000 1.0000 1.00004-Year Avg 1.0275 1.0138 1.0037 1.0032 0.9977 1.0010 1.0002 1.0000 1.0000 1.0000Age-to-Ult 1.0477 1.0197 1.0058 1.0021 0.9989 1.0012 1.0002 1.0000 1.0000 1.0000
All-Year Avg 1.0169 1.0157 1.0048 1.0032 0.9977 1.0010 1.0002 1.0000 1.0000 1.0000Age-to-Ult 1.0400 1.0227 1.0069 1.0021 0.9989 1.0012 1.0002 1.0000 1.0000 1.0000M3 of L5 1.0193 1.0144 1.0069 1.0032 0.9977 1.0010 1.0002 1.0000 1.0000 1.0000
Age-to-Ult 1.0433 1.0235 1.0090 1.0021 0.9989 1.0012 1.0002 1.0000 1.0000 1.00002-Year LWA 1.0345 1.0147 1.0057 1.0005 0.9996 1.0015 1.0002 1.0000 1.0000 1.0000Age-to-Ult 1.0576 1.0223 1.0075 1.0018 1.0013 1.0017 1.0002 1.0000 1.0000 1.0000
3-Year LWA 1.0291 1.0144 1.0023 1.0019 0.9992 1.0015 1.0002 1.0000 1.0000 1.0000Age-to-Ult 1.0493 1.0196 1.0051 1.0028 1.0009 1.0017 1.0002 1.0000 1.0000 1.0000
4-Year LWA 1.0256 1.0138 1.0033 1.0021 0.9992 1.0015 1.0002 1.0000 1.0000 1.0000Age-to-Ult 1.0463 1.0202 1.0063 1.0030 1.0009 1.0017 1.0002 1.0000 1.0000 1.0000
All-Year LWA 1.0190 1.0147 1.0035 1.0021 0.9992 1.0015 1.0002 1.0000 1.0000 1.0000Age-to-Ult 1.0407 1.0213 1.0065 1.0030 1.0009 1.0017 1.0002 1.0000 1.0000 1.0000Selected 1.0368 1.0147 1.0059 1.0005 0.9993 1.0010 1.0002 1.0000 1.0000 1.0000 Tail Factor
Age-to-Ult 1.0593 1.0217 1.0069 1.0010 1.0005 1.0012 1.0002 1.0000 1.0000 1.0000 1.0000
Estimated Ultimates Under Each AlgorithmAccident Year
EndingLosses as of 12/31/2015 Latest Year 2-Year Avg 3-Year Avg 4-Year Avg All-Year Avg M3 of L5 2-Year LWA 3-Year LWA 4-Year LWA All-Year LWA
2005/3 0 0 0 0 0 0 0 0 0 0 02006/3 0 0 0 0 0 0 0 0 0 0 02007/3 0 0 0 0 0 0 0 0 0 0 02008/3 3,274,853 3,274,853 3,274,853 3,274,853 3,274,853 3,274,853 3,274,853 3,274,853 3,274,853 3,274,853 3,274,8532009/3 13,365,836 13,368,509 13,368,509 13,368,509 13,368,509 13,368,509 13,368,509 13,368,509 13,368,509 13,368,509 13,368,5092010/3 22,545,346 22,590,437 22,572,400 22,572,400 22,572,400 22,572,400 22,572,400 22,583,673 22,583,673 22,583,673 22,583,6732011/3 26,882,086 26,951,979 26,895,527 26,852,516 26,852,516 26,852,516 26,852,516 26,917,033 26,906,280 26,906,280 26,906,2802012/3 29,267,718 29,352,594 29,296,986 29,314,546 29,329,180 29,329,180 29,329,180 29,320,400 29,349,668 29,355,521 29,355,5212013/3 26,742,801 26,927,326 26,927,326 26,836,401 26,897,909 26,927,326 26,983,486 26,943,372 26,879,189 26,911,281 26,916,6292014/3 20,020,158 20,474,616 20,454,595 20,380,521 20,414,555 20,474,616 20,490,632 20,466,608 20,412,553 20,424,565 20,446,5872015/3 14,522,268 15,624,508 15,383,438 15,248,381 15,214,980 15,103,159 15,151,082 15,358,751 15,238,216 15,194,649 15,113,324
Summary Results Based on Selected Development FactorsAccident Year
EndingLosses as of 12/31/2015
Age-to-Ult Factor
Losses Not Developed
Ultimate Losses
Ultimate Count
Earned Premium
Earned Exposures
Ultimate Severity
Ultimate Frequency
Ultimate Loss Cost
Ultimate Loss Ratio
2005/3 0 1.0000 02006/3 0 1.0000 02007/3 0 1.0000 02008/3 3,274,853 1.0000 0 3,274,853 880 2,793,290 83,081 3,721 10.592 39.42 117.2%2009/3 13,365,836 1.0002 0 13,368,509 3,647 11,757,922 357,938 3,666 10.189 37.35 113.7%2010/3 22,545,346 1.0012 0 22,572,400 5,716 19,760,422 602,598 3,949 9.486 37.46 114.2%2011/3 26,882,086 1.0005 0 26,895,527 7,213 24,973,018 796,348 3,729 9.058 33.77 107.7%2012/3 29,267,718 1.0010 0 29,296,986 7,840 30,059,866 932,810 3,737 8.405 31.41 97.5%2013/3 26,742,801 1.0069 0 26,927,326 7,222 32,915,529 963,999 3,729 7.492 27.93 81.8%2014/3 20,020,158 1.0217 0 20,454,595 5,256 29,174,751 811,190 3,892 6.479 25.22 70.1%2015/3 14,522,268 1.0593 0 15,383,438 4,178 24,023,173 651,508 3,682 6.413 23.61 64.0%

Exhibit IVPage 6
© 2016 Nationwide
Pennsylvania Personal AutomobileNationwide Affinity Insurance Company of America
Loss Development for Accident Years Ending September 30, 2015With 5 Quarters of Development as of December 31, 2015
Comprehensive
Paid Losses
Paid Cost and DCC Expense Amount, Excluding CatastrophesAccident Age in Months
Year Ending 15 27 39 51 63 75 87 99 111 123 1352005/3 0 0 0 0 0 0 0 0 0 0 02006/3 0 0 0 0 0 0 0 0 0 02007/3 0 0 0 0 0 0 0 0 02008/3 2,146,313 2,214,242 2,212,378 2,212,653 2,206,863 2,206,760 2,206,917 2,206,1512009/3 9,310,642 9,444,031 9,478,591 9,477,403 9,478,916 9,477,290 9,477,1352010/3 14,935,173 15,103,530 15,115,988 15,115,634 15,120,131 15,114,3622011/3 23,018,894 23,227,982 23,239,835 23,243,882 23,251,9312012/3 24,819,554 25,063,323 25,029,870 25,032,2632013/3 24,999,348 25,262,463 25,331,7402014/3 22,383,406 22,583,0652015/3 16,882,787
Age-to-Age Development FactorsAccident Development Interval
Year Ending 15 - 27 27 - 39 39 - 51 51 - 63 63 - 75 75 - 87 87 - 99 99 - 111 111 - 123 123 - 1352005/32006/32007/32008/3 1.0316 0.9992 1.0001 0.9974 1.0000 1.0001 0.99972009/3 1.0143 1.0037 0.9999 1.0002 0.9998 1.00002010/3 1.0113 1.0008 1.0000 1.0003 0.99962011/3 1.0091 1.0005 1.0002 1.00032012/3 1.0098 0.9987 1.00012013/3 1.0105 1.00272014/3 1.0089
Average and Selected FactorsAlgorithm 15 - 27 27 - 39 39 - 51 51 - 63 63 - 75 75 - 87 87 - 99 99 - 111 111 - 123 123 - 135
Latest Year 1.0089 1.0027 1.0001 1.0003 0.9996 1.0000 0.9997 1.0000 1.0000 1.0000Age-to-Ult 1.0113 1.0024 0.9997 0.9996 0.9993 0.9997 0.9997 1.0000 1.0000 1.00002-Year Avg 1.0097 1.0007 1.0002 1.0003 0.9997 1.0001 0.9997 1.0000 1.0000 1.0000Age-to-Ult 1.0104 1.0007 1.0000 0.9998 0.9995 0.9998 0.9997 1.0000 1.0000 1.00003-Year Avg 1.0097 1.0006 1.0001 1.0003 0.9998 1.0001 0.9997 1.0000 1.0000 1.0000Age-to-Ult 1.0103 1.0006 1.0000 0.9999 0.9996 0.9998 0.9997 1.0000 1.0000 1.00004-Year Avg 1.0096 1.0007 1.0001 0.9996 0.9998 1.0001 0.9997 1.0000 1.0000 1.0000Age-to-Ult 1.0096 1.0000 0.9993 0.9992 0.9996 0.9998 0.9997 1.0000 1.0000 1.0000
All-Year Avg 1.0136 1.0009 1.0001 0.9996 0.9998 1.0001 0.9997 1.0000 1.0000 1.0000Age-to-Ult 1.0138 1.0002 0.9993 0.9992 0.9996 0.9998 0.9997 1.0000 1.0000 1.0000M3 of L5 1.0098 1.0013 1.0001 0.9996 0.9998 1.0001 0.9997 1.0000 1.0000 1.0000
Age-to-Ult 1.0104 1.0006 0.9993 0.9992 0.9996 0.9998 0.9997 1.0000 1.0000 1.00002-Year LWA 1.0098 1.0007 1.0001 1.0003 0.9997 1.0000 0.9997 1.0000 1.0000 1.0000Age-to-Ult 1.0103 1.0005 0.9998 0.9997 0.9994 0.9997 0.9997 1.0000 1.0000 1.0000
3-Year LWA 1.0098 1.0006 1.0001 1.0003 0.9997 1.0000 0.9997 1.0000 1.0000 1.0000Age-to-Ult 1.0102 1.0004 0.9998 0.9997 0.9994 0.9997 0.9997 1.0000 1.0000 1.0000
4-Year LWA 1.0096 1.0007 1.0001 1.0002 0.9997 1.0000 0.9997 1.0000 1.0000 1.0000Age-to-Ult 1.0100 1.0004 0.9997 0.9996 0.9994 0.9997 0.9997 1.0000 1.0000 1.0000
All-Year LWA 1.0106 1.0009 1.0001 1.0002 0.9997 1.0000 0.9997 1.0000 1.0000 1.0000Age-to-Ult 1.0112 1.0006 0.9997 0.9996 0.9994 0.9997 0.9997 1.0000 1.0000 1.0000Selected 1.0097 1.0013 1.0002 1.0003 0.9997 1.0001 0.9997 1.0000 1.0000 1.0000 Tail Factor
Age-to-Ult 1.0110 1.0013 1.0000 0.9998 0.9995 0.9998 0.9997 1.0000 1.0000 1.0000 1.0000
Estimated Ultimates Under Each AlgorithmAccident Year
EndingLosses as of 12/31/2015 Latest Year 2-Year Avg 3-Year Avg 4-Year Avg All-Year Avg M3 of L5 2-Year LWA 3-Year LWA 4-Year LWA All-Year LWA
2005/3 0 0 0 0 0 0 0 0 0 0 02006/3 0 0 0 0 0 0 0 0 0 0 02007/3 0 0 0 0 0 0 0 0 0 0 02008/3 2,206,151 2,206,151 2,206,151 2,206,151 2,206,151 2,206,151 2,206,151 2,206,151 2,206,151 2,206,151 2,206,1512009/3 9,477,135 9,474,292 9,474,292 9,474,292 9,474,292 9,474,292 9,474,292 9,474,292 9,474,292 9,474,292 9,474,2922010/3 15,114,362 15,109,828 15,111,339 15,111,339 15,111,339 15,111,339 15,111,339 15,109,828 15,109,828 15,109,828 15,109,8282011/3 23,251,931 23,235,655 23,240,305 23,242,630 23,242,630 23,242,630 23,242,630 23,237,980 23,237,980 23,237,980 23,237,9802012/3 25,032,263 25,022,250 25,027,257 25,029,760 25,012,237 25,012,237 25,012,237 25,024,753 25,024,753 25,022,250 25,022,2502013/3 25,331,740 25,324,140 25,331,740 25,331,740 25,314,008 25,314,008 25,314,008 25,326,674 25,326,674 25,324,140 25,324,1402014/3 22,583,065 22,637,264 22,598,873 22,596,615 22,583,065 22,587,582 22,596,615 22,594,357 22,592,098 22,592,098 22,596,6152015/3 16,882,787 17,073,562 17,058,368 17,056,680 17,044,862 17,115,769 17,058,368 17,056,680 17,054,991 17,051,615 17,071,874
Summary Results Based on Selected Development FactorsAccident Year
EndingLosses as of 12/31/2015
Age-to-Ult Factor
Losses Not Developed
Ultimate Losses
Ultimate Count
Earned Premium
Earned Exposures
Ultimate Severity
Ultimate Frequency
Ultimate Loss Cost
Ultimate Loss Ratio
2005/3 0 1.0000 02006/3 0 1.0000 02007/3 0 1.0000 02008/3 2,206,151 1.0000 0 2,206,151 1,673 2,415,003 26,196 1,319 63.865 84.22 91.4%2009/3 9,477,135 0.9997 0 9,474,292 7,211 10,657,906 112,508 1,314 64.093 84.21 88.9%2010/3 15,114,362 0.9998 0 15,111,339 12,654 18,534,516 187,310 1,194 67.556 80.68 81.5%2011/3 23,251,931 0.9995 0 23,240,305 18,188 25,084,550 245,533 1,278 74.076 94.65 92.6%2012/3 25,032,263 0.9998 0 25,027,257 19,155 31,299,956 288,575 1,307 66.378 86.73 80.0%2013/3 25,331,740 1.0000 0 25,331,740 18,292 34,236,544 299,819 1,385 61.010 84.49 74.0%2014/3 22,583,065 1.0013 0 22,612,423 17,441 30,366,140 252,833 1,297 68.982 89.44 74.5%2015/3 16,882,787 1.0110 0 17,068,498 12,590 25,566,615 203,274 1,356 61.936 83.97 66.8%
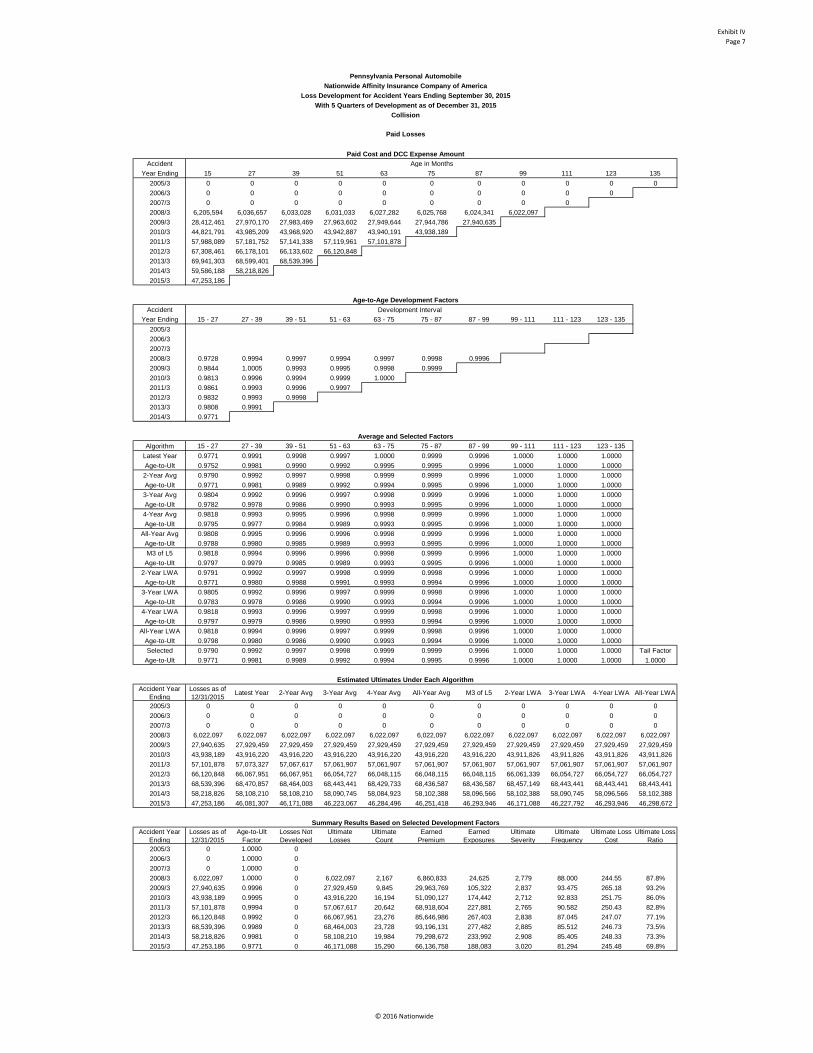
Exhibit IVPage 7
© 2016 Nationwide
Pennsylvania Personal AutomobileNationwide Affinity Insurance Company of America
Loss Development for Accident Years Ending September 30, 2015With 5 Quarters of Development as of December 31, 2015
Collision
Paid Losses
Paid Cost and DCC Expense AmountAccident Age in Months
Year Ending 15 27 39 51 63 75 87 99 111 123 1352005/3 0 0 0 0 0 0 0 0 0 0 02006/3 0 0 0 0 0 0 0 0 0 02007/3 0 0 0 0 0 0 0 0 02008/3 6,205,594 6,036,657 6,033,028 6,031,033 6,027,282 6,025,768 6,024,341 6,022,0972009/3 28,412,461 27,970,170 27,983,469 27,963,602 27,949,644 27,944,786 27,940,6352010/3 44,821,791 43,985,209 43,968,920 43,942,887 43,940,191 43,938,1892011/3 57,988,089 57,181,752 57,141,338 57,119,961 57,101,8782012/3 67,308,461 66,178,101 66,133,602 66,120,8482013/3 69,941,303 68,599,401 68,539,3962014/3 59,586,188 58,218,8262015/3 47,253,186
Age-to-Age Development FactorsAccident Development Interval
Year Ending 15 - 27 27 - 39 39 - 51 51 - 63 63 - 75 75 - 87 87 - 99 99 - 111 111 - 123 123 - 1352005/32006/32007/32008/3 0.9728 0.9994 0.9997 0.9994 0.9997 0.9998 0.99962009/3 0.9844 1.0005 0.9993 0.9995 0.9998 0.99992010/3 0.9813 0.9996 0.9994 0.9999 1.00002011/3 0.9861 0.9993 0.9996 0.99972012/3 0.9832 0.9993 0.99982013/3 0.9808 0.99912014/3 0.9771
Average and Selected FactorsAlgorithm 15 - 27 27 - 39 39 - 51 51 - 63 63 - 75 75 - 87 87 - 99 99 - 111 111 - 123 123 - 135
Latest Year 0.9771 0.9991 0.9998 0.9997 1.0000 0.9999 0.9996 1.0000 1.0000 1.0000Age-to-Ult 0.9752 0.9981 0.9990 0.9992 0.9995 0.9995 0.9996 1.0000 1.0000 1.00002-Year Avg 0.9790 0.9992 0.9997 0.9998 0.9999 0.9999 0.9996 1.0000 1.0000 1.0000Age-to-Ult 0.9771 0.9981 0.9989 0.9992 0.9994 0.9995 0.9996 1.0000 1.0000 1.00003-Year Avg 0.9804 0.9992 0.9996 0.9997 0.9998 0.9999 0.9996 1.0000 1.0000 1.0000Age-to-Ult 0.9782 0.9978 0.9986 0.9990 0.9993 0.9995 0.9996 1.0000 1.0000 1.00004-Year Avg 0.9818 0.9993 0.9995 0.9996 0.9998 0.9999 0.9996 1.0000 1.0000 1.0000Age-to-Ult 0.9795 0.9977 0.9984 0.9989 0.9993 0.9995 0.9996 1.0000 1.0000 1.0000
All-Year Avg 0.9808 0.9995 0.9996 0.9996 0.9998 0.9999 0.9996 1.0000 1.0000 1.0000Age-to-Ult 0.9788 0.9980 0.9985 0.9989 0.9993 0.9995 0.9996 1.0000 1.0000 1.0000M3 of L5 0.9818 0.9994 0.9996 0.9996 0.9998 0.9999 0.9996 1.0000 1.0000 1.0000
Age-to-Ult 0.9797 0.9979 0.9985 0.9989 0.9993 0.9995 0.9996 1.0000 1.0000 1.00002-Year LWA 0.9791 0.9992 0.9997 0.9998 0.9999 0.9998 0.9996 1.0000 1.0000 1.0000Age-to-Ult 0.9771 0.9980 0.9988 0.9991 0.9993 0.9994 0.9996 1.0000 1.0000 1.0000
3-Year LWA 0.9805 0.9992 0.9996 0.9997 0.9999 0.9998 0.9996 1.0000 1.0000 1.0000Age-to-Ult 0.9783 0.9978 0.9986 0.9990 0.9993 0.9994 0.9996 1.0000 1.0000 1.0000
4-Year LWA 0.9818 0.9993 0.9996 0.9997 0.9999 0.9998 0.9996 1.0000 1.0000 1.0000Age-to-Ult 0.9797 0.9979 0.9986 0.9990 0.9993 0.9994 0.9996 1.0000 1.0000 1.0000
All-Year LWA 0.9818 0.9994 0.9996 0.9997 0.9999 0.9998 0.9996 1.0000 1.0000 1.0000Age-to-Ult 0.9798 0.9980 0.9986 0.9990 0.9993 0.9994 0.9996 1.0000 1.0000 1.0000Selected 0.9790 0.9992 0.9997 0.9998 0.9999 0.9999 0.9996 1.0000 1.0000 1.0000 Tail Factor
Age-to-Ult 0.9771 0.9981 0.9989 0.9992 0.9994 0.9995 0.9996 1.0000 1.0000 1.0000 1.0000
Estimated Ultimates Under Each AlgorithmAccident Year
EndingLosses as of 12/31/2015 Latest Year 2-Year Avg 3-Year Avg 4-Year Avg All-Year Avg M3 of L5 2-Year LWA 3-Year LWA 4-Year LWA All-Year LWA
2005/3 0 0 0 0 0 0 0 0 0 0 02006/3 0 0 0 0 0 0 0 0 0 0 02007/3 0 0 0 0 0 0 0 0 0 0 02008/3 6,022,097 6,022,097 6,022,097 6,022,097 6,022,097 6,022,097 6,022,097 6,022,097 6,022,097 6,022,097 6,022,0972009/3 27,940,635 27,929,459 27,929,459 27,929,459 27,929,459 27,929,459 27,929,459 27,929,459 27,929,459 27,929,459 27,929,4592010/3 43,938,189 43,916,220 43,916,220 43,916,220 43,916,220 43,916,220 43,916,220 43,911,826 43,911,826 43,911,826 43,911,8262011/3 57,101,878 57,073,327 57,067,617 57,061,907 57,061,907 57,061,907 57,061,907 57,061,907 57,061,907 57,061,907 57,061,9072012/3 66,120,848 66,067,951 66,067,951 66,054,727 66,048,115 66,048,115 66,048,115 66,061,339 66,054,727 66,054,727 66,054,7272013/3 68,539,396 68,470,857 68,464,003 68,443,441 68,429,733 68,436,587 68,436,587 68,457,149 68,443,441 68,443,441 68,443,4412014/3 58,218,826 58,108,210 58,108,210 58,090,745 58,084,923 58,102,388 58,096,566 58,102,388 58,090,745 58,096,566 58,102,3882015/3 47,253,186 46,081,307 46,171,088 46,223,067 46,284,496 46,251,418 46,293,946 46,171,088 46,227,792 46,293,946 46,298,672
Summary Results Based on Selected Development FactorsAccident Year
EndingLosses as of 12/31/2015
Age-to-Ult Factor
Losses Not Developed
Ultimate Losses
Ultimate Count
Earned Premium
Earned Exposures
Ultimate Severity
Ultimate Frequency
Ultimate Loss Cost
Ultimate Loss Ratio
2005/3 0 1.0000 02006/3 0 1.0000 02007/3 0 1.0000 02008/3 6,022,097 1.0000 0 6,022,097 2,167 6,860,833 24,625 2,779 88.000 244.55 87.8%2009/3 27,940,635 0.9996 0 27,929,459 9,845 29,963,769 105,322 2,837 93.475 265.18 93.2%2010/3 43,938,189 0.9995 0 43,916,220 16,194 51,090,127 174,442 2,712 92.833 251.75 86.0%2011/3 57,101,878 0.9994 0 57,067,617 20,642 68,918,604 227,881 2,765 90.582 250.43 82.8%2012/3 66,120,848 0.9992 0 66,067,951 23,276 85,646,986 267,403 2,838 87.045 247.07 77.1%2013/3 68,539,396 0.9989 0 68,464,003 23,728 93,196,131 277,482 2,885 85.512 246.73 73.5%2014/3 58,218,826 0.9981 0 58,108,210 19,984 79,298,672 233,992 2,908 85.405 248.33 73.3%2015/3 47,253,186 0.9771 0 46,171,088 15,290 66,136,758 188,083 3,020 81.294 245.48 69.8%

Exhibit IVPage 8
© 2016 Nationwide
Pennsylvania Personal AutomobileNationwide Affinity Insurance Company of America
Loss Development for Accident Years Ending September 30, 2015With 5 Quarters of Development as of December 31, 2015
Loss of Use
Paid Losses
Paid Cost and DCC Expense AmountAccident Age in Months
Year Ending 15 27 39 51 63 75 87 99 111 123 1352005/3 0 0 0 0 0 0 0 0 0 0 02006/3 0 0 0 0 0 0 0 0 0 02007/3 0 0 0 0 0 0 0 0 02008/3 533,234 524,007 524,002 524,007 524,007 523,603 523,475 523,4752009/3 2,449,170 2,413,712 2,411,442 2,410,273 2,410,362 2,409,879 2,410,0852010/3 4,196,769 4,146,969 4,143,877 4,142,658 4,142,758 4,143,2412011/3 5,306,779 5,268,747 5,267,095 5,268,395 5,268,4092012/3 5,860,639 5,799,584 5,793,287 5,795,0112013/3 5,827,396 5,750,675 5,745,0732014/3 5,257,750 5,240,9462015/3 3,624,033
Age-to-Age Development FactorsAccident Development Interval
Year Ending 15 - 27 27 - 39 39 - 51 51 - 63 63 - 75 75 - 87 87 - 99 99 - 111 111 - 123 123 - 1352005/32006/32007/32008/3 0.9827 1.0000 1.0000 1.0000 0.9992 0.9998 1.00002009/3 0.9855 0.9991 0.9995 1.0000 0.9998 1.00012010/3 0.9881 0.9993 0.9997 1.0000 1.00012011/3 0.9928 0.9997 1.0002 1.00002012/3 0.9896 0.9989 1.00032013/3 0.9868 0.99902014/3 0.9968
Average and Selected FactorsAlgorithm 15 - 27 27 - 39 39 - 51 51 - 63 63 - 75 75 - 87 87 - 99 99 - 111 111 - 123 123 - 135
Latest Year 0.9968 0.9990 1.0003 1.0000 1.0001 1.0001 1.0000 1.0000 1.0000 1.0000Age-to-Ult 0.9963 0.9995 1.0005 1.0002 1.0002 1.0001 1.0000 1.0000 1.0000 1.00002-Year Avg 0.9918 0.9990 1.0003 1.0000 1.0000 1.0000 1.0000 1.0000 1.0000 1.0000Age-to-Ult 0.9911 0.9993 1.0003 1.0000 1.0000 1.0000 1.0000 1.0000 1.0000 1.00003-Year Avg 0.9911 0.9992 1.0001 1.0000 0.9997 1.0000 1.0000 1.0000 1.0000 1.0000Age-to-Ult 0.9901 0.9990 0.9998 0.9997 0.9997 1.0000 1.0000 1.0000 1.0000 1.00004-Year Avg 0.9915 0.9992 0.9999 1.0000 0.9997 1.0000 1.0000 1.0000 1.0000 1.0000Age-to-Ult 0.9903 0.9988 0.9996 0.9997 0.9997 1.0000 1.0000 1.0000 1.0000 1.0000
All-Year Avg 0.9889 0.9993 0.9999 1.0000 0.9997 1.0000 1.0000 1.0000 1.0000 1.0000Age-to-Ult 0.9878 0.9989 0.9996 0.9997 0.9997 1.0000 1.0000 1.0000 1.0000 1.0000M3 of L5 0.9902 0.9991 1.0000 1.0000 0.9997 1.0000 1.0000 1.0000 1.0000 1.0000
Age-to-Ult 0.9890 0.9988 0.9997 0.9997 0.9997 1.0000 1.0000 1.0000 1.0000 1.00002-Year LWA 0.9916 0.9990 1.0003 1.0000 1.0000 1.0000 1.0000 1.0000 1.0000 1.0000Age-to-Ult 0.9909 0.9993 1.0003 1.0000 1.0000 1.0000 1.0000 1.0000 1.0000 1.0000
3-Year LWA 0.9909 0.9992 1.0001 1.0000 0.9999 1.0000 1.0000 1.0000 1.0000 1.0000Age-to-Ult 0.9901 0.9992 1.0000 0.9999 0.9999 1.0000 1.0000 1.0000 1.0000 1.0000
4-Year LWA 0.9913 0.9992 1.0000 1.0000 0.9999 1.0000 1.0000 1.0000 1.0000 1.0000Age-to-Ult 0.9904 0.9991 0.9999 0.9999 0.9999 1.0000 1.0000 1.0000 1.0000 1.0000
All-Year LWA 0.9902 0.9992 1.0000 1.0000 0.9999 1.0000 1.0000 1.0000 1.0000 1.0000Age-to-Ult 0.9893 0.9991 0.9999 0.9999 0.9999 1.0000 1.0000 1.0000 1.0000 1.0000Selected 0.9918 0.9990 1.0003 1.0000 1.0000 1.0000 1.0000 1.0000 1.0000 1.0000 Tail Factor
Age-to-Ult 0.9911 0.9993 1.0003 1.0000 1.0000 1.0000 1.0000 1.0000 1.0000 1.0000 1.0000
Estimated Ultimates Under Each AlgorithmAccident Year
EndingLosses as of 12/31/2015 Latest Year 2-Year Avg 3-Year Avg 4-Year Avg All-Year Avg M3 of L5 2-Year LWA 3-Year LWA 4-Year LWA All-Year LWA
2005/3 0 0 0 0 0 0 0 0 0 0 02006/3 0 0 0 0 0 0 0 0 0 0 02007/3 0 0 0 0 0 0 0 0 0 0 02008/3 523,475 523,475 523,475 523,475 523,475 523,475 523,475 523,475 523,475 523,475 523,4752009/3 2,410,085 2,410,085 2,410,085 2,410,085 2,410,085 2,410,085 2,410,085 2,410,085 2,410,085 2,410,085 2,410,0852010/3 4,143,241 4,143,655 4,143,241 4,143,241 4,143,241 4,143,241 4,143,241 4,143,241 4,143,241 4,143,241 4,143,2412011/3 5,268,409 5,269,463 5,268,409 5,266,828 5,266,828 5,266,828 5,266,828 5,268,409 5,267,882 5,267,882 5,267,8822012/3 5,795,011 5,796,170 5,795,011 5,793,272 5,793,272 5,793,272 5,793,272 5,795,011 5,794,431 5,794,431 5,794,4312013/3 5,745,073 5,747,946 5,746,797 5,743,924 5,742,775 5,742,775 5,743,349 5,746,797 5,745,073 5,744,498 5,744,4982014/3 5,240,946 5,238,326 5,237,277 5,235,705 5,234,657 5,235,181 5,234,657 5,237,277 5,236,753 5,236,229 5,236,2292015/3 3,624,033 3,610,624 3,591,779 3,588,155 3,588,880 3,579,820 3,584,169 3,591,054 3,588,155 3,589,242 3,585,256
Summary Results Based on Selected Development FactorsAccident Year
EndingLosses as of 12/31/2015
Age-to-Ult Factor
Losses Not Developed
Ultimate Losses
Ultimate Count
Earned Premium
Earned Exposures
Ultimate Severity
Ultimate Frequency
Ultimate Loss Cost
Ultimate Loss Ratio
2005/3 0 1.0000 02006/3 0 1.0000 02007/3 0 1.0000 02008/3 523,475 1.0000 0 523,475 1,515 627,785 17,244 346 87.857 30.36 83.4%2009/3 2,410,085 1.0000 0 2,410,085 6,952 2,669,587 73,186 347 94.991 32.93 90.3%2010/3 4,143,241 1.0000 0 4,143,241 11,031 4,318,394 118,534 376 93.062 34.95 95.9%2011/3 5,268,409 1.0000 0 5,268,409 14,278 5,490,786 151,972 369 93.952 34.67 95.9%2012/3 5,795,011 1.0000 0 5,795,011 16,141 6,831,183 175,660 359 91.888 32.99 84.8%2013/3 5,745,073 1.0003 0 5,746,797 16,097 7,707,183 179,847 357 89.504 31.95 74.6%2014/3 5,240,946 0.9993 0 5,237,277 13,756 6,960,644 149,706 381 91.887 34.98 75.2%2015/3 3,624,033 0.9911 0 3,591,779 9,753 5,715,835 119,671 368 81.498 30.01 62.8%
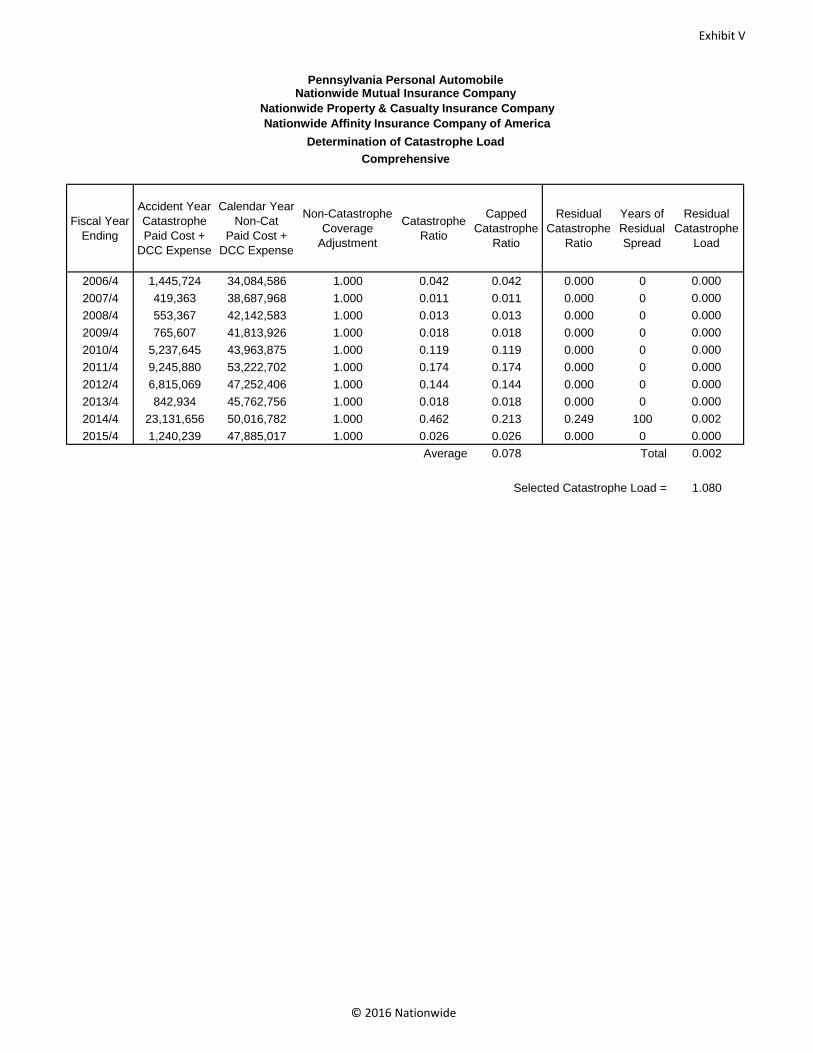
Exhibit V
© 2016 Nationwide
Pennsylvania Personal AutomobileNationwide Mutual Insurance Company
Nationwide Property & Casualty Insurance Company Nationwide Affinity Insurance Company of America
Determination of Catastrophe LoadComprehensive
Fiscal Year Ending
Accident YearCatastrophePaid Cost +
DCC Expense
Calendar YearNon-Cat
Paid Cost + DCC Expense
Non-Catastrophe Coverage
Adjustment
Catastrophe Ratio
Capped Catastrophe
Ratio
Residual Catastrophe
Ratio
Years of Residual Spread
Residual Catastrophe
Load
2006/4 1,445,724 34,084,586 1.000 0.042 0.042 0.000 0 0.0002007/4 419,363 38,687,968 1.000 0.011 0.011 0.000 0 0.0002008/4 553,367 42,142,583 1.000 0.013 0.013 0.000 0 0.0002009/4 765,607 41,813,926 1.000 0.018 0.018 0.000 0 0.0002010/4 5,237,645 43,963,875 1.000 0.119 0.119 0.000 0 0.0002011/4 9,245,880 53,222,702 1.000 0.174 0.174 0.000 0 0.0002012/4 6,815,069 47,252,406 1.000 0.144 0.144 0.000 0 0.0002013/4 842,934 45,762,756 1.000 0.018 0.018 0.000 0 0.0002014/4 23,131,656 50,016,782 1.000 0.462 0.213 0.249 100 0.0022015/4 1,240,239 47,885,017 1.000 0.026 0.026 0.000 0 0.000
Average 0.078 Total 0.002
Selected Catastrophe Load = 1.080
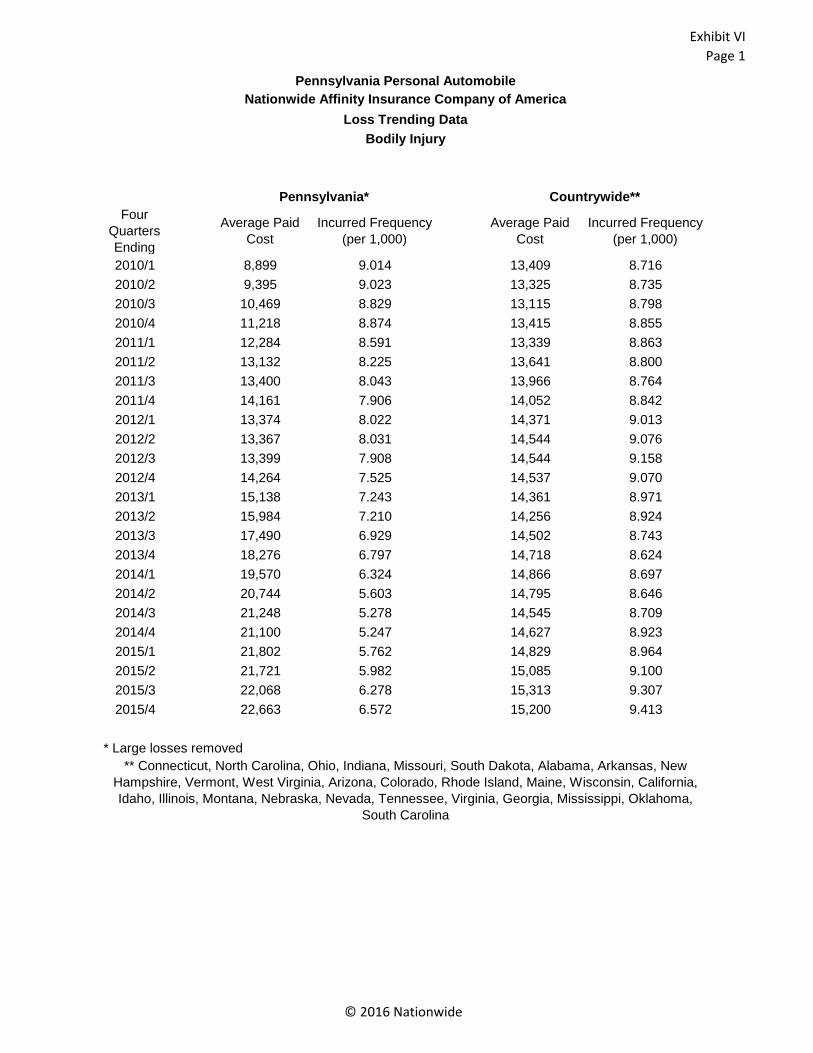
Exhibit VIPage 1
© 2016 Nationwide
Pennsylvania Personal AutomobileNationwide Affinity Insurance Company of America
Loss Trending DataBodily Injury
Pennsylvania* Countrywide**Four
Quarters Ending
Average Paid Cost
Incurred Frequency (per 1,000)
Average Paid Cost
Incurred Frequency (per 1,000)
2010/1 8,899 9.014 13,409 8.7162010/2 9,395 9.023 13,325 8.7352010/3 10,469 8.829 13,115 8.7982010/4 11,218 8.874 13,415 8.8552011/1 12,284 8.591 13,339 8.8632011/2 13,132 8.225 13,641 8.8002011/3 13,400 8.043 13,966 8.7642011/4 14,161 7.906 14,052 8.8422012/1 13,374 8.022 14,371 9.0132012/2 13,367 8.031 14,544 9.0762012/3 13,399 7.908 14,544 9.1582012/4 14,264 7.525 14,537 9.0702013/1 15,138 7.243 14,361 8.9712013/2 15,984 7.210 14,256 8.9242013/3 17,490 6.929 14,502 8.7432013/4 18,276 6.797 14,718 8.6242014/1 19,570 6.324 14,866 8.6972014/2 20,744 5.603 14,795 8.6462014/3 21,248 5.278 14,545 8.7092014/4 21,100 5.247 14,627 8.9232015/1 21,802 5.762 14,829 8.9642015/2 21,721 5.982 15,085 9.1002015/3 22,068 6.278 15,313 9.3072015/4 22,663 6.572 15,200 9.413
* Large losses removed** Connecticut, North Carolina, Ohio, Indiana, Missouri, South Dakota, Alabama, Arkansas, New
Hampshire, Vermont, West Virginia, Arizona, Colorado, Rhode Island, Maine, Wisconsin, California, Idaho, Illinois, Montana, Nebraska, Nevada, Tennessee, Virginia, Georgia, Mississippi, Oklahoma,
South Carolina

Exhibit VIPage 2
© 2016 Nationwide
Pennsylvania Personal AutomobileNationwide Affinity Insurance Company of America
Loss Trending DataProperty Damage
Pennsylvania CountrywideFour
Quarters Ending
Average Paid Cost
Paid Frequency (per 1,000)
Average Paid Cost
Paid Frequency (per 1,000)
2010/1 2,664 45.107 2,704 34.4982010/2 2,650 44.650 2,687 34.5592010/3 2,695 45.388 2,684 34.8332010/4 2,783 45.669 2,694 35.1352011/1 2,800 45.885 2,703 35.2362011/2 2,836 45.750 2,744 35.0182011/3 2,848 44.978 2,761 34.8552011/4 2,853 44.628 2,790 34.8752012/1 2,939 44.282 2,833 35.0482012/2 2,970 44.200 2,849 35.3832012/3 3,003 43.984 2,904 35.4162012/4 3,055 42.627 2,941 35.2832013/1 3,074 41.939 2,973 35.1462013/2 3,109 41.918 3,018 35.1782013/3 3,127 42.046 3,044 35.1222013/4 3,163 42.847 3,121 34.4872014/1 3,170 42.749 3,202 33.7702014/2 3,244 41.392 3,322 32.9822014/3 3,384 38.969 3,471 32.1372014/4 3,538 36.413 3,579 31.7382015/1 3,809 33.786 3,718 31.2492015/2 4,104 32.282 3,837 30.9842015/3 4,287 31.670 3,914 30.9422015/4 4,439 32.051 4,013 31.139

Exhibit VIPage 3
© 2016 Nationwide
Pennsylvania Personal AutomobileNationwide Affinity Insurance Company of America
Loss Trending DataUninsured Motorists - Bodily Injury
Pennsylvania Countrywide*Four
Quarters Ending
Average Paid Cost
Incurred Frequency (per 1,000)
Average Paid Cost
Incurred Frequency (per 1,000)
2010/1 6,424 0.927 17,265 1.1162010/2 5,992 0.950 17,770 1.0902010/3 5,898 1.001 17,300 1.0952010/4 7,139 1.050 17,853 1.0722011/1 7,489 1.096 18,093 1.0832011/2 9,934 1.091 18,395 1.0692011/3 11,249 1.044 19,155 1.0942011/4 12,235 1.035 19,169 1.0952012/1 12,645 1.066 19,451 1.1022012/2 12,239 1.029 19,115 1.1502012/3 12,098 0.972 18,846 1.1432012/4 12,100 0.817 18,875 1.1872013/1 12,289 0.698 18,157 1.1822013/2 11,703 0.550 18,415 1.1692013/3 12,933 0.498 18,481 1.1422013/4 13,613 0.560 18,782 0.9922014/1 16,398 0.538 19,239 0.9082014/2 18,037 0.501 19,521 0.8162014/3 18,117 0.470 19,674 0.7832014/4 19,719 0.454 19,505 0.9002015/1 18,780 0.423 20,225 1.0042015/2 20,708 0.568 20,218 1.1302015/3 22,116 0.555 21,167 1.2632015/4 22,625 0.443 21,712 1.309
* Connecticut, North Carolina, Ohio, Indiana, Missouri, Alabama, Arkansas, New Hampshire, Vermont, West Virginia, Arizona, Colorado, Rhode Island, Maine, California, Idaho, Illinois, Montana, Nevada,
Tennessee, Virginia, Georgia, Mississippi, Oklahoma, South Carolina

Exhibit VIPage 4
© 2016 Nationwide
Pennsylvania Personal AutomobileNationwide Affinity Insurance Company of America
Loss Trending DataUnderinsured Motorists - Bodily Injury
Pennsylvania* Countrywide**Four
Quarters Ending
Average Paid Cost
Incurred Frequency (per 1,000)
Average Paid Cost
Incurred Frequency (per 1,000)
2010/1 31,297 0.681 39,326 0.5922010/2 27,020 0.689 37,414 0.6372010/3 27,709 0.681 39,096 0.6292010/4 30,612 0.729 40,126 0.6402011/1 30,412 0.862 40,725 0.6252011/2 34,370 0.916 39,581 0.6012011/3 38,476 1.006 37,117 0.5962011/4 40,566 1.028 36,634 0.5922012/1 41,967 1.033 34,077 0.5982012/2 39,044 1.030 34,897 0.5872012/3 37,036 1.002 36,070 0.5932012/4 36,811 1.057 35,394 0.6092013/1 38,113 1.044 37,067 0.5822013/2 37,926 1.133 37,102 0.6372013/3 37,952 1.153 37,844 0.6102013/4 38,822 1.086 36,493 0.5452014/1 36,333 1.078 35,640 0.5202014/2 38,367 1.022 37,220 0.4612014/3 40,162 0.983 35,879 0.4742014/4 41,974 0.972 37,926 0.5362015/1 46,286 0.995 39,119 0.5862015/2 49,441 1.021 40,199 0.6292015/3 46,366 1.144 41,276 0.6472015/4 47,482 1.350 40,223 0.645
* Large losses removed** Iowa, North Carolina, Indiana, Missouri, Arkansas, West Virginia, Arizona, Montana, South Carolina

Exhibit VIPage 5
© 2016 Nationwide
Pennsylvania Personal AutomobileNationwide Affinity Insurance Company of America
Loss Trending DataAccidental Death Benefits, Combined Loss Benefits, Funeral Benefits, Loss of Income Benefits,
Medical Benefits, Excess Medical Benefits
Pennsylvania Countrywide*Four
Quarters Ending
Average Paid Cost
Incurred Frequency (per 1,000)
Average Paid Cost
Incurred Frequency (per 1,000)
2010/1 3,670 9.6382010/2 3,641 9.4312010/3 3,769 9.4942010/4 3,882 9.5442011/1 3,913 9.4842011/2 3,867 9.3782011/3 3,748 9.1052011/4 3,701 8.8642012/1 3,760 8.7462012/2 3,628 8.5122012/3 3,615 8.3172012/4 3,656 8.0032013/1 3,398 7.8642013/2 3,426 7.7422013/3 3,468 7.5022013/4 3,442 7.3712014/1 3,564 7.0642014/2 3,714 6.7792014/3 3,591 6.5272014/4 3,584 6.3862015/1 3,625 6.4552015/2 3,415 6.3802015/3 3,481 6.4452015/4 3,483 6.385
*

Exhibit VIPage 6
© 2016 Nationwide
Pennsylvania Personal AutomobileNationwide Affinity Insurance Company of America
Loss Trending DataComprehensive
Pennsylvania* CountrywideFour
Quarters Ending
Average Paid Cost
Paid Frequency (per 1,000)
Average Paid Cost
Paid Frequency (per 1,000)
2010/1 1,254 62.346 967 62.7812010/2 1,202 65.160 924 66.2672010/3 1,174 66.152 894 68.8362010/4 1,253 65.746 889 69.2922011/1 1,269 66.313 888 68.8462011/2 1,294 70.723 927 68.9552011/3 1,286 72.291 946 69.8712011/4 1,289 74.643 963 70.4902012/1 1,280 74.728 987 70.0482012/2 1,259 68.885 997 66.7992012/3 1,304 66.371 1,032 64.2162012/4 1,344 63.719 1,050 62.1972013/1 1,383 61.302 1,063 60.6682013/2 1,388 61.673 1,070 59.9052013/3 1,365 61.214 1,058 59.0352013/4 1,350 61.191 1,074 58.8152014/1 1,330 63.290 1,083 59.7492014/2 1,388 67.235 1,119 62.9132014/3 1,311 69.603 1,085 63.1172014/4 1,287 70.220 1,078 62.7402015/1 1,309 68.684 1,093 61.1672015/2 1,226 65.627 1,063 58.6722015/3 1,340 63.152 1,128 58.1572015/4 1,375 62.066 1,120 58.174
* Catastrophes removed

Exhibit VIPage 7
© 2016 Nationwide
Pennsylvania Personal AutomobileNationwide Affinity Insurance Company of America
Loss Trending DataCollision
Pennsylvania CountrywideFour
Quarters Ending
Average Paid Cost
Paid Frequency (per 1,000)
Average Paid Cost
Paid Frequency (per 1,000)
2010/1 2,809 91.671 2,678 59.4672010/2 2,766 90.387 2,661 59.9352010/3 2,762 90.162 2,654 60.6032010/4 2,737 90.409 2,647 61.4422011/1 2,812 90.882 2,661 61.4252011/2 2,786 90.298 2,676 61.1152011/3 2,801 89.467 2,711 61.3732011/4 2,822 89.452 2,744 61.5092012/1 2,808 87.461 2,750 60.5762012/2 2,832 87.318 2,793 61.0102012/3 2,845 86.461 2,833 60.8262012/4 2,873 84.464 2,863 60.8242013/1 2,952 84.789 2,922 61.4052013/2 2,963 84.971 2,948 61.9662013/3 2,931 85.811 2,962 62.0752013/4 2,882 87.404 3,009 61.6342014/1 2,844 88.141 3,078 62.2352014/2 2,820 87.452 3,120 61.8892014/3 2,837 86.426 3,169 61.6932014/4 2,889 84.923 3,199 61.9002015/1 2,890 82.826 3,221 61.3192015/2 2,900 83.066 3,251 61.8572015/3 2,907 82.926 3,269 62.5592015/4 2,951 82.710 3,305 63.056

Exhibit VIPage 8
© 2016 Nationwide
Pennsylvania Personal AutomobileNationwide Affinity Insurance Company of America
Loss Trending DataLoss of Use
Pennsylvania CountrywideFour
Quarters Ending
Average Paid Cost
Paid Frequency (per 1,000)
Average Paid Cost
Paid Frequency (per 1,000)
2010/1 368 91.216 300 62.3712010/2 372 90.499 302 63.0492010/3 374 89.628 304 63.6282010/4 380 90.471 305 64.0742011/1 379 89.571 303 63.6642011/2 370 88.277 305 63.0782011/3 373 89.457 309 65.6732011/4 369 89.629 311 65.6492012/1 367 92.648 312 67.2242012/2 366 91.735 315 68.1332012/3 363 90.902 319 67.6522012/4 362 89.526 321 66.9702013/1 364 89.191 329 67.7712013/2 368 92.103 332 69.2032013/3 360 92.456 336 66.8982013/4 356 94.373 342 65.4792014/1 362 92.737 350 63.2052014/2 360 88.021 356 62.1852014/3 375 89.668 356 64.0182014/4 380 90.991 355 68.7402015/1 371 88.234 355 69.0762015/2 369 93.462 359 71.4292015/3 357 90.348 364 72.1022015/4 360 86.032 372 70.370

Exhibit VIIPage 1
© 2016 Nationwide
Pennsylvania Personal AutomobileNationwide Affinity Insurance Company of America
Loss Trend SummaryBodily Injury
Four Quarter Ending Calendar Year Data as of: 2015/4Latest Four Quarters Ending Exposures: 227,319Credibility Constant: 20,000
Pennsylvania Four CQ Ending
as of 2015/4
Annualized Average
Paid CostR2 Z
Annualized Non-NW Fast
Track as of 2015/3
Annualized Incurred
Frequency (per 1,000)
R2 Z
Annualized Non-NW Fast
Track as of 2015/3
Annualized Adjusted
Pure Premium
R2 Z
Annualized Non-NW Fast
Track as of 2015/3
24 Point Trend 17.1% 0.96 0.42 -8.5% 0.83 0.61 7.2% 0.77 0.7623 Point Trend 16.6% 0.95 0.44 -8.6% 0.81 0.61 6.5% 0.76 0.7822 Point Trend 16.0% 0.95 0.47 -8.7% 0.80 0.62 5.9% 0.73 0.8021 Point Trend 15.6% 0.95 0.42 -8.7% 0.78 0.62 5.5% 0.69 0.8020 Point Trend 15.5% 0.94 0.40 4.3% -8.7% 0.75 0.63 0.6% 5.4% 0.66 0.80 4.9%19 Point Trend 15.7% 0.93 0.31 4.6% -8.7% 0.71 0.63 1.0% 5.6% 0.64 0.79 5.7%18 Point Trend 16.2% 0.93 0.28 5.1% -8.8% 0.69 0.64 1.4% 6.0% 0.64 0.79 6.6%17 Point Trend 16.8% 0.93 0.28 5.4% -8.9% 0.66 0.64 1.7% 6.4% 0.64 0.79 7.2%16 Point Trend 17.8% 0.94 0.32 5.8% -9.1% 0.63 0.64 2.0% 7.1% 0.67 0.81 7.9%15 Point Trend 18.0% 0.93 0.31 6.2% -8.9% 0.57 0.64 2.4% 7.5% 0.65 0.81 8.7%14 Point Trend 17.7% 0.91 0.29 6.4% -8.4% 0.49 0.64 2.8% 7.8% 0.63 0.79 9.5%13 Point Trend 16.4% 0.90 0.28 6.7% -7.5% 0.39 0.60 3.5% 7.7% 0.57 0.74 10.5%12 Point Trend 15.0% 0.88 0.28 7.1% -6.5% 0.28 0.55 4.2% 7.5% 0.50 0.64 11.6%11 Point Trend 13.3% 0.86 0.34 7.6% -5.3% 0.17 0.46 4.7% 7.3% 0.42 0.56 12.6%10 Point Trend 11.0% 0.87 0.46 8.1% -2.9% 0.05 0.31 4.8% 7.8% 0.38 0.50 13.2%9 Point Trend 9.3% 0.84 0.56 8.6% 0.4% 0.00 0.19 4.5% 9.8% 0.44 0.47 13.5%8 Point Trend 7.1% 0.88 0.79 9.1% 6.4% 0.21 0.23 4.4% 14.0% 0.60 0.51 13.9%7 Point Trend 5.4% 0.92 0.89 9.0% 14.6% 0.76 0.22 4.2% 20.9% 0.84 0.49 13.6%6 Point Trend 5.3% 0.87 0.72 9.2% 21.1% 0.96 0.60 3.9% 27.5% 0.95 0.52 13.4%5 Point Trend 6.4% 0.89 0.80 8.3% 23.9% 0.97 0.72 3.5% 31.8% 0.96 0.67 12.1%4 Point Trend 5.4% 0.79 0.79 4.2% 19.4% 1.00 0.95 2.3% 25.9% 0.98 0.89 6.6%3 Point Trend 8.9% 0.98 0.96 3.3% 20.7% 1.00 1.00 -0.6% 31.4% 1.00 0.99 2.6%
* Large losses removed
Pennsylvania AY's as of 2015/3
Estimated Ultimate Severity
Estimated Ultimate
Frequency
Est Ult Pure Premium
6 Year Trend 2.1% -6.8% -4.8%5 Year Trend 1.4% -6.9% -5.6%4 Year Trend 0.1% -8.0% -7.9%3 Year Trend -2.9% -4.5% -7.2%
Countrywide Four CQ Ending as of
2015/4
Annualized Average
Paid CostR2
Annualized Non-NW Fast
Track as of 2015/3
Annualized Incurred
Frequency (per 1,000)
R2
Annualized Non-NW Fast
Track as of 2015/3
Annualized Adjusted
Pure Premium
R2
Annualized Non-NW Fast
Track as of 2015/3
24 Point Trend 2.4% 0.86 0.5% 0.17 2.9% 0.7523 Point Trend 2.4% 0.85 0.5% 0.14 2.9% 0.7222 Point Trend 2.4% 0.83 0.5% 0.11 2.9% 0.6821 Point Trend 2.2% 0.82 0.5% 0.09 2.7% 0.6420 Point Trend 2.1% 0.79 2.7% 0.5% 0.09 0.7% 2.6% 0.59 3.4%19 Point Trend 1.8% 0.78 2.7% 0.5% 0.09 0.6% 2.3% 0.52 3.4%18 Point Trend 1.6% 0.76 2.9% 0.5% 0.07 0.5% 2.1% 0.44 3.4%17 Point Trend 1.5% 0.72 3.0% 0.4% 0.04 0.4% 1.9% 0.37 3.4%16 Point Trend 1.4% 0.66 3.2% 0.4% 0.03 0.2% 1.8% 0.29 3.3%15 Point Trend 1.5% 0.63 3.3% 0.5% 0.05 0.0% 2.0% 0.30 3.3%14 Point Trend 1.7% 0.67 3.4% 0.8% 0.10 -0.2% 2.5% 0.38 3.2%13 Point Trend 1.9% 0.71 3.4% 1.4% 0.24 -0.2% 3.3% 0.54 3.2%12 Point Trend 2.1% 0.75 3.3% 2.1% 0.42 -0.1% 4.3% 0.70 3.2%11 Point Trend 2.2% 0.71 3.3% 2.8% 0.61 0.0% 5.1% 0.78 3.2%10 Point Trend 1.9% 0.61 3.3% 3.8% 0.83 -0.1% 5.8% 0.82 3.2%9 Point Trend 1.9% 0.52 3.5% 4.7% 0.93 -0.3% 6.6% 0.84 3.1%8 Point Trend 2.2% 0.53 3.7% 5.2% 0.94 -0.4% 7.5% 0.85 3.3%7 Point Trend 3.1% 0.72 4.3% 6.0% 0.98 -0.5% 9.3% 0.94 3.8%6 Point Trend 4.4% 0.90 4.8% 6.2% 0.98 -0.2% 10.9% 0.98 4.6%5 Point Trend 4.5% 0.85 5.5% 5.9% 0.96 0.4% 10.7% 0.96 6.0%4 Point Trend 3.6% 0.70 6.4% 7.0% 0.99 0.9% 10.9% 0.92 7.4%3 Point Trend 1.5% 0.26 6.6% 7.0% 0.96 1.2% 8.6% 0.82 7.9%

Exhibit VIIPage 2
© 2016 Nationwide
Pennsylvania Personal AutomobileNationwide Affinity Insurance Company of America
Loss Trend SummaryProperty Damage
Four Quarter Ending Calendar Year Data as of: 2015/4Latest Four Quarters Ending Exposures: 227,359Credibility Constant: 1,000
Pennsylvania Four CQ Ending
as of 2015/4
Annualized Average
Paid CostR2 Z
Annualized Non-NW Fast
Track as of 2015/3
Annualized Paid
Frequency (per 1,000)
R2 Z
Annualized Non-NW Fast
Track as of 2015/3
Annualized Paid Pure Premium
R2 Z
Annualized Non-NW Fast
Track as of 2015/3
24 Point Trend 8.0% 0.86 0.99 -5.8% 0.75 0.98 1.8% 0.61 0.9823 Point Trend 8.3% 0.86 0.99 -6.1% 0.76 0.98 1.6% 0.56 0.9822 Point Trend 8.5% 0.85 0.99 -6.6% 0.79 0.97 1.4% 0.51 0.9821 Point Trend 8.7% 0.85 0.99 -6.9% 0.80 0.97 1.2% 0.44 0.9820 Point Trend 9.1% 0.85 0.98 2.8% -7.3% 0.81 0.97 0.7% 1.1% 0.39 0.98 3.5%19 Point Trend 9.6% 0.85 0.98 2.8% -7.7% 0.81 0.97 0.8% 1.2% 0.36 0.98 3.6%18 Point Trend 10.1% 0.85 0.98 2.7% -8.0% 0.81 0.97 1.0% 1.2% 0.36 0.98 3.7%17 Point Trend 10.6% 0.85 0.98 2.7% -8.5% 0.81 0.96 1.1% 1.2% 0.31 0.98 3.8%16 Point Trend 11.1% 0.85 0.98 2.6% -9.0% 0.82 0.96 1.1% 1.1% 0.24 0.98 3.8%15 Point Trend 11.9% 0.86 0.97 2.6% -9.6% 0.82 0.94 1.3% 1.1% 0.21 0.98 3.9%14 Point Trend 12.8% 0.86 0.97 2.7% -10.2% 0.83 0.93 1.4% 1.2% 0.21 0.98 4.2%13 Point Trend 13.8% 0.88 0.96 2.8% -10.9% 0.82 0.93 1.5% 1.5% 0.24 0.98 4.4%12 Point Trend 15.2% 0.90 0.95 2.8% -11.9% 0.84 0.93 1.9% 1.5% 0.21 0.97 4.7%11 Point Trend 16.8% 0.92 0.93 2.8% -13.3% 0.88 0.94 1.9% 1.3% 0.14 0.97 4.8%10 Point Trend 18.8% 0.94 0.92 2.7% -14.9% 0.92 0.96 1.9% 1.1% 0.08 0.96 4.6%9 Point Trend 20.9% 0.96 0.95 2.6% -16.5% 0.94 0.97 1.8% 1.0% 0.05 0.92 4.5%8 Point Trend 23.3% 0.98 0.98 2.7% -17.3% 0.94 0.97 1.8% 2.0% 0.13 0.82 4.5%7 Point Trend 25.0% 0.99 0.99 2.9% -17.0% 0.91 0.95 1.7% 3.8% 0.34 0.74 4.6%6 Point Trend 25.8% 0.98 0.97 3.0% -15.2% 0.86 0.92 1.8% 6.7% 0.64 0.78 4.9%5 Point Trend 25.7% 0.97 0.97 3.4% -12.0% 0.78 0.93 2.2% 10.6% 0.91 0.90 5.7%4 Point Trend 22.3% 0.97 0.92 4.1% -6.8% 0.66 0.93 2.7% 13.9% 0.98 0.98 6.9%3 Point Trend 17.0% 1.00 0.98 4.1% -1.4% 0.14 0.93 4.4% 15.3% 0.97 0.98 8.7%
Pennsylvania AY's as of 2015/3
Estimated Ultimate Severity
Estimated Ultimate
Frequency
Est Ult Pure Premium
6 Year Trend 7.7% -8.1% -1.0%5 Year Trend 9.3% -9.6% -1.3%4 Year Trend 11.4% -11.5% -1.5%3 Year Trend 16.3% -14.0% 0.0%
Countrywide Four CQ Ending as of
2015/4
Annualized Average
Paid CostR2
Annualized Non-NW Fast
Track as of 2015/3
Annualized Paid
Frequency (per 1,000)
R2
Annualized Non-NW Fast
Track as of 2015/3
Annualized Paid Pure Premium
R2
Annualized Non-NW Fast
Track as of 2015/3
24 Point Trend 7.4% 0.91 -2.2% 0.62 5.0% 0.9723 Point Trend 7.8% 0.92 -2.4% 0.67 5.2% 0.9822 Point Trend 8.1% 0.93 -2.6% 0.71 5.3% 0.9821 Point Trend 8.5% 0.94 -2.9% 0.75 5.4% 0.9820 Point Trend 8.8% 0.94 3.0% -3.1% 0.77 1.0% 5.5% 0.98 4.1%19 Point Trend 9.1% 0.95 3.1% -3.3% 0.78 1.0% 5.6% 0.97 4.2%18 Point Trend 9.6% 0.95 3.2% -3.6% 0.81 1.1% 5.7% 0.97 4.4%17 Point Trend 10.0% 0.96 3.4% -3.9% 0.85 1.1% 5.7% 0.97 4.5%16 Point Trend 10.4% 0.96 3.5% -4.3% 0.89 1.1% 5.7% 0.96 4.6%15 Point Trend 10.9% 0.97 3.6% -4.7% 0.92 1.1% 5.7% 0.95 4.7%14 Point Trend 11.4% 0.97 3.8% -5.0% 0.93 1.0% 5.8% 0.95 4.9%13 Point Trend 12.0% 0.98 4.0% -5.3% 0.94 1.1% 6.1% 0.95 5.1%12 Point Trend 12.6% 0.98 4.1% -5.5% 0.94 1.3% 6.4% 0.95 5.5%11 Point Trend 13.3% 0.99 4.2% -5.8% 0.93 1.5% 6.7% 0.95 5.8%10 Point Trend 13.8% 0.99 4.2% -5.8% 0.91 1.7% 7.3% 0.96 5.9%9 Point Trend 14.0% 0.99 4.1% -5.3% 0.88 1.8% 7.9% 0.98 6.0%8 Point Trend 13.9% 0.99 4.3% -4.7% 0.85 1.7% 8.6% 0.99 6.1%7 Point Trend 13.3% 0.99 4.7% -3.8% 0.80 1.5% 9.0% 0.99 6.3%6 Point Trend 12.4% 0.99 5.0% -2.7% 0.74 1.6% 9.4% 0.99 6.6%5 Point Trend 11.9% 0.98 5.4% -1.9% 0.55 1.7% 9.7% 0.99 7.2%4 Point Trend 10.5% 0.99 6.0% -0.5% 0.11 1.8% 9.9% 0.99 7.9%3 Point Trend 9.4% 1.00 6.1% 1.0% 0.56 2.5% 10.5% 0.98 8.8%

Exhibit VIIPage 3
© 2016 Nationwide
Pennsylvania Personal AutomobileNationwide Affinity Insurance Company of America
Loss Trend SummaryUninsured Motorists - Bodily Injury
Four Quarter Ending Calendar Year Data as of: 2015/4Latest Four Quarters Ending Exposures: 205,584Credibility Constant: 10,000
Pennsylvania Four CQ Ending
as of 2015/4
Annualized Average
Paid CostR2 Z
Annualized Non-NW Fast
Track
Annualized Incurred
Frequency (per 1,000)
R2 ZAnnualized
Non-NW Fast Track
Annualized Adjusted
Pure Premium
R2 ZAnnualized
Non-NW Fast Track
24 Point Trend 24.8% 0.92 0.76 -16.3% 0.78 0.96 4.4% 0.08 0.9723 Point Trend 24.7% 0.91 0.75 -17.4% 0.81 0.96 3.0% 0.04 0.9722 Point Trend 23.7% 0.90 0.76 -18.4% 0.82 0.97 1.0% 0.00 0.9721 Point Trend 21.9% 0.90 0.78 -19.2% 0.83 0.97 -1.5% 0.01 0.9820 Point Trend 20.7% 0.89 0.80 -19.8% 0.82 0.97 -3.2% 0.05 0.9819 Point Trend 19.0% 0.89 0.82 -20.0% 0.81 0.97 -4.9% 0.10 0.9818 Point Trend 19.0% 0.87 0.82 -20.1% 0.78 0.97 -4.9% 0.08 0.9817 Point Trend 19.8% 0.87 0.81 -20.0% 0.75 0.97 -4.2% 0.05 0.9816 Point Trend 21.4% 0.89 0.82 -19.5% 0.70 0.97 -2.3% 0.01 0.9815 Point Trend 23.6% 0.92 0.82 -18.0% 0.64 0.98 1.3% 0.00 0.9914 Point Trend 25.5% 0.93 0.80 -15.5% 0.55 0.98 6.0% 0.09 0.9913 Point Trend 27.2% 0.94 0.77 -11.8% 0.45 0.99 12.1% 0.33 0.9912 Point Trend 28.5% 0.94 0.59 -8.0% 0.30 0.99 18.1% 0.57 0.9911 Point Trend 29.3% 0.92 0.59 -4.2% 0.12 1.00 23.8% 0.71 1.0010 Point Trend 26.8% 0.91 0.61 -3.3% 0.06 0.99 22.6% 0.63 0.999 Point Trend 24.1% 0.88 0.65 -4.5% 0.08 0.99 18.5% 0.50 0.998 Point Trend 18.8% 0.92 0.85 -1.7% 0.01 0.98 16.9% 0.38 0.987 Point Trend 17.5% 0.89 0.84 2.7% 0.02 0.93 20.6% 0.38 0.936 Point Trend 19.4% 0.88 0.80 7.1% 0.07 0.83 27.9% 0.42 0.725 Point Trend 19.2% 0.80 0.62 9.3% 0.07 0.78 30.3% 0.33 0.734 Point Trend 28.4% 0.93 0.85 4.7% 0.01 0.76 34.5% 0.24 0.703 Point Trend 19.4% 0.93 0.81 -39.2% 0.82 0.94 -27.4% 0.56 0.94
Pennsylvania AY's as of 2015/3
Estimated Ultimate Severity
Estimated Ultimate
Frequency
Est Ult Pure Premium
6 Year Trend 8.7% -18.6% -11.6%5 Year Trend 9.5% -21.1% -13.6%4 Year Trend 8.2% -21.2% -14.8%3 Year Trend 4.5% -15.0% -11.2%
Countrywide Four CQ Ending as of
2015/4
Annualized Average
Paid CostR2
Annualized Non-NW Fast
Track
Annualized Incurred
Frequency (per 1,000)
R2Annualized
Non-NW Fast Track
Annualized Adjusted
Pure Premium
R2Annualized
Non-NW Fast Track
24 Point Trend 2.8% 0.72 -1.1% 0.02 1.7% 0.0523 Point Trend 2.7% 0.69 -1.0% 0.02 1.6% 0.0422 Point Trend 2.7% 0.66 -1.1% 0.02 1.6% 0.0321 Point Trend 2.5% 0.61 -1.1% 0.02 1.4% 0.0220 Point Trend 2.5% 0.56 -1.2% 0.02 1.2% 0.0119 Point Trend 2.4% 0.52 -1.3% 0.02 1.0% 0.0118 Point Trend 2.4% 0.48 -1.6% 0.02 0.9% 0.0117 Point Trend 2.8% 0.53 -1.6% 0.02 1.1% 0.0116 Point Trend 3.2% 0.59 -1.7% 0.02 1.5% 0.0115 Point Trend 3.9% 0.72 -1.6% 0.01 2.3% 0.0214 Point Trend 4.6% 0.81 -0.9% 0.00 3.7% 0.0513 Point Trend 5.3% 0.87 0.1% 0.00 5.4% 0.0812 Point Trend 6.2% 0.94 2.5% 0.02 8.8% 0.1611 Point Trend 6.3% 0.94 6.2% 0.08 12.9% 0.2610 Point Trend 6.6% 0.93 12.3% 0.25 19.7% 0.439 Point Trend 6.6% 0.90 22.1% 0.57 30.2% 0.688 Point Trend 6.7% 0.87 32.8% 0.80 41.7% 0.847 Point Trend 7.4% 0.86 45.0% 0.95 55.8% 0.966 Point Trend 8.8% 0.89 52.7% 0.98 66.2% 0.995 Point Trend 11.0% 0.95 47.9% 0.98 64.1% 0.994 Point Trend 10.9% 0.90 43.7% 0.96 59.3% 0.983 Point Trend 15.3% 0.97 34.2% 0.92 54.7% 0.94

Exhibit VIIPage 4
© 2016 Nationwide
Pennsylvania Personal AutomobileNationwide Affinity Insurance Company of America
Loss Trend SummaryUnderinsured Motorists - Bodily Injury
Four Quarter Ending Calendar Year Data as of: 2015/4Latest Four Quarters Ending Exposures: 203,708Credibility Constant: 10,000
Pennsylvania Four CQ Ending
as of 2015/4
Annualized Average
Paid CostR2 Z
Annualized Non-NW Fast
Track
Annualized Incurred
Frequency (per 1,000)
R2 ZAnnualized
Non-NW Fast Track
Annualized Adjusted
Pure Premium
R2 ZAnnualized
Non-NW Fast Track
24 Point Trend 8.0% 0.72 0.89 7.9% 0.59 0.81 16.6% 0.72 0.8123 Point Trend 8.2% 0.71 0.89 7.2% 0.53 0.82 16.0% 0.68 0.8122 Point Trend 7.5% 0.67 0.90 6.3% 0.47 0.83 14.3% 0.64 0.8221 Point Trend 6.6% 0.62 0.90 4.9% 0.39 0.86 11.9% 0.62 0.8420 Point Trend 6.0% 0.57 0.89 3.5% 0.30 0.88 9.7% 0.57 0.8619 Point Trend 5.1% 0.49 0.86 2.7% 0.20 0.89 8.0% 0.51 0.8618 Point Trend 4.8% 0.42 0.79 2.1% 0.12 0.89 6.9% 0.43 0.8517 Point Trend 5.2% 0.43 0.75 2.0% 0.10 0.89 7.3% 0.41 0.8416 Point Trend 6.2% 0.51 0.73 2.1% 0.09 0.89 8.4% 0.46 0.8515 Point Trend 8.0% 0.69 0.81 2.1% 0.08 0.89 10.3% 0.55 0.8714 Point Trend 9.3% 0.77 0.85 2.2% 0.07 0.89 11.7% 0.59 0.8813 Point Trend 10.2% 0.78 0.86 1.7% 0.03 0.89 12.0% 0.55 0.8812 Point Trend 11.0% 0.77 0.86 1.8% 0.03 0.89 13.0% 0.53 0.8811 Point Trend 12.4% 0.80 0.87 1.6% 0.02 0.88 14.3% 0.52 0.8710 Point Trend 14.0% 0.82 0.88 3.5% 0.07 0.85 18.0% 0.60 0.869 Point Trend 15.7% 0.82 0.81 7.3% 0.22 0.79 24.1% 0.75 0.838 Point Trend 18.4% 0.86 0.81 11.4% 0.37 0.71 31.9% 0.88 0.857 Point Trend 16.9% 0.79 0.81 18.5% 0.60 0.56 38.5% 0.93 0.846 Point Trend 14.7% 0.66 0.78 27.1% 0.77 0.70 45.8% 0.96 0.925 Point Trend 10.4% 0.42 0.69 37.5% 0.86 0.66 51.9% 0.96 0.904 Point Trend 0.5% 0.00 0.81 50.9% 0.91 0.61 51.7% 0.93 0.813 Point Trend -7.8% 0.39 0.84 74.8% 0.99 0.68 61.2% 0.90 0.60
* Large losses removed
Pennsylvania AY's as of 2015/3
Estimated Ultimate Severity
Estimated Ultimate
Frequency
Est Ult Pure Premium
6 Year Trend 4.7% -5.9% -1.5%5 Year Trend 6.0% -5.2% 0.5%4 Year Trend -0.5% -4.5% -4.9%3 Year Trend 0.5% 6.4% 7.0%
Countrywide Four CQ Ending as of
2015/4
Annualized Average
Paid CostR2
Annualized Non-NW Fast
Track
Annualized Incurred
Frequency (per 1,000)
R2Annualized
Non-NW Fast Track
Annualized Adjusted
Pure Premium
R2Annualized
Non-NW Fast Track
24 Point Trend 0.2% 0.00 -1.5% 0.09 -1.3% 0.0423 Point Trend 0.4% 0.02 -1.7% 0.10 -1.3% 0.0322 Point Trend 0.5% 0.02 -1.5% 0.07 -1.1% 0.0221 Point Trend 0.7% 0.04 -1.4% 0.05 -0.6% 0.0120 Point Trend 1.3% 0.12 -1.0% 0.03 0.2% 0.0019 Point Trend 2.1% 0.31 -0.7% 0.01 1.4% 0.0218 Point Trend 2.9% 0.56 -0.5% 0.00 2.4% 0.0617 Point Trend 3.5% 0.65 -0.3% 0.00 3.1% 0.0916 Point Trend 4.0% 0.73 -0.1% 0.00 3.9% 0.1115 Point Trend 3.8% 0.68 0.3% 0.00 4.1% 0.1114 Point Trend 3.8% 0.62 0.6% 0.00 4.4% 0.1013 Point Trend 4.1% 0.61 1.3% 0.01 5.4% 0.1212 Point Trend 4.0% 0.55 2.8% 0.04 6.9% 0.1511 Point Trend 4.6% 0.59 4.1% 0.07 9.0% 0.1910 Point Trend 5.5% 0.64 8.8% 0.27 14.9% 0.399 Point Trend 7.4% 0.82 15.5% 0.60 24.1% 0.708 Point Trend 8.6% 0.85 21.8% 0.79 32.3% 0.847 Point Trend 8.5% 0.79 29.1% 0.92 40.1% 0.916 Point Trend 10.2% 0.81 28.2% 0.88 41.3% 0.865 Point Trend 7.1% 0.71 20.6% 0.86 29.2% 0.824 Point Trend 4.5% 0.42 13.5% 0.78 18.6% 0.693 Point Trend 0.1% 0.00 5.2% 0.66 5.2% 0.22

Exhibit VIIPage 5
© 2016 Nationwide
Pennsylvania Personal AutomobileNationwide Affinity Insurance Company of America
Loss Trend Summary
Accidental Death Benefits, Combined Loss Benefits, Funeral Benefits, Loss of Income Benefits, Medical Benefits, Excess Medical Benefits
Four Quarter Ending Calendar Year Data as of: 2015/4Latest Four Quarters Ending Exposures: 615,306Credibility Constant: 1,000
Pennsylvania Four CQ Ending
as of 2015/4
Annualized Average
Paid CostR2 Z
Annualized Non-NW Fast
Track
Annualized Incurred
Frequency (per 1,000)
R2 ZAnnualized
Non-NW Fast Track
Annualized Adjusted
Pure Premium
R2 ZAnnualized
Non-NW Fast Track
24 Point Trend -1.6% 0.45 1.00 -8.3% 0.97 1.00 -9.7% 0.95 1.0023 Point Trend -1.7% 0.48 1.00 -8.5% 0.97 1.00 -10.0% 0.95 1.0022 Point Trend -1.9% 0.53 1.00 -8.7% 0.98 1.00 -10.5% 0.97 1.0021 Point Trend -2.0% 0.51 1.00 -8.9% 0.98 1.00 -10.7% 0.97 1.0020 Point Trend -1.8% 0.45 1.00 -9.0% 0.97 1.00 -10.7% 0.96 1.0019 Point Trend -1.6% 0.36 1.00 -9.0% 0.97 1.00 -10.5% 0.96 1.0018 Point Trend -1.3% 0.26 1.00 -9.0% 0.97 1.00 -10.1% 0.95 1.0017 Point Trend -1.1% 0.18 1.00 -8.9% 0.96 1.00 -9.9% 0.95 1.0016 Point Trend -0.9% 0.12 1.00 -8.9% 0.95 1.00 -9.7% 0.94 1.0015 Point Trend -0.4% 0.03 1.00 -8.7% 0.94 1.00 -9.1% 0.94 1.0014 Point Trend -0.2% 0.01 1.00 -8.6% 0.93 1.00 -8.8% 0.93 1.0013 Point Trend 0.1% 0.00 1.00 -8.3% 0.91 1.00 -8.2% 0.92 1.0012 Point Trend 0.8% 0.06 1.00 -8.2% 0.89 1.00 -7.4% 0.92 1.0011 Point Trend 0.3% 0.01 1.00 -7.8% 0.85 1.00 -7.6% 0.91 1.0010 Point Trend -0.4% 0.01 1.00 -7.2% 0.81 1.00 -7.6% 0.88 1.009 Point Trend -1.2% 0.09 1.00 -6.3% 0.74 1.00 -7.5% 0.84 1.008 Point Trend -2.9% 0.47 1.00 -4.7% 0.66 1.00 -7.5% 0.78 1.007 Point Trend -4.2% 0.66 1.00 -2.9% 0.54 1.00 -7.0% 0.68 1.006 Point Trend -3.4% 0.48 1.00 -1.1% 0.31 1.00 -4.4% 0.52 1.005 Point Trend -3.8% 0.41 1.00 -0.1% 0.00 1.00 -3.9% 0.33 1.004 Point Trend -3.9% 0.27 1.00 -0.9% 0.23 1.00 -4.8% 0.28 1.003 Point Trend 4.0% 0.77 1.00 0.2% 0.00 1.00 4.2% 0.46 1.00
Pennsylvania AY's as of 2015/3
Estimated Ultimate Severity
Estimated Ultimate
Frequency
Est Ult Pure Premium
6 Year Trend -0.6% -8.4% -9.0%5 Year Trend 0.2% -9.1% -8.9%4 Year Trend 0.0% -9.1% -9.1%3 Year Trend -0.6% -7.5% -8.1%
Countrywide Four CQ Ending as of
2015/4
Annualized Average
Paid CostR2
Annualized Non-NW Fast
Track
Annualized Incurred
Frequency (per 1,000)
R2Annualized
Non-NW Fast Track
Annualized Adjusted
Pure Premium
R2Annualized
Non-NW Fast Track
24 Point Trend23 Point Trend22 Point Trend21 Point Trend20 Point Trend19 Point Trend18 Point Trend17 Point Trend16 Point Trend15 Point Trend14 Point Trend13 Point Trend12 Point Trend11 Point Trend10 Point Trend9 Point Trend8 Point Trend7 Point Trend6 Point Trend5 Point Trend4 Point Trend3 Point Trend

Exhibit VIIPage 6
© 2016 Nationwide
Pennsylvania Personal AutomobileNationwide Affinity Insurance Company of America
Loss Trend SummaryComprehensive
Four Quarter Ending Calendar Year Data as of: 2015/4Latest Four Quarters Ending Exposures: 192,022Credibility Constant: 1,000
Pennsylvania Four CQ Ending
as of 2015/4
Annualized Average
Paid CostR2 Z
Annualized Non-NW Fast
Track as of 2015/3
Annualized Paid
Frequency (per 1,000)
R2 Z
Annualized Non-NW Fast
Track as of 2015/3
Annualized Paid Pure Premium
R2 Z
Annualized Non-NW Fast
Track as of 2015/3
24 Point Trend 1.5% 0.33 0.99 -0.7% 0.04 0.99 0.8% 0.05 0.9823 Point Trend 1.5% 0.31 0.99 -1.1% 0.09 0.99 0.4% 0.01 0.9822 Point Trend 1.3% 0.24 0.99 -1.3% 0.12 0.99 0.0% 0.00 0.9821 Point Trend 0.9% 0.14 0.99 -1.6% 0.14 0.99 -0.7% 0.04 0.9820 Point Trend 0.7% 0.09 0.99 6.3% -1.9% 0.18 0.99 -0.5% -1.2% 0.12 0.98 5.8%19 Point Trend 0.5% 0.05 0.98 6.4% -2.2% 0.21 0.99 -0.7% -1.7% 0.21 0.98 5.7%18 Point Trend 0.5% 0.03 0.98 6.3% -2.1% 0.17 0.99 -0.8% -1.6% 0.18 0.98 5.5%17 Point Trend 0.3% 0.01 0.98 6.3% -1.7% 0.11 0.99 -0.5% -1.4% 0.12 0.98 5.8%16 Point Trend 0.1% 0.00 0.97 6.6% -0.9% 0.03 0.99 0.2% -0.7% 0.04 0.98 6.8%15 Point Trend -0.3% 0.01 0.97 6.9% 0.5% 0.01 0.99 1.6% 0.2% 0.00 0.99 8.6%14 Point Trend -1.0% 0.10 0.97 7.3% 1.4% 0.08 0.99 3.5% 0.3% 0.01 0.99 11.1%13 Point Trend -1.6% 0.21 0.97 7.2% 2.1% 0.16 0.98 4.8% 0.4% 0.01 0.99 12.4%12 Point Trend -2.0% 0.24 0.97 6.6% 2.5% 0.17 0.98 6.2% 0.4% 0.01 0.99 13.2%11 Point Trend -1.9% 0.18 0.97 7.0% 2.1% 0.10 0.98 7.1% 0.2% 0.00 0.99 14.6%10 Point Trend -1.4% 0.09 0.97 7.4% 1.5% 0.04 0.98 7.4% 0.0% 0.00 0.99 15.4%9 Point Trend -1.0% 0.04 0.97 7.7% -0.1% 0.00 0.98 7.7% -1.1% 0.02 0.98 16.0%8 Point Trend -0.6% 0.01 0.97 6.5% -3.0% 0.16 0.98 6.0% -3.6% 0.20 0.98 12.9%7 Point Trend -0.5% 0.00 0.97 -0.6% -6.9% 0.65 0.97 1.3% -7.4% 0.62 0.98 0.7%6 Point Trend 3.4% 0.16 0.97 -14.8% -10.2% 0.92 0.99 -7.2% -7.1% 0.49 0.98 -21.0%5 Point Trend 6.4% 0.32 0.97 -21.5% -12.4% 0.98 1.00 -13.5% -6.8% 0.33 0.98 -32.1%4 Point Trend 9.9% 0.39 0.98 -29.5% -12.8% 0.97 1.00 -19.2% -4.2% 0.09 0.98 -43.0%3 Point Trend 25.8% 0.91 0.99 -38.5% -10.6% 0.95 0.97 -24.1% 12.5% 0.86 1.00 -53.4%
* Catastrophes removed
Pennsylvania AY's as of 2015/3
Estimated Ultimate Severity
Estimated Ultimate
Frequency
Est Ult Pure Premium
6 Year Trend 2.1% -2.1% 0.0%5 Year Trend 1.1% -3.1% -2.1%4 Year Trend 0.4% -0.8% -0.4%3 Year Trend -1.1% 0.8% -0.3%
Countrywide Four CQ Ending as of
2015/4
Annualized Average
Paid CostR2
Annualized Non-NW Fast
Track as of 2015/3
Annualized Paid
Frequency (per 1,000)
R2
Annualized Non-NW Fast
Track as of 2015/3
Annualized Paid Pure Premium
R2
Annualized Non-NW Fast
Track as of 2015/3
24 Point Trend 4.1% 0.83 -2.9% 0.59 1.1% 0.2123 Point Trend 4.4% 0.86 -3.4% 0.70 0.9% 0.1522 Point Trend 4.6% 0.86 -3.6% 0.73 0.8% 0.1021 Point Trend 4.4% 0.84 -3.7% 0.71 0.6% 0.0520 Point Trend 4.2% 0.82 2.9% -3.8% 0.69 -3.0% 0.3% 0.01 -0.2%19 Point Trend 3.7% 0.81 2.3% -3.8% 0.65 -3.3% -0.2% 0.01 -1.1%18 Point Trend 3.4% 0.78 1.4% -3.7% 0.61 -3.6% -0.4% 0.03 -2.2%17 Point Trend 3.1% 0.75 0.9% -3.5% 0.54 -3.7% -0.5% 0.03 -2.9%16 Point Trend 2.7% 0.72 0.6% -2.9% 0.45 -3.5% -0.3% 0.01 -2.9%15 Point Trend 2.4% 0.66 0.2% -2.1% 0.33 -3.1% 0.2% 0.01 -2.9%14 Point Trend 1.9% 0.60 -0.1% -1.4% 0.19 -2.4% 0.5% 0.02 -2.5%13 Point Trend 1.7% 0.50 -0.8% -0.9% 0.08 -1.7% 0.8% 0.05 -2.4%12 Point Trend 1.6% 0.42 -2.2% -0.6% 0.03 -1.2% 1.0% 0.06 -3.4%11 Point Trend 1.6% 0.36 -1.6% -0.6% 0.03 -0.7% 1.0% 0.04 -2.3%10 Point Trend 1.7% 0.31 -0.7% -0.9% 0.05 -0.2% 0.7% 0.02 -0.8%9 Point Trend 1.3% 0.18 1.0% -2.0% 0.15 0.2% -0.7% 0.01 1.2%8 Point Trend 1.1% 0.10 4.5% -3.9% 0.45 0.3% -2.8% 0.22 4.8%7 Point Trend 1.0% 0.05 4.0% -6.4% 0.89 -0.2% -5.5% 0.62 3.8%6 Point Trend 3.1% 0.39 2.4% -7.4% 0.91 -1.4% -4.6% 0.43 1.0%5 Point Trend 4.4% 0.46 -0.3% -7.7% 0.86 -2.5% -3.7% 0.23 -2.7%4 Point Trend 5.4% 0.41 -3.6% -6.2% 0.73 -4.0% -1.1% 0.01 -7.4%3 Point Trend 11.0% 0.65 -7.0% -1.7% 0.72 -5.1% 9.1% 0.63 -11.7%
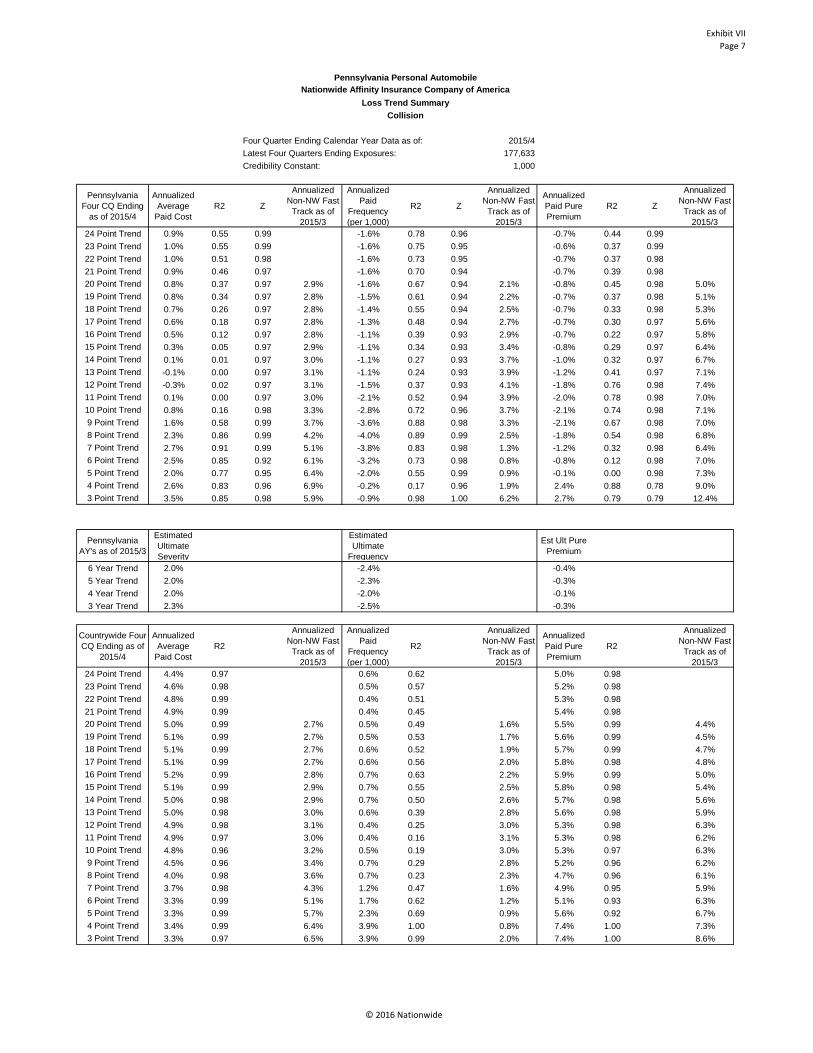
Exhibit VIIPage 7
© 2016 Nationwide
Pennsylvania Personal AutomobileNationwide Affinity Insurance Company of America
Loss Trend SummaryCollision
Four Quarter Ending Calendar Year Data as of: 2015/4Latest Four Quarters Ending Exposures: 177,633Credibility Constant: 1,000
Pennsylvania Four CQ Ending
as of 2015/4
Annualized Average
Paid CostR2 Z
Annualized Non-NW Fast
Track as of 2015/3
Annualized Paid
Frequency (per 1,000)
R2 Z
Annualized Non-NW Fast
Track as of 2015/3
Annualized Paid Pure Premium
R2 Z
Annualized Non-NW Fast
Track as of 2015/3
24 Point Trend 0.9% 0.55 0.99 -1.6% 0.78 0.96 -0.7% 0.44 0.9923 Point Trend 1.0% 0.55 0.99 -1.6% 0.75 0.95 -0.6% 0.37 0.9922 Point Trend 1.0% 0.51 0.98 -1.6% 0.73 0.95 -0.7% 0.37 0.9821 Point Trend 0.9% 0.46 0.97 -1.6% 0.70 0.94 -0.7% 0.39 0.9820 Point Trend 0.8% 0.37 0.97 2.9% -1.6% 0.67 0.94 2.1% -0.8% 0.45 0.98 5.0%19 Point Trend 0.8% 0.34 0.97 2.8% -1.5% 0.61 0.94 2.2% -0.7% 0.37 0.98 5.1%18 Point Trend 0.7% 0.26 0.97 2.8% -1.4% 0.55 0.94 2.5% -0.7% 0.33 0.98 5.3%17 Point Trend 0.6% 0.18 0.97 2.8% -1.3% 0.48 0.94 2.7% -0.7% 0.30 0.97 5.6%16 Point Trend 0.5% 0.12 0.97 2.8% -1.1% 0.39 0.93 2.9% -0.7% 0.22 0.97 5.8%15 Point Trend 0.3% 0.05 0.97 2.9% -1.1% 0.34 0.93 3.4% -0.8% 0.29 0.97 6.4%14 Point Trend 0.1% 0.01 0.97 3.0% -1.1% 0.27 0.93 3.7% -1.0% 0.32 0.97 6.7%13 Point Trend -0.1% 0.00 0.97 3.1% -1.1% 0.24 0.93 3.9% -1.2% 0.41 0.97 7.1%12 Point Trend -0.3% 0.02 0.97 3.1% -1.5% 0.37 0.93 4.1% -1.8% 0.76 0.98 7.4%11 Point Trend 0.1% 0.00 0.97 3.0% -2.1% 0.52 0.94 3.9% -2.0% 0.78 0.98 7.0%10 Point Trend 0.8% 0.16 0.98 3.3% -2.8% 0.72 0.96 3.7% -2.1% 0.74 0.98 7.1%9 Point Trend 1.6% 0.58 0.99 3.7% -3.6% 0.88 0.98 3.3% -2.1% 0.67 0.98 7.0%8 Point Trend 2.3% 0.86 0.99 4.2% -4.0% 0.89 0.99 2.5% -1.8% 0.54 0.98 6.8%7 Point Trend 2.7% 0.91 0.99 5.1% -3.8% 0.83 0.98 1.3% -1.2% 0.32 0.98 6.4%6 Point Trend 2.5% 0.85 0.92 6.1% -3.2% 0.73 0.98 0.8% -0.8% 0.12 0.98 7.0%5 Point Trend 2.0% 0.77 0.95 6.4% -2.0% 0.55 0.99 0.9% -0.1% 0.00 0.98 7.3%4 Point Trend 2.6% 0.83 0.96 6.9% -0.2% 0.17 0.96 1.9% 2.4% 0.88 0.78 9.0%3 Point Trend 3.5% 0.85 0.98 5.9% -0.9% 0.98 1.00 6.2% 2.7% 0.79 0.79 12.4%
Pennsylvania AY's as of 2015/3
Estimated Ultimate Severity
Estimated Ultimate
Frequency
Est Ult Pure Premium
6 Year Trend 2.0% -2.4% -0.4%5 Year Trend 2.0% -2.3% -0.3%4 Year Trend 2.0% -2.0% -0.1%3 Year Trend 2.3% -2.5% -0.3%
Countrywide Four CQ Ending as of
2015/4
Annualized Average
Paid CostR2
Annualized Non-NW Fast
Track as of 2015/3
Annualized Paid
Frequency (per 1,000)
R2
Annualized Non-NW Fast
Track as of 2015/3
Annualized Paid Pure Premium
R2
Annualized Non-NW Fast
Track as of 2015/3
24 Point Trend 4.4% 0.97 0.6% 0.62 5.0% 0.9823 Point Trend 4.6% 0.98 0.5% 0.57 5.2% 0.9822 Point Trend 4.8% 0.99 0.4% 0.51 5.3% 0.9821 Point Trend 4.9% 0.99 0.4% 0.45 5.4% 0.9820 Point Trend 5.0% 0.99 2.7% 0.5% 0.49 1.6% 5.5% 0.99 4.4%19 Point Trend 5.1% 0.99 2.7% 0.5% 0.53 1.7% 5.6% 0.99 4.5%18 Point Trend 5.1% 0.99 2.7% 0.6% 0.52 1.9% 5.7% 0.99 4.7%17 Point Trend 5.1% 0.99 2.7% 0.6% 0.56 2.0% 5.8% 0.98 4.8%16 Point Trend 5.2% 0.99 2.8% 0.7% 0.63 2.2% 5.9% 0.99 5.0%15 Point Trend 5.1% 0.99 2.9% 0.7% 0.55 2.5% 5.8% 0.98 5.4%14 Point Trend 5.0% 0.98 2.9% 0.7% 0.50 2.6% 5.7% 0.98 5.6%13 Point Trend 5.0% 0.98 3.0% 0.6% 0.39 2.8% 5.6% 0.98 5.9%12 Point Trend 4.9% 0.98 3.1% 0.4% 0.25 3.0% 5.3% 0.98 6.3%11 Point Trend 4.9% 0.97 3.0% 0.4% 0.16 3.1% 5.3% 0.98 6.2%10 Point Trend 4.8% 0.96 3.2% 0.5% 0.19 3.0% 5.3% 0.97 6.3%9 Point Trend 4.5% 0.96 3.4% 0.7% 0.29 2.8% 5.2% 0.96 6.2%8 Point Trend 4.0% 0.98 3.6% 0.7% 0.23 2.3% 4.7% 0.96 6.1%7 Point Trend 3.7% 0.98 4.3% 1.2% 0.47 1.6% 4.9% 0.95 5.9%6 Point Trend 3.3% 0.99 5.1% 1.7% 0.62 1.2% 5.1% 0.93 6.3%5 Point Trend 3.3% 0.99 5.7% 2.3% 0.69 0.9% 5.6% 0.92 6.7%4 Point Trend 3.4% 0.99 6.4% 3.9% 1.00 0.8% 7.4% 1.00 7.3%3 Point Trend 3.3% 0.97 6.5% 3.9% 0.99 2.0% 7.4% 1.00 8.6%

Exhibit VIIPage 8
© 2016 Nationwide
Pennsylvania Personal AutomobileNationwide Affinity Insurance Company of America
Loss Trend SummaryLoss of Use
Four Quarter Ending Calendar Year Data as of: 2015/4Latest Four Quarters Ending Exposures: 112,923Credibility Constant: 1,000
Pennsylvania Four CQ Ending
as of 2015/4
Annualized Average
Paid CostR2 Z
Annualized Non-NW Fast
Track
Annualized Paid
Frequency (per 1,000)
R2 ZAnnualized
Non-NW Fast Track
Annualized Paid Pure Premium
R2 ZAnnualized
Non-NW Fast Track
24 Point Trend -0.5% 0.18 0.98 0.0% 0.00 0.99 -0.5% 0.11 0.9823 Point Trend -0.5% 0.20 0.98 0.0% 0.00 0.99 -0.5% 0.11 0.9822 Point Trend -0.5% 0.19 0.98 0.0% 0.00 0.99 -0.5% 0.10 0.9821 Point Trend -0.5% 0.16 0.97 -0.1% 0.00 0.99 -0.6% 0.09 0.9820 Point Trend -0.4% 0.09 0.97 -0.1% 0.00 0.99 -0.4% 0.05 0.9819 Point Trend -0.2% 0.02 0.97 -0.1% 0.01 0.99 -0.3% 0.03 0.9818 Point Trend -0.1% 0.01 0.97 -0.4% 0.04 0.99 -0.5% 0.05 0.9817 Point Trend 0.0% 0.00 0.97 -0.5% 0.08 0.99 -0.5% 0.05 0.9816 Point Trend 0.1% 0.01 0.97 -0.8% 0.13 0.99 -0.6% 0.06 0.9815 Point Trend 0.2% 0.02 0.97 -0.7% 0.09 0.99 -0.5% 0.03 0.9814 Point Trend 0.3% 0.03 0.97 -0.7% 0.08 0.99 -0.4% 0.02 0.9813 Point Trend 0.3% 0.02 0.97 -0.8% 0.08 0.99 -0.5% 0.02 0.9812 Point Trend 0.2% 0.01 0.97 -1.2% 0.16 0.99 -1.0% 0.07 0.9811 Point Trend 0.2% 0.01 0.96 -1.9% 0.31 0.99 -1.7% 0.16 0.9810 Point Trend 0.5% 0.03 0.96 -2.1% 0.30 0.99 -1.6% 0.12 0.979 Point Trend 0.3% 0.01 0.95 -2.3% 0.26 0.99 -2.0% 0.14 0.968 Point Trend -0.7% 0.04 0.95 -1.4% 0.10 0.98 -2.1% 0.11 0.927 Point Trend -1.8% 0.18 0.96 -0.4% 0.01 0.98 -2.2% 0.08 0.926 Point Trend -4.4% 0.79 0.99 -1.9% 0.11 0.98 -6.3% 0.51 0.965 Point Trend -5.7% 0.86 0.98 -3.5% 0.20 0.95 -9.0% 0.63 0.924 Point Trend -4.8% 0.73 0.92 -4.3% 0.16 0.95 -8.9% 0.46 0.923 Point Trend -4.8% 0.52 0.81 -15.3% 0.99 1.00 -19.4% 0.98 0.99
Pennsylvania AY's as of 2015/3
Estimated Ultimate Severity
Estimated Ultimate
Frequency
Est Ult Pure Premium
6 Year Trend 0.0% -2.1% -2.2%5 Year Trend 0.5% -2.8% -2.3%4 Year Trend 1.4% -3.3% -1.9%3 Year Trend 1.5% -4.6% -3.1%
Countrywide Four CQ Ending as of
2015/4
Annualized Average
Paid CostR2
Annualized Non-NW Fast
Track
Annualized Paid
Frequency (per 1,000)
R2Annualized
Non-NW Fast Track
Annualized Paid Pure Premium
R2Annualized
Non-NW Fast Track
24 Point Trend 4.0% 0.96 1.6% 0.42 5.7% 0.9323 Point Trend 4.1% 0.97 1.6% 0.37 5.8% 0.9322 Point Trend 4.3% 0.97 1.5% 0.33 5.8% 0.9221 Point Trend 4.4% 0.97 1.5% 0.29 5.9% 0.9120 Point Trend 4.5% 0.98 1.4% 0.25 6.0% 0.9119 Point Trend 4.6% 0.97 1.3% 0.20 6.0% 0.8918 Point Trend 4.6% 0.97 1.1% 0.13 5.7% 0.8717 Point Trend 4.7% 0.97 1.1% 0.11 5.8% 0.8616 Point Trend 4.7% 0.96 1.0% 0.09 5.8% 0.8315 Point Trend 4.6% 0.95 1.2% 0.10 5.9% 0.8114 Point Trend 4.5% 0.94 1.6% 0.14 6.2% 0.8013 Point Trend 4.4% 0.93 2.1% 0.19 6.6% 0.7912 Point Trend 4.1% 0.92 2.5% 0.22 6.7% 0.7611 Point Trend 3.9% 0.90 3.4% 0.30 7.5% 0.7710 Point Trend 3.6% 0.87 5.3% 0.55 9.1% 0.879 Point Trend 3.2% 0.83 7.2% 0.72 10.6% 0.918 Point Trend 2.7% 0.77 9.1% 0.83 12.1% 0.947 Point Trend 2.7% 0.69 9.7% 0.79 12.7% 0.936 Point Trend 3.6% 0.78 7.7% 0.66 11.6% 0.895 Point Trend 4.9% 0.90 3.7% 0.47 8.7% 0.884 Point Trend 6.4% 0.98 2.6% 0.20 9.2% 0.813 Point Trend 7.4% 0.98 -2.9% 0.37 4.3% 0.66

Exhibit VIIIPage 1
© 2016 Nationwide
Pennsylvania Personal AutomobileNationwide Affinity Insurance Company of America
Determination of Loss Projection FactorsBodily Injury
Fiscal Calendar Year Ending2013/3 2014/3 2015/3
Past-to-Present Adjustments1. Average Loss Date for Fiscal Calendar Year 3/31/2013 3/31/2014 3/31/20152. Average Loss Date for Latest Fiscal Calendar Year 3/31/2015 3/31/2015 3/31/20153. Years of Trend = (2) - (1) 2.000 1.000 0.0004. Selected Severity Trend 11.0% 11.0% 11.0%5. Selected Frequency Trend -4.5% -4.5% -4.5%6. Selected Pure Premium Trend = [1+(4)] × [1+(5)] - 1 6.0% 6.0% 6.0%7. Past-to-Present Factor = [1+(6)](3) 1.124 1.060 1.000
Present-to-Future Adjustments8. Average Loss Date for Latest Fiscal Calendar Year 3/31/2015 3/31/2015 3/31/20159. Average Loss Date for Assumed Effective Period 6/22/2017 6/22/2017 6/22/201710. Years of Trend = (9) - (8) 2.232 2.232 2.23211. Selected Severity Trend 5.4% 5.4% 5.4%12. Selected Frequency Trend 2.8% 2.8% 2.8%13. Selected Pure Premium Trend = [1+(11)] × [1+(12)] - 1 8.4% 8.4% 8.4%14. Present-to-Future Factor = [1+(13)](10) 1.197 1.197 1.197
Past-to-Future Adjustments15. Loss Projection Factor = (7) × (14) 1.345 1.269 1.197
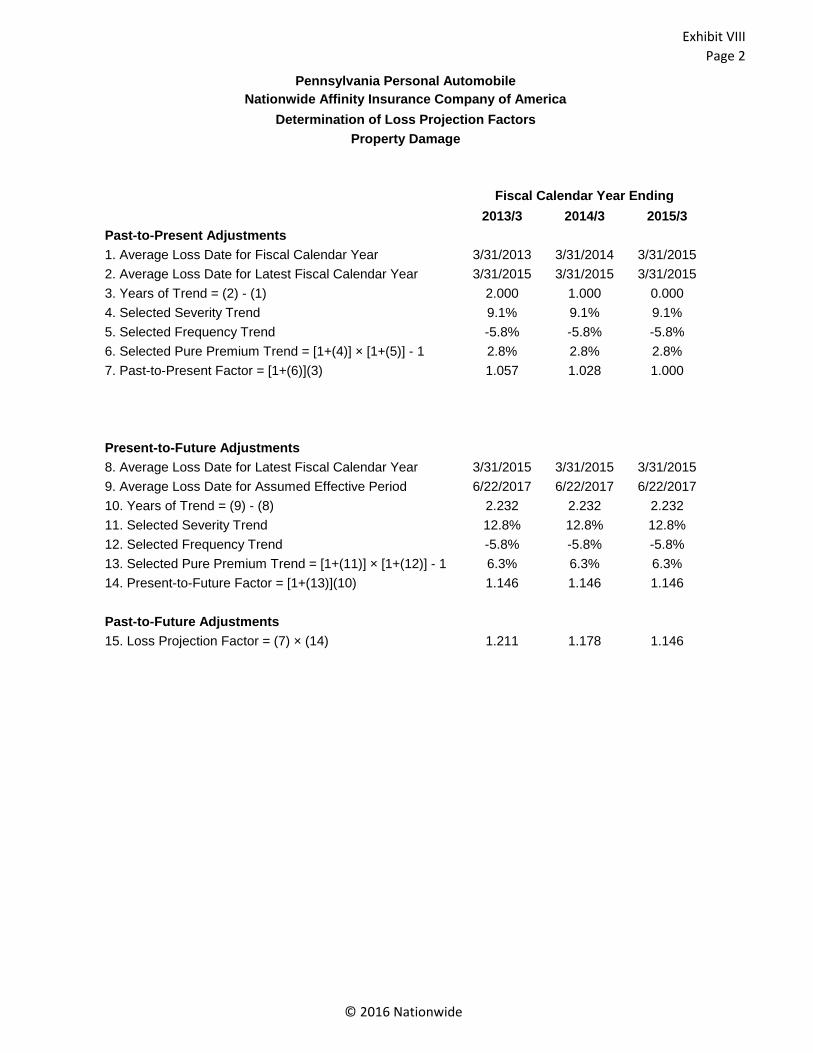
Exhibit VIIIPage 2
© 2016 Nationwide
Pennsylvania Personal AutomobileNationwide Affinity Insurance Company of America
Determination of Loss Projection FactorsProperty Damage
Fiscal Calendar Year Ending2013/3 2014/3 2015/3
Past-to-Present Adjustments1. Average Loss Date for Fiscal Calendar Year 3/31/2013 3/31/2014 3/31/20152. Average Loss Date for Latest Fiscal Calendar Year 3/31/2015 3/31/2015 3/31/20153. Years of Trend = (2) - (1) 2.000 1.000 0.0004. Selected Severity Trend 9.1% 9.1% 9.1%5. Selected Frequency Trend -5.8% -5.8% -5.8%6. Selected Pure Premium Trend = [1+(4)] × [1+(5)] - 1 2.8% 2.8% 2.8%7. Past-to-Present Factor = [1+(6)](3) 1.057 1.028 1.000
Present-to-Future Adjustments8. Average Loss Date for Latest Fiscal Calendar Year 3/31/2015 3/31/2015 3/31/20159. Average Loss Date for Assumed Effective Period 6/22/2017 6/22/2017 6/22/201710. Years of Trend = (9) - (8) 2.232 2.232 2.23211. Selected Severity Trend 12.8% 12.8% 12.8%12. Selected Frequency Trend -5.8% -5.8% -5.8%13. Selected Pure Premium Trend = [1+(11)] × [1+(12)] - 1 6.3% 6.3% 6.3%14. Present-to-Future Factor = [1+(13)](10) 1.146 1.146 1.146
Past-to-Future Adjustments15. Loss Projection Factor = (7) × (14) 1.211 1.178 1.146

Exhibit VIIIPage 3
© 2016 Nationwide
Pennsylvania Personal AutomobileNationwide Affinity Insurance Company of America
Determination of Loss Projection FactorsUninsured Motorists - Bodily Injury
Fiscal Calendar Year Ending2013/3 2014/3 2015/3
Past-to-Present Adjustments1. Average Loss Date for Fiscal Calendar Year 3/31/2013 3/31/2014 3/31/20152. Average Loss Date for Latest Fiscal Calendar Year 3/31/2015 3/31/2015 3/31/20153. Years of Trend = (2) - (1) 2.000 1.000 0.0004. Selected Severity Trend 6.2% 6.2% 6.2%5. Selected Frequency Trend 0.0% 0.0% 0.0%6. Selected Pure Premium Trend = [1+(4)] × [1+(5)] - 1 6.2% 6.2% 6.2%7. Past-to-Present Factor = [1+(6)](3) 1.128 1.062 1.000
Present-to-Future Adjustments8. Average Loss Date for Latest Fiscal Calendar Year 3/31/2015 3/31/2015 3/31/20159. Average Loss Date for Assumed Effective Period 6/22/2017 6/22/2017 6/22/201710. Years of Trend = (9) - (8) 2.232 2.232 2.23211. Selected Severity Trend 6.6% 6.6% 6.6%12. Selected Frequency Trend 2.5% 2.5% 2.5%13. Selected Pure Premium Trend = [1+(11)] × [1+(12)] - 1 9.3% 9.3% 9.3%14. Present-to-Future Factor = [1+(13)](10) 1.220 1.220 1.220
Past-to-Future Adjustments15. Loss Projection Factor = (7) × (14) 1.376 1.296 1.220

Exhibit VIIIPage 4
© 2016 Nationwide
Pennsylvania Personal AutomobileNationwide Affinity Insurance Company of America
Determination of Loss Projection FactorsUnderinsured Motorists - Bodily Injury
Fiscal Calendar Year Ending2013/3 2014/3 2015/3
Past-to-Present Adjustments1. Average Loss Date for Fiscal Calendar Year 3/31/2013 3/31/2014 3/31/20152. Average Loss Date for Latest Fiscal Calendar Year 3/31/2015 3/31/2015 3/31/20153. Years of Trend = (2) - (1) 2.000 1.000 0.0004. Selected Severity Trend 5.2% 5.2% 5.2%5. Selected Frequency Trend 2.7% 2.7% 2.7%6. Selected Pure Premium Trend = [1+(4)] × [1+(5)] - 1 8.0% 8.0% 8.0%7. Past-to-Present Factor = [1+(6)](3) 1.166 1.080 1.000
Present-to-Future Adjustments8. Average Loss Date for Latest Fiscal Calendar Year 3/31/2015 3/31/2015 3/31/20159. Average Loss Date for Assumed Effective Period 6/22/2017 6/22/2017 6/22/201710. Years of Trend = (9) - (8) 2.232 2.232 2.23211. Selected Severity Trend 5.2% 5.2% 5.2%12. Selected Frequency Trend 2.7% 2.7% 2.7%13. Selected Pure Premium Trend = [1+(11)] × [1+(12)] - 1 8.0% 8.0% 8.0%14. Present-to-Future Factor = [1+(13)](10) 1.187 1.187 1.187
Past-to-Future Adjustments15. Loss Projection Factor = (7) × (14) 1.384 1.282 1.187

Exhibit VIIIPage 5
© 2016 Nationwide
Pennsylvania Personal AutomobileNationwide Affinity Insurance Company of America
Determination of Loss Projection FactorsAccidental Death Benefits, Combined Loss Benefits, Funeral Benefits, Loss of Income
Benefits, Medical Benefits, Excess Medical Benefits
Fiscal Calendar Year Ending2013/3 2014/3 2015/3
Past-to-Present Adjustments1. Average Loss Date for Fiscal Calendar Year 3/31/2013 3/31/2014 3/31/20152. Average Loss Date for Latest Fiscal Calendar Year 3/31/2015 3/31/2015 3/31/20153. Years of Trend = (2) - (1) 2.000 1.000 0.0004. Selected Severity Trend -1.6% -1.6% -1.6%5. Selected Frequency Trend -4.7% -4.7% -4.7%6. Selected Pure Premium Trend = [1+(4)] × [1+(5)] - 1 -6.2% -6.2% -6.2%7. Past-to-Present Factor = [1+(6)](3) 0.880 0.938 1.000
Present-to-Future Adjustments8. Average Loss Date for Latest Fiscal Calendar Year 3/31/2015 3/31/2015 3/31/20159. Average Loss Date for Assumed Effective Period 6/22/2017 6/22/2017 6/22/201710. Years of Trend = (9) - (8) 2.232 2.232 2.23211. Selected Severity Trend -1.6% -1.6% -1.6%12. Selected Frequency Trend -1.1% -1.1% -1.1%13. Selected Pure Premium Trend = [1+(11)] × [1+(12)] - 1 -2.7% -2.7% -2.7%14. Present-to-Future Factor = [1+(13)](10) 0.941 0.941 0.941
Past-to-Future Adjustments15. Loss Projection Factor = (7) × (14) 0.828 0.883 0.941

Exhibit VIIIPage 6
© 2016 Nationwide
Pennsylvania Personal AutomobileNationwide Affinity Insurance Company of America
Determination of Loss Projection FactorsComprehensive
Fiscal Calendar Year Ending2013/3 2014/3 2015/3
Past-to-Present Adjustments1. Average Loss Date for Fiscal Calendar Year 3/31/2013 3/31/2014 3/31/20152. Average Loss Date for Latest Fiscal Calendar Year 3/31/2015 3/31/2015 3/31/20153. Years of Trend = (2) - (1) 2.000 1.000 0.0004. Selected Severity Trend 1.5% 1.5% 1.5%5. Selected Frequency Trend -1.1% -1.1% -1.1%6. Selected Pure Premium Trend = [1+(4)] × [1+(5)] - 1 0.4% 0.4% 0.4%7. Past-to-Present Factor = [1+(6)](3) 1.008 1.004 1.000
Present-to-Future Adjustments8. Average Loss Date for Latest Fiscal Calendar Year 3/31/2015 3/31/2015 3/31/20159. Average Loss Date for Assumed Effective Period 6/22/2017 6/22/2017 6/22/201710. Years of Trend = (9) - (8) 2.232 2.232 2.23211. Selected Severity Trend 2.0% 2.0% 2.0%12. Selected Frequency Trend -1.1% -1.1% -1.1%13. Selected Pure Premium Trend = [1+(11)] × [1+(12)] - 1 0.9% 0.9% 0.9%14. Present-to-Future Factor = [1+(13)](10) 1.020 1.020 1.020
Past-to-Future Adjustments15. Loss Projection Factor = (7) × (14) 1.028 1.024 1.020

Exhibit VIIIPage 7
© 2016 Nationwide
Pennsylvania Personal AutomobileNationwide Affinity Insurance Company of America
Determination of Loss Projection FactorsCollision
Fiscal Calendar Year Ending2013/3 2014/3 2015/3
Past-to-Present Adjustments1. Average Loss Date for Fiscal Calendar Year 3/31/2013 3/31/2014 3/31/20152. Average Loss Date for Latest Fiscal Calendar Year 3/31/2015 3/31/2015 3/31/20153. Years of Trend = (2) - (1) 2.000 1.000 0.0004. Selected Severity Trend 1.0% 1.0% 1.0%5. Selected Frequency Trend -1.6% -1.6% -1.6%6. Selected Pure Premium Trend = [1+(4)] × [1+(5)] - 1 -0.6% -0.6% -0.6%7. Past-to-Present Factor = [1+(6)](3) 0.988 0.994 1.000
Present-to-Future Adjustments8. Average Loss Date for Latest Fiscal Calendar Year 3/31/2015 3/31/2015 3/31/20159. Average Loss Date for Assumed Effective Period 6/22/2017 6/22/2017 6/22/201710. Years of Trend = (9) - (8) 2.232 2.232 2.23211. Selected Severity Trend 2.3% 2.3% 2.3%12. Selected Frequency Trend -1.3% -1.3% -1.3%13. Selected Pure Premium Trend = [1+(11)] × [1+(12)] - 1 1.0% 1.0% 1.0%14. Present-to-Future Factor = [1+(13)](10) 1.022 1.022 1.022
Past-to-Future Adjustments15. Loss Projection Factor = (7) × (14) 1.010 1.016 1.022

Exhibit VIIIPage 8
© 2016 Nationwide
Pennsylvania Personal AutomobileNationwide Affinity Insurance Company of America
Determination of Loss Projection FactorsLoss of Use
Fiscal Calendar Year Ending2013/3 2014/3 2015/3
Past-to-Present Adjustments1. Average Loss Date for Fiscal Calendar Year 3/31/2013 3/31/2014 3/31/20152. Average Loss Date for Latest Fiscal Calendar Year 3/31/2015 3/31/2015 3/31/20153. Years of Trend = (2) - (1) 2.000 1.000 0.0004. Selected Severity Trend 0.0% 0.0% 0.0%5. Selected Frequency Trend 0.0% 0.0% 0.0%6. Selected Pure Premium Trend = [1+(4)] × [1+(5)] - 1 0.0% 0.0% 0.0%7. Past-to-Present Factor = [1+(6)](3) 1.000 1.000 1.000
Present-to-Future Adjustments8. Average Loss Date for Latest Fiscal Calendar Year 3/31/2015 3/31/2015 3/31/20159. Average Loss Date for Assumed Effective Period 6/22/2017 6/22/2017 6/22/201710. Years of Trend = (9) - (8) 2.232 2.232 2.23211. Selected Severity Trend 0.0% 0.0% 0.0%12. Selected Frequency Trend 0.0% 0.0% 0.0%13. Selected Pure Premium Trend = [1+(11)] × [1+(12)] - 1 0.0% 0.0% 0.0%14. Present-to-Future Factor = [1+(13)](10) 1.000 1.000 1.000
Past-to-Future Adjustments15. Loss Projection Factor = (7) × (14) 1.000 1.000 1.000

Nationwide Mutual and Affiliated Insurance Companies
Financial Needs Model
Underwriting Profit Provision Support
Standard Auto – Liability & Physical Damage
The underwriting profit provisions for liability and physical damage coverages used in this filing’s rate level analysis were selected after reviewing the required underwriting profit provisions developed separately using an internal rate of return model that incorporates the estimated timing of premium receipts, loss payments, expense payments, and other underwriting components. This model simulates a single insurance transaction (Premium = $100.00) and its related assets flow and determines the required underwriting profit provision that would result in the desired rate of return on the surplus that supports the transaction. The underlying surplus supporting the transaction at any given point in time is a function of the insurance reserves being held. Also, if the cash balance is insufficient to offset the insurance liabilities less receivables, additional surplus is committed to fund these reserves. In addition to the historical payout patterns and expense provisions, the model reflects the following assumptions:
Liability Physical Damage Desired Rate of Return: 15.0 % 15.0 % Equity Allocated to Line of Business Using Premium to Surplus Ratio:
1.01 to 1.00
1.72 to 1.00
Reserve to Premium Ratio: 1.17 to 1.00 0.31 to 1.00 Investment Yield: 4.92 % 4.66 % Portion of Assets Available for Investments: 100.0 % 100.0 % Federal Tax Rate: 35.0 % 35.0 % Pages 3 and 6 of this exhibit display the cash flow resulting from these assumptions for liability and physical damage coverages respectively. The model derives an underwriting profit of $9.43 for liability coverages and an underwriting profit of $14.54 for physical damage coverages in order for these lines to achieve the desired rate of return. These underwriting profits are the sum of the net underwriting flows across all time periods. Pages 4 and 7 provide the model’s required assets (sum of reserve and surplus requirements) as well as the available assets (sum of receivables and cash balance from insurance operations) for liability and physical damage coverages respectively. If the available assets are not sufficient to offset the required assets, additional assets (from surplus) must be infused to support the transaction. Page 5 for liability coverages and Page 8 for physical damage coverages display the assets flows (negative values indicate flow to insurance operations while positive values indicate flow back to surplus). The total asset flow is then discounted at the desired rate of return, and the resulting sum of the discounted asset flow is $0.00. Thus, an underwriting profit provision of
© 2016 Nationwide
Exhibit IX Page 1

9.43 percent ($9.43/$100.00) is expected to achieve a 15.0 percent rate of return for liability coverages, and an underwriting profit provision of 14.54 percent ($14.54/$100.00) is expected to achieve a 15.0 percent rate of return for physical damage coverages. The following table summarizes the required underwriting profit provisions required to generate a 15.0 percent rate of return on surplus funds, the selected underwriting profit provisions used in this rate filing and the corresponding rate of return on surplus funds associated with the selected provisions:
Liability Physical Damage Required Underwriting Profit Provision 9.43% 14.54% Selected Underwriting Profit Provision 2.00% 3.50% Rate of Return – Selected Underwriting Profit Provision 7.56% 6.22%
© 2016 Nationwide
Exhibit IX Page 2
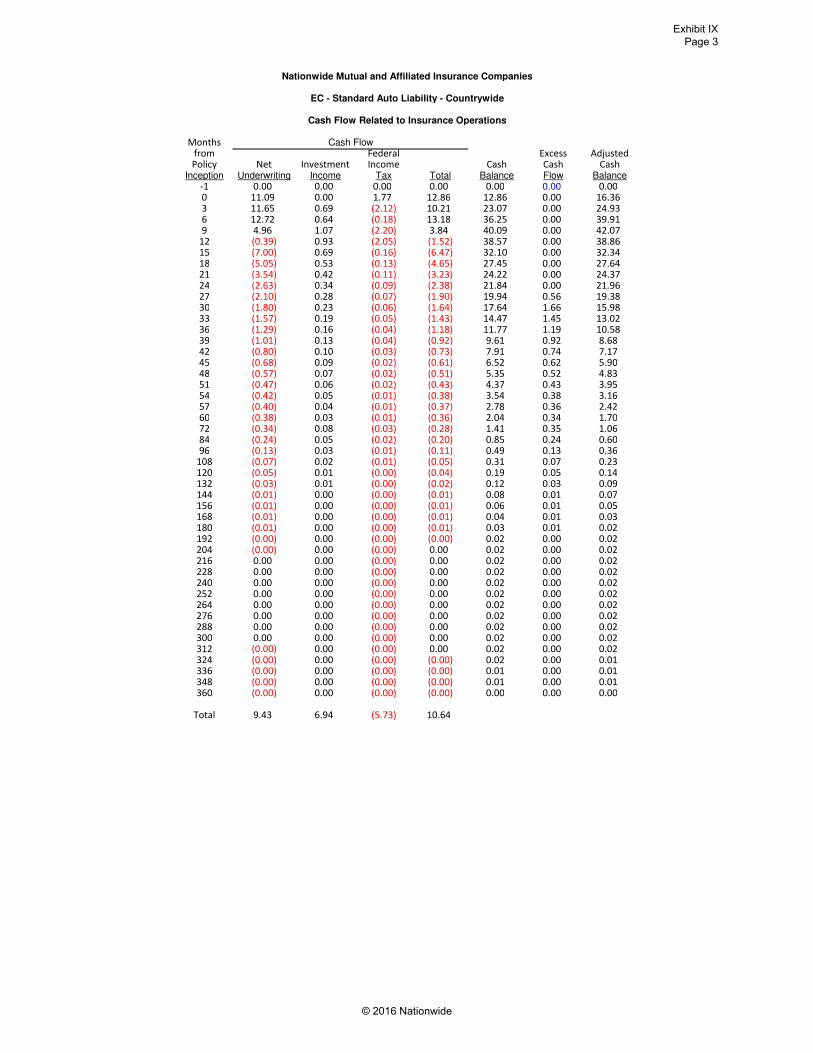
Nationwide Mutual and Affiliated Insurance Companies
EC - Standard Auto Liability - Countrywide
Cash Flow Related to Insurance Operations
Months Cash Flowfrom Federal Excess AdjustedPolicy Net Investment Income Cash Cash Cash
Inception Underwriting Income Tax Total Balance Flow Balance-1 0.00 0.00 0.00 0.00 0.00 0.00 0.000 11.09 0.00 1.77 12.86 12.86 0.00 16.363 11.65 0.69 (2.12) 10.21 23.07 0.00 24.936 12.72 0.64 (0.18) 13.18 36.25 0.00 39.919 4.96 1.07 (2.20) 3.84 40.09 0.00 42.07
12 (0.39) 0.93 (2.05) (1.52) 38.57 0.00 38.8615 (7.00) 0.69 (0.16) (6.47) 32.10 0.00 32.3418 (5.05) 0.53 (0.13) (4.65) 27.45 0.00 27.6421 (3.54) 0.42 (0.11) (3.23) 24.22 0.00 24.3724 (2.63) 0.34 (0.09) (2.38) 21.84 0.00 21.9627 (2.10) 0.28 (0.07) (1.90) 19.94 0.56 19.3830 (1.80) 0.23 (0.06) (1.64) 17.64 1.66 15.9833 (1.57) 0.19 (0.05) (1.43) 14.47 1.45 13.0236 (1.29) 0.16 (0.04) (1.18) 11.77 1.19 10.5839 (1.01) 0.13 (0.04) (0.92) 9.61 0.92 8.6842 (0.80) 0.10 (0.03) (0.73) 7.91 0.74 7.1745 (0.68) 0.09 (0.02) (0.61) 6.52 0.62 5.9048 (0.57) 0.07 (0.02) (0.51) 5.35 0.52 4.8351 (0.47) 0.06 (0.02) (0.43) 4.37 0.43 3.9554 (0.42) 0.05 (0.01) (0.38) 3.54 0.38 3.1657 (0.40) 0.04 (0.01) (0.37) 2.78 0.36 2.4260 (0.38) 0.03 (0.01) (0.36) 2.04 0.34 1.7072 (0.34) 0.08 (0.03) (0.28) 1.41 0.35 1.0684 (0.24) 0.05 (0.02) (0.20) 0.85 0.24 0.6096 (0.13) 0.03 (0.01) (0.11) 0.49 0.13 0.36
108 (0.07) 0.02 (0.01) (0.05) 0.31 0.07 0.23120 (0.05) 0.01 (0.00) (0.04) 0.19 0.05 0.14132 (0.03) 0.01 (0.00) (0.02) 0.12 0.03 0.09144 (0.01) 0.00 (0.00) (0.01) 0.08 0.01 0.07156 (0.01) 0.00 (0.00) (0.01) 0.06 0.01 0.05168 (0.01) 0.00 (0.00) (0.01) 0.04 0.01 0.03180 (0.01) 0.00 (0.00) (0.01) 0.03 0.01 0.02192 (0.00) 0.00 (0.00) (0.00) 0.02 0.00 0.02204 (0.00) 0.00 (0.00) 0.00 0.02 0.00 0.02216 0.00 0.00 (0.00) 0.00 0.02 0.00 0.02228 0.00 0.00 (0.00) 0.00 0.02 0.00 0.02240 0.00 0.00 (0.00) 0.00 0.02 0.00 0.02252 0.00 0.00 (0.00) 0.00 0.02 0.00 0.02264 0.00 0.00 (0.00) 0.00 0.02 0.00 0.02276 0.00 0.00 (0.00) 0.00 0.02 0.00 0.02288 0.00 0.00 (0.00) 0.00 0.02 0.00 0.02300 0.00 0.00 (0.00) 0.00 0.02 0.00 0.02312 (0.00) 0.00 (0.00) 0.00 0.02 0.00 0.02324 (0.00) 0.00 (0.00) (0.00) 0.02 0.00 0.01336 (0.00) 0.00 (0.00) (0.00) 0.01 0.00 0.01348 (0.00) 0.00 (0.00) (0.00) 0.01 0.00 0.01360 (0.00) 0.00 (0.00) (0.00) 0.00 0.00 0.00
Total 9.43 6.94 (5.73) 10.64
© 2016 Nationwide
Exhibit IX Page 3

MonthsfromPolicy
Inception-10369
1215182124273033363942454851545760728496
108120132144156168180192204216228240252264276288300312324336348360
Total
Nationwide Mutual and Affiliated Insurance Companies
EC - Standard Auto Liability - Countrywide
Assets Required to Support Insurance Operations
Required Assets Available Assets from OperationsUnearned Loss & Required Salvage & Required AssetsPremium LAE Required Additional Underlying Premium Subrogation Cash Prior toReserve Reserve Surplus Surplus Surplus Total Receivable Receivable Balance Infusion
0.00 0.00 0.00 0.00 0.00 0.00 0.00 0.00 0.00 0.0050.00 0.00 42.37 0.00 42.37 92.37 32.14 0.00 16.36 48.4925.00 11.28 30.75 0.00 30.75 67.03 12.21 0.36 24.93 37.4950.00 17.73 57.40 0.00 57.40 125.12 32.21 0.54 39.91 72.6525.00 24.65 42.07 0.00 42.07 91.72 12.21 0.73 42.07 55.010.00 31.51 26.71 0.00 26.71 58.22 0.07 0.92 38.86 39.850.00 24.32 20.61 0.00 20.61 44.92 (0.00) 0.72 32.34 33.050.00 19.12 16.20 0.00 16.20 35.32 (0.00) 0.56 27.64 28.200.00 15.47 13.11 0.00 13.11 28.59 (0.00) 0.46 24.37 24.830.00 12.77 10.82 0.00 10.82 23.60 (0.00) 0.38 21.96 22.350.00 10.61 8.99 0.00 8.99 19.60 (0.00) 0.32 19.38 19.700.00 8.75 7.42 0.00 7.42 16.17 (0.00) 0.27 15.98 16.250.00 7.13 6.04 0.00 6.04 13.17 (0.00) 0.22 13.02 13.240.00 5.79 4.91 0.00 4.91 10.70 (0.00) 0.17 10.58 10.760.00 4.75 4.03 0.00 4.03 8.78 (0.00) 0.14 8.68 8.830.00 3.92 3.33 0.00 3.33 7.25 (0.00) 0.12 7.17 7.290.00 3.23 2.73 0.00 2.73 5.96 (0.00) 0.10 5.90 5.990.00 2.64 2.24 0.00 2.24 4.88 (0.00) 0.08 4.83 4.910.00 2.16 1.83 0.00 1.83 3.99 (0.00) 0.07 3.95 4.010.00 1.73 1.47 0.00 1.47 3.20 (0.00) 0.06 3.16 3.220.00 1.33 1.12 0.00 1.12 2.45 (0.00) 0.05 2.42 2.460.00 0.94 0.79 0.00 0.79 1.73 (0.00) 0.04 1.70 1.740.00 0.59 0.50 0.00 0.50 1.08 (0.00) 0.03 1.06 1.090.00 0.34 0.29 0.00 0.29 0.62 (0.00) 0.02 0.60 0.630.00 0.20 0.17 0.00 0.17 0.38 (0.00) 0.02 0.36 0.380.00 0.13 0.11 0.00 0.11 0.25 (0.00) 0.01 0.23 0.250.00 0.08 0.07 0.00 0.07 0.15 (0.00) 0.01 0.14 0.150.00 0.05 0.04 0.00 0.04 0.09 (0.00) 0.01 0.09 0.100.00 0.04 0.03 0.00 0.03 0.07 (0.00) 0.01 0.07 0.070.00 0.03 0.03 0.00 0.03 0.06 (0.00) 0.00 0.05 0.060.00 0.02 0.02 0.00 0.02 0.04 (0.00) 0.00 0.03 0.040.00 0.01 0.01 0.00 0.01 0.02 (0.00) 0.00 0.02 0.020.00 0.01 0.01 0.00 0.01 0.02 (0.00) 0.00 0.02 0.020.00 0.01 0.01 0.00 0.01 0.02 (0.00) 0.00 0.02 0.020.00 0.01 0.01 0.00 0.01 0.02 (0.00) 0.00 0.02 0.020.00 0.01 0.01 0.00 0.01 0.02 (0.00) 0.00 0.02 0.020.00 0.01 0.01 0.00 0.01 0.02 (0.00) 0.00 0.02 0.020.00 0.01 0.01 0.00 0.01 0.02 (0.00) 0.00 0.02 0.020.00 0.01 0.01 0.00 0.01 0.02 (0.00) 0.00 0.02 0.020.00 0.01 0.01 0.00 0.01 0.02 (0.00) 0.00 0.02 0.020.00 0.01 0.01 0.00 0.01 0.02 (0.00) 0.00 0.02 0.020.00 0.01 0.01 0.00 0.01 0.02 (0.00) 0.00 0.02 0.020.00 0.01 0.01 0.00 0.01 0.02 (0.00) 0.00 0.02 0.020.00 0.01 0.01 0.00 0.01 0.01 (0.00) 0.00 0.01 0.010.00 0.00 0.00 0.00 0.00 0.01 (0.00) 0.00 0.01 0.010.00 0.00 0.00 0.00 0.00 0.01 (0.00) 0.00 0.01 0.010.00 0.00 0.00 0.00 0.00 0.00 (0.00) 0.00 0.00 0.00
© 2016 Nationwide
Exhibit IX Page 4

MonthsfromPolicy
Inception-10369
1215182124273033363942454851545760728496
108120132144156168180192204216228240252264276288300312324336348360
Total
Nationwide Mutual and Affiliated Insurance Companies
EC - Standard Auto Liability - Countrywide
Infused and Excess Asset Flows Resulting from Insurance Operations
Assets Required Infused Excess Total Discount DiscountedRequired Prior to Infused Asset Asset Asset Factor at AssetAssets Infusion Assets Flow Flow Flow 15.0% ROR Flow0.00 0.00 0.00 0.00 0.00 0.00 1.0117 0.00
92.37 48.49 43.88 (43.88) 0.00 (43.88) 1.0000 (43.88)67.03 37.49 29.54 14.34 0.00 14.34 0.9657 13.84
125.12 72.65 52.47 (22.93) 0.00 (22.93) 0.9325 (21.38)91.72 55.01 36.72 15.75 0.00 15.75 0.9005 14.1958.22 39.85 18.37 18.34 0.00 18.34 0.8696 15.9544.92 33.05 11.87 6.50 0.00 6.50 0.8397 5.4635.32 28.20 7.12 4.75 0.00 4.75 0.8109 3.8528.59 24.83 3.76 3.36 0.00 3.36 0.7830 2.6323.60 22.35 1.25 2.51 0.00 2.51 0.7561 1.9019.60 19.70 0.00 1.25 0.66 1.91 0.7302 1.4016.17 16.25 0.00 0.00 1.74 1.74 0.7051 1.2313.17 13.24 0.00 0.00 1.52 1.52 0.6809 1.0310.70 10.76 0.00 0.00 1.25 1.25 0.6575 0.828.78 8.83 0.00 0.00 0.97 0.97 0.6349 0.627.25 7.29 0.00 0.00 0.78 0.78 0.6131 0.485.96 5.99 0.00 0.00 0.65 0.65 0.5921 0.394.88 4.91 0.00 0.00 0.55 0.55 0.5718 0.313.99 4.01 0.00 0.00 0.45 0.45 0.5521 0.253.20 3.22 0.00 0.00 0.40 0.40 0.5332 0.212.45 2.46 0.00 0.00 0.37 0.37 0.5149 0.191.73 1.74 0.00 0.00 0.35 0.35 0.4972 0.181.08 1.09 0.00 0.00 0.35 0.35 0.4323 0.150.62 0.63 0.00 0.00 0.25 0.25 0.3759 0.090.38 0.38 0.00 0.00 0.13 0.13 0.3269 0.040.25 0.25 0.00 0.00 0.07 0.07 0.2843 0.020.15 0.15 0.00 0.00 0.05 0.05 0.2472 0.010.09 0.10 0.00 0.00 0.03 0.03 0.2149 0.010.07 0.07 0.00 0.00 0.01 0.01 0.1869 0.000.06 0.06 0.00 0.00 0.01 0.01 0.1625 0.000.04 0.04 0.00 0.00 0.01 0.01 0.1413 0.000.02 0.02 0.00 0.00 0.01 0.01 0.1229 0.000.02 0.02 0.00 0.00 0.00 0.00 0.1069 0.000.02 0.02 0.00 0.00 0.00 0.00 0.0929 0.000.02 0.02 0.00 0.00 0.00 0.00 0.0808 0.000.02 0.02 0.00 0.00 0.00 0.00 0.0703 0.000.02 0.02 0.00 0.00 0.00 0.00 0.0611 0.000.02 0.02 0.00 0.00 0.00 0.00 0.0531 0.000.02 0.02 0.00 0.00 0.00 0.00 0.0462 0.000.02 0.02 0.00 0.00 0.00 0.00 0.0402 0.000.02 0.02 0.00 0.00 0.00 0.00 0.0349 0.000.02 0.02 0.00 0.00 0.00 0.00 0.0304 0.000.02 0.02 0.00 0.00 0.00 0.00 0.0264 0.000.01 0.01 0.00 0.00 0.00 0.00 0.0230 0.000.01 0.01 0.00 0.00 0.00 0.00 0.0200 0.000.01 0.01 0.00 0.00 0.00 0.00 0.0174 0.000.00 0.00 0.00 0.00 0.00 0.00 0.0151 0.00
0.00 10.64 10.64 0.00
© 2016 Nationwide
Exhibit IX Page 5

Nationwide Mutual and Affiliated Insurance Companies
EC - Standard Auto Physical Damage - Countrywide
Cash Flow Related to Insurance Operations
Months Cash Flowfrom Federal Excess AdjustedPolicy Net Investment Income Cash Cash Cash
Inception Underwriting Income Tax Total Balance Flow Balance-1 0.00 0.00 0.00 0.00 0.00 0.00 0.000 11.04 0.00 1.85 12.89 12.89 0.00 16.393 6.44 1.25 (2.73) 4.96 17.85 0.00 19.626 7.17 0.84 (0.59) 7.42 25.27 0.00 28.799 1.10 1.40 (2.75) (0.25) 25.02 0.00 26.79
12 (1.61) 0.88 (2.47) (3.20) 21.82 0.00 21.8615 (5.39) 0.36 (0.10) (5.13) 16.70 2.57 14.1318 (2.32) 0.16 (0.04) (2.20) 11.90 5.55 6.3521 (1.07) 0.07 (0.02) (1.01) 5.32 2.53 2.7924 (0.53) 0.03 (0.01) (0.50) 2.29 1.17 1.1227 (0.17) 0.01 (0.00) (0.16) 0.95 0.40 0.5530 (0.04) 0.01 (0.00) (0.03) 0.52 0.11 0.4133 (0.02) 0.00 (0.00) (0.01) 0.39 0.06 0.3336 (0.01) 0.00 (0.00) (0.01) 0.32 0.04 0.2839 (0.01) 0.00 (0.00) (0.01) 0.28 0.03 0.2542 (0.00) 0.00 (0.00) (0.00) 0.25 0.02 0.2345 (0.01) 0.00 (0.00) (0.01) 0.22 0.03 0.2048 (0.00) 0.00 (0.00) (0.00) 0.19 0.02 0.1851 (0.00) 0.00 (0.00) 0.00 0.18 0.01 0.1754 (0.00) 0.00 (0.00) (0.00) 0.17 0.01 0.1657 (0.00) 0.00 (0.00) (0.00) 0.16 0.01 0.1560 (0.00) 0.00 (0.00) (0.00) 0.14 0.02 0.1372 (0.01) 0.01 (0.00) (0.00) 0.12 0.03 0.0984 (0.01) 0.00 (0.00) (0.00) 0.09 0.03 0.0696 (0.01) 0.00 (0.00) (0.00) 0.06 0.02 0.04
108 (0.00) 0.00 (0.00) (0.00) 0.03 0.01 0.02120 (0.00) 0.00 (0.00) (0.00) 0.02 0.01 0.01132 (0.00) 0.00 (0.00) (0.00) 0.01 0.01 0.01144 (0.00) 0.00 (0.00) (0.00) 0.01 0.00 0.00156 (0.00) 0.00 (0.00) (0.00) 0.00 0.00 0.00168 0.00 0.00 0.00 0.00 0.00 0.00 0.00180 0.00 0.00 0.00 0.00 0.00 0.00 0.00192 0.00 0.00 0.00 0.00 0.00 0.00 0.00204 0.00 0.00 0.00 0.00 0.00 0.00 0.00216 0.00 0.00 0.00 0.00 0.00 0.00 0.00228 0.00 0.00 0.00 0.00 0.00 0.00 0.00240 0.00 0.00 0.00 0.00 0.00 0.00 0.00252 0.00 0.00 0.00 0.00 0.00 0.00 0.00264 0.00 0.00 0.00 0.00 0.00 0.00 0.00276 0.00 0.00 0.00 0.00 0.00 0.00 0.00288 0.00 0.00 0.00 0.00 0.00 0.00 0.00300 0.00 0.00 0.00 0.00 0.00 0.00 0.00312 0.00 0.00 0.00 0.00 0.00 0.00 0.00324 0.00 0.00 0.00 0.00 0.00 0.00 0.00336 (0.00) 0.00 (0.00) (0.00) 0.00 0.00 0.00348 (0.00) 0.00 (0.00) (0.00) 0.00 0.00 0.00360 0.00 0.00 (0.00) 0.00 0.00 0.00 0.00
Total 14.54 5.06 (6.86) 12.74
© 2016 Nationwide
Exhibit IX Page 6

MonthsfromPolicy
Inception-10369
1215182124273033363942454851545760728496
108120132144156168180192204216228240252264276288300312324336348360
Total
Nationwide Mutual and Affiliated Insurance Companies
EC - Standard Auto Physical Damage - Countrywide
Assets Required to Support Insurance Operations
Required Assets Available Assets from OperationsUnearned Loss & Required Salvage & Required AssetsPremium LAE Required Additional Underlying Premium Subrogation Cash Prior toReserve Reserve Surplus Surplus Surplus Total Receivable Receivable Balance Infusion
0.00 0.00 0.00 0.00 0.00 0.00 0.00 0.00 0.00 0.0050.00 0.00 94.34 0.00 94.34 144.34 32.14 0.00 16.39 48.5325.00 5.60 57.74 0.00 57.74 88.34 12.21 1.19 19.62 33.0250.00 5.25 104.25 0.00 104.25 159.50 32.20 1.40 28.79 62.3925.00 7.15 60.65 0.00 60.65 92.80 12.21 1.72 26.79 40.720.00 11.58 21.84 0.00 21.84 33.42 0.07 1.98 21.86 23.910.00 5.24 9.89 0.00 9.89 15.14 (0.00) 1.04 14.13 15.170.00 2.36 4.45 0.00 4.45 6.81 (0.00) 0.48 6.35 6.820.00 1.05 1.97 0.00 1.97 3.02 (0.00) 0.23 2.79 3.030.00 0.44 0.83 0.00 0.83 1.26 (0.00) 0.15 1.12 1.270.00 0.23 0.44 0.00 0.44 0.67 (0.00) 0.12 0.55 0.670.00 0.18 0.33 0.00 0.33 0.51 (0.00) 0.10 0.41 0.510.00 0.15 0.27 0.00 0.27 0.42 (0.00) 0.09 0.33 0.420.00 0.12 0.23 0.00 0.23 0.36 (0.00) 0.08 0.28 0.360.00 0.11 0.21 0.00 0.21 0.32 (0.00) 0.07 0.25 0.320.00 0.10 0.19 0.00 0.19 0.29 (0.00) 0.07 0.23 0.290.00 0.09 0.17 0.00 0.17 0.25 (0.00) 0.06 0.20 0.250.00 0.08 0.15 0.00 0.15 0.23 (0.00) 0.05 0.18 0.230.00 0.08 0.14 0.00 0.14 0.22 (0.00) 0.05 0.17 0.220.00 0.07 0.14 0.00 0.14 0.21 (0.00) 0.05 0.16 0.210.00 0.07 0.12 0.00 0.12 0.19 (0.00) 0.04 0.15 0.190.00 0.06 0.11 0.00 0.11 0.16 (0.00) 0.04 0.13 0.160.00 0.04 0.08 0.00 0.08 0.13 (0.00) 0.03 0.09 0.130.00 0.03 0.06 0.00 0.06 0.09 (0.00) 0.03 0.06 0.090.00 0.02 0.04 0.00 0.04 0.06 (0.00) 0.02 0.04 0.060.00 0.01 0.02 0.00 0.02 0.04 (0.00) 0.02 0.02 0.040.00 0.01 0.02 0.00 0.02 0.02 (0.00) 0.01 0.01 0.020.00 0.01 0.01 0.00 0.01 0.02 (0.00) 0.01 0.01 0.020.00 0.00 0.01 0.00 0.01 0.01 (0.00) 0.01 0.00 0.010.00 0.00 0.00 0.00 0.01 0.01 (0.00) 0.01 0.00 0.010.00 0.00 0.00 0.00 0.01 0.01 (0.00) 0.01 0.00 0.010.00 0.00 0.00 0.00 0.01 0.01 (0.00) 0.01 0.00 0.010.00 0.00 0.00 0.00 0.00 0.00 (0.00) 0.00 0.00 0.000.00 0.00 0.00 0.00 0.00 0.00 (0.00) 0.00 0.00 0.000.00 0.00 0.00 0.00 0.00 0.00 (0.00) 0.00 0.00 0.000.00 0.00 0.00 0.00 0.00 0.00 (0.00) 0.00 0.00 0.000.00 0.00 0.00 0.00 0.00 0.00 (0.00) 0.00 0.00 0.000.00 0.00 0.00 0.00 0.00 0.00 (0.00) 0.00 0.00 0.000.00 0.00 0.00 0.00 0.00 0.00 (0.00) 0.00 0.00 0.000.00 0.00 0.00 0.00 0.00 0.00 (0.00) 0.00 0.00 0.000.00 0.00 0.00 0.00 0.00 0.00 (0.00) 0.00 0.00 0.000.00 0.00 0.00 0.00 0.00 0.00 (0.00) 0.00 0.00 0.000.00 0.00 0.00 0.00 0.00 0.00 (0.00) 0.00 0.00 0.000.00 0.00 0.00 0.00 0.00 0.00 (0.00) 0.00 0.00 0.000.00 0.00 0.00 0.00 0.00 0.00 (0.00) 0.00 0.00 0.000.00 0.00 0.00 0.00 0.00 0.00 (0.00) 0.00 0.00 0.000.00 0.00 0.00 0.00 0.00 0.00 (0.00) 0.00 0.00 (0.00)
© 2016 Nationwide
Exhibit IX Page 7

MonthsfromPolicy
Inception-10369
1215182124273033363942454851545760728496
108120132144156168180192204216228240252264276288300312324336348360
Total
Nationwide Mutual and Affiliated Insurance Companies
EC - Standard Auto Physical Damage - Countrywide
Infused and Excess Asset Flows Resulting from Insurance Operations
Assets Required Infused Excess Total Discount DiscountedRequired Prior to Infused Asset Asset Asset Factor at AssetAssets Infusion Assets Flow Flow Flow 15.0% ROR Flow0.00 0.00 0.00 0.00 0.00 0.00 1.0117 0.00
144.34 48.53 95.81 (95.81) 0.00 (95.81) 1.0000 (95.81)88.34 33.02 55.32 40.48 0.00 40.48 0.9657 39.09
159.50 62.39 97.11 (41.78) 0.00 (41.78) 0.9325 (38.96)92.80 40.72 52.08 45.02 0.00 45.02 0.9005 40.5433.42 23.91 9.50 42.58 0.00 42.58 0.8696 37.0315.14 15.17 0.00 9.50 2.60 12.10 0.8397 10.166.81 6.82 0.00 0.00 5.57 5.57 0.8109 4.513.02 3.03 0.00 0.00 2.53 2.53 0.7830 1.981.26 1.27 0.00 0.00 1.17 1.17 0.7561 0.890.67 0.67 0.00 0.00 0.40 0.40 0.7302 0.290.51 0.51 0.00 0.00 0.11 0.11 0.7051 0.080.42 0.42 0.00 0.00 0.06 0.06 0.6809 0.040.36 0.36 0.00 0.00 0.04 0.04 0.6575 0.030.32 0.32 0.00 0.00 0.03 0.03 0.6349 0.020.29 0.29 0.00 0.00 0.02 0.02 0.6131 0.010.25 0.25 0.00 0.00 0.03 0.03 0.5921 0.020.23 0.23 0.00 0.00 0.02 0.02 0.5718 0.010.22 0.22 0.00 0.00 0.01 0.01 0.5521 0.000.21 0.21 0.00 0.00 0.01 0.01 0.5332 0.000.19 0.19 0.00 0.00 0.01 0.01 0.5149 0.010.16 0.16 0.00 0.00 0.02 0.02 0.4972 0.010.13 0.13 0.00 0.00 0.03 0.03 0.4323 0.010.09 0.09 0.00 0.00 0.03 0.03 0.3759 0.010.06 0.06 0.00 0.00 0.02 0.02 0.3269 0.010.04 0.04 0.00 0.00 0.01 0.01 0.2843 0.000.02 0.02 0.00 0.00 0.01 0.01 0.2472 0.000.02 0.02 0.00 0.00 0.01 0.01 0.2149 0.000.01 0.01 0.00 0.00 0.00 0.00 0.1869 0.000.01 0.01 0.00 0.00 0.00 0.00 0.1625 0.000.01 0.01 0.00 0.00 0.00 0.00 0.1413 0.000.01 0.01 0.00 0.00 0.00 0.00 0.1229 0.000.00 0.00 0.00 0.00 0.00 0.00 0.1069 0.000.00 0.00 0.00 0.00 0.00 0.00 0.0929 0.000.00 0.00 0.00 0.00 0.00 0.00 0.0808 0.000.00 0.00 0.00 0.00 0.00 0.00 0.0703 0.000.00 0.00 0.00 0.00 0.00 0.00 0.0611 0.000.00 0.00 0.00 0.00 0.00 0.00 0.0531 0.000.00 0.00 0.00 0.00 0.00 0.00 0.0462 0.000.00 0.00 0.00 0.00 0.00 0.00 0.0402 0.000.00 0.00 0.00 0.00 0.00 0.00 0.0349 0.000.00 0.00 0.00 0.00 0.00 0.00 0.0304 0.000.00 0.00 0.00 0.00 0.00 0.00 0.0264 0.000.00 0.00 0.00 0.00 0.00 0.00 0.0230 0.000.00 0.00 0.00 0.00 0.00 0.00 0.0200 0.000.00 0.00 0.00 0.00 0.00 0.00 0.0174 0.000.00 (0.00) 0.00 (0.00) 0.00 (0.00) 0.0151 (0.00)
(0.00) 12.74 12.74 (0.00)
© 2016 Nationwide
Exhibit IX Page 8

Exhibit XPage 1
© 2016 Nationwide
Pennsylvania Personal AutomobileNationwide Affinity Insurance Company of America
Determination of Trended Permissible Loss and ALAE RatioBodily Injury
Permissible Loss and DCC Expense Ratio Underlying Current Rates1. Variable Expense Ratio 13.5%2. Underwriting Profit Provision -0.8%3. Fixed Expense Ratio 24.3%4. Permissible Loss and DCC Expense Ratio = 100% - (1) - (2) - (3) 63.0%
Trend5. Selected Prospective Loss Trend 8.4%6. Selected Prospective Premium Trend -3.7%7. Average Earned Date Underlying Proposed Rates 6/22/20178. Average Earned Date Underlying Current Rates 12/21/20169. Years of Trend = (7) - (8) 0.5010. Trend Factor = {[1+(5)] ÷ [1+(6)]} (9) 1.061
Trended Permissible Loss and DCC Expense Ratio11. Trended Permissible Loss and DCC Expense Ratio = (4) × (10) 66.8%12. Adjustment for Coverage Change 1.000013. Adjustment for Rate Inadequacy 1.000014. Adjusted Trended Permissible Loss and DCC Expense Ratio = (11) × (12) × (13) 66.8%

Exhibit XPage 2
© 2016 Nationwide
Pennsylvania Personal AutomobileNationwide Affinity Insurance Company of America
Determination of Trended Permissible Loss and ALAE RatioProperty Damage
Permissible Loss and DCC Expense Ratio Underlying Current Rates1. Variable Expense Ratio 13.5%2. Underwriting Profit Provision -0.8%3. Fixed Expense Ratio 24.3%4. Permissible Loss and DCC Expense Ratio = 100% - (1) - (2) - (3) 63.0%
Trend5. Selected Prospective Loss Trend 6.3%6. Selected Prospective Premium Trend -2.9%7. Average Earned Date Underlying Proposed Rates 6/22/20178. Average Earned Date Underlying Current Rates 12/21/20169. Years of Trend = (7) - (8) 0.5010. Trend Factor = {[1+(5)] ÷ [1+(6)]} (9) 1.046
Trended Permissible Loss and DCC Expense Ratio11. Trended Permissible Loss and DCC Expense Ratio = (4) × (10) 65.9%12. Adjustment for Coverage Change 1.000013. Adjustment for Rate Inadequacy 1.000014. Adjusted Trended Permissible Loss and DCC Expense Ratio = (11) × (12) × (13) 65.9%

Exhibit XPage 3
© 2016 Nationwide
Pennsylvania Personal AutomobileNationwide Affinity Insurance Company of America
Determination of Trended Permissible Loss and ALAE RatioUninsured Motorists - Bodily Injury
Permissible Loss and DCC Expense Ratio Underlying Current Rates1. Variable Expense Ratio 13.5%2. Underwriting Profit Provision -0.8%3. Fixed Expense Ratio 24.3%4. Permissible Loss and DCC Expense Ratio = 100% - (1) - (2) - (3) 63.0%
Trend5. Selected Prospective Loss Trend 9.3%6. Selected Prospective Premium Trend -3.4%7. Average Earned Date Underlying Proposed Rates 6/22/20178. Average Earned Date Underlying Current Rates 12/21/20169. Years of Trend = (7) - (8) 0.5010. Trend Factor = {[1+(5)] ÷ [1+(6)]} (9) 1.064
Trended Permissible Loss and DCC Expense Ratio11. Trended Permissible Loss and DCC Expense Ratio = (4) × (10) 67.0%12. Adjustment for Coverage Change 1.000013. Adjustment for Rate Inadequacy 1.000014. Adjusted Trended Permissible Loss and DCC Expense Ratio = (11) × (12) × (13) 67.0%

Exhibit XPage 4
© 2016 Nationwide
Pennsylvania Personal AutomobileNationwide Affinity Insurance Company of America
Determination of Trended Permissible Loss and ALAE RatioUnderinsured Motorists - Bodily Injury
Permissible Loss and DCC Expense Ratio Underlying Current Rates1. Variable Expense Ratio 13.5%2. Underwriting Profit Provision -0.8%3. Fixed Expense Ratio 24.3%4. Permissible Loss and DCC Expense Ratio = 100% - (1) - (2) - (3) 63.0%
Trend5. Selected Prospective Loss Trend 8.0%6. Selected Prospective Premium Trend -1.2%7. Average Earned Date Underlying Proposed Rates 6/22/20178. Average Earned Date Underlying Current Rates 12/21/20169. Years of Trend = (7) - (8) 0.5010. Trend Factor = {[1+(5)] ÷ [1+(6)]} (9) 1.046
Trended Permissible Loss and DCC Expense Ratio11. Trended Permissible Loss and DCC Expense Ratio = (4) × (10) 65.9%12. Adjustment for Coverage Change 1.000013. Adjustment for Rate Inadequacy 1.000014. Adjusted Trended Permissible Loss and DCC Expense Ratio = (11) × (12) × (13) 65.9%

Exhibit XPage 5
© 2016 Nationwide
Pennsylvania Personal AutomobileNationwide Affinity Insurance Company of America
Determination of Trended Permissible Loss and ALAE RatioAccidental Death Benefits, Combined Loss Benefits, Funeral Benefits, Loss of Income Benefits, Medical
Benefits, Excess Medical Benefits
Permissible Loss and DCC Expense Ratio Underlying Current Rates1. Variable Expense Ratio 13.5%2. Underwriting Profit Provision -0.8%3. Fixed Expense Ratio 24.3%4. Permissible Loss and DCC Expense Ratio = 100% - (1) - (2) - (3) 63.0%
Trend5. Selected Prospective Loss Trend -2.7%6. Selected Prospective Premium Trend -5.4%7. Average Earned Date Underlying Proposed Rates 6/22/20178. Average Earned Date Underlying Current Rates 12/21/20169. Years of Trend = (7) - (8) 0.5010. Trend Factor = {[1+(5)] ÷ [1+(6)]} (9) 1.014
Trended Permissible Loss and DCC Expense Ratio11. Trended Permissible Loss and DCC Expense Ratio = (4) × (10) 63.9%12. Adjustment for Coverage Change 1.000013. Adjustment for Rate Inadequacy 1.000014. Adjusted Trended Permissible Loss and DCC Expense Ratio = (11) × (12) × (13) 63.9%
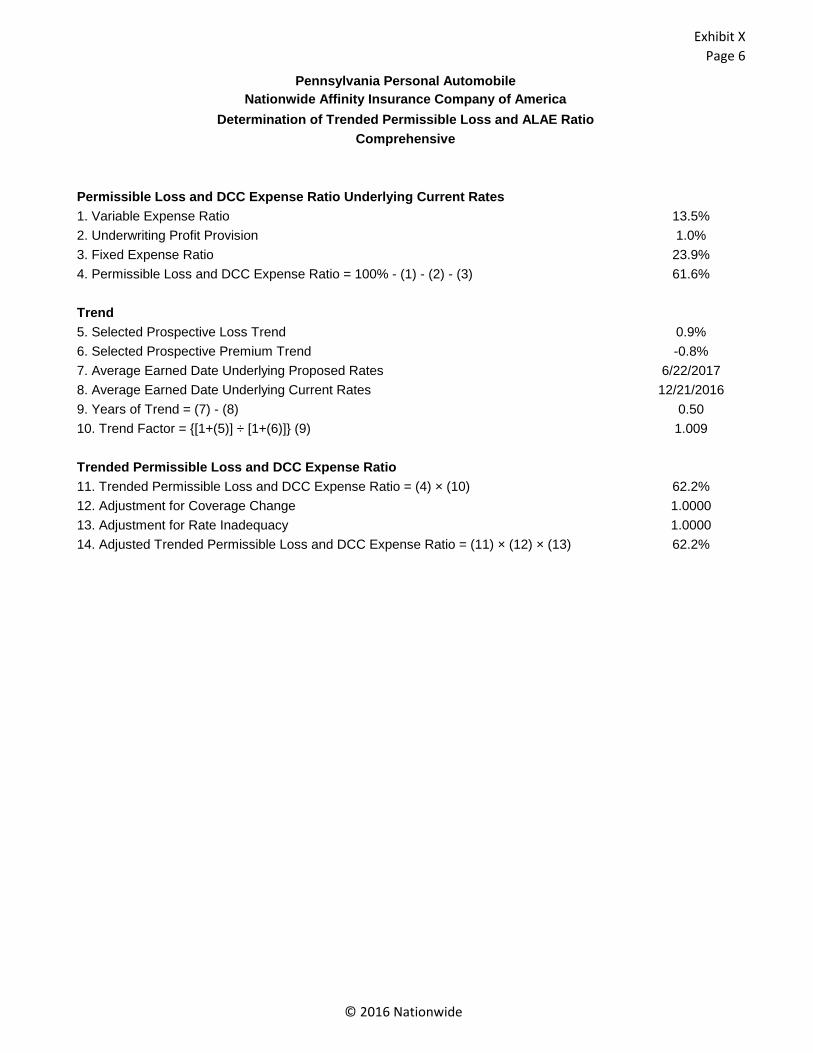
Exhibit XPage 6
© 2016 Nationwide
Pennsylvania Personal AutomobileNationwide Affinity Insurance Company of America
Determination of Trended Permissible Loss and ALAE RatioComprehensive
Permissible Loss and DCC Expense Ratio Underlying Current Rates1. Variable Expense Ratio 13.5%2. Underwriting Profit Provision 1.0%3. Fixed Expense Ratio 23.9%4. Permissible Loss and DCC Expense Ratio = 100% - (1) - (2) - (3) 61.6%
Trend5. Selected Prospective Loss Trend 0.9%6. Selected Prospective Premium Trend -0.8%7. Average Earned Date Underlying Proposed Rates 6/22/20178. Average Earned Date Underlying Current Rates 12/21/20169. Years of Trend = (7) - (8) 0.5010. Trend Factor = {[1+(5)] ÷ [1+(6)]} (9) 1.009
Trended Permissible Loss and DCC Expense Ratio11. Trended Permissible Loss and DCC Expense Ratio = (4) × (10) 62.2%12. Adjustment for Coverage Change 1.000013. Adjustment for Rate Inadequacy 1.000014. Adjusted Trended Permissible Loss and DCC Expense Ratio = (11) × (12) × (13) 62.2%

Exhibit XPage 7
© 2016 Nationwide
Pennsylvania Personal AutomobileNationwide Affinity Insurance Company of America
Determination of Trended Permissible Loss and ALAE RatioCollision
Permissible Loss and DCC Expense Ratio Underlying Current Rates1. Variable Expense Ratio 13.5%2. Underwriting Profit Provision 1.0%3. Fixed Expense Ratio 23.9%4. Permissible Loss and DCC Expense Ratio = 100% - (1) - (2) - (3) 61.6%
Trend5. Selected Prospective Loss Trend 1.0%6. Selected Prospective Premium Trend -0.9%7. Average Earned Date Underlying Proposed Rates 6/22/20178. Average Earned Date Underlying Current Rates 12/21/20169. Years of Trend = (7) - (8) 0.5010. Trend Factor = {[1+(5)] ÷ [1+(6)]} (9) 1.010
Trended Permissible Loss and DCC Expense Ratio11. Trended Permissible Loss and DCC Expense Ratio = (4) × (10) 62.2%12. Adjustment for Coverage Change 1.000013. Adjustment for Rate Inadequacy 1.000014. Adjusted Trended Permissible Loss and DCC Expense Ratio = (11) × (12) × (13) 62.2%

Exhibit XPage 8
© 2016 Nationwide
Pennsylvania Personal AutomobileNationwide Affinity Insurance Company of America
Determination of Trended Permissible Loss and ALAE RatioLoss of Use
Permissible Loss and DCC Expense Ratio Underlying Current Rates1. Variable Expense Ratio 13.5%2. Underwriting Profit Provision 1.0%3. Fixed Expense Ratio 23.9%4. Permissible Loss and DCC Expense Ratio = 100% - (1) - (2) - (3) 61.6%
Trend5. Selected Prospective Loss Trend 0.0%6. Selected Prospective Premium Trend -0.7%7. Average Earned Date Underlying Proposed Rates 6/22/20178. Average Earned Date Underlying Current Rates 12/21/20169. Years of Trend = (7) - (8) 0.5010. Trend Factor = {[1+(5)] ÷ [1+(6)]} (9) 1.004
Trended Permissible Loss and DCC Expense Ratio11. Trended Permissible Loss and DCC Expense Ratio = (4) × (10) 61.8%12. Adjustment for Coverage Change 1.000013. Adjustment for Rate Inadequacy 1.000014. Adjusted Trended Permissible Loss and DCC Expense Ratio = (11) × (12) × (13) 61.8%

Exhibit XIPage 1
© 2016 Nationwide
Pennsylvania Private Passenger AutomobileNationwide Affinity Insurance Company of America
Current and Revised Territory Base RatesEffective 12/22/16
BIBodily Injury
TerrIndicated Change
Internal Change
Current Rate
Revised Rate
Base Rate
ChangeTotal
Change1 9.6% 0.0% 229.00 251.00 9.6% 9.6%2 9.6% 0.0% 238.10 261.00 9.6% 9.6%3 9.6% 0.0% 245.40 269.00 9.6% 9.6%4 9.6% 0.0% 249.20 273.10 9.6% 9.6%5 9.6% 0.0% 256.80 281.50 9.6% 9.6%6 9.6% 0.0% 258.70 283.50 9.6% 9.6%7 9.6% 0.0% 260.80 285.80 9.6% 9.6%8 9.6% 0.0% 264.40 289.80 9.6% 9.6%9 9.6% 0.0% 266.00 291.50 9.6% 9.6%
10 9.6% 0.0% 268.20 293.90 9.6% 9.6%11 9.6% 0.0% 286.90 314.40 9.6% 9.6%12 9.6% 0.0% 288.40 316.10 9.6% 9.6%13 9.6% 0.0% 297.60 326.20 9.6% 9.6%14 9.6% 0.0% 335.10 367.30 9.6% 9.6%15 9.6% 0.0% 353.60 387.50 9.6% 9.6%16 9.6% 0.0% 355.60 389.70 9.6% 9.6%17 9.6% 0.0% 401.90 440.50 9.6% 9.6%18 9.6% 0.0% 431.80 473.30 9.6% 9.6%19 9.6% 0.0% 444.90 487.60 9.6% 9.6%20 9.6% 0.0% 545.50 597.90 9.6% 9.6%21 9.6% 0.0% 706.10 773.90 9.6% 9.6%22 9.6% 0.0% 720.10 789.20 9.6% 9.6%23 9.6% 0.0% 824.50 903.70 9.6% 9.6%24 9.6% 0.0% 856.30 938.50 9.6% 9.6%25 9.6% 0.0% 884.50 969.40 9.6% 9.6%
999 9.6% 0.0% 334.20 366.30 9.6% 9.6%
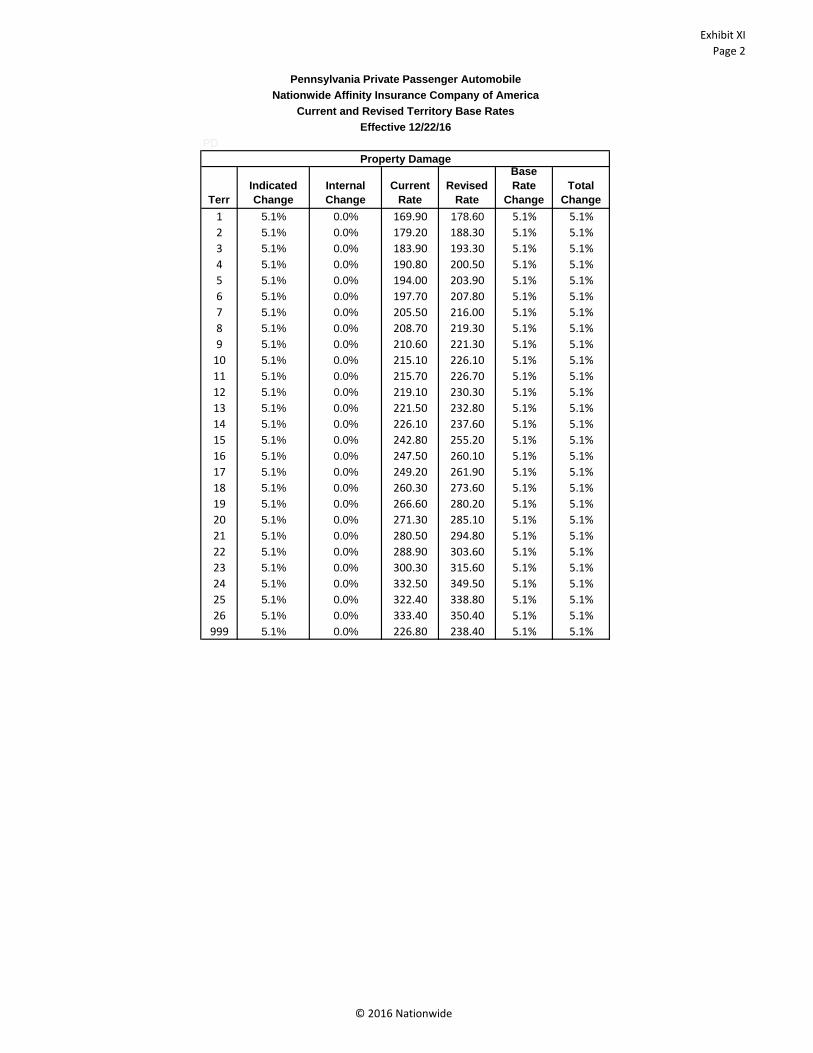
Exhibit XIPage 2
© 2016 Nationwide
Effective 12/22/16PD
Property Damage
TerrIndicated Change
Internal Change
Current Rate
Revised Rate
Base Rate
ChangeTotal
Change1 5.1% 0.0% 169.90 178.60 5.1% 5.1%2 5.1% 0.0% 179.20 188.30 5.1% 5.1%3 5.1% 0.0% 183.90 193.30 5.1% 5.1%4 5.1% 0.0% 190.80 200.50 5.1% 5.1%5 5.1% 0.0% 194.00 203.90 5.1% 5.1%6 5.1% 0.0% 197.70 207.80 5.1% 5.1%7 5.1% 0.0% 205.50 216.00 5.1% 5.1%8 5.1% 0.0% 208.70 219.30 5.1% 5.1%9 5.1% 0.0% 210.60 221.30 5.1% 5.1%
10 5.1% 0.0% 215.10 226.10 5.1% 5.1%11 5.1% 0.0% 215.70 226.70 5.1% 5.1%12 5.1% 0.0% 219.10 230.30 5.1% 5.1%13 5.1% 0.0% 221.50 232.80 5.1% 5.1%14 5.1% 0.0% 226.10 237.60 5.1% 5.1%15 5.1% 0.0% 242.80 255.20 5.1% 5.1%16 5.1% 0.0% 247.50 260.10 5.1% 5.1%17 5.1% 0.0% 249.20 261.90 5.1% 5.1%18 5.1% 0.0% 260.30 273.60 5.1% 5.1%19 5.1% 0.0% 266.60 280.20 5.1% 5.1%20 5.1% 0.0% 271.30 285.10 5.1% 5.1%21 5.1% 0.0% 280.50 294.80 5.1% 5.1%22 5.1% 0.0% 288.90 303.60 5.1% 5.1%23 5.1% 0.0% 300.30 315.60 5.1% 5.1%24 5.1% 0.0% 332.50 349.50 5.1% 5.1%25 5.1% 0.0% 322.40 338.80 5.1% 5.1%26 5.1% 0.0% 333.40 350.40 5.1% 5.1%
999 5.1% 0.0% 226.80 238.40 5.1% 5.1%
Current and Revised Territory Base RatesNationwide Affinity Insurance Company of America
Pennsylvania Private Passenger Automobile

Exhibit XIPage 3
© 2016 Nationwide
Effective 12/22/16FPB
Medical Benefits
TerrIndicated Change
Internal Change
Current Rate
Revised Rate
Base Rate
ChangeTotal
Change1 3.8% 0.0% 287.40 298.30 3.8% 3.8%2 3.8% 0.0% 309.70 321.50 3.8% 3.8%3 3.8% 0.0% 357.10 370.70 3.8% 3.8%4 3.8% 0.0% 374.70 388.90 3.8% 3.8%5 3.8% 0.0% 379.60 394.00 3.8% 3.8%6 3.8% 0.0% 384.50 399.10 3.8% 3.8%7 3.8% 0.0% 414.10 429.80 3.8% 3.8%8 3.8% 0.0% 416.60 432.40 3.8% 3.8%9 3.8% 0.0% 435.10 451.60 3.8% 3.8%
10 3.8% 0.0% 431.00 447.40 3.8% 3.8%11 3.8% 0.0% 441.50 458.30 3.8% 3.8%12 3.8% 0.0% 444.30 461.20 3.8% 3.8%13 3.8% 0.0% 471.40 489.30 3.8% 3.8%14 3.8% 0.0% 488.50 507.10 3.8% 3.8%15 3.8% 0.0% 564.50 586.00 3.8% 3.8%16 3.8% 0.0% 601.20 624.00 3.8% 3.8%17 3.8% 0.0% 575.10 597.00 3.8% 3.8%18 3.8% 0.0% 657.70 682.70 3.8% 3.8%19 3.8% 0.0% 650.90 675.60 3.8% 3.8%20 3.8% 0.0% 688.60 714.80 3.8% 3.8%21 3.8% 0.0% 758.30 787.10 3.8% 3.8%22 3.8% 0.0% 1,216.10 1,262.30 3.8% 3.8%23 3.8% 0.0% 1,415.50 1,469.30 3.8% 3.8%24 3.8% 0.0% 1,423.30 1,477.40 3.8% 3.8%25 3.8% 0.0% 1,483.00 1,539.40 3.8% 3.8%
999 3.8% 0.0% 487.90 506.40 3.8% 3.8%
Current and Revised Territory Base RatesNationwide Affinity Insurance Company of America
Pennsylvania Private Passenger Automobile
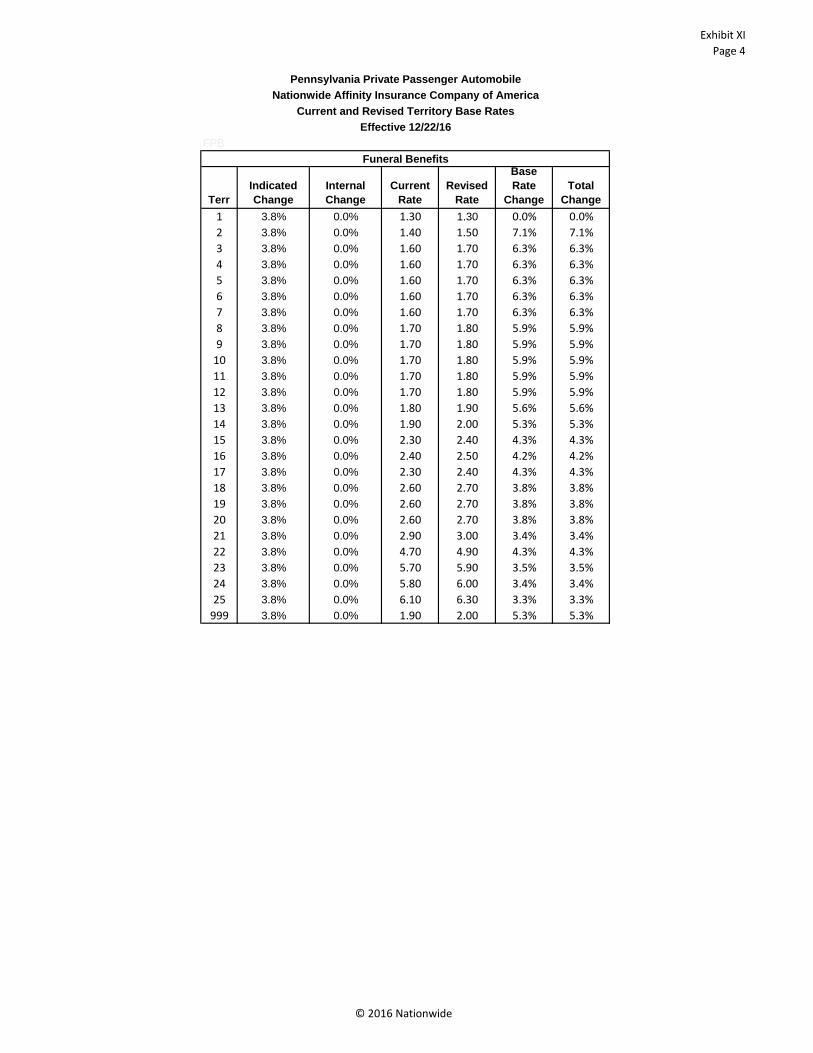
Exhibit XIPage 4
© 2016 Nationwide
Effective 12/22/16 FPB
Funeral Benefits
TerrIndicated Change
Internal Change
Current Rate
Revised Rate
Base Rate
ChangeTotal
Change1 3.8% 0.0% 1.30 1.30 0.0% 0.0%2 3.8% 0.0% 1.40 1.50 7.1% 7.1%3 3.8% 0.0% 1.60 1.70 6.3% 6.3%4 3.8% 0.0% 1.60 1.70 6.3% 6.3%5 3.8% 0.0% 1.60 1.70 6.3% 6.3%6 3.8% 0.0% 1.60 1.70 6.3% 6.3%7 3.8% 0.0% 1.60 1.70 6.3% 6.3%8 3.8% 0.0% 1.70 1.80 5.9% 5.9%9 3.8% 0.0% 1.70 1.80 5.9% 5.9%
10 3.8% 0.0% 1.70 1.80 5.9% 5.9%11 3.8% 0.0% 1.70 1.80 5.9% 5.9%12 3.8% 0.0% 1.70 1.80 5.9% 5.9%13 3.8% 0.0% 1.80 1.90 5.6% 5.6%14 3.8% 0.0% 1.90 2.00 5.3% 5.3%15 3.8% 0.0% 2.30 2.40 4.3% 4.3%16 3.8% 0.0% 2.40 2.50 4.2% 4.2%17 3.8% 0.0% 2.30 2.40 4.3% 4.3%18 3.8% 0.0% 2.60 2.70 3.8% 3.8%19 3.8% 0.0% 2.60 2.70 3.8% 3.8%20 3.8% 0.0% 2.60 2.70 3.8% 3.8%21 3.8% 0.0% 2.90 3.00 3.4% 3.4%22 3.8% 0.0% 4.70 4.90 4.3% 4.3%23 3.8% 0.0% 5.70 5.90 3.5% 3.5%24 3.8% 0.0% 5.80 6.00 3.4% 3.4%25 3.8% 0.0% 6.10 6.30 3.3% 3.3%
999 3.8% 0.0% 1.90 2.00 5.3% 5.3%
Current and Revised Territory Base RatesNationwide Affinity Insurance Company of America
Pennsylvania Private Passenger Automobile

Exhibit XIPage 5
© 2016 Nationwide
Effective 12/22/16FPB
Accidental Death Benefits
TerrIndicated Change
Internal Change
Current Rate
Revised Rate
Base Rate
ChangeTotal
Change1 3.8% 0.0% 7.00 7.30 4.3% 4.3%2 3.8% 0.0% 7.90 8.20 3.8% 3.8%3 3.8% 0.0% 8.80 9.10 3.4% 3.4%4 3.8% 0.0% 9.10 9.40 3.3% 3.3%5 3.8% 0.0% 9.20 9.50 3.3% 3.3%6 3.8% 0.0% 9.20 9.50 3.3% 3.3%7 3.8% 0.0% 10.30 10.70 3.9% 3.9%8 3.8% 0.0% 10.40 10.80 3.8% 3.8%9 3.8% 0.0% 10.80 11.20 3.7% 3.7%
10 3.8% 0.0% 10.70 11.10 3.7% 3.7%11 3.8% 0.0% 10.90 11.30 3.7% 3.7%12 3.8% 0.0% 11.00 11.40 3.6% 3.6%13 3.8% 0.0% 11.40 11.80 3.5% 3.5%14 3.8% 0.0% 12.00 12.50 4.2% 4.2%15 3.8% 0.0% 13.80 14.30 3.6% 3.6%16 3.8% 0.0% 14.80 15.40 4.1% 4.1%17 3.8% 0.0% 14.30 14.80 3.5% 3.5%18 3.8% 0.0% 16.20 16.80 3.7% 3.7%19 3.8% 0.0% 16.10 16.70 3.7% 3.7%20 3.8% 0.0% 17.00 17.60 3.5% 3.5%21 3.8% 0.0% 18.60 19.30 3.8% 3.8%22 3.8% 0.0% 29.90 31.00 3.7% 3.7%23 3.8% 0.0% 34.70 36.00 3.7% 3.7%24 3.8% 0.0% 34.80 36.10 3.7% 3.7%25 3.8% 0.0% 36.40 37.80 3.8% 3.8%
999 3.8% 0.0% 12.00 12.50 4.2% 4.2%
Current and Revised Territory Base RatesNationwide Affinity Insurance Company of America
Pennsylvania Private Passenger Automobile
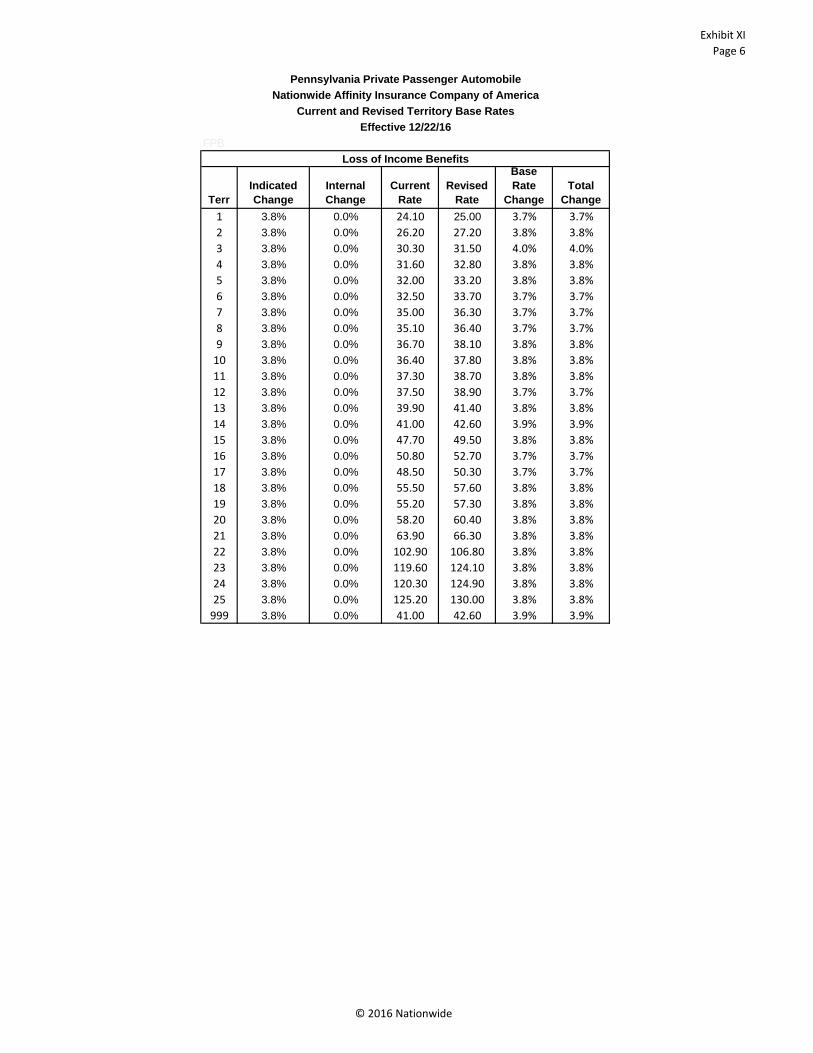
Exhibit XIPage 6
© 2016 Nationwide
Effective 12/22/16FPB
Loss of Income Benefits
TerrIndicated Change
Internal Change
Current Rate
Revised Rate
Base Rate
ChangeTotal
Change1 3.8% 0.0% 24.10 25.00 3.7% 3.7%2 3.8% 0.0% 26.20 27.20 3.8% 3.8%3 3.8% 0.0% 30.30 31.50 4.0% 4.0%4 3.8% 0.0% 31.60 32.80 3.8% 3.8%5 3.8% 0.0% 32.00 33.20 3.8% 3.8%6 3.8% 0.0% 32.50 33.70 3.7% 3.7%7 3.8% 0.0% 35.00 36.30 3.7% 3.7%8 3.8% 0.0% 35.10 36.40 3.7% 3.7%9 3.8% 0.0% 36.70 38.10 3.8% 3.8%
10 3.8% 0.0% 36.40 37.80 3.8% 3.8%11 3.8% 0.0% 37.30 38.70 3.8% 3.8%12 3.8% 0.0% 37.50 38.90 3.7% 3.7%13 3.8% 0.0% 39.90 41.40 3.8% 3.8%14 3.8% 0.0% 41.00 42.60 3.9% 3.9%15 3.8% 0.0% 47.70 49.50 3.8% 3.8%16 3.8% 0.0% 50.80 52.70 3.7% 3.7%17 3.8% 0.0% 48.50 50.30 3.7% 3.7%18 3.8% 0.0% 55.50 57.60 3.8% 3.8%19 3.8% 0.0% 55.20 57.30 3.8% 3.8%20 3.8% 0.0% 58.20 60.40 3.8% 3.8%21 3.8% 0.0% 63.90 66.30 3.8% 3.8%22 3.8% 0.0% 102.90 106.80 3.8% 3.8%23 3.8% 0.0% 119.60 124.10 3.8% 3.8%24 3.8% 0.0% 120.30 124.90 3.8% 3.8%25 3.8% 0.0% 125.20 130.00 3.8% 3.8%
999 3.8% 0.0% 41.00 42.60 3.9% 3.9%
Current and Revised Territory Base RatesNationwide Affinity Insurance Company of America
Pennsylvania Private Passenger Automobile

Exhibit XIPage 7
© 2016 Nationwide
Effective 12/22/16 FPB
Combined Loss Benefits
TerrIndicated Change
Internal Change
Current Rate
Revised Rate
Base Rate
ChangeTotal
Change1 3.8% 0.0% 383.10 397.70 3.8% 3.8%2 3.8% 0.0% 412.00 427.70 3.8% 3.8%3 3.8% 0.0% 475.10 493.20 3.8% 3.8%4 3.8% 0.0% 499.00 518.00 3.8% 3.8%5 3.8% 0.0% 505.20 524.40 3.8% 3.8%6 3.8% 0.0% 511.70 531.10 3.8% 3.8%7 3.8% 0.0% 551.50 572.50 3.8% 3.8%8 3.8% 0.0% 554.70 575.80 3.8% 3.8%9 3.8% 0.0% 578.80 600.80 3.8% 3.8%
10 3.8% 0.0% 574.20 596.00 3.8% 3.8%11 3.8% 0.0% 587.70 610.00 3.8% 3.8%12 3.8% 0.0% 590.90 613.40 3.8% 3.8%13 3.8% 0.0% 627.10 650.90 3.8% 3.8%14 3.8% 0.0% 649.90 674.60 3.8% 3.8%15 3.8% 0.0% 751.40 780.00 3.8% 3.8%16 3.8% 0.0% 800.10 830.50 3.8% 3.8%17 3.8% 0.0% 765.90 795.00 3.8% 3.8%18 3.8% 0.0% 875.50 908.80 3.8% 3.8%19 3.8% 0.0% 866.20 899.10 3.8% 3.8%20 3.8% 0.0% 916.10 950.90 3.8% 3.8%21 3.8% 0.0% 1,009.30 1,047.70 3.8% 3.8%22 3.8% 0.0% 1,618.50 1,680.00 3.8% 3.8%23 3.8% 0.0% 1,883.70 1,955.30 3.8% 3.8%24 3.8% 0.0% 1,894.10 1,966.10 3.8% 3.8%25 3.8% 0.0% 1,973.50 2,048.50 3.8% 3.8%
999 3.8% 0.0% 649.30 674.00 3.8% 3.8%
Current and Revised Territory Base RatesNationwide Affinity Insurance Company of America
Pennsylvania Private Passenger Automobile
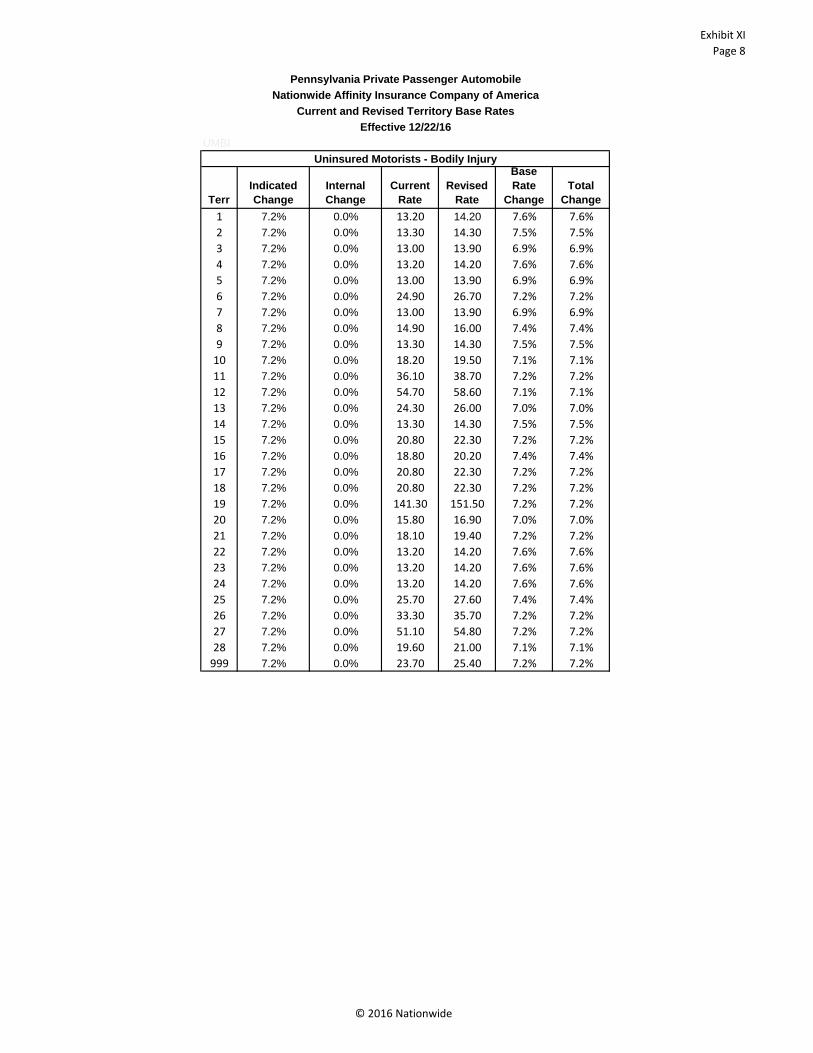
Exhibit XIPage 8
© 2016 Nationwide
Effective 12/22/16 UMBI
Uninsured Motorists - Bodily Injury
TerrIndicated Change
Internal Change
Current Rate
Revised Rate
Base Rate
ChangeTotal
Change1 7.2% 0.0% 13.20 14.20 7.6% 7.6%2 7.2% 0.0% 13.30 14.30 7.5% 7.5%3 7.2% 0.0% 13.00 13.90 6.9% 6.9%4 7.2% 0.0% 13.20 14.20 7.6% 7.6%5 7.2% 0.0% 13.00 13.90 6.9% 6.9%6 7.2% 0.0% 24.90 26.70 7.2% 7.2%7 7.2% 0.0% 13.00 13.90 6.9% 6.9%8 7.2% 0.0% 14.90 16.00 7.4% 7.4%9 7.2% 0.0% 13.30 14.30 7.5% 7.5%
10 7.2% 0.0% 18.20 19.50 7.1% 7.1%11 7.2% 0.0% 36.10 38.70 7.2% 7.2%12 7.2% 0.0% 54.70 58.60 7.1% 7.1%13 7.2% 0.0% 24.30 26.00 7.0% 7.0%14 7.2% 0.0% 13.30 14.30 7.5% 7.5%15 7.2% 0.0% 20.80 22.30 7.2% 7.2%16 7.2% 0.0% 18.80 20.20 7.4% 7.4%17 7.2% 0.0% 20.80 22.30 7.2% 7.2%18 7.2% 0.0% 20.80 22.30 7.2% 7.2%19 7.2% 0.0% 141.30 151.50 7.2% 7.2%20 7.2% 0.0% 15.80 16.90 7.0% 7.0%21 7.2% 0.0% 18.10 19.40 7.2% 7.2%22 7.2% 0.0% 13.20 14.20 7.6% 7.6%23 7.2% 0.0% 13.20 14.20 7.6% 7.6%24 7.2% 0.0% 13.20 14.20 7.6% 7.6%25 7.2% 0.0% 25.70 27.60 7.4% 7.4%26 7.2% 0.0% 33.30 35.70 7.2% 7.2%27 7.2% 0.0% 51.10 54.80 7.2% 7.2%28 7.2% 0.0% 19.60 21.00 7.1% 7.1%
999 7.2% 0.0% 23.70 25.40 7.2% 7.2%
Current and Revised Territory Base Rates
Pennsylvania Private Passenger AutomobileNationwide Affinity Insurance Company of America

Exhibit XIPage 9
© 2016 Nationwide
Effective 12/22/16 UIMBI
Underinsured Motorists - Bodily Injury
TerrIndicated Change
Internal Change
Current Rate
Revised Rate
Base Rate
ChangeTotal
Change1 14.5% 0.0% 58.80 67.30 14.5% 14.5%2 14.5% 0.0% 55.90 64.00 14.5% 14.5%3 14.5% 0.0% 51.10 58.50 14.5% 14.5%4 14.5% 0.0% 53.30 61.00 14.4% 14.4%5 14.5% 0.0% 49.90 57.10 14.4% 14.4%6 14.5% 0.0% 76.90 88.10 14.6% 14.6%7 14.5% 0.0% 45.90 52.60 14.6% 14.6%8 14.5% 0.0% 51.50 59.00 14.6% 14.6%9 14.5% 0.0% 59.00 67.60 14.6% 14.6%
10 14.5% 0.0% 49.70 56.90 14.5% 14.5%11 14.5% 0.0% 93.80 107.40 14.5% 14.5%12 14.5% 0.0% 133.50 152.90 14.5% 14.5%13 14.5% 0.0% 59.00 67.60 14.6% 14.6%14 14.5% 0.0% 51.20 58.60 14.5% 14.5%15 14.5% 0.0% 111.40 127.60 14.5% 14.5%16 14.5% 0.0% 82.60 94.60 14.5% 14.5%17 14.5% 0.0% 82.60 94.60 14.5% 14.5%18 14.5% 0.0% 82.60 94.60 14.5% 14.5%19 14.5% 0.0% 237.00 271.40 14.5% 14.5%20 14.5% 0.0% 65.10 74.50 14.4% 14.4%21 14.5% 0.0% 77.70 89.00 14.5% 14.5%22 14.5% 0.0% 53.90 61.70 14.5% 14.5%23 14.5% 0.0% 56.70 64.90 14.5% 14.5%24 14.5% 0.0% 49.10 56.20 14.5% 14.5%25 14.5% 0.0% 76.20 87.20 14.4% 14.4%26 14.5% 0.0% 92.10 105.50 14.5% 14.5%27 14.5% 0.0% 125.00 143.10 14.5% 14.5%28 14.5% 0.0% 82.60 94.60 14.5% 14.5%
999 14.5% 0.0% 70.10 80.30 14.6% 14.6%
Current and Revised Territory Base Rates
Pennsylvania Private Passenger AutomobileNationwide Affinity Insurance Company of America

Exhibit XIPage 10
© 2016 Nationwide
Effective 12/22/16 COMP
Comprehensive
TerrIndicated Change
Internal Change
Current Rate
Revised Rate
Base Rate
ChangeTotal
Change1 2.1% 0.0% 84.30 86.10 2.1% 2.1%2 2.1% 0.0% 90.20 92.10 2.1% 2.1%3 2.1% 0.0% 92.50 94.40 2.1% 2.1%4 2.1% 0.0% 98.70 100.80 2.1% 2.1%5 2.1% 0.0% 107.10 109.30 2.1% 2.1%6 2.1% 0.0% 112.30 114.70 2.1% 2.1%7 2.1% 0.0% 110.40 112.70 2.1% 2.1%8 2.1% 0.0% 118.50 121.00 2.1% 2.1%9 2.1% 0.0% 116.50 118.90 2.1% 2.1%
10 2.1% 0.0% 121.30 123.80 2.1% 2.1%11 2.1% 0.0% 126.80 129.50 2.1% 2.1%12 2.1% 0.0% 136.30 139.20 2.1% 2.1%13 2.1% 0.0% 127.80 130.50 2.1% 2.1%14 2.1% 0.0% 134.40 137.20 2.1% 2.1%15 2.1% 0.0% 143.20 146.20 2.1% 2.1%16 2.1% 0.0% 138.80 141.70 2.1% 2.1%17 2.1% 0.0% 156.10 159.40 2.1% 2.1%18 2.1% 0.0% 175.60 179.30 2.1% 2.1%19 2.1% 0.0% 165.30 168.80 2.1% 2.1%20 2.1% 0.0% 186.30 190.20 2.1% 2.1%21 2.1% 0.0% 197.70 201.90 2.1% 2.1%22 2.1% 0.0% 201.00 205.20 2.1% 2.1%23 2.1% 0.0% 197.10 201.20 2.1% 2.1%24 2.1% 0.0% 206.00 210.30 2.1% 2.1%25 2.1% 0.0% 209.20 213.60 2.1% 2.1%26 2.1% 0.0% 173.20 176.80 2.1% 2.1%27 2.1% 0.0% 188.30 192.30 2.1% 2.1%28 2.1% 0.0% 220.20 224.80 2.1% 2.1%29 2.1% 0.0% 188.30 192.30 2.1% 2.1%30 2.1% 0.0% 202.80 207.10 2.1% 2.1%31 2.1% 0.0% 225.70 230.40 2.1% 2.1%32 2.1% 0.0% 210.30 214.70 2.1% 2.1%33 2.1% 0.0% 264.30 269.90 2.1% 2.1%34 2.1% 0.0% 248.70 253.90 2.1% 2.1%35 2.1% 0.0% 216.80 221.40 2.1% 2.1%36 2.1% 0.0% 252.20 257.50 2.1% 2.1%37 2.1% 0.0% 263.90 269.40 2.1% 2.1%38 2.1% 0.0% 264.80 270.40 2.1% 2.1%
999 2.1% 0.0% 130.20 132.90 2.1% 2.1%
Pennsylvania Private Passenger AutomobileNationwide Affinity Insurance Company of America
Current and Revised Territory Base Rates
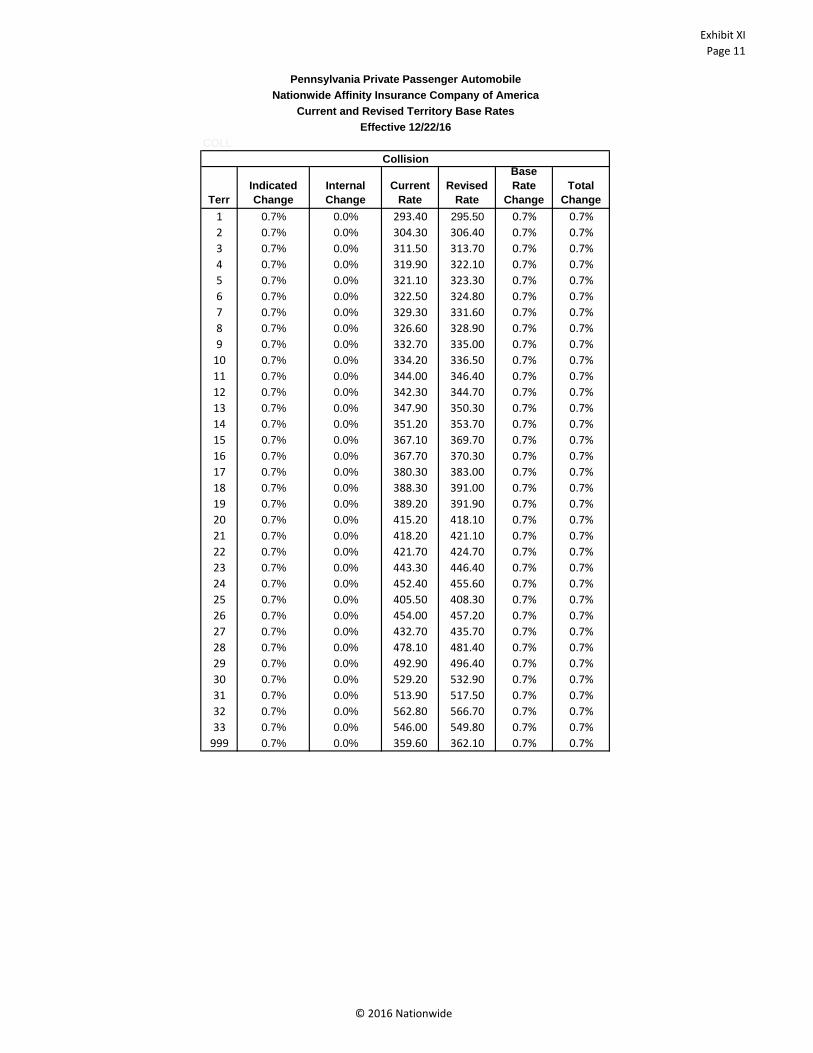
Exhibit XIPage 11
© 2016 Nationwide
Effective 12/22/16COLL
Collision
TerrIndicated Change
Internal Change
Current Rate
Revised Rate
Base Rate
ChangeTotal
Change1 0.7% 0.0% 293.40 295.50 0.7% 0.7%2 0.7% 0.0% 304.30 306.40 0.7% 0.7%3 0.7% 0.0% 311.50 313.70 0.7% 0.7%4 0.7% 0.0% 319.90 322.10 0.7% 0.7%5 0.7% 0.0% 321.10 323.30 0.7% 0.7%6 0.7% 0.0% 322.50 324.80 0.7% 0.7%7 0.7% 0.0% 329.30 331.60 0.7% 0.7%8 0.7% 0.0% 326.60 328.90 0.7% 0.7%9 0.7% 0.0% 332.70 335.00 0.7% 0.7%
10 0.7% 0.0% 334.20 336.50 0.7% 0.7%11 0.7% 0.0% 344.00 346.40 0.7% 0.7%12 0.7% 0.0% 342.30 344.70 0.7% 0.7%13 0.7% 0.0% 347.90 350.30 0.7% 0.7%14 0.7% 0.0% 351.20 353.70 0.7% 0.7%15 0.7% 0.0% 367.10 369.70 0.7% 0.7%16 0.7% 0.0% 367.70 370.30 0.7% 0.7%17 0.7% 0.0% 380.30 383.00 0.7% 0.7%18 0.7% 0.0% 388.30 391.00 0.7% 0.7%19 0.7% 0.0% 389.20 391.90 0.7% 0.7%20 0.7% 0.0% 415.20 418.10 0.7% 0.7%21 0.7% 0.0% 418.20 421.10 0.7% 0.7%22 0.7% 0.0% 421.70 424.70 0.7% 0.7%23 0.7% 0.0% 443.30 446.40 0.7% 0.7%24 0.7% 0.0% 452.40 455.60 0.7% 0.7%25 0.7% 0.0% 405.50 408.30 0.7% 0.7%26 0.7% 0.0% 454.00 457.20 0.7% 0.7%27 0.7% 0.0% 432.70 435.70 0.7% 0.7%28 0.7% 0.0% 478.10 481.40 0.7% 0.7%29 0.7% 0.0% 492.90 496.40 0.7% 0.7%30 0.7% 0.0% 529.20 532.90 0.7% 0.7%31 0.7% 0.0% 513.90 517.50 0.7% 0.7%32 0.7% 0.0% 562.80 566.70 0.7% 0.7%33 0.7% 0.0% 546.00 549.80 0.7% 0.7%
999 0.7% 0.0% 359.60 362.10 0.7% 0.7%
Pennsylvania Private Passenger AutomobileNationwide Affinity Insurance Company of America
Current and Revised Territory Base Rates

Exhibit XII
© 2016 Nationwide
Pennsylvania Private Passenger AutomobileNationwide Affinity Insurance Company of America
Base Rates for Miscellaneous CoveragesEffective 12/22/16
LOULoss of Use
TotalPer Total Current Proposed Internal RevisedDay Limit Rate Change Change Rate$30 $900 37.60 -4.0% 0.0% 36.10$40 $1,200 48.80 -4.0% 0.0% 46.80$50 $1,500 59.70 -4.0% 0.0% 57.30$60 $1,800 70.50 -4.0% 0.0% 67.70$75 $2,250 84.50 -4.0% 0.0% 81.10
$100 $3,000 109.10 -4.0% 0.0% 104.70
FPBExcess Medical Benefits
Indicated Change
Internal Change
Current Rate
Revised Rate
Base Rate
ChangeTotal
Change3.8% 0.0% 22.80 23.70 3.9% 3.9%

Exhibit XIII
© 2016 Nationwide
Pennsylvania Personal AutomobileNationwide Affinity Insurance Company of America
Rate Change Histograms for All Filed ChangesAll Coverages Combined
0.0%
10.0%
20.0%
30.0%
40.0%
50.0%
60.0%
70.0%
0% <= 5% 5% <= 10% 10% <= 15%
Distribution of Policy Percent Change
0.0%
10.0%
20.0%
30.0%
40.0%
50.0%
60.0%
70.0%
80.0%
90.0%
100.0%
$0 <= $100 $100 <= $200 $200+
Distribution of Policy Dollar Changes
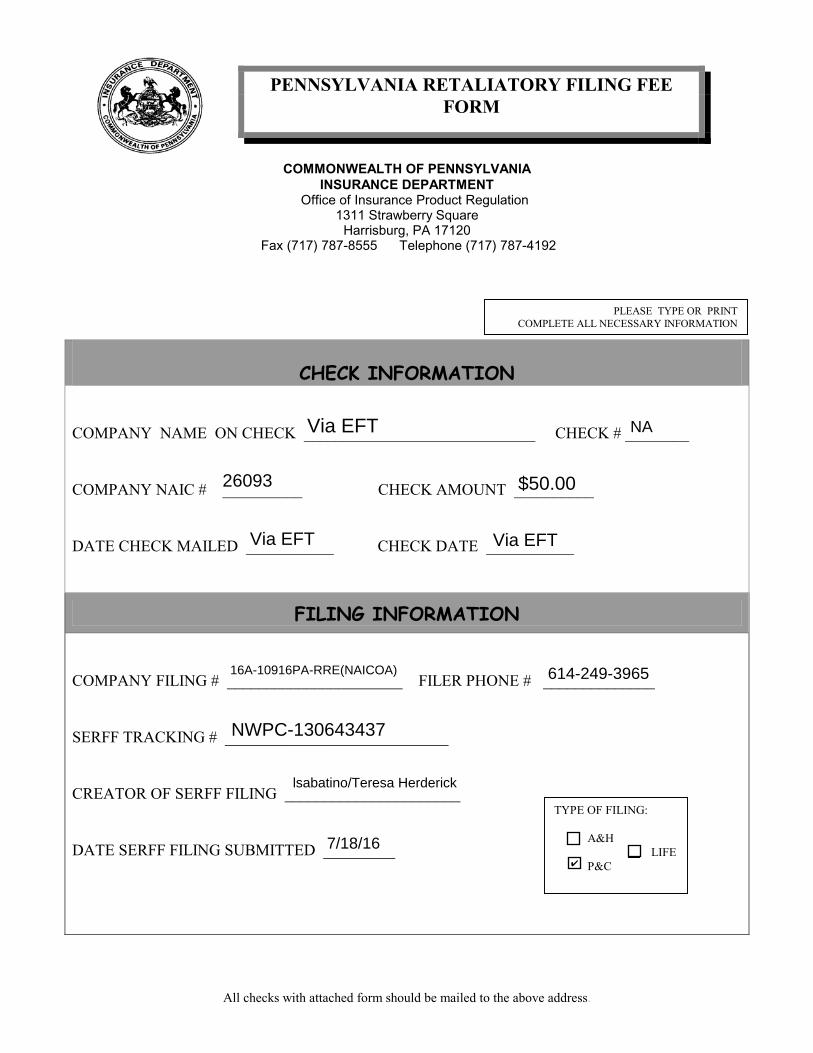
COMMONWEALTH OF PENNSYLVANIA INSURANCE DEPARTMENT Office of Insurance Product Regulation 1311 Strawberry Square Harrisburg, PA 17120
Fax (717) 787-8555 Telephone (717) 787-4192
PENNSYLVANIA RETALIATORY FILING FEE FORM
PLEASE TYPE OR PRINTCOMPLETE ALL NECESSARY INFORMATION
CHECK INFORMATION
COMPANY NAME ON CHECK _____________________________ CHECK # ________ COMPANY NAIC # __________ CHECK AMOUNT __________ DATE CHECK MAILED ___________ CHECK DATE ___________
FILING INFORMATION
COMPANY FILING # ______________________ FILER PHONE # ______________ SERFF TRACKING # ____________________________ CREATOR OF SERFF FILING ______________________ DATE SERFF FILING SUBMITTED _________
TYPE OF FILING: A&H LIFE P&C
All checks with attached form should be mailed to the above address.
NWPC-130643437
7/18/16
lsabatino/Teresa Herderick
✔
Via EFT NA
26093 $50.00
Via EFT Via EFT
16A-10916PA-RRE(NAICOA) 614-249-3965

SUPPLEMENTAL DATA MEMORANDUM Pennsylvania Private Passenger Automobile
Nationwide Affinity Insurance Company of America Per Pa.B. Doc. No. 13-1417, we are providing the following information: 1. Summary Exhibit of Proposed Changes
Please refer to Exhibits XI and XII of the Filing Exhibits for a summary of proposed changes by coverage and territory.
2. Histograms
Exhibit XIII of the Filing Exhibits show the histogram resulting from this rate change. Please see the attached Annual Histogram exhibit for the cumulative rate change histograms for all filed changes over one year.
3. Rate History Please see the attached Rate History exhibit for a rate history over the past 6 years.
4. Premium and Exposure Data
Please see the attached Prem and Exp Data exhibit for premium and exposure data for each of the 5 most recent accident years.
5. Expense Exhibit
The attached Expense Exhibit displays expense information for each of the 3 most recent calendar years.
6. Loss Development Data
Please see the attached Loss Development exhibit for loss development data over the past 5 accident years.
7. Loss Development Considerations
Loss Development is analyzed separately by coverage. The ultimate loss estimates for the injury coverages rely on incurred loss development instead of paid or settled loss development due to the frequency of changes in the settlement rate for injury claims. We have adjusted Bodily Injury, Uninsured Motorists-Bodily Injury and Underinsured Motorists-Bodily Injury coverages’ ultimate losses by removing large losses over $500,000, developing the remaining losses to ultimate and then adding the large losses back into the estimated ultimate losses.
8. Ratemaking Considerations Regarding considerations that may have a substantive impact on the analysis, the combined impact of changes in mix of business is provided in the premium trend analysis displayed in original filing, Exhibit II. The major determinants of the mix of business trends are matrix factors, model year factors, deductible factors, rate symbols, and passive restraint device discounts
© 2016 Nationwide
1

Annual Histograms
© 2016, Nationwide
Pennsylvania Personal AutomobileNationwide Affinity Insurance Company of America
Cumulative Rate Change Histograms for All Filed Changes Over One YearAll Coverages Combined
0.0%
10.0%
20.0%
30.0%
40.0%
50.0%
60.0%
70.0%
80.0%
0% <= 5% 5% <= 10% 10% <= 15% 15% <= 20% 20% <= 25%
Distribution of Policy Percent Change
0.0%
10.0%
20.0%
30.0%
40.0%
50.0%
60.0%
70.0%
$0 <= $100 $100 <= $200 $200 <= $300 $300 <= $400 $400 <= $500 $600+
Distribution of Policy Dollar Changes

Rate HistoryPage 1
© 2016, Nationwide
PENNSYLVANIA INSURANCE DEPARTMENTRATE HISTORY
NATIONWIDE AFFINITY INSURANCE COMPANY OF AMERICA
Most Recent Rate Change 2016 1ST Prior Rate Change 2016 2ND Prior Rate Change 2016Effective Date: 06/22/16 Effective Date: Effective Date:
Coverage $ Change % Change $ Change % Change $ Change % ChangeBodily Injury $5,210,300 9.3%Property Damage $6,126,900 11.7%First Party Benefits $968,000 3.8%Uninsured Motorists -$83,100 -1.7%Underinsured Motorists -$535,500 -2.7%Comprehensive $1,388,800 4.5%Collision $3,874,400 4.8%All Coverages Combined $16,949,800 6.3%
Most Recent Rate Change 2015 1ST Prior Rate Change 2015 2ND Prior Rate Change 2015Effective Date: 06/22/15 Effective Date: 12/22/15 Effective Date:
Coverage $ Change % Change $ Change % Change $ Change % ChangeBodily Injury $3,215,000 5.0% $5,916,000 9.7%Property Damage $3,071,500 5.0% $3,655,600 6.2%First Party Benefits $1,553,398 5.0% $0 0.0%Uninsured Motorists $0 0.0% $0 0.0%Underinsured Motorists $0 0.0% $786,600 3.6%Comprehensive $1,676,400 5.0% $2,919,000 9.0%Collision $4,476,300 5.0% $5,105,100 5.9%All Coverages Combined $13,992,598 4.4% $18,382,300 6.2%
Most Recent Rate Change 2014 1ST Prior Rate Change 2014 2ND Prior Rate Change 2014Effective Date: 12/22/14 Effective Date: 06/23/14 Effective Date:
Coverage $ Change % Change $ Change % Change $ Change % ChangeBodily Injury $4,644,787 7.0% $0 0.0%Property Damage $4,531,243 7.1% $0 0.0%First Party Benefits $1,995,392 6.0% $0 0.0%Uninsured Motorists $0 0.0% $0 0.0%Underinsured Motorists $0 0.0% $0 0.0%Comprehensive $1,178,383 3.3% $0 0.0%Collision $3,758,853 4.0% $0 0.0%All Coverages Combined $16,108,658 4.8% $0 0.0%
Most Recent Rate Change 2013 1ST Prior Rate Change 2013 2ND Prior Rate Change 2013Effective Date: 12/11/13 Effective Date: 05/06/13 Effective Date:
Coverage $ Change % Change $ Change % Change $ Change % ChangeBodily Injury $0 0.0% $2,668,821 4.0%Property Damage $0 0.0% $2,441,168 4.0%First Party Benefits $0 0.0% $2,003,090 6.0%Uninsured Motorists $0 0.0% $0 0.0%Underinsured Motorists $0 0.0% $0 0.0%Comprehensive $0 0.0% $1,607,661 5.0%Collision $0 0.0% $858,524 1.0%All Coverages Combined $0 0.0% $9,579,264 3.1%

Rate HistoryPage 2
© 2016, Nationwide
PENNSYLVANIA INSURANCE DEPARTMENTRATE HISTORY
NATIONWIDE AFFINITY INSURANCE COMPANY OF AMERICA
Most Recent Rate Change 2012 1ST Prior Rate Change 2012 2ND Prior Rate Change 2012Effective Date: 09/12/12 Effective Date: 03/05/12 Effective Date:
Coverage $ Change % Change $ Change % Change $ Change % ChangeBodily Injury $1,743,323 3.0% $4,717,326 10.0%Property Damage $3,610,074 7.0% $4,146,377 10.0%First Party Benefits $1,966,368 7.0% $2,282,662 10.0%Uninsured Motorists $0 0.0% $219,672 3.9%Underinsured Motorists -$449,500 -2.0% $0 0.0%Comprehensive $1,068,579 4.0% $1,731,893 8.0%Collision $1,454,084 2.0% $4,165,883 7.0%All Coverages Combined $9,392,929 3.5% $17,263,811 7.9%
Most Recent Rate Change 2011 1ST Prior Rate Change 2011 2ND Prior Rate Change 2011Effective Date: 09/05/11 Effective Date: Effective Date:
Coverage $ Change % Change $ Change % Change $ Change % ChangeBodily Injury $2,651,009 7.0%Property Damage $2,314,211 7.0%First Party Benefits $1,226,942 6.7%Uninsured Motorists -$283,554 -5.5%Underinsured Motorists $0 0.0%Comprehensive $785,974 4.5%Collision $2,171,146 4.5%All Coverages Combined $8,865,728 5.0%

Prem and Exp DataPage 1
© 2016, Nationwide
PENNSYLVANIA INSURANCE DEPARTMENTPENNSYLVANIA PREMIUM AND EXPOSURE DATA
NATIONWIDE AFFINITY INSURANCE COMPANY OF AMERICA
Accident Year Ending: 20153I. Percent of J. Percent of K. Percent of Premium
Premium Premium Earned on other than Earned Car Earned Premiums Earned Premiums Earned on an Earned on a an Annual or
Coverage Years at collected rate at current rate level Annual Policy Semi-Annual Policy Semi-Annual PolicyBodily Injury 241,178 47,257,867 61,278,660 0% 100% 0%Property Damage 241,239 45,227,876 58,093,774 0% 100% 0%First Party Benefits - All 651,508 24,023,173 26,830,815 0% 100% 0%Uninsured Motorists 217,916 4,745,924 4,653,891 0% 100% 0%Underinsured Motorists 215,873 17,946,542 18,026,227 0% 100% 0%Comprehensive 203,274 25,566,615 30,869,842 0% 100% 0%Collision 188,083 66,136,758 78,407,343 0% 100% 0%All Coverages Combined 1,959,071 230,904,755 278,160,552 0% 100% 0%
Accident Year Ending: 20143I. Percent of J. Percent of K. Percent of Premium
Premium Premium Earned on other than Earned Car Earned Premiums Earned Premiums Earned on an Earned on a an Annual or
Coverage Years at collected rate at current rate level Annual Policy Semi-Annual Policy Semi-Annual PolicyBodily Injury 302,936 57,739,065 79,973,566 0% 100% 0%Property Damage 302,960 54,106,959 75,174,926 0% 100% 0%First Party Benefits - All 811,190 29,174,751 35,329,425 0% 100% 0%Uninsured Motorists 272,449 6,049,082 6,020,885 0% 100% 0%Underinsured Motorists 269,720 22,418,971 22,804,271 0% 100% 0%Comprehensive 252,833 30,366,140 38,315,150 0% 100% 0%Collision 233,992 79,298,672 97,373,203 0% 100% 0%All Coverages Combined 2,446,080 279,153,640 354,991,426 0% 100% 0%
Accident Year Ending: 20133I. Percent of J. Percent of K. Percent of Premium
Premium Premium Earned on other than Earned Car Earned Premiums Earned Premiums Earned on an Earned on a an Annual or
Coverage Years at collected rate at current rate level Annual Policy Semi-Annual Policy Semi-Annual PolicyBodily Injury 363,680 67,625,453 100,046,613 0% 100% 0%Property Damage 363,768 62,134,916 93,244,369 0% 100% 0%First Party Benefits - All 963,999 32,915,529 44,707,517 0% 100% 0%Uninsured Motorists 325,138 7,393,489 7,478,325 0% 100% 0%Underinsured Motorists 321,773 26,822,434 27,532,775 0% 100% 0%Comprehensive 299,819 34,236,544 45,964,516 0% 100% 0%Collision 277,482 93,196,131 115,766,691 0% 100% 0%All Coverages Combined 2,915,659 324,324,496 434,740,806 0% 100% 0%
Accident Year Ending: 20123I. Percent of J. Percent of K. Percent of Premium
Premium Premium Earned on other than Earned Car Earned Premiums Earned Premiums Earned on an Earned on a an Annual or
Coverage Years at collected rate at current rate level Annual Policy Semi-Annual Policy Semi-Annual PolicyBodily Injury 354,193 62,553,894 102,733,752 0% 100% 0%Property Damage 354,313 56,195,747 94,827,661 0% 100% 0%First Party Benefits - All 932,810 29,963,026 46,831,863 0% 100% 0%Uninsured Motorists 314,777 7,423,575 7,627,316 0% 100% 0%Underinsured Motorists 311,460 26,922,823 27,227,761 0% 100% 0%Comprehensive 288,575 31,233,488 45,926,443 0% 100% 0%Collision 267,403 85,467,545 112,918,288 0% 100% 0%All Coverages Combined 2,823,532 299,760,098 438,093,083 0% 100% 0%

Prem and Exp DataPage 2
© 2016, Nationwide
PENNSYLVANIA INSURANCE DEPARTMENTPENNSYLVANIA PREMIUM AND EXPOSURE DATA
NATIONWIDE AFFINITY INSURANCE COMPANY OF AMERICA
Accident Year Ending: 20113I. Percent of J. Percent of K. Percent of Premium
Premium Premium Earned on other than Earned Car Earned Premiums Earned Premiums Earned on an Earned on a an Annual or
Coverage Years at collected rate at current rate level Annual Policy Semi-Annual Policy Semi-Annual PolicyBodily Injury 304,356 51,933,463 92,609,541 0% 100% 0%Property Damage 304,440 45,965,526 84,035,309 0% 100% 0%First Party Benefits - All 796,348 24,973,018 42,620,602 0% 100% 0%Uninsured Motorists 269,206 6,937,615 6,913,617 0% 100% 0%Underinsured Motorists 266,305 23,685,106 24,029,875 0% 100% 0%Comprehensive 245,533 25,084,550 39,174,929 0% 100% 0%Collision 227,881 68,918,604 95,905,487 0% 100% 0%All Coverages Combined 2,414,069 247,497,882 385,289,361 0% 100% 0%

Expense Exhibit
© 2016, Nationwide
PENNSYLVANIA INSURANCE DEPARTMENTEXPENSE EXHIBIT
NATIONWIDE AFFINITY INSURANCE COMPANY OF AMERICA
Countrywide Countrywide Pennsylvania Pennsylvania Pennsylvania Pennsylvania Pennsylvania Pennsylvania Pennsylvania Pennsylvania Pennsylvania Pennsylvania PennsylvaniaC. Direct E. Dir. Other Acq, I. Direct Paid J. Direct Paid K. Direct Inc.
A.Direct Written B. Direct Earned A. Direct Written B. Direct Earned Commission D. Direct General Field Supervision & F. Taxes, Licenses G. Incurred Losses H. Paid Unallocated Loss Allocated Loss ALAE2015 Premium Premium Premium Premium and Brokerage Expenses Collection Expenses and Fees Excluding IBNR Losses Adj. Expenses Adj. Expenses Excluding IBNRBodily Injury 226,525,769 225,615,677 43,266,142 44,999,189 4,811,082 4,069,748 4,460,695 995,121 31,800,219 41,389,115 4,057,369 4,060,497 4,060,497Property Damage 174,659,192 174,243,676 41,603,149 43,172,747 4,626,162 3,904,564 4,279,643 956,872 32,240,507 32,372,879 3,892,687 96,212 96,212First Party Benefits - Medical Benefits 18,604,513 19,492,756 18,588,755 19,466,790 2,067,021 1,760,586 1,929,710 427,541 12,845,237 13,177,098 1,755,230 467,739 467,739First Party Benefits - Income Loss 1,930,158 2,003,492 1,928,389 2,000,163 214,432 180,896 198,273 44,353 955,970 1,165,779 180,345 4,696 4,696First Party Benefits - Accidental Death 324,627 335,760 324,389 335,372 36,071 30,331 33,245 7,461 185,770 160,000 30,239 0 0First Party Benefits - Funeral Benefits 121,365 126,023 121,202 125,705 13,477 11,369 12,461 2,788 59,267 60,767 11,334 22 22First Party Benefits - Combination Benefits 645,247 666,284 644,584 665,327 71,676 60,172 65,953 14,825 623,409 615,147 59,989 16,404 16,404First Party Benefits - EMB 172,519 178,552 172,351 178,284 19,165 16,124 17,673 3,964 270,538 110,732 16,075 994 994First Party Benefits - All 21,798,428 22,802,867 21,779,670 22,771,640 2,421,842 2,059,478 2,257,315 500,932 14,940,191 15,289,523 2,053,214 489,855 489,855Uninsured Motorists 43,586,722 43,264,075 4,160,694 4,442,310 462,658 401,765 440,359 95,696 1,470,627 2,811,742 400,543 199,009 199,009Underinsured Motorists 25,496,533 25,939,884 15,916,339 16,893,810 1,769,855 1,527,884 1,674,655 366,076 12,038,952 13,065,534 1,523,237 575,191 575,191Comprehensive 101,192,889 100,431,967 23,727,100 24,595,460 2,636,428 2,234,455 2,237,471 545,723 16,869,252 17,139,471 2,181,149 67,936 67,936Collision 243,880,033 241,782,536 61,515,684 63,670,348 6,835,293 5,784,340 5,792,148 1,414,861 42,818,947 43,399,552 5,646,347 253,427 253,427All Coverages Combined 837,139,567 834,080,682 211,968,777 220,545,504 23,563,321 19,982,233 21,142,285 4,875,282 152,178,696 165,467,815 19,754,545 5,742,127 5,742,127
C. Direct E. Direct Other Acq, I. Direct Paid J. Direct Paid K. Direct Inc.A.Direct Written B. Direct Earned A. Direct Written B. Direct Earned Commission D. Direct General Field Supervision & F. Taxes, Licenses G. Incurred Losses H. Paid Unallocated Loss Allocated Loss ALAE
2014 Premium Premium Premium Premium and Brokerage Expenses Collection Expenses and Fees Excluding IBNR Losses Adj. Expenses Adj. Expenses Excluding IBNRBodily Injury 221,404,343 217,769,855 52,002,937 54,410,271 5,977,647 4,381,207 4,751,075 1,196,068 37,556,152 44,831,047 3,588,946 3,380,711 3,380,711Property Damage 173,164,466 171,222,702 49,370,675 51,292,850 5,675,073 4,130,187 4,478,864 1,135,526 38,858,250 36,881,241 3,383,318 123,185 123,185First Party Benefits - Medical Benefits 22,862,551 23,797,164 22,813,392 23,746,173 2,622,359 1,912,082 2,073,503 524,708 15,005,559 16,981,094 1,566,317 575,441 575,441First Party Benefits - Income Loss 2,293,686 2,366,289 2,287,170 2,359,622 262,906 190,001 206,041 52,605 1,637,971 1,749,613 155,643 6,397 6,397First Party Benefits - Accidental Death 378,175 391,022 377,458 390,270 43,388 31,425 34,078 8,682 137,973 172,173 25,743 0 0First Party Benefits - Funeral Benefits 145,430 151,626 144,788 150,989 16,643 12,158 13,184 3,330 69,533 68,293 9,959 0 0First Party Benefits - Combination Benefits 760,635 779,915 758,503 777,466 87,189 62,603 67,888 17,446 649,738 661,717 51,282 27,359 27,359First Party Benefits - EMB 202,037 207,211 201,527 206,674 23,165 16,642 18,047 4,635 751,390 328,478 13,632 1 1First Party Benefits - All 26,642,513 27,693,226 26,582,837 27,631,196 3,055,651 2,224,911 2,412,741 611,405 18,252,163 19,961,368 1,822,576 609,198 609,198Uninsured Motorists 42,335,963 41,325,173 5,427,568 5,711,000 623,889 459,859 498,681 124,834 3,689,593 4,162,022 376,702 290,094 290,094Underinsured Motorists 27,233,132 27,592,781 20,336,479 21,282,663 2,337,643 1,713,716 1,858,390 467,739 12,004,931 12,206,679 1,403,822 282,072 282,072Comprehensive 98,144,541 97,239,497 27,988,003 29,017,604 3,237,488 2,342,343 2,238,154 643,724 31,856,000 30,669,822 2,130,179 34,510 34,510Collision 235,421,411 231,595,567 72,235,851 75,359,948 8,355,819 6,083,163 5,812,582 1,661,425 57,924,334 54,368,553 5,532,165 334,355 334,355All Coverages Combined 824,346,370 814,438,802 253,944,349 264,705,531 29,263,209 21,335,386 22,050,488 5,840,720 200,141,424 203,080,731 18,237,709 5,054,125 5,054,125
C. Direct E. Direct Other Acq, I. Direct Paid J. Direct Paid K. Direct Inc.A.Direct Written B. Direct Earned A. Direct Written B. Direct Earned Commission D. Direct General Field Supervision & F. Taxes, Licenses G. Incurred Losses H. Paid Unallocated Loss Allocated Loss ALAE
2013 Premium Premium Premium Premium and Brokerage Expenses Collection Expenses and Fees Excluding IBNR Losses Adj. Expenses Adj. Expenses Excluding IBNRBodily Injury 202,478,659 196,340,157 62,539,982 65,120,386 6,941,168 5,251,234 5,721,188 1,438,420 45,947,221 46,192,275 6,809,140 2,909,281 2,909,281Property Damage 161,606,387 157,838,852 57,863,916 60,086,613 6,422,182 4,845,316 5,278,943 1,330,870 47,888,987 47,880,787 6,282,797 124,045 124,045First Party Benefits - Medical Benefits 26,701,495 27,723,725 26,650,335 27,671,735 2,957,859 2,231,417 2,431,116 612,958 22,567,021 23,360,851 2,893,421 588,167 588,167First Party Benefits - Income Loss 2,577,657 2,636,749 2,570,436 2,629,338 285,287 212,027 231,002 59,120 1,806,663 1,792,395 274,930 2,745 2,745First Party Benefits - Accidental Death 431,511 441,965 430,723 441,178 47,805 35,576 38,760 9,907 357,200 320,000 46,131 5 5First Party Benefits - Funeral Benefits 168,660 172,775 168,050 172,167 18,651 13,883 15,126 3,865 113,155 110,395 18,002 0 0First Party Benefits - Combination Benefits 826,675 839,681 824,079 837,075 91,463 67,501 73,542 18,954 905,821 914,491 87,527 5,547 5,547First Party Benefits - EMB 220,593 224,498 220,027 223,929 24,420 18,057 19,673 5,061 30,727 89,390 23,414 2,382 2,382First Party Benefits - All 30,926,590 32,039,393 30,863,650 31,975,422 3,425,485 2,578,462 2,809,218 709,864 25,780,589 26,587,521 3,343,425 598,846 598,846Uninsured Motorists 36,588,916 34,725,688 6,779,466 7,112,429 752,437 573,538 624,866 155,928 2,672,660 2,728,352 743,692 187,714 187,714Underinsured Motorists 29,132,279 29,748,896 24,867,853 25,922,795 2,760,026 2,090,385 2,277,461 571,961 12,519,229 12,358,019 2,710,548 235,295 235,295Comprehensive 92,127,677 90,479,680 32,524,219 33,526,325 3,695,065 2,704,323 2,446,986 748,057 24,696,491 24,687,291 3,125,835 74,377 74,377Collision 217,477,410 212,806,914 87,202,914 90,593,154 9,907,092 7,307,485 6,612,122 2,005,667 68,139,672 68,110,517 8,446,474 285,288 285,288All Coverages Combined 770,337,918 753,979,581 302,641,998 314,337,123 33,903,455 25,350,742 25,770,784 6,960,766 227,644,848 228,544,762 31,461,910 4,414,845 4,414,845

Loss DevelopmentPage 1
© 2016, Nationwide
PENNSYLVANIA INSURANCE DEPARTMENT LOSS DEVELOPMENT
NATIONWIDE AFFINITY INSURANCE COMPANY OF AMERICA BODILY INJURY
Accident A.Year Ended Earned9/30/2015 Exposures
2011 304,3562012 354,1932013 363,6802014 302,9362015 241,178
Accident B: Cumulative Reported ClaimsYear Ended9/30/2015 15 27 39 51 63
2011 5,680 5,761 5,797 5,801 5,8012012 6,361 6,450 6,475 6,4792013 5,887 5,964 5,9862014 3,546 3,6182015 2,160
Accident C: Cumulative Claims Closed With PaymentYear Ended9/30/2015 15 27 39 51 63
2011 1,186 1,876 2,243 2,339 2,3632012 1,489 2,235 2,655 2,7562013 1,353 2,027 2,3882014 915 1,4222015 796
Accident D: Cumulative Claims Closed Without PaymentYear Ended9/30/2015 15 27 39 51 63
2011 3,142 3,344 3,402 3,417 3,4192012 3,413 3,598 3,658 3,6672013 3,252 3,406 3,4572014 1,665 1,7842015 566

Loss DevelopmentPage 2
© 2016, Nationwide
PENNSYLVANIA INSURANCE DEPARTMENT LOSS DEVELOPMENT
NATIONWIDE AFFINITY INSURANCE COMPANY OF AMERICA BODILY INJURY
Accident E: Cumulative Paid Losses (Excluding Loss Adjustment Expense)Year Ended9/30/2015 15 27 39 51 63
2011 7,784,470 24,271,092 35,861,343 41,100,207 42,364,7092012 9,393,150 30,213,495 44,649,626 50,016,9582013 9,719,901 26,852,550 41,037,4722014 6,373,590 21,113,7492015 5,039,939
Accident F: Cumulative Paid Allocated Loss Adjustment ExpenseYear Ended9/30/2015 15 27 39 51 63
2011 136,421 711,564 2,065,855 2,943,177 3,230,5442012 165,322 1,050,172 2,512,340 3,630,0472013 177,681 888,438 2,695,9972014 129,250 835,4292015 64,566
Accident G: Incurred Losses on a Case, Formula or Reported Basis,Year Ended i.e. Excluding IBNR and/or Bulk Reserves and Loss Adjustment Expenses9/30/2015 15 27 39 51 63
2011 38,393,399 40,900,991 42,321,255 43,199,537 43,116,9572012 45,132,704 49,985,349 52,774,848 52,980,0252013 40,041,086 45,144,150 48,193,0762014 31,833,769 35,818,1532015 23,221,416
Accident H: Incurred ALAE on a Case, Formula or Reported Basis: Year Ended i.e., Excluding IBNR and/or Bulk Reserves9/30/2015 15 27 39 51 63
2011 136,421 711,564 2,065,855 2,943,177 3,230,5442012 165,322 1,050,172 2,512,340 3,630,0472013 177,681 888,438 2,695,9972014 129,250 835,4292015 64,566

Loss DevelopmentPage 3
© 2016, Nationwide
PENNSYLVANIA INSURANCE DEPARTMENT LOSS DEVELOPMENT
NATIONWIDE AFFINITY INSURANCE COMPANY OF AMERICA PROPERTY DAMAGE
Accident A.Year Ended Earned9/30/2015 Exposures
2011 304,4402012 354,3132013 363,7682014 302,9602015 241,239
Accident B: Cumulative Reported ClaimsYear Ended9/30/2015 15 27 39 51 63
2011 13,610 14,066 14,101 14,109 14,1122012 15,141 15,617 15,659 15,6682013 14,733 15,198 15,2462014 16,649 16,8002015 16,566
Accident C: Cumulative Claims Closed With PaymentYear Ended9/30/2015 15 27 39 51 63
2011 13,610 14,066 14,101 14,109 14,1122012 15,141 15,617 15,658 15,6672013 14,729 15,174 15,2192014 10,670 10,8702015 7,243
Accident D: Cumulative Claims Closed Without PaymentYear Ended9/30/2015 15 27 39 51 63
2011 0 0 0 0 02012 0 0 1 12013 3 23 272014 5,818 5,9152015 9,207

Loss DevelopmentPage 4
© 2016, Nationwide
PENNSYLVANIA INSURANCE DEPARTMENT LOSS DEVELOPMENT
NATIONWIDE AFFINITY INSURANCE COMPANY OF AMERICA PROPERTY DAMAGE
Accident E: Cumulative Paid Losses (Excluding Loss Adjustment Expense)Year Ended9/30/2015 15 27 39 51 63
2011 37,441,178 40,680,554 40,891,476 41,006,714 41,015,3922012 44,182,446 47,877,071 48,164,999 48,230,7802013 44,126,948 47,454,974 47,844,6082014 34,354,292 37,677,0712015 29,005,926
Accident F: Cumulative Paid Allocated Loss Adjustment ExpenseYear Ended9/30/2015 15 27 39 51 63
2011 112,859 154,993 187,480 208,000 208,8922012 73,486 117,215 129,288 134,5682013 49,001 88,798 119,2642014 41,956 77,5142015 22,493
Accident G: Incurred Losses on a Case, Formula or Reported Basis,Year Ended i.e. Excluding IBNR and/or Bulk Reserves and Loss Adjustment Expenses9/30/2015 15 27 39 51 63
2011 37,441,178 40,680,554 40,891,476 41,006,714 41,015,3922012 44,182,446 47,877,071 48,164,999 48,230,7802013 44,128,588 47,456,614 47,844,6082014 35,204,372 38,236,8522015 29,536,868
Accident H: Incurred ALAE on a Case, Formula or Reported Basis: Year Ended i.e., Excluding IBNR and/or Bulk Reserves9/30/2015 15 27 39 51 63
2011 112,859 154,993 187,480 208,000 208,8922012 73,486 117,215 129,288 134,5682013 49,001 88,798 119,2642014 41,956 77,5142015 22,493

Loss DevelopmentPage 5
© 2016, Nationwide
PENNSYLVANIA INSURANCE DEPARTMENT LOSS DEVELOPMENT
NATIONWIDE AFFINITY INSURANCE COMPANY OF AMERICA FIRST PARTY BENEFITS
Accident A.Year Ended Earned9/30/2015 Exposures
2011 796,3482012 932,8102013 963,9992014 811,1902015 651,508
Accident B: Cumulative Reported ClaimsYear Ended9/30/2015 15 27 39 51 63
2011 10,242 10,343 10,354 10,359 10,3602012 11,386 11,534 11,552 11,5632013 10,667 10,769 10,7862014 7,807 7,8802015 6,222
Accident C: Cumulative Claims Closed With PaymentYear Ended9/30/2015 15 27 39 51 63
2011 5,579 7,043 7,171 7,202 7,2072012 6,017 7,688 7,796 7,8272013 5,814 7,097 7,1832014 4,247 5,1842015 3,352
Accident D: Cumulative Claims Closed Without PaymentYear Ended9/30/2015 15 27 39 51 63
2011 2,995 3,132 3,144 3,148 3,1482012 3,530 3,702 3,719 3,7252013 3,441 3,555 3,5692014 2,540 2,6282015 2,037

Loss DevelopmentPage 6
© 2016, Nationwide
PENNSYLVANIA INSURANCE DEPARTMENT LOSS DEVELOPMENT
NATIONWIDE AFFINITY INSURANCE COMPANY OF AMERICA FIRST PARTY BENEFITS
Accident E: Cumulative Paid Losses (Excluding Loss Adjustment Expense)Year Ended9/30/2015 15 27 39 51 63
2011 22,060,237 25,285,476 25,800,621 26,078,435 26,128,5022012 23,524,740 27,403,829 27,990,241 28,255,0692013 21,709,182 25,047,721 25,565,1682014 16,140,129 18,696,0012015 12,051,762
Accident F: Cumulative Paid Allocated Loss Adjustment ExpenseYear Ended9/30/2015 15 27 39 51 63
2011 145,875 380,131 537,398 635,315 655,5722012 227,946 485,329 628,381 731,5462013 167,022 398,758 490,6582014 110,682 257,1212015 82,241
Accident G: Incurred Losses on a Case, Formula or Reported Basis,Year Ended i.e. Excluding IBNR and/or Bulk Reserves and Loss Adjustment Expenses9/30/2015 15 27 39 51 63
2011 25,745,970 25,922,238 26,131,108 26,237,451 26,226,5142012 27,950,361 28,272,729 28,522,823 28,536,1732013 25,606,307 25,929,960 26,252,1432014 18,920,713 19,763,0372015 14,440,027
Accident H: Incurred ALAE on a Case, Formula or Reported Basis: Year Ended i.e., Excluding IBNR and/or Bulk Reserves9/30/2015 15 27 39 51 63
2011 145,875 380,131 537,398 635,315 655,5722012 227,946 485,329 628,381 731,5462013 167,022 398,758 490,6582014 110,682 257,1212015 82,241
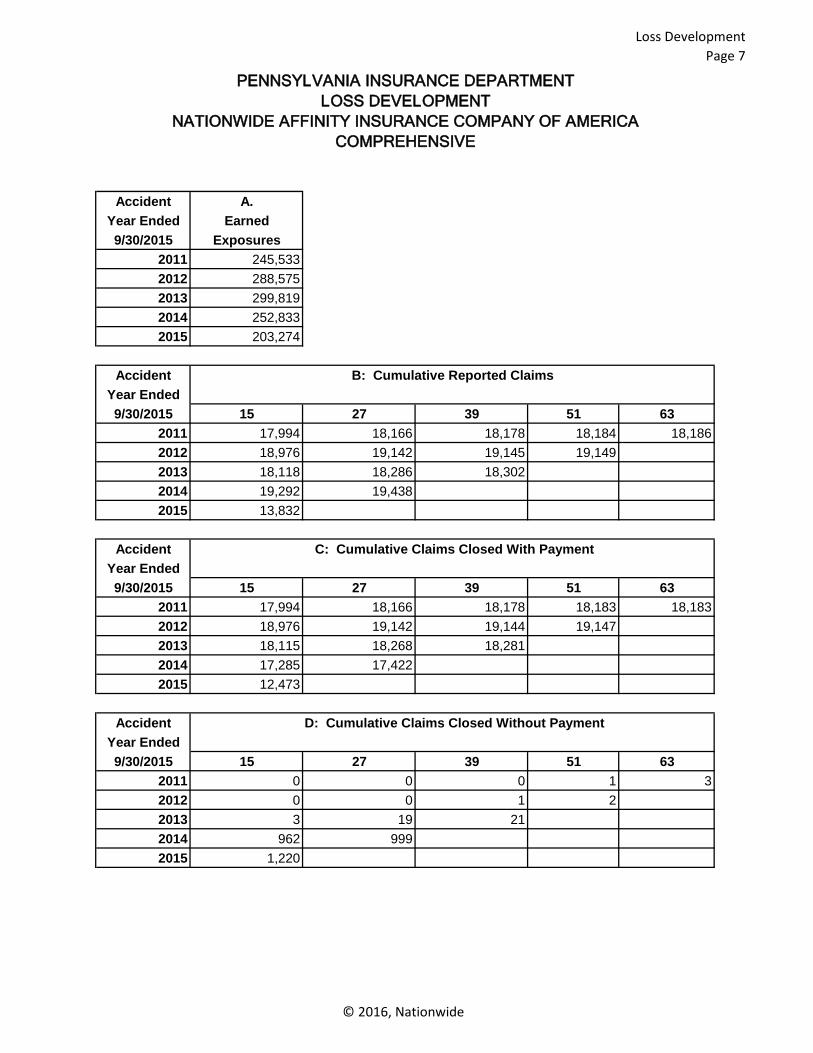
Loss DevelopmentPage 7
© 2016, Nationwide
PENNSYLVANIA INSURANCE DEPARTMENT LOSS DEVELOPMENT
NATIONWIDE AFFINITY INSURANCE COMPANY OF AMERICA COMPREHENSIVE
Accident A.Year Ended Earned9/30/2015 Exposures
2011 245,5332012 288,5752013 299,8192014 252,8332015 203,274
Accident B: Cumulative Reported ClaimsYear Ended9/30/2015 15 27 39 51 63
2011 17,994 18,166 18,178 18,184 18,1862012 18,976 19,142 19,145 19,1492013 18,118 18,286 18,3022014 19,292 19,4382015 13,832
Accident C: Cumulative Claims Closed With PaymentYear Ended9/30/2015 15 27 39 51 63
2011 17,994 18,166 18,178 18,183 18,1832012 18,976 19,142 19,144 19,1472013 18,115 18,268 18,2812014 17,285 17,4222015 12,473
Accident D: Cumulative Claims Closed Without PaymentYear Ended9/30/2015 15 27 39 51 63
2011 0 0 0 1 32012 0 0 1 22013 3 19 212014 962 9992015 1,220

Loss DevelopmentPage 8
© 2016, Nationwide
PENNSYLVANIA INSURANCE DEPARTMENT LOSS DEVELOPMENT
NATIONWIDE AFFINITY INSURANCE COMPANY OF AMERICA COMPREHENSIVE
Accident E: Cumulative Paid Losses (Excluding Loss Adjustment Expense)Year Ended9/30/2015 15 27 39 51 63
2011 22,977,843 23,181,944 23,192,143 23,195,941 23,203,9132012 24,789,551 25,018,105 24,982,681 24,984,9012013 24,936,326 25,179,983 25,215,3332014 22,372,744 22,568,0872015 16,863,734
Accident F: Cumulative Paid Allocated Loss Adjustment ExpenseYear Ended9/30/2015 15 27 39 51 63
2011 41,051 46,038 47,692 47,941 48,0182012 30,003 45,218 47,189 47,3622013 63,022 82,480 116,4072014 10,662 14,9782015 19,053
Accident G: Incurred Losses on a Case, Formula or Reported Basis,Year Ended i.e. Excluding IBNR and/or Bulk Reserves and Loss Adjustment Expenses9/30/2015 15 27 39 51 63
2011 22,977,843 23,181,944 23,192,143 23,195,941 23,203,9132012 24,789,551 25,018,105 24,982,681 24,984,9012013 24,936,326 25,179,983 25,215,5832014 25,354,983 25,513,5832015 17,063,471
Accident H: Incurred ALAE on a Case, Formula or Reported Basis: Year Ended i.e., Excluding IBNR and/or Bulk Reserves9/30/2015 15 27 39 51 63
2011 41,051 46,038 47,692 47,941 48,0182012 30,003 45,218 47,189 47,3622013 63,022 82,480 116,4072014 10,662 14,9782015 19,053
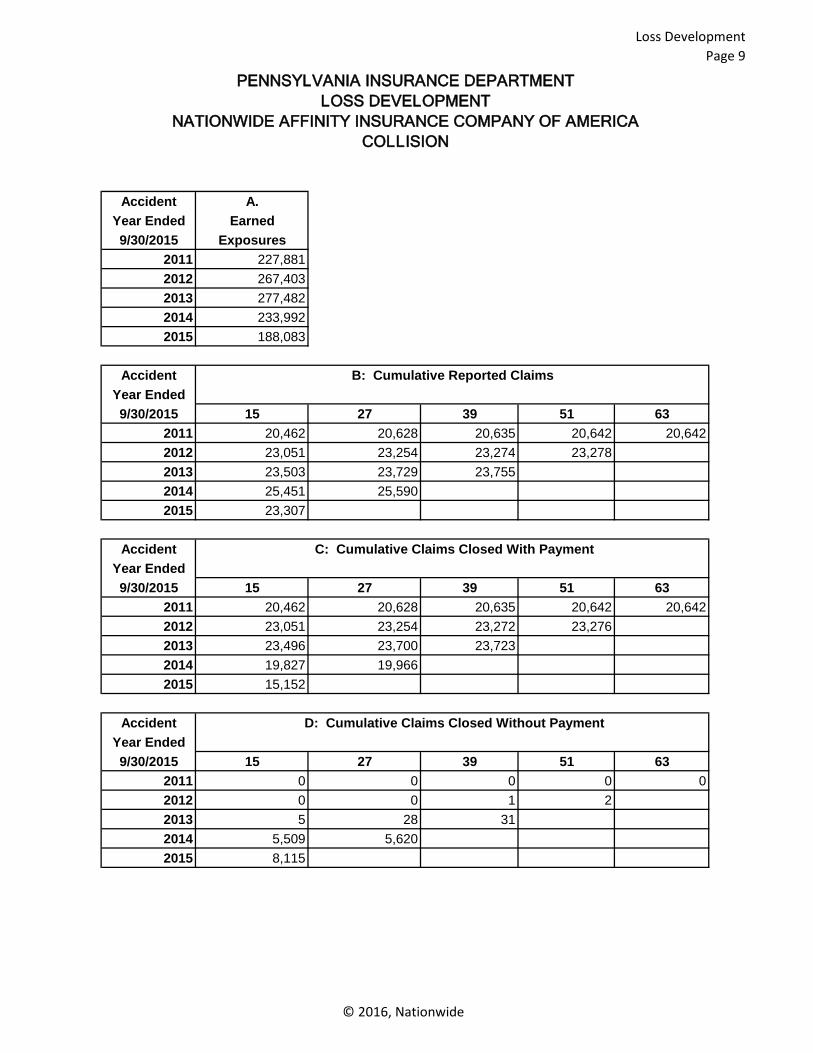
Loss DevelopmentPage 9
© 2016, Nationwide
PENNSYLVANIA INSURANCE DEPARTMENT LOSS DEVELOPMENT
NATIONWIDE AFFINITY INSURANCE COMPANY OF AMERICA COLLISION
Accident A.Year Ended Earned9/30/2015 Exposures
2011 227,8812012 267,4032013 277,4822014 233,9922015 188,083
Accident B: Cumulative Reported ClaimsYear Ended9/30/2015 15 27 39 51 63
2011 20,462 20,628 20,635 20,642 20,6422012 23,051 23,254 23,274 23,2782013 23,503 23,729 23,7552014 25,451 25,5902015 23,307
Accident C: Cumulative Claims Closed With PaymentYear Ended9/30/2015 15 27 39 51 63
2011 20,462 20,628 20,635 20,642 20,6422012 23,051 23,254 23,272 23,2762013 23,496 23,700 23,7232014 19,827 19,9662015 15,152
Accident D: Cumulative Claims Closed Without PaymentYear Ended9/30/2015 15 27 39 51 63
2011 0 0 0 0 02012 0 0 1 22013 5 28 312014 5,509 5,6202015 8,115

Loss DevelopmentPage 10
© 2016, Nationwide
PENNSYLVANIA INSURANCE DEPARTMENT LOSS DEVELOPMENT
NATIONWIDE AFFINITY INSURANCE COMPANY OF AMERICA COLLISION
Accident E: Cumulative Paid Losses (Excluding Loss Adjustment Expense)Year Ended9/30/2015 15 27 39 51 63
2011 57,827,099 56,959,356 56,878,371 56,842,945 56,822,5802012 67,197,210 65,949,362 65,853,756 65,823,6652013 69,804,054 68,286,258 68,167,2172014 59,497,078 58,032,5502015 47,180,481
Accident F: Cumulative Paid Allocated Loss Adjustment ExpenseYear Ended9/30/2015 15 27 39 51 63
2011 160,990 222,396 262,967 277,016 279,2982012 111,251 228,739 279,846 297,1832013 137,249 313,143 372,1792014 89,110 186,2762015 72,705
Accident G: Incurred Losses on a Case, Formula or Reported Basis,Year Ended i.e. Excluding IBNR and/or Bulk Reserves and Loss Adjustment Expenses9/30/2015 15 27 39 51 63
2011 57,827,099 56,959,356 56,878,371 56,842,945 56,822,5802012 67,197,210 65,949,362 65,856,156 65,823,6652013 69,808,854 68,288,658 68,169,8172014 60,331,528 58,613,0622015 47,708,658
Accident H: Incurred ALAE on a Case, Formula or Reported Basis: Year Ended i.e., Excluding IBNR and/or Bulk Reserves9/30/2015 15 27 39 51 63
2011 160,990 222,396 262,967 277,016 279,2982012 111,251 228,739 279,846 297,1832013 137,249 313,143 372,1792014 89,110 186,2762015 72,705

Loss DevelopmentPage 11
© 2016, Nationwide
PENNSYLVANIA INSURANCE DEPARTMENT LOSS DEVELOPMENT
NATIONWIDE AFFINITY INSURANCE COMPANY OF AMERICA UNINSURED MOTORISTS
Accident A.Year Ended Earned9/30/2015 Exposures
2011 269,2062012 314,7772013 325,1382014 272,4492015 217,916
Accident B: Cumulative Reported ClaimsYear Ended9/30/2015 15 27 39 51 63
2011 467 493 501 505 5072012 497 520 538 5432013 330 354 3632014 200 2302015 115
Accident C: Cumulative Claims Closed With PaymentYear Ended9/30/2015 15 27 39 51 63
2011 145 240 260 275 2822012 159 231 274 2802013 94 154 1772014 82 1302015 44
Accident D: Cumulative Claims Closed Without PaymentYear Ended9/30/2015 15 27 39 51 63
2011 183 209 220 222 2232012 208 238 250 2582013 139 165 1742014 66 832015 26

Loss DevelopmentPage 12
© 2016, Nationwide
PENNSYLVANIA INSURANCE DEPARTMENT LOSS DEVELOPMENT
NATIONWIDE AFFINITY INSURANCE COMPANY OF AMERICA UNINSURED MOTORISTS
Accident E: Cumulative Paid Losses (Excluding Loss Adjustment Expense)Year Ended9/30/2015 15 27 39 51 63
2011 890,335 2,254,917 2,650,036 3,260,350 3,550,4712012 1,284,915 2,750,983 3,808,057 3,954,0692013 520,246 1,943,527 2,714,5122014 849,604 1,931,1902015 467,842
Accident F: Cumulative Paid Allocated Loss Adjustment ExpenseYear Ended9/30/2015 15 27 39 51 63
2011 15,757 73,912 157,137 242,094 274,9602012 12,165 64,304 206,853 240,4562013 11,488 36,028 100,2442014 11,649 65,6532015 7,040
Accident G: Incurred Losses on a Case, Formula or Reported Basis,Year Ended i.e. Excluding IBNR and/or Bulk Reserves and Loss Adjustment Expenses9/30/2015 15 27 39 51 63
2011 3,263,403 3,159,022 3,328,541 3,611,352 3,577,9712012 3,188,664 3,687,903 4,067,058 4,032,7612013 2,211,522 2,858,097 3,012,0802014 2,025,254 2,297,6882015 1,134,242
Accident H: Incurred ALAE on a Case, Formula or Reported Basis: Year Ended i.e., Excluding IBNR and/or Bulk Reserves9/30/2015 15 27 39 51 63
2011 15,757 73,912 157,137 242,094 274,9602012 12,165 64,304 206,853 240,4562013 11,488 36,028 100,2442014 11,649 65,6532015 7,040

Loss DevelopmentPage 13
© 2016, Nationwide
PENNSYLVANIA INSURANCE DEPARTMENTLOSS DEVELOPMENT
NATIONWIDE AFFINITY INSURANCE COMPANY OF AMERICAUNDERINSURED MOTORISTS
Accident A.Year Ended Earned9/30/2015 Exposures
2011 266,3052012 311,4602013 321,7732014 269,7202015 215,873
Accident B: Cumulative Reported ClaimsYear Ended9/30/2015 15 27 39 51 63
2011 213 361 433 456 4682012 222 386 494 5332013 220 361 4472014 122 2362015 132
Accident C: Cumulative Claims Closed With PaymentYear Ended9/30/2015 15 27 39 51 63
2011 47 167 246 279 2942012 56 185 283 3412013 67 178 2622014 29 1062015 33
Accident D: Cumulative Claims Closed Without PaymentYear Ended9/30/2015 15 27 39 51 63
2011 50 88 116 136 1482012 47 89 130 1502013 48 96 1332014 28 582015 15

Loss DevelopmentPage 14
© 2016, Nationwide
PENNSYLVANIA INSURANCE DEPARTMENTLOSS DEVELOPMENT
NATIONWIDE AFFINITY INSURANCE COMPANY OF AMERICAUNDERINSURED MOTORISTS
Accident E: Cumulative Paid Losses (Excluding Loss Adjustment Expense)Year Ended9/30/2015 15 27 39 51 63
2011 1,926,150 5,444,893 7,834,056 9,220,406 9,630,4062012 2,755,049 8,160,304 11,617,963 15,409,9622013 2,649,809 7,261,429 10,349,9502014 1,932,300 6,086,1652015 1,280,186
Accident F: Cumulative Paid Allocated Loss Adjustment ExpenseYear Ended9/30/2015 15 27 39 51 63
2011 16,719 55,650 150,593 209,515 275,7622012 17,417 99,166 239,852 492,8732013 14,892 57,262 204,8682014 5,949 67,0072015 4,466
Accident G: Incurred Losses on a Case, Formula or Reported Basis,Year Ended i.e. Excluding IBNR and/or Bulk Reserves and Loss Adjustment Expenses9/30/2015 15 27 39 51 63
2011 6,683,206 9,543,945 10,631,839 10,618,920 10,631,4202012 8,140,593 12,599,039 15,622,042 17,262,9772013 6,659,862 10,551,032 12,382,7682014 6,246,946 9,068,7672015 5,130,499
Accident H: Incurred ALAE on a Case, Formula or Reported Basis: Year Ended i.e., Excluding IBNR and/or Bulk Reserves9/30/2015 15 27 39 51 63
2011 16,719 55,650 150,593 209,515 275,7622012 17,417 99,166 239,852 492,8732013 14,892 57,262 204,8682014 5,949 67,0072015 4,466