Download - use and acceptance of information and
USE AND ACCEPTANCE OF INFORMATION AND
COMMUNICATION TECHNOLOGIES (ICTS) BY UNIVERSITY
STUDENTS: DEVELOPING A MODEL FOR THE SRI LANKAN
CONTEXT
BY
G D MANOJA NILANTHI SAMARADIWAKARA
(2011/MPhil-PhD/040)
submitted in accordance with the requirements for the degree of
DOCTOR OF PHILOSOPHY
FACULTY OF GRADUATE STUDIES
UNIVERSITY OF COLOMBO
COLOMBO
SRI LANKA
SUPERVISOR: PROFFESSOR CHANDRA GUNAWARDENA
May/2015

ii
DECLARATION OF THE CANDIDATE
Student number: 2011/MPhil-PhD/040
I declare that the study, Use and acceptance of ICTs by university students: developing a
model to the Sri Lankan context is my own work and the thesis contains no material that has
been submitted previously, in whole or in part, for the award of any other academic degree.
___________________________ 29th
May 2015
Signature Date
(G D Manoja N Samaradiwakara)
iii
DECLARATION OF THE SUPERVISOR
I hereby certify that the dissertation contains the results of the research study
conducted by the candidate, G D M N Samaradiwakara under my supervision and
I would like to recommend it for the final submission.
------------------------------ -------------------------
Supervisor Date
Prof. Chandra Gunawardena
Emeritus Professor of Education,
Open University of Sri Lanka,
Nawala, Nugegoda,
Sri Lanka.
iv
ACKNOWLEDGEMENTS
First and foremost I am extremely grateful to my supervisor Professor Chandra Gunawardena
who guided this research drawing upon her wealth of experience as an eminent researcher. I
particularly need to express my deepest gratitude and sincere appreciation to her whose kindness,
hospitality, knowledge, wisdom, motherliness and friendship have supported, enlightened and
encouraged me over the period of my research.
I wish to gratefully acknowledge, Dr. A A C Abeysinghe, the Course Coordinator and the Dean,
Prof. Sunil Chandrasiri, Faculty of Graduate Studies, University of Colombo for their guidance
in all endeavors. I must also gratefully appreciate the unflagging support of Prof. James Eric
Gaskin, Marriott School of Management, Brigham Young University, Provo, Utah, who helped
to make my research statistically realistic.
My doctoral study was financially supported by the University of Sri Jayewardenepura and I
thank my university, especially Dr. N L A Karunaratne, Mr. Punchibanda Gallaba, Prof,
Sampath Amaratunge, Prof. Sudantha Liyanage for their kind assistance and Dr. N D
Wijayasundara, without whose support, I would not have been able to complete the research.
It is with heartfelt appreciation and gratitude I acknowledge Mr. P. Vidanapathirana and my
heartiest friend Rasali Samaravickrama the driving forces behind most of my personal and
professional achievements. Thank you for being the wind beneath my wings.
My warmest thanks must go to my friends of the University of Colombo, University of Sri
Jayewardenepura, University of Ruhuna and South- Eastern University of Sri Lanka, and my
PhD batch mates for their fullest support given in collecting data and the interviewees as well as
students who responded to my survey.
Sometimes the words “Thank you very much” are not enough for their kindness in trying to help
one pass the obstacles to the goal that one wants to achieve. They are my mother and mother-in-
law not only for their spiritual and emotional guidance but also for their love and caring.
Last but certainly not least, my special thanks should also go to my beloved husband Buddhin,
for his continuous support, encouragement, and patience. Thank you for caring and
understanding. It’s because of that I was able accomplish this great task successfully as
anticipated.
v
ABSTRACT
Information and Communication Technology (ICT) is an umbrella term that covers all
technologies in retrieving and communicating information and it has turned the world into a
global village enabling the compression of time and space. This circumstance has led to a
paradigm shift in higher education of Sri Lanka in an effort to capture ICTs to a large extent, as it
is the foremost important method to create a technology-equipped generation as effective users
of ICTs to cope with the present job market demands. However, literature reveals a lack of
sufficient interest in individual use and acceptance of ICTs among Sri Lankan university
students. Many researchers in other countries have studied and proposed theories and models on
individual use and acceptance of technologies to facilitate predicting individual user behavior
with technology over a rapid change in both technologies and their environments. Each theory or
model consists of different sets of determinants and moderators exclusive to their own countries.
It is therefore questioned whether these theories and models can be used in outside contexts,
especially in countries like Sri Lanka. Many researchers have also found that individual cultural
values have a strong contextual influence on individual use and acceptance of ICTs. Therefore,
the current research aims at proposing a parsimonious and a robust model, which best describes
the individual use and acceptance of ICTs among university students in Sri Lanka with the
intention of promoting usage and future acceptance. The research study involved a combination
of positivist and phenomenological inquiries that led to the use of qualitative and quantitative
approaches. The design of the study consisted of two main phases: the exploratory study and the
main study. The exploratory study was carried out to check the feasibility of the research and the
main study, tested the conceptual model using structured questionnaires from 1681 of university
students. Statistical analysis methods and Structural Equation Modeling were employed with
SPSS version 21 with AMOS to analyze data. The model developed, ICT Use and Acceptance
Model (ICTUAM), was finalized with an excellent model fit. Performance expectancy and
facilitating conditions are the determinants which describe the current ICT usage behavior and
the performance expectancy, effort expectancy, social influence and current usage behavior play
important roles in determining the behavior intention to future use of ICTs.
Masculinity/femininity moderated the relationship between performance expectancy and current
usage behavior. Power distance moderated the relationship between performance expectancy and
the behavior intention to future use of ICTs. The relationship between the social influence and
behavior intention to future use of ICTs was moderated by the main subject stream,
masculinity/femininity, individualism/collectivism and uncertainty avoidance.
Individualism/collectivism moderated the relationship between effort expectancy and behavior
vi
intention to future use of ICTs. The model is a useful tool to suggest strategies to improve the
use and acceptance of ICTs to gain skills and thereby contribute to accrue higher dividends for
the individuals as well as the society as a whole.
vii
TABLE OF CONTENTS
PAGE
DECLARATION OF THE CANDIDATE......................................................... ii
DECLARATION OF THE SUPERVISOR........................................................ iii
ACKNOWLEDGEMENT.................................................................................. iv
ABSTRACT........................................................................................................ v
TABLE OF CONTENTS.................................................................................... vii
LIST OF ABBREVIATIONS............................................................................. xiv
LIST OF TABLES.............................................................................................. xvii
LIST OF FIGURES............................................................................................. xix
CHAPTER 1: INTRODUCTION TO THE STUDY
1.1 Introduction.....………………………………………………………………… 1
1.2 Background of the study…………..………………………………………....... 1
1.2.1 ICT background……..…………………………………….................. 2
1.2.1.1 ICT evolution in Sri Lanka....……………………………… 2
1.2.1.2 ICTs and education in Sri Lanka........................................... 4
1.2.1.3 ICTs and meeting employer demands……………………... 6
1.2.2 Theoretical background ……………………………………………... 9
1.2.3 Empirical background ………………………………………………. 12
1.2.4 Statement of the problem …………………………………………… 14
1.2.5 Purpose of the study ………………………………………………… 15
1.2.5.1 Objectives of the study ……………………………………. 15
1.2.5.2 Research questions ………………………………………... 15
1.3 Research design and methodology ……………………………………………. 15
1.4 Scope of the study ………………………………………………….................. 17
1.5 Originality and the contributions of the research................................................ 18
1.6 Significance of the research ………………………………............................... 19
1.7 Definition of terms …………………………………………………................. 21
1.8 Structure of the thesis …………………………………………………………. 21
CHAPTER 2: REVIEW OF THEORETICAL AND EMPIRICAL LITERATURE
2.1 Introduction …………………………………………………………………… 23
2.2 Use and acceptance of ICTs in universities………………………..………….. 23
2.2.1 Different ICT uses in universities......………………..…………….... 24
viii
2.2.2 Factors affecting ICT use and acceptance in universities…………… 26
2.3 Technology acceptance theories and models …………………………………. 27
2.3.1 Cognitive Dissonance Theory (CDT) ………………………………. 28
2.3.2 Innovation Diffusion Theory (IDT) ………………………………… 28
2.3.3 Task Technology Fit Model (TTF) …………………………………. 28
2.3.4 Expectation-Disconfirmation Theory (EDT) ……………………….. 29
2.3.5 Theory of Reasoned Action (TRA) …………………………………. 30
2.3.6 Theory of Planned Behaviour (TPB) ……………………………….. 31
2.3.7 Social Cognitive Theory (SCT) …………………………………….. 31
2.3.8 Technology Acceptance Model (TAM) …………………………….. 32
2.3.9 Model of PC Utilization (MPCU) …………………………………... 33
2.3.10 Motivational Model (MM) ………………………………………….. 33
2.3.11 Decomposed Theory of Planned Behaviour (DTPB)……………….. 33
2.3.12 Combined TAM and TPB (C-TAM-TPB) ………………………….. 34
2.3.13 Technology Acceptance Model (TAM2) …………………………… 35
2.3.14 The Unified Theory of Acceptance and Use of Technology
(UTAUT).............................................................................................. 36
2.4 Comparison of technology acceptance theories/models………………………. 37
2.5 The cultural dimensions and ICT use and acceptance………………………… 41
2.6 Analysis of the applicability of technology acceptance theories/models……… 43
2.6.1 UTAUT applications in university settings…………………………... 44
2.6.1.1 Context consideration of UTAUT in university settings…. 45
2.6.1.2 Endogenous/exogenous variable considerations in
UTAUT within university settings………………………..
46
2.6.1.3 Moderators/ other variable considerations in UTAUT
within university settings………………………………….
48
2.6.1.4 Hofstede’s cultural factor considerations with UTAUT in
university settings…………………………………………
50
2.7 Summary of the literature review........................................................................ 52
2.8 Summary............................................................................................................. 53
CHAPTER 3: THEORETICAL FRAMEWORK AND HYPOTHESES
3.1 Introduction......................................................................................................... 54
3.2 Basic concepts of the theoretical framework...................................................... 54
3.3 Theoretical framework........................................................................................ 55
ix
3.3.1 Identification of dependent variables………………………………… 55
3.3.2 Identification of core determinants…………………………………… 56
3.3.2.1 Performance Expectancy (PE) …………………………… 57
3.3.2.2 Effort Expectancy (EE) ………………………………….. 57
3.3.2.3 Social Influence (SI) …………………………………….. 57
3.3.2.4 Facilitating Conditions (FC) …………………………… 58
3.3.3 Identification of socio-demographic moderators……………………... 59
3.3.3.1 Age, gender and ICT experience…………………………. 59
3.3.3.2 Common subject stream....................................................... 60
3.3.4 Identification of cultural factors............................................................ 60
3.3.4.1 Power Distance (PD)…………………………………… 60
3.3.4.2 Uncertainty Avoidance (UA)…………………………… 61
3.3.4.3 Individualism-Collectivism (IC)………………………….. 61
3.3.4.4 Masculinity-Femininity (MF)…………………………….. 62
3.4 Theoretical framework of the study.................................................................... 63
3.4.1 Hypotheses of the model........................................................................ 64
3.4.1.1 Direct path hypotheses......................................................... 64
3.4.1.2 Moderating hypotheses........................................................ 64
3.5 Summary............................................................................................................. 66
CHAPTER 4: RESEARCH DESIGN AND METHODOLOGY
4.1 Introduction......................................................................................................... 67
4.2 Research process................................................................................................. 67
4.2.1 Research philosophy.............................................................................. 68
4.2.2 Research approach................................................................................. 70
4.2.3 Research strategy................................................................................... 71
4.2.4 Research choice..................................................................................... 71
4.2.5 Time horizon.......................................................................................... 72
4.2.6 Technique and procedure...…………………………………………… 72
4.3 Research framework............................................................................................ 73
4.4 Phase 1: Exploratory study.................................................................................. 73
4.4.1 Step One: Identify the area of ICT use and acceptance......................... 73
4.4.2 Step Two: Drawing a list of determinants of ICT use and acceptance
and ICT tools which graduates should be skilled with..........................
74
x
4.4.3 Step Three: Developing a questionnaire to gather preliminary data on
ICT use and acceptance environment and to identify determinants
and the important ICT tools...................................................................
74
4.4.4 Step Four: Conducting the semi-structured interviews/focus group
discussions to gather information..........................................................
75
4.4.5 Step Five: Data analysis.......................................................................... 76
4.5 Phase 2 - Main study........................................................................................... 77
4.5.1 Step One: Conducting the questionnaire survey.................................... 77
4.5.1.1 Population............................................................................ 77
4.5.1.2 Sampling and the sample..................................................... 79
4.5.1.3 Main study-data collection................................................... 80
4.5.1.3.1 Questionnaire..................................................... 81
4.5.1.3.2 Questionnaire designing.................................... 81
4.5.1.3.3 Pre-testing of the questionnaire......................... 83
4.5.1.3.4 Pilot survey........................................................ 84
4.5.1.3.5 Data collection procedure.................................. 85
4.5.1.3.6 Data editing and coding..................................... 85
4.5.2 Step Two: Data analysis........................................................................ 85
4.5.2.1 Reliability analysis............................................................... 85
4.5.2.2 Validity test.......................................................................... 86
4.5.2.3 Descriptive statistics............................................................ 86
4.5.2.4 Chi-square test..................................................................... 86
4.5.2.5 Independent-k-sample test (Kruskal-Wallis test)................ 86
4.5.2.6 Structural Equation Modelling (SEM)................................. 87
4.5.2.7 Multi-group moderation....................................................... 89
4.5.3 Step Three: Model selection.................................................................. 89
4.6 Summary............................................................................................................. 92
CHAPTER 5: EXPLORATORY STUDY-DATA ANALYSIS AND FINDINGS
5.1 Introduction......................................................................................................... 93
5.2 Semi-structured interviews.................................................................................. 93
5.3 Analysis of interview data................................................................................... 94
5.3.1 Background information of the interviewees......................................... 94
5.3.2 Thematic analysis of the interviews....................................................... 96
5.3.2.1 Importance of ICTs for graduates........................................ 96
xi
5.3.2.2 Current situation of ICT environment of universities and
graduates’ performance on ICTs..........................................
99
5.3.2.3 Enthusiasm and the major reasons for using ICTs.............. 102
5.3.2.4 Differences among undergraduates/ graduates in their
levels of performance of ICTs.............................................
105
5.3.2.5 Strategies to promote ICT use of students........................... 107
5.3.3 Commonly important ICT tools for graduates....................................... 109
5.4 Summary............................................................................................................. 110
CHAPTER 6: MAIN STUDY-PRELIMINARY DATA ANALYSIS AND FINDINGS
6.1 Introduction......................................................................................................... 112
6.2 Reliability and validity analysis.......................................................................... 112
6.3 Profile of the responses....................................................................................... 113
6.4 Socio-demographic background of the respondents........................................... 114
6.5 Individual cultural values.................................................................................... 115
6.6 Background of ICT use of the respondents........................................................ 116
6.6.1 Differences of the background of ICT use according to demographic
factors.....................................................................................................
117
6.7 Types of ICT tools used by the students and intention to use............................. 118
6.8 Extent to which students’ use and intention to use ICTs for various
purposes...............................................................................................................
120
6.8.1 Use behaviour of ICTs for various purposes and intention to use on
average...................................................................................................
121
6.8.2 Use behaviour of ICTs for various purposes and intention to use as
percentages.............................................................................................
121
6.8.3 Current use and intention to use of ICTs according to socio-
demographic factors...............................................................................
122
6.8.3.1 Common subject stream....................................................... 122
6.8.3.2 Gender.................................................................................. 123
6.8.3.3 Age....................................................................................... 123
6.8.3.4 ICT experience..................................................................... 123
6.9 Motivation to make full use of ICTs................................................................... 123
6.9.1 Differences in motivation to make full use of ICTs with socio-
demographic factors...............................................................................
124
6.10 Comments on ICT use and future acceptance..................................................... 124
xii
6.11 Summary............................................................................................................. 125
CHAPTER 7: MAIN STUDY-ICT USE AND ACCEPTANCE MODELLING
7.1 Introduction......................................................................................................... 127
7.2 Constructs of the research model........................................................................ 127
7.3 Reliability of the constructs................................................................................. 128
7.4 Validity of the constructs.................................................................................... 129
7.4.1 Discriminant validity of exogenous constructs...................................... 130
7.4.2 Discriminant validity of endogenous constructs.................................... 131
7.5 ICT use and acceptance model............................................................................ 132
7.5.1 Phase 1: Basic model............................................................................. 132
7.5.2 Phase 2: Model with moderator effects................................................. 139
7.6 ICT Use and Acceptance Model (ICTUAM)...................................................... 143
7.7 Summary............................................................................................................. 144
CHAPTER 8: CONCLUSIONS AND SUGGESTIONS
8.1 Introduction......................................................................................................... 145
8.2 Key findings........................................................................................................ 145
8.2.1 Socio-demographic and cultural background of the respondents.......... 145
8.2.2 Students’ background in relation to ICT use......................................... 146
8.2.3 Types of ICT tools used by the students and their intention to use....... 147
8.2.4 Extent to which university students use and intention to use
ICTs.......................................................................................................
147
8.2.5 Effect of socio-demographic factors on ICT use and intention to
use..........................................................................................................
148
8.2.6 Motivations to make full use of ICTs.................................................... 148
8.2.7 Students’ comments on use and future acceptance of
ICTs.......................................................................................................
149
8.3 ICT use and acceptance model............................................................................ 149
8.4 Overall implications of the research.................................................................... 154
8.4.1 Methodological contribution.................................................................. 154
8.4.2 Practical contribution............................................................................. 154
8.5 Limitations of the study....................................................................................... 156
8.6 Suggestions for further research.......................................................................... 156
8.7 Summary............................................................................................................. 157
xiii
BIBLIOGRAPHY........................................................................................................ 159
APPENDISES
Appendix I: Different ICT uses in universities............................................................. 185
Appendix II: Applicability of technology acceptance theories/models........................ 190
Appendix III: Socio-demographic factors used by past researchers............................ 206
Appendix IV: Exploratory study questionnaire............................................................ 208
Appendix V: Subjects of the Exploratory study........................................................... 210
Appendix VI: Main study-Questionnaire..................................................................... 212
Appendix VII: Data coding sheet................................................................................. 219
Appendix VIII: Missing data analysis.......................................................................... 224
Appendix IX: Descriptive statistics.............................................................................. 226
Appendix X: Semi structured interview schedule........................................................ 228
Appendix XI: Individual cultural values...................................................................... 230
Appendix XII: Kruskal-Wallis test results................................................................... 233
Appendix XIII: Correlations and covariance.............................................................. 242
xiv
LIST OF ABBREVIATIONS
ADB Asian Development Bank
ADSL Asymmetric Digital Subscriber Line
AIC Akaike Information Criterion
AMOS Analysis of Moment Structures
ANOVA Analysis of variance
BI Behaviour Intention
CDT Cognitive Dissonance Theory
CFI Comparative Fit Index
CINTEC Computer and Information Technology Council of Sri Lanka
CLC Computer Learning Center
COMPOL National Computer Policy for Sri Lanka
CRC Computer Resource Center
C-TAM-TPB Combined TAM and TPB
DF Degrees of Freedom
DTPB Decomposed Theory of Planned Behavior
ECT Expectation Confirmation Theory
EDT Expectation Disconfirmation Theory
EE Effort Expectancy
ELTU English Language Teaching Units
FC Facilitating Conditions
FGD Focus Group Discussion
GCE General Certificate of Examination
GFI Goodness- of- Fit Index
HETC Higher Education for Twenty first Century
HSPA High Speed Packet Access
IBM International Business Machines corporation
IC Individualism-Collectivism
ICT Information and Communication Technology
ICTA Information and Communication Technology Agency of Sri Lanka
ICTUAM ICT Use And Acceptance Model
IDT Innovations Diffusion Theory
IS Information System
ISP Internet Service Provider
xv
IT Information Technology
LEARN Lanka Education and Research Network
MF Masculinity-Femininity
MIS Managing Information Systems
ML Maximum likelihood
MM Motivational Model
MoE Ministry of Education
MPCU Model of Personal Computer Utilization
MPhil Master of Philosophy
MS MicroSoft
NFI Normed Fit Index
NNFI Non-Normed Fit Index
NREN National Research and Education Network
O/L Ordinary-Level
PD Power Distance
PE Performance Expectancy
PGFI Parsimony Goodness-of-Fit Index
PhD Doctor of Philosophy
RMSEA Root Mean Square Error of Approximation
SCT Social Cognitive Theory
SEM Structural Equation Modelling
SEUSL South-Eastern University of Sri Lanka
SI Social Influence
SLT Sri Lanka Telecom
SMC Squared Multiple Correlations
SN Social Norms
SPSS Statistical Package for the Social Sciences
SQL Structured Query Language
SRMR Standardized Soot Mean Square Residual
TAM Technology Acceptance Model
TCP/IP Transmission Control Protocol/Internet Protocol
TLI Tucker-Lewis Index
TPB Theory of Planned Behaviour
TRA Theory of Reasoned Action
xvi
TTF Task-Technology Fit
UA Uncertainty Avoidance
UB Use Behavior
UCTIT University students Competency Test for Information Technology
UGC University Grant Commission
UK United Kingdom
ULS Un-weighted Least Squares
UNESCO United Nations Educational, Scientific and Cultural Organization
USA United State s of America
UTAUT Unified Theory of Acceptance and Use of Technology
VLE Virtual Learning Environments
WAN Wide Area Networks
WIMAX Worldwide Interoperability for Microwave
WWW World Wide Web
xvii
LIST OF TABLES
PAGE
CHAPTER 1
Table 1.1 Research propositions................................................................................ 17
CHAPTER 2
Table 2.1 Technology acceptance theories/models comparison................................ 40
Table 2.2 Summary for the most known cultural dimensions.................................... 42
Table 2.3 Endogenous/exogenous predictors of UTAUT variables used in university
settings..................................................................................................................
47
Table 2.4 Moderators and other variables used in UTAUT in university settings..... 49
Table 2.5
Relationships between the Hofstede’s cultural dimensions used with
technology acceptance models in university settings.................................
51
CHAPTER 4
Table 4.1 Methodological design of the exploratory study........................................ 74
Table 4.2 Methodological design of the main study.................................................. 77
Table 4.3 Study population of the research................................................................ 78
Table 4.4 Sample of the study.................................................................................... 79
Table 4.5 Structure of the questionnaire.................................................................... 82
Table 4.6 Reference of model fit indices................................................................... 91
CHAPTER 5
Table 5.1 Subject dynamics of the exploratory study................................................ 95
Table 5.2 Descriptive statistics of commonly important ICT tools........................... 110
CHAPTER 6
Table 6.1 Results of the reliability and validity tests................................................. 113
Table 6.2 Profile of the questionnaire responses........................................................ 114
Table 6.3 Socio-demographic characteristics of the respondents.............................. 115
Table 6.4 Means of the cultural factors...................................................................... 115
Table 6.5 Background information of personal ICT use............................................ 117
Table 6.6 Distribution of the ICT experience with demographic factors................... 118
Table 6.7 Distribution of the ICT skills with demographic factors............................ 118
Table 6.8 Current frequency of use of different ICT tools by university 119
xviii
students.......................................................................................................
Table 6.9 Frequency (means and modes) of intention to use of ICT tools................ 120
Table 6.10 Frequency (means and modes) of use of ICTs for different purposes and
intention to use...........................................................................................
121
Table 6.11 Current frequency of use of ICTs for different purposes........................... 121
Table 6.12 Summary of the Kruskal-Wallis test results (no. of significantly
different variables).....................................................................................
122
Table 6.13 Motivations to make full use of ICTs......................................................... 124
Table 6.14 Frequency of comments on ICT usage and acceptance............................. 125
CHAPTER 7
Table 7.1 Constructs in the research model............................................................... 127
Table 7.2 SMC of 15 items of four exogenous latent constructs............................... 128
Table 7.3 SMC of 15 items of two endogenous latent constructs.............................. 129
Table 7.4 Correlations of four exogenous latent constructs....................................... 130
Table 7.5 Regression weights of the modified model................................................ 136
Table 7.6 Standardized regression weights of the modified model........................... 136
Table 7.7 Covariance between the factors in modified model................................... 137
Table 7.8 Regression weights of the final model....................................................... 139
Table 7.9 Summary of findings – Multi-group moderation (z-scores)...................... 141
Table 7.10 Summary of findings – Multi-group moderation (estimates, p-values and
z-scores).....................................................................................................
142
xix
LIST OF FIGURES
PAGE
CHAPTER 2
Figure 2.1 A model of five stages in the innovation- decision process...................... 29
Figure 2.2 Task Technology Fit (TTF) model............................................................ 29
Figure 2.3 Model of the Expectation-Disconfirmation Theory..................................... 30
Figure 2.4 Model of the TRA..................................................................................... 30
Figure 2.5 Model of TPB............................................................................................ 31
Figure 2.6 Model of SCT............................................................................................ 32
Figure 2.7 TAM.......................................................................................................... 33
Figure 2.8 Model of the DTPB................................................................................... 34
Figure 2.9 Model of C-TAM-TPB............................................................................. 34
Figure 2.10 TAM2 model............................................................................................. 35
Figure 2.11 UTAUT model.......................................................................................... 36
CHAPTER 3
Figure 3.1 Basic concept of technology acceptance............................................................. 55
Figure 3.2 Theoretical model of the study.................................................................. 65
CHAPTER 4
Figure 4.1 The research process onion....................................................................... 68
CHAPTER 7
Figure 7.1 Standardized estimates for four exogenous latent constructs................... 131
Figure 7.2 Standardized estimates for two endogenous latent constructs.................. 133
Figure 7.3 Initial model with standardized estimates................................................. 134
Figure 7.4 Modified model with standardized estimates............................................ 135
Figure 7.5 Final basic model with standardized estimates......................................... 138
Figure 7.6 ICT Use and Acceptance Model (ICTUAM)............................................ 143
1
CHAPTER 1
INTRODUCTION TO THE STUDY
1.1 INTRODUCTION
This chapter provides an overview of the study. It initially presents the background to the study
in detail. Then the problem statement explains why an analysis of the use and acceptance of ICTs
by university students is needed in the Sri Lankan context. It also presents the theoretical
perspectives, a brief review of the past studies, research aim and objectives, significance and
scope of the study, originality of the research, operational definitions, methodology, contribution
and the structure of the thesis.
1.2 BACKGROUND OF THE STUDY
Studying the environment of an individual's use of information technology has been a goal of
Managing Information Systems (MIS) research since the mid-1970s, when organizations and
researchers found that the adoption of novel technology was not living up to expectations
(Compeau & Higgins, 1995). Therefore, technology adoption is now one of the most mature
streams specifically in Information Systems research (Vessey, Ramesh, & Glass, 2002;
Venkatesh, Morris, Davis, & Davis, 2003; Straub & Burton-Jones, 2007; Brown, Dennis, &
Venkatesh, 2010). Two other major disciplines have also contributed to the development of
models and theories addressing technology use, future acceptance and adoption: Psychology and
Sociology. These disciplines focus on technology use and acceptance behavior, whereas
Information Systems focuses on systems’ characteristics in relation to technology acceptance.
One of the benefits of such maturity is the availability of frameworks and models that can be
applied to the study of relevant emerging problems.
ICT can be defined as a “diverse set of technological tools and resources used to communicate,
to create, disseminate, store, and manage information” (Blurton, 1999). These technologies
include computers, the Internet, broadcasting technologies (radio and television), and telephony
(Tinio, 2002). While the older technologies such as the radio and television are now given less
attention, computers and the Internet have become more prominent. However, the most
prominent mechanism is the smart phones which couple wireless networks and mobile
communications with personal computing devices and present new means for the 21st century
technological revolution. Therefore, computer application software and the Internet application
tools and resources used to communicate, and to create, disseminate, store, and manage
2
information which access via desktop computers, laptop computers, the Internet enabled smart
phones and other handheld devices is considered as ICTs for the current study and their current
use and future acceptance is examined.
ICT adoption is therefore often studied in various contexts; their use, future acceptance, factors
affecting their use and acceptance etc. With the ongoing development of ICTs and the
diversification of the fields it affects, various theoretical studies have been carried out in order to
ensure a better understanding of its diffusion, adoption, usage and acceptance (Rogers, 1983;
Davis, 1989; Taylor & Todd, 1995; Venkatesh & Davis, 2000; Venkatesh et al., 2003; Wang,
Wu, & Wang, 2009). As such, technology acceptance research is a constantly developing field,
as new technologies keep evolving all the time. Therefore, the same studies may not be relevant
as they will not be constant across time and in different contexts.
According to the literature review, there has been very little effort to investigate the use and
acceptance of ICTs from a theoretical perspective in university settings. Due to the non-
availability of such specific studies, especially in Sri Lanka, the current research aims to fill this
gap by examining the use and acceptance of ICTs of university students, while at the same time
developing a parsimonious and a robust model which can best describe the use and acceptance of
ICTs by university students in the Sri Lankan context.
1.2.1 ICT background
ICTs have quickly become a crucial part of our global society and is dramatically transforming
the world, facilitating innovation and productivity increases, connecting people and
communities, and improving standards of living and opportunities across the globe (Dutta &
Mia, 2011) enabling the compression of time and space. This circumstance has led to a paradigm
shift in education capturing ICTs in a large degree, as it is the foremost important method to
create a technology equipped generation (Aryasinha, 2002; Godamanna & Jayamaha, 2013).
1.2.1.1 ICT evolution of Sri Lanka
Sri Lanka has a long history of ICT development, beginning with the formulation of the National
Computer Policy for Sri Lanka (COMPOL) in 1983 which identified key areas of development
in the use of computers. Then the Computer and Information Technology Council of Sri Lanka
(CINTEC), which later became the Council for Information Technology was established in 1984
in the Ministry of Higher Education and Information Technology Development on the
recommendations of CINTEC. This was entrusted to make policy recommendations regarding
ICTs use in the country and monitor developments and achievements. Later, under the ICT Act
3
No. 27of 2003 the CINTEC was transferred to the Information and Communication Technology
Agency of Sri Lanka (ICTA). ICTA was established to set out the e-Sri Lanka vision to harness
ICT as a lever for economic and social advancement.
The first attempt of Sri Lanka in ICT adaptation occurred in 1960’s (Aryasinha, 2002). As
Ranasinghe (2004) highlighted, the ICT adaptation took place at a very slow speed in its first
phase and limited IT facilities were available only in selected government institutes such as the
Department of Census and Statistics. The process has further accelerated since 1991 after the
establishment of Sri Lanka Telecom (SLT). The Internet access on a commercial basis became
available in Sri Lanka for the first time in 1995 (Reddi & Sinha, 2004). SLT initiated its Internet
service facility in 1996. Thereafter Private Internet Service Providers (ISPs) emerged and there
were about 4 fixed line ISP operators (1 ADSL, and 3 WIMAX) and 4 mobile broadband
operators (HSPA – 3G+) by 2012 in Sri Lanka (Amarasinghe, 2012). Computers were used
widely in the private sector for business applications with varying degrees of Internet
connectivity and speed (Reddi & Sinha, 2004). The present ISPs cover a broad geographical
area, and the Internet and e-mail with good connectivity are available. As a result, Sri Lanka has
increased the Internet penetration to 11.8% by December 2011, with an estimated 2.5 million
Internet users. About 13% of the population aged 5 to 69 years has used the Internet facility at
least once during the last twelve months (Statistics Sri Lanka, 2009). The urban sector, where the
facilities are commonly available, shows a higher use of the Internet than the non-urban sectors.
At the same time, computer ownership at household level has increased rapidly in Sri Lanka.
According to the Statistics Sri Lanka (2009), the household computer availability in the urban
sector is 23.6%, where a computer is available in one out of every four households and it is much
higher than in the rural sector which is 9.2% and the estate sector at 3.1%. However, the rural
sector shows a higher percentage of acquisition from 2005 to 2009 with 75% than the urban
sector with 66%. Even though, as mushrooming computer vendors and training centres increase,
computer usage is spreading all over the country, there exist significant differences in computer
awareness across the sectors. The highest computer awareness of 60% is reported from the urban
sector households and the lowest awareness of 15.8% is reported from the estate sector.
Moreover, there exists a heightened urban/rural disparity with respect to access to the computer
and the Internet in Sri Lanka, and public Internet facilities are also limited.
The programs planned under e-Sri Lanka vision aspire to encourage Sri Lankan citizens to
exploit ICTs. The overall situation for ICTs in Sri Lanka has visibly improved within the last two
4
decades. The Internet usage has grown steadily in Sri Lanka in the recent past. According to the
“Internet world stats: Usage and population statistics (2011)”, there were 1,776,200 Internet
users as of June, 2010 representing 8.3% of the population. According to the ICT market
analysis (2008), the total number of Internet users in Sri Lanka expanded at a growth rate of
40.2% during 2004-2007. Sri Lanka is in the 5th place among the countries that progressed in
computer literacy and ICTs within a very short period in the Asian region. Accordingly, during
the last five years the computer literacy in the country has increased from 4% to 30%. However,
this percentage for Sri Lanka is still low. It seems that Sri Lanka is far behind the rest of the
world in ICT penetration (11.8% at December 2011) despite most of the population being able to
read and write. Researchers have identified that the concentration and utilization of ICT facilities
in the rural sector is extremely low as compared to many developed and developing countries,
Sri Lanka’s level of ICT utilization is relatively low (Ranasinghe, 2004; Satharasinghe, 2004;
Gunawardana, 2005; Gamage & Halpin, 2007; Palagolla & Wickramarachchi, 2009). As
researchers emphasized, in comparison with the rest of the world, Sri Lanka is still not a heavy
user of ICTs. Overall, the growth of ICTs in Sri Lanka has been slow and uneven and is
concentrated mainly in urban areas. However, there exists a wide expansion of ICT
concentration in all aspects of the country in recent times contributing to Sri Lanka’s march
towards an information economy and a knowledge society. It is clear that ICTs are becoming
more and more important in all aspects of the country.
1.2.1.2 ICTs and education in Sri Lanka
Education system of Sri Lanka is primarily a national system. Sri Lankan national education is
free at all levels from kindergarten to first degree at the university level and free textbooks are
also provided to all students. The school system of Sri Lanka consists of public/state schools,
Pirivenas (the educational institutes where Buddhist monks receive their education) and
private/international schools. The medium of instruction in state/public schools is Sinhala or
Tamil and it is English in the International schools. English has also been introduced as the
language of instruction at secondary level in some state schools recently. English is the second
language in the country, and all students should learn English from Grade three to G.C.E
(Advanced Level).
The integration of ICTs in secondary education was initiated in Sri Lanka in 1980s by the Sri
Lankan government. Proactive government support and funds from international donor agencies
enabled Sri Lanka to successfully implement the vision. As a start, computers were provided to
some schools in 1984 to familiarize and encourage school children in the use of ICTs. Later on
5
Computer Resource Centers (CRCs) were established in 1994 in some schools with the support
of Asian Development Bank (ADB) to provide basic computer literacy to students during their
vacations once they had taken the GCE Ordinary-Level and Advanced-Level examinations, and
after they had left schools.
The Ministry of Education (MoE) of Sri Lanka has endeavored to fully utilize ICTs in secondary
education since Sri Lanka is still lagging behind in integrating ICTs when compared to other
middle income countries. Although it introduced ICT as a subject at the GCE (O.L) in 2001
under a national policy approved in 2001 (Ministry of Education, 2007), ICT education in Sri
Lanka does not still seem sustainable as compared to other Asian countries (Edirisuriya, 2006).
Further developments in this scenario were taken with support from the World Bank and ADB.
Four hundred ICT Centers in schools were established in 2001‐2004.
In the year 2006 SchoolNet service was established under the ADB funded project of Secondary
School Modernization with the aim of providing Web portal Internet access to 1000 schools, 120
educational institutions (Palagolla & Wickramarachchi, 2009; Pasqual, 2009). Then 1006
Computer Learning Centers (CLCs) were established by 2006 and at present action is being
further taken to expand these to enhance teaching and learning through ICTs in secondary
schools in Sri Lanka.
However, successful integration of ICTs in Sri Lankan secondary schools has been challenged
and its use seems minimal due to inadequacy of teacher training programs, poor English
language proficiency among school teachers, lack of connectivity especially in remote, rural, and
disadvantaged areas, lack of teacher guides, resource books, and model question papers to
support the curriculum and finally a lack of awareness due to poor attitudes (Palagolla &
Wickramarachchi, 2009). But the Sri Lanka Country Plan for ICT education attempted to address
this issue in a soluble way so as to establish ICT infrastructure for all Sri Lankan schools, to
empower teachers with necessary skills of ICT, to supplement educational digital content for all
the subjects of Primary/Secondary curricula (“Country plan for ICT education in Sri Lanka,”
2007). Further, 1000 schools have recently been identified for infrastructure development.
Sri Lankan education system has been designed for students to enter conventional universities
after successful completion of secondary education. There are 15 conventional universities in
the country. The first university, the University of Ceylon was established in 1942 and it was
sited in two locations (Peradeniya and Colombo) until the University of Colombo became an
independent university in 1968 and the latest one is the Uva Wellassa University (2005). Entry to
6
Sri Lankan national universities is highly competitive, except in the case of the Open University.
A small percentage of the relevant age group gets this chance as compared with the percentages
in other countries with respect to the total population in the country. Almost all the courses in the
fields of Science, Engineering and Medicine are conducted in the English medium in
conventional universities, and the courses in other Faculties are generally are conducted in all
three languages Sinhala, English and Tamil. Undergraduate students should qualify in the
English language and they are required to get through English language examinations at
specified levels to obtain degrees. The English Language Teaching Units (ELTUs) have been set
up at all universities to conduct English language programs for academic purposes.
However, Sri Lankan education processes are becoming increasingly technology-intensive and it
poses a future challenge for education (Aturupane, 2008). Having identified the importance of
ICTs in this scenario, the Government of Sri Lanka under the National Policy on IT has taken
several initiatives to enhance access to ICTs in the university education system. These intended
to provide IT awareness to all undergraduates, establishing Wide Area Networks (WAN) in all
conventional universities, providing the Internet access to all, and introducing ICT courses.
These are being implemented in all universities of the country, at various levels. The Lanka
Education and Research Network (LEARN) is the National Research and Education Network
(NREN) of Sri Lanka, which interconnects Educational and Research institutions across the
country. All the higher educational institutions including universities have now been linked to
LEARN.
Further, the Sri Lankan government is also allocating extra funds yearly during the last decade to
enhance the ICT infrastructure of universities (University Grant Commission (UGC) statistics,
2010) and gradually has increased the bandwidth of the LEARN appropriately. The government
has also formed solid plans to enhance ICTs in higher education so as to provide on-line access
for all the university courses and distance education for all interested (Aturupane, 2008). The
vision of higher education development in “Mahinda Chinthana Vision for the future” includes
the establishment of Information Technology Faculties in all universities and the university
students are expected to know how to work with a computer and to surf the Internet
(Department of National Planning, 2010).
1.2.1.3 ICTs and meeting employer demands
Universities must strive to meet 21st century challenges of providing graduates with an education
which is driven by ICTs and is viewed by employers as relevant and valuable (Obanya, 2009).
This is because an individual who lacks ICT skills has fewer opportunities for personal
7
advancement, and a society that lacks an ICT literate workforce will not be able to compete in
the global economy (Tyler, 2005). The ability to effectively use computers in the workplace is
now essential in almost every profession (Kaminiski, Seel, & Cullen, 2003).
Students are supposed to acquire the essential basic skills in order to work with computers and
the Internet because most jobs in the 21st century will require some use of computers together
with communication networks (Fary, 1984). The development and use of communications tools
require new communications skills, which do not emerge automatically (Vihera & Nurmela,
2001). It means that there has been a substantial emphasis given regarding the preparation of the
global workforce in terms of ICTs.
In this regard the higher education institutions are under increasing pressure to incorporate ICTs
into their teaching and learning activities and to prepare technology literate graduates (Kaminiski
et al., 2003). However, the rate of integration and the effectiveness of technology use in
education are still considerably lower (van Braak, 2004).
In the Sri Lankan situation, higher education institutions now rely mainly on computers and the
Internet for all aspects of their activities: administration, teaching, learning and research. Also,
conventional universities have made a high institutional investment in ICT infrastructure.
Moreover, higher educational institutions increasingly rely on ICTs to develop their students’
skills because in all sectors of education, an immense growth on university students’ use of
computers and the Internet has occurred. The University students Competency Test for IT
(UCTIT) exams under the Higher Education for Twenty first Century (HETC) project are also
being conducted for university students in all 15 universities to provide an opportunity to
enhance their IT skills and get recognition for their IT knowledge. Employers, moreover, expect
graduates to be “ICT fluent” and to keep this trend continuously to have more jobs
(Gunawardana, 2005; Wickramasinghe & Perera, 2010). Therefore, there is a strong emphasis in
universities to constantly develop and evaluate their ICT provision in order to remain attractive
to both graduates and employers. A varied set of stakeholders, not limited to the Government, is
making attempts to ensure the relevance of education in terms of employer requirements, and
more importantly today, the ability of students and graduates to compete globally taking ICTs as
a key competence for success.
In Sri Lankan job market analysis, many employers are not satisfied with the competencies and
skills of graduates (Weligamage & Siengthai, 2003). They complain that the graduates do not
have the knowledge and skills required for job performance and demand more training to make
8
them better suited. Therefore, there is less demand for graduates in Sri Lanka because employers
seek quality graduates who can effectively face the challenges in the rapidly changing ICT
environment. This is basically due to the existing mismatch between the graduates’ ICT
competencies and the employers’ demand (Aggestam & Hallberg, 2004; Herath & Ranasinghe,
2011).
Many researchers have explored this issue. Researchers argue that in 1997 the government
implemented the Tharuna Aruna Scheme to assist unemployed university graduates in finding
employment in the private sector (World Bank, 1999). The conclusions drawn from that scheme
confirms that employers prefer Science and Commerce graduates who are well equipped with
analytical and computer skills. The problem is that Sri Lankan students have very limited
exposure to English and the development of technical skills has been neglected at even higher
levels of education. On the other hand, nearly 80% of the applicants who were graduates in
Humanities and Arts did not possess the skills needed (World Bank, 1999).
Central Bank, (2009) report highlighted that general skills are critically important for the labor
market of a middle income country, but are especially scarce in Sri Lanka. Highest among these
scarce general skills are English Language and ICT skills. The report further accentuated that a
graduate who lacks fluency in an international language and ICT skills is cut-off from much of
the world of the twenty-first century knowledge and information and that his or her productivity
and performance at work would fall well below the level required by reputed private sector firms
from their managerial staff and technical specialists.
University education in Sri Lanka suffers from both the inability to meet demand and the failure
to supply a quality education compatible with labor market requirements (Central Bank, 2010).
The education system has been producing graduates without any exposure to computers
(Wikramanayake, Hewagamage, Gamage, & Weerasinghe, 2007). When these graduates join the
global job market, they are not equipped to use technology and they fail to compete with global
ICT skill levels. Herath & Ranasinghe (2011) also have found that private sector employers
complain that Sri Lankan Business graduates especially lack ICT skills. More recently, it has
been shown that the expected outcome of the ICT facilitated education in universities which
focuses on improving Digital Literacy has not been achieved yet (Godamanna & Jayamaha,
2013). This was further confirmed by Hewagamage (2013) with the results of the IT proficiency
test conducted under HETC project for undergraduates in Sri Lanka, finding that only a 49.7% of
undergraduates have obtained the pass mark (50).
9
These circumstances create an uncertain dilemma as to why undergraduates are not using ICTs
up to the desired level even under a regular improvement of ICT perspectives in universities. A
number of factors have been identified and recommendations have been made to substantially
strengthen producing international quality graduates in terms of IT literacy and competence as a
necessary condition for a good quality graduate in the modern world. Finally, it was found that
the ultimate necessity is that an individual graduate should improve himself/herself in the ICT
use and the future acceptance in order to create a good demand at the job market for them
(Garrido, Sullivan, Gordon, & Coward, 2009). Therefore, it is relevant to explore this
environment in the individual context of undergraduates in Sri Lankan universities.
1.2.2 Theoretical background
Understanding why people accept or reject ICTs use has been one of the most challenging issues
(Oye, Iahad, & Rahim, 2012). Technology acceptance is about how people agree to and adopt
some technology to use (Louho, Kallioja, & Oittinen, 2006) and it is a process starting with the
user becoming aware of the technology, and ending with the user embracing the technology and
making full use of it (Renaud & van Biljon, 2008). Dillon & Morris (2006) defined user
acceptance as the demonstrable willingness within a user group to employ information
technology for the tasks it is designed to support and this concept is not being applied to
situations in which users claim they will employ it without providing evidence of use, or to the
use of a technology for purposes unintended by the designers such as using the Internet
connection for personal entertainment in a work situation.
Information Systems researchers focused for a long time on how and why individuals adopt
technology. These researchers have focused across individual use and acceptance (Davis,
Bagozzi & Warshaw, 1989; Compeau & Higgins, 1995), implementation success at organization
level (Leonard-Barton & Deschamps, 1988) and task-technology fit (Goodhue, 1995; Goodhue
& Thompson, 1995). Individual use and acceptance of technology is a vastly researched area
among these studies and measuring variables are continuously developing over time.
The first theoretical perspective to gain widespread use and acceptance in this research area was
the Theory of Reasoned Action (TRA) (Fishbein & Ajzen, 1975). This theory maintains that
individuals would use technology if they could see that there would be positive benefits
(outcomes) associated with using them. Another fundamental outcome measure of individuals’
use and acceptance is their attitude towards using the technology. The attitude towards using
technology refers to ‘‘an individual’s overall affective reaction to using a system” (Venkatesh et
al., 2003, p. 455). Consideration of user attitude is an integral part of educational ICT use as
10
attitudes influence not only individuals' initial use of ICTs, but their future acceptance behavior
regarding technology (Selwyn, 1997). Ajzen & Fishbein (1977) recommend that an attitude
measure should be specific in terms of the target and the context of behavior being assessed.
However, the necessity of other explanatory variables has been identified (Thompson, Higgins,
& Howell, 1991; Webster & Martocchio, 1992) to best explain technology use and acceptance
behaviour. Such variables were introduced by Albert Bandura in his work on Social Cognitive
Theory (SCT) (Bandura, 1986). SCT is based on the premise that environmental influences such
as social pressures or unique situational characteristics, cognitive and other personal factors
including personality as well as demographic characteristics are equally significant in
determining behaviour. One such variable derived to understand the factors that influence an
individual's use of information technology is self-efficacy which is the belief that one has the
capability to perform a particular behavior (Compeau & Higgins, 1995). It is concerned not with
the skills one has, but with judgments of what one can do with whatever skills one possesses
(Bandura, 1986, p. 391). Compeau & Higgins (1995) have added self-efficacy to understand why
people use technology, over and above concepts like outcome expectations, anxiety, and affect.
Further, more variables, such as gender, age, and experience, from SCT were researched as to
whether they play an important role in the explanation of the acceptance of ICTs (Sutton, 1991;
Gefen & Straub, 1997; Reinen & Plomp, 1997; Venkatesh & Davis, 2000; Volman & Eck, 2001;
Colley & Comber, 2003; Losh, 2004).
The basic concept of individual’s ICT use and acceptance could be further reflected on various
aspects within contexts such as user, technology and organization. Researchers have revealed
that positive benefits (outcomes) associated with using technology (Fishbein & Ajzen, 1975) are
more timely. This view was later termed as the ‘perceived usefulness’ which refers to ‘‘the
degree to which a person believes that using a particular system would enhance his or her job
performance” (Venkatesh et al., 2003, p. 448). Some focus on the explanation of use and
acceptance of ICTs and find its inspiration in the perceived usefulness of a technology and the
relative comfort of learning it (Verhoeven, Heerwegh, & De Wit, 2010). Relative comfort is the
perceived ease of use which refers to “the degree to which a person believes that using a
particular system would be free of effort” (Venkatesh et al., 2003, p. 450). Davis et al. (1989)
found a strong relationship between the usefulness of a system and the usage of a system, and
this relationship was much stronger than the relationship between the ease of use of a system and
its use. This approach was later called the Technology Acceptance Model (TAM) developed
from the Theory of Reasoned Action (TRA). The model assumes that both perceived usefulness
11
and perceived ease of use of the new technology are central in influencing the individual’s
attitude towards using that technology (van Raaij & Schepers, 2008; Park & Park, 2009; Teo et
al., 2009; Pouratashi & Rezvanfar, 2010; Sanchez-Franco, 2010). Research has shown that those
two explanatory variables are very important for the explanation of the intention to use ICTs and
ICT competence (Teo et al., 2009).
Two other variables were added to the design of the Unified Theory of Acceptance and Use of
Technology (UTAUT) by (Venkatesh et al., 2003); they are social influence and facilitating
conditions. Social influence has been defined as “the degree to which an individual perceives
that significant others believe that he or she should choose the new system” (Venkatesh et al.,
2003, p. 451). Facilitating conditions may be described as ‘‘the degree to which an individual
believes that an organizational and technical infrastructure exists to support the use of the
system” (Venkatesh et al., 2003, p. 453). Attitude, self-efficacy and anxiety which together is
“the degree to which a person is afraid to use or apply new information technology” have also
been considered by (Venkatesh et al., 2003) to have a significant effect on technology
acceptance.
Perceived usefulness, perceived ease of use, social influence, facilitating conditions, attitude,
self-efficacy and anxiety together would thus be the basis of the explanation of the usage of
technology (Wu, Tao, & Yang, 2007; van Raaij & Schepers, 2008; Wills, El-Gayar, & Bennett,
2008). Although these variables play a very important role in the explanation of the use and
acceptance of technology, Venkatesh et al. (2003) have also added situational variables, gender,
age, experience and voluntariness of use to the UTAUT model and they play key roles in the
explanation of the use and acceptance of ICTs (Verhoeven et al., 2010; De Wit, Heerwegh, &
Verhoeven, 2011; Verhoeven, Heerwegh, & Wit, 2011). Therefore, the UTAUT model has
covered a vast area in technology acceptance research. UTAUT has been tested and has received
acceptance among technology acceptance researchers. The acceptance of this model rests on its
high explanatory power. During its development, the UTAUT model test results revealed that it
was capable of accounting for 70% of variance in intention to use several different technologies;
thus making it a robust and comprehensive model, while other models could explain less than
50% of variance (Venkatesh et al., 2003; Rosen, 2005). It should be noted that although the
UTAUT model is very promising in enhancing our understanding of technology acceptance, it
may still need modifications to suit specific contextual research settings (Wu et al., 2007). It is
claimed for example, by Gogus, Nistor, Riley, & Lerche, 2012 that the UTAUT, was
insufficiently validated in culturally diverse settings.
12
Culture specific variables can have an impact on an individual’s decision to use and the
acceptance of a specific technology (Myers & Tan, 2002). At the individual level of analysis,
culture can be treated as an individual difference variable (Srite & Karahanna, 2006) and this
concept is the most influential culture theory among social-science research too, with strong
empirical support (Sanchez-Franco, Martínez-López, & Martín-Velicia, 2009).
Though, many approaches and frameworks have been used to measure culture, from an academic
perspective, the effects of culture on ICT use and acceptance have been studied by research
based principally on Hofstede's (1980) cultural dimensions. Hofstede’s cultural dimensions have
also been widely used in studies in which culture is an important facet of the research context
especially within the information systems discipline (Straub, Loch, Evaristo, Karahanna, & Srite,
2002; Ali, Brooks, Alshawi & Papazafeiropoulou, 2006; Cardon & Marshall, 2008; Voros &
Choudrie, 2011). Hofstede (1997) stated that culture shaped individual values and affected
individual behavior and that it was seen to be different across social environments such as
nation, ethnicity or profession and that people may behave differently depending on their culture.
Hofstede’s four cultural dimensions; power distance, individualism/ collectivism, masculinity/
femininity and uncertainty avoidance are used to explore the technology acceptance behavior of
individual university students in different cultural settings.
In conclusion, an understanding of all these concerns with UTAUT will provide a solid base to
explain how individuals use, accept or reject a technology in a specific perspective. But, there is
no single, unified, universally accepted theory of adoption and diffusion and each theoretical
model addresses different aspects of the diffusion process or a different type of innovation or
organization (Surry, Ensminger, & Haab, 2005). Therefore, researching these concepts enabled
the researcher to determine which would be the most appropriate means of predicting ICT use
and acceptance behavior of university students in Sri Lanka in order to promote the usage.
1.2.3 Empirical background
In conceptualizing ICT use and acceptance behavior of university students in Sri Lanka, suitability of
technology acceptance theories were examined to identify the best suited diagnostic model to
promote usage and also to explain what hinders acceptance and usage of technologies in Sri
Lanka.
Literature clearly demonstrates the mushrooming growth of studies on technology acceptance
and use used in various organizational, technological and individual user contexts and that
UTAUT was proposed and validated in order to afford a unified theoretical basis to facilitate
13
research on technology adoption and diffusion. After a comprehensive review of literature on the
university context a favorable number of facts could be drawn;
Studies have covered a vast range of technology applications from the basic computer
using, web 2.0 technologies to the newest concept, cloud computing.
Technology acceptance applications have taken place in many countries all over the
world such as USA, UK, China, Saudi Arabia and India etc. with different behaviors.
However, these theories and models were developed in the West and focused on large
organizations and developed countries have sufficient resources and greater training
facilities unlike developing countries.
Although, additional determinants were adapted specifically to suit particular
technologies and particular user categories in those applications, it was found that when
tested outside of North America; Switzerland, Japan and Arabic countries etc. most
models have been found to be less productive (Straub, 1994; Straub, Keil, & Brenner,
1997; Rose & Straub, 1998; Anandarajan, Igbaria, & Anakwe, 2000; Bagozzi, Wong,
Abe, & Bergami, 2000; Al-Gahtani, 2001; Loch, Straub, & Kamel, 2003; Mao & Palvia,
2006; McCoy, Galletta, & King, 2007; Schepers & Wetzels, 2007).
Some variables were adapted for the UTAUT to examine a particular effect even though
they have not been strictly highlighted in UTAUT.
Many authors have found that the culture has a strong contextual influence on how
individuals employ ICTs (Davies, 1988; Makrakis, 1992; Layton, 1994; Holmes, 1998;
Collis, 1999; Li & Kirkup, 2007).
Research has been done in different countries and results are attributed to country-level
differences on the dimensions of culture but not to individual cultural values. Even
though, the culture plays an important role in technology acceptance, prior research
typically tested these individual-level models in aggregate indifferent countries and
differences in observed results are attributed to country-level differences on the
dimensions of culture (Srite & Karahanna, 2006).
Also, it has further been claimed by some authors that the UTAUT is insufficiently
validated in culturally diverse settings (Wu et al., 2007; Nistor et al., 2012).
Therefore an unanswered concern that remains is that although the UTAUT model is very
promising in enhancing our understanding of technology acceptance, it still needs modifications
to suit specific contextual research settings. As highlighted above, inconsistencies may have
among them key determinants and moderators for specific contexts, other than the determinants
and moderators developed in the original model for the original context. Some other
14
determinants and moderators can also play important roles with respect to ICT use and
acceptance in the Sri Lankan university context outside where they were constructed.
In the Sri Lankan context, the mother tongue of the majority of the population is Sinhala and the
main religion is Buddhism. However, there are other cultural groups and religious groups as
well. Hence, there is a need for include the cultural dimensions’ effect on the individual use and
acceptance of ICT behavior of Sri Lankan university students. Existing theoretical frameworks
do not reflect the unique individual cultural situation of Sri Lanka and adaptation may require an
improved exploration. Also, as new technologies keep evolving all the time in the world of
technology, studies cannot be constant across time and/or in different contexts. Therefore, a
parsimonious and a robust model which best describes the use and acceptance of ICTs of
university students in the Sri Lankan context is very critical in order to promote the usage of
ICTs to be enable the individual graduates to make a demand in the job market and achieve the
vision to e-Sri Lanka.
1.2.4 Statement of the problem
There has been an enormous effort regarding the preparation of the global workforce in terms of
ICTs (Dougherty et al., 2002) and the factors that emerged have strengthened and encouraged
moves to adopt ICTs in higher education all over the world. While a lot of researchers in the
field of Information Systems have focused on a variety of technological contexts, very few
empirical research studies have been carried out in the field of Information Sciences (Suraweera
& Liew, 2011) even when the researchers in the field have the accountability of making future
workforce information literate where ICTs perform as the driving force. Therefore, an
unanswered concern which remains is “Could the existing models be used without modifications
in improved exploration of ICT use and acceptance in various contexts?” There may be
inconsistencies among key determinants and moderators of existing models contextually. It is
questioned whether only the determinants and moderators developed in the original model to the
original context have been constructed. Perhaps some other determinants and moderators also
play important roles with respect to technology acceptance and use in contexts outside where
they were constructed. This means that modifications are still needed to suit contextually specific
cultural settings. These should be thoroughly investigated to improve the ICT use of universities.
It is expected to provide ICT infrastructure in a similar manner across all the universities in Sri
Lanka. But the ICT acceptance and likelihood of use is variable (Hewagamage, 2009). That may
not be due to institutional factors, but may be due to individual factors. The different indicators
of ICT use and acceptance in the university may not be properly understood. The use of
15
institutional and individual perceptions of acceptance and the analysis of use differences among
various technological domains are essential to determine the most effective means of explaining
ICT use and acceptance by Sri Lankan university students.
1.2.5 Purpose of the study
This study aims to develop a model for assessing the extent to which individual characteristics
can describe current ICT usage behavior and future acceptance of the university students in the
Sri Lankan context. In order to address the purpose of the study, the objectives are outlined as
indicated below.
1.2.5.1 Objectives of the study
1. To assess what types of ICTs are in use by university students in Sri Lanka.
2. To assess the extent to which Sri Lankan university students use and intend to use ICTs.
3. To identify the effect of socio-demographic factors on ICT use and acceptance of
university students.
4. To investigate how university students are motivated to improve the use of ICTs.
5. To propose a model which best describes the ICT use and acceptance of university
students in Sri Lanka
1.2.5.2 Research questions
These objectives comprise three research questions.
Do differences exist among university students in their levels of ICT use and acceptance
and types of ICTs?
If differences exist, what are the reasons for their different levels of ICT use and
acceptance?
What strategies should be recommended to promote ICT use and acceptance behavior of
university students?
Table 1.1 summarizes the objectives, research questions and possible sources of data of the
study. This table will guide the data collection and analysis in all stages of the research.
1.3 RESEARCH DESIGN AND METHODOLOGY
The research design and methodology applied in the research are described in this section. The
study has been designed under two main phases- an exploratory study which constitutes
checking the feasibility of conducting the proposed study in the context of a sample of university
students which covers the investigation of the present situation regarding ICTs in universities
16
and the job market, identifying the determinants of ICT use and essential ICT tools which a fresh
graduate basically has to be able to use. The main survey aims at testing the proposed model.
The basic philosophy underlying this study is positivism. Since semi-structured interviews and
focus group discussions are employed in the first phase of the study it follows the
phenomenological approach. The first phase of the study uses a mix of quantitative and
qualitative paradigms since it aims to explore the entire ICT use and acceptance behavior of
university students through semi structured interviews in order to focus on the problem
addressed in the study. The inductive approach characteristics is deployed to recognize the
underpinning theories, preliminary information, determinants and ICT tools through semi
structured interviews and focus group discussions. However, the second phase of research is
entirely based on the deductive approach, as it adopts a positivist inquiry to achieve predictive
values and it purely quantitative in nature.
The research is mainly exploratory in nature. The explanatory survey strategy is used in this
study to identify the relationships between factors and the ICT use behavior in the Sri Lankan
university sector. The current study examines the ICT use behavior of university students at a
given point in time and therefore it is a cross sectional study of 1st year and 3rd year university
students.
The exploratory study was conducted for a specific group of participants. Non-probability
sampling is employed with a specific purpose in mind and 24 interviews/group discussions were
conducted. Eighteen subjects were from the university sector and six were from other fields. The
sample from the University community consisted of lecturers who handle ICT activities in
Faculties, Librarian, computer officers and undergraduates the four universities selected for the
study. Participants from the other fields comprise human resource personnel who are top level
persons in charge of recruitment for jobs in Sri Lankan leading fields such as diversified
companies, higher education, industrial, administrative and finance. Four (4) discussions were
scheduled with students in the selected four universities, that is, one discussion per university.
Each group comprised students from Arts, Science and Management Faculties. Content analysis and
descriptive statistics using SPSS were performed for data analysis of the exploratory study.
The main survey was conducted using a stratified random sample of 2,331 first year and third
year undergraduate students from the selected four universities. Data gathering for the study was
done using a structured questionnaire with the specific sample by the researcher personally
visiting the selected universities. Basically the Structural Equation Modeling (SEM) was used
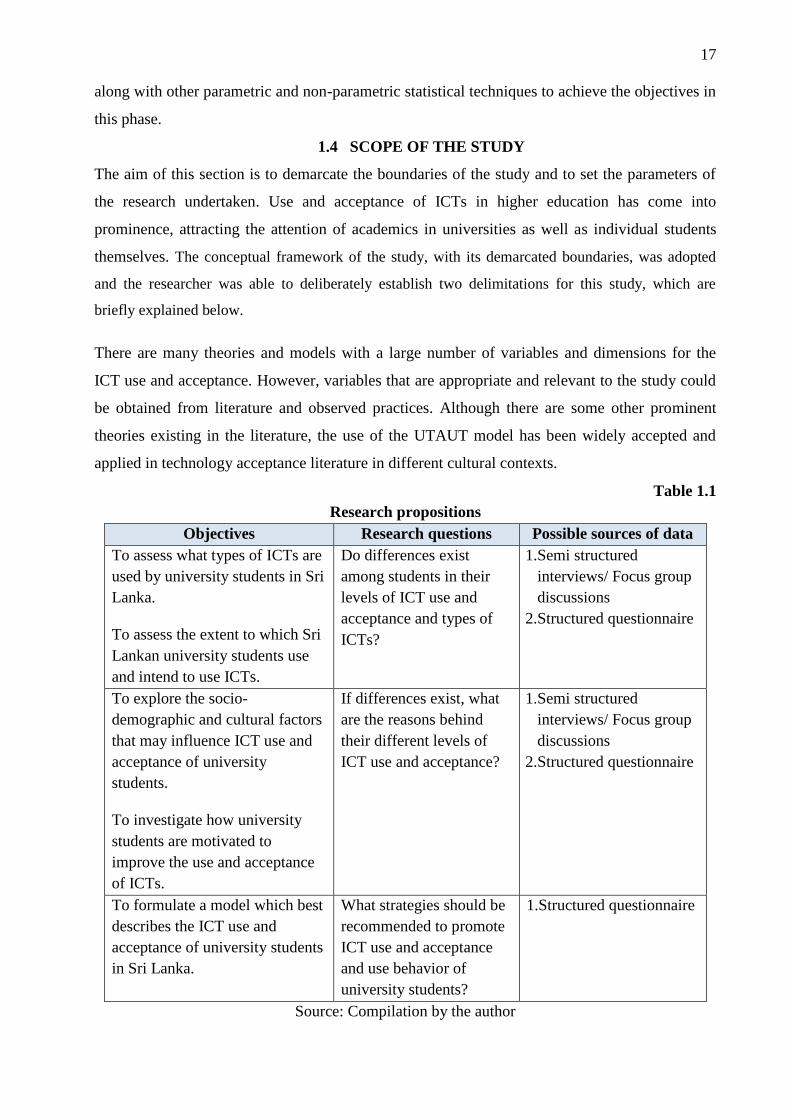
17
along with other parametric and non-parametric statistical techniques to achieve the objectives in
this phase.
1.4 SCOPE OF THE STUDY
The aim of this section is to demarcate the boundaries of the study and to set the parameters of
the research undertaken. Use and acceptance of ICTs in higher education has come into
prominence, attracting the attention of academics in universities as well as individual students
themselves. The conceptual framework of the study, with its demarcated boundaries, was adopted
and the researcher was able to deliberately establish two delimitations for this study, which are
briefly explained below.
There are many theories and models with a large number of variables and dimensions for the
ICT use and acceptance. However, variables that are appropriate and relevant to the study could
be obtained from literature and observed practices. Although there are some other prominent
theories existing in the literature, the use of the UTAUT model has been widely accepted and
applied in technology acceptance literature in different cultural contexts.
Table 1.1
Research propositions
Objectives Research questions Possible sources of data
To assess what types of ICTs are
used by university students in Sri
Lanka.
To assess the extent to which Sri
Lankan university students use
and intend to use ICTs.
Do differences exist
among students in their
levels of ICT use and
acceptance and types of
ICTs?
1.Semi structured
interviews/ Focus group
discussions
2.Structured questionnaire
To explore the socio-
demographic and cultural factors
that may influence ICT use and
acceptance of university
students.
To investigate how university
students are motivated to
improve the use and acceptance
of ICTs.
If differences exist, what
are the reasons behind
their different levels of
ICT use and acceptance?
1.Semi structured
interviews/ Focus group
discussions
2.Structured questionnaire
To formulate a model which best
describes the ICT use and
acceptance of university students
in Sri Lanka.
What strategies should be
recommended to promote
ICT use and acceptance
and use behavior of
university students?
1.Structured questionnaire
Source: Compilation by the author
18
This study focuses on two universities located in Colombo, the capital of Sri Lanka- the
University of Colombo and the University of Sri Jayewardenepura, and other two universities
located in the outer regions- the University of Ruhuna in the Southern Province, and the South-
Eastern University of Sri Lanka, located in the Eastern Province, in order to include a wider
representative sample from the entire university system in Sri Lanka. To grasp the disciplinary
differences in ICT use and acceptance within very common subject streams, Science,
Management and Arts except Medicine, Engineering and IT, only the relevant Faculties from
each of the selected universities were selected as samples. Since it was expected to investigate
how university students are motivated to improve the use of ICTs from an individual perspective,
a cross sectional study of first year and third year students, was considered as the sampling
population for the study, because the use behavior and the attitudes on ICTs could have changed
by the third year with the institutional ICT environment.
1.5 ORIGINALITY AND THE CONTRIBUTION OF THE RESEARCH
As indicated by literature, during the past decade, Information Science research has drastically
matured and moved towards conceptually and contextually better. This has facilitated to research
to be undertaken to achieve wider conceptual progress. However, the researcher was motivated
to conduct the current study due to the need to validate the concepts of ICT use and acceptance
across different cultures and this research aims for a greater degree of reliability and validity
through a robust and comprehensive framework and a systematic methodological process of the
research. The application of Structural Equation Modeling (SEM) promotes a better quality of
the research associated with ICT use and acceptance in a cultural context and it has useful
features, especially in modeling multivariate relations, and there are no widely and easily applied
alternative methods of this kind (Byrne, 2006). Therefore, this research, it is hoped, will
significantly contribute to the Information Science discipline to provide a broader theoretical
growth.
A higher number of past researches related to the current study have been carried out in Western
countries and a few in Eastern Asian countries. Therefore, it was considered important and
significant to investigate the Sri Lankan scenario to enhance the existing body of knowledge for
worldwide application as another original contribution to the body of knowledge since the Sri
Lankan national universities facilitating a free education from the undergraduate level and
functioning in multi-cultural surroundings, provide a new dimension and insights into the ICT
environment.
19
Moreover, Walker (1997) has provided some features to be considered in relation to the
originality of a research. These were new areas of research, new interpretations of existing
material, new applications of existing theories to new areas, or new blends of ideas and
development of new methodologies, tools and/or techniques. The current research has
contributed to develop appropriate measures using well suited theories/ models to predict the
ICT use and acceptance behavior of the university students in the context of Sri Lanka.
The necessity to develop a new model for the individual use and future acceptance of ICTs by
Sri Lankan university students were based on two major reasons. One reason was that the
literature reveals that the existing models should be revised for specific user, organizational and
technology and cultural contexts (Venkatesh et al., 2003; Kriponant, 2007; Rocker, 2010). The
second reason was that the literature disclosed that none of the studies had been carried out to
comprehensively explore the ICT use and future acceptance behavior under a strong theoretical
basis accompanying with the individual cultural aspects in the context of Sri Lankan universities.
Therefore, the current study provides a better parsimonious model for the prediction of ICT use
and acceptance behavior based on two theoretical paradigms: technology acceptance and
individual cultural aspects which demonstrate another aspect of novelty for the knowledge base.
1.6 SIGNIFICANCE OF THE RESEARCH
This study would serve as a useful tool to explain ICT use and acceptance behavior of university
students in Sri Lanka and also to suggest strategies to improve the use and acceptance of ICTs to
gain skills and thereby contribute to accrue higher dividends for the individuals as well as the
society as a whole.
A measure of success today is how well one can communicate, evaluate, and manage all forms
of information within a technological environment. These are ICT skills. ICT skills are
increasingly taken for granted at all stages of a student’s educational experience from
kindergarten to university and the skills gained depend on the level of acceptance and their use.
Students who lack ICT skills cannot fully benefit from learning opportunities. Students who are
less proficient in ICTs may be unable to evaluate the validity of information that they find
through modern search engines or draw meaning from such information. They may not be able
to compare information from numerous sources or communicate their findings effectively,
ethically and legally. An individual who lacks ICT skills has fewer opportunities for personal
advancement, and finally a society that lacks an ICT literate workforce will not be able to
compete in the global economy (Ellis, 2001). The lost opportunity to acquire these skills in the
university may follow them throughout their careers. Therefore, the universities have made
20
considerable efforts to get students to use Information Technology and the study will be
extremely useful.
Despite widespread consensus about the need for ICT literacy among university students, there is
little information available to explore the dimensions of the need or what might be done to
address it. As such, there is still a need to measure the effectiveness of these efforts and to
evaluate whether students have obtained the ICT skills that they need to be successful in an
information-rich, technology-based society. Further, there are numerous barriers to the
integration of instructional technology into higher education, such as technology infrastructure,
faculty effort, technology satisfaction, student characteristics and undergraduates’ competency
(Surry et al., 2005). Hence, the researchers need to identify the root causes for low ICT
performance and more action would be required to enhance both the knowledge and skills of ICT
proficiency in order to make undergraduates more employable and productive knowledge
workers in the future. Therefore, the outcomes of the study are very vital for the total university
system to enhance the quality of its products. Moreover this would be very important for
improving the employability of individual students.
Universities can use the aggregated results in a variety of ways: Consider information on the ICT behaviors, preferences and attitudes of undergraduates,
especially as it relates to their academic experience.
Provide information to university administrators that will help them to develop a conducive
university ICT environment for students.
Inform teaching faculty and librarians to develop their curricula, resources and services in
rich and meaningful ways.
Improve ICT proficiency and determine students’ need for training in individual level
Help guide curricular innovations and changes
Provide support for institutional ICT literacy initiatives
For the individual students the benefits can come in different ways:
Satisfaction of the need for an Information Technology literacy requirement
Enhance employability
As argued, the critical issues of how to make full use of ICTs in facilitating higher education
processes are of national concern. National plans have been issued to motivate and support ICT
use in the country towards the march of e-Sri Lanka concept. Therefore it is essential for all
students in higher education to use ICTs, in order to cope with global students who have already
21
had an ICT experience. The model produced from this research could afford information
necessary in explaining what promotes ICT use and what hinders use. It is expected that this
research will help develop National Policies especially to develop a policy to increase ICT use in
higher education process.
1.7 DEFINITION OF TERMS
The operational definitions used in this study as a basis for understanding the conceptual and
contextual concepts related to the stated research problem are given below.
ICTs are the computer and Internet application tools and resources used to communicate, and to
create, disseminate, store, and manage information which is accessed via desktop computers,
laptop computers, Internet enabled smart phones and other handheld devices.
Internet is a publicly available computer network consisting of a worldwide network of
computer networks that use the TCP/IP network protocols to facilitate data transmission and
exchange.
Culture is the complete way of life of a people: the shared attitudes, values, goals, and practices
that characterize a group; their customs, art, literature, religion, philosophy, etc.; the pattern of
learned and shared behavior among the members of a group.
1.8 STRUCTURE OF THE THESIS
Chapter 1 – Introduction – The background of the study and a brief overview of the theoretical
and contextual backgrounds to the research study are discussed in this chapter. The research
objectives, research questions, potential contribution, scope and outline of the thesis are briefly
discussed.
Chapter 2 – Review of theoretical and empirical literature – This chapter reviews the
theoretical and empirical literature in relation to technology acceptance, which cover supporting
relationships to address the study.
Chapter 3 –Theoretical framework and hypotheses– This chapter formulate the theoretical
framework of the study based on the theoretical and empirical literature reviewed on technology
acceptance.
Chapter 4 – Research design and methodology – This chapter comprises two major parts- the
study framework, and research strategy and methods. The framework of the study gives direction
to the empirical aspect of the study and the research strategy and methods present the
22
underpinning research methodology of the study. The sampling procedure, data collection
procedure and analytical procedure used are also presented.
Chapter 5 – Exploratory study: Data analysis and findings – This chapter presents the results
of the data analysis in the first stage of the research design–that is, the exploratory study.
Chapter 6 – Main study: Preliminary data analysis and findings – This chapter presents the
preliminary data analysis of the second phase of the study (main study).
Chapter 7 – ICT use and acceptance modeling – This chapter covers the proposed research
model testing and the final formulation of the best model applicable to the Sri Lankan context.
Chapter 8 – Conclusions and suggestions– This chapter presents a summary of the thesis, the
model developed and discusses the findings of the study in general. The chapter concludes with
suggestions for future research.
23
CHAPTER 2
REVIEW OF THEORETICAL AND EMPIRICAL LITERATURE
2.1 INTRODUCTION
This chapter presents the review of the theoretical and empirical literature, which provides a
conceptual underpinning for the study that focuses on the ICT use and acceptance behavior of
university students. It attempts to discuss the main theories underlying technology use and
acceptance in order to construct an integrated conceptualization of theories or models, which will
form the conceptual base of this study. The concepts and constructs of existing theories/models
on technology acceptance, and individual cultural dimensions on technology use and acceptance
are comprehensively reviewed with empirical applications. The review thus facilitated the
foundation on development of a theoretical framework to gain a clear understanding of ICT use
and its acceptance by university students in Sri Lanka.
2.2 USE AND ACCEPTANCE OF ICTS IN UNIVERSITIES
ICTs provide the latest means which makes it possible to communicate, inquire, make decisions
and solve problems and improve the quality of education by augmenting student enthusiasm and
commitment and the acquisition of fundamental skills of students (Sarkar, 2012). Therefore, ICT
use and acceptance for education is more critical today than before (Pajo & Wallace, 2001) and it
has increasingly adopted various kinds of tools for teaching, curriculum development, staff
development, and student learning (Kumpulainen, 2007; Usluel et al., 2008). Vast arrays of ICT
tools which are kept apart in many technological aspects have touched virtually all dimensions of
universities.
Some researchers (Zoraini, Lim, & Tai-Kwan, 2009; Lei, 2010; Young, 2011) view technology
such as a smart phone and laptop as influential technology that may directly affect teaching and
learning outcomes and that further use of these technologies, can encourage the shift to an
environment which is learner-centered. In such a learning environment, with the aid of the
relevant technology, students are able to collaborate, use critical thinking, develop /higher order
thinking, develop certain generic skills like lifelong learning skills and find alternatives for
solution of problems (Dewey, 1943; Yuen, Law, & Wong, 2003; Ebner, Lienhardt, Rohs, &
Meyer, 2010; Žerovnik, Rugelj, & Šerbec, 2011; Biasutti & EL-Deghaidy, 2012). The success of
the newer Web 2.0 movement (O’Reilly, 2005) and the proliferation of Web-based applications
have encouraged the appearance of ICT tools and their acceptance to support making educated
24
individuals (Conole & Alevizou, 2010). Therefore, the importance of ubiquitous technology in
the higher educational system and integration is magnified (Sedek, Mahmud, Jalil, & Daud,
2012).
Surry & Ensminger (2006) pointed out that there are many different investigations and topics on
subjects related to technology and also that these are at various levels within any educational
system, with different expectations and drivers about technology’s value and adoption at both
personal and organizational levels. Most researchers suggest that university students do use
technologies for learning but that great diversity exists in frequency of technology use, types of
technologies adopted, and their readiness to integrate technology into learning (Kennedy, Judd,
Churchward, Gray, & Krause, 2008; Johnson, Levine, & Smith, 2009; Jones, Ramanau, Cross, &
Healing, 2010; Lai & Gu, 2011).
The impact of ICTs on study and learning practices has generated research seeking to identify
both the extent of ICT usage and the effects it is having on student experience at university more
broadly (Conole, De Laat, Dillon, & Darby, 2008). Empirical studies, conducted in different
countries and in different types of universities, are reaching very similar conclusions suggesting
that the ‘digital native’ label may be too simplistic to explain the ways young people use
technologies (Margaryan, Littlejohn, & Vojt, 2011). Hence the results of some surveys suggest
that to accept the claims of some of the researchers on the changes needed in universities to cater
for technology savvy students, further research would be needed (Kennedy et al., 2007; Combes,
2009; Lei, 2010; Jones & Shao, 2011; Margaryan et al., 2011).
2.2.1 Different ICT uses in universities
In the world of higher education, virtually every aspect of scholarship has been influenced by
technology. ICT is becoming a necessity even to gain university entry through filling in an on-
line application form and it is important to the student to use the Internet to access up-to-date
publications or even to word-process their assignments/reports/dissertations. Students conduct
research through the Web, drawing from academic journals, newspaper articles and speech
transcripts. Some submit assignments online and e-mail completed projects to their lecturers.
Many use spreadsheets, graph plotters, presentation programs and multimedia tools on a regular
basis. The proliferation of distance education and e-learning has altered the traditional definition
of “the classroom.”
According to the literature reviewed, most of the universities are basically equipped with
computers with ordinary operational and application software such as Windows, MS Office and
25
the Internet access at numerous levels. Only a minority of the courses do not require students to
have computer access in most universities. Some universities provide personal computers and
computer lab facilities but some universities allow students to use their own laptops for access to
the Internet anywhere in the university premises facilitating wireless networking. University
websites would help in information dissemination and e-management. University libraries all
over the world also make available a wide variety of electronic information sources such as
integrated library software, e-books and e-journals etc. Universities, especially those in the West,
have adopted most of novel ICT tools as a means to impart upon students the knowledge and
skills demanded by 21st century advancement (UNESCO, 2009). Sophisticated software, novel
ways for communication and efficient educational ICT tools etc. have become a crucial part of
using ICTs in universities. These include Web 2.0 technologies and Virtual Learning
Environments (VLE) too.
Web 2.0 technologies have become the novel trend and have opened new doors for more
effective learning giving the potential to support lifelong learning (Klamma et al., 2007;
Richardson, 2010). Many of these tools such as Facebook, wikis etc. which were not specifically
designed for educational purposes, have been successfully employed in the classroom
(Richardson, 2010). There are so many different ICT tools available that choosing a suitable one
for a specific learning situation is not an easy step, and requires the educator to be informed
about the educational capabilities of different ICT tools (Ruiz-Calleja et al., 2012).
Prior researchers have identified that web 2.0 technologies are mostly used for educational
purposes (Selwyn, 1997; Ito et al., 2009; Luckin et al., 2009; Christine Greenhow, 2011) since
those tools provide for active participation to the process of learning and can be used effectively
in the individual and collaborative learning environments (Minocha, 2008; Gruzd, Staves, &
Wilk, 2012). Avci & Askar (2012) showed that university students are positive to using blog and
wiki in the teaching-learning process and that they found wiki more useful. Amichai-Hamburger
& Vinitzky (2010) showed a strong link between individual personality and Facebook use by
university students in Israel. It is obvious that the impact of using web 2.0 technologies is
diverse.
VLE are used in universities in this era in which web-based communication platforms that allow
students, without limitation of time and place, to access different learning tools, such as program
information, course content, teacher assistance, discussion boards, document sharing systems,
and learning resources (Martins & Kellermanns, 2004). VLE have found enabled improvements
in communication efficiency, both between student and teacher, as well as among students
26
(Martins & Kellermanns, 2004). Also, they are having intense, immediate, and disruptive
transformations on education systems (Archer, Anderson, & Garrison, 1999). Zhang et al. (2004)
reported improved academic outcomes and Chou & Liu, (2005) showed improved learning
performance and satisfaction from students using VLE. Also, students agreed that VLE is a good
idea and that its frequent usage is useful at the university (Marchewka, Liu, & Kostiwa, 2007).
Since a large range of ICT tools for different uses are employed by students and different tools
are specific for different purposes regarding the ICT use in universities, a thorough examination
of literature related to the ICT use and acceptance in the university context and employers’
context within various countries was performed. Important ICT tools and their different uses
were identified (see Appendix I). In the university context, most of the studies have focused only
on one specific ICT tool/type or an application. Even though, some researchers have used the
term ICT/ technology/IT, they have specified the term ICT in different ways-as different tools
or/and different purposes/uses (see Appendix I). Since, the current research is conducted with a
focus on the readiness of the fresh graduates for the competitive job market demand, studies with
the intention of identifying ICT use and acceptance role in organizational productivity, and
organizational performance in various sectors were also reviewed and they provide better
evidence regarding ICT needs of the job market. However, ICT tools and their different uses for
data gathering were formulated as: academic/ educational technology use, social communication
use, technical use and other use.
2.2.2 Factors affecting ICT use and acceptance in universities
Level of access, hours spent on computers and the Internet, frequency of use and perceptions on
competence and generally the role of ICTs have been taken as the core determinants of most
empirical studies. A significant difference has been identified between the ICT availability and
the utilization by Umunadi (2011). ICT usage has been measured through the attitude towards
computers, self-efficacy and computer phobia by Selwyn (1997), Macleod, Denise, & Haywood
(2002), Waldman (2003), Gay et al. (2006), Li & Kirkup (2007), Mcilroy, Sadler & Boojawon
(2007) and by Mahmood (2009) on a variety of ICT contexts. Most of the non-theory based
studies have identified gender, age, and study year as the differentiating factors on ICT use
behavior. Subject wise disparities in ICT acceptance have also been identified by
Samaradiwakara (2010) and Mahmood (2009). They have found that the students from Arts and
Humanities disciplines were not sufficiently aware of the benefits of ICTs. Prior experience of
computer or/and the Internet and the secondary school experience on computing were other
differentiating factors identified (MacLeod et al., 2000; Li & Kirkup, 2007; Rekabdarkolaei &
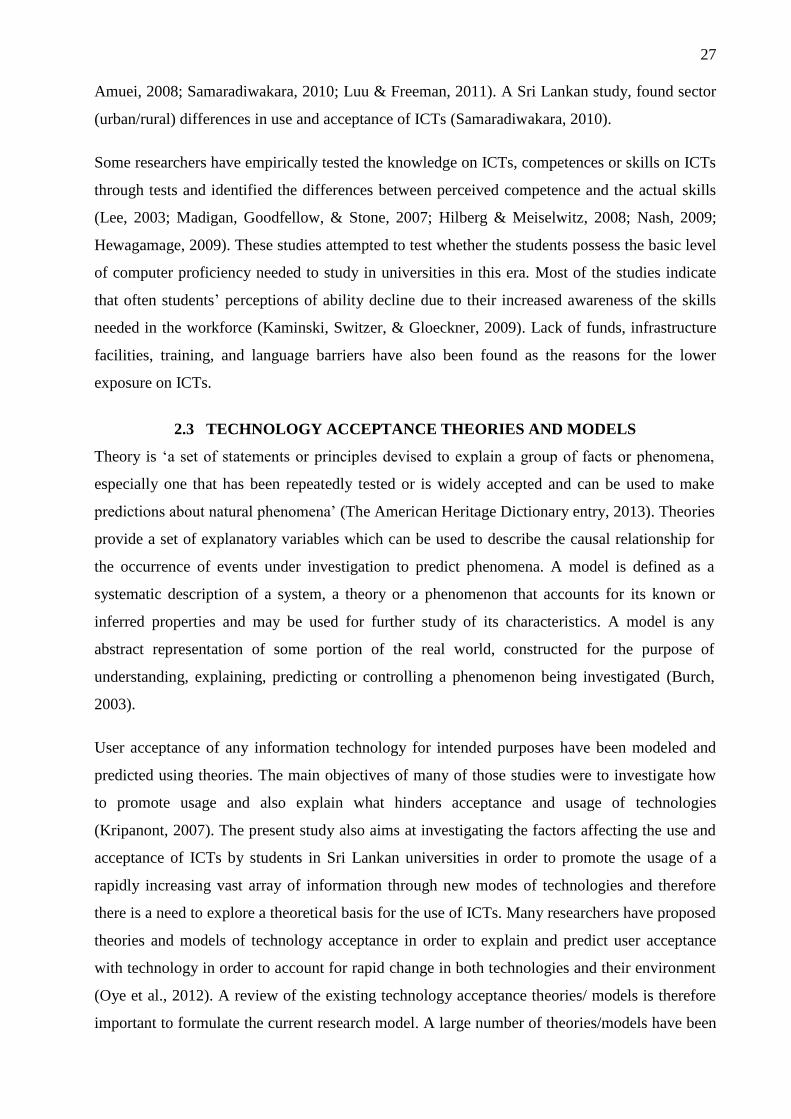
27
Amuei, 2008; Samaradiwakara, 2010; Luu & Freeman, 2011). A Sri Lankan study, found sector
(urban/rural) differences in use and acceptance of ICTs (Samaradiwakara, 2010).
Some researchers have empirically tested the knowledge on ICTs, competences or skills on ICTs
through tests and identified the differences between perceived competence and the actual skills
(Lee, 2003; Madigan, Goodfellow, & Stone, 2007; Hilberg & Meiselwitz, 2008; Nash, 2009;
Hewagamage, 2009). These studies attempted to test whether the students possess the basic level
of computer proficiency needed to study in universities in this era. Most of the studies indicate
that often students’ perceptions of ability decline due to their increased awareness of the skills
needed in the workforce (Kaminski, Switzer, & Gloeckner, 2009). Lack of funds, infrastructure
facilities, training, and language barriers have also been found as the reasons for the lower
exposure on ICTs.
2.3 TECHNOLOGY ACCEPTANCE THEORIES AND MODELS
Theory is ‘a set of statements or principles devised to explain a group of facts or phenomena,
especially one that has been repeatedly tested or is widely accepted and can be used to make
predictions about natural phenomena’ (The American Heritage Dictionary entry, 2013). Theories
provide a set of explanatory variables which can be used to describe the causal relationship for
the occurrence of events under investigation to predict phenomena. A model is defined as a
systematic description of a system, a theory or a phenomenon that accounts for its known or
inferred properties and may be used for further study of its characteristics. A model is any
abstract representation of some portion of the real world, constructed for the purpose of
understanding, explaining, predicting or controlling a phenomenon being investigated (Burch,
2003).
User acceptance of any information technology for intended purposes have been modeled and
predicted using theories. The main objectives of many of those studies were to investigate how
to promote usage and also explain what hinders acceptance and usage of technologies
(Kripanont, 2007). The present study also aims at investigating the factors affecting the use and
acceptance of ICTs by students in Sri Lankan universities in order to promote the usage of a
rapidly increasing vast array of information through new modes of technologies and therefore
there is a need to explore a theoretical basis for the use of ICTs. Many researchers have proposed
theories and models of technology acceptance in order to explain and predict user acceptance
with technology in order to account for rapid change in both technologies and their environment
(Oye et al., 2012). A review of the existing technology acceptance theories/ models is therefore
important to formulate the current research model. A large number of theories/models have been
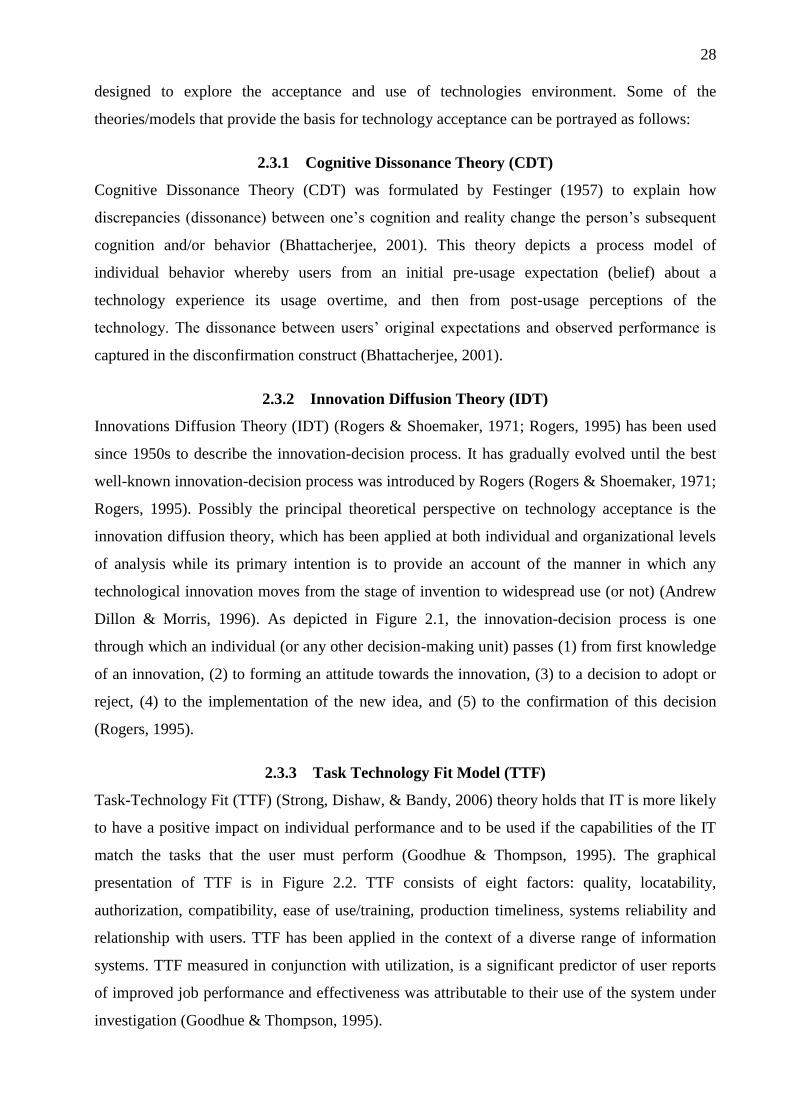
28
designed to explore the acceptance and use of technologies environment. Some of the
theories/models that provide the basis for technology acceptance can be portrayed as follows:
2.3.1 Cognitive Dissonance Theory (CDT)
Cognitive Dissonance Theory (CDT) was formulated by Festinger (1957) to explain how
discrepancies (dissonance) between one’s cognition and reality change the person’s subsequent
cognition and/or behavior (Bhattacherjee, 2001). This theory depicts a process model of
individual behavior whereby users from an initial pre-usage expectation (belief) about a
technology experience its usage overtime, and then from post-usage perceptions of the
technology. The dissonance between users’ original expectations and observed performance is
captured in the disconfirmation construct (Bhattacherjee, 2001).
2.3.2 Innovation Diffusion Theory (IDT)
Innovations Diffusion Theory (IDT) (Rogers & Shoemaker, 1971; Rogers, 1995) has been used
since 1950s to describe the innovation-decision process. It has gradually evolved until the best
well-known innovation-decision process was introduced by Rogers (Rogers & Shoemaker, 1971;
Rogers, 1995). Possibly the principal theoretical perspective on technology acceptance is the
innovation diffusion theory, which has been applied at both individual and organizational levels
of analysis while its primary intention is to provide an account of the manner in which any
technological innovation moves from the stage of invention to widespread use (or not) (Andrew
Dillon & Morris, 1996). As depicted in Figure 2.1, the innovation-decision process is one
through which an individual (or any other decision-making unit) passes (1) from first knowledge
of an innovation, (2) to forming an attitude towards the innovation, (3) to a decision to adopt or
reject, (4) to the implementation of the new idea, and (5) to the confirmation of this decision
(Rogers, 1995).
2.3.3 Task Technology Fit Model (TTF)
Task-Technology Fit (TTF) (Strong, Dishaw, & Bandy, 2006) theory holds that IT is more likely
to have a positive impact on individual performance and to be used if the capabilities of the IT
match the tasks that the user must perform (Goodhue & Thompson, 1995). The graphical
presentation of TTF is in Figure 2.2. TTF consists of eight factors: quality, locatability,
authorization, compatibility, ease of use/training, production timeliness, systems reliability and
relationship with users. TTF has been applied in the context of a diverse range of information
systems. TTF measured in conjunction with utilization, is a significant predictor of user reports
of improved job performance and effectiveness was attributable to their use of the system under
investigation (Goodhue & Thompson, 1995).
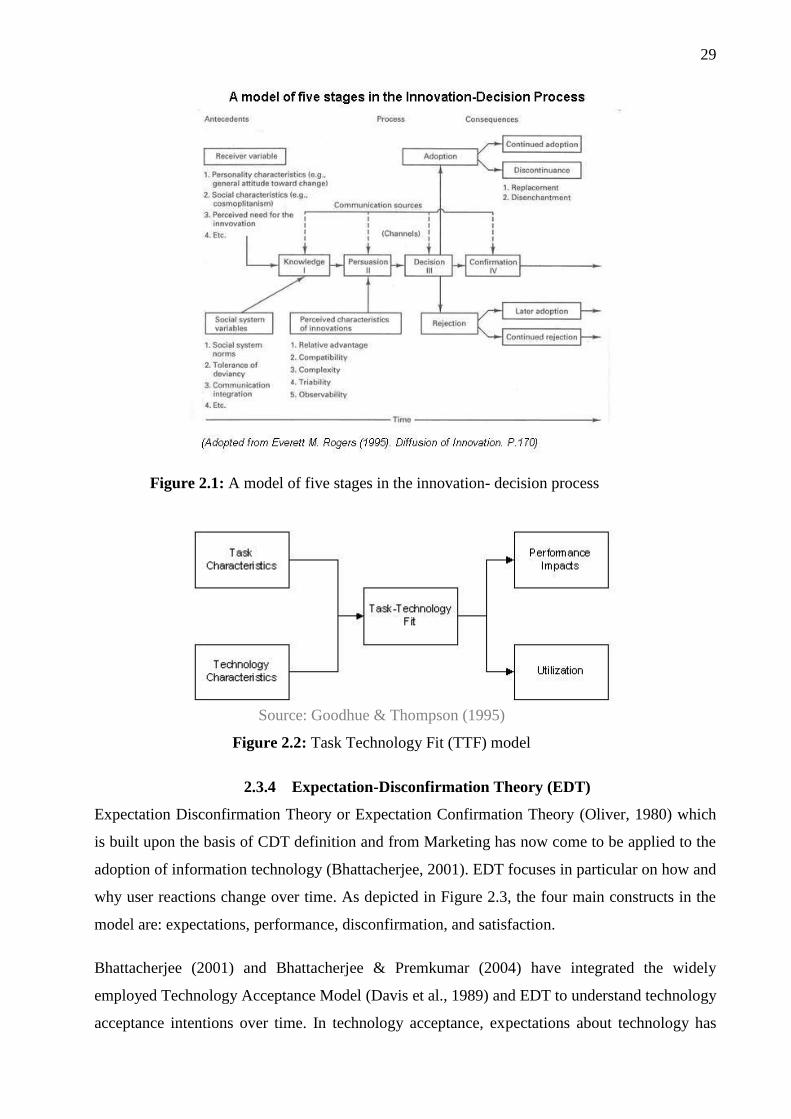
29
2.3.4 Expectation-Disconfirmation Theory (EDT)
Expectation Disconfirmation Theory or Expectation Confirmation Theory (Oliver, 1980) which
is built upon the basis of CDT definition and from Marketing has now come to be applied to the
adoption of information technology (Bhattacherjee, 2001). EDT focuses in particular on how and
why user reactions change over time. As depicted in Figure 2.3, the four main constructs in the
model are: expectations, performance, disconfirmation, and satisfaction.
Bhattacherjee (2001) and Bhattacherjee & Premkumar (2004) have integrated the widely
employed Technology Acceptance Model (Davis et al., 1989) and EDT to understand technology
acceptance intentions over time. In technology acceptance, expectations about technology has
Figure 2.1: A model of five stages in the innovation- decision process
Source: Goodhue & Thompson (1995)
Figure 2.2: Task Technology Fit (TTF) model
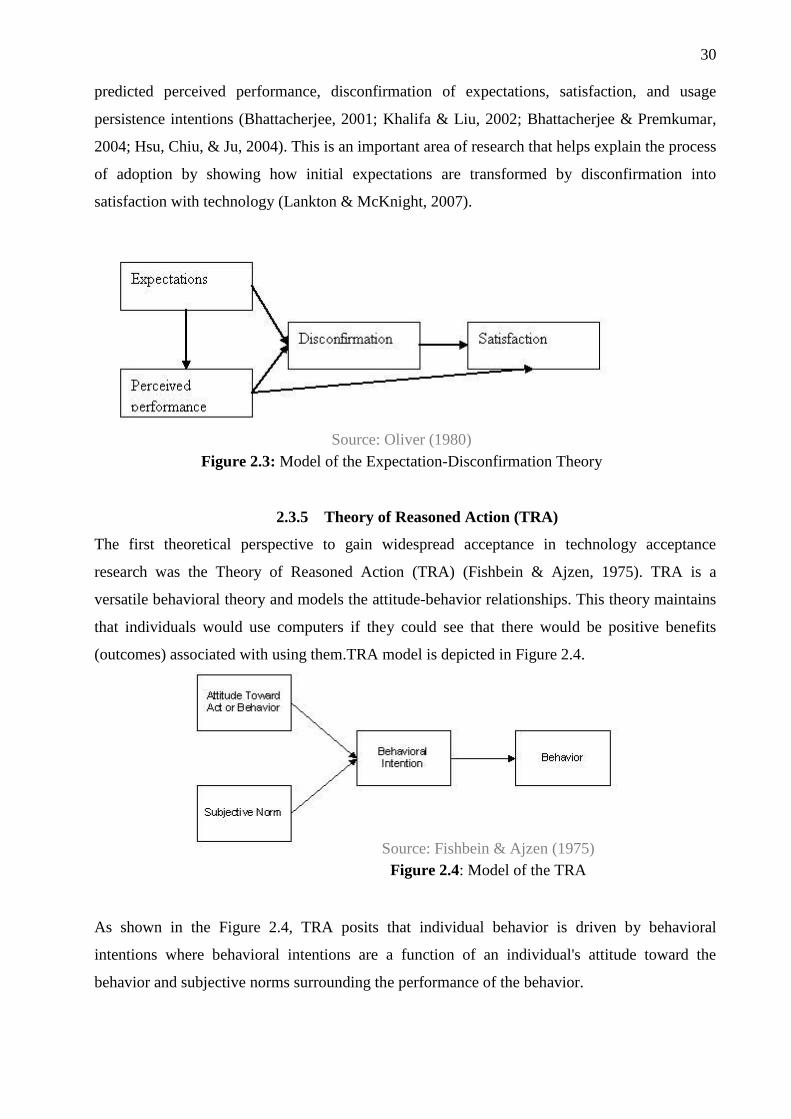
30
predicted perceived performance, disconfirmation of expectations, satisfaction, and usage
persistence intentions (Bhattacherjee, 2001; Khalifa & Liu, 2002; Bhattacherjee & Premkumar,
2004; Hsu, Chiu, & Ju, 2004). This is an important area of research that helps explain the process
of adoption by showing how initial expectations are transformed by disconfirmation into
satisfaction with technology (Lankton & McKnight, 2007).
2.3.5 Theory of Reasoned Action (TRA)
The first theoretical perspective to gain widespread acceptance in technology acceptance
research was the Theory of Reasoned Action (TRA) (Fishbein & Ajzen, 1975). TRA is a
versatile behavioral theory and models the attitude-behavior relationships. This theory maintains
that individuals would use computers if they could see that there would be positive benefits
(outcomes) associated with using them.TRA model is depicted in Figure 2.4.
As shown in the Figure 2.4, TRA posits that individual behavior is driven by behavioral
intentions where behavioral intentions are a function of an individual's attitude toward the
behavior and subjective norms surrounding the performance of the behavior.
Source: Oliver (1980)
Figure 2.3: Model of the Expectation-Disconfirmation Theory
Source: Fishbein & Ajzen (1975)
Figure 2.4: Model of the TRA
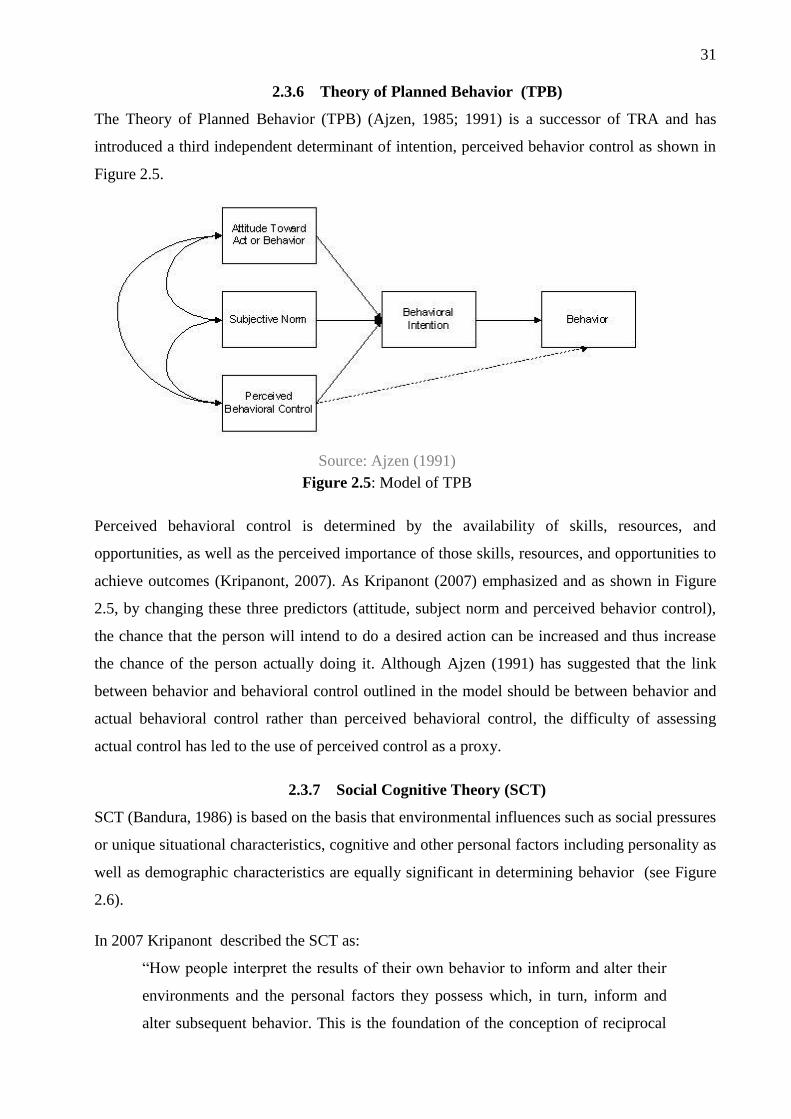
31
2.3.6 Theory of Planned Behavior (TPB)
The Theory of Planned Behavior (TPB) (Ajzen, 1985; 1991) is a successor of TRA and has
introduced a third independent determinant of intention, perceived behavior control as shown in
Figure 2.5.
Perceived behavioral control is determined by the availability of skills, resources, and
opportunities, as well as the perceived importance of those skills, resources, and opportunities to
achieve outcomes (Kripanont, 2007). As Kripanont (2007) emphasized and as shown in Figure
2.5, by changing these three predictors (attitude, subject norm and perceived behavior control),
the chance that the person will intend to do a desired action can be increased and thus increase
the chance of the person actually doing it. Although Ajzen (1991) has suggested that the link
between behavior and behavioral control outlined in the model should be between behavior and
actual behavioral control rather than perceived behavioral control, the difficulty of assessing
actual control has led to the use of perceived control as a proxy.
2.3.7 Social Cognitive Theory (SCT)
SCT (Bandura, 1986) is based on the basis that environmental influences such as social pressures
or unique situational characteristics, cognitive and other personal factors including personality as
well as demographic characteristics are equally significant in determining behavior (see Figure
2.6).
In 2007 Kripanont described the SCT as:
“How people interpret the results of their own behavior to inform and alter their
environments and the personal factors they possess which, in turn, inform and
alter subsequent behavior. This is the foundation of the conception of reciprocal
Source: Ajzen (1991)
Figure 2.5: Model of TPB
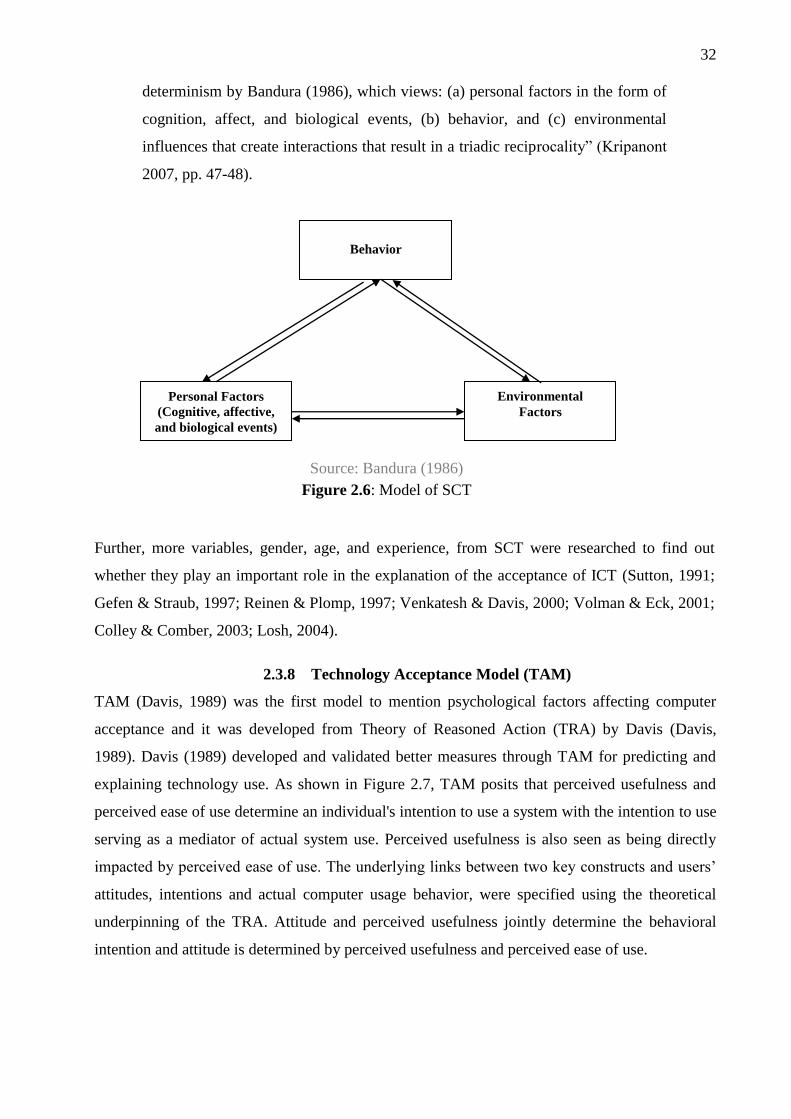
32
determinism by Bandura (1986), which views: (a) personal factors in the form of
cognition, affect, and biological events, (b) behavior, and (c) environmental
influences that create interactions that result in a triadic reciprocality” (Kripanont
2007, pp. 47-48).
Further, more variables, gender, age, and experience, from SCT were researched to find out
whether they play an important role in the explanation of the acceptance of ICT (Sutton, 1991;
Gefen & Straub, 1997; Reinen & Plomp, 1997; Venkatesh & Davis, 2000; Volman & Eck, 2001;
Colley & Comber, 2003; Losh, 2004).
2.3.8 Technology Acceptance Model (TAM)
TAM (Davis, 1989) was the first model to mention psychological factors affecting computer
acceptance and it was developed from Theory of Reasoned Action (TRA) by Davis (Davis,
1989). Davis (1989) developed and validated better measures through TAM for predicting and
explaining technology use. As shown in Figure 2.7, TAM posits that perceived usefulness and
perceived ease of use determine an individual's intention to use a system with the intention to use
serving as a mediator of actual system use. Perceived usefulness is also seen as being directly
impacted by perceived ease of use. The underlying links between two key constructs and users’
attitudes, intentions and actual computer usage behavior, were specified using the theoretical
underpinning of the TRA. Attitude and perceived usefulness jointly determine the behavioral
intention and attitude is determined by perceived usefulness and perceived ease of use.
Behavior
Environmental
Factors
Personal Factors
(Cognitive, affective,
and biological events)
Source: Bandura (1986)
Figure 2.6: Model of SCT
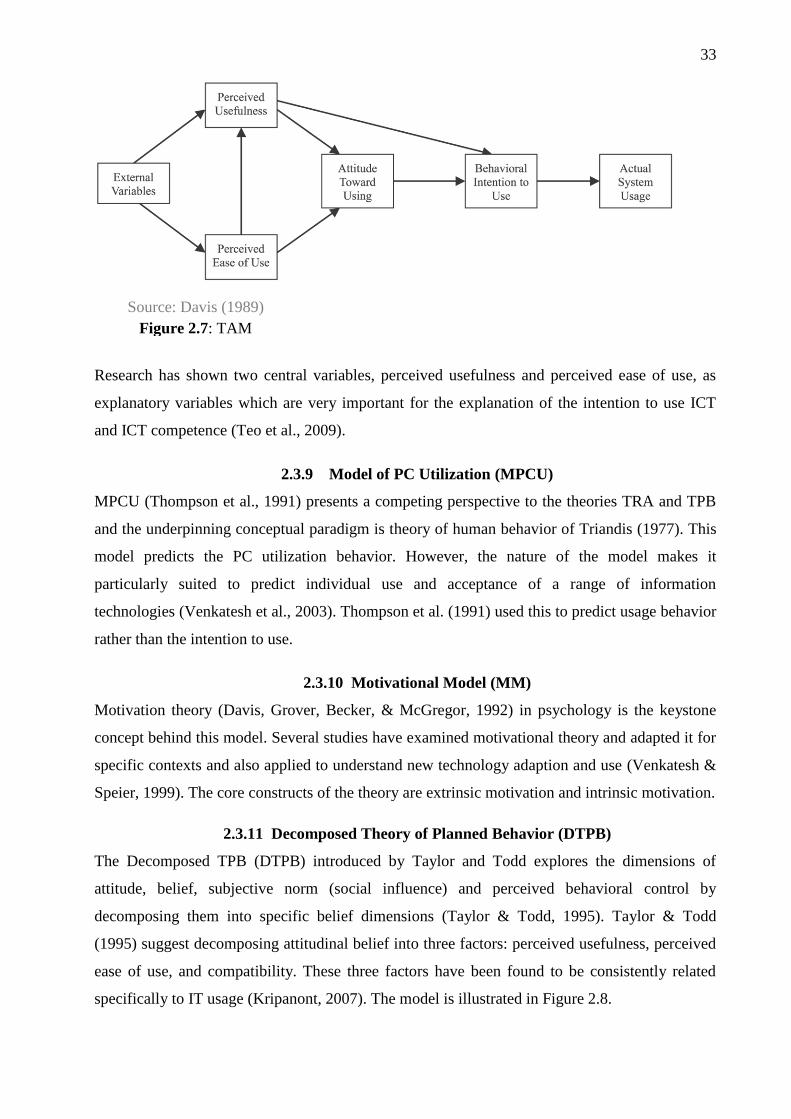
33
Research has shown two central variables, perceived usefulness and perceived ease of use, as
explanatory variables which are very important for the explanation of the intention to use ICT
and ICT competence (Teo et al., 2009).
2.3.9 Model of PC Utilization (MPCU)
MPCU (Thompson et al., 1991) presents a competing perspective to the theories TRA and TPB
and the underpinning conceptual paradigm is theory of human behavior of Triandis (1977). This
model predicts the PC utilization behavior. However, the nature of the model makes it
particularly suited to predict individual use and acceptance of a range of information
technologies (Venkatesh et al., 2003). Thompson et al. (1991) used this to predict usage behavior
rather than the intention to use.
2.3.10 Motivational Model (MM)
Motivation theory (Davis, Grover, Becker, & McGregor, 1992) in psychology is the keystone
concept behind this model. Several studies have examined motivational theory and adapted it for
specific contexts and also applied to understand new technology adaption and use (Venkatesh &
Speier, 1999). The core constructs of the theory are extrinsic motivation and intrinsic motivation.
2.3.11 Decomposed Theory of Planned Behavior (DTPB)
The Decomposed TPB (DTPB) introduced by Taylor and Todd explores the dimensions of
attitude, belief, subjective norm (social influence) and perceived behavioral control by
decomposing them into specific belief dimensions (Taylor & Todd, 1995). Taylor & Todd
(1995) suggest decomposing attitudinal belief into three factors: perceived usefulness, perceived
ease of use, and compatibility. These three factors have been found to be consistently related
specifically to IT usage (Kripanont, 2007). The model is illustrated in Figure 2.8.
Source: Davis (1989)
Figure 2.7: TAM
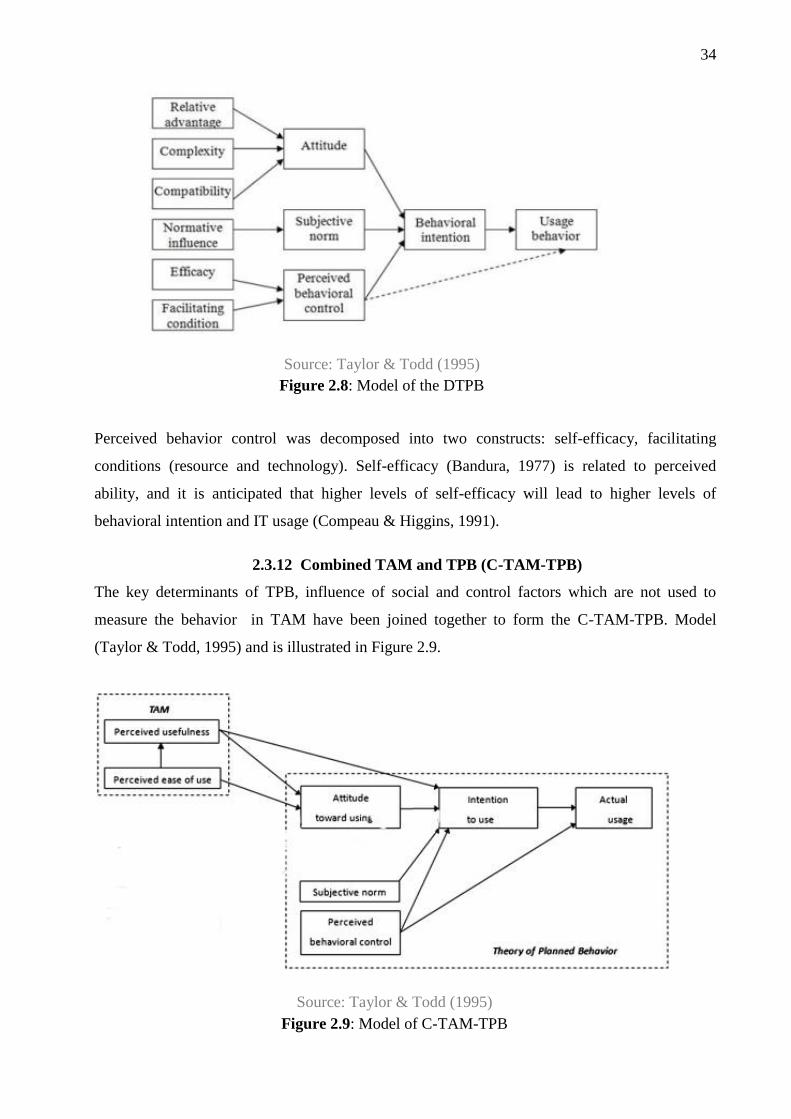
34
Perceived behavior control was decomposed into two constructs: self-efficacy, facilitating
conditions (resource and technology). Self-efficacy (Bandura, 1977) is related to perceived
ability, and it is anticipated that higher levels of self-efficacy will lead to higher levels of
behavioral intention and IT usage (Compeau & Higgins, 1991).
2.3.12 Combined TAM and TPB (C-TAM-TPB)
The key determinants of TPB, influence of social and control factors which are not used to
measure the behavior in TAM have been joined together to form the C-TAM-TPB. Model
(Taylor & Todd, 1995) and is illustrated in Figure 2.9.
Source: Taylor & Todd (1995)
Figure 2.8: Model of the DTPB
Source: Taylor & Todd (1995)
Figure 2.9: Model of C-TAM-TPB
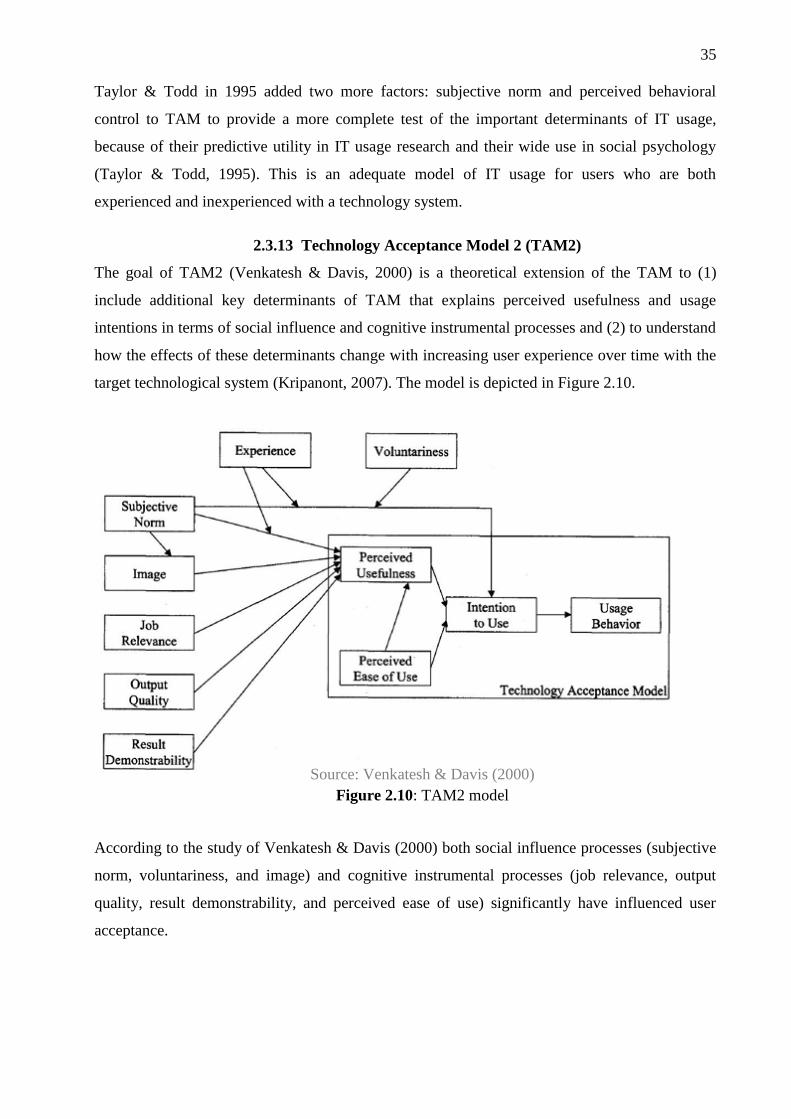
35
Taylor & Todd in 1995 added two more factors: subjective norm and perceived behavioral
control to TAM to provide a more complete test of the important determinants of IT usage,
because of their predictive utility in IT usage research and their wide use in social psychology
(Taylor & Todd, 1995). This is an adequate model of IT usage for users who are both
experienced and inexperienced with a technology system.
2.3.13 Technology Acceptance Model 2 (TAM2)
The goal of TAM2 (Venkatesh & Davis, 2000) is a theoretical extension of the TAM to (1)
include additional key determinants of TAM that explains perceived usefulness and usage
intentions in terms of social influence and cognitive instrumental processes and (2) to understand
how the effects of these determinants change with increasing user experience over time with the
target technological system (Kripanont, 2007). The model is depicted in Figure 2.10.
According to the study of Venkatesh & Davis (2000) both social influence processes (subjective
norm, voluntariness, and image) and cognitive instrumental processes (job relevance, output
quality, result demonstrability, and perceived ease of use) significantly have influenced user
acceptance.
Source: Venkatesh & Davis (2000)
Figure 2.10: TAM2 model
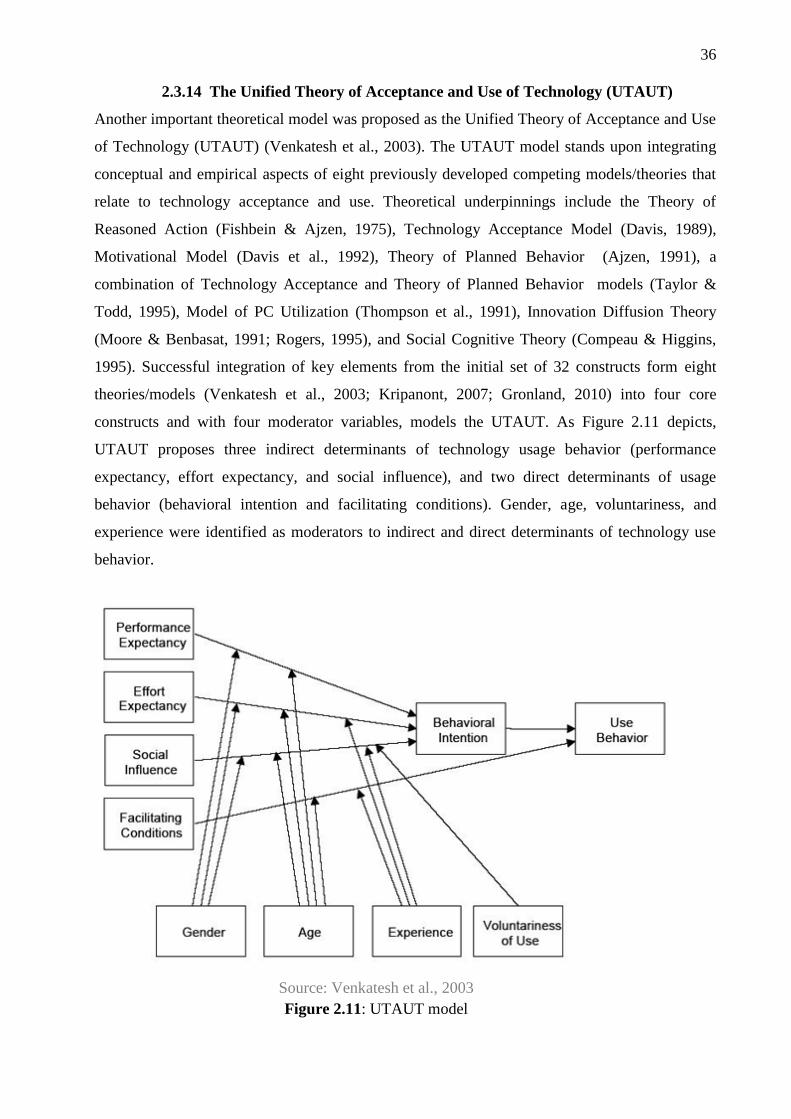
36
2.3.14 The Unified Theory of Acceptance and Use of Technology (UTAUT)
Another important theoretical model was proposed as the Unified Theory of Acceptance and Use
of Technology (UTAUT) (Venkatesh et al., 2003). The UTAUT model stands upon integrating
conceptual and empirical aspects of eight previously developed competing models/theories that
relate to technology acceptance and use. Theoretical underpinnings include the Theory of
Reasoned Action (Fishbein & Ajzen, 1975), Technology Acceptance Model (Davis, 1989),
Motivational Model (Davis et al., 1992), Theory of Planned Behavior (Ajzen, 1991), a
combination of Technology Acceptance and Theory of Planned Behavior models (Taylor &
Todd, 1995), Model of PC Utilization (Thompson et al., 1991), Innovation Diffusion Theory
(Moore & Benbasat, 1991; Rogers, 1995), and Social Cognitive Theory (Compeau & Higgins,
1995). Successful integration of key elements from the initial set of 32 constructs form eight
theories/models (Venkatesh et al., 2003; Kripanont, 2007; Gronland, 2010) into four core
constructs and with four moderator variables, models the UTAUT. As Figure 2.11 depicts,
UTAUT proposes three indirect determinants of technology usage behavior (performance
expectancy, effort expectancy, and social influence), and two direct determinants of usage
behavior (behavioral intention and facilitating conditions). Gender, age, voluntariness, and
experience were identified as moderators to indirect and direct determinants of technology use
behavior.
Source: Venkatesh et al., 2003
Figure 2.11: UTAUT model
37
Attitude toward using technology, self-efficacy, and anxiety are not theorized to be direct
determinants of intention (Kripanont, 2007). The key moderators in the model are gender, age,
voluntariness, and experience. From a theoretical perspective, UTAUT (Venkatesh et al., 2003)
provides a refined view of how the determinants of intention and behavior evolve over time, and
it is important to emphasize that most of the key relationships in the model are moderated
(Kripanont, 2007).
2.4 COMPARISON OF TECHNOLOGY ACCEPTANCE THEORIES/MODELS
Comparison of technology acceptance theories/models in general is vital to position the most
suitable theoretical paradigm for the current study. It provides an overall picture of underpinning
concepts of theories/models which have been used on the technology acceptance environment.
The underpinning paradigms of theories of CDT and EDT have proved as more relevant to form
technology acceptance, through a few studies in the literature (Bhattacherjee, 2001;
Bhattacherjee & Premkumar, 2004). Yet, those aspects do not appear to direct the current study
sufficiently and they have not received the same level of attention in the available literature as
the other theories/models in technology acceptance. CDT and EDT have not been researched in
various contexts in technology acceptance.
TRA, TPB, TAM, TAM2 and UTAUT are more popular technology acceptance theories/ models
that are being used worldwide in different settings more especially in IS literature. TRA has been
adapted for use in many fields and is widely used in academia and business today (Magee, 2002)
and has demonstrated validity in the Information Systems literature (Han, 2003). TRA model has
some limitations including a significant risk of confounding between attitudes and norms since
attitudes can often be reframed as norms and vice versa. The second limitation is the assumption
that when someone forms an intention to act, they will be free to act without limitation. In
practice, constraints such as limited ability, time, environmental or organizational limits, and
unconscious habits will limit the freedom to act. However, there is also a growing recognition
that additional explanatory variables are needed for TRA (Thompson et al., 1991; Webster &
Martocchio, 1992).
The Theory of Planned Behavior (TPB) attempts to resolve the limitations of TRA. TPB has
been the explicit theoretical basis for many studies over various contextual settings. Therefore,
DTPB could provide a more complete understanding of technology usage (Taylor & Todd,
1995). But, Davis et al. (1989) explained that SN scales have a very poor psychometric
38
standpoint, and may not exert any influence on BI, especially when IS applications are fairly
personal while individual usage is voluntary.
Generally, Technology Acceptance Model (TAM) specifies general determinants of individual
technology acceptance and therefore can be and has been applied to explain or predict individual
behaviors across a broad range of end user computing technologies and user groups (Davis et al.,
1989). Simultaneously TAM compared favorably with TRA and TPB in parsimonious capability
(Han, 2003). However, TAM is easier to use than TPB, and provides a quick and inexpensive
way of gathering general information about an individual’s perception of a technology.
According to the critical review and meta-analysis of TAM (Legris, Ingham, & Collerette, 2003),
claimed the TAM to be a useful model. However many researchers have attempted to expand
TAM which has only created confusion (Benbasat & Barki, 2007). Therefore the comparisons
confirm that TAM is parsimonious and easy to apply across different research settings;
nevertheless, it has to pay the trade-off of losing information richness derived from the studies
(Kripanont, 2007).
In a meta-analysis study on TAM with 88 published studies, King & He (2006) concluded that
the TAM is a valid and robust model. For the past two decades, substantial empirical evidence
has supported TAM. Perceived usefulness, perceived ease of use, social influence, facilitating
conditions, attitude, self-efficacy and anxiety together with UTAUT would thus be the basis of
the explanation of the usage of new technology (Wu et al., 2007; van Raaij & Schepers, 2008;
Wills et al., 2008). Venkatesh et al. (2003) have also added situational variables, gender, age,
experience and voluntariness of use to the UTAUT model even though core constructs play a
very important role in the explanation of the acceptance and use of technology (Verhoeven et al.,
2010; De Wit et al., 2011; Verhoeven et al., 2011). Therefore, the UTAUT has been playing a
key role in technology acceptance research and provides a solid base to explain why users accept
or reject a technology in a specific perspective.
It is clear however, that these theories/models have been expansively applied in a vast array of
research studies in technology contexts and other various areas of academic interest and they
have further proven their enhanced applicability in modeling technology acceptance in different
contextual settings.
The reviewed literature on technology acceptance theories/models which are relevant to the
current study (Bhattacherjee, 2001; Venkatesh et al., 2003; Bhattacherjee & Premkumar, 2004;
Kripanont, 2007; van Biljon & Kotzé, 2007; Al-Qeisi, 2009; Dulle, 2010) thus confirm that they
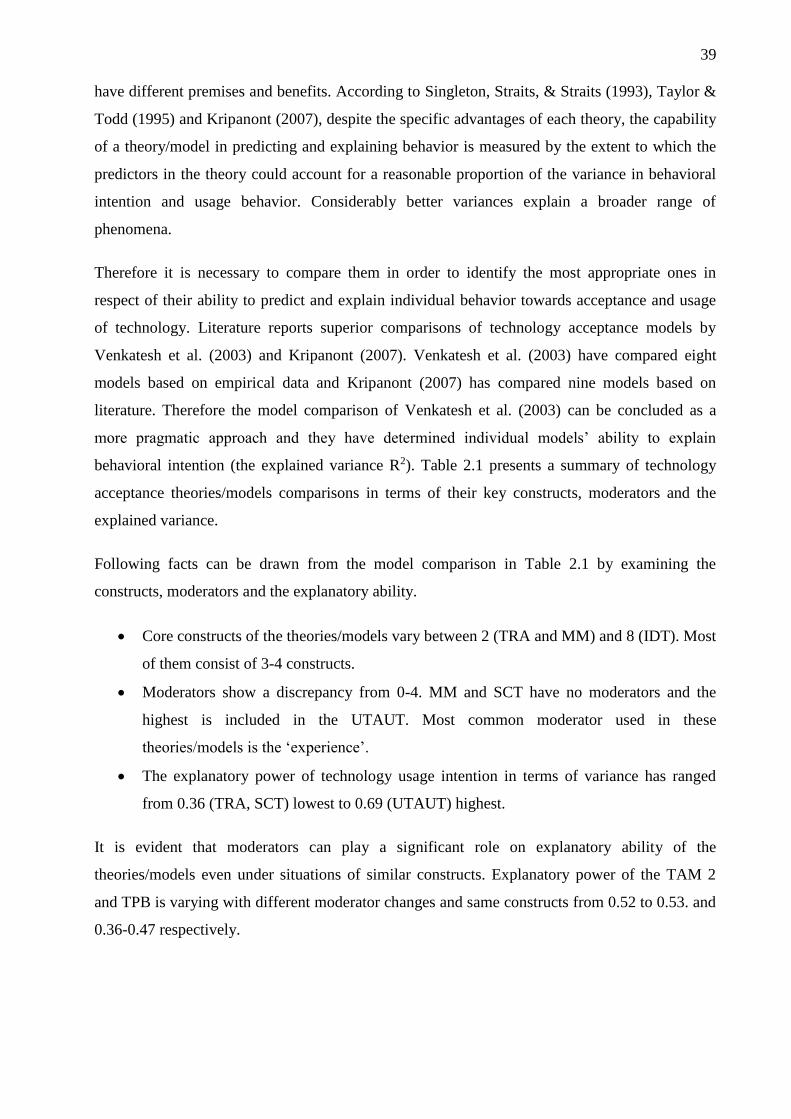
39
have different premises and benefits. According to Singleton, Straits, & Straits (1993), Taylor &
Todd (1995) and Kripanont (2007), despite the specific advantages of each theory, the capability
of a theory/model in predicting and explaining behavior is measured by the extent to which the
predictors in the theory could account for a reasonable proportion of the variance in behavioral
intention and usage behavior. Considerably better variances explain a broader range of
phenomena.
Therefore it is necessary to compare them in order to identify the most appropriate ones in
respect of their ability to predict and explain individual behavior towards acceptance and usage
of technology. Literature reports superior comparisons of technology acceptance models by
Venkatesh et al. (2003) and Kripanont (2007). Venkatesh et al. (2003) have compared eight
models based on empirical data and Kripanont (2007) has compared nine models based on
literature. Therefore the model comparison of Venkatesh et al. (2003) can be concluded as a
more pragmatic approach and they have determined individual models’ ability to explain
behavioral intention (the explained variance R2). Table 2.1 presents a summary of technology
acceptance theories/models comparisons in terms of their key constructs, moderators and the
explained variance.
Following facts can be drawn from the model comparison in Table 2.1 by examining the
constructs, moderators and the explanatory ability.
Core constructs of the theories/models vary between 2 (TRA and MM) and 8 (IDT). Most
of them consist of 3-4 constructs.
Moderators show a discrepancy from 0-4. MM and SCT have no moderators and the
highest is included in the UTAUT. Most common moderator used in these
theories/models is the ‘experience’.
The explanatory power of technology usage intention in terms of variance has ranged
from 0.36 (TRA, SCT) lowest to 0.69 (UTAUT) highest.
It is evident that moderators can play a significant role on explanatory ability of the
theories/models even under situations of similar constructs. Explanatory power of the TAM 2
and TPB is varying with different moderator changes and same constructs from 0.52 to 0.53. and
0.36-0.47 respectively.
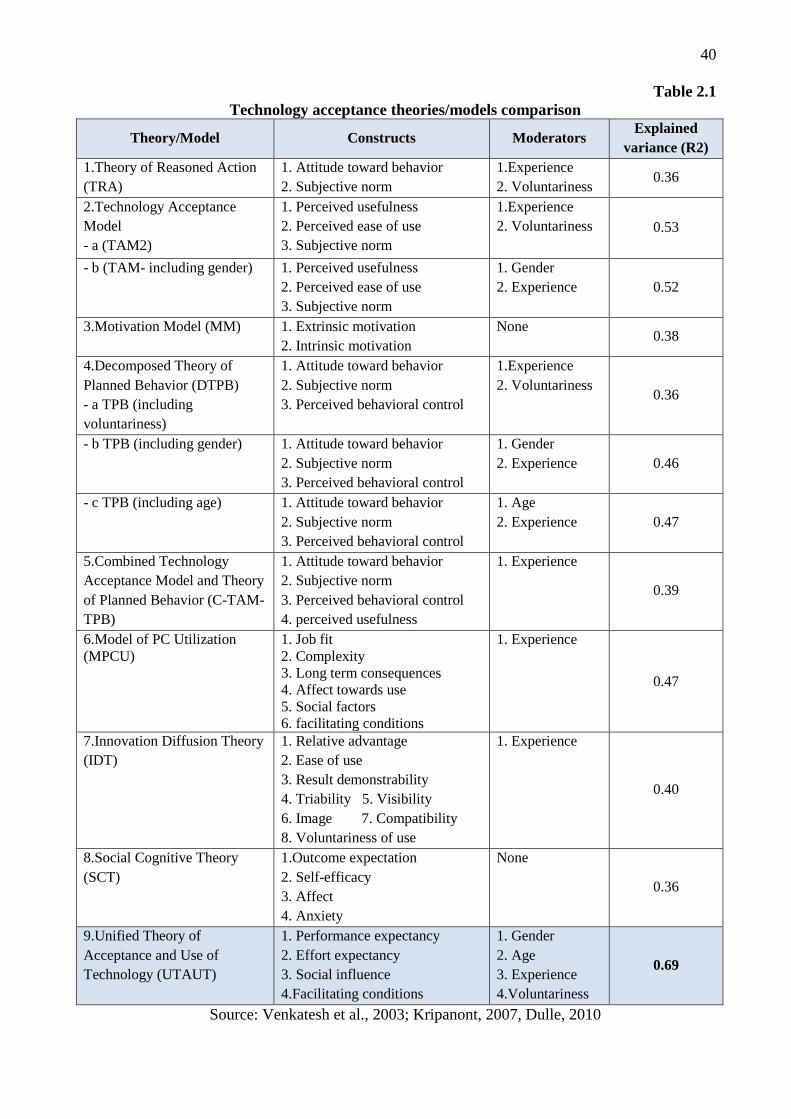
40
Table 2.1
Technology acceptance theories/models comparison
Theory/Model Constructs Moderators Explained
variance (R2)
1.Theory of Reasoned Action
(TRA)
1. Attitude toward behavior
2. Subjective norm
1.Experience
2. Voluntariness 0.36
2.Technology Acceptance
Model
- a (TAM2)
1. Perceived usefulness
2. Perceived ease of use
3. Subjective norm
1.Experience
2. Voluntariness 0.53
- b (TAM- including gender) 1. Perceived usefulness
2. Perceived ease of use
3. Subjective norm
1. Gender
2. Experience 0.52
3.Motivation Model (MM) 1. Extrinsic motivation
2. Intrinsic motivation
None 0.38
4.Decomposed Theory of
Planned Behavior (DTPB)
- a TPB (including
voluntariness)
1. Attitude toward behavior
2. Subjective norm
3. Perceived behavioral control
1.Experience
2. Voluntariness 0.36
- b TPB (including gender) 1. Attitude toward behavior
2. Subjective norm
3. Perceived behavioral control
1. Gender
2. Experience 0.46
- c TPB (including age) 1. Attitude toward behavior
2. Subjective norm
3. Perceived behavioral control
1. Age
2. Experience 0.47
5.Combined Technology
Acceptance Model and Theory
of Planned Behavior (C-TAM-
TPB)
1. Attitude toward behavior
2. Subjective norm
3. Perceived behavioral control
4. perceived usefulness
1. Experience
0.39
6.Model of PC Utilization
(MPCU) 1. Job fit 2. Complexity 3. Long term consequences 4. Affect towards use 5. Social factors 6. facilitating conditions
1. Experience
0.47
7.Innovation Diffusion Theory
(IDT)
1. Relative advantage
2. Ease of use
3. Result demonstrability
4. Triability 5. Visibility
6. Image 7. Compatibility
8. Voluntariness of use
1. Experience
0.40
8.Social Cognitive Theory
(SCT)
1.Outcome expectation
2. Self-efficacy
3. Affect
4. Anxiety
None
0.36
9.Unified Theory of
Acceptance and Use of
Technology (UTAUT)
1. Performance expectancy
2. Effort expectancy
3. Social influence
4.Facilitating conditions
1. Gender
2. Age
3. Experience
4.Voluntariness
0.69
Source: Venkatesh et al., 2003; Kripanont, 2007, Dulle, 2010
41
According to Taylor & Todd (1995) models should be evaluated in terms of both parsimony (few
predictors) and their contribution to understanding. This means that a model with a good
explanatory power and a lesser number of variables is well suited. But the researchers have
argued that parsimony is not desirable by itself but rather is desirable only to the extent that it
facilitates understanding (Venkatesh et al., 2003).
For predictive, practical applications of the model, parsimony may be more heavily weighted; on
the other hand, if trying to obtain the most complete understanding of a phenomenon, a degree of
parsimony may be sacrificed (Kripanont, 2007). As shown in the Table 2.1 the UTAUT is rich in
the explanatory ability in explaining behavioral intention and usage of technology. Therefore, the
theory contributes to a better understanding about the drivers of behavior of acceptance and use
of new technologies than other similar theories and models (Venkatesh et al., 2003; Kripanont,
2007; Wu et al., 2007; Dulle, 2010). Since current research is aimed at producing a model that
could contribute to a practical application and a prediction together with an understanding about
the ICT acceptance and use phenomenon, UTAUT seems to be the best theoretical underpinning
that should provide a useful tool to assess the likelihood of success for ICT acceptance and use.
2.5 THE CULTURAL DIMENSIONS AND ICT USE AND ACCEPTANCE
The study of use and acceptance of technology is a complex issue especially given its multi-
disciplinary subject nature pertaining to psychological, technical, and social contexts (Day,
2006). The difficulty is increased since technology adoption is as much a cultural issue as a
rational decision-making process (Im, Hong, & Kang, 2011). Thus, the cultural psychology and
psychological anthropology perspective that assesses cultural traits by personality tests at the
individual level of analysis should also be considered (Tyler, Allan, & Huo, 2000).
There have been many definitions of the concept of “individual culture” in the social science
literature (Al-Qeisi, 2009). However, none of these can be embraced in the same manner since
the macro level national cultural phenomena often lack precision in explaining behavior at the
individual level (Srite & Karahanna, 2006). According to Straub et al. (2002), most of the
definitions of culture depend on the assumption that an individual's membership in any cultural
group is influenced and modified by membership in other professional, organizational, ethnic,
religious, and various other social groups, each of which has its own specialized culture and
value set.
However, a number of dominant frameworks or models have been used in the study of culture in
Information Systems research. The most known cultural values and dimensions introduced by
42
major contributors are presented in Table 2.2. Table 2.2 consists of six different frameworks
(Schwartz, 1994; Hofstede, 1997; Trompenaars & Hampden-Turner, 1998) of understanding
culture and their seminaries of dimensions. Trompenaars & Hampden-Turner (1998) have seven
cultural dimensions by surveying managers from twenty different countries. Schwartz (1994) has
identified three dimensions; Conservatism / Autonomy, Hierarchy / Egalitarianism and Mastery /
Harmony (Voros & Choudrie, 2011). However, the most referred-to framework within the study
of culture is Hofstede’s dimensions theory.
Table 2.2
Summary for the most known cultural dimensions
Hofstede
(1997)
Schwartz
(1994)
Trompenaars and
Hampden-Turner
(1998)
Chinese
Cultural
Connection
(1987)
Hall
(1989)
Kluckhohn
and
Strodtbeck
(1961)
Power
Distance
Hierarchy/
Egalitarianism
- - - -
Individualism/
Collectivism
Autonomy Individualism/
Communitarianism - - Rational
Orientation
Masculinity/
Femininity
Mastery/
Harmony
Achievement/
Ascription inner-
directed/
Outer-directed
- -
Man-nature
orientation
Uncertainty
Avoidance - - - - -
Long- Term
Orientation
Conservatism
Attitude to Time
Confucian
Work
Dynamism
Time
Perception
Time
Orientation
- - Specific/
Diffuse
- Space
(personal
space &
Territory)
Space
Orientation
(Public &
Private)
- - - - High/Low
Context -
Source: Zakour (2008)
Hofstede's definition is arguably the most predominantly used (Srite & Karahanna, 2006) and he
defines culture as "the collective programming of the mind which distinguishes the members of
one human group from another" (1980, p. 260). This means that an individual's attitudes, beliefs,
and behavior are influenced by their social context and that individuals learn about behavior
through the study of the informational and social environment to which they belong (Srite &
Karahanna, 2006). Hofstede (1980) provides four widely cited dimensions of culture:
individualism/collectivism, power distance, uncertainty avoidance, and masculinity/femininity
which are used in individual basis for the current study.
43
2.6 ANALYSIS OF THE APPLICABILITY OF TECHNOLOGY ACCEPTANCE
THEORIES/MODELS
This section analyses the empirical applications of technology acceptance theories/models
identified, with the aim of determining the extent to which determinants and moderators of these
theories/models are pertinent to measure the technology use and acceptance behavior in Sri
Lankan university settings.
The diffusion of various aspects of technology/ICT studies that have made a significant
contribution towards propagating the knowledge emerging from the past research studies in
higher education settings as depicted in Appendix II. Those studies further provide opportunities
for possible exploration of the conceptualization, methodologies and interpretation of the
research.
A majority of the current studies is based on the UTAUT Venkatesh et al. (2003), which comes
under Information Systems theory and used in other disciplines including Information Science,
Marketing, Social Psychology and Management (see Appendix II). Williams, Rana, Dwivedi, &
Lal (2011) also showed that the originating article of UTAUT has already been cited by a large
number of studies within a short period of time. TAM is the secondly most-used acceptance
theory (see Appendix II). Also some researchers have claimed that prior to the existence of the
UTAUT, TAM was the most widely utilized theory to study IS/IT adoption within the IS
discipline (Venkatesh et al., 2003; Dwivedi, Williams, Lal, & Schwartz, 2008; Williams et al.,
2011). However, in a systematic literature review conducted in e-learning acceptance by Šumak,
Heričko, & Pušnik (2011) found that the TAM is the mostly used theory in e-learning use and
acceptance. Their study was not limited to university settings: the most common user type used
was students and academics. During TAM’s 20 years of existence, it has been utilized by a large
number of studies across various business- and management-related disciplines (Williams et al.,
2011). However, it appears that UTAUT has become a popular theoretical choice during the last
2-3 years within the field of Information System (IS)/Information Technology (IT) and adoption
and diffusion in higher education settings. It is therefore believed that UTAUT will provide a
sound theoretical basis for the current study.
According to Venkatesh et al. (2003), technology adoption research can be distinguished
between research that focuses on the individual acceptance, in which the behavioral intentions of
users, or actual use, are used as a dependent variable, and research that is more focused on
implementation success at the organizational level (Šumak et al., 2011). Therefore, there are at
various levels within any educational system, different expectations and drivers about
44
technology’s value and adoption on both personal and organizational level (Surry & Ensminger,
2006). However, the number of novel technologies increases and their diverse applicability
expands in individuals and organizations level alike. Although, the organizations get used
commonly to be updated with the trend in other organizations or countries in technology
innovation, individual use and acceptance is limited by various factors. Thus, it may be the
reason to focus on individual acceptance and use behavior than organizational, by most of the
researchers. It is confirmed by the summary of the literature on ICT adoption in university
settings (see Appendix II). It shows that only one study has focused on organizational utilization
(Kasse & Balunywa, 2013) while all other studies are on individual acceptance and use.
According to Kripanont (2007), theories/models that have been developed and repeatedly tested
in studies in other settings may not be equally valid in professional/educational settings. The
arguments elaborated in a study of Röcker (2010), has shown that the factors used to predict
adoption in existing systems (IT/IS), were not sufficient for explaining the adoption of future
ICTs. Also, on similar grounds Venkatesh et al. (2003) recommended further work on
identification and testing the additional boundary conditions of the UTAUT model in an attempt
to “provide a richer understanding of technology adoption and usage behavior in different
organizational and technological contexts”. Hence, it is pertinent to modify the determinants and
moderators of UTAUT to suit the specific research environment of the current study by
reviewing the empirical applications of UTAUT in university context.
2.6.1 UTAUT applications in university settings
The constant use of UTAUT for the last ten years since its origination attracted the efforts of
numerous researchers in analyzing trends and patterns of use and acceptance (El-Gayar &
Moran, 2006; Lin & Anol, 2008; Stephan et al., 2009; Verhoeven et al., 2010; Shu & Chuang,
2011; Avci & Askar, 2012; Lin, Lu, & Liu, 2013), illustrating actual performance by employing
systematic reviews (Williams et al., 2011), cross cultural validations (Oshlyansky, Cairns, &
Thimbleby, 2007; Im et al., 2011) and the meta-analysis approach (Williams et al., 2011) in
technology adoption in university contexts.
One of the first steps in establishing the efficacy of a theoretical model is examining its ability
for generalization across time, populations, and contexts (Shadish, Cook, & Campbell, 2002). A
similar concept has been further identified by Venkatesh, Thong, & Xu (2012) as three broad
types of UTAUT extensions/integrations; (1) new contexts such as new technologies, new user
populations and new cultural settings (2) addition of new constructs in order to expand the scope
of the endogenous theoretical mechanisms outlined in UTAUT and (3) inclusion of exogenous
45
predictors of the UTAUT variables. Existence of these integrations in the university settings
should be reviewed in order to further identify knowledge gaps in the literature which will be
covered by the current research.
Appendix II clearly shows the development in applicability of UTAUT across the time and that it
is vastly diffused. Also, it shows the broad range of contexts such as organizational, individual,
technological and cultural, in which generalizability has been examined. In-depth consideration
of those contexts will provide a better foundation to fill the knowledge gap through the current
research study.
2.6.1.1 Context considerations of UTAUT in university settings
With the intention of comprehensively understanding individual acceptance of technology, it is
necessary to infer end user behavior in university settings within at least three contexts:
technology context, user population context and the cultural (national) context (Venkatesh et al.,
2012), where a context refers to the interrelated conditions in which something exists or occurs
(Webster, 2006).
Technology (system) context refers to the end-user computing technologies under investigation,
such as any IT innovations, information system applications, and communications technology
(Kripanont, 2007). Those ICT tools have usually been adapted by past researchers separately or
together. Most of the studies have covered a vast range of technology applications from the basic
computer use (Valentín et al., 2013), web 2.0 technologies (Gruzd et al., 2012; Escobar-
Rodriguez, Carvajal-Trujillo, & Monge-Lozano, 2013) to the newest concept, cloud computing
(Chang, Chiang, & Hopkinson, 2013) in university settings. Further, they were applied within
new contexts in university settings, such as E-Library (Ayele & Sreenivasarao, 2013);
podcasting (Lin, Zimmer, & Lee, 2013); Wiki/Blog (Avci & Askar, 2012) etc.
Individual/ user population context refers to those essential characteristics of individual users
that are related to technology usage (Kripanont, 2007). In university settings a range of users
have been exploited for UTAUT testing (see Appendix II). Some researchers focused their
studies on university teachers (Oye et al., 2012; Thowfeek & Jaafar, 2013), post graduate
students (Rahman, Jamaludin, & Mahmud, 2011), library users (Santos-Feliscuzo & Himang,
2011), the whole university community including academics, non-academics, executives, post
graduate students and undergraduate students together (Chen, 2011) and the combination of
those user categories (Ayele & Sreenivasarao, 2013; Lin et al., 2013). However, most of the
studies have focused on students’ use and acceptance of any technology tool (El-Gayar &
46
Moran, 2006; Marchewka et al., 2007; Lin & Anol, 2008; Stephan et al., 2009; Verhoeven et al.,
2010; Yoo & Huang, 2011; Tan, 2013 etc.) since they become the leading members of the e-
workforce when they leave their universities. Therefore, it is vital to redirect the focus on use
and acceptance of ICTs towards students.
The next context to be considered is the culture. Here, the national cultural context, which refers
to the macro environment in which the investigated user behavior occurs, should be considered
because, it is believed that the national culture also has an impact on an individual’s decision-
making process towards using a technology (Han, 2003). Most of the UTAUT applications have
taken place in western countries and user behavior in other cultural settings needs to be studied
to make sure that the knowledge derived from studies in Western countries can be cautiously
applied to other cultures particularly.
2.6.1.2 Endogenous/exogenous variable consideration in UTAUT within university settings
Most of the studies only adapted main constructs of the UTAUT (see Appendix II). However,
some researchers have adapted external variables for the UTAUT variables in order to better
explain the particular technology acceptance environments. Table 2.3 depicts the summary of the
endogenous and exogenous predictors used in UTAUT within university contexts.
As depicted in the above Table 2.3, although some studies have used computer self-efficacy,
attitude and anxiety or one or two of them as direct determinants of the behavioral intention to
use technologies (El-Gayar & Moran, 2006; Marchewka et al., 2007; Yoo & Huang, 2011; Avci
& Askar, 2012; Nassuora, 2012), those were included not as direct determinants to the
behavioral intention, but as indirect determinants of the UTAUT model (Venkatesh et al., 2003).
Further, some studies have adapted a number of exogenous variables for the UTAUT in
university settings. Some of them are intrinsic/hedonic motivation (Basar, 2012; Escobar-
Rodriguez et al., 2013), personal innovativeness (van Raaij & Schepers, 2008; Lin et al., 2013),
education compatibility (Chen, 2011), cultural factors (Thowfeek & Jaafar, 2013), technology
task fit (Jing, Jinghua, & Junquan, 2010) and user involvement (Shu & Chuang, 2011) etc.
However, different results have been received from most of those studies for particular
technologies and particular user categories.
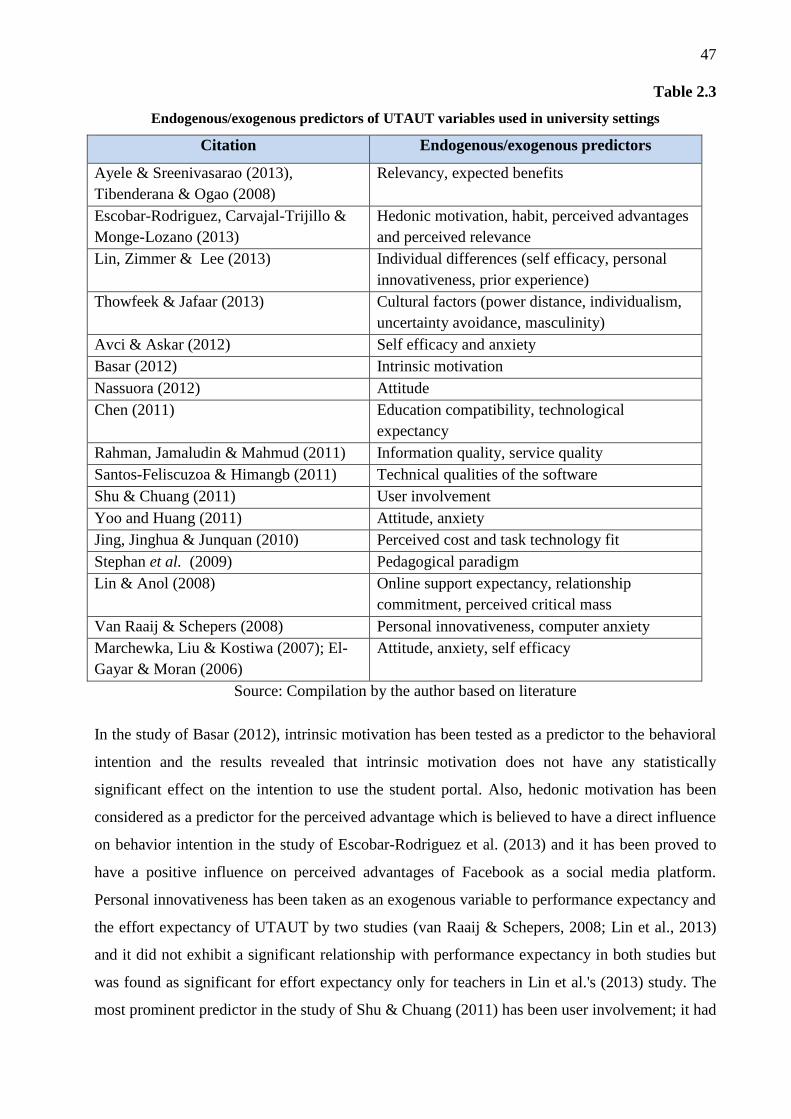
47
Table 2.3
Endogenous/exogenous predictors of UTAUT variables used in university settings
Citation Endogenous/exogenous predictors
Ayele & Sreenivasarao (2013),
Tibenderana & Ogao (2008)
Relevancy, expected benefits
Escobar-Rodriguez, Carvajal-Trijillo &
Monge-Lozano (2013)
Hedonic motivation, habit, perceived advantages
and perceived relevance
Lin, Zimmer & Lee (2013) Individual differences (self efficacy, personal
innovativeness, prior experience)
Thowfeek & Jafaar (2013) Cultural factors (power distance, individualism,
uncertainty avoidance, masculinity)
Avci & Askar (2012) Self efficacy and anxiety
Basar (2012) Intrinsic motivation
Nassuora (2012) Attitude
Chen (2011) Education compatibility, technological
expectancy
Rahman, Jamaludin & Mahmud (2011) Information quality, service quality
Santos-Feliscuzoa & Himangb (2011) Technical qualities of the software
Shu & Chuang (2011) User involvement
Yoo and Huang (2011) Attitude, anxiety
Jing, Jinghua & Junquan (2010) Perceived cost and task technology fit
Stephan et al. (2009) Pedagogical paradigm
Lin & Anol (2008) Online support expectancy, relationship
commitment, perceived critical mass
Van Raaij & Schepers (2008) Personal innovativeness, computer anxiety
Marchewka, Liu & Kostiwa (2007); El-
Gayar & Moran (2006)
Attitude, anxiety, self efficacy
Source: Compilation by the author based on literature
In the study of Basar (2012), intrinsic motivation has been tested as a predictor to the behavioral
intention and the results revealed that intrinsic motivation does not have any statistically
significant effect on the intention to use the student portal. Also, hedonic motivation has been
considered as a predictor for the perceived advantage which is believed to have a direct influence
on behavior intention in the study of Escobar-Rodriguez et al. (2013) and it has been proved to
have a positive influence on perceived advantages of Facebook as a social media platform.
Personal innovativeness has been taken as an exogenous variable to performance expectancy and
the effort expectancy of UTAUT by two studies (van Raaij & Schepers, 2008; Lin et al., 2013)
and it did not exhibit a significant relationship with performance expectancy in both studies but
was found as significant for effort expectancy only for teachers in Lin et al.'s (2013) study. The
most prominent predictor in the study of Shu & Chuang (2011) has been user involvement; it had
48
the greatest explanatory power in their study, indicated by the size of the correlation and its
statistical significance. This proved that wikis are “customer centric” and require greater user
involvement to guarantee their success because of their decentralized and collaborative nature.
Therefore, most of them cannot be confirmed as good exogenous predictors for UTAUT on
entire ICT use and acceptance behavior within the university context.
Education compatibility has been defined as the degree to which an e-learning system is
perceived as being congruent with a student’s learning expectancy. More specifically, it has been
referred to as the degree to which an e-learning system complies with the overall learning
expectancy of students, including the current learning situation, the learning style, and the
preference of conducting learning activities. However, educational compatibility has proven to
be the most critical determinant for e-learning acceptance in the study of Chen (2011). This
finding means that how a student’s perceptions of technology fit with his/her learning
expectancies is more important than perceptions regarding technological usage. Thus,
educational compatibility predominates in a student’s decision to accept a technology. This
determinant has been seldom considered by prior research. Though the university students are
traditionally motivated to use ICTs to successfully face technological improvement in the job
market, they tend to use them usually if the technology matches or needs their learning/course
requirements. Therefore, educational compatibility will be a better suited predictor of use and
acceptance of ICTs in university settings. However, education compatibility is contained in
performance expectancy as Venkatesh et al. (2003) defined performance expectancy is the
degree to which a student believes that using ICTs will help him or her to attain gains in
education/job performance.
2.6.1.3 Moderators/ other variable considerations in UTAUT within university settings
One of the major characteristics in UTAUT is the inclusion of moderator variables. The original
TAM did not include any moderating effects. Moderating variable is one that has a strong
contingent effect on the independent variable and dependent variable relationship (Serenko,
Turel, & Yol, 2006; Kripanont, 2007). That is, the presence of a third variable (the moderating
variable) modifies the original relationship between the independent and the dependent variables
and moderators can potentially increase the predictive validity of models.
The UTAUT has included experience, voluntariness, gender and age in order to make better
prediction and explanation associated with user behavior for a particular technology. Prior
research has examined those four factors as the main moderators of beliefs on technology
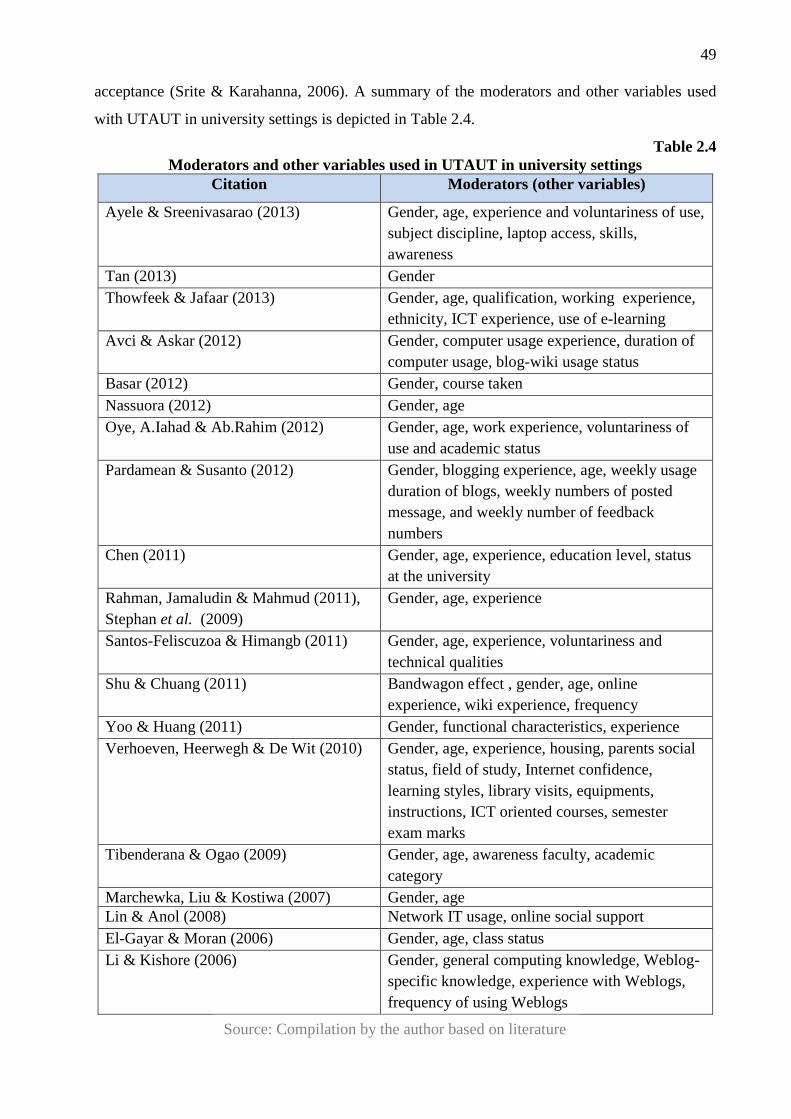
49
acceptance (Srite & Karahanna, 2006). A summary of the moderators and other variables used
with UTAUT in university settings is depicted in Table 2.4.
Table 2.4
Moderators and other variables used in UTAUT in university settings
Citation Moderators (other variables)
Ayele & Sreenivasarao (2013) Gender, age, experience and voluntariness of use,
subject discipline, laptop access, skills,
awareness
Tan (2013) Gender
Thowfeek & Jafaar (2013) Gender, age, qualification, working experience,
ethnicity, ICT experience, use of e-learning
Avci & Askar (2012) Gender, computer usage experience, duration of
computer usage, blog-wiki usage status
Basar (2012) Gender, course taken
Nassuora (2012) Gender, age
Oye, A.Iahad & Ab.Rahim (2012) Gender, age, work experience, voluntariness of
use and academic status
Pardamean & Susanto (2012) Gender, blogging experience, age, weekly usage
duration of blogs, weekly numbers of posted
message, and weekly number of feedback
numbers
Chen (2011) Gender, age, experience, education level, status
at the university
Rahman, Jamaludin & Mahmud (2011),
Stephan et al. (2009)
Gender, age, experience
Santos-Feliscuzoa & Himangb (2011) Gender, age, experience, voluntariness and
technical qualities
Shu & Chuang (2011)
Bandwagon effect , gender, age, online
experience, wiki experience, frequency
Yoo & Huang (2011) Gender, functional characteristics, experience
Verhoeven, Heerwegh & De Wit (2010) Gender, age, experience, housing, parents social
status, field of study, Internet confidence,
learning styles, library visits, equipments,
instructions, ICT oriented courses, semester
exam marks
Tibenderana & Ogao (2009) Gender, age, awareness faculty, academic
category
Marchewka, Liu & Kostiwa (2007) Gender, age
Lin & Anol (2008) Network IT usage, online social support
El-Gayar & Moran (2006) Gender, age, class status
Li & Kishore (2006) Gender, general computing knowledge, Weblog-
specific knowledge, experience with Weblogs,
frequency of using Weblogs
Source: Compilation by the author based on literature
50
Table 2.4 illustrates that while some researchers have used moderator variables, others have not.
Even though most of the researchers have termed some variables as moderators in UTAUT, they
have not analyzed the moderator effects (Santos-Feliscuzo & Himang, 2011; Ayele &
Sreenivasarao, 2013 etc.).
Other researchers have treated moderators as external constructs in some of the studies. A number
of researchers have opted for adding or dropping some of the moderators while others have
retained the same variables as those in the original UTAUT model to suit their specific research
contexts (Kripanont, 2007; Tibenderana & Ogao, 2008; Shu & Chuang, 2011). Such a concept
that has been investigated in the paper of Shu & Chuang (2011) is the ‘peer effect’ or
‘bandwagon effect’. Keynes (1936) stated that facing multiple choices, people tend to confirm
their final decision when other people also make the same choice. Since the bandwagon effect
does not directly affect the intention to use, it is expected to have a moderator effect on the use
of wikis. Results showed that the bandwagon effect has intensified the impact of intention to use
wikis on the actual use. However, the bandwagon effect seems to be more suited for specific ICT
tools such as wikis and not for general ICT use and acceptance.
2.6.1.4 Hofstede’s cultural factor considerations with UTAUT in university settings
Reviewed literature revealed that a country’s national culture is an important factor limiting the
use and acceptance of ICTs and the role of culture in technology adoption has been examined in
many studies (Im et al., 2011). Yet, other studies have been conducted in organizational contexts
as well. However, Oshlyansky et al. (2007) have shown that the UTAUT tool is robust enough in
providing insight into cross-cultural technology acceptance differences.
Although Im et al. (2011) and Nwabueze et al. (2009) argue that the UTAUT and its
predecessors have left out culture as a key antecedent to technology acceptance, including
gender which is a fundamental aspect of culture, as a key moderator of the UTAUT Venkatesh et
al. (2003) have given evidence by including individual cultural factors into the model. More
especially ICT acceptance and the adaptation of Hofstede’s cultural dimensions with
UTAUT/TAM in university settings are summarized in Table 2.5.
All the studies presented in Table 2.5 are more recent. It means that the adaptation of well-
established Hofstede’s cultural dimensions into the academic domain is a current trend. Some
authors have adapted cultural factors as exogenous variables to measure the direct effect on
behavior intention or usage of technologies (Suraweera & Liew, 2011; Gogus et al., 2012;
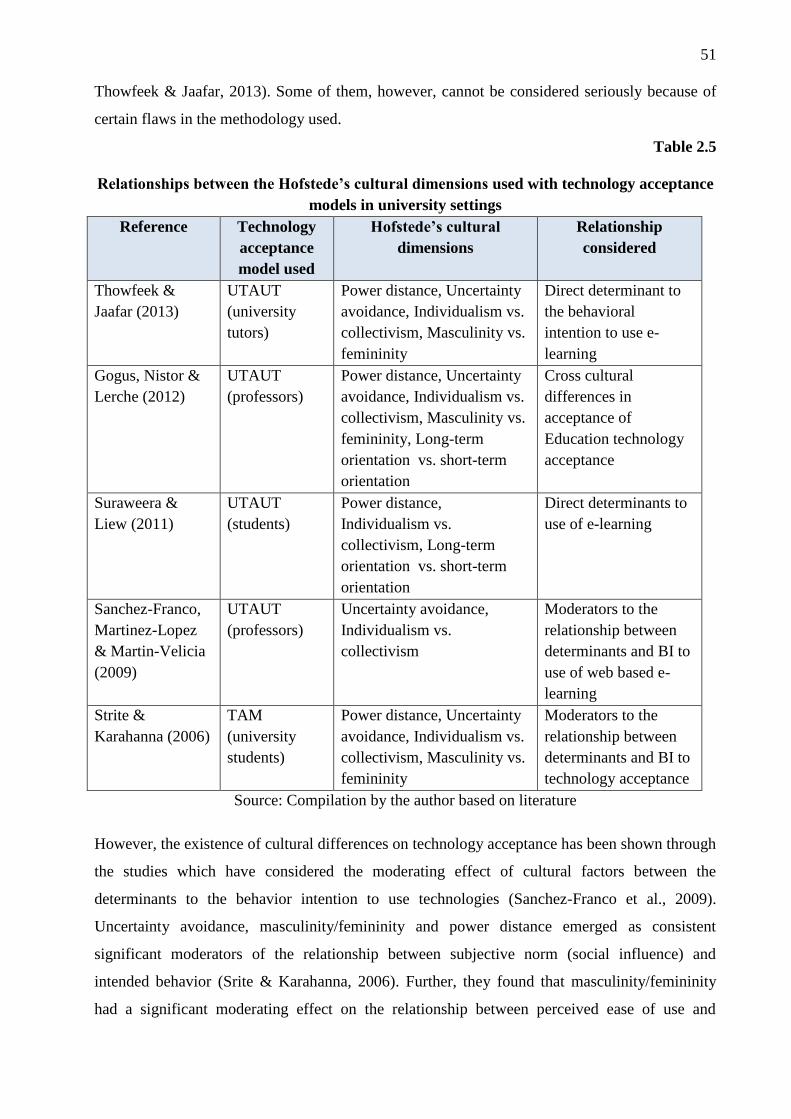
51
Thowfeek & Jaafar, 2013). Some of them, however, cannot be considered seriously because of
certain flaws in the methodology used.
Table 2.5
Relationships between the Hofstede’s cultural dimensions used with technology acceptance
models in university settings
Reference Technology
acceptance
model used
Hofstede’s cultural
dimensions
Relationship
considered
Thowfeek &
Jaafar (2013)
UTAUT
(university
tutors)
Power distance, Uncertainty
avoidance, Individualism vs.
collectivism, Masculinity vs.
femininity
Direct determinant to
the behavioral
intention to use e-
learning
Gogus, Nistor &
Lerche (2012)
UTAUT
(professors)
Power distance, Uncertainty
avoidance, Individualism vs.
collectivism, Masculinity vs.
femininity, Long-term
orientation vs. short-term
orientation
Cross cultural
differences in
acceptance of
Education technology
acceptance
Suraweera &
Liew (2011)
UTAUT
(students)
Power distance,
Individualism vs.
collectivism, Long-term
orientation vs. short-term
orientation
Direct determinants to
use of e-learning
Sanchez-Franco,
Martinez-Lopez
& Martin-Velicia
(2009)
UTAUT
(professors)
Uncertainty avoidance,
Individualism vs.
collectivism
Moderators to the
relationship between
determinants and BI to
use of web based e-
learning
Strite &
Karahanna (2006)
TAM
(university
students)
Power distance, Uncertainty
avoidance, Individualism vs.
collectivism, Masculinity vs.
femininity
Moderators to the
relationship between
determinants and BI to
technology acceptance
Source: Compilation by the author based on literature
However, the existence of cultural differences on technology acceptance has been shown through
the studies which have considered the moderating effect of cultural factors between the
determinants to the behavior intention to use technologies (Sanchez-Franco et al., 2009).
Uncertainty avoidance, masculinity/femininity and power distance emerged as consistent
significant moderators of the relationship between subjective norm (social influence) and
intended behavior (Srite & Karahanna, 2006). Further, they found that masculinity/femininity
had a significant moderating effect on the relationship between perceived ease of use and
52
intended behavior also. Those studies focused on the availability of cultural differences among a
variety of cultural groups but have not established clear relationships between cultural variables
and ICT adoption and usage determinants. Also, they have not considered how the model
increases the explanatory power in explaining particular technology acceptance environment
within a specific group.
2.7 SUMMARY OF THE LITERATURE REVIEW
Though, literature reveals that a large range of ICT tools and applications has become integrated
into higher education almost instantly, it does not report an optimal absorption by students. Thus,
further exploring the ICT use and acceptance in university settings in order to examine whether
they are optimally utilized is imperative and it seems to have been largely ignored in Information
Science, as is evident from the paucity of literature in the field. Moreover, it was apparent that a
variety of novel ICT tools emerge timely in a mushrooming growth and students rush on them.
However, in the UCTIT exams under HETC project in Sri Lanka has affirmed that capability in
using MS Word, Excel, Access and Power Point and the Internet searching and social
communication networks as the ICT tools in which a student should be skilled (“Outline of the
areas covered in the UCTIT exam,” 2014). Further, a phenomenological inquiry would help the
researcher to identify the important ICT tools that graduates in Sri Lankan universities should be
equipped with.
Overall, the results of the non-theory based studies confirmed that specific differences in
individual behavior of ICT use and acceptance in diverse country contexts may exist. Further,
the progress seemed to be of a lower rapidity due to poor promotion in exploiting ICTs in Sri
Lankan universities. Therefore, the problem domain in the current study fills the gap on
knowledge exploring the behavior of university students on use and acceptance of ICTs in Sri
Lankan universities.
From the comprehensive critique of fourteen technology acceptance theories/models, it emerges
that the UTAUT would be more suited to modeling ICT acceptance and use because UTAUT is
generic and can be applied in any particular technology acceptance setting. UTAUT is further
well suited to explore the technology use and acceptance behavior since it has given a provision
to extend to wider environments with different cultures. Moreover, literature clearly revealed
that the UTAUT is the most recently applied theoretical underpinning in most of the technology
acceptance theories and therefore an in-depth review of the applications of UTAUT on university
settings was performed. Although, a huge number of UTAUT applications have taken place
using a variety of ICT tools and user categories, mostly in Western countries on behavior
53
intention to use technologies, the present study attempts to fill the knowledge gap by
contributing to modeling the current usage behavior and intention to future use of ICTs by
university students in a non-Western developing country, Sri Lanka. In an in-depth study on the
integrations of UTAUT, it was found that the addition of new constructs in order to expand the
scope of the endogenous theoretical mechanisms outlined in UTAUT and the inclusion of
exogenous predictors of the UTAUT variables can be useful. However, many of those did not
seem successful and therefore by scrutinizing those circumstances the researcher will be able to
better explain predictors of UTAUT in examining the technology acceptance behavior in the
current context.
It was further found that little effort has been taken to establish clear moderation effects on
technology acceptance and that there was no study on ascertaining moderating effects of
individual cultural factors on UTAUT at all. Therefore, a closer enquiry is desirable in the
context of rapidly changing ICTs, because the impact of individual culture may be greater within
fast advancing technologies. Finally, a strong requirement exists to explore the ICT use and
acceptance behavior in each country, as each country may have its own culture which has been
proved as highly influential on technology adoption by many researchers with different levels of
importance. University students’ behavior on use and acceptance of ICTs are associated with the
Sri Lankan culture, and therefore, any findings from previous studies carried out in other
countries may have limited relevance.
2.8 SUMMARY
In this Chapter, fourteen well-known theories and models relevant to technology acceptance
have been reviewed. In spite of the specific features of each theory, the capability of the
theory/model in predicting and explaining behavior has been measured by the extent to which
the predictors in the theory could account for a reasonable proportion of the variance. If it is
greater, the strength of the model in predicting and explaining the usage behavior and intention
to use behavior is greater. Also, a preferable model should be evaluated in terms of both
parsimony and its contribution to understanding. Since the current study expects to produce a
model of ICT use and acceptance, these well-known theories and models were found to have
specific features and significant benefits that will support to develop the theoretical framework
of the study. However, the UTAUT seems to be provided a solid base to explain why users
accept or reject a technology in a specific perspective and it is very promising in enhancing our
understanding of technology acceptance. Therefore, the empirical applications of UTAUT in
university settings with incorporation of individual cultural dimensions were further reviewed
54
and it was concluded that further applications in other technological, user and cultural contexts
would have to take place. Therefore, using the above theoretical and empirical understandings,
the conceptualization of theoretical framework and hypotheses will be discussed in the next
Chapter.
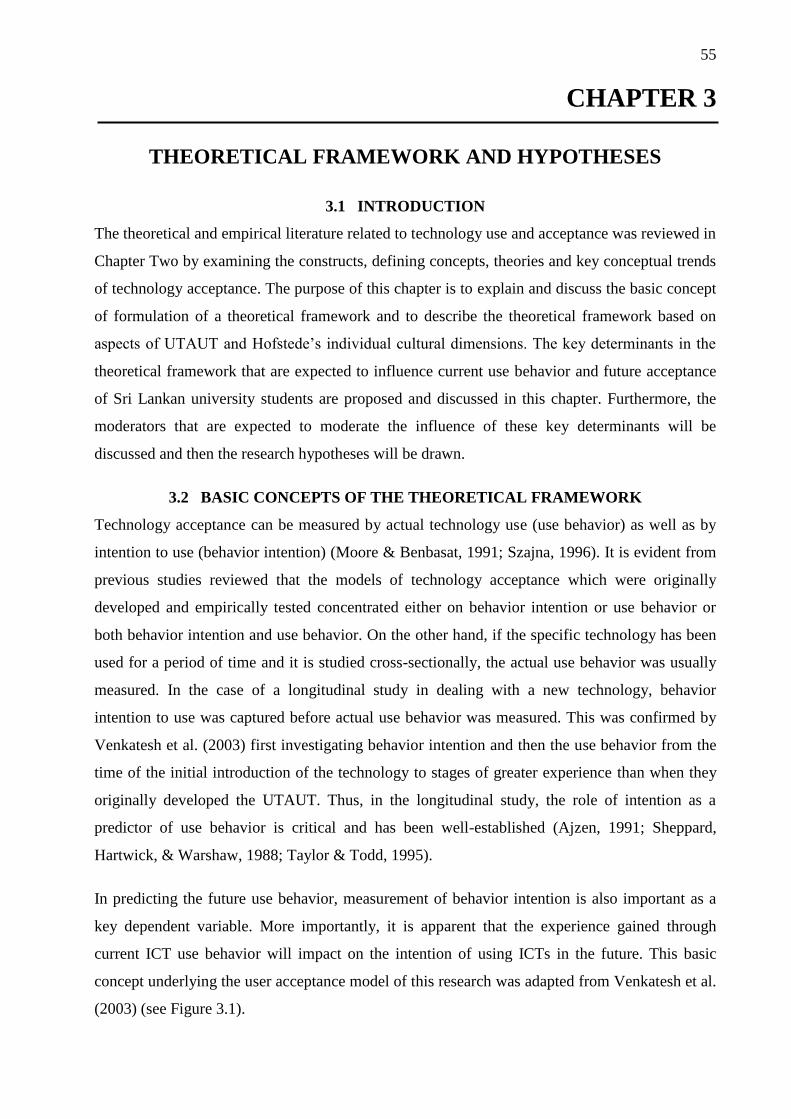
55
CHAPTER 3
THEORETICAL FRAMEWORK AND HYPOTHESES
3.1 INTRODUCTION
The theoretical and empirical literature related to technology use and acceptance was reviewed in
Chapter Two by examining the constructs, defining concepts, theories and key conceptual trends
of technology acceptance. The purpose of this chapter is to explain and discuss the basic concept
of formulation of a theoretical framework and to describe the theoretical framework based on
aspects of UTAUT and Hofstede’s individual cultural dimensions. The key determinants in the
theoretical framework that are expected to influence current use behavior and future acceptance
of Sri Lankan university students are proposed and discussed in this chapter. Furthermore, the
moderators that are expected to moderate the influence of these key determinants will be
discussed and then the research hypotheses will be drawn.
3.2 BASIC CONCEPTS OF THE THEORETICAL FRAMEWORK
Technology acceptance can be measured by actual technology use (use behavior) as well as by
intention to use (behavior intention) (Moore & Benbasat, 1991; Szajna, 1996). It is evident from
previous studies reviewed that the models of technology acceptance which were originally
developed and empirically tested concentrated either on behavior intention or use behavior or
both behavior intention and use behavior. On the other hand, if the specific technology has been
used for a period of time and it is studied cross-sectionally, the actual use behavior was usually
measured. In the case of a longitudinal study in dealing with a new technology, behavior
intention to use was captured before actual use behavior was measured. This was confirmed by
Venkatesh et al. (2003) first investigating behavior intention and then the use behavior from the
time of the initial introduction of the technology to stages of greater experience than when they
originally developed the UTAUT. Thus, in the longitudinal study, the role of intention as a
predictor of use behavior is critical and has been well-established (Ajzen, 1991; Sheppard,
Hartwick, & Warshaw, 1988; Taylor & Todd, 1995).
In predicting the future use behavior, measurement of behavior intention is also important as a
key dependent variable. More importantly, it is apparent that the experience gained through
current ICT use behavior will impact on the intention of using ICTs in the future. This basic
concept underlying the user acceptance model of this research was adapted from Venkatesh et al.
(2003) (see Figure 3.1).
56
As shown in Figure 3.1, Venkatesh et al. (2003) suggest that individual reactions to use ICTs
may influence actual use of ICTs and consequently, actual use of ICTs may influence the
intention to use technology. Furthermore, it is assumed that individuals’ actual use of ICTs will
determine their reactions towards continuing to use the new mode of ICTs.
3.3 THEORETICAL FRAMEWORK
A theoretical framework, which is also referred to as a conceptual framework is defined as “an
assembly of research concepts or variables together with their logical relationships represented in
diagrams, charts, graphs, pictographs, flow-charts, or mathematical sets” (Miles & Huberman,
1994, p. 18; Ndunguru, 2007, p. 47). A theoretical framework explains how the researcher
theorizes or makes logical sense of the relationships among factors that have been identified as
important to the problem being investigated (Kripanont, 2007) and helps in setting up boundaries
of the studied phenomena. The critical intent of developing a conceptual framework is to guide
researchers to postulate and test certain relationships so as to improve the understanding of the
dynamics of the investigated phenomenon.
The theoretical and empirical reviews combine a conceptual justification and contextual
applicability of the conceptual underpinnings to examine ICT use and acceptance, in the
university context. The following section will present a more comprehensive theoretical
framework for the current study, based on the theoretical concepts identified in Chapter Two,
which were supported by the existing empirical research literature.
3.3.1 Identification of dependent variables
The dependent variables in this study are Use Behavior (UB) and Behavior Intention to future
use (BI). Both dependent variables will be measured and investigated to find out whether use
behavior will significantly influence behavior intention to future use ICTs (Kripanont, 2007) in
order to form a model which could have power in explaining use behavior and future acceptance
of ICTs.
Source: Venkatesh et al. (2003)
Figure 3.1: Basic concept of technology acceptance
Individual
reactions to use
ICT
Actual use of ICT Intention to use
ICT
57
Davis (1989) emphasizes that BI is a proper dimension to examine and predict a UB toward a
particular technology. A large amount of research has shown consistent results showing a
significant correlation between BI and UB. Furthermore, the path from BI to UB is significant in
other models such as TAM, TPB, and DTPB too. As UB is largely influenced by BI, BI plays an
important role in predicting UB. However, it is important to note that BI is more predictive of
UB when individuals have had prior experience with the technology (Taylor & Todd, 1995).
Therefore, taking BI and UB as dependent variables in the current research seems relevant since
the ICTs have been introduced early to Sri Lankan universities’ environments and therefore the
students are experienced to some extent. Further, it is consistent with the original UTAUT
model, as it was assumed that the BI has a significant positive influence on UB.
3.3.2 Identification of core determinants
Contextual review demonstrated that quite a number of core determinants pertaining to user
acceptance technologies have been identified by previous researchers with a base on UTAUT in
the university context. However, inconsistencies in using supplementary constructs
(determinants) have also been found in the literature. They are;
1. Even though, the variables, self-efficacy, anxiety, and attitude were theorized not as
direct determinants of the behavioral intention to use, but as indirect determinants in the
original UTAUT, they have been identified as direct determinants to the behavioral
intention to use technologies in some models.
2. Most of those additional determinants were adapted specifically to suit particular
technologies and to particular user categories.
3. Most of the time, newly added variables were not significant.
4. Some studies have used exogenous variables whose effects had already been included in
the original UTAUT.
5. Some variables were adapted for the UTAUT to examine a particular effect which has
not been strictly highlighted in UTAUT. For example, Hofstede’s cultural factors have
been captured as direct determinants to the behavioral intention to use technology to
investigate that particular cultural impact on technology acceptance and use.
The four core determinants established in the original UTAUT were considered as suitable to be
adapted for this particular study. They are Performance Expectancy (PE), Effort Expectancy
(EE), Social Influence (SI) and the Facilitating Conditions (FC).
58
3.3.2.1 Performance Expectancy (PE)
The performance expectancy construct has been established to be the strongest predictor of
intentions and has remained significant at all points for all the eight models tested by Venkatesh
et al. (2003). Most of the technology acceptance studies which have used UTAUT as the base
theory and were conducted in university contexts clearly show PE as the significant predictor for
the BI (see Appendix II). Previous technology acceptance studies have strongly acknowledged
the strength of performance expectancy construct in predicting BI and strong evidence has
supported performance expectancy as a direct determinant of UB (Kripanont, 2007). The
evidence provides a good rationale to use PE as the direct determinant of UB and BI in the
current study and it is expected that PE will significantly determine UB and BI of ICTs. PE is
defined and used in this study as:
“The degree to which an individual student believes that using ICTs will help him or her
to attain gains in university performance (Venkatesh et al., 2003, p. 451)”
3.3.2.2 Effort Expectancy (EE)
The effort expectancy construct is said be significant in both voluntary and mandatory usage
contexts during early stages of technology adoption but becomes non-significant over periods of
extended and sustained usage (Dulle, 2010). However, EE has been found by many acceptance
studies based on UTAUT in university settings to have a significant influence on BI (see
Appendix II) and Pardamean & Susanto (2012) report that EE is not significant in Blog
acceptance and use. Even though, EE was theorized as a direct determinant of BI in a number of
other theories and models including TAM, TAM2, and C-TAM-TPB, it was found as a
significant determinant for usage behavior too (Kripanont, 2007).
Conversely, it is apparent that ICTs are a rapidly changing aspect with new innovations hastily
introduced becoming popular among university students. Therefore, EE is theorized as a direct
determinant of the UB and BI in the current study. In this study EE is defined and used as;
“The degree of ease associated with the use of ICTs (Venkatesh et al., 2003, p. 451)”
It is expected that this factor would have a significant influence on UB and BI of ICT access by
students in Sri Lankan universities.
3.3.2.3 Social Influence (SI)
The core construct which is termed as social influence (SI) in UTAUT is represented as a
subjective norm in many theories (Venkatesh et al., 2003) including the TRA, TPB, DTPB,
TAM2, and C-TAM-TPB. Moreover, other research also has suggested social influence as a
59
direct determinant of BI (Venkatesh & Davis, 2000). Although studies done in university settings
based on UTAUT also have confirmed the significant influence of SI on BI (see Appendix II),
Schaper & Pervan (2004) found that SI does not have a direct influence on BI.
However, Venkatesh et al, (2003) claimed that “none of the social influence constructs are
significant in a voluntary context but become significant when use is mandated”. Although the
same idea was further confirmed through the study of Al-Qeisi (2009), Schaper & Pervan (2007)
have provided evidence for the contribution of SI on ICT usage under involuntary situations.
Considering the above facts, the current study expects to further shed light on whether or not
such a determinant is significant in an ICT use environment. With this justification, SI is
theorized as a direct determinant of UB and BI in this study and it is expected to determine the
intention to use ICTs. Social influence is defined and used in this study as:
“The degree to which an individual student perceives that other important persons
believe he or she should use ICTs (Venkatesh et al., 2003, p. 451)”
More specifically, it is expected that to find out the extent to which students are influenced by
fellow students and lecturers in their ICT use and acceptance at the university.
3.3.2.4 Facilitating Conditions (FC)
Facilitating conditions (FC) were found to be non-significant in predicting intention but
significant in determining usage (Venkatesh et al., 2003; Zhou, Lu, & Wang, 2010). Also, the FC
has been modeled as a direct determinant of BI and usage in the theory of DTPB. Moreover, it
was found that facilitating conditions were significantly related to the UB and BI to use (Lin et
al., 2013) of various types of technology use in university contexts (see Appendix II). However,
FC did not seem to be much used as the other determinants of UTAUT and therefore it is very
important to investigate whether this construct is a direct determinant of UB and BI in ICT use
and acceptance in the Sri Lankan university environment.
Having been supported by such evidence FC is theorized as a direct determinant and is expected
to influence UB and BI. The facilitating conditions determinant is defined and used in this
research as:
“The degree to which an individual student believes that an institutional and technical
infrastructure exists to support use of ICTs (Venkatesh et al., 2003, p. 453)”
Especially, an assessment of the availability or non-availability of the factors facilitating ICT
access would be done in relation to the existing practice of open access usage in the study area.
60
3.3.3 Identification of socio-demographic moderators
A close study of the existing literature undertaken with the objective of identifying users’ socio-
demographic factors that may affect ICT use and acceptance has not indicated in any way that
these factors contribute to the determination of ICT use and acceptance. A considerable number
of research studies which used UTAUT as the base theory in university contexts have collected
socio-demographic factors of the users and sometimes examined the relationships to suit their
specific research contexts. However, a number of research studies indicate that some of these
factors have a direct influence or a moderator effect on ICT use and acceptance.
Venkatesh et al. (2003) have verified the strength of four socio-demographic factors (age,
gender, experience and voluntariness) which present significant moderating effects on the
influence of the determinants on behavior intention. Therefore, the proposed research model
seeks to adapt three original UTAUT model moderator variables (age, gender and experience)
and to add more factors specifically considered as important under the current study
environment.
An original moderator (voluntariness) will be dropped from the current research model due to
some inconsistencies as shown by prior research. Students access most of the ICTs voluntarily
since it is not mandatory in Sri Lankan universities. Moreover, the majority of the students have
to engage in mostly similar ICT applications according to the common subject streams they
study in. Therefore, voluntariness is excluded from the model as a moderator, especially as
voluntariness is often used under situations where technology usage is mandatory (Venkatesh et
al., 2003).
Following the discussions above, it may be concluded that socio-demographic factors may
directly or indirectly impact on technology use and acceptance. It is therefore prudent to
integrate three socio-demographic factors (age, gender, ICT experience, and the common subject
stream), which have been extracted from prior research (see Appendix III) into the conceptual
model for further empirical investigation in order to identify the impact on ultimate ICT use and
acceptance.
3.3.3.1 Age, gender and ICT experience
Age, gender and experience have been included in several UTAUT based models with evidence
of significantly moderating the influence of determinants of behavioral intention and use
(Venkatesh et al., 2003). As Venkatesh et al. (2003) confirm through their findings, it is
established that the effect of performance expectancy and facilitating conditions on behavioral
61
intention was moderated by gender and age, the effect of effort expectancy and social influence
were moderated by age, gender and experience. Moreover, a number of other studies in
university settings (Kripanont, 2007; Stephan et al., 2009; Rahman et al., 2011; Oye et al., 2012;
Pardamean & Susanto, 2012) considered the above moderators to impart various effects on
independent variables towards dependent variables. Therefore, age, gender and experience will
be investigated to find out their peculiar effects on various determinants of behavioral intention
and use of ICTs.
3.3.3.2 Common subject stream
It was evident that the common subject stream had been investigated as a factor/predictor in the
studies on factors that influenced adoption and use of information technology (see Appendix III).
Therefore, the common subject stream seemed to have an impact on the influence of
determinants toward technology acceptance. In the current study common subject streams are
considered as a moderating factor. Students engage in a variety of course units in their common
subject streams in relevant Faculties. It is perceived that students who engage in different subject
streams may have different perceptions and views relating to using ICTs. Thus, the common
subject stream is expected to impact the influence of determinant toward current use behavior
and intention to future use.
3.3.4 Identification of cultural factors
Based on the perspective that the individual cultural values may affect individual use and
acceptance of ICTs and empirical evidence, the well-established four cultural dimensions; Power
Distance (PD), Uncertainty Avoidance (UA), Individualism-Collectivism (IC), and Masculinity-
Femininity (MF) (Hofstede, 2001; Hofstede & McCrae, 2004) would be adopted to see if they
have any impact on ICT use and acceptance environment in Sri Lanka.
3.3.4.1 Power Distance (PD)
Power distance has been identified as a powerful predictor which can differentiate the
technology acceptance with UTAUT in university contexts (Suraweera & Liew, 2011; Gogus et
al., 2012; Thowfeek & Jaafar, 2013). However, its explanatory power may change for a model
that describes ICT use and acceptance, as a moderator has been measured by Srite & Karahanna
(2006) in university settings who found a significant impact on the relationship between
subjective norms (social influence) and the behavioral intention to use. Thus, it should be an
effective moderator for the current study too and it is adopted expecting that it would have an
effect on the relations between determinants towards use behavior or intention to use ICT in Sri
Lankan context. Power Distance is defined for the study as:
62
“Degree to which, large differentials of power and inequality are accepted as normal by
the individual. Power distance will condition the extent to which the employee accepts
that his/her superiors have more power (Srite & Karahanna, 2006, p. 682)”
3.3.4.2 Uncertainty Avoidance (UA)
As Hofstede (1980) claimed, an uncertainty avoidance group tends to hold lower perceptions of
self-efficacy and is more concerned about the risks associated with ICT; and feels anxiety, fewer
optimal experiences, when faced with unfamiliar risks, deviant ideas, or conflicts. It further will
tend to take time to act until they acquire enough knowledge and information (perceived
usefulness and ease of use) to resolve unclear and unstructured situations (Meyers-Levy, 1988).
This is further supported by the study of Sanchez-Franco et al. (2009) showing significant
moderator effects - attitude towards behavior intention to use web based e-learning and showing
a consistent significant moderator effect on the relationship between subjective norms (social
influence) and intended behavior. Similarly, Thowfeek & Jaafar (2013) have shown a significant
impact of uncertainty avoidance on behavior intention to use e-learning.
Taking into consideration the above facts, uncertainty avoidance will be included in the current
research model to test for impact on the influence of determinants towards behavior intention to
use or use behavior although there is no previous evidence of this kind of investigation.
Uncertainty Avoidance is defined for the study as:
“The level of risk accepted by the individual, which can be gleaned by his/her emphasis
on rule obedience, ritual behavior, and labor mobility. This dimension examines the
extent to which one feels threatened by ambiguous situations (Srite & Karahanna, 2006,
p. 682).”
3.3.4.3 Individualism-Collectivism (IC)
Purpose of education is to learn how to learn in an individualistic cluster, and since students’
individual initiatives are encouraged there, they associate according to interests, and this differs
from a collectivism cluster, where they associate according to in-groups (Hofstede, 2008).
Therefore, students from an individualistic cluster could use ICT because of its potential
usefulness for performing learning tasks, but not because of the perceived social pressure
(Sanchez-Franco et al., 2009).
While Thowfeek & Jaafar (2013) suggest that there is no impact of individualism-collectivism
on behavior intention, Sanchez-Franco et al. (2009) confirm the existence of a significant impact
on the influence of perceived usefulness towards intention. With that evidence, individualism-
63
collectivism is adopted for the current study with the expectation that it will have an impact on
the relationship between determinants towards use behavior as well as behavior intention to use
ICTs. Individualism-Collectivism is defined in the study as:
“Degree to which the individual emphasizes his/her own needs as opposed to the group
needs and prefers to act as an individual rather than as a member of a group (Srite &
Karahanna, 2006, p. 682)”
3.3.4.4 Masculinity-Femininity (MF)
Gender differences in technology acceptance were very prominent in the past literature. A plenty
of empirical evidence is available to prove the existence of gender differences in technology
acceptance (Li & Kirkup, 2007; Madigan et al., 2007; Mahmood, 2009; Kaminski et al., 2009).
In accordance with the findings of Venkatesh et al. (2003), it has been found that the effect of
performance expectancy, effort expectancy and social influence on behavior intention was
moderated by gender.
Even though Kripanont (2007) added gender as a moderator variable to the influence between
determinants and the intention and usage behavior, it did not impact the influence of the key
determinants toward usage behavior and behavior intention. However, masculinity-femininity
has been identified as having a significant moderating effect on the relationships between
subjective norms (social influence) and the behavioral intention to use, and on the relationship
between perceived ease of use and intended behavior by the study of Srite & Karahanna (2006).
Further, masculinity-femininity has been identified as a significant factor on instructors’
behavioral intention to adopt e-learning by Thowfeek & Jaafar (2013). Considering these facts
masculinity-femininity was added to the current model to further investigate its effect on the
influence of determinants towards use behavior and the intention to use. It is defined for the
study as;
“The degree to which, gender inequalities are espoused by an individual. Individuals
who espouse masculine values emphasize work goals such as earnings, advancement,
competitiveness, performance, and assertiveness. On the other hand, individuals who
espouse feminine values tend to emphasize personal goals such as a friendly atmosphere,
comfortable work environment, quality of life, and warm personal relationships (Srite &
Karahanna, 2006, p. 682)”
Following the discussion presented above, it may be concluded that core determinants, socio-
demographic factors and cultural factors may impact ICT use and acceptance behavior and also
the intention for future use. It is therefore prudent to integrate these all these variables into the
64
conceptual model for further empirical investigation in order to show the impact on ultimate ICT
use and acceptance.
3.4 THEORETICAL FRAMEWORK OF THE STUDY
This section outlines and discusses the conceptual model for the study that has been built based
on issues that emerged from the review of theoretical and empirical contributions of past studies.
Hypotheses of the study derived from the model will be presented later.
Figure 3.2 depicts the conceptual model developed for the study based on the conceptual
paradigms, critiques and arguments and from empirical research findings in the area of study, in
order to render it more comprehensive, contextualized and feasible for the current study.
The model presented in Figure 3.2, is theoretically parsimonious rather than comprehensive and
it reflects the scientific theoretical conceptualization of the technology use and acceptance
behavior. It further provides loyal directions derived from the prevailing research literature, first
and foremost to ensure its applicability for resolving the problem identified in current study.
Then, the model will examine through data gathered in a survey to establish its fitness to the
problem domain, and finally, to revise it along with the contextual issues to make it more
comprehensive and feasible.
The conceptual model has a number of unique characteristics that makes it suitable for empirical
testing. This model elucidates the conceptual underpinning of the UTAUT and the final model
formed for ICT use and acceptance behavior of university students, which will be the ultimate
outcome of this study. Other than core determinants identified, it incorporates two groups of
moderator variables, that is, socio-demographic and cultural, which enable the model to be re-
conceptualized to address the issues identified in the research literature.
The research model comprises the four core determinants or constructs (performance
expectancy, effort expectancy, social influence and facilitating conditions), two dependent
variables (use behavior and behavior intention) and four socio-demographic (age, gender, ICT
experience, common subject stream) and four cultural moderators (power distance, uncertainty
avoidance, individualism-collectivism and masculinity-femininity) as illustrated in Figure 3.2.
Essentially, the determinants are the perceived variables expected to have an effect on the use
and acceptance of ICTs while moderators are the conditions likely to shape the effect of the
determinants. More moderators were added based on their demonstrated effects in other studies
that could further validate the UTAUT in the Sri Lankan university context.
65
The conceptual model illustrates four major relationships among determinants, intention, use and
the moderators as specified below.
1. Indirect determinants may act as predictors of intention to ICTs. As an example, performance
expectancy may predict the intention to use ICTs for a particular phenomenon.
2. Direct determinants may act directly as significant predictors of overall ICT use behavior. As
an example ‘facilitating condition’ directly relates to predict the ICT use behavior.
3. Moderator variables may act as significant predictors of overall ICT use and intention as
well. As an example, experience moderates the impact of effort expectancy on intention and
impact of facilitating conditions on ICT use behavior.
4. Current ICT use behavior is directly related the behavior intention to future use of ICTs.
3.4.1 Hypotheses of the model
Testable hypotheses are developed to examine whether the theory formulated is valid or not after
formulating the theoretical framework (Sekaran, 2003). Two categories of hypotheses were
developed based on the constructed model.
1. Direct path hypotheses: hypotheses formulated for direct paths to test the significance of
direct paths between key determinants and use behavior.
2. Moderating hypotheses: moderating hypotheses formulated to test the moderating
influence of independent variables on dependent variables.
3.4.1.1 Direct path hypotheses
The direct path hypotheses were formulated in two groups:
1. Hypotheses formulated to test the significant influence of four determinants on use
behavior.
2. Hypotheses formulated to test the significant influence between use behavior and
behavior intention to use.
3.4.1.2 Moderating hypotheses
Moderating hypotheses were formulated to test the moderating effect in two categories:
1. Hypotheses formulated to test moderating effect on the relationship between four
determinants towards use behavior.
2. Hypotheses formulated to test moderating effect on the influence of use behavior towards
behavior intention to use.
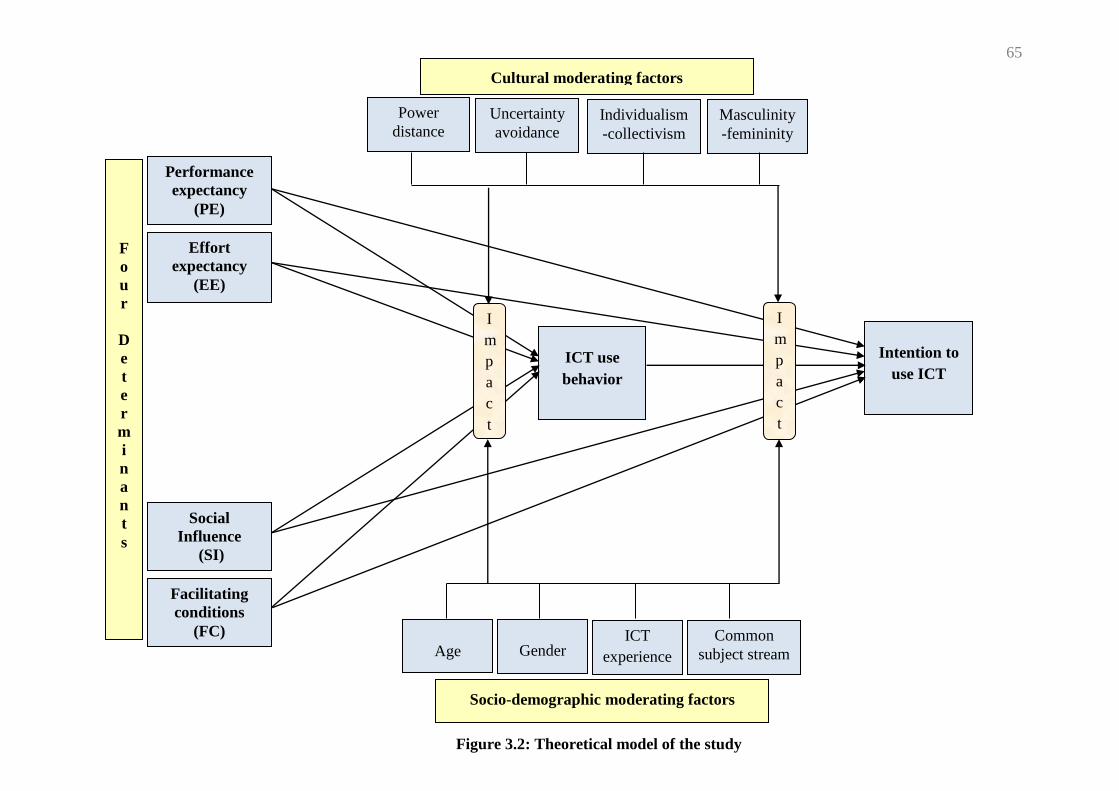
157
Cultural moderating factors
F
o
u
r
D
e
t
e
r
m
i
n
a
n
t
s
Socio-demographic moderating factors
Intention to
use ICT
Performance
expectancy
(PE)
Masculinity
-femininity
Age
ICT use
behavior
Social
Influence
(SI)
Effort
expectancy
(EE)
Facilitating
conditions
(FC)
Individualism
-collectivism
Common
subject stream Gender
Uncertainty
avoidance
Power
distance
ICT
experience
I
m
p
a
c
t
I
m
p
a
c
t
Figure 3.2: Theoretical model of the study
65
65
3.5 SUMMARY
This chapter proposes a conceptual research model based on eminent theories/models of
technology acceptance together with the findings from prior research which present well-built
evidence toward the development of a relevant model. The development of the theoretical
framework has been based on an understanding of relationships between core determinants and
use behavior, use behavior and behavior intention and the influence of moderators on the
influence of these key determinants toward use behavior, and the moderators’ impact on the
influence of use behavior toward behavior intention. Two categories of hypotheses have been
proposed - direct path hypotheses and moderating hypotheses, in order to verify the proposed
research model. Major research issues have been identified in this contextual research review,
and their implications have been considered in the research design and methodology presented in
Chapter Four. Chapter Four outlines the research design and data collection strategies to be
employed in obtaining the required data for analysis.
66

66
67
CHAPTER 4
RESEARCH DESIGN AND METHODOLOGY
4.1 INTRODUCTION
In Chapter Three, the conceptual model of this study was refined on the basis of the outcomes of
comprehensive theoretical and empirical research studies existing in the literature, with the
objective of redefining or validating the study within real-life settings. This chapter presents the
research design and the methodology employed in the study to address the research problem of
developing a model to understand ICT use and future acceptance by university students in the Sri
Lankan context. The research methodology included the identification of systemic conventions
and procedures of the research plan. The research design is presented in two stages. In the first
stage, which is the exploratory study, the feasibility of conducting the proposed study was
checked in order to examine the present situation regarding ICTs in universities and the job
market, identifying the determinants of ICT use and essential ICT tools which a fresh graduate is
basically equipped. The second stage, which is the main study, investigates the best
parsimonious model through statistical testing. These two stages of the research study treat the
design issues as similar and unique to both the stages of the study. The justification of choices
and uses will be presented in this chapter. The rationale will be discussed and explained in terms
of the research process: design, development of the instrument, pilot study, population, sample,
data collection and data analysis. Finally, the summary of the chapter is presented as a prelude to
the exploratory study presented in Chapter Five.
4.2 RESEARCH PROCESS
“Research process consists of a series of actions or steps necessary to effectively carry out the
research and the desired sequencing of these steps” (Kothari, 2004, p. 56). The research process
was adapted from Saunders, Thornhill & Lewis (2009) which is called the “onion” depicted in
Figure 4.1. This process enabled the presentation of a detailed description of the research design
of the study and provided the basis to identify the issues that emerged when different data
gathering techniques were employed (Saunders et al., 2009).
As shown in Figure 4.1, the onion of the research process consists of six major layers, research
philosophies, research approaches, research strategies, research choices, time horizons and
techniques and procedures which are described in the following sections.
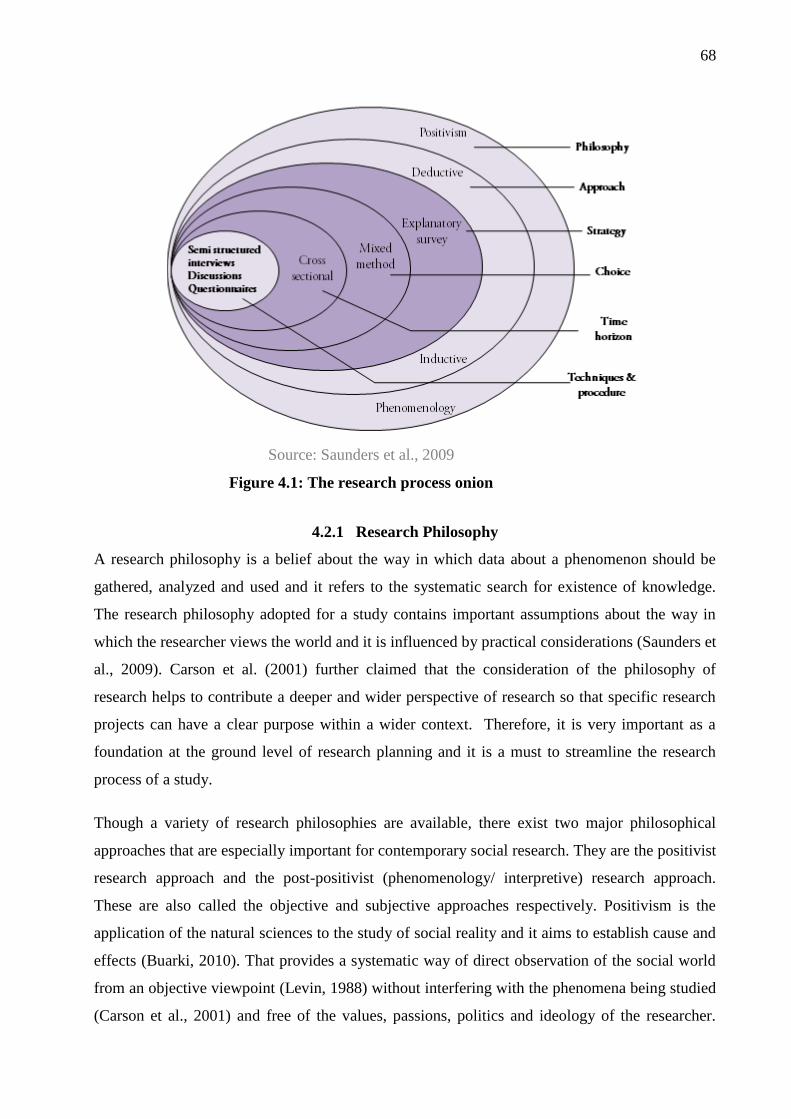
68
4.2.1 Research Philosophy
A research philosophy is a belief about the way in which data about a phenomenon should be
gathered, analyzed and used and it refers to the systematic search for existence of knowledge.
The research philosophy adopted for a study contains important assumptions about the way in
which the researcher views the world and it is influenced by practical considerations (Saunders et
al., 2009). Carson et al. (2001) further claimed that the consideration of the philosophy of
research helps to contribute a deeper and wider perspective of research so that specific research
projects can have a clear purpose within a wider context. Therefore, it is very important as a
foundation at the ground level of research planning and it is a must to streamline the research
process of a study.
Though a variety of research philosophies are available, there exist two major philosophical
approaches that are especially important for contemporary social research. They are the positivist
research approach and the post-positivist (phenomenology/ interpretive) research approach.
These are also called the objective and subjective approaches respectively. Positivism is the
application of the natural sciences to the study of social reality and it aims to establish cause and
effects (Buarki, 2010). That provides a systematic way of direct observation of the social world
from an objective viewpoint (Levin, 1988) without interfering with the phenomena being studied
(Carson et al., 2001) and free of the values, passions, politics and ideology of the researcher.
Source: Saunders et al., 2009
Figure 4.1: The research process onion
69
Positivist approach which can test theories and establish scientific laws, looks at society as the
focus for research, and through the understanding of its internal laws and establishing relevant
facts, researchers can in turn help them to understand how and why individuals behave as they
do (Walliman, 2006). In the positivistic philosophical approach researchers are interested in the
collection of general information and data from a large social sample instead of focusing on
details of research. Further, researcher’s own beliefs would not influence the research study and
it is mainly focused on the observations and experiments to collect numeric data with this
approach (Easterby-Smith, Thorpe, Jackson, & Lowe, 2008). Positivism uses quantitative
methods to collect data in order to arrive at generalized conclusions (Saunders et al., 2009).
Post-positivism provides an alternative to the traditions and foundations of positivism for
conducting disciplined inquiry and the post-positivist approaches assume that reality is multiple,
subjective, and mentally constructed by individuals (Crossan, 2003). As Philips (1990) claimed,
the researcher interacts with those being researched, and findings are the outcome of this
interactive process with a focus on meaning and understanding the situation or phenomenon
under examination. The use of flexible and multiple methods is desirable as a way of studying a
small sample in depth overtime that can establish warranted assert ability as opposed to absolute
truth (Forbes et al., 1999). Hence, phenomenology refers to the way in which researchers as
humans make sense of the world around them (Saunders et al., 2009), and the qualitative
methodological approaches are adapted (Cohen, Manion, & Morrison, 2000).
The current research aims to examine in a deeper complexity about the use and acceptance of
ICTs based on a strong existing theory in the context of universities. It was recognized that the
technology use and acceptance behavior has to be understood in qualitative terms first to uncover
the real dynamism. Thus, the more advantageous phenomenological research approach was used
in the first phase of this study to ascertain the inherent vitality of the problem area to explore ICT
use and acceptance environment. Accordingly, as the current research intends to validate
quantitative results and to establish causal relationships that explain ICT use and its future
acceptance by university students in Sri Lanka in the second phase, the positivist approach is also
selected as the better choice for that purpose. Therefore, these two philosophical assumptions
were taken in to consideration for the current study.
Research can include elements of both the positivist and phenomenological approaches, if
managed carefully and Anderson (1983) further argues that no single best research paradigm can
be found in any science, and specifically, that it is not possible to find a single paradigm to
evaluate a specific phenomenon. Beynon-Davies (2002) argues that organizations are a part of
70
the social world and ICT is a part of the physical world. Therefore, both of these positions are
valid within this research, in which data were collected on students’ ICT use and acceptance
behavior through positivist and phenomenological approaches, employing quantitative and
qualitative data.
4.2.2 Research Approach
As Saunders et al. (2009) claimed theory may or may not be made explicit in the design of the
research, although it will usually be made explicit in the presentation of the findings and
conclusions. The research approach helps to decide what theories are applicable to research
issues which help the researcher to adopt the research design to adjust to various constraints and
to form hypotheses (Saunders et al., 2009). That is whether the research should use the deductive
approach, which attempts to develop a theory and hypothesis (or hypotheses) and design a
research strategy to test the hypothesis, or the inductive approach, in which data is collected and
a theory is developed as a result of the data analysis (Saunders et al., 2009). Further, they argued
that as deduction owes more to positivism and induction to interpretivism, those inspirations
possess no real practical value at all.
Since the initial steps of the first phase (exploratory study), aims to study a part of the social
world and aspects of human behavior, it takes the characteristics of inductive approach which is
not initiated with a theory or any hypotheses and attempts to know what is going on. It aims to
identify the phenomenon of interest, and then make observations within that area to identify the
evolving patterns and explanations that offer ways of conceptualizing the processes underlying
the phenomenon. That basic part subjectively deals with the collection of qualitative data using
semi structured interviews/ focus group discussions and expert opinions. The use of the inductive
approach to ensure the inclusion of all necessary dimensions is required to understand the
inherent dynamic behavior of ICT use and acceptance by university students in Sri Lanka.
The main study of the research would adopt the deductive reasoning approach or a quantitative
inquiry. Deductive reasoning leads to a quantitative inquiry. There are some important
characteristics in the deductive approach, which reflect the positivist research philosophy. It
examines the specific outcome/s of the inquiry, searches to explain causal relationships between
variables, develops a hypothesis, and collects quantitative data (Saunders et al., 2009). It is
obvious that the deductive approach under the positivist philosophical approach uses a highly
structured methodology to facilitate replication (Gill & Johnson, 2002). Therefore, the
quantitative approach was considered as the best-suited practice to address the current study
71
which mainly intends to establish the relationship between various factors and ICT use and
acceptance to develop a parsimonious predictive model.
4.2.3 Research Strategy
The next peel of the research onion is the research strategy which may be employed for a
research. Research strategy can be used for exploratory, descriptive and explanatory research
(Yin, 2003) and they will be guided by research questions and objectives, the extent of existing
knowledge, the amount of time and other resources available, as well as philosophical
underpinnings (Saunders et al., 2009).
Since the current study is an in-depth empirical investigation which examines the ICT use and
acceptance behavior of university students in Sri Lanka, it is designed in multiple stages and
each of the stages was set to follow a specific methodology from among a variety of research
methods. Therefore, this study has adopted the survey research strategy. Survey is a more
popular and common strategy in social sciences research and is most frequently used (Baker,
2001). The survey strategy is usually associated with the deductive approach (Saunders et al.,
2009) and it is regarded as being inherently quantitative and to originate from the positivistic
tradition (May, 2001). Surveys tend to be used for exploratory and descriptive research
(Saunders et al., 2009).
Since the descriptive survey strategy is perceived as authoritative by people in general and is
both comparatively easy to explain and to understand, it was selected to describe the nature of
the existing situation regarding ICT use and to confirm the factors that affect existing use
behavior and acceptance in the future in universities. The explanatory survey strategy was used
to identify the relationships between factors and the use behavior in the Sri Lankan university
sector since it allows the collection of a large amount of data from a sizeable population in a
highly economical way. Thus, the use of the survey research strategy was found to be the best-
suited strategy for the study undertaken.
4.2.4 Research Choice
As shown in Figure 4.1, research choice is the next important peel of the research process onion
and there are several choices that can be adopted for a particular study. Data collection
techniques and data analysis procedures are differentiated by the terms ‘quantitative’ and
‘qualitative’ which are mostly used in social sciences research. Research choice decides on how
quantitative and qualitative techniques and procedures are combined (Saunders et al., 2009).
72
The current study used more than one data collection technique and analysis procedure to answer
research questions. In other words, the current research uses multiple methods. As Saunders et al.
(2009) further categorized, there are four different possibilities in combining data collection
techniques and procedures using some form of multiple methods design. The term multi-method
refers to those combinations where more than one data collection technique is used with
associated analysis techniques, but this is restricted within either a quantitative or qualitative
world view (Tashakkori & Teddlie, 2003). As this study involved two stages with multiple
methods in each of them, multi-method research choice was adopted.
4.2.5 Time Horizon
As Saunders et al. (2009) assured, it is important to decide whether the research is to be a
“snapshot” taken at a particular time or is to be a “series of snapshots” and be a representation of
events over a given period. They further claimed that it should be decided according to the
research questions of a particular study and that time horizons are independent of which research
strategy is pursued or the choice of method. The ‘snapshot’ time horizon is called cross-sectional
while the ‘series of snapshots’ perspective is called longitudinal.
Cross-sectional studies often employ the survey strategy (Robson, 2002; Easterby-Smith et al.,
2008). Cross-sectional time horizon may seek to describe the incidence of a phenomenon
(Saunders et al., 2009). The current study examines the ICT use behavior of university students
at a given point in time and to explain how factors are related to ICT use and behavior in
different universities. The cross sectional study used 1st year and 3rd year university students.
Because the use behavior and the attitudes on ICTs may have changed by 3rd year with the
institutional ICT environment, it is worthwhile considering 3rd year students to study the
institutional ICT backup given during the 3 years. It used qualitative and quantitative methods
with the survey strategy. Therefore, the time horizon suited for this research was cross-sectional.
4.2.6 Technique and Procedure
Data collection involves gathering of data using selected techniques in order to achieve the
objectives of the study (Onyango, 2002; Kripanont, 2007; Dulle, 2010). Data collection methods
are followed by the selected research strategies. Interviewing, administering questionnaires, and
observing people and phenomena are the three main data collection methods in survey strategy
(Sekaran, 2003; Kothari, 2004; Veal, 2005). Further, Beynon-Davies (2002) affirmed that a
combination of several techniques provides “a more complete picture of some phenomenon
through exploiting the inherent strengths of each technique”. Thus, allowing for better collection
and analysis of data and reaching matching or conflicting results. According to the above, in this
73
research study, questionnaires, semi structured interviews and focus group discussions were used
as the data collecting methods based on the survey strategy.
4.3 RESEARCH FRAMEWORK
Research design based on the research process described above, provides a framework that the
research fits into, depending on the theory and nature of the research problem (Buarki, 2010) and
it highlights all of the research activities (Walliman, 2006). Research is guided by a theory or
theories providing a systematic view of a particular phenomenon and employs theory testing or
building. This research is basically focused on testing an existing theory to create new
knowledge in the discipline of information sciences.
Current research design is entirely guided by the theoretical framework developed for the study.
The purpose of a research design is to present a structure for the collection and analysis of data
(David & Sutton, 2004), in a way to achieve the aim of the research (Selltiz, Wrightsman, &
Cook, 1976). This research comprised two main phases:
Phase1 - Exploratory study: Feasibility study
Phase 2 - Main study: Model testing
The exploratory study hopes to gather preliminary data on the present situation regarding ICTs in
universities and the job market and the main study expects to test the model developed for the
study. Reliable statistical assessments and parametric and nonparametric statistical techniques
will be carried out to determine the most suitable model for the prediction of the current use
behavior and the future acceptance of ICTs by students in Sri Lankan universities. Based on the
results of the tests, a parsimonious model will be drawn.
4.4 PHASE 1 - EXPLORATORY STUDY
As the first phase of the research framework, the exploratory study comprises interrelated steps
and focuses on gathering preliminary data on ICT use and acceptance in the university and job
market environment to check the feasibility of doing the study. Also, it is planned to identify the
determinants of ICT use and acceptance and important ICT tools which basically equips a
graduate. The methodological design for the identification is depicted in Table 4.1.
4.4.1 Step One: Identify the area of ICT use and acceptance
The area of the study was identified through a widespread literature survey. It consists of the use
and acceptance of ICTs, ICT skills, student perceptions, and so on.
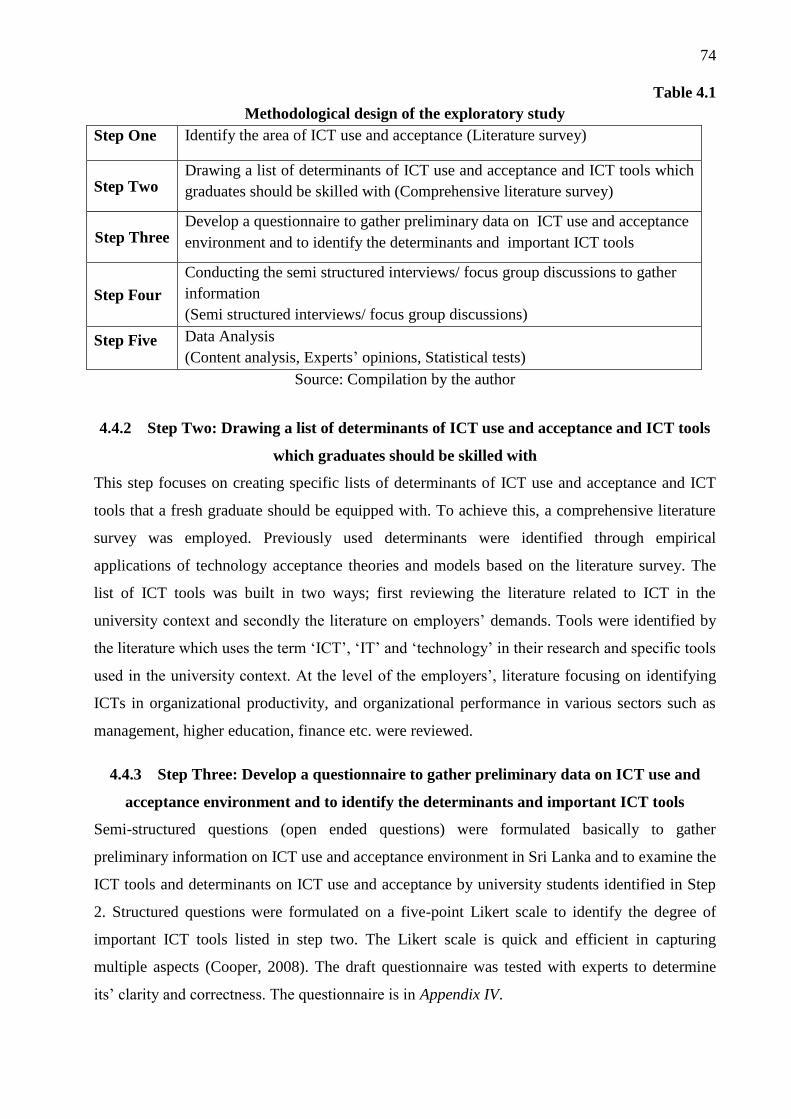
74
Table 4.1
Methodological design of the exploratory study
Step One Identify the area of ICT use and acceptance (Literature survey)
Step Two Drawing a list of determinants of ICT use and acceptance and ICT tools which
graduates should be skilled with (Comprehensive literature survey)
Step Three Develop a questionnaire to gather preliminary data on ICT use and acceptance
environment and to identify the determinants and important ICT tools
Step Four
Conducting the semi structured interviews/ focus group discussions to gather
information
(Semi structured interviews/ focus group discussions)
Step Five Data Analysis
(Content analysis, Experts’ opinions, Statistical tests)
Source: Compilation by the author
4.4.2 Step Two: Drawing a list of determinants of ICT use and acceptance and ICT tools
which graduates should be skilled with
This step focuses on creating specific lists of determinants of ICT use and acceptance and ICT
tools that a fresh graduate should be equipped with. To achieve this, a comprehensive literature
survey was employed. Previously used determinants were identified through empirical
applications of technology acceptance theories and models based on the literature survey. The
list of ICT tools was built in two ways; first reviewing the literature related to ICT in the
university context and secondly the literature on employers’ demands. Tools were identified by
the literature which uses the term ‘ICT’, ‘IT’ and ‘technology’ in their research and specific tools
used in the university context. At the level of the employers’, literature focusing on identifying
ICTs in organizational productivity, and organizational performance in various sectors such as
management, higher education, finance etc. were reviewed.
4.4.3 Step Three: Develop a questionnaire to gather preliminary data on ICT use and
acceptance environment and to identify the determinants and important ICT tools
Semi-structured questions (open ended questions) were formulated basically to gather
preliminary information on ICT use and acceptance environment in Sri Lanka and to examine the
ICT tools and determinants on ICT use and acceptance by university students identified in Step
2. Structured questions were formulated on a five-point Likert scale to identify the degree of
important ICT tools listed in step two. The Likert scale is quick and efficient in capturing
multiple aspects (Cooper, 2008). The draft questionnaire was tested with experts to determine
its’ clarity and correctness. The questionnaire is in Appendix IV.
75
4.4.4 Step Four: Conducting the semi structured interviews/discussions to gather
information
The aim of this step was to gather preliminary information on ICT use and acceptance
environment on what is happening and why, to get an idea or a feel for what was happening in
the situation and to refine the identified determinants and ICT tools which fresh graduates are to
be equipped with.
An interview is a purposeful discussion between two or more people (Kahn & Cannell, 1957).
The use of interviews is a positive data collection method (Sekaran, 2003) to gather valid and
reliable data and therefore interviews may be included in the exploratory stage of a research. In
the present study, the interviews were conducted face to face using open-ended questions to
collect preliminary information on ICT use and acceptance environment in Sri Lanka. This
method has advantages in that the interviewer can adapt the questions as necessary, clarify
doubts, and ensure that the responses are properly understood by repeating or rephrasing the
question, and could establish friendly relationships and motivate respondents (Kripanont, 2007).
Participants for the interviews are normally chosen using non-probability sampling, often with a
specific purpose in mind (Saunders et al., 2009) and Krueger & Casey (2000) refer to such
specific participants as being ‘information rich’. The semi structured interview schedule for the
current study was used with a specific set of participants: eighteen from the university sector and
five from various other relevant fields in Sri Lanka. Participants from the university sector
consisted of university lecturers, who were in charge of ICT in Faculties of Arts, Science and
Management, officers from the Main Computer Centre, Librarian and undergraduates from two
universities located in the Colombo, the University of Colombo and the University of Sri
Jayewardenepura–and two other universities in remote areas in the country, the University of
Ruhuna and the South Eastern University of Sri Lanka which had been selected as the study
population in the Main study (see section 4.5.1.1 in p.76). Participants from the other fields
comprised human resource persons who were top level persons in charge of recruitment for jobs
in Sri Lankan leading fields such as diversified companies, higher education, industrial,
administrative and finance. Four (4) discussions were scheduled with students in the selected
four universities, that is, one group per university. Each group comprised with students from Arts,
Science and Management Faculties. Participant’s information collecting sheet of the selected
group is given in Appendix V. Altogether twenty three interviews/ focus group discussions were
scheduled for the current study to collect preliminary data. These interviews were started from
December/2013.
76
As Saunders et al. (2009) claimed in semi-structured interviews the researcher will have a list of
themes and questions to be covered, although these may vary from interview to interview and
some questions can be omitted in particular interviews, given a specific organizational context
that is encountered in relation to purpose. Further, it allows for changing the order according to
the flow of the conversation and additional questions can be included exploring the nature of
particular objectives. Further they claimed that in a group interview, all participants have the
opportunity to state their points of view and answer the questions. Thus, the semi structured
interview/group interview method is best suited for the current study since it is an exploratory
study that needs to gather information from various sectors.
Each individual was asked questions to answer regarding the ICT use environment in the
university and employability respectively. Next, the interviewees were requested to identify the
important ICT tools.
4.4.5 Step Five: Data Analysis
The aim of this step was to explore the preliminary information and to refine the determinants
and important ICT tools, as perceived by a specific group. This process was utilized through
content analysis of qualitative data, expert opinions and statistical tests.
The preliminary information gathered through interviews and discussions analyzed using content
analysis techniques. It was helpful to refine the determinants on ICT use to include to the main
survey.
The determinants and the ICT tools drawn by semi structured interviews were reviewed by three
ICT professionals who are senior academics in Sri Lankan universities. These three professionals
had more than fifteen years’ experience in universities, as academics, and they held professional
qualifications at the PhD level. The objective of this review process was to finalize the
determinants and ICT tools which were identified to use in the current study.
In summary, selecting determinants and important ICT tools for the study was based upon a
comprehensive methodology consisting of three methods. Firstly, reviewing the existing
literature, and then refining those determinants and tools by semi structured interviews and
finally, through the evaluation by a panel of experts and statistical techniques.
To finalize the important ICT tools were further validated through statistical tests. Descriptive
statistics were employed for this purpose and then the Friedman Test which is a non-parametric
test was used to check the significance of the group means.
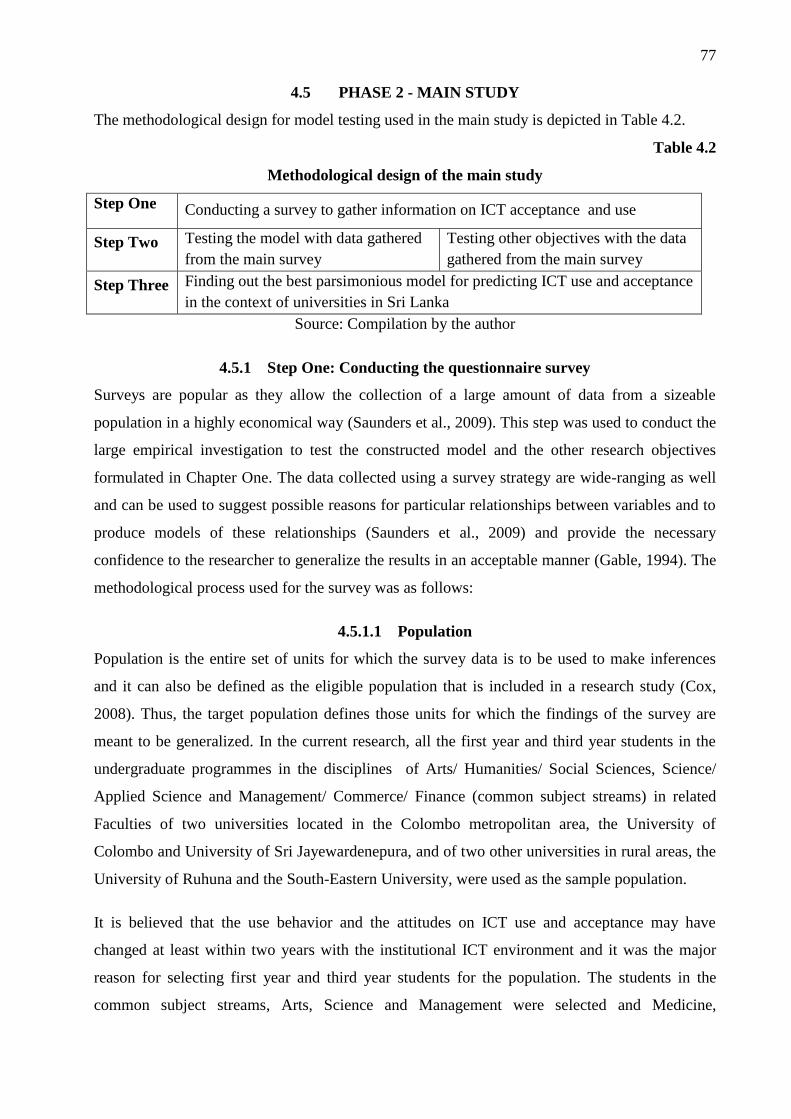
77
4.5 PHASE 2 - MAIN STUDY
The methodological design for model testing used in the main study is depicted in Table 4.2.
Table 4.2
Methodological design of the main study
Step One Conducting a survey to gather information on ICT acceptance and use
Step Two Testing the model with data gathered
from the main survey
Testing other objectives with the data
gathered from the main survey
Step Three Finding out the best parsimonious model for predicting ICT use and acceptance
in the context of universities in Sri Lanka
Source: Compilation by the author
4.5.1 Step One: Conducting the questionnaire survey
Surveys are popular as they allow the collection of a large amount of data from a sizeable
population in a highly economical way (Saunders et al., 2009). This step was used to conduct the
large empirical investigation to test the constructed model and the other research objectives
formulated in Chapter One. The data collected using a survey strategy are wide-ranging as well
and can be used to suggest possible reasons for particular relationships between variables and to
produce models of these relationships (Saunders et al., 2009) and provide the necessary
confidence to the researcher to generalize the results in an acceptable manner (Gable, 1994). The
methodological process used for the survey was as follows:
4.5.1.1 Population
Population is the entire set of units for which the survey data is to be used to make inferences
and it can also be defined as the eligible population that is included in a research study (Cox,
2008). Thus, the target population defines those units for which the findings of the survey are
meant to be generalized. In the current research, all the first year and third year students in the
undergraduate programmes in the disciplines of Arts/ Humanities/ Social Sciences, Science/
Applied Science and Management/ Commerce/ Finance (common subject streams) in related
Faculties of two universities located in the Colombo metropolitan area, the University of
Colombo and University of Sri Jayewardenepura, and of two other universities in rural areas, the
University of Ruhuna and the South-Eastern University, were used as the sample population.
It is believed that the use behavior and the attitudes on ICT use and acceptance may have
changed at least within two years with the institutional ICT environment and it was the major
reason for selecting first year and third year students for the population. The students in the
common subject streams, Arts, Science and Management were selected and Medicine,
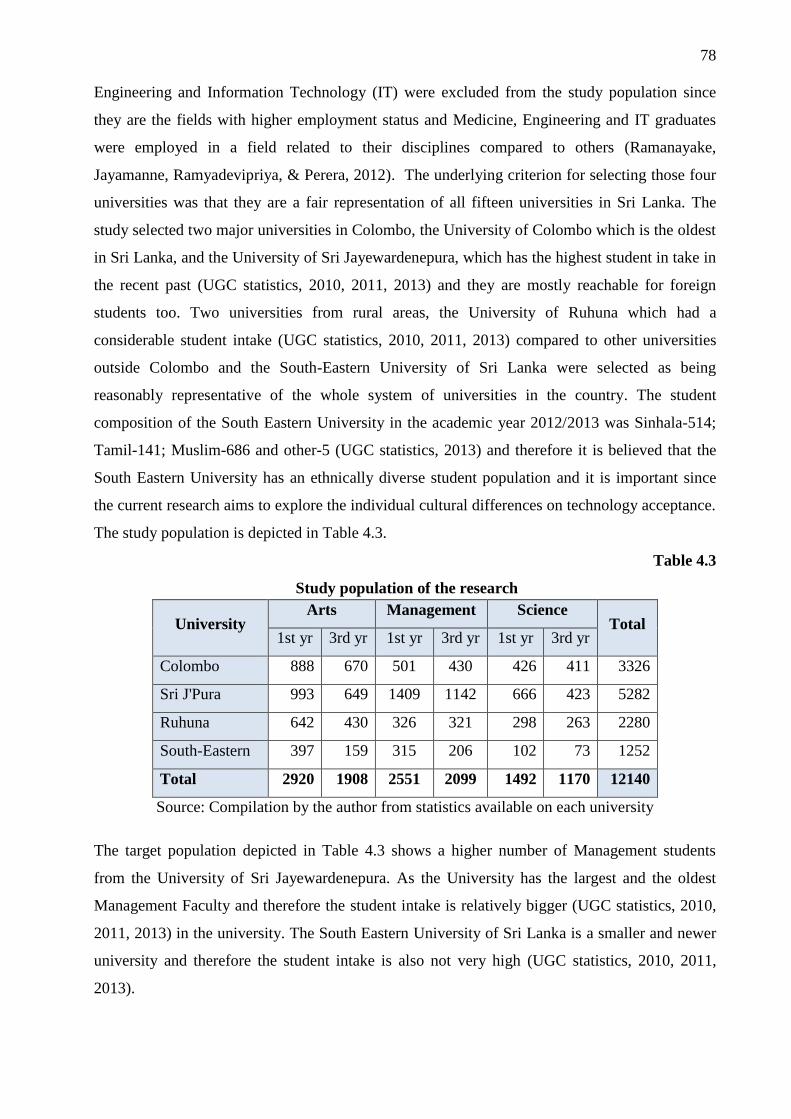
78
Engineering and Information Technology (IT) were excluded from the study population since
they are the fields with higher employment status and Medicine, Engineering and IT graduates
were employed in a field related to their disciplines compared to others (Ramanayake,
Jayamanne, Ramyadevipriya, & Perera, 2012). The underlying criterion for selecting those four
universities was that they are a fair representation of all fifteen universities in Sri Lanka. The
study selected two major universities in Colombo, the University of Colombo which is the oldest
in Sri Lanka, and the University of Sri Jayewardenepura, which has the highest student in take in
the recent past (UGC statistics, 2010, 2011, 2013) and they are mostly reachable for foreign
students too. Two universities from rural areas, the University of Ruhuna which had a
considerable student intake (UGC statistics, 2010, 2011, 2013) compared to other universities
outside Colombo and the South-Eastern University of Sri Lanka were selected as being
reasonably representative of the whole system of universities in the country. The student
composition of the South Eastern University in the academic year 2012/2013 was Sinhala-514;
Tamil-141; Muslim-686 and other-5 (UGC statistics, 2013) and therefore it is believed that the
South Eastern University has an ethnically diverse student population and it is important since
the current research aims to explore the individual cultural differences on technology acceptance.
The study population is depicted in Table 4.3.
Table 4.3
Study population of the research
University Arts Management Science
Total 1st yr 3rd yr 1st yr 3rd yr 1st yr 3rd yr
Colombo 888 670 501 430 426 411 3326
Sri J'Pura 993 649 1409 1142 666 423 5282
Ruhuna 642 430 326 321 298 263 2280
South-Eastern 397 159 315 206 102 73 1252
Total 2920 1908 2551 2099 1492 1170 12140
Source: Compilation by the author from statistics available on each university
The target population depicted in Table 4.3 shows a higher number of Management students
from the University of Sri Jayewardenepura. As the University has the largest and the oldest
Management Faculty and therefore the student intake is relatively bigger (UGC statistics, 2010,
2011, 2013) in the university. The South Eastern University of Sri Lanka is a smaller and newer
university and therefore the student intake is also not very high (UGC statistics, 2010, 2011,
2013).
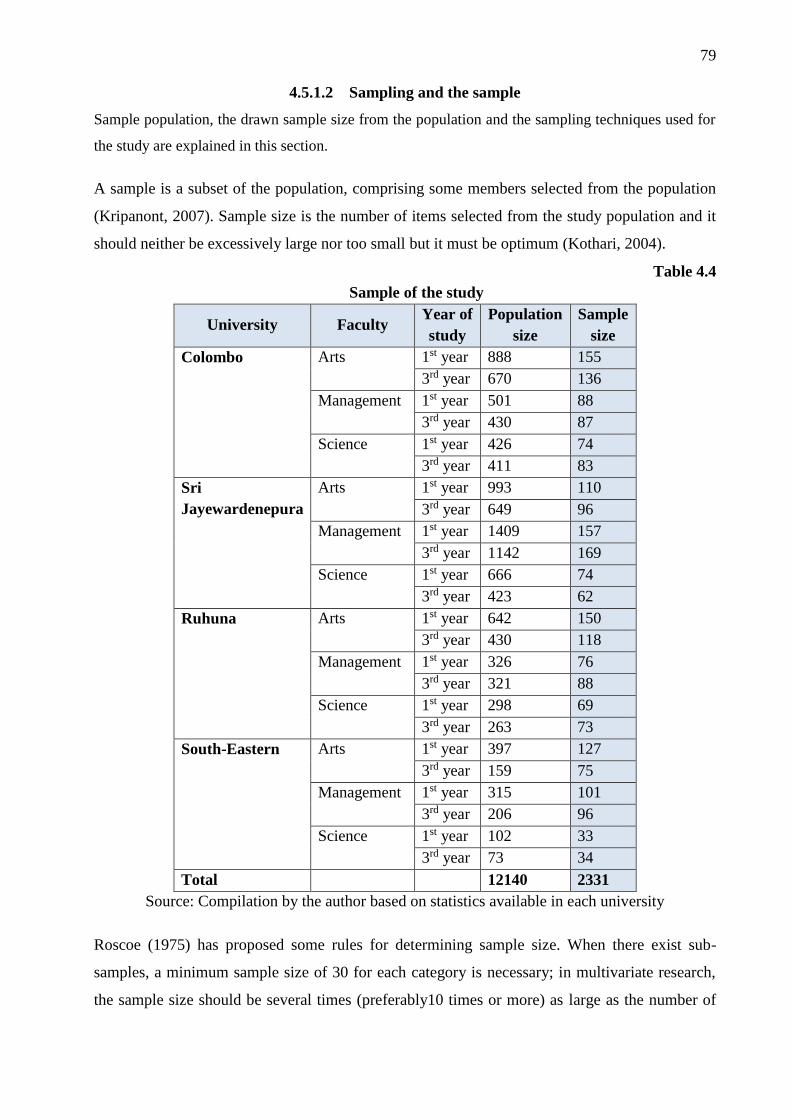
79
4.5.1.2 Sampling and the sample
Sample population, the drawn sample size from the population and the sampling techniques used for
the study are explained in this section.
A sample is a subset of the population, comprising some members selected from the population
(Kripanont, 2007). Sample size is the number of items selected from the study population and it
should neither be excessively large nor too small but it must be optimum (Kothari, 2004).
Table 4.4
Sample of the study
University Faculty Year of
study
Population
size
Sample
size
Colombo Arts 1st year 888 155
3rd year 670 136
Management 1st year 501 88
3rd year 430 87
Science 1st year 426 74
3rd year 411 83
Sri
Jayewardenepura
Arts 1st year 993 110
3rd year 649 96
Management 1st year 1409 157
3rd year 1142 169
Science 1st year 666 74
3rd year 423 62
Ruhuna Arts 1st year 642 150
3rd year 430 118
Management 1st year 326 76
3rd year 321 88
Science 1st year 298 69
3rd year 263 73
South-Eastern Arts 1st year 397 127
3rd year 159 75
Management 1st year 315 101
3rd year 206 96
Science 1st year 102 33
3rd year 73 34
Total 12140 2331
Source: Compilation by the author based on statistics available in each university
Roscoe (1975) has proposed some rules for determining sample size. When there exist sub-
samples, a minimum sample size of 30 for each category is necessary; in multivariate research,
the sample size should be several times (preferably10 times or more) as large as the number of
80
variables in the study. Also Neuman (2006) claimed three criteria for a researcher’s decision
about the best sample size: the degree of accuracy required; the degree of variability or diversity
in the population; and the number of different variables were examined simultaneously.
However, Saunders et al. (2009) argued that in an ideal situation (manageable population,
adequate time and financial resources) the researcher is supposed to study the whole population.
It is believed that sampling is necessary in this study due to the fact that limited time and
financial resources would not allow the researcher to study the whole population of 12,140
respondents. The researcher thus aimed at obtaining a representative sample of the population in
order to establish the representativeness of the sample to make generalizations about the whole
population (Sekaran, 2003). A stratified random sampling method was employed to determine
the number of elements required from each stratum. Year of study in each university was the
stratum factor in this study, that is, first year undergraduate students and third year undergraduate
students. The sample size of the study was determined according to the generalized scientific
guideline for sample size decision developed by Krejcie & Morgan (1970) under 95%
confidence interval level for each stratum. Then the total number of subjects in each stratum was
proportionately distributed among common subject streams. The total sample consisted of 2331
subjects as 19.2% from the target population. Simple random sampling method was used to
select the subjects for the study. The proportionately distributed sample among each stratum is
depicted in Table 4.4.
4.5.1.3 Main study-data collection
Data collection involves gathering of data using defined techniques in order to answer the pre-
defined research questions of the study (Kripanont, 2007). Data collection method is determined
by the chosen research strategies. Main study is the second phase of the research which adopted
a quantitative survey research strategy under the positivist nature of the enquiry discussed earlier
by means of a questionnaire. The greatest use of questionnaires is made within the survey
strategy (Gray, 2004).
A self-administered questionnaire is a fixed format of the tool that eliminates variation in the
questioning process, encourages frank responses, where the respondents have adequate time to
give well thought-out answers; the tool can be constructed so that quantitative data are relatively
easy to collect and analyze (Onyango, 2002; Gray, 2004; Kothari, 2004; Dulle, 2010).
Administering a questionnaire is a relatively simple and straightforward approach to extract
information on attitudes, beliefs, and motives from the sample, conducted with strict data
standardization and control (Adamantis Diamantopoulos & Schlegelmilch, 1997). As Sekaran
81
(2003) suggests, the advantage of the questionnaire method is that administering questionnaires
to large numbers of subjects simultaneously is economical and less time consuming and that it
does not require specific skills. Thus, a structured questionnaire can be considered as one of the
most appropriate data collection methods.
4.5.1.3.1 Questionnaire
A questionnaire is a list of carefully structured questions, chosen after considerable testing with a
view to eliciting reliable responses from a chosen sample (Hussey & Hussey, 1997). It is an
efficient data collection mechanism when the researcher knows exactly what is required and how
to measure the variables of interest (Kripanont, 2007).
A questionnaire could be structured or unstructured with regard to the general form of the
questions formed. If there are definite concrete and pre-determined response options,
questionnaires are called structured questionnaires and the unstructured ones are those with no
definitive response (Gray, 2004; Kothari, 2004). The structured questionnaires are simple to
administer and provide data which are suitable for statistical analysis (Kothari, 2004; Ndunguru,
2007) and it provides quantifiable results that could be helpful in empirical investigations, and
informants find it quicker and easier to answer the questions (Neuman, 2002). On the other hand,
unstructured questionnaires are highly challenging when it comes to data analysis. Also the
structured questionnaire is free of bias of the researcher and as Sekaran (2003) claimed the bias
could be further minimized by focusing on three areas in designing questionnaire: the wording of
the questions, planning of issues of how the variables will be categorized, scaled, and coded after
receipt of the responses, and the general appearance of the questionnaire. Thus, the current study
adapts a structured questionnaire in order to minimize the errors that could occur through
questions.
4.5.1.3.2 Questionnaire designing
Designing questionnaires is important to keep in mind why the research is being done (Ticehurst
& Veal, 2000). In designing a well-focused questionnaire, the researcher should use the research
objectives, research questions and the formulated research model as a guide. Questions were
included in the questionnaire used in this study only when they aligned within the research
objectives, research questions and the research model (Dulle, 2010). Also the researcher ensured
that questions were easily understood, simple and conveyed one thought at a time to help the
researcher to collect more accurate data.
It is applicable to adapt questions or items from previous studies in order to design a suitable and
a more reliable questionnaire. For the current research study questions used in the measurement
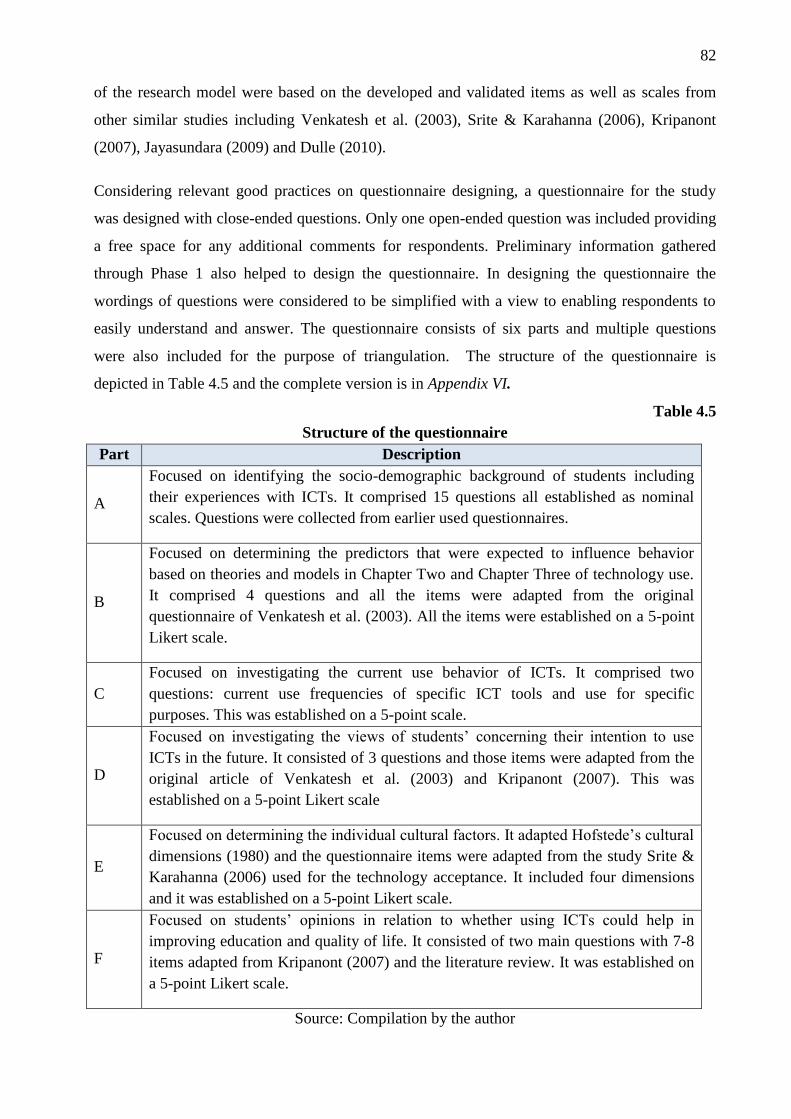
82
of the research model were based on the developed and validated items as well as scales from
other similar studies including Venkatesh et al. (2003), Srite & Karahanna (2006), Kripanont
(2007), Jayasundara (2009) and Dulle (2010).
Considering relevant good practices on questionnaire designing, a questionnaire for the study
was designed with close-ended questions. Only one open-ended question was included providing
a free space for any additional comments for respondents. Preliminary information gathered
through Phase 1 also helped to design the questionnaire. In designing the questionnaire the
wordings of questions were considered to be simplified with a view to enabling respondents to
easily understand and answer. The questionnaire consists of six parts and multiple questions
were also included for the purpose of triangulation. The structure of the questionnaire is
depicted in Table 4.5 and the complete version is in Appendix VI.
Table 4.5
Structure of the questionnaire
Part Description
A
Focused on identifying the socio-demographic background of students including
their experiences with ICTs. It comprised 15 questions all established as nominal
scales. Questions were collected from earlier used questionnaires.
B
Focused on determining the predictors that were expected to influence behavior
based on theories and models in Chapter Two and Chapter Three of technology use.
It comprised 4 questions and all the items were adapted from the original
questionnaire of Venkatesh et al. (2003). All the items were established on a 5-point
Likert scale.
C
Focused on investigating the current use behavior of ICTs. It comprised two
questions: current use frequencies of specific ICT tools and use for specific
purposes. This was established on a 5-point scale.
D
Focused on investigating the views of students’ concerning their intention to use
ICTs in the future. It consisted of 3 questions and those items were adapted from the
original article of Venkatesh et al. (2003) and Kripanont (2007). This was
established on a 5-point Likert scale
E
Focused on determining the individual cultural factors. It adapted Hofstede’s cultural
dimensions (1980) and the questionnaire items were adapted from the study Srite &
Karahanna (2006) used for the technology acceptance. It included four dimensions
and it was established on a 5-point Likert scale.
F
Focused on students’ opinions in relation to whether using ICTs could help in
improving education and quality of life. It consisted of two main questions with 7-8
items adapted from Kripanont (2007) and the literature review. It was established on
a 5-point Likert scale.
Source: Compilation by the author
83
First, the questionnaire was designed in English Language. Normally, university students have
sufficient English knowledge to understand and answer an English questionnaire as most of the
courses are conducted in English in universities. Further, there is one ethnic group of students,
whose mother tongue is English and some foreign students in Sri Lankan universities. Therefore,
the Tamil translation was not used since comparatively a small number of Tamil students were
included for the sample. However, majority of the Sri Lankan university students normally use
Sinhala language for everyday life. Therefore, the questionnaire was translated to Sinhala and
then it was again translated from Sinhala to English to confirm that the translation was
equivalent. Finally, both language questionnaires were used appropriately for the survey.
4.5.1.3.3 Pre-testing of the questionnaire
Pre-testing of a questionnaire is a trial conducted with a specific group of respondents for the
purpose of detecting problems in the questionnaire instructions or design (Sekaran, 2003). Pre-
testing is important to know whether the respondents have any difficulty in understanding the
questionnaire or whether there are any ambiguities or biases. Colleagues, respondent surrogates,
or actual respondents could be utilized for the purpose of refining a measuring instrument in the
pre-testing procedure (Cooper, 2008).
Validity and the practicability of the questionnaire are assessed by the pre-testing trial. Validity
refers to whether a test measures what it actually intends to measure (Jayasundara, 2009).
Practicability is an operational requirement of the questionnaire. As Cooper (2008) claimed it
needs to be economically, administratively and interpretably feasible to be suited for a large
sample. Pre-testing determines the clarity of instructions and questions, repetitiveness and
sensitivity of questions, coherence of format and layout, and appropriate length (Jayasundara,
2009). Thus, the pre-testing of the questionnaire is strongly recommended to detect deficiencies
in design, administration and wording of questions and Zikmund (2002) suggests that the size of
the pre-testing group may be 25 or 50 subjects.
In this study, first pretesting of both questionnaires was carried out during January-February
2014 using 50 students, peers and superiors in two universities: University of Colombo and
University of Sri Jayewardenepura. Some suggestions were to modify wordings of both the
questionnaires and they were revised. The second pre-testing was done during the first two
weeks of March in 2014. Both questionnaires were again revised to incorporate suggestions
about wording and inappropriate sequencing by consulting the senior professionals.
84
4.5.1.3.4 Pilot survey
A pilot study or a feasibility study which is a small-scale version of the larger survey (Kripanont,
2007) is conducted to detect weaknesses in design and instrumentation and to provide proxy data
for selection (Dulle, 2010). Since the pilot survey is a small-scale version of the main survey, it
is recommended to draw subjects from the target population and simulate the procedures and
protocols that have been designed for data collection of the major study. However, it is always
proposed to carry out one or more pilot studies before launching the data collection for the main
study.
As Ticehurst & Veal (2000), Kripanont (2007) and Dulle (2010) have argued there are a number
of objectives and advantages of conducting a feasibility study. Some of them are:
Improving the internal validity of the questionnaire
Assessing whether the research protocol is realistic and workable
Assessing the feasibility of a (full-scale) study/survey
Establishing whether the sampling frame and technique are effective;
Identifying logistical problems which might occur in using proposed methods;
Estimating variability in outcomes to help determine sample size;
Collecting preliminary data;
Assessing the proposed data analysis techniques to uncover potential problems
In conclusion the most valuable advantage of the pilot study was that it gave advance warning
about where the main research project could fail, where research protocols may not be followed,
or whether the proposed methods or instruments are inappropriate or too complicated (van
Teijlingen & Hundley, 2001). The size of the pilot group may range from 25 to 100 subjects
(Cooper, 2008).
In this study, the pilot survey was conducted during March-April 2014 in two universities,
University of Colombo and University of Sri Jayewardenepura using personal visits. Ninety five
(95) completely filled questionnaires in both languages could be drawn. With the completion of
data collection for the pilot study, data was analyzed using preliminary basic statistical methods
including reliability test and validity test using SPSS. As a result, minor changes were made to
both questionnaires for their formats in order to improve understanding. Finally, results
confirmed that the reliability and validity of the instrument was ensured to use for the main
survey.
85
4.5.1.3.5 Data collection procedure
Administration of the questionnaires to the pre-determined sample of undergraduates (first year
and third year) from the related Faculties of Arts, Management and Science/Applied Science of
the selected universities was carried out during May-December 2014. The researcher participated
in person when data was collected. The questionnaires were personally distributed to each of the
students in the sample during data collection. Only the students who agreed to participate in the
survey were requested to complete the questionnaires. This method of data collection was
important to ensure a better response rate and it provided an opportunity to the researcher to
explain the purpose of the investigation and to answer any queries raised by the subjects. Further,
the missing data could be minimized with this engagement.
4.5.1.3.6 Data editing and coding
Data editing and coding is important before analyzing the data. After coding, data could be
stored using statistical software. During data editing, data was checked for errors, omissions,
legibility and consistency and they were adjusted accordingly in order to ensure completeness,
consistency, and readability of the collected data. Descriptive statistical techniques were used for
this process and then data could be coded assigning character symbols, numerical symbols to
enter them. The coding sheet is in Appendix VII and it consisted of a list of all variables. After
entering the data into SPSS, data screening and cleaning was performed in SPSS to ensure that
there were no errors at this stage.
4.5.2 Step Two: Data analysis
This section has been designed to discuss the general issues and tests that the researcher
employed in the analysis of the pilot survey and the main survey. The analysis was done across
all the available data using the IBM SPSS version 21 with AMOS. The in-depth details of the
tests used for the data analysis is discussed where appropriate in Chapter Five, Six and Seven.
4.5.2.1 Reliability analysis
A reliability test is an attempt taken to indicate the extent to which the research tool is free of
bias and hence offers consistent measurement across time and across the various items in the
instrument (Kripanont, 2007). Reliability of the measures is tested by testing goodness of data.
The most popular test of inter-item consistency reliability is the Cronbach’s coefficient alpha
(Cronbach, 1951) which was used for the current study in determining the reliability. It tests the
consistency of respondents’ answers to all the items in a measure and the degree to which the
items are independent measures of the same concept, and correlates with one another (Sekaran,
86
2000). The Cronbach’s coefficient alpha values less than 0.6 considered to be poor, those in the
0.7 range, acceptable, those over 0.8 good and those very close to 1.0 even better.
4.5.2.2 Validity test
Validity is the extent to which the collected data truly reflect the phenomenon being studied
(Field, 2005). This is used to assess the instrument’s validity and it can be assessed by
undertaking content validity, criterion validity or construct validity (Kripanont, 2007). Content
validity was achieved by borrowing previously validated items for the measurement of the
research model. As noted by Kripanont (2007), the other approach for assessing content validity
is to examine the responses from the respondents and the construct validity is determined
through assessment of the convergent validity which is synonymous to correlation analysis. In
testing the validity of data in the current study, correlation of the measures with each other was
considered. The acceptable values range from 0.3 to 0.5 for item-total and inter-item
correlations respectively (Field, 2005).
4.5.2.3 Descriptive statistics
Descriptive statistical techniques such as the minimum, maximum, mean, median, mode, the
dispersion of variability (variance, standard deviation, range and quartile deviation), and the
shape (skewness) of the data distribution (Cooper, 2008) were employed to produce a complete
descriptive profile of the respondents in this study. As Kripanont (2007) noted, there exists a
number of benefits in descriptive statistics: describing the characteristics of the sample, checking
variables for any violation of the assumptions underlying the statistical techniques used, and
addressing specific objectives.
4.5.2.4 Chi-square test
The Chi-square test is used to determine whether there is a significant difference between the
expected frequencies and the observed frequencies in one or more categories. It compares the
observed and expected frequencies in each category to test that all categories contain the same
proportion of values. If the quantitative data is collected in random sampling with one or more
categories, the Chi-square test could be employed. In the current study, the group differences
observed through percentages were further tested using Chi-square test for statistical
significance.
4.5.2.5 Independent–k-sample test (Kruskal-Wallis test)
The Kruskal-Wallis test is a nonparametric test used to compare three or more samples. It could
be used without assuming the data to have a normal distribution. It was used to find out whether
87
there were any significant differences in the mean scores of current use behavior and the
intention to use behavior of ICTs with socio-demographic factors for the current study.
4.5.2.6 Structural Equation Modeling (SEM)
The Structural Equation Modeling (SEM) was selected to achieve the main objective of the study
that was to build up a model of ICT use and acceptance by university students. SEM is a
multivariate technique combining aspects of multiple regression which examines dependence
relationships and factor analysis which represents unmeasured concepts (latent factors or factors
with multiple variables) to estimate a series of interrelated dependence relationships
simultaneously (Hair, Black, Babin, Anderson, & Tatman, 2006). Further, SEM is well known as
the path analysis uses to form casual relationships in multivariate data in Social Science research.
SEM integrates other statistical techniques including ANOVA, analysis of covariance, principal
component analysis and classical test theory (Holmes-Smith, 2000).
SEM comprises some benefits when compared to other multivariate techniques to be selected in
the current study. As Byrne (2001, 2006) pointed out:
While most of the other multivariate techniques are essentially descriptive by nature such
as exploratory factor analysis, SEM takes a confirmatory approach (hypothesis-testing) to
the analysis of a structural theory relating to some phenomenon with two important
aspects: the causal processes under study are represented by a series of structural
equations, and these structural relations can be modeled pictorially to enable a clearer
conceptualization of the theory under study.
While traditional multivariate techniques are not capable of either assessing or correcting
for measurement error, SEM can provide explicit estimates of error variance parameters.
While former data analysis techniques are only based on observed measures, SEM
procedures can incorporate both unobserved (latent variables) and observed variables as
well.
SEM methodology has many important features available including modeling
multivariate relations, or for estimating point and/or interval indirect effects whilst there
are no widely and easily applied alternative methods for these kinds of features.
The theorized model was statistically tested using SEM in a simultaneous analysis of the entire
set of variables to verify the extent to which it is consistent with the collected data in the
specified context.
88
However, before employing SEM on model generation, it has been recommended to manage
data for multivariate analysis. In terms of data management for multivariate analysis, it is
essential to examine for missing data, outlier detection and also to test for the assumptions
underlying the statistical bases for multivariate analysis; multivariate normality and
multicolinearity (Hair et al., 2006).
Missing data analysis: In survey research, missing data impacts on the reduction of the sample
size available for analysis from an adequate sample to an inadequate sample and statistical
results could be biased and lead to erroneous results (Hair et al., 2006). In SEM, computing some
fit measures requires fitting the saturated and independence models in addition to the researcher
model (Arbuckle, 2007). Further, Arbuckle claimed that some missing data value patterns can
make it impossible to fit the saturated model even if it is possible to fit the researcher model.
Therefore, Hair et al. (2006) suggests that direct means of assessing the extent of missing data
should be by tabulating the percentage of variables with missing data for each case, and the
number of cases with missing data for each variable. SPSS facilitates this missing data analysis
and that process identifies not only the extent of missing data but any exceptionally high levels
of missing data that occur for individual cases or observations. In the current study, the missing
data analysis was conducted using SPSS 21 before employing the SEM (see Appendix VIII).
Multivariate outliers: Outliers are the observations which are substantially different from the
remainder of the dataset, that is, as extreme values (Hair et al., 1998). As Kripanont (2007)
argued an unusually high or low value on a variable, or a unique combination of values across
several variables that make the observation stand out from the others should be detected.
Otherwise problematic outliers are not representative of the population and they are counter to
the objectives of the analysis and can seriously distort statistical tests (Hair et al., 2006). Thus,
the dataset was cleaned to remove outliers employing descriptive statistics.
Multivariate normality: One of the basic assumptions of multivariate analysis is the multivariate
normality. Normality is correspondence to the normal distribution which is the benchmark for
statistical methods and normality can be assessed to some extent by obtaining Skewness and
Kurtosis values (Hair et al., 2006). The Skewness value provides an indication of the symmetry
of the distribution. Kurtosis provides information about the “peakedness” of the distribution
(Pallant, 2005) and it indicates the extent of departure from multivariate normality. In general,
Skewness 1 indicates moderate Skewness (Weisstein, 2004) and values of Kurtosis less than 1
are negligible, values 1-10 indicate moderate non-normality while values greater than 10 indicate
severe non-normality (Holmes-Smith & Coote, 2006). The Skewness test in descriptive statistics
89
was used to identify the normality of the database for the current study (see Appendix IX).
Approximated normality of the endogenous variables were utilized for the model generating in
the current study.
The general recommendation is to obtain more data (larger samples) whenever possible when
data deviate from normality or are flawed in some way (almost always the case). Further, there
are some other ways to deal with variables deviated in normality. These ways are designed for
variables that are assumed to have an underlying continuous distribution. For instance, if a Likert
scale of self-esteem items to research participants is administered and the scale points tap into
points along a continuum of self-esteem, and even though the item data are not continuously
distributed, the underlying self-esteem distribution is continuous. Thus, the larger sample (1681
cases) and the Likert scale used in the current study were therefore good enough to assume
multivariate normality.
Multicolinearity: Higher correlations of variables with each other, is referred to as
multicollinearity. Hair et al. (1998) suggest that, while no limit has been set to define high
correlations, values exceeding 0.9 needs to be considered, and correlations exceeding 0.8 can
often be indicative of problems. Therefore, the value exceeding 0.9 was used as the cut-off point
to determine multicollinearity in the current study. There was evidence of multicollinearity of
dependent variables so it was essential to consider removing one of them from data analysis.
This was achieved when conducting construct reliability and discriminant validity analysis in
Chapter Seven.
4.5.2.7 Multi-group moderation
AMOS’ multi-group moderation analysis was used in order to investigate the impact of
moderators on the influence of predictors toward dependent variables. In the multi-group
moderation analysis, the critical ratios (z-scores) calculated to represent the magnitude of the
difference between groups on each of the theorized paths were compared to assess if the
standardized effects differed across groups in order to test the group of hypotheses.
4.5.3 Step Three: Model selection
The best model was formulated using model fit indices provided in AMOS and using the ‘model
trimming’ techniques showed by Kremelberg (2010). The final model selection was done using
the goodness of fit adequacy; if it is satisfied then the model argues for the plausibility of the
postulated relations among variables; if it is unsatisfied, the tenability of such relations should be
rejected.
90
The goodness of fit index consisted of various types of measures and each type has its specific
capability in model evaluation, such as measures of parsimony, minimum sample discrepancy
function, measures based on the population discrepancy, in comparison to a baseline model.
Model Chi-Square (χ2) measure: The chi-square measure is a traditional measure for evaluating
the overall model fit. It assesses the magnitude of discrepancy between the sample and fitted
covariance matrices’ (Hu & Bentler, 1999, p. 2). A good model fit would provide an
insignificant result at a 0.05 threshold (Barrett, 2007). Chi-Square measure is in essence a
statistical significance test which is sensitive to sample size which means that the Chi-Square
statistic nearly always rejects the model when large samples are used (Bentler & Bonett, 1980;
Jöreskog & Sörbom, 1996). On the other hand, where small samples are used, the Chi-Square
statistic lacks power and because of this may not discriminate between good fitting models and
poor fitting models (Kenny & McCoach, 2003). Due to the restrictiveness of this Chi-Square
measure, researchers have sought alternative indices to assess model fit and even in the current
study, chi-square measure was not much considered as a good model fit measure.
Minimum Sample Discrepancy Function/DF: CMIN/DF is the minimum discrepancy divided
by its degrees of freedom; this measure was used in the current study in best model selection.
This ratio should be closer to 1 for acceptable models. Arbuckle (2007) claimed that it is not
clear how far from 1 it should be to let the ratio get before concluding that a model is
unsatisfactory. However, it has been found that this measure is as high as 5.0 (Wheaton, Muthen,
Alwin, & Summers, 1977) to as low as 2.0 (Tabachnick & Fidell, 2006) for satisfactory models
and that range was considered in model section of the current study.
Measures of Parsimony: A model’s simplicity is the parsimony. A model high in parsimony has
relatively few parameters and relatively many degrees of freedom. On the other hand, a model
with many parameters and a few degrees of freedom is considered as lacking in parsimony.
Therefore, it is an important measure in selecting the best suited model and it was considered in
the current study.
Measures Based on the Population Discrepancy: The population Root Mean Square Error of
Approximation (RMSEA) is the most commonly used measure in model selecting and it was
used for the current study too.
Comparison to a Baseline Model: There are many measures to compare the fitted model with a
baseline model. The three significant indices; NFI (Normed Fit Index), TLI (Tucker-Lewis
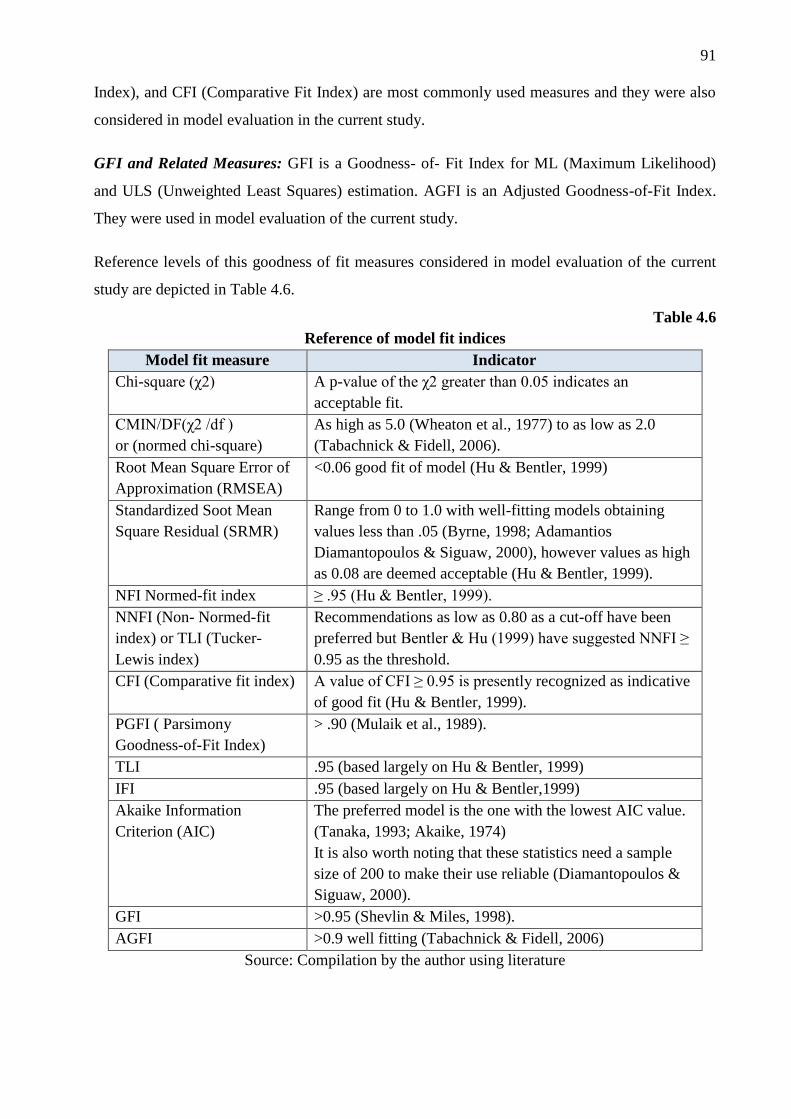
91
Index), and CFI (Comparative Fit Index) are most commonly used measures and they were also
considered in model evaluation in the current study.
GFI and Related Measures: GFI is a Goodness- of- Fit Index for ML (Maximum Likelihood)
and ULS (Unweighted Least Squares) estimation. AGFI is an Adjusted Goodness-of-Fit Index.
They were used in model evaluation of the current study.
Reference levels of this goodness of fit measures considered in model evaluation of the current
study are depicted in Table 4.6.
Table 4.6
Reference of model fit indices
Model fit measure Indicator
Chi-square (χ2) A p-value of the χ2 greater than 0.05 indicates an
acceptable fit.
CMIN/DF(χ2 /df )
or (normed chi-square)
As high as 5.0 (Wheaton et al., 1977) to as low as 2.0
(Tabachnick & Fidell, 2006).
Root Mean Square Error of
Approximation (RMSEA)
<0.06 good fit of model (Hu & Bentler, 1999)
Standardized Soot Mean
Square Residual (SRMR)
Range from 0 to 1.0 with well-fitting models obtaining
values less than .05 (Byrne, 1998; Adamantios
Diamantopoulos & Siguaw, 2000), however values as high
as 0.08 are deemed acceptable (Hu & Bentler, 1999).
NFI Normed-fit index ≥ .95 (Hu & Bentler, 1999).
NNFI (Non- Normed-fit
index) or TLI (Tucker-
Lewis index)
Recommendations as low as 0.80 as a cut-off have been
preferred but Bentler & Hu (1999) have suggested NNFI ≥
0.95 as the threshold.
CFI (Comparative fit index) A value of CFI ≥ 0.95 is presently recognized as indicative
of good fit (Hu & Bentler, 1999).
PGFI ( Parsimony
Goodness-of-Fit Index)
> .90 (Mulaik et al., 1989).
TLI .95 (based largely on Hu & Bentler, 1999)
IFI .95 (based largely on Hu & Bentler,1999)
Akaike Information
Criterion (AIC)
The preferred model is the one with the lowest AIC value.
(Tanaka, 1993; Akaike, 1974)
It is also worth noting that these statistics need a sample
size of 200 to make their use reliable (Diamantopoulos &
Siguaw, 2000).
GFI >0.95 (Shevlin & Miles, 1998).
AGFI >0.9 well fitting (Tabachnick & Fidell, 2006)
Source: Compilation by the author using literature
92
4.6 SUMMARY
This chapter presented the plan of the research study and it comprises the mix method approach.
The basic plan of the study outlined the methodology used to explore ICT use and acceptance
behavior of university students in Sri Lanka. Methodology adopted for the study incorporates the
theory testing/building in the field of ICT use and acceptance behavior of university students.
The chapter attempted to describe the two phases scheduled for the research; exploratory study
and the main study which comprise the primary research components. It further justified the
quantitative approach adopted for the research in the main study under positivist philosophy and
qualitative characteristics belonging to phenomenological inquiry used in the exploratory study.
Then the two phases in detail were described. It discusses data collection methods and data
analysis techniques too. The next chapter presents the results of the exploratory study.
93
CHAPTER 5
EXPLORATORY STUDY-DATA ANALYSIS AND FINDINGS
5.1 INTRODUCTION
Chapter Four discussed the methodological approach that was designed to achieve the aims and
objectives of the study. Chapter Five presents the results of the data analysis of the first stage of
the research or the exploratory part of the current study. The data collected from semi structured
interviews/discussions was analyzed using content analysis techniques and statistical techniques
to explore the present situation regarding ICT use and acceptance in universities and the job
market, important determinants on technology acceptance and important ICT tools which are
mostly relevant to the current job market.
5.2 SEMI STRUCTURED INTERVIEWS
Semi structured interviews were mainly conducted in order to check the feasibility of the study.
Moreover, the refining of core determinants and moderating factors included in the model and
specification of the important ICT tools for fresh graduates were also considered through semi
structured interviews to make sure those are specific to the university context in Sri Lanka.
Twenty three interviews were scheduled using non-probability sampling, often with a specific
purpose in mind from the four selected universities and various other fields in Sri Lanka. Eight
(8) lecturers who were in charge of ICT in the Faculties of Arts, Science/ Applied Science and
Management and five (5) ICT instructors and one Librarian (1) were chosen from the University
of Colombo, the University of Sri Jayewardenepura, the University of Ruhuna and the South
Eastern University of Sri Lanka. Four (4) focus group discussions were scheduled with students
in the selected four universities, that is, one Group Discussion per university. Five (5) other
interviews with top level employers who engage in recruitment of employees for jobs in leading
fields in Sri Lanka such as diversified companies, higher education, industrial, administrative
and finance were also scheduled.
A semi structured schedule was developed to guide the interviews and it is presented in Appendix
X. The guideline indicates the themes covered by the interviews, underlying principles of
selecting them and the method/s employed in the interviews.
Background information of the subjects were included in the interview schedule in order to
determine whether selected subjects are suitable to get information on ICT use and acceptance of
94
undergraduates/graduates in Sri Lanka. Importance and the requirement of ICTs for fresh
graduates and the current ICT environment (facilities and courses) of Sri Lankan universities
were also planned to be discussed with the subjects to determine whether they are aware of the
relationship between the ICT skills of graduates and job market demand. Factors which mainly
cause undergraduates/ graduates to use ICTs and the differences experienced by their main
subjects in using ICTs were also included with the rationale to examine whether the determinants
and moderating factors identified in the literature are relevant for ICT use and acceptance in Sri
Lankan universities. Since it was needed to identify the attributes which can be exploited to
make full use of ICTs, and recommendations to promote ICT use it was planned to discuss these
aspects with the selected participants. Finally, it was planned to derive the commonly important
ICT tools for graduates through the interviews.
Data collection for the exploratory study was carried out by personally visiting the relevant
universities and other places in which the subjects were selected by the researcher. These
interviews were conducted during December/2013-January/2014. Approximately half an hour
face to face interview was held with each interviewee. More than one hour was spent for each of
the group discussion and students for the group discussion were selected at respective libraries of
the selected universities, based on their motivation to participate.
A clear view of the present situation of ICT use/knowledge/skills of graduates in the university
context and at the employer’s end, relevant factors affecting ICT use and the most important ICT
tools which the graduates should be equipped with, could be drawn out from the interviews and
the questionnaires.
5.3 ANALYSIS OF INTERVIEW DATA
Analysis of the data collected from semi structured interviews was employed using the content
analysis as well as the quantitative techniques in SPSS 16.0 version.
5.3.1 Background information of the interviewees
Table 5.1 summarizes the background information of participants in different categories.
According to the Table 5.1, twenty four (24) interviews were included in the sample. It consisted
of nine (9) ICT coordinating lecturers, five (5) computer instructors, one (1) university Librarian
and three (3) groups of undergraduate students where each group consisted of more than ten
students from Arts, Science/ Applied Science and Management Faculties from three selected
universities and six (6) employers from the job market. However, the sample composition
scheduled for the university sector, could not be achieved since practical problems occurred with
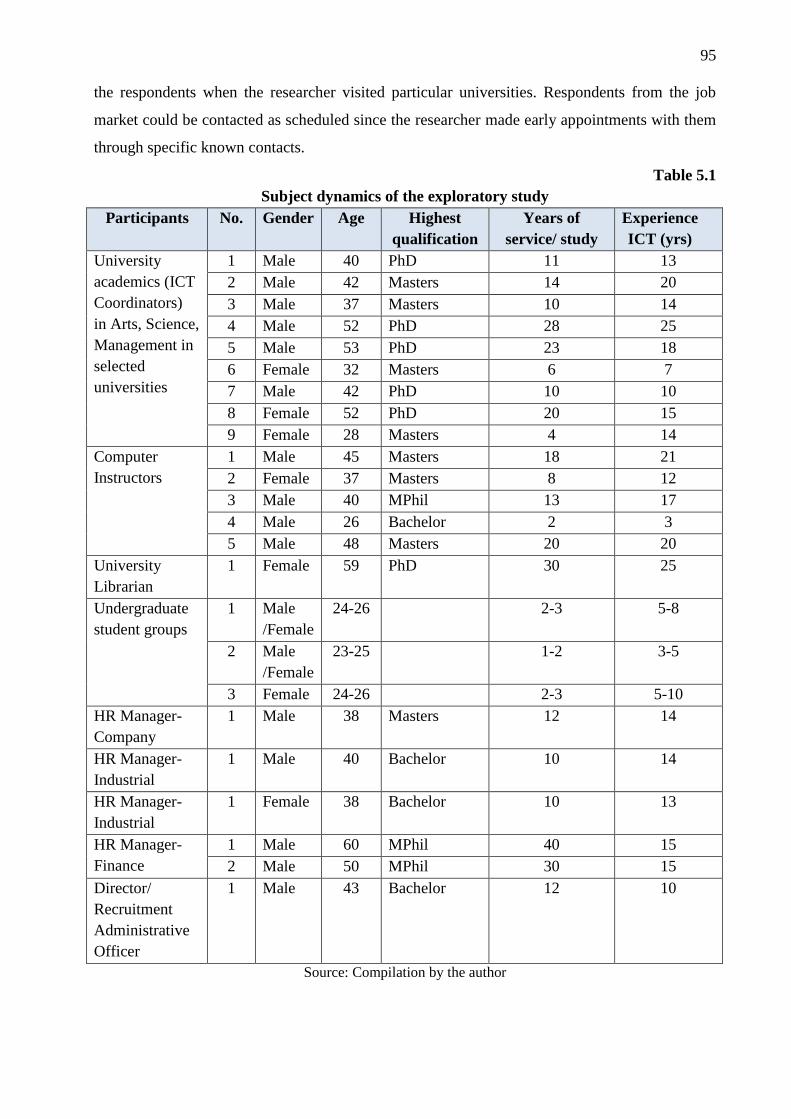
95
the respondents when the researcher visited particular universities. Respondents from the job
market could be contacted as scheduled since the researcher made early appointments with them
through specific known contacts.
Table 5.1
Subject dynamics of the exploratory study
Participants No. Gender Age Highest
qualification
Years of
service/ study
Experience
ICT (yrs)
University
academics (ICT
Coordinators)
in Arts, Science,
Management in
selected
universities
1 Male 40 PhD 11 13
2 Male 42 Masters 14 20
3 Male 37 Masters 10 14
4 Male 52 PhD 28 25
5 Male 53 PhD 23 18
6 Female 32 Masters 6 7
7 Male 42 PhD 10 10
8 Female 52 PhD 20 15
9 Female 28 Masters 4 14
Computer
Instructors
1 Male 45 Masters 18 21
2 Female 37 Masters 8 12
3 Male 40 MPhil 13 17
4 Male 26 Bachelor 2 3
5 Male 48 Masters 20 20
University
Librarian
1 Female 59 PhD 30 25
Undergraduate
student groups
1 Male
/Female
24-26 2-3 5-8
2 Male
/Female
23-25 1-2 3-5
3 Female 24-26 2-3 5-10
HR Manager-
Company
1 Male 38 Masters 12 14
HR Manager-
Industrial
1 Male 40 Bachelor 10 14
HR Manager-
Industrial
1 Female 38 Bachelor 10 13
HR Manager-
Finance
1 Male 60 MPhil 40 15
2 Male 50 MPhil 30 15
Director/
Recruitment
Administrative
Officer
1 Male 43 Bachelor 12 10
Source: Compilation by the author
96
The majority of the participants had considerable experience and experience with ICTs.
Moreover, most of them except the students were males and had at least a Bachelors Degree
level education. These characteristics of the interviewees helped to achieve the basic objectives
of the exploratory study as expected without any issues.
5.3.2 Thematic analysis of the interviews
The interviews were conducted according to the themes indicated in interview schedule (see
Appendix X). Participants enjoyed responding to the interviews which enabled the researcher to
gain a wealth of information. Twenty four (24) interviews/ focus group discussions were
conducted with the subjects who are in the university field and the job market field as depicted in
Table 5.1.
5.3.2.1 Importance of ICTs for graduates
All four categories of participants from the university field (ICT coordinating lecturers, ICT
instructors in computer labs, librarian, undergraduate students) and from the job market
unanimously emphasized the importance of ICT for fresh graduates as a requirement.
Most of the ICT coordinating lecturers and ICT instructors stressed that since each and every
industry is information based in this information age and as therefore work processes in all
industries are based on ICTs, fresh graduates should be equipped with not only with computer
skills but also ICT skills.
One male ICT coordinating lecturer with 10 years working experience in the University of Sri
Jayewardenepura described the importance of ICTs as follows:
“ICT is essential without being based on whatever the field is. As an example, we have a
student who is an artist. Now, he is a performing artist using computers very well.
Moreover, Archaeology students do marvelous visualizations using Google sketch-ups. It
is clear that each and every task can be performed using ICTs. So, will there be job
opportunities without ICTs?”
They further claimed that basic ICT is an essential component for fresh graduates and advanced
ICTs is an advantage in getting jobs. A young (38 years-old) Human Resource Manager with 12
years of his working experience in a reputed diversified company in Sri Lanka stated:
“Fresh graduates should have at least basic skills in using computers and especially
Internet searching abilities. So, we conduct a test on Word, Excel, PowerPoint and
Internet searching skills to measure their basic ICT capabilities.”
97
An ICT coordinating male lecturer with a PhD and 23 years working experience in the
University of Colombo explained the importance of having ICT skills for graduates in another
aspect. He said that:
“Our graduates have to compete with students from International schools where they
teach programming languages as PASCAL in grades 6-7. Therefore, our students have to
go down even at the local job market without having ICTs on their hands.”
This statement was confirmed by one Human Resources Manager who was 38 years of age and
holding a Masters level qualification in a reputed company in Sri Lanka stating:
“We mostly prefer to enroll school leavers from International schools since they are more
elegant in handling various novel ICTs than graduates from traditional universities.”
A young ICT coordinating female lecturer from the University of Ruhuna emphasized that past
students of her Faculty have been blessed with better jobs based on the certificate given for the
compulsory ICT courses conducted in the Faculty. She further showed examples of the graduates
who were well skilled in ICTs being promoted in the private sector jobs as well as in the
government sector. This was further confirmed by an ICT coordinating lecturer who has
qualified with a PhD from the University of Sri Jayewardenepura who stated that:
“Our department has faced a big problem in recruiting temporary instructors with ICT
skills because the top ten in the list have already got better jobs. Today I called for the
37th student in the list to work as a Temporary Instructor for the Department.”
All the participants from the job market reiterated the same opinion. They highlighted that,
higher ICT skills is an advantage for securing better jobs in Sri Lanka. They further stressed that
after having their basic training they group new comers according to their skills, and if someone
has got equipped with advanced ICT skills he/she would be able to get better positions.
Most commonly, computer instructors in all selected universities agreed on that:
“Though individual Faculties have adequate facilities and courses to promote the ICT
acceptance for the students, not all the students have identified the necessity to improve
their ICT use. Always, they limit themselves to course content and do not go beyond
using various applications even in the Web. Lecturers have to always direct them through
assignments or any other engagements.”
However, the students who participated in group interviews voiced their opinions freely
disagreeing with what the earlier interviewees had stated. Most of them claimed that they had
followed computer courses before entering the university since they had identified the necessity
98
for ICTs to successfully cope up with this digital era. Some of them believed that it is unable to
successfully complete the degree at universities without having ICT experiences and that
therefore they had followed ICT courses. Some believed that ICT is a trend and they have to
move towards it. A group of students in the Arts stream have started to follow ICT courses
outside the university simultaneously while following their degrees at universities to get better
opportunities in the job market. This was confirmed by the focus group discussion held at the
University of Colombo. They agreed that:
“ICT is essential. It is very important for some job fields. We think all students have
identified the necessity in our batch and they follow courses at various institutions. Some
senior students have laptops. We have lab facilities, we use them optionally. Some
subjects are ICT facilitated. But the problem is we have no added time to use ICTs with
our course work.”
The perceptions of the Librarian with her 30 years’ experience in the university sector and the
Human Resource Manager from the Garment industry are also given herewith. The Librarian
emphasized that:
“New students are knowledgeable on ICTs and this trend has grown during the last 5
years. Knowledge has been confined mostly to e-mail, Facebook, Internet searching and
music, You Tube etc. These skills also may be useful for the job market in this networked
era.”
The HR Manger endorsed that:
“We check for the qualifications in ICTs of coming graduates. Most of them can manage
basic ICTs such as Word, Excel. That capability is enough for us for the preliminary
stages.”
However, a different perception was added to this by a Director/ Recruitment in a government
ministry and he stated that they have no problem with ICT use with Science graduates, but they
have to face problems in recruiting suitable employees from the Arts streams.
However, the students from the Faculty of Arts, University of Ruhuna expressed their ideas in a
different way. All of them agreed that:
“Even though ICT is a necessity, it seems that not all have equally identified its
importance. Most of the students who identified the importance have followed computer
courses before and after entering the university. On the other hand, if there is a
99
compulsory ICT course in the university, some students only prepare for the tests of that
course and thereafter ignore using ICTs continuously.”
According to all these perceptions of the interviewees, it is apparent that basic ICT is considered
as an essential component for today’s job market and advanced ICT skills compose a plus point
for better positions. It was found that Word, Excel, Power Point, e-mail and Internet searching
and its applications are the essential basic ICT tools for fresh graduates. Moreover, it was
revealed that even though, most of the students have identified this necessity; still there are some
who do not accept ICTs as an essential element. On the other hand, job market employers seek
ICT equipped employees. They further put their emphasis on the job market demand with ICTs
and believe that a graduate can easily capture the demand by him/herself for their position with
advanced ICT skills. Therefore, it is clear that the current study is feasible and relevant.
5.3.2.2 Current situation of ICT environment of universities and graduates’ performance
on ICTs
Interviewees from the university sector were asked about the current status of the facilities and
compulsory and optional courses offered for the students and the students’ performance with
ICTs. Simultaneously, the trend in ICT performance of fresh graduates was questioned from the
respondents selected from the job market.
The perceptions of the ICT coordinating lecturers of universities, revealed that introductory ICT
courses had been conducted. While Word, Excel, Power Point, Internet searching and e-mail
practices were covered through all the courses as the minimum requirement, some courses
contained the advanced ICT options. The nature of these courses differed according to the
Faculties and the universities. Some were credit based courses and others were non-credit based.
Most of the Faculty level courses were compulsory. There were yearly driven ICT courses in 2-
3 Faculties. They have scheduled their course content from very basic to advanced. Other than
this common situation, it was possible to find some specific programs conducted at department
levels. A male young ICT coordinating lecturer (40 years old) with a PhD from the University of
Sri Jayewardenepura endorsed that:
“We have implemented a program called computer practices (using key board to practice
typing) for first year students at our Department level to enhance the ICT skills of poor
skilled students. Since it is an optional, students gradually give up attending as they are
tight with the content of their normal degree course. We have further introduced subject
specific software which I used for my higher degrees in abroad and students are
mandated to use them in order to make them smart with ICT use at their places of

100
employment. For example, research students should use LATEX software to arrange their
thesis and we provide the basic introduction for the software.”
The Librarian interviewed also reiterated that other than preliminary courses, introductory
courses and preliminary laboratory courses conducted as compulsory courses, they further
facilitate digital literacy courses to train the students to work under digital environments.
A different aspect of implementation has been carried out in a particular Faculty in a selected
university. A 37 year aged male ICT coordinating lecturer with Masters level qualification stated
that:
“Other than the fundamental ICT courses, almost all the subjects in the Faculty are
connected with ICTs. For example Accounting as Computer based accounting, Marketing
as Digital marketing, ERP-Enterprise Resource Planning etc. Then all the students have
to use them, whether they like or not to be skilled with ICTs. “
Moreover, the majority of the ICT coordinating lecturers concurred that they always plan to
initiate new ICT related course units for students and that some of them have already
implemented such programs.
All the ICT instructors in selected universities also agreed with what the coordinators mentioned.
Moreover, they stated that other than common introductory ICT courses students are facilitated
with practical classes on subject specific ICTs.
The responding lecturers and the ICT instructors were questioned about the infrastructure
facilities available in their Faculties and universities. Regular developments on ICT environment
in universities have taken place, they agreed. Some of the Faculties own Wi-Fi zones and other
remaining Faculties have also planned for them. According to their perceptions, students are
facilitated with ample computer and Internet labs where they can work whenever they need.
Majority of the Faculties have access for a variety of ICT tools and the ICT instructors agreed
that timely planned repairing of computers and connections take place.
A lecturer who was the Dean cum ICT coordinator of an Arts Faculty and a Masters Degree
holder aged 37 years captured all the perceptions given by others reiterating that:
“Although we knew the necessity of ICT skills for our graduates, resources were the
main problem we had to face. Limited lab facilities and lack of qualified staff were the
main problems. So the plans went wrong. Finally we could improve computer lab
facilities within the Faculty and install new computers. Thereafter, we could introduce 5
101
certificate courses in JAVA, Web designing, Graphic design, MS Office, hardware and
SQL too. They are very useful and the students who qualified with these courses have got
good jobs. We conducted those using visiting lecturers. Further, subject based IT
components have been included in the Faculty curricula. For example, Statistics-SPSS,
History-Graphic design and Economics-e-views etc. Lecturers in the Faculty have been
advised to communicate with students through e-mails in order to get them to practice to
use e-mails for their personal and learning activities.”
Students’ agreement with their lecturers’ and instructors’ perceptions were examined at group
discussions. All the groups agreed with their teachers regarding the compulsory and optional
courses. However, the group of students who participated for the group discussion at the
University of Ruhuna endorsed that:
“Although we are facilitated with the basic ICT courses and other subject related ICT
courses, not all the students can equally catch up with them. One reason is the support
given during the computer work is not satisfactory and therefore some of our friends give
up the courses. In order that students expect to have more ICT courses very basically with
a strong assistance and more facilities because with limited facilities we face problems
specially in using communication technologies.”
Not only the group of students from University of Ruhuna, but students from other selected
universities except South-Eastern University of Sri Lanka (SEUSL) also reiterated that they have
not been allowed to use communicating ICT tools. The students of the SEUSL mentioned that
they have Wi-Fi zones and therefore they can use their own mobile computing devices to trial a
variety of ICT tools. However, the students who joined the discussion at the University of Sri
Jayewardenepura cited that their lecturers always encourage them to get ICT skills.
The quality of ICT capabilities of fresh graduates was probed into at the employers’ end.
Employers agreed that there has been an improvement of the percentage of ICT capable
graduates within last 5 years. Some of the job market employers stated that fresh graduates are
smart in using ICTs, which means that the universities have identified the necessity and are
performing their job well. However, private sector employers claimed that the fresh graduates’
capabilities are not exactly matched with their requirements and one employer with 12 years
working experience endorsed that:
“If graduates have gained ICT skills from their respective universities, then they are able
to catch up with the rapidly changing ICT environments in working places. Therefore, we
102
prefer ICT skilled graduates. Since there are many graduates who are willing to get jobs,
we always try recruiting well-skilled ones for our limited requirements.”
A different perception was endorsed by the Government sector employer who had 12 years
experience in recruiting people who said that:
“Newly recruited graduates have to perform whatever the duties they are entrusted with
in the places where they are positioned in addition to their subject skills gained from their
universities. So, we wish to have at least word processing skills for graduates, but still
there are some without that skill.”
Considering all the views pointed by university people, it could be highlighted that universities
were making maximum efforts to build ICT literate graduates to be able to create a global
demand for their products. They have turned to the enhancement of ICT facilities with more ICT
oriented courses at Faculty levels and students are also immersed in this ICT environment in
their Faculties at respective universities. Concurrently, employers are also striving to recruit
mostly skilled graduates to be compatible with ICTs in this electronic era. Therefore, it is
apparent that, individual acceptance would be the one and only reason not to meet the graduates’
ICT skills gained at universities and employers’ demands. Therefore the study would be able to
contribute with suggestions.
5.3.2.3 Enthusiasm and the major reasons for using ICTs
While the university community were asked about the students’ awareness or the enthusiasm on
ICTs and identified reasons to use ICTs, job market employers were questioned about the
graduates’ flexibility for their ICT environments.
Different perceptions were given by the interviewees from the university field regarding
students’/ graduates’ enthusiasm and their experience regarding the reasons to use them.
However, most of the ICT coordinating lecturers affirmed that the students are less motivated
and that they do not seem to have understood the benefits that could be gained through ICTs.
They further argued that:
“Students are always credit, certificate and marks oriented. They believe that they can
receive better positions by only obtaining the certificate for ICT courses. Therefore, they
wish to get certificates with less effort. So, lecturers have to always force students to use
ICTs showing its benefits.”
The same view was also confirmed by most of ICT instructors in selected universities. They
altogether agreed that:
103
“A poor participation of the students is experienced for the optional ICT courses. Even
though some introductory ICT courses are compulsory, it could be seen that attendance is
gradually decreasing for the classes. At the beginning they are much enthusiastic to use
computers and to learn new things, but later they limit themselves to their compulsory
applications of the related course units which are assigned by lecturers.”
A 48-year old male computer instructor who had 20 years’ experience and qualified with a
Masters’ Degree endorsed that:
“It seems that students are not much enthusiastic on ICTs and this may be considered as a
privilege by Arts students. Poor attendance is higher for male students than female
students in the Arts stream. But, I don’t know whether they practice using their own
methods or devices.”
A forty two year-old lecturer with 10 years working experience and holding a PhD Degree who
was interviewed from the Faculty of Management in the University of Colombo further
elaborated the views of others:
“Students are smart now. But, most of them have not really identified the necessity of
ICTs for the job market. Though they behave blindly regarding ICTs during the first two
years in the university, they need ICT skills to continue their studies in their third year.
That is a technique we use to direct them towards using ICTs. “
A different perception was presented by three ICT coordinating lecturers from Sri
Jayewardenepura and South-Eastern universities. One mentioned that though the present
students are more knowledgeable than earlier students, they are less motivated for learning new
applications other than traditional and highly required ICT applications. Another lecturer from
the University of Sri Jayewardenepura who is a 37-year old male with 10 years’ experience in
the university and holding a Masters level qualification also endorsed that:
“Students are much more enthusiastic on ICTs. They prefer IT practical than theoretical
classes having understood the relative advantages that could be drawn from ICT than
manual processes. It seems that they further like to work with their batch mates together.
However, these ICT applications are compulsory for their subjects and sometimes that
may be the reason to use ICTs.”
The other lecturer who brought forward a totally different perception was a 28-year old female
with 4 years’ experience in the university with a Masters’ Degree who stated that:
104
“I think that all the students have identified the requirement in our Faculty. We conduct
ICT classes on weekends. Students enthusiastically participate in them too. I personally
experienced that they always question to clarify their doubts about the lesson and other
new applications.”
Then the students were questioned about their views regarding ICT usage. All groups of the
students in selected universities agreed that:
“We have really understood the chance we can get at the job market with ICT certificates
and skills. Our seniors have already got that chance too. Also, our lecturers always
believe that we should use ICTs and they encourage us at all times. We have computer
and Internet facilities too. But the problem is that when the course activities of our degree
programs become tight; we do not have the time to allocate for extra things of ICTs. Then
we are only limited to our subject applications of ICTs. Therefore, we suggest changing
our curricula towards ICT oriented programs.”
Majority of the students further claimed that they have clearly experienced the efficiency and
effectiveness that could be gained by using ICTs than their manual practices. It seems that they
have become inclined to their traditional systems with rigid time frames. However, some
students raised the issues of receiving minor support at computer labs, limited facilities and use
of limited applications as problems in using ICTs at universities.
Fresh graduates’ flexibility towards their job environments were inquired from the employers
and all the employers in the private sector claimed that fresh graduates selected are interested in
working in ICT oriented milieus. Moreover, they affirmed that it is not needed to train selected
graduates for their specific ICT environments, because the graduates’ are confident in their ICT
skills. However, they mentioned that this may be because they select the spirit from the
graduates’ pool.
Conversely, the Government sector Director/Recruitment who had 12 years’ experience said
that:
“Even though we consider ICT knowledge as an additional qualification in recruiting
graduates, a very few of them are trying to do something using their ICT knowledge gained
at universities. But, most of the time they are not allowed to be smart with ICTs under the
government sector regulations.”
The rationale of the theme was to determine whether the determinants identified in the literature
are relevant for present ICT use and acceptance environment in Sri Lankan universities.
105
According to the perceptions of ICT coordinating lecturers, ICT instructors and students, it was
clear that most of the time students are compelled to use ICTs since they receive benefits using
ICTs and since their teachers think that they should use ICTs for their future. These are the two
determinants identified from the literature review; performance expectancy which is the degree
to which an individual student believes that using ICTs will help him or her to attain gains in
performance and social influence which is the degree to which an individual student perceives
that other important persons believe he or she should use ICTs.
According to the views of a majority of students, ease of using ICTs and the availability of more
infrastructure facilities were the other two determinants identified. Those determinants were the
effort expectancy: the degree of ease associated with the use of ICTs and the facilitating
conditions: the degree to which an individual student believes that an institutional and technical
infrastructure exists to support use of ICTs. Therefore, it is obvious that the key determinants
identified in the literature review are well suited to the current pattern of using ICTs in
universities.
5.3.2.4 Differences among undergraduates/ graduates in their levels of performance of
ICTs
Not all students/graduates behave in the same manner when using ICTs. This aspect was
inquired from the university community and the job market employers in order to ascertain
whether the moderating factors identified from the literature are relevant for the current levels of
using ICTs by the students/ graduates.
An interesting feature of the perceptions was that though all the interviewees have experienced
individual differences in the performance on ICTs of the students/ graduates, exact reasons could
not be identified by all of them. They believe that happens because of the students’/ graduates’
attitudes and the self-efficacy towards the work/job and ICTs. Attitude, self-efficacy and anxiety
were indirect determinants identified by the theoretical base selected for the current study.
Most of the interviewees identified the existence of the digital divide among students/ graduates.
Most of the university people have identified that this gap declines throughout the time in the
university and that it vanishes when they leave the university. Students also entirely agreed with
this perception and further clarified that:
“Most of our colleagues from rural areas make efforts to remove the gap and mostly
achieve this when almost one year has elapsed. But, some of our friends they absolutely
give up using ICTs.”
106
However, one ICT coordinator, a female lecturer from the SEUSL endorsed that:
“There is a big variation among students in their ICT performance. One of them is the
difference between the students from metropolitan areas and rural areas. This gap
continuously exists.”
She was 28-year old lecturer with a Masters Degree having only 4 years’ experience in the
university service. Sometimes, her lower experience in university service may have caused to her
to give a different perception than other senior people. However, that view could not be totally
discarded due to a perception made by one Human Resource Manager, who was a 38-year old
male with 12 years’ experience in employment who said that:
“We normally prefer to recruit persons who have done their education in metropolitan
areas because they are always stylish in English and are keeping up with ICTs.”
It seems that the digital divide may continue for a little time after the graduation too.
Moreover, the university community has identified that the students who had ICT experience at
their schools or through extra courses they followed before entering the university have
performed well in using ICTs. This was confirmed by the focus group discussion held at the
University of Ruhuna. All the students agreed that:
“Some of our students show best performance using ICTs since they have prior
knowledge and experience with ICTs. We believe that prior experience is essential to
successfully complete the computer courses in the university.”
Further, the university community claimed that the students who are facilitated with their own
computers and Internet connections are more skillful than others. One of the ICT coordinating
lecturers with more than 10 years experience in the university from the Arts Faculty of the
University of Sri Jayewardenepura reiterated that:
“There is a big variation among students in ICT performance. Students, who were familiar
with ICTs in their schools or in private courses, perform well. On the other hand, most of the
students do not know even how to use a keyboard at the beginning, but finally they do
programming too.”
Some of the lecturers and ICT instructors stated that they have experienced a gender difference
in using ICTs. They affirmed that male students are more skillful than females. Moreover, some
of the employers revealed that most of the time fresh graduates differ in ICT performance
107
according to the subject stream followed at universities and according to the university they
graduated from.
Suggestions proposed by the interviewees disclose the existence of more factors which predict
the ICT use and acceptance other than the main determinants identified. Those were the
community to which students belong, their ICT experience and facilities available, gender,
subject streams and the university. All these factors were considered for the current study and
gender, ICT experience and Faculty were included as the moderating factors of the proposed
model. In addition, the cultural factors were also included for the model as moderating factors in
order to determine the individual differences among the students as experienced by the
interviewees. Therefore, it is apparent that the proposed model has lent itself as relevant for the
presently available ICT environments at universities.
5.3.2.5 Strategies to promote ICT use of students
In order to identify the attributes that could be used to make full use of ICTs by university
students, the interviewees were asked to recommend strategies to promote ICT use and
acceptance at universities. A variety of views was put forward by the university community and
the employers in the leading fields. In a nutshell, while ICT lecturers and instructors are looking
for expedients to promote using ICTs in universities; the job market employers are willing to
have more ICT skilled graduates for their work places.
A common perception of all the ICT coordinating lecturers was to enhance the ICT infrastructure
facilities in their Faculties. Those who do not have Wi-Fi zones have planned to implement more
computer lab facilities with unlimited Internet connections. At the same time the lecturers have
already taken action to commence more ICT courses such as credit based courses, entire ICT
degree programs and ICT-oriented course units too.
Moreover, some had big plans beyond these. A Dean cum ICT coordinator of the Faculty who
had 14 years’ working experience with a Masters’ level qualification said that:
“Concurrently we have planned to provide laptops for students and to improve the
infrastructure facilities within the Faculty with a Wi-Fi zone. Also, we have already made
arrangements to initiate a credit based compulsory ICT course for our students from next
year.”
Another young male lecturer with 10 years’ experience in the University of Sri Jayewardenepura
endorsed that:
108
“Our vision is towards a paperless scenario in the Faculty. Traditional methods will be
replaced by electronic. For example digital notice boards (currently implemented) and
digital publications too. Also, we wish to improve facilities and other subject-based
improvements.”
Another different plan was revealed by a male ICT coordinating lecturer from the University of
Colombo. He was a PhD qualified senior lecturer with 10 years’ ICT experience and he declared
that;
“Online computer based assignments will be employed. Arrangements have already been
made to repair computers by the students themselves by providing necessary knowledge
and skills to them.”
Majority of the ICT coordinating lecturers have identified the lack of qualified staff in their
Faculties as a barrier to making students more skilled in ICTs. They have already made plans to
train their existing staff members and to extend recruiting more skillful lecturers. However, one
of the ICT coordinating lecturers who is a professor with a PhD Degree and 52-year-old
mentioned that:
“I do not plan to make more facilities and courses in the Faculty, because the existing
resources have not been fully utilized by the present students. Therefore, I wish to use
other strategies to promote using ICTs among the students in the Faculty.”
A majority of the ICT instructors have experienced that most of the students do not get the
maximum benefits of the resources available in Faculties and they suggest that lecturers should
form strategic plans to force students to make full use of ICTs. Students also expect such a
situation in their Faculties. Groups of the students with whom discussions were made agreed
that:
“If we can use ICTs along with our course units of the degree programs or as a
compulsory part of the subjects we learn, then we will be able to use them to the level our
lecturers expect with our rigid schedules.”
Moreover, the majority of the students wish to have ICT courses which are very basic to
advanced with an enormous support at the practical classes. Some were willing to have more
computer and Internet facilities to be able to use them whenever they need.
A variety of perceptions were given by the employers. Most commonly they had experienced
that even though the students were knowledgeable in using ICTs they are reluctant to use their
knowledge at their work places. Some private sector employers claimed that they prefer if fresh
109
graduates would be able to use communication technologies such as Skype, Facebook and e-
mail. Finally, a novel view emerged through the perceptions of employers. They believe that the
students can build up a self-demand at the job market by improving their individual use of ICTs
during the undergraduate period.
According to the perceptions given by the interviewees, it emerged that complete utilization of
ICTs has not taken place by the university students. Therefore, it is clear that there exists a gap
between the input and output with respect to ICTs and the current study is feasible and relevant
for the prevailing situation. Exploring the individual use and acceptance of ICTs will be critical
to fill the gap.
5.3.3 Commonly important ICT tools for graduates
The interviewees were then provided with a list of ICT tools identified through the literature
review to rank them according to importance in order to determine the mostly important ICT
tools for all graduates in common. The scale of 1 to 5 where 1 is very unimportant and 5 is very
important was used to gauge the importance of each item that participants think a graduate
should be equipped with. The descriptive statistics of each ICT tool is summarized in Table 5.2.
According to Table 5.2, the higher means (>4) and the value that occurs most often (modes =5)
belong to Word processing, Spreadsheets, Presentation, E-mail, Internet search engines and
online applications (banking, bill paying etc.) indicating that the majority of the respondents
ranked those tools as very important for fresh graduates. Statistical significance of the mean
differences was tested employing the Friedman test. The Chi-square value was 242.939 and the
p-value was 0.000 (<0.05) verifying that the identified mean differences are significant. The
highest mean ranks of the Friedman test were for Word processing, Spreadsheets, Presentation,
E-mail, Internet search engines and online applications (banking, bill paying etc.).
Results revealed that without a significant difference between the groups ‘university community’
and the ‘employers’, the majority of the respondents believe that fresh graduates should be
equipped with at least Word processing, Spreadsheets, Presentation, E-mail, Internet search
engines and online applications (banking, bill paying etc.) skills in common.
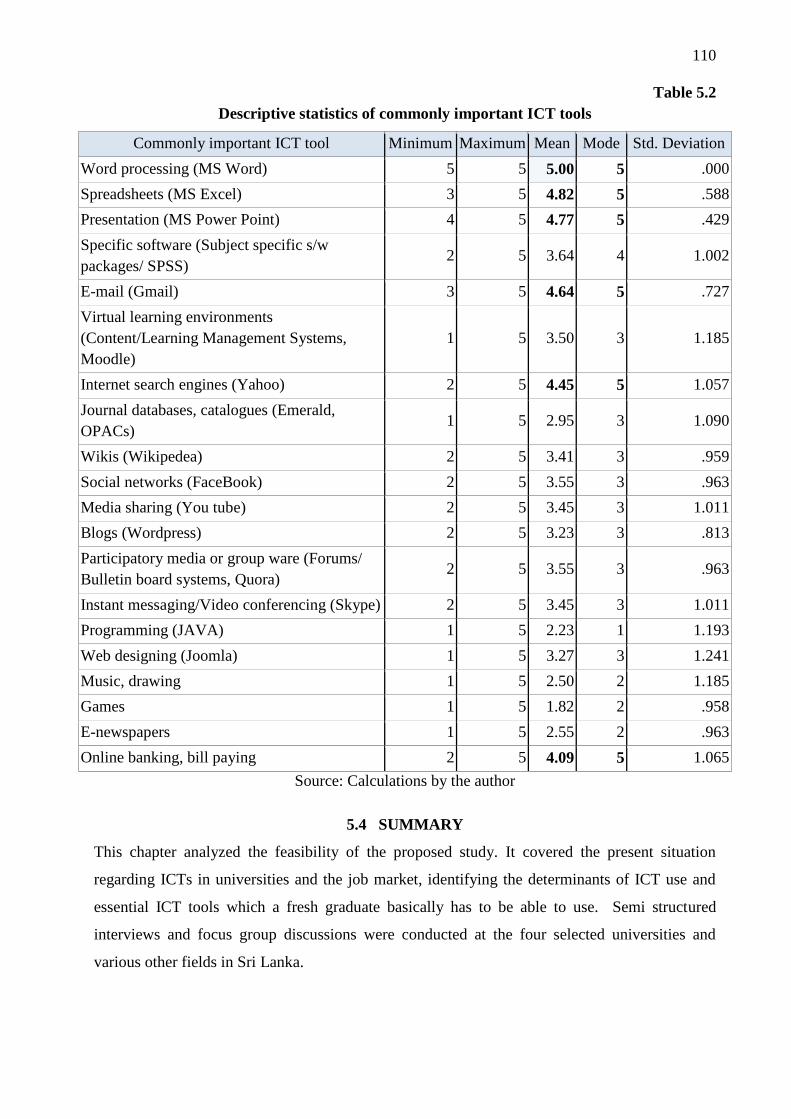
110
Table 5.2
Descriptive statistics of commonly important ICT tools
Commonly important ICT tool Minimum Maximum Mean Mode Std. Deviation
Word processing (MS Word) 5 5 5.00 5 .000
Spreadsheets (MS Excel) 3 5 4.82 5 .588
Presentation (MS Power Point) 4 5 4.77 5 .429
Specific software (Subject specific s/w
packages/ SPSS) 2 5 3.64 4 1.002
E-mail (Gmail) 3 5 4.64 5 .727
Virtual learning environments
(Content/Learning Management Systems,
Moodle)
1 5 3.50 3 1.185
Internet search engines (Yahoo) 2 5 4.45 5 1.057
Journal databases, catalogues (Emerald,
OPACs) 1 5 2.95 3 1.090
Wikis (Wikipedea) 2 5 3.41 3 .959
Social networks (FaceBook) 2 5 3.55 3 .963
Media sharing (You tube) 2 5 3.45 3 1.011
Blogs (Wordpress) 2 5 3.23 3 .813
Participatory media or group ware (Forums/
Bulletin board systems, Quora) 2 5 3.55 3 .963
Instant messaging/Video conferencing (Skype) 2 5 3.45 3 1.011
Programming (JAVA) 1 5 2.23 1 1.193
Web designing (Joomla) 1 5 3.27 3 1.241
Music, drawing 1 5 2.50 2 1.185
Games 1 5 1.82 2 .958
E-newspapers 1 5 2.55 2 .963
Online banking, bill paying 2 5 4.09 5 1.065
Source: Calculations by the author
5.4 SUMMARY
This chapter analyzed the feasibility of the proposed study. It covered the present situation
regarding ICTs in universities and the job market, identifying the determinants of ICT use and
essential ICT tools which a fresh graduate basically has to be able to use. Semi structured
interviews and focus group discussions were conducted at the four selected universities and
various other fields in Sri Lanka.
111
Perceptions of the interviewees revealed that the basic ICT is an essential component for today’s
job market and that employers believe that a graduate can easily capture the demand by
him/herself for their position with advanced ICT skills. Universities were making efforts to make
graduates ICT literate and a majority of the students have identified the necessity of ICTs for the
job market demand. These facts support the feasibility of the current study. It was found that a
majority of the respondents believe that fresh graduates should be equipped with at least Word
processing, Spreadsheets, Presentation, E-mail, Internet search engines and online applications
(banking, bill paying etc.) skills in common.
Results further revealed that the key determinants identified in the literature review are well
suited to the current pattern of using ICTs in Sri Lankan universities. Further, the interviewees
disclosed the existence of more factors which predict ICT use and acceptance other than the
main determinants identified. Hence, the moderating factors were also matched with the
proposed factors and it revealed the proposed model has lent itself as relevant for the presently
available ICT environments at universities.
Finally, it was revealed that the complete utilization of ICTs has not taken place at universities
by the students and that therefore there exists a gap between the input and output with respect to
ICTs and the current study is still feasible for the prevailing situation.
112
CHAPTER 6
MAIN STUDY-PRELIMINARY DATA ANALYSIS AND
FINDINGS
6.1 INTRODUCTION
Chapter Five analyzed the exploratory part of the study which showed that the study was feasible
in the present Sri Lankan context. It also evaluated the determinants on ICT use and most
important ICT tools for undergraduates and how skills in using these tools are necessary for the
job market. This chapter presents the preliminary data analysis of the main study. The reliability
and the validity of data were measured by testing the Cronbach’s alpha together with inter-item
correlation and convergent validity of the constructs. The descriptive analysis of responses and
respondents, cultural aspects of the sample, background of ICT use and their relationships with
demographic factors, types of ICT tools used by the students and the intention to use, extent to
which students use ICTs, how to motivate them to make full use of ICTs and significant
differences of ICT use behavior according to demographic factors were achieved using
descriptive statistical techniques and Chi-square test. Further the additional comments on current
use and future acceptance of ICTs were also analyzed. Therefore, the results of this preliminary
data analysis would fulfill the following four objectives of the study;
1. To assess what types of ICTs are used by university students in Sri Lanka
2. To assess the extent to which Sri Lankan university students use and intend to use ICTs
3. To identify socio-demographic factors that may influence ICT use and acceptance by
university students.
4. To investigate how university students are motivated to improve the use of ICTs
6.2 RELIABILITY AND VALIDITY ANALYSIS
Internal consistency reliabilities measured based on Cronbach’s alphas were considered to be
good (greater than 0.80) and only a few were acceptable (in 0.7 range) as presented in Table 6.1.
Quite high values of reliability indicate that the items in each set (concept) are positively
correlated with one another which mean that the questionnaire items in each independent
variable show accuracy in measurement in the main survey.
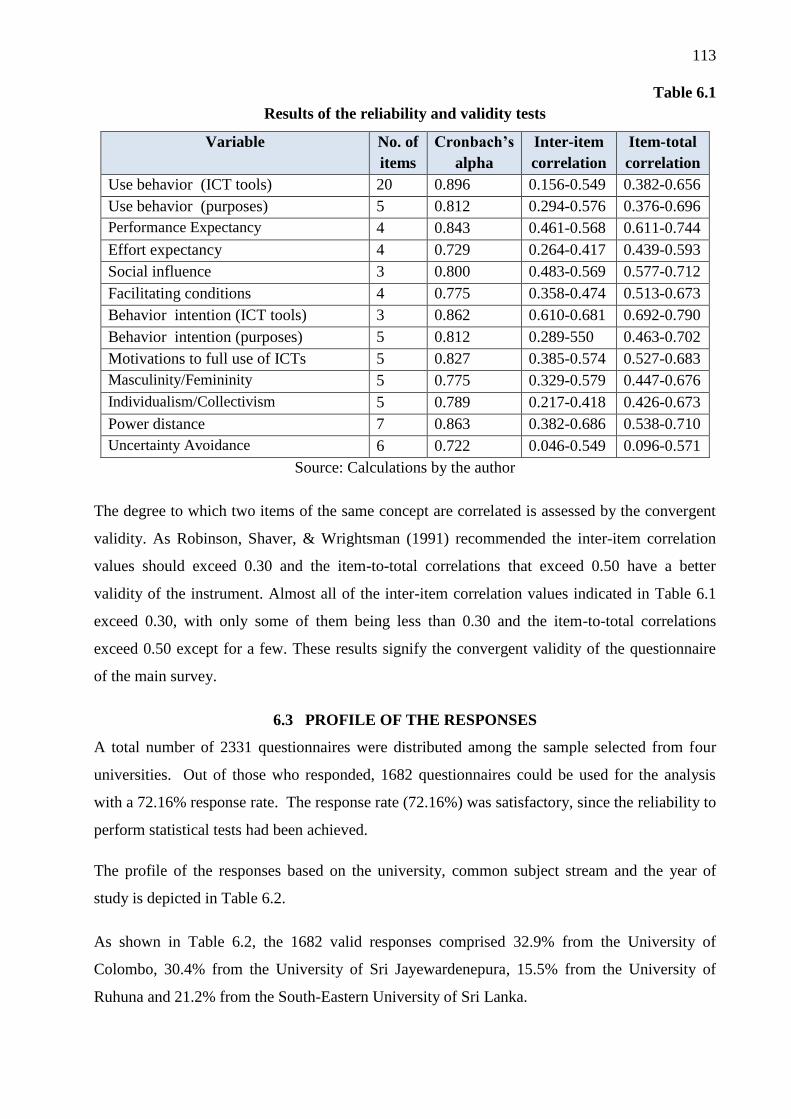
113
Table 6.1
Results of the reliability and validity tests
Variable No. of
items
Cronbach’s
alpha
Inter-item
correlation
Item-total
correlation
Use behavior (ICT tools) 20 0.896 0.156-0.549 0.382-0.656
Use behavior (purposes) 5 0.812 0.294-0.576 0.376-0.696
Performance Expectancy 4 0.843 0.461-0.568 0.611-0.744
Effort expectancy 4 0.729 0.264-0.417 0.439-0.593
Social influence 3 0.800 0.483-0.569 0.577-0.712
Facilitating conditions 4 0.775 0.358-0.474 0.513-0.673
Behavior intention (ICT tools) 3 0.862 0.610-0.681 0.692-0.790
Behavior intention (purposes) 5 0.812 0.289-550 0.463-0.702
Motivations to full use of ICTs 5 0.827 0.385-0.574 0.527-0.683
Masculinity/Femininity 5 0.775 0.329-0.579 0.447-0.676
Individualism/Collectivism 5 0.789 0.217-0.418 0.426-0.673
Power distance 7 0.863 0.382-0.686 0.538-0.710
Uncertainty Avoidance 6 0.722 0.046-0.549 0.096-0.571
Source: Calculations by the author
The degree to which two items of the same concept are correlated is assessed by the convergent
validity. As Robinson, Shaver, & Wrightsman (1991) recommended the inter-item correlation
values should exceed 0.30 and the item-to-total correlations that exceed 0.50 have a better
validity of the instrument. Almost all of the inter-item correlation values indicated in Table 6.1
exceed 0.30, with only some of them being less than 0.30 and the item-to-total correlations
exceed 0.50 except for a few. These results signify the convergent validity of the questionnaire
of the main survey.
6.3 PROFILE OF THE RESPONSES
A total number of 2331 questionnaires were distributed among the sample selected from four
universities. Out of those who responded, 1682 questionnaires could be used for the analysis
with a 72.16% response rate. The response rate (72.16%) was satisfactory, since the reliability to
perform statistical tests had been achieved.
The profile of the responses based on the university, common subject stream and the year of
study is depicted in Table 6.2.
As shown in Table 6.2, the 1682 valid responses comprised 32.9% from the University of
Colombo, 30.4% from the University of Sri Jayewardenepura, 15.5% from the University of
Ruhuna and 21.2% from the South-Eastern University of Sri Lanka.
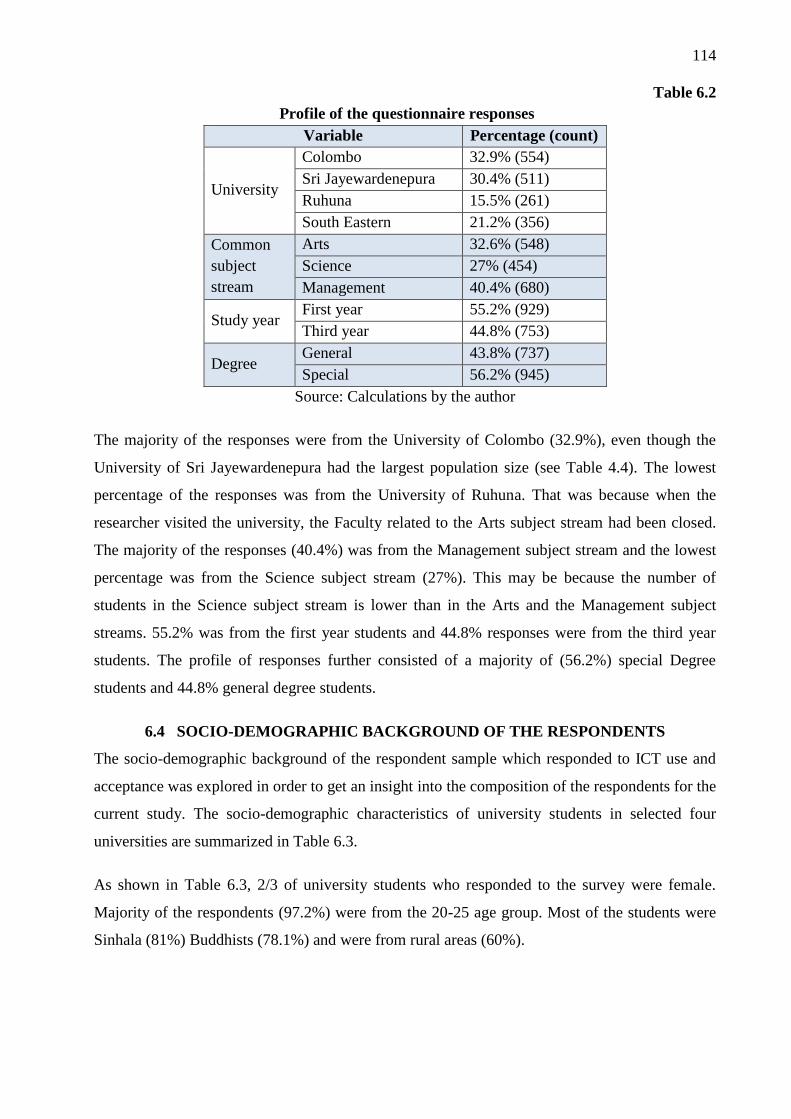
114
Table 6.2
Profile of the questionnaire responses
Variable Percentage (count)
University
Colombo 32.9% (554)
Sri Jayewardenepura 30.4% (511)
Ruhuna 15.5% (261)
South Eastern 21.2% (356)
Common
subject
stream
Arts 32.6% (548)
Science 27% (454)
Management 40.4% (680)
Study year First year 55.2% (929)
Third year 44.8% (753)
Degree General 43.8% (737)
Special 56.2% (945)
Source: Calculations by the author
The majority of the responses were from the University of Colombo (32.9%), even though the
University of Sri Jayewardenepura had the largest population size (see Table 4.4). The lowest
percentage of the responses was from the University of Ruhuna. That was because when the
researcher visited the university, the Faculty related to the Arts subject stream had been closed.
The majority of the responses (40.4%) was from the Management subject stream and the lowest
percentage was from the Science subject stream (27%). This may be because the number of
students in the Science subject stream is lower than in the Arts and the Management subject
streams. 55.2% was from the first year students and 44.8% responses were from the third year
students. The profile of responses further consisted of a majority of (56.2%) special Degree
students and 44.8% general degree students.
6.4 SOCIO-DEMOGRAPHIC BACKGROUND OF THE RESPONDENTS
The socio-demographic background of the respondent sample which responded to ICT use and
acceptance was explored in order to get an insight into the composition of the respondents for the
current study. The socio-demographic characteristics of university students in selected four
universities are summarized in Table 6.3.
As shown in Table 6.3, 2/3 of university students who responded to the survey were female.
Majority of the respondents (97.2%) were from the 20-25 age group. Most of the students were
Sinhala (81%) Buddhists (78.1%) and were from rural areas (60%).
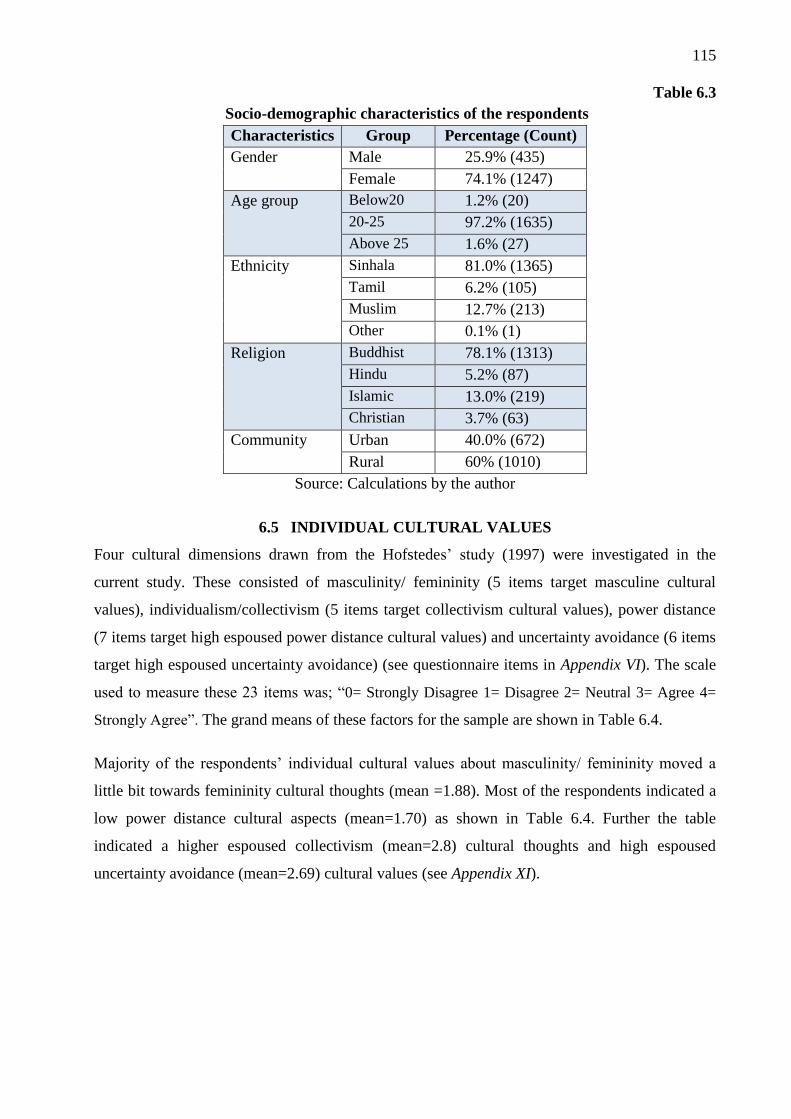
115
Table 6.3
Socio-demographic characteristics of the respondents
Characteristics Group Percentage (Count)
Gender Male 25.9% (435)
Female 74.1% (1247)
Age group Below20 1.2% (20)
20-25 97.2% (1635)
Above 25 1.6% (27)
Ethnicity Sinhala 81.0% (1365)
Tamil 6.2% (105)
Muslim 12.7% (213)
Other 0.1% (1)
Religion Buddhist 78.1% (1313)
Hindu 5.2% (87)
Islamic 13.0% (219)
Christian 3.7% (63)
Community Urban 40.0% (672)
Rural 60% (1010)
Source: Calculations by the author
6.5 INDIVIDUAL CULTURAL VALUES
Four cultural dimensions drawn from the Hofstedes’ study (1997) were investigated in the
current study. These consisted of masculinity/ femininity (5 items target masculine cultural
values), individualism/collectivism (5 items target collectivism cultural values), power distance
(7 items target high espoused power distance cultural values) and uncertainty avoidance (6 items
target high espoused uncertainty avoidance) (see questionnaire items in Appendix VI). The scale
used to measure these 23 items was; “0= Strongly Disagree 1= Disagree 2= Neutral 3= Agree 4=
Strongly Agree”. The grand means of these factors for the sample are shown in Table 6.4.
Majority of the respondents’ individual cultural values about masculinity/ femininity moved a
little bit towards femininity cultural thoughts (mean =1.88). Most of the respondents indicated a
low power distance cultural aspects (mean=1.70) as shown in Table 6.4. Further the table
indicated a higher espoused collectivism (mean=2.8) cultural thoughts and high espoused
uncertainty avoidance (mean=2.69) cultural values (see Appendix XI).
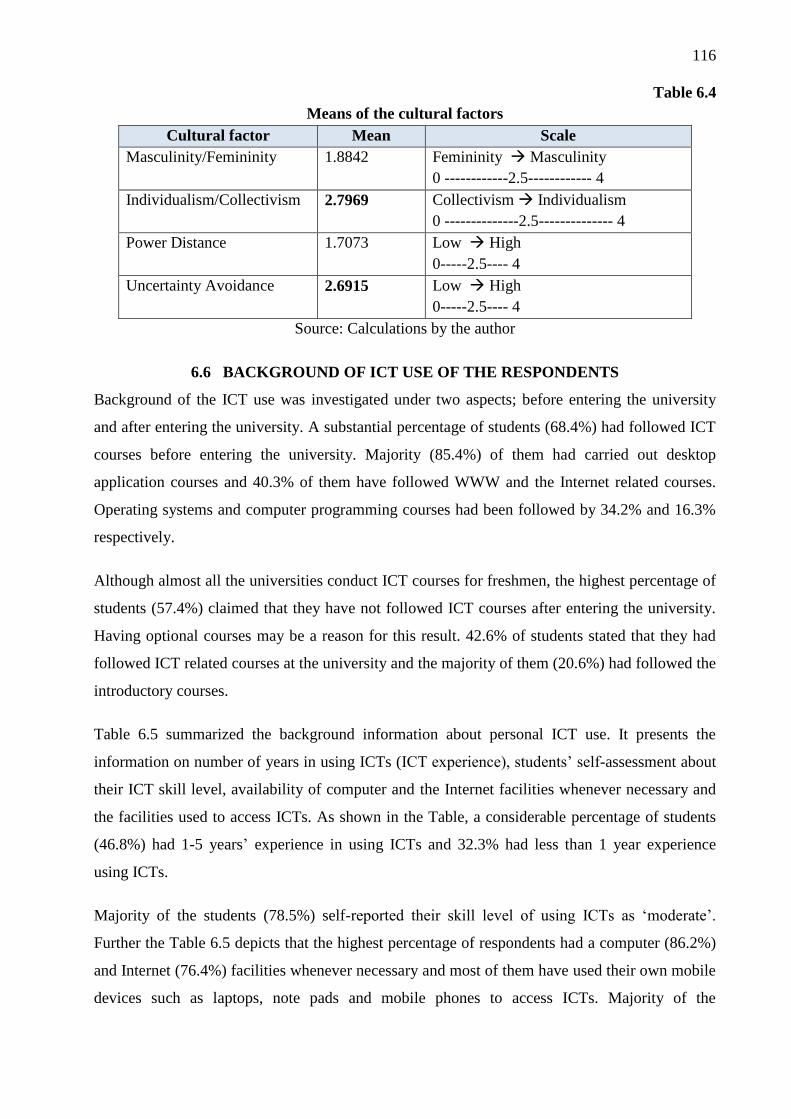
116
Table 6.4
Means of the cultural factors
Cultural factor Mean Scale
Masculinity/Femininity 1.8842 Femininity Masculinity
0 ------------2.5------------ 4
Individualism/Collectivism 2.7969 Collectivism Individualism
0 --------------2.5-------------- 4
Power Distance 1.7073 Low High
0-----2.5---- 4
Uncertainty Avoidance 2.6915 Low High
0-----2.5---- 4
Source: Calculations by the author
6.6 BACKGROUND OF ICT USE OF THE RESPONDENTS
Background of the ICT use was investigated under two aspects; before entering the university
and after entering the university. A substantial percentage of students (68.4%) had followed ICT
courses before entering the university. Majority (85.4%) of them had carried out desktop
application courses and 40.3% of them have followed WWW and the Internet related courses.
Operating systems and computer programming courses had been followed by 34.2% and 16.3%
respectively.
Although almost all the universities conduct ICT courses for freshmen, the highest percentage of
students (57.4%) claimed that they have not followed ICT courses after entering the university.
Having optional courses may be a reason for this result. 42.6% of students stated that they had
followed ICT related courses at the university and the majority of them (20.6%) had followed the
introductory courses.
Table 6.5 summarized the background information about personal ICT use. It presents the
information on number of years in using ICTs (ICT experience), students’ self-assessment about
their ICT skill level, availability of computer and the Internet facilities whenever necessary and
the facilities used to access ICTs. As shown in the Table, a considerable percentage of students
(46.8%) had 1-5 years’ experience in using ICTs and 32.3% had less than 1 year experience
using ICTs.
Majority of the students (78.5%) self-reported their skill level of using ICTs as ‘moderate’.
Further the Table 6.5 depicts that the highest percentage of respondents had a computer (86.2%)
and Internet (76.4%) facilities whenever necessary and most of them have used their own mobile
devices such as laptops, note pads and mobile phones to access ICTs. Majority of the
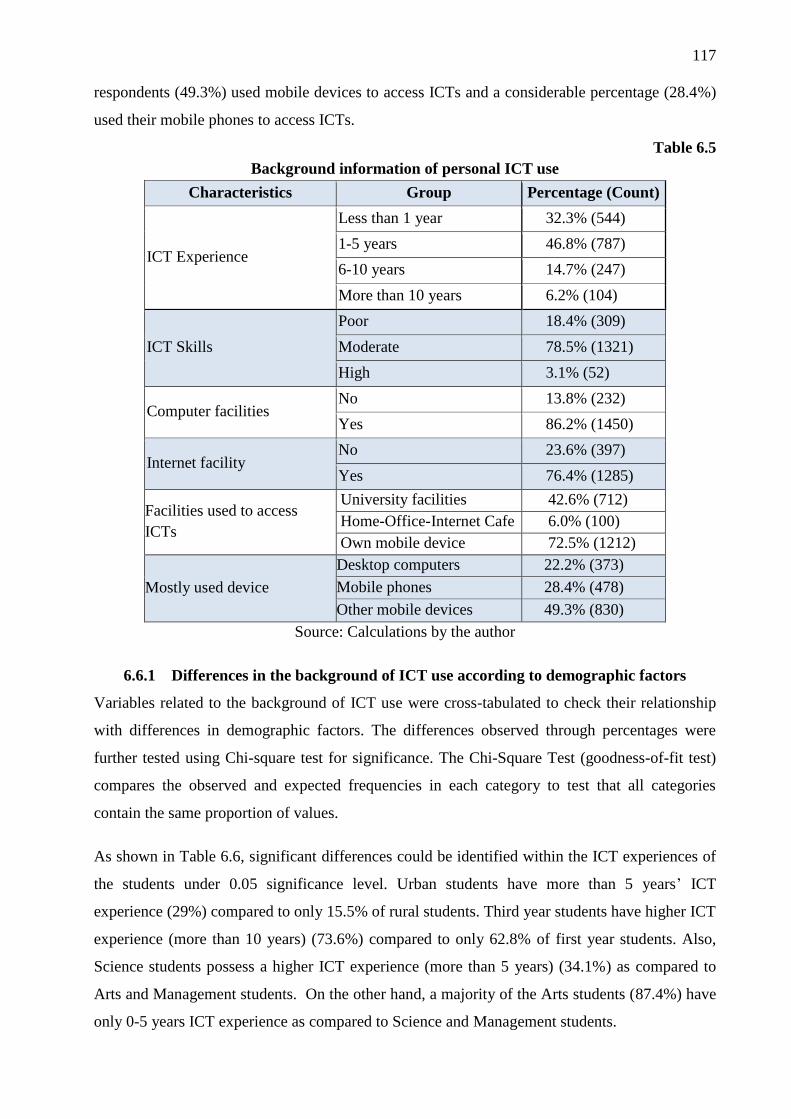
117
respondents (49.3%) used mobile devices to access ICTs and a considerable percentage (28.4%)
used their mobile phones to access ICTs.
Table 6.5
Background information of personal ICT use
Characteristics Group Percentage (Count)
ICT Experience
Less than 1 year 32.3% (544)
1-5 years 46.8% (787)
6-10 years 14.7% (247)
More than 10 years 6.2% (104)
ICT Skills
Poor 18.4% (309)
Moderate 78.5% (1321)
High 3.1% (52)
Computer facilities No 13.8% (232)
Yes 86.2% (1450)
Internet facility No 23.6% (397)
Yes 76.4% (1285)
Facilities used to access
ICTs
University facilities 42.6% (712)
Home-Office-Internet Cafe 6.0% (100)
Own mobile device 72.5% (1212)
Mostly used device
Desktop computers 22.2% (373)
Mobile phones 28.4% (478)
Other mobile devices 49.3% (830)
Source: Calculations by the author
6.6.1 Differences in the background of ICT use according to demographic factors
Variables related to the background of ICT use were cross-tabulated to check their relationship
with differences in demographic factors. The differences observed through percentages were
further tested using Chi-square test for significance. The Chi-Square Test (goodness-of-fit test)
compares the observed and expected frequencies in each category to test that all categories
contain the same proportion of values.
As shown in Table 6.6, significant differences could be identified within the ICT experiences of
the students under 0.05 significance level. Urban students have more than 5 years’ ICT
experience (29%) compared to only 15.5% of rural students. Third year students have higher ICT
experience (more than 10 years) (73.6%) compared to only 62.8% of first year students. Also,
Science students possess a higher ICT experience (more than 5 years) (34.1%) as compared to
Arts and Management students. On the other hand, a majority of the Arts students (87.4%) have
only 0-5 years ICT experience as compared to Science and Management students.
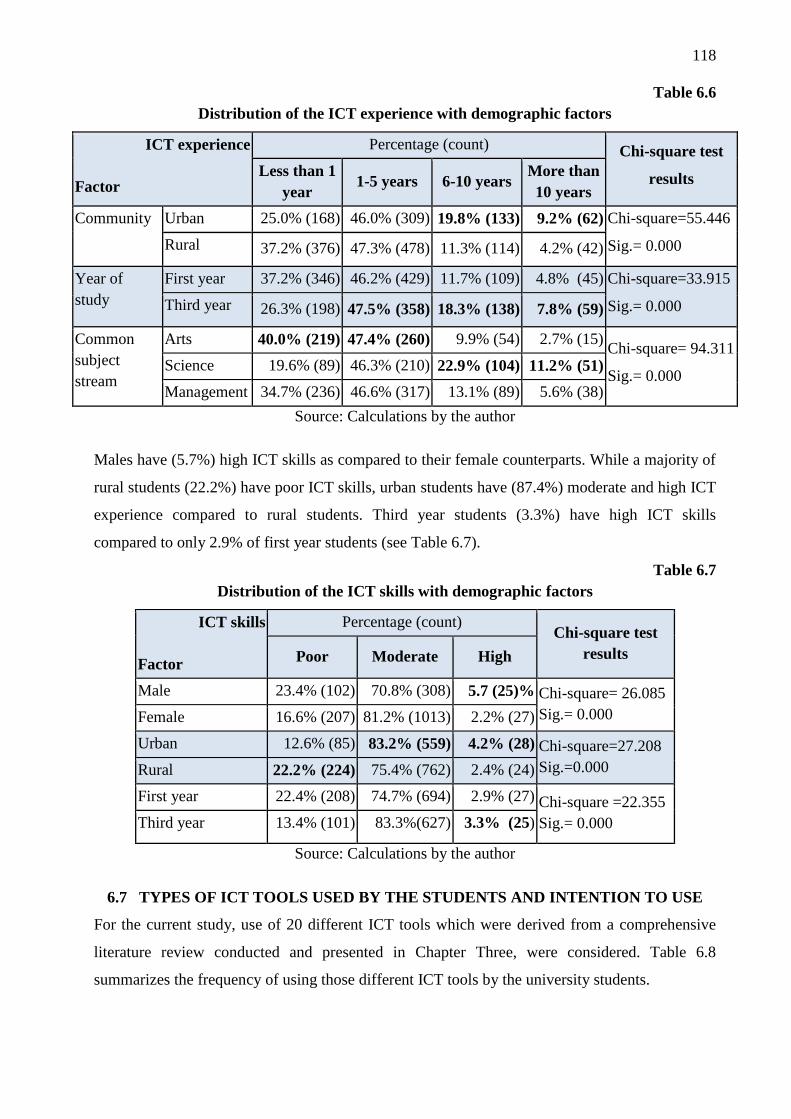
118
Table 6.6
Distribution of the ICT experience with demographic factors
ICT experience
Factor
Percentage (count) Chi-square test
results Less than 1
year 1-5 years 6-10 years
More than
10 years
Community Urban 25.0% (168) 46.0% (309) 19.8% (133) 9.2% (62) Chi-square=55.446
Sig.= 0.000 Rural 37.2% (376) 47.3% (478) 11.3% (114) 4.2% (42)
Year of
study
First year 37.2% (346) 46.2% (429) 11.7% (109) 4.8% (45) Chi-square=33.915
Sig.= 0.000 Third year 26.3% (198) 47.5% (358) 18.3% (138) 7.8% (59)
Common
subject
stream
Arts 40.0% (219) 47.4% (260) 9.9% (54) 2.7% (15) Chi-square= 94.311
Sig.= 0.000 Science 19.6% (89) 46.3% (210) 22.9% (104) 11.2% (51)
Management 34.7% (236) 46.6% (317) 13.1% (89) 5.6% (38)
Source: Calculations by the author
Males have (5.7%) high ICT skills as compared to their female counterparts. While a majority of
rural students (22.2%) have poor ICT skills, urban students have (87.4%) moderate and high ICT
experience compared to rural students. Third year students (3.3%) have high ICT skills
compared to only 2.9% of first year students (see Table 6.7).
Table 6.7
Distribution of the ICT skills with demographic factors
ICT skills
Factor
Percentage (count) Chi-square test
results Poor Moderate High
Male 23.4% (102) 70.8% (308) 5.7 (25)% Chi-square= 26.085
Sig.= 0.000 Female 16.6% (207) 81.2% (1013) 2.2% (27)
Urban 12.6% (85) 83.2% (559) 4.2% (28) Chi-square=27.208
Sig.=0.000 Rural 22.2% (224) 75.4% (762) 2.4% (24)
First year 22.4% (208) 74.7% (694) 2.9% (27) Chi-square =22.355
Sig.= 0.000 Third year 13.4% (101) 83.3%(627) 3.3% (25)
Source: Calculations by the author
6.7 TYPES OF ICT TOOLS USED BY THE STUDENTS AND INTENTION TO USE
For the current study, use of 20 different ICT tools which were derived from a comprehensive
literature review conducted and presented in Chapter Three, were considered. Table 6.8
summarizes the frequency of using those different ICT tools by the university students.
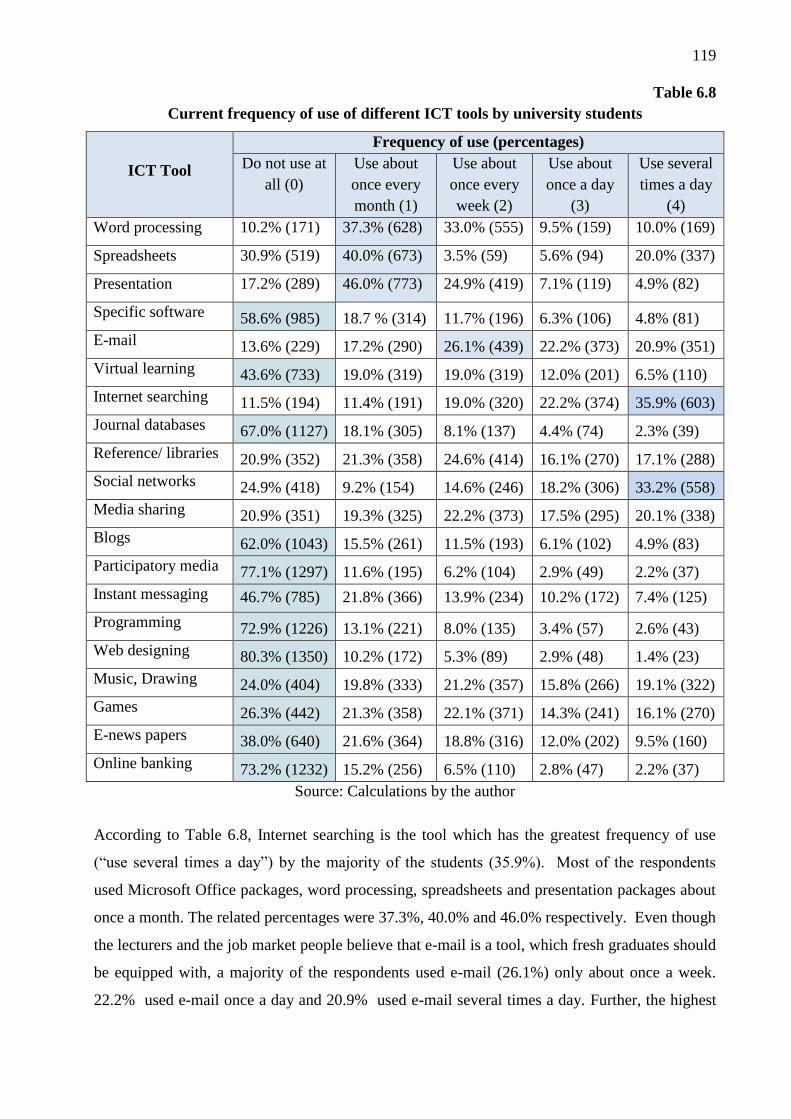
119
Table 6.8
Current frequency of use of different ICT tools by university students
ICT Tool
Frequency of use (percentages)
Do not use at
all (0)
Use about
once every
month (1)
Use about
once every
week (2)
Use about
once a day
(3)
Use several
times a day
(4)
Word processing 10.2% (171) 37.3% (628) 33.0% (555) 9.5% (159) 10.0% (169)
Spreadsheets 30.9% (519) 40.0% (673) 3.5% (59) 5.6% (94) 20.0% (337)
Presentation 17.2% (289) 46.0% (773) 24.9% (419) 7.1% (119) 4.9% (82)
Specific software 58.6% (985) 18.7 % (314) 11.7% (196) 6.3% (106) 4.8% (81)
E-mail 13.6% (229) 17.2% (290) 26.1% (439) 22.2% (373) 20.9% (351)
Virtual learning 43.6% (733) 19.0% (319) 19.0% (319) 12.0% (201) 6.5% (110)
Internet searching 11.5% (194) 11.4% (191) 19.0% (320) 22.2% (374) 35.9% (603)
Journal databases 67.0% (1127) 18.1% (305) 8.1% (137) 4.4% (74) 2.3% (39)
Reference/ libraries 20.9% (352) 21.3% (358) 24.6% (414) 16.1% (270) 17.1% (288)
Social networks 24.9% (418) 9.2% (154) 14.6% (246) 18.2% (306) 33.2% (558)
Media sharing 20.9% (351) 19.3% (325) 22.2% (373) 17.5% (295) 20.1% (338)
Blogs 62.0% (1043) 15.5% (261) 11.5% (193) 6.1% (102) 4.9% (83)
Participatory media 77.1% (1297) 11.6% (195) 6.2% (104) 2.9% (49) 2.2% (37)
Instant messaging 46.7% (785) 21.8% (366) 13.9% (234) 10.2% (172) 7.4% (125)
Programming 72.9% (1226) 13.1% (221) 8.0% (135) 3.4% (57) 2.6% (43)
Web designing 80.3% (1350) 10.2% (172) 5.3% (89) 2.9% (48) 1.4% (23)
Music, Drawing 24.0% (404) 19.8% (333) 21.2% (357) 15.8% (266) 19.1% (322)
Games 26.3% (442) 21.3% (358) 22.1% (371) 14.3% (241) 16.1% (270)
E-news papers 38.0% (640) 21.6% (364) 18.8% (316) 12.0% (202) 9.5% (160)
Online banking 73.2% (1232) 15.2% (256) 6.5% (110) 2.8% (47) 2.2% (37)
Source: Calculations by the author
According to Table 6.8, Internet searching is the tool which has the greatest frequency of use
(“use several times a day”) by the majority of the students (35.9%). Most of the respondents
used Microsoft Office packages, word processing, spreadsheets and presentation packages about
once a month. The related percentages were 37.3%, 40.0% and 46.0% respectively. Even though
the lecturers and the job market people believe that e-mail is a tool, which fresh graduates should
be equipped with, a majority of the respondents used e-mail (26.1%) only about once a week.
22.2% used e-mail once a day and 20.9% used e-mail several times a day. Further, the highest
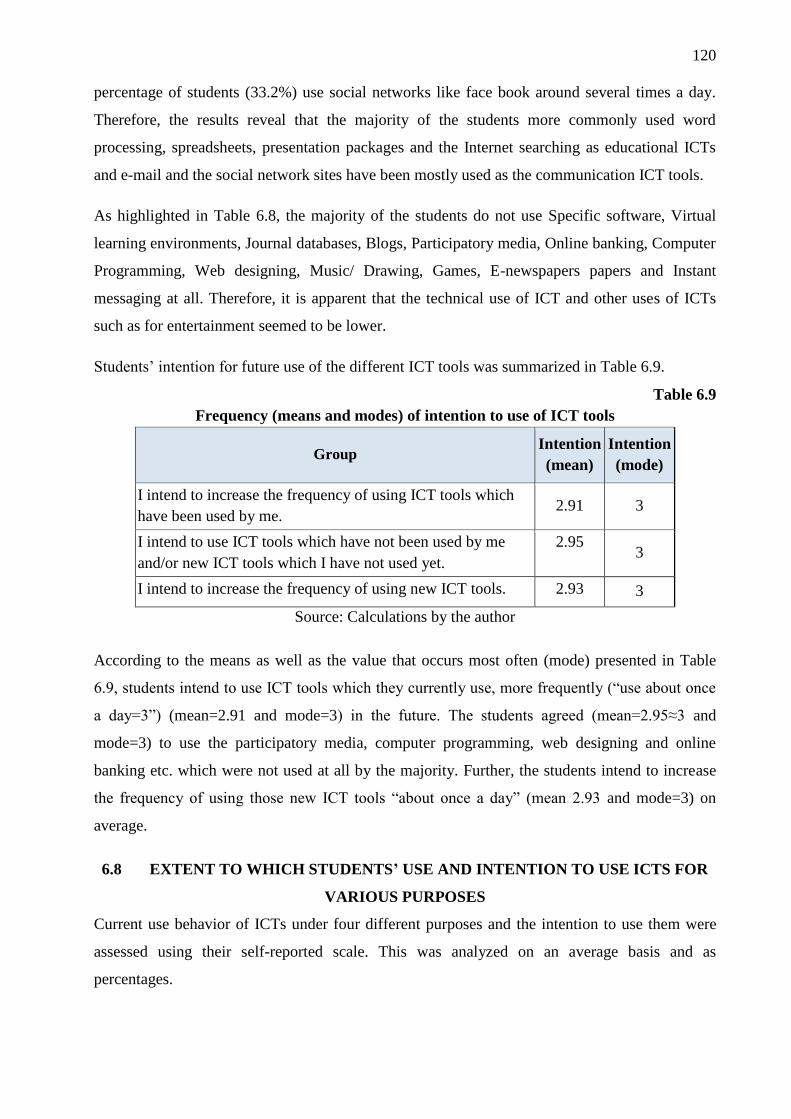
120
percentage of students (33.2%) use social networks like face book around several times a day.
Therefore, the results reveal that the majority of the students more commonly used word
processing, spreadsheets, presentation packages and the Internet searching as educational ICTs
and e-mail and the social network sites have been mostly used as the communication ICT tools.
As highlighted in Table 6.8, the majority of the students do not use Specific software, Virtual
learning environments, Journal databases, Blogs, Participatory media, Online banking, Computer
Programming, Web designing, Music/ Drawing, Games, E-newspapers papers and Instant
messaging at all. Therefore, it is apparent that the technical use of ICT and other uses of ICTs
such as for entertainment seemed to be lower.
Students’ intention for future use of the different ICT tools was summarized in Table 6.9.
Table 6.9
Frequency (means and modes) of intention to use of ICT tools
Group Intention
(mean)
Intention
(mode)
I intend to increase the frequency of using ICT tools which
have been used by me. 2.91 3
I intend to use ICT tools which have not been used by me
and/or new ICT tools which I have not used yet.
2.95 3
I intend to increase the frequency of using new ICT tools. 2.93 3
Source: Calculations by the author
According to the means as well as the value that occurs most often (mode) presented in Table
6.9, students intend to use ICT tools which they currently use, more frequently (“use about once
a day=3”) (mean=2.91 and mode=3) in the future. The students agreed (mean=2.95≈3 and
mode=3) to use the participatory media, computer programming, web designing and online
banking etc. which were not used at all by the majority. Further, the students intend to increase
the frequency of using those new ICT tools “about once a day” (mean 2.93 and mode=3) on
average.
6.8 EXTENT TO WHICH STUDENTS’ USE AND INTENTION TO USE ICTS FOR
VARIOUS PURPOSES
Current use behavior of ICTs under four different purposes and the intention to use them were
assessed using their self-reported scale. This was analyzed on an average basis and as
percentages.
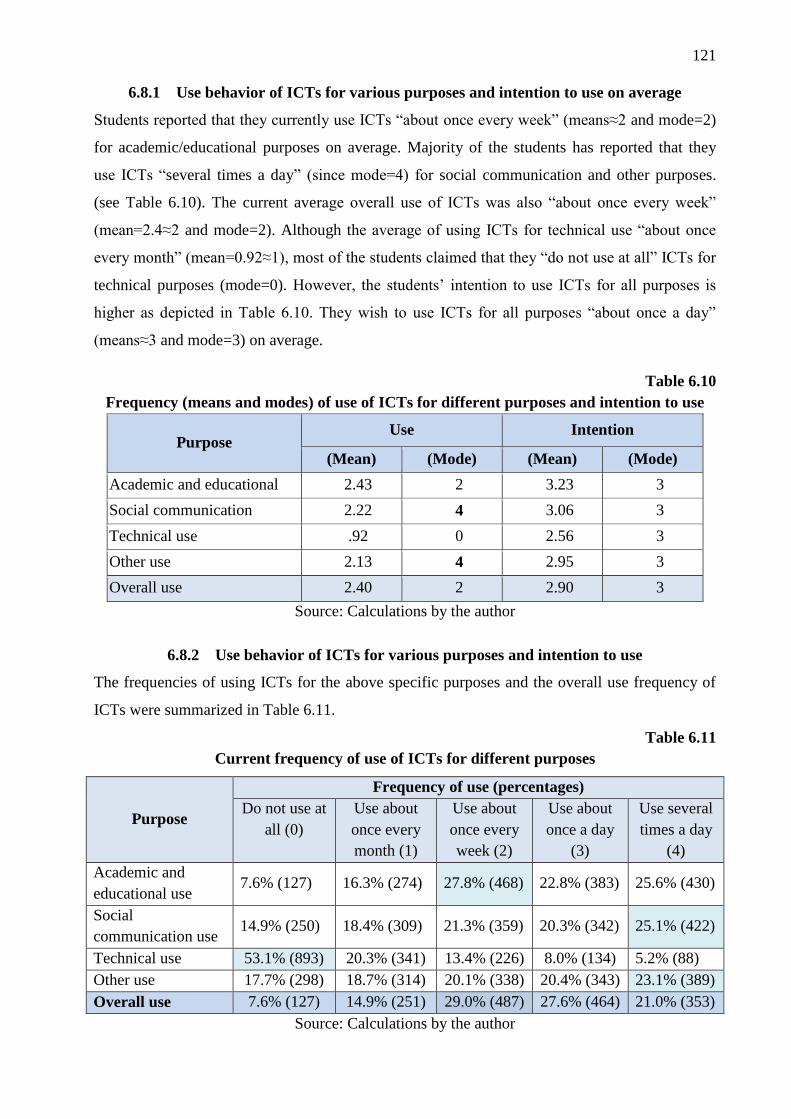
121
6.8.1 Use behavior of ICTs for various purposes and intention to use on average
Students reported that they currently use ICTs “about once every week” (means≈2 and mode=2)
for academic/educational purposes on average. Majority of the students has reported that they
use ICTs “several times a day” (since mode=4) for social communication and other purposes.
(see Table 6.10). The current average overall use of ICTs was also “about once every week”
(mean=2.4≈2 and mode=2). Although the average of using ICTs for technical use “about once
every month” (mean=0.92≈1), most of the students claimed that they “do not use at all” ICTs for
technical purposes (mode=0). However, the students’ intention to use ICTs for all purposes is
higher as depicted in Table 6.10. They wish to use ICTs for all purposes “about once a day”
(means≈3 and mode=3) on average.
Table 6.10
Frequency (means and modes) of use of ICTs for different purposes and intention to use
Purpose Use Intention
(Mean) (Mode) (Mean) (Mode)
Academic and educational 2.43 2 3.23 3
Social communication 2.22 4 3.06 3
Technical use .92 0 2.56 3
Other use 2.13 4 2.95 3
Overall use 2.40 2 2.90 3
Source: Calculations by the author
6.8.2 Use behavior of ICTs for various purposes and intention to use
The frequencies of using ICTs for the above specific purposes and the overall use frequency of
ICTs were summarized in Table 6.11.
Table 6.11
Current frequency of use of ICTs for different purposes
Purpose
Frequency of use (percentages)
Do not use at
all (0)
Use about
once every
month (1)
Use about
once every
week (2)
Use about
once a day
(3)
Use several
times a day
(4)
Academic and
educational use 7.6% (127) 16.3% (274) 27.8% (468) 22.8% (383) 25.6% (430)
Social
communication use 14.9% (250) 18.4% (309) 21.3% (359) 20.3% (342) 25.1% (422)
Technical use 53.1% (893) 20.3% (341) 13.4% (226) 8.0% (134) 5.2% (88)
Other use 17.7% (298) 18.7% (314) 20.1% (338) 20.4% (343) 23.1% (389)
Overall use 7.6% (127) 14.9% (251) 29.0% (487) 27.6% (464) 21.0% (353)
Source: Calculations by the author
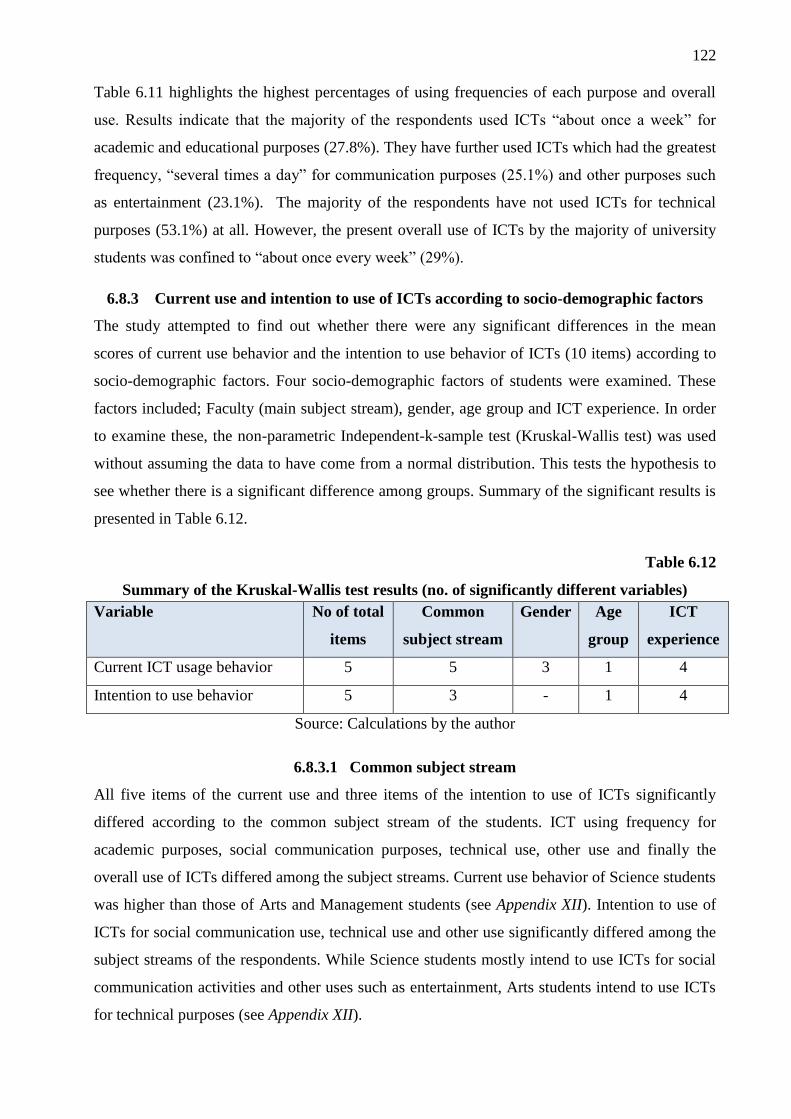
122
Table 6.11 highlights the highest percentages of using frequencies of each purpose and overall
use. Results indicate that the majority of the respondents used ICTs “about once a week” for
academic and educational purposes (27.8%). They have further used ICTs which had the greatest
frequency, “several times a day” for communication purposes (25.1%) and other purposes such
as entertainment (23.1%). The majority of the respondents have not used ICTs for technical
purposes (53.1%) at all. However, the present overall use of ICTs by the majority of university
students was confined to “about once every week” (29%).
6.8.3 Current use and intention to use of ICTs according to socio-demographic factors
The study attempted to find out whether there were any significant differences in the mean
scores of current use behavior and the intention to use behavior of ICTs (10 items) according to
socio-demographic factors. Four socio-demographic factors of students were examined. These
factors included; Faculty (main subject stream), gender, age group and ICT experience. In order
to examine these, the non-parametric Independent-k-sample test (Kruskal-Wallis test) was used
without assuming the data to have come from a normal distribution. This tests the hypothesis to
see whether there is a significant difference among groups. Summary of the significant results is
presented in Table 6.12.
Table 6.12
Summary of the Kruskal-Wallis test results (no. of significantly different variables)
Variable No of total
items
Common
subject stream
Gender Age
group
ICT
experience
Current ICT usage behavior 5 5 3 1 4
Intention to use behavior 5 3 - 1 4
Source: Calculations by the author
6.8.3.1 Common subject stream
All five items of the current use and three items of the intention to use of ICTs significantly
differed according to the common subject stream of the students. ICT using frequency for
academic purposes, social communication purposes, technical use, other use and finally the
overall use of ICTs differed among the subject streams. Current use behavior of Science students
was higher than those of Arts and Management students (see Appendix XII). Intention to use of
ICTs for social communication use, technical use and other use significantly differed among the
subject streams of the respondents. While Science students mostly intend to use ICTs for social
communication activities and other uses such as entertainment, Arts students intend to use ICTs
for technical purposes (see Appendix XII).
123
6.8.3.2 Gender
The significant differences in the mean scores of social communication use, technical use and
other use of ICTs of male respondents were higher than those of female students (see Appendix
XII).
6.8.3.3 Age
The Kruskall-Wallis test results indicated significant differences among age groups in current
use of ICTs for social communication purposes and the intention to use for technical purposes in
the future. Current use of ICTs for social communication activities was higher for older (above
25 years) students than for others. However, it was shown that the students from 20-25 age group
intend to use ICT for technical purposes more than the other groups (see Appendix XII).
6.8.3.4 ICT experience
Current use behavior of ICTs for academic/ educational use, social communication use, other use
overall use and intention to use ICTs for the same purposes significantly differed according to
the ICT experience of the respondents. While academic/ educational use was higher for the
students who have 6-10 years ICT experience, other three uses were higher for the more
experienced (more than 10 years) students than others. The intention to use ICTs for academic/
educational, social communication, other use and the overall use were higher for the longer
experienced (more than 10 years) students than those of others (see Appendix XII).
6.9 MOTIVATION TO MAKE FULL USE OF ICTS
Majority of students (43.1%) agreed that they still have not made full use of the ICTs, and
therefore intended to use ICTs more in all types of work in the future (mean=3.03 and mode=3)
(see Appendix XII). Percentages of the agreements of the motivation to make full use of ICTs are
summarized in Table 6.13.
As highlighted in Table 6.13, a majority of the students agree that they are motivated to make
full use of ICTs in the future. Secondly, a higher percentage of students strongly agreed with
motivation. The suggested motives were:
1. Availability of persons to help when in difficulties
2. Having updated trainings/ workshops/ courses regularly
3. Availability of satisfactory facilities
4. Changes of curriculum to ICT orientation in the future
5. Need to initiate university policy to be an e-University in the future
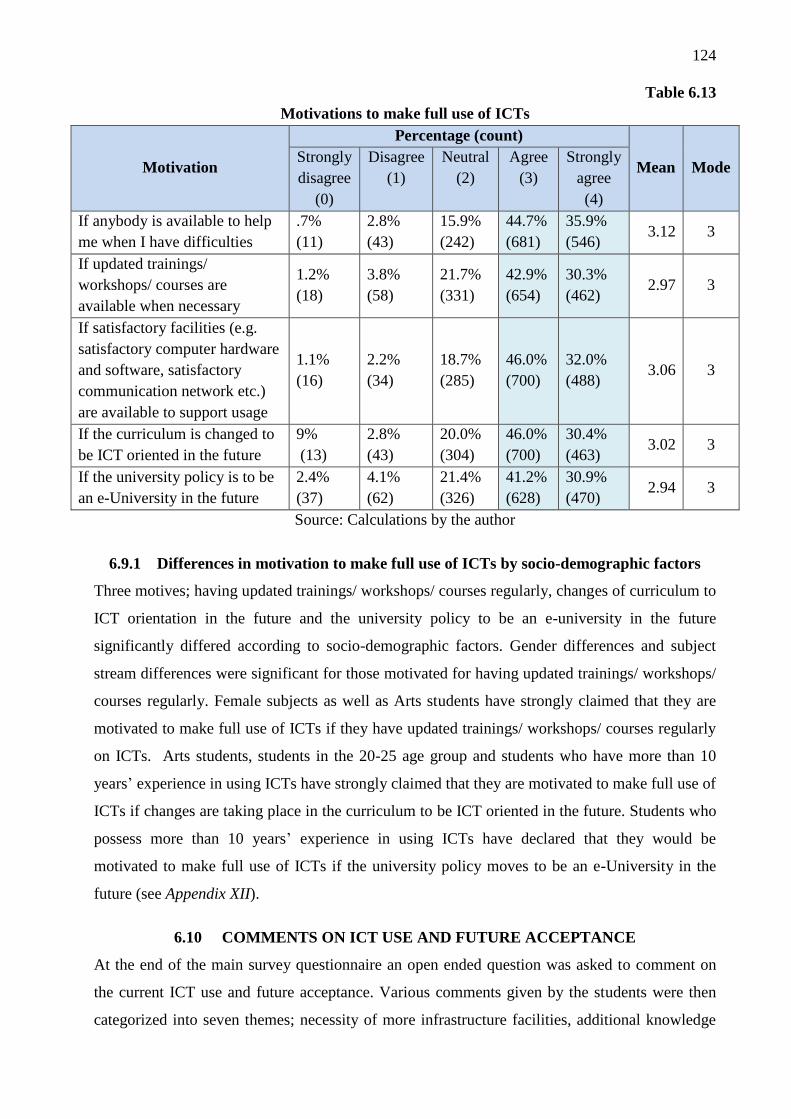
124
Table 6.13
Motivations to make full use of ICTs
Motivation
Percentage (count)
Mean Mode Strongly
disagree
(0)
Disagree
(1)
Neutral
(2)
Agree
(3)
Strongly
agree
(4)
If anybody is available to help
me when I have difficulties
.7%
(11)
2.8%
(43)
15.9%
(242)
44.7%
(681)
35.9%
(546) 3.12 3
If updated trainings/
workshops/ courses are
available when necessary
1.2%
(18)
3.8%
(58)
21.7%
(331)
42.9%
(654)
30.3%
(462) 2.97 3
If satisfactory facilities (e.g.
satisfactory computer hardware
and software, satisfactory
communication network etc.)
are available to support usage
1.1%
(16)
2.2%
(34)
18.7%
(285)
46.0%
(700)
32.0%
(488) 3.06 3
If the curriculum is changed to
be ICT oriented in the future
9%
(13)
2.8%
(43)
20.0%
(304)
46.0%
(700)
30.4%
(463) 3.02 3
If the university policy is to be
an e-University in the future
2.4%
(37)
4.1%
(62)
21.4%
(326)
41.2%
(628)
30.9%
(470) 2.94 3
Source: Calculations by the author
6.9.1 Differences in motivation to make full use of ICTs by socio-demographic factors
Three motives; having updated trainings/ workshops/ courses regularly, changes of curriculum to
ICT orientation in the future and the university policy to be an e-university in the future
significantly differed according to socio-demographic factors. Gender differences and subject
stream differences were significant for those motivated for having updated trainings/ workshops/
courses regularly. Female subjects as well as Arts students have strongly claimed that they are
motivated to make full use of ICTs if they have updated trainings/ workshops/ courses regularly
on ICTs. Arts students, students in the 20-25 age group and students who have more than 10
years’ experience in using ICTs have strongly claimed that they are motivated to make full use of
ICTs if changes are taking place in the curriculum to be ICT oriented in the future. Students who
possess more than 10 years’ experience in using ICTs have declared that they would be
motivated to make full use of ICTs if the university policy moves to be an e-University in the
future (see Appendix XII).
6.10 COMMENTS ON ICT USE AND FUTURE ACCEPTANCE
At the end of the main survey questionnaire an open ended question was asked to comment on
the current ICT use and future acceptance. Various comments given by the students were then
categorized into seven themes; necessity of more infrastructure facilities, additional knowledge
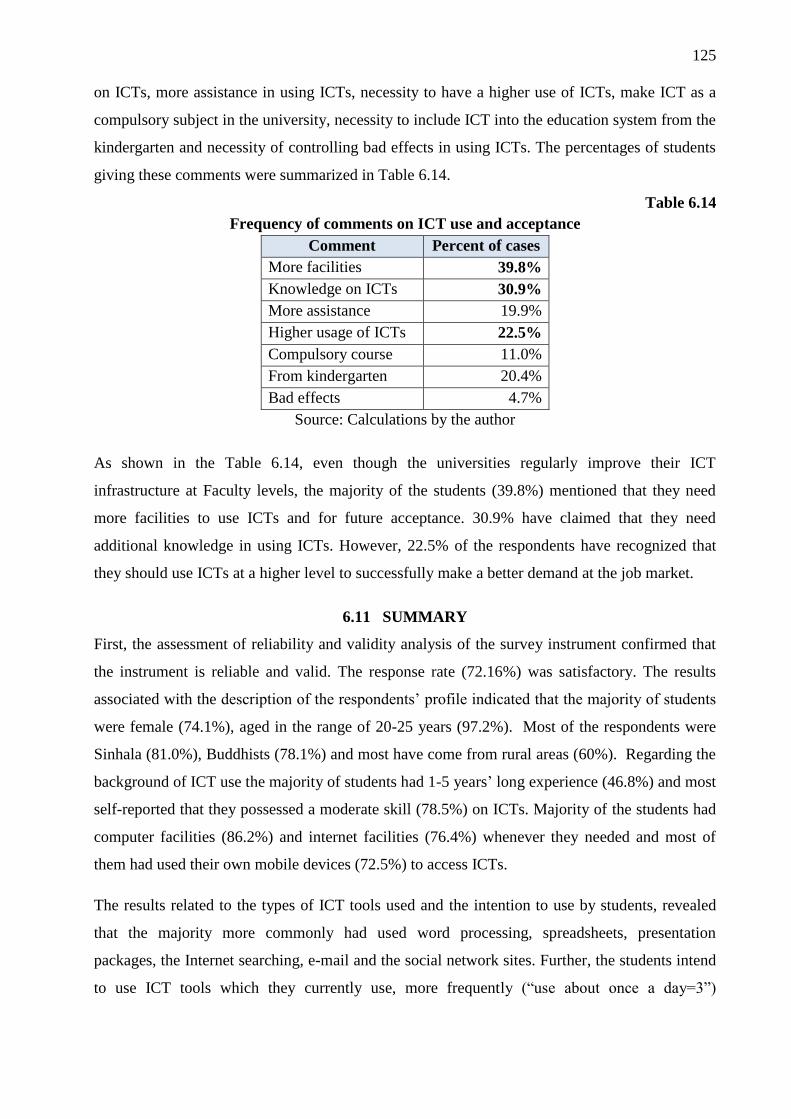
125
on ICTs, more assistance in using ICTs, necessity to have a higher use of ICTs, make ICT as a
compulsory subject in the university, necessity to include ICT into the education system from the
kindergarten and necessity of controlling bad effects in using ICTs. The percentages of students
giving these comments were summarized in Table 6.14.
Table 6.14
Frequency of comments on ICT use and acceptance
Comment Percent of cases
More facilities 39.8%
Knowledge on ICTs 30.9%
More assistance 19.9%
Higher usage of ICTs 22.5%
Compulsory course 11.0%
From kindergarten 20.4%
Bad effects 4.7%
Source: Calculations by the author
As shown in the Table 6.14, even though the universities regularly improve their ICT
infrastructure at Faculty levels, the majority of the students (39.8%) mentioned that they need
more facilities to use ICTs and for future acceptance. 30.9% have claimed that they need
additional knowledge in using ICTs. However, 22.5% of the respondents have recognized that
they should use ICTs at a higher level to successfully make a better demand at the job market.
6.11 SUMMARY
First, the assessment of reliability and validity analysis of the survey instrument confirmed that
the instrument is reliable and valid. The response rate (72.16%) was satisfactory. The results
associated with the description of the respondents’ profile indicated that the majority of students
were female (74.1%), aged in the range of 20-25 years (97.2%). Most of the respondents were
Sinhala (81.0%), Buddhists (78.1%) and most have come from rural areas (60%). Regarding the
background of ICT use the majority of students had 1-5 years’ long experience (46.8%) and most
self-reported that they possessed a moderate skill (78.5%) on ICTs. Majority of the students had
computer facilities (86.2%) and internet facilities (76.4%) whenever they needed and most of
them had used their own mobile devices (72.5%) to access ICTs.
The results related to the types of ICT tools used and the intention to use by students, revealed
that the majority more commonly had used word processing, spreadsheets, presentation
packages, the Internet searching, e-mail and the social network sites. Further, the students intend
to use ICT tools which they currently use, more frequently (“use about once a day=3”)
126
(mean=2.91 and mode=3) in the future. However, the students intended to increase the frequency
of using new ICT tools “about once a day” (mean 2.93 and mode=3) on average.
Results indicate that the majority of the respondents used ICTs “about once a week” for
academic and educational purposes (27.8%). They have further used ICTs “several times a day”
for communication purposes (25.1%) and other purposes such as entertainment (23.1%). The
majority of the respondents have not used ICTs for technical purposes (53.1%) at all. However,
the present overall use of ICTs by the majority of university students was confined to “about
once every week” (29%) and they intend to use ICTs for all purposes “about once a day”
(means≈3 and mode=3) on average. Further, the significant differences in the mean scores of
current use behavior and intention to use behavior of ICTs with common subject stream, gender,
age and the ICT experience could be identified.
However, the majority of students (43.1%) agreed that they still have not made full use of the
ICTs, and therefore intended to use ICTs more in all types of work in the future (mean=3.03) and
they suggested motivations; availability of helping persons for difficulties, having updated
trainings/ workshops/ courses regularly, availability of satisfactory facilities, changes of
curriculum to be ICT oriented in the future and the university policy to be moved towards an e-
University in the future. Further, some of these motivations significantly differed according to
the socio-demographic factors.
Also, the majority of the students (39.8%) commented that they need more facilities for current
use of ICTs and future acceptance. Finally, 22.5% of the respondents have recognized that they
should use ICTs at a higher level to successfully make a better demand at the job market. Further
analysis using AMOS will be conducted to assess the relationship between determinants and
current use behavior and behavior intention to use ICTs modeled in Chapter Three, the core of
this research will be presented in Chapter Seven.
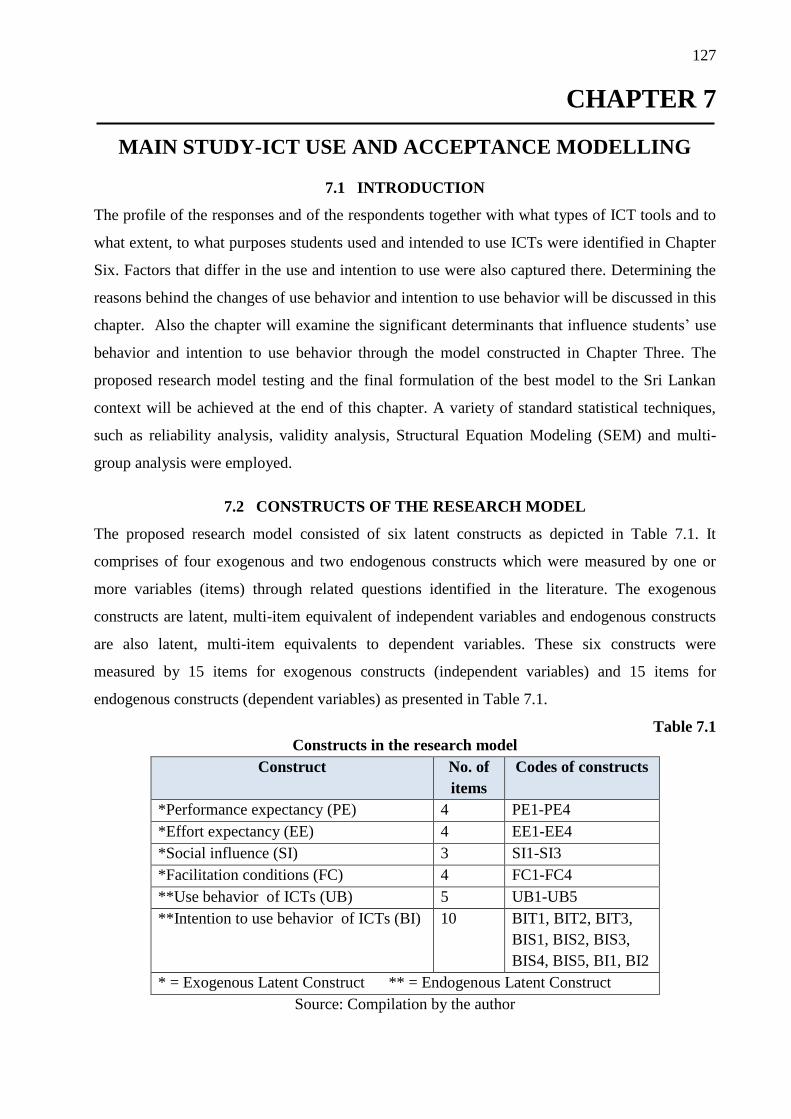
127
CHAPTER 7
MAIN STUDY-ICT USE AND ACCEPTANCE MODELLING
7.1 INTRODUCTION
The profile of the responses and of the respondents together with what types of ICT tools and to
what extent, to what purposes students used and intended to use ICTs were identified in Chapter
Six. Factors that differ in the use and intention to use were also captured there. Determining the
reasons behind the changes of use behavior and intention to use behavior will be discussed in this
chapter. Also the chapter will examine the significant determinants that influence students’ use
behavior and intention to use behavior through the model constructed in Chapter Three. The
proposed research model testing and the final formulation of the best model to the Sri Lankan
context will be achieved at the end of this chapter. A variety of standard statistical techniques,
such as reliability analysis, validity analysis, Structural Equation Modeling (SEM) and multi-
group analysis were employed.
7.2 CONSTRUCTS OF THE RESEARCH MODEL
The proposed research model consisted of six latent constructs as depicted in Table 7.1. It
comprises of four exogenous and two endogenous constructs which were measured by one or
more variables (items) through related questions identified in the literature. The exogenous
constructs are latent, multi-item equivalent of independent variables and endogenous constructs
are also latent, multi-item equivalents to dependent variables. These six constructs were
measured by 15 items for exogenous constructs (independent variables) and 15 items for
endogenous constructs (dependent variables) as presented in Table 7.1.
Table 7.1
Constructs in the research model
Construct No. of
items
Codes of constructs
*Performance expectancy (PE) 4 PE1-PE4
*Effort expectancy (EE) 4 EE1-EE4
*Social influence (SI) 3 SI1-SI3
*Facilitation conditions (FC) 4 FC1-FC4
**Use behavior of ICTs (UB) 5 UB1-UB5
**Intention to use behavior of ICTs (BI) 10 BIT1, BIT2, BIT3,
BIS1, BIS2, BIS3,
BIS4, BIS5, BI1, BI2
* = Exogenous Latent Construct ** = Endogenous Latent Construct
Source: Compilation by the author
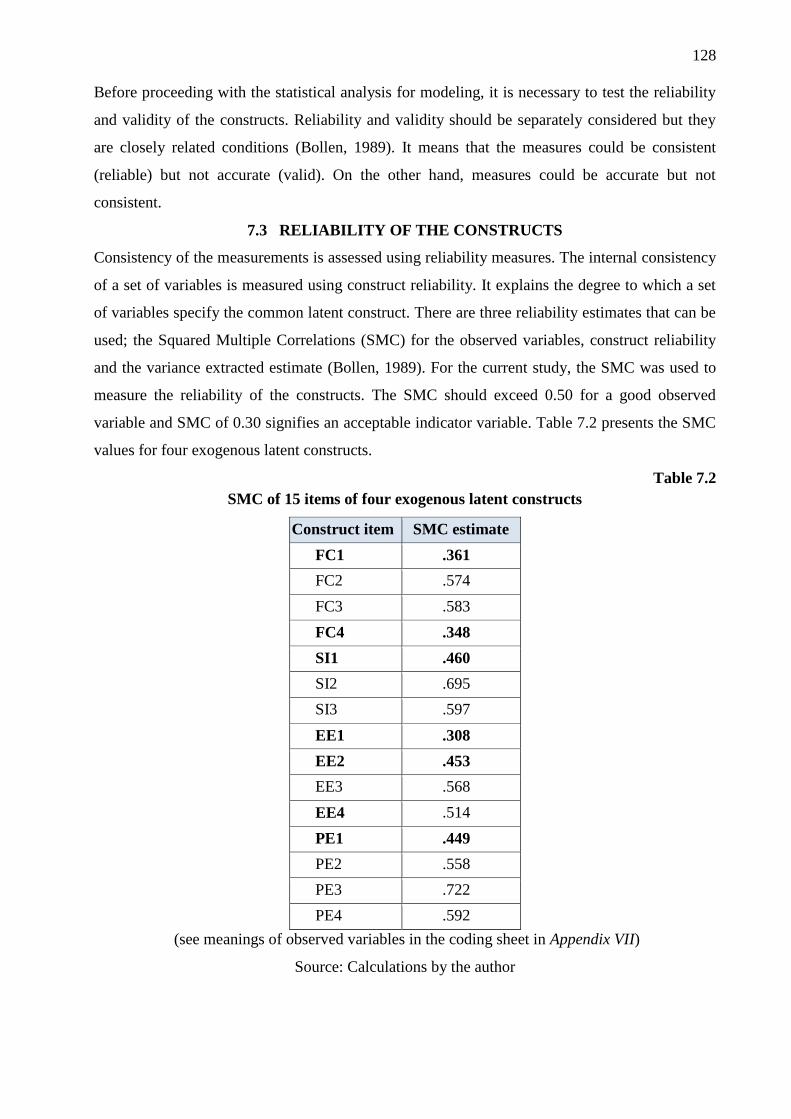
128
Before proceeding with the statistical analysis for modeling, it is necessary to test the reliability
and validity of the constructs. Reliability and validity should be separately considered but they
are closely related conditions (Bollen, 1989). It means that the measures could be consistent
(reliable) but not accurate (valid). On the other hand, measures could be accurate but not
consistent.
7.3 RELIABILITY OF THE CONSTRUCTS
Consistency of the measurements is assessed using reliability measures. The internal consistency
of a set of variables is measured using construct reliability. It explains the degree to which a set
of variables specify the common latent construct. There are three reliability estimates that can be
used; the Squared Multiple Correlations (SMC) for the observed variables, construct reliability
and the variance extracted estimate (Bollen, 1989). For the current study, the SMC was used to
measure the reliability of the constructs. The SMC should exceed 0.50 for a good observed
variable and SMC of 0.30 signifies an acceptable indicator variable. Table 7.2 presents the SMC
values for four exogenous latent constructs.
Table 7.2
SMC of 15 items of four exogenous latent constructs
Construct item SMC estimate
FC1 .361
FC2 .574
FC3 .583
FC4 .348
SI1 .460
SI2 .695
SI3 .597
EE1 .308
EE2 .453
EE3 .568
EE4 .514
PE1 .449
PE2 .558
PE3 .722
PE4 .592
(see meanings of observed variables in the coding sheet in Appendix VII)
Source: Calculations by the author
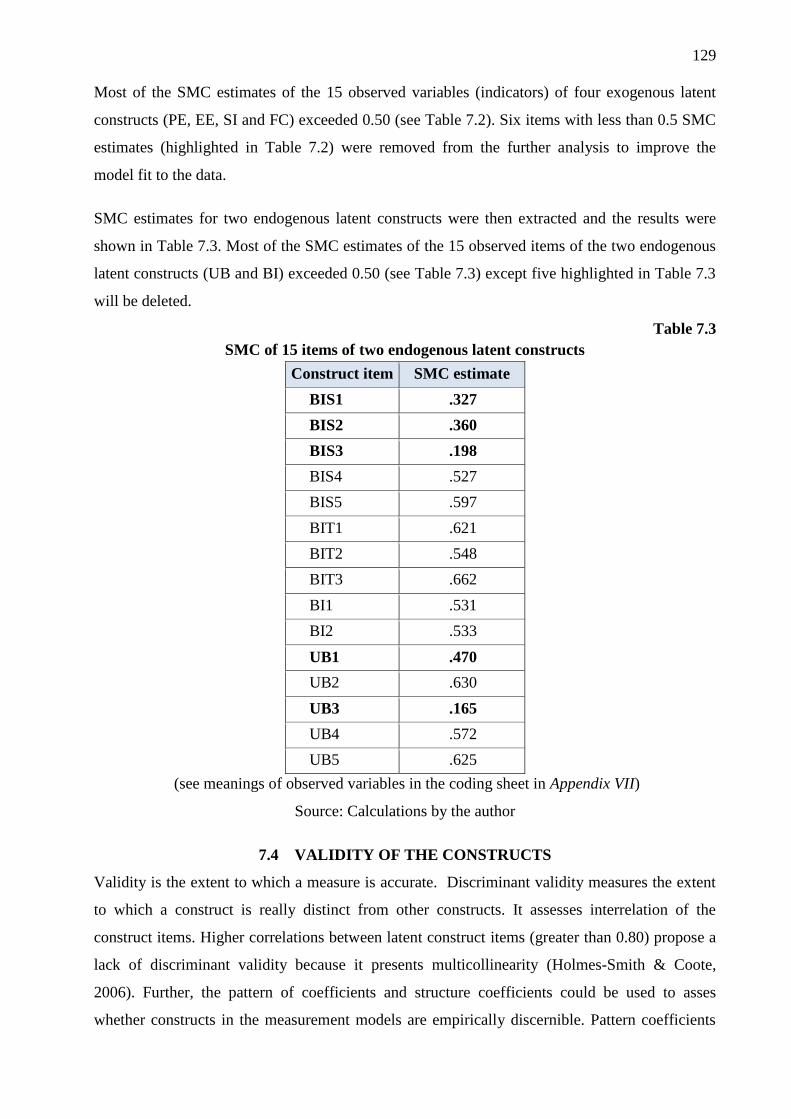
129
Most of the SMC estimates of the 15 observed variables (indicators) of four exogenous latent
constructs (PE, EE, SI and FC) exceeded 0.50 (see Table 7.2). Six items with less than 0.5 SMC
estimates (highlighted in Table 7.2) were removed from the further analysis to improve the
model fit to the data.
SMC estimates for two endogenous latent constructs were then extracted and the results were
shown in Table 7.3. Most of the SMC estimates of the 15 observed items of the two endogenous
latent constructs (UB and BI) exceeded 0.50 (see Table 7.3) except five highlighted in Table 7.3
will be deleted.
Table 7.3
SMC of 15 items of two endogenous latent constructs
Construct item SMC estimate
BIS1 .327
BIS2 .360
BIS3 .198
BIS4 .527
BIS5 .597
BIT1 .621
BIT2 .548
BIT3 .662
BI1 .531
BI2 .533
UB1 .470
UB2 .630
UB3 .165
UB4 .572
UB5 .625
(see meanings of observed variables in the coding sheet in Appendix VII)
Source: Calculations by the author
7.4 VALIDITY OF THE CONSTRUCTS
Validity is the extent to which a measure is accurate. Discriminant validity measures the extent
to which a construct is really distinct from other constructs. It assesses interrelation of the
construct items. Higher correlations between latent construct items (greater than 0.80) propose a
lack of discriminant validity because it presents multicollinearity (Holmes-Smith & Coote,
2006). Further, the pattern of coefficients and structure coefficients could be used to asses
whether constructs in the measurement models are empirically discernible. Pattern coefficients
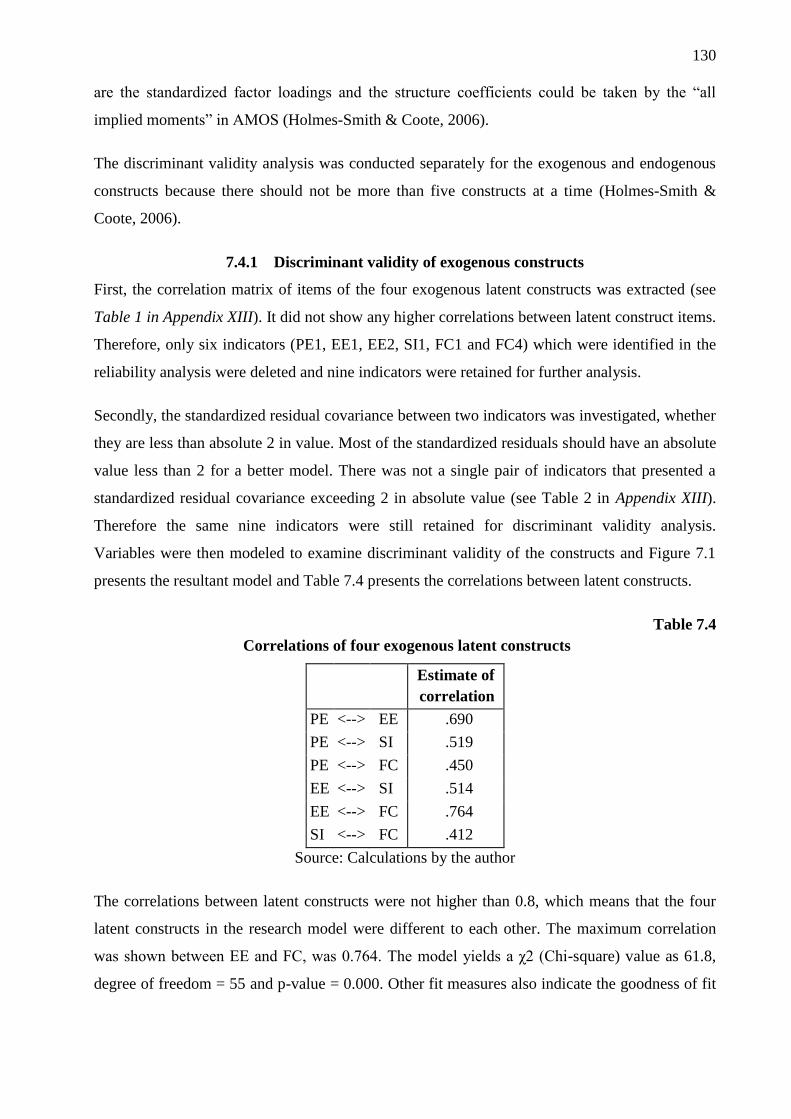
130
are the standardized factor loadings and the structure coefficients could be taken by the “all
implied moments” in AMOS (Holmes-Smith & Coote, 2006).
The discriminant validity analysis was conducted separately for the exogenous and endogenous
constructs because there should not be more than five constructs at a time (Holmes-Smith &
Coote, 2006).
7.4.1 Discriminant validity of exogenous constructs
First, the correlation matrix of items of the four exogenous latent constructs was extracted (see
Table 1 in Appendix XIII). It did not show any higher correlations between latent construct items.
Therefore, only six indicators (PE1, EE1, EE2, SI1, FC1 and FC4) which were identified in the
reliability analysis were deleted and nine indicators were retained for further analysis.
Secondly, the standardized residual covariance between two indicators was investigated, whether
they are less than absolute 2 in value. Most of the standardized residuals should have an absolute
value less than 2 for a better model. There was not a single pair of indicators that presented a
standardized residual covariance exceeding 2 in absolute value (see Table 2 in Appendix XIII).
Therefore the same nine indicators were still retained for discriminant validity analysis.
Variables were then modeled to examine discriminant validity of the constructs and Figure 7.1
presents the resultant model and Table 7.4 presents the correlations between latent constructs.
Table 7.4
Correlations of four exogenous latent constructs
Estimate of
correlation
PE <--> EE .690
PE <--> SI .519
PE <--> FC .450
EE <--> SI .514
EE <--> FC .764
SI <--> FC .412
Source: Calculations by the author
The correlations between latent constructs were not higher than 0.8, which means that the four
latent constructs in the research model were different to each other. The maximum correlation
was shown between EE and FC, was 0.764. The model yields a χ2 (Chi-square) value as 61.8,
degree of freedom = 55 and p-value = 0.000. Other fit measures also indicate the goodness of fit
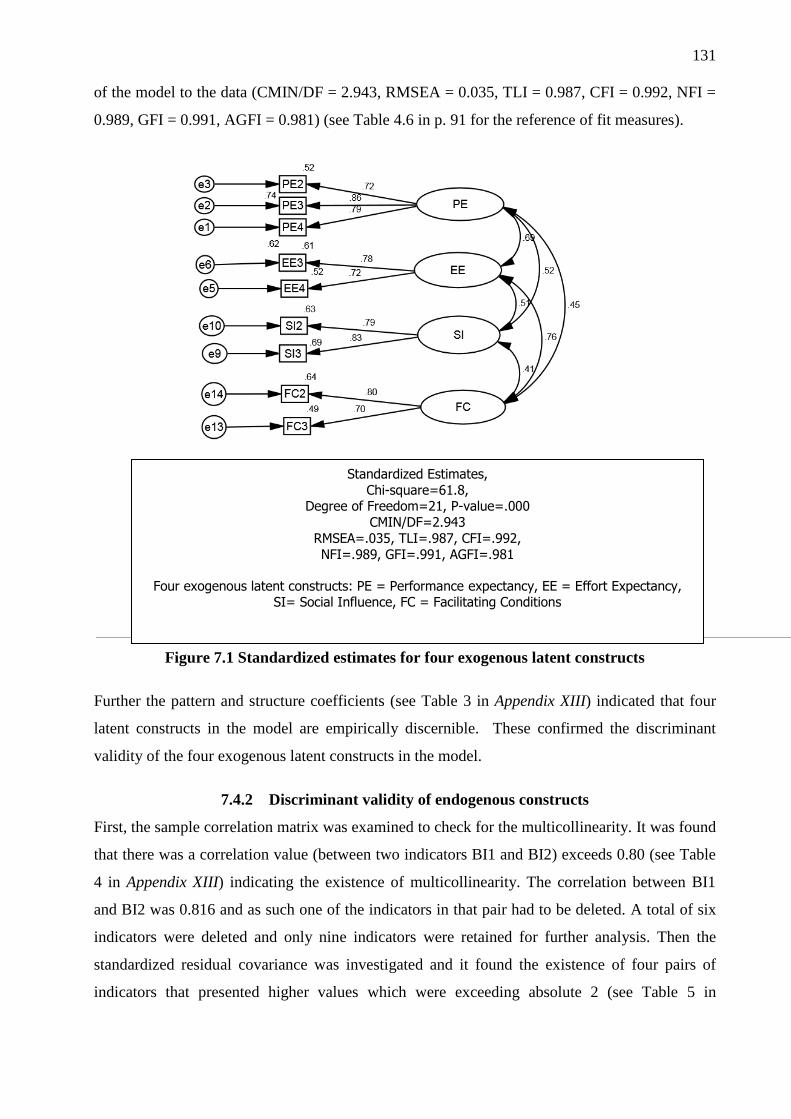
131
of the model to the data (CMIN/DF = 2.943, RMSEA = 0.035, TLI = 0.987, CFI = 0.992, NFI =
0.989, GFI = 0.991, AGFI = 0.981) (see Table 4.6 in p. 91 for the reference of fit measures).
Figure 7.1 Standardized estimates for four exogenous latent constructs
Further the pattern and structure coefficients (see Table 3 in Appendix XIII) indicated that four
latent constructs in the model are empirically discernible. These confirmed the discriminant
validity of the four exogenous latent constructs in the model.
7.4.2 Discriminant validity of endogenous constructs
First, the sample correlation matrix was examined to check for the multicollinearity. It was found
that there was a correlation value (between two indicators BI1 and BI2) exceeds 0.80 (see Table
4 in Appendix XIII) indicating the existence of multicollinearity. The correlation between BI1
and BI2 was 0.816 and as such one of the indicators in that pair had to be deleted. A total of six
indicators were deleted and only nine indicators were retained for further analysis. Then the
standardized residual covariance was investigated and it found the existence of four pairs of
indicators that presented higher values which were exceeding absolute 2 (see Table 5 in
Standardized Estimates,
Chi-square=61.8, Degree of Freedom=21, P-value=.000
CMIN/DF=2.943
RMSEA=.035, TLI=.987, CFI=.992,
NFI=.989, GFI=.991, AGFI=.981
Four exogenous latent constructs: PE = Performance expectancy, EE = Effort Expectancy, SI= Social Influence, FC = Facilitating Conditions
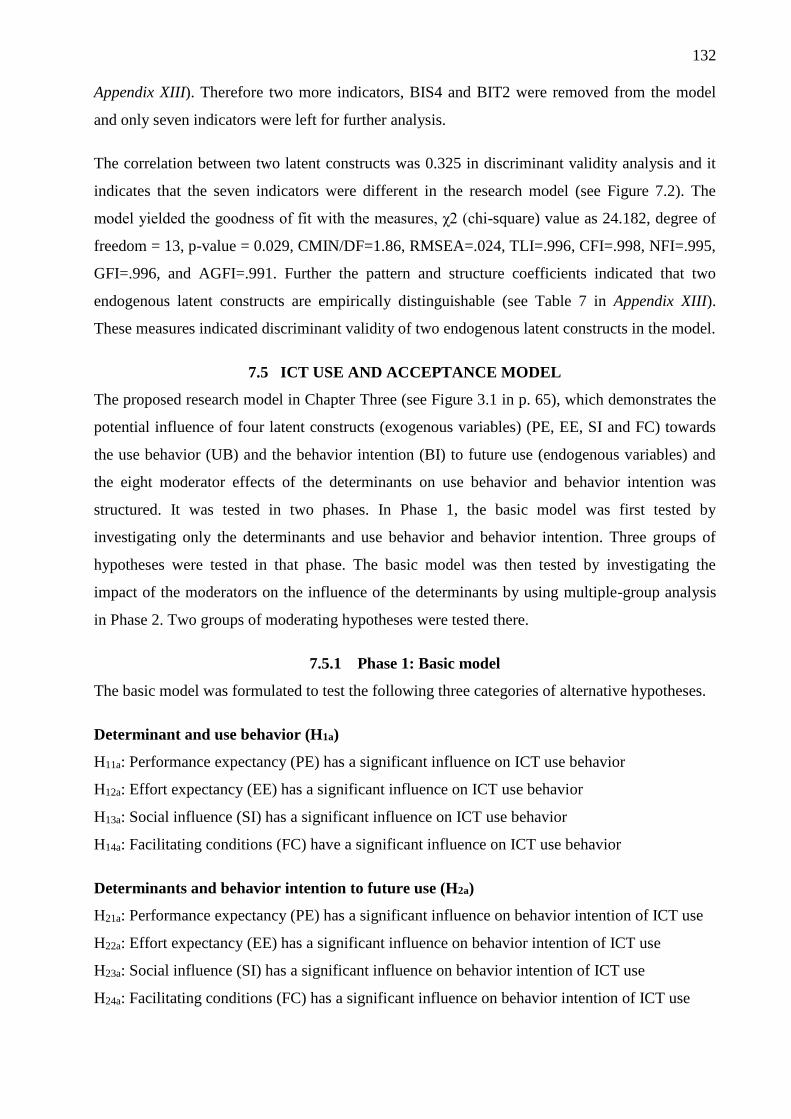
132
Appendix XIII). Therefore two more indicators, BIS4 and BIT2 were removed from the model
and only seven indicators were left for further analysis.
The correlation between two latent constructs was 0.325 in discriminant validity analysis and it
indicates that the seven indicators were different in the research model (see Figure 7.2). The
model yielded the goodness of fit with the measures, χ2 (chi-square) value as 24.182, degree of
freedom = 13, p-value = 0.029, CMIN/DF=1.86, RMSEA=.024, TLI=.996, CFI=.998, NFI=.995,
GFI=.996, and AGFI=.991. Further the pattern and structure coefficients indicated that two
endogenous latent constructs are empirically distinguishable (see Table 7 in Appendix XIII).
These measures indicated discriminant validity of two endogenous latent constructs in the model.
7.5 ICT USE AND ACCEPTANCE MODEL
The proposed research model in Chapter Three (see Figure 3.1 in p. 65), which demonstrates the
potential influence of four latent constructs (exogenous variables) (PE, EE, SI and FC) towards
the use behavior (UB) and the behavior intention (BI) to future use (endogenous variables) and
the eight moderator effects of the determinants on use behavior and behavior intention was
structured. It was tested in two phases. In Phase 1, the basic model was first tested by
investigating only the determinants and use behavior and behavior intention. Three groups of
hypotheses were tested in that phase. The basic model was then tested by investigating the
impact of the moderators on the influence of the determinants by using multiple-group analysis
in Phase 2. Two groups of moderating hypotheses were tested there.
7.5.1 Phase 1: Basic model
The basic model was formulated to test the following three categories of alternative hypotheses.
Determinant and use behavior (H1a)
H11a: Performance expectancy (PE) has a significant influence on ICT use behavior
H12a: Effort expectancy (EE) has a significant influence on ICT use behavior
H13a: Social influence (SI) has a significant influence on ICT use behavior
H14a: Facilitating conditions (FC) have a significant influence on ICT use behavior
Determinants and behavior intention to future use (H2a)
H21a: Performance expectancy (PE) has a significant influence on behavior intention of ICT use
H22a: Effort expectancy (EE) has a significant influence on behavior intention of ICT use
H23a: Social influence (SI) has a significant influence on behavior intention of ICT use
H24a: Facilitating conditions (FC) has a significant influence on behavior intention of ICT use
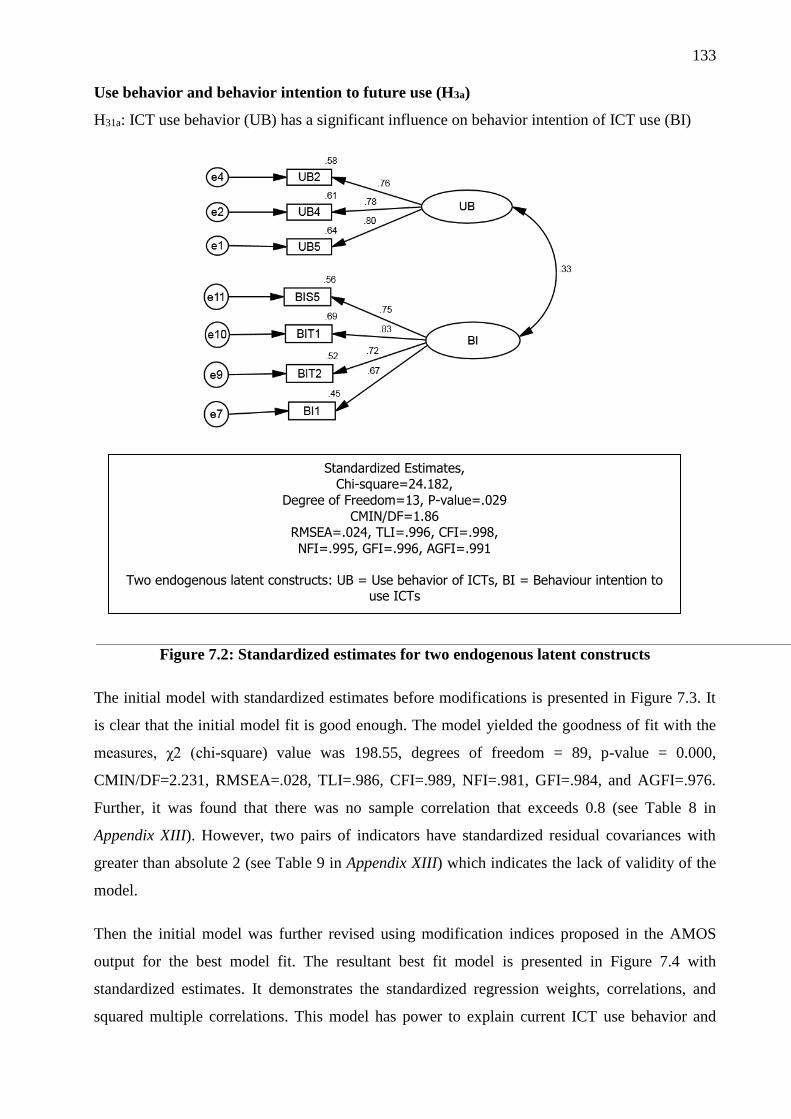
133
Use behavior and behavior intention to future use (H3a)
H31a: ICT use behavior (UB) has a significant influence on behavior intention of ICT use (BI)
Figure 7.2: Standardized estimates for two endogenous latent constructs
The initial model with standardized estimates before modifications is presented in Figure 7.3. It
is clear that the initial model fit is good enough. The model yielded the goodness of fit with the
measures, χ2 (chi-square) value was 198.55, degrees of freedom = 89, p-value = 0.000,
CMIN/DF=2.231, RMSEA=.028, TLI=.986, CFI=.989, NFI=.981, GFI=.984, and AGFI=.976.
Further, it was found that there was no sample correlation that exceeds 0.8 (see Table 8 in
Appendix XIII). However, two pairs of indicators have standardized residual covariances with
greater than absolute 2 (see Table 9 in Appendix XIII) which indicates the lack of validity of the
model.
Then the initial model was further revised using modification indices proposed in the AMOS
output for the best model fit. The resultant best fit model is presented in Figure 7.4 with
standardized estimates. It demonstrates the standardized regression weights, correlations, and
squared multiple correlations. This model has power to explain current ICT use behavior and
Standardized Estimates, Chi-square=24.182,
Degree of Freedom=13, P-value=.029
CMIN/DF=1.86 RMSEA=.024, TLI=.996, CFI=.998,
NFI=.995, GFI=.996, AGFI=.991
Two endogenous latent constructs: UB = Use behavior of ICTs, BI = Behaviour intention to use ICTs
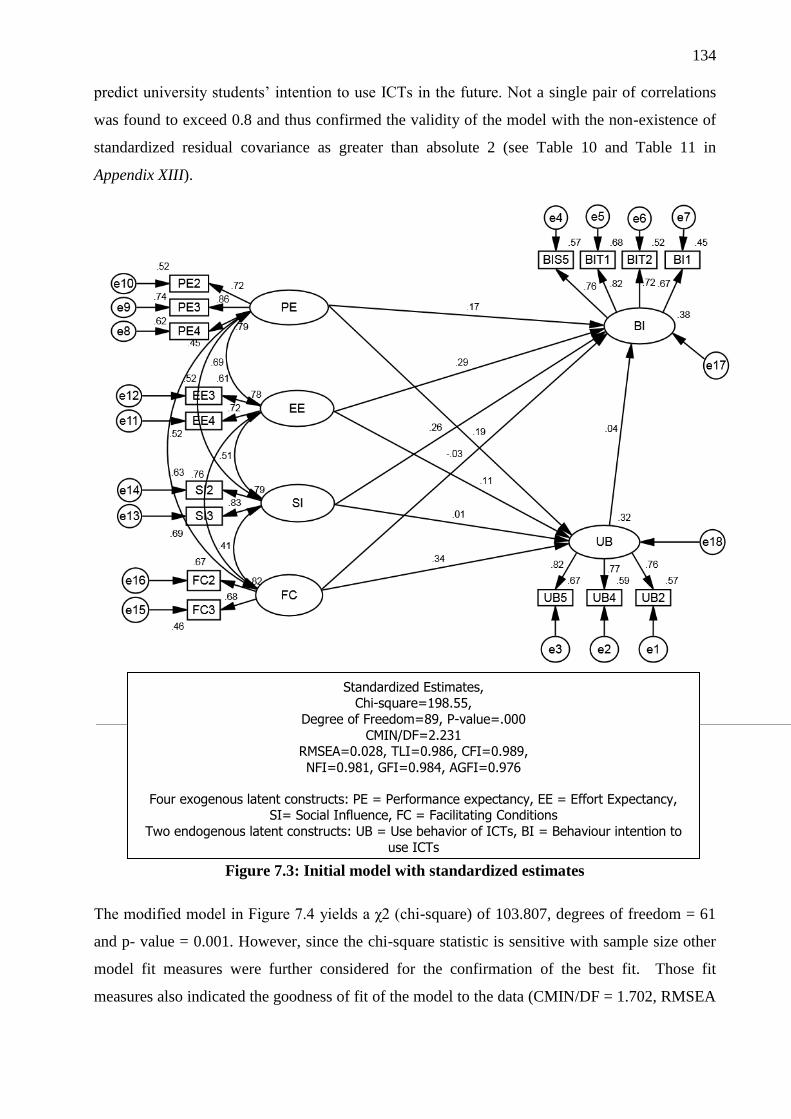
134
predict university students’ intention to use ICTs in the future. Not a single pair of correlations
was found to exceed 0.8 and thus confirmed the validity of the model with the non-existence of
standardized residual covariance as greater than absolute 2 (see Table 10 and Table 11 in
Appendix XIII).
Figure 7.3: Initial model with standardized estimates
The modified model in Figure 7.4 yields a χ2 (chi-square) of 103.807, degrees of freedom = 61
and p- value = 0.001. However, since the chi-square statistic is sensitive with sample size other
model fit measures were further considered for the confirmation of the best fit. Those fit
measures also indicated the goodness of fit of the model to the data (CMIN/DF = 1.702, RMSEA
Standardized Estimates, Chi-square=198.55,
Degree of Freedom=89, P-value=.000
CMIN/DF=2.231 RMSEA=0.028, TLI=0.986, CFI=0.989,
NFI=0.981, GFI=0.984, AGFI=0.976
Four exogenous latent constructs: PE = Performance expectancy, EE = Effort Expectancy, SI= Social Influence, FC = Facilitating Conditions
Two endogenous latent constructs: UB = Use behavior of ICTs, BI = Behaviour intention to
use ICTs
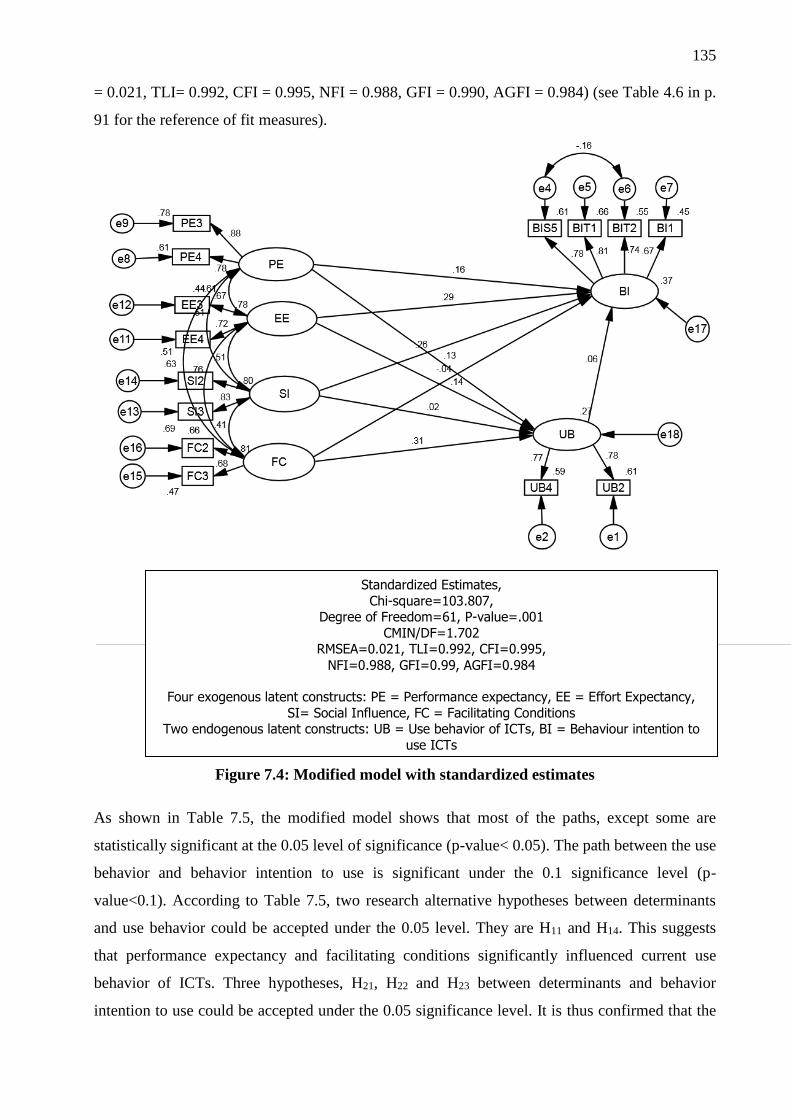
135
= 0.021, TLI= 0.992, CFI = 0.995, NFI = 0.988, GFI = 0.990, AGFI = 0.984) (see Table 4.6 in p.
91 for the reference of fit measures).
Figure 7.4: Modified model with standardized estimates
As shown in Table 7.5, the modified model shows that most of the paths, except some are
statistically significant at the 0.05 level of significance (p-value< 0.05). The path between the use
behavior and behavior intention to use is significant under the 0.1 significance level (p-
value<0.1). According to Table 7.5, two research alternative hypotheses between determinants
and use behavior could be accepted under the 0.05 level. They are H11 and H14. This suggests
that performance expectancy and facilitating conditions significantly influenced current use
behavior of ICTs. Three hypotheses, H21, H22 and H23 between determinants and behavior
intention to use could be accepted under the 0.05 significance level. It is thus confirmed that the
Standardized Estimates,
Chi-square=103.807, Degree of Freedom=61, P-value=.001
CMIN/DF=1.702 RMSEA=0.021, TLI=0.992, CFI=0.995,
NFI=0.988, GFI=0.99, AGFI=0.984
Four exogenous latent constructs: PE = Performance expectancy, EE = Effort Expectancy,
SI= Social Influence, FC = Facilitating Conditions Two endogenous latent constructs: UB = Use behavior of ICTs, BI = Behaviour intention to
use ICTs
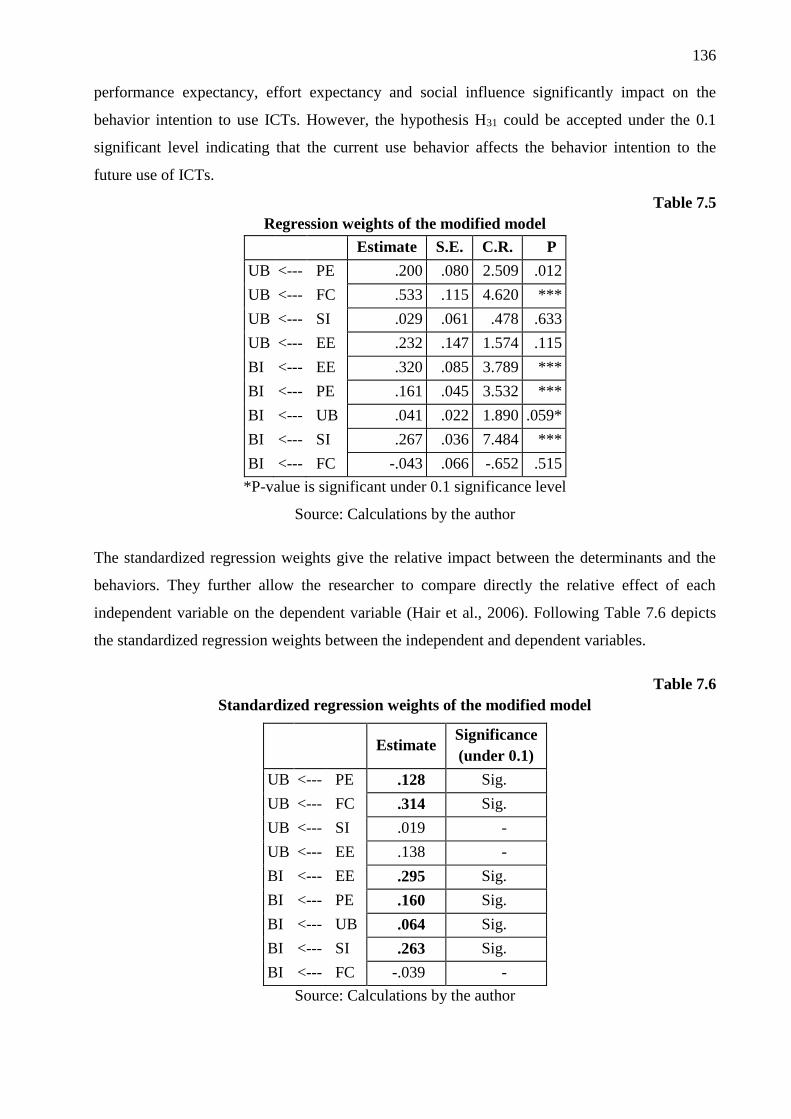
136
performance expectancy, effort expectancy and social influence significantly impact on the
behavior intention to use ICTs. However, the hypothesis H31 could be accepted under the 0.1
significant level indicating that the current use behavior affects the behavior intention to the
future use of ICTs.
Table 7.5
Regression weights of the modified model
Estimate S.E. C.R. P
UB <--- PE .200 .080 2.509 .012
UB <--- FC .533 .115 4.620 ***
UB <--- SI .029 .061 .478 .633
UB <--- EE .232 .147 1.574 .115
BI <--- EE .320 .085 3.789 ***
BI <--- PE .161 .045 3.532 ***
BI <--- UB .041 .022 1.890 .059*
BI <--- SI .267 .036 7.484 ***
BI <--- FC -.043 .066 -.652 .515
*P-value is significant under 0.1 significance level
Source: Calculations by the author
The standardized regression weights give the relative impact between the determinants and the
behaviors. They further allow the researcher to compare directly the relative effect of each
independent variable on the dependent variable (Hair et al., 2006). Following Table 7.6 depicts
the standardized regression weights between the independent and dependent variables.
Table 7.6
Standardized regression weights of the modified model
Estimate
Significance
(under 0.1)
UB <--- PE .128 Sig.
UB <--- FC .314 Sig.
UB <--- SI .019 -
UB <--- EE .138 -
BI <--- EE .295 Sig.
BI <--- PE .160 Sig.
BI <--- UB .064 Sig.
BI <--- SI .263 Sig.
BI <--- FC -.039 -
Source: Calculations by the author
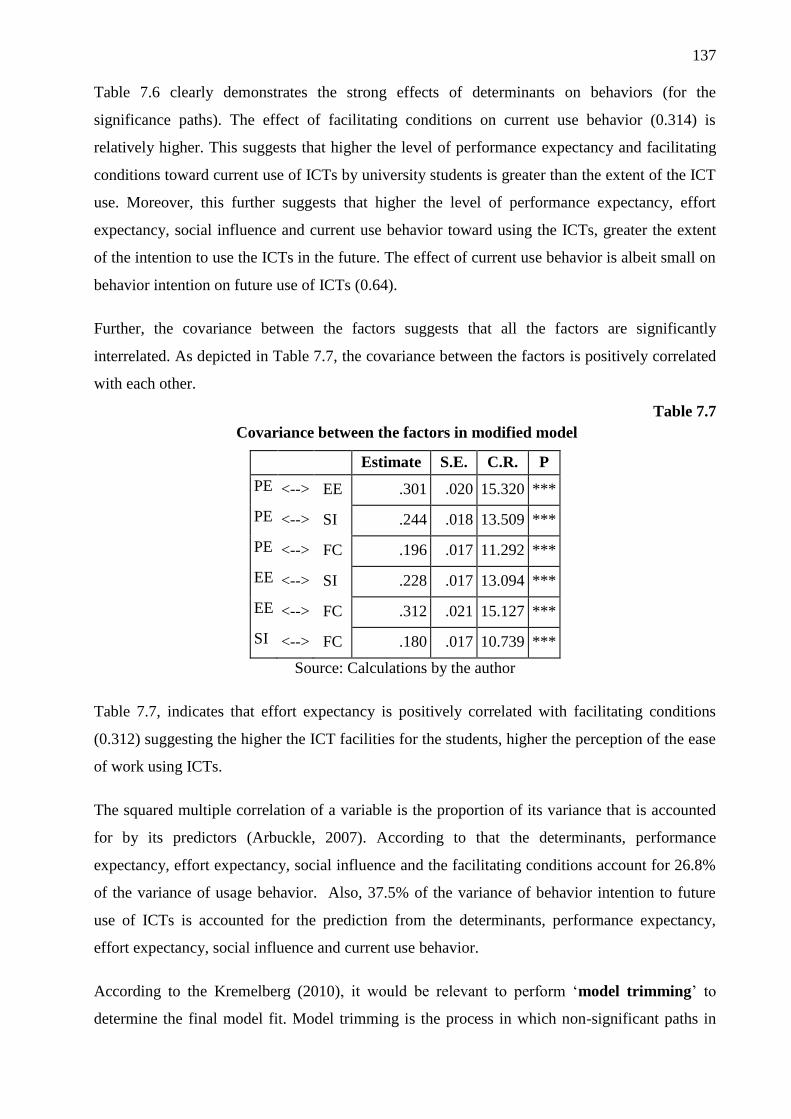
137
Table 7.6 clearly demonstrates the strong effects of determinants on behaviors (for the
significance paths). The effect of facilitating conditions on current use behavior (0.314) is
relatively higher. This suggests that higher the level of performance expectancy and facilitating
conditions toward current use of ICTs by university students is greater than the extent of the ICT
use. Moreover, this further suggests that higher the level of performance expectancy, effort
expectancy, social influence and current use behavior toward using the ICTs, greater the extent
of the intention to use the ICTs in the future. The effect of current use behavior is albeit small on
behavior intention on future use of ICTs (0.64).
Further, the covariance between the factors suggests that all the factors are significantly
interrelated. As depicted in Table 7.7, the covariance between the factors is positively correlated
with each other.
Table 7.7
Covariance between the factors in modified model
Estimate S.E. C.R. P
PE <--> EE .301 .020 15.320 ***
PE <--> SI .244 .018 13.509 ***
PE <--> FC .196 .017 11.292 ***
EE <--> SI .228 .017 13.094 ***
EE <--> FC .312 .021 15.127 ***
SI <--> FC .180 .017 10.739 ***
Source: Calculations by the author
Table 7.7, indicates that effort expectancy is positively correlated with facilitating conditions
(0.312) suggesting the higher the ICT facilities for the students, higher the perception of the ease
of work using ICTs.
The squared multiple correlation of a variable is the proportion of its variance that is accounted
for by its predictors (Arbuckle, 2007). According to that the determinants, performance
expectancy, effort expectancy, social influence and the facilitating conditions account for 26.8%
of the variance of usage behavior. Also, 37.5% of the variance of behavior intention to future
use of ICTs is accounted for the prediction from the determinants, performance expectancy,
effort expectancy, social influence and current use behavior.
According to the Kremelberg (2010), it would be relevant to perform ‘model trimming’ to
determine the final model fit. Model trimming is the process in which non-significant paths in
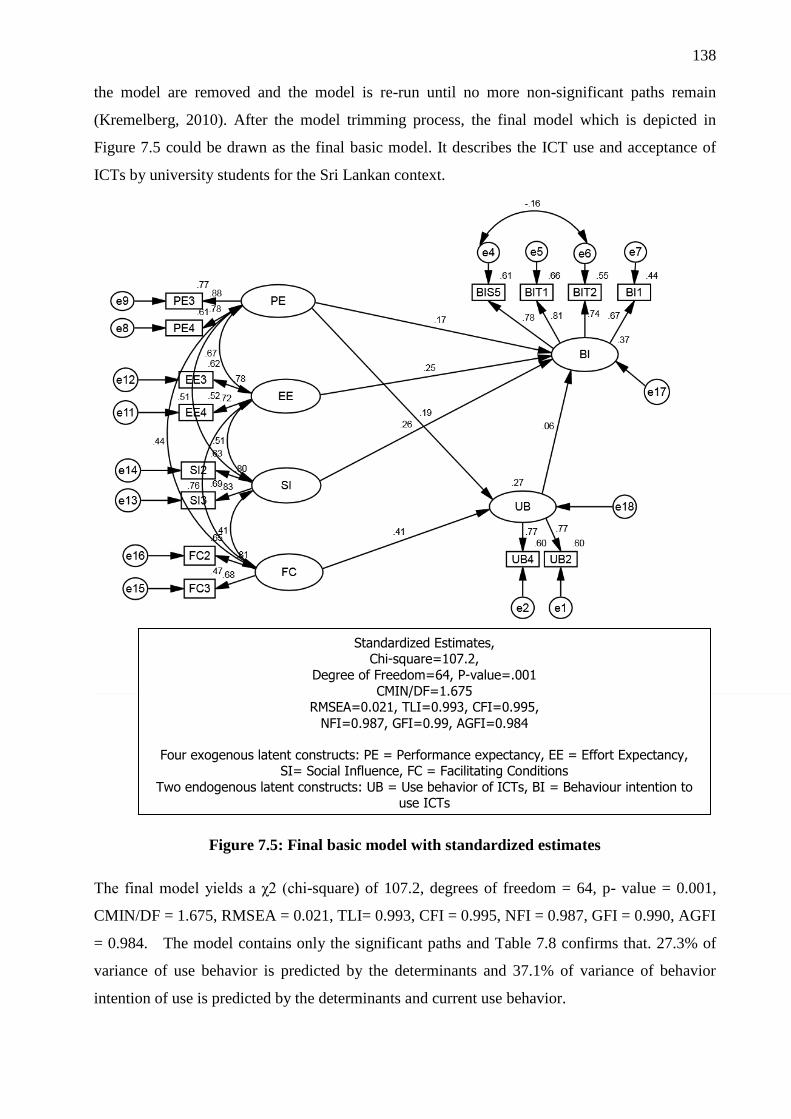
138
the model are removed and the model is re-run until no more non-significant paths remain
(Kremelberg, 2010). After the model trimming process, the final model which is depicted in
Figure 7.5 could be drawn as the final basic model. It describes the ICT use and acceptance of
ICTs by university students for the Sri Lankan context.
Figure 7.5: Final basic model with standardized estimates
The final model yields a χ2 (chi-square) of 107.2, degrees of freedom = 64, p- value = 0.001,
CMIN/DF = 1.675, RMSEA = 0.021, TLI= 0.993, CFI = 0.995, NFI = 0.987, GFI = 0.990, AGFI
= 0.984. The model contains only the significant paths and Table 7.8 confirms that. 27.3% of
variance of use behavior is predicted by the determinants and 37.1% of variance of behavior
intention of use is predicted by the determinants and current use behavior.
Standardized Estimates, Chi-square=107.2,
Degree of Freedom=64, P-value=.001
CMIN/DF=1.675 RMSEA=0.021, TLI=0.993, CFI=0.995,
NFI=0.987, GFI=0.99, AGFI=0.984
Four exogenous latent constructs: PE = Performance expectancy, EE = Effort Expectancy, SI= Social Influence, FC = Facilitating Conditions
Two endogenous latent constructs: UB = Use behavior of ICTs, BI = Behaviour intention to use ICTs
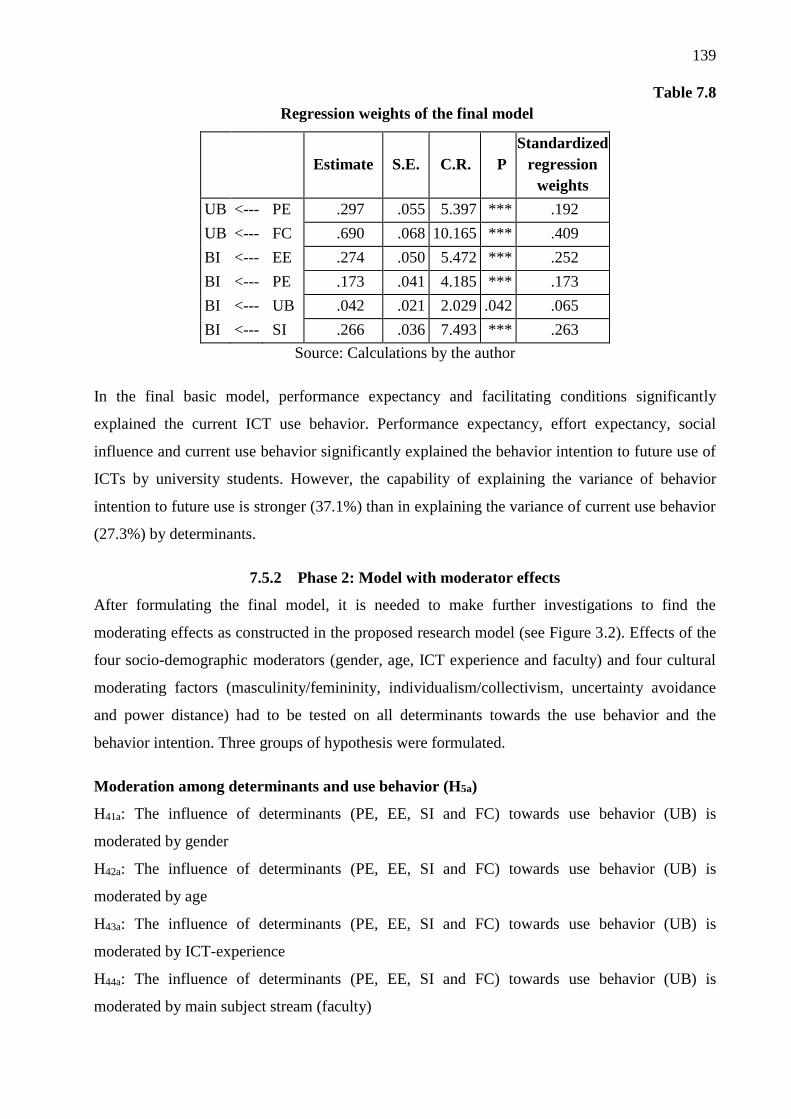
139
Table 7.8
Regression weights of the final model
Estimate S.E. C.R. P
Standardized
regression
weights
UB <--- PE .297 .055 5.397 *** .192
UB <--- FC .690 .068 10.165 *** .409
BI <--- EE .274 .050 5.472 *** .252
BI <--- PE .173 .041 4.185 *** .173
BI <--- UB .042 .021 2.029 .042 .065
BI <--- SI .266 .036 7.493 *** .263
Source: Calculations by the author
In the final basic model, performance expectancy and facilitating conditions significantly
explained the current ICT use behavior. Performance expectancy, effort expectancy, social
influence and current use behavior significantly explained the behavior intention to future use of
ICTs by university students. However, the capability of explaining the variance of behavior
intention to future use is stronger (37.1%) than in explaining the variance of current use behavior
(27.3%) by determinants.
7.5.2 Phase 2: Model with moderator effects
After formulating the final model, it is needed to make further investigations to find the
moderating effects as constructed in the proposed research model (see Figure 3.2). Effects of the
four socio-demographic moderators (gender, age, ICT experience and faculty) and four cultural
moderating factors (masculinity/femininity, individualism/collectivism, uncertainty avoidance
and power distance) had to be tested on all determinants towards the use behavior and the
behavior intention. Three groups of hypothesis were formulated.
Moderation among determinants and use behavior (H5a)
H41a: The influence of determinants (PE, EE, SI and FC) towards use behavior (UB) is
moderated by gender
H42a: The influence of determinants (PE, EE, SI and FC) towards use behavior (UB) is
moderated by age
H43a: The influence of determinants (PE, EE, SI and FC) towards use behavior (UB) is
moderated by ICT-experience
H44a: The influence of determinants (PE, EE, SI and FC) towards use behavior (UB) is
moderated by main subject stream (faculty)
140
H45a: The influence of determinants (PE, EE, SI and FC) towards use behavior (UB) is
moderated by masculinity/femininity
H46a: The influence of determinants (PE, EE, SI and FC) towards use behavior (UB) is
moderated by individualism/collectivism
H47a: The influence of determinants (PE, EE, SI and FC) towards use behavior (UB) is
moderated by uncertainty avoidance
H48a: The influence of determinants (PE, EE, SI and FC) towards use behavior (UB) is
moderated by power distance
Moderation among determinants and behavior intention to future use (H5b)
H51b: The influence of determinants (PE, EE, SI and FC) towards behavior intention to future use
(BI) is moderated by gender
H52b: The influence of determinants (PE, EE, SI and FC) towards behavior intention to future use
(BI) is moderated by age
H53b: The influence of determinants (PE, EE, SI and FC) towards behavior intention to future use
(BI) is moderated by ICT-experience
H54b: The influence of determinants (PE, EE, SI and FC) towards behavior intention to future use
(BI) is moderated by main subject stream (faculty)
H55b: The influence of determinants (PE, EE, SI and FC) towards behavior intention to future use
(BI) is moderated by masculinity/femininity
H56b: The influence of determinants (PE, EE, SI and FC) towards behavior intention to future use
(BI) is moderated by individualism/collectivism
H57b: The influence of determinants (PE, EE, SI and FC) towards behavior intention to future use
(BI) is moderated by uncertainty avoidance
H58b: The influence of determinants (PE, EE, SI and FC) towards behavior intention to future use
(BI) is moderated by power distance
Moderation between use behavior and behavior intention to future use (H6c)
H61c: The influence of use behavior (UB) towards behavior intention to future use (BI) is
moderated by gender
H62c: The influence of use behavior (UB) towards behavior intention to future use (BI) is
moderated by age
H63c: The influence of use behavior (UB) towards behavior intention to future use (BI) is
moderated by ICT-experience
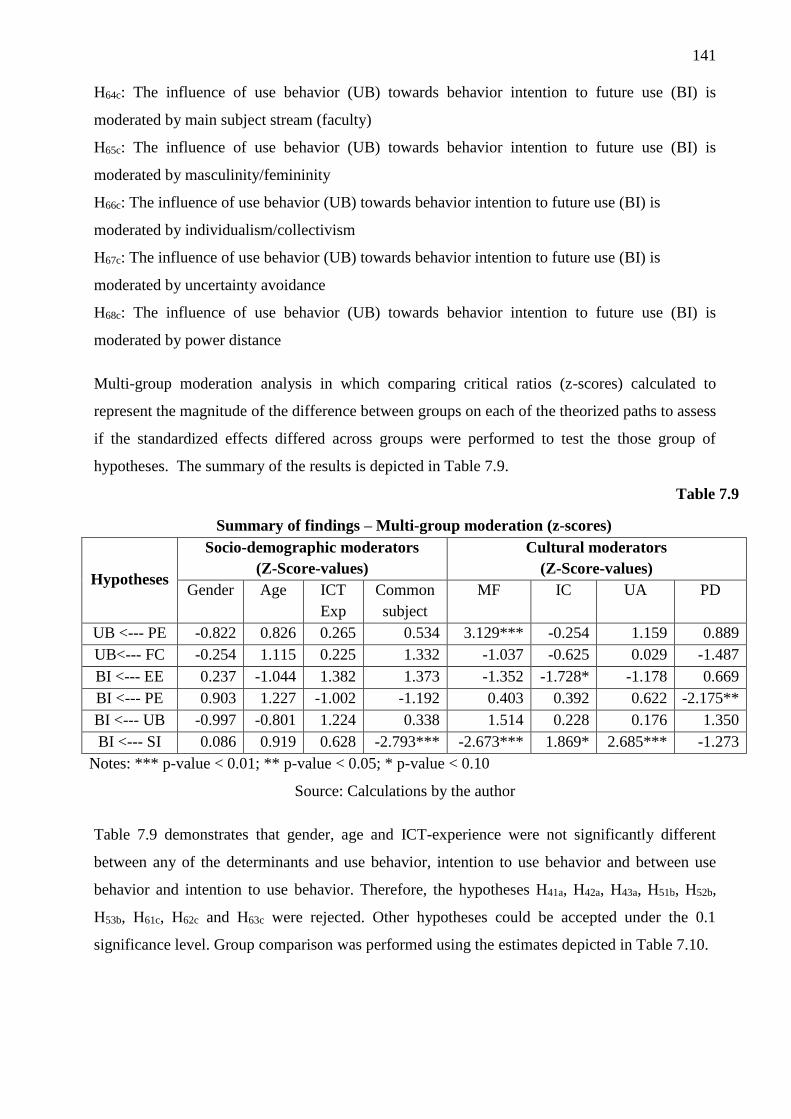
141
H64c: The influence of use behavior (UB) towards behavior intention to future use (BI) is
moderated by main subject stream (faculty)
H65c: The influence of use behavior (UB) towards behavior intention to future use (BI) is
moderated by masculinity/femininity
H66c: The influence of use behavior (UB) towards behavior intention to future use (BI) is
moderated by individualism/collectivism
H67c: The influence of use behavior (UB) towards behavior intention to future use (BI) is
moderated by uncertainty avoidance
H68c: The influence of use behavior (UB) towards behavior intention to future use (BI) is
moderated by power distance
Multi-group moderation analysis in which comparing critical ratios (z-scores) calculated to
represent the magnitude of the difference between groups on each of the theorized paths to assess
if the standardized effects differed across groups were performed to test the those group of
hypotheses. The summary of the results is depicted in Table 7.9.
Table 7.9
Summary of findings – Multi-group moderation (z-scores)
Hypotheses
Socio-demographic moderators
(Z-Score-values)
Cultural moderators
(Z-Score-values)
Gender Age ICT
Exp
Common
subject
MF IC UA PD
UB <--- PE -0.822 0.826 0.265 0.534 3.129*** -0.254 1.159 0.889
UB<--- FC -0.254 1.115 0.225 1.332 -1.037 -0.625 0.029 -1.487
BI <--- EE 0.237 -1.044 1.382 1.373 -1.352 -1.728* -1.178 0.669
BI <--- PE 0.903 1.227 -1.002 -1.192 0.403 0.392 0.622 -2.175**
BI <--- UB -0.997 -0.801 1.224 0.338 1.514 0.228 0.176 1.350
BI <--- SI 0.086 0.919 0.628 -2.793*** -2.673*** 1.869* 2.685*** -1.273
Notes: *** p-value < 0.01; ** p-value < 0.05; * p-value < 0.10
Source: Calculations by the author
Table 7.9 demonstrates that gender, age and ICT-experience were not significantly different
between any of the determinants and use behavior, intention to use behavior and between use
behavior and intention to use behavior. Therefore, the hypotheses H41a, H42a, H43a, H51b, H52b,
H53b, H61c, H62c and H63c were rejected. Other hypotheses could be accepted under the 0.1
significance level. Group comparison was performed using the estimates depicted in Table 7.10.
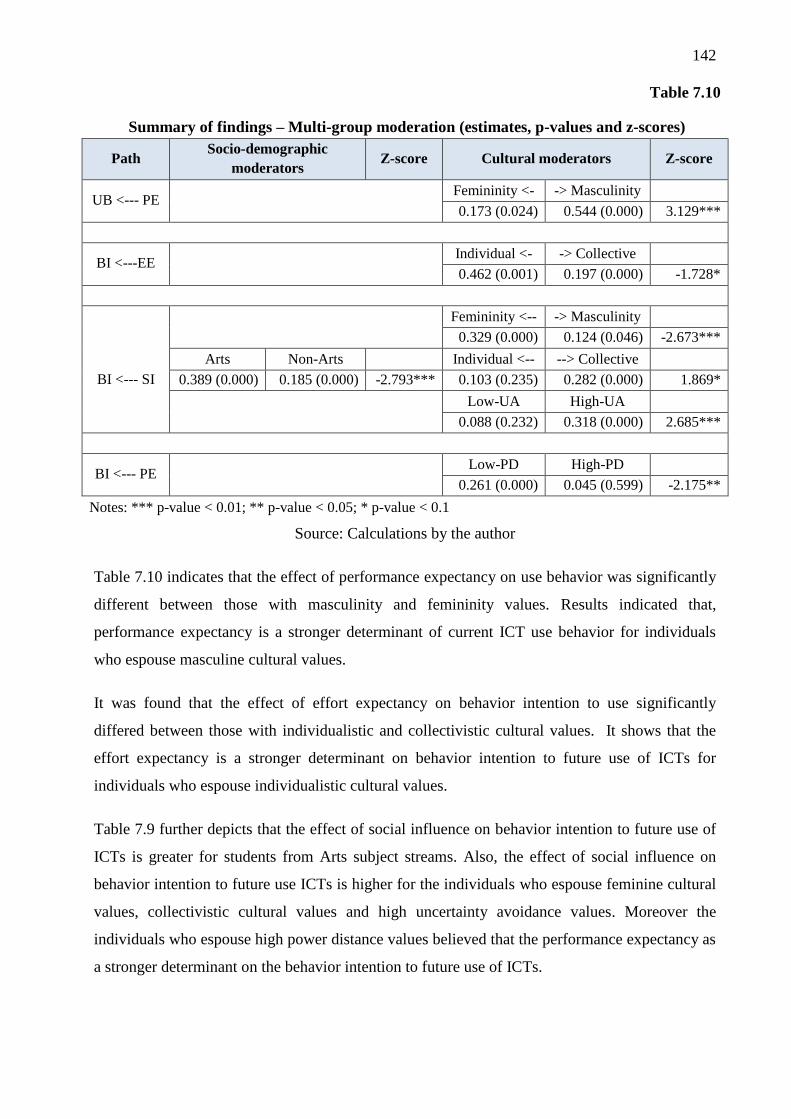
142
Table 7.10
Summary of findings – Multi-group moderation (estimates, p-values and z-scores)
Path Socio-demographic
moderators Z-score Cultural moderators Z-score
UB <--- PE
Femininity <- -> Masculinity
0.173 (0.024) 0.544 (0.000) 3.129***
BI <---EE
Individual <- -> Collective
0.462 (0.001) 0.197 (0.000) -1.728*
Femininity <-- -> Masculinity
BI <--- SI
0.329 (0.000) 0.124 (0.046) -2.673***
Arts Non-Arts
Individual <-- --> Collective
0.389 (0.000) 0.185 (0.000) -2.793*** 0.103 (0.235) 0.282 (0.000) 1.869*
Low-UA High-UA
0.088 (0.232) 0.318 (0.000) 2.685***
BI <--- PE
Low-PD High-PD
0.261 (0.000) 0.045 (0.599) -2.175**
Notes: *** p-value < 0.01; ** p-value < 0.05; * p-value < 0.1
Source: Calculations by the author
Table 7.10 indicates that the effect of performance expectancy on use behavior was significantly
different between those with masculinity and femininity values. Results indicated that,
performance expectancy is a stronger determinant of current ICT use behavior for individuals
who espouse masculine cultural values.
It was found that the effect of effort expectancy on behavior intention to use significantly
differed between those with individualistic and collectivistic cultural values. It shows that the
effort expectancy is a stronger determinant on behavior intention to future use of ICTs for
individuals who espouse individualistic cultural values.
Table 7.9 further depicts that the effect of social influence on behavior intention to future use of
ICTs is greater for students from Arts subject streams. Also, the effect of social influence on
behavior intention to future use ICTs is higher for the individuals who espouse feminine cultural
values, collectivistic cultural values and high uncertainty avoidance values. Moreover the
individuals who espouse high power distance values believed that the performance expectancy as
a stronger determinant on the behavior intention to future use of ICTs.
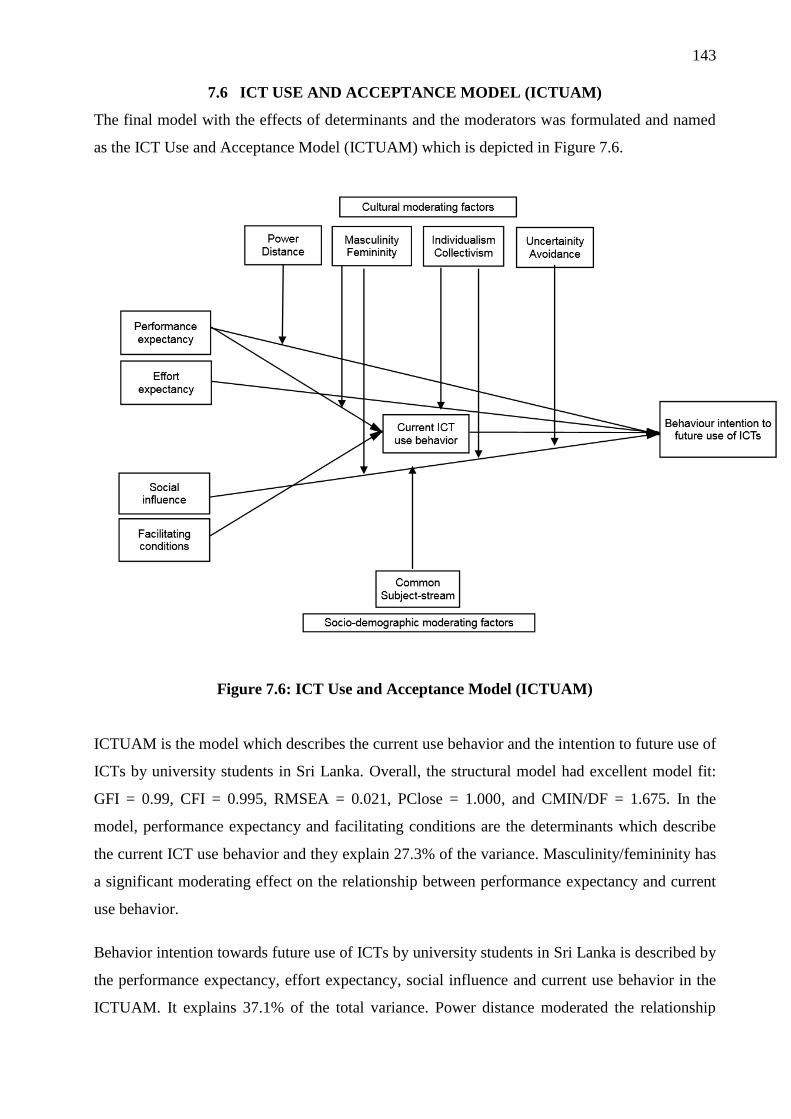
143
7.6 ICT USE AND ACCEPTANCE MODEL (ICTUAM)
The final model with the effects of determinants and the moderators was formulated and named
as the ICT Use and Acceptance Model (ICTUAM) which is depicted in Figure 7.6.
Figure 7.6: ICT Use and Acceptance Model (ICTUAM)
ICTUAM is the model which describes the current use behavior and the intention to future use of
ICTs by university students in Sri Lanka. Overall, the structural model had excellent model fit:
GFI = 0.99, CFI = 0.995, RMSEA = 0.021, PClose = 1.000, and CMIN/DF = 1.675. In the
model, performance expectancy and facilitating conditions are the determinants which describe
the current ICT use behavior and they explain 27.3% of the variance. Masculinity/femininity has
a significant moderating effect on the relationship between performance expectancy and current
use behavior.
Behavior intention towards future use of ICTs by university students in Sri Lanka is described by
the performance expectancy, effort expectancy, social influence and current use behavior in the
ICTUAM. It explains 37.1% of the total variance. Power distance moderated the relationship
144
between performance expectancy and the behavior intention to the future use of ICTs. The
relationship between the social influence and behavior intention to future use of ICTs is
moderated by ICT-experience, masculinity/femininity, individualism/collectivism and
uncertainty avoidance. Individualism/collectivism has a significant moderating effect on the
relationship between effort expectancy and behavior intention to future use of ICTs by university
students in Sri Lanka.
7.7 SUMMARY
The purpose of this study was to formulate a model which describes the current use behavior and
the intention to future use of ICTs by university students in Sri Lanka. Initially in the chapter, it
confirmed the construct reliability and discriminant validity. Then the proposed research model
was tested in two phases. First, the research model was constructed using SEM techniques by
investigating only the determinants and behaviors. Next, the impact of the moderators on the
influence of the determinants/predictors on current use behavior and behavior intention to future
use was examined using the multi-group analysis. Finally, the model which is called “ICT Use
and Acceptance Model (ICTUAM)” was drawn with an excellent model fit. More importantly,
ICT-experience and the cultural factors moderated the relationships in the model. Finally the
model describes the current use behavior and the intention to future use of ICTs by university
students in Sri Lanka. Moreover, the model has the power to explain 27.3% of the variance of
current use behavior and 37.1% of the variance of behavior intention to the future use of ICTs.
The next chapter summarizes the key findings of the study, its theoretical, methodological,
managerial implications along with the limitations of the study and recommendations for further
research.
145
CHAPTER 8
CONCLUSIONS AND SUGGESTIONS
8.1 INTRODUCTION
The previous chapter presented the analysis of data and the discussion of emerging findings. This
chapter summarizes the key findings along with methodological and practical implications. The
limitations of the study and suggestions for further research are also discussed.
8.2 KEY FINDINGS
This study focused on proposing a model for assessing the extent to which individual
characteristics describe current use behavior and future acceptance of ICTs by university
students in the Sri Lankan context. In order to achieve the main aim of the study, following
specific objectives could be formulated.
1. To assess what types of ICTs are used by university students in Sri Lanka.
2. To assess the extent to which Sri Lankan university students use and intend to use ICTs.
3. To identify the effect of socio-demographic factors on ICT use and acceptance of
university students.
4. To investigate how university students are motivated to improve the use of ICTs.
5. To propose a model which best describes the ICT use and acceptance by university
students in Sri Lanka
Data were collected from the first year and third year students from four universities located in
the Colombo metropolitan area and rural areas in Sri Lanka with a 72.16% (1682 out of 2331)
satisfactory response rate and the reliability and validity of the survey instrument could be
achieved. Data collected in relation to the first objective was investigated and presented in
Chapter Five and Six. Next three objectives were analysed and presented in Chapter Six. Model
testing was performed and presented in Chapter Seven. Key findings of those sections are
summarized in the following sections.
8.2.1 Socio-demographic and cultural background of the respondents
The respondents’ profile indicated that the majority of students were female (74.1%), and were
in the age range of 20-25 years (97.2%). Two-thirds of university students who responded to the
survey were female and a big age difference among them could not be seen. Most of the
respondents were Sinhala (81.0%), and Buddhist (78.1%). It reveals that there is not a huge
146
variation of the sample regarding the ethnicity and religion when compared with the composition
of the population in the country. Most of the students had come from rural areas (60%).
Majority of the respondents’ individual cultural values about masculinity/ femininity moved a
closer towards femininity cultural values (mean =1.88). Most of the respondents preferred a low
power distance cultural direction (mean=1.7). Moreover, the respondents individually possessed
a higher espoused collectivism (mean=2.8) cultural thoughts and high espoused uncertainty
avoidance (mean=2.69) cultural values.
8.2.2 Students’ background in relation to ICT use
Analysis of students’ background related to ICT usage indicated that a larger number of students
(68.4%) had followed ICT courses before entering the university. Majority (85.4%) of them had
followed desktop application courses and 40.3% of them had followed WWW and Internet
related courses. This information reveals that the majority of the students had identified ICTs as
an important component for the future and that therefore they tend to follow ICT courses
systematically. Although almost all the universities conduct ICT related courses for freshmen,
the highest percentage of students of the sample (57.4%) claimed that they have not followed
ICT courses after entering the university. These courses being optional courses may be a reason
for this result. 42.6% of students stated that they had followed ICT related courses at the
university and a majority of them (20.6%) had followed the introductory courses.
Most of the students had access to computer facilities (86.2%) and internet facilities (76.4%)
whenever they needed and most of them had used their own mobile devices (72.5%) to access
ICTs. It reveals that the majority owns ICT facilities enabling easy access in this context.
Majority of students had 0-5 years’ long experience (79.1%) and only 14.7% had more than 10
years longer experience of more than 10 years. It thus appeared that almost all the university
students possess the capability to access ICTs. In terms of the length of experience, 29% of urban
students assessed themselves as having more than 5 years’ experience as compared with only
15.5% of rural students. This means that on average, urban students have longer ICT experience
than rural students. This could be due to the digital divide. Moreover, the third year students
have higher ICT experience (more than 10 years) (73.6%) as compared to only of 62.8% first
year students. Third year students have spent more than 3 years in the university with ICT
facilities than the first year students and therefore they could have more than 5 years of ICT
experience. Moreover, Science students were seen to possess a longer ICT experience (more than
5 years) (34.1%) as compared to Arts and Management students. On the other hand, the majority
147
of the Arts students (87.4%) have only lower ICT experience (0-5 years) as compared to Science
and Management students. Most of the time, students who learn Arts subjects, tend to degrade
technologies and this may be because they have lower ICT experience.
Most of the students have self-reported that they possessed a moderate level of skill (78.5%) in
ICTs. Males have (5.7%) higher ICT skills compared to their female counterparts. This may be
because in nature, males are considered as more technology-oriented than females and they are
also more active in striving to improve their skills with new technology than females. While a
majority of rural students (22.2%) have poor ICT skills, urban students have (87.4%) moderate
and high ICT experience compared to rural students. Third year students (3.3%) have high ICT
skills compared to only 02.9% of first year students.
8.2.3 Types of ICT tools used by the students and their intention to use
Usage frequency of 20 different ICT tools identified in the literature was considered and it was
found that the Internet searching is the tool which has the greatest frequency of use (“use several
times a day”) by the majority of the students (35.9%). This may be because the net generation
mostly relies on the Internet for each and every purpose. Even though the lecturers and the
employers in the job market believe that e-mail is a tool, which fresh graduates should be
equipped with, the majority of the respondents used e-mail (26.1%) only about once a week,
22.2% used e-mail once a day and 20.9% used e-mail several times a day. Net generation
currently makes use of social networks for communication and therefore does not make use of e-
mail frequently. It is evident by the result that the highest percentage of students (33.2%) use
social networks like face book several times a day. Most of the respondents used word
processing (37.3%), spreadsheets (40%) and presentation packages (46%) about once a month.
University students intend to use ICT tools which they currently use, more frequently (“use
about once a day=3”) (mean=2.91) in the future. The students agreed (mean=2.95≈3) that in the
future they need to use the participatory media, computer programming, web designing and
online banking etc. which were not used at all by the majority. Further, the students intend to
increase the frequency of using those new ICT tools “about once a day” (mean 2.93) on average.
Results further revealed that the students have an idea to improve their individual ICT use of
different ICT tools.
8.2.4 Extent to which university students use and intention to use ICTs
The highest frequency of University students using ICTs, - “several times a day” was for
communication purposes (25.1%) and other purposes such as entertainment (23.1%). A majority
148
of the students had used ICTs “about once a week” for academic and educational purposes
(27.8%). However, most of the respondents have not used ICTs for technical purposes (53.1%) at
all. Thus, the current overall use of ICTs by the majority of university students was confined to
“about once every week” (29%) which means that the Sri Lankan university students in the
sample appear to have used ICTs to some extent only. However, the results reveal that the
students’ intention on future use is higher for every purpose even though, overall, the current use
is unsatisfactory.
8.2.5 Effect of socio-demographic factors on ICT use and intention to use
The effect of four socio-demographic factors: gender, age group, ICT experience and main
subject stream (Faculty) on current use frequencies of ICTs for various purposes and overall as
well as on behavior intention to future use was examined and yielded the following results.
More male respondents were shown to be using ICTs to a higher extent than female
respondents for social communication use, technical use and other use of ICTs.
Generally, males were more interested in using ICTs.
Current use of ICTs for social communication activities was higher for older (above 25
years) students than for others. However, respondents from the 20-25 age group intended
to use ICT for technical purposes to a greater extent than the other groups.
While academic/ educational use of ICTs was higher for the respondents who have 6-10
years’ ICT experience, in three other uses (social communication, technical and other
purposes) the frequencies were higher for the more experienced (more than 10 years)
respondents than others. The intention related to future use of ICTs for academic/
educational, social communication, other use and the overall use was higher for the more
experienced (more than 10 years) respondents than for others.
Current use frequency for academic purposes, social communication purposes, technical
use, other uses and finally the overall use of ICTs of respondents from Science subject
streams was higher than of those from Arts and Management subject streams. Generally,
the students from the Science stream had more experience in practical applications of
ICTs for their courses. While Science students mostly intended to use ICTs for social
communication activities and other uses such as entertainment in the future, Arts students
intended to use ICTs for technical purposes in the future.

149
8.2.6 Motivations to make full use of ICTs
Majority of the students (43.1%) agreed that they still have not made full use of the ICTs, but
that they intend to use ICTs more in all types of work in the future (mean=3.03). Students
acknowledged the following as important motivating factors:
1 Availability of helping persons in difficulties
2 Having updated trainings/ workshops/ courses regularly
3 Availability of satisfactory facilities
4 Changes of curriculum to be ICT oriented in the future
5 The university policy to develop e-University in the future
More female students as well as Arts students have claimed that they are motivated to make full
use of ICTs if they have updated trainings/ workshops/ courses regularly on ICTs.
Arts students, students in the 20-25 age group and students who have more than 10 years’
experience in using ICTs have claimed that they are motivated to make full use of ICTs if
changes are taking place in the curriculum to be ICT oriented in the future.
Students who possess more than 10 years’ experience in using ICTs have declared that they
would be motivated to make full use of ICTs if the university policy moves to be an e-University
in the future.
8.2.7 Students’ comments on use and future acceptance of ICTs
Even though the universities regularly improve their ICT infrastructure at Faculty levels, a
majority of the students (39.8%) mentioned that they need more facilities to use ICTs. Thirty-one
percent have claimed that they need additional knowledge in using ICTs. However, 22.5% of the
respondents have recognized that they should use ICTs by themselves at a higher level to meet
demand at the job market more successfully. Therefore, raising awareness among students about
the importance of ICT use, integrating use of ICT in both formative and summative assessment
making ICTs compulsory for them will be useful for the future acceptance of ICTs.
8.3 ICT USE AND ACCEPTANCE MODEL
The focus of this research was to formulate a model which best describes the use and acceptance
of ICTs by university students in Sri Lankan universities. The proposed research model
integrated determinants and moderators from prominent theories/models on individual
acceptance of information technology including UTAUT after a review of the empirical studies
in the individual, organizational, and cultural contexts.
150
The proposed research model was tested and modified using the 1551 usable data drawn from
the cross-sectional survey of first year and third year university students in four reputed
universities located in the Colombo area and rural areas. Finally the “ICT Use and Acceptance
Model (ICTUAM)” was finalized using SEM as a statistical technique with AMOS.
ICTUAM is the model which describes the current use behavior and the intention to future use of
ICTs by university students in Sri Lanka. Overall, the structural model had an excellent model
fit: GFI = 0.99, CFI = 0.995, RMSEA = 0.021, PClose = 1.000, and CMIN/df = 1.675.
Moreover, the model is well capable of explaining the variances in four latent constructs by
examining the Square Multiple Correlation (SMC) which is equivalent to the R2 statistic
(Sharma, 1995). SMC value for the current use behavior is 27.3% and for behavior intention to
future use value is 37.1%. The capability in explaining the variances of use behavior and
behavior intention to future use of the model presented a considerable amount over the
technology acceptance theories and models (see Table 2.1 in p.40).
Some features are evident to prove the uniqueness of this model:
1. The model displays a structure with an intrinsic dynamism of the ICT use and acceptance
behavior of university students in Sri Lanka.
2. It integrates prevailing literature in Information Science and includes aspects of linearity and
complexity of the constructs.
3. The model includes cultural dimensions that have not been considered in other ICT use and
acceptance models developed in relation to university students.
4. The socio-demographic and cultural influences were also considered in the model to predict a
best description that cannot be found from other similar models.
Finally, the proposed research model consists of four major determinants of use behavior and the
behavior intention to future use of ICTs: performance expectancy (PE), effort expectancy (EE),
social influence (SI) and facilitating conditions (FC) and four individual characteristics
moderators: gender, age, ICT-experience and faculty (main subject stream) and four individual
cultural moderators: masculinity/femininity, individualism/collectivism, uncertainty avoidance
and power distance.
Performance expectancy
As performance expectancy (or perceived usefulness) has received considerable attention in the
technology acceptance research literature (see Chapter Three), it presents a significant influence
on usage behavior and behavior intention to future use as well in the current model. This
151
suggests that students use and expect to use ICTs because they believe that the ICTs were useful
for them. This perception has motivated them to make use of ICTs for their work.
Effort expectancy
It is evident in the past literature that the effort expectancy (perceived ease of use) has been
found to have a significant influence on behavior intention by many technology acceptance
studies based on UTAUT in university settings (see Chapter Three) and it was found as a
significant determinant for usage behavior too (Kripanont, 2007). However, in the model
developed to the Sri Lankan context the effect of the effort expectancy was not significant for
current ICT usage behavior, but it was a determinant of future acceptance of ICTs by university
students. It may be because the ease associated with ICTs in performing their activities in
university is not much relevant, but the students responded that they tend to use ICTs in the
future because they perceive the ease associated with ICTs is motivating them.
Social influence
While many researchers have argued whether the effect of social influence on behavior intention
in various settings was significant or not (see Chapter Three), some have argued for the
significance of social influence on usage behavior (Schaper & Pervan, 2007; Al-Qeisi, 2009).
However, social influence has no significant influence on current usage behavior in this study.
This may be because students have already had ICT experience even before entering the
university. However, it affects the behavior intention to the future use of ICTs in the current
model as many researchers found in different contexts (see Chapter Three). This means that
students perceive that other important persons (significant others) believe they should use ICTs
in the future and that this concept motivates them towards future acceptance of ICTs.
Facilitating conditions
Facilitating conditions have a significant effect on usage behavior, indicating that the students
believe that institutional and technical infrastructure that exists in the university has made a big
support in using ICTs for their activities. Yet, it did not have a significant effect with the
behavior intention to future use in the current model. This finding, however, was not consistent
with the finding of Venkatesh et al. (2003), Zhou et al. (2010) and Lin et al. (2013).
Usage behavior and behavior intention to future use
As many researchers have shown a significant correlation between behavior intention and usage
behavior, current usage behavior was also a key determinant for the behavior intention to future
use of ICTs in this study.
152
Although many researchers including Venkatesh et al. (2003) found age, gender and experience
as significant moderating factors on technology acceptance, the current model did not find a
significant moderating effect of those factors.
Common subject stream
The common subject stream students follow is a significant moderating factor though there was
no evidence that it has functioned as a moderator in technology acceptance research. The Faculty
which the students belong to, moderated the effect of social influence on behavior intention to
future use of ICTs. That effect is greater for students from the Arts subject streams. It means that
the students from the Arts subject stream perceive that other important persons such as lecturers
believe they should use ICTs in the future and that this belief motivates them towards future
acceptance of ICTs.
Moreover, the moderating effect of the individual cultural factors on the relationships between
determinant and usage behavior and the behavior intention to future use is one of the specific
features found in the current model.
Masculinity/femininity
Thowfeek & Jaafar (2013) found that the masculinity/femininity has a direct effect on
technology adoption. Srite & Karahanna (2006) had found that the masculinity/femininity was a
significant moderating factor for the effect of social norms (social influence) on behavior
intention to use technology and that relationship was stronger for feminine cultures. The same
result was found in the current study indicating that individuals who were aiming at personal
goals such as a friendly atmosphere and warm personal relationships perceived that other
important persons such as lecturers believe they should use ICTs in the future and that this
concept motivates them to future acceptance of ICTs. Moreover, the influence of performance
expectancy on current usage behavior of ICTs is moderated by the masculinity/femininity
cultural factor. Performance expectancy is a stronger determinant of current ICT usage behavior
for individuals who espouse masculine cultural values. This indicates that the individuals who
are aiming at work goals such as, advancement, competitiveness, and performance believed that
the ICTs were useful for their activities in the university.
Individualism/collectivism
Individualism/collectivism had been identified as a moderating factor for the effect of perceived
ease of use on behavior intention to technology performances by Sanchez-Franco et al. (2009)
and it was weighted more strongly by individualism. People with individualistic values prefer to
153
make their own decisions and therefore they themselves decide that the ease associated with
technology on their activities may motivate them to use ICTs in the future. Current study also
showed that the effort expectancy is a stronger determinant on behavior intention to the future
use of ICTs for individuals who espouse individualistic cultural values. Further, the study found
that the effect of social influence on behavior intention to future use of ICTs is higher for the
individuals who espouse collectivistic cultural values. This indicates that students who espoused
collective cultural values expect to use ICTs in the future because they perceive that important
persons such as lecturers believe they should use ICTs. This may be because students with
collectivistic cultures do not prefer to make their own decisions and members of the inner circle
(family, university people and friends) were having the greatest influence (Hofstede & Bond,
1988).
Uncertainty avoidance
While Thowfeek & Jaafar (2013) found that the uncertainty avoidance has a direct effect on
technology adoption, Srite & Karahanna (2006) found to a consistently significant moderating
effect on the relationship between subjective norms and behavioral intention to use, and that this
relationship was stronger for individuals with high levels of espoused uncertainty avoidance.
This was proven by the current study suggesting that individual students who espouse high
uncertainty avoidance cultural values look to their society for cues to propose whether ICT
acceptance is appropriate. Therefore, they tend to accept ICTs since their lecturers, friends and
others expect to use ICTs in the future.
Power distance
Thowfeek & Jaafar (2013) found that the power distance is a significant determinant of
technology acceptance. Simultaneously in their study Srite & Karahanna (2006) introduced
power distance as a significant moderating factor of the effect of social influence on behavior
intention to use technologies. Further, they found that the relationship was stronger for
individuals with low espoused power distance cultural values. A different finding was shown in
the current study for the Sri Lankan context. It revealed that the power distance is a significant
moderator of the influence of the performance expectancy on the behavior intention to future use
of ICTs. Individuals who espouse high power distance values believed performance expectancy
to be a stronger determinant on behavior intention to the future use of ICTs. This clearly
indicates that the students, who were not in a relative position of power, believe that the ICTs are
useful for them and it motivates them to make acceptance of ICTs for their work in the future.
154
8.4 OVERALL IMPLICATIONS OF THE RESEARCH
The empirical evidence of this study offers a valuable contribution to the body of knowledge in
two main aspects–methodological as well as practical.
8.4.1 Methodological contribution
To best describe the current use behavior and the future acceptance of ICTs by university
students in Sri Lanka, a combination of positivist and phenomenological inquiries was adopted
in this study. The dynamism and the feasibility of the problem identified were inquired through
the phenomenological approach. This approach helped to identify the real picture of ICT use
behavior and the related surroundings in the universities and the job market through interviews
and focus group discussions.
The procedure for model development was conducted using a series of statistical tests and it
which was based upon the positivistic approach. It used a structured questionnaire survey. The
researcher visited all selected universities and managed to get the questionnaires completed
accurately having participated with the respondents and therefore the number of missing values
was lower. The data collected was tested for reliability, content validity, construct validity
(discriminant validity) and convergent validity. The methodological process was carried out
using a very relevant statistical method “Structural Equation Modeling (SEM)” which is strongly
recommended to be used for model developing. SEM is a powerful methodology which has a
number of benefits over other multivariate techniques (Byrne 2001, 2006) (see Chapter Four for
more details).
It is apparent that the above methodological contribution is unique to ICT use and acceptance
behavior of university students. This is one of the major methodological contributions of the
present study that expands the knowledge base of Information Science for the university context
in particular.
8.4.2 Practical contribution
It is essential for fresh university graduates to be equipped with ICT capabilities to meet the
demand in the present job market. Therefore it is very important for university administrators to
recognize the elements that play a role to promote ICT use and acceptance behavior of university
students. Hence, the contribution of the key findings of this study provides significant benefits
not only for individual students, but also to the Universities in Sri Lanka as well as the country.
According to the results presented in Chapter Six, a number of practical implications could be
drawn to motivate students to make full use of ICTs for their work. Moreover, the ICT use and
155
acceptance model (ICTUAM) provides a better understanding about association of core
determinants and current use behavior and behavior intention to future use of ICTs and the
impact of the important moderating factors. This model in terms of both parsimony and its
contribution to understanding will support to promote ICT use of university students in Sri
Lanka.
As mentioned earlier, students claimed the necessity for satisfactory facilities, for helping staff
and updated regular courses, an ICT oriented curriculum and the e-university policy to motivate
to make full use of the ICTs. Also they commented that they need more facilities to use ICTs and
future acceptance and a facilitating condition was one of the significant key determinants of the
ICTUAM. If universities and the Government make use of this knowledge whenever necessary
by considering the availability of satisfactory facilities, training, helping staff and by paying
attention on changing curricula and policies towards ICTs that will certainly encourage students
to make better use of the ICTs at a satisfactory level. Further, universities and the government
could pay their attention to provide regular training or courses which are found to be very
significant in encouraging individuals to have more self-confidence in their use of ICTs.
In considering the impact of common subject streams on the model, social influence should be
given more attention in promoting future acceptance of ICTs for Arts students. It implies that
universities have to play an important role to encourage Arts students to use ICTs.
Moreover, the ICTUAM presents the impact of the individual cultural values on ICT use and
acceptance behavior which can then be useful as individual distinction constructs in theoretical
models and they will enhance conceptual understanding of the phenomenon. Moderating effects
of the cultural factors have direct managerial implications. Espoused cultural values (particularly
masculinity/femininity and uncertainty avoidance) influence technology implementation
reactions cause to alleviate resistance to use (Srite & Karahanna, 2006). Social influence is a
significant determinant on the behavior intention to future use of ICTs in the ICTUAM and
masculinity/femininity, individualism/collectivism and uncertainty avoidance appear to have
moderated this effect. Hence, for individuals high on uncertainty avoidance and high on
femininity, improvement of the social environment provides an effective mechanism to
encourage acceptance of ICTs. The moderating effect of individualism/collectivism implies that
social influence needs to be conceptualized in a more distinctive manner to capture minor
changes of the social environment (Srite & Karahanna, 2006).
156
Further, the moderating effect of uncertainty avoidance on acceptance behavior may be
important for management to identify uncertainty reduction mechanisms to make possible
acceptance behaviors. They provide a clear indication from management on expectations with
respect to acceptance of the technology, user support groups, structured learning opportunities,
and availability of situated training (Srite & Karahanna, 2006). Moreover, the espoused power
distance values indicate a preference to influence the impact of authority referents on behavior
(Tyler et al., 2000). Espoused individualism/collectivism values indicate a preference to
influence the impact of in-group referents on behavior (Bond & Smith, 1996).
Finally, the ICTUAM will support to implement university policy and National Policies
especially to increase ICT use and acceptance in universities and also influence the development
of the National Policy of e-university towards e-Sri Lanka.
8.5 LIMITATIONS OF THE STUDY
This study was conducted reviewing a wide range of theoretical viewpoints and with a
considerably larger sample representing university students in Sri Lanka. Hence the results of
this study can be considered as very significant. However, there are some shortcomings and
limitations in the approaches of the study.
This study was restricted to four national universities in Sri Lanka instead of the entire number
(15) of universities. However, this restriction was alleviated by selecting two universities in the
Colombo area and two outside Colombo, which sample can be considered as a reasonably
representative sample of the universities.
The current study used a cross-sectional sample. The causal relationships can be inferred but
cannot be strictly proven with cross-sectional samples. Before-after measures in a longitudinal
research design with requisite controls may be well suited to properly test causality of ICT use
and acceptance. Longitudinal studies take a much longer time and they are practically difficult to
conduct. However, such investigations are too advanced to study the issues of technology
acceptance.
8.6 SUGGESTIONS FOR FURTHER RESEARCH
By considering the scope and the limitations of this study, there may be further research
opportunities in a wider scope using the model developed (ICTUAM) under the current study.
The same model may be used in the future considering all common subject streams in all 15
universities in Sri Lanka.
157
Further, considering the technology adoption in the higher education context, many more useful
moderating effects other than age, gender, experience and common subject stream may be
significant (see Chapter Four for more factors). Moderating effects specific to the Sri Lankan
context could be incorporated to the model with a bigger sample size to well describe the ICT
use and acceptance behavior.
Since the current study was conducted in Sri Lanka, further expansion and comparison involving
university students outside Sri Lanka, with differing ICT uses, methods, different ICT tools, and
other education levels can be conducted.
Though the results of this study were compared with the results of other studies conducted in
different countries, these results are very specific to university students in Sri Lanka. Hence,
there is space for additional and further investigations.
It was found that the individual culture had a significant influence on ICT use and acceptance.
This would give rise to another path of comparative research that could help universities
understand national cultural differences pertaining to ICT use and acceptance behavior.
Comparing the results with other cultural contexts (countries) may be relevant, useful and
valuable for the universities and countries too.
The current study employed a unique methodology specific to the research problem for the
study. Therefore, it is a very significant contribution to the relevant body of knowledge. This
methodology could be used for further research studies to examine its strength making
generalizations in different contexts.
8.7 SUMMARY
This chapter linked research objectives to the key findings of the study along with the research
limitations and implications. Methodological contributions and practical contributions identified
as specific to the use and acceptance of ICTs in the university context, it is argued, are useful for
future researchers.
The model developed (ICTUAM) was finalized with an excellent model fit and it describes the
current use behavior and the intention to the future use of ICTs by university students in Sri
Lanka. Performance expectancy and facilitating conditions are the determinants which describe
the current ICT use behavior. Further, the performance expectancy, effort expectancy, social
influence and current use behavior all play important roles in determining the behavior intention
to future use of ICTs.
158
Masculinity/femininity has a significant moderating effect on the relationship between
performance expectancy and current use behavior. Power distance was seen to moderate the
relationship between performance expectancy and the behavior intention to future use of ICTs.
The relationship between the social influence and behavior intention to future use of ICTs is
moderated by the common subject stream, masculinity/femininity, individualism/collectivism
and uncertainty avoidance. Individualism/collectivism has a significant moderating effect on the
relationship between effort expectancy and behavior intention to future use of ICTs.
However, the core findings and the model developed (ICTUAM) under this study provide crucial
information not only to the universities in Sri Lanka but also at the national level.
159
BIBLIOGRAPHY
Aggestam, J., & Hallberg, A. (2004). Unemployment in Sri Lanka: Explanations, constraints and
prospects for the future (Bachelor thesis). Lund University, School of Economics and
Management. Retrieved from
http://lup.lub.lu.se/luur/download?func=downloadFile&recordOId=1337285&fileOId=16
46423
Ajzen, I. (1985). From Intentions to Actions: A Theory of Planned Behavior. In P. D. J. Kuhl &
D. J. Beckmann (Eds.), Action Control (pp. 11–39). Springer Berlin Heidelberg.
Retrieved from
http://search.epnet.com/login.aspx?direct=true&db=aph&authdb=epref&an=ACFCB.AJ
ZEN.SPRINGER.AIHE.AA
Ajzen, I. (1991). The theory of planned behaviour. Organisational Behaviour and Human
Decision Processes, 50(2), 179–211.
Ajzen, I., & Fishbein, M. (1977). Attitude-behavior relations: A theoretical analysis and review
of empirical research. Psychological Bulletin, 84(5), 888–918. doi:10.1037/0033-
2909.84.5.888
Akaike, H. (1974). A new look at the statistical model identification. IEEE Transactions on
Automatic Control, 19(6), 716–723. doi:10.1109/TAC.1974.1100705
Al-Gahtani, S. (2001). The applicability of TAM outside North America: An empirical test in the
United Kingdom. Inf. Resour. Manage. J., 14(3), 37–46. doi:10.4018/irmj.2001070104
Ali, M., Brooks, L., Alshawi, S., & Papazafeiropoulou, A. (2006). Cultural dimensions and CRM
systems implementation: A preliminary framework. AMCIS. Retrieved from
http://bura.brunel.ac.uk/handle/2438/1877
Al-Qeisi, K. I. (2009). Analyzing the use of UTAUT model in explaining an online behaviour:
Internet banking adoption (Thesis). Brunel University Brunel Business School PhD
Theses. Retrieved from http://bura.brunel.ac.uk/handle/2438/3620
Amarasinghe, A. (2012). 11.8% Internet Penetration? Is This Really Enough? Retrieved from
http://www.amisampath.com/2012/02/118-internet-penetration-is-this-really.html
American heritage dictionary of the english language. (2013). Retrieved February 2, 2013, from
https://www.ahdictionary.com/
Amichai-Hamburger, Y., & Vinitzky, G. (2010). Social network use and personality. Computers
in Human Behavior, 26(6), 1289–1295. doi:10.1016/j.chb.2010.03.018
160
Anandarajan, M., Igbaria, M., & Anakwe, U. P. (2000). Technology acceptance in the banking
industry. Information Technology & People, 13(4), 298–312.
doi:10.1108/09593840010359491
Anderson, P. F. (1983). Marketing, scientific progress, and scientific method. Journal of
Marketing, 47(4), 18–31. doi:10.2307/1251395
Arbuckle, J. (2007). Amos 16.0 User’s Guide. Marketing Department, SPSS Incorporated.
Archer, W., Anderson, T., & Garrison, R. (1999). Adopting disruptive technologies in traditional
universities: Continuing education as an incubator for innovation. Canadian Journal of
University Continuing Education, 25(1), 13–30.
Aryasinha, R. (2002). The internet in South Asia: Opportunities and challenges. Daily News,
Associated Newspapers of Ceylon Ltd.,. Colombo. Retrieved from
http://archives.dailynews.lk/2002/01/30/fea09.html
Aturupane, H. (2008). Celebrating 60 years of educational progress and challenges in education
in Sri Lanka. Presented at the 60’th Anniversary Celebrations of Sri Lanka, Westminster,
London: Council for education in the commonwealth. Retrieved from
http://www.cecomm.org.uk/resources/reports-a-conferences/126-celebrating-60-years-of-
educational-progress-and-challenges-in-education-in-sri-lanka
Avci, U., & Askar, P. (2012). The Comparison of the opinions of the university students on the
usage of blog and wiki for their courses. Educational Technology & Society, 15(2), 194–
205.
Ayele, A. A., & Sreenivasarao, V. (2013). A case study of acceptance and use of electronic
library services in universities based on SO-UTAUT model. International Journal of
Innovative Research in Computer and Communication Engineering, 1(4), 903–911.
Bagozzi, R. P., Wong, N., Abe, S., & Bergami, M. (2000). Cultural and situational contingencies
and the theory of reasoned action: Application to fast food restaurant consumption.
Journal of Consumer Psychology, 9(2), 97–106. doi:10.1207/S15327663JCP0902_4
Baker, W. (2001). A national survey of the Vermont visitor 2000: Outdoor recreation
supplement. Retrieved February 13, 2011, from http://www.uakron.edu/cba/cba-
home/about-us/directory/profile.dot?identity=1198240
Bandura, A. (1977). Self-efficacy: Toward a unifying theory of behavioral change.
Psychological Review, 84(2), 191–215. doi:10.1037/0033-295X.84.2.191
Bandura, A. (1986). Social foundations of thought and action: a social cognitive theory.
Prentice-Hall.
161
Barrett, P. (2007). Structural equation modelling: Adjudging model fit. Personality and
Individual Differences, 42(5), 815–824. doi:10.1016/j.paid.2006.09.018
Basar, S. (2012). Factors influencing continuance intention to use student portal among
university college Shahputra’s students. Asian Forum on Business Education, 5(3), 275–
291.
Benbasat, I., & Barki, H. (2007). Quo vadis TAM? Journal of the Association for Information
Systems, 8(4). Retrieved from http://aisel.aisnet.org/jais/vol8/iss4/16
Bentler, P. M., & Bonett, D. G. (1980). Significance tests and goodness of fit in the analysis of
covariance structures. Psychological Bulletin, 88(3), 588–606. doi:10.1037/0033-
2909.88.3.588
Beynon-Davies, P. (2002). Information systems: An introduction to informatics in organisations.
Basingstoke: Palgrave Macmillan.
Bhattacherjee, A. (2001). Understanding information systems continuance: An expectation-
confirmation model. MIS Quarterly, 25(3), 351–370. doi:10.2307/3250921
Bhattacherjee, A., & Premkumar, G. (2004). Understanding changes in belief and attitude toward
information technology usage: a theoretical model and longitudinal test. MIS Quarterly,
28(2), 229–254.
Biasutti, M., & EL-Deghaidy, H. (2012). Using wiki in teacher education: impact on knowledge
management processes and student satisfaction. Computers & Education, 59(3), 861–
872. doi:10.1016/j.compedu.2012.04.009
Blurton, C. (1999). New directions of ICT-use in education (Communication and Information)
(p. 51). UNESCO. Retrieved from
http://www.unesco.org/education/educprog/lwf/dl/edict.pdf
Bollen, K. A. (1989). Structural equations with latent variables. New York: Wiley-Interscience.
Bond, R., & Smith, P. B. (1996). Culture and conformity: A meta-analysis of studies using
Asch’s. Psychol Bull, 111–137.
Brown, S., Dennis, A., & Venkatesh, V. (2010). Predicting collaboration technology use:
Integrating technology adoption and collaboration research. J. Manage. Inf. Syst., 27(2),
9–54. doi:10.2753/MIS0742-1222270201
Buarki, H. J. (2010). Towards an improvement of LIS graduates ICT skills and employability
needs in Kuwait (Thesis). Loughborough University, Loughborough, Leicestershire, UK.
Retrieved from https://dspace.lboro.ac.uk/dspace-jspui/handle/2134/6339
Burch, T. K. (2003). Demography in a new key: A theory of population theory. Demographic
Research, 9(11), 263–284. doi:10.4054/DemRes.2003.9.11
162
Byrne, B. M. (1998). Structural equation modeling with lisrel, prelis, and simplis: Basic
concepts, applications, and programming. Mahwah, N.J: Psychology Press.
Byrne, B. M. (2001). Structural equation modeling with AMOS: Basic concepts, applications,
and programming. Mahwah, New Jersey, USA: Taylor & Francis.
Byrne, B. M. (2006). Structural equation modeling with EQS: Basic concepts, applications, and
programming (2nd ed.). Mahwah, New Jersey, USA: Lawrence Erlbaum Associates.
Cardon, P. W., & Marshall, B. A. (2008). National culture and technology acceptance: The
impact of uncertainty avoidance. Issues In Information Systems, 2, 103–110.
Carson, D. J., Gilmore, A., Perry, C., & Gronhaug, K. (2001). Qualitative Marketing Research.
London ; Thousand Oaks, Calif: SAGE Publications Ltd.
Central Bank. (2009). The towers of learning: Performance, peril and promise of higher
education in Sri Lanka (Central Bank Report). Colombo: The World Bank Colombo
Office. Retrieved from
http://siteresources.worldbank.org/SOUTHASIAEXT/Resources/Publications/TOLreport
final.pdf
Central Bank. (2010). Central bank of Sri Lanka annual report 2010 (Annual Report). Colombo:
Central Bank of Sri Lanka. Retrieved from
http://www.cbsl.gov.lk/pics_n_docs/10_pub/_docs/efr/annual_report/AR2010/English/co
ntent.htm
Chang, N., Chiang, C., & Hopkinson, A. (2013). A Study of user acceptance using google
software as a service (Saas). In International Conference on Computer, Networks and
Communication Engineering (ICCNCE 2013). Atlantis Press.
doi:10.2991/iccnce.2013.18
Chen, J. L. (2011). The effects of education compatibility and technological expectancy on e-
learning acceptance. Computers & Education, 57(2), 1501–1511.
doi:10.1016/j.compedu.2011.02.009
Chou, S. W., & Liu, C.-H. (2005). Learning effectiveness in a web-based virtual learning
environment: a learner control perspective. Journal of Computer Assisted Learning,
21(1), 65–76. doi:10.1111/j.1365-2729.2005.00114.x
Christine Greenhow. (2011). Online social networks and learning. On the Horizon, 19(1), 4–12.
doi:10.1108/10748121111107663
Cohen, L., Manion, L., & Morrison, K. (2000). Research methods in education (5th ed.).
London ; New York: RoutledgeFalmer.
163
Colley, A., & Comber, C. (2003). Age and gender differences in computer use and attitudes
among secondary school students: What has changed? Educational Research, 45(2), 155–
165. doi:10.1080/0013188032000103235
Collis, B. (1999). Designing for differences: Cultural issues in the design of WWW-based
course-support sites. British Journal of Educational Technology, 30(3), 201–215.
doi:10.1111/1467-8535.00110
Combes, B. (2009). Generation Y: Are they really digital natives or more like digital refugees?
Synergy, 7(1), 31–40.
Compeau, D. R., & Higgins, C. A. (1991). A social cognitive theory perspective on individual
reactions to computing technology. In Proceedings of the Twelfth International
Conference on Information Systems (pp. 187–198). Minneapolis, MN, USA: University
of Minnesota. Retrieved from http://dl.acm.org/citation.cfm?id=126686.150733
Compeau, D. R., & Higgins, C. A. (1995). Computer self-efficacy: Development of a measure
and initial test. MIS Quarterly, 19(2), 189–211. doi:10.2307/249688
Conole, G., & Alevizou, P. (2010). A literature review of the use of web 2.0 tools in higher
education (Are portcommissioned by the Higher Education Acade). Walton
Hall, Milton Keyne, UK: The Open University. Retrieved from
http://www.heacademy.ac.uk/assets/EvidenceNet/Conole_Alevizou_2010.pdf
Conole, G., De Laat, M., Dillon, T., & Darby, J. (2008). “Disruptive technologies”, “pedagogical
innovation”: What’s new? findings from an in-depth study of students’ use and
perception of technology. Computers & Education, 50(2), 511–524.
doi:10.1016/j.compedu.2007.09.009
Cooper, D. R. (2008). Business research methods (10th ed.). Boston: McGraw-Hill.
Country plan for ICT education in Sri Lanka. (2007). Presented at the ICT for education
Leaders: from vision to reality international forum, Seoul Korea. Retrieved from
http://info.worldbank.org/etools/docs/library/243150/day5Sri%20Lanka.pdf
Cox, B. G. (2008). Target population. Retrieved March 11, 2011, from
http://srmo.sagepub.com/view/encyclopedia-of-survey-research-methods/n571.xml
Cronbach, L. J. (1951). Coefficient alpha and the internal structure of tests. Psychometrika,
16(3), 297–334. doi:10.1007/BF02310555
Crossan, F. (2003). Research philosophy: Towards an understanding. Nurse Researcher, 11(1),
46–55. doi:10.7748/nr2003.10.11.1.46.c5914
David, M., & Sutton, C. (2004). Social research: The basics. London ; Thousand Oaks: SAGE
Publications Ltd.
164
Davies, M. W. (1988). Women clerical workers and the typewriter: The writing machine. In C.
Kramarae (Ed.), Technology and women’s voices: keeping in touch. New York:
Routledge.
Davis, F. D. (1989). Perceived usefulness, perceived ease of use, and user acceptance of
information technology. MIS Quarterly, 13(3), 319–340. doi:10.2307/249008
Davis, F. D., Bagozzi, R. P., & Warshaw, P. R. (1989). User acceptance of computer technology:
A comparison of two theoretical models. Management Science, 35(8), 982–1003.
Davis, S. F., Grover, C. A., Becker, A. H., & McGregor, L. N. (1992). Academic Dishonesty:
Prevalence, Determinants, Techniques, and Punishments. Teaching of Psychology, 19(1),
16–20. doi:10.1207/s15328023top1901_3
Day, D. (2006). Cultural aspects of user interface acceptance. In International encyclopedia of
ergonomics and human factors (Vol. 1, pp. 1067–1070).
Department of National Planning. (2010). The Emerging Wonder of Asia Mahinda Chinthana -
Vision for the Future: The Development Policy Framework Government of Sri Lanka. Ministry
of Finance and Planning, Sri Lanka.
Dewey, J. (1943). The child and the curriculum; The school and society. Chicago: University of
Chicago Press.
De Wit, K., Heerwegh, D., & Verhoeven, J. C. (2011). Changes in the basic ICT skills of
freshmen between 2005 and 2009: Who’s catching up and who’s still behind? Education
and Information Technologies, 17(2), 205–231. doi:10.1007/s10639-011-9154-z
Diamantopoulos, A., & Schlegelmilch, B. (1997). Taking the fear out of data analysis. London:
Cengage Learning EMEA.
Diamantopoulos, A., & Siguaw, J. A. (2000). Introducing LISREL: A Guide for the Uninitiated.
SAGE.
Dillon, A., & Morris, M. (2006). User acceptance of information technology: Theories and
models. Annual Review of Information Science and Technology, 31, 3–32.
Dillon, A., & Morris, M. G. (1996). User acceptance of information technology: Theories and
models. Annual Review of Information Science and Technology (ARIST), 31, 3–32.
Dougherty, J. P., Dececchi, T., Clear, T., Richards, B., Cooper, S., & Wilusz, T. (2002).
Information technology fluency in practice. In Working Group Reports from ITiCSE on
Innovation and Technology in Computer Science Education (pp. 153–171). New York,
NY, USA: ACM. doi:10.1145/782941.782999
Dulle, W. F. (2010). An analysis of open access schorlarly communication Tanzanian public
universities (Thesis). Retrieved from http://uir.unisa.ac.za/handle/10500/3684
165
Dutta, S., & Mia, I. (2011). The global information technology report 2010-2011 (p. 435). World
Economic Forum. Retrieved from http://www.weforum.org/reports/global-information-
technology-report-2010-2011-0
Dwivedi, Y., Williams, M., Lal, B., & Schwartz, A. (2008). Profiling adoption, acceptance and
diffusion research in the information systems discipline. In Proceedings of the 16th.
European Conference on Information Systems (pp. 1204–1215). Ireland. Retrieved from
http://aisel.aisnet.org/ecis2008/112/
Easterby-Smith, M., Thorpe, R., Jackson, P., & Lowe, A. (2008). Management research.
London: Sage Publications.
Ebner, M., Lienhardt, C., Rohs, M., & Meyer, I. (2010). Microblogs in higher education – a
chance to facilitate informal and process-oriented learning? Computers & Education,
55(1), 92–100. doi:10.1016/j.compedu.2009.12.006
Edirisuriya, M. (2006). The sustainability of ICT education in Sri Lanka. University of
Moratuwa, Moratuwa. Retrieved from http://dl.lib.mrt.ac.lk/handle/123/466
El-Gayar, O. F., & Moran, M. (2006). College students’ acceptance of tablet PCs: An application
of the UTAUT model. In In Annual meeting of the decision sciences institute conference
proceedings (Vol. 2845–2850).
Ellis, C. (2001). Innovation in education: The increasing digital world—issues of today and
tomorrow. Presented at the National IT Workforce Convocation of the Information
Technology Association of America, San Diego, California. Retrieved from
http://www.intel.com/education/community/contribution
Escobar-Rodriguez, T., Carvajal-Trujillo, E., & Monge-Lozano, P. (2013). Factors that drive
students to use Facebook as a learning tool: An extension of the UTAUT. Retrieved from
http://www.ugr.es/~dbuendia/IX%20Jornada%20de%20Docencia.pdf
Fary, B. A. (1984). Computer literacy for staff development. AEDS Journal, 17(4), 1–8.
doi:10.1080/00011037.1984.11008372
Festinger, L. A. (1957). Theory of cognitive dissonance. Evanston, IL: Row and Peterson.
Field, A. (2005). Project 2: Design a questionnaire. Retrieved from
http://www.statisticshell.com/p roject2.pdf
Fishbein, M., & Ajzen, I. (1975). Belief, attitude, intention and behavior: an introduction to
theory and research. Reading, Mass: Addison-Wesley Pub.
Forbes, D. A., King, K. M., Kushner, K. E., Letourneau, N. L., Myrick, A. F., & Profetto-
McGrath, J. (1999). Warrantable evidence in nursing science. Journal of Advanced
Nursing, 29(2), 373–379.
166
Gable, G. G. (1994). Integrating case study and survey research methods: An example in
information systems. European Journal of Information Systems, 3(2), 112–126.
Garrido, M., Sullivan, J., Gordon, A., & Coward, C. (2009). Researching the links between ICT
skills and employability: An analytical framework (CIS Working Paper No. 4). Seattle,
WA 98195 USA: Center for Information & Society (CIS), University of Washington.
Retrieved from www.cis.washington.edu/employability
Gay, G., Mahon, S., Devonish, D., Alleyne, P., & Alleyne, P. (2006). Perceptions of information
and communication technology among undergraduate management students in Barbados.
International Journal of Education and Development Using ICT, 2(4). Retrieved from
http://ijedict.dec.uwi.edu/viewarticle.php?id=223&layout=html
Gefen, D., & Straub, D. W. (1997). Gender differences in the perception and use of E-Mail: An
extension to the technology acceptance model. MIS Quarterly, 21(4), 389–400.
doi:10.2307/249720
Gill, J., & Johnson, P. (2002). Research methods for managers. London: SAGE.
Godamanna, E. H., & Jayamaha, A. (2013). Information and communication technology
facilitated education in national universities of Sri Lanka. Journal of Emerging Trends in
Educational Research and Policy Studies (JETERAPS), 4(5), 726–732.
Gogus, A., Nistor, N., Riley, R. W., & Lerche, T. (2012). Educational Technology Acceptance
across Cultures: A validation of the unified theory of acceptance and use of technology in
the context of Turkish national culture. Turkish Online Journal of Educational
Technology - TOJET, 11(4), 394–408.
Goodhue, D. L. (1995). Understanding user evaluations of information systems. Management
Science, 41(12), 1827–1844.
Goodhue, D. L., & Thompson, R. L. (1995). Task-technology fit and individual performance.
MIS Quarterly, 19(2), 213–236. doi:10.2307/249689
Gray, R. (2004). No longer a man: Using ethnographic fiction to represent life history research.
Auto/biography, 12(1), 44–61. doi:10.1191/0967550704ab005oa
Gronland, M. (2010). User acceptance of information technology: An empirical study of it’s
learning. Norwegian University of Science and Technology, Norwegian. Retrieved from
http://ntnu.diva-portal.org/smash/get/diva2:349980/FULLTEXT01
Gruzd, A., Staves, K., & Wilk, A. (2012). Connected scholars: Examining the role of social
media in research practices of faculty using the UTAUT model. Computers in Human
Behavior, 28(6), 2340–2350. doi:10.1016/j.chb.2012.07.004
167
Gunawardana, K. D. (2005). An empirical study of potential challenges and benefits of
implementing e-learning in Sri Lanka. In Proceed ings of t h e Se cond In tern ational
Con f eren ce on eL earning for Knowledg e- Based Soc iet y (Vol. 33, pp. 1–8).
Bangkok, Thaila nd. Retrieved from
http://www.journal.au.edu/ijcim/2005/specialaug05/PP33.pdf
Hair, J. F., Tatham, R. L., Anderson, R. E., & Black, W. (1998). Multivariate data analysis (5th
ed.). Upper Saddle River, N.J: Prentice Hall.
Hair, J. J., Black, W. C., Babin, B. J., Anderson, R. E., & Tatman, R. L. (2006). Multivariate
data analysis (6th ed.). New Jersey: Prentice Hall.
Han, S. (2003). Individual adoption of information systems in organisations: A literature review
of technology acceptance model (Technical Report No. 540). TUCS. Retrieved from
http://www.google.lk/url?sa=t&rct=j&q=&esrc=s&source=web&cd=1&ved=0CCEQFjA
A&url=http%3A%2F%2Ftucs.fi%2Fpublications%2Fattachment.php%3Ffname%3DTR
540.pdf&ei=w0e2VOLmB46LuwTMhoKQCw&usg=AFQjCNE3aqKMPLQ-
rj07OHAct2TlDl4Y_Q&bvm=bv.83640239,d.c2E
Herath, H. M. T. S., & Ranasinghe, A. (2011). Labour market prospects for business graduates in
Sri Lanka. International Journal of Social Science and Humanity, 1(1), 26–30.
Hewagamage, K. P. (2009). Information Technology proficiency of undergraduates in higher
education institutes in Sri Lanka (Final report). University of Colombo School of
Computing (UCSC).
Hewagamage, K. P. (2013). Expected ICT Literacy & Professional Levels. Lecture Note.
Retrieved from
http://www.google.com/url?sa=t&rct=j&q=&esrc=s&source=web&cd=1&ved=0CB8QFj
AA&url=http%3A%2F%2Fwww.ruh.ac.lk%2FUni%2Fhetc%2FUDG%2520-
%2520Training%2520Materials%2FPresentations%2FLec%25203.%2520Expected%252
0IT%2520Proficiency%2520Levels%2520by%2520Dr.%2520KPH.ppt&ei=kmbpVM_A
OcyLuwSMqoHICA&usg=AFQjCNFQV7mFq1rcNB0anjAwIeAK3kwuog&bvm=bv.86
475890,d.c2E
Higher education for twenty first century project. (2014). Outline of the areas covered in the
UCTIT exam. Ministry of higher education. Retrieved from
http://www.hetc.lk/exams/documents/uctit_details_students.pdf
Hilberg, J. S., & Meiselwitz, G. (2008). Undergraduate fluency with information and
communication technology: Perceptions and reality. In Proceedings of the 9th ACM SIGITE
168
Conference on Information Technology Education (pp. 5–10). New York, NY, USA: ACM.
doi:10.1145/1414558.1414562
Hofstede, G. (1980). Culture’s consequences: International differences in work-related values
(Abridged edition). Beverly Hills: SAGE Publications, Inc.
Hofstede, G. (2001). Culture’s consequences: comparing values, behaviors, institutions and
organizations across nations (2nd edition). Thousand Oaks, Calif.: SAGE Publications,
Inc.
Hofstede, G. (2008). Cultural differences in teaching and learning. Presentation slides presented
at the FUHU conference on education and training in the multicultural classroom
copenhagen. Retrieved from http://www. FBE_geert_hofstede_teaching_learning-1.pdf
Hofstede, G., & Bond, M. H. (1988). The confucius connection: From cultural roots to economic
growth. Organizational Dynamics, 16(4), 5–21. doi:10.1016/0090-2616(88)90009-5
Hofstede, G. H. (1997). Cultures and organizations: software of the mind. McGraw-Hill.
Hofstede, G., & McCrae, R. R. (2004). Personality and culture revisited: Linking traits and
dimensions of culture. Cross-Cultural Research, 38(1), 52–88.
doi:10.1177/1069397103259443
Holmes, B. (1998). Cross-cultural differences of use of information technology in education: A
comparative study of the use of computers in Japanese and British classrooms.
University of Cambridge, Wolfson College.
Holmes-Smith, C. E., & Coote, L. (2006). Structural equation modeling: From the fundamentals
to advanced topics. School Research, Evaluation and Measurement Services.
Holmes-Smith, P. (2000). Introduction to structural equation modelling using AMOS 4.0:
Course notes. Melbourne: SREAMS.
Hsu, M. H., Chiu, C. M., & Ju, T. L. (2004). Determinants of continued use of the WWW: An
integration of two theoretical models. Industrial Management & Data Systems, 104(9),
766–775. doi:10.1108/02635570410567757
Hu, L., & Bentler, P. M. (1999). Cutoff criteria for fit indexes in covariance structure analysis:
Conventional criteria versus new alternatives. Structural Equation Modeling: A
Multidisciplinary Journal, 6(1), 1–55. doi:10.1080/10705519909540118
Hussey, J., & Hussey, R. (1997). Business research: A practical guide for undergraduate and
postgraduate students. Basingstoke, Hampshire: Macmillan Business.
ICT market analysis. (2008). Retrieved August 7, 2010, from
http://www.marketsmonitor.com/Market-Research/IT.html
169
Im, I., Hong, S., & Kang, M. S. (2011). An international comparison of technology adoption:
Testing the UTAUT model. Information & Management, 48(1), 1–8.
doi:10.1016/j.im.2010.09.001
Internet world stats: Usage and population statistics. (2011). Internet world stats. Retrieved from
http://www.internetworldstats.com/asia/lk.htm
Ito, M., Antin, J., Finn, M., Law, A., Manion, A., Mitnick, S., … Horst, H. A. (2009). Hanging
out, messing around, and geeking out: Kids living and learning with new media. MIT
Press.
Jayasundara, C. C. (2009). Developing a model for predicting customer satisfaction in relation to
service quality in university libraries in Sri Lanka (Thesis). University of South Africa,
South Africa. Retrieved from http://archive.cmb.ac.lk/research/handle/70130/169
Jing, Z., Jinghua, H., & Junquan, C. (2010). Empirical research on user acceptance of mobile
searches. Tsinghua Science and Technology, 15(2), 235–245. doi:10.1016/S1007-
0214(10)70056-0
Johnson, L., Levine, A., & Smith, R. (2009). The Horizon Report: new media consortium and
EDUCAUSE learning initiative. NMC. Retrieved from http://www.nmc.org/pdf/2009-
Horizon-Report.pdf
Jones, C., Ramanau, R., Cross, S., & Healing, G. (2010). Net generation or digital natives: Is
there a distinct new generation entering university? Computers & Education, 54(3), 722–
732. doi:10.1016/j.compedu.2009.09.022
Jones, C., & Shao, B. (2011). The net generation and digital natives: implications for higher
education [Other]. Retrieved February 12, 2012, from
http://www.heacademy.ac.uk/resources/detail/evidencenet/net-generation-and-digital-
natives
Jöreskog, K. G., & Sörbom, D. (1996). LISREL 8: User’s reference guide. Scientific Software
International.
Kahn, R. L., & Cannell, C. F. (1957). The dynamics of interviewing: Theory, technique, and
cases. New York: Wiley.
Kaminiski, K., Seel, P., & Cullen, K. (2003). Technology literate students: a survey of freshman
students at Colorado State university measured their self-determined ability to use
technology. EDUCAUSE Quarterly, 3, 34–40.
Kaminski, K., Switzer, J., & Gloeckner, G. (2009). Workforce readiness: A study of university
students’ fluency with information technology. Computers & Education, 53(2), 228–233.
doi:10.1016/j.compedu.2009.01.017
170
Kasse, J. P., & Balunywa, W. (2013). An assessment of e-learning utilization by a section of
Ugandan universities: Challenges, success factors and way forward. In Proceedings of
the International Conference on ICT for Africa 2013. Harare, Zimbabwe.
Kennedy, G., Dalgarno, B., Gray, K., Judd, T., Waycott, J., Bennett, S., … Churchwood, A.
(2007). The net generation are not big users of web 2.0 technologies: Preliminary
findings. Faculty of Education - Papers (Archive), 517–525.
Kennedy, G. E., Judd, T. S., Churchward, A., Gray, K., & Krause, K.-L. (2008). First year
students’ experiences with technology: are they really digital natives? Australasian
Journal of Educational Technology, 24(1), 108–122.
Kenny, D. A., & McCoach, D. B. (2003). Effect of the number of variables on measures of fit in
structural equation modeling. Structural Equation Modeling, 10(3), 333–351.
doi:10.1207/S15328007SEM1003_1
Keynes, J. M. (1936). The general theory of employment, interest, and money. London:
Macmillan. Retrieved from http://ebooks.adelaide.edu.au/k/keynes/john_maynard/k44g/
Khalifa, M., & Liu, V. (2002). Explaining satisfaction at different stages of adoption in the
context of internet-based services. In ICIS 2002 Proceedings. Barcelona, Spain, 15–18
December. Retrieved from http://aisel.aisnet.org/icis2002/14
King, W. R., & He, J. (2006). A meta-analysis of the technology acceptance model. Information
& Management, 43(6), 740–755. doi:10.1016/j.im.2006.05.003
Klamma, R., Chatti, M. A., Duval, E., Hummel, H., Hvannberg, E. T., Kravcik, M., … Scott, P.
(2007). Social software for life-long learning. Journal of Educational Technology &.
Society, 10(3), 72–83.
Kothari, C. R. (2004). Research methodology: Methods and techniques. New Delhi: New Age
International.
Krejcie, R. V., & Morgan, D. W. (1970). Determining sample size for research activities.
Educational and Psychological Measurement, 30(3), 607–610.
doi:10.1177/001316447003000308
Kremelberg, D. (2010). Practical statistics: A quick and easy guide to IBM® SPSS® statistics,
STATA, and other statistical software. Los Angeles: SAGE Publications, Inc.
Kripanont, N. (2007). Examining a technology acceptance model of Internet usage by academics
within Thai business schools (phd). Victoria University. Retrieved from
http://www.vu.edu.au/research
Krueger, R. A., & Casey, M. A. (2000). Focus groups: A practical guide for applied research.
Thousand Oaks: Sage.
171
Kumpulainen, K. (2007). Educational technology: Opportunities and challenges. Oulu, Finland:
University of Oulu. Retrieved from
http://herkules.oulu.fi/isbn9789514284069/isbn9789514284069.pdf
Lai, C., & Gu, M. (2011). Self-regulated out-of-class language learning with technology.
Computer Assisted Language Learning, 24(4), 317–335.
doi:10.1080/09588221.2011.568417
Lankton, N., & McKnight, D. H. (2007). Using expectation disconfirmation theory to predict
technology trust and usage continuance intentions. Retrieved from
http://citeseerx.ist.psu.edu/viewdoc/download?doi=10.1.1.97.1921&rep=rep1&type=pdf
Layton, R. H. (1994). Conflict in the archaeology of living traditions. Taylor & Francis.
Lee, A. C. K. (2003). Undergraduate students’ gender differences in IT skills and attitudes.
Journal of Computer Assisted Learning, 19(4), 488–500. doi:10.1046/j.0266-
4909.2003.00052.x
Legris, P., Ingham, J., & Collerette, P. (2003). Why do people use information technology? A
critical review of the technology acceptance model. Information & Management, 40(3),
191–204. doi:10.1016/S0378-7206(01)00143-4
Lei, J. (2010). Quantity versus quality: A new approach to examine the relationship between
technology use and student outcomes. British Journal of Educational Technology, 41(3),
455–472. doi:10.1111/j.1467-8535.2009.00961.x
Leonard-Barton, D., & Deschamps, I. (1988). Managerial influence in the implementation of
new technology. Management Science, 34(10), 1252–1265.
doi:10.1287/mnsc.34.10.1252
Levin, D. M. (1988). The opening of vision: Nihilism and the postmodern situation. New York:
Routledge.
Lin, C. P., & Anol, B. (2008). Learning online social support: An investigation of network
information technology based on UTAUT. Cyberpsychology & Behavior: The Impact of
the Internet, Multimedia and Virtual Reality on Behavior and Society, 11(3), 268–272.
doi:10.1089/cpb.2007.0057
Li, N., & Kirkup, G. (2007). Gender and cultural differences in Internet use: A study of China
and the UK. Computers & Education, 48(2), 301–317.
doi:10.1016/j.compedu.2005.01.007
Lin, P. C., Lu, H.-K., & Liu, S. C. (2013). Towards an education behavioral intention model for
e-learning systems: An extension of UTAUT. Journal of Theoretical & Applied
Information Technology, 47(3), 1120–1127.
172
Lin, S., Zimmer, J. C., & Lee, V. (2013). Podcasting acceptance on campus: The differing
perspectives of teachers and students. Computers & Education, 68, 416–428.
doi:10.1016/j.compedu.2013.06.003
Loch, K. D., Straub, D. W., & Kamel, S. (2003). Diffusing the Internet in the Arab world: The
role of social norms and technological culturation. IEEE Transactions on Engineering
Management, 50(1), 45–63. doi:10.1109/TEM.2002.808257
Losh, S. C. (2004). Gender, educational, and occupational digital gaps 1983-2002. Social
Science Computer Review, 22(2), 152–166. doi:10.1177/0894439303262557
Louho, R., Kallioja, M., & Oittinen, P. (2006). Factors affecting the use of hybrid media
applications. Graphic Arts in Finland, 35(3), 11–21.
Luckin, R., Clark, W., Graber, R., Logan, K., Mee, A., & Oliver, M. (2009). Do web 2.0 tools
really open the door to learning? : Practices, perceptions and profiles of 11-16-year-old
students. Learning, Media and Technology, 34(2), 87–104.
Luu, K., & Freeman, J. G. (2011). An analysis of the relationship between information and
communication technology (ICT) and scientific literacy in Canada and Australia.
Computers & Education, 56(4), 1072–1082. doi:10.1016/j.compedu.2010.11.008
MacLeod, A., Tweedie, A., Welburn, S. C., Maudlin, I., Turner, C. M. R., & Tait, A. (2000).
Minisatellite marker analysis of Trypanosoma brucei: Reconciliation of clonal,
panmictic, and epidemic population genetic structures. Proceedings of the National
Academy of Sciences, 97(24), 13442–13447. doi:10.1073/pnas.230434097
Macleod, H., Denise, H., & Haywood, J. (2002). Gender & information & communications
technology-A 10-year study of new undergraduates. TechTrends, 46(6), 11–15.
doi:10.1007/BF02824154
Madigan, E. M., Goodfellow, M., & Stone, J. A. (2007). Gender, perceptions, and reality:
Technological literacy among first-year students. In Proceedings of the 38th SIGCSE
Technical Symposium on Computer Science Education (pp. 410–414). New York, NY,
USA: ACM. doi:10.1145/1227310.1227453
Magee, A. (2002). Attitude-behaviour relationship. Retrieved April 12, 2011, from
http://www.ciadvertising.org/SA/fall_02/adv382j/mageeac/theory.htm
Mahmood, K. (2009). Gender, subject and degree differences in university students’ access, use
and attitudes toward information and communication technology (ICT) [Non-Refereed
Case Study]. Retrieved January 19, 2012, from
http://ijedict.dec.uwi.edu/viewarticle.php?id=704
173
Makrakis, V. (1992). Cross‐cultural comparison of gender differences in attitude towards
computers in Japan and Sweden. Scandinavian Journal of Educational Research, 36(4),
275–287. doi:10.1080/0031383920360403
Mao, E., & Palvia, P. (2006). Testing an extended model of IT acceptance in the Chinese cultural
context. SIGMIS Database, 37(2-3), 20–32. doi:10.1145/1161345.1161351
Marchewka, J., Liu, C., & Kostiwa, K. (2007). An application of the UTAUT model for
understanding student perceptions using course management software. Communications
of the IIMA, 7(2), 93–104.
Margaryan, A., Littlejohn, A., & Vojt, G. (2011). Are digital natives a myth or reality?
University students’ use of digital technologies. Computers & Education, 56(2), 429–
440. doi:10.1016/j.compedu.2010.09.004
Martins, L. L., & Kellermanns, F. W. (2004). A model of business school students’ acceptance
of a web-based course management system. Academy of Management Learning &
Education, 3(1), 7–26.
May, T. (2001). Social research methods: Issues, methods and process (3rd ed.). Buckingham:
Open University Press.
McCoy, S., Galletta, D. F., & King, W. R. (2007). Applying TAM across cultures: The need for
caution. European Journal of Information Systems, 16(1), 81–90.
doi:10.1057/palgrave.ejis.3000659
Mcilroy, D., Sadler, C., & Boojawon, N. (2007). Computer phobia and computer self-efficacy:
Their association with undergraduates’ use of university computer facilities. Computers
in Human Behavior, 23(3), 1285–1299. doi:10.1016/j.chb.2004.12.004
Meyers-Levy, J. (1988). Factors affecting the use of conceptually driven and data driven
processing. Advances in Consumer Research, 15, 169–173.
Miles, M. B., & Huberman, A. M. (1994). Qualitative data analysis: An expanded sourcebook
(2nd ed.). Thousand Oaks: SAGE Publications, Inc.
Ministry of Education. (2007). Education sector development programme (Final Report No.
ADB TA 4733). Ministry of Education, Sri Lanka. Retrieved from
http://www.adb.org/sites/default/files/project-document/73211/39293-02-sri-dpta.pdf
Minocha, S. (2008). A study on the effective use of social software by further and higher
education in the UK to support student learning and engagement. (JISC Final Report)
(pp. 1–115). Retrieved from http://www.jisc.ac.uk/media/documents/projects/effective-
use-of-social-software-in-education-finalreport.pdf
174
Moore, G. C., & Benbasat, I. (1991). Development of an instrument to measure the perceptions
of adopting an information technology innovation. Information Systems Research, 2(3),
192–222. doi:10.1287/isre.2.3.192
Mulaik, S. A., James, L. R., Van Alstine, J., Bennett, N., Lind, S., & Dean, C. (1989). Evaluation
of goodness-of-fit indices for structural equation models. Psychological Bulletin, 105(3),
430–445. doi:10.1037/0033-2909.105.3.430
Myers, M. D., & Tan, F. B. (2002). Beyond models of national culture in information systems
research: Journal of Global Information Management, 10(1), 24–32.
doi:10.4018/jgim.2002010103
Nash, J. (2009). Computer skills of first-year students at a South African university. In
Proceedings of the 2009 Annual Conference of the Southern African Computer
Lecturers’ Association (pp. 88–92). New York, NY, USA: ACM.
doi:10.1145/1562741.1562752
Nassuora, A. (2012). Students acceptance of mobile learning for higher education in Saudi
Arabia. American Academic & Scholarly Research Journal, 4(2), 24–30.
Ndunguru, P. C. (2007). Lectures on research methodology for social sciences. Research
Information and Publications Department, Mzumbe University.
Neuman, W. L. (2002). Social research methods: Qualitative and quantitative approaches (5
edition). Boston: Allyn & Bacon.
Neuman, W. L. (2006). Social research methods: qualitative and quantitative approaches (6th
ed.). Boston: Pearson Education, Inc.
Nistor, N., Lerche, T., Weinberger, A., Ceobanu, C., & Heymann, O. (2012). Towards the
integration of culture into the unified theory of acceptance and use of technology. British
Journal of Educational Technology, 45(1), 36–55. doi:10.1111/j.1467-
8535.2012.01383.x
Nwabueze, S. N., Meso, P. N., Mbarika, V. W., Kifle, M., Okoli, C., & Chustz, M. (2009). The
effects of culture of adoption of telemedicine in medically underserved communities. In
42nd Hawaii International Conference on System Sciences, 2009. HICSS ’09 (pp. 1–10).
doi:10.1109/HICSS.2009.430
Obanya, P. (2009). Dreaming, living and doing education. Ibadan: Institute of Ibadan.
Oliver, R. L. (1980). A cognitive model of the antecedents and consequences of satisfaction
decisions. Journal of Marketing Research, 17(4), 460–469. doi:10.2307/3150499
175
Onyango, R. A. O. (2002). Data collection instruments in information sciences. In L. O. Aina
(Ed.), Research in Information Sciences: An African Perspective. Nigeria: Stirling-
Horden Publishers (Nig.).
O’Reilly, T. (2005). What Is web 2.0. Retrieved January 25, 2012, from
http://oreilly.com/web2/archive/what-is-web-20.html
Oshlyansky, L., Cairns, P., & Thimbleby, H. (2007). Validating the unified theory of acceptance
and use of technology (UTAUT) tool cross-culturally. In Proceedings of the 21st British
HCI Group Annual Conference on People and Computers: HCI...But Not As We Know It
- Volume 2 (pp. 83–86). Swinton, UK, UK: British Computer Society. Retrieved from
http://dl.acm.org/citation.cfm?id=1531407.1531429
Oye, N. D., A.Iahad, N., & Ab.Rahim, N. (2012). The history of UTAUT model and its impact
on ICT acceptance and usage by academicians. Education and Information Technologies,
19(1), 251–270. doi:10.1007/s10639-012-9189-9
Pajo, K., & Wallace, C. (2001). Barriers to the uptake of web-based technology by university
teachers. Journal of Distance Education, 16(1), 70–84.
Palagolla, W. W. N. C. K., & Wickramarachchi, A. P. R. (2009). Effective integration of ICT to
facilitate the secondary education in Sri Lanka. In Conference proceedings Accounting
and management Information Systems. Sri Lanka: Faculty of Management and Finance,
University of Colombo.
Pallant, J. (2005). SPSS survival manual: a step by step guide to data analysis using SPSS. Allen
& Unwin, Crows Nest, NSW. Retrieved from
http://www.academia.dk/BiologiskAntropologi/Epidemiologi/PDF/SPSS_Survival_Manu
al_Ver12.pdf
Pardamean, B., & Susanto, M. (2012). Assessing user acceptance toward Blog technology:
Using the UTAUT model. International Journal of Mathematics and Computers in
Simulation, 6(1), 203–212.
Park, S. Y., & Park, S. Y. (2009). An analysis of the technology acceptance model in
understanding university students’ behavioral intention to use e-learning. Educational
Technology & Society, 12(3), 150–162.
Pasqual, A. (2009). SchoolNet – towards a next generation teaching/ learning platform.
Vidurawa, 26(Special), 19–22.
Philips, D. (1990). Post-positivistic science myths and realities. In E. Guba (Ed.), The Paradigm
dialog. Newbury Park: Sage.
176
Pouratashi, M., & Rezvanfar, A. (2010). Analysis of factors influencing application of ICT by
agricultural graduate students. J. Am. Soc. Inf. Sci. Technol., 61(1), 81–87.
doi:10.1002/asi.v61:1
Rahman, A. L. A., Jamaludin, A., & Mahmud, Z. (2011). Intention to use digital library based on
modified UTAUT model: Perspectives of Malaysian postgraduate students. World
Academy of Science, Engineering & Technology, 5(3), 96–103.
Ramanayake, A., Jayamanne, I., Ramyadevipriya, Y., & Perera, K. . L. R. R. H. (2012).
Graduand Employment Census 2012 (pp. 1–71). Colombo: Ministry of Higher
Education.
Ranasinghe, A. L. (2004). ICT and decent work: an assessment of the labour market impacts of
the advent of information and communication technology in Sri Lanka. Presented at the
JILPT/ILO Networking of National Institutes for Labour Studies: Meeting on Joint
Investigative Studies for "Determining the Impact of Information and Communications
Technology on Decent Work in the Asia and Pacific Region. Retrieved from
:http://www.jil.go.jp/english/events_and_information/documents/ann04_sri_lanka.pdf
Reddi, U. V., & Sinha, V. (2004). Sri Lanka: ICT use in education (meta-survey report on the
use of technologies in education 2003-2004). UNESCO. Retrieved from
http://unesdoc.unesco.org/images/0013/001349/134960e.pdf
Reinen, I. J., & Plomp, T. (1997). Information technology and gender equality: A contradiction
in terminis? Computers & Education, 28(2), 65–78. doi:10.1016/S0360-1315(97)00005-5
Rekabdarkolaei, S. M., & Amuei, F. (2008). Evaluation of ICT literacy differences in trainee
student teachers from the view of sexuality. Campus-Wide Information Systems, 25(3),
176–188. doi:10.1108/10650740810886349
Renaud, K., & van Biljon, J. (2008). Predicting technology acceptance and adoption by the
elderly: A qualitative study. In Proceedings of the 2008 Annual Research Conference of
the South African Institute of Computer Scientists and Information Technologists on IT
Research in Developing Countries: Riding the Wave of Technology (pp. 210–219). New
York, NY, USA: ACM. doi:10.1145/1456659.1456684
Richardson, W. (2010). Blogs, wikis, podcasts, and other powerful web tools for classrooms
(Third Edition edition). Thousand Oaks, Calif: Corwin.
Robinson, J. P., Shaver, P. R., & Wrightsman, L. S. (1991). Criteria for scale selection and
evaluation. In Measures of Personality and Social Psychological Attitudes. 1-6: Gulf
Professional Publishing.
Robson, C. (2002). Real world research (2nd ed.). Oxford: Wiley.
177
Röcker, C. (2010). Why traditional technology acceptance models won’t work for future
information technologies? World Academy of Science, Engineering and Technology, 65,
237–243.
Rogers, E. M. (1983). Diffusion of innovations (3rd ed.). New York: The Free Press.
Rogers, E. M. (1995). Diffusion of innovations (4th ed.). New York: The Free Press.
Rogers, E. M., & Shoemaker, F. F. (1971). Communication of innovations: A cross-culture
approach (2nd ed.). New York: Free Press.
Roscoe, J. T. (1975). Fundamental research statistics for the behavioral sciences. New York:
Holt, Rinehart and Winston.
Rose, G., & Straub, D. (1998). Predicting general IT use: Applying TAM to the Arabic world.
Journal of Global Information Management, 6(3), 39–46. doi:10.4018/jgim.1998070104
Rosen, P. A. (2005). The effect of personal innovativeness on technology acceptance (PhD
Dissertation). Oklahoma State University. Retrieved from
https://shareok.org/bitstream/handle/11244/6811/Department%20of%20Management_21.
pdf?sequence=1
Ruiz-Calleja, A., Vega-Gorgojo, G., Asensio-Pérez, J. I., Bote-Lorenzo, M. L., Gómez-Sánchez,
E., & Alario-Hoyos, C. (2012). A linked data approach for the discovery of educational
ICT tools in the web of data. Computers & Education, 59(3), 952–962.
doi:10.1016/j.compedu.2012.04.005
Samaradiwakara, G. D. M. N. (2010). Freshmen and ICT literacy: An islandwide survey
(Research final report). University of Sri Jayewardenepura.
Sanchez-Franco, M. J. (2010). WebCT – the quasimoderating effect of perceived affective
quality on an extending technology acceptance model. Computers & Education, 54(1),
37–46. doi:10.1016/j.compedu.2009.07.005
Sanchez-Franco, M. J., Martínez-López, F. J., & Martín-Velicia, F. A. (2009). Exploring the
impact of individualism and uncertainty avoidance in web-based electronic learning: An
empirical analysis in European higher education. Computers & Education, 52(3), 588–
598. doi:10.1016/j.compedu.2008.11.006
Santos-Feliscuzo, L. T., & Himang, C. M. (2011). Library periodical indexing software
evaluation using unified theory of acceptance and use of technology. Procedia - Social
and Behavioral Sciences, 25, 104–114. doi:10.1016/j.sbspro.2011.10.532
Sarkar, S. (2012). The role of information and communication technology (ICT) in higher
education for the 21st century. The Science Probe, 1(1), 30–41.
178
Satharasinghe, A. J. (2004). Computer literacy of Sri Lanka. Retrieved from
http://www.statistics.gov.lk/cls2004/index.htm
Saunders, M. N. K., Thornhill, A., & Lewis, P. (2009). Research methods for business students
(5th ed.). New York: Prentice Hall.
Schaper, L. K., & Pervan, G. P. (2007). An investigation of factors affecting technology
acceptance and use decisions by Australian allied health therapists. In 40th Annual
Hawaii International Conference on System Sciences, 2007. HICSS 2007 (pp. 141–141).
doi:10.1109/HICSS.2007.69
Schaper, L., & Pervan, G. (2004). A model of information and communication technology
acceptance and utilisation by occupational therapists. In in 2004 IFIP International
Conference on Decision Support Systems. 2004. Retrieved from
ttp://dsslab.infotec.monash.edu.au/dss2004/proceedings/pdf/72-schaper-pervan.pdf
Schepers, J., & Wetzels, M. (2007). A meta-analysis of the technology acceptance model:
Investigating subjective norm and moderation effects. Information & Management, 44(1),
90–103. doi:10.1016/j.im.2006.10.007
Schwartz, S. H. (1994). Beyond individualism/collectivism: New cultural dimensions of values,
85–119.
Sedek, M., Mahmud, R., Jalil, H. A., & Daud, S. M. (2012). Types and levels of ubiquitous
technology use among ICT undergraduates. Procedia - Social and Behavioral Sciences,
64, 255–264. doi:10.1016/j.sbspro.2012.11.030
Sekaran, U. (2000). Research methods for business: A skill-building approach (3rd ed.). Wiley.
Sekaran, U. (2003). Research methods for business: A skill building approach (4th ed.). New
York: Wiley.
Selltiz, C., Wrightsman, L. S., & Cook, S. W. (1976). Research Methods in Social Relations.
New York: Holt, Rinehart and Winston.
Selwyn, N. (1997). Students’ attitudes toward computers: Validation of a computer attitude scale
for 16–19 education. Computers & Education, 28(1), 35–41. doi:10.1016/S0360-
1315(96)00035-8
Serenko, A., Turel, O., & Yol, S. (2006). Moderating roles of user demographics in the
American customer satisfaction model within the context of mobile services. Journal of
Information Technology Management, 17(4), 20–32.
Shadish, W., Cook, T., & Campbell, D. (2002). Statistical conclusion validity and internal
validity: Experimental and quasi experimental designs for generilized causal inference.
Boston: Houghton Mifflin.
179
Sharma, S. (1995). Applied multivariate techniques. New York: Wiley.
Sheppard, B. H., Hartwick, J., & Warshaw, P. R. (1988). The theory of reasoned action: A meta-
analysis of past research with recommendations for modifications and future research.
Journal of Consumer Research, 15(3), 325–343.
Shevlin, M., & Miles, J. N. V. (1998). Effects of sample size, model specification and factor
loadings on the GFI in confirmatory factor analysis. Personality and Individual
Differences, 25(1), 85–90. doi:10.1016/S0191-8869(98)00055-5
Shu, W., & Chuang, Y.-H. (2011). The behavior of wiki users. Social Behavior and Personality:
An International Journal, 39(6), 851–864.
doi:http://dx.doi.org/10.2224/sbp.2011.39.6.851
Singleton, R., Straits, B. C., & Straits, M. M. (1993). Approaches to social research (2nd ed.).
New York: Oxford University Press.
Srite, M., & Karahanna, E. (2006). The role of espoused national cultural values in technology
acceptance. MIS Quarterly, 30(3), 679–704.
Statistics Sri Lanka. (2009). Computer literacy survey. Sri Lanka: Department of Census and
Statistics. Retrieved from
http://www.statistics.gov.lk/CLS/BuletinComputerLiteracy_2009.pdf
Stephan, P., Patrick, W., Milis, K., & Van Stee, E. (2009). Modeling educational technology
acceptance and satisfaction. Presented at the EDULEARN09 International Conference on
Education and New Learning Technologies, Convention Centre, Gran Hotel Princess
Sofia (Barcelona), Spain. Retrieved from
https://lirias.kuleuven.be/handle/123456789/384296
Straub, D., & Burton-Jones, A. (2007). Veni, Vidi, Vici: Breaking the TAM Logjam. Journal of
the Association for Information Systems, 8(4). Retrieved from
http://aisel.aisnet.org/jais/vol8/iss4/14
Straub, D., Keil, M., & Brenner, W. (1997). Testing the technology acceptance model across
cultures: A three country study. Information & Management, 33(1), 1–11.
doi:10.1016/S0378-7206(97)00026-8
Straub, D., Loch, K., Evaristo, R., Karahanna, E., & Srite, M. (2002). Toward a theory-based
measurement of culture. Journal of Global Information Management, 10(1), 13–23.
doi:10.4018/jgim.2002010102
Straub, D. W. (1994). The effect of culture on IT diffusion: e-mail and fax in Japan and the U.S.
Information Systems Research, 5(1), 23–47.
180
Strong, D. M., Dishaw, M. T., & Bandy, D. B. (2006). Extending task technology fit with
computer self-efficacy. SIGMIS Database, 37(2-3), 96–107.
doi:10.1145/1161345.1161358
Šumak, B., Heričko, M., & Pušnik, M. (2011). A meta-analysis of e-learning technology
acceptance: The role of user types and e-learning technology types. Computers in Human
Behavior, 27(6), 2067–2077. doi:10.1016/j.chb.2011.08.005
Suraweera, N., & Liew, C. L. (2011). E-learning in information management education in Sri
Lanka. Presented at the 12th Annual Research Symposium, University of Kelaniya.
Retrieved from http://www.kln.ac.lk/uokr/ICBI2011/ICT%20210.pdf
Surry, D. W., & Ensminger, D. C. (2006). Facilitating the use of web based learning by higher
education faculty. British Journal of Educational Technology, 36(2), 327–329.
Surry, D. W., Ensminger, D. C., & Haab, M. (2005). A model for integrating instructional
technology into higher education. British Journal of Educational Technology, 36(2),
327–329. doi:10.1111/j.1467-8535.2005.00461.x
Sutton, R. E. (1991). Equity and computers in the schools: A decade of research. Review of
Educational Research, 61(4), 475–503. doi:10.3102/00346543061004475
Szajna, B. (1996). Empirical evaluation of the revised technology acceptance model.
Management Science, 42(1), 85–92.
Tabachnick, B. G., & Fidell, L. S. (2006). Using multivariate statistics. Needham Heights, MA,
USA: Allyn & Bacon, Inc.
Tanaka, J. S. (1993). Multifaceted conceptions of fit in structural equation models. In K. A.
Bollen & J. S. Long (Eds.), Testing structural equation models. SAGE Publications.
Tan, P. J. B. (2013). Students’ adoptions and attitudes towards electronic placement tests: a
UTAUT analysis. American Journal of Computer Technology and Application, 1(1), 14–
24.
Tashakkori, A., & Teddlie, C. (Eds.). (2003). Handbook of Mixed Methods in Social &
Behavioral Research. SAGE Publications.
Taylor, S., & Todd, P. (1995). Assessing IT usage: The role of prior experience. MIS Quarterly,
19(4), 561–570. doi:10.2307/249633
Teo, T., Lee, C. B., Chai, C. S., Wong, S. L., Teo, T., Lee, C. B., … Wong, S. L. (2009).
Assessing the intention to use technology among pre-service teachers in Singapore and
Malaysia: A multigroup invariance analysis of the technology acceptance model (TAM).
Computers & Education, 53(3), 1000–1009.
181
Thompson, R. L., Higgins, C. A., & Howell, J. M. (1991). Personal computing: Toward a
conceptual model of utilization. MIS Quarterly, 15(1), 125–143. doi:10.2307/249443
Thowfeek, M. H., & Jaafar, A. (2013). The influence of cultural factors on the adoption of e-
learning: A reference to a public university in Sri Lanka. Applied Mechanics and
Materials, 263-266, 3424–3434. doi:10.4028/www.scientific.net/AMM.263-266.3424
Tibenderana, P. K. G., & Ogao, P. J. (2008). Acceptance and use of electronic library services in
Ugandan universities. In Proceedings of the 8th ACM/IEEE-CS Joint Conference on
Digital Libraries (pp. 323–332). New York, NY, USA: ACM.
doi:10.1145/1378889.1378944
Ticehurst, G. W., & Veal, A. J. (2000). Business research methods: A managerial approach.
Longman.
Tinio, V. L. (2002). ICT in education. Bangkok: UNDP-Asia Pacific development information
programme (APDIP). Retrieved from
http://www.apdip.net/publications/iespprimers/eprimer-edu.pdf
Triandis, H. C. (1977). Interpersonal behavior. Brooks/Cole Pub. Co.
Trompenaars, F., & Hampden-Turner, C. (1998). Riding the waves of culture: Understanding
cultural diversity in global business. New York: McGraw Hill.
Tyler, L. (2005). ICT literacy: Equipping students to succeed in an information-rich,
technology-based society (An issue paper from Educational Testing Service). Retrieved
from
http://www.ets.org/Media/Tests/ICT_Literacy/pdf/ICT_Equipping_Students_to_Succeed.
Tyler, T. R., Allan, E., & Huo, Y. J. (2000). Cultural values and authority relations: The
psychology of conflict resolution across cultures. Psychology, Public Policy, and Law,
6(4), 1138–1163. doi:10.1037/1076-8971.6.4.1138
Umunadi, E. K. (2011). Perception of technical education students on the role of ICT in general
studies programme (GSP) in university education. International Journal of Academic
Research in Business and Social Sciences, 1(3), 190.
UNESCO. (2009). UNESCO portal on higher education institutions. Education Institutions in
Nigeria.
University grant commission (UGC) statistics. (2013). Retrieved from
http://www.ugc.ac.lk/en/publications/1418-sri-lanka-university-statistics-2013.html
182
University grant commission (UGC) statistics. (2011). Retrieved from
http://www.ugc.ac.lk/en/university-statistics-2012/898-sri-lanka-university-statistics-
2011.html
University grant commission (UGC) statistics. (2010). Retrieved from
http://www.ugc.ac.lk/en/statistics/university-statistics-2010.html
Usluel, Y. K., Askar, P., Bas, T., Usluel, Y. K., Askar, P., & Bas, T. (2008). A structural
equation model for ICT usage in higher education. Educational Technology & Society,
11(2), 262–273.
Valentín, A., Mateos, P. M., GonzáLez-Tablas, M. M., PéRez, L., LóPez, E., & GarcíA, I.
(2013). Motivation and learning strategies in the use of ICTs among university students.
Comput. Educ., 61, 52–58. doi:10.1016/j.compedu.2012.09.008
Van Biljon, J., & Kotzé, P. (2007). Modelling the factors that influence mobile phone adoption.
In Proceedings of the 2007 Annual Research Conference of the South African Institute of
Computer Scientists and Information Technologists on IT Research in Developing
Countries (pp. 152–161). New York, NY, USA: ACM. doi:10.1145/1292491.1292509
Van Braak, J. P. (2004). Domains and determinants of university students’ self-perceived
computer competence. Computers & Education, 43(3), 299–312.
doi:10.1016/j.compedu.2003.09.006
Van Raaij, E. M., & Schepers, J. J. L. (2008). The acceptance and use of a virtual learning
environment in China. Computers & Education, 50(3), 838–852.
doi:10.1016/j.compedu.2006.09.001
Van Teijlingen, E. R., & Hundley, V. (2001). The importance of pilot studies. Retrieved from
http://aura.abdn.ac.uk/handle/2164/157
Veal, A. J. (2005). Business research methods: a managerial approach (2nd ed.). Frenchs
Forest: Pearson Australia.
Venkatesh, V., & Davis, F. D. (2000). A theoretical extension of the technology acceptance
model: Four longitudinal field studies. Management Science, 46(2), 186–204.
doi:10.1287/mnsc.46.2.186.11926
Venkatesh, V., Morris, M. G., Davis, G. B., & Davis, F. D. (2003). User acceptance of
information technology: Toward a unified view. MIS Quarterly, 27(3), 425–478.
Venkatesh, V., & Speier, C. (1999). Computer technology training in the workplace: A
longitudinal investigation of the effect of mood. Organizational Behavior and Human
Decision Processes, 79(1), 1–28. doi:10.1006/obhd.1999.2837
183
Venkatesh, V., Thong, J. Y. L., & Xu, X. (2012). Consumer acceptance and use of information
technology: Extending the unified theory of acceptance and use of technology. MIS Q.,
36(1), 157–178.
Verhoeven, J. C., Heerwegh, D., & De Wit, K. (2010). Information and communication
technologies in the life of university freshmen: An analysis of change. Computers &
Education, 55(1), 53–66. doi:10.1016/j.compedu.2009.12.002
Verhoeven, J. C., Heerwegh, D., & Wit, K. D. (2011). First year university students’ self-
perception of ICT skills: Do learning styles matter? Education and Information
Technologies, 17(1), 109–133. doi:10.1007/s10639-010-9149-1
Vessey, I., Ramesh, V., & Glass, R. L. (2002). The classification (TR 107- 1), and CS (TR 112-
1), SE (TR 105-1), and IS (TR 106-1). Retrieved from
www.indiana.edu/~isdept/research/workingpapers.html
Vihera, M. L., & Nurmela, J. (2001). Communication capability as an intrinsic determinant for
information age. Futures, 33(3–4), 245–265. doi:10.1016/S0016-3287(00)00070-7
Volman, M., & Eck, E. van. (2001). Gender equity and information technology in education: The
second decade. Review of Educational Research, 71(4), 613–634.
Voros, T., & Choudrie, J. (2011). Uncertainty avoidance and technology acceptance in emerging
economies: A comparative study. In Proceedings Annual Work shop of the AIS Special
Interest Group for ICT Global Development. Retrieved from
http://aisel.aisnet.org/cgi/viewcontent.cgi?article=1011&context=globdev2011
Waldman, M. (2003). Freshmen’s use of library electronic resources and self-efficiency.
Information Research, (8), 2.
Walker, D. T. H. (1997). Choosing an appropriate research methodology for a particular research
question. Construction Management and Economics, 15(2), 149–159.
Walliman, N. (2006). Social research methods. SAGE.
Wang, Y. S., Wu, M. C., & Wang, H. Y. (2009). Investigating the determinants and age and
gender differences in the acceptance of mobile learning. British Journal of Educational
Technology, 40(1), 92–118. doi:10.1111/j.1467-8535.2007.00809.x
Webster, J., & Martocchio, J. J. (1992). Microcomputer playfulness: Development of a measure
with workplace implications. MIS Quarterly, 16(2), 201–226. doi:10.2307/249576
Webster, M. (2006). Definition of context. Merriam-Webster Online Dictionary. Retrieved from
http://www.webster.com/cgi-bin/dictionary?context
Weisstein, E. W. (2004). Kurtosis. Retrieved August 7, 2010, from
http://mathwold.wolfram.com/Kurtosis.html
184
Weligamage, S., & Siengthai, S. (2003). Employer needs and graduate skills: The gap between
employer expectations and job expectations of Sri Lankan university graduates. Presented
at the 9th International Conference on Sri Lanka Studies, Matara, Sri Lanka. Retrieved
from http://www.slageconr.net/slsnet/9thicsls/fullpapers/fullp029.pdf
Wheaton, B., Muthen, B., Alwin, D. F., & Summers, G. F. (1977). Assessing reliability and
stability in panel models. Sociological Methodology, 8, 84–136.
Wickramasinghe, V., & Perera, L. (2010). Graduates’, university lecturers’ and employers’
perceptions towards employability skills. Education + Training, 52(3), 226–244.
doi:10.1108/00400911011037355
Wikramanayake, G. N., Hewagamage, K. P., Gamage, G. I., & Weerasinghe, A. R. (2007). Asia
eBIT @ UCSC: Implementing the paradigm shift from teaching to learning through e-
learning framework. In Proceeding of the 25th National IT conference. Colombo, Sri
Lanka. Retrieved from http://www.slideshare.net/wikramanayake/asia-ebit-ucsc-
implementing-the-paradigm-shift-from-teaching-to-learning-through-elearning-
framework
Williams, M. D., Rana, N. P., Dwivedi, Y. K., & Lal, B. (2011). Is UTAUT really used or just
cited for the sake of it? A systematic review of citations of UTAUT’s originating article.
In ECIS Proceedings (p. 231). Retrieved from http://aisel.aisnet.org/ecis2011/231/
Wills, M. J., El-Gayar, O. F., & Bennett, D. (2008). Examining healthcare professionals’
acceptance of electronic medical records using UTAUT. Issues in Information Systems
(IIS), VOL IX, No. 2, IX(2). Retrieved from http://iacis.org/iis/2008/S2008_1053.pdf
World Bank. (1999). Sri Lanka - A fresh look at unemployment (No. 19609) (pp. 1–65). The
World Bank. Retrieved from
http://documents.worldbank.org/curated/en/1999/08/440270/sri-lanka-fresh-look-
unemployment
Wu, Y.-L., Tao, Y.-H., & Yang, P.-C. (2007). Using UTAUT to explore the behavior of 3G
mobile communication users. In 2007 IEEE International Conference on Industrial
Engineering and Engineering Management (pp. 199–203).
doi:10.1109/IEEM.2007.4419179
Yin, R. K. (2003). Case study research: Design and method (3rd ed.). London: Sage.
Yoo, S. J., & Huang, W. D. (2011). Comparison of web 2.0 technology acceptance level based
on cultural differences. Educational Technology & Society, 14(4), 241–252.
Young, J. R. (2011). 6 Top smart phone apps to improve teaching, research, and your life.
Technology, 1–4.
185
Yuen, A. H. K., Law, N., & Wong, K. C. (2003). ICT implementation and school leadership.
Journal of Educational Administration, 41(2), 158–170.
doi:10.1108/09578230310464666
Zakour, A. (2008). Information Technology acceptance across cultures. In P. Zaphiris & C. S.
Ang (Eds.), Human Computer Interaction: Concepts, Methodologies, Tools, and
Applications. IGI Global Snippet.
Žerovnik, A., Rugelj, J., & Šerbec, I. N. (2011). ICT supported environment for active learning.
EDULEARN11 Proceedings, 6252–6260.
Zhang, D., Zhao, J. L., Zhou, L., & Nunamaker, J. F., Jr. (2004). Can e-Learning replace
classroom learning? Commun. ACM, 47(5), 75–79. doi:10.1145/986213.986216
Zhou, T., Lu, Y., & Wang, B. (2010). Integrating TTF and UTAUT to explain mobile banking
user adoption. Comput. Hum. Behav., 26(4), 760–767. doi:10.1016/j.chb.2010.01.013
Zikmund, W. G. (2002). Business research methods (7th ed.). Mason, OH: Cengage Learning.
Zoraini, W. A., Lim, T. S. K., & Tai-Kwan, W. (2009). Mobile learning initiative through SMS:
A formative evaluation. ASEAN Journal of Open and Distance Learning, 1(1), 49–58.


