STANDARDISED EXPANDED NUTRITION SURVEY (SENS)
FINAL REPORT
Kharasana and El Meiram South Sudanese Refugee Settlements, West Kordofan State-Republic of Sudan
Survey Dates: - 22nd October – 4th November 2017
Report Finalized: - February 2018.
Coordinated by UNHCR with technical support from Ministry of Health, WFP, UNICEF, COR, HAC, CONCERN, PANCARE, ISLAMIC RELIEF and GAH Report written by: Samuel Tadesse Beyene, Nutrition and Food Security Officer, UNHCR Khartoum Reviewed by: Naser Mohmand, Senior regional nutrition and food security officer UNHCR regional service
centre (RSC) and Nasur Muwonge, Health and Nutrition Officer UNHCR Khartoum
Acknowledgements
This survey was financed and coordinated by the United Nations High Commissioner for Refugees (UNHCR) and with logistical and technical support from Ministry of Health, UNICEF and WFP. We gratefully acknowledge the important contributions made by all those involved that made the survey possible. Thanks also to UNHCR colleagues in South Kordofan (Kadugli) and West Kordofan (El Fula) for assigning staff and providing logistical support including transportation of survey teams and logistics throughout the exercise. Our deepest gratitude goes to for the technical support and feedback provided from nutrition and food security unit of the UNHCR Regional Service Centre (RSC) for timely technical guidance, review of SENS T0R, preliminary and final report. We would like to acknowledge all agencies involved in planning and executing the survey. We are indebted and extend our special thanks for West Kordofan Ministry of Health for providing survey team members for the entire duration of the exercise and for the support provided throughout this time. Our gratitude goes to COR, HAC, CONCERN, IR, PANCARE and GAH for providing staff, logistics, and facilitation in the refugee settlements. Sincere thanks goes to all drivers who supported the survey with enthusiasm working long hours starting early in the morning to late hours in mobilizing the survey teams and logistics. Special thanks to refugee leaders and community volunteers in the two settlements for their support in community mobilization and awareness raising prior to the survey period. We express our gratitude to refugee communities in all camps for their participation and allowing their children and women to be measured and responding to various questions in the tools used by the survey.
Table of Contents EXECUTIVE SUMMARY ................................................................................................................................................... 2 1. Introduction ....................................................................................................................................................... 11
1.1 Survey Objectives .................................................................................................................................................................. 15 2. Methodology ...................................................................................................................................................... 16
2.1 Sample size ............................................................................................................................................................................ 16 2.2 Sampling procedure: selecting households ........................................................................................................................... 16 2.3 Questionnaire and measurement methods .......................................................................................................................... 17 2.4 Case definitions, inclusion criteria and calculations .............................................................................................................. 19 2.5 Training, coordination and supervision ................................................................................................................................. 24 2.6 Data collection, entry and analysis ........................................................................................................................................ 25 2.7 Quality control....................................................................................................................................................................... 26 2.8 Ethical consideration and consent of study population ........................................................................................................ 26
3. Results per Location ........................................................................................................................................ 27 3.1. Results from Kharasana ........................................................................................................................................ 27
3.2.1. Anthropometric results (based on WHO Growth Standards 2006) ................................................................................. 27 3.2.2. Mortality results (retrospective over three months/90 days prior to interview) ............................................................ 32 3.2.3. Programme Coverage ...................................................................................................................................................... 32 3.2.4. Diarrhoea results .............................................................................................................................................................. 33 3.2.5. Anaemia results................................................................................................................................................................ 34 3.2.6. Infant and Young Children Feeding (Children 0-23 months) in Kharasana .......................... Error! Bookmark not defined. 3.2.7. Women 15-49 years in Kharasana ................................................................................................................................... 35 3.2.8. Food security .................................................................................................................................................................... 36 3.2.1. Water Sanitation and Hygiene (WASH) ............................................................................................................................ 39 3.2.9. Mosquito Net Coverage ................................................................................................................................................... 40
3.2. Results from El Meiram .......................................................................................................................................... 41 3.2.2. Anthropometric results (based on WHO Growth Standards 2006) ................................................................................. 42 3.2.3. Mortality results (retrospective over three months/90 days prior to interview) ............................................................ 46 3.2.4. Programme Coverage ...................................................................................................................................................... 46 3.2.5. Diarrhoea results .............................................................................................................................................................. 48 3.2.6. Anaemia results................................................................................................................................................................ 48 3.2.7. Infant and Young Children Feeding (Children 0-23 months) in El Meiram ...................................................................... 49 3.2.8. Women 15-49 years ......................................................................................................................................................... 50 3.2.9. Food security .................................................................................................................................................................... 50 3.2.10. Water Sanitation and Hygiene (WASH) .......................................................................................................................... 53 3.2.11. Mosquito Net Coverage ................................................................................................................................................. 54
4. Discussion .................................................................................................................................................................. 57 5. Conclusions ...................................................................................................................................................... 59 6. Recommendations ............................................................................................................................................ 60 7. Appendixes ........................................................................................................................................................ 62
Lists of Acronyms BSFP Blanket Supplementary Feeding Programme
CDC Center for Disease Control
CDR Crude Death Rate
CI Confidence Interval
ENA Emergency Nutrition Assessment
EPI Expanded Programme on Immunization
Epi Info Name of CDC software for epidemiological investigations
GAM Global Acute Malnutrition
GAH Global Aid Hand
GFD General Food Distribution
HAZ Height-for-Age Z-score
HFA Height-for-Age
HAICO Hamam Alsalam International Charity Organization
IR Islamic Relief
IYCF Infant and young child feeding
Kcal Kilocalorie
Kg Kilogram
MAM Moderate Acute Malnutrition
MUAC Mid-Upper Arm Circumference
NCHS National Centre for Health Statistics ODK Open Data Kit OTP Outpatient Therapeutic Programme
SAM Severe Acute Malnutrition
SC Stabilization Center
SMART Systematic Monitoring and Assessment for Relief and Transitions
SMOH Sudan Ministry of Health
SENS Standardized Expanded Nutrition Survey
SFP Supplementary Feeding Programme
TFP Therapeutic Feeding Programme
TSFP Targeted Supplementary Feeding Programme
UNHCR United Nations High Commissioner for Refugees
UNICEF United Nations Children’s Fund
WASH Water Sanitation and Health
WFA Weight-for-Age
WFH Weight-for-Height
WFP World Food Programme
WHO World Health Organization
WHZ Weight-for-Height / Length Z-score
2 | P a g e
EXECUTIVE SUMMARY Introduction The conflict that broke out in South Sudan on 15 December 2013 displaced hundreds of thousands of civilians in South Sudan and continues to cause an outflow of refugees into neighboring countries including Sudan. Kharasana and El Meiram are among the newly established settlements receiving refugees and provided with basic protection and lifesaving interventions. These settlements are located in the south-west region of Sudan of West Kordofan state in Keilak and El Meiram localities respectively. The majority of refugees are women and children that fled from Northern Bahr el Ghazal, Western Bahr el Ghazal, Warrap and Abyei in South Sudan. During the time of this survey the refugee population was estimated as follows: in Kharasana 4,887 and El Meiram 10,422. The refugees’ settlements in Kharasana and El Meiram are unique in nature, whereby refugees are settled in the periphery of the local towns and living together with the host community. However, refugees identify themselves in the group settlement, subdivided into bocks. The house arrangement is similar to a usual standard village setting, as opposed to a typical camp house set-up. This report summarizes the results of a Standardized Expanded Nutrition Survey (SENS) conducted in Kharasana and El Meiram refugee settlements during the period 22nd October and 4th November 2017. The survey was aimed at assessing the general health, nutrition and mortality indices of refugees in order to establish baseline data and formulate action-oriented recommendations for appropriate nutrition, public health and related interventions.
Objectives: Primary objectives:
a. To determine the prevalence of acute malnutrition among children 6-59 months.
b. To determine the prevalence of stunting among children 6-59 months.
c. To assess the two-week period prevalence of diarrhoea among children 6-59 months.
d. To assess the prevalence of Anaemia among children 6-59 months and women of
reproductive age (non-pregnant 15-49 years).
e. To determine the coverage of measles vaccination among children 9-59 months.
f. To determine the coverage of vitamin A supplementation in the last six months among
children 6-59 months.
g. To investigate IYCF practices among children 0-23 months.
h. To assess the proportion of households that use an adequate quantity of water per person
per day.
i. To determine the population’s access to improved water, sanitation and hygiene facilities.
j. To determine the coverage of ration cards and the duration the General Food Distribution
(GFD) ration lasts for recipient households.
k. To determine the extent to which negative coping strategies are used by households
l. To assess household dietary diversity.
m. To determine the utilization of mosquito nets (all types and LLINs) by the total population,
children 0-59 months and pregnant women.
n. To make recommendations on actions to be undertaken to address the situation.
3 | P a g e
Secondary objectives: o. To assess crude and under-five mortality rates in the refugee settlements in the last three
months.
p. To determine enrolment into Antenatal Care clinic and coverage of iron-folic acid
supplementation in pregnant women.
q. To assess the enrollment status of children 6-59 months into selective feeding programmes
(OTP/SC and TSFP).
Methodology: The survey approach was based on the UNHCR Standardized Expanded Nutrition Survey
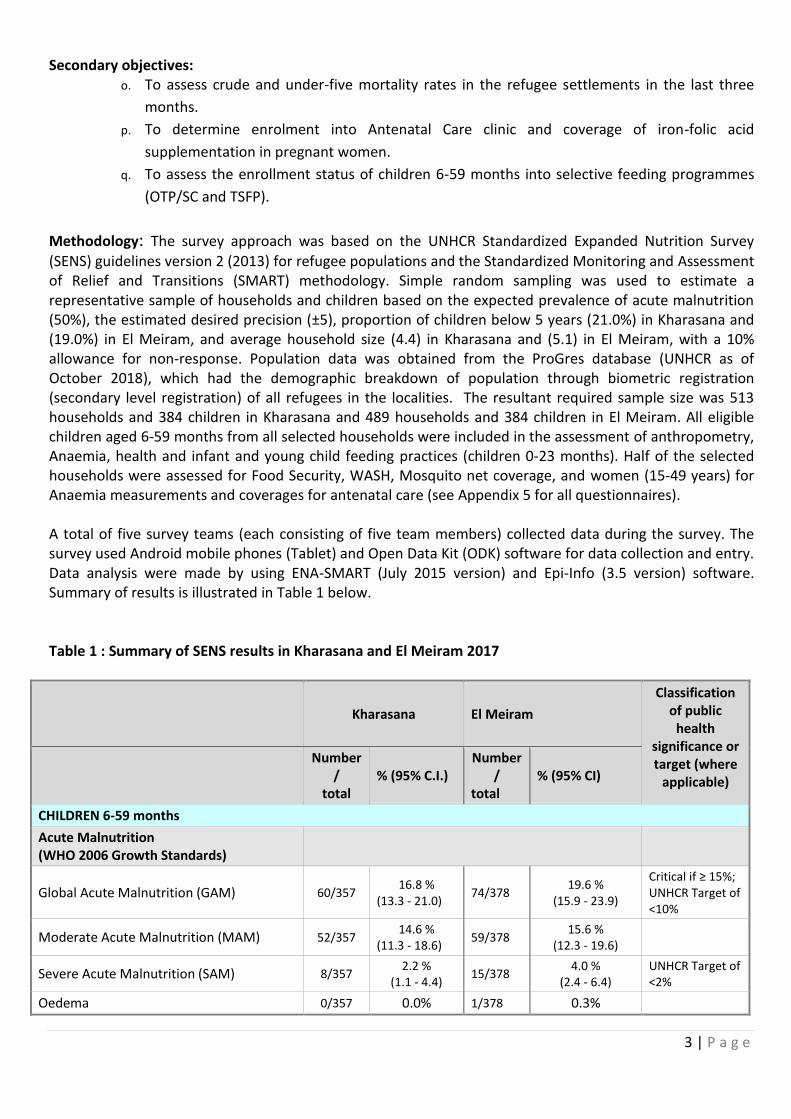
(SENS) guidelines version 2 (2013) for refugee populations and the Standardized Monitoring and Assessment of Relief and Transitions (SMART) methodology. Simple random sampling was used to estimate a representative sample of households and children based on the expected prevalence of acute malnutrition (50%), the estimated desired precision (±5), proportion of children below 5 years (21.0%) in Kharasana and (19.0%) in El Meiram, and average household size (4.4) in Kharasana and (5.1) in El Meiram, with a 10% allowance for non-response. Population data was obtained from the ProGres database (UNHCR as of October 2018), which had the demographic breakdown of population through biometric registration (secondary level registration) of all refugees in the localities. The resultant required sample size was 513 households and 384 children in Kharasana and 489 households and 384 children in El Meiram. All eligible children aged 6-59 months from all selected households were included in the assessment of anthropometry, Anaemia, health and infant and young child feeding practices (children 0-23 months). Half of the selected households were assessed for Food Security, WASH, Mosquito net coverage, and women (15-49 years) for Anaemia measurements and coverages for antenatal care (see Appendix 5 for all questionnaires). A total of five survey teams (each consisting of five team members) collected data during the survey. The survey used Android mobile phones (Tablet) and Open Data Kit (ODK) software for data collection and entry. Data analysis were made by using ENA-SMART (July 2015 version) and Epi-Info (3.5 version) software. Summary of results is illustrated in Table 1 below. Table 1 : Summary of SENS results in Kharasana and El Meiram 2017
Kharasana El Meiram
Classification of public
health significance or target (where
applicable)
Number /
total % (95% C.I.)
Number /
total % (95% CI)
CHILDREN 6-59 months
Acute Malnutrition (WHO 2006 Growth Standards)
Global Acute Malnutrition (GAM) 60/357 16.8 %
(13.3 - 21.0) 74/378
19.6 % (15.9 - 23.9)
Critical if ≥ 15%; UNHCR Target of <10%
Moderate Acute Malnutrition (MAM) 52/357 14.6 %
(11.3 - 18.6) 59/378
15.6 % (12.3 - 19.6)
Severe Acute Malnutrition (SAM) 8/357 2.2 %
(1.1 - 4.4) 15/378
4.0 % (2.4 - 6.4)
UNHCR Target of <2%
Oedema 0/357 0.0% 1/378 0.3%
4 | P a g e
Kharasana El Meiram
Classification of public
health significance or target (where
applicable)
Number /
total % (95% C.I.)
Number /
total % (95% CI)
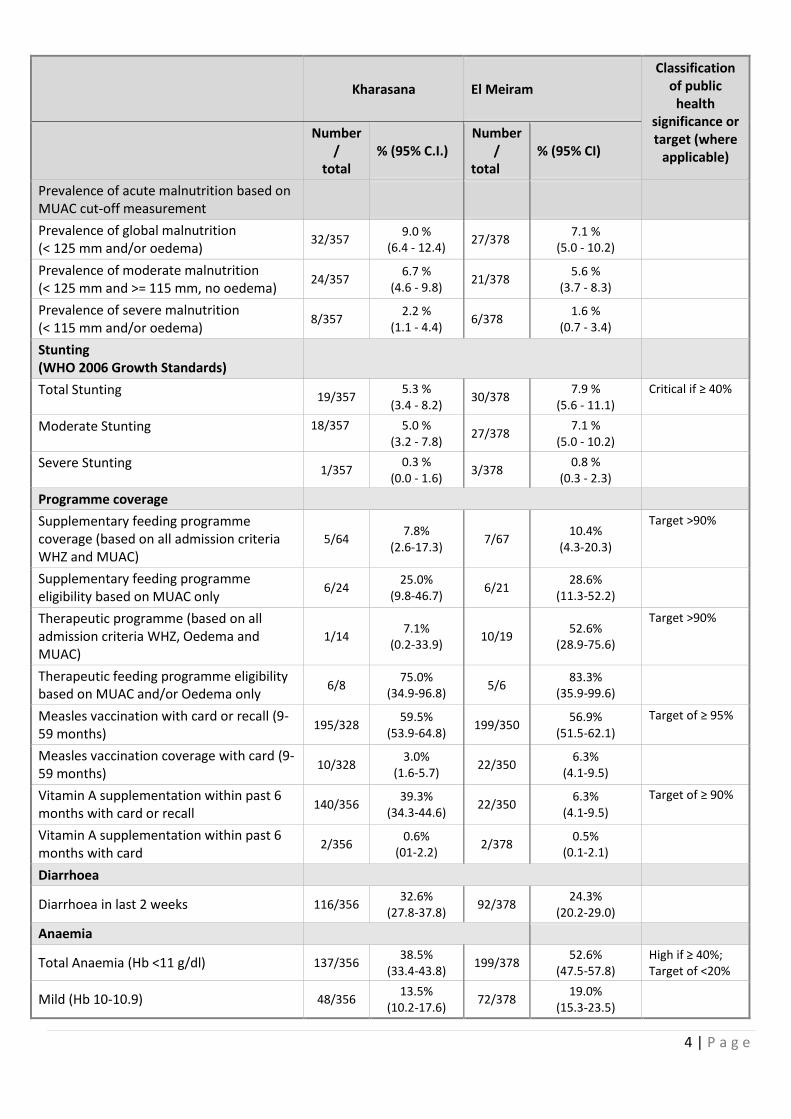
Prevalence of acute malnutrition based on MUAC cut-off measurement
Prevalence of global malnutrition (< 125 mm and/or oedema)
32/357 9.0 %
(6.4 - 12.4) 27/378
7.1 % (5.0 - 10.2)
Prevalence of moderate malnutrition (< 125 mm and >= 115 mm, no oedema)
24/357 6.7 %
(4.6 - 9.8) 21/378
5.6 % (3.7 - 8.3)
Prevalence of severe malnutrition (< 115 mm and/or oedema)
8/357 2.2 %
(1.1 - 4.4) 6/378
1.6 % (0.7 - 3.4)
Stunting (WHO 2006 Growth Standards)
Total Stunting 19/357
5.3 % (3.4 - 8.2)
30/378 7.9 %
(5.6 - 11.1) Critical if ≥ 40%
Moderate Stunting 18/357
5.0 % (3.2 - 7.8)
27/378 7.1 %
(5.0 - 10.2)
Severe Stunting 1/357
0.3 % (0.0 - 1.6)
3/378 0.8 %
(0.3 - 2.3)
Programme coverage
Supplementary feeding programme coverage (based on all admission criteria WHZ and MUAC)
5/64 7.8%
(2.6-17.3) 7/67
10.4% (4.3-20.3)
Target >90%
Supplementary feeding programme eligibility based on MUAC only
6/24 25.0%
(9.8-46.7) 6/21
28.6% (11.3-52.2)
Therapeutic programme (based on all admission criteria WHZ, Oedema and MUAC)
1/14 7.1%
(0.2-33.9) 10/19
52.6% (28.9-75.6)
Target >90%
Therapeutic feeding programme eligibility based on MUAC and/or Oedema only
6/8 75.0%
(34.9-96.8) 5/6
83.3% (35.9-99.6)
Measles vaccination with card or recall (9-59 months)
195/328 59.5%
(53.9-64.8) 199/350
56.9% (51.5-62.1)
Target of ≥ 95%
Measles vaccination coverage with card (9-59 months)
10/328 3.0%
(1.6-5.7) 22/350
6.3% (4.1-9.5)
Vitamin A supplementation within past 6 months with card or recall
140/356 39.3%
(34.3-44.6) 22/350
6.3% (4.1-9.5)
Target of ≥ 90%
Vitamin A supplementation within past 6 months with card
2/356 0.6%
(01-2.2) 2/378
0.5% (0.1-2.1)
Diarrhoea
Diarrhoea in last 2 weeks 116/356 32.6%
(27.8-37.8) 92/378
24.3% (20.2-29.0)
Anaemia
Total Anaemia (Hb <11 g/dl) 137/356 38.5%
(33.4-43.8) 199/378
52.6% (47.5-57.8)
High if ≥ 40%; Target of <20%
Mild (Hb 10-10.9) 48/356 13.5%
(10.2-17.6) 72/378
19.0% (15.3-23.5)
5 | P a g e
Kharasana El Meiram
Classification of public
health significance or target (where
applicable)
Number /
total % (95% C.I.)
Number /
total % (95% CI)
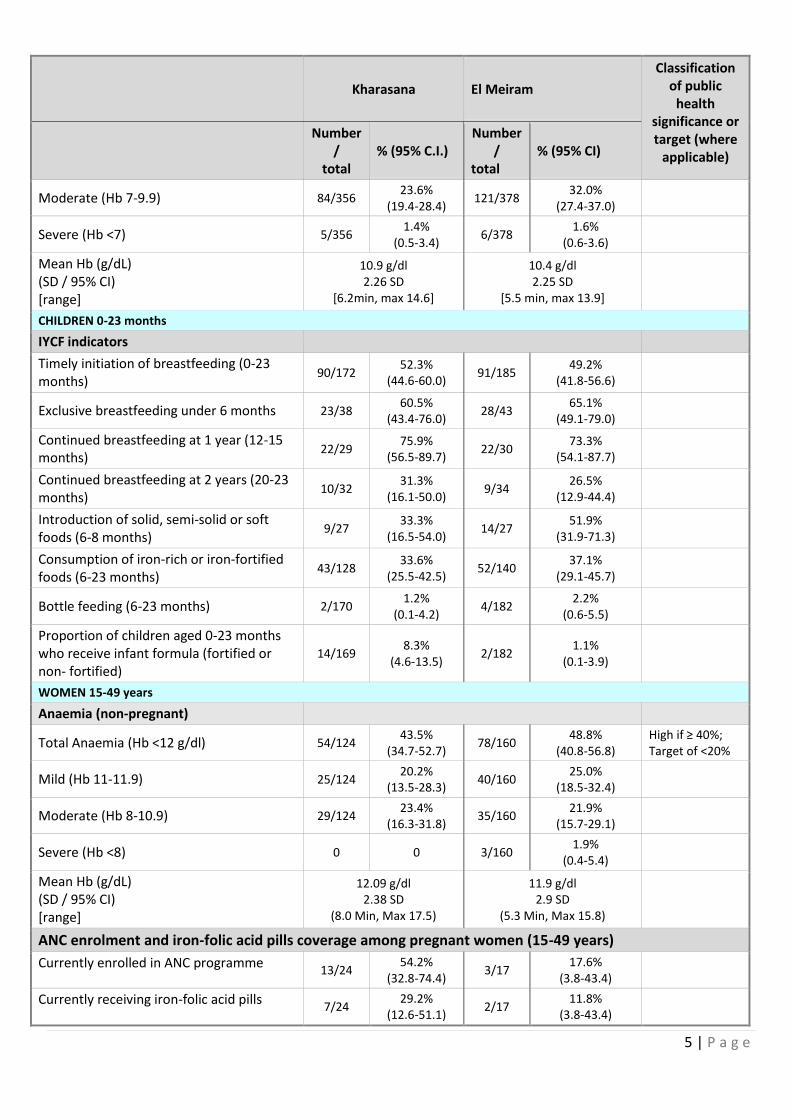
Moderate (Hb 7-9.9) 84/356 23.6%
(19.4-28.4) 121/378
32.0% (27.4-37.0)
Severe (Hb <7) 5/356 1.4%
(0.5-3.4) 6/378
1.6% (0.6-3.6)
Mean Hb (g/dL) (SD / 95% CI) [range]
10.9 g/dl 2.26 SD
[6.2min, max 14.6]
10.4 g/dl 2.25 SD
[5.5 min, max 13.9]
CHILDREN 0-23 months
IYCF indicators
Timely initiation of breastfeeding (0-23 months)
90/172 52.3%
(44.6-60.0) 91/185
49.2% (41.8-56.6)
Exclusive breastfeeding under 6 months 23/38 60.5%
(43.4-76.0) 28/43
65.1% (49.1-79.0)
Continued breastfeeding at 1 year (12-15 months)
22/29 75.9%
(56.5-89.7) 22/30
73.3% (54.1-87.7)
Continued breastfeeding at 2 years (20-23 months)
10/32 31.3%
(16.1-50.0) 9/34
26.5% (12.9-44.4)
Introduction of solid, semi-solid or soft foods (6-8 months)
9/27 33.3%
(16.5-54.0) 14/27
51.9% (31.9-71.3)
Consumption of iron-rich or iron-fortified foods (6-23 months)
43/128 33.6%
(25.5-42.5) 52/140
37.1% (29.1-45.7)
Bottle feeding (6-23 months) 2/170 1.2%
(0.1-4.2) 4/182
2.2% (0.6-5.5)
Proportion of children aged 0-23 months who receive infant formula (fortified or non- fortified)
14/169 8.3%
(4.6-13.5) 2/182
1.1% (0.1-3.9)
WOMEN 15-49 years
Anaemia (non-pregnant)
Total Anaemia (Hb <12 g/dl) 54/124 43.5%
(34.7-52.7) 78/160
48.8% (40.8-56.8)
High if ≥ 40%; Target of <20%
Mild (Hb 11-11.9) 25/124 20.2%
(13.5-28.3) 40/160
25.0% (18.5-32.4)
Moderate (Hb 8-10.9) 29/124 23.4%
(16.3-31.8) 35/160
21.9% (15.7-29.1)
Severe (Hb <8) 0 0 3/160 1.9%
(0.4-5.4)
Mean Hb (g/dL) (SD / 95% CI) [range]
12.09 g/dl 2.38 SD
(8.0 Min, Max 17.5)
11.9 g/dl 2.9 SD
(5.3 Min, Max 15.8)
ANC enrolment and iron-folic acid pills coverage among pregnant women (15-49 years)
Currently enrolled in ANC programme 13/24
54.2% (32.8-74.4)
3/17 17.6%
(3.8-43.4)
Currently receiving iron-folic acid pills 7/24
29.2% (12.6-51.1)
2/17 11.8%
(3.8-43.4)
6 | P a g e
Kharasana El Meiram
Classification of public
health significance or target (where
applicable)
Number /
total % (95% C.I.)
Number /
total % (95% CI)
FOOD SECURITY
Food distribution
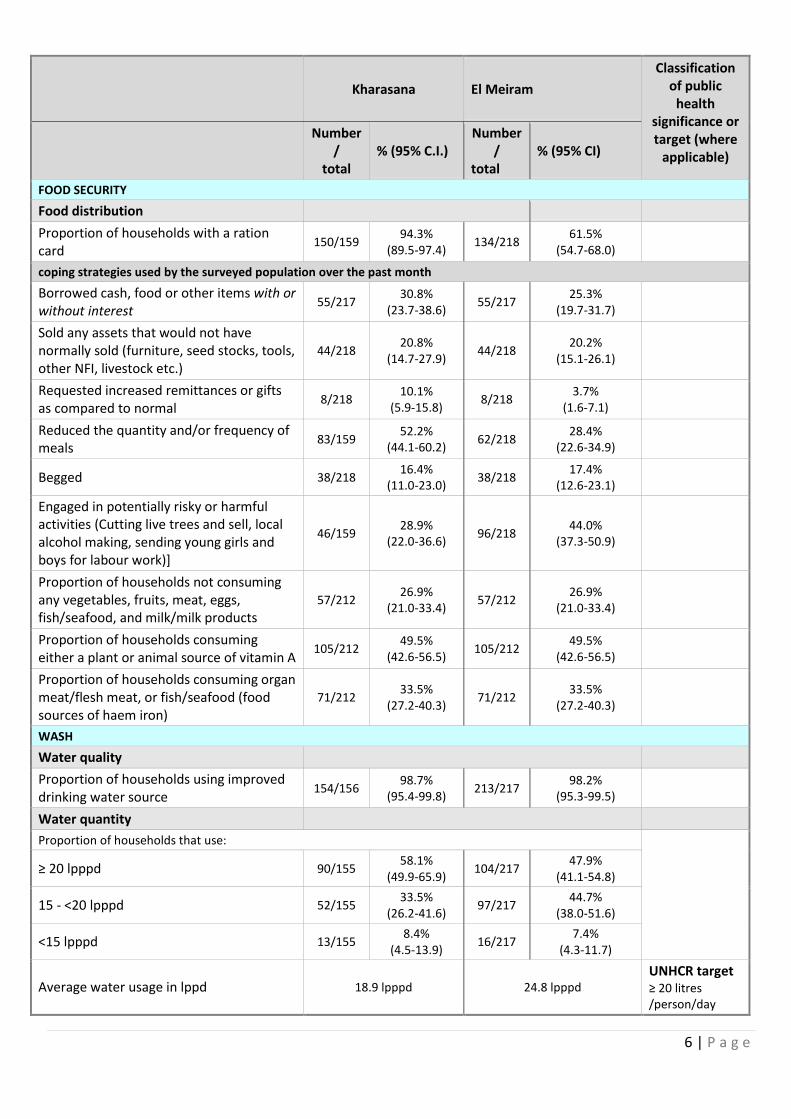
Proportion of households with a ration card
150/159 94.3%
(89.5-97.4) 134/218
61.5% (54.7-68.0)
coping strategies used by the surveyed population over the past month
Borrowed cash, food or other items with or without interest
55/217 30.8%
(23.7-38.6) 55/217
25.3% (19.7-31.7)
Sold any assets that would not have normally sold (furniture, seed stocks, tools, other NFI, livestock etc.)
44/218 20.8%
(14.7-27.9) 44/218
20.2% (15.1-26.1)
Requested increased remittances or gifts as compared to normal
8/218 10.1%
(5.9-15.8) 8/218
3.7% (1.6-7.1)
Reduced the quantity and/or frequency of meals
83/159 52.2%
(44.1-60.2) 62/218
28.4% (22.6-34.9)
Begged 38/218 16.4%
(11.0-23.0) 38/218
17.4% (12.6-23.1)
Engaged in potentially risky or harmful activities (Cutting live trees and sell, local alcohol making, sending young girls and boys for labour work)]
46/159 28.9%
(22.0-36.6) 96/218
44.0% (37.3-50.9)
Proportion of households not consuming any vegetables, fruits, meat, eggs, fish/seafood, and milk/milk products
57/212 26.9%
(21.0-33.4) 57/212
26.9% (21.0-33.4)
Proportion of households consuming either a plant or animal source of vitamin A
105/212 49.5%
(42.6-56.5) 105/212
49.5% (42.6-56.5)
Proportion of households consuming organ meat/flesh meat, or fish/seafood (food sources of haem iron)
71/212 33.5%
(27.2-40.3) 71/212
33.5% (27.2-40.3)
WASH
Water quality
Proportion of households using improved drinking water source
154/156 98.7%
(95.4-99.8) 213/217
98.2% (95.3-99.5)
Water quantity
Proportion of households that use:
≥ 20 lpppd 90/155 58.1%
(49.9-65.9) 104/217
47.9% (41.1-54.8)
15 - <20 lpppd 52/155 33.5%
(26.2-41.6) 97/217
44.7% (38.0-51.6)
<15 lpppd 13/155 8.4%
(4.5-13.9) 16/217
7.4% (4.3-11.7)
Average water usage in lppd 18.9 lpppd 24.8 lpppd UNHCR target ≥ 20 litres /person/day
7 | P a g e
Kharasana El Meiram
Classification of public
health significance or target (where
applicable)
Number /
total % (95% C.I.)
Number /
total % (95% CI)
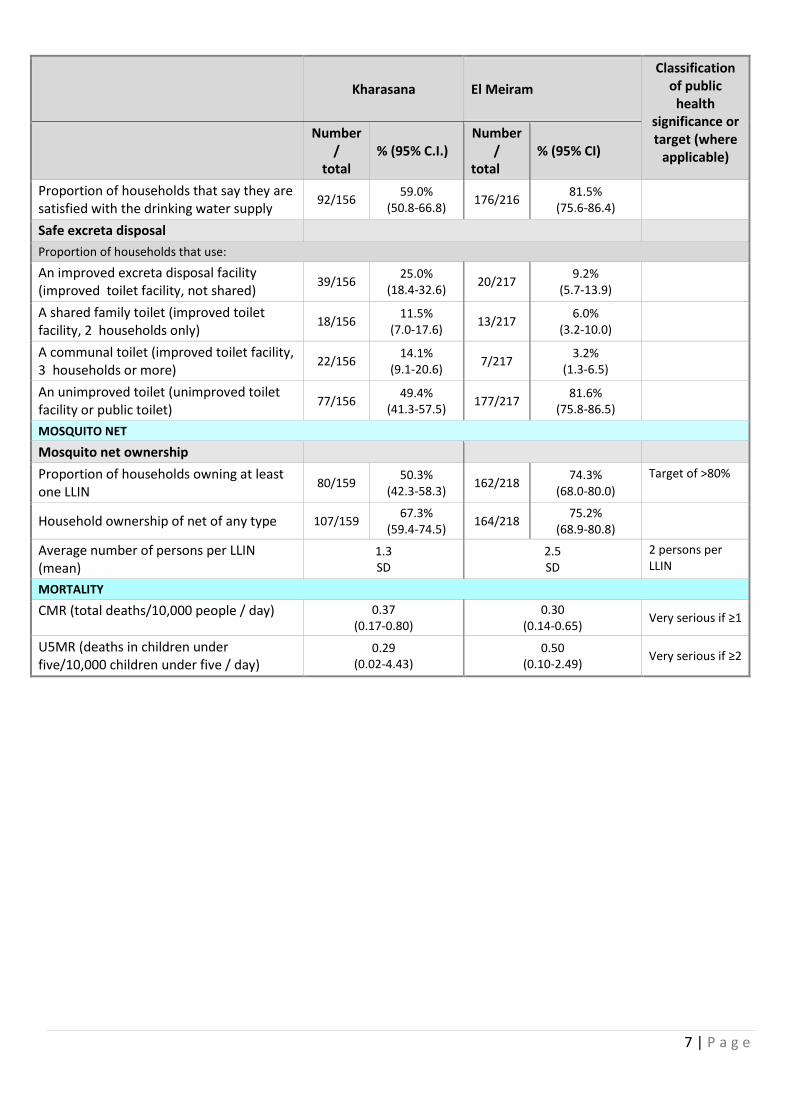
Proportion of households that say they are satisfied with the drinking water supply
92/156 59.0%
(50.8-66.8) 176/216
81.5% (75.6-86.4)
Safe excreta disposal
Proportion of households that use:
An improved excreta disposal facility (improved toilet facility, not shared)
39/156 25.0%
(18.4-32.6) 20/217
9.2% (5.7-13.9)
A shared family toilet (improved toilet facility, 2 households only)
18/156 11.5%
(7.0-17.6) 13/217
6.0% (3.2-10.0)
A communal toilet (improved toilet facility, 3 households or more)
22/156 14.1%
(9.1-20.6) 7/217
3.2% (1.3-6.5)
An unimproved toilet (unimproved toilet facility or public toilet)
77/156 49.4%
(41.3-57.5) 177/217
81.6% (75.8-86.5)
MOSQUITO NET
Mosquito net ownership
Proportion of households owning at least one LLIN
80/159 50.3%
(42.3-58.3) 162/218
74.3% (68.0-80.0)
Target of >80%
Household ownership of net of any type 107/159 67.3%
(59.4-74.5) 164/218
75.2% (68.9-80.8)
Average number of persons per LLIN (mean)
1.3 SD
2.5 SD
2 persons per LLIN
MORTALITY
CMR (total deaths/10,000 people / day) 0.37 (0.17-0.80)
0.30 (0.14-0.65)
Very serious if ≥1
U5MR (deaths in children under five/10,000 children under five / day)
0.29 (0.02-4.43)
0.50 (0.10-2.49)
Very serious if ≥2
8 | P a g e
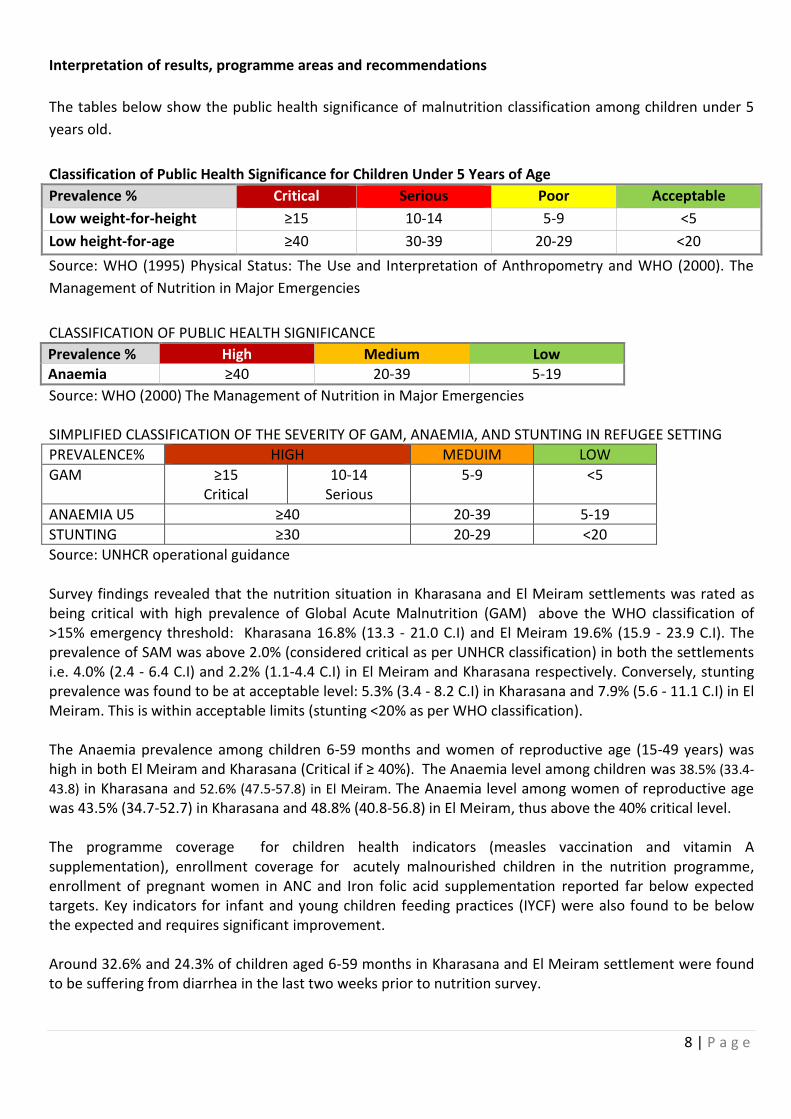
Interpretation of results, programme areas and recommendations
The tables below show the public health significance of malnutrition classification among children under 5
years old.
Classification of Public Health Significance for Children Under 5 Years of Age
Prevalence % Critical Serious Poor Acceptable
Low weight-for-height ≥15 10-14 5-9 <5
Low height-for-age ≥40 30-39 20-29 <20
Source: WHO (1995) Physical Status: The Use and Interpretation of Anthropometry and WHO (2000). The
Management of Nutrition in Major Emergencies
CLASSIFICATION OF PUBLIC HEALTH SIGNIFICANCE
Prevalence % High Medium Low Anaemia ≥40 20-39 5-19
Source: WHO (2000) The Management of Nutrition in Major Emergencies SIMPLIFIED CLASSIFICATION OF THE SEVERITY OF GAM, ANAEMIA, AND STUNTING IN REFUGEE SETTING
PREVALENCE% HIGH MEDUIM LOW
GAM ≥15 Critical
10-14 Serious
5-9 <5
ANAEMIA U5 ≥40 20-39 5-19
STUNTING ≥30 20-29 <20
Source: UNHCR operational guidance Survey findings revealed that the nutrition situation in Kharasana and El Meiram settlements was rated as being critical with high prevalence of Global Acute Malnutrition (GAM) above the WHO classification of >15% emergency threshold: Kharasana 16.8% (13.3 - 21.0 C.I) and El Meiram 19.6% (15.9 - 23.9 C.I). The prevalence of SAM was above 2.0% (considered critical as per UNHCR classification) in both the settlements i.e. 4.0% (2.4 - 6.4 C.I) and 2.2% (1.1-4.4 C.I) in El Meiram and Kharasana respectively. Conversely, stunting prevalence was found to be at acceptable level: 5.3% (3.4 - 8.2 C.I) in Kharasana and 7.9% (5.6 - 11.1 C.I) in El Meiram. This is within acceptable limits (stunting <20% as per WHO classification). The Anaemia prevalence among children 6-59 months and women of reproductive age (15-49 years) was high in both El Meiram and Kharasana (Critical if ≥ 40%). The Anaemia level among children was 38.5% (33.4-
43.8) in Kharasana and 52.6% (47.5-57.8) in El Meiram. The Anaemia level among women of reproductive age was 43.5% (34.7-52.7) in Kharasana and 48.8% (40.8-56.8) in El Meiram, thus above the 40% critical level. The programme coverage for children health indicators (measles vaccination and vitamin A supplementation), enrollment coverage for acutely malnourished children in the nutrition programme, enrollment of pregnant women in ANC and Iron folic acid supplementation reported far below expected targets. Key indicators for infant and young children feeding practices (IYCF) were also found to be below the expected and requires significant improvement. Around 32.6% and 24.3% of children aged 6-59 months in Kharasana and El Meiram settlement were found to be suffering from diarrhea in the last two weeks prior to nutrition survey.
9 | P a g e
At the time of the survey most refugees had exhausted their food ration which was distributed during the month of August to cover the two month’s needs (i.e. August and September). Among other options, negative coping strategies included engaging in potentially risky activities as well as reduction of daily meal in terms of quantity and quality. This is considered as an area of concern. General food assistance is the principal source of household food security for the entire refugee community in Kharasana and El Meiram. The existing process of inclusion of new refugees in the food ration distribution list takes a long time and the distribution system also does not provide room for flexibility to consider refugees in first level registration. As a result, many of the newly arriving refugees do not access food, and are therefore, dependent on socio-cultural support mechanisms. Those accessing food ration further share what they have with their family and clan members. As a result, the intended recommended 2,100 Kcal per person per day is further diluted and hence does not meet the desired objectives. This situation has a direct impact on nutritional status deterioration for refugees. With respect to water supply in both settlements, the study revealed that people access water from safe sources i.e. 98.7% (95.4-99.8) in Kharasana and 98.2% (95.3-99.5) in El Meiram. Regarding the sanitation situation, the study found out that 49.4% (41.3-57.5) in Kharasana and 81.6% (75.8-86.5) in El Meiram use unsafe methods of excreta disposal. The exposure to diarrhoeal disease is primarily associated with poor hygiene and sanitation practices of the community. It is worth noting that high diarrheal prevalence is directly correlated to the high level of acute malnutrition. The proportion of households owning at least one LLIN was 50.3% (42.3-58.3) in Kharasana and 74.3% (68.0-80.0) in El Meiram. This is below UNHCR’s target >80%. Household ownership of net of any type was 67.3% (59.4-74.5) in Kharasana and 75.2% (68.9-80.8) in El Meiram. The proportion of total population (all ages) that slept under a net of any type was 48.3% in Kharasana and 70.7% in El Meiram. The proportion of children (aged 0-59 months) that slept under nets of any type was 52.7% in Kharasana and 16.1% in El Meiram. The proportion of pregnant women slept under a net of any type was 62.8% in Kharasana and 75.0 % in El Meiram. According to health facility information from Kharasana and El Meiram settlements, Malaria is one of the leading causes of morbidity. Lack of adequate mosquito net coverage contributes towards epidemics, and directly impacts on the overall health condition of the population. The retrospective mortality rates for the previous three months for crude mortality rate was 0.37 (0.17-0.80 95% CI) in Kharasana and 0.30 (0.14-0.65 95% CI) in El Meiram. The under-five mortality rate was 0.29 (0.02-4.43 95% CI) in Kharasana and 0.50 (0.10-2.49 95% CI) in El Meiram. The overall results indicating the mortality rate in both locations is within acceptable limits <1/10,000/day for CMR and <2/10,000/day for U5MR. The ultimate cause of high levels of acute malnutrition and Anaemia among the refugees in Kharasana and El Meiram is associated with multiple factors including but not limited to: poor dietary intake, poor infant and young children feeding practices, living in unhealthy conditions, limited food and nutritional support and low level of related service delivery. Recommendations: Immediate actions on nutrition
High prevalence of acute malnutrition requires an integrated and holistic approach strengthening both the preventive and curative aspects of nutrition interventions. (UNICEF, UNHCR, WFP and MOH to agree and provide clear guidance for nutrition partners)
10 | P a g e
Community-based Management of Acute Malnutrition (CMAM) should consider and scale up the MAM coverage, routine MUAC screening, IYCF and health services and enhance linkages between programmes vis-à-vis quality of service delivery and information management for the timely detection of malnutrition and actions. (All nutrition partners, UNICEF, UNHCR, WFP and MOH to ensure and support the implementation)
Devise a mechanism to introduce micronutrient supplementation as an anaemia reduction strategy and reverse the high prevalence to acceptable situation. (WFP, UNICEF UNHCR and WHO to coordinate and support nutrition and health projects implementing partners for implementation of recommendation).
Health partners should undertake de-worming campaigns as a complementary action to reduce the anaemia and acute malnutrition level among children 6-59 months. Streamline the routine and mass immunization and Vitamin A supplementations for children 6-59 months and ensure that individual vaccinations are recorded on vaccine card and kept with the mother/care-giver. (WFP, UNICEF, UNHCR and WHO to coordinate and support nutrition and health projects implementing partners for implementation of recommendation).
High prevalence of acute malnutrition and anaemia justifies the need for nutritional supplementation which provides energy and micronutrient needs of the most vulnerable groups. Continuation and strengthening of Blanket Supplementary Feeding Programme (BSFP) for all children 6-59 months and all Pregnant and Lactating Women (PLW). Blanket Supplementary Feeding Programme (BSFP) is already implemented in the two settlements, however, strengthening of the programme, timely targeting and delivery of resources with clear a set of outreach activities is needed to ensure coverage and compliance, mothers/care-taker counselling and sensitization. (WFP to consider allocations of resources and all nutrition partners to support targeting and timely liaise with WFP for the implementations of Supplementary feeding programme).
General Food Assistance
UNHCR and COR to discuss and agree with WFP so that new arrivals are allowed to access food assistance based on level 1 Registration, and in the meantime establish a mechanism for continuous second level (Biometrics) registration and issuance of ration cards on a timely basis to avoid increased backlog and minimize suffering of refugees from food shortage.
Refugees Awareness on service and utilization
Community outreach agents in all sites should strengthen and expand awareness campaigns, regularizing this in the programme in order to improve access to facility and community-based services. (UNHCR, WFP, UNICEF and WHO to support partners in the areas of outreach interventions).
11 | P a g e
1. Introduction This report presents SENS assessments conducted in two refugee settlements in Kharasana and El Meiram in Keilak and El Meiram localities of West Kordofan state respectively. The survey was carried out between 22nd of October to 4th of November 2017. The report presentation is outlined as below:
Background: This section presents background information related to the health, nutrition and food security situation for the two locations.
Methodology: the methodology and survey teams used for the surveys were similar in all settlements.
Results: presents the findings, and this is reported separately for each settlement.
Discussion: refers to the discussion of the two locations highlighting similarities and differences.
Recommendations: This presents joint recommendations (where situations are similar), and specific recommendations if situations are different.
Annexes: Includes NCHS results, summary of plausibility, lists of participants, maps, local calendar and full SENS questionnaires.
Geographic description of survey area West Kordofan is one of the 18 states of Sudan situated in the south western part of the country. Al-Fula is the capital of the state, which connects the capital city Khartoum to western part, through an Asphalt road crossing to Darfur states. The state is sharing boundaries internally with South Kordofan state in the East, Darfur state in the west, North Kordofan state from the North and international boundary in the south with South Sudan. West Kordofan is known for rain fed/seasonal agricultural activities which include agronomy and agro-pastoral livelihood system. Sorghum, Sesame and Nuts are widely grown crops. Livestock (cattle, goats and sheep) also contributes substantial amounts of household food economy and income. Description of the South Sudanese Refugees The conflict that broke out in South Sudan on 15 December 2013 displaced hundreds of thousands of civilians in South Sudan and continues to cause an outflow of refugees into neighboring countries including Sudan. As of October 2017, over 416,829 South Sudanese refugees have arrived in Sudan since December 2013. The sporadic influx into mostly White Nile, East Darfur, South Darfur, North Darfur, South Kordofan, and West Kordofan states, which has averaged at approximately 25,000 individuals per month in 2017. Beginning 2017, there was a surge of South Sudanese refugees fleeing into Sudan with critical and urgent health and nutrition needs, the majority were women and children. A large number (45 per cent) of South Sudanese refugees continue to reside in eight designated settlements in two localities in White Nile state (Jouri, Al Redis 1 and 2, El Kashafa, Um Sangour, Khor Alwarel, Al Alagaya, and Dabat Bosin) and in two established settlements in East Darfur (Kario and Al Nimir). The rest of the South Sudanese arrivals are highly mobile and spread out across Sudan, living mainly outside of formally established camps in South and North Darfur, West and South Kordofan and Khartoum, with a small number also living in Blue Nile and North Kordofan. Kharasana and El Meiram are among the newly established rural settlements receiving refugees and are provided with basic protection and lifesaving interventions. These settlements are located in the south-west of Sudan in West Kordofan state in Keilak and El Meiram localities respectively. The majority of refugees are women and children that fled from Northern Bahr el Ghazal, Western Bahr el Ghazal, Warrap and Abyei in South Sudan. During the design of this survey the population was estimated to be 15,132 in Kharasana and 9,679 in El Meiram. However, after the secondary level registration (Biometrics) the population in Kharasana was
12 | P a g e
reduced and was estimated at 4,887 and El Meiram 10,422, it is worth noting that the secondary level registration was undertaken during the season of agricultural activities, in which the mobility of south Sudanese is high in search of labour work as a coping mechanism. The refugees’ settlements in Kharasana and El Meiram are unique in nature, as refugees are settled in the periphery of the local towns and living together with the host community. However, refugees identify themselves in the group settlement, subdivided into bocks. The house arrangement is similar to a usual standard village setting, as opposed to a typical camp house set-up.
Description of interventions:
Food Security
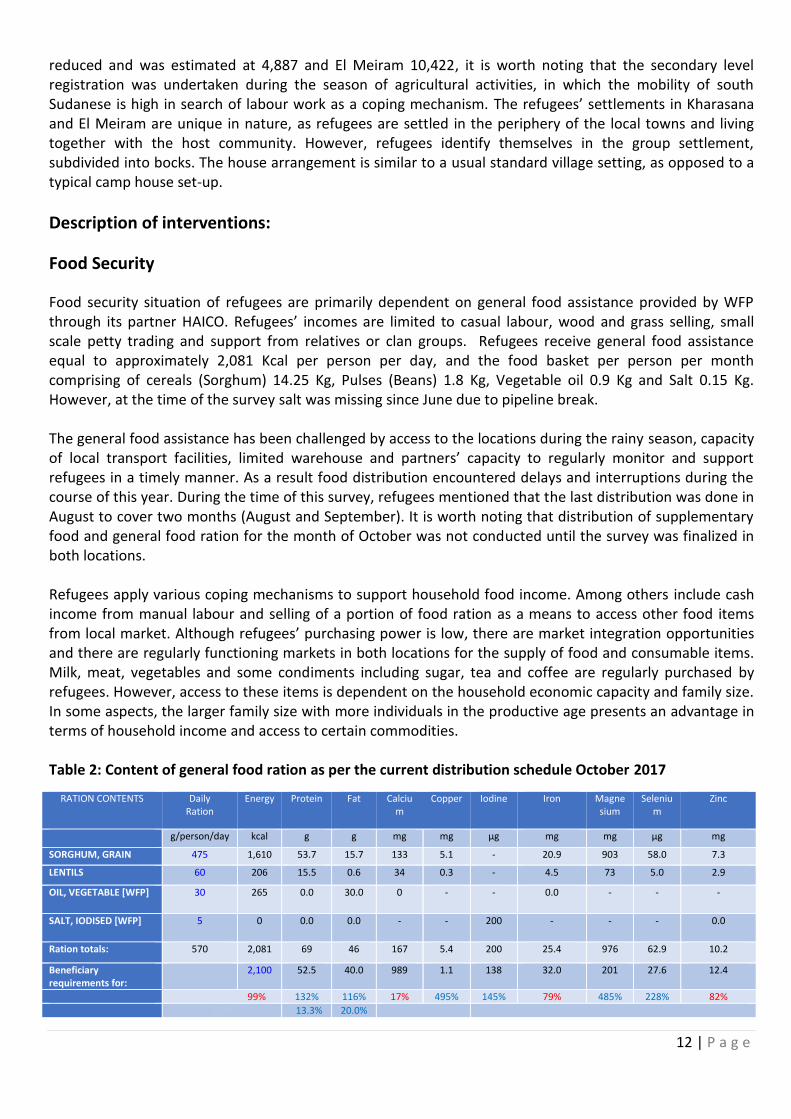
Food security situation of refugees are primarily dependent on general food assistance provided by WFP through its partner HAICO. Refugees’ incomes are limited to casual labour, wood and grass selling, small scale petty trading and support from relatives or clan groups. Refugees receive general food assistance equal to approximately 2,081 Kcal per person per day, and the food basket per person per month comprising of cereals (Sorghum) 14.25 Kg, Pulses (Beans) 1.8 Kg, Vegetable oil 0.9 Kg and Salt 0.15 Kg. However, at the time of the survey salt was missing since June due to pipeline break. The general food assistance has been challenged by access to the locations during the rainy season, capacity of local transport facilities, limited warehouse and partners’ capacity to regularly monitor and support refugees in a timely manner. As a result food distribution encountered delays and interruptions during the course of this year. During the time of this survey, refugees mentioned that the last distribution was done in August to cover two months (August and September). It is worth noting that distribution of supplementary food and general food ration for the month of October was not conducted until the survey was finalized in both locations. Refugees apply various coping mechanisms to support household food income. Among others include cash income from manual labour and selling of a portion of food ration as a means to access other food items from local market. Although refugees’ purchasing power is low, there are market integration opportunities and there are regularly functioning markets in both locations for the supply of food and consumable items. Milk, meat, vegetables and some condiments including sugar, tea and coffee are regularly purchased by refugees. However, access to these items is dependent on the household economic capacity and family size. In some aspects, the larger family size with more individuals in the productive age presents an advantage in terms of household income and access to certain commodities. Table 2: Content of general food ration as per the current distribution schedule October 2017
RATION CONTENTS Daily Ration
Energy Protein Fat Calcium
Copper Iodine Iron Magnesium
Selenium
Zinc
g/person/day kcal g g mg mg µg mg mg µg mg
SORGHUM, GRAIN 475 1,610 53.7 15.7 133 5.1 - 20.9 903 58.0 7.3
LENTILS 60 206 15.5 0.6 34 0.3 - 4.5 73 5.0 2.9
OIL, VEGETABLE [WFP] 30 265 0.0 30.0 0 - - 0.0 - - -
SALT, IODISED [WFP] 5 0 0.0 0.0 - - 200 - - - 0.0
Ration totals: 570 2,081 69 46 167 5.4 200 25.4 976 62.9 10.2
Beneficiary requirements for:
2,100 52.5 40.0 989 1.1 138 32.0 201 27.6 12.4
99% 132% 116% 17% 495% 145% 79% 485% 228% 82%
67% 13.3% 20.0%
13 | P a g e
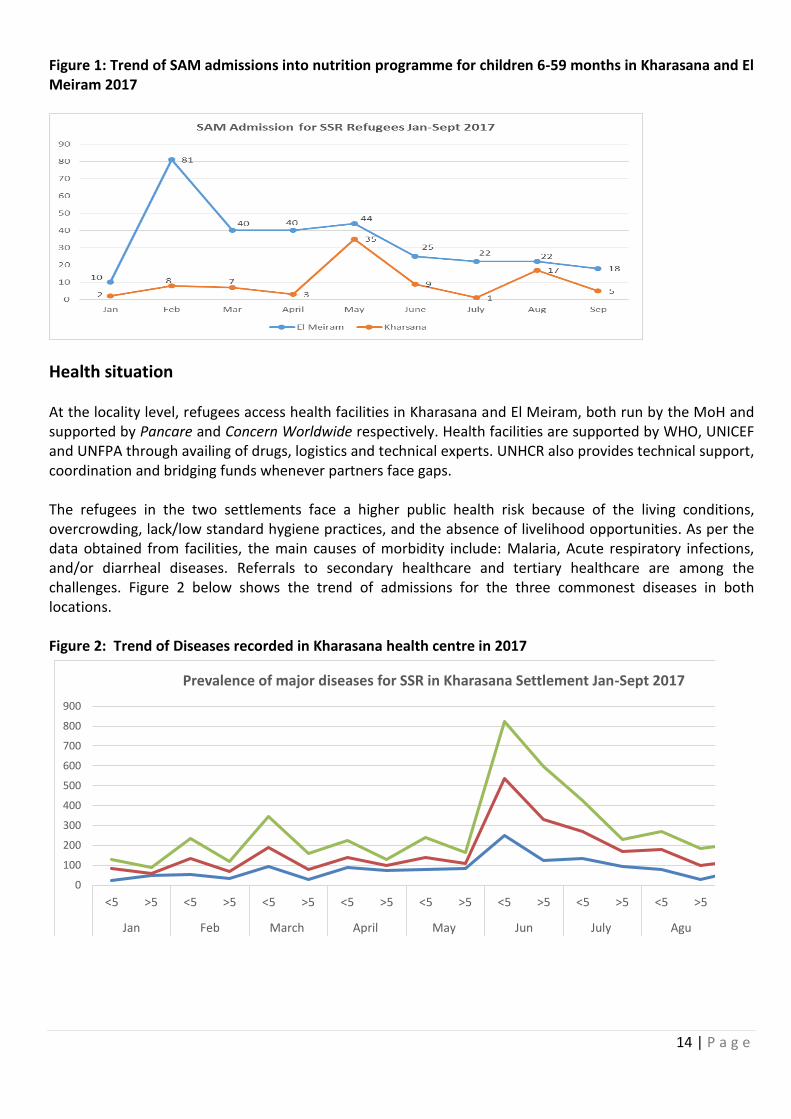
Nutrition Programming Situation The nutrition programme in the West Kordofan is managed through an interagency coordination mechanism. UNICEF-led sector coordination and UNHCR-led Refugee Response Technical Advisory Group (TAG) are the main fora to coordinate and lead nutrition interventions in refugee settlements. The roles and responsibilities are shared amongst partners to address the nutrition and health interventions from the reception/entry points through final settlement or destination of refugees in the country. Accordingly, UNICEF is responsible for the mobilization of therapeutic resources and provide technical guidance for the treatment of severe acute malnutrition (SAM). WHO provides support for the treatment of severe acute malnutrition with medical complications at facility based stabilization centres (SC). Therapeutic milk F75/F100 and ReSoMal for the SC is provided by UNICEF. Ministry of Health is responsible and the main channel to receive and mobilize nutrition resources from the centre to facility levels. UNHCR is responsible for coordination and providing support to health and nutrition programme at reception centres and camps, and also avails funding to bridge the gaps whenever partners are facing funding problems. WFP is responsible for the mobilization of supplementary food. The WFP nutrition programme is in principle categorized as follows: treatment of Moderate Acute Malnutrition (MAM), emergency Blanket supplementary feeding programme for pregnant women, lactating mothers and children 6-59 months and preventive programme through 1,000 days policy to support linear growth and development of child from the time of conception to the first two years of age of a child (Pregnant women, Lactating mothers and children 6-23 months). The current ongoing WFP programme is addressing treatment of acute moderate malnutrition through nutrition project implementing partners and distribution of emergency blanket supplementary food through general food distribution partner. Although, blanket supplementary feeding programme has encountered problems of interruptions, WFP provided the support for the extended period or beyond the implementation duration of emergency response in order to curb the high malnutrition rate of vulnerable groups. Partner NGOs, Pancare and Ministry of Health are main partners implementing nutrition and health programme in Kharasana. During the time of the survey, Pancare was preparing to phase-out and MOH was expecting CONCERN Worldwide to phase-in. Refugees access nutritional support from the district hospital in Kharasana and small health facility established in the centre of the refugees’ village. GAH and ASSIST are Local NGOs and ministry of health are implementing nutrition programme in El-Meiram. During the time of the survey CONCERN was preparing to phase-in and will be the main Nutrition and health partner for both Kharasana and El Meiram until March 2018. In terms of operations, periodic and regular MUAC screening are undertaken by volunteers and outreach workers for the admission of malnourished children into the programme. Weight-for- height criteria is less utilised at community and facility level. Fragmentation of nutrition programme interventions among different partners per location is common and this is identified as a gap. The nutrition programmes are delivered from one room, which was observed as confined and lacking quiet/appetite testing corner, baby friendly space and breast feeding corners. The IYCF aspects of nutrition programme is limited to awareness activities and it is difficult to measure the progress or the impact in a precise manner. Figure 1 below shows the trend of admissions of SAM children into the ongoing nutrition programme in Kharasana and El Meiram.
14 | P a g e
Figure 1: Trend of SAM admissions into nutrition programme for children 6-59 months in Kharasana and El Meiram 2017
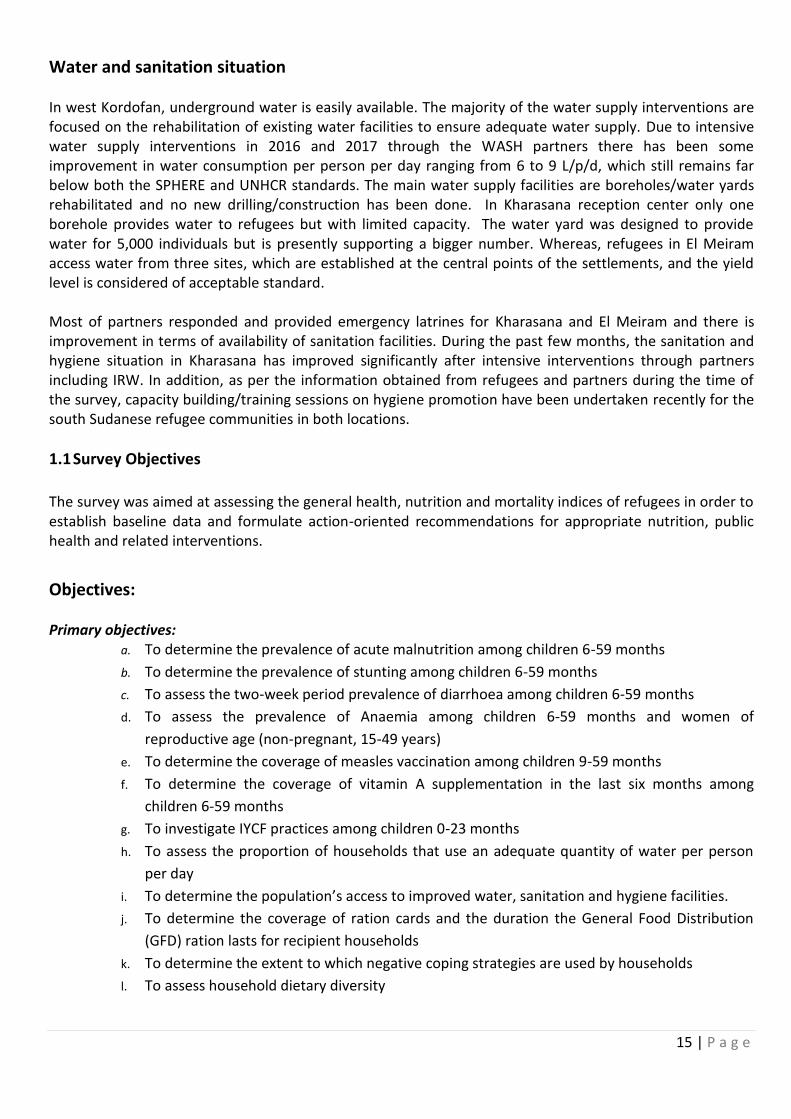
Health situation At the locality level, refugees access health facilities in Kharasana and El Meiram, both run by the MoH and supported by Pancare and Concern Worldwide respectively. Health facilities are supported by WHO, UNICEF and UNFPA through availing of drugs, logistics and technical experts. UNHCR also provides technical support, coordination and bridging funds whenever partners face gaps. The refugees in the two settlements face a higher public health risk because of the living conditions, overcrowding, lack/low standard hygiene practices, and the absence of livelihood opportunities. As per the data obtained from facilities, the main causes of morbidity include: Malaria, Acute respiratory infections, and/or diarrheal diseases. Referrals to secondary healthcare and tertiary healthcare are among the challenges. Figure 2 below shows the trend of admissions for the three commonest diseases in both locations. Figure 2: Trend of Diseases recorded in Kharasana health centre in 2017
0
100
200
300
400
500
600
700
800
900
<5 >5 <5 >5 <5 >5 <5 >5 <5 >5 <5 >5 <5 >5 <5 >5
Jan Feb March April May Jun July Agu
Prevalence of major diseases for SSR in Kharasana Settlement Jan-Sept 2017
15 | P a g e
Water and sanitation situation In west Kordofan, underground water is easily available. The majority of the water supply interventions are focused on the rehabilitation of existing water facilities to ensure adequate water supply. Due to intensive water supply interventions in 2016 and 2017 through the WASH partners there has been some improvement in water consumption per person per day ranging from 6 to 9 L/p/d, which still remains far below both the SPHERE and UNHCR standards. The main water supply facilities are boreholes/water yards rehabilitated and no new drilling/construction has been done. In Kharasana reception center only one borehole provides water to refugees but with limited capacity. The water yard was designed to provide water for 5,000 individuals but is presently supporting a bigger number. Whereas, refugees in El Meiram access water from three sites, which are established at the central points of the settlements, and the yield level is considered of acceptable standard. Most of partners responded and provided emergency latrines for Kharasana and El Meiram and there is improvement in terms of availability of sanitation facilities. During the past few months, the sanitation and hygiene situation in Kharasana has improved significantly after intensive interventions through partners including IRW. In addition, as per the information obtained from refugees and partners during the time of the survey, capacity building/training sessions on hygiene promotion have been undertaken recently for the south Sudanese refugee communities in both locations.
1.1 Survey Objectives
The survey was aimed at assessing the general health, nutrition and mortality indices of refugees in order to establish baseline data and formulate action-oriented recommendations for appropriate nutrition, public health and related interventions.
Objectives: Primary objectives:
a. To determine the prevalence of acute malnutrition among children 6-59 months
b. To determine the prevalence of stunting among children 6-59 months
c. To assess the two-week period prevalence of diarrhoea among children 6-59 months
d. To assess the prevalence of Anaemia among children 6-59 months and women of
reproductive age (non-pregnant, 15-49 years)
e. To determine the coverage of measles vaccination among children 9-59 months
f. To determine the coverage of vitamin A supplementation in the last six months among
children 6-59 months
g. To investigate IYCF practices among children 0-23 months
h. To assess the proportion of households that use an adequate quantity of water per person
per day
i. To determine the population’s access to improved water, sanitation and hygiene facilities.
j. To determine the coverage of ration cards and the duration the General Food Distribution
(GFD) ration lasts for recipient households
k. To determine the extent to which negative coping strategies are used by households
l. To assess household dietary diversity
16 | P a g e
m. To determine the utilization of mosquito nets (all types and LLINs) by the total population,
children 0-59 months and pregnant women
n. To make recommendations on actions to be undertaken to address the situation
Secondary objectives: o. To assess crude and under-five mortality rates in the refugee settlements in the last three
months.
p. To determine enrolment into Antenatal Care clinic and coverage of iron-folic acid
supplementation in pregnant women.
q. To assess the enrollment status of children 6-59 months into selective feeding programmes
(OTP/SC and TSFP).
2. Methodology
Methodology: The survey was based on the UNHCR Standardized Expanded Nutrition Survey (SENS)
guidelines for refugee populations version 2 (2013) and the Standardized Monitoring and Assessment of Relief and Transitions (SMART) methodology.
2.1 Sample size
Simple random sampling was used to estimate a representative sample of households and children based on the expected prevalence of acute malnutrition (50%), the estimated desired precision (±5), proportion of children below 5 years (21.0%) in Kharasana and (19.0%) in El Meiram, and average household size (4.4) in Kharasana and (5.1) in El Meiram, with a 10% allowance for non-response. Population data was obtained from the ProGres database (UNCHR October 2017), which had the demographic breakdown of population through biometric registration (secondary level) of all refugees in the localities. The resultant required sample size was 513 households and 384 children in Kharasana and 489 households and 384 children in El Meiram. All eligible children aged 6-59 months from all selected households were included in the assessment of anthropometry, Anaemia, health and infant and young child feeding (children (0-23 months). Half of the selected households were assessed for Food Security, WASH, Mosquito net coverage, and women (15-49 years) for Anaemia measurements and coverage for antenatal care. Table 3 : Sample size calculation: Anthropometry and Mortality October 2017 Kharasana El Meiram
Estimated prevalence (%) (no data) 50 50
± Desired precision (%) (UNHCR SENS guidelines) ±5 ±5
Average household size (ProGres) 4.4 5.1
<5 population (%)(ProGres)) 21.0 19.0
Non response households (NRR) (%) 10 10
Children to be included 384 384
Households to be included for Anthropometry and Health module (ENA for SMART) Including NRR 513 489
2.2 Sampling procedure: selecting households
In each settlement, houses were physically labeled with unique numbers per block. To reduce the non-response rate and ensure results were representative of people actually living in the camps at the time of
17 | P a g e
the survey, empty houses or shelter1, as verified through neighbors were labeled but not included in the sampling frame. If more than one shelter is available in a compound, and if all houses belong to the same family, then the number is given only to the main house where all family members are dwelling and eating together. Whereas if the houses belong to different family members, then unique numbers were given for each house to be considered separately and included in the sampling frame. Random method was followed to select sample households by using ENA-for-SMART method. The total households in the settlement are considered as sampling frame. A Household is considered as sampling unit and the total number of households to be studied were calculated by using ENA simple random method. The resultant sampled households (513 in Kharasana and 489 in El Meiram) were drawn and distributed by using ENA statistical calculator for sampling or random numbers. The data range for the sampling frame taken from the total households labeled during the time of the survey.
2.3 Questionnaire and measurement methods
Questionnaires
The questionnaires were prepared in English language and administered in Arabic and local language (Nuer and Dinka) via translators. The questionnaires were pre-tested before the survey.
Following the SENS guideline the six modules of SENS were used (anthropometry and health, Anaemia, IYCF, WASH, mosquito net coverage, and food security). In addition the mortality module from SMART survey was included to maintain a baseline mortality data. Following these modules questionnaires were designed to provide information on the relevant indicators for the different target groups as indicated in the survey objectives. The six modules of questionnaires covered the following areas and measurements:
Module 1 (anthropometry and health): Children 6-59 months- This included information on questions and measurements on children aged 6-59 months. Information was collected on anthropometric status, Oedema, enrolment in selective feeding programmes, immunization (measles), vitamin A supplementation in the last six months, morbidity from diarrhoea in past two weeks.
Module 2 (Anaemia) Haemoglobin assessment among children aged 6 – 59 months and non-pregnant women: Women 15-49 years- This included questions and measurements on women aged 15 – 49 years. Information was collected on women’s pregnancy status, enrolment in ANC, coverage of iron-folic acid pills.
Module 3 (IYCF): Children 0-23 months- This included questions on infant and young child feeding (IYCF) practices among children aged 0-23 months.
Module 4: Water, Sanitation and Hygiene (WASH). This included questions on the quantity of water used per household and the satisfaction with the drinking water supply, hygiene and sanitation.
Module 5: Mosquito net:-This included questions on proportion of households owning at least one mosquito net and utilization.
Module 6: Food Security: - This included questions on access and use of the GFD ration, use of negative coping mechanisms and household dietary diversity.
1 An empty shelter was considered as abandoned and excluded from the nutrition survey if no one was present in that house and
no information when they are coming back.
18 | P a g e
Additional Module from SMART: Mortality- This included questions related to mortality in the last three months among the households.
Measurement methods
a) Household-level indicators
WASH: The questionnaire used was adopted from the UNHCR’s Standardized Expanded Nutrition Survey Guidelines for Refugee Populations. Food Security: The questionnaire used was adopted from the UNHCR’s Standardized Expanded Nutrition Survey Guidelines for Refugee Populations. Mosquito Net: The questionnaire used was adopted from the UNHCR’s Standardized Expanded Nutrition Survey Guidelines for Refugee Populations. Mortality: Individual-level mortality data collection was used from the SMART methodology.
b) Individual-level indicators
Sex of children: recorded as male or female. Birth date or age in months for children 0-59 months: the exact date of birth (day, month, and year) was recorded from birth certificates and checked on an EPI card or child health card. If no reliable proof of age was available, age was estimated in months using multiple approaches, by using a local seasonal and events calendar or by probing, checking if sibling age is known and length/height measurement was used for inclusion; the child had to measure between 65 cm and 110 cm. The age in mortality data was recorded in years.
Age of women 15-49 years: Unlike small children, the exact date of birth of women was difficult to explore. Reported age was recorded in years.
Weight of children 6-59 months: measurements were taken to the closest 100 grams using an electronic scale (SECA scale). All children were weighed without clothes. Female children were measured by female survey team inside the selected house, or keeping light clothes to address cultural sensitivity.
Height/Length of children 6-59 months: children’s height or length was taken to the closest millimeter using a wooden height board (Shorr Product). Height was used to decide on whether a child should be measured lying down (length) or standing up (height). Children less than 87cm were measured lying down, while those greater than or equal to 87cm were measured standing up.
Oedema in children 6-59 months: bilateral Oedema was assessed by applying gentle thumb pressure on to the tops of both feet of the child for a period of three seconds (counting 1001 to 1003) and thereafter observing for the presence or absence of an indent. MUAC of children 6-59 months: MUAC was measured at the mid-point of the left upper arm between the elbow and the shoulder and taken to the closest millimeter using a standard tape. MUAC was recorded in centimeters.
19 | P a g e
Child enrolment in selective feeding programme for children 6-59 months: selective feeding programme
enrolment status was assessed for the outpatient therapeutic programme and for the supplementary
feeding programme. This was verified by card or showing the mother or care-giver the sample products
given at the different programmes.
Measles vaccination in children 6-59 months: measles vaccination was assessed by checking for the measles
vaccine on the EPI card if available or by asking the care-giver to recall if no EPI card was available. For ease
of data collection, results were recorded on all children but were only analyzed for children aged 9-59
months.
Vitamin A supplementation in last 6 months in children 6-59 months: whether the child received a vitamin A capsule over the past six months was recorded from the EPI card or health card if available or by asking the caregiver to recall if no card is available. A vitamin A capsule was shown to the caregiver when asked to recall. Haemoglobin concentration in children 6-59 months and women 15-49 years: Hb concentration was taken from a capillary blood sample from the fingertip and recorded to the closest gram per deciliter by using the portable HemoCue Hb 301 Analyzers (HemoCue, Sweden). If severe Anaemia was detected, the child or the woman was referred for treatment immediately. Diarrhoea in the last two weeks in children 6-59 months: an episode of diarrhoea was defined as three loose stools or more in 24 hours. Caregivers were asked if their child had suffered from episodes of diarrhoea in the past two weeks. ANC enrolment and iron/folic acid pills coverage: if the surveyed woman was pregnant, it was assessed by card or recall whether she was enrolled in the ANC programme and was receiving iron-folic acid pills. Infant and young child feeding practices in children 0-23 months: infant and young child feeding practices
were assessed based on the UNHCR’s Standardized Expanded Nutrition Survey Guidelines for Refugee
Populations.
Referrals: Children aged 6-59 months were referred to health centre/post for treatment when MUAC was < 12.5 cm, when oedema was present, or when haemoglobin was < 7.0 g/dL. Women of reproductive age were referred to the hospital for treatment when haemoglobin was < 8.0 g/dL.
2.4 Case definitions, inclusion criteria and calculations
Mortality: The Crude Mortality Rate (CMR) was expressed as the number of deaths per 10,000 persons per day. The formula below was applied: Crude Death Rate (CMR) = 10,000/a*f/ (b+f/2-e/2+d/2-c/2)
Where:
a = Number of recall days
b = Number of current household residents
c = Number of people who joined household during recall period
d = Number of people who left household during recall period
20 | P a g e
e = Number of births during recall period
f = Number of deaths during recall period
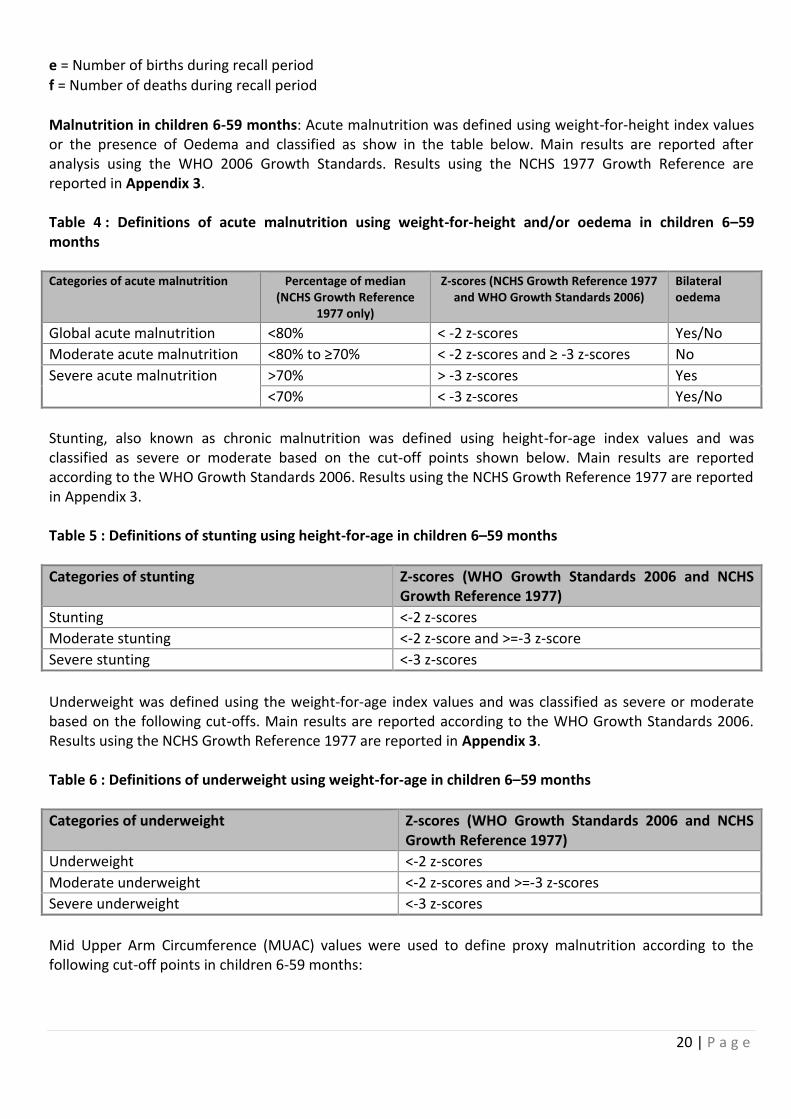
Malnutrition in children 6-59 months: Acute malnutrition was defined using weight-for-height index values or the presence of Oedema and classified as show in the table below. Main results are reported after analysis using the WHO 2006 Growth Standards. Results using the NCHS 1977 Growth Reference are reported in Appendix 3. Table 4 : Definitions of acute malnutrition using weight-for-height and/or oedema in children 6–59 months Categories of acute malnutrition Percentage of median
(NCHS Growth Reference 1977 only)
Z-scores (NCHS Growth Reference 1977 and WHO Growth Standards 2006)
Bilateral oedema
Global acute malnutrition <80% < -2 z-scores Yes/No
Moderate acute malnutrition <80% to ≥70% < -2 z-scores and ≥ -3 z-scores No
Severe acute malnutrition >70% > -3 z-scores Yes
<70% < -3 z-scores Yes/No
Stunting, also known as chronic malnutrition was defined using height-for-age index values and was classified as severe or moderate based on the cut-off points shown below. Main results are reported according to the WHO Growth Standards 2006. Results using the NCHS Growth Reference 1977 are reported in Appendix 3. Table 5 : Definitions of stunting using height-for-age in children 6–59 months
Categories of stunting Z-scores (WHO Growth Standards 2006 and NCHS Growth Reference 1977)
Stunting <-2 z-scores
Moderate stunting <-2 z-score and >=-3 z-score
Severe stunting <-3 z-scores
Underweight was defined using the weight-for-age index values and was classified as severe or moderate based on the following cut-offs. Main results are reported according to the WHO Growth Standards 2006. Results using the NCHS Growth Reference 1977 are reported in Appendix 3. Table 6 : Definitions of underweight using weight-for-age in children 6–59 months
Categories of underweight Z-scores (WHO Growth Standards 2006 and NCHS Growth Reference 1977)
Underweight <-2 z-scores
Moderate underweight <-2 z-scores and >=-3 z-scores
Severe underweight <-3 z-scores
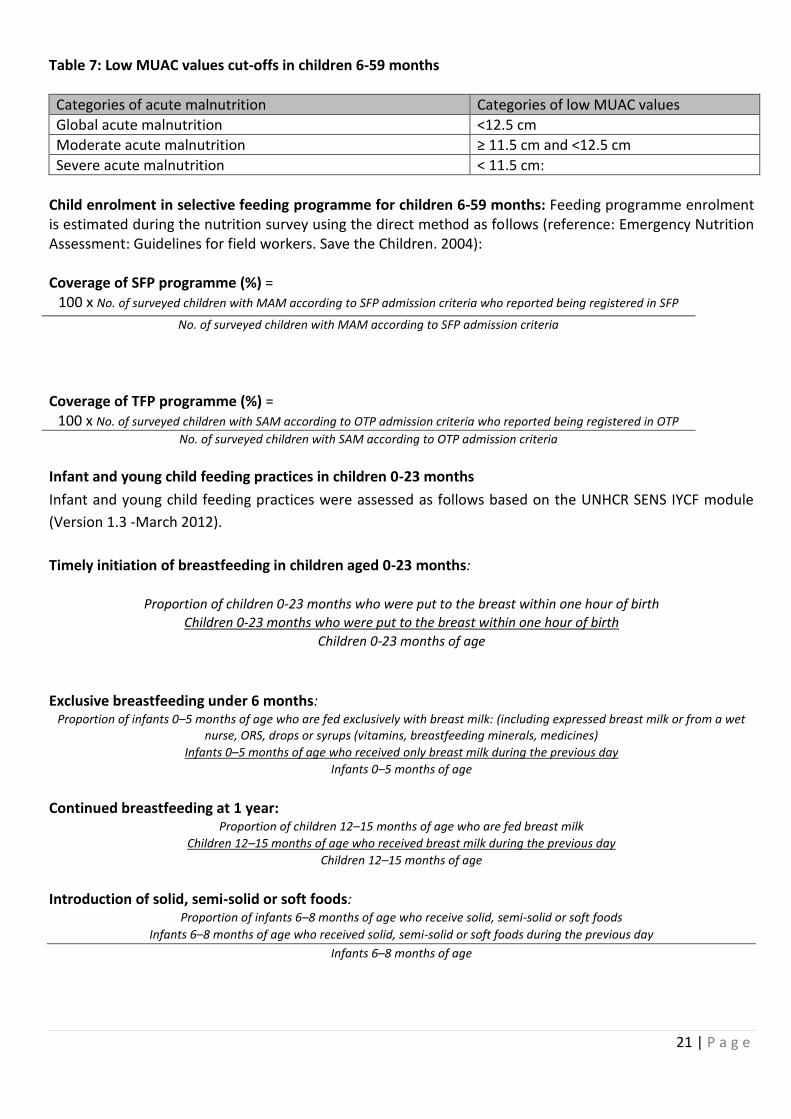
Mid Upper Arm Circumference (MUAC) values were used to define proxy malnutrition according to the following cut-off points in children 6-59 months:
21 | P a g e
Table 7: Low MUAC values cut-offs in children 6-59 months
Categories of acute malnutrition Categories of low MUAC values
Global acute malnutrition <12.5 cm
Moderate acute malnutrition ≥ 11.5 cm and <12.5 cm
Severe acute malnutrition < 11.5 cm:
Child enrolment in selective feeding programme for children 6-59 months: Feeding programme enrolment is estimated during the nutrition survey using the direct method as follows (reference: Emergency Nutrition Assessment: Guidelines for field workers. Save the Children. 2004): Coverage of SFP programme (%) =
100 x No. of surveyed children with MAM according to SFP admission criteria who reported being registered in SFP
No. of surveyed children with MAM according to SFP admission criteria
Coverage of TFP programme (%) =
100 x No. of surveyed children with SAM according to OTP admission criteria who reported being registered in OTP
No. of surveyed children with SAM according to OTP admission criteria
Infant and young child feeding practices in children 0-23 months
Infant and young child feeding practices were assessed as follows based on the UNHCR SENS IYCF module
(Version 1.3 -March 2012).
Timely initiation of breastfeeding in children aged 0-23 months:
Proportion of children 0-23 months who were put to the breast within one hour of birth
Children 0-23 months who were put to the breast within one hour of birth
Children 0-23 months of age
Exclusive breastfeeding under 6 months: Proportion of infants 0–5 months of age who are fed exclusively with breast milk: (including expressed breast milk or from a wet
nurse, ORS, drops or syrups (vitamins, breastfeeding minerals, medicines)
Infants 0–5 months of age who received only breast milk during the previous day
Infants 0–5 months of age
Continued breastfeeding at 1 year: Proportion of children 12–15 months of age who are fed breast milk
Children 12–15 months of age who received breast milk during the previous day
Children 12–15 months of age
Introduction of solid, semi-solid or soft foods: Proportion of infants 6–8 months of age who receive solid, semi-solid or soft foods
Infants 6–8 months of age who received solid, semi-solid or soft foods during the previous day
Infants 6–8 months of age
22 | P a g e
Children ever breastfed: Proportion of children born in the last 24 months who were ever breastfed Children born in the last 24 months who were ever
breastfed
Children born in the last 24 months
Continued breastfeeding at 2 years: Proportion of children 20–23 months of age who are fed breast milk
Children 20–23 months of age who received breast milk during the previous day
Children 20–23 months of age
Consumption of iron rich or iron fortified foods in children aged 6-23 months: Proportion of children 6–23 months of age who receive an iron-rich or iron-fortified food that is specially designed for infants and
young children, or that is fortified in the home. Children 6–23 months of age who received an iron-rich food or a food that was specially designed for infants and young children
and was fortified with iron, or a food that was Fortified in the home with a product that included iron during the previous day
Children 6–23 months of age
Bottle feeding: Proportion of children 0-23 months of age who are fed with a bottle
Children 0–23 months of age who were fed with a bottle during the previous day
Children 0–23 months of age
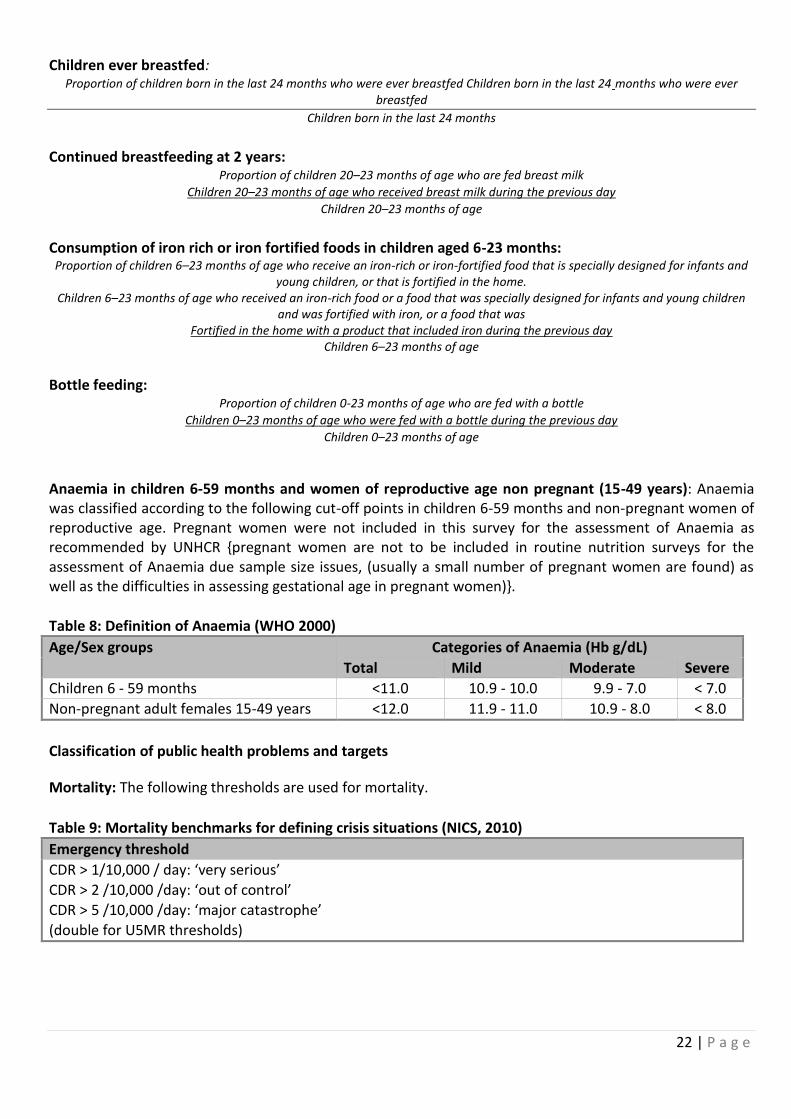
Anaemia in children 6-59 months and women of reproductive age non pregnant (15-49 years): Anaemia was classified according to the following cut-off points in children 6-59 months and non-pregnant women of reproductive age. Pregnant women were not included in this survey for the assessment of Anaemia as recommended by UNHCR {pregnant women are not to be included in routine nutrition surveys for the assessment of Anaemia due sample size issues, (usually a small number of pregnant women are found) as well as the difficulties in assessing gestational age in pregnant women)}.
Table 8: Definition of Anaemia (WHO 2000)
Age/Sex groups Categories of Anaemia (Hb g/dL)
Total Mild Moderate Severe
Children 6 - 59 months <11.0 10.9 - 10.0 9.9 - 7.0 < 7.0
Non-pregnant adult females 15-49 years <12.0 11.9 - 11.0 10.9 - 8.0 < 8.0
Classification of public health problems and targets
Mortality: The following thresholds are used for mortality.
Table 9: Mortality benchmarks for defining crisis situations (NICS, 2010)
Emergency threshold
CDR > 1/10,000 / day: ‘very serious’
CDR > 2 /10,000 /day: ‘out of control’
CDR > 5 /10,000 /day: ‘major catastrophe’
(double for U5MR thresholds)
23 | P a g e
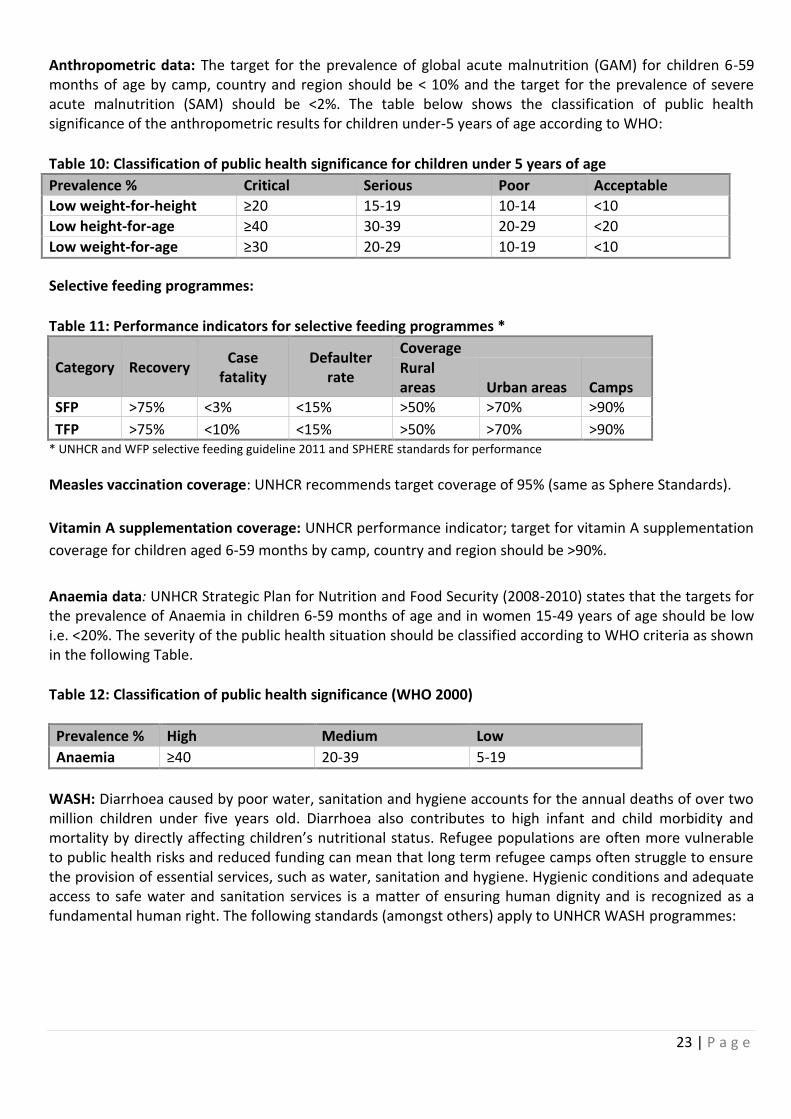
Anthropometric data: The target for the prevalence of global acute malnutrition (GAM) for children 6-59 months of age by camp, country and region should be < 10% and the target for the prevalence of severe acute malnutrition (SAM) should be <2%. The table below shows the classification of public health significance of the anthropometric results for children under-5 years of age according to WHO:
Table 10: Classification of public health significance for children under 5 years of age
Prevalence % Critical Serious Poor Acceptable
Low weight-for-height ≥20 15-19 10-14 <10
Low height-for-age ≥40 30-39 20-29 <20
Low weight-for-age ≥30 20-29 10-19 <10
Selective feeding programmes:
Table 11: Performance indicators for selective feeding programmes *
Category Recovery Case
fatality Defaulter
rate
Coverage Rural areas Urban areas Camps
SFP >75% <3% <15% >50% >70% >90%
TFP >75% <10% <15% >50% >70% >90% * UNHCR and WFP selective feeding guideline 2011 and SPHERE standards for performance
Measles vaccination coverage: UNHCR recommends target coverage of 95% (same as Sphere Standards).
Vitamin A supplementation coverage: UNHCR performance indicator; target for vitamin A supplementation
coverage for children aged 6-59 months by camp, country and region should be >90%.
Anaemia data: UNHCR Strategic Plan for Nutrition and Food Security (2008-2010) states that the targets for the prevalence of Anaemia in children 6-59 months of age and in women 15-49 years of age should be low i.e. <20%. The severity of the public health situation should be classified according to WHO criteria as shown in the following Table.
Table 12: Classification of public health significance (WHO 2000)
Prevalence % High Medium Low
Anaemia ≥40 20-39 5-19
WASH: Diarrhoea caused by poor water, sanitation and hygiene accounts for the annual deaths of over two million children under five years old. Diarrhoea also contributes to high infant and child morbidity and mortality by directly affecting children’s nutritional status. Refugee populations are often more vulnerable to public health risks and reduced funding can mean that long term refugee camps often struggle to ensure the provision of essential services, such as water, sanitation and hygiene. Hygienic conditions and adequate access to safe water and sanitation services is a matter of ensuring human dignity and is recognized as a fundamental human right. The following standards (amongst others) apply to UNHCR WASH programmes:
24 | P a g e
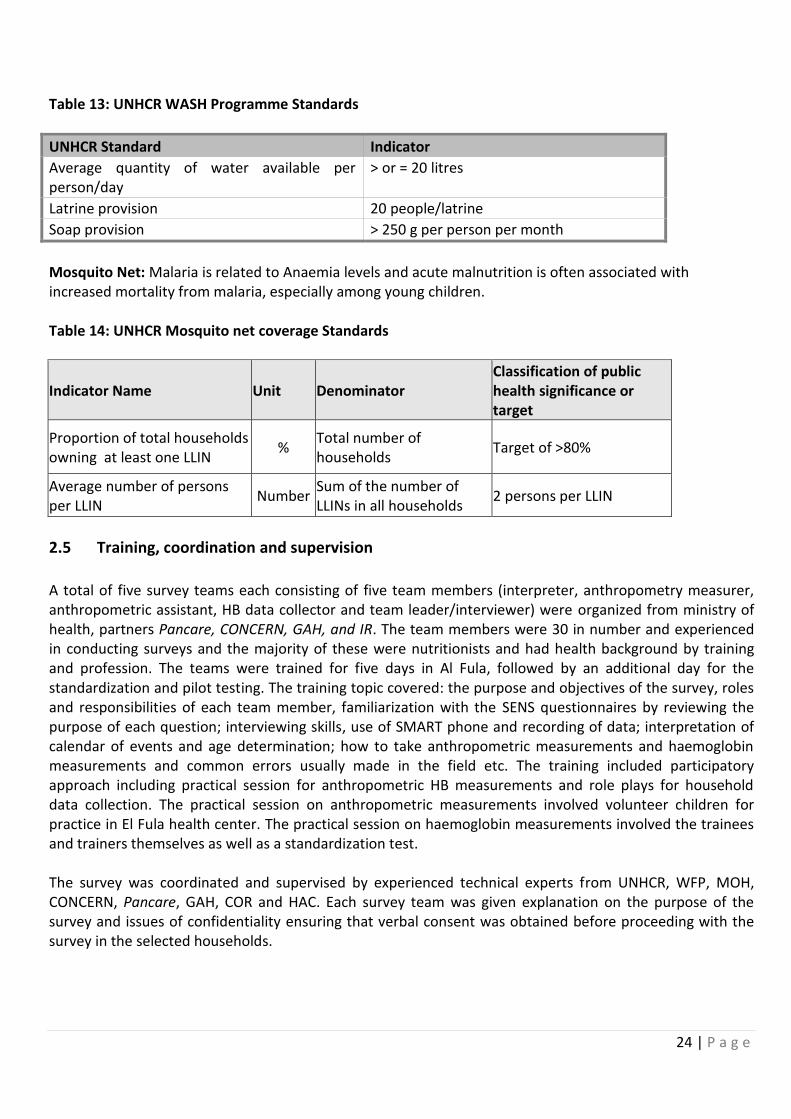
Table 13: UNHCR WASH Programme Standards
UNHCR Standard Indicator
Average quantity of water available per person/day
> or = 20 litres
Latrine provision 20 people/latrine
Soap provision > 250 g per person per month
Mosquito Net: Malaria is related to Anaemia levels and acute malnutrition is often associated with increased mortality from malaria, especially among young children. Table 14: UNHCR Mosquito net coverage Standards
Indicator Name Unit Denominator Classification of public health significance or target
Proportion of total households owning at least one LLIN
% Total number of households
Target of >80%
Average number of persons per LLIN
Number Sum of the number of LLINs in all households
2 persons per LLIN
2.5 Training, coordination and supervision
A total of five survey teams each consisting of five team members (interpreter, anthropometry measurer, anthropometric assistant, HB data collector and team leader/interviewer) were organized from ministry of health, partners Pancare, CONCERN, GAH, and IR. The team members were 30 in number and experienced in conducting surveys and the majority of these were nutritionists and had health background by training and profession. The teams were trained for five days in Al Fula, followed by an additional day for the standardization and pilot testing. The training topic covered: the purpose and objectives of the survey, roles and responsibilities of each team member, familiarization with the SENS questionnaires by reviewing the purpose of each question; interviewing skills, use of SMART phone and recording of data; interpretation of calendar of events and age determination; how to take anthropometric measurements and haemoglobin measurements and common errors usually made in the field etc. The training included participatory approach including practical session for anthropometric HB measurements and role plays for household data collection. The practical session on anthropometric measurements involved volunteer children for practice in El Fula health center. The practical session on haemoglobin measurements involved the trainees and trainers themselves as well as a standardization test. The survey was coordinated and supervised by experienced technical experts from UNHCR, WFP, MOH, CONCERN, Pancare, GAH, COR and HAC. Each survey team was given explanation on the purpose of the survey and issues of confidentiality ensuring that verbal consent was obtained before proceeding with the survey in the selected households.
25 | P a g e
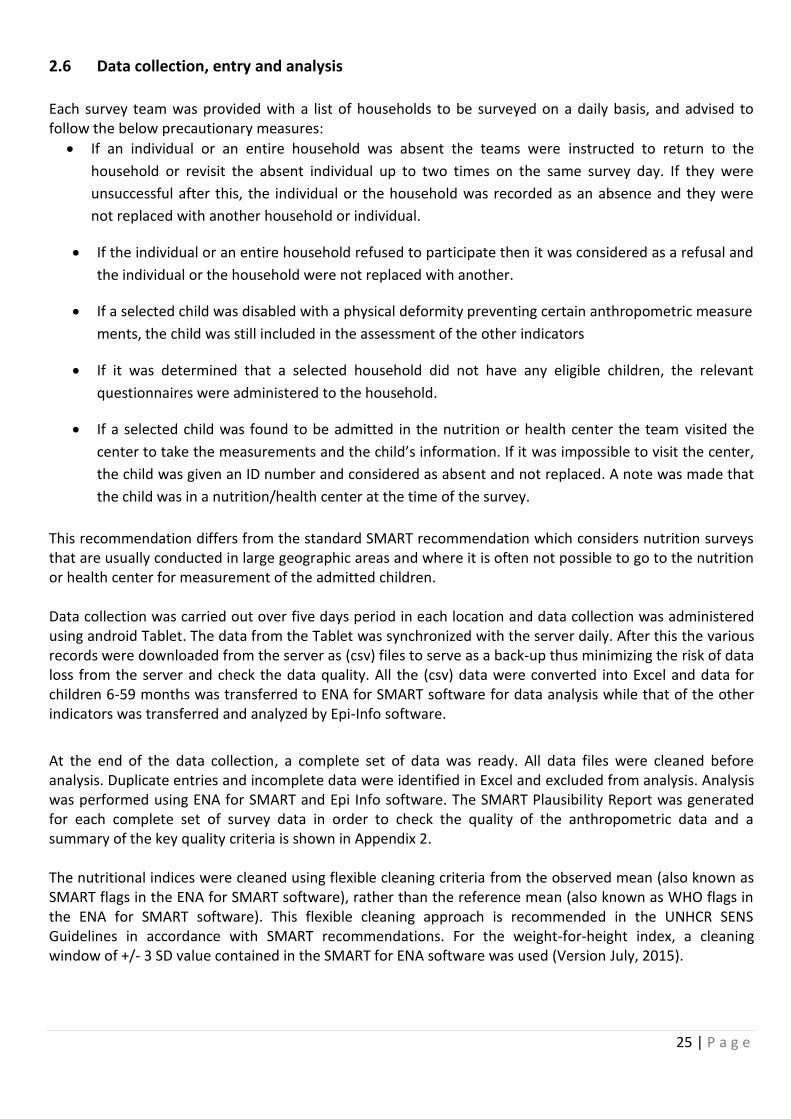
2.6 Data collection, entry and analysis
Each survey team was provided with a list of households to be surveyed on a daily basis, and advised to follow the below precautionary measures:
If an individual or an entire household was absent the teams were instructed to return to the
household or revisit the absent individual up to two times on the same survey day. If they were
unsuccessful after this, the individual or the household was recorded as an absence and they were
not replaced with another household or individual.
If the individual or an entire household refused to participate then it was considered as a refusal and
the individual or the household were not replaced with another.
If a selected child was disabled with a physical deformity preventing certain anthropometric measure
ments, the child was still included in the assessment of the other indicators
If it was determined that a selected household did not have any eligible children, the relevant
questionnaires were administered to the household.
If a selected child was found to be admitted in the nutrition or health center the team visited the
center to take the measurements and the child’s information. If it was impossible to visit the center,
the child was given an ID number and considered as absent and not replaced. A note was made that
the child was in a nutrition/health center at the time of the survey.
This recommendation differs from the standard SMART recommendation which considers nutrition surveys that are usually conducted in large geographic areas and where it is often not possible to go to the nutrition or health center for measurement of the admitted children. Data collection was carried out over five days period in each location and data collection was administered using android Tablet. The data from the Tablet was synchronized with the server daily. After this the various records were downloaded from the server as (csv) files to serve as a back-up thus minimizing the risk of data loss from the server and check the data quality. All the (csv) data were converted into Excel and data for children 6-59 months was transferred to ENA for SMART software for data analysis while that of the other indicators was transferred and analyzed by Epi-Info software.
At the end of the data collection, a complete set of data was ready. All data files were cleaned before analysis. Duplicate entries and incomplete data were identified in Excel and excluded from analysis. Analysis was performed using ENA for SMART and Epi Info software. The SMART Plausibility Report was generated for each complete set of survey data in order to check the quality of the anthropometric data and a summary of the key quality criteria is shown in Appendix 2. The nutritional indices were cleaned using flexible cleaning criteria from the observed mean (also known as SMART flags in the ENA for SMART software), rather than the reference mean (also known as WHO flags in the ENA for SMART software). This flexible cleaning approach is recommended in the UNHCR SENS Guidelines in accordance with SMART recommendations. For the weight-for-height index, a cleaning window of +/- 3 SD value contained in the SMART for ENA software was used (Version July, 2015).
26 | P a g e
2.7 Quality control
Quality was maintained by comprehensive training and an intensive supervision during the data collection period. The ENA-SMART plausibility check for anthropometric measurements was generated daily and feedback provided to the teams. The use of pre-programmed Android Tablets for data collection was used. Quality of data was ensured through: crosschecking of filled questionnaires on daily basis and daily review of performance of the data collection teams in addressing any difficulties encountered. The measurement tools were calibrated every morning before the start of the data collections; HemoCue machines were checked daily. Daily reminders were made on proper use of the micro-cuvettes. Additionally, all survey tools were duly maintained.
2.8 Ethical consideration and consent of study population
During the protocol development relevant partners, MOH, UNICEF and WFP were consulted and their respective input/feedback was duly incorporated. Each step of the survey was shared with relevant partners in order to ensure active participation and also keeping them updated on the progress. The camp management, from COR and HAC were also informed at all levels. Refugee working group forum and health and nutrition technical meetings were used as an opportunity to share information with respect to the survey. Prior to the actual filed work, community leaders and community members were informed about the survey. Household labeling was also used as an opportunity to pass messages to all community members. Given the comprehensive nature of the survey and taking of peripheral blood, verbal consent was obtained from individuals or/and households before the interviews, anthropometric measurements and haemoglobin test. Children and women with serious health and nutrition problems (either sick or malnourished) were referred to the health center for further assessment and treatment. Main ethical considerations including keeping privacy, cultural sensitivities and any issues associated with rights and dignity of the study populations were considered and respected.
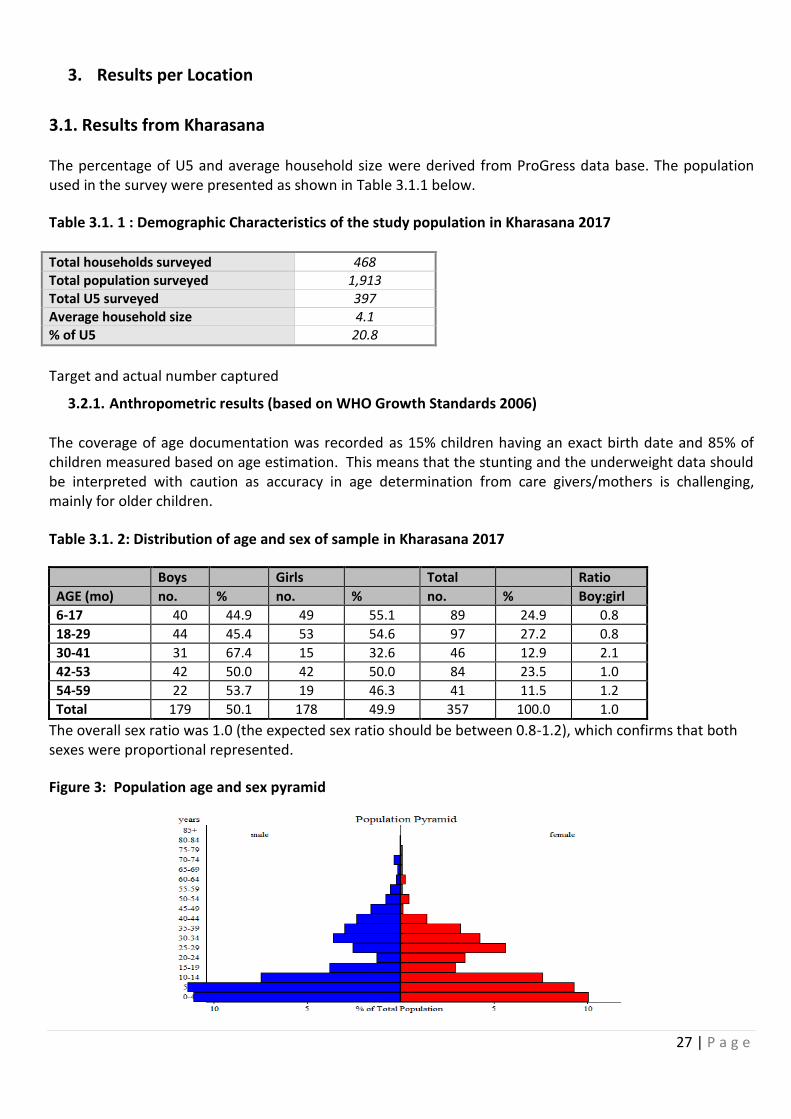
27 | P a g e
3. Results per Location
3.1. Results from Kharasana The percentage of U5 and average household size were derived from ProGress data base. The population used in the survey were presented as shown in Table 3.1.1 below.
Table 3.1. 1 : Demographic Characteristics of the study population in Kharasana 2017 Total households surveyed 468 Total population surveyed 1,913 Total U5 surveyed 397 Average household size 4.1 % of U5 20.8
Target and actual number captured
3.2.1. Anthropometric results (based on WHO Growth Standards 2006)
The coverage of age documentation was recorded as 15% children having an exact birth date and 85% of children measured based on age estimation. This means that the stunting and the underweight data should be interpreted with caution as accuracy in age determination from care givers/mothers is challenging, mainly for older children.
Table 3.1. 2: Distribution of age and sex of sample in Kharasana 2017
Boys Girls Total Ratio
AGE (mo) no. % no. % no. % Boy:girl
6-17 40 44.9 49 55.1 89 24.9 0.8
18-29 44 45.4 53 54.6 97 27.2 0.8
30-41 31 67.4 15 32.6 46 12.9 2.1
42-53 42 50.0 42 50.0 84 23.5 1.0
54-59 22 53.7 19 46.3 41 11.5 1.2
Total 179 50.1 178 49.9 357 100.0 1.0
The overall sex ratio was 1.0 (the expected sex ratio should be between 0.8-1.2), which confirms that both sexes were proportional represented.
Figure 3: Population age and sex pyramid
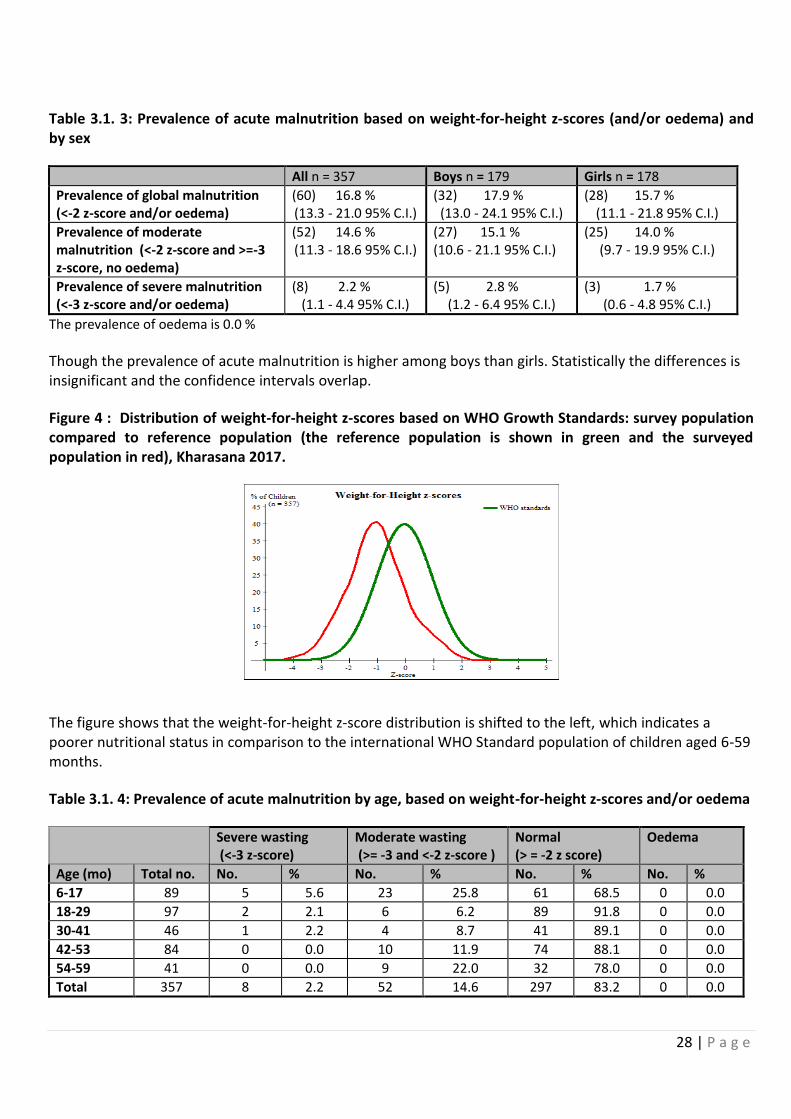
28 | P a g e
Table 3.1. 3: Prevalence of acute malnutrition based on weight-for-height z-scores (and/or oedema) and by sex
All n = 357 Boys n = 179 Girls n = 178
Prevalence of global malnutrition (<-2 z-score and/or oedema)
(60) 16.8 % (13.3 - 21.0 95% C.I.)
(32) 17.9 % (13.0 - 24.1 95% C.I.)
(28) 15.7 % (11.1 - 21.8 95% C.I.)
Prevalence of moderate malnutrition (<-2 z-score and >=-3 z-score, no oedema)
(52) 14.6 % (11.3 - 18.6 95% C.I.)
(27) 15.1 % (10.6 - 21.1 95% C.I.)
(25) 14.0 % (9.7 - 19.9 95% C.I.)
Prevalence of severe malnutrition (<-3 z-score and/or oedema)
(8) 2.2 % (1.1 - 4.4 95% C.I.)
(5) 2.8 % (1.2 - 6.4 95% C.I.)
(3) 1.7 % (0.6 - 4.8 95% C.I.)
The prevalence of oedema is 0.0 %
Though the prevalence of acute malnutrition is higher among boys than girls. Statistically the differences is insignificant and the confidence intervals overlap.
Figure 4 : Distribution of weight-for-height z-scores based on WHO Growth Standards: survey population compared to reference population (the reference population is shown in green and the surveyed population in red), Kharasana 2017.
The figure shows that the weight-for-height z-score distribution is shifted to the left, which indicates a poorer nutritional status in comparison to the international WHO Standard population of children aged 6-59 months.
Table 3.1. 4: Prevalence of acute malnutrition by age, based on weight-for-height z-scores and/or oedema
Severe wasting (<-3 z-score)
Moderate wasting (>= -3 and <-2 z-score )
Normal (> = -2 z score)
Oedema
Age (mo) Total no. No. % No. % No. % No. %
6-17 89 5 5.6 23 25.8 61 68.5 0 0.0
18-29 97 2 2.1 6 6.2 89 91.8 0 0.0
30-41 46 1 2.2 4 8.7 41 89.1 0 0.0
42-53 84 0 0.0 10 11.9 74 88.1 0 0.0
54-59 41 0 0.0 9 22.0 32 78.0 0 0.0
Total 357 8 2.2 52 14.6 297 83.2 0 0.0
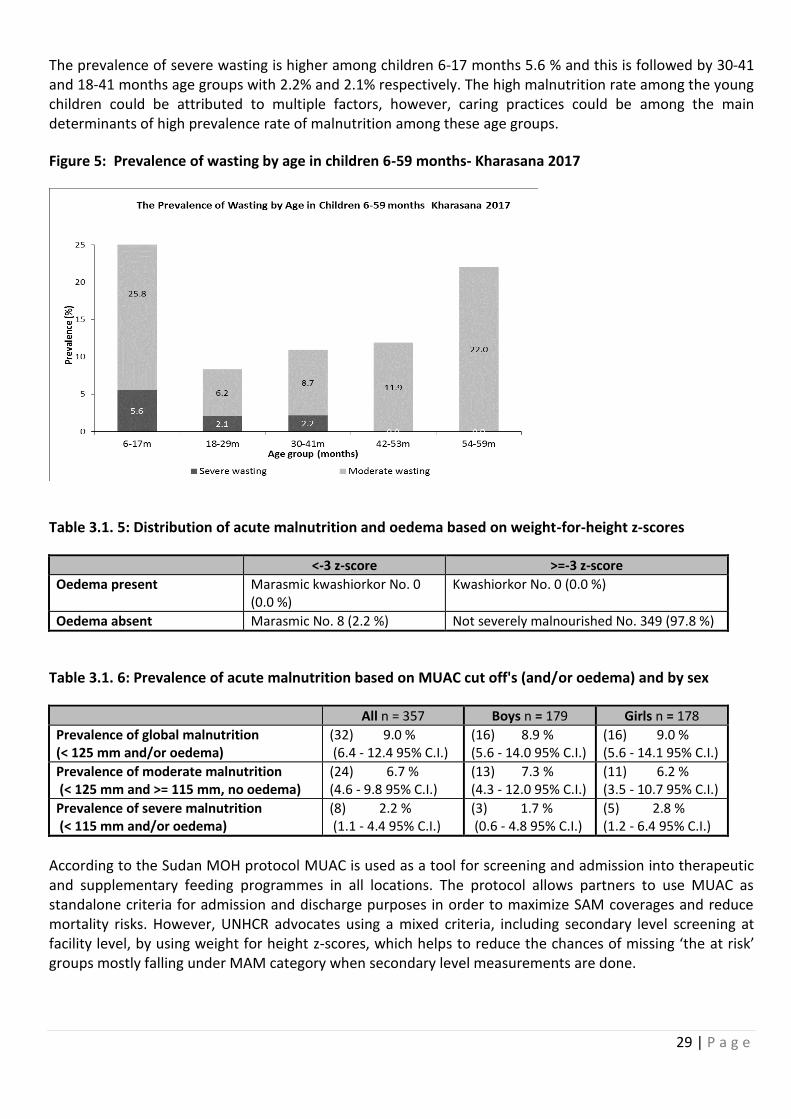
29 | P a g e
The prevalence of severe wasting is higher among children 6-17 months 5.6 % and this is followed by 30-41 and 18-41 months age groups with 2.2% and 2.1% respectively. The high malnutrition rate among the young children could be attributed to multiple factors, however, caring practices could be among the main determinants of high prevalence rate of malnutrition among these age groups.
Figure 5: Prevalence of wasting by age in children 6-59 months- Kharasana 2017
Table 3.1. 5: Distribution of acute malnutrition and oedema based on weight-for-height z-scores
<-3 z-score >=-3 z-score
Oedema present Marasmic kwashiorkor No. 0 (0.0 %)
Kwashiorkor No. 0 (0.0 %)
Oedema absent Marasmic No. 8 (2.2 %) Not severely malnourished No. 349 (97.8 %)
Table 3.1. 6: Prevalence of acute malnutrition based on MUAC cut off's (and/or oedema) and by sex
All n = 357 Boys n = 179 Girls n = 178
Prevalence of global malnutrition (< 125 mm and/or oedema)
(32) 9.0 % (6.4 - 12.4 95% C.I.)
(16) 8.9 % (5.6 - 14.0 95% C.I.)
(16) 9.0 % (5.6 - 14.1 95% C.I.)
Prevalence of moderate malnutrition (< 125 mm and >= 115 mm, no oedema)
(24) 6.7 % (4.6 - 9.8 95% C.I.)
(13) 7.3 % (4.3 - 12.0 95% C.I.)
(11) 6.2 % (3.5 - 10.7 95% C.I.)
Prevalence of severe malnutrition (< 115 mm and/or oedema)
(8) 2.2 % (1.1 - 4.4 95% C.I.)
(3) 1.7 % (0.6 - 4.8 95% C.I.)
(5) 2.8 % (1.2 - 6.4 95% C.I.)
According to the Sudan MOH protocol MUAC is used as a tool for screening and admission into therapeutic and supplementary feeding programmes in all locations. The protocol allows partners to use MUAC as standalone criteria for admission and discharge purposes in order to maximize SAM coverages and reduce mortality risks. However, UNHCR advocates using a mixed criteria, including secondary level screening at facility level, by using weight for height z-scores, which helps to reduce the chances of missing ‘the at risk’ groups mostly falling under MAM category when secondary level measurements are done.
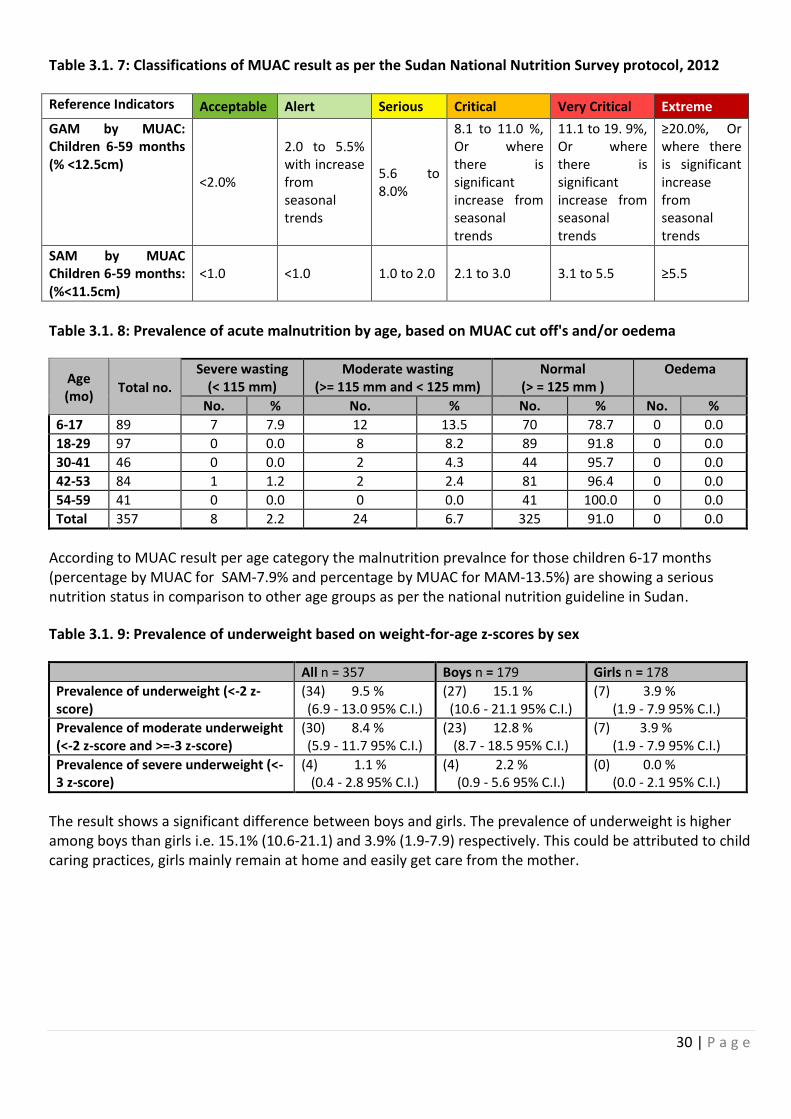
30 | P a g e
Table 3.1. 7: Classifications of MUAC result as per the Sudan National Nutrition Survey protocol, 2012
Reference Indicators Acceptable Alert Serious Critical Very Critical Extreme
GAM by MUAC: Children 6-59 months (% <12.5cm)
<2.0%
2.0 to 5.5% with increase from seasonal trends
5.6 to 8.0%
8.1 to 11.0 %, Or where there is significant increase from seasonal trends
11.1 to 19. 9%, Or where there is significant increase from seasonal trends
≥20.0%, Or where there is significant increase from seasonal trends
SAM by MUAC Children 6-59 months: (%<11.5cm)
<1.0 <1.0 1.0 to 2.0 2.1 to 3.0 3.1 to 5.5 ≥5.5
Table 3.1. 8: Prevalence of acute malnutrition by age, based on MUAC cut off's and/or oedema
Age (mo)
Total no.
Severe wasting (< 115 mm)
Moderate wasting (>= 115 mm and < 125 mm)
Normal (> = 125 mm )
Oedema
No. % No. % No. % No. %
6-17 89 7 7.9 12 13.5 70 78.7 0 0.0
18-29 97 0 0.0 8 8.2 89 91.8 0 0.0
30-41 46 0 0.0 2 4.3 44 95.7 0 0.0
42-53 84 1 1.2 2 2.4 81 96.4 0 0.0
54-59 41 0 0.0 0 0.0 41 100.0 0 0.0
Total 357 8 2.2 24 6.7 325 91.0 0 0.0
According to MUAC result per age category the malnutrition prevalnce for those children 6-17 months (percentage by MUAC for SAM-7.9% and percentage by MUAC for MAM-13.5%) are showing a serious nutrition status in comparison to other age groups as per the national nutrition guideline in Sudan.
Table 3.1. 9: Prevalence of underweight based on weight-for-age z-scores by sex
All n = 357 Boys n = 179 Girls n = 178
Prevalence of underweight (<-2 z-score)
(34) 9.5 % (6.9 - 13.0 95% C.I.)
(27) 15.1 % (10.6 - 21.1 95% C.I.)
(7) 3.9 % (1.9 - 7.9 95% C.I.)
Prevalence of moderate underweight (<-2 z-score and >=-3 z-score)
(30) 8.4 % (5.9 - 11.7 95% C.I.)
(23) 12.8 % (8.7 - 18.5 95% C.I.)
(7) 3.9 % (1.9 - 7.9 95% C.I.)
Prevalence of severe underweight (<-3 z-score)
(4) 1.1 % (0.4 - 2.8 95% C.I.)
(4) 2.2 % (0.9 - 5.6 95% C.I.)
(0) 0.0 % (0.0 - 2.1 95% C.I.)
The result shows a significant difference between boys and girls. The prevalence of underweight is higher among boys than girls i.e. 15.1% (10.6-21.1) and 3.9% (1.9-7.9) respectively. This could be attributed to child caring practices, girls mainly remain at home and easily get care from the mother.
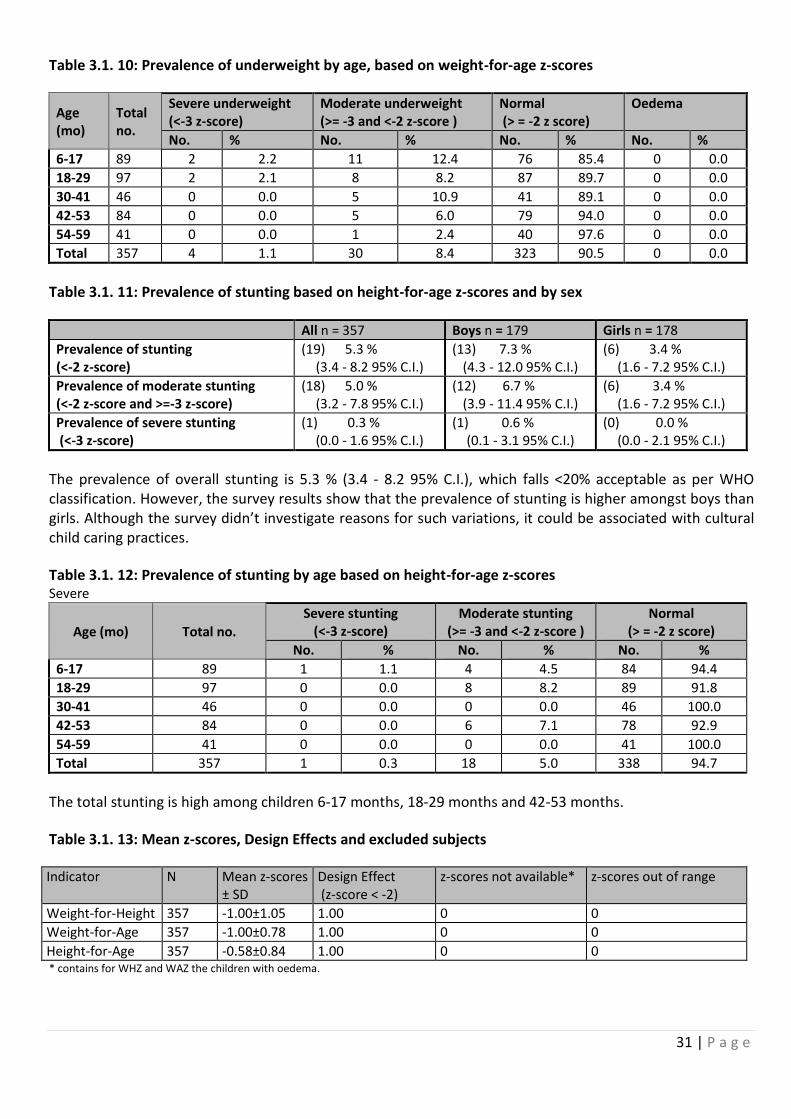
31 | P a g e
Table 3.1. 10: Prevalence of underweight by age, based on weight-for-age z-scores
Age (mo)
Total no.
Severe underweight (<-3 z-score)
Moderate underweight (>= -3 and <-2 z-score )
Normal (> = -2 z score)
Oedema
No. % No. % No. % No. %
6-17 89 2 2.2 11 12.4 76 85.4 0 0.0
18-29 97 2 2.1 8 8.2 87 89.7 0 0.0
30-41 46 0 0.0 5 10.9 41 89.1 0 0.0
42-53 84 0 0.0 5 6.0 79 94.0 0 0.0
54-59 41 0 0.0 1 2.4 40 97.6 0 0.0
Total 357 4 1.1 30 8.4 323 90.5 0 0.0
Table 3.1. 11: Prevalence of stunting based on height-for-age z-scores and by sex
All n = 357 Boys n = 179 Girls n = 178
Prevalence of stunting (<-2 z-score)
(19) 5.3 % (3.4 - 8.2 95% C.I.)
(13) 7.3 % (4.3 - 12.0 95% C.I.)
(6) 3.4 % (1.6 - 7.2 95% C.I.)
Prevalence of moderate stunting (<-2 z-score and >=-3 z-score)
(18) 5.0 % (3.2 - 7.8 95% C.I.)
(12) 6.7 % (3.9 - 11.4 95% C.I.)
(6) 3.4 % (1.6 - 7.2 95% C.I.)
Prevalence of severe stunting (<-3 z-score)
(1) 0.3 % (0.0 - 1.6 95% C.I.)
(1) 0.6 % (0.1 - 3.1 95% C.I.)
(0) 0.0 % (0.0 - 2.1 95% C.I.)
The prevalence of overall stunting is 5.3 % (3.4 - 8.2 95% C.I.), which falls <20% acceptable as per WHO classification. However, the survey results show that the prevalence of stunting is higher amongst boys than girls. Although the survey didn’t investigate reasons for such variations, it could be associated with cultural child caring practices.
Table 3.1. 12: Prevalence of stunting by age based on height-for-age z-scores Severe
Age (mo) Total no.
Severe stunting (<-3 z-score)
Moderate stunting (>= -3 and <-2 z-score )
Normal (> = -2 z score)
No. % No. % No. %
6-17 89 1 1.1 4 4.5 84 94.4
18-29 97 0 0.0 8 8.2 89 91.8
30-41 46 0 0.0 0 0.0 46 100.0
42-53 84 0 0.0 6 7.1 78 92.9
54-59 41 0 0.0 0 0.0 41 100.0
Total 357 1 0.3 18 5.0 338 94.7
The total stunting is high among children 6-17 months, 18-29 months and 42-53 months.
Table 3.1. 13: Mean z-scores, Design Effects and excluded subjects
Indicator N Mean z-scores ± SD
Design Effect (z-score < -2)
z-scores not available* z-scores out of range
Weight-for-Height 357 -1.00±1.05 1.00 0 0
Weight-for-Age 357 -1.00±0.78 1.00 0 0
Height-for-Age 357 -0.58±0.84 1.00 0 0 * contains for WHZ and WAZ the children with oedema.
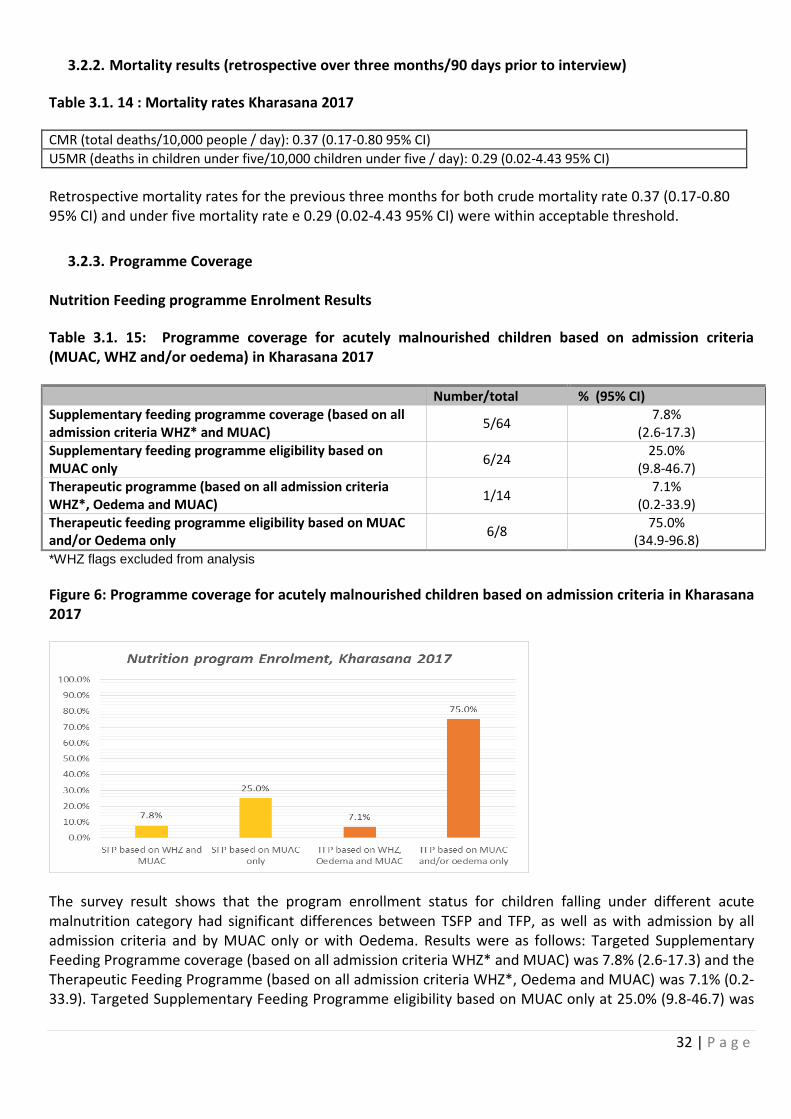
32 | P a g e
3.2.2. Mortality results (retrospective over three months/90 days prior to interview)
Table 3.1. 14 : Mortality rates Kharasana 2017
CMR (total deaths/10,000 people / day): 0.37 (0.17-0.80 95% CI)
U5MR (deaths in children under five/10,000 children under five / day): 0.29 (0.02-4.43 95% CI)
Retrospective mortality rates for the previous three months for both crude mortality rate 0.37 (0.17-0.80 95% CI) and under five mortality rate e 0.29 (0.02-4.43 95% CI) were within acceptable threshold.
3.2.3. Programme Coverage Nutrition Feeding programme Enrolment Results
Table 3.1. 15: Programme coverage for acutely malnourished children based on admission criteria (MUAC, WHZ and/or oedema) in Kharasana 2017
Number/total % (95% CI) Supplementary feeding programme coverage (based on all admission criteria WHZ* and MUAC)
5/64 7.8%
(2.6-17.3) Supplementary feeding programme eligibility based on MUAC only
6/24 25.0%
(9.8-46.7) Therapeutic programme (based on all admission criteria WHZ*, Oedema and MUAC)
1/14 7.1%
(0.2-33.9) Therapeutic feeding programme eligibility based on MUAC and/or Oedema only
6/8 75.0%
(34.9-96.8)
*WHZ flags excluded from analysis
Figure 6: Programme coverage for acutely malnourished children based on admission criteria in Kharasana 2017
The survey result shows that the program enrollment status for children falling under different acute malnutrition category had significant differences between TSFP and TFP, as well as with admission by all admission criteria and by MUAC only or with Oedema. Results were as follows: Targeted Supplementary Feeding Programme coverage (based on all admission criteria WHZ* and MUAC) was 7.8% (2.6-17.3) and the Therapeutic Feeding Programme (based on all admission criteria WHZ*, Oedema and MUAC) was 7.1% (0.2-33.9). Targeted Supplementary Feeding Programme eligibility based on MUAC only at 25.0% (9.8-46.7) was
33 | P a g e
much lower than Therapeutic Program admission eligibility based on MUAC and/or Oedema only at 75.0% (34.9-96.8).
Measles vaccination coverage results
Table 3.1. 16: Measles vaccination coverage for children aged 9-59 months (n=328) in Kharasana 2017
Measles (with card)
n=10
Measles (with card or confirmation from mother)
n=195
YES
3.0% (1.6-5.7)
59.5% (53.9-64.8)
As shown in the table 3.1. 16 above, the result of measles vaccination coverage for children 9-59 months in Kharasana was far below the standard of the expected >95% coverage both by card and confirmation from mother. Vitamin A supplementation coverage results
Table 3.1. 17: Vitamin A supplementation for children aged 6-59 months within past 6 (n= 356) in Kharasana 2017
Vitamin A capsule (with card) n=2
Vitamin A capsule (with card or confirmation from mother)
n=140
YES
0.6% (01-2.2)
39.3% (34.3-44.6)
The vitamin A coverage result both by card and confirmation from mother found by far below the standard of >90% coverage.
Vitamin A supplementation coverage for children 6-59 months in Kharasana was also below the standard (>90% expected coverage) by both card and confirmation from mother.
3.2.4. Diarrhoea results Table 3.1. 18: Period prevalence of diarrhoea in Kharasana 2017
Number/total Prevalence in %(95% CI)
Diarrhea in the last two weeks 116/356
32.6% (27.8-37.8)
The prevalence of diarrhoea among children 6-59 months that was registered within the last two weeks of recall period was 32.6% (27.8 -37.8). This was higher than the reported trend from of the health facility clinical records in Kharasana.
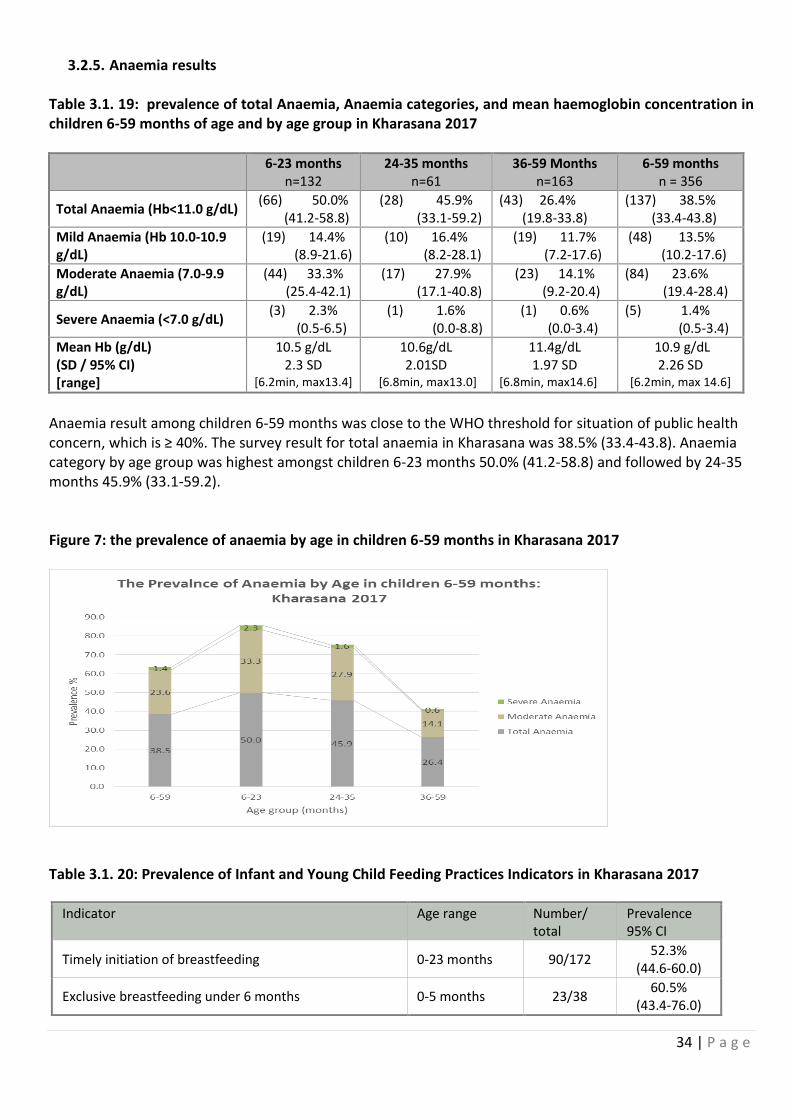
34 | P a g e
3.2.5. Anaemia results Table 3.1. 19: prevalence of total Anaemia, Anaemia categories, and mean haemoglobin concentration in children 6-59 months of age and by age group in Kharasana 2017
6-23 months n=132
24-35 months n=61
36-59 Months n=163
6-59 months n = 356
Total Anaemia (Hb<11.0 g/dL) (66) 50.0% (41.2-58.8)
(28) 45.9% (33.1-59.2)
(43) 26.4% (19.8-33.8)
(137) 38.5% (33.4-43.8)
Mild Anaemia (Hb 10.0-10.9 g/dL)
(19) 14.4% (8.9-21.6)
(10) 16.4% (8.2-28.1)
(19) 11.7% (7.2-17.6)
(48) 13.5% (10.2-17.6)
Moderate Anaemia (7.0-9.9 g/dL)
(44) 33.3% (25.4-42.1)
(17) 27.9% (17.1-40.8)
(23) 14.1% (9.2-20.4)
(84) 23.6% (19.4-28.4)
Severe Anaemia (<7.0 g/dL) (3) 2.3%
(0.5-6.5) (1) 1.6%
(0.0-8.8) (1) 0.6%
(0.0-3.4) (5) 1.4%
(0.5-3.4)
Mean Hb (g/dL) (SD / 95% CI) [range]
10.5 g/dL 2.3 SD
[6.2min, max13.4]
10.6g/dL 2.01SD
[6.8min, max13.0]
11.4g/dL 1.97 SD
[6.8min, max14.6]
10.9 g/dL 2.26 SD
[6.2min, max 14.6]
Anaemia result among children 6-59 months was close to the WHO threshold for situation of public health concern, which is ≥ 40%. The survey result for total anaemia in Kharasana was 38.5% (33.4-43.8). Anaemia category by age group was highest amongst children 6-23 months 50.0% (41.2-58.8) and followed by 24-35 months 45.9% (33.1-59.2). Figure 7: the prevalence of anaemia by age in children 6-59 months in Kharasana 2017
Table 3.1. 20: Prevalence of Infant and Young Child Feeding Practices Indicators in Kharasana 2017
Indicator Age range Number/ total
Prevalence 95% CI
Timely initiation of breastfeeding 0-23 months 90/172 52.3%
(44.6-60.0)
Exclusive breastfeeding under 6 months 0-5 months 23/38 60.5%
(43.4-76.0)
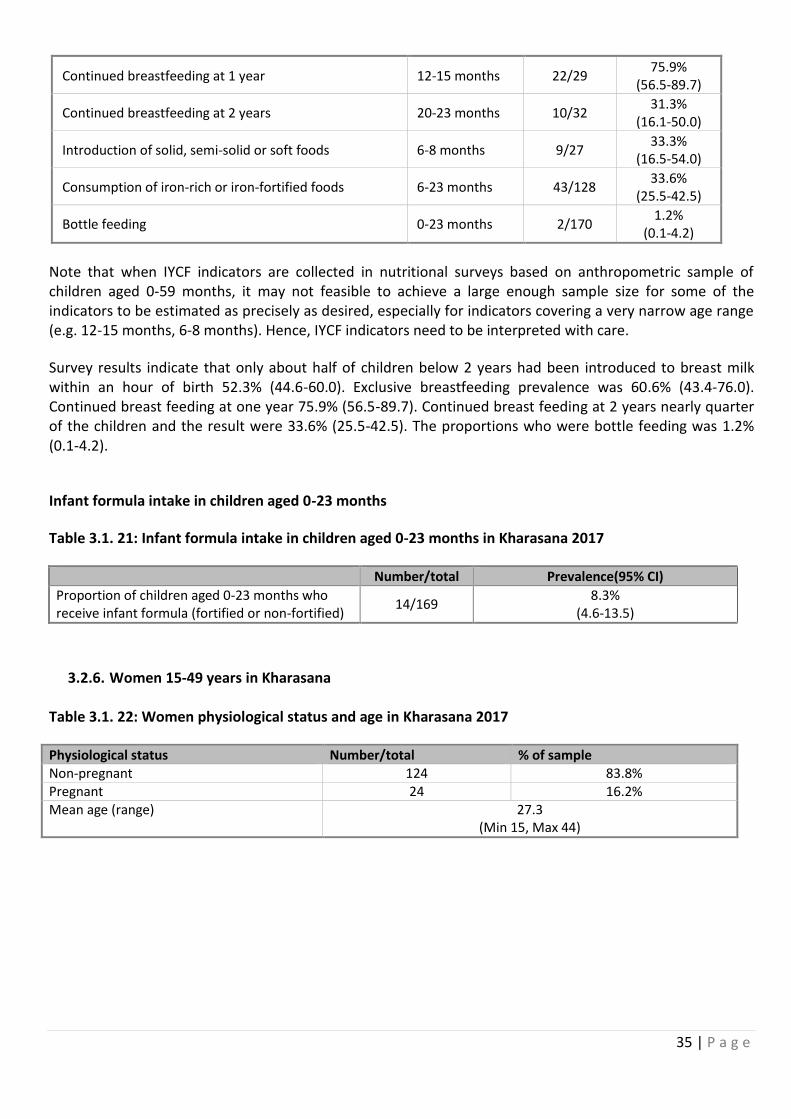
35 | P a g e
Continued breastfeeding at 1 year 12-15 months 22/29 75.9%
(56.5-89.7)
Continued breastfeeding at 2 years 20-23 months 10/32 31.3%
(16.1-50.0)
Introduction of solid, semi-solid or soft foods 6-8 months 9/27 33.3%
(16.5-54.0)
Consumption of iron-rich or iron-fortified foods 6-23 months 43/128 33.6%
(25.5-42.5)
Bottle feeding 0-23 months 2/170 1.2%
(0.1-4.2)
Note that when IYCF indicators are collected in nutritional surveys based on anthropometric sample of children aged 0-59 months, it may not feasible to achieve a large enough sample size for some of the indicators to be estimated as precisely as desired, especially for indicators covering a very narrow age range (e.g. 12-15 months, 6-8 months). Hence, IYCF indicators need to be interpreted with care.
Survey results indicate that only about half of children below 2 years had been introduced to breast milk within an hour of birth 52.3% (44.6-60.0). Exclusive breastfeeding prevalence was 60.6% (43.4-76.0). Continued breast feeding at one year 75.9% (56.5-89.7). Continued breast feeding at 2 years nearly quarter of the children and the result were 33.6% (25.5-42.5). The proportions who were bottle feeding was 1.2% (0.1-4.2).
Infant formula intake in children aged 0-23 months
Table 3.1. 21: Infant formula intake in children aged 0-23 months in Kharasana 2017
Number/total Prevalence(95% CI)
Proportion of children aged 0-23 months who receive infant formula (fortified or non-fortified)
14/169 8.3%
(4.6-13.5)
3.2.6. Women 15-49 years in Kharasana Table 3.1. 22: Women physiological status and age in Kharasana 2017
Physiological status Number/total % of sample Non-pregnant 124 83.8% Pregnant 24 16.2% Mean age (range) 27.3
(Min 15, Max 44)
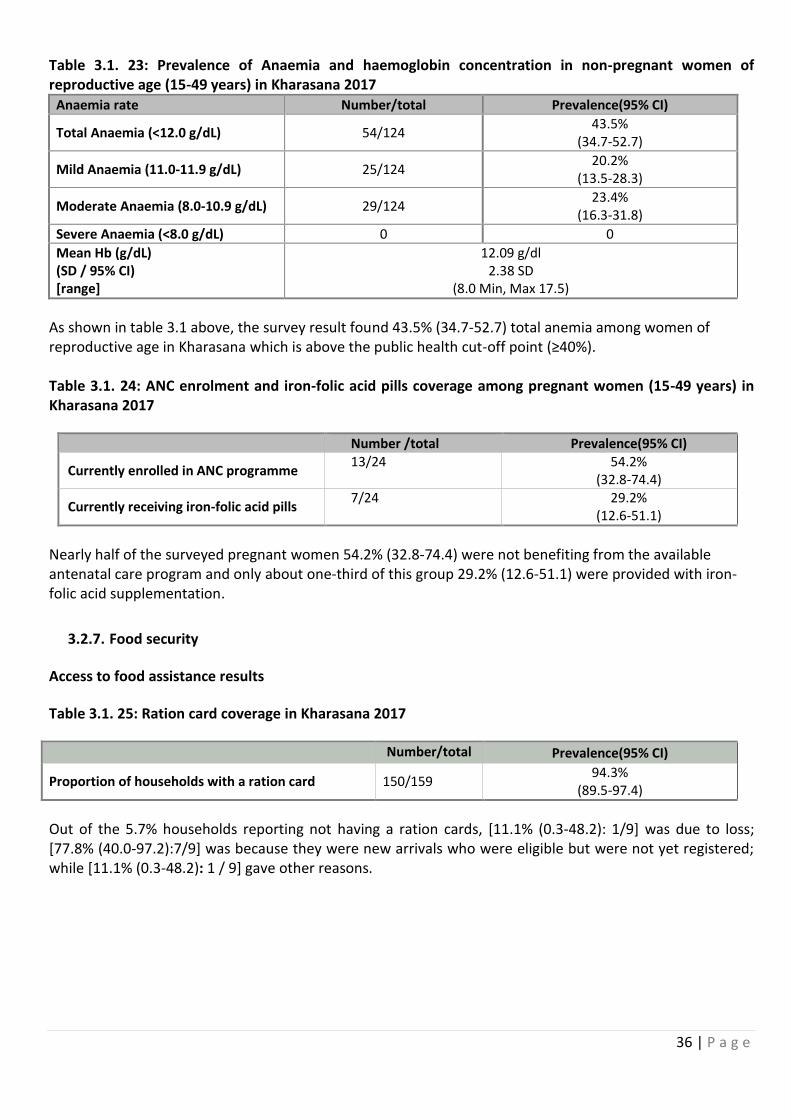
36 | P a g e
Table 3.1. 23: Prevalence of Anaemia and haemoglobin concentration in non-pregnant women of reproductive age (15-49 years) in Kharasana 2017
Anaemia rate Number/total Prevalence(95% CI)
Total Anaemia (<12.0 g/dL) 54/124 43.5%
(34.7-52.7)
Mild Anaemia (11.0-11.9 g/dL) 25/124 20.2%
(13.5-28.3)
Moderate Anaemia (8.0-10.9 g/dL) 29/124 23.4%
(16.3-31.8)
Severe Anaemia (<8.0 g/dL) 0 0
Mean Hb (g/dL) (SD / 95% CI) [range]
12.09 g/dl 2.38 SD
(8.0 Min, Max 17.5)
As shown in table 3.1 above, the survey result found 43.5% (34.7-52.7) total anemia among women of reproductive age in Kharasana which is above the public health cut-off point (≥40%). Table 3.1. 24: ANC enrolment and iron-folic acid pills coverage among pregnant women (15-49 years) in Kharasana 2017
Number /total Prevalence(95% CI)
Currently enrolled in ANC programme 13/24 54.2%
(32.8-74.4)
Currently receiving iron-folic acid pills 7/24 29.2%
(12.6-51.1)
Nearly half of the surveyed pregnant women 54.2% (32.8-74.4) were not benefiting from the available antenatal care program and only about one-third of this group 29.2% (12.6-51.1) were provided with iron-folic acid supplementation.
3.2.7. Food security
Access to food assistance results
Table 3.1. 25: Ration card coverage in Kharasana 2017
Number/total Prevalence(95% CI)
Proportion of households with a ration card 150/159 94.3%
(89.5-97.4)
Out of the 5.7% households reporting not having a ration cards, [11.1% (0.3-48.2): 1/9] was due to loss; [77.8% (40.0-97.2):7/9] was because they were new arrivals who were eligible but were not yet registered; while [11.1% (0.3-48.2): 1 / 9] gave other reasons.
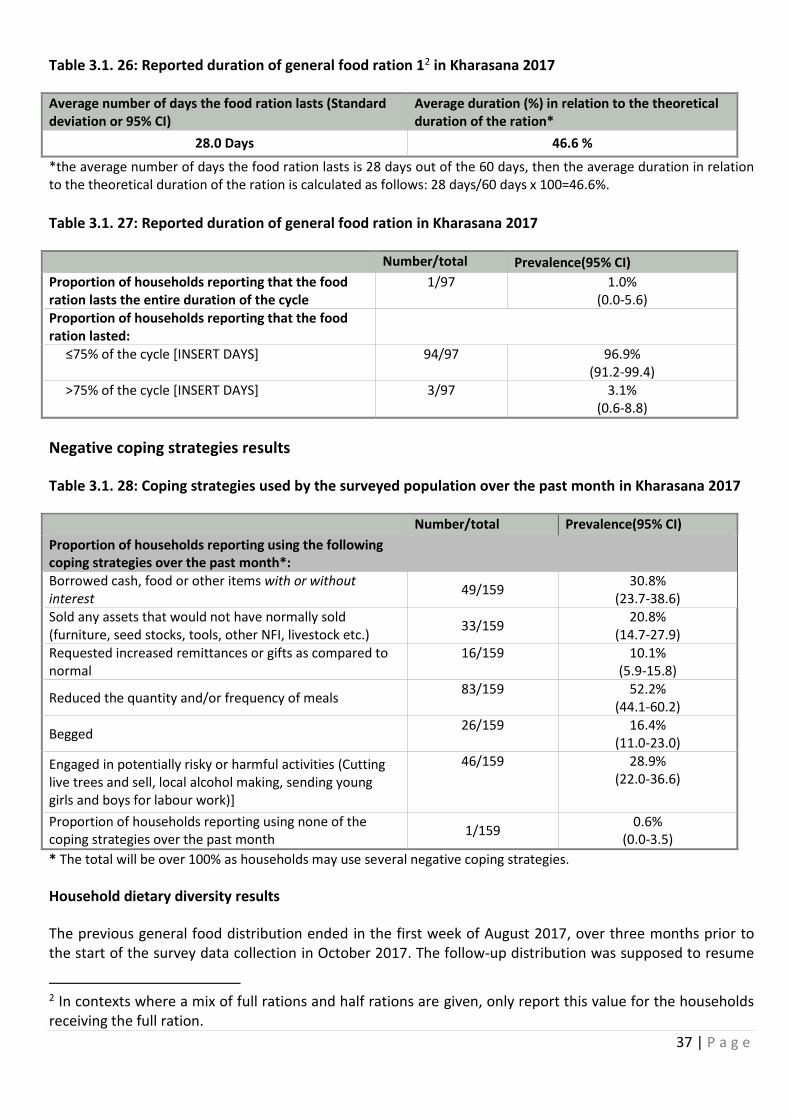
37 | P a g e
Table 3.1. 26: Reported duration of general food ration 12 in Kharasana 2017
Average number of days the food ration lasts (Standard deviation or 95% CI)
Average duration (%) in relation to the theoretical duration of the ration*
28.0 Days 46.6 %
*the average number of days the food ration lasts is 28 days out of the 60 days, then the average duration in relation to the theoretical duration of the ration is calculated as follows: 28 days/60 days x 100=46.6%.
Table 3.1. 27: Reported duration of general food ration in Kharasana 2017
Number/total Prevalence(95% CI)
Proportion of households reporting that the food ration lasts the entire duration of the cycle
1/97 1.0% (0.0-5.6)
Proportion of households reporting that the food ration lasted:
≤75% of the cycle [INSERT DAYS]
94/97 96.9% (91.2-99.4)
>75% of the cycle [INSERT DAYS]
3/97 3.1% (0.6-8.8)
Negative coping strategies results
Table 3.1. 28: Coping strategies used by the surveyed population over the past month in Kharasana 2017
Number/total Prevalence(95% CI)
Proportion of households reporting using the following coping strategies over the past month*:
Borrowed cash, food or other items with or without interest
49/159 30.8%
(23.7-38.6) Sold any assets that would not have normally sold (furniture, seed stocks, tools, other NFI, livestock etc.)
33/159 20.8%
(14.7-27.9) Requested increased remittances or gifts as compared to normal
16/159 10.1% (5.9-15.8)
Reduced the quantity and/or frequency of meals 83/159 52.2%
(44.1-60.2)
Begged 26/159 16.4%
(11.0-23.0)
Engaged in potentially risky or harmful activities (Cutting live trees and sell, local alcohol making, sending young girls and boys for labour work)]
46/159 28.9% (22.0-36.6)
Proportion of households reporting using none of the coping strategies over the past month
1/159 0.6%
(0.0-3.5)
* The total will be over 100% as households may use several negative coping strategies.
Household dietary diversity results
The previous general food distribution ended in the first week of August 2017, over three months prior to the start of the survey data collection in October 2017. The follow-up distribution was supposed to resume
2 In contexts where a mix of full rations and half rations are given, only report this value for the households receiving the full ration.
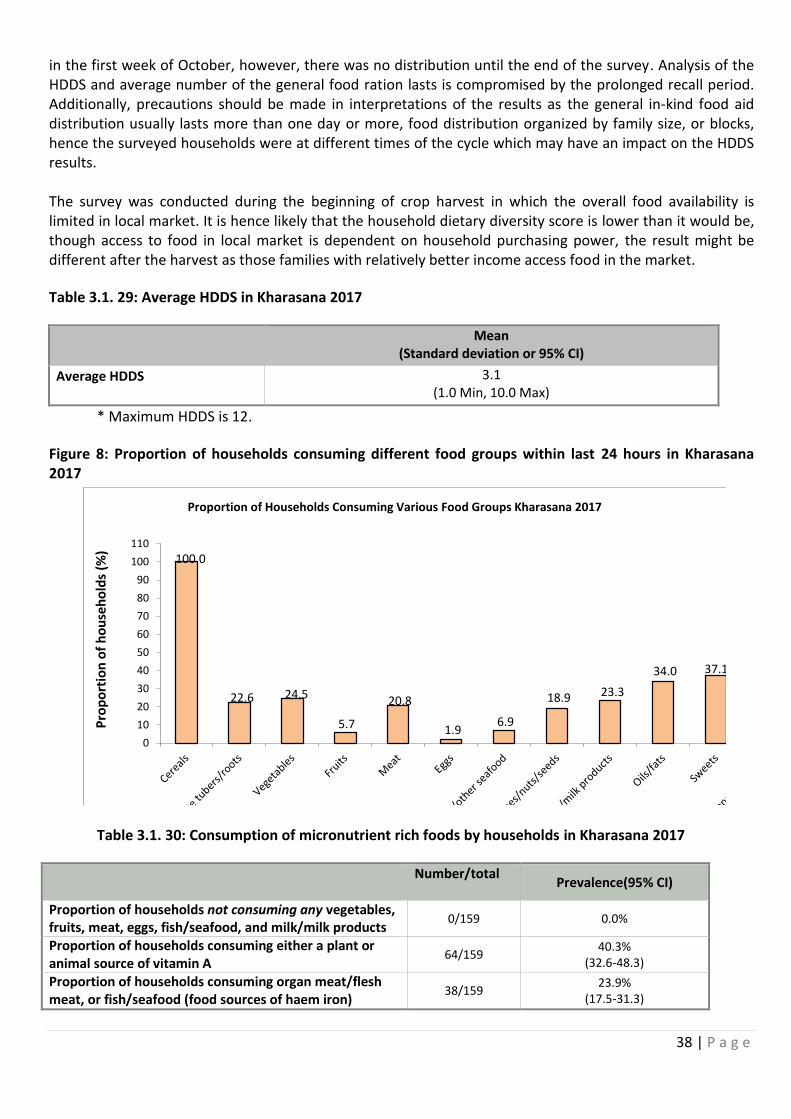
38 | P a g e
in the first week of October, however, there was no distribution until the end of the survey. Analysis of the HDDS and average number of the general food ration lasts is compromised by the prolonged recall period. Additionally, precautions should be made in interpretations of the results as the general in-kind food aid distribution usually lasts more than one day or more, food distribution organized by family size, or blocks, hence the surveyed households were at different times of the cycle which may have an impact on the HDDS results. The survey was conducted during the beginning of crop harvest in which the overall food availability is limited in local market. It is hence likely that the household dietary diversity score is lower than it would be, though access to food in local market is dependent on household purchasing power, the result might be different after the harvest as those families with relatively better income access food in the market.
Table 3.1. 29: Average HDDS in Kharasana 2017
Mean
(Standard deviation or 95% CI)
Average HDDS
3.1 (1.0 Min, 10.0 Max)
* Maximum HDDS is 12.
Figure 8: Proportion of households consuming different food groups within last 24 hours in Kharasana 2017
100.0
22.6 24.5
5.7
20.8
1.96.9
18.9 23.3
34.0 37.1
0
10
20
30
40
50
60
70
80
90
100
110
Pro
po
rtio
n o
f h
ou
seh
old
s (%
)
Proportion of Households Consuming Various Food Groups Kharasana 2017
Table 3.1. 30: Consumption of micronutrient rich foods by households in Kharasana 2017
Number/total Prevalence(95% CI)
Proportion of households not consuming any vegetables, fruits, meat, eggs, fish/seafood, and milk/milk products
0/159 0.0%
Proportion of households consuming either a plant or animal source of vitamin A
64/159 40.3%
(32.6-48.3)
Proportion of households consuming organ meat/flesh meat, or fish/seafood (food sources of haem iron)
38/159 23.9%
(17.5-31.3)
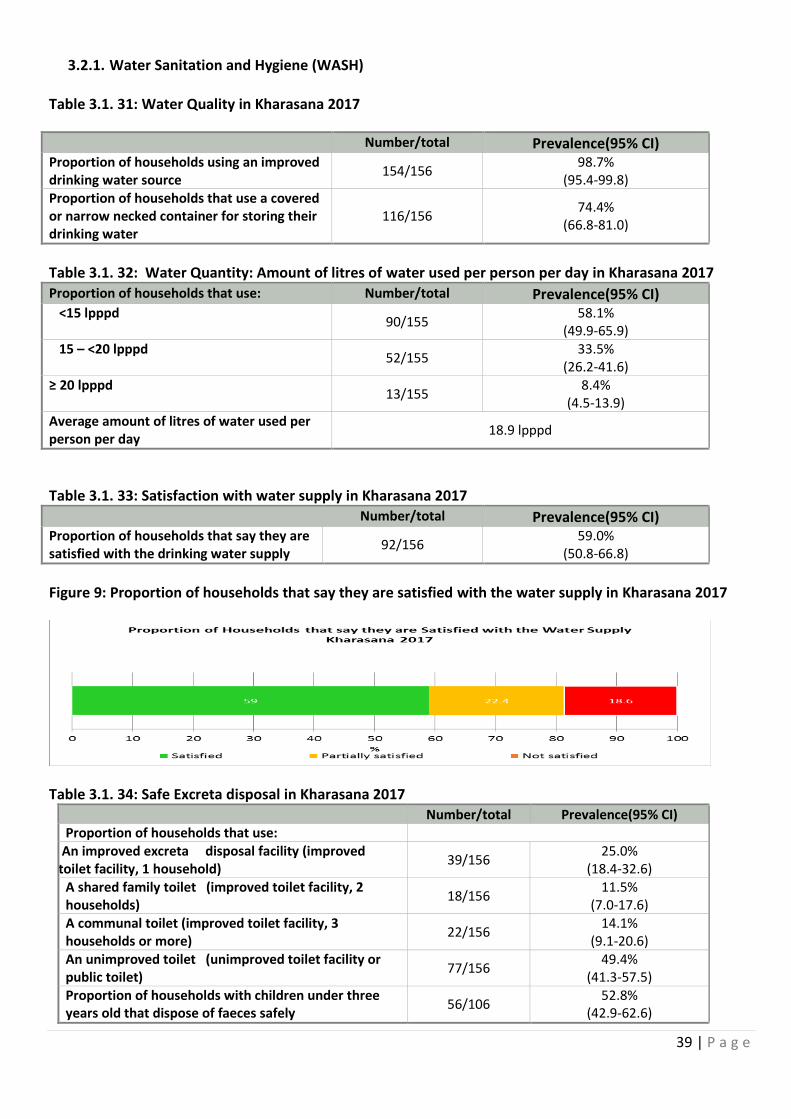
39 | P a g e
3.2.1. Water Sanitation and Hygiene (WASH) Table 3.1. 31: Water Quality in Kharasana 2017
Number/total Prevalence(95% CI) Proportion of households using an improved drinking water source
154/156 98.7%
(95.4-99.8) Proportion of households that use a covered or narrow necked container for storing their drinking water
116/156 74.4%
(66.8-81.0)
Table 3.1. 32: Water Quantity: Amount of litres of water used per person per day in Kharasana 2017
Proportion of households that use: Number/total Prevalence(95% CI) <15 lpppd
90/155 58.1%
(49.9-65.9) 15 – <20 lpppd
52/155 33.5%
(26.2-41.6) ≥ 20 lpppd
13/155 8.4%
(4.5-13.9) Average amount of litres of water used per person per day
18.9 lpppd
Table 3.1. 33: Satisfaction with water supply in Kharasana 2017 Number/total Prevalence(95% CI) Proportion of households that say they are satisfied with the drinking water supply
92/156 59.0%
(50.8-66.8)
Figure 9: Proportion of households that say they are satisfied with the water supply in Kharasana 2017
Table 3.1. 34: Safe Excreta disposal in Kharasana 2017 Number/total Prevalence(95% CI) Proportion of households that use:
An improved excreta disposal facility (improved toilet facility, 1 household)
39/156 25.0%
(18.4-32.6) A shared family toilet (improved toilet facility, 2 households)
18/156 11.5%
(7.0-17.6) A communal toilet (improved toilet facility, 3 households or more)
22/156 14.1%
(9.1-20.6) An unimproved toilet (unimproved toilet facility or public toilet)
77/156 49.4%
(41.3-57.5) Proportion of households with children under three years old that dispose of faeces safely
56/106 52.8%
(42.9-62.6)
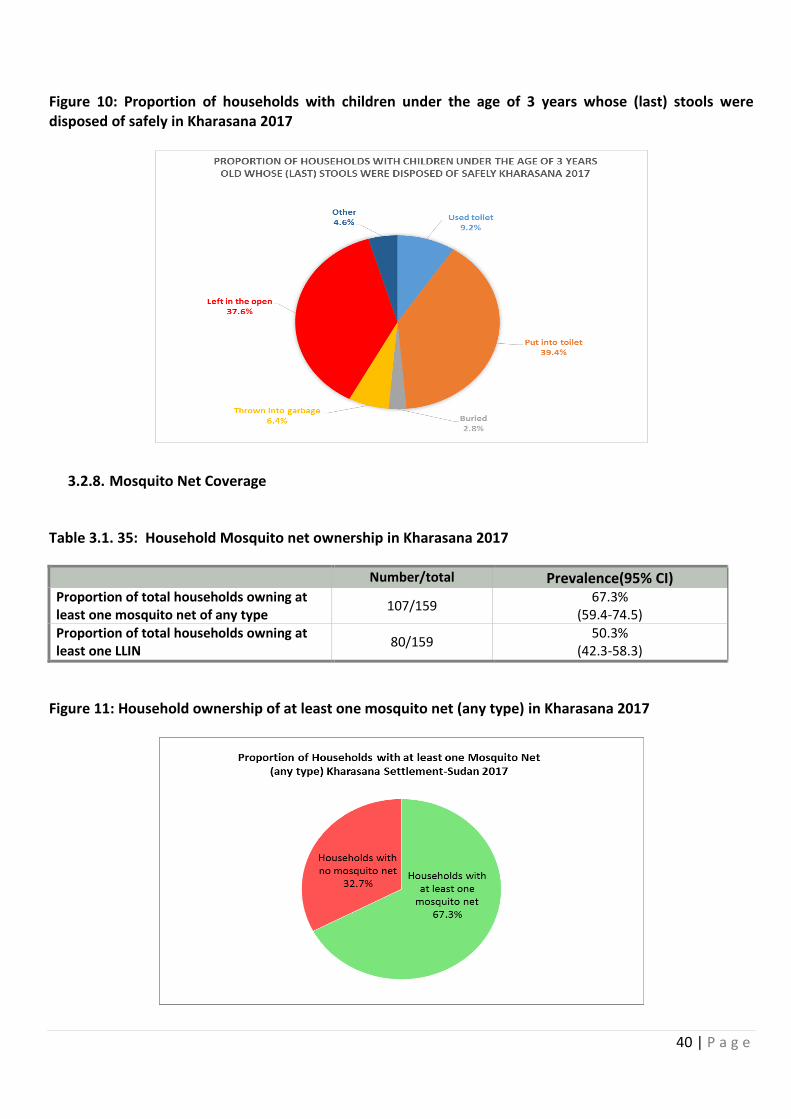
40 | P a g e
Figure 10: Proportion of households with children under the age of 3 years whose (last) stools were disposed of safely in Kharasana 2017
3.2.8. Mosquito Net Coverage
Table 3.1. 35: Household Mosquito net ownership in Kharasana 2017
Number/total Prevalence(95% CI) Proportion of total households owning at least one mosquito net of any type
107/159 67.3%
(59.4-74.5) Proportion of total households owning at least one LLIN
80/159 50.3%
(42.3-58.3)
Figure 11: Household ownership of at least one mosquito net (any type) in Kharasana 2017
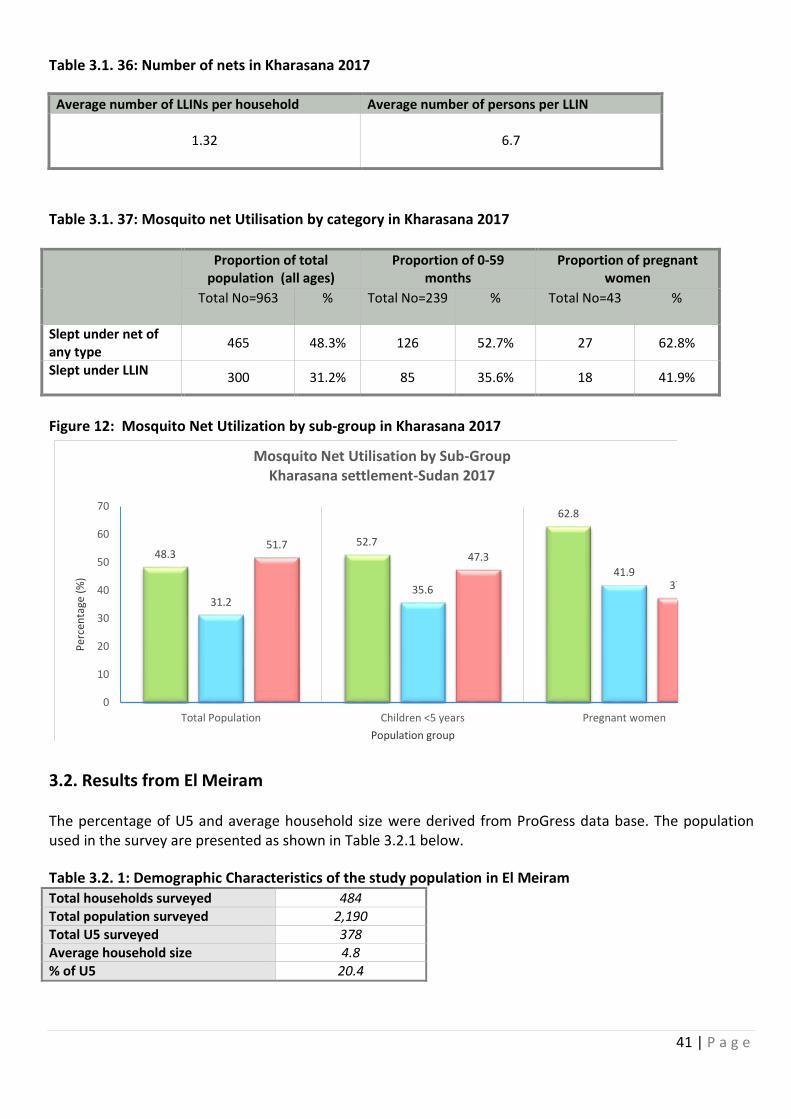
41 | P a g e
Table 3.1. 36: Number of nets in Kharasana 2017
Average number of LLINs per household Average number of persons per LLIN
1.32
6.7
Table 3.1. 37: Mosquito net Utilisation by category in Kharasana 2017
Proportion of total population (all ages)
Proportion of 0-59 months
Proportion of pregnant women
Total No=963
% Total No=239
% Total No=43
%
Slept under net of any type
465 48.3% 126 52.7% 27 62.8%
Slept under LLIN 300 31.2% 85 35.6% 18 41.9%
Figure 12: Mosquito Net Utilization by sub-group in Kharasana 2017
48.352.7
62.8
31.235.6
41.9
51.747.3
37.2
0
10
20
30
40
50
60
70
Total Population Children <5 years Pregnant women
Per
cen
tage
(%
)
Population group
Mosquito Net Utilisation by Sub-GroupKharasana settlement-Sudan 2017
3.2. Results from El Meiram The percentage of U5 and average household size were derived from ProGress data base. The population used in the survey are presented as shown in Table 3.2.1 below.
Table 3.2. 1: Demographic Characteristics of the study population in El Meiram Total households surveyed 484 Total population surveyed 2,190 Total U5 surveyed 378 Average household size 4.8 % of U5 20.4
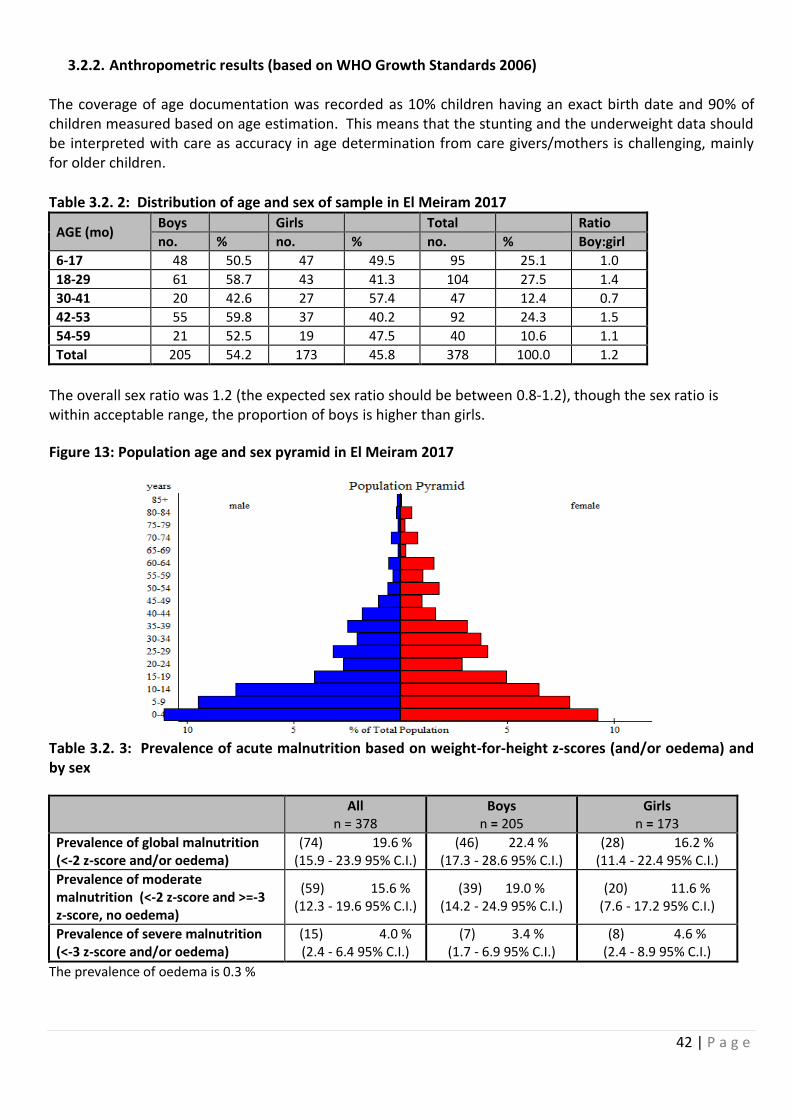
42 | P a g e
3.2.2. Anthropometric results (based on WHO Growth Standards 2006)
The coverage of age documentation was recorded as 10% children having an exact birth date and 90% of children measured based on age estimation. This means that the stunting and the underweight data should be interpreted with care as accuracy in age determination from care givers/mothers is challenging, mainly for older children.
Table 3.2. 2: Distribution of age and sex of sample in El Meiram 2017
AGE (mo) Boys Girls Total Ratio
no. % no. % no. % Boy:girl
6-17 48 50.5 47 49.5 95 25.1 1.0
18-29 61 58.7 43 41.3 104 27.5 1.4
30-41 20 42.6 27 57.4 47 12.4 0.7
42-53 55 59.8 37 40.2 92 24.3 1.5
54-59 21 52.5 19 47.5 40 10.6 1.1
Total 205 54.2 173 45.8 378 100.0 1.2
The overall sex ratio was 1.2 (the expected sex ratio should be between 0.8-1.2), though the sex ratio is within acceptable range, the proportion of boys is higher than girls.
Figure 13: Population age and sex pyramid in El Meiram 2017
Table 3.2. 3: Prevalence of acute malnutrition based on weight-for-height z-scores (and/or oedema) and by sex
All n = 378
Boys n = 205
Girls n = 173
Prevalence of global malnutrition (<-2 z-score and/or oedema)
(74) 19.6 % (15.9 - 23.9 95% C.I.)
(46) 22.4 % (17.3 - 28.6 95% C.I.)
(28) 16.2 % (11.4 - 22.4 95% C.I.)
Prevalence of moderate malnutrition (<-2 z-score and >=-3 z-score, no oedema)
(59) 15.6 % (12.3 - 19.6 95% C.I.)
(39) 19.0 % (14.2 - 24.9 95% C.I.)
(20) 11.6 % (7.6 - 17.2 95% C.I.)
Prevalence of severe malnutrition (<-3 z-score and/or oedema)
(15) 4.0 % (2.4 - 6.4 95% C.I.)
(7) 3.4 % (1.7 - 6.9 95% C.I.)
(8) 4.6 % (2.4 - 8.9 95% C.I.)
The prevalence of oedema is 0.3 %
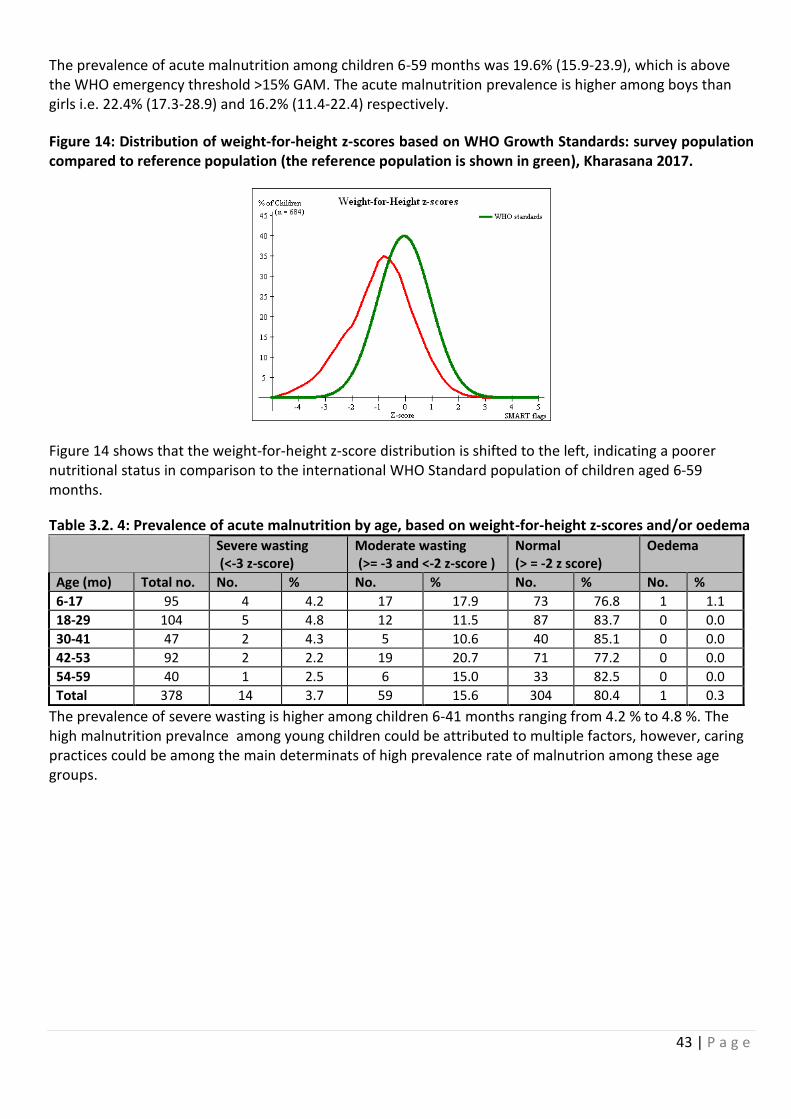
43 | P a g e
The prevalence of acute malnutrition among children 6-59 months was 19.6% (15.9-23.9), which is above the WHO emergency threshold >15% GAM. The acute malnutrition prevalence is higher among boys than girls i.e. 22.4% (17.3-28.9) and 16.2% (11.4-22.4) respectively.
Figure 14: Distribution of weight-for-height z-scores based on WHO Growth Standards: survey population compared to reference population (the reference population is shown in green), Kharasana 2017.
Figure 14 shows that the weight-for-height z-score distribution is shifted to the left, indicating a poorer nutritional status in comparison to the international WHO Standard population of children aged 6-59 months.
Table 3.2. 4: Prevalence of acute malnutrition by age, based on weight-for-height z-scores and/or oedema Severe wasting
(<-3 z-score) Moderate wasting (>= -3 and <-2 z-score )
Normal (> = -2 z score)
Oedema
Age (mo) Total no. No. % No. % No. % No. %
6-17 95 4 4.2 17 17.9 73 76.8 1 1.1
18-29 104 5 4.8 12 11.5 87 83.7 0 0.0
30-41 47 2 4.3 5 10.6 40 85.1 0 0.0
42-53 92 2 2.2 19 20.7 71 77.2 0 0.0
54-59 40 1 2.5 6 15.0 33 82.5 0 0.0
Total 378 14 3.7 59 15.6 304 80.4 1 0.3
The prevalence of severe wasting is higher among children 6-41 months ranging from 4.2 % to 4.8 %. The high malnutrition prevalnce among young children could be attributed to multiple factors, however, caring practices could be among the main determinats of high prevalence rate of malnutrion among these age groups.
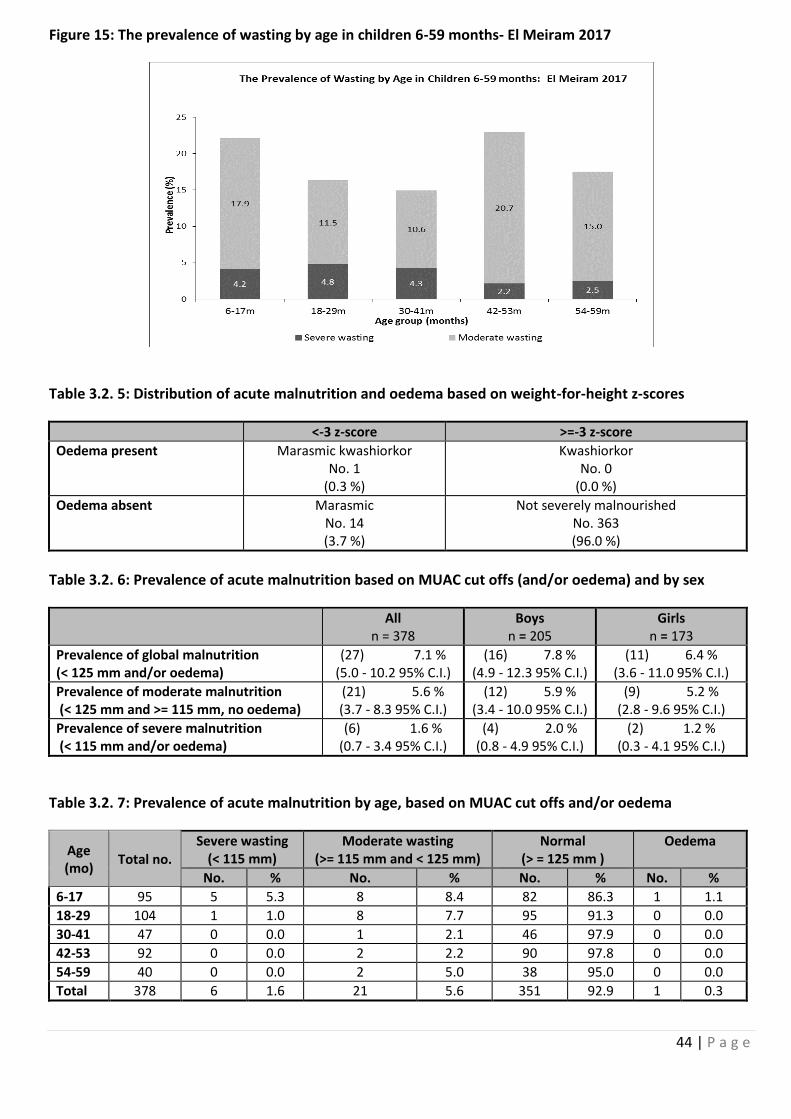
44 | P a g e
Figure 15: The prevalence of wasting by age in children 6-59 months- El Meiram 2017
Table 3.2. 5: Distribution of acute malnutrition and oedema based on weight-for-height z-scores
<-3 z-score >=-3 z-score
Oedema present Marasmic kwashiorkor No. 1
(0.3 %)
Kwashiorkor No. 0
(0.0 %)
Oedema absent Marasmic No. 14 (3.7 %)
Not severely malnourished No. 363 (96.0 %)
Table 3.2. 6: Prevalence of acute malnutrition based on MUAC cut offs (and/or oedema) and by sex
All n = 378
Boys n = 205
Girls n = 173
Prevalence of global malnutrition (< 125 mm and/or oedema)
(27) 7.1 % (5.0 - 10.2 95% C.I.)
(16) 7.8 % (4.9 - 12.3 95% C.I.)
(11) 6.4 % (3.6 - 11.0 95% C.I.)
Prevalence of moderate malnutrition (< 125 mm and >= 115 mm, no oedema)
(21) 5.6 % (3.7 - 8.3 95% C.I.)
(12) 5.9 % (3.4 - 10.0 95% C.I.)
(9) 5.2 % (2.8 - 9.6 95% C.I.)
Prevalence of severe malnutrition (< 115 mm and/or oedema)
(6) 1.6 % (0.7 - 3.4 95% C.I.)
(4) 2.0 % (0.8 - 4.9 95% C.I.)
(2) 1.2 % (0.3 - 4.1 95% C.I.)
Table 3.2. 7: Prevalence of acute malnutrition by age, based on MUAC cut offs and/or oedema
Age (mo)
Total no. Severe wasting
(< 115 mm) Moderate wasting
(>= 115 mm and < 125 mm) Normal
(> = 125 mm ) Oedema
No. % No. % No. % No. %
6-17 95 5 5.3 8 8.4 82 86.3 1 1.1
18-29 104 1 1.0 8 7.7 95 91.3 0 0.0
30-41 47 0 0.0 1 2.1 46 97.9 0 0.0
42-53 92 0 0.0 2 2.2 90 97.8 0 0.0
54-59 40 0 0.0 2 5.0 38 95.0 0 0.0
Total 378 6 1.6 21 5.6 351 92.9 1 0.3
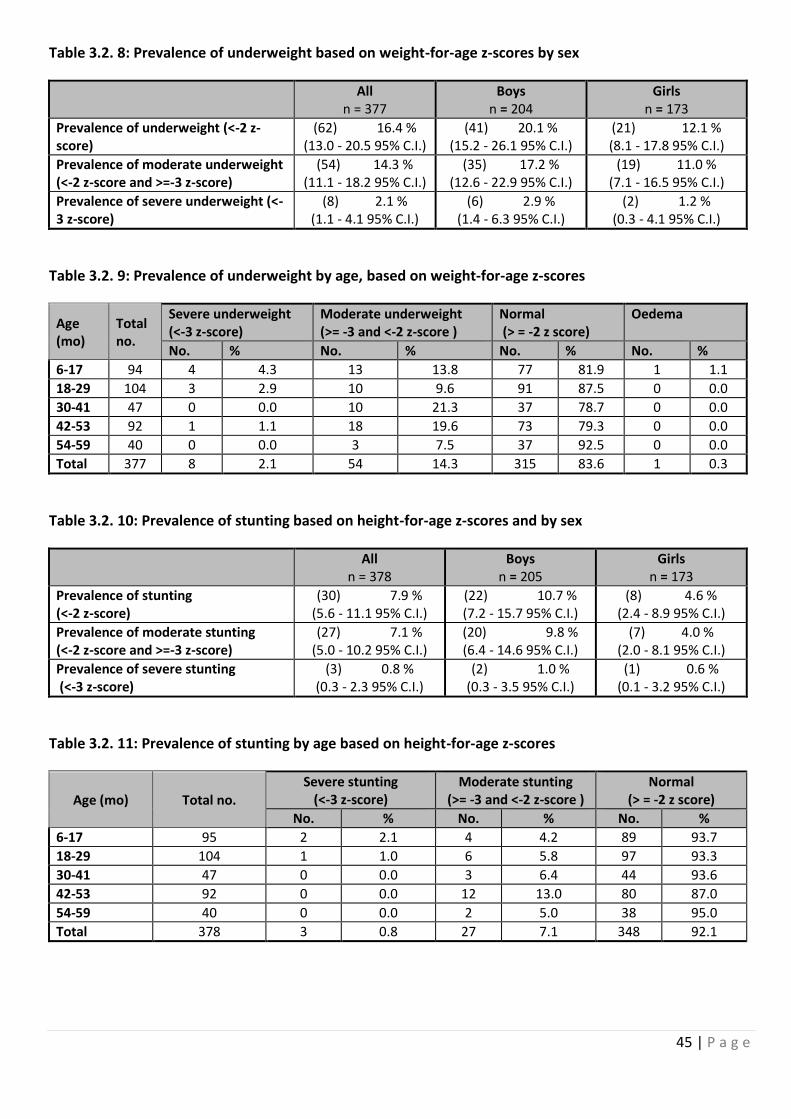
45 | P a g e
Table 3.2. 8: Prevalence of underweight based on weight-for-age z-scores by sex
All n = 377
Boys n = 204
Girls n = 173
Prevalence of underweight (<-2 z-score)
(62) 16.4 % (13.0 - 20.5 95% C.I.)
(41) 20.1 % (15.2 - 26.1 95% C.I.)
(21) 12.1 % (8.1 - 17.8 95% C.I.)
Prevalence of moderate underweight (<-2 z-score and >=-3 z-score)
(54) 14.3 % (11.1 - 18.2 95% C.I.)
(35) 17.2 % (12.6 - 22.9 95% C.I.)
(19) 11.0 % (7.1 - 16.5 95% C.I.)
Prevalence of severe underweight (<-3 z-score)
(8) 2.1 % (1.1 - 4.1 95% C.I.)
(6) 2.9 % (1.4 - 6.3 95% C.I.)
(2) 1.2 % (0.3 - 4.1 95% C.I.)
Table 3.2. 9: Prevalence of underweight by age, based on weight-for-age z-scores
Age (mo)
Total no.
Severe underweight (<-3 z-score)
Moderate underweight (>= -3 and <-2 z-score )
Normal (> = -2 z score)
Oedema
No. % No. % No. % No. %
6-17 94 4 4.3 13 13.8 77 81.9 1 1.1
18-29 104 3 2.9 10 9.6 91 87.5 0 0.0
30-41 47 0 0.0 10 21.3 37 78.7 0 0.0
42-53 92 1 1.1 18 19.6 73 79.3 0 0.0
54-59 40 0 0.0 3 7.5 37 92.5 0 0.0
Total 377 8 2.1 54 14.3 315 83.6 1 0.3
Table 3.2. 10: Prevalence of stunting based on height-for-age z-scores and by sex
All n = 378
Boys n = 205
Girls n = 173
Prevalence of stunting (<-2 z-score)
(30) 7.9 % (5.6 - 11.1 95% C.I.)
(22) 10.7 % (7.2 - 15.7 95% C.I.)
(8) 4.6 % (2.4 - 8.9 95% C.I.)
Prevalence of moderate stunting (<-2 z-score and >=-3 z-score)
(27) 7.1 % (5.0 - 10.2 95% C.I.)
(20) 9.8 % (6.4 - 14.6 95% C.I.)
(7) 4.0 % (2.0 - 8.1 95% C.I.)
Prevalence of severe stunting (<-3 z-score)
(3) 0.8 % (0.3 - 2.3 95% C.I.)
(2) 1.0 % (0.3 - 3.5 95% C.I.)
(1) 0.6 % (0.1 - 3.2 95% C.I.)
Table 3.2. 11: Prevalence of stunting by age based on height-for-age z-scores
Age (mo) Total no. Severe stunting
(<-3 z-score) Moderate stunting
(>= -3 and <-2 z-score ) Normal
(> = -2 z score)
No. % No. % No. %
6-17 95 2 2.1 4 4.2 89 93.7
18-29 104 1 1.0 6 5.8 97 93.3
30-41 47 0 0.0 3 6.4 44 93.6
42-53 92 0 0.0 12 13.0 80 87.0
54-59 40 0 0.0 2 5.0 38 95.0
Total 378 3 0.8 27 7.1 348 92.1
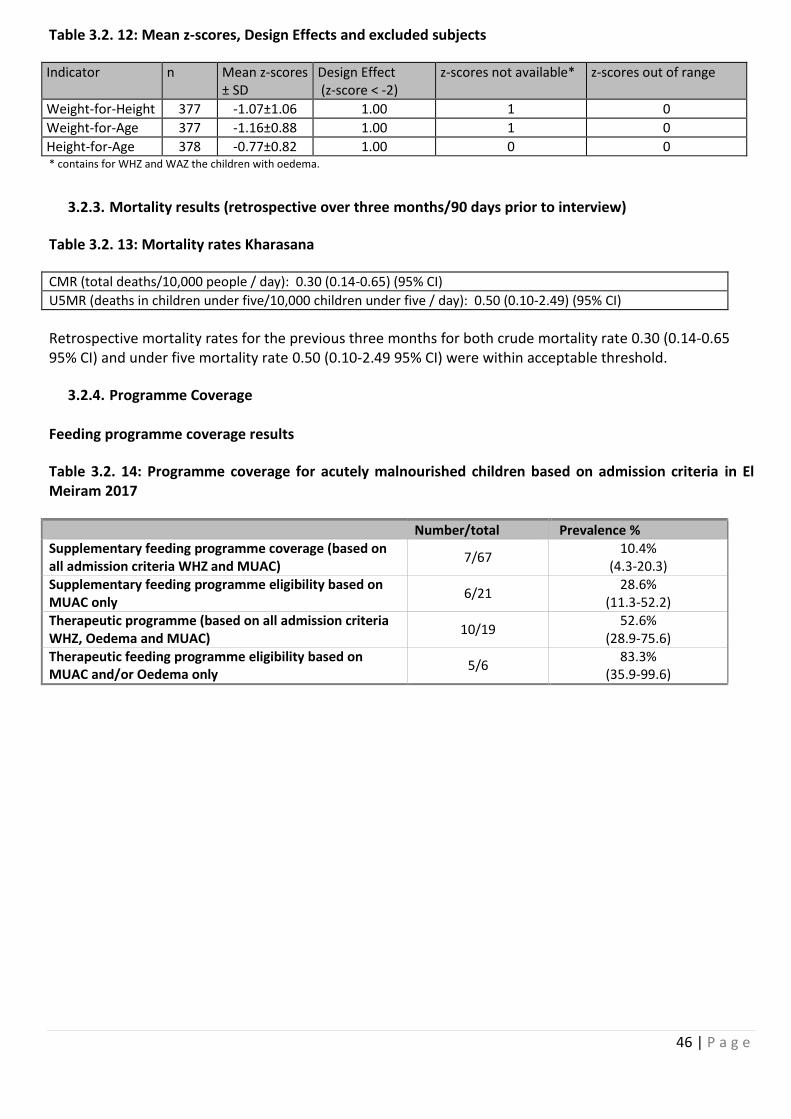
46 | P a g e
Table 3.2. 12: Mean z-scores, Design Effects and excluded subjects
Indicator n Mean z-scores ± SD
Design Effect (z-score < -2)
z-scores not available* z-scores out of range
Weight-for-Height 377 -1.07±1.06 1.00 1 0
Weight-for-Age 377 -1.16±0.88 1.00 1 0
Height-for-Age 378 -0.77±0.82 1.00 0 0 * contains for WHZ and WAZ the children with oedema.
3.2.3. Mortality results (retrospective over three months/90 days prior to interview)
Table 3.2. 13: Mortality rates Kharasana
CMR (total deaths/10,000 people / day): 0.30 (0.14-0.65) (95% CI)
U5MR (deaths in children under five/10,000 children under five / day): 0.50 (0.10-2.49) (95% CI)
Retrospective mortality rates for the previous three months for both crude mortality rate 0.30 (0.14-0.65 95% CI) and under five mortality rate 0.50 (0.10-2.49 95% CI) were within acceptable threshold.
3.2.4. Programme Coverage Feeding programme coverage results
Table 3.2. 14: Programme coverage for acutely malnourished children based on admission criteria in El Meiram 2017
Number/total Prevalence % Supplementary feeding programme coverage (based on all admission criteria WHZ and MUAC)
7/67 10.4%
(4.3-20.3) Supplementary feeding programme eligibility based on MUAC only
6/21 28.6%
(11.3-52.2) Therapeutic programme (based on all admission criteria WHZ, Oedema and MUAC)
10/19 52.6%
(28.9-75.6) Therapeutic feeding programme eligibility based on MUAC and/or Oedema only
5/6 83.3%
(35.9-99.6)
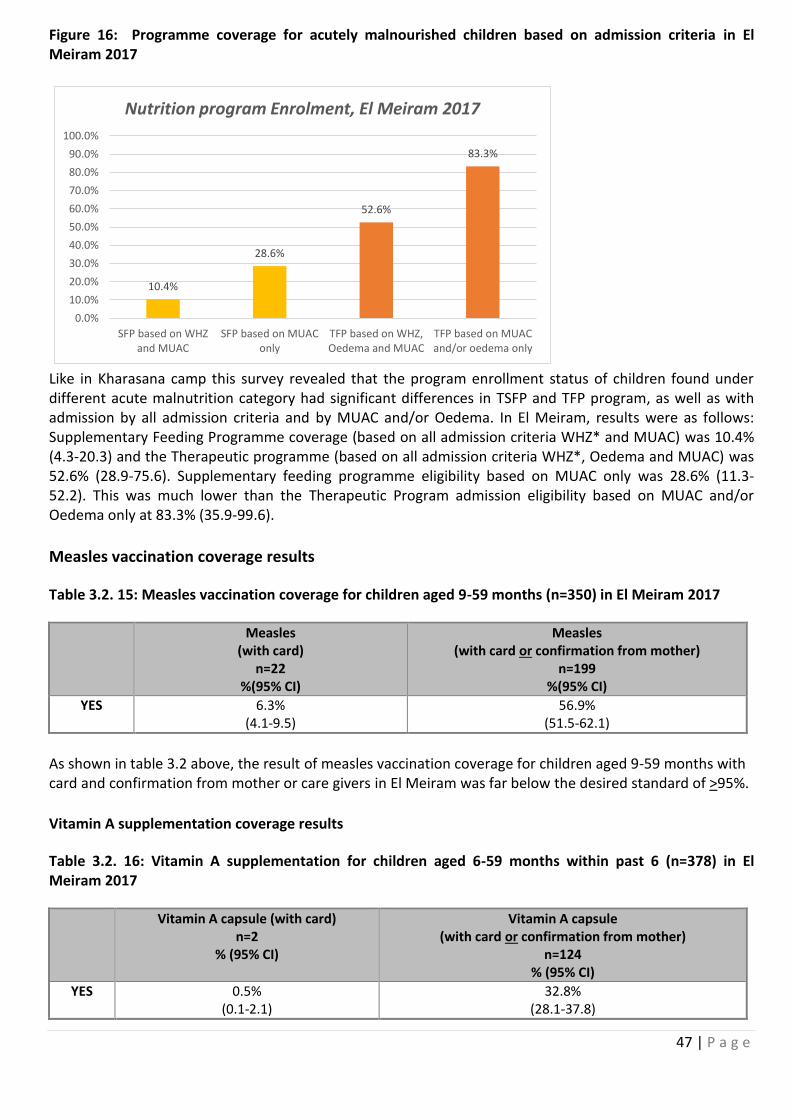
47 | P a g e
Figure 16: Programme coverage for acutely malnourished children based on admission criteria in El Meiram 2017
10.4%
28.6%
52.6%
83.3%
0.0%
10.0%
20.0%
30.0%
40.0%
50.0%
60.0%
70.0%
80.0%
90.0%
100.0%
SFP based on WHZand MUAC
SFP based on MUAConly
TFP based on WHZ,Oedema and MUAC
TFP based on MUACand/or oedema only
Nutrition program Enrolment, El Meiram 2017
Like in Kharasana camp this survey revealed that the program enrollment status of children found under different acute malnutrition category had significant differences in TSFP and TFP program, as well as with admission by all admission criteria and by MUAC and/or Oedema. In El Meiram, results were as follows: Supplementary Feeding Programme coverage (based on all admission criteria WHZ* and MUAC) was 10.4% (4.3-20.3) and the Therapeutic programme (based on all admission criteria WHZ*, Oedema and MUAC) was 52.6% (28.9-75.6). Supplementary feeding programme eligibility based on MUAC only was 28.6% (11.3-52.2). This was much lower than the Therapeutic Program admission eligibility based on MUAC and/or Oedema only at 83.3% (35.9-99.6).
Measles vaccination coverage results
Table 3.2. 15: Measles vaccination coverage for children aged 9-59 months (n=350) in El Meiram 2017
Measles (with card)
n=22 %(95% CI)
Measles (with card or confirmation from mother)
n=199 %(95% CI)
YES
6.3% (4.1-9.5)
56.9% (51.5-62.1)
As shown in table 3.2 above, the result of measles vaccination coverage for children aged 9-59 months with card and confirmation from mother or care givers in El Meiram was far below the desired standard of >95%.
Vitamin A supplementation coverage results
Table 3.2. 16: Vitamin A supplementation for children aged 6-59 months within past 6 (n=378) in El Meiram 2017
Vitamin A capsule (with card) n=2
% (95% CI)
Vitamin A capsule (with card or confirmation from mother)
n=124 % (95% CI)
YES
0.5% (0.1-2.1)
32.8% (28.1-37.8)
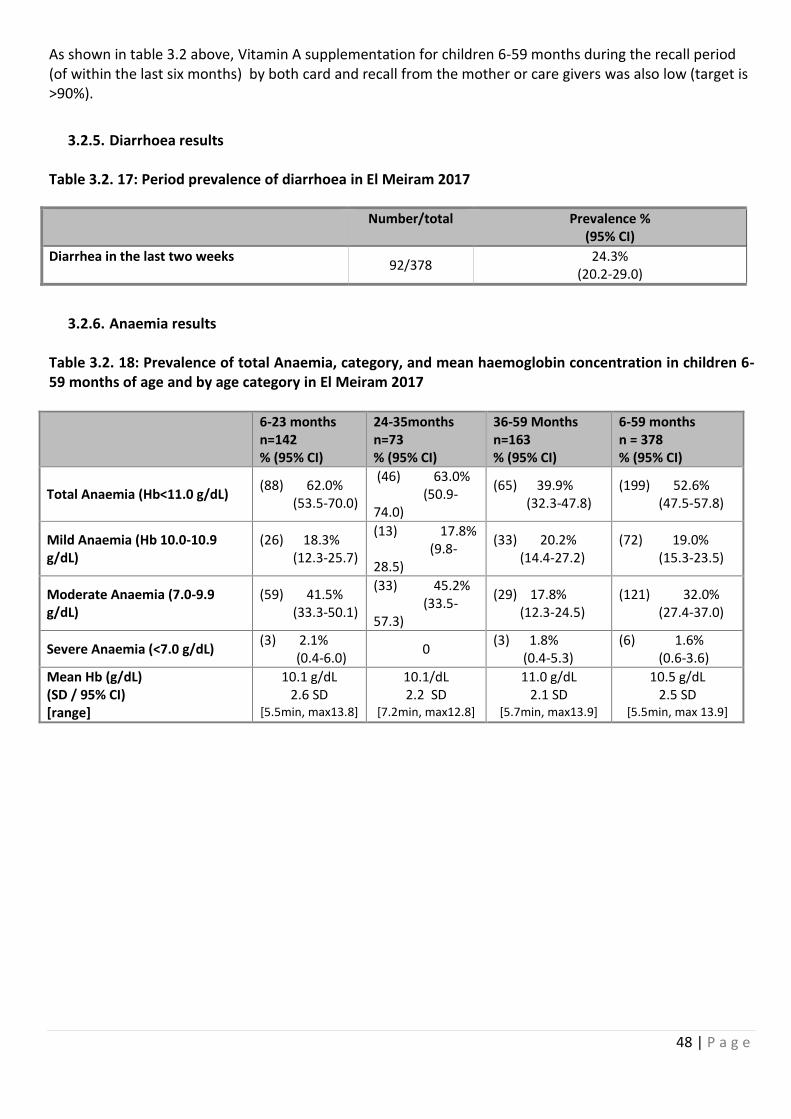
48 | P a g e
As shown in table 3.2 above, Vitamin A supplementation for children 6-59 months during the recall period (of within the last six months) by both card and recall from the mother or care givers was also low (target is >90%).
3.2.5. Diarrhoea results Table 3.2. 17: Period prevalence of diarrhoea in El Meiram 2017
Number/total Prevalence % (95% CI)
Diarrhea in the last two weeks 92/378
24.3% (20.2-29.0)
3.2.6. Anaemia results Table 3.2. 18: Prevalence of total Anaemia, category, and mean haemoglobin concentration in children 6-59 months of age and by age category in El Meiram 2017
6-23 months n=142 % (95% CI)
24-35months n=73 % (95% CI)
36-59 Months n=163 % (95% CI)
6-59 months n = 378 % (95% CI)
Total Anaemia (Hb<11.0 g/dL) (88) 62.0% (53.5-70.0)
(46) 63.0% (50.9-74.0)
(65) 39.9% (32.3-47.8)
(199) 52.6% (47.5-57.8)
Mild Anaemia (Hb 10.0-10.9 g/dL)
(26) 18.3% (12.3-25.7)
(13) 17.8% (9.8-28.5)
(33) 20.2% (14.4-27.2)
(72) 19.0% (15.3-23.5)
Moderate Anaemia (7.0-9.9 g/dL)
(59) 41.5% (33.3-50.1)
(33) 45.2% (33.5-57.3)
(29) 17.8% (12.3-24.5)
(121) 32.0% (27.4-37.0)
Severe Anaemia (<7.0 g/dL) (3) 2.1% (0.4-6.0)
0 (3) 1.8% (0.4-5.3)
(6) 1.6% (0.6-3.6)
Mean Hb (g/dL) (SD / 95% CI) [range]
10.1 g/dL 2.6 SD
[5.5min, max13.8]
10.1/dL 2.2 SD
[7.2min, max12.8]
11.0 g/dL 2.1 SD
[5.7min, max13.9]
10.5 g/dL 2.5 SD
[5.5min, max 13.9]
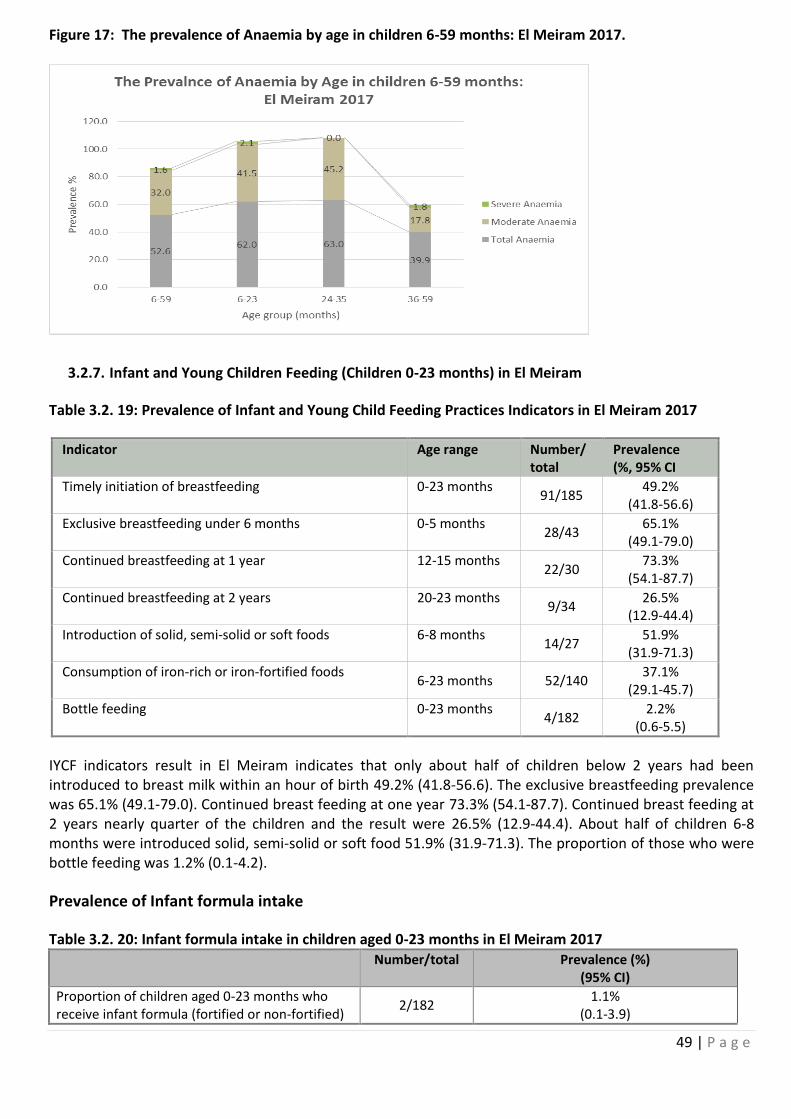
49 | P a g e
Figure 17: The prevalence of Anaemia by age in children 6-59 months: El Meiram 2017.
3.2.7. Infant and Young Children Feeding (Children 0-23 months) in El Meiram
Table 3.2. 19: Prevalence of Infant and Young Child Feeding Practices Indicators in El Meiram 2017
Indicator Age range Number/ total
Prevalence (%, 95% CI
Timely initiation of breastfeeding 0-23 months 91/185
49.2% (41.8-56.6)
Exclusive breastfeeding under 6 months 0-5 months 28/43
65.1% (49.1-79.0)
Continued breastfeeding at 1 year 12-15 months 22/30
73.3% (54.1-87.7)
Continued breastfeeding at 2 years 20-23 months 9/34
26.5% (12.9-44.4)
Introduction of solid, semi-solid or soft foods 6-8 months 14/27
51.9% (31.9-71.3)
Consumption of iron-rich or iron-fortified foods 6-23 months 52/140
37.1% (29.1-45.7)
Bottle feeding 0-23 months 4/182
2.2% (0.6-5.5)
IYCF indicators result in El Meiram indicates that only about half of children below 2 years had been introduced to breast milk within an hour of birth 49.2% (41.8-56.6). The exclusive breastfeeding prevalence was 65.1% (49.1-79.0). Continued breast feeding at one year 73.3% (54.1-87.7). Continued breast feeding at 2 years nearly quarter of the children and the result were 26.5% (12.9-44.4). About half of children 6-8 months were introduced solid, semi-solid or soft food 51.9% (31.9-71.3). The proportion of those who were bottle feeding was 1.2% (0.1-4.2).
Prevalence of Infant formula intake
Table 3.2. 20: Infant formula intake in children aged 0-23 months in El Meiram 2017 Number/total Prevalence (%)
(95% CI)
Proportion of children aged 0-23 months who receive infant formula (fortified or non-fortified)
2/182 1.1%
(0.1-3.9)
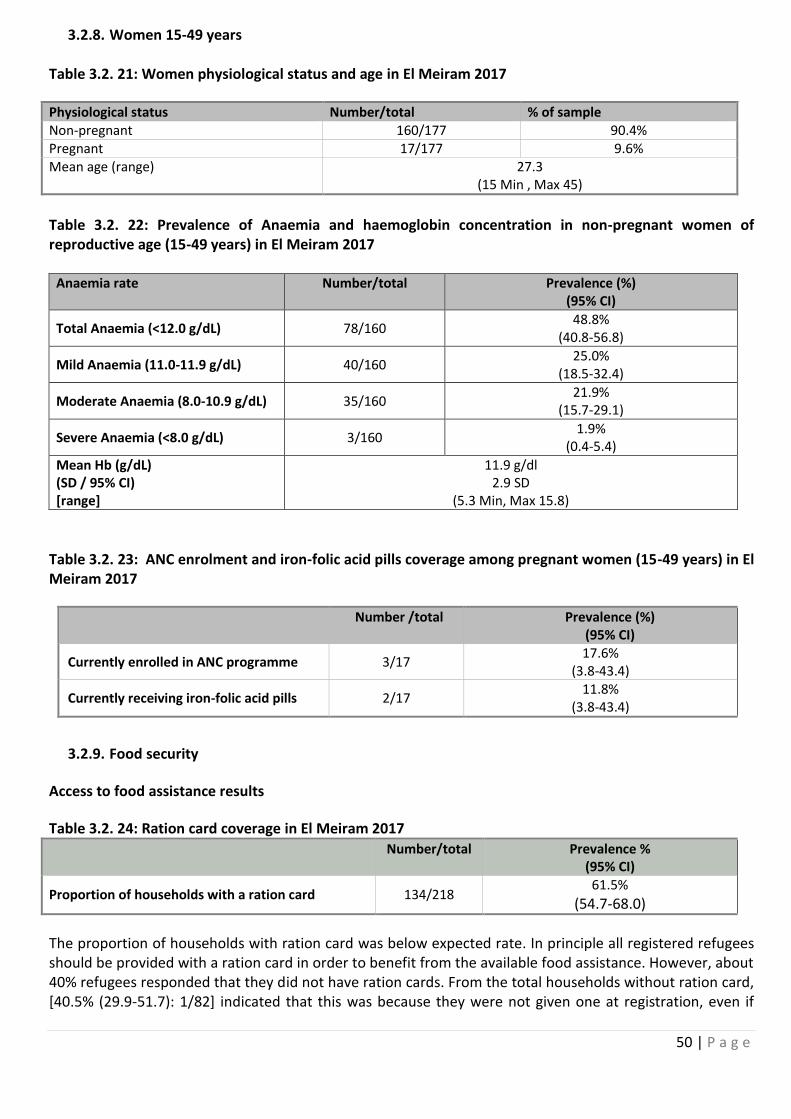
50 | P a g e
3.2.8. Women 15-49 years Table 3.2. 21: Women physiological status and age in El Meiram 2017
Physiological status Number/total % of sample Non-pregnant 160/177 90.4% Pregnant 17/177 9.6% Mean age (range) 27.3
(15 Min , Max 45)
Table 3.2. 22: Prevalence of Anaemia and haemoglobin concentration in non-pregnant women of reproductive age (15-49 years) in El Meiram 2017
Anaemia rate Number/total Prevalence (%) (95% CI)
Total Anaemia (<12.0 g/dL) 78/160 48.8%
(40.8-56.8)
Mild Anaemia (11.0-11.9 g/dL) 40/160 25.0%
(18.5-32.4)
Moderate Anaemia (8.0-10.9 g/dL) 35/160 21.9%
(15.7-29.1)
Severe Anaemia (<8.0 g/dL) 3/160 1.9%
(0.4-5.4)
Mean Hb (g/dL) (SD / 95% CI) [range]
11.9 g/dl 2.9 SD
(5.3 Min, Max 15.8)
Table 3.2. 23: ANC enrolment and iron-folic acid pills coverage among pregnant women (15-49 years) in El Meiram 2017
Number /total Prevalence (%) (95% CI)
Currently enrolled in ANC programme 3/17 17.6%
(3.8-43.4)
Currently receiving iron-folic acid pills 2/17 11.8%
(3.8-43.4)
3.2.9. Food security
Access to food assistance results
Table 3.2. 24: Ration card coverage in El Meiram 2017
Number/total Prevalence %
(95% CI)
Proportion of households with a ration card 134/218 61.5%
(54.7-68.0)
The proportion of households with ration card was below expected rate. In principle all registered refugees should be provided with a ration card in order to benefit from the available food assistance. However, about 40% refugees responded that they did not have ration cards. From the total households without ration card, [40.5% (29.9-51.7): 1/82] indicated that this was because they were not given one at registration, even if
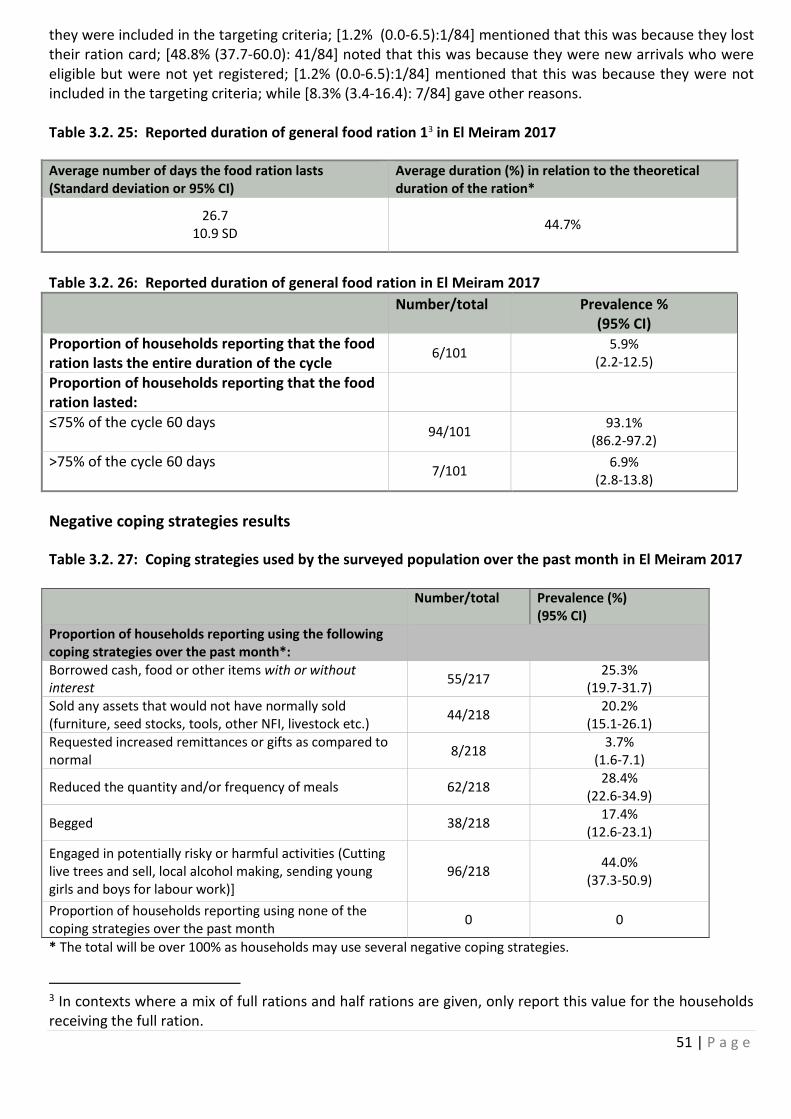
51 | P a g e
they were included in the targeting criteria; [1.2% (0.0-6.5):1/84] mentioned that this was because they lost their ration card; [48.8% (37.7-60.0): 41/84] noted that this was because they were new arrivals who were eligible but were not yet registered; [1.2% (0.0-6.5):1/84] mentioned that this was because they were not included in the targeting criteria; while [8.3% (3.4-16.4): 7/84] gave other reasons. Table 3.2. 25: Reported duration of general food ration 13 in El Meiram 2017
Average number of days the food ration lasts (Standard deviation or 95% CI)
Average duration (%) in relation to the theoretical duration of the ration*
26.7 10.9 SD
44.7%
Table 3.2. 26: Reported duration of general food ration in El Meiram 2017
Number/total Prevalence %
(95% CI) Proportion of households reporting that the food ration lasts the entire duration of the cycle
6/101 5.9%
(2.2-12.5)
Proportion of households reporting that the food ration lasted:
≤75% of the cycle 60 days
94/101 93.1%
(86.2-97.2)
>75% of the cycle 60 days
7/101 6.9%
(2.8-13.8)
Negative coping strategies results
Table 3.2. 27: Coping strategies used by the surveyed population over the past month in El Meiram 2017
Number/total Prevalence (%)
(95% CI) Proportion of households reporting using the following coping strategies over the past month*:
Borrowed cash, food or other items with or without interest
55/217 25.3%
(19.7-31.7) Sold any assets that would not have normally sold (furniture, seed stocks, tools, other NFI, livestock etc.)
44/218 20.2%
(15.1-26.1) Requested increased remittances or gifts as compared to normal
8/218 3.7%
(1.6-7.1)
Reduced the quantity and/or frequency of meals 62/218 28.4%
(22.6-34.9)
Begged 38/218 17.4%
(12.6-23.1)
Engaged in potentially risky or harmful activities (Cutting live trees and sell, local alcohol making, sending young girls and boys for labour work)]
96/218 44.0%
(37.3-50.9)
Proportion of households reporting using none of the coping strategies over the past month
0 0
* The total will be over 100% as households may use several negative coping strategies.
3 In contexts where a mix of full rations and half rations are given, only report this value for the households receiving the full ration.
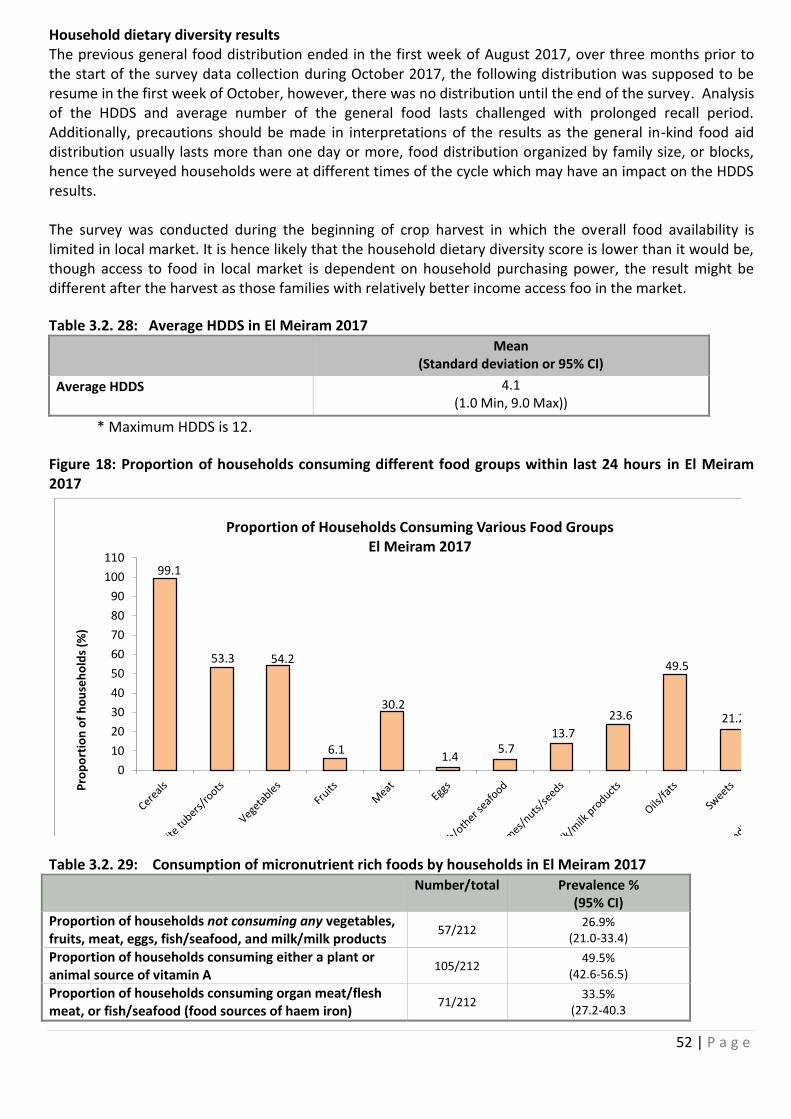
52 | P a g e
Household dietary diversity results The previous general food distribution ended in the first week of August 2017, over three months prior to the start of the survey data collection during October 2017, the following distribution was supposed to be resume in the first week of October, however, there was no distribution until the end of the survey. Analysis of the HDDS and average number of the general food lasts challenged with prolonged recall period. Additionally, precautions should be made in interpretations of the results as the general in-kind food aid distribution usually lasts more than one day or more, food distribution organized by family size, or blocks, hence the surveyed households were at different times of the cycle which may have an impact on the HDDS results. The survey was conducted during the beginning of crop harvest in which the overall food availability is limited in local market. It is hence likely that the household dietary diversity score is lower than it would be, though access to food in local market is dependent on household purchasing power, the result might be different after the harvest as those families with relatively better income access foo in the market.
Table 3.2. 28: Average HDDS in El Meiram 2017
Mean
(Standard deviation or 95% CI)
Average HDDS
4.1 (1.0 Min, 9.0 Max))
* Maximum HDDS is 12.
Figure 18: Proportion of households consuming different food groups within last 24 hours in El Meiram 2017
99.1
53.3 54.2
6.1
30.2
1.45.7
13.7
23.6
49.5
21.2
0
10
20
30
40
50
60
70
80
90
100
110
Pro
po
rtio
n o
f h
ou
seh
old
s (%
)
Proportion of Households Consuming Various Food GroupsEl Meiram 2017
Table 3.2. 29: Consumption of micronutrient rich foods by households in El Meiram 2017
Number/total Prevalence % (95% CI)
Proportion of households not consuming any vegetables, fruits, meat, eggs, fish/seafood, and milk/milk products
57/212 26.9%
(21.0-33.4)
Proportion of households consuming either a plant or animal source of vitamin A
105/212 49.5%
(42.6-56.5)
Proportion of households consuming organ meat/flesh meat, or fish/seafood (food sources of haem iron)
71/212 33.5%
(27.2-40.3
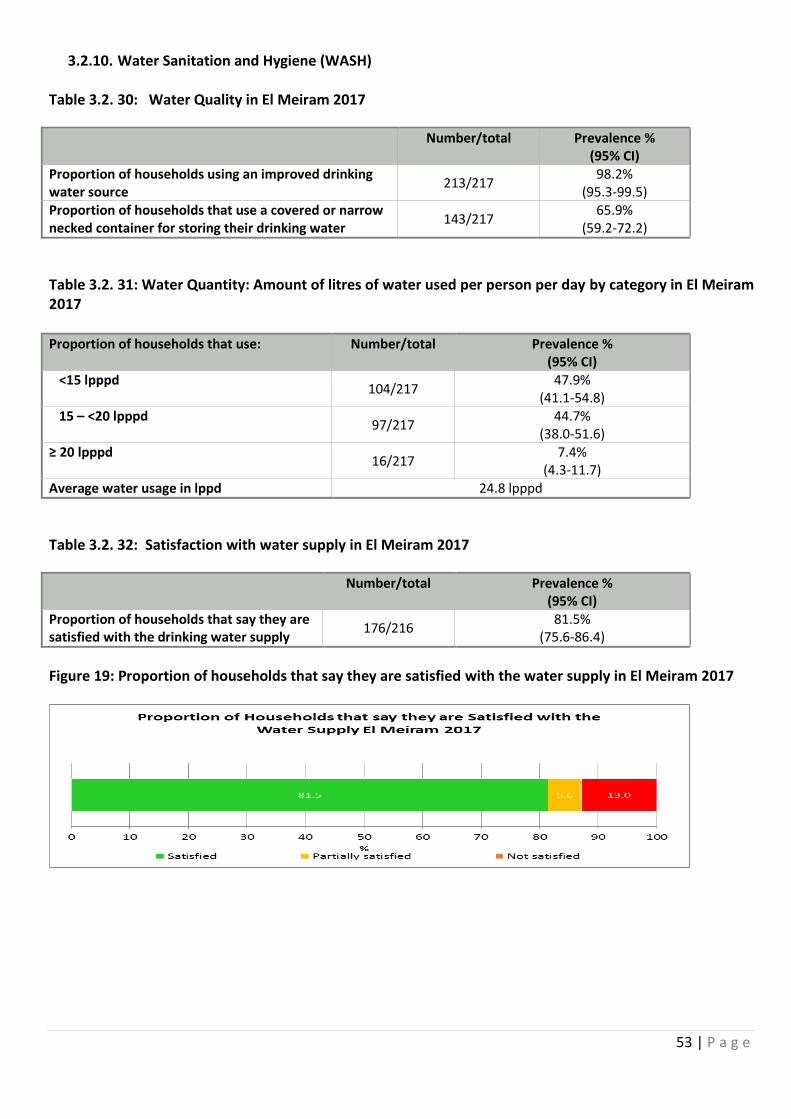
53 | P a g e
3.2.10. Water Sanitation and Hygiene (WASH) Table 3.2. 30: Water Quality in El Meiram 2017
Number/total Prevalence % (95% CI)
Proportion of households using an improved drinking water source
213/217 98.2%
(95.3-99.5) Proportion of households that use a covered or narrow necked container for storing their drinking water
143/217 65.9%
(59.2-72.2)
Table 3.2. 31: Water Quantity: Amount of litres of water used per person per day by category in El Meiram 2017 Proportion of households that use: Number/total Prevalence %
(95% CI) <15 lpppd
104/217 47.9%
(41.1-54.8) 15 – <20 lpppd
97/217 44.7%
(38.0-51.6) ≥ 20 lpppd
16/217 7.4%
(4.3-11.7) Average water usage in lppd 24.8 lpppd
Table 3.2. 32: Satisfaction with water supply in El Meiram 2017
Number/total Prevalence % (95% CI)
Proportion of households that say they are satisfied with the drinking water supply
176/216 81.5%
(75.6-86.4)
Figure 19: Proportion of households that say they are satisfied with the water supply in El Meiram 2017
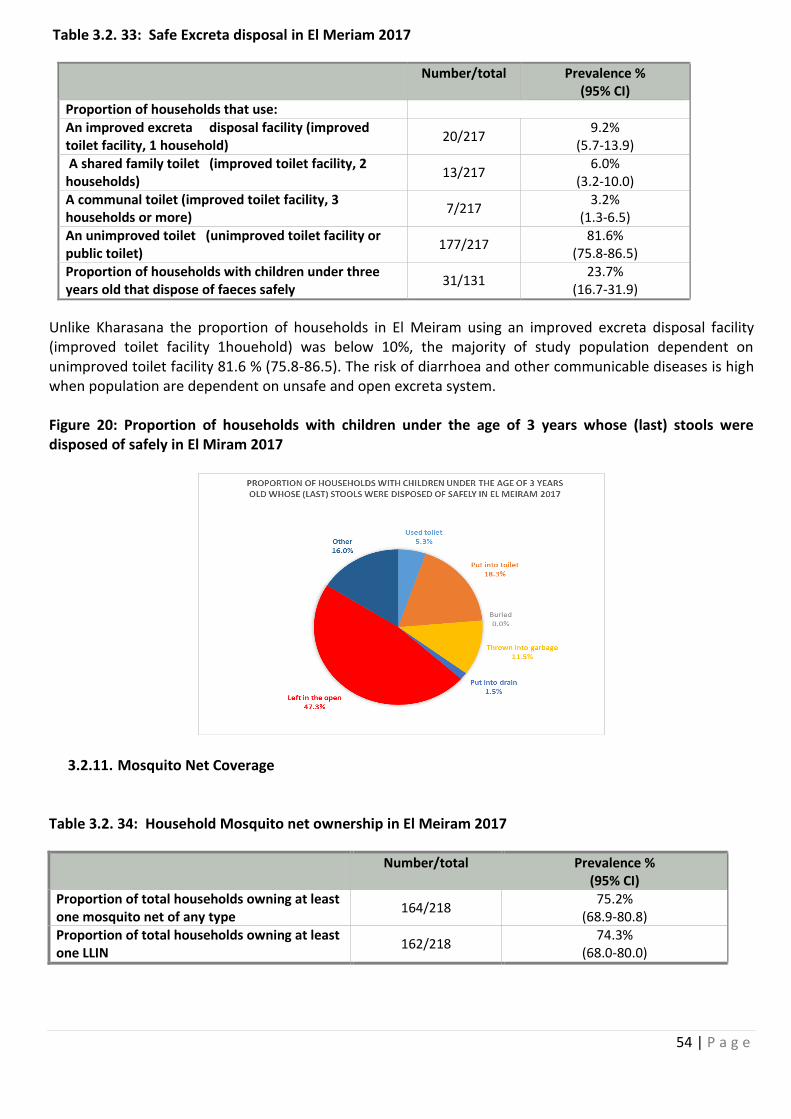
54 | P a g e
Table 3.2. 33: Safe Excreta disposal in El Meriam 2017
Number/total Prevalence % (95% CI)
Proportion of households that use: An improved excreta disposal facility (improved toilet facility, 1 household)
20/217 9.2%
(5.7-13.9) A shared family toilet (improved toilet facility, 2 households)
13/217 6.0%
(3.2-10.0) A communal toilet (improved toilet facility, 3 households or more)
7/217 3.2%
(1.3-6.5) An unimproved toilet (unimproved toilet facility or public toilet)
177/217 81.6%
(75.8-86.5) Proportion of households with children under three years old that dispose of faeces safely
31/131 23.7%
(16.7-31.9)
Unlike Kharasana the proportion of households in El Meiram using an improved excreta disposal facility (improved toilet facility 1houehold) was below 10%, the majority of study population dependent on unimproved toilet facility 81.6 % (75.8-86.5). The risk of diarrhoea and other communicable diseases is high when population are dependent on unsafe and open excreta system. Figure 20: Proportion of households with children under the age of 3 years whose (last) stools were disposed of safely in El Miram 2017
3.2.11. Mosquito Net Coverage Table 3.2. 34: Household Mosquito net ownership in El Meiram 2017
Number/total Prevalence % (95% CI)
Proportion of total households owning at least one mosquito net of any type
164/218 75.2%
(68.9-80.8) Proportion of total households owning at least one LLIN
162/218 74.3%
(68.0-80.0)
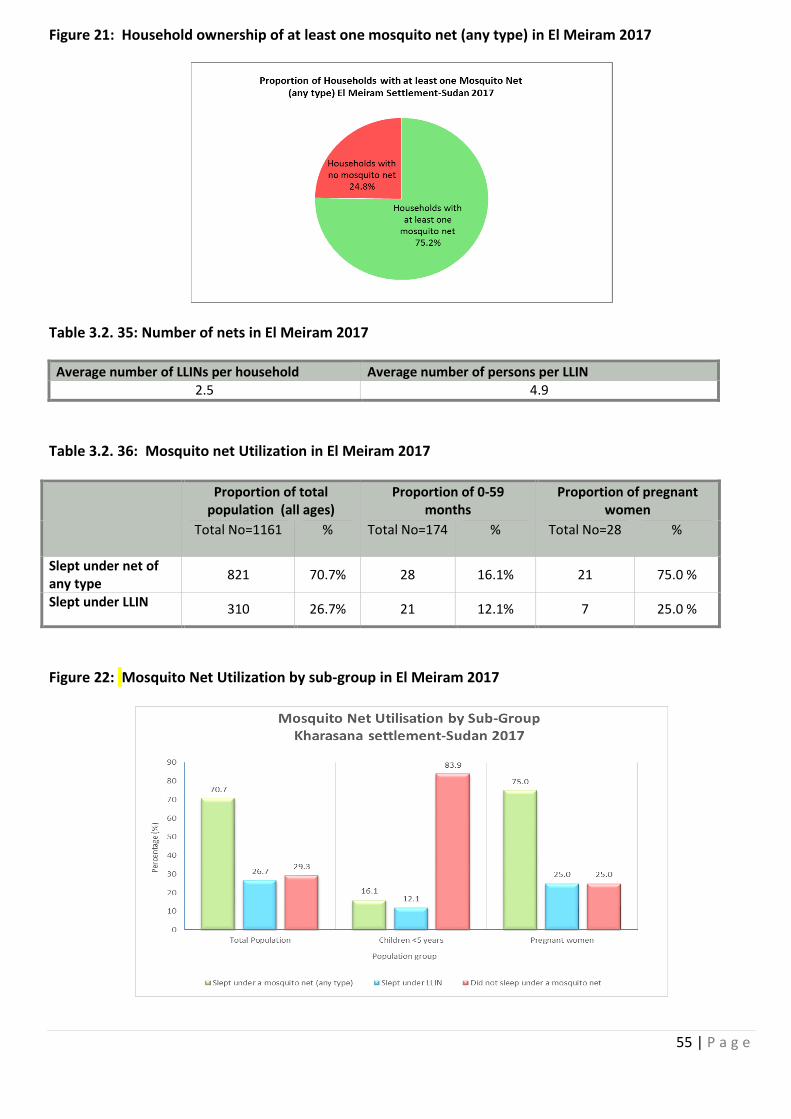
55 | P a g e
Figure 21: Household ownership of at least one mosquito net (any type) in El Meiram 2017
Table 3.2. 35: Number of nets in El Meiram 2017
Average number of LLINs per household Average number of persons per LLIN 2.5 4.9
Table 3.2. 36: Mosquito net Utilization in El Meiram 2017
Proportion of total population (all ages)
Proportion of 0-59 months
Proportion of pregnant women
Total No=1161 % Total No=174
% Total No=28
%
Slept under net of any type
821 70.7% 28 16.1% 21 75.0 %
Slept under LLIN 310 26.7% 21 12.1% 7 25.0 %
Figure 22: Mosquito Net Utilization by sub-group in El Meiram 2017
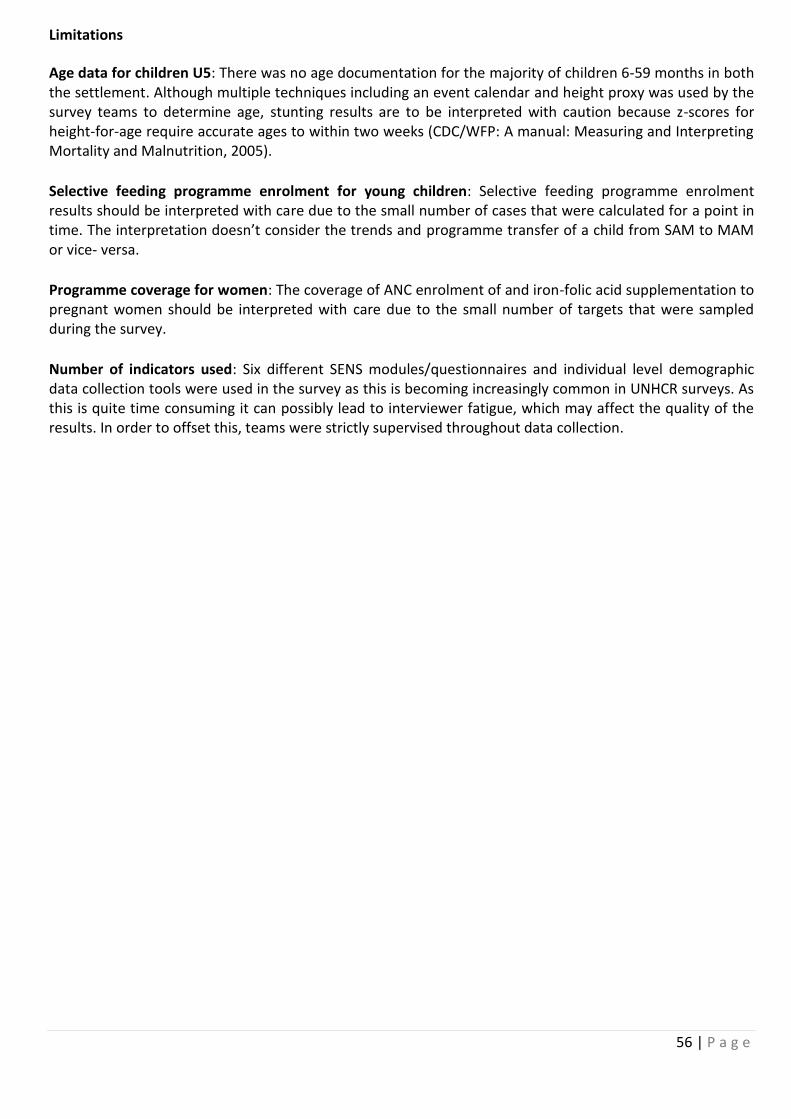
56 | P a g e
Limitations
Age data for children U5: There was no age documentation for the majority of children 6-59 months in both the settlement. Although multiple techniques including an event calendar and height proxy was used by the survey teams to determine age, stunting results are to be interpreted with caution because z-scores for height-for-age require accurate ages to within two weeks (CDC/WFP: A manual: Measuring and Interpreting Mortality and Malnutrition, 2005).
Selective feeding programme enrolment for young children: Selective feeding programme enrolment results should be interpreted with care due to the small number of cases that were calculated for a point in time. The interpretation doesn’t consider the trends and programme transfer of a child from SAM to MAM or vice- versa.
Programme coverage for women: The coverage of ANC enrolment of and iron-folic acid supplementation to pregnant women should be interpreted with care due to the small number of targets that were sampled during the survey.
Number of indicators used: Six different SENS modules/questionnaires and individual level demographic data collection tools were used in the survey as this is becoming increasingly common in UNHCR surveys. As this is quite time consuming it can possibly lead to interviewer fatigue, which may affect the quality of the results. In order to offset this, teams were strictly supervised throughout data collection.
57 | P a g e
4. Discussion
4.1 Nutritional status of young children The overall sex ratio was 1.0 in Kharasana and 1.2 in El Meiram as expected (the expected sex ratio 0.8-1.2), which means that both sexes were proportionally represented in the survey. The nutrition situation in Kharasana and El Meiram settlements was critical with high prevalence of Global Acute Malnutrition (GAM) above the 15% of emergency thresholds as per WHO classification: Kharasana 16.8 % (13.3 - 21.0) and El Meiram 19.6 % (15.9 - 23.9). The severe acute malnutrition prevalence was also higher than the target of <2.0% i.e. 4.0 % (2.4 - 6.4) in El Meiram and 2.2% (1.1-4.4) in Kharasana. The acute malnutrition prevalence varies between age categories. The prevalence of severe wasting is higher among children 6-17 months 5.6 % in Kharasana, while this ranged between 4.2-4.8% in the 6- 41 months age category in El Meiram. Conversely, stunting was acceptable in both locations: 5.3 % (3.4 - 8.2) in Kharasana and 7.9 % (5.6 - 11.1) in El Meiram. This is within acceptable limits (critical if ≥ 40% as per WHO standards).
Crude mortality and under five mortality rates were within the acceptable standard of <1 death per 10,000 persons per day and <2 deaths per 10,000 persons per day respectively: CMR 0.37 (0.17-0.80) in Kharasana and 0.30 (0.14-0.65) in El Meiram and U5MR 0.29 (0.02-4.43) in Kharasana and 0.50 (0.10-2.49) in El Meiram.
4.2 Programme coverage The programme coverage for health indicators of children who were found to be malnourished during the time of survey and their enrollment status into the ongoing MAM and SAM nutrition programme was below the expected threshold: Target of > 90 % MAM and SAM coverages for the camp settings (Sphere and UNHCR SENS indicators). The survey revealed that Supplementary Feeding Programme coverage for the treatment of MAM (based on all admission criteria WHZ and MUAC) was 7.8% (2.6-17.3) in Kharasana and 10.4% (4.3-20.3) in El Meiram. Therapeutic feeding programme coverage for the treatment of SAM was 7.1% (0.2-33.9) in Kharasana and 52.6% (28.9-75.6) in El Meiram. It is worth noting that the result obtained by using only MUAC and/or Oedema admission criteria was relatively better for the therapeutic feeding programme coverage i.e. 75.0% (34.9-96.8) in Kharasana and 83.3% (35.9-99.6) in El Meiram. However, the coverage for the supplementary programme was lower with similar MUAC admission criteria i.e. 25.0% (9.8-46.7) in Kharasana and 28.6% (11.3-52.2) in El Meiram. Such disparity on enrollment status into MAM and SAM nutrition programmes is an indication that the two programmes are not well coordinated or integrated. Nutrition program fragmentation was confirmed during the time of the survey. There were also limited partners for the implementation of MAM programme. Increased coordination and integration is recommended, aimed at harnessing synergy for improved programme quality and impact.
Programme coverage for Measles vaccination for children age 9-59 months by both card and confirmed from respondents was below the acceptable threshold (UNHCR standard coverage should be ≥ 95%). The survey result revealed 59.5% (53.9-64.8) in Kharasana and 56.9% (51.5-62.1) in El Meiram. Similar below par performance was observed on Vitamin A supplementation coverage for children aged 6-59 months during the last six months of recall period. The Vitamin A coverage by both card and confirmed from respondents was 39.3% (34.3-44.6) in Kharasana and 6.3% (4.1-9.5) in El Meiram, against the UNHCR standard coverage ≥ 90%. As these results were based on both card and recall there is also need to ensure distribution of cards when children are vaccinated. This helps in monitoring purposed as well as guaranteeing reliability. Programme coverage for pregnant women who attended Antenatal care and also received Iron- folate pills was low. In Kharasana, 54.2% (32.8-74.4 pregnant women were enrolled in ANC programme), while only 17.6% (3.8-43.4) were enrolled in ANC in El Meiram. Among the enrolled pregnant women, 29.2% (12.6-51.1) and 11.8% (3.8-43.4) received iron-folic acid pills in Kharasana and El Meiram respectively.
58 | P a g e
4.3 Anaemia in young children and women The study revealed that the Anaemia prevalence among children 6-59 months and women of reproductive age (15-49 years) was high in both El Meiram and Kharasana (Critical if ≥ 40%). The Anaemia level among children 6-59 months was higher in El Meiram than Kharasana i.e. 52.6% (47.5-57.8) in El Meiram and 38.5% (33.4-43.8) in Kharasana. Likewise, the Anaemia level amongst women of reproductive age group was higher in El Meiram than Kharasana, i.e. 48.8% (40.8-56.8) in El Meiram and 43.5% (34.7-52.7) in Kharasana.
Amongst the common causes of Anaemia include: parasitic infestation, disease infections, low intake of iron rich food due to poor dietary practices, inadequate absorption due to presence of inhibitors in food such as tannins and phytates, and low intake of Vitamin C. Improved absorption of non-heam iron enhanced with the consumption of Vitamin C rich fruits and vegetables Consumption of iron-rich or iron-fortified foods was 33.6% (25.5-42.5) in Kharasana and 37.1% (29.1-45.7) in Kharasana. According to food security results the proportion of households consuming vegetables and fruits was low: those who consumed vegetables 24.5% in Kharasana and 54.2 % in El Meiram and those consuming fruits 5.7% in Kharasana and 6.1% in El Meiram respectively. Proportion of households consuming organ meat/flesh meat, or fish/seafood (food sources of haem iron): 23.9% (17.5-31.3) in Kharasana and 33.5% (27.2-40.3) in El Meiram.
4.4 IYCF indicators
This survey revealed the following findings on IYCF: Timely initiation of breastfeeding (0-23 months) 52.3% (44.6-60.0) in Kharasana and 49.2% (41.8-56.6) in El Meiram; and Exclusive breastfeeding under 6 months 60.5% (43.4-76.0) in Kharasana and 65.1% (49.1-79.0) in El Meiram. The results for these two indicators in both El Meiram and Kharasana showed lower rates for breast feeding. Babies who are breastfed are generally healthier and achieve optimal growth and development. Breastfeeding also reduces infant morbidity and mortality from diarrhoea and associated diseases. Continued breastfeeding at the age of 1 year (12-15 months) is relatively better: 75.9% (56.5-89.7) in Kharasana and 73.3% (54.1-87.7) in El Meiram. Introduction of solid or semi-solid or soft foods for infants (6-8 months) was lower: 33.3% (16.5-54.0) in Kharasana and 51.9% (31.9-71.3) in El Meiram. Exclusive breast feeding believed to be inadequate after six months of age and infants should be complemented with appropriate mushy, semi-solid and solid food timely to support linear growth and development during the first two years of child and onwards.
4.5 Food security
General food assistance is the principal source of household food security for the entire refugee community in Kharasana and El Meiram. The existing process of inclusion of new refugees in the food ration distribution list takes a long time and the distribution system also does not provide room for flexibility to consider refugees at the first level registration. As a result, many of newly arriving refugees do not access food, and are therefore, dependent on socio-support networks. The proportion of households with a ration card during the time of survey was 94.3% (89.5-97.4) in Kharasana and 61.5% (54.7-68.0) in El Meiram. The general food assistance for refugee operations aims at providing food on a monthly-basis (most desirable situation). However, due to operational and access challenges the two locations experienced irregularities and interruptions of food distribution. By the time of the survey, the schedule for the next distribution had already delayed by one month. As per the donors’ regulations and relief assistance protocols, retroactive food distribution is not provided to beneficiaries, as such refugees had already missed the expected food ration for the month of October 2017. The average duration (%) in relation to the theoretical period which food ration lasts (Standard deviation or 95% CI) was 25.5 days in Kharasana and 26.7 days in El Meiram. Among other options, negative coping strategies included engaging in potentially risky activities as well as reduction of daily meal in terms of quantity and quality. This is considered as an area of concern. All coping
59 | P a g e
mechanisms were used by the surveyed population over the past month in both locations. Some families used single or multiple coping strategies. Engagement in potentially risky or harmful activities (cutting live trees and sell, local alcohol making, sending young girls and boys for manual labour) was at 28.9% (22.0-36.6) in Kharasana and 44.0% (37.3-50.9) in El Meiram. Borrowed cash, food or other items with or without interest was at 30.8% (23.7-38.6) in Kharasana and 25.3% (19.7-31.7) in El Meiram. Reduced the quantity and/or frequency of meals was at 52.2% (44.1-60.2) in Kharasana and 28.4% (22.6-34.9) in El Meiram. Begging was at 16.4% (11.0-23.0) in Kharasana and 17.4% (12.6-23.1) in El Meiram.
4.6 WASH
With respect to water supply in both settlements, the study revealed that people access water from safe sources i.e. 98.7% (95.4-99.8) in Kharasana and 98.2% (95.3-99.5) in El Meiram. Regarding the sanitation situation, the study found out that El Meiram is in a very poor state whereby 81.6% (75.8-86.5) population use unsafe method of excreta disposal while nearly of half of the population in Kharasana also uses similar method 49.4% (41.3-57.5). The survey also revealed that the pproportion of households with children under three years old that dispose of faeces safely was 23.7% (16.7-31.9) in El Meiram and 52.8% (42.9-62.6) in Kharasana. The exposure to diarrhoeal disease is primarily associated with poor hygiene and sanitation practices of the community. It is worth noting that high diarrheal prevalence is directly correlated to the high level of malnutrition.
4.7 Mosquito net coverage
The proportion of households owning at least one LLIN was 50.3% (42.3-58.3) in Kharasana and 74.3% (68.0-80.0) in El Meiram. This is below UNHCR’s target >80%. Household ownership of net of any type was 67.3% (59.4-74.5) in Kharasana and 75.2% (68.9-80.8) in El Meiram. The proportion of total population (all ages) that slept under a net of any type was 48.3% in Kharasana and 70.7% in El Meiram. The proportion of 0-59 months that slept under nets of any type was 52.7% in Kharasana and 16.1% in El Meiram. The proportion of pregnant women slept under a net of any type was 62.8% in Kharasana and 75.0 % in El Meiram. According to health facility information from Kharasana and El Meiram settlements, Malaria is one of the leading causes of morbidity. Lack of adequate mosquito net coverage contributes towards epidemics, and directly impacts of the overall health condition of the population.
4.8 Mortality The retrospective mortality rates for the previous three months were as follows: Crude mortality rate 0.37 (0.17-0.80 95% CI) in Kharasana and 0.30 (0.14-0.65 95% CI) in El Meiram, and under five mortality rate 0.29 (0.02-4.43 95% CI) in Kharasana and 0.50 (0.10-2.49 95% CI) in El Meiram. The overall results indicate that the mortality rate in both locations is within acceptable emergency limits <1/10,000/day for CMR and <2/10,000/day for U5MR.
5. Conclusions
The prevalence of global acute malnutrition among children aged 6-59 months in Kharasana and El Meiram settlements indicates a critical situation with high Global Acute Malnutrition (GAM) prevalence above the emergency thresholds as per WHO classification , and with Severe Acute Malnutrition (SAM) prevalence being above 2% of critical (UNHCR standard). Prevalence of Anaemia among children 6-59 months and women of reproductive age (15-49 years) is either close to or above 40% of public health significance in respective settlements. The prevalence of diarrhoea in the last two weeks of survey was above 20% among children 6-59 months, which is rated as the highest in the two locations when compared to health facility clinical records. The duration and length of food assistance was below the expected. Only few families were meeting the principal length of time until the next schedule of distribution. About 40% of household had no
60 | P a g e
ration card, and in such a situation refugees share the available resources and this affects the food security status of families. Refugees are mainly dependent on the general food ration with no or little access to additional sources of food/income. Any interruption or irregularity of food assistance contributes towards nutritional deterioration. As a result the likelihood of people engaging in risky coping strategies will be high, in order to cope with such food insecurity situation. Programme coverage for various interventions is far below the expected standards. The enrollment status of children identified as moderately and severely acute malnutrition is below 90% of the UNHCR/Sphere minimum standards for camp settings. Immunization coverage for measles vaccination among children 9-59 months and vitamin A supplementations for children 6-59 months were by far below the UNHCR/the Sudan MOH survey guideline standard 95% and 90% respectively. Hence, nutritional deterioration is mostly expected in such situations. Over-all, the ultimate cause of high levels of malnutrition among the refugees in Kharasana and El Meiram is associated with multiple factors including but not limited to: poor dietary intake, poor infant and young children feeding and caring practices, living in unhealthy conditions and high levels of diarrhoea, limited food and nutritional support and low level of related service delivery. Therefore, the response mechanisms require strengthening of the multi-organizational and multi-sectoral interventions to address the challenging situation.
6. Recommendations
Nutrition related
High prevalence of acute malnutrition requires an integrated and holistic approach strengthening both the preventive and curative aspects of nutrition interventions. (UNICEF, UNHCR, WFP and MOH to agree and provide clear guidance for nutrition partners)
Community Management of Acute Malnutrition (CMAM) should consider and scale up the MAM coverage, routine MUAC screening, IYCF and health services and enhance linkages between programmes vis-à-vis quality of service delivery and information management for the timely detections of malnutrition and actions. (All nutrition partners, UNICEF, UNHCR, WFP and MOH to ensure and support the implementation)
Devise a mechanism to introduce micronutrient supplementation as an anaemia reduction strategy and reverse the high prevalence rate to acceptable situation. Additionally, health partners should undertake deworming campaigns as complementary action to reduce the Anaemia and malnutrition level among children 6-59 months. (WFP, UNHCR, UNICEF and WHO to coordinate and support nutrition and health projects implementing partners for implementation of recommendation).
High prevalence of acute malnutrition and levels of Anaemia justifies the need for nutritional supplementation which provides energy and micronutrient needs of the most vulnerable groups. Continuation and strengthening of Blanket Supplementary Feeding Programme (BSFP) for all children 6-59 months and all Pregnant and Lactating Women (PLW). Blanket Supplementary Feeding Programme (BSFP) is already implemented in the two settlements, however, strengthening of the programme, timely targeting and delivery of resources with clear a set of outreach activities needed to ensure coverage and compliance, mothers/care-taker counselling and sensitization. (WFP to consider allocations of resources and all nutrition partners to support targeting and timely liaise with WFP for the implementations of Supplementary feeding programme).
61 | P a g e
Food related
UNHCR and COR to discuss and agree with WFP so that new arrivals allowed to access food based on level 1 Registration, and in the meantime establish a mechanism for continuous registration and issuance of ration cards on a timely basis to avoid increased backlog and minimize suffering of refugees from food shortage.
The principal sources of food for refugees is general food assistance, WFP to continue the 100% assistance general food ration in all settlements
UNHCR, WFP and livelihood/food security partners to scale up the food security and livelihood programs options and initiatives for the refugees to improve the economic status and enhance purchasing power so as to create access to food from the local market.
Health related
UNICF, MOH and Health partners to develop a strategy to ensure periodic vitamin A supplementation for (children 6-59 months) campaign for refugees and host population, at least two times in the year. Apart from campaigns, there should be a clear linkages among ANC, PNC, Nutrition and EPI program in the facilities and regularize interventions.
WSH Related
To promote best hygiene practices, hygiene promoters trained in some SSR location and host community need to continue encouraging proper use and maintenance of sanitation facilities. Focus has been on the implementation of WASH activities such as rehabilitation, construction of latrines and distribution of hygiene tools and materials. (UNHCR, UNICEF and WASH partners)
Program coverage
Nutrition and health partners to periodically conduct an integrated joint review of all programmes and their progress towards achieving standards and maximize service delivery coverage for the target groups. (UNHCR, UNICEF, WFP and WHO to facilitate joint mission with partners)
Refugees Awareness on service and utilization
Community outreach agents in all settlements should strengthen and expand awareness campaigns, regularizing this in the programming in order to improve access to facility and community-based services. (UNHCR, WFP, UNICEF and WHO to support partners in the areas of outreach interventions).
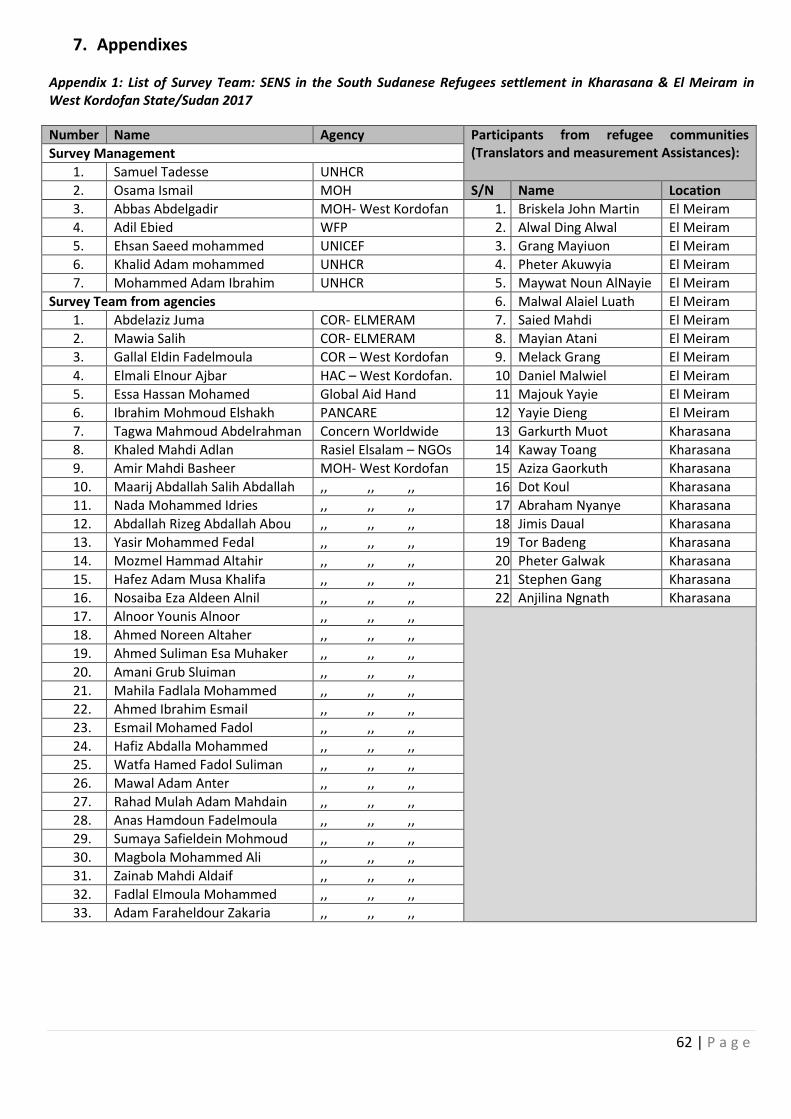
62 | P a g e
7. Appendixes Appendix 1: List of Survey Team: SENS in the South Sudanese Refugees settlement in Kharasana & El Meiram in West Kordofan State/Sudan 2017
Number Name Agency Participants from refugee communities (Translators and measurement Assistances): Survey Management
1. Samuel Tadesse UNHCR
2. Osama Ismail MOH S/N Name Location
3. Abbas Abdelgadir MOH- West Kordofan 1. Briskela John Martin El Meiram
4. Adil Ebied WFP 2. Alwal Ding Alwal El Meiram
5. Ehsan Saeed mohammed UNICEF 3. Grang Mayiuon El Meiram
6. Khalid Adam mohammed UNHCR 4. Pheter Akuwyia El Meiram
7. Mohammed Adam Ibrahim UNHCR 5. Maywat Noun AlNayie El Meiram
Survey Team from agencies 6. Malwal Alaiel Luath El Meiram
1. Abdelaziz Juma COR- ELMERAM 7. Saied Mahdi El Meiram
2. Mawia Salih COR- ELMERAM 8. Mayian Atani El Meiram
3. Gallal Eldin Fadelmoula COR – West Kordofan 9. Melack Grang El Meiram
4. Elmali Elnour Ajbar HAC – West Kordofan. 10. Daniel Malwiel El Meiram
5. Essa Hassan Mohamed Global Aid Hand 11. Majouk Yayie El Meiram
6. Ibrahim Mohmoud Elshakh PANCARE 12. Yayie Dieng El Meiram
7. Tagwa Mahmoud Abdelrahman Concern Worldwide 13. Garkurth Muot Kharasana
8. Khaled Mahdi Adlan Rasiel Elsalam – NGOs 14. Kaway Toang Kharasana
9. Amir Mahdi Basheer MOH- West Kordofan 15. Aziza Gaorkuth Kharasana
10. Maarij Abdallah Salih Abdallah ,, ,, ,, 16. Dot Koul Kharasana
11. Nada Mohammed Idries ,, ,, ,, 17. Abraham Nyanye Kharasana
12. Abdallah Rizeg Abdallah Abou ,, ,, ,, 18. Jimis Daual Kharasana
13. Yasir Mohammed Fedal ,, ,, ,, 19. Tor Badeng Kharasana
14. Mozmel Hammad Altahir ,, ,, ,, 20. Pheter Galwak Kharasana
15. Hafez Adam Musa Khalifa ,, ,, ,, 21. Stephen Gang Kharasana
16. Nosaiba Eza Aldeen Alnil ,, ,, ,, 22. Anjilina Ngnath Kharasana
17. Alnoor Younis Alnoor ,, ,, ,,
18. Ahmed Noreen Altaher ,, ,, ,,
19. Ahmed Suliman Esa Muhaker ,, ,, ,,
20. Amani Grub Sluiman ,, ,, ,,
21. Mahila Fadlala Mohammed ,, ,, ,,
22. Ahmed Ibrahim Esmail ,, ,, ,,
23. Esmail Mohamed Fadol ,, ,, ,,
24. Hafiz Abdalla Mohammed ,, ,, ,,
25. Watfa Hamed Fadol Suliman ,, ,, ,,
26. Mawal Adam Anter ,, ,, ,,
27. Rahad Mulah Adam Mahdain ,, ,, ,,
28. Anas Hamdoun Fadelmoula ,, ,, ,,
29. Sumaya Safieldein Mohmoud ,, ,, ,,
30. Magbola Mohammed Ali ,, ,, ,,
31. Zainab Mahdi Aldaif ,, ,, ,,
32. Fadlal Elmoula Mohammed ,, ,, ,,
33. Adam Faraheldour Zakaria ,, ,, ,,
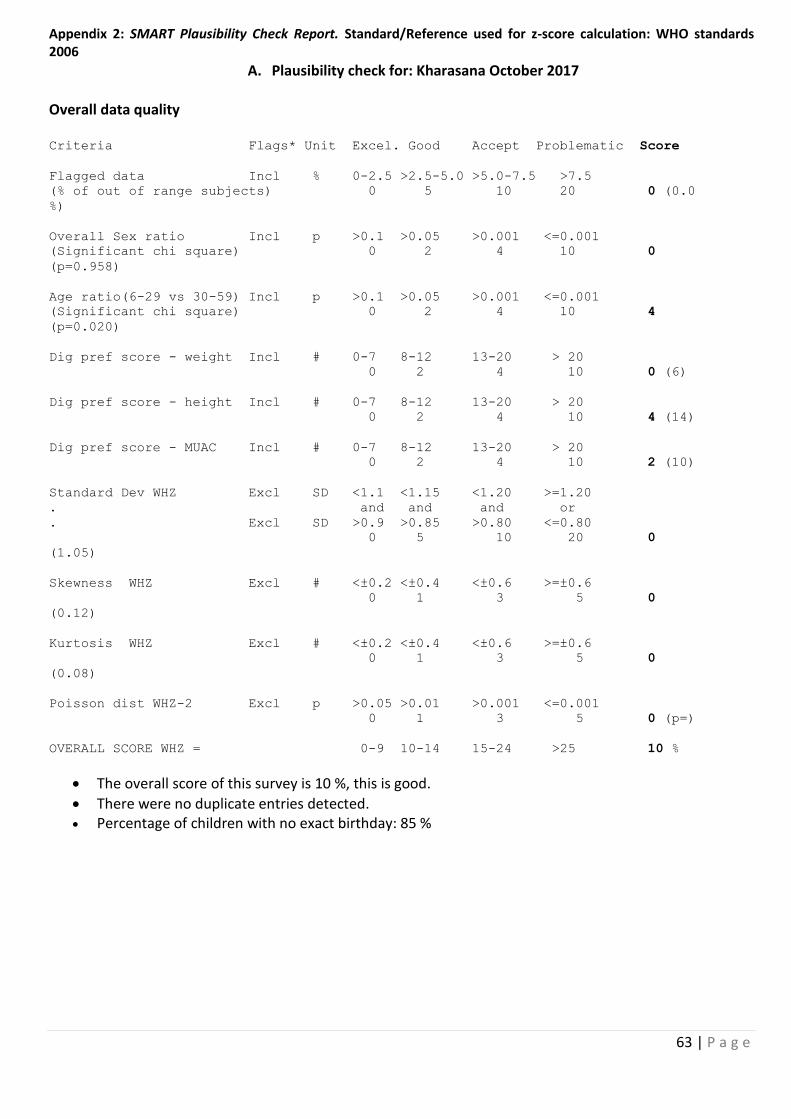
63 | P a g e
Appendix 2: SMART Plausibility Check Report. Standard/Reference used for z-score calculation: WHO standards 2006
A. Plausibility check for: Kharasana October 2017 Overall data quality Criteria Flags* Unit Excel. Good Accept Problematic Score
Flagged data Incl % 0-2.5 >2.5-5.0 >5.0-7.5 >7.5
(% of out of range subjects) 0 5 10 20 0 (0.0
%)
Overall Sex ratio Incl p >0.1 >0.05 >0.001 <=0.001
(Significant chi square) 0 2 4 10 0
(p=0.958)
Age ratio(6-29 vs 30-59) Incl p >0.1 >0.05 >0.001 <=0.001
(Significant chi square) 0 2 4 10 4
(p=0.020)
Dig pref score - weight Incl # 0-7 8-12 13-20 > 20
0 2 4 10 0 (6)
Dig pref score - height Incl # 0-7 8-12 13-20 > 20
0 2 4 10 4 (14)
Dig pref score - MUAC Incl # 0-7 8-12 13-20 > 20
0 2 4 10 2 (10)
Standard Dev WHZ Excl SD <1.1 <1.15 <1.20 >=1.20
. and and and or
. Excl SD >0.9 >0.85 >0.80 <=0.80
0 5 10 20 0
(1.05)
Skewness WHZ Excl # <±0.2 <±0.4 <±0.6 >=±0.6
0 1 3 5 0
(0.12)
Kurtosis WHZ Excl # <±0.2 <±0.4 <±0.6 >=±0.6
0 1 3 5 0
(0.08)
Poisson dist WHZ-2 Excl p >0.05 >0.01 >0.001 <=0.001
0 1 3 5 0 (p=)
OVERALL SCORE WHZ = 0-9 10-14 15-24 >25 10 %
The overall score of this survey is 10 %, this is good.
There were no duplicate entries detected. Percentage of children with no exact birthday: 85 %
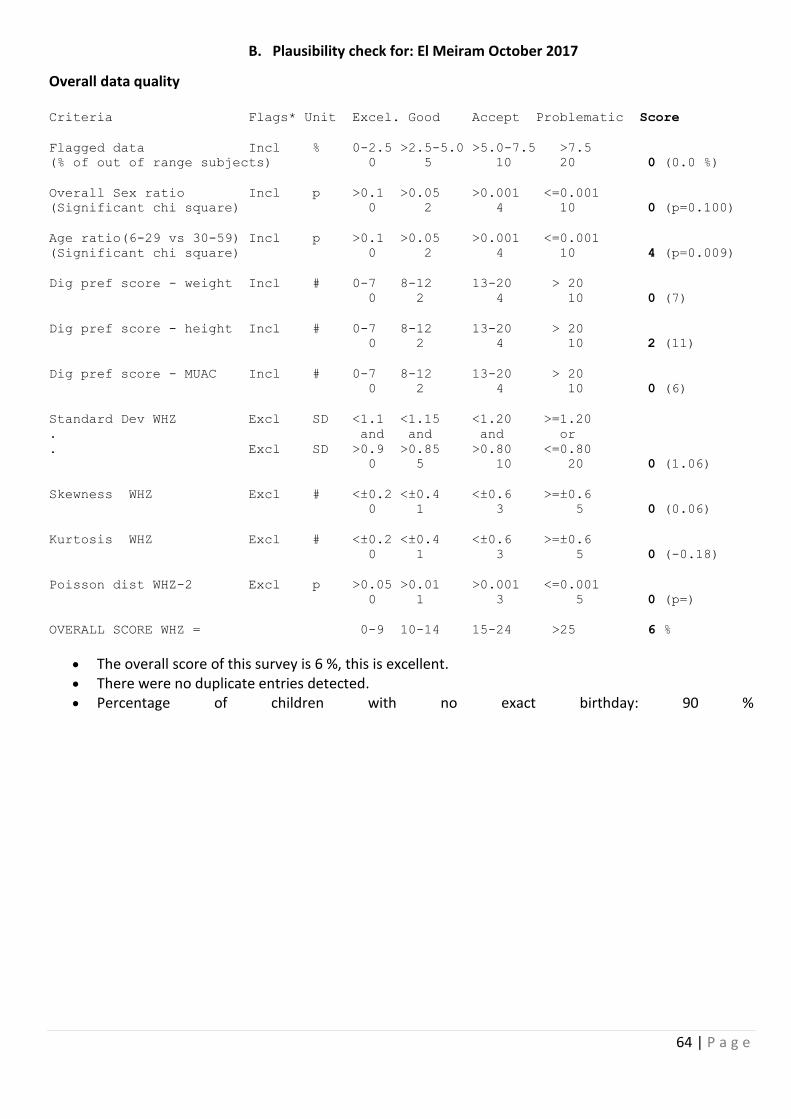
64 | P a g e
B. Plausibility check for: El Meiram October 2017
Overall data quality Criteria Flags* Unit Excel. Good Accept Problematic Score
Flagged data Incl % 0-2.5 >2.5-5.0 >5.0-7.5 >7.5
(% of out of range subjects) 0 5 10 20 0 (0.0 %)
Overall Sex ratio Incl p >0.1 >0.05 >0.001 <=0.001
(Significant chi square) 0 2 4 10 0 (p=0.100)
Age ratio(6-29 vs 30-59) Incl p >0.1 >0.05 >0.001 <=0.001
(Significant chi square) 0 2 4 10 4 (p=0.009)
Dig pref score - weight Incl # 0-7 8-12 13-20 > 20
0 2 4 10 0 (7)
Dig pref score - height Incl # 0-7 8-12 13-20 > 20
0 2 4 10 2 (11)
Dig pref score - MUAC Incl # 0-7 8-12 13-20 > 20
0 2 4 10 0 (6)
Standard Dev WHZ Excl SD <1.1 <1.15 <1.20 >=1.20
. and and and or
. Excl SD >0.9 >0.85 >0.80 <=0.80
0 5 10 20 0 (1.06)
Skewness WHZ Excl # <±0.2 <±0.4 <±0.6 >=±0.6
0 1 3 5 0 (0.06)
Kurtosis WHZ Excl # <±0.2 <±0.4 <±0.6 >=±0.6
0 1 3 5 0 (-0.18)
Poisson dist WHZ-2 Excl p >0.05 >0.01 >0.001 <=0.001
0 1 3 5 0 (p=)
OVERALL SCORE WHZ = 0-9 10-14 15-24 >25 6 %
The overall score of this survey is 6 %, this is excellent. There were no duplicate entries detected. Percentage of children with no exact birthday: 90 %
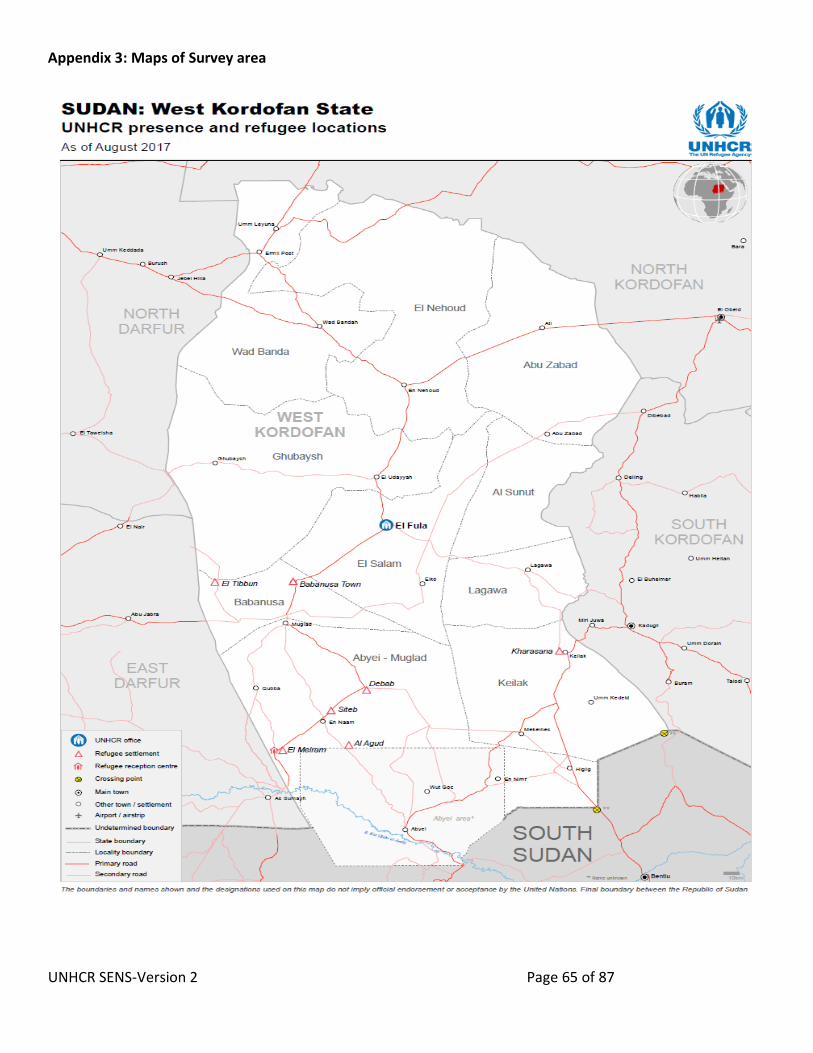
UNHCR SENS-Version 2 Page 65 of 87
Appendix 3: Maps of Survey area
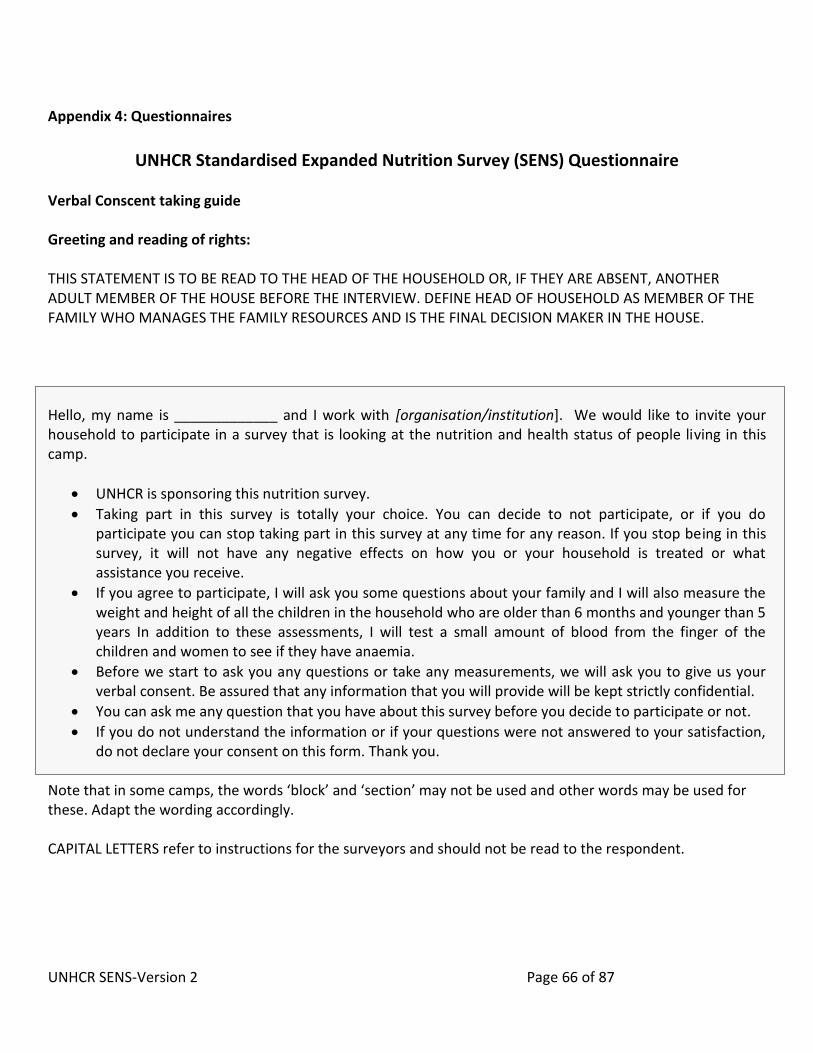
UNHCR SENS-Version 2 Page 66 of 87
Appendix 4: Questionnaires
UNHCR Standardised Expanded Nutrition Survey (SENS) Questionnaire
Verbal Conscent taking guide Greeting and reading of rights: THIS STATEMENT IS TO BE READ TO THE HEAD OF THE HOUSEHOLD OR, IF THEY ARE ABSENT, ANOTHER ADULT MEMBER OF THE HOUSE BEFORE THE INTERVIEW. DEFINE HEAD OF HOUSEHOLD AS MEMBER OF THE FAMILY WHO MANAGES THE FAMILY RESOURCES AND IS THE FINAL DECISION MAKER IN THE HOUSE. Hello, my name is _____________ and I work with [organisation/institution]. We would like to invite your household to participate in a survey that is looking at the nutrition and health status of people living in this camp.
UNHCR is sponsoring this nutrition survey.
Taking part in this survey is totally your choice. You can decide to not participate, or if you do participate you can stop taking part in this survey at any time for any reason. If you stop being in this survey, it will not have any negative effects on how you or your household is treated or what assistance you receive.
If you agree to participate, I will ask you some questions about your family and I will also measure the weight and height of all the children in the household who are older than 6 months and younger than 5 years In addition to these assessments, I will test a small amount of blood from the finger of the children and women to see if they have anaemia.
Before we start to ask you any questions or take any measurements, we will ask you to give us your verbal consent. Be assured that any information that you will provide will be kept strictly confidential.
You can ask me any question that you have about this survey before you decide to participate or not.
If you do not understand the information or if your questions were not answered to your satisfaction, do not declare your consent on this form. Thank you.
Note that in some camps, the words ‘block’ and ‘section’ may not be used and other words may be used for these. Adapt the wording accordingly. CAPITAL LETTERS refer to instructions for the surveyors and should not be read to the respondent.
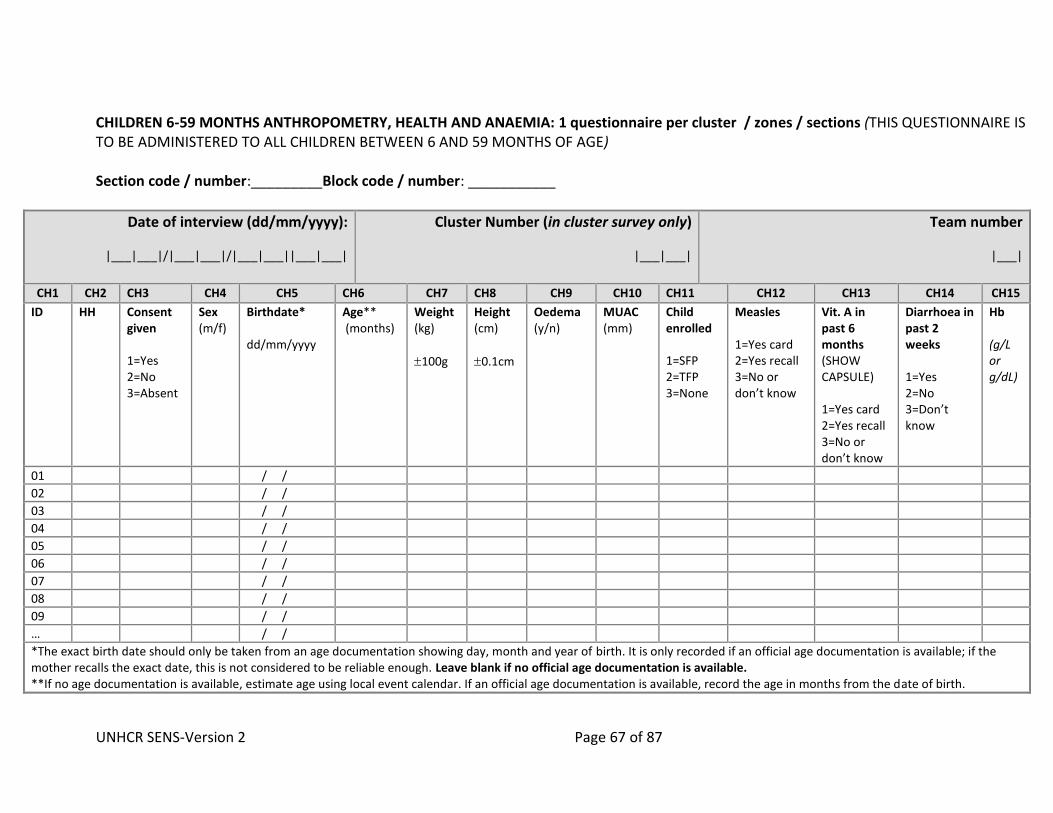
UNHCR SENS-Version 2 Page 67 of 87
CHILDREN 6-59 MONTHS ANTHROPOMETRY, HEALTH AND ANAEMIA: 1 questionnaire per cluster / zones / sections (THIS QUESTIONNAIRE IS TO BE ADMINISTERED TO ALL CHILDREN BETWEEN 6 AND 59 MONTHS OF AGE) Section code / number:_________Block code / number: ___________
Date of interview (dd/mm/yyyy):
|___|___|/|___|___|/|___|___||___|___|
Cluster Number (in cluster survey only)
|___|___|
Team number
|___|
CH1 CH2 CH3 CH4 CH5 CH6 CH7 CH8 CH9 CH10 CH11 CH12 CH13 CH14 CH15
ID HH Consent given 1=Yes 2=No 3=Absent
Sex (m/f)
Birthdate* dd/mm/yyyy
Age** (months)
Weight (kg)
100g
Height (cm)
0.1cm
Oedema (y/n)
MUAC (mm)
Child enrolled 1=SFP 2=TFP 3=None
Measles 1=Yes card 2=Yes recall 3=No or don’t know
Vit. A in past 6 months (SHOW CAPSULE) 1=Yes card 2=Yes recall 3=No or don’t know
Diarrhoea in past 2 weeks 1=Yes 2=No 3=Don’t know
Hb (g/L or g/dL)
01 / /
02 / /
03 / /
04 / /
05 / /
06 / /
07 / /
08 / /
09 / /
… / /
*The exact birth date should only be taken from an age documentation showing day, month and year of birth. It is only recorded if an official age documentation is available; if the mother recalls the exact date, this is not considered to be reliable enough. Leave blank if no official age documentation is available. **If no age documentation is available, estimate age using local event calendar. If an official age documentation is available, record the age in months from the date of birth.
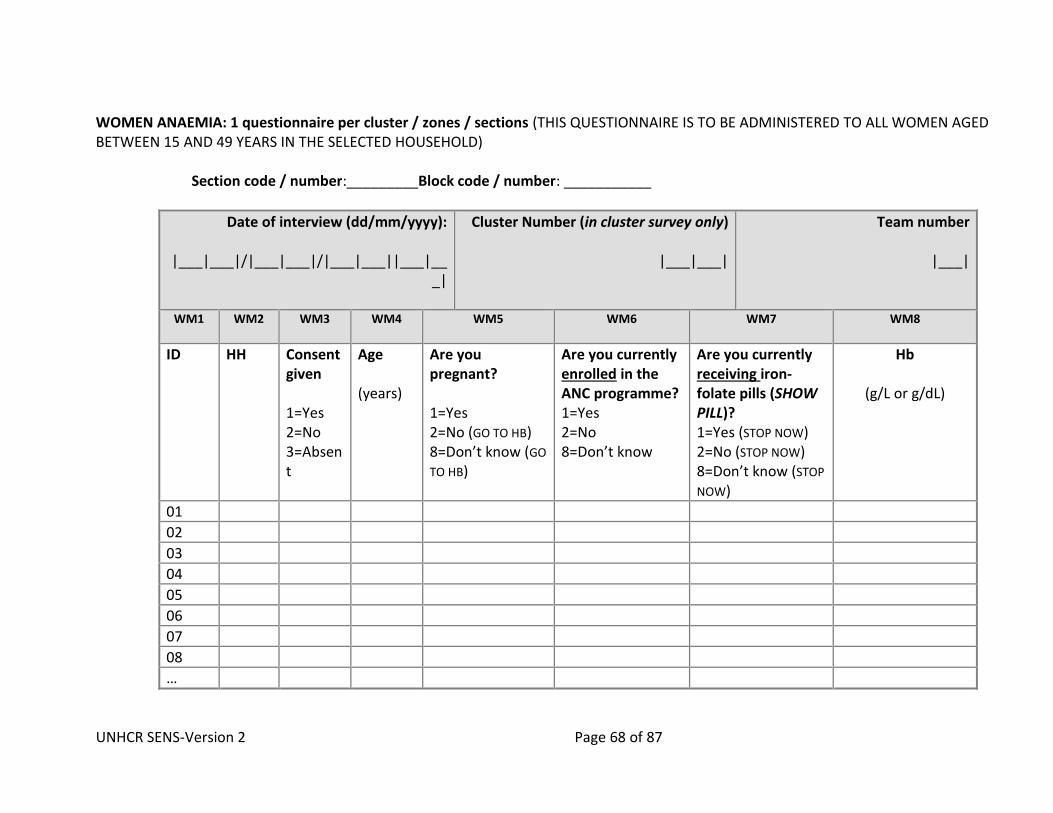
UNHCR SENS-Version 2 Page 68 of 87
WOMEN ANAEMIA: 1 questionnaire per cluster / zones / sections (THIS QUESTIONNAIRE IS TO BE ADMINISTERED TO ALL WOMEN AGED BETWEEN 15 AND 49 YEARS IN THE SELECTED HOUSEHOLD)
Section code / number:_________Block code / number: ___________
Date of interview (dd/mm/yyyy):
|___|___|/|___|___|/|___|___||___|___|
Cluster Number (in cluster survey only)
|___|___|
Team number
|___|
WM1 WM2 WM3 WM4 WM5 WM6
WM7
WM8
ID
HH Consent given 1=Yes 2=No 3=Absent
Age (years)
Are you pregnant? 1=Yes 2=No (GO TO HB) 8=Don’t know (GO
TO HB)
Are you currently enrolled in the ANC programme? 1=Yes 2=No 8=Don’t know
Are you currently receiving iron-folate pills (SHOW PILL)? 1=Yes (STOP NOW) 2=No (STOP NOW) 8=Don’t know (STOP
NOW)
Hb
(g/L or g/dL)
01
02
03
04
05
06
07
08
…
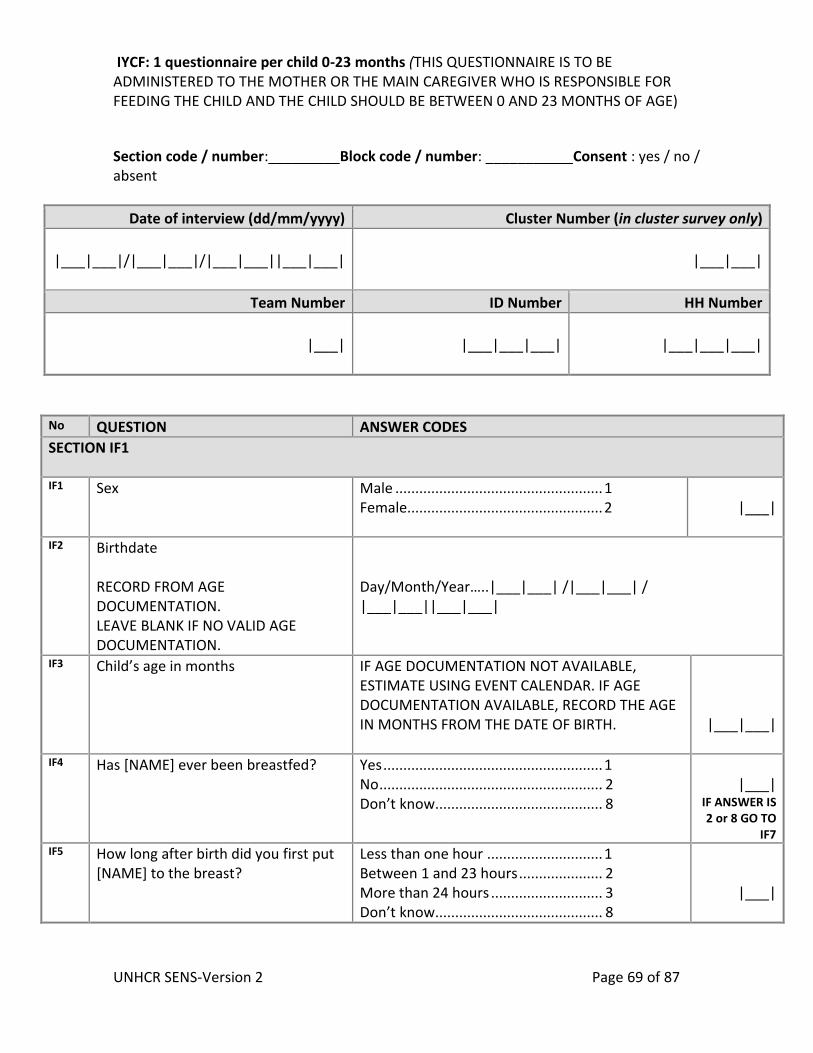
UNHCR SENS-Version 2 Page 69 of 87
IYCF: 1 questionnaire per child 0-23 months (THIS QUESTIONNAIRE IS TO BE ADMINISTERED TO THE MOTHER OR THE MAIN CAREGIVER WHO IS RESPONSIBLE FOR FEEDING THE CHILD AND THE CHILD SHOULD BE BETWEEN 0 AND 23 MONTHS OF AGE)
Section code / number:_________Block code / number: ___________Consent : yes / no / absent
Date of interview (dd/mm/yyyy) Cluster Number (in cluster survey only)
|___|___|/|___|___|/|___|___||___|___|
|___|___|
Team Number ID Number HH Number
|___|
|___|___|___|
|___|___|___|
No QUESTION ANSWER CODES
SECTION IF1 IF1 Sex
Male .................................................... 1 Female................................................. 2
|___|
IF2 Birthdate
RECORD FROM AGE DOCUMENTATION. LEAVE BLANK IF NO VALID AGE DOCUMENTATION.
Day/Month/Year…..|___|___| /|___|___| / |___|___||___|___|
IF3 Child’s age in months
IF AGE DOCUMENTATION NOT AVAILABLE, ESTIMATE USING EVENT CALENDAR. IF AGE DOCUMENTATION AVAILABLE, RECORD THE AGE IN MONTHS FROM THE DATE OF BIRTH.
|___|___|
IF4 Has [NAME] ever been breastfed?
Yes ....................................................... 1 No ........................................................ 2 Don’t know .......................................... 8
|___|
IF ANSWER IS 2 or 8 GO TO
IF7 IF5 How long after birth did you first put
[NAME] to the breast?
Less than one hour ............................. 1 Between 1 and 23 hours ..................... 2 More than 24 hours ............................ 3 Don’t know .......................................... 8
|___|
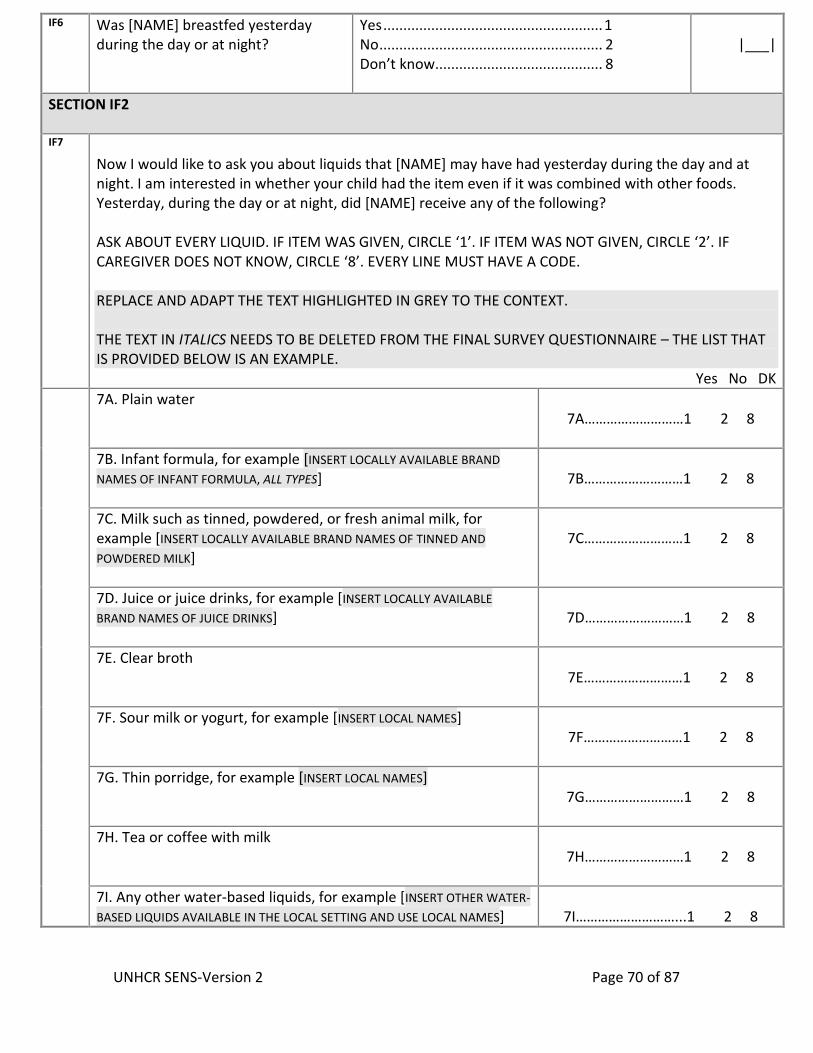
UNHCR SENS-Version 2 Page 70 of 87
IF6 Was [NAME] breastfed yesterday during the day or at night?
Yes ....................................................... 1 No ........................................................ 2 Don’t know .......................................... 8
|___|
SECTION IF2 IF7
Now I would like to ask you about liquids that [NAME] may have had yesterday during the day and at night. I am interested in whether your child had the item even if it was combined with other foods. Yesterday, during the day or at night, did [NAME] receive any of the following? ASK ABOUT EVERY LIQUID. IF ITEM WAS GIVEN, CIRCLE ‘1’. IF ITEM WAS NOT GIVEN, CIRCLE ‘2’. IF CAREGIVER DOES NOT KNOW, CIRCLE ‘8’. EVERY LINE MUST HAVE A CODE. REPLACE AND ADAPT THE TEXT HIGHLIGHTED IN GREY TO THE CONTEXT. THE TEXT IN ITALICS NEEDS TO BE DELETED FROM THE FINAL SURVEY QUESTIONNAIRE – THE LIST THAT IS PROVIDED BELOW IS AN EXAMPLE. Yes No DK
7A. Plain water
7A………………………1 2 8
7B. Infant formula, for example [INSERT LOCALLY AVAILABLE BRAND
NAMES OF INFANT FORMULA, ALL TYPES]
7B………………………1 2 8
7C. Milk such as tinned, powdered, or fresh animal milk, for example [INSERT LOCALLY AVAILABLE BRAND NAMES OF TINNED AND
POWDERED MILK]
7C………………………1 2 8
7D. Juice or juice drinks, for example [INSERT LOCALLY AVAILABLE
BRAND NAMES OF JUICE DRINKS]
7D………………………1 2 8
7E. Clear broth
7E………………………1 2 8
7F. Sour milk or yogurt, for example [INSERT LOCAL NAMES]
7F………………………1 2 8
7G. Thin porridge, for example [INSERT LOCAL NAMES]
7G………………………1 2 8
7H. Tea or coffee with milk
7H………………………1 2 8
7I. Any other water-based liquids, for example [INSERT OTHER WATER-
BASED LIQUIDS AVAILABLE IN THE LOCAL SETTING AND USE LOCAL NAMES]
7I………………………...1 2 8

UNHCR SENS-Version 2 Page 71 of 87
(e.g. sodas, other sweet drinks, herbal infusion, gripe water, clear tea with no milk, black coffee, ritual fluids)
IF8 Yesterday, during the day or at night, did [NAME] eat solid or semi-solid (soft, mushy) food?
Yes………………....1 No……………….....2 Don’t know….....8
|___|
SECTION IF3 IF9 Did [NAME] drink anything from a bottle with a nipple yesterday
during the day or at night?
Yes…..................1 No……………….....2 Don’t know….....8
|___|
SECTION IF4 IF10 IS CHILD AGED 6-23 MONTHS?
REFER TO IF2 / IF3
Yes…………………1 No…………...…...2
|___|
IF ANSWER IS 2 STOP NOW
IF11 Now I would like to ask you about some particular foods [NAME] may eat. I am interested in whether your child had the item even if it was combined with other foods. Yesterday, during the day or at night, did [NAME] consume any of the following? ASK ABOUT EVERY ITEM. IF ITEM WAS GIVEN, CIRCLE ‘1’. IF ITEM WAS NOT GIVEN, CIRCLE ‘2’. IF CAREGIVER DOES NOT KNOW, CIRCLE ‘8’. EVERY LINE MUST HAVE A CODE. REPLACE AND ADAPT THE TEXT HIGHLIGHTED IN GREY TO THE CONTEXT. THE TEXT IN ITALICS NEEDS TO BE DELETED FROM THE FINAL SURVEY QUESTIONNAIRE – THE LIST THAT IS PROVIDED BELOW IS AN EXAMPLE. IF A CATEGORY OF IRON-RICH FOOD (11A-11H) IS NOT AVAILABLE IN THE SETTING, DELETE IT FROM THE QUESTIONNAIRE BUT KEEP THE ORIGINAL QUESTION NUMBERS AND DO NOT CHANGE.
Yes No DK 11A. [INSERT COMMON MEAT, FISH, POULTRY AND LIVER/ORGAN FLESH
FOODS USED THE LOCAL SETTING] (e.g. beef, goat, lamb, mutton, pork, rabbit, chicken, duck, liver, kidney, heart)
11A………………………………..1 2 8
11B. [INSERT FBF AVAILABLE IN THE LOCAL SETTING AND USE LOCAL NAMES] (e.g. CSB+, WSB+)
11B…………………..…………….1 2 8
11C. [INSERT FBF++ AVAILABLE IN THE LOCAL SETTING AND USE LOCAL
NAMES] (e.g. CSB++, WSB++)
11C………………..………………1 2 8
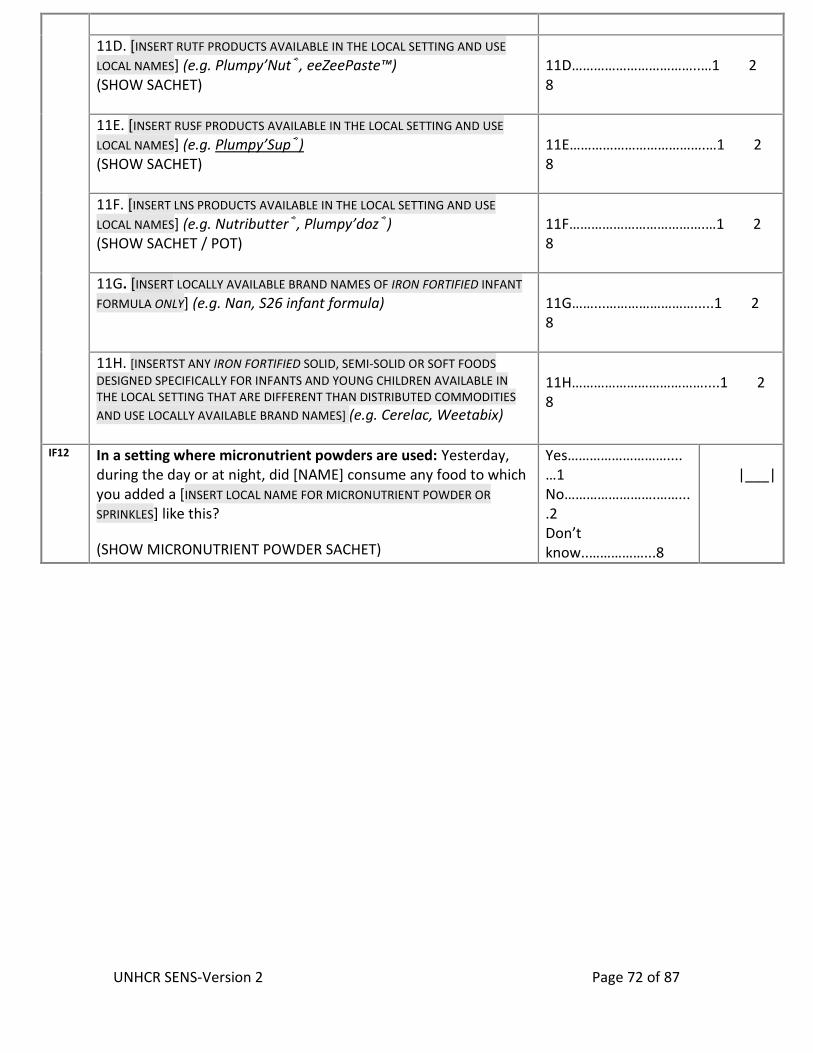
UNHCR SENS-Version 2 Page 72 of 87
11D. [INSERT RUTF PRODUCTS AVAILABLE IN THE LOCAL SETTING AND USE
LOCAL NAMES] (e.g. Plumpy’Nut®, eeZeePaste™) (SHOW SACHET)
11D……………………………..…1 2 8
11E. [INSERT RUSF PRODUCTS AVAILABLE IN THE LOCAL SETTING AND USE
LOCAL NAMES] (e.g. Plumpy’Sup®) (SHOW SACHET)
11E……………………………….…1 2 8
11F. [INSERT LNS PRODUCTS AVAILABLE IN THE LOCAL SETTING AND USE
LOCAL NAMES] (e.g. Nutributter®, Plumpy’doz®) (SHOW SACHET / POT)
11F……………………………….…1 2 8
11G. [INSERT LOCALLY AVAILABLE BRAND NAMES OF IRON FORTIFIED INFANT
FORMULA ONLY] (e.g. Nan, S26 infant formula)
11G……...…………………….....1 2 8
11H. [INSERTST ANY IRON FORTIFIED SOLID, SEMI-SOLID OR SOFT FOODS
DESIGNED SPECIFICALLY FOR INFANTS AND YOUNG CHILDREN AVAILABLE IN THE LOCAL SETTING THAT ARE DIFFERENT THAN DISTRIBUTED COMMODITIES
AND USE LOCALLY AVAILABLE BRAND NAMES] (e.g. Cerelac, Weetabix)
11H………………………………....1 2 8
IF12 In a setting where micronutrient powders are used: Yesterday, during the day or at night, did [NAME] consume any food to which you added a [INSERT LOCAL NAME FOR MICRONUTRIENT POWDER OR
SPRINKLES] like this?
(SHOW MICRONUTRIENT POWDER SACHET)
Yes………………………....…1 No…………………….……....2 Don’t know..……………...8
|___|
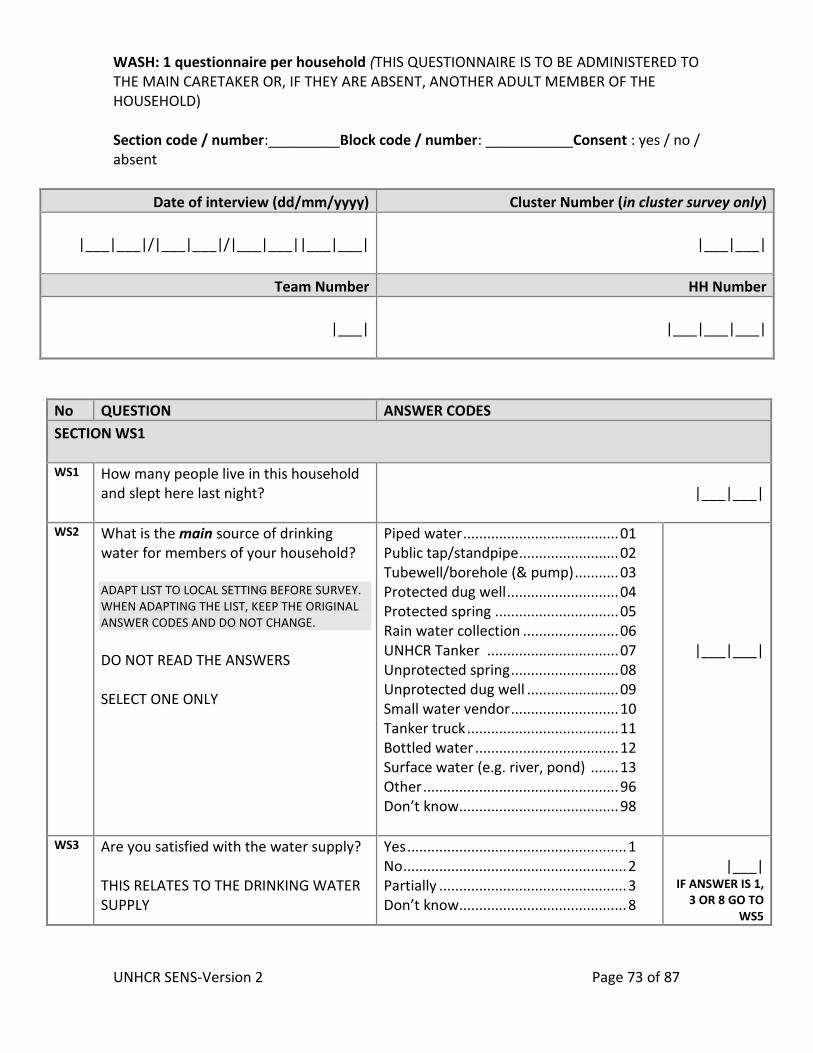
UNHCR SENS-Version 2 Page 73 of 87
WASH: 1 questionnaire per household (THIS QUESTIONNAIRE IS TO BE ADMINISTERED TO THE MAIN CARETAKER OR, IF THEY ARE ABSENT, ANOTHER ADULT MEMBER OF THE HOUSEHOLD) Section code / number:_________Block code / number: ___________Consent : yes / no / absent
Date of interview (dd/mm/yyyy) Cluster Number (in cluster survey only)
|___|___|/|___|___|/|___|___||___|___|
|___|___|
Team Number HH Number
|___|
|___|___|___|
No QUESTION ANSWER CODES
SECTION WS1 WS1 How many people live in this household
and slept here last night?
|___|___|
WS2 What is the main source of drinking water for members of your household? ADAPT LIST TO LOCAL SETTING BEFORE SURVEY. WHEN ADAPTING THE LIST, KEEP THE ORIGINAL ANSWER CODES AND DO NOT CHANGE.
DO NOT READ THE ANSWERS SELECT ONE ONLY
Piped water ....................................... 01 Public tap/standpipe ......................... 02 Tubewell/borehole (& pump) ........... 03 Protected dug well ............................ 04 Protected spring ............................... 05 Rain water collection ........................ 06 UNHCR Tanker ................................. 07 Unprotected spring ........................... 08 Unprotected dug well ....................... 09 Small water vendor ........................... 10 Tanker truck ...................................... 11 Bottled water .................................... 12 Surface water (e.g. river, pond) ....... 13 Other ................................................. 96 Don’t know ........................................ 98
|___|___|
WS3 Are you satisfied with the water supply? THIS RELATES TO THE DRINKING WATER SUPPLY
Yes ....................................................... 1 No ........................................................ 2 Partially ............................................... 3 Don’t know .......................................... 8
|___|
IF ANSWER IS 1, 3 OR 8 GO TO
WS5
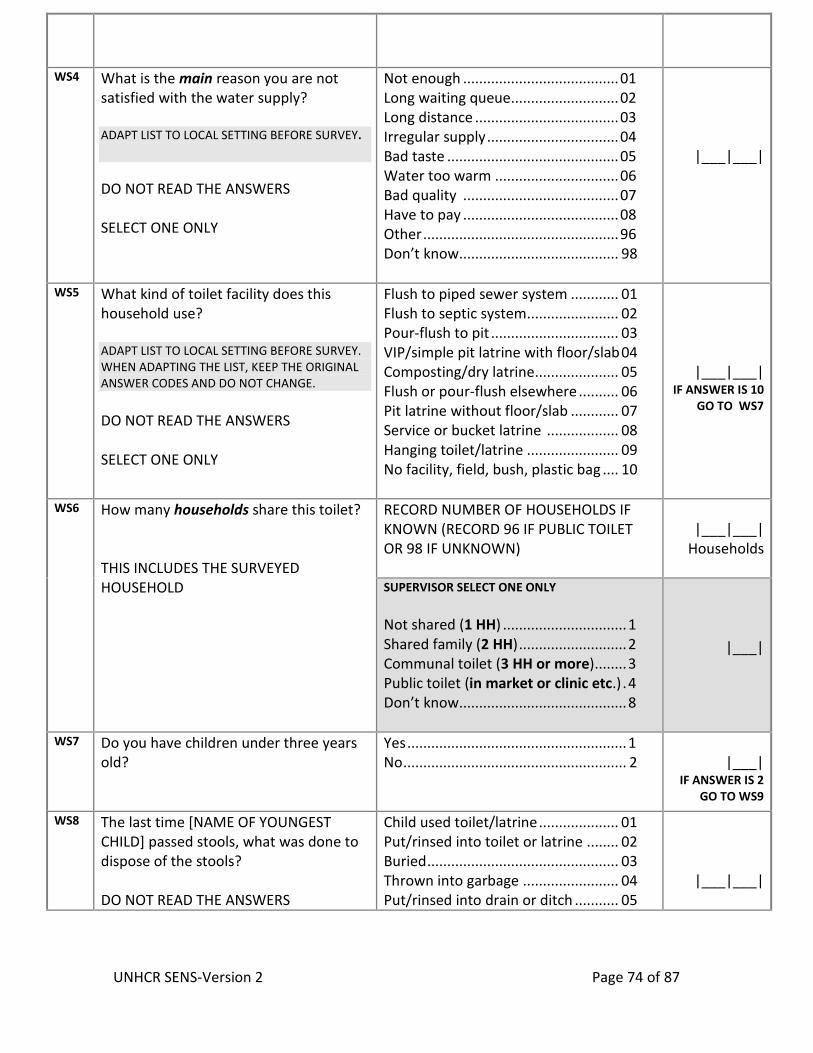
UNHCR SENS-Version 2 Page 74 of 87
WS4 What is the main reason you are not
satisfied with the water supply? ADAPT LIST TO LOCAL SETTING BEFORE SURVEY.
DO NOT READ THE ANSWERS SELECT ONE ONLY
Not enough ....................................... 01 Long waiting queue ........................... 02 Long distance .................................... 03 Irregular supply ................................. 04 Bad taste ........................................... 05 Water too warm ............................... 06 Bad quality ....................................... 07 Have to pay ....................................... 08 Other ................................................. 96 Don’t know ........................................ 98
|___|___|
WS5 What kind of toilet facility does this household use? ADAPT LIST TO LOCAL SETTING BEFORE SURVEY. WHEN ADAPTING THE LIST, KEEP THE ORIGINAL ANSWER CODES AND DO NOT CHANGE.
DO NOT READ THE ANSWERS SELECT ONE ONLY
Flush to piped sewer system ............ 01 Flush to septic system ....................... 02 Pour-flush to pit ................................ 03 VIP/simple pit latrine with floor/slab 04 Composting/dry latrine ..................... 05 Flush or pour-flush elsewhere .......... 06 Pit latrine without floor/slab ............ 07 Service or bucket latrine .................. 08 Hanging toilet/latrine ....................... 09 No facility, field, bush, plastic bag .... 10
|___|___| IF ANSWER IS 10
GO TO WS7
WS6 How many households share this toilet? THIS INCLUDES THE SURVEYED HOUSEHOLD
RECORD NUMBER OF HOUSEHOLDS IF KNOWN (RECORD 96 IF PUBLIC TOILET OR 98 IF UNKNOWN)
|___|___|
Households
SUPERVISOR SELECT ONE ONLY
Not shared (1 HH) ............................... 1 Shared family (2 HH) ........................... 2 Communal toilet (3 HH or more) ........ 3 Public toilet (in market or clinic etc.) . 4 Don’t know .......................................... 8
|___|
WS7 Do you have children under three years old?
Yes ....................................................... 1 No ........................................................ 2
|___|
IF ANSWER IS 2 GO TO WS9
WS8 The last time [NAME OF YOUNGEST CHILD] passed stools, what was done to dispose of the stools? DO NOT READ THE ANSWERS
Child used toilet/latrine .................... 01 Put/rinsed into toilet or latrine ........ 02 Buried ................................................ 03 Thrown into garbage ........................ 04 Put/rinsed into drain or ditch ........... 05
|___|___|
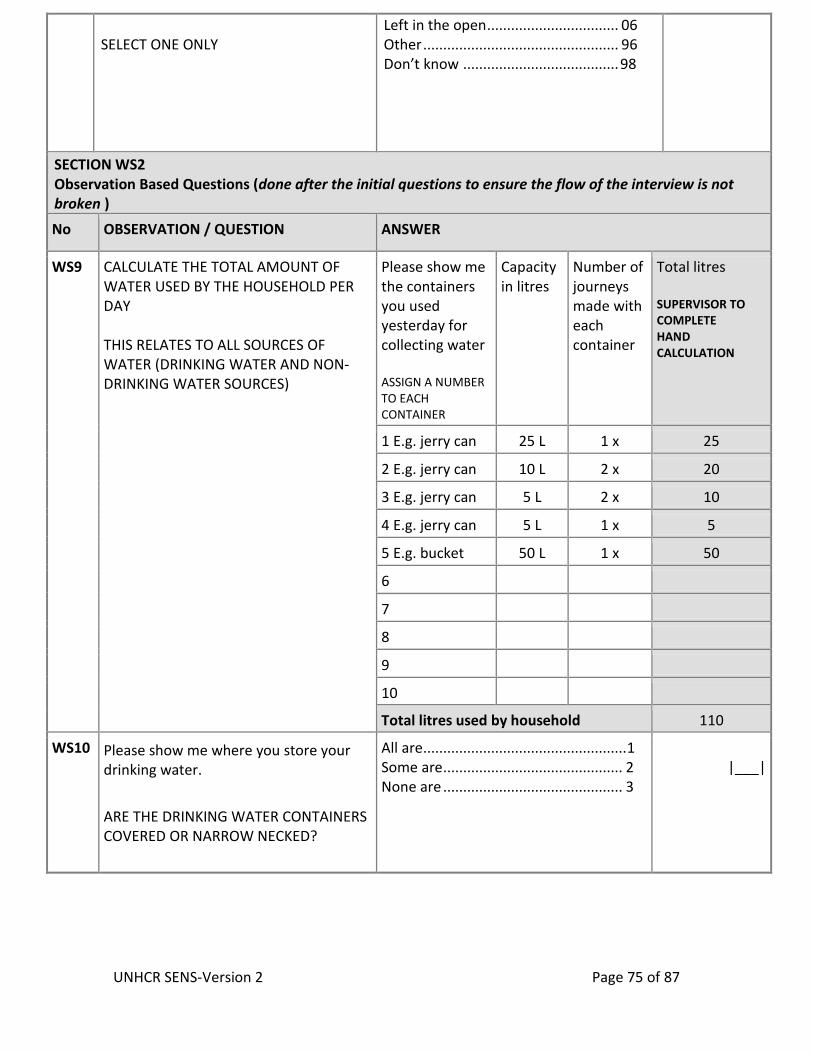
UNHCR SENS-Version 2 Page 75 of 87
SELECT ONE ONLY
Left in the open ................................. 06 Other ................................................. 96 Don’t know ....................................... 98
SECTION WS2 Observation Based Questions (done after the initial questions to ensure the flow of the interview is not broken )
No OBSERVATION / QUESTION ANSWER
WS9
CALCULATE THE TOTAL AMOUNT OF WATER USED BY THE HOUSEHOLD PER DAY THIS RELATES TO ALL SOURCES OF WATER (DRINKING WATER AND NON-DRINKING WATER SOURCES)
Please show me the containers you used yesterday for collecting water ASSIGN A NUMBER TO EACH CONTAINER
Capacity in litres
Number of journeys made with each container
Total litres SUPERVISOR TO COMPLETE HAND CALCULATION
1 E.g. jerry can 25 L 1 x 25
2 E.g. jerry can 10 L 2 x 20
3 E.g. jerry can 5 L 2 x 10
4 E.g. jerry can 5 L 1 x 5
5 E.g. bucket 50 L 1 x 50
6
7
8
9
10
Total litres used by household 110
WS10 Please show me where you store your drinking water.
ARE THE DRINKING WATER CONTAINERS COVERED OR NARROW NECKED?
All are ................................................... 1 Some are ............................................. 2 None are ............................................. 3
|___|
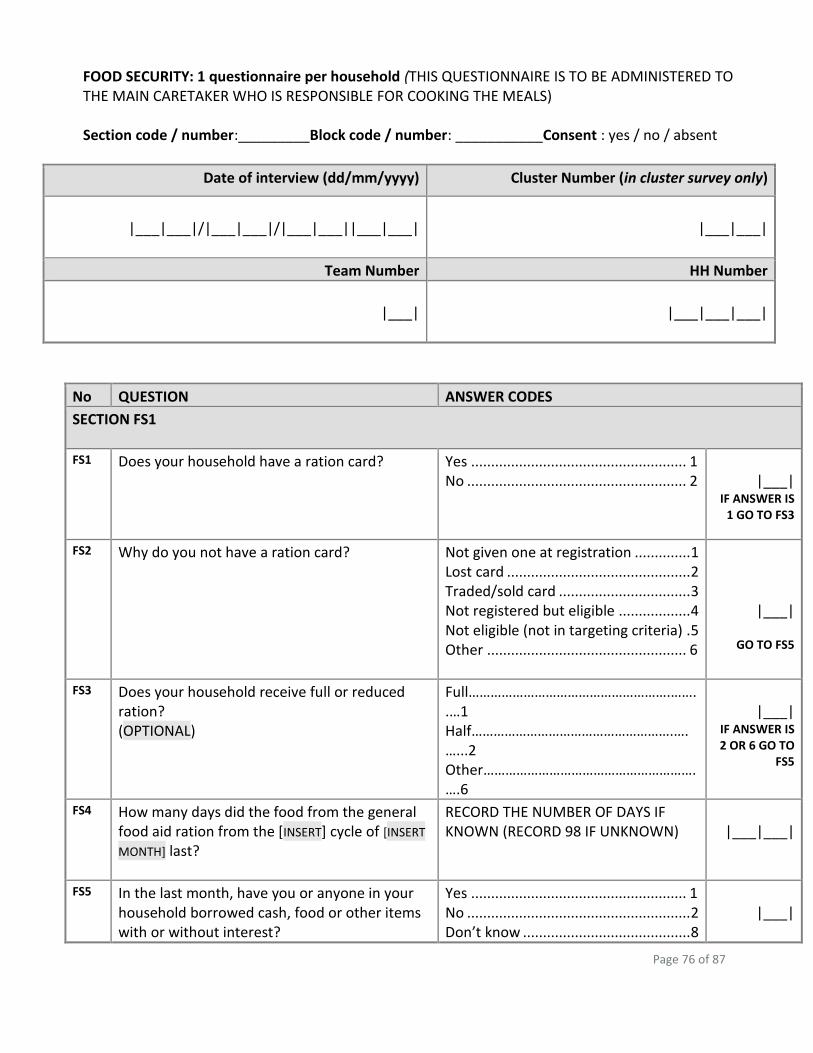
Page 76 of 87
FOOD SECURITY: 1 questionnaire per household (THIS QUESTIONNAIRE IS TO BE ADMINISTERED TO THE MAIN CARETAKER WHO IS RESPONSIBLE FOR COOKING THE MEALS) Section code / number:_________Block code / number: ___________Consent : yes / no / absent
Date of interview (dd/mm/yyyy) Cluster Number (in cluster survey only)
|___|___|/|___|___|/|___|___||___|___|
|___|___|
Team Number HH Number
|___|
|___|___|___|
No QUESTION ANSWER CODES
SECTION FS1
FS1 Does your household have a ration card?
Yes ...................................................... 1 No ....................................................... 2
|___|
IF ANSWER IS 1 GO TO FS3
FS2 Why do you not have a ration card?
Not given one at registration .............. 1 Lost card .............................................. 2 Traded/sold card ................................. 3 Not registered but eligible .................. 4 Not eligible (not in targeting criteria) . 5 Other .................................................. 6
|___|
GO TO FS5
FS3 Does your household receive full or reduced ration? (OPTIONAL)
Full……………………………………………….……..…1 Half……………………………………………….….…...2 Other………………………………………………….….6
|___|
IF ANSWER IS 2 OR 6 GO TO
FS5
FS4 How many days did the food from the general food aid ration from the [INSERT] cycle of [INSERT
MONTH] last?
RECORD THE NUMBER OF DAYS IF KNOWN (RECORD 98 IF UNKNOWN)
|___|___|
FS5 In the last month, have you or anyone in your household borrowed cash, food or other items with or without interest?
Yes ...................................................... 1 No ........................................................ 2 Don’t know .......................................... 8
|___|
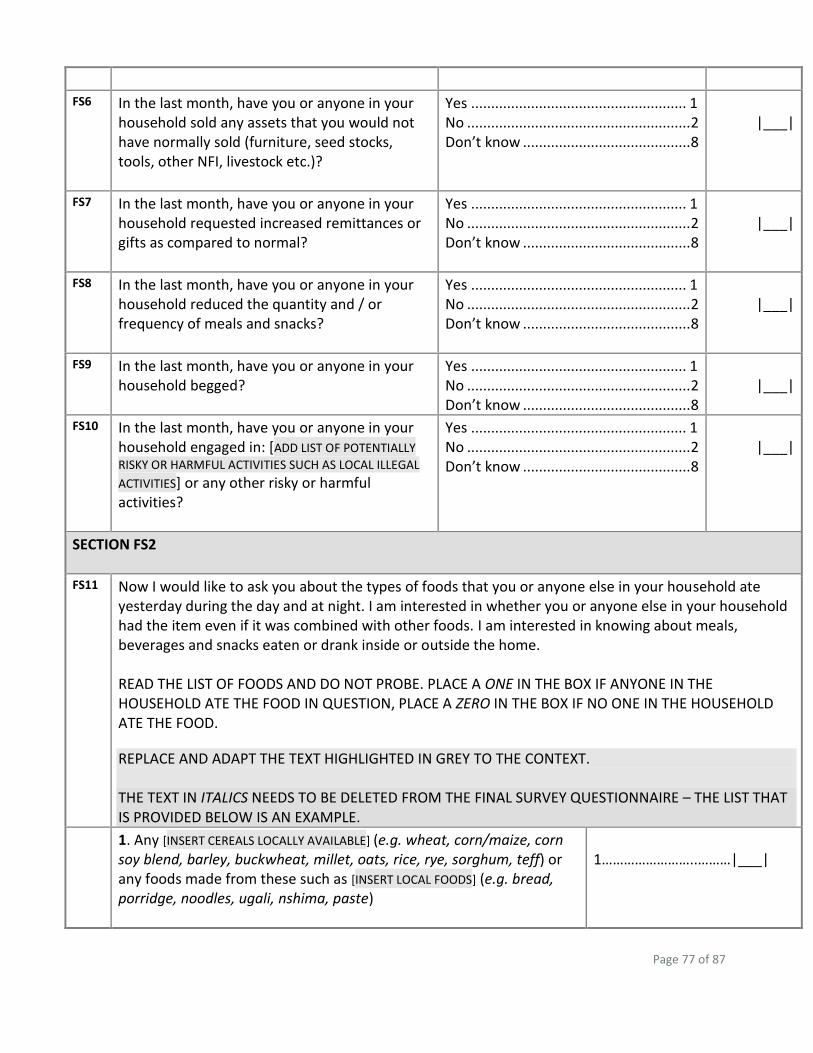
Page 77 of 87
FS6 In the last month, have you or anyone in your household sold any assets that you would not have normally sold (furniture, seed stocks, tools, other NFI, livestock etc.)?
Yes ...................................................... 1 No ........................................................ 2 Don’t know .......................................... 8
|___|
FS7 In the last month, have you or anyone in your household requested increased remittances or gifts as compared to normal?
Yes ...................................................... 1 No ........................................................ 2 Don’t know .......................................... 8
|___|
FS8 In the last month, have you or anyone in your household reduced the quantity and / or frequency of meals and snacks?
Yes ...................................................... 1 No ........................................................ 2 Don’t know .......................................... 8
|___|
FS9 In the last month, have you or anyone in your household begged?
Yes ...................................................... 1 No ........................................................ 2 Don’t know .......................................... 8
|___|
FS10 In the last month, have you or anyone in your household engaged in: [ADD LIST OF POTENTIALLY
RISKY OR HARMFUL ACTIVITIES SUCH AS LOCAL ILLEGAL
ACTIVITIES] or any other risky or harmful activities?
Yes ...................................................... 1 No ........................................................ 2 Don’t know .......................................... 8
|___|
SECTION FS2
FS11 Now I would like to ask you about the types of foods that you or anyone else in your household ate yesterday during the day and at night. I am interested in whether you or anyone else in your household had the item even if it was combined with other foods. I am interested in knowing about meals, beverages and snacks eaten or drank inside or outside the home. READ THE LIST OF FOODS AND DO NOT PROBE. PLACE A ONE IN THE BOX IF ANYONE IN THE HOUSEHOLD ATE THE FOOD IN QUESTION, PLACE A ZERO IN THE BOX IF NO ONE IN THE HOUSEHOLD ATE THE FOOD.
REPLACE AND ADAPT THE TEXT HIGHLIGHTED IN GREY TO THE CONTEXT. THE TEXT IN ITALICS NEEDS TO BE DELETED FROM THE FINAL SURVEY QUESTIONNAIRE – THE LIST THAT IS PROVIDED BELOW IS AN EXAMPLE.
1. Any [INSERT CEREALS LOCALLY AVAILABLE] (e.g. wheat, corn/maize, corn soy blend, barley, buckwheat, millet, oats, rice, rye, sorghum, teff) or any foods made from these such as [INSERT LOCAL FOODS] (e.g. bread, porridge, noodles, ugali, nshima, paste)
1……………………..………|___|
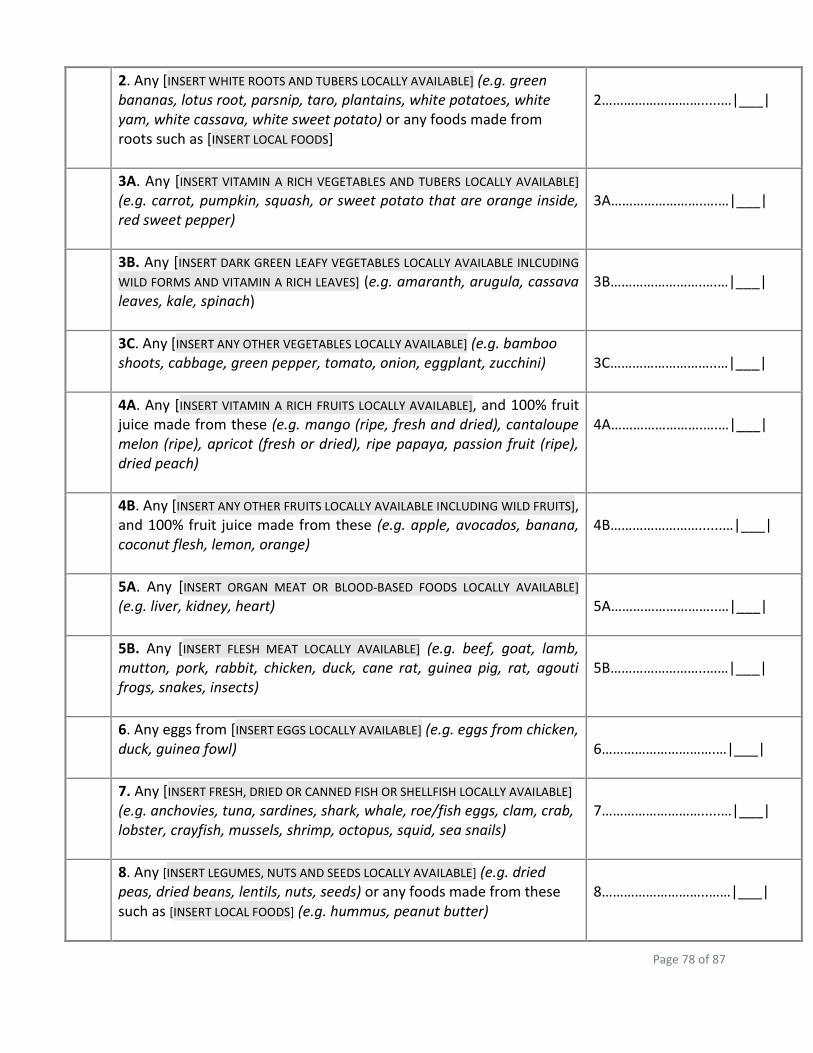
Page 78 of 87
2. Any [INSERT WHITE ROOTS AND TUBERS LOCALLY AVAILABLE] (e.g. green bananas, lotus root, parsnip, taro, plantains, white potatoes, white yam, white cassava, white sweet potato) or any foods made from roots such as [INSERT LOCAL FOODS]
2……………………….....…|___|
3A. Any [INSERT VITAMIN A RICH VEGETABLES AND TUBERS LOCALLY AVAILABLE] (e.g. carrot, pumpkin, squash, or sweet potato that are orange inside, red sweet pepper)
3A…………………….….…|___|
3B. Any [INSERT DARK GREEN LEAFY VEGETABLES LOCALLY AVAILABLE INLCUDING
WILD FORMS AND VITAMIN A RICH LEAVES] (e.g. amaranth, arugula, cassava leaves, kale, spinach)
3B…………………….….…|___|
3C. Any [INSERT ANY OTHER VEGETABLES LOCALLY AVAILABLE] (e.g. bamboo shoots, cabbage, green pepper, tomato, onion, eggplant, zucchini)
3C………………………..…|___|
4A. Any [INSERT VITAMIN A RICH FRUITS LOCALLY AVAILABLE], and 100% fruit juice made from these (e.g. mango (ripe, fresh and dried), cantaloupe melon (ripe), apricot (fresh or dried), ripe papaya, passion fruit (ripe), dried peach)
4A…………………….….…|___|
4B. Any [INSERT ANY OTHER FRUITS LOCALLY AVAILABLE INCLUDING WILD FRUITS], and 100% fruit juice made from these (e.g. apple, avocados, banana, coconut flesh, lemon, orange)
4B……………………......…|___|
5A. Any [INSERT ORGAN MEAT OR BLOOD-BASED FOODS LOCALLY AVAILABLE] (e.g. liver, kidney, heart)
5A………………………..…|___|
5B. Any [INSERT FLESH MEAT LOCALLY AVAILABLE] (e.g. beef, goat, lamb, mutton, pork, rabbit, chicken, duck, cane rat, guinea pig, rat, agouti frogs, snakes, insects)
5B……………………..……|___|
6. Any eggs from [INSERT EGGS LOCALLY AVAILABLE] (e.g. eggs from chicken, duck, guinea fowl)
6………………………….…|___|
7. Any [INSERT FRESH, DRIED OR CANNED FISH OR SHELLFISH LOCALLY AVAILABLE] (e.g. anchovies, tuna, sardines, shark, whale, roe/fish eggs, clam, crab, lobster, crayfish, mussels, shrimp, octopus, squid, sea snails)
7……………………….....…|___|
8. Any [INSERT LEGUMES, NUTS AND SEEDS LOCALLY AVAILABLE] (e.g. dried peas, dried beans, lentils, nuts, seeds) or any foods made from these such as [INSERT LOCAL FOODS] (e.g. hummus, peanut butter)
8………………………..……|___|
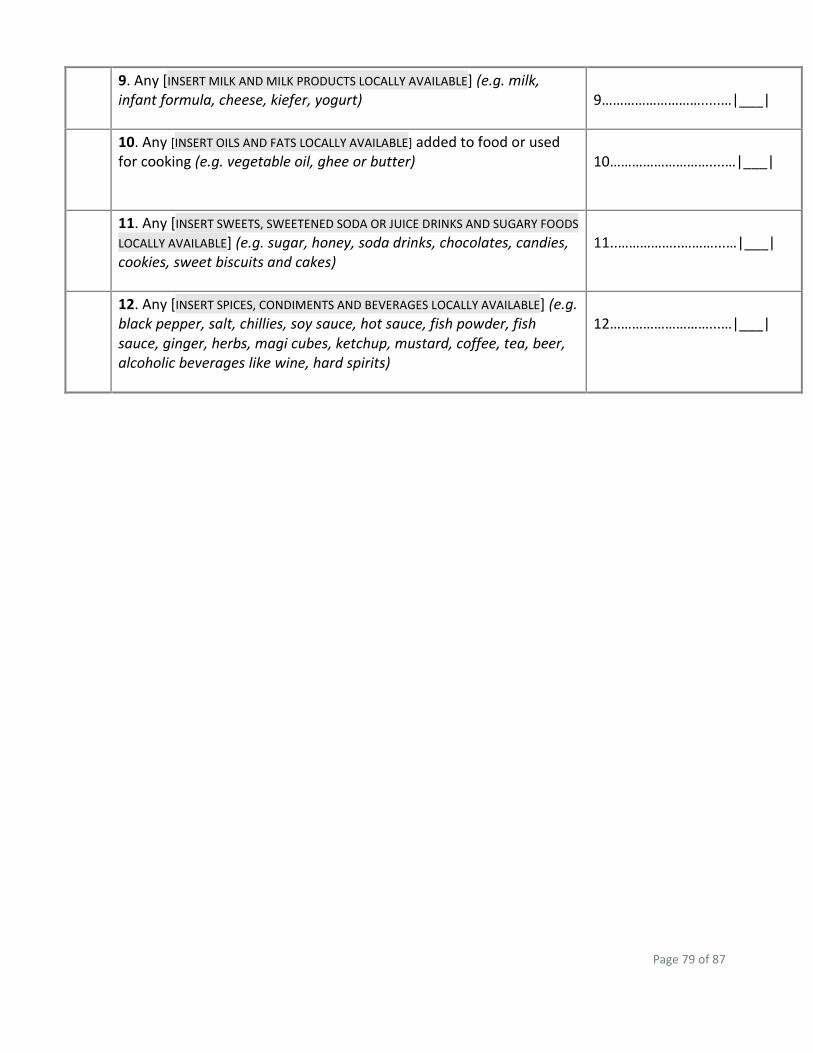
Page 79 of 87
9. Any [INSERT MILK AND MILK PRODUCTS LOCALLY AVAILABLE] (e.g. milk, infant formula, cheese, kiefer, yogurt)
9……………………….....…|___|
10. Any [INSERT OILS AND FATS LOCALLY AVAILABLE] added to food or used for cooking (e.g. vegetable oil, ghee or butter)
10………………………....…|___|
11. Any [INSERT SWEETS, SWEETENED SODA OR JUICE DRINKS AND SUGARY FOODS
LOCALLY AVAILABLE] (e.g. sugar, honey, soda drinks, chocolates, candies, cookies, sweet biscuits and cakes)
11..……………..………...…|___|
12. Any [INSERT SPICES, CONDIMENTS AND BEVERAGES LOCALLY AVAILABLE] (e.g. black pepper, salt, chillies, soy sauce, hot sauce, fish powder, fish sauce, ginger, herbs, magi cubes, ketchup, mustard, coffee, tea, beer, alcoholic beverages like wine, hard spirits)
12………………………...…|___|
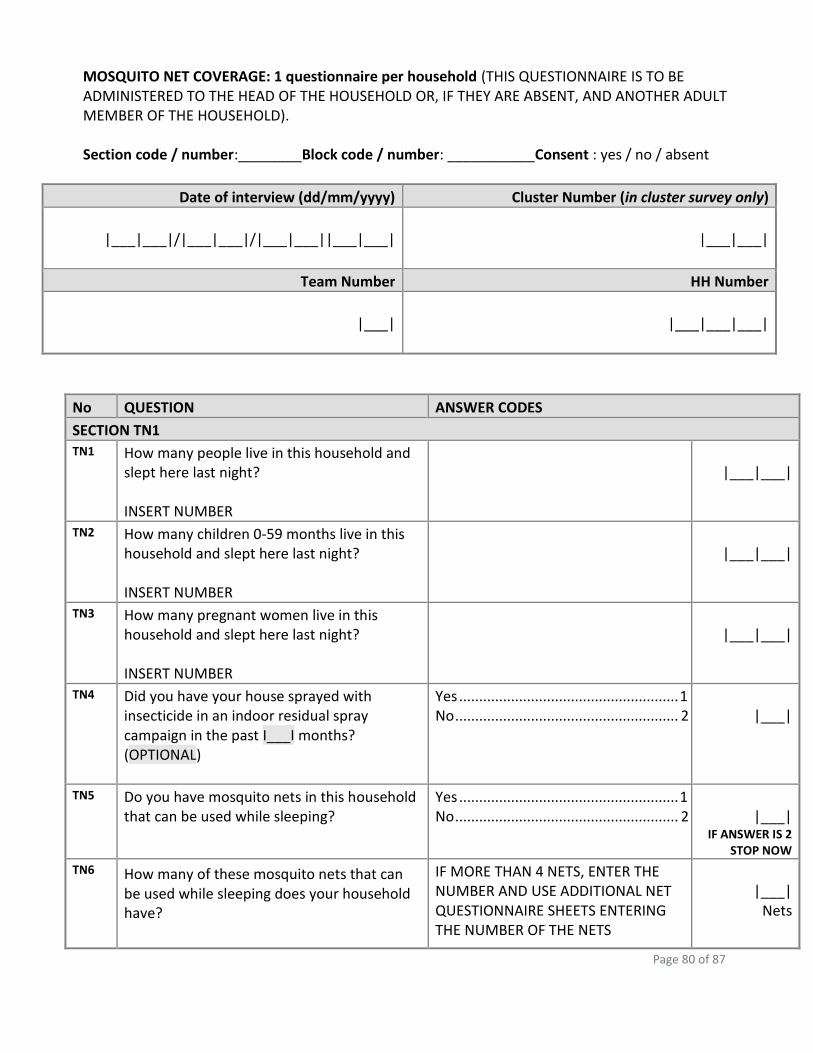
Page 80 of 87
MOSQUITO NET COVERAGE: 1 questionnaire per household (THIS QUESTIONNAIRE IS TO BE ADMINISTERED TO THE HEAD OF THE HOUSEHOLD OR, IF THEY ARE ABSENT, AND ANOTHER ADULT MEMBER OF THE HOUSEHOLD). Section code / number:________Block code / number: ___________Consent : yes / no / absent
Date of interview (dd/mm/yyyy) Cluster Number (in cluster survey only)
|___|___|/|___|___|/|___|___||___|___|
|___|___|
Team Number HH Number
|___|
|___|___|___|
No QUESTION ANSWER CODES
SECTION TN1
TN1 How many people live in this household and slept here last night? INSERT NUMBER
|___|___|
TN2 How many children 0-59 months live in this household and slept here last night? INSERT NUMBER
|___|___|
TN3 How many pregnant women live in this household and slept here last night? INSERT NUMBER
|___|___|
TN4 Did you have your house sprayed with insecticide in an indoor residual spray campaign in the past I___I months? (OPTIONAL)
Yes ....................................................... 1 No ........................................................ 2
|___|
TN5 Do you have mosquito nets in this household that can be used while sleeping?
Yes ....................................................... 1 No ........................................................ 2
|___|
IF ANSWER IS 2 STOP NOW
TN6 How many of these mosquito nets that can be used while sleeping does your household have?
IF MORE THAN 4 NETS, ENTER THE NUMBER AND USE ADDITIONAL NET QUESTIONNAIRE SHEETS ENTERING THE NUMBER OF THE NETS
|___|
Nets
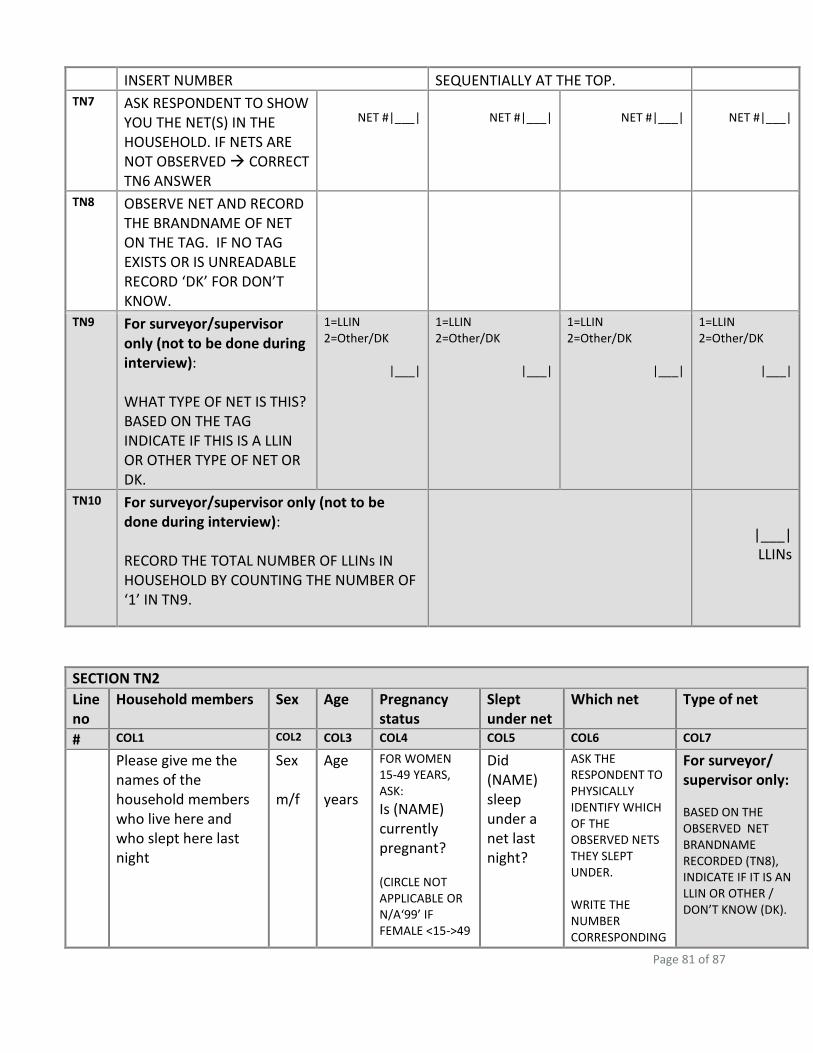
Page 81 of 87
INSERT NUMBER SEQUENTIALLY AT THE TOP.
TN7 ASK RESPONDENT TO SHOW YOU THE NET(S) IN THE HOUSEHOLD. IF NETS ARE NOT OBSERVED CORRECT TN6 ANSWER
NET #|___|
NET #|___|
NET #|___|
NET #|___|
TN8 OBSERVE NET AND RECORD THE BRANDNAME OF NET ON THE TAG. IF NO TAG EXISTS OR IS UNREADABLE RECORD ‘DK’ FOR DON’T KNOW.
TN9 For surveyor/supervisor only (not to be done during interview): WHAT TYPE OF NET IS THIS? BASED ON THE TAG INDICATE IF THIS IS A LLIN OR OTHER TYPE OF NET OR DK.
1=LLIN 2=Other/DK
|___|
1=LLIN 2=Other/DK
|___|
1=LLIN 2=Other/DK
|___|
1=LLIN 2=Other/DK
|___|
TN10 For surveyor/supervisor only (not to be done during interview): RECORD THE TOTAL NUMBER OF LLINs IN HOUSEHOLD BY COUNTING THE NUMBER OF ‘1’ IN TN9.
|___|
LLINs
SECTION TN2
Line no
Household members Sex Age Pregnancy status
Slept under net
Which net Type of net
# COL1 COL2 COL3 COL4 COL5 COL6 COL7
Please give me the names of the household members who live here and who slept here last night
Sex m/f
Age years
FOR WOMEN 15-49 YEARS, ASK:
Is (NAME) currently pregnant? (CIRCLE NOT APPLICABLE OR N/A‘99’ IF FEMALE <15->49
Did (NAME) sleep under a net last night?
ASK THE RESPONDENT TO PHYSICALLY IDENTIFY WHICH OF THE OBSERVED NETS THEY SLEPT UNDER. WRITE THE NUMBER CORRESPONDING
For surveyor/ supervisor only:
BASED ON THE OBSERVED NET BRANDNAME RECORDED (TN8), INDICATE IF IT IS AN LLIN OR OTHER / DON’T KNOW (DK).
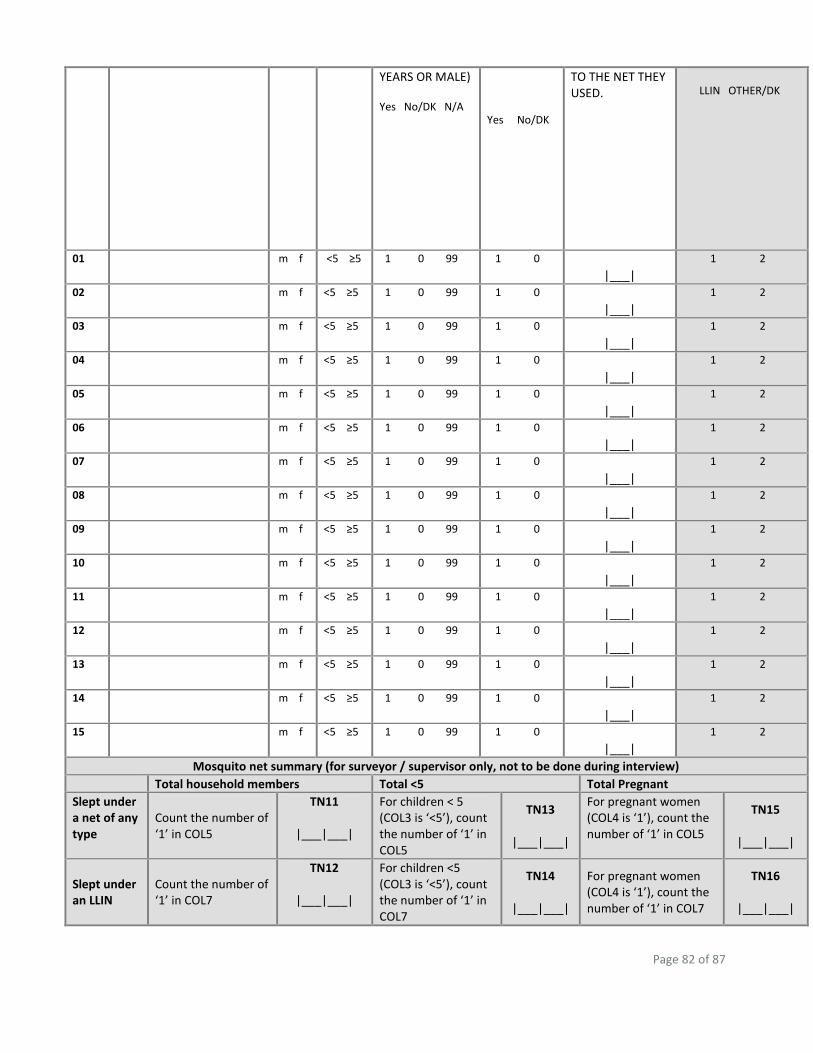
Page 82 of 87
YEARS OR MALE) Yes No/DK N/A
Yes No/DK
TO THE NET THEY USED.
LLIN OTHER/DK
01
m f <5 ≥5 1 0 99 1 0 |___|
1 2
02
m f <5 ≥5 1 0 99 1 0 |___|
1 2
03
m f <5 ≥5 1 0 99 1 0 |___|
1 2
04
m f <5 ≥5 1 0 99 1 0 |___|
1 2
05
m f <5 ≥5 1 0 99 1 0 |___|
1 2
06
m f <5 ≥5 1 0 99 1 0 |___|
1 2
07
m f <5 ≥5 1 0 99 1 0 |___|
1 2
08
m f <5 ≥5 1 0 99 1 0 |___|
1 2
09
m f <5 ≥5 1 0 99 1 0 |___|
1 2
10
m f <5 ≥5 1 0 99 1 0 |___|
1 2
11
m f <5 ≥5 1 0 99 1 0 |___|
1 2
12
m f <5 ≥5 1 0 99 1 0 |___|
1 2
13
m f <5 ≥5 1 0 99 1 0 |___|
1 2
14
m f <5 ≥5 1 0 99 1 0 |___|
1 2
15
m f <5 ≥5 1 0 99 1 0 |___|
1 2
Mosquito net summary (for surveyor / supervisor only, not to be done during interview)
Total household members Total <5 Total Pregnant
Slept under a net of any type
Count the number of ‘1’ in COL5
TN11
|___|___|
For children < 5 (COL3 is ‘<5’), count the number of ‘1’ in COL5
TN13
|___|___|
For pregnant women (COL4 is ‘1’), count the number of ‘1’ in COL5
TN15
|___|___|
Slept under an LLIN
Count the number of ‘1’ in COL7
TN12
|___|___|
For children <5 (COL3 is ‘<5’), count the number of ‘1’ in COL7
TN14
|___|___|
For pregnant women (COL4 is ‘1’), count the number of ‘1’ in COL7
TN16
|___|___|
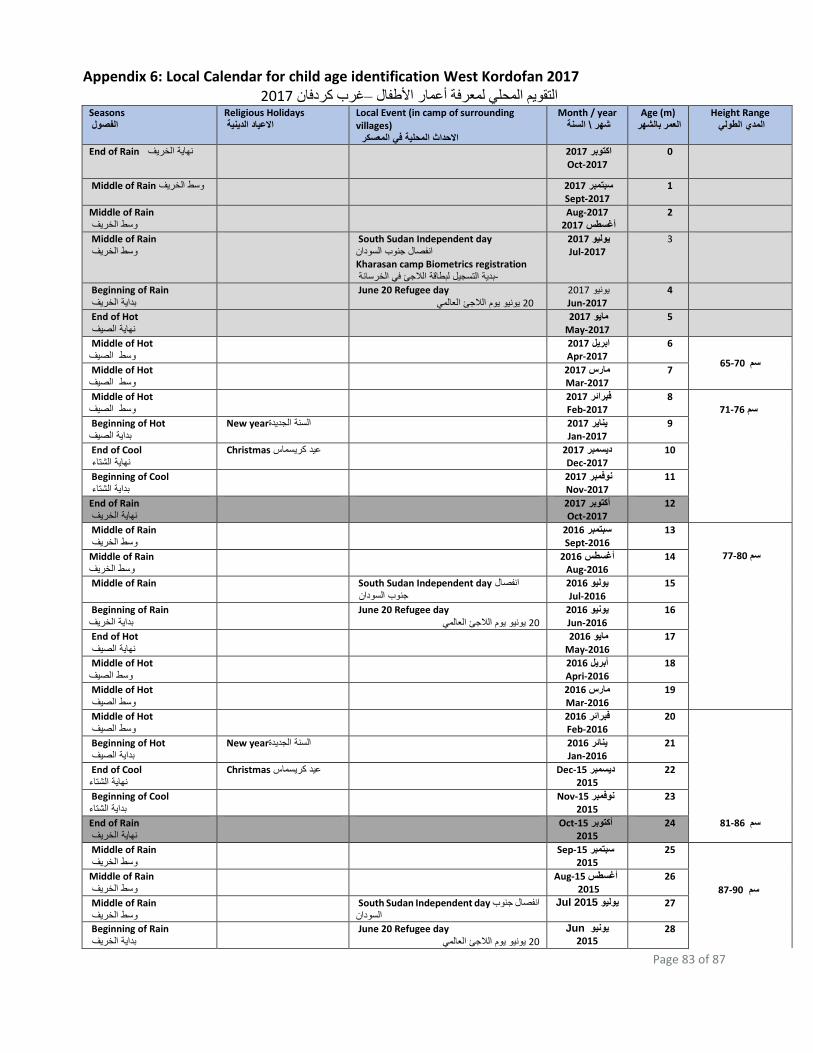
Page 83 of 87
Appendix 6: Local Calendar for child age identification West Kordofan 2017
2017غرب كردفان –التقويم المحلي لمعرفة أعمار األطفال Seasons الفصول
Religious Holidays االعياد الدينية
Local Event (in camp of surrounding villages) االحداث المحلية في المعسكر
Month / year السنة \شهر
Age (m) العمر بالشهر
Height Range المدي الطولي
End of Rain نهاية الخريف 2017اكتوبر
Oct-2017
0
Middle of Rain وسط الخريف 2017سبتمبر Sept-2017
1
Middle of Rain
وسط الخريف Aug-2017
2017أغسطس 2
Middle of Rain
وسط الخريف South Sudan Independent day
انفصال جنوب السودان
Kharasan camp Biometrics registration بدية التسجيل لبطاقة الالجئ في الخرسانة-
2017يوليو Jul-2017
3
Beginning of Rain
بداية الخريف June 20 Refugee day
يونيو يوم الالجئ العالمي 20 2017يونيو
Jun-2017 4
End of Hot نهاية الصيف
2017مايو May-2017
5
Middle of Hot وسط الصيف
2017ابريل Apr-2017
6
سم 65-70 Middle of Hot وسط الصيف
2017مارس Mar-2017
7
Middle of Hot وسط الصيف
2017فبرائر Feb-2017
8 71-76 سم
Beginning of Hot بداية الصيف
New year السنة الجديدة 2017يناير Jan-2017
9
End of Cool نهاية الشتاء
Christmas ريسماس عيد ك 2017ديسمبر Dec-2017
10
Beginning of Cool بداية الشتاء
2017نوفمبر Nov-2017
11
End of Rain
نهاية الخريف 2017أكتوبر
Oct-2017 12
Middle of Rain
وسط الخريف 2016سبتمبر
Sept-2016 13
سم 77-80
Middle of Rain
خريفوسط ال 2016أغسطس
Aug-2016 14
Middle of Rain South Sudan Independent day انفصال
جنوب السودان 2016يوليو
Jul-2016 15
Beginning of Rain
بداية الخريف June 20 Refugee day
يونيو يوم الالجئ العالمي 20 2016يونيو
Jun-2016 16
End of Hot الصيف نهاية
2016مايو May-2016
17
Middle of Hot وسط الصيف
2016أبريل Apri-2016
18
Middle of Hot وسط الصيف
2016مارس Mar-2016
19
Middle of Hot وسط الصيف
2016فبرائر Feb-2016
20
سم 81-86
Beginning of Hot بداية الصيف
New year السنة الجديدة 2016ينائر Jan-2016
21
End of Cool نهاية الشتاء
Christmas كريسماس عيد Dec-15 ديسمبر
2015 22
Beginning of Cool بداية الشتاء
Nov-15 نوفمبر
2015 23
End of Rain
نهاية الخريف Oct-15 أكتوبر
2015 24
Middle of Rain
خريف وسط ال Sep-15 سبتمبر
2015 25
87-90 سم
Middle of Rain
وسط الخريف Aug-15 أغسطس
2015 26
Middle of Rain
وسط الخريف South Sudan Independent day انفصال جنوب
السودانJul 2015يوليو 27
Beginning of Rain
بداية الخريف June 20 Refugee day
يونيو يوم الالجئ العالمي 20
Junيونيو
2015 28
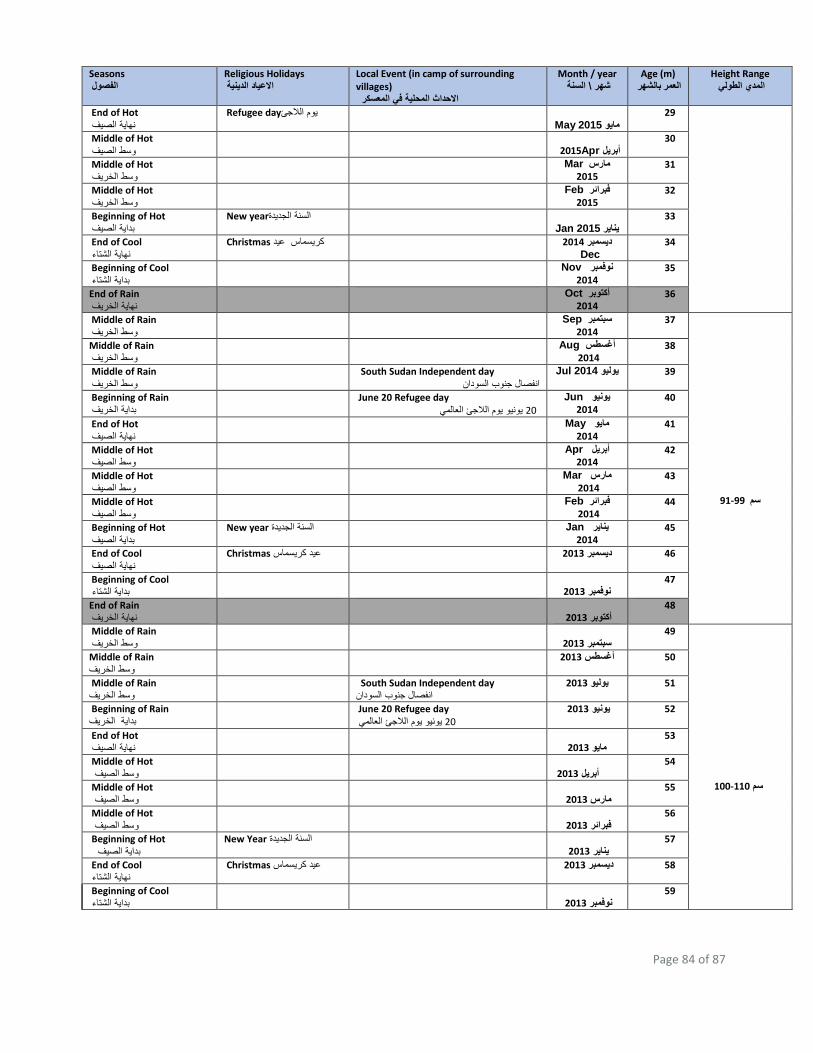
Page 84 of 87
Seasons الفصول
Religious Holidays االعياد الدينية
Local Event (in camp of surrounding villages) االحداث المحلية في المعسكر
Month / year السنة \شهر
Age (m) العمر بالشهر
Height Range المدي الطولي
End of Hot نهاية الصيف
Refugee day يوم الالجئ May 2015مايو
29
Middle of Hot وسط الصيف
Apr2015أبريل
30
Middle of Hot وسط الخريف
Marمارس
2015 31
Middle of Hot وسط الخريف
Febفبرائر
2015 32
Beginning of Hot بداية الصيف
New year السنة الجديدة Jan 2015يناير
33
End of Cool نهاية الشتاء
Christmas 2014ديسمبر كريسماس عيد
Dec 34
Beginning of Cool بداية الشتاء
Novنوفمبر
2014 35
End of Rain
نهاية الخريف Octأكتوبر
2014 36
Middle of Rain
وسط الخريف Sepسبتمبر
2014 37
سم 91-99
Middle of Rain
وسط الخريف Augأغسطس
2014 38
Middle of Rain
وسط الخريف South Sudan Independent day
لسودانانفصال جنوب ا Jul 2014يوليو 39
Beginning of Rain
بداية الخريف June 20 Refugee day
يونيو يوم الالجئ العالمي 20
Junيونيو
2014 40
End of Hot نهاية الصيف
Mayمايو
2014 41
Middle of Hot وسط الصيف
Aprأبريل
2014 42
Middle of Hot لصيف وسط ا
Marمارس
2014 43
Middle of Hot وسط الصيف
Febفبرائر
2014 44
Beginning of Hot بداية الصيف
New year يناير السنة الجديدةJan
2014 45
End of Cool نهاية الصيف
Christmas 2013ديسمبر عيد كريسماس 46
Beginning of Cool ية الشتاء بدا
2013نوفمبر
47
End of Rain
نهاية الخريف
2013أكتوبر 48
Middle of Rain
وسط الخريف
2013سبتمبر 49
100-110 سم
Middle of Rain
وسط الخريف2013أغسطس 50
Middle of Rain
وسط الخريف South Sudan Independent day
انفصال جنوب السودان2013يوليو 51
Beginning of Rain
بداية الخريف June 20 Refugee day
يونيو يوم الالجئ العالمي 20 52 2013يونيو
End of Hot نهاية الصيف
2013مايو
53
Middle of Hot وسط الصيف
2013أبريل
54
Middle of Hot الصيف وسط
2013مارس
55
Middle of Hot وسط الصيف
2013فبرائر
56
Beginning of Hot بداية الصيف
New Year السنة الجديدة 2013يناير
57
End of Cool نهاية الشتاء
Christmas عيد كريسماس 58 2013ديسمبر
Beginning of Cool ء بداية الشتا
2013نوفمبر
59


