The External Costs of Foreclosure: The Impact of Single-Family MortgageForeclosures on Property ValuesDan Immergluck
Georgia Institute of Technology
Geoff Smith
Woodstock Institute
AbstractTo measure the impact of foreclosures on nearby property values, we use
a database that combines data on 1997 and 1998 foreclosures with data onneighborhood characteristics and more than 9,600 single-family propertytransactions in Chicago in 1999. After controlling for some 40 characteristicsof properties and their respective neighborhoods, we find that foreclosures ofconventional single-family (one- to four-unit) loans have a significant impacton nearby property values. Our most conservative estimates indicate that eachconventional foreclosure within an eighth of a mile of a single-family homeresults in a decline of 0.9 percent in value.
Cumulatively, this means that, for the entire city of Chicago, the 3,750foreclosures that occurred in 1997 and 1998 are estimated to have reducednearby property values by more than $598 million, for an average of $159,000per foreclosure. This does not include effects on the value of condominiums,multifamily rental properties, and commercial buildings.
Keywords: Foreclosure; Homeownership; Mortgages
Introduction
Since at least the late 1960s, foreclosures of single-family homes (one- tofour-unit) have been viewed as a serious threat to neighborhood stability andcommunity well-being. Foreclosures, particularly in lower-income neighbor-hoods, can lead to vacant, boarded-up, or abandoned properties. These prop-erties, in turn, contribute to physical disorder in a community, create a havenfor criminal activity, discourage the formation of social capital, and lead tofurther disinvestment. If foreclosures lead to such negative effects, then wewould expect them to also lead to lower property values in the immediatevicinity, especially for residential property.
57
HOUSING POLICY DEBATE VOLUME 17 ISSUE 1© 2006 FANNIE MAE FOUNDATION. ALL RIGHTS RESERVED.
In this article, we measure the impact of foreclosures on nearby propertyvalues by using a unique database that combines data on 1997 and 1998 fore-closures with data on neighborhood characteristics and more than 9,600single-family property transactions in Chicago in 1999. Even after controllingfor over 40 characteristics of properties and their respective neighborhoods, wefind that foreclosures of conventional single-family loans have a significantimpact on nearby property values. Our most conservative estimates indicatethat each conventional foreclosure within an eighth of a mile of a single-familyhome results in a 0.9 percent decline in the value of that home. Cumulatively,this means that for the entire city of Chicago, the 3,750 foreclosures thatoccurred in 1997 and 1998 are estimated to have reduced nearby propertyvalues by more than $598 million, or an average of $159,000 per foreclosure.This does not include effects on the value of condominiums, larger multifam-ily rental properties, and commercial buildings.
Less conservative estimates suggest that each conventional foreclosurewithin an eighth of a mile of a property results in a 1.136 percent decline inthat property’s value and that each foreclosure between an eighth and a quar-ter of a mile away results in a 0.325 percent decline in value. This less conser-vative finding corresponds to a citywide loss in property values (again, notconsidering multifamily or commercial values) of just over $1.39 billion—oran average of more than $371,000 per foreclosure.
The private and social costs of foreclosures
Foreclosures can mean significant costs and hardships for those mostdirectly affected in that they can involve not only the loss of accumulated homeequity and the cost of acquiring the home, but also access to stable, decenthousing. Moreover, foreclosures can damage credit ratings, hurting owners’prospects in credit, labor and insurance, and rental housing markets. There arepotential psychological and emotional costs as well. For the holders of the loan,foreclosures are estimated to cost an average of $58,792 and take 18 monthsto resolve (Cutts and Green 2004).
But economic and social costs can have implications for surroundingneighborhoods and for larger communities as well as the parties directlyinvolved. (For example, cities, counties, and school districts may lose taxrevenue from abandoned homes.) The neighborhood and municipal costs ofconcentrated foreclosures are beginning to be recognized and quantified. Thesecosts increase significantly for properties that are not quickly returned to themarket via regular mechanisms.
FANNIE MAE FOUNDATION
58 Dan Immergluck and Geoff Smith
In examining Federal Housing Administration (FHA) foreclosures,Moreno (1995) estimated average city costs of $27,000 and neighborhoodcosts of $10,000 for a foreclosure. Apgar and Duda (2005) found that thedirect costs to Chicago city government involve more than a dozen agenciesand two dozen specific municipal activities, generating government costs thatexceed $30,000 per property in some cases.
One potential impact of increased foreclosures in a community is crime.Vacant and abandoned buildings are often considered a component of neigh-borhood physical disorder (as opposed to social disorder). Physical disorderinvolves “signs of negligence and unchecked decay” in a neighborhood(Skogan 1990, 4). Several observers and researchers have argued that physicaland social disorder causes crime (Kelling and Coles 1996; Wilson and Kelling1982) and that disorder undermines the ways in which communities maintainsocial control. Fewer residents are concerned about or take responsibility fordisorder in public spaces outside their own households. Criminals flock to suchcommunities because they do not fear being caught. Thus, social and physicaldisorder leads to more serious crime.
Skogan (1990) argues that abandoned buildings can harm a neighborhoodin various ways. First, they can harbor decay. They may be havens for trash,rats, or other stray animals; squatters; or even criminals. Abandoned housesmay also serve as places where drugs are sold and used or can be taken overby criminals who may attack neighborhood residents. Finally, abandoned orvacant homes may be targets for vandalism, the theft of wiring or other build-ing components, or arson. Moreover, theft of property from such ostensiblyunoccupied buildings may be less likely to be reported. Indirectly, the presenceof boarded-up and abandoned buildings may lead neighborhood residents toexhibit a lack of collective concern over neighborhood crime.
In examining the relationship between neighborhood foreclosures andcrime, Immergluck and Smith (2006) find that higher levels of foreclosures docontribute to higher levels of violent crime, although the results for propertycrime are not statistically significant. An increase of one standard deviation inthe foreclosure rate (about 2.8 foreclosures for every 100 owner-occupiedproperties in one year) corresponds to an increase in neighborhood violentcrime of approximately 6.7 percent.
Despite the persistence of the problem of concentrated foreclosures andtheir perceived ill effects, little systematic research has directly measured theirimpact on nearby property values. Some recent literature has addressed theimpact of deteriorated or vacant residential buildings on property values or,conversely, the impact of rehabilitation on property values. Shlay and Whitman(2004) examined the impact of vacant housing units on nearby home values in
HOUSING POLICY DEBATE
The External Costs of Single-Family Mortgage Foreclosures 59
Philadelphia and found that properties located within 150 feet of an aban-doned unit sold for over $7,000 less than other properties. Ding, Simons, andBaku (2000) found that housing rehabilitation and, especially, new con-struction have a positive effect on nearby property values and that this effectis larger in lower-income neighborhoods and in predominantly whiteneighborhoods.
In assessing the societal, as well as the individual, risks and costs of mort-gage lending policies and programs, regulators and policy makers need to havebetter information on the spillover costs of foreclosures on neighborhoods andcommunities. A significant portion of the neighborhood costs of foreclosuresshould be capitalized into local property values. In this article, we seek to esti-mate such capitalized impacts.
Short- and long-term increases in foreclosures
In the past decade, many cities have experienced substantial growth inforeclosures, with particularly large increases occurring during recent economicdownturns. These increases have been particularly steep in low- and moderate-income and minority neighborhoods.
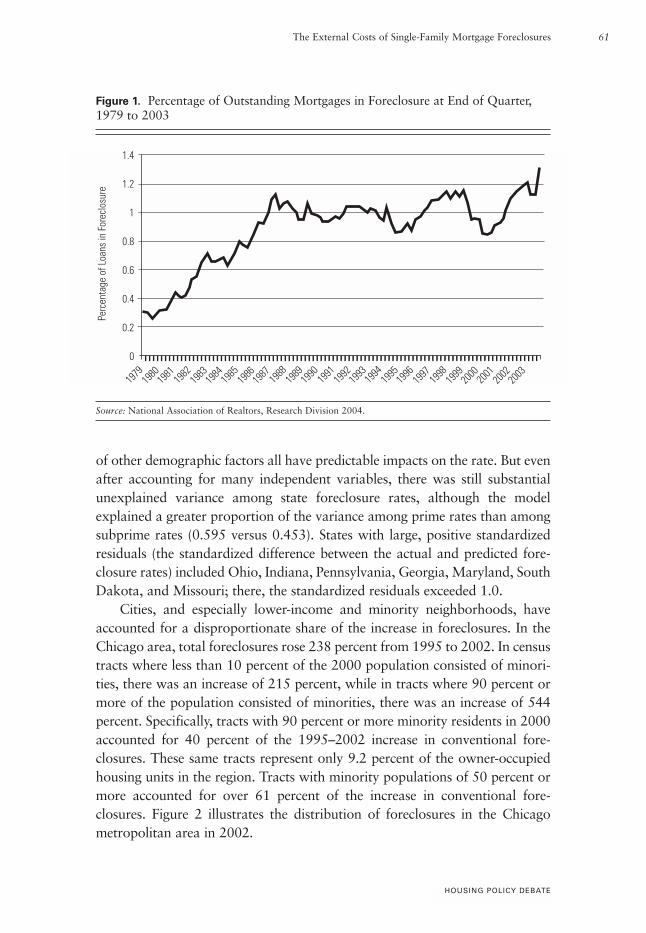
Nationally, foreclosure rates have ebbed and flowed, but over the longterm, the trend has been decidedly upward. Figure 1 tracks foreclosure rates onall mortgage loans since 1979. In the early 1980s, foreclosure rates on conven-tional loans were on the order of 0.3 to 0.4 percent. They rose significantlyover that decade to exceed 1 percent. Even as the economy grew in the late1990s, foreclosure rates increased, exceeding 1.1 percent by late 1997. In thelate 1990s and early 2000s, foreclosure levels reached historic highs (1.3percent in late 2003) (Federal Deposit Insurance Corporation [FDIC] 2004).
At the state level, 23 states saw foreclosures increase more than 24 percentfrom the end of 2001 to the end of 2003, and 8 saw increases of more than 50percent over the same period (FDIC 2004). States like Indiana, Ohio,Kentucky, South Carolina, Pennsylvania, and Mississippi all had foreclosurerates above 2 percent in late 2003. Increases have been particularly large inregions with weak economies. In Indiana, rates climbed steadily from less than0.5 percent in 1995 to over 2 percent by 2003. In Pennsylvania, rates increasedfrom less than 1 percent in 2000 to more than 1.5 percent by 2003 (NationalAssociation of Realtors, Research Division 2004).
However, economic conditions do not provide a sufficient explanation forwhy some regions and cities have experienced particularly severe increases.Using multiple regression to identify factors that explain state-level foreclosurerates for prime and subprime loans, Goldstein et al. (2005) found that income,average credit score, unemployment rate, owner-occupancy rate, and a number
FANNIE MAE FOUNDATION
60 Dan Immergluck and Geoff Smith
of other demographic factors all have predictable impacts on the rate. But evenafter accounting for many independent variables, there was still substantialunexplained variance among state foreclosure rates, although the modelexplained a greater proportion of the variance among prime rates than amongsubprime rates (0.595 versus 0.453). States with large, positive standardizedresiduals (the standardized difference between the actual and predicted fore-closure rates) included Ohio, Indiana, Pennsylvania, Georgia, Maryland, SouthDakota, and Missouri; there, the standardized residuals exceeded 1.0.
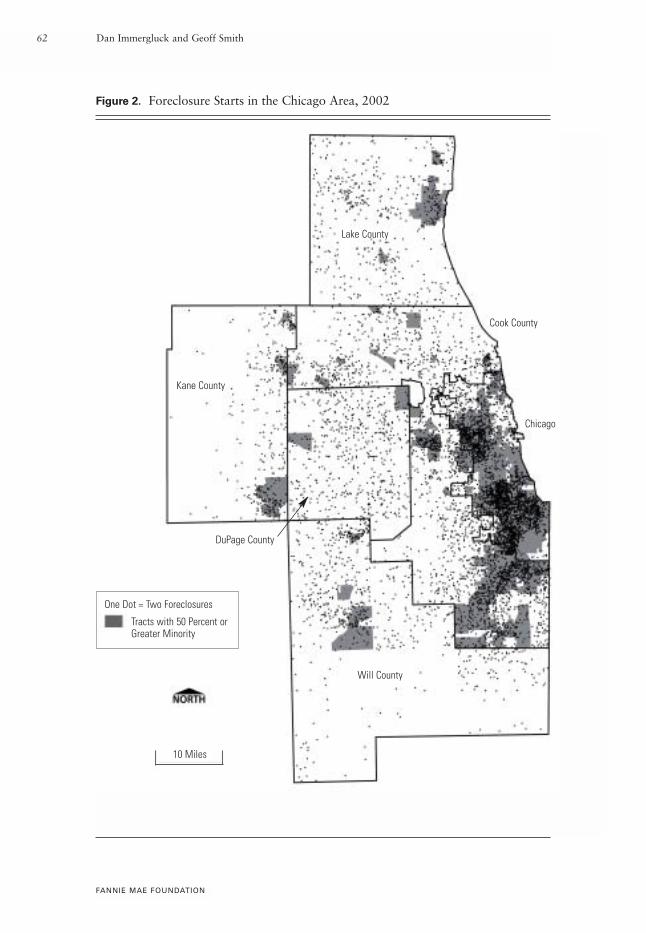
Cities, and especially lower-income and minority neighborhoods, haveaccounted for a disproportionate share of the increase in foreclosures. In theChicago area, total foreclosures rose 238 percent from 1995 to 2002. In censustracts where less than 10 percent of the 2000 population consisted of minori-ties, there was an increase of 215 percent, while in tracts where 90 percent ormore of the population consisted of minorities, there was an increase of 544percent. Specifically, tracts with 90 percent or more minority residents in 2000accounted for 40 percent of the 1995–2002 increase in conventional fore-closures. These same tracts represent only 9.2 percent of the owner-occupiedhousing units in the region. Tracts with minority populations of 50 percent ormore accounted for over 61 percent of the increase in conventional fore-closures. Figure 2 illustrates the distribution of foreclosures in the Chicagometropolitan area in 2002.
HOUSING POLICY DEBATE
The External Costs of Single-Family Mortgage Foreclosures 61
Figure 1. Percentage of Outstanding Mortgages in Foreclosure at End of Quarter,1979 to 2003
Source: National Association of Realtors, Research Division 2004.
Perc
enta
ge o
f Loa
ns in
For
eclo
sure
1.4
1.2
1
0.8
0.6
0.4
0.2
0
1979
1980
1981 19
8219
8319
84 1985
1986
1987 19
8819
8919
90 1991
1992
1993 19
9419
9519
9619
97 1998
1999
2000 20
0120
0220
03
FANNIE MAE FOUNDATION
62 Dan Immergluck and Geoff Smith
Figure 2. Foreclosure Starts in the Chicago Area, 2002
DuPage County
Kane County
Cook County
Lake County
Chicago
Will County
10 Miles
One Dot = Two Foreclosures
Tracts with 50 Percent or Greater Minority
HOUSING POLICY DEBATE
Subprime lending and foreclosures
More than 30 years ago, when the FHA’s loan programs began experienc-ing large increases in defaults, community activists recognized foreclosures asa threat to neighborhood and community stability. Despite some well-inten-tioned efforts to reverse the FHA redlining practices of previous decades,neglect and hostility toward the agency by various administrations and funda-mental design flaws in its programs led to high levels of foreclosures in manyolder, working-class, and inner-city neighborhoods. FHA programs thatworked fairly well when borrowers had options in the conventional lendingmarket broke down in a system of “reverse redlining.”
Unlike the FHA’s earlier problems, today’s foreclosures—and particularlythe growth in foreclosures—are increasingly driven by conventional loans. Inparticular, high-risk subprime lending is resulting in substantially higher levelsof foreclosures, with much of the increase concentrated in minority and lower-income communities. In the Chicago area, while foreclosures of government-guaranteed mortgages rose by 105 percent from 1995 to 2002, foreclosures ofconventional mortgages increased 350 percent. As a result, while conventionalloans accounted for only slightly more than half of foreclosures in 1995, theyaccounted for almost three out of four just seven years later.
Quercia, Stegman, and Davis (2005) found that 20.7 percent of all first-lien subprime refinancing loans originated in 1999 had entered foreclosure byDecember 2003 and that the rate at which subprime loans entered foreclosurein late 2003 was more than 10 times the rate for prime loans. In examiningforeclosures in Philadelphia, Goldstein et al. (2005) estimated that some 40percent of subprime loans made in 1998 or 1999 were in foreclosure between2000 and 2003, compared with less than 3 percent of prime loans. In neigh-boring Montgomery County (PA), approximately 20 percent of subprime loansmade in 1998 or 1999 were in foreclosure during the same period, comparedwith less than 0.4 percent of prime loans.
In the case of refinance lending, for example, Immergluck and Smith(2005) found that, other things being equal, 100 more subprime loans in acensus tract over a five-year period led to almost eight foreclosures in a singleyear following this period. They also found that the effect of subprime lendingon foreclosures is generally on the order of 20 to 30 times the effect of primelending.
While the specific magnitude of foreclosure rates varies by the type of data,the way they are measured, and the timeframes and geographies involved, it isclear that in recent years, subprime loans had a propensity for foreclosure 10to 40 times higher than prime loans did, with the lower differential frequentlyoccurring in areas where prime foreclosure rates were already quite high.
The External Costs of Single-Family Mortgage Foreclosures 63
Measuring the effect of foreclosures on nearby property values
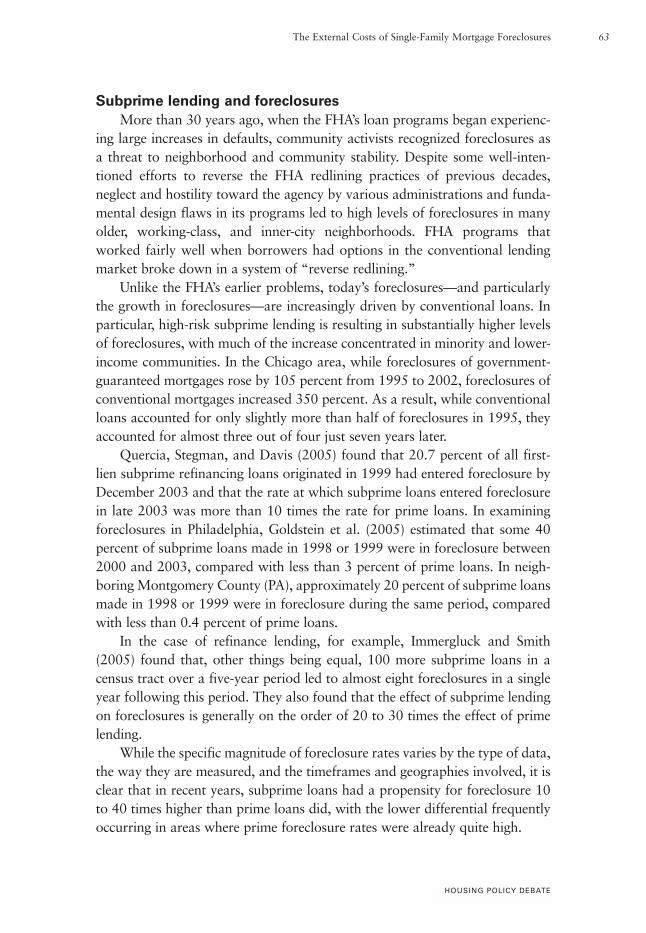
We use a hedonic regression model to estimate the impact of foreclosureson the value of nearby single-family properties and to discern the independenteffect (that is, controlling for other explanatory variables) of a change in anattribute or location of a property on its price. Figure 3 provides a schematicrepresentation of our hedonic model of housing values and nearby foreclo-sures. In this model, each property sale, p, is situated in 1 of the more than 800census tracts in Chicago. Around each property, we draw two buffer areas, onewith a radius of an eighth of a mile and one with a radius of a quarter of a mile.From the literature on the effects of proximate phenomena on property values,we assume that significant impacts of foreclosures on property values willoccur within a quarter of a mile or less. We then measure the number of fore-closures within a buffer distance of an eighth of a mile (area A) and the numberof foreclosures between a radius of an eighth of a mile and a quarter of a mile(area B).
To estimate the value of a property, p, we develop a pricing model asfollows:
Ln(pi) = α + ββ1Xi + ββ2Zi + β3ACi + β4BCi + β5AGi + β6BGi
+ β7AOi + β8BOi + εi (1)
where Ln(p) is the natural log of the price of the property, X is a vector of prop-erty characteristics (e.g., square footage, garage, construction, etc.), and Z is avector of neighborhood characteristics (population density, income, race, etc.,
FANNIE MAE FOUNDATION
64 Dan Immergluck and Geoff Smith
Figure 3. Modeling the Impact of Forecosures on Property Values
Census Tract
1⁄4 mile
1⁄8 mile
B
P
A
as well as locational measures such as longitude and latitude), as measured by2000 census tract data. The remaining variables measure the phenomena ofinterest—foreclosures. Specifically we disaggregate the following types:
1. AC is the number of foreclosures of conventional single-family loanswithin an eighth of a mile from the property.
2. BC is the number of foreclosures of conventional single family loansbetween an eighth and a quarter of a mile from the property.
3. AG is the number of foreclosures of government-insured single-familyloans within an eighth of a mile from the property.
4. BG is the number of foreclosures of government-insured single-familyloans between an eighth and a quarter of a mile from the property.
5. AO is the number of other foreclosures (multifamily and commercial prop-erty) within an eighth of a mile from the property.
6. BO is the number of other foreclosures (multifamily and commercial prop-erty) between an eighth and a quarter of a mile from the property.
To estimate equation (1), we were able to obtain property characteristicsand sales prices for over 9,600 detached, single-family properties that were soldin Chicago in 1999. These data do not include all single-family transactions inthe city. The data were originally assembled by the Illinois Department ofRevenue, which obtains them from state real estate transfer tax records. Thedepartment cleaned the data, eliminated transactions that have extreme ratiosof sales price to assessed value, and then provided a 50 percent random sampleof the remaining residential property sales.
Data on property characteristics are from the Cook County Assessor’soffice and are for the 1999 assessment year. Because we expect a lag betweenforeclosures and their effect on property values, we gathered data on foreclo-sures in the city in 1997 and 1998.
Before we estimate equation (1), it is helpful to examine the average valuesof the independent variables of interest for different types of neighborhoods.Table 1 breaks these variables out by the income level of the census tract. Itshows that the average number of foreclosures surrounding a property withina radius of an eighth of a mile drops from 2.07 conventional and 1.08 govern-ment foreclosures in low-income tracts to 0.38 conventional foreclosures and0.09 government foreclosures surrounding properties in upper-income tracts.Between an eighth and a quarter of a mile, the average number of conventionalforeclosures drops from 5.49 for low-income tracts to 1.03 for upper-incometracts, and the average number of government-guaranteed foreclosures drops
HOUSING POLICY DEBATE
The External Costs of Single-Family Mortgage Foreclosures 65
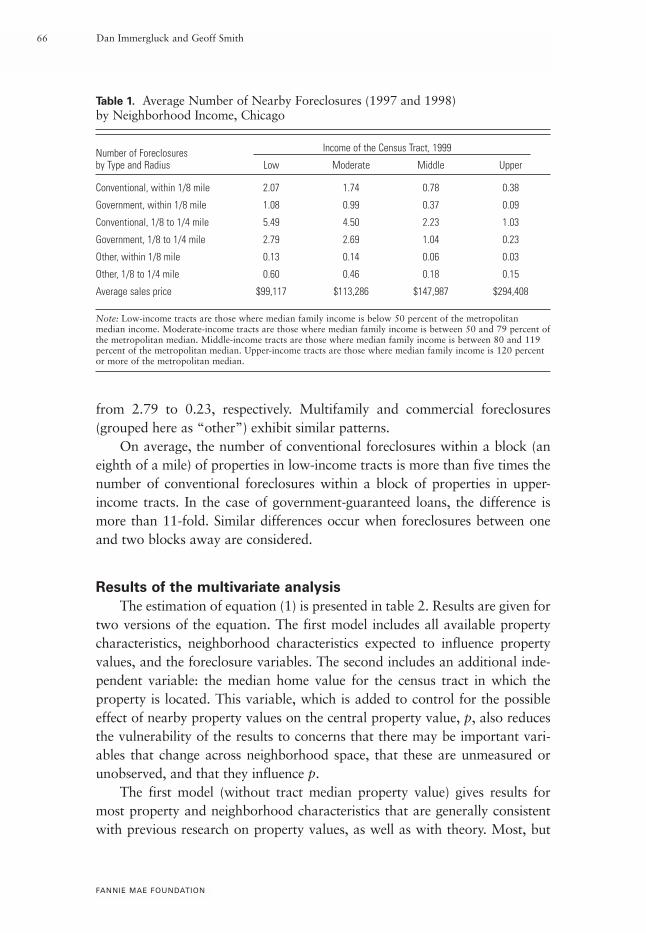
from 2.79 to 0.23, respectively. Multifamily and commercial foreclosures(grouped here as “other”) exhibit similar patterns.
On average, the number of conventional foreclosures within a block (aneighth of a mile) of properties in low-income tracts is more than five times thenumber of conventional foreclosures within a block of properties in upper-income tracts. In the case of government-guaranteed loans, the difference ismore than 11-fold. Similar differences occur when foreclosures between oneand two blocks away are considered.
Results of the multivariate analysis
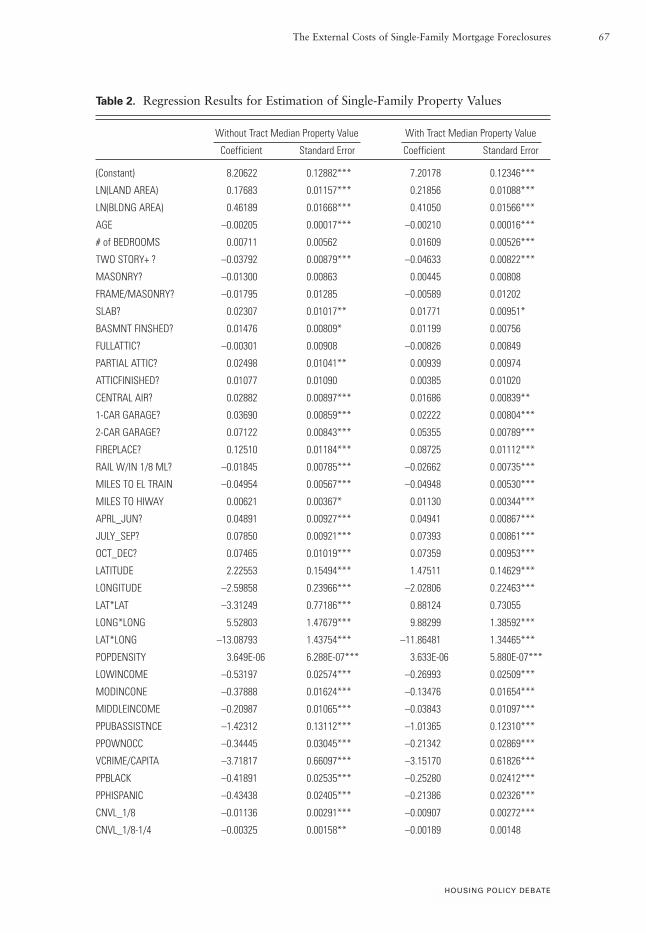
The estimation of equation (1) is presented in table 2. Results are given fortwo versions of the equation. The first model includes all available propertycharacteristics, neighborhood characteristics expected to influence propertyvalues, and the foreclosure variables. The second includes an additional inde-pendent variable: the median home value for the census tract in which theproperty is located. This variable, which is added to control for the possibleeffect of nearby property values on the central property value, p, also reducesthe vulnerability of the results to concerns that there may be important vari-ables that change across neighborhood space, that these are unmeasured orunobserved, and that they influence p.
The first model (without tract median property value) gives results formost property and neighborhood characteristics that are generally consistentwith previous research on property values, as well as with theory. Most, but
FANNIE MAE FOUNDATION
66 Dan Immergluck and Geoff Smith
Table 1. Average Number of Nearby Foreclosures (1997 and 1998) by Neighborhood Income, Chicago
Number of Foreclosures Income of the Census Tract, 1999
by Type and Radius Low Moderate Middle Upper
Conventional, within 1/8 mile 2.07 1.74 0.78 0.38
Government, within 1/8 mile 1.08 0.99 0.37 0.09
Conventional, 1/8 to 1/4 mile 5.49 4.50 2.23 1.03
Government, 1/8 to 1/4 mile 2.79 2.69 1.04 0.23
Other, within 1/8 mile 0.13 0.14 0.06 0.03
Other, 1/8 to 1/4 mile 0.60 0.46 0.18 0.15
Average sales price $99,117 $113,286 $147,987 $294,408
Note: Low-income tracts are those where median family income is below 50 percent of the metropolitanmedian income. Moderate-income tracts are those where median family income is between 50 and 79 percent ofthe metropolitan median. Middle-income tracts are those where median family income is between 80 and 119percent of the metropolitan median. Upper-income tracts are those where median family income is 120 percentor more of the metropolitan median.
HOUSING POLICY DEBATE
The External Costs of Single-Family Mortgage Foreclosures 67
Table 2. Regression Results for Estimation of Single-Family Property Values
Without Tract Median Property Value With Tract Median Property Value
Coefficient Standard Error Coefficient Standard Error
(Constant) 8.20622 0.12882*** 7.20178 0.12346***
LN(LAND AREA) 0.17683 0.01157*** 0.21856 0.01088***
LN(BLDNG AREA) 0.46189 0.01668*** 0.41050 0.01566***
AGE –0.00205 0.00017*** –0.00210 0.00016***
# of BEDROOMS 0.00711 0.00562 0.01609 0.00526***
TWO STORY+ ? –0.03792 0.00879*** –0.04633 0.00822***
MASONRY? –0.01300 0.00863 0.00445 0.00808
FRAME/MASONRY? –0.01795 0.01285 –0.00589 0.01202
SLAB? 0.02307 0.01017** 0.01771 0.00951*
BASMNT FINSHED? 0.01476 0.00809* 0.01199 0.00756
FULLATTIC? –0.00301 0.00908 –0.00826 0.00849
PARTIAL ATTIC? 0.02498 0.01041** 0.00939 0.00974
ATTICFINISHED? 0.01077 0.01090 0.00385 0.01020
CENTRAL AIR? 0.02882 0.00897*** 0.01686 0.00839**
1-CAR GARAGE? 0.03690 0.00859*** 0.02222 0.00804***
2-CAR GARAGE? 0.07122 0.00843*** 0.05355 0.00789***
FIREPLACE? 0.12510 0.01184*** 0.08725 0.01112***
RAIL W/IN 1/8 ML? –0.01845 0.00785*** –0.02662 0.00735***
MILES TO EL TRAIN –0.04954 0.00567*** –0.04948 0.00530***
MILES TO HIWAY 0.00621 0.00367* 0.01130 0.00344***
APRL_JUN? 0.04891 0.00927*** 0.04941 0.00867***
JULY_SEP? 0.07850 0.00921*** 0.07393 0.00861***
OCT_DEC? 0.07465 0.01019*** 0.07359 0.00953***
LATITUDE 2.22553 0.15494*** 1.47511 0.14629***
LONGITUDE –2.59858 0.23966*** –2.02806 0.22463***
LAT*LAT –3.31249 0.77186*** 0.88124 0.73055
LONG*LONG 5.52803 1.47679*** 9.88299 1.38592***
LAT*LONG –13.08793 1.43754*** –11.86481 1.34465***
POPDENSITY 3.649E-06 6.288E-07*** 3.633E-06 5.880E-07***
LOWINCOME –0.53197 0.02574*** –0.26993 0.02509***
MODINCONE –0.37888 0.01624*** –0.13476 0.01654***
MIDDLEINCOME –0.20987 0.01065*** –0.03843 0.01097***
PPUBASSISTNCE –1.42312 0.13112*** –1.01365 0.12310***
PPOWNOCC –0.34445 0.03045*** –0.21342 0.02869***
VCRIME/CAPITA –3.71817 0.66097*** –3.15170 0.61826***
PPBLACK –0.41891 0.02535*** –0.25280 0.02412***
PPHISPANIC –0.43438 0.02405*** –0.21386 0.02326***
CNVL_1/8 –0.01136 0.00291*** –0.00907 0.00272***
CNVL_1/8-1/4 –0.00325 0.00158** –0.00189 0.00148
not all, property characteristics are measured by dummy variables, with a 1indicating the presence of the feature (e.g., masonry construction) and a zeroindicating its absence. (Dummy variables are followed by a question mark.) Anincrease in the square footage of the home itself, or the land, results inincreased value. Other things being equal, single-story buildings are more valu-able than multistory ones. Amenities such as a finished basement, central airconditioning, a fireplace, and a one- or two-car garage add value. On the onehand, being located within a block or so of a railroad track reduces propertyvalues, while on the other, value declines as the distance from an elevated trainor subway stop increases. The regression also controls for seasonality effects onprices, which prove to be significant.
Neighborhood characteristics prove to be quite significant predictors ofproperty values. Lower incomes among residents, higher percentages of resi-dents on public assistance, and higher levels of violent crime are among thevariables that have negative effects on property values.
Four variables are included to control for the possibility that the impactsof the neighborhood and property characteristics on value vary across space. Itmay be that the attributes of a property contribute differently to value in someparts of the city as opposed to others. This phenomenon, sometimes calledspatial submarket segmentation, can be accounted for by an econometric tech-nique that controls for spatial location throughout the city.1
FANNIE MAE FOUNDATION
68 Dan Immergluck and Geoff Smith
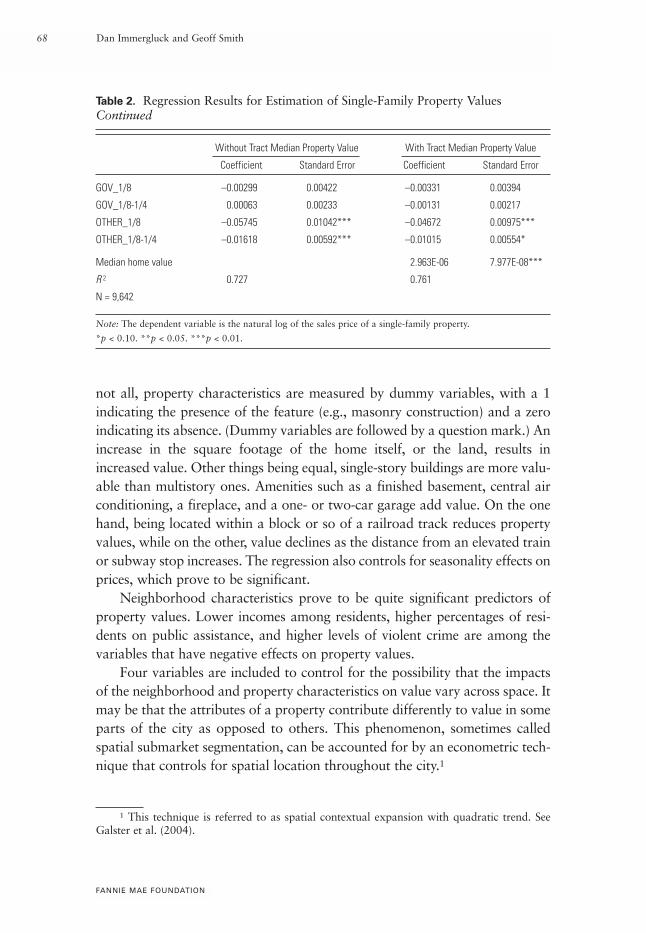
Table 2. Regression Results for Estimation of Single-Family Property Values Continued
Without Tract Median Property Value With Tract Median Property Value
Coefficient Standard Error Coefficient Standard Error
GOV_1/8 –0.00299 0.00422 –0.00331 0.00394
GOV_1/8-1/4 0.00063 0.00233 –0.00131 0.00217
OTHER_1/8 –0.05745 0.01042*** –0.04672 0.00975***
OTHER_1/8-1/4 –0.01618 0.00592*** –0.01015 0.00554*
Median home value 2.963E-06 7.977E-08***
R 2 0.727 0.761
N = 9,642
Note: The dependent variable is the natural log of the sales price of a single-family property.
*p < 0.10. **p < 0.05. ***p < 0.01.
1 This technique is referred to as spatial contextual expansion with quadratic trend. SeeGalster et al. (2004).
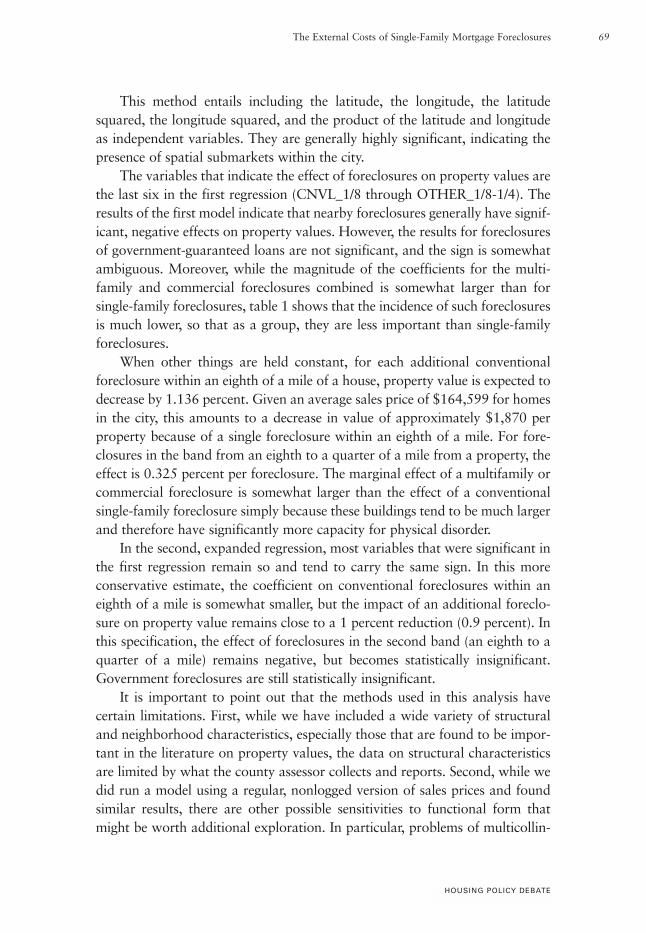
This method entails including the latitude, the longitude, the latitudesquared, the longitude squared, and the product of the latitude and longitudeas independent variables. They are generally highly significant, indicating thepresence of spatial submarkets within the city.
The variables that indicate the effect of foreclosures on property values arethe last six in the first regression (CNVL_1/8 through OTHER_1/8-1/4). Theresults of the first model indicate that nearby foreclosures generally have signif-icant, negative effects on property values. However, the results for foreclosuresof government-guaranteed loans are not significant, and the sign is somewhatambiguous. Moreover, while the magnitude of the coefficients for the multi-family and commercial foreclosures combined is somewhat larger than forsingle-family foreclosures, table 1 shows that the incidence of such foreclosuresis much lower, so that as a group, they are less important than single-familyforeclosures.
When other things are held constant, for each additional conventionalforeclosure within an eighth of a mile of a house, property value is expected todecrease by 1.136 percent. Given an average sales price of $164,599 for homesin the city, this amounts to a decrease in value of approximately $1,870 perproperty because of a single foreclosure within an eighth of a mile. For fore-closures in the band from an eighth to a quarter of a mile from a property, theeffect is 0.325 percent per foreclosure. The marginal effect of a multifamily orcommercial foreclosure is somewhat larger than the effect of a conventionalsingle-family foreclosure simply because these buildings tend to be much largerand therefore have significantly more capacity for physical disorder.
In the second, expanded regression, most variables that were significant inthe first regression remain so and tend to carry the same sign. In this moreconservative estimate, the coefficient on conventional foreclosures within aneighth of a mile is somewhat smaller, but the impact of an additional foreclo-sure on property value remains close to a 1 percent reduction (0.9 percent). Inthis specification, the effect of foreclosures in the second band (an eighth to aquarter of a mile) remains negative, but becomes statistically insignificant.Government foreclosures are still statistically insignificant.
It is important to point out that the methods used in this analysis havecertain limitations. First, while we have included a wide variety of structuraland neighborhood characteristics, especially those that are found to be impor-tant in the literature on property values, the data on structural characteristicsare limited by what the county assessor collects and reports. Second, while wedid run a model using a regular, nonlogged version of sales prices and foundsimilar results, there are other possible sensitivities to functional form thatmight be worth additional exploration. In particular, problems of multicollin-
HOUSING POLICY DEBATE
The External Costs of Single-Family Mortgage Foreclosures 69
earity prohibited us from testing for interactions between neighborhood attri-butes such as race and income. A larger, broader data set might reduce suchproblems.
Finally, there remains a possibility that the negative relationship betweenforeclosures and property values is as much the effect of property values onforeclosures as the other way around. If the lower value of the observed prop-erty (the centroid in figure 3) is highly correlated with those of nearby proper-ties, then we may be measuring the impact of lower value on the likelihood offoreclosure. Other things being equal, a lower property value and, more impor-tant, lower owner equity are likely to positively affect the probability of fore-closure because the owner has less equity at risk.
We attempt to minimize the problem of reverse causation in two ways.First, the spatial structure of our model, as illustrated by figure 3, measures theeffects of surrounding foreclosures on the value of a single property at thecentral focus of the foreclosures. Second—and related to the first point—is theaddition of neighborhood median property value as an additional independentvariable. Because nearby property values may affect foreclosures in areas A andB in figure 3, we control for such values, although perhaps imperfectly, via themedian tract value.
The use of the median home value for the tract is by no means a perfectmethod for dealing with the potential endogeneity of the nearby foreclosures.Our data on nearby property values are measured at the census-tract level,which is larger than the eighth of a mile radius around each property. However,it was the best method available. We could not identify any appropriate instru-ments with which to address endogeneity via an instrumental variablesapproach. In addition, change-over-time analysis was precluded by the limitedsales and property data available. Future research should aim to address theselimitations.
Effects of foreclosures on property values in low- and
moderate-income tracts
Given that low- and moderate-income neighborhoods experience asubstantially higher level of foreclosures and given that such foreclosures maybe more likely in vacant, abandoned, or blighted property than in property inmore affluent areas, it is useful to determine whether the effects of foreclosuresin such neighborhoods differ from the effects for all transactions. To do this,we estimate equation (1), both the basic and expanded versions, for only the2,265 property transactions in low- and moderate-income tracts in the city.
As seen in table 3, the results of the regression without median home valueindicate that for each additional foreclosure within an eighth of a mile of a
FANNIE MAE FOUNDATION
70 Dan Immergluck and Geoff Smith
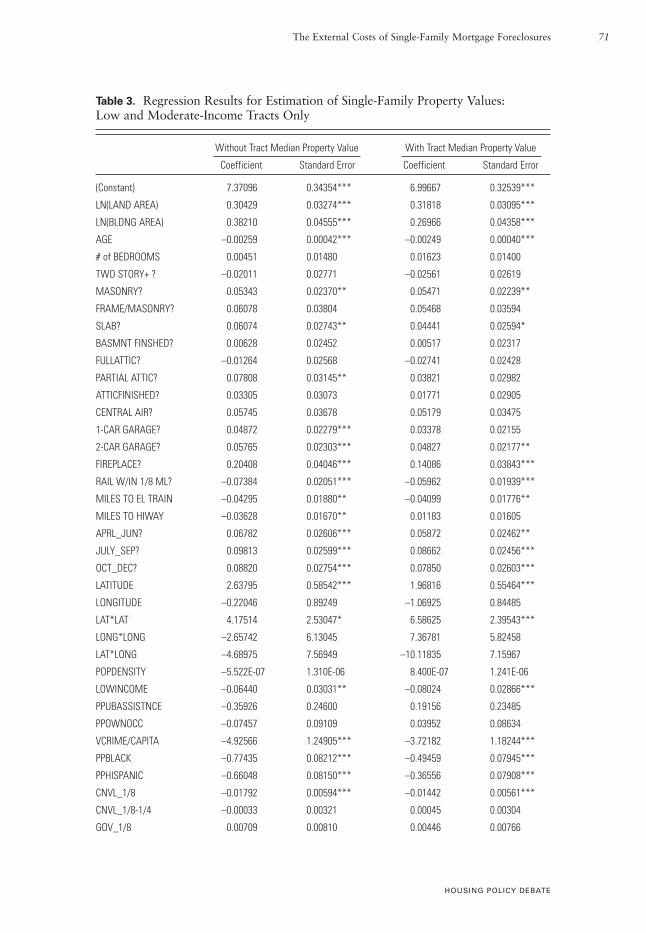
Table 3. Regression Results for Estimation of Single-Family Property Values: Low and Moderate-Income Tracts Only
Without Tract Median Property Value With Tract Median Property Value
Coefficient Standard Error Coefficient Standard Error
(Constant) 7.37096 0.34354*** 6.99667 0.32539***
LN(LAND AREA) 0.30429 0.03274*** 0.31818 0.03095***
LN(BLDNG AREA) 0.38210 0.04555*** 0.26966 0.04358***
AGE –0.00259 0.00042*** –0.00249 0.00040***
# of BEDROOMS 0.00451 0.01480 0.01623 0.01400
TWO STORY+ ? –0.02011 0.02771 –0.02561 0.02619
MASONRY? 0.05343 0.02370** 0.05471 0.02239**
FRAME/MASONRY? 0.06078 0.03804 0.05468 0.03594
SLAB? 0.06074 0.02743** 0.04441 0.02594*
BASMNT FINSHED? 0.00628 0.02452 0.00517 0.02317
FULLATTIC? –0.01264 0.02568 –0.02741 0.02428
PARTIAL ATTIC? 0.07808 0.03145** 0.03821 0.02982
ATTICFINISHED? 0.03305 0.03073 0.01771 0.02905
CENTRAL AIR? 0.05745 0.03678 0.05179 0.03475
1-CAR GARAGE? 0.04872 0.02279*** 0.03378 0.02155
2-CAR GARAGE? 0.05765 0.02303*** 0.04827 0.02177**
FIREPLACE? 0.20408 0.04046*** 0.14086 0.03843***
RAIL W/IN 1/8 ML? –0.07384 0.02051*** –0.05962 0.01939***
MILES TO EL TRAIN –0.04295 0.01880** –0.04099 0.01776**
MILES TO HIWAY –0.03628 0.01670** 0.01183 0.01605
APRL_JUN? 0.06782 0.02606*** 0.05872 0.02462**
JULY_SEP? 0.09813 0.02599*** 0.08662 0.02456***
OCT_DEC? 0.08820 0.02754*** 0.07850 0.02603***
LATITUDE 2.63795 0.58542*** 1.96816 0.55464***
LONGITUDE –0.22046 0.89249 –1.06925 0.84485
LAT*LAT 4.17514 2.53047* 6.58625 2.39543***
LONG*LONG –2.65742 6.13045 7.36781 5.82458
LAT*LONG –4.68975 7.56949 –10.11835 7.15967
POPDENSITY –5.522E-07 1.310E-06 8.400E-07 1.241E-06
LOWINCOME –0.06440 0.03031** –0.08024 0.02866***
PPUBASSISTNCE –0.35926 0.24600 0.19156 0.23485
PPOWNOCC –0.07457 0.09109 0.03952 0.08634
VCRIME/CAPITA –4.92566 1.24905*** –3.72182 1.18244***
PPBLACK –0.77435 0.08212*** –0.49459 0.07945***
PPHISPANIC –0.66048 0.08150*** –0.36556 0.07908***
CNVL_1/8 –0.01792 0.00594*** –0.01442 0.00561***
CNVL_1/8-1/4 –0.00033 0.00321 0.00045 0.00304
GOV_1/8 0.00709 0.00810 0.00446 0.00766
HOUSING POLICY DEBATE
The External Costs of Single-Family Mortgage Foreclosures 71
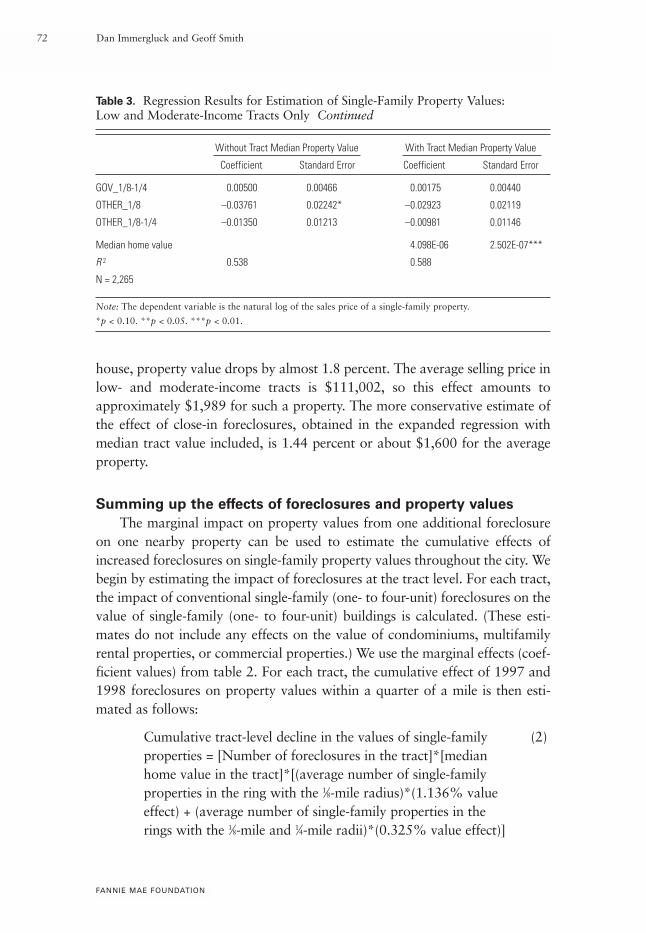
Table 3. Regression Results for Estimation of Single-Family Property Values: Low and Moderate-Income Tracts Only Continued
Without Tract Median Property Value With Tract Median Property Value
Coefficient Standard Error Coefficient Standard Error
GOV_1/8-1/4 0.00500 0.00466 0.00175 0.00440
OTHER_1/8 –0.03761 0.02242* –0.02923 0.02119
OTHER_1/8-1/4 –0.01350 0.01213 –0.00981 0.01146
Median home value 4.098E-06 2.502E-07***
R 2 0.538 0.588
N = 2,265
Note: The dependent variable is the natural log of the sales price of a single-family property.
*p < 0.10. **p < 0.05. ***p < 0.01.
FANNIE MAE FOUNDATION
72 Dan Immergluck and Geoff Smith
house, property value drops by almost 1.8 percent. The average selling price inlow- and moderate-income tracts is $111,002, so this effect amounts toapproximately $1,989 for such a property. The more conservative estimate ofthe effect of close-in foreclosures, obtained in the expanded regression withmedian tract value included, is 1.44 percent or about $1,600 for the averageproperty.
Summing up the effects of foreclosures and property values
The marginal impact on property values from one additional foreclosureon one nearby property can be used to estimate the cumulative effects ofincreased foreclosures on single-family property values throughout the city. Webegin by estimating the impact of foreclosures at the tract level. For each tract,the impact of conventional single-family (one- to four-unit) foreclosures on thevalue of single-family (one- to four-unit) buildings is calculated. (These esti-mates do not include any effects on the value of condominiums, multifamilyrental properties, or commercial properties.) We use the marginal effects (coef-ficient values) from table 2. For each tract, the cumulative effect of 1997 and1998 foreclosures on property values within a quarter of a mile is then esti-mated as follows:
Cumulative tract-level decline in the values of single-family (2)properties = [Number of foreclosures in the tract]*[median home value in the tract]*[(average number of single-family properties in the ring with the 1⁄8-mile radius)*(1.136% value effect) + (average number of single-family properties in the rings with the 1⁄8-mile and 1⁄4-mile radii)*(0.325% value effect)]
HOUSING POLICY DEBATE
The External Costs of Single-Family Mortgage Foreclosures 73
The rings are assumed to have the same single-family housing densities asthe tract as a whole.2 Because foreclosures are more likely to occur in thoseparts of tracts where owner-occupied housing is denser, this assumption yieldsa conservative estimate of the number of homes that are close to foreclosures.
To provide an even more conservative estimate of the impact of foreclo-sures on property values, we also performed another calculation that assumesfirst that there is no effect on properties more than an eighth of a mile from aforeclosure and second that the effect on properties within an eighth of a mileis the smaller 0.907 percent effect shown in the expanded (right-hand side)results of table 2.
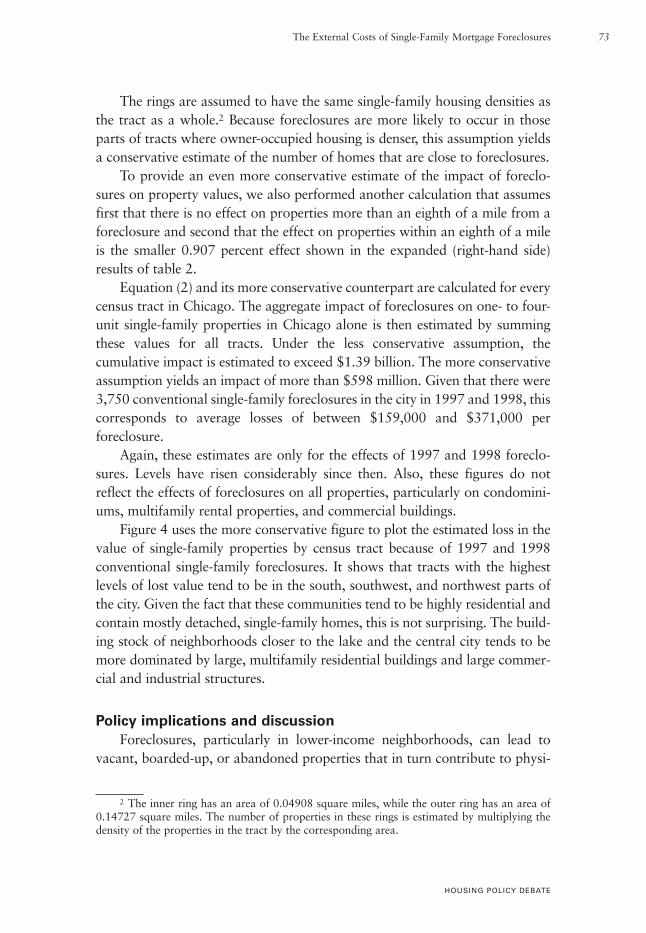
Equation (2) and its more conservative counterpart are calculated for everycensus tract in Chicago. The aggregate impact of foreclosures on one- to four-unit single-family properties in Chicago alone is then estimated by summingthese values for all tracts. Under the less conservative assumption, thecumulative impact is estimated to exceed $1.39 billion. The more conservativeassumption yields an impact of more than $598 million. Given that there were3,750 conventional single-family foreclosures in the city in 1997 and 1998, thiscorresponds to average losses of between $159,000 and $371,000 perforeclosure.
Again, these estimates are only for the effects of 1997 and 1998 foreclo-sures. Levels have risen considerably since then. Also, these figures do notreflect the effects of foreclosures on all properties, particularly on condomini-ums, multifamily rental properties, and commercial buildings.
Figure 4 uses the more conservative figure to plot the estimated loss in thevalue of single-family properties by census tract because of 1997 and 1998conventional single-family foreclosures. It shows that tracts with the highestlevels of lost value tend to be in the south, southwest, and northwest parts ofthe city. Given the fact that these communities tend to be highly residential andcontain mostly detached, single-family homes, this is not surprising. The build-ing stock of neighborhoods closer to the lake and the central city tends to bemore dominated by large, multifamily residential buildings and large commer-cial and industrial structures.
Policy implications and discussion
Foreclosures, particularly in lower-income neighborhoods, can lead tovacant, boarded-up, or abandoned properties that in turn contribute to physi-
2 The inner ring has an area of 0.04908 square miles, while the outer ring has an area of0.14727 square miles. The number of properties in these rings is estimated by multiplying thedensity of the properties in the tract by the corresponding area.
FANNIE MAE FOUNDATION
74 Dan Immergluck and Geoff Smith
Figure 4. Cumulative Effect of 1997–1998 Foreclosures on Single-Family PropertyValues, City of Chicago
3 Miles
Estimated Cumulative Property Value Lost per Tract because of Foreclosures
More than $1 Million
$500,000 to $999,999
$250,000 to $499,999
$50,000 to $249,000
Less than $50,000
Fewer than 10 properties
HOUSING POLICY DEBATE
The External Costs of Single-Family Mortgage Foreclosures 75
cal disorder in a community—disorder that can create a haven for criminalactivity, discourage the formation of social capital, and lead to more disinvest-ment. Since foreclosures lead to such negative effects, we would expect them toalso lead to lower property values in their immediate vicinity, especially forresidential property.
Our findings demonstrate that conventional foreclosures have a statisti-cally and economically significant effect on property values. We provide a rela-tively conservative measure of such effects by estimating only the effects onsingle-family properties and excluding condominiums, multifamily rental prop-erties, and commercial buildings. The magnitude of the impact for Chicago isbetween $598 million and $1.39 billion.
These findings have implications for the regulation of subprime mortgagelending, the regulation of the growing segment of exotic mortgage products inthe prime market, and policies that aim to expand homeownership to includea broader segment of lower-income households. There are also implications forcommunity reinvestment policy and foreclosure law itself.
First, our findings have clear implications for the regulation of subprimemortgage lending. A variety of recent research demonstrates that foreclosureshave been increasingly driven by subprime lending (Goldstein et al. 2005;Immergluck and Smith 2005; Quercia, Stegman, and Davis 2005). Moreover,such foreclosures are exacerbated by the highly concentrated nature of sub-prime lending in neighborhoods with large minority populations.
If policy makers are to make wise decisions about whether and how muchto regulate subprime lending, they must consider not only any benefits or coststhat might accrue to the lenders or borrowers who are directly involved, butalso the significant costs of foreclosures borne by communities. Most of theresidents of the affected communities—many of them lower-income and work-ing-class neighborhoods—have no direct role in the foreclosures occurringaround them. There are, of course, strong arguments for regulating marketactivity when poorly informed or unsophisticated borrowers are harmed byparticular lending products or practices. The history of federal and state policyis full of precedents for protecting vulnerable citizens in economic transactions,especially ones as important as mortgage loans. However, when a certainoutcome is shown to hurt parties external to the transaction, the arguments forpolicy intervention and for more direct policy intervention (e.g., limiting oroutlawing certain practices versus simply requiring disclosure) become evenmore robust. Justification no longer depends on the limited financial literacy orimpaired understanding of the borrowers. The substantial neighborhood harmcaused by high-risk lending should be considered an important cost, regardlessof the borrower’s ability to make an informed financial decision.
FANNIE MAE FOUNDATION
76 Dan Immergluck and Geoff Smith
Second, the negative impact of foreclosures on neighborhoods and citiesalso has implications for the regulation of the exotic, higher-risk prime mort-gage products that have grown increasingly popular over the past few years.Interest-only loans, negative amortization products, and combinations of theseand other higher-risk loan terms can increase the risk of default even forborrowers with strong credit histories. Moreover, the experience of thesubprime market has shown that some of this risk may not be well understooduntil such loans are exposed to increasing interest rates, a weaker economy, orother adverse conditions.
Third, as Schwartz (2006) and others have argued, U.S. federal housingpolicy over the past 10 or 15 years has increasingly focused on expandinghomeownership opportunities for lower-income and minority households.While this is a laudable goal from several perspectives, one risk of pushinghomeownership too hard is that such policies may encourage higher-risk lend-ing and borrowing to the point where costs outweigh benefits. Moreover, thedistribution of the costs of higher-risk lending may be disproportionately borneby certain communities or neighborhoods. Of course, the challenge is todevelop regulatory regimes that reduce such costs while preserving as many ofthe benefits of increased homeownership opportunities as possible. In the end,however, some limits on access to homeownership may have to be tolerated ifconcentrated foreclosures and their impacts are to be held to tolerable levels.The neighborhood costs of foreclosures we have noted suggest that policymakers would be wise to emphasize the sustainability and preservation ofhomeownership as much as its short-term growth.
Community reinvestment policy can be used to encourage lenders toaddress the problem of concentrated foreclosures. A number of activities thatcan be rewarded under the Community Reinvestment Act (CRA) could provehelpful in reducing foreclosures, especially those concentrated in lower-incomeareas. First, banks can be rewarded in their CRA examinations for offering orparticipating in the various types of anti–predatory lending programs beingoffered around the country. Such programs are usually organized by neighbor-hood-based community development organizations (Higgins 2005). Amongthose receiving the most attention is the NORMAL program of Chicago’sNeighborhood Housing Services. In this program, borrowers at severe risk offoreclosure are provided with more affordable loans to refinance a predatoryloan. To compensate for any predatory terms or fees, the payoff to the originallender is less than the outstanding balance. Banks can also receive credit underthe CRA Investment or Service Test for supporting foreclosure prevention pro-grams, including postpurchase counseling.
HOUSING POLICY DEBATE
The External Costs of Single-Family Mortgage Foreclosures 77
Second, CRA regulators can encourage more responsible lending and thusreduce local foreclosure rates by considering not only the quantity of lendingthat banks and their affiliates make in lower-income and minority neighbor-hoods, but also the nature and performance of those loans in bringing aboutsustainable homeownership. Of course, care should be taken not to adoptpractices that might inadvertently discourage responsible lending in lower-income communities.
Reducing high and concentrated foreclosures is a policy objective that willserve the interests not only of consumers and neighborhoods, but of the mort-gage banking industry as well. Such an objective is a natural target of bankregulatory policy in that it combines reinvestment and safety and soundnessgoals. For banks that make loans in impacted communities, concentrated fore-closures could adversely affect their lending markets and their collateral baseby depressing property values.
Finally, the impact of foreclosures on property values and neighborhoodvitality generally suggests that the nature of the default and foreclosure processitself should be considered. For example, the time that elapses between filingthe foreclosure notice and the completed foreclosure sale varies greatly acrossstates. In some states, such as Texas and Georgia, foreclosure periods can be asshort as 25 to 35 days, while in others, they can last more than a year. In study-ing the costs of foreclosures to municipal governments, Apgar and Duda(2005) suggest that streamlining might reduce the negative effects of fore-closures by reducing opportunities for property deterioration and vandalism.Given the potential costs to individual homeowners, more research is neededto determine whether speedier or simpler foreclosure processes are likely tohave the desired effects.
This article represents an initial attempt to measure the likely costs of fore-closures on neighborhood property values. More work is needed, including thedevelopment of larger databases that include more robust sales data over time.Moreover, additional program and policy development work is needed to iden-tify the most promising methods to reduce foreclosures and to limit the nega-tive impacts of mortgage defaults on neighborhoods and communities.Notwithstanding the need for additional research and program development,the existing evidence on the personal and social costs of foreclosures stronglysuggests that policy makers should act aggressively in the near term to stem thecontinuing problem of high levels of foreclosures that plague so many commu-nities around the country.
FANNIE MAE FOUNDATION
78 Dan Immergluck and Geoff Smith
AuthorsDan Immergluck is an Associate Professor in the City and Regional Planning Program in theCollege of Architecture at Georgia Institute of Technology. Geoff Smith is a Research ProjectDirector at the Woodstock Institute.
We would like to thank Kristopher Rengert and two anonymous referees for providinghelpful comments on this article. We also thank Daniel McMillen for providing us access tothese data. Any errors or omissions remain our responsibility. This article is based onresearch from a 2005 working paper, titled There Goes the Neighborhood: The Effect ofSingle-Family Mortgage Foreclosures on Property Values, prepared for the WoodstockInstitute.
ReferencesApgar, William, and Mark Duda. 2005. Collateral Damage: The Municipal Impact ofToday’s Mortgage Foreclosure Boom. Washington, DC: Homeownership PreservationFoundation. World Wide Web page <http://www.hpfonline.org/images/Apgar-Duda%20Study%20Final.pdf> (accessed May 11).
Cutts, Amy Crews, and Richard K. Green. 2004. Innovative Servicing Technology: SmartEnough to Keep People in Their Houses? Freddie Mac Working Paper No. 04–03. Wash-ington, DC: Freddie Mac. World Wide Web page <http://www.freddiemac.com/news/pdf/fmwp_0403_servicing.pdf> (accessed August 12, 2005).
Ding, Chengri, Robert Simons, and Esmail Baku. 2000. The Effect of Residential Investmenton Nearby Property Values: Evidence from Cleveland, Ohio. Journal of Real EstateResearch 19:23–48.
Federal Deposit Insurance Corporation. 2004. Economic Conditions and Emerging Risks inBanking. April 26. World Wide Web page <http://www.fdic.gov/deposit/insurance/risk/ecerb.pdf> (accessed January 6, 2005).
Galster, George, Kenneth Temkin, Chris Walker, and Noah Sawyer. 2004. Measuring theImpacts of Community Development Initiatives: A New Application of the Adjusted Inter-rupted Time-Series Method. Evaluation Review 28(6):502–38.
Goldstein, Ira, Maggie McCullough, Al Parker, and Daniel Urevick-Ackelsberg. 2005. Mort-gage Foreclosure Filings in Pennsylvania. Philadelphia: Reinvestment Fund. World WideWeb page <http://www.trfund.com/policy/PA_Foreclosures.htm> (accessed August 10).
Higgins, Lindley. 2005. Effective Community-Based Strategies for Preventing Foreclosures.Neighborworks America. World Wide Web page <http://www.nw.org/network/pubs/studies/documents/foreclosureReport092905.pdf> (accessed December 30).
Immergluck, Dan, and Geoff Smith. 2005. Measuring the Effects of Subprime Lending onNeighborhood Foreclosures: Evidence from Chicago. Urban Affairs Review 40:362–89.
Immergluck, Dan, and Geoff Smith. 2005. There Goes the Neighborhood: The Effect ofSingle-Family Mortgage Foreclosures on Property Values. Working paper. WoodstockInstitute.
HOUSING POLICY DEBATE
The External Costs of Single-Family Mortgage Foreclosures 79
Immergluck, Dan, and Geoff Smith. 2006. The Impact of Single-Family Mortgage Foreclo-sures on Neighborhood Crime. Housing Studies, forthcoming.
Kelling, George, and Catherine Coles. 1996. Fixing Broken Windows: Restoring Order andReducing Crime in Our Communities. New York: Touchstone.
Moreno, Anne. 1995. The Cost-Effectiveness of Mortgage Foreclosure Prevention. Minne-apolis: Family Housing Fund.
National Association of Realtors, Research Division. 2004. Rising Foreclosure Rates inIndiana: An Explanatory Analysis of Contributing Factors. March. World Wide Web page<http://www.mibor.com/_pdfs/ForeclosureStudy2004.pdf> (accessed August 25, 2005).
Quercia, Roberto, Michael Stegman, and Walter Davis. 2005. The Impact of PredatoryLoan Terms on Subprime Foreclosures: The Special Case of Prepayment Penalties andBalloon Payments. University of North Carolina–Chapel Hill, Center for Community Capi-talism.
Schwartz, Alex. 2006. Housing Policy in the United States: An Introduction. New York:Routledge.
Shlay, Anne B., and Gordon Whitman. 2004. Research for Democracy: Linking Commu-nity Organizing and Research to Leverage Blight Policy. World Wide Web page<http://comm-org.wisc.edu/papers2004/shlay/shlay.htm> (accessed July 15, 2005).
Skogan, Wesley. 1990. Disorder and Decline: Crime and the Spiral of Decay in AmericanNeighborhoods. Berkeley, CA: University of California Press.
Wilson, James Q., and George Kelling. 1982. Broken Windows: The Police and Neighbor-hood Safety. Atlantic, March, pp. 29–38.


