Download - Temenos Corporate Deck

14 February 2018
Capital
Markets Day
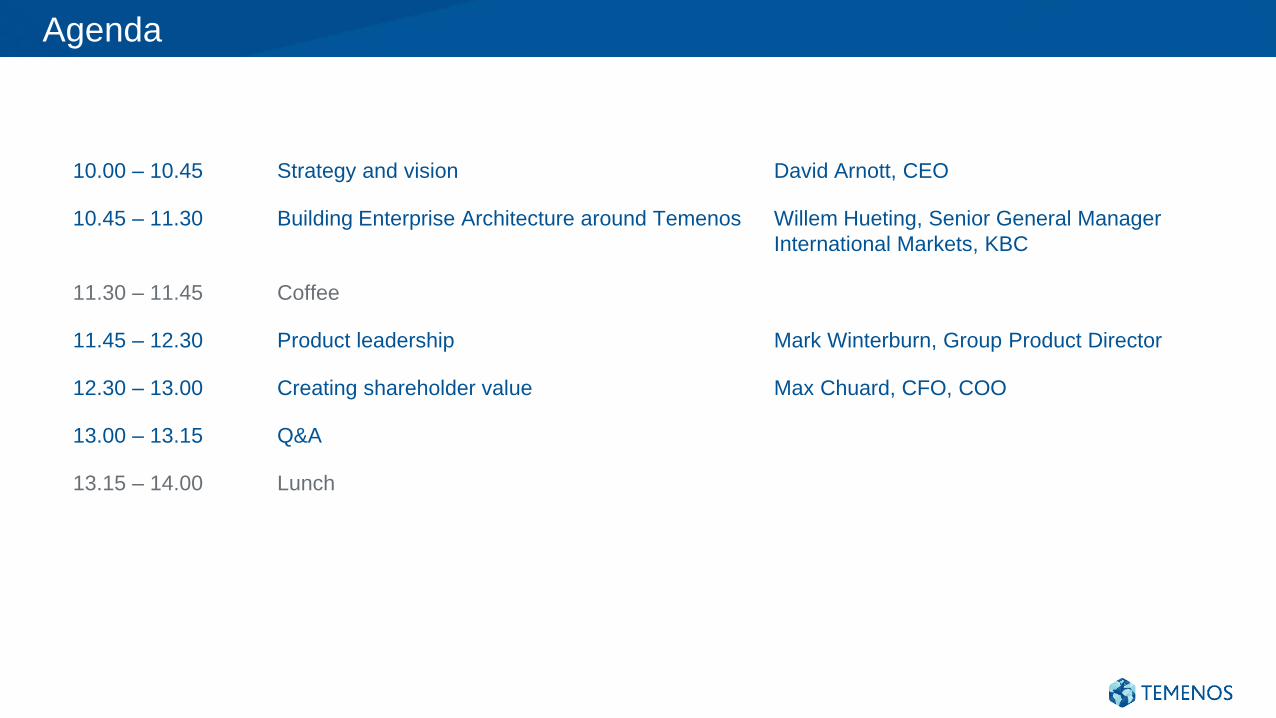
Agenda
10.00 – 10.45 Strategy and vision David Arnott, CEO
10.45 – 11.30 Building Enterprise Architecture around Temenos Willem Hueting, Senior General Manager
International Markets, KBC
11.30 – 11.45 Coffee
11.45 – 12.30 Product leadership Mark Winterburn, Group Product Director
12.30 – 13.00 Creating shareholder value Max Chuard, CFO, COO
13.00 – 13.15 Q&A
13.15 – 14.00 Lunch
Strategy and
VisionDavid Arnott, CEO
14 February 2018
Key messages
We are best placed to capitalize on the opportunity
2017 was another outstanding year
Strategy to deliver sustained growth
Market growth underpinned by structural drivers
5
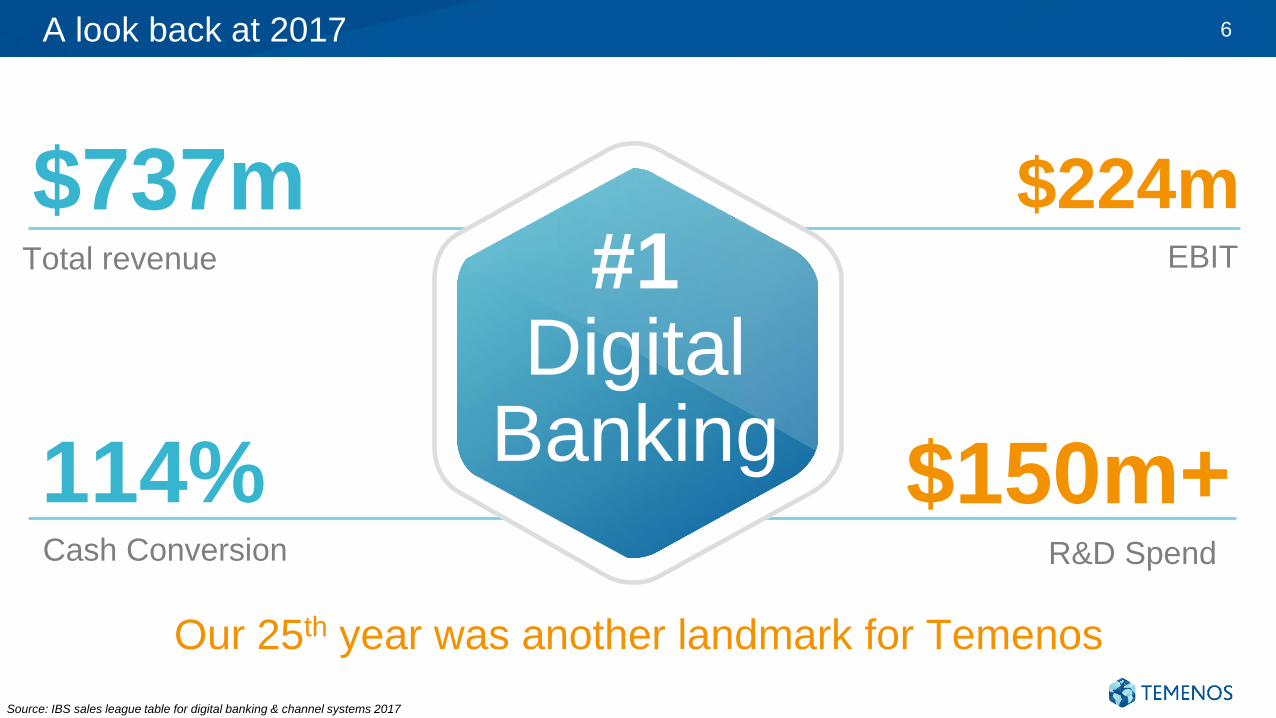
A look back at 2017 6
#1Digital
Banking114%Cash Conversion
$737mTotal revenue
$224mEBIT
$150m+R&D Spend
Our 25th year was another landmark for Temenos
Source: IBS sales league table for digital banking & channel systems 2017
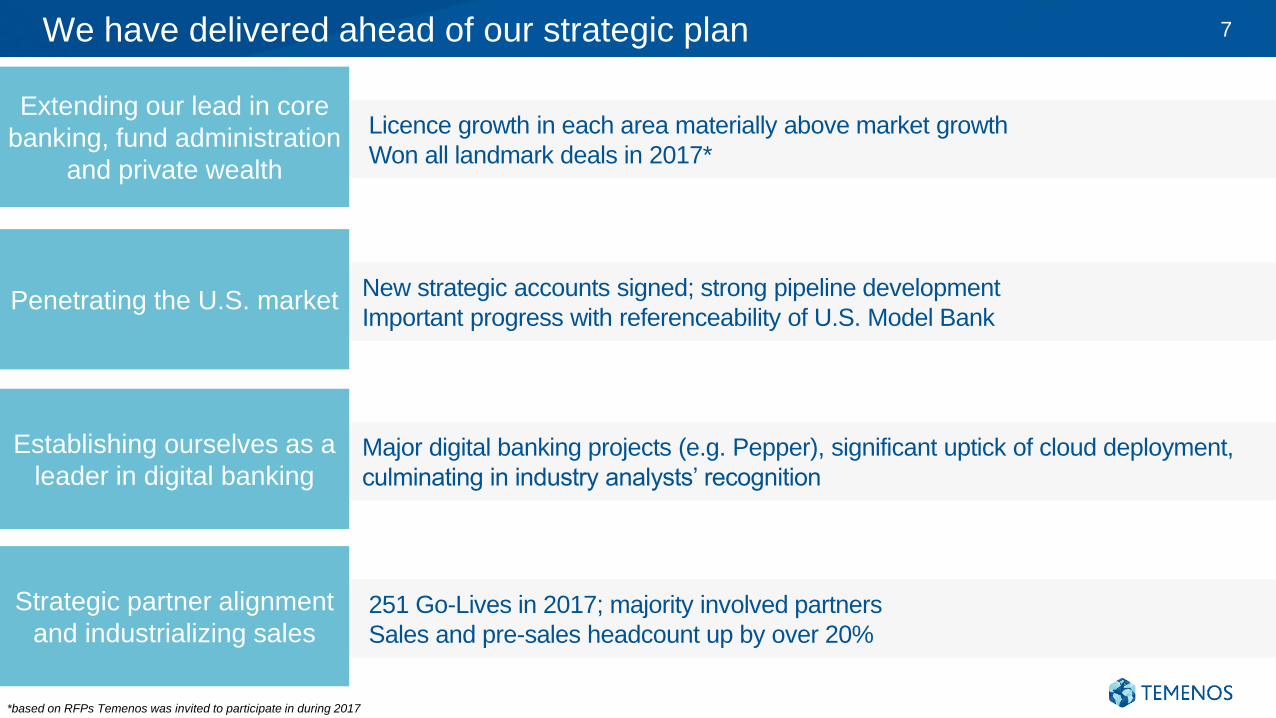
We have delivered ahead of our strategic plan
Licence growth in each area materially above market growth
Won all landmark deals in 2017*
7
Extending our lead in core
banking, fund administration
and private wealth
New strategic accounts signed; strong pipeline development
Important progress with referenceability of U.S. Model BankPenetrating the U.S. market
Major digital banking projects (e.g. Pepper), significant uptick of cloud deployment,
culminating in industry analysts’ recognition
Establishing ourselves as a
leader in digital banking
251 Go-Lives in 2017; majority involved partners
Sales and pre-sales headcount up by over 20%
Strategic partner alignment
and industrializing sales
*based on RFPs Temenos was invited to participate in during 2017
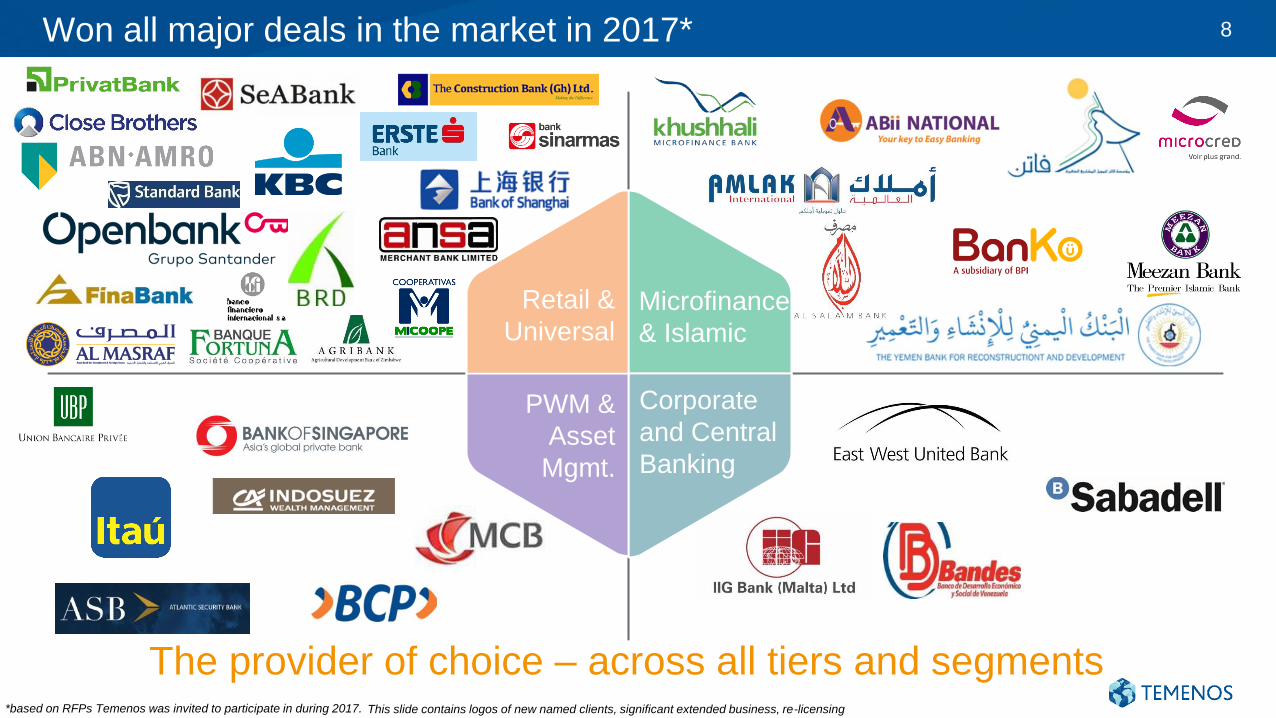
Won all major deals in the market in 2017* 8
The provider of choice – across all tiers and segments
Microfinance
& Islamic
Corporate
and Central
Banking
Retail &
Universal
PWM &
Asset
Mgmt.
This slide contains logos of new named clients, significant extended business, re-licensing*based on RFPs Temenos was invited to participate in during 2017.
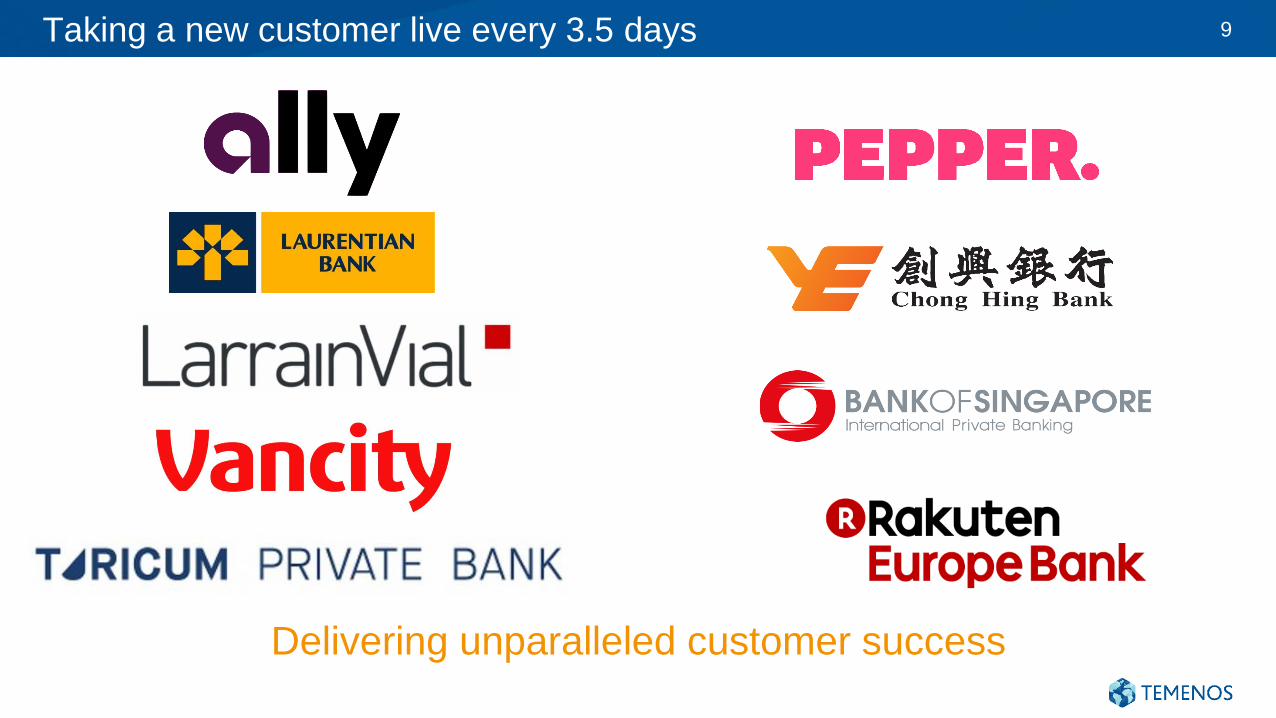
Taking a new customer live every 3.5 days 9
Delivering unparalleled customer success
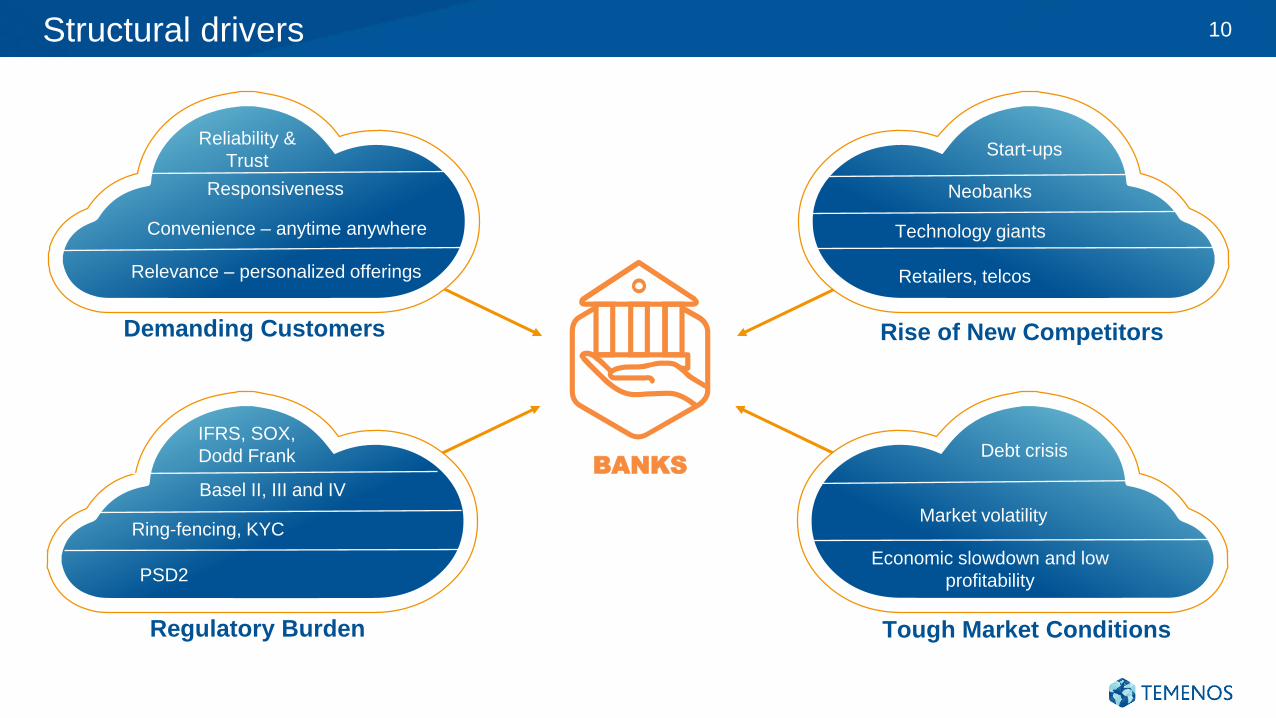
Structural drivers 10
BANKS
Demanding Customers
Regulatory Burden
Rise of New Competitors
Relevance – personalized offerings
Tough Market Conditions
Economic slowdown and low
profitability
Neobanks
Technology giants
Retailers, telcos
Reliability &
Trust
Debt crisis
Start-ups
Market volatility
Convenience – anytime anywhere
Responsiveness
PSD2
IFRS, SOX,
Dodd Frank
Basel II, III and IV
Ring-fencing, KYC
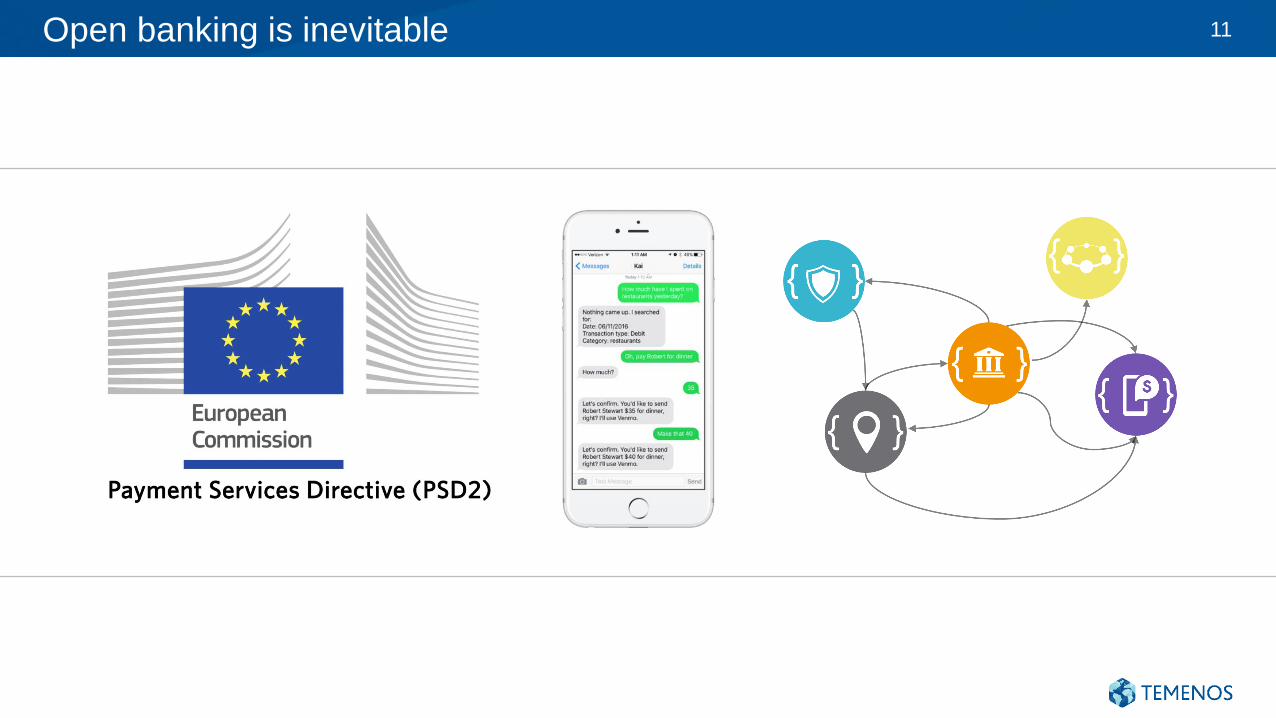
Open banking is inevitable 11
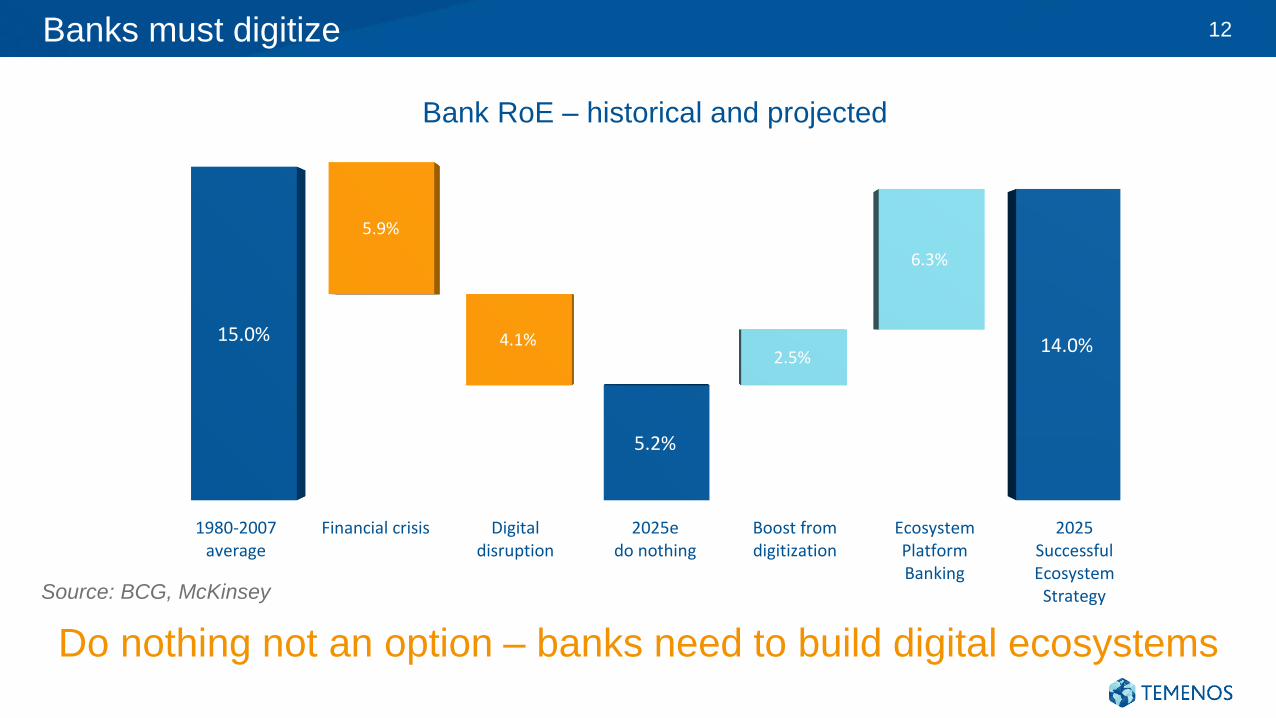
Banks must digitize 12
Do nothing not an option – banks need to build digital ecosystems
Source: BCG, McKinsey
1980-2007average
Financial crisis Digitaldisruption
2025edo nothing
Boost fromdigitization
EcosystemPlatformBanking
2025SuccessfulEcosystem
Strategy
15.0%
5.2% 5.2%
7.7%
14.0%
5.9%
4.1%2.5%
6.3%
Bank RoE – historical and projected
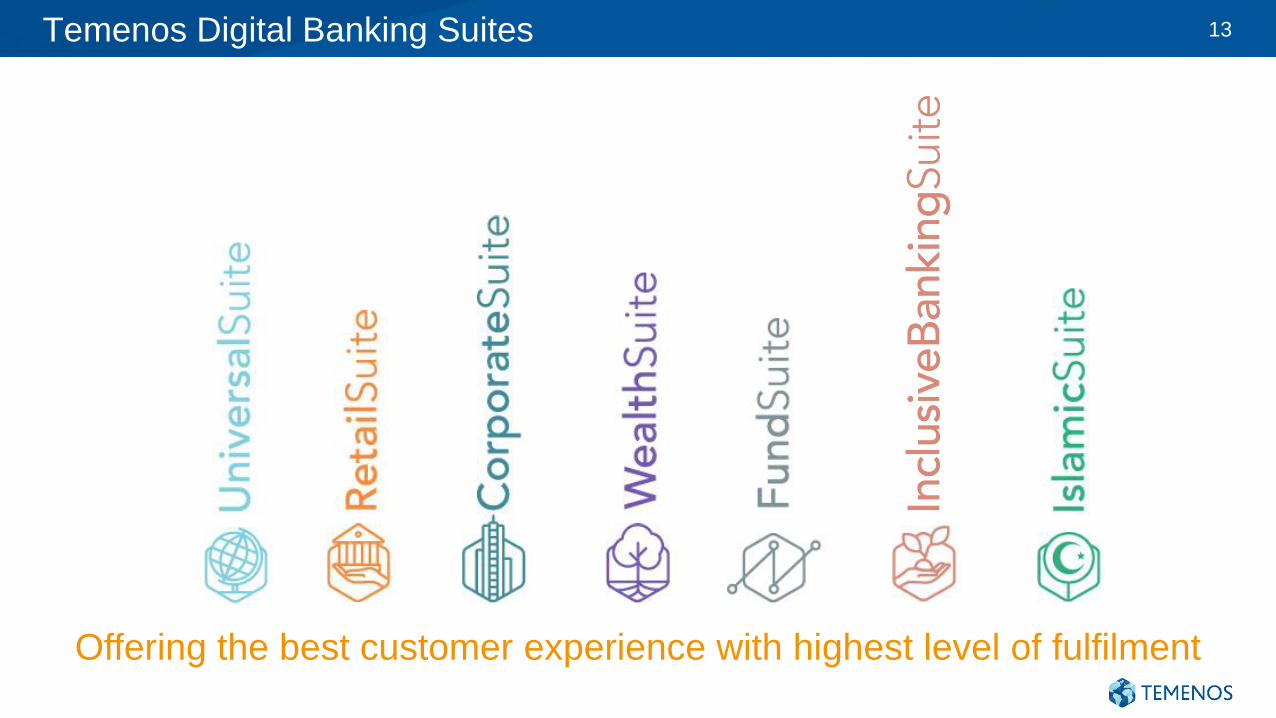
Temenos Digital Banking Suites
Offering the best customer experience with highest level of fulfilment
13
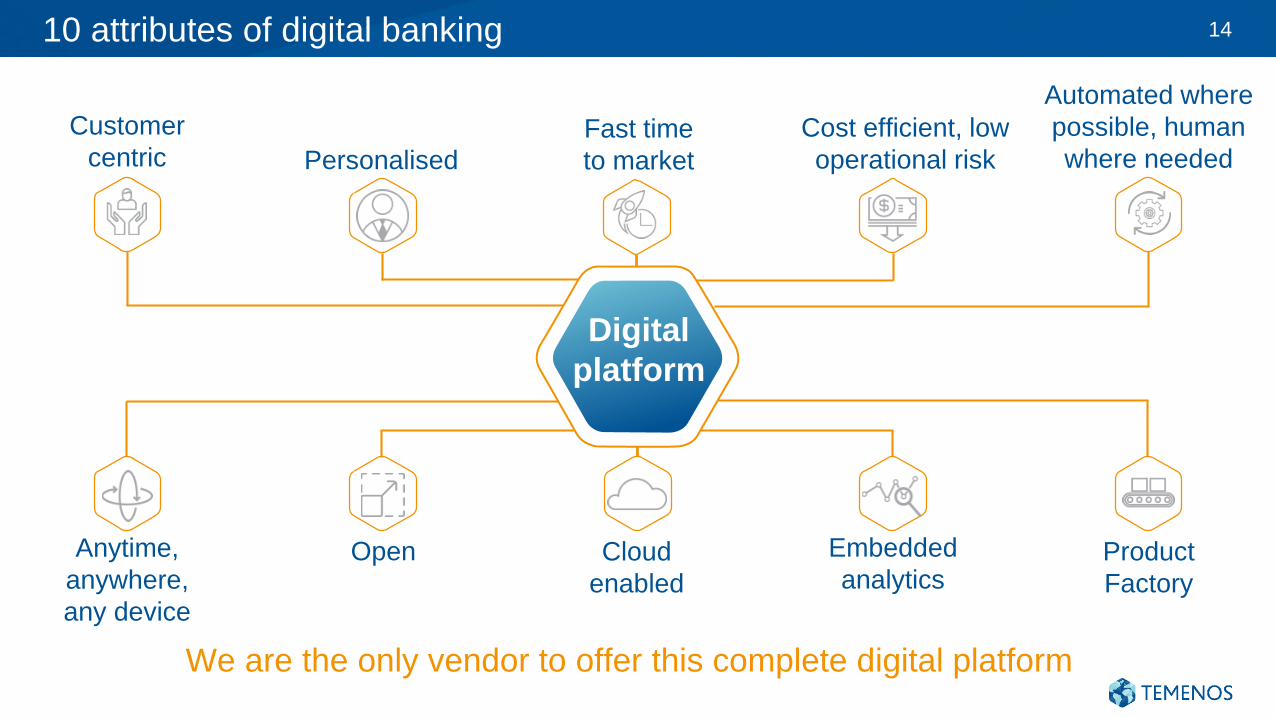
10 attributes of digital banking
Cloud
enabled
Automated where
possible, human
where needed
Product
Factory
Embedded
analyticsOpen
Cost efficient, low
operational risk
Anytime,
anywhere,
any device
Customer
centric Personalised
Fast time
to market
Digital
platform
We are the only vendor to offer this complete digital platform
14
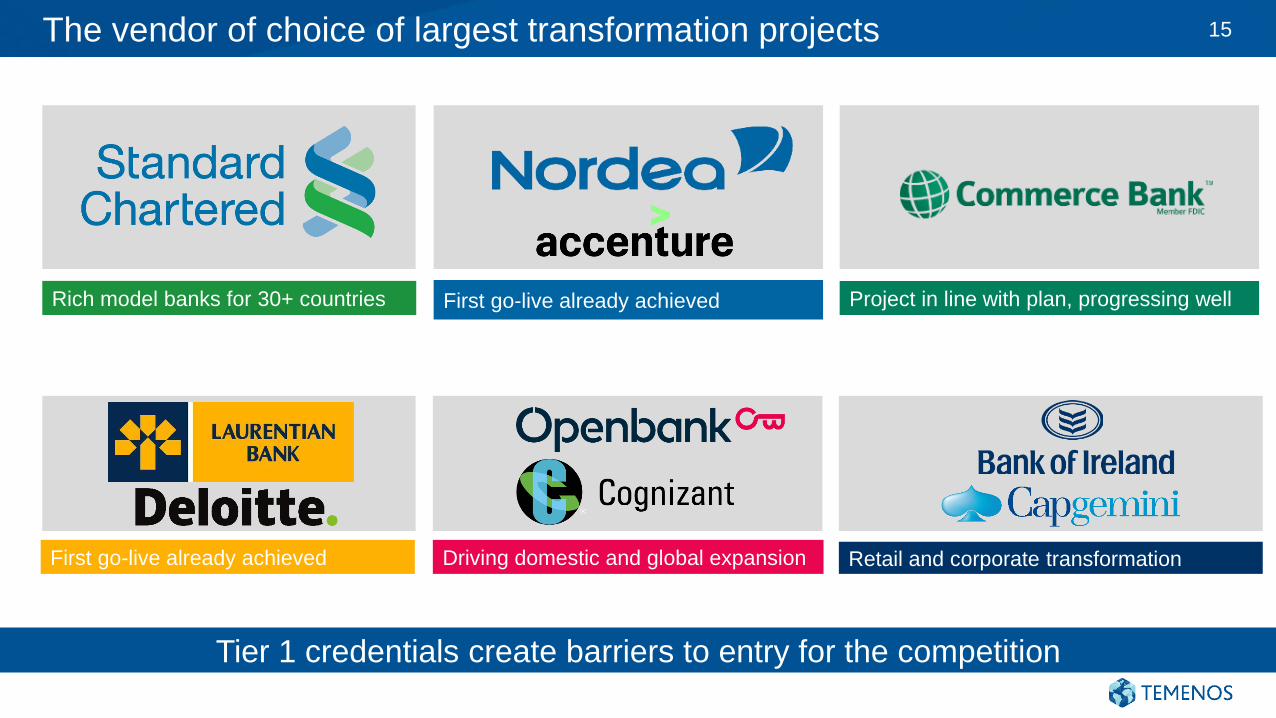
The vendor of choice of largest transformation projects 15
Tier 1 credentials create barriers to entry for the competition
Retail and corporate transformation
Rich model banks for 30+ countries Project in line with plan, progressing wellFirst go-live already achieved
First go-live already achieved Driving domestic and global expansion
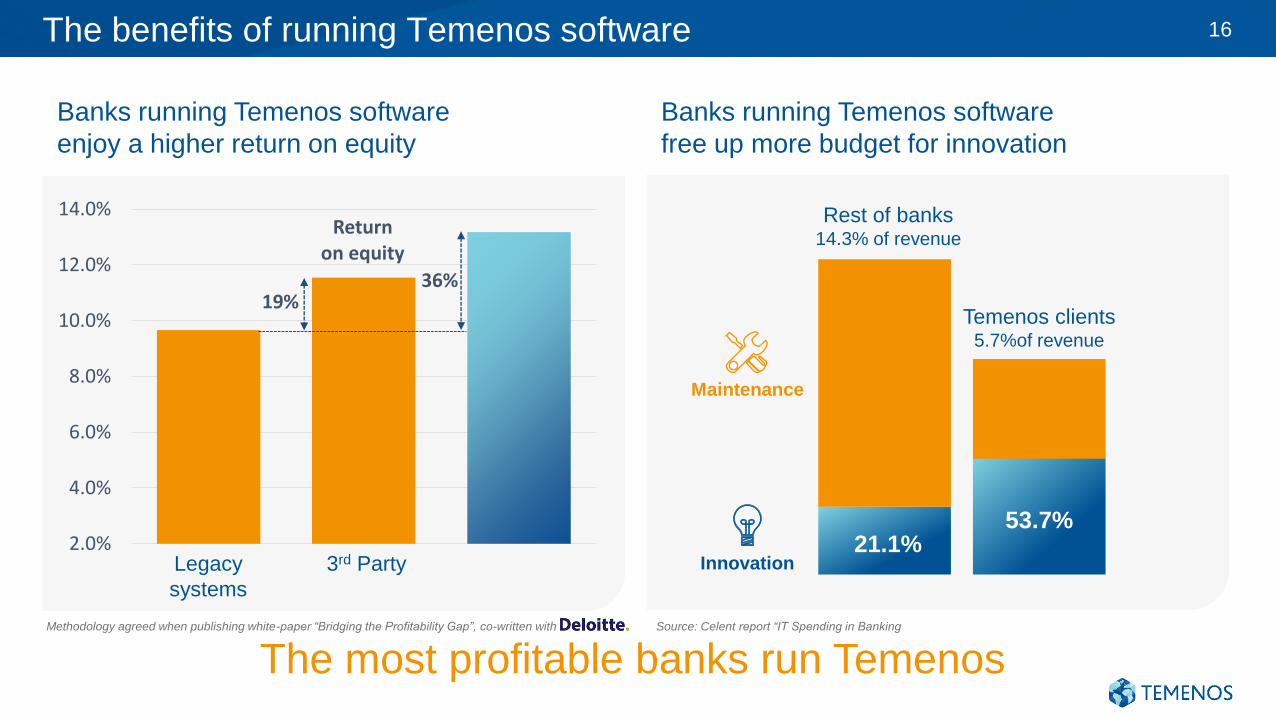
The benefits of running Temenos software
Banks running Temenos software
enjoy a higher return on equity
Banks running Temenos software
free up more budget for innovation
2.0%
4.0%
6.0%
8.0%
10.0%
12.0%
14.0%Return
on equity
19%36%
Legacy
systems
3rd Party
Methodology agreed when publishing white-paper “Bridging the Profitability Gap”, co-written with Source: Celent report “IT Spending in Banking
Rest of banks14.3% of revenue
21.1%
Temenos clients5.7%of revenue
53.7%
Innovation
Maintenance
The most profitable banks run Temenos
16
Looking forward
0.0
5.0
10.0
15.0
20.0
25.0
30.0
35.0
40.0
45.0
50.0
Total Addressable Spend Third-party spend today Medium term third-party spend
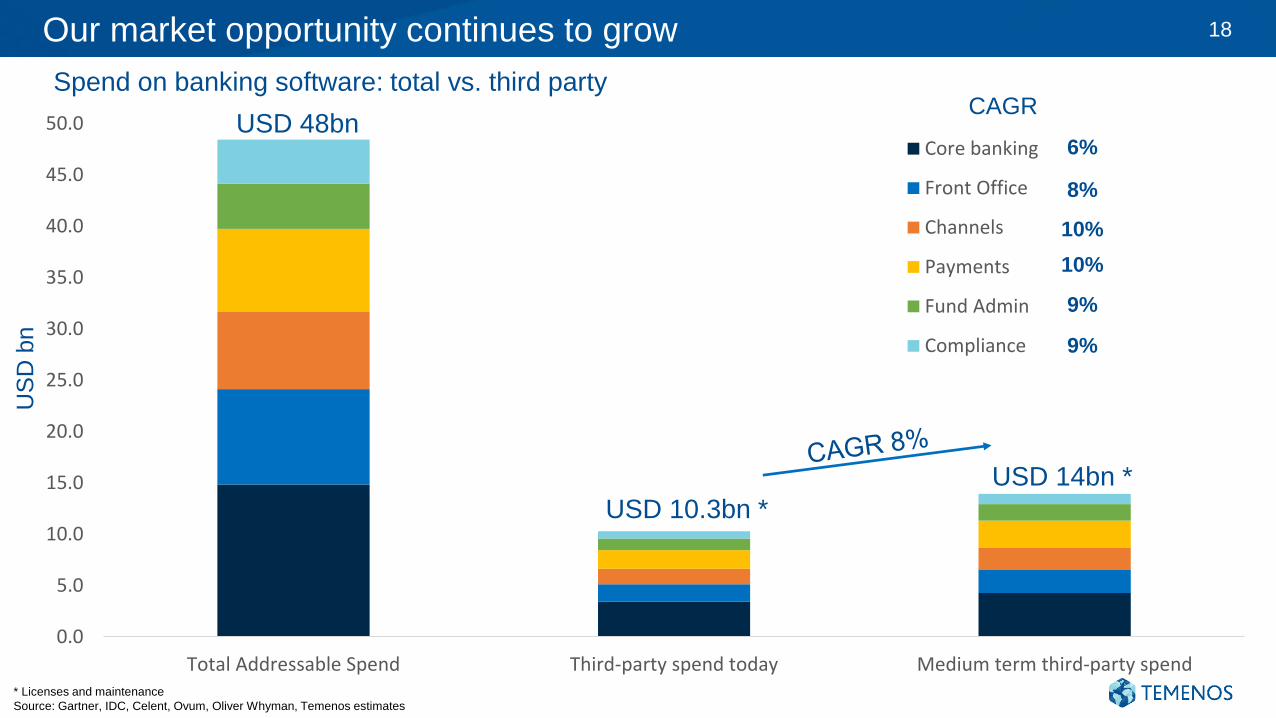
Core banking
Front Office
Channels
Payments
Fund Admin
Compliance
Our market opportunity continues to grow 18
6%
CAGR
US
D b
n
USD 48bn
USD 10.3bn *
USD 14bn *
8%
10%
10%
9%
9%
Spend on banking software: total vs. third party
* Licenses and maintenance
Source: Gartner, IDC, Celent, Ovum, Oliver Whyman, Temenos estimates
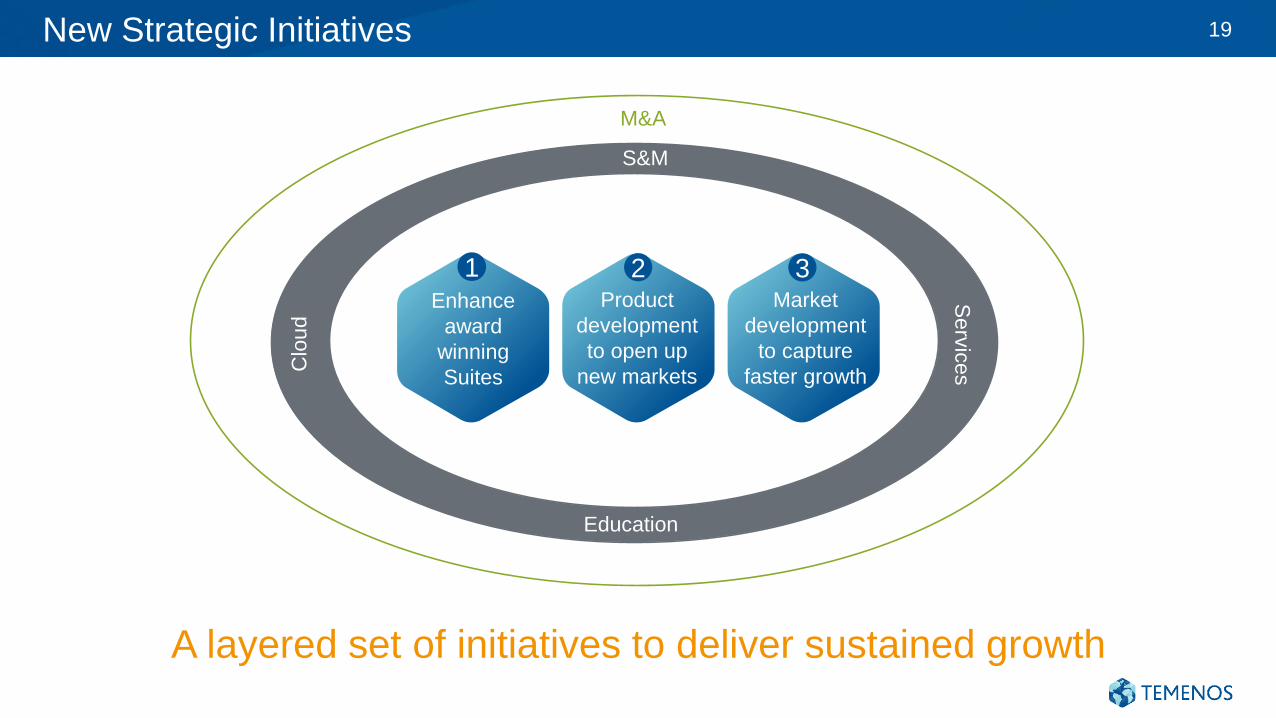
New Strategic Initiatives 19
A layered set of initiatives to deliver sustained growth
S&M
Serv
ices
Clo
ud
Education
M&A
Enhance
award
winning
Suites
1Product
development
to open up
new markets
2Market
development
to capture
faster growth
3
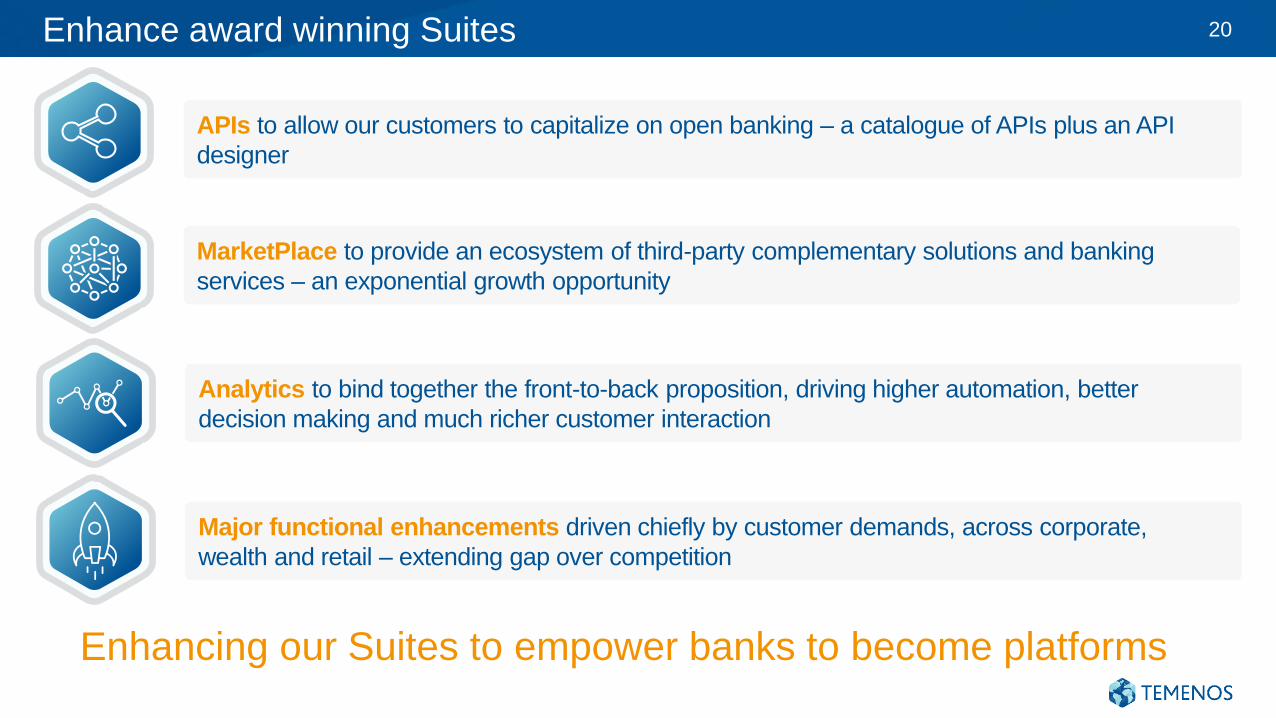
Enhance award winning Suites 20
Enhancing our Suites to empower banks to become platforms
APIs to allow our customers to capitalize on open banking – a catalogue of APIs plus an API
designer
MarketPlace to provide an ecosystem of third-party complementary solutions and banking
services – an exponential growth opportunity
Analytics to bind together the front-to-back proposition, driving higher automation, better
decision making and much richer customer interaction
Major functional enhancements driven chiefly by customer demands, across corporate,
wealth and retail – extending gap over competition
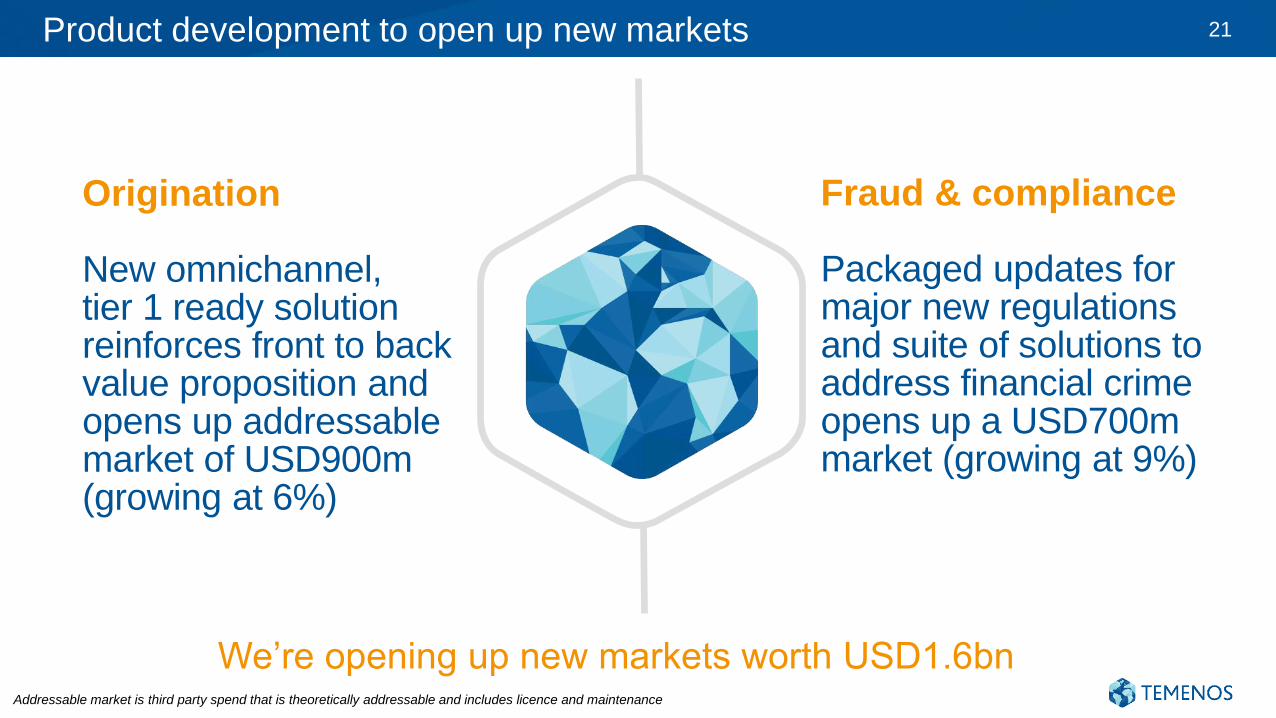
Product development to open up new markets 21
We’re opening up new markets worth USD1.6bnAddressable market is third party spend that is theoretically addressable and includes licence and maintenance
Fraud & compliance
Packaged updates for major new regulations and suite of solutions to address financial crime opens up a USD700m market (growing at 9%)
Origination
New omnichannel, tier 1 ready solution reinforces front to back value proposition and opens up addressable market of USD900m (growing at 6%)
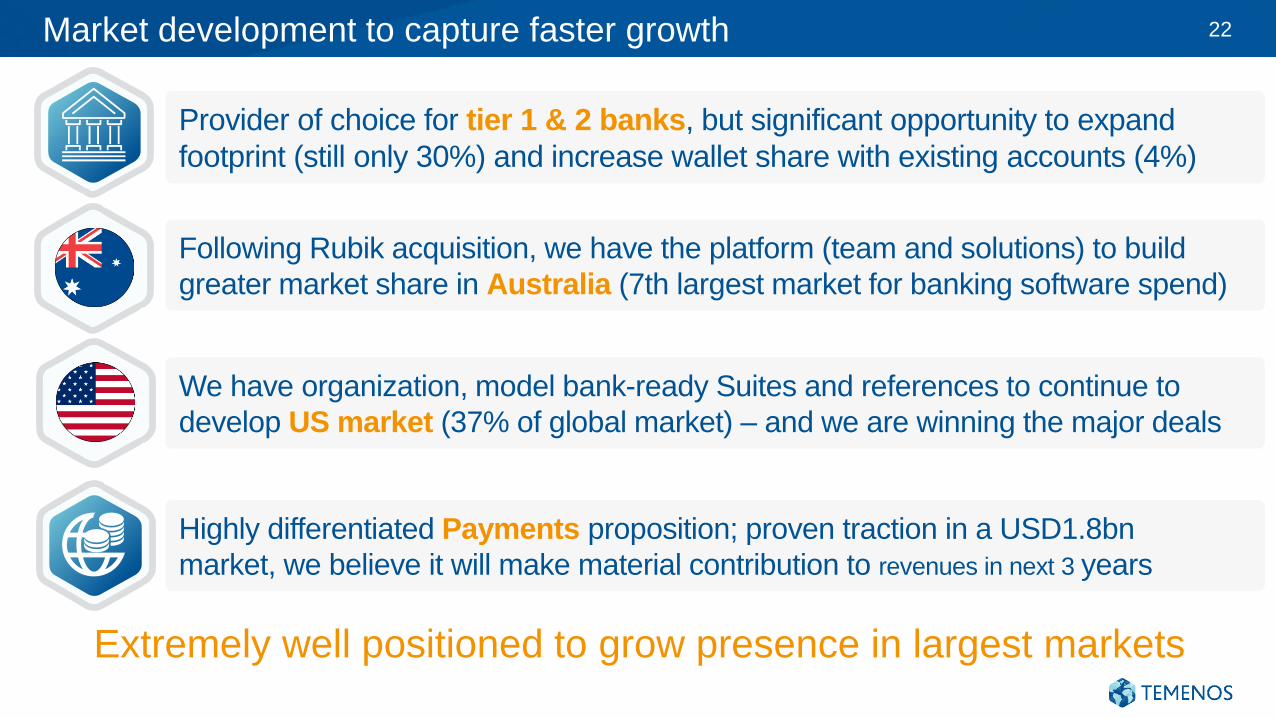
Market development to capture faster growth 22
Extremely well positioned to grow presence in largest markets
Provider of choice for tier 1 & 2 banks, but significant opportunity to expand
footprint (still only 30%) and increase wallet share with existing accounts (4%)
Following Rubik acquisition, we have the platform (team and solutions) to build
greater market share in Australia (7th largest market for banking software spend)
We have organization, model bank-ready Suites and references to continue to
develop US market (37% of global market) – and we are winning the major deals
Highly differentiated Payments proposition; proven traction in a USD1.8bn
market, we believe it will make material contribution to revenues in next 3 years
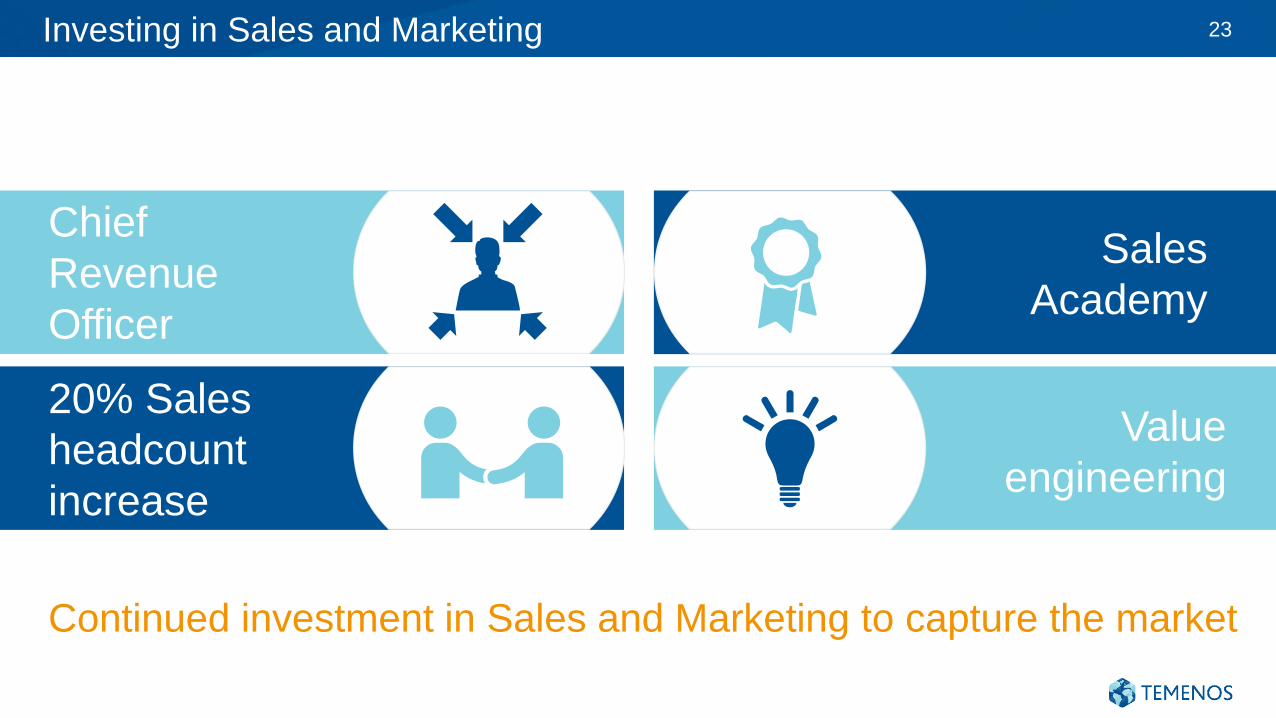
Investing in Sales and Marketing 23
Chief
Revenue
Officer
20% Sales
headcount
increase
Sales
Academy
Value
engineering
Continued investment in Sales and Marketing to capture the market
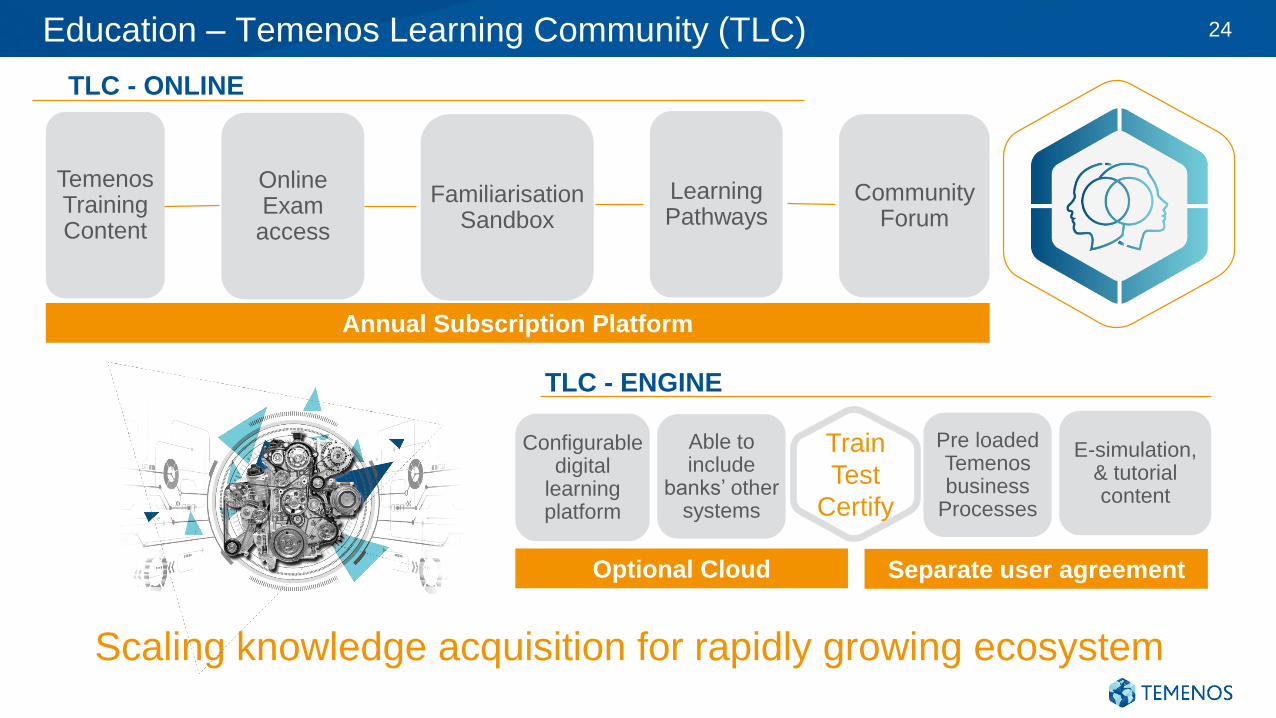
TLC - ENGINE
Education – Temenos Learning Community (TLC) 24
TLC - ONLINE
Temenos Training Content
Online Exam
access
Community Forum
Annual Subscription Platform
Configurable digital
learning platform
Able to include
banks’ other systems
Train
Test
Certify
Optional Cloud Separate user agreement
Pre loadedTemenos business
Processes
E-simulation, & tutorial content
Scaling knowledge acquisition for rapidly growing ecosystem
Familiarisation Sandbox
Learning Pathways
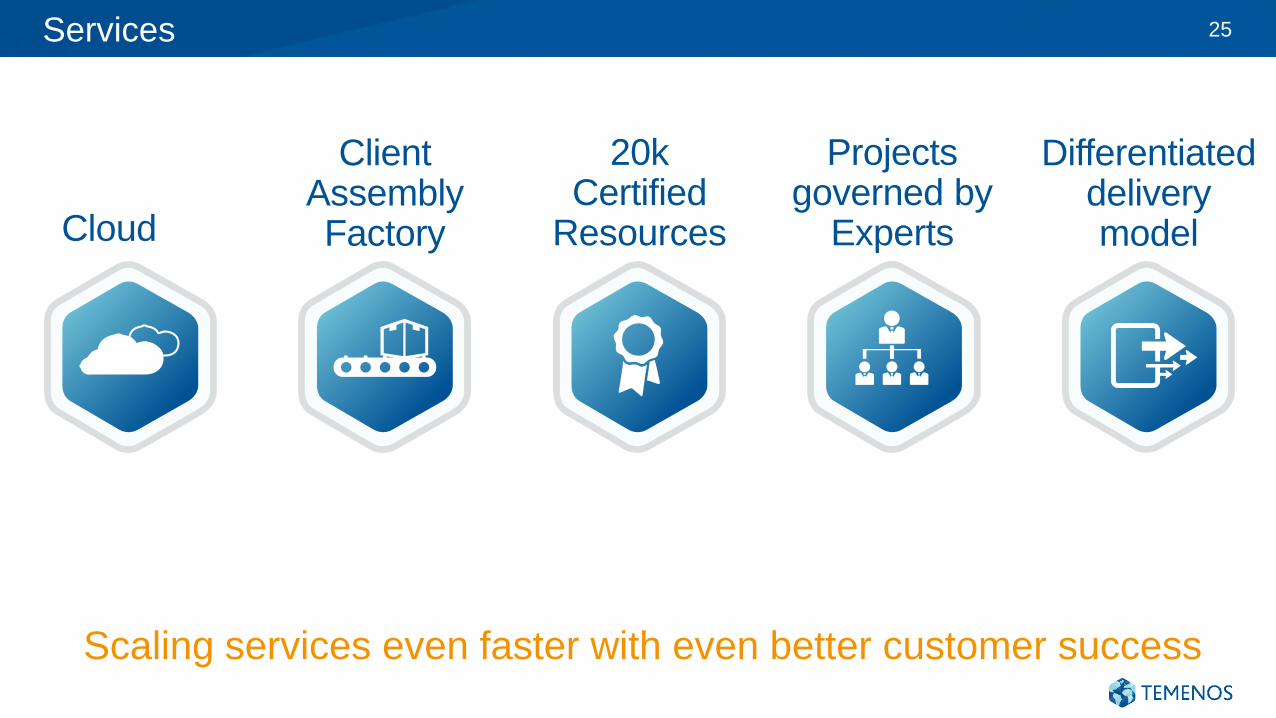
Services 25
20kCertified
Resources
Projects governed by
Experts
Client Assembly Factory
Differentiated delivery modelCloud
Scaling services even faster with even better customer success
Implement on Cloud
Partner
Resources
Test on Cloud Run on Cloud
Cloud 26
Leverage cloud for faster, more cost-effective implementation & deployment
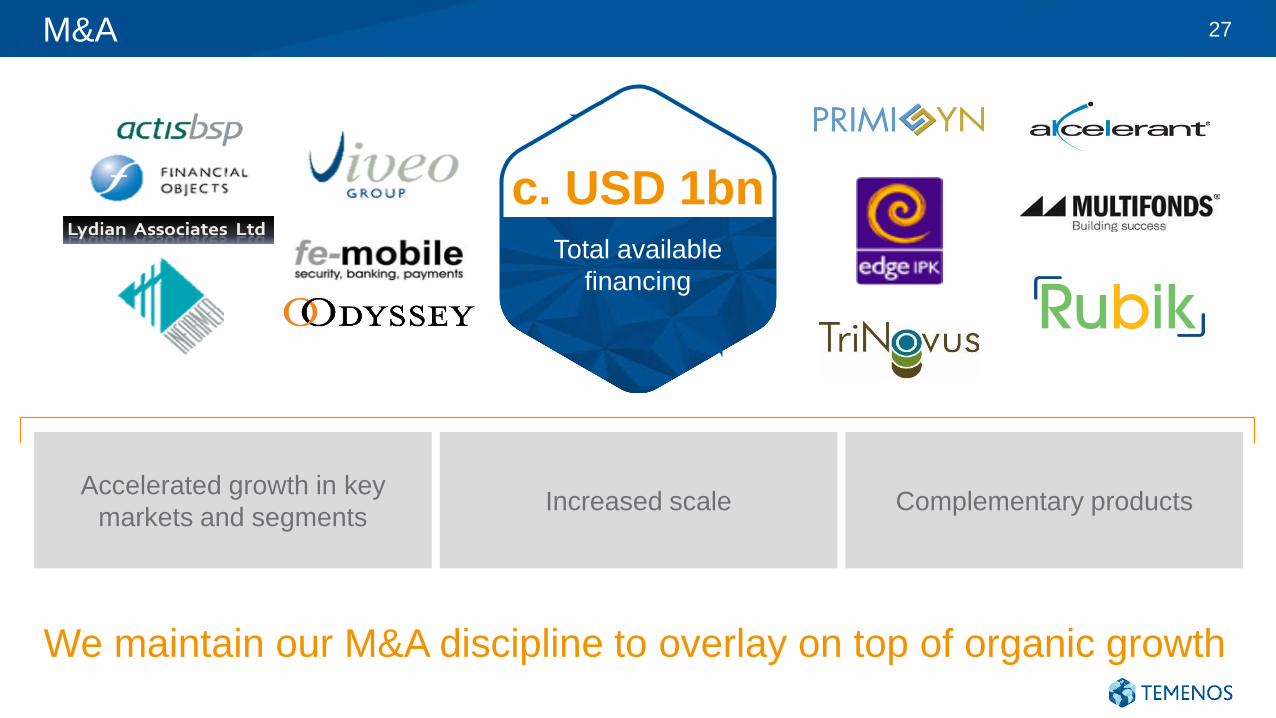
M&A 27
c. USD 1bnTotal available
financing
We maintain our M&A discipline to overlay on top of organic growth
Accelerated growth in key
markets and segmentsIncreased scale Complementary products
Key messages
We are best placed to capitalize on the opportunity
2017 was another outstanding year
Strategy to deliver sustained growth
Market growth underpinned by structural drivers
28
29
Temenos Capital Markets Day
London, 14 February 2018
BE@TBuilding Enterprise Architecture around Temenos
30
31
Agenda
1. KBC Business Profile
2. KBC Group Strategy
3. Group-wide digital transformation
4. Temenos in BU IM
32
1. KBC’s Business Profile
33
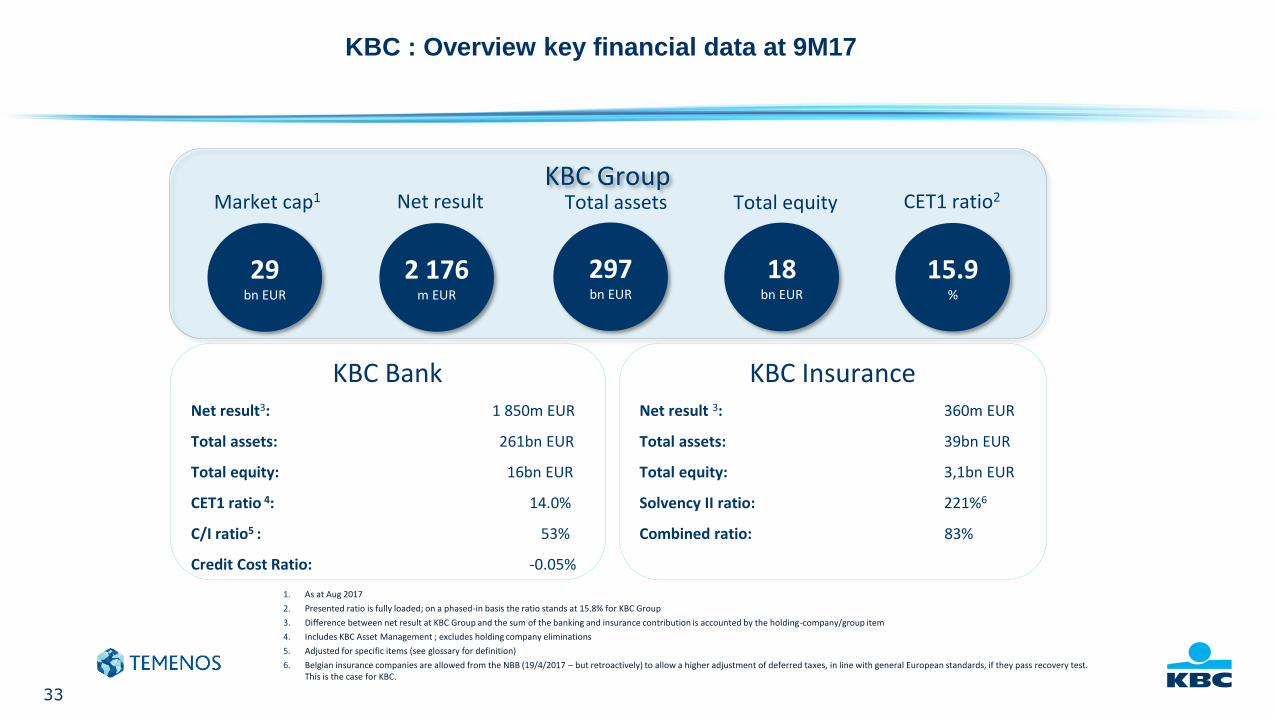
KBC : Overview key financial data at 9M17
KBC Group
29bn EUR
2 176m EUR
297bn EUR
18bn EUR
15.9%
Market cap1 Net result Total assets Total equity CET1 ratio2
KBC BankNet result3: 1 850m EUR
Total assets: 261bn EUR
Total equity: 16bn EUR
CET1 ratio 4: 14.0%
C/I ratio5 : 53%
Credit Cost Ratio: -0.05%
KBC InsuranceNet result 3: 360m EUR
Total assets: 39bn EUR
Total equity: 3,1bn EUR
Solvency II ratio: 221%6
Combined ratio: 83%
1. As at Aug 2017
2. Presented ratio is fully loaded; on a phased-in basis the ratio stands at 15.8% for KBC Group
3. Difference between net result at KBC Group and the sum of the banking and insurance contribution is accounted by the holding-company/group item
4. Includes KBC Asset Management ; excludes holding company eliminations
5. Adjusted for specific items (see glossary for definition)
6. Belgian insurance companies are allowed from the NBB (19/4/2017 – but retroactively) to allow a higher adjustment of deferred taxes, in line with general European standards, if they pass recovery test. This is the case for KBC.
34
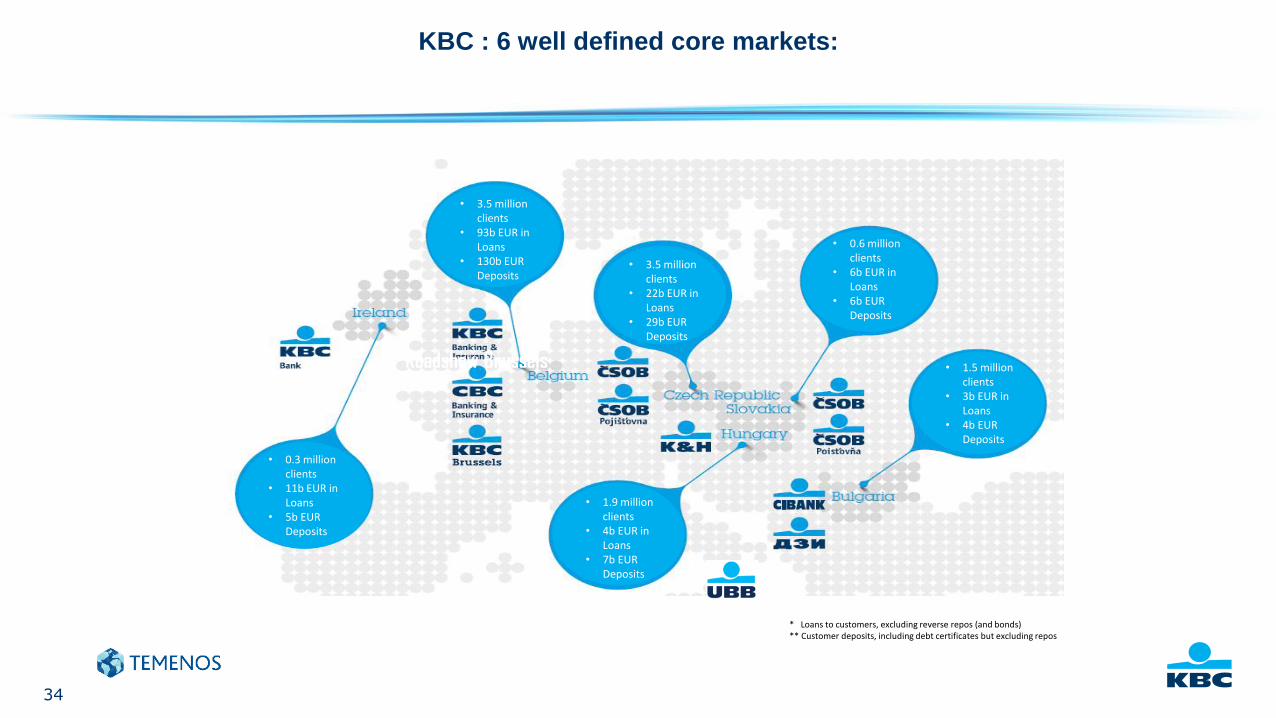
KBC : 6 well defined core markets:
• 3.5 million clients
• 93b EUR in Loans
• 130b EUR Deposits
• 3.5 million clients
• 22b EUR in Loans
• 29b EUR Deposits
• 0.6 million clients
• 6b EUR in Loans
• 6b EUR Deposits
• 1.5 million clients
• 3b EUR in Loans
• 4b EUR Deposits
• 1.9 million clients
• 4b EUR in Loans
• 7b EUR Deposits
• 0.3 million clients
• 11b EUR in Loans
• 5b EUR Deposits
* Loans to customers, excluding reverse repos (and bonds) ** Customer deposits, including debt certificates but excluding repos
Roadshow Brussels
35
2. KBC Group Strategy
36
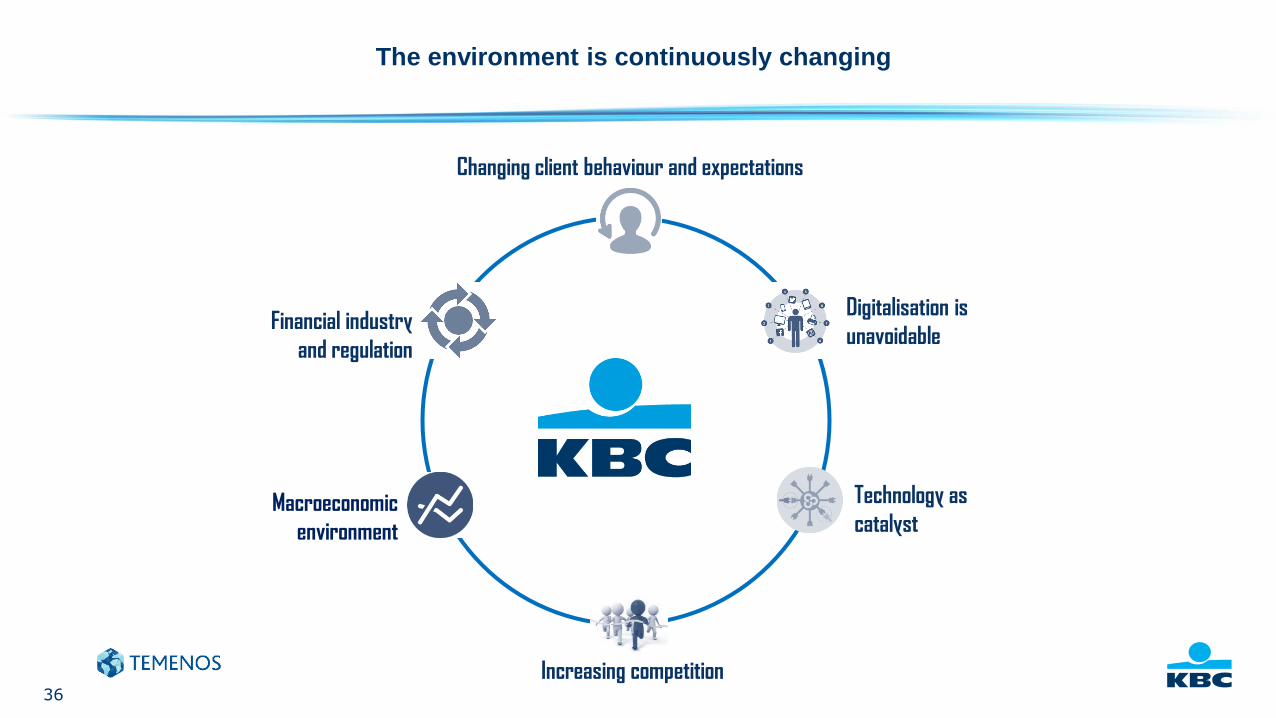
The environment is continuously changing
Changing client behaviour and expectations
Macroeconomic
environment
Technology as
catalyst
Increasing competition
Financial industry
and regulation
Digitalisation is
unavoidable
37
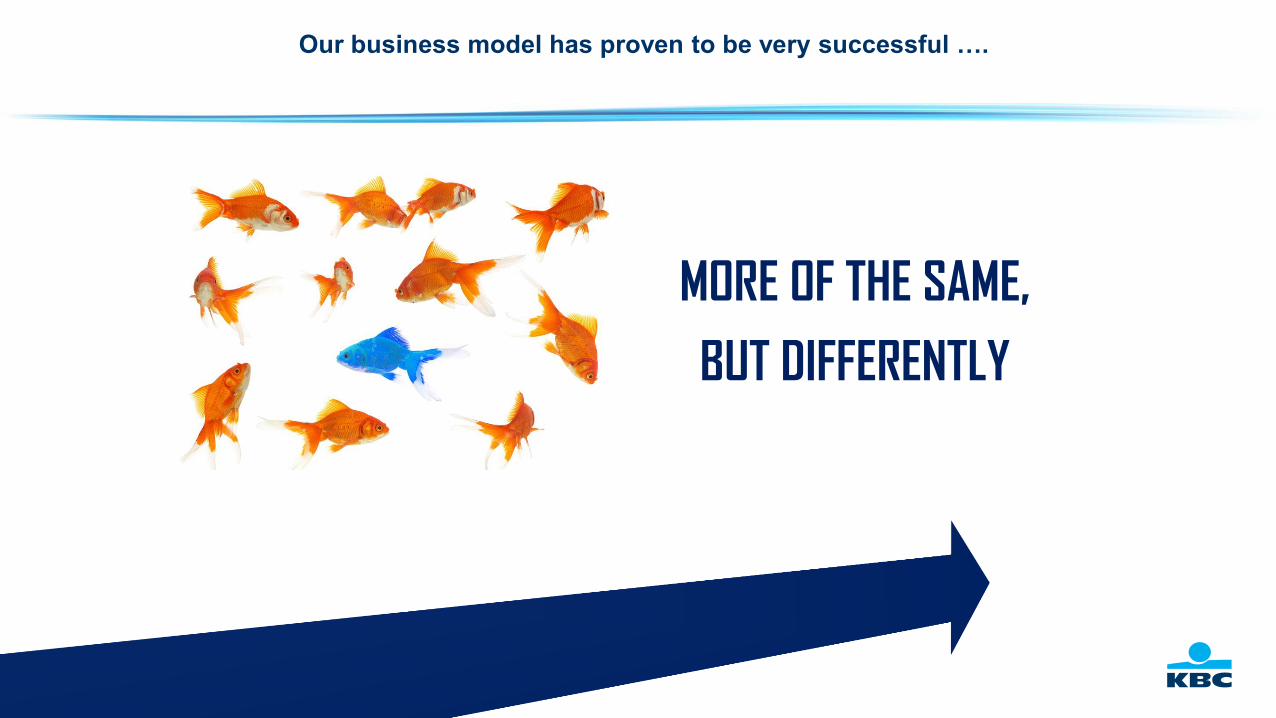
Our business model has proven to be very successful ….
MORE OF THE SAME,
BUT DIFFERENTLY
38
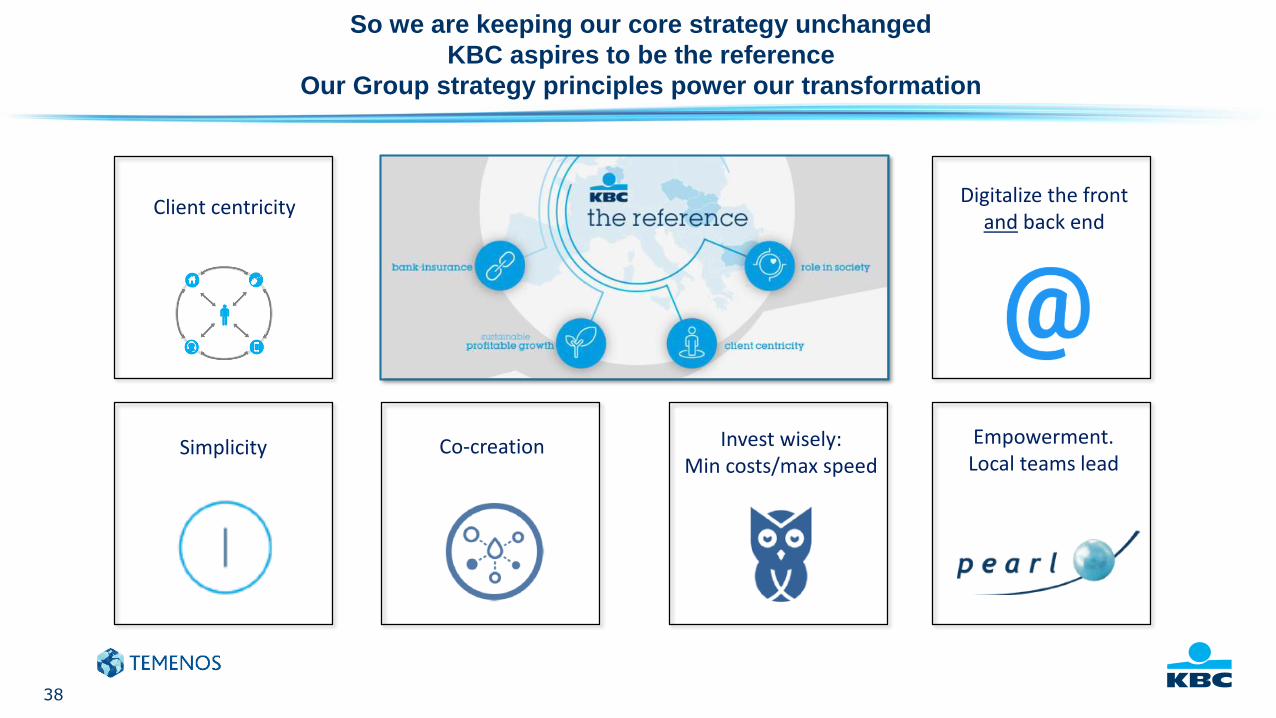
So we are keeping our core strategy unchanged
KBC aspires to be the reference
Our Group strategy principles power our transformation
Client centricity
Simplicity Co-creation
Digitalize the front and back end
Invest wisely:Min costs/max speed
Empowerment. Local teams lead
39
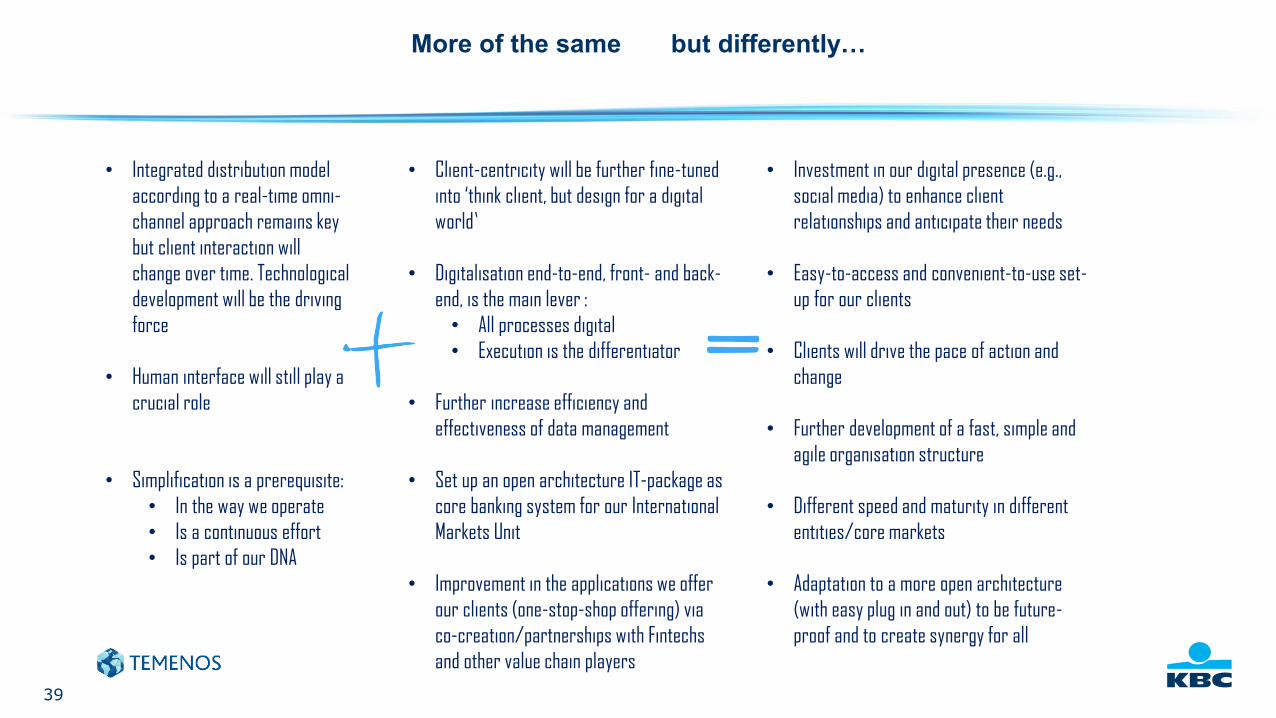
More of the same but differently…
• Integrated distribution model
according to a real-time omni-
channel approach remains key
but client interaction will
change over time. Technological
development will be the driving
force
• Human interface will still play a
crucial role
• Simplification is a prerequisite:
• In the way we operate
• Is a continuous effort
• Is part of our DNA
• Client-centricity will be further fine-tuned
into ‘think client, but design for a digital
world’
• Digitalisation end-to-end, front- and back-
end, is the main lever :
• All processes digital
• Execution is the differentiator
• Further increase efficiency and
effectiveness of data management
• Set up an open architecture IT-package as
core banking system for our International
Markets Unit
• Improvement in the applications we offer
our clients (one-stop-shop offering) via
co-creation/partnerships with Fintechs
and other value chain players
• Investment in our digital presence (e.g.,
social media) to enhance client
relationships and anticipate their needs
• Easy-to-access and convenient-to-use set-
up for our clients
• Clients will drive the pace of action and
change
• Further development of a fast, simple and
agile organisation structure
• Different speed and maturity in different
entities/core markets
• Adaptation to a more open architecture
(with easy plug in and out) to be future-
proof and to create synergy for all
40
3. Group-wide digital
transformation
41
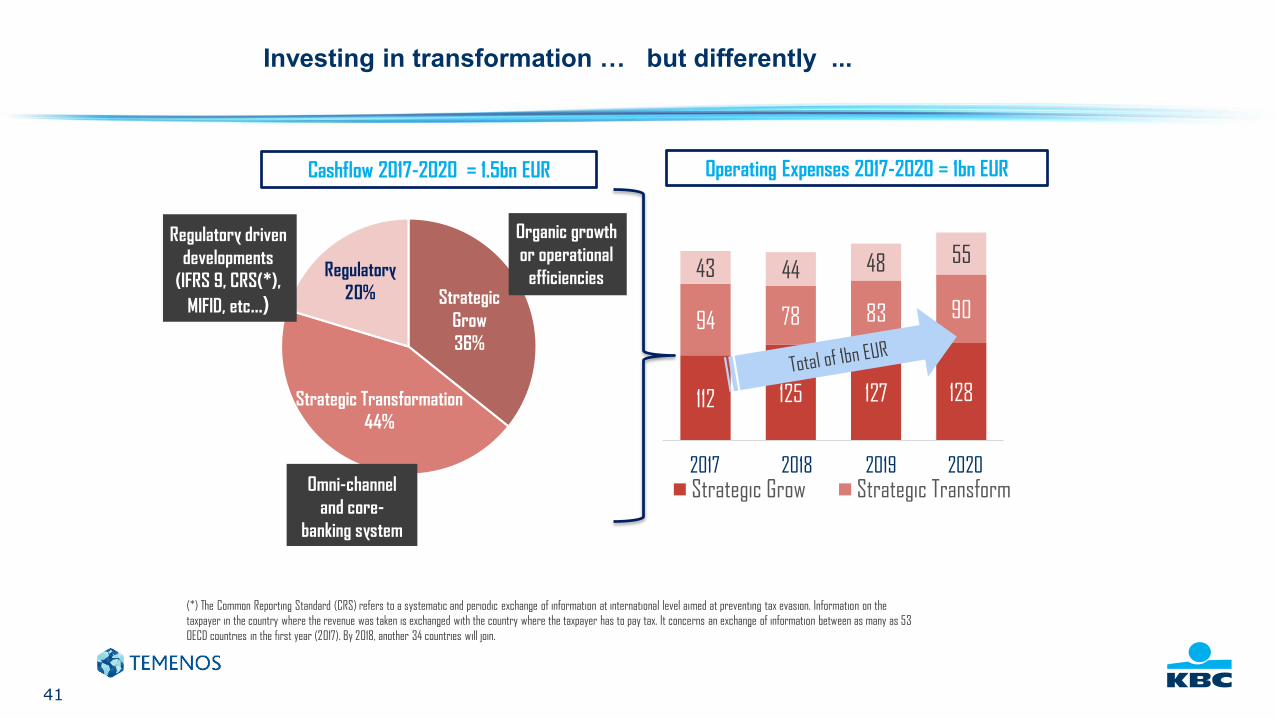
Investing in transformation … but differently ...
112 125 127 128
94 78 83 90
43 44 48 55
Strategic Grow Strategic Transform
Cashflow 2017-2020 = 1.5bn EUR Operating Expenses 2017-2020 = 1bn EUR
(*) The Common Reporting Standard (CRS) refers to a systematic and periodic exchange of information at international level aimed at preventing tax evasion. Information on the
taxpayer in the country where the revenue was taken is exchanged with the country where the taxpayer has to pay tax. It concerns an exchange of information between as many as 53
OECD countries in the first year (2017). By 2018, another 34 countries will join.
2017 2018 2019 2020
Regulatory driven
developments
(IFRS 9, CRS(*),
MIFID, etc...)
Omni-channel
and core-
banking system
Organic growth
or operational
efficienciesRegulatory
20% Strategic
Grow
36%
Strategic Transformation
44%
42
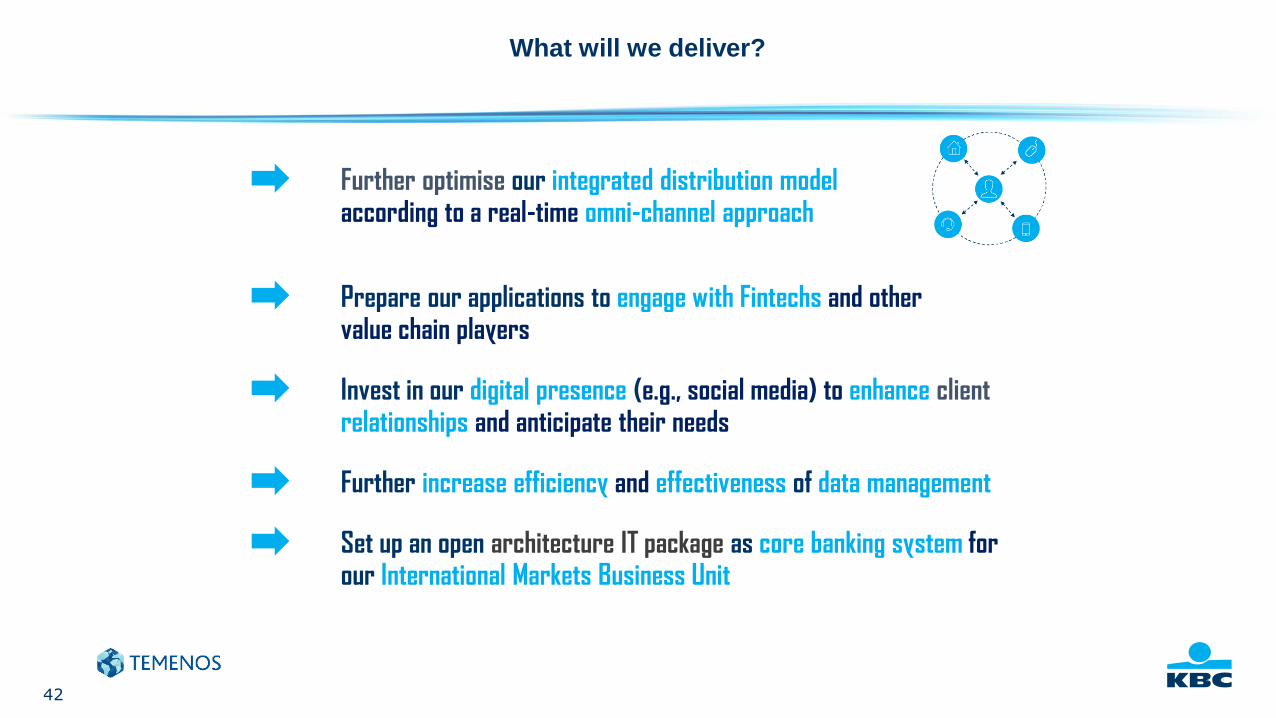
What will we deliver?
Further increase efficiency and effectiveness of data management
Set up an open architecture IT package as core banking system for our International Markets Business Unit
Further optimise our integrated distribution model according to a real-time omni-channel approach
Prepare our applications to engage with Fintechs and other value chain players
Invest in our digital presence (e.g., social media) to enhance client relationships and anticipate their needs
43
4. Temenos in BU IM
43
44
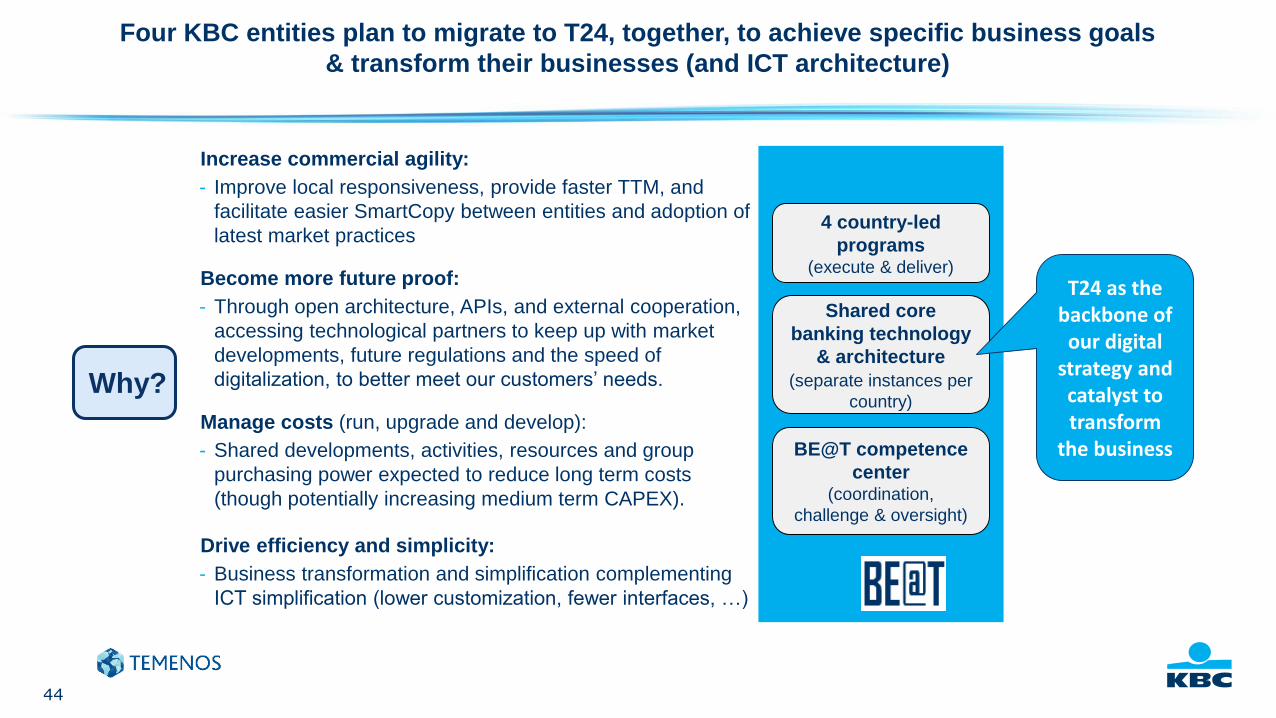
Shared core
banking technology
& architecture
(separate instances per
country)
Increase commercial agility:
- Improve local responsiveness, provide faster TTM, and
facilitate easier SmartCopy between entities and adoption of
latest market practices
Become more future proof:
- Through open architecture, APIs, and external cooperation,
accessing technological partners to keep up with market
developments, future regulations and the speed of
digitalization, to better meet our customers’ needs.
Manage costs (run, upgrade and develop):
- Shared developments, activities, resources and group
purchasing power expected to reduce long term costs
(though potentially increasing medium term CAPEX).
Drive efficiency and simplicity:
- Business transformation and simplification complementing
ICT simplification (lower customization, fewer interfaces, …)
Four KBC entities plan to migrate to T24, together, to achieve specific business goals
& transform their businesses (and ICT architecture)
4 country-led
programs(execute & deliver)
BE@T competence
center(coordination,
challenge & oversight)
Why?
T24 as the backbone of our digital
strategy and catalyst to transform
the business
45
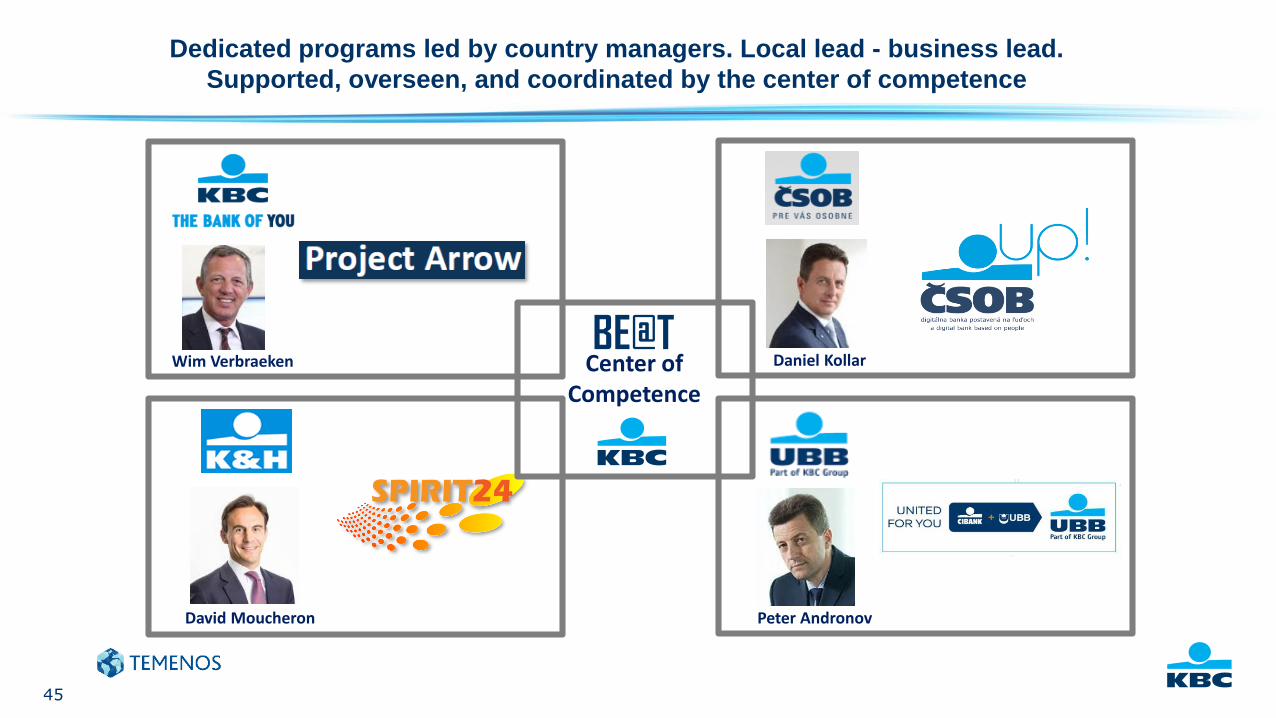
Dedicated programs led by country managers. Local lead - business lead.
Supported, overseen, and coordinated by the center of competence
David Moucheron Peter Andronov
Daniel KollarWim VerbraekenBE@T
Center of Competence
46
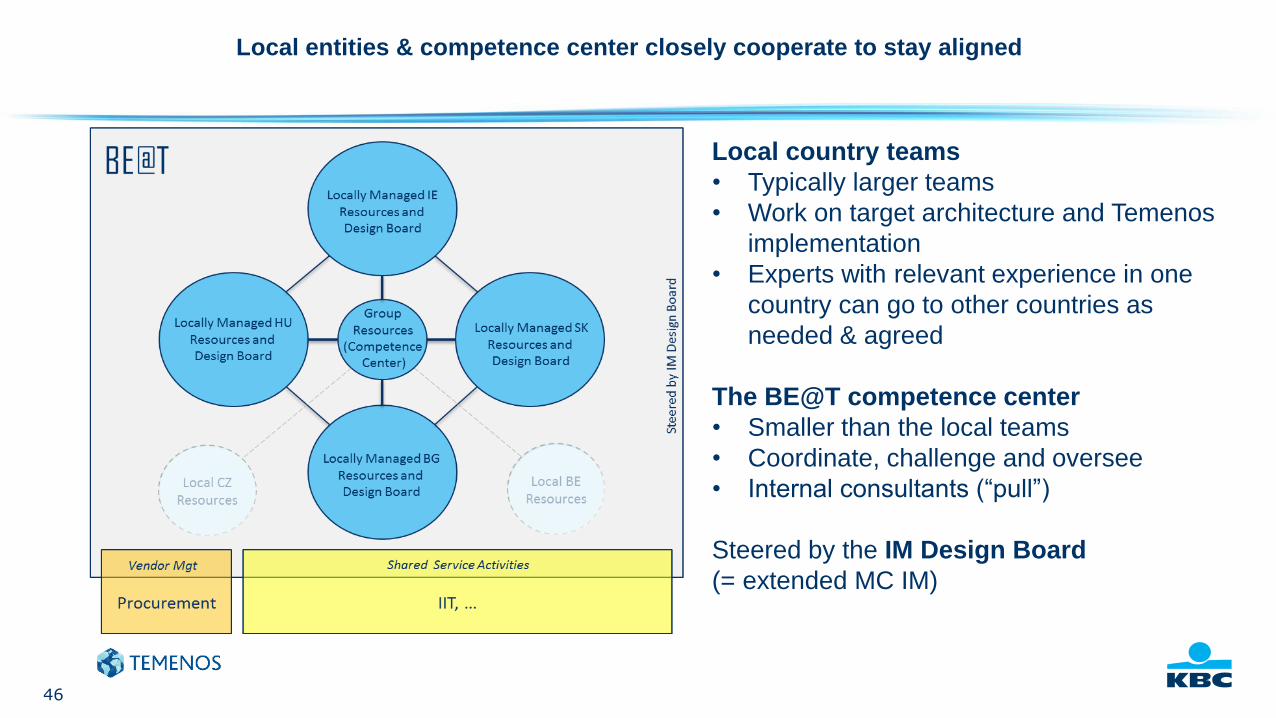
Local entities & competence center closely cooperate to stay aligned
Local country teams
• Typically larger teams
• Work on target architecture and Temenos
implementation
• Experts with relevant experience in one
country can go to other countries as
needed & agreed
The BE@T competence center
• Smaller than the local teams
• Coordinate, challenge and oversee
• Internal consultants (“pull”)
Steered by the IM Design Board
(= extended MC IM)
47
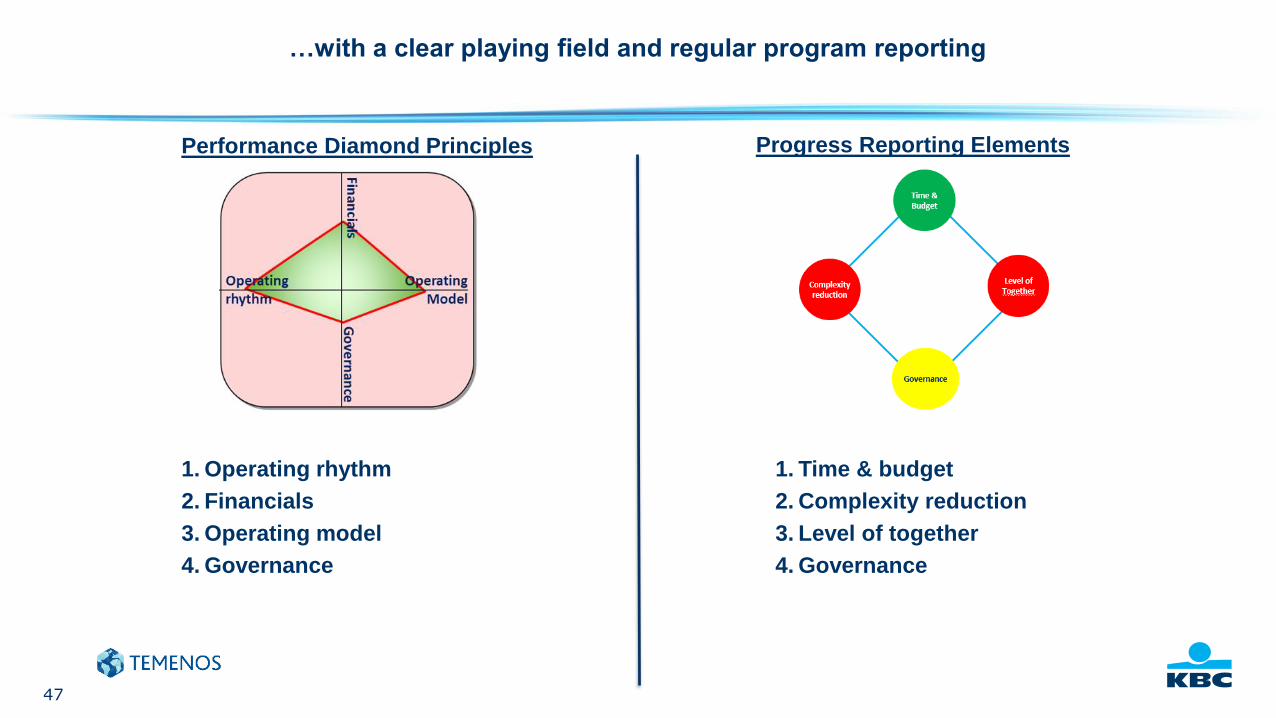
…with a clear playing field and regular program reporting
Performance Diamond Principles Progress Reporting Elements
1. Operating rhythm
2. Financials
3. Operating model
4. Governance
1. Time & budget
2. Complexity reduction
3. Level of together
4. Governance
48
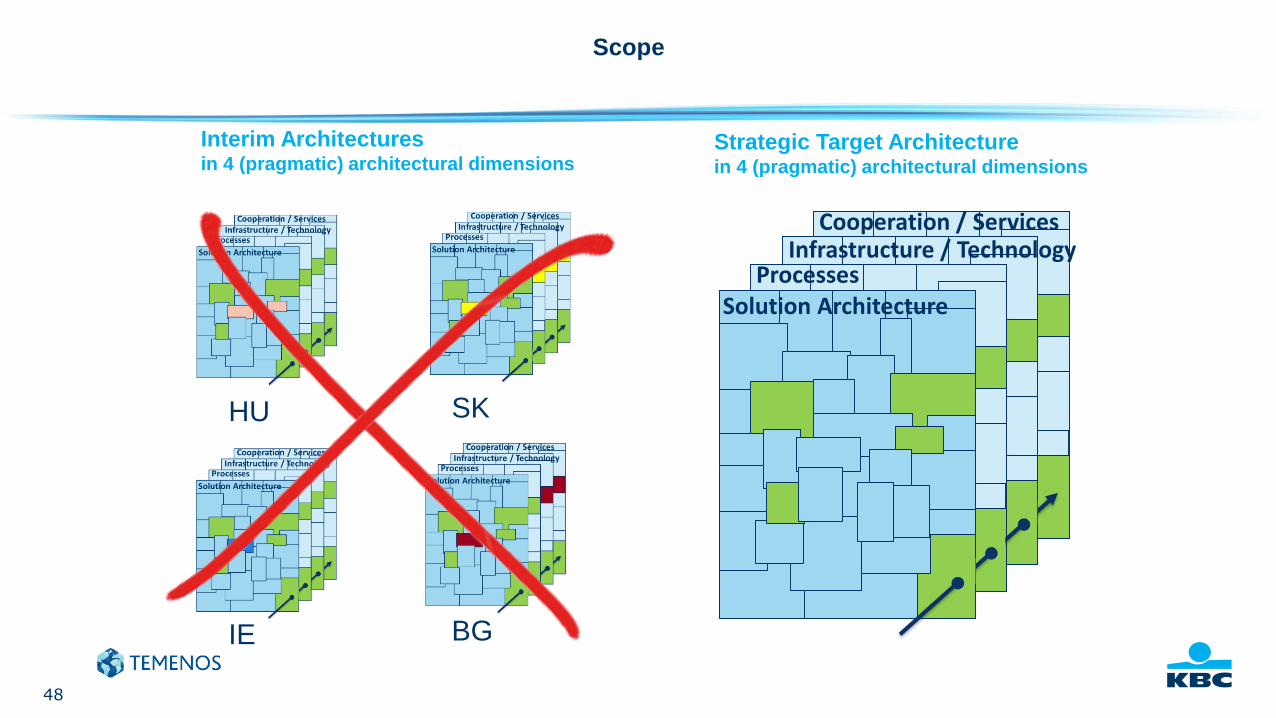
Scope
HU
IE
SK
BG
Interim Architecturesin 4 (pragmatic) architectural dimensions
Solution Architecture
Infrastructure / Technology Cooperation / Services
Processes
Strategic Target Architecture in 4 (pragmatic) architectural dimensions
49
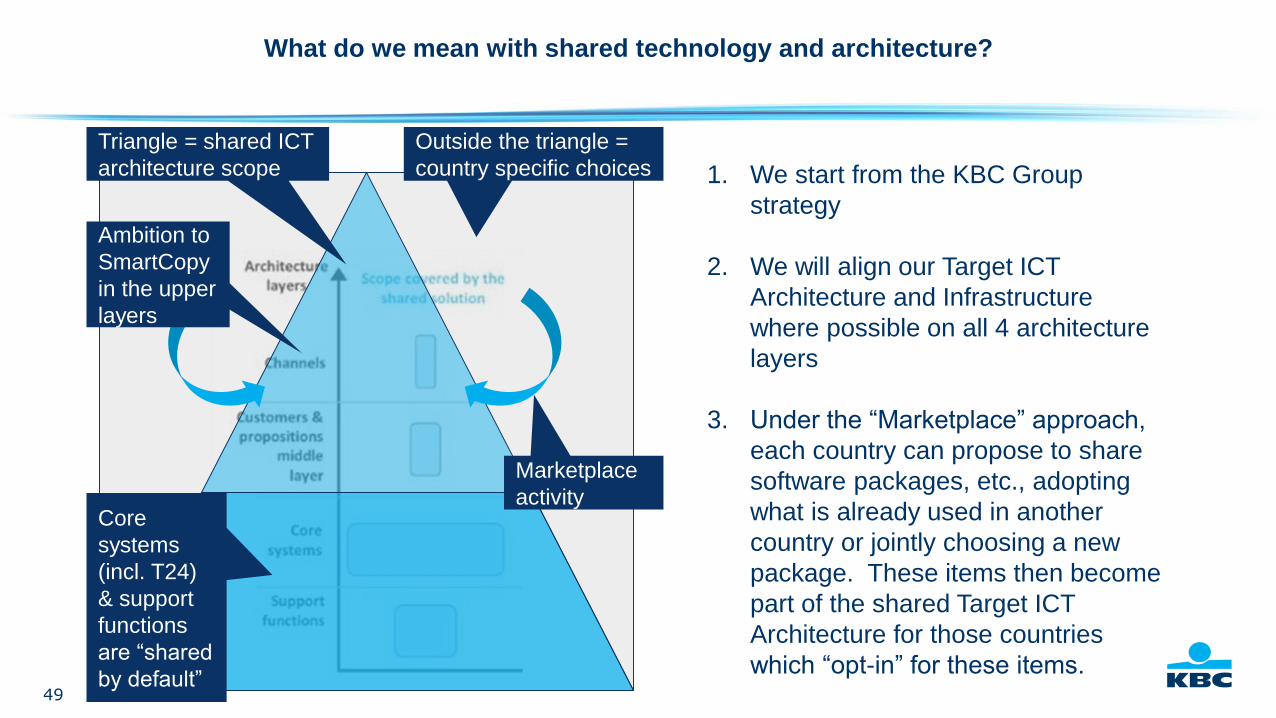
What do we mean with shared technology and architecture?
1. We start from the KBC Group
strategy
2. We will align our Target ICT
Architecture and Infrastructure
where possible on all 4 architecture
layers
3. Under the “Marketplace” approach,
each country can propose to share
software packages, etc., adopting
what is already used in another
country or jointly choosing a new
package. These items then become
part of the shared Target ICT
Architecture for those countries
which “opt-in” for these items.
Triangle = shared ICT
architecture scope
Core
systems
(incl. T24)
& support
functions
are “shared
by default”
Outside the triangle =
country specific choices
Ambition to
SmartCopy
in the upper
layers
Marketplace
activity
50
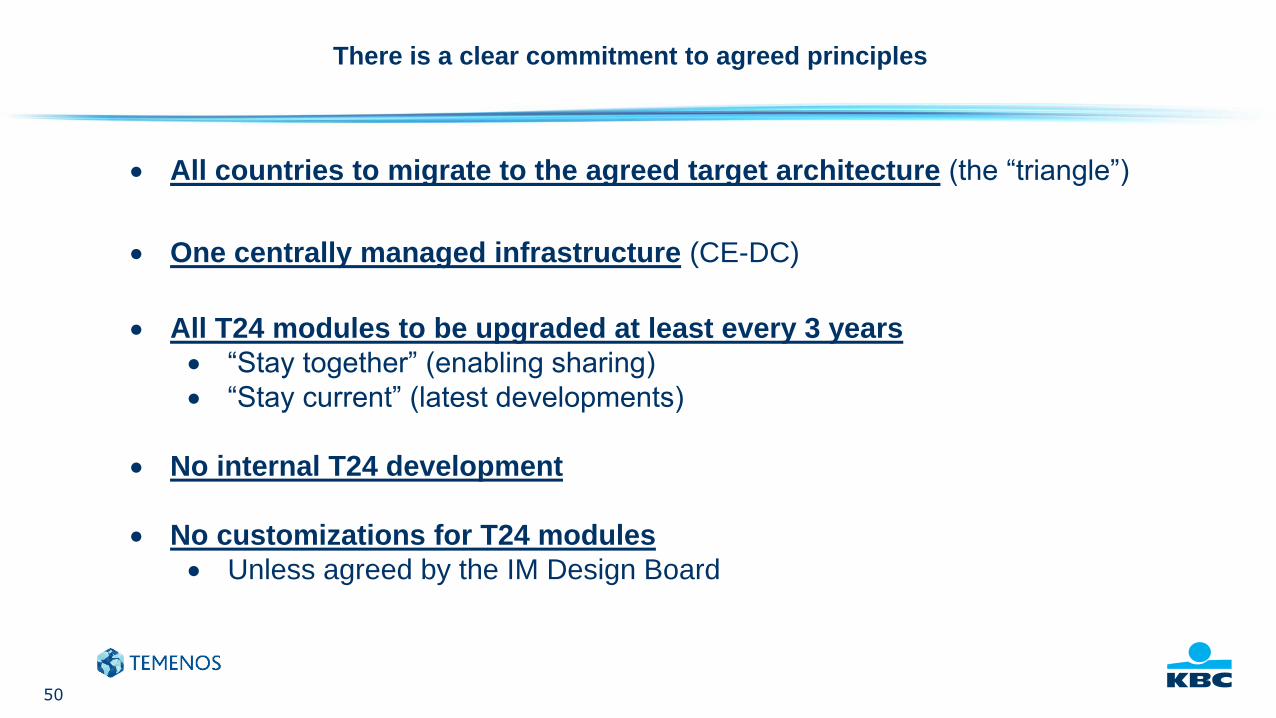
There is a clear commitment to agreed principles
All countries to migrate to the agreed target architecture (the “triangle”)
One centrally managed infrastructure (CE-DC)
All T24 modules to be upgraded at least every 3 years
“Stay together” (enabling sharing)
“Stay current” (latest developments)
No internal T24 development
No customizations for T24 modules
Unless agreed by the IM Design Board
51
KBC and Temenos launched a strategic partnership, and will commit significant
resources and attention to make it a success
52
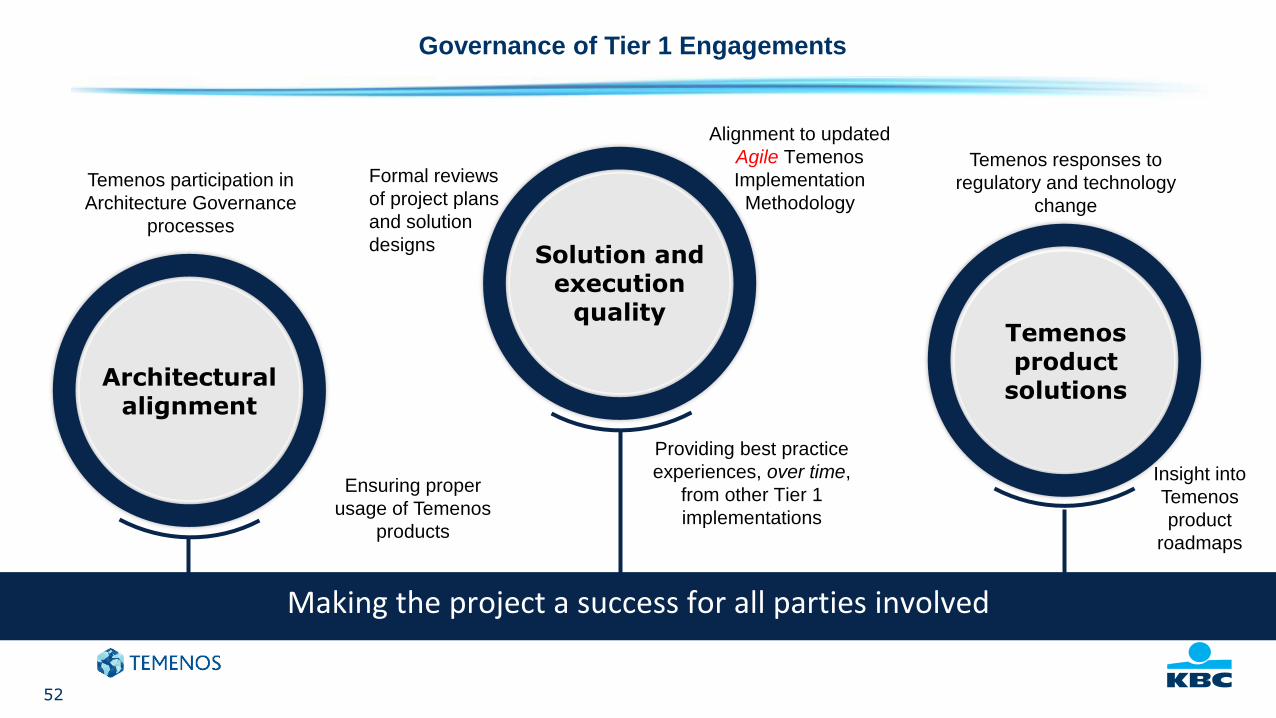
Architectural alignment
Solution and execution
qualityTemenosproduct
solutions
Governance of Tier 1 Engagements
Making the project a success for all parties involved
Providing best practice
experiences, over time,
from other Tier 1
implementations
Alignment to updated
Agile Temenos
Implementation
Methodology
Formal reviews
of project plans
and solution
designs
Temenos participation in
Architecture Governance
processes
Temenos responses to
regulatory and technology
change
Ensuring proper
usage of Temenos
products
Insight into
Temenos
product
roadmaps
53
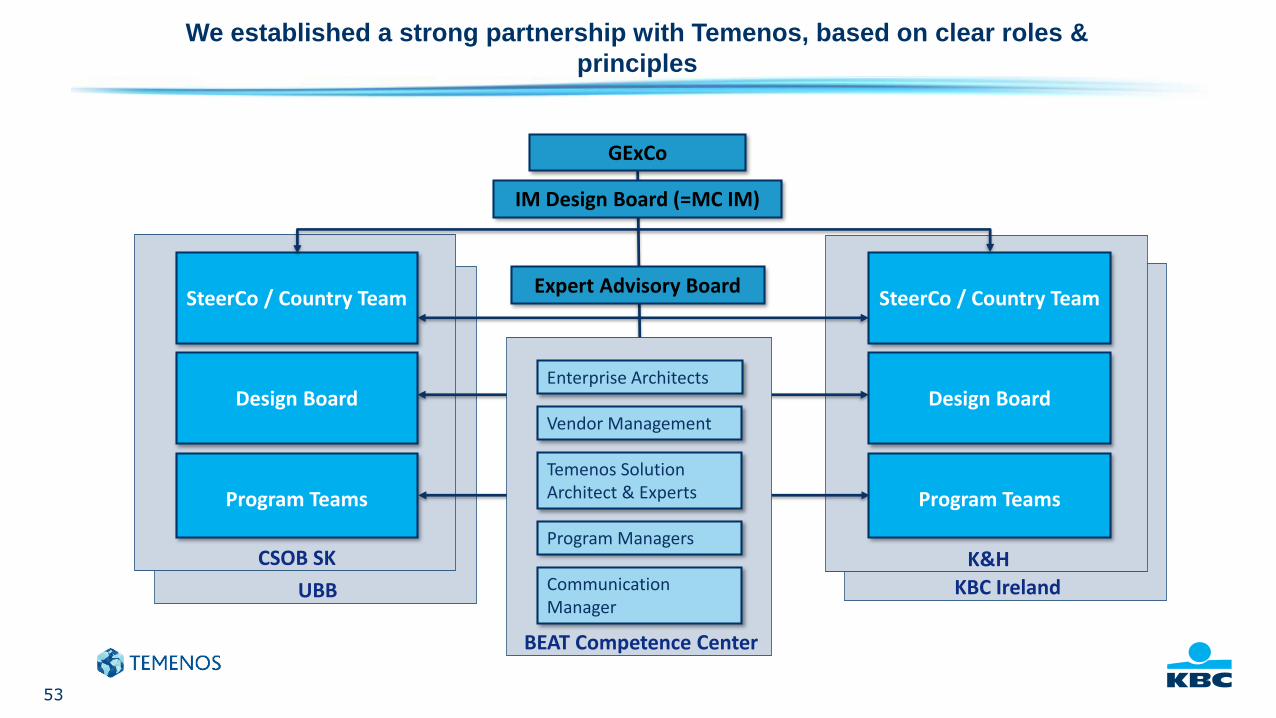
We established a strong partnership with Temenos, based on clear roles &
principles
UBB KBC Ireland
CSOB SK
Design Board
Program Teams
K&H
Design Board
Program Teams
SteerCo / Country TeamSteerCo / Country TeamExpert Advisory Board
IM Design Board (=MC IM)
GExCo
BEAT Competence Center
Enterprise Architects
Vendor Management
Program Managers
Communication Manager
Temenos Solution Architect & Experts
54
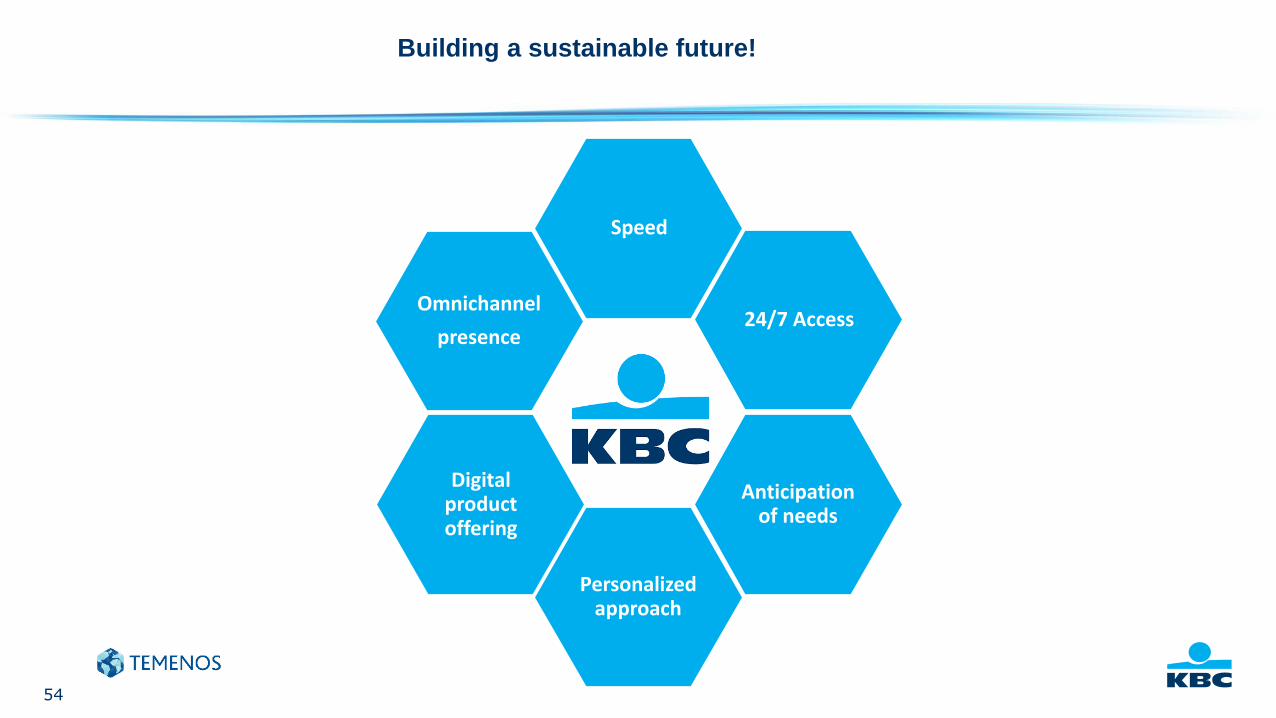
Speed
24/7 Access
Anticipation of needs
Personalizedapproach
Digital product offering
Omnichannel
presence
Digital product offering
Building a sustainable future!

55
Product
Leadership
Mark Winterburn, Group Product Director
Kanika Hope, Strategic Business Development Director
Prema Varadhan, Chief Architect, Product
14 February 2018
Introduction
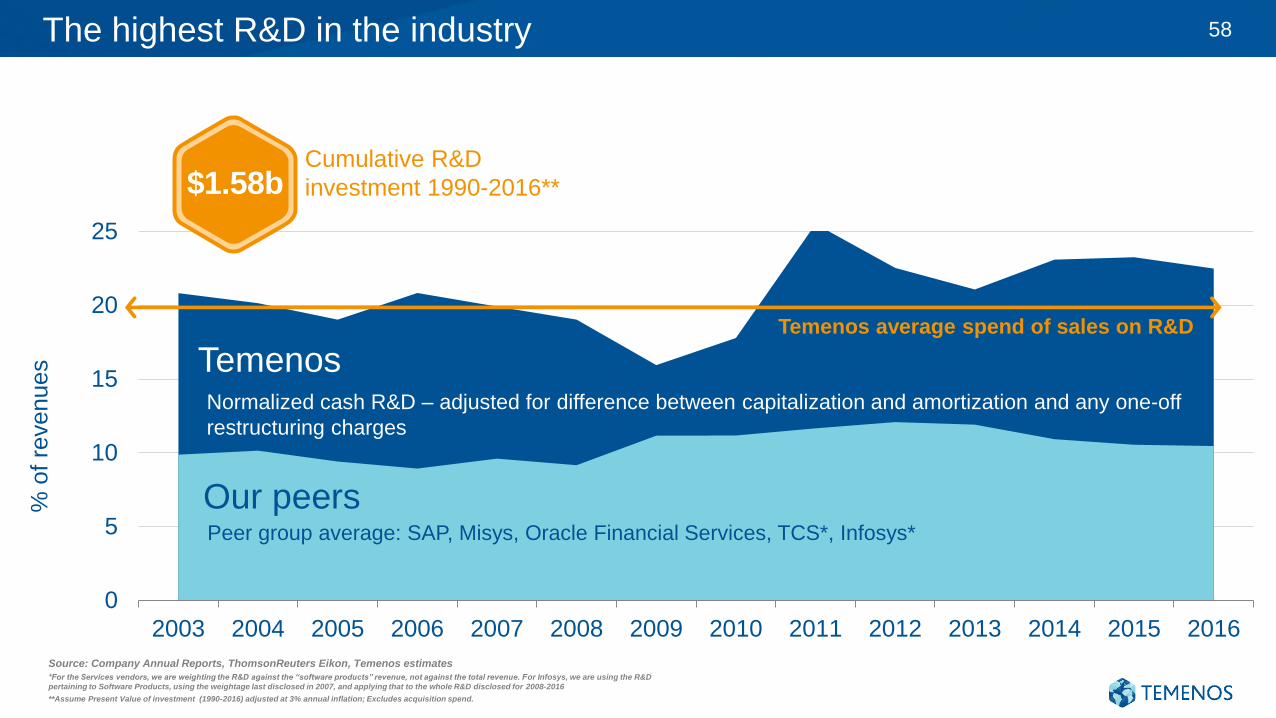
The highest R&D in the industry 58
0
5
10
15
20
25
2003 2004 2005 2006 2007 2008 2009 2010 2011 2012 2013 2014 2015 2016
% o
f re
venue
s
Normalized cash R&D – adjusted for difference between capitalization and amortization and any one-off
restructuring charges
Peer group average: SAP, Misys, Oracle Financial Services, TCS*, Infosys*
Temenos
Our peers
Temenos average spend of sales on R&D
Source: Company Annual Reports, ThomsonReuters Eikon, Temenos estimates
*For the Services vendors, we are weighting the R&D against the “software products” revenue, not against the total revenue. For Infosys, we are using the R&D
pertaining to Software Products, using the weightage last disclosed in 2007, and applying that to the whole R&D disclosed for 2008-2016
**Assume Present Value of investment (1990-2016) adjusted at 3% annual inflation; Excludes acquisition spend.
$1.58bCumulative R&D
investment 1990-2016**
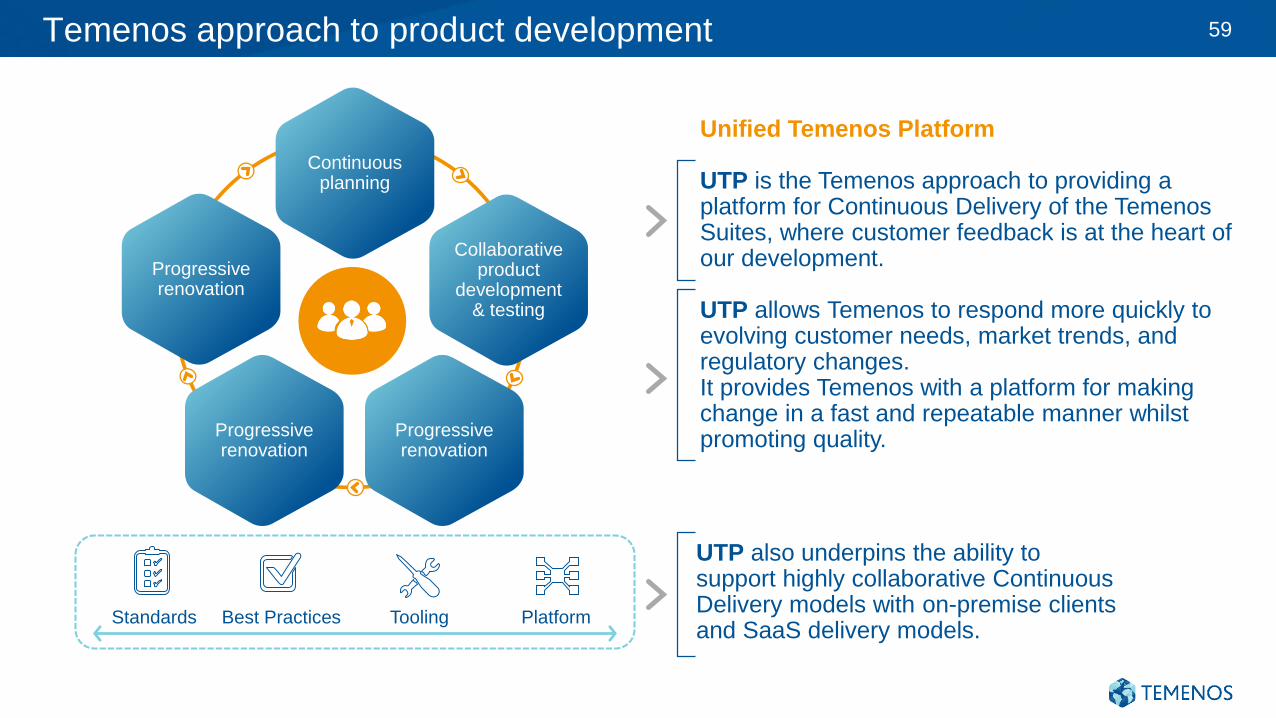
Temenos approach to product development 59
Continuous planning
Collaborative product
development & testing
Progressive renovation
Progressive renovation
Progressive renovation
Standards Best Practices Tooling Platform
Unified Temenos Platform
UTP is the Temenos approach to providing a platform for Continuous Delivery of the Temenos Suites, where customer feedback is at the heart of our development.
UTP allows Temenos to respond more quickly to evolving customer needs, market trends, and regulatory changes.It provides Temenos with a platform for making change in a fast and repeatable manner whilst promoting quality.
UTP also underpins the ability to support highly collaborative Continuous Delivery models with on-premise clients and SaaS delivery models.
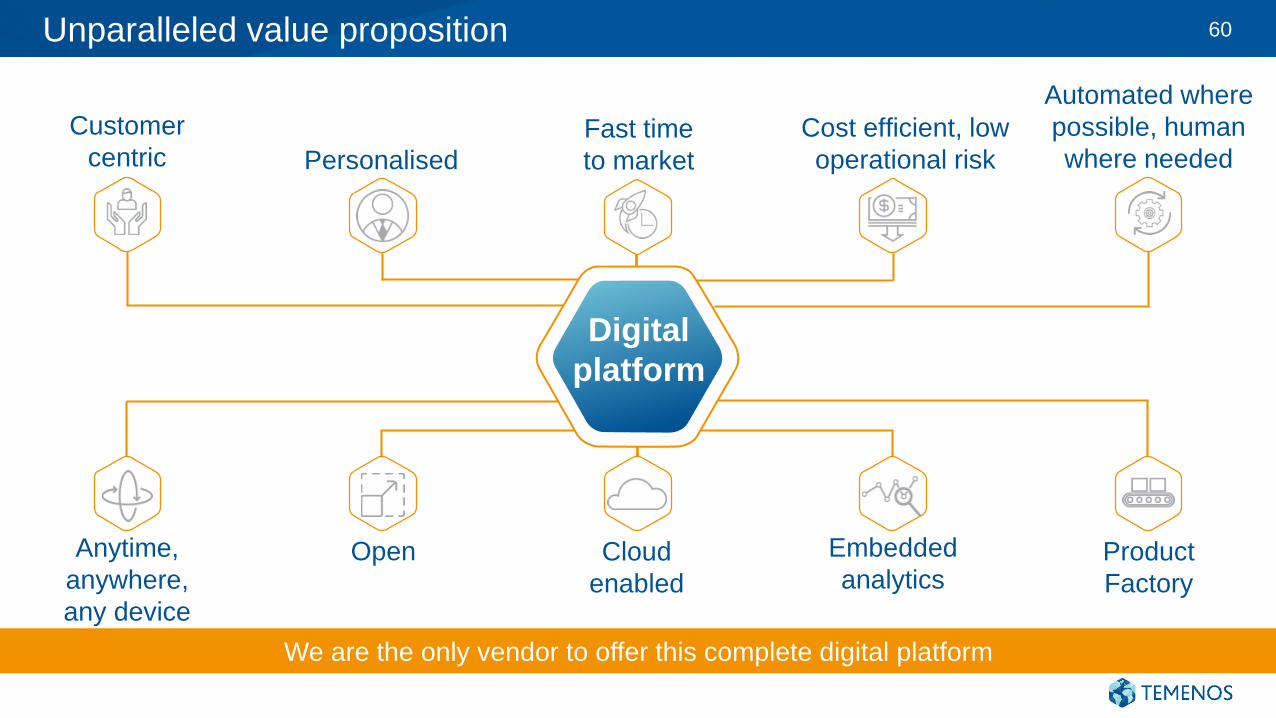
Unparalleled value proposition 60
Cloud
enabled
Automated where
possible, human
where needed
Product
Factory
Embedded
analyticsOpen
Cost efficient, low
operational risk
Anytime,
anywhere,
any device
Customer
centric Personalised
Fast time
to market
Digital
platform
We are the only vendor to offer this complete digital platform
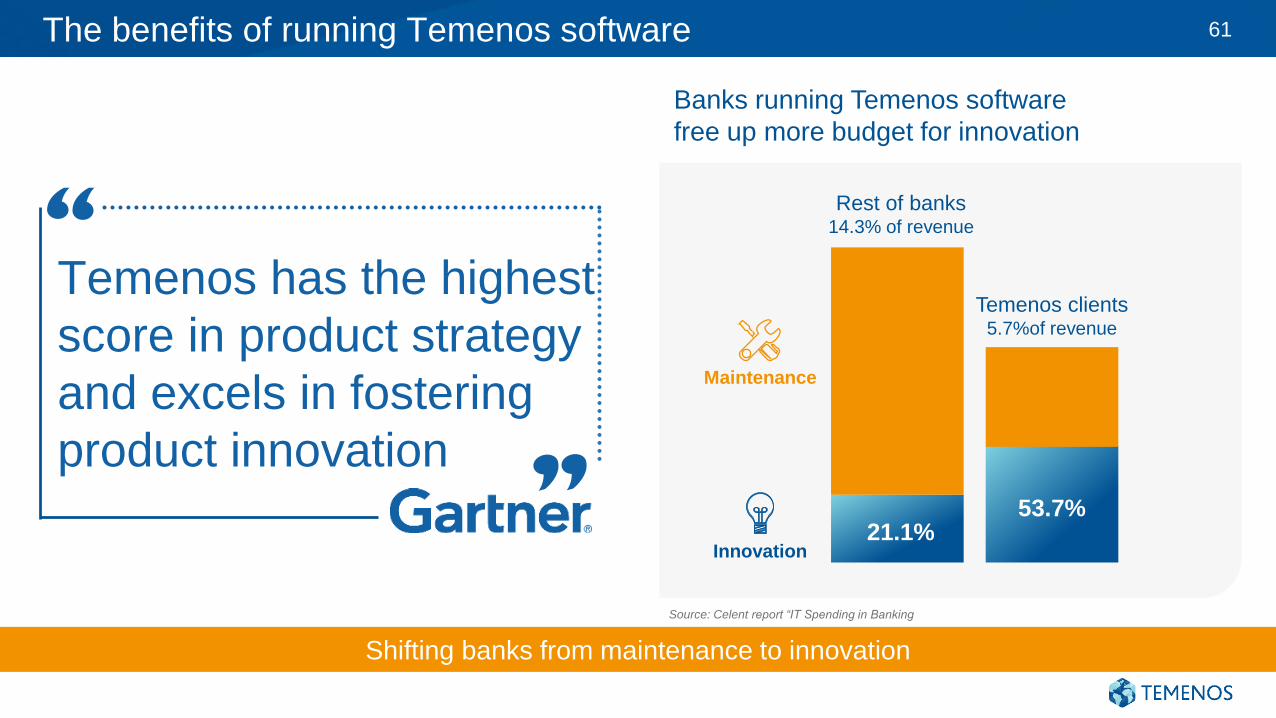
The benefits of running Temenos software 61
Banks running Temenos software
free up more budget for innovation
Source: Celent report “IT Spending in Banking
Rest of banks14.3% of revenue
21.1%
Temenos clients5.7%of revenue
53.7%
Innovation
Maintenance
Temenos has the highest
score in product strategy
and excels in fostering
product innovation
Shifting banks from maintenance to innovation
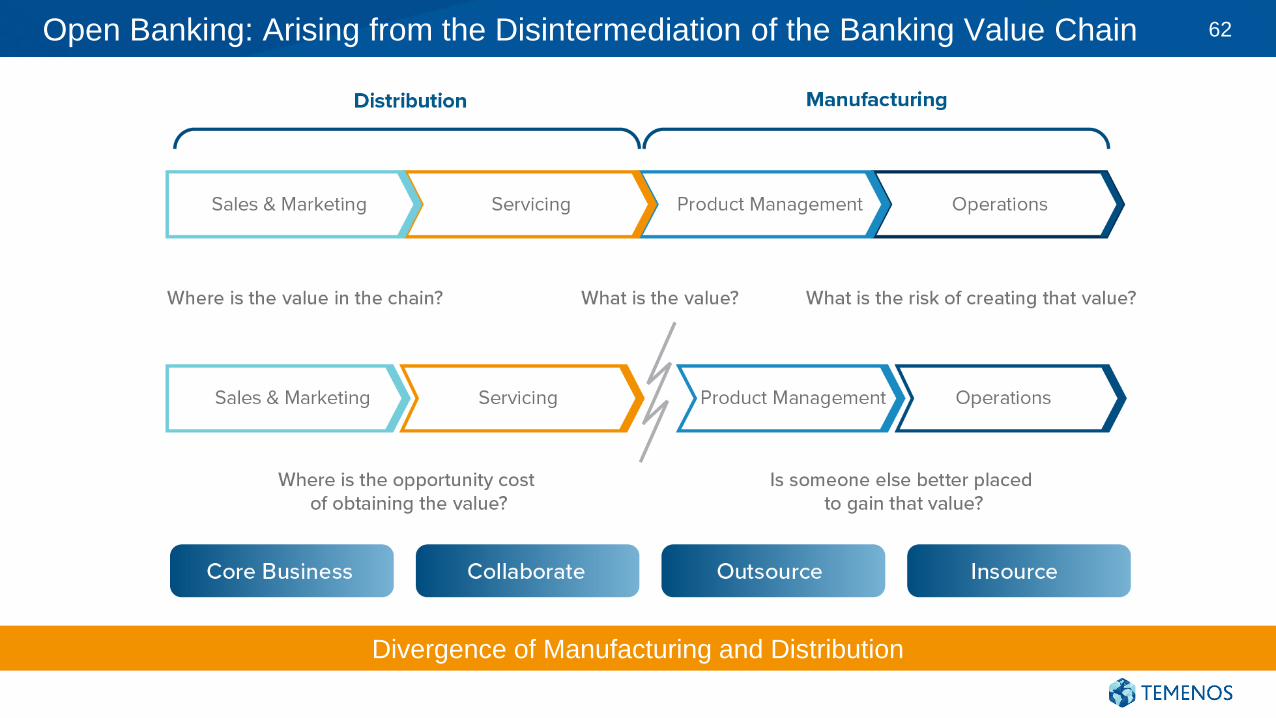
Open Banking: Arising from the Disintermediation of the Banking Value Chain 62
Divergence of Manufacturing and Distribution
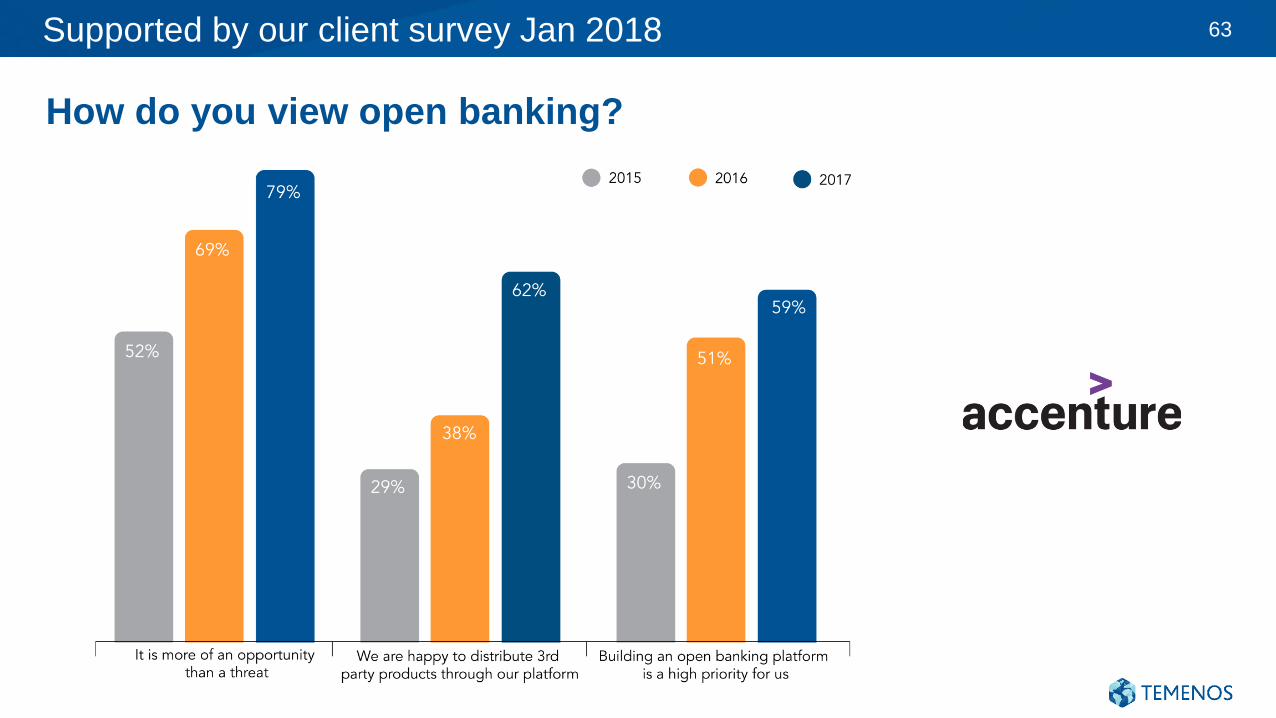
Supported by our client survey Jan 2018 63
How do you view open banking?
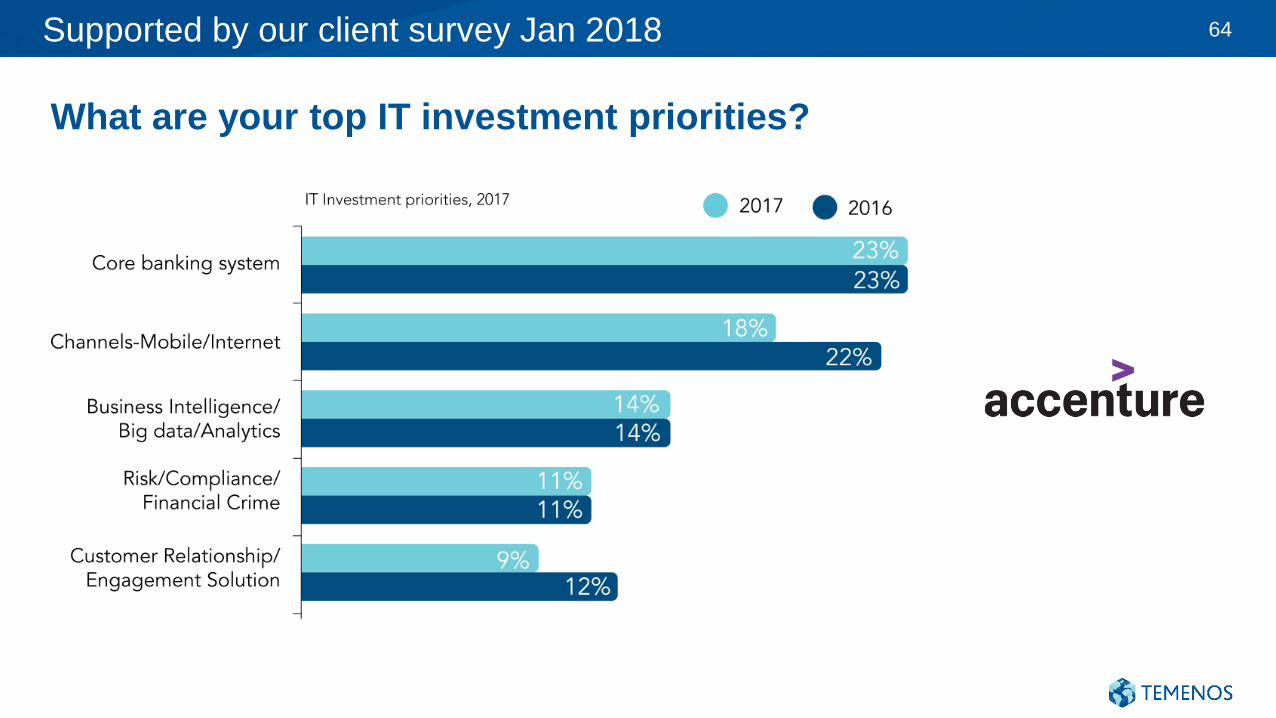
Supported by our client survey Jan 2018 64
What are your top IT investment priorities?
Temenos
Perspectives on
Open Banking
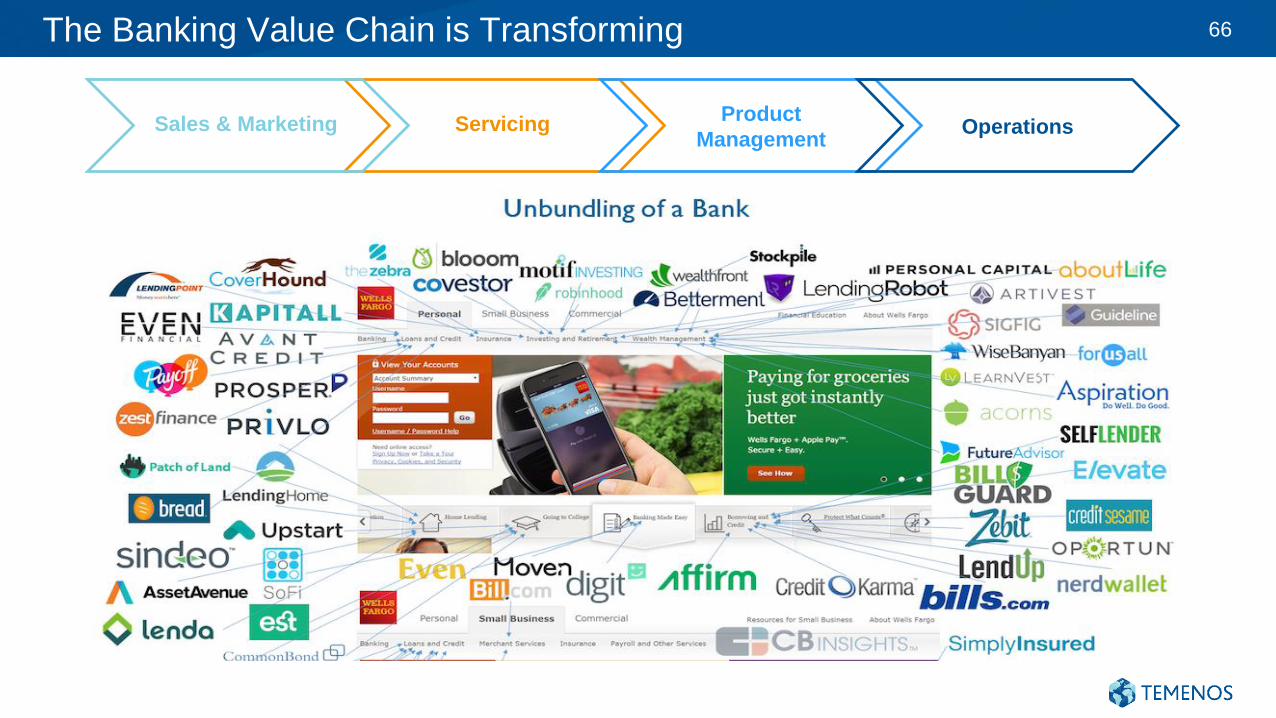
The Banking Value Chain is Transforming 66
ServicingProduct
ManagementOperationsSales & Marketing
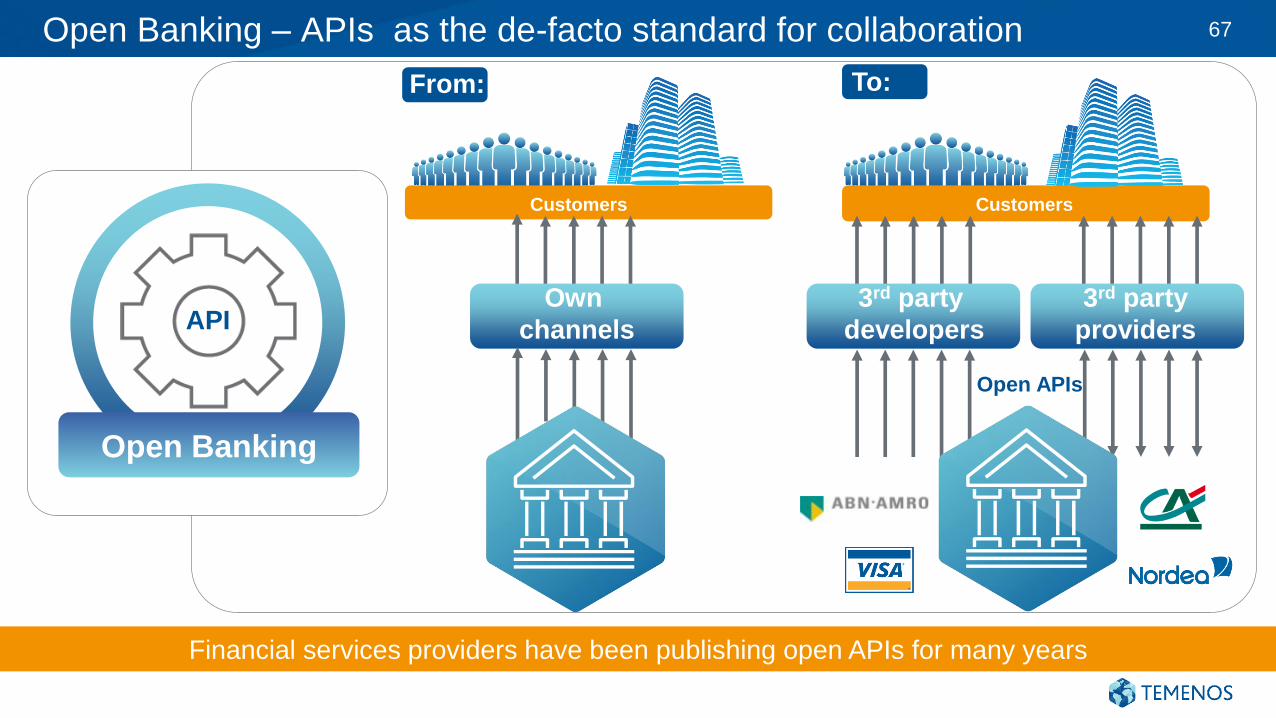
Open Banking – APIs as the de-facto standard for collaboration 67
Financial services providers have been publishing open APIs for many years
API
Open Banking
Individuals CustomersCustomers
Own
channels
3rd party
developers
3rd party
providers
From: To:
Open APIs
“Open banking will fundamentally shift banking in the way internet banking did more than a decade ago.
We will see new ways of distributing banking products. This will create more choice and value for customers.”
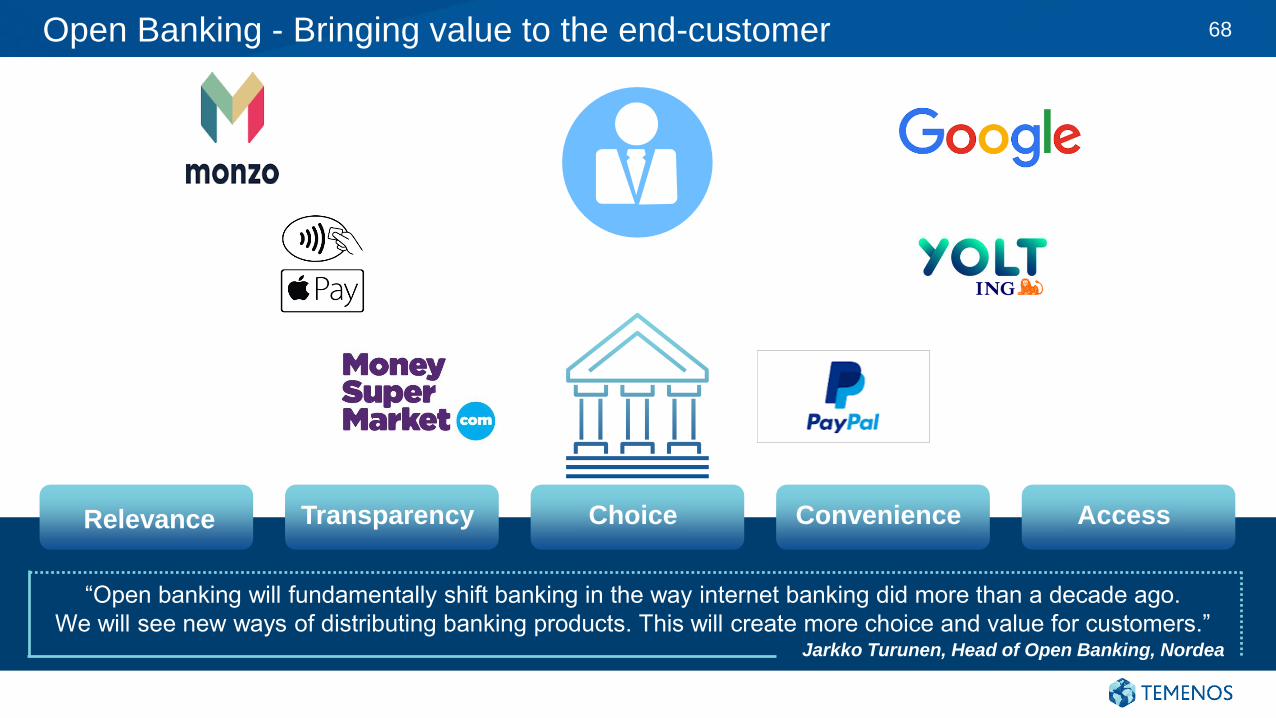
Open Banking - Bringing value to the end-customer 68
Relevance Transparency Choice AccessConvenience
Jarkko Turunen, Head of Open Banking, Nordea
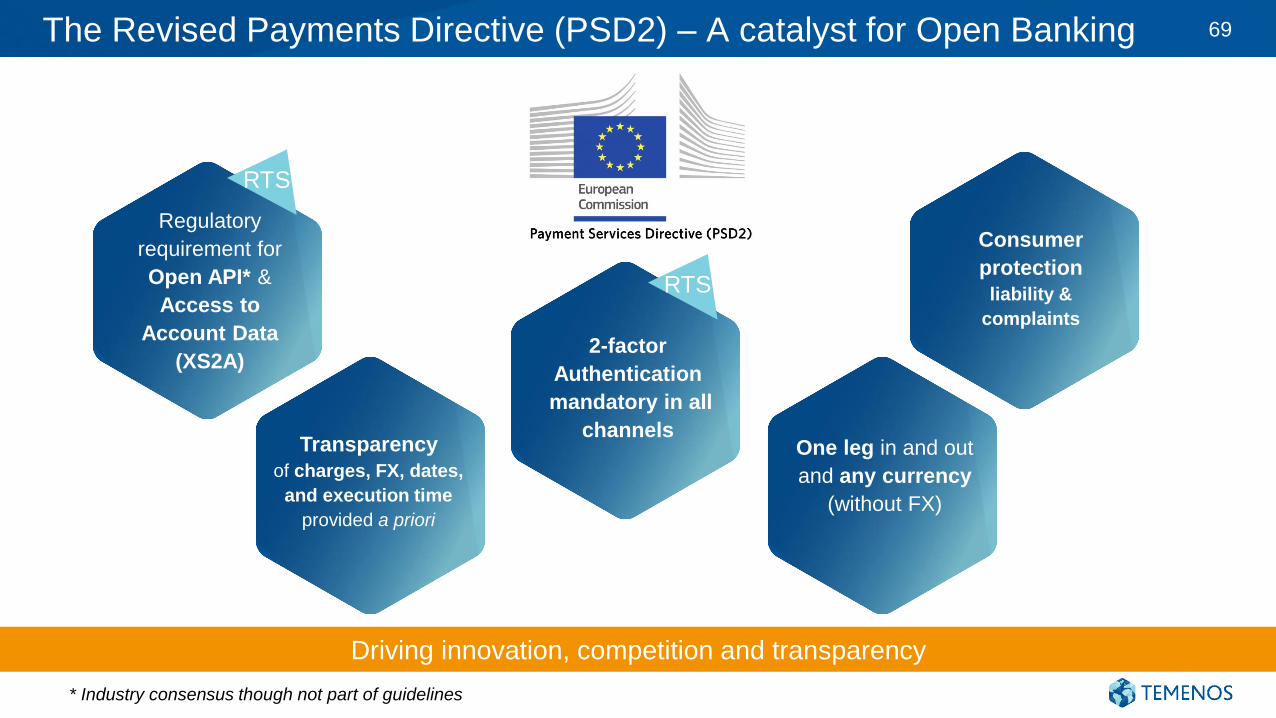
The Revised Payments Directive (PSD2) – A catalyst for Open Banking 69
* Industry consensus though not part of guidelines
Driving innovation, competition and transparency
2-factor
Authentication
mandatory in all
channelsTransparency
of charges, FX, dates,
and execution time
provided a priori
Consumer
protection
liability &
complaints
One leg in and out
and any currency
(without FX)
Regulatory
requirement for
Open API* &
Access to
Account Data
(XS2A)
RTS
RTS
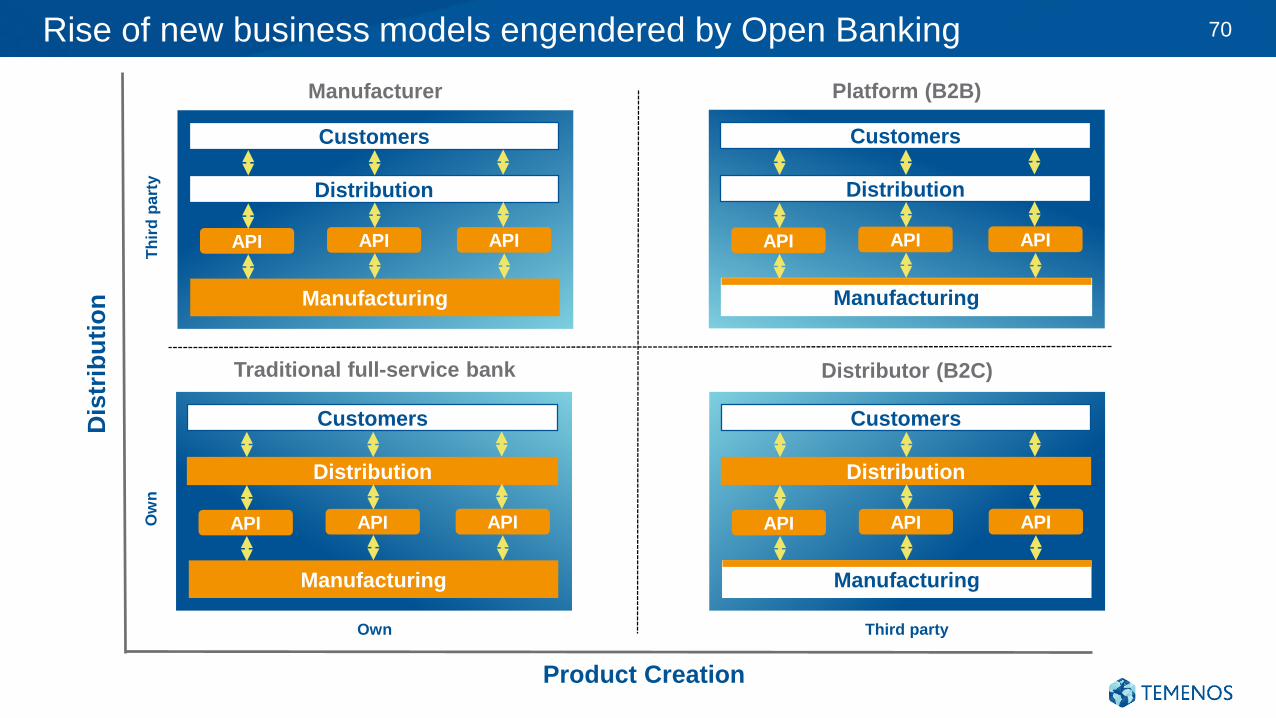
Rise of new business models engendered by Open Banking 70
Distribution
Manufacturing
Customers
API API API
Traditional full-service bank Distributor (B2C)
Manufacturer Platform (B2B)
Product Creation
Dis
trib
uti
on
Ow
nT
hir
d p
art
y
Own Third party
Distribution
Manufacturing
Customers
API API API
Distribution
Manufacturing
Customers
API API API
Distribution
Manufacturing
Customers
API API API
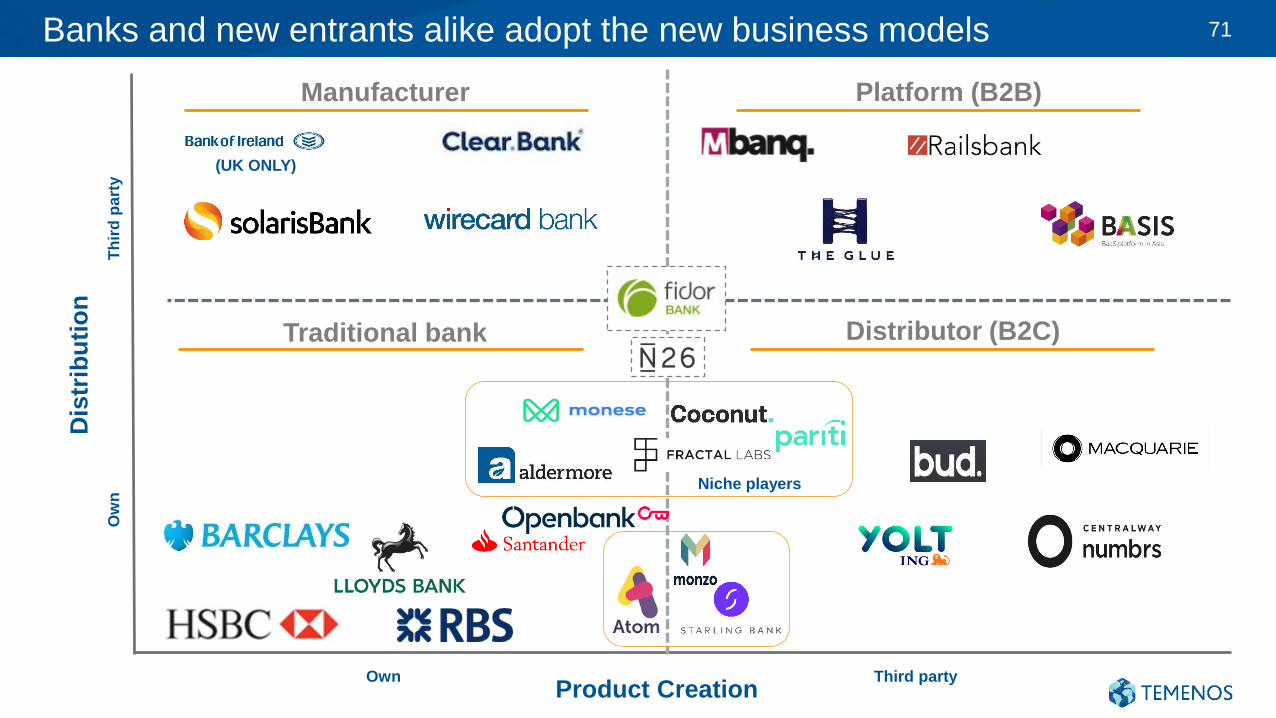
Banks and new entrants alike adopt the new business models 71
Distributor (B2C)
Manufacturer Platform (B2B)
Product Creation
Dis
trib
uti
on
Ow
nT
hir
d p
art
y
Own Third party
Traditional bank
(UK ONLY)
Niche players
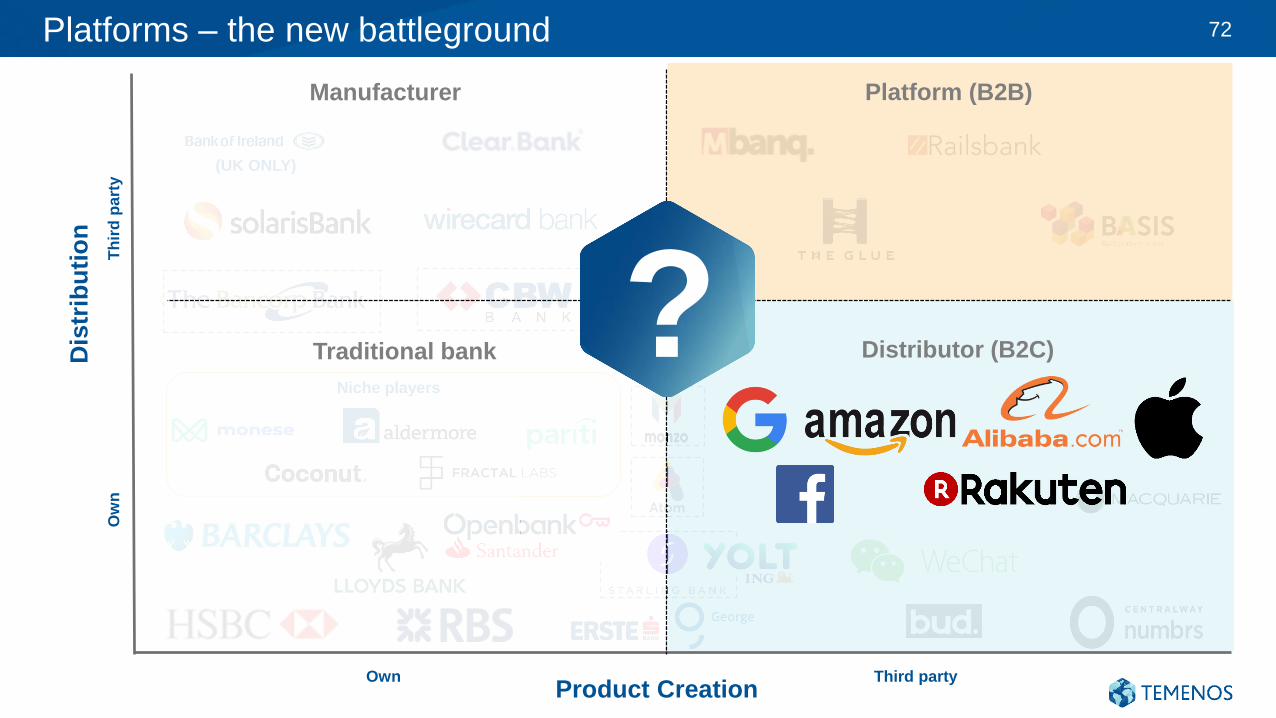
Platforms – the new battleground 72
Product Creation
Dis
trib
uti
on
Ow
nT
hir
d p
art
y
Own Third party
(UK ONLY)
Niche players
Manufacturer
Traditional bank Distributor (B2C)
Platform (B2B)
?
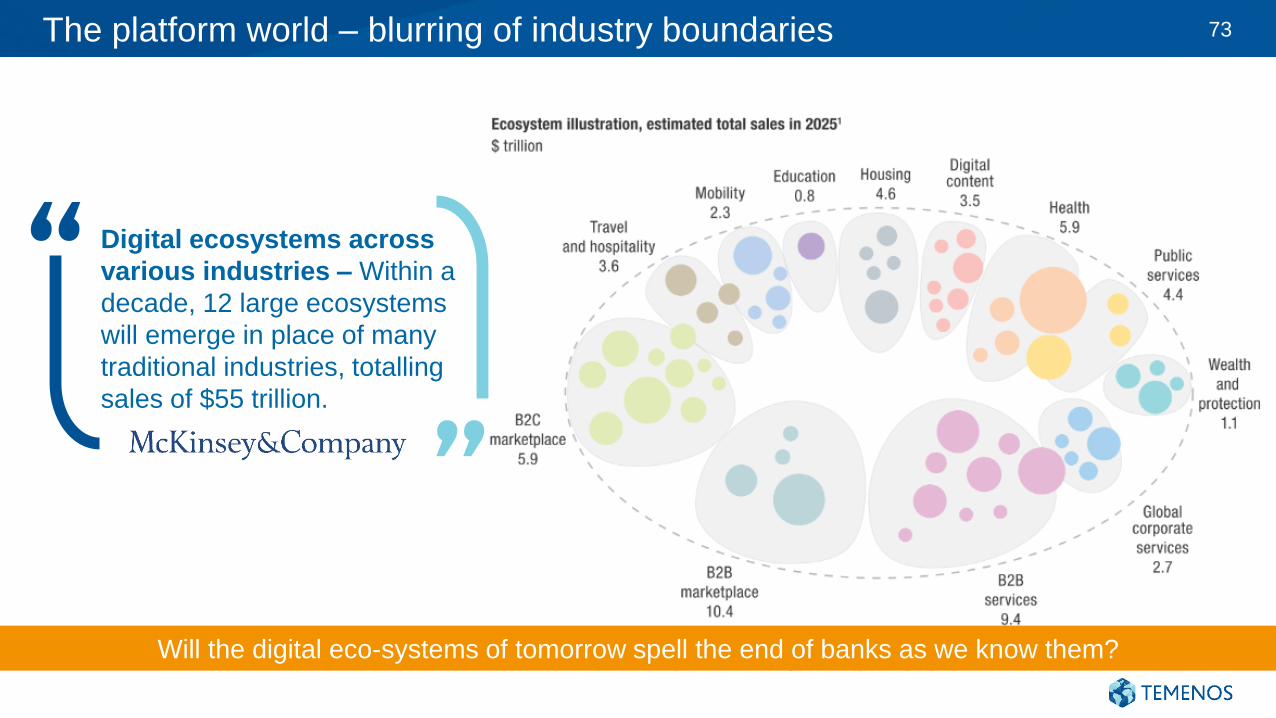
Digital ecosystems across
various industries – Within a
decade, 12 large ecosystems
will emerge in place of many
traditional industries, totalling
sales of $55 trillion.
The platform world – blurring of industry boundaries 73
Will the digital eco-systems of tomorrow spell the end of banks as we know them?
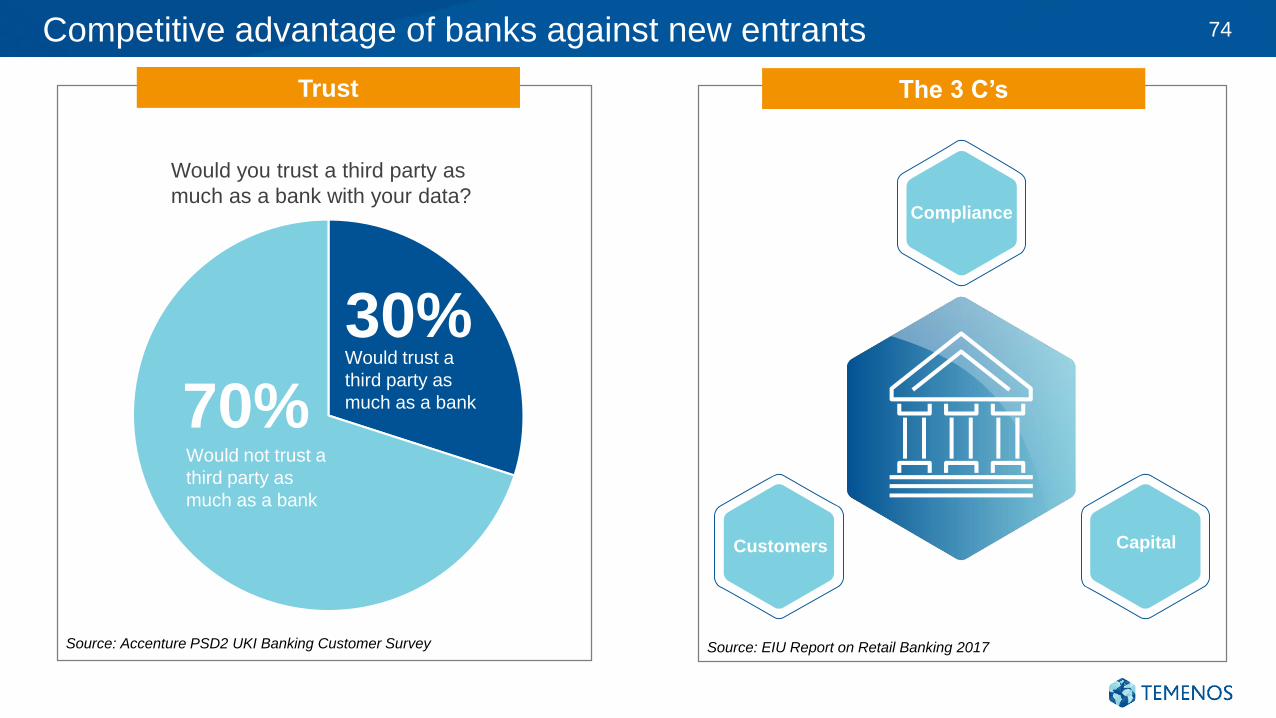
Competitive advantage of banks against new entrants 74
Source: Accenture PSD2 UKI Banking Customer Survey
Customers
Compliance
Capital
The 3 C’s
Source: EIU Report on Retail Banking 2017
Trust
30%
70%Would trust a
third party as
much as a bank
Would not trust a
third party as
much as a bank
Would you trust a third party as
much as a bank with your data?
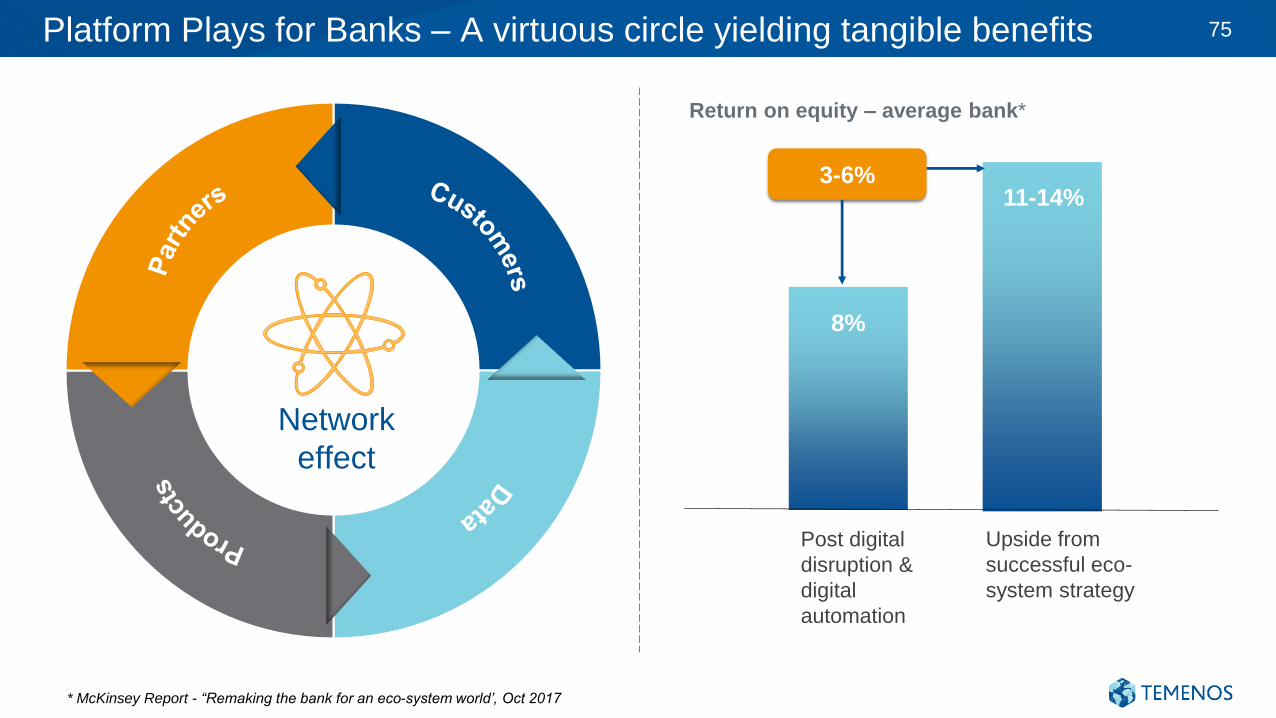
Platform Plays for Banks – A virtuous circle yielding tangible benefits
3-6%
8%
11-14%
* McKinsey Report - “Remaking the bank for an eco-system world’, Oct 2017
Network
effect
Post digital
disruption &
digital
automation
Upside from
successful eco-
system strategy
Return on equity – average bank*
75
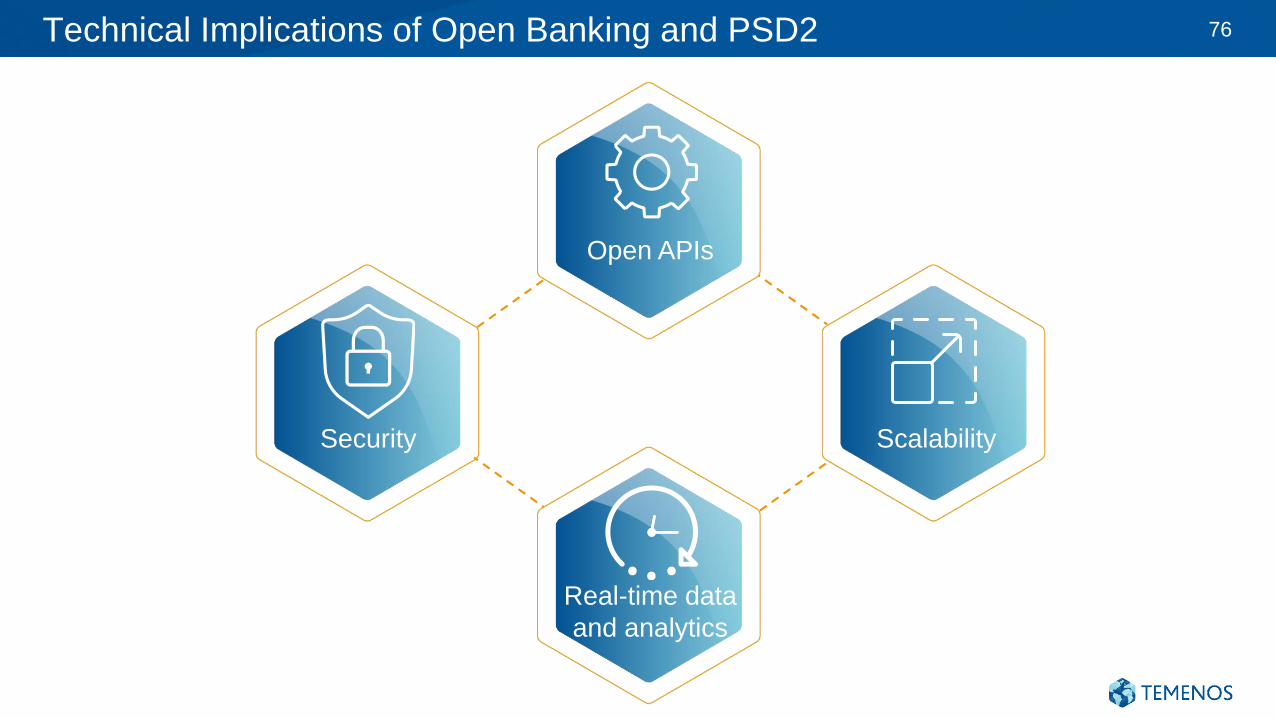
Technical Implications of Open Banking and PSD2
Open APIs
Scalability
Real-time data
and analytics
Security
76
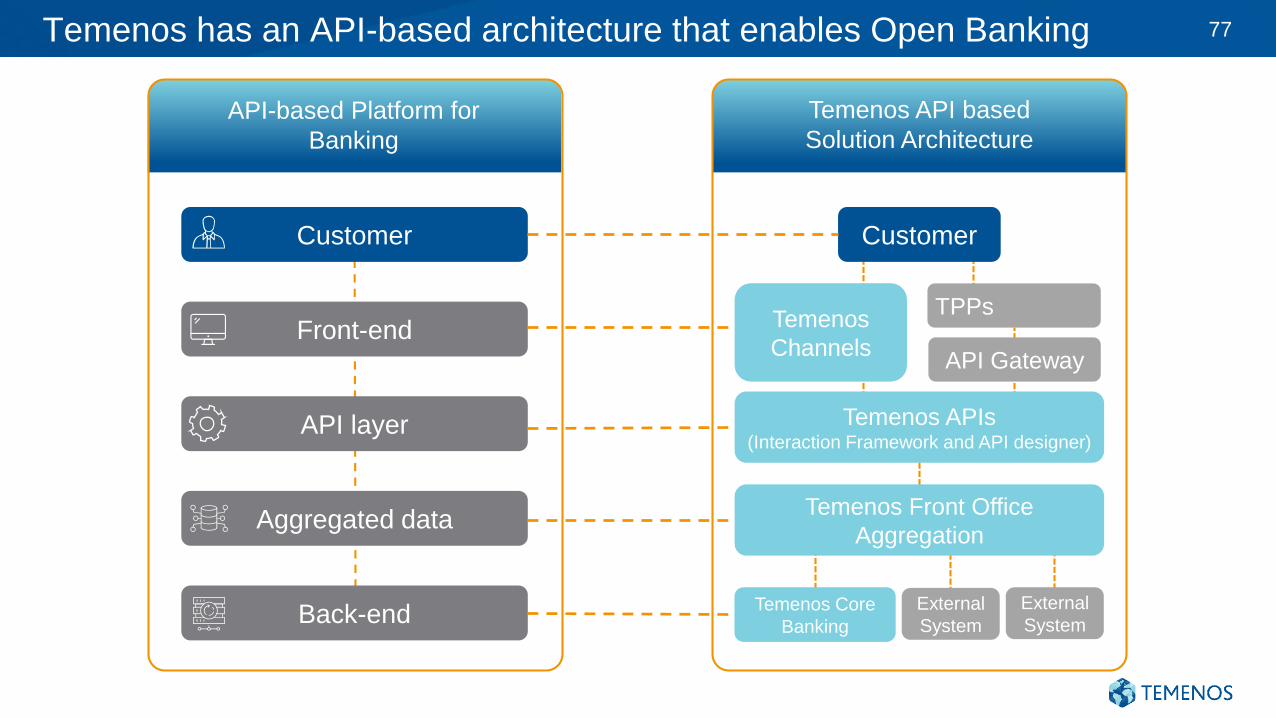
Customer
Temenos has an API-based architecture that enables Open Banking
Temenos API based
Solution Architecture
Front-end
API layer
Aggregated data
Back-end
Customer
TPPsTemenos
ChannelsAPI Gateway
Temenos APIs(Interaction Framework and API designer)
Temenos Front Office
Aggregation
Temenos Core
Banking
External
System
External
System
API-based Platform for
Banking
77
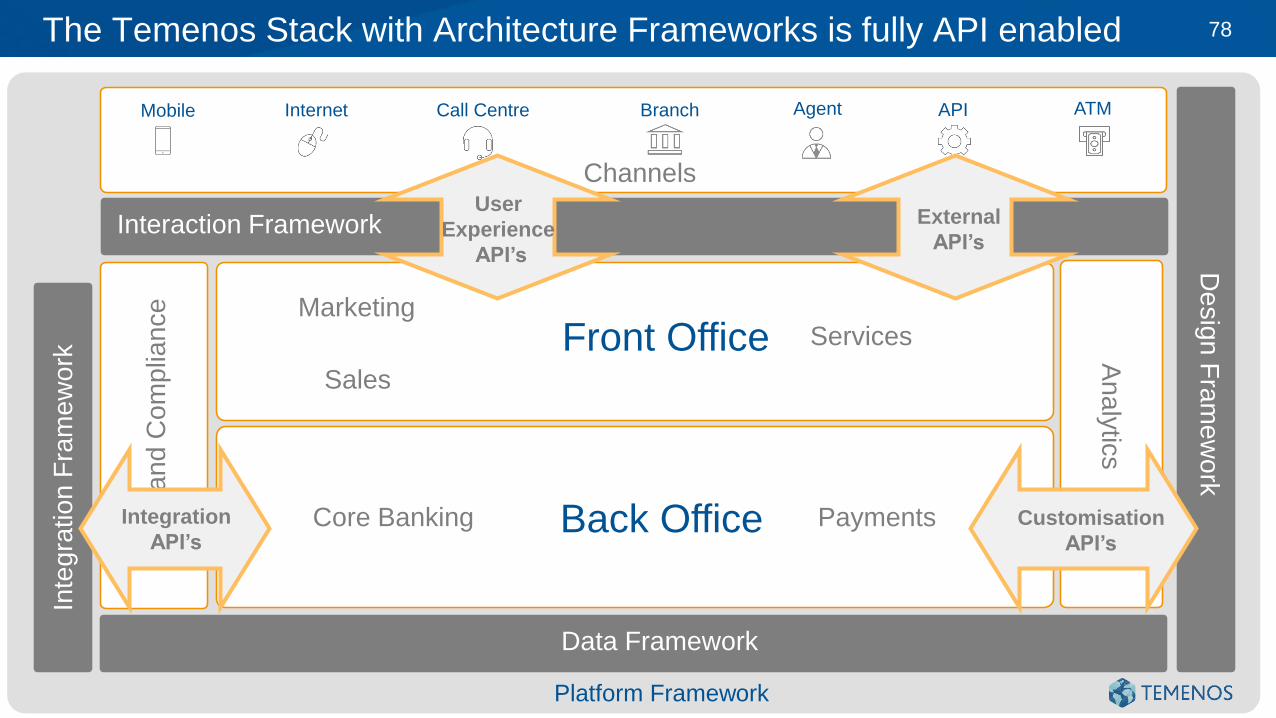
The Temenos Stack with Architecture Frameworks is fully API enabled
Back Office
Front Office
Mobile
Core Banking Payments
Sales
MarketingServices
Channels
APIInternet ATMBranch AgentCall Centre
Ris
k a
nd
Co
mp
lian
ce
Analy
tics
De
sig
n F
ram
ew
ork
Interaction Framework
Inte
gra
tio
n F
ram
ew
ork
Data Framework
Platform Framework
User
Experience
API’s
External
API’s
Customisation
API’s
Integration
API’s
78
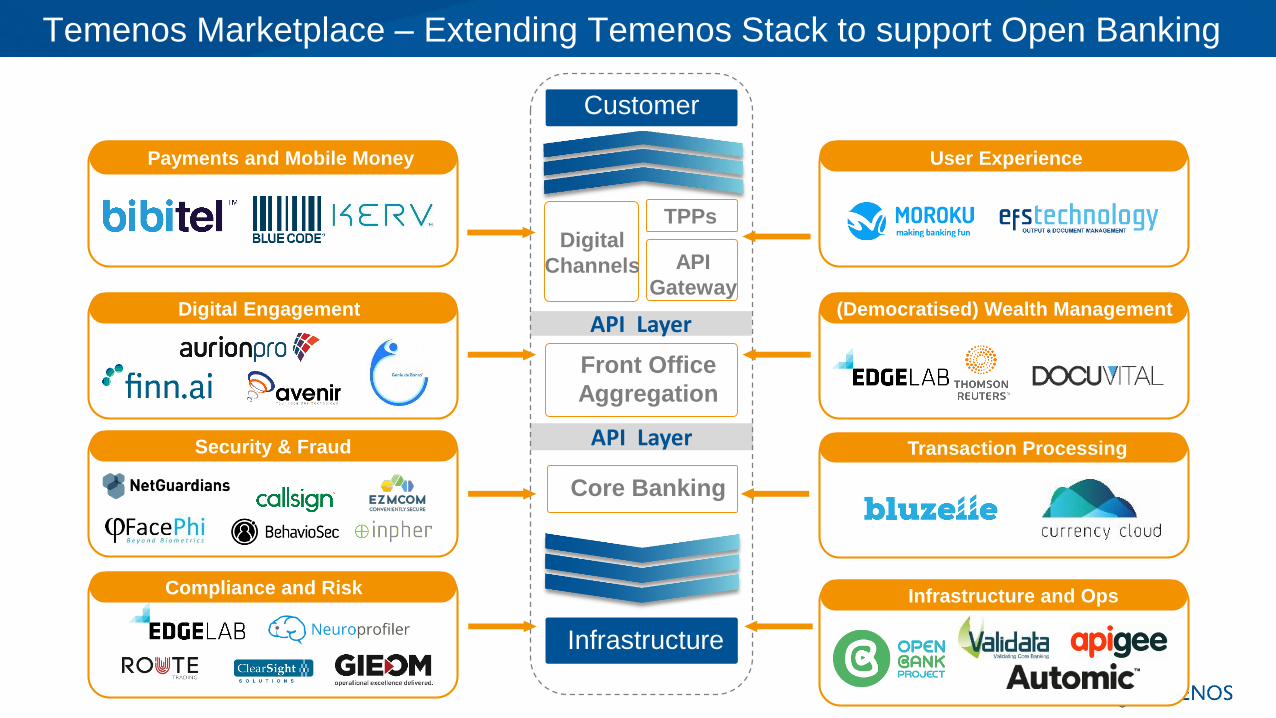
Temenos Marketplace – Extending Temenos Stack to support Open Banking
FrontFront Office
Aggregation
FrontCore Banking
Infrastructure
TPPs
API Layer
Customer
API
Gateway
API Layer
Digital
Channels
Transaction ProcessingSecurity & Fraud
(Democratised) Wealth ManagementDigital Engagement
Payments and Mobile Money User Experience
Infrastructure and OpsCompliance and Risk
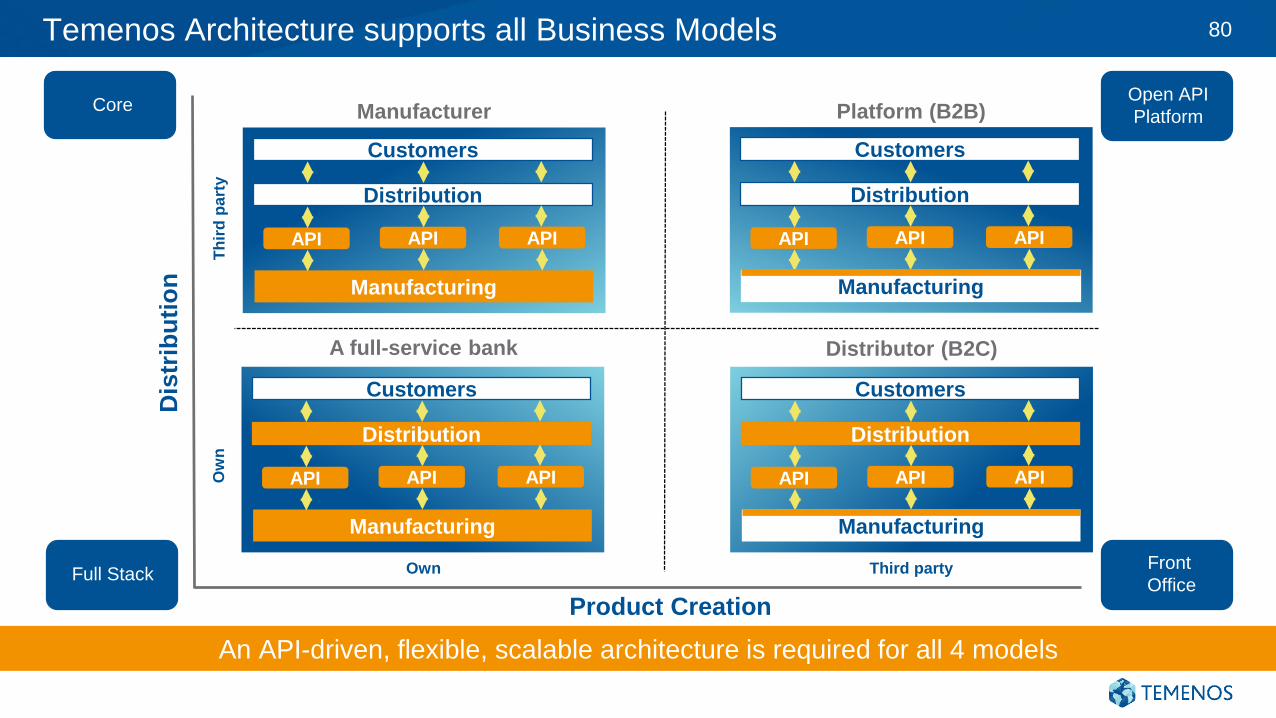
Temenos Architecture supports all Business Models
Distribution
Manufacturing
Customers
API API API
A full-service bank Distributor (B2C)
Manufacturer Platform (B2B)
Product Creation
Dis
trib
uti
on
Ow
nT
hir
d p
art
y
Own Third party
Distribution
Manufacturing
Customers
API API API
Distribution
Manufacturing
Customers
API API API
Distribution
Manufacturing
Customers
API API API
Core
Full Stack
Open API
Platform
Front
Office
An API-driven, flexible, scalable architecture is required for all 4 models
80
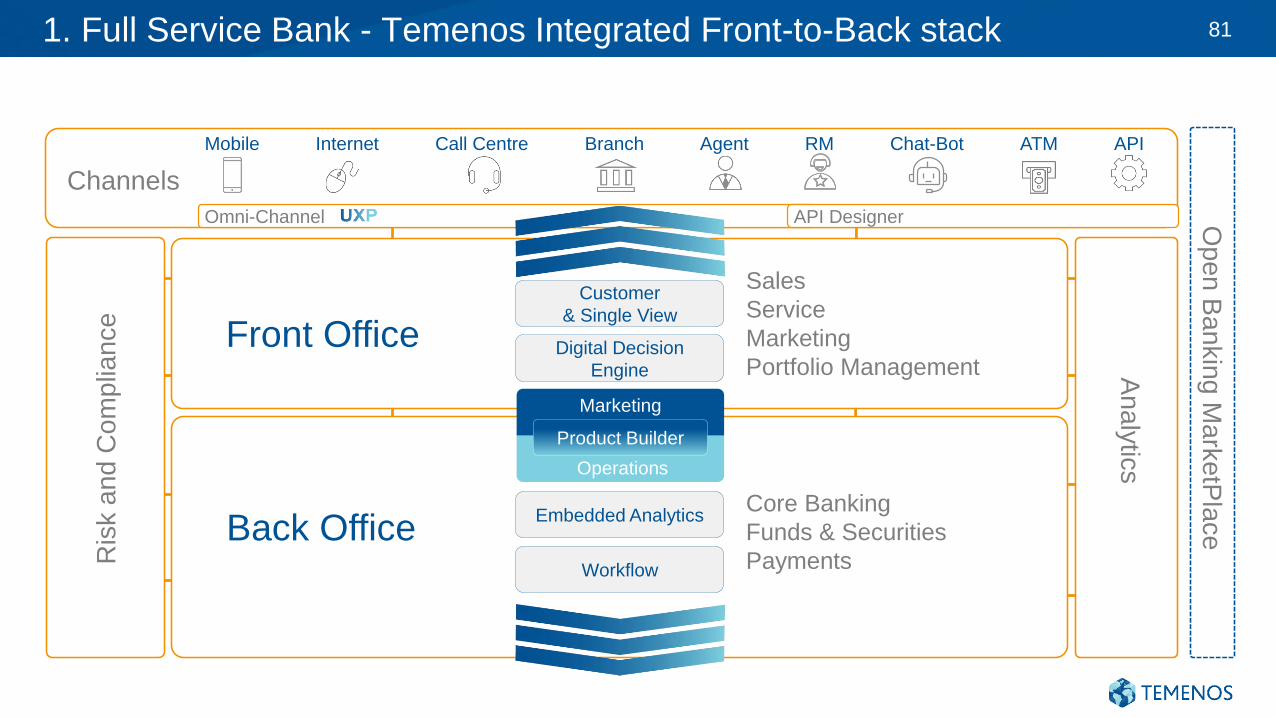
Mobile APIInternet ATMBranch AgentCall Centre
1. Full Service Bank - Temenos Integrated Front-to-Back stack
Omni-Channel API Designer
Channels
Front Office
Back Office
Sales
Service
Marketing
Portfolio Management
Core Banking
Funds & Securities
PaymentsWorkflow
Customer
& Single View
Digital Decision
Engine
Embedded Analytics
RM Chat-Bot
Ris
k a
nd
Co
mp
lian
ce
An
aly
tics
Op
en
Ba
nkin
g M
ark
etP
lace
Product Builder
Marketing
Operations
81
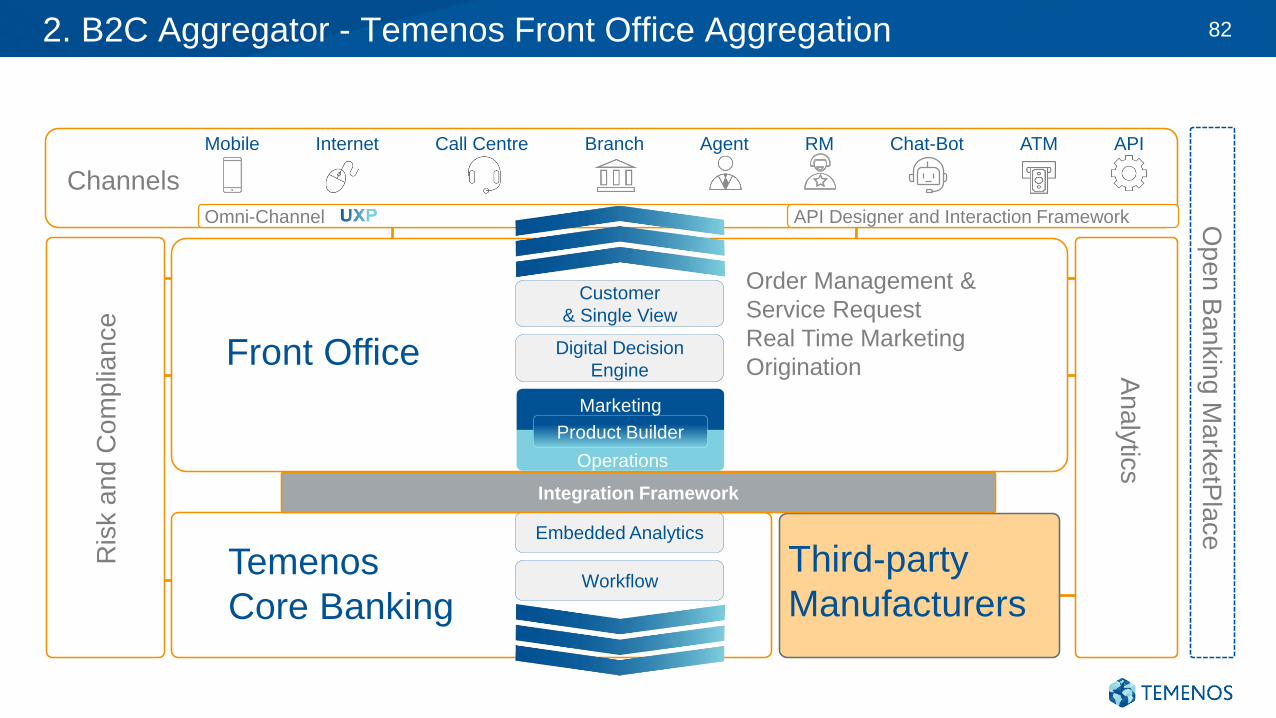
Mobile APIInternet ATMBranch AgentCall Centre
2. B2C Aggregator - Temenos Front Office Aggregation 82
Omni-Channel API Designer and Interaction Framework
Channels
Front Office
Temenos
Core Banking
Order Management &
Service Request
Real Time Marketing
Origination
Workflow
Customer
& Single View
Digital Decision
Engine
Embedded Analytics
RM Chat-Bot
Ris
k a
nd
Co
mp
lian
ce
An
aly
tics
Op
en
Ba
nkin
g M
ark
etP
lace
Product Builder
Marketing
Operations
Third-party
Manufacturers
Integration Framework
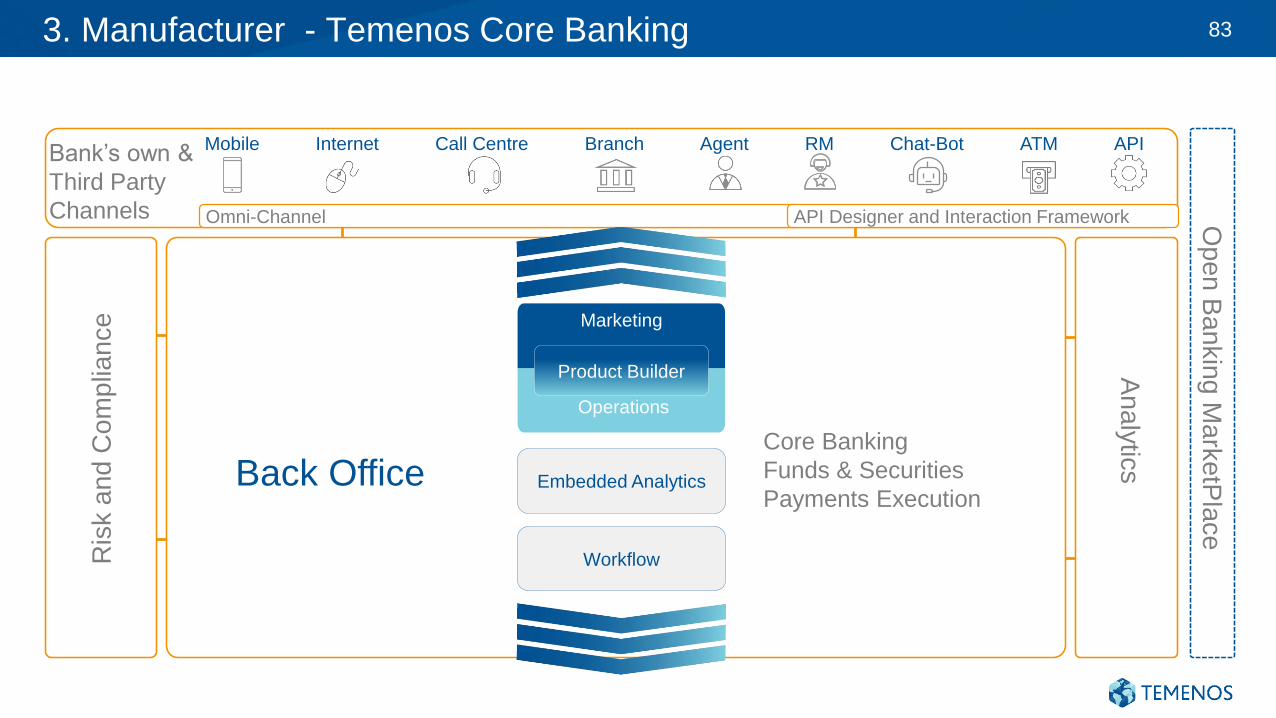
3. Manufacturer - Temenos Core Banking 83
Back Office
Workflow
Embedded Analytics
Ris
k a
nd
Co
mp
lian
ce
An
aly
tics
Op
en
Ba
nkin
g M
ark
etP
lace
Product Builder
Marketing
Operations
Core Banking
Funds & Securities
Payments Execution
Mobile APIInternet ATMBranch AgentCall Centre RM Chat-Bot
Omni-Channel
Bank’s own &
Third Party
Channels API Designer and Interaction Framework
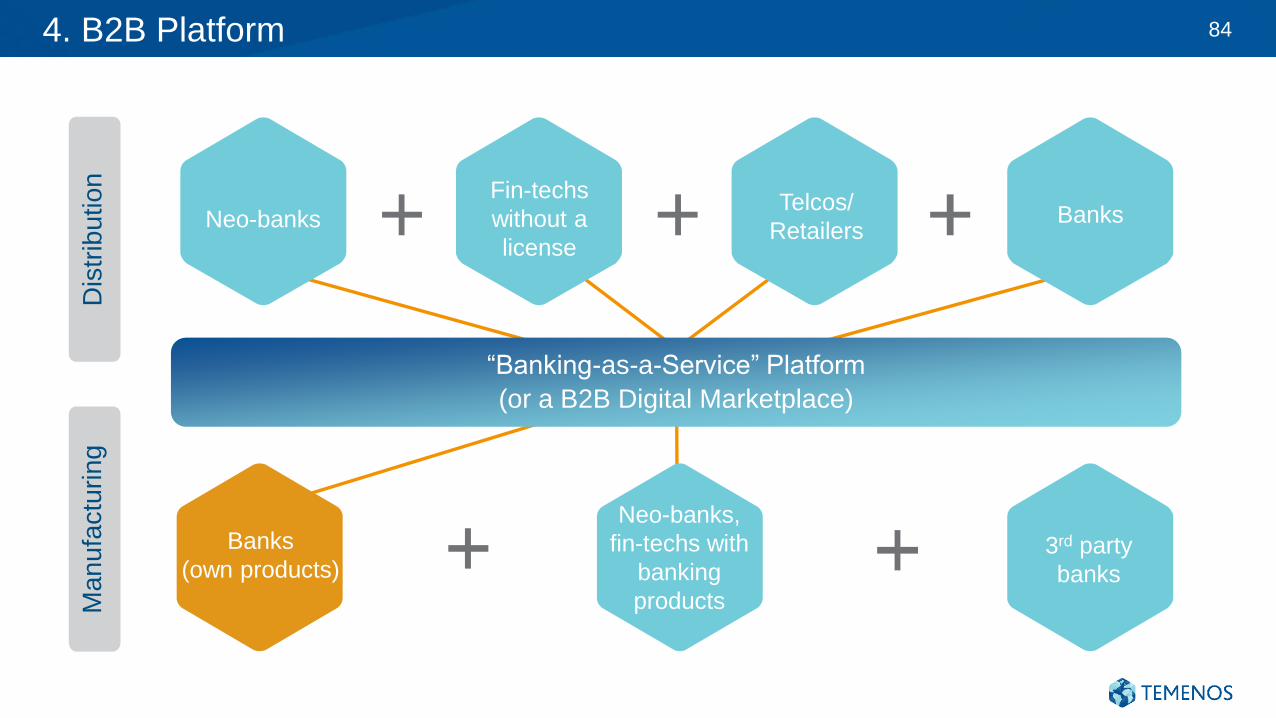
4. B2B Platform
Neo-banks
Fin-techs
without a
license
Telcos/
Retailers
3rd party
banks
Neo-banks,
fin-techs with
banking
products
Bank
oducts)
Dis
trib
utio
nM
an
ufa
ctu
rin
g
“Banking-as-a-Service” Platform
(or a B2B Digital Marketplace)
Banks
Banks
(own products)
84
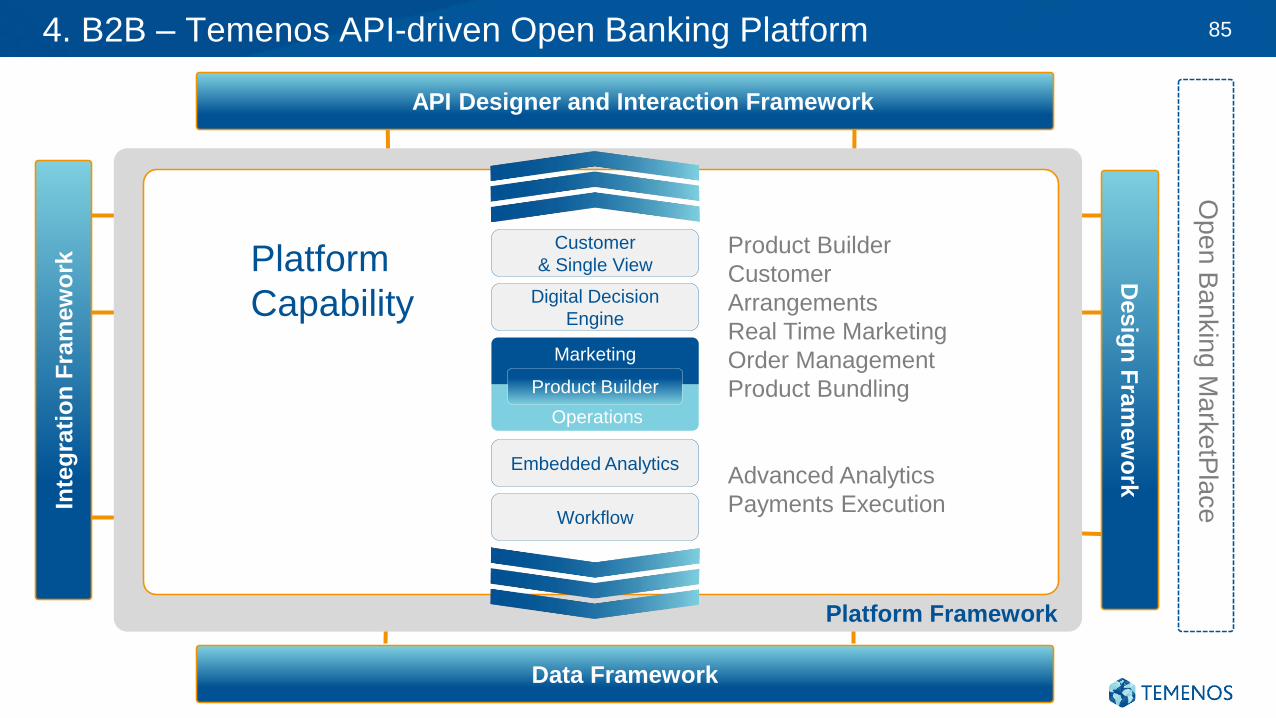
4. B2B – Temenos API-driven Open Banking Platform 85
Platform
Capability
Product Builder
Customer
Arrangements
Real Time Marketing
Order Management
Product Bundling
Workflow
Customer
& Single View
Digital Decision
Engine
Embedded Analytics
An
aly
tics
Product Builder
Marketing
Operations
API Designer and Interaction Framework
Op
en
Ba
nkin
g M
ark
etP
lace
Advanced Analytics
Payments Execution
Platform Framework
Inte
gra
tio
n F
ram
ew
ork
API Designer and Interaction Framework
Desig
n F
ram
ew
ork
Data Framework
Artificial
Intelligence at
Temenos
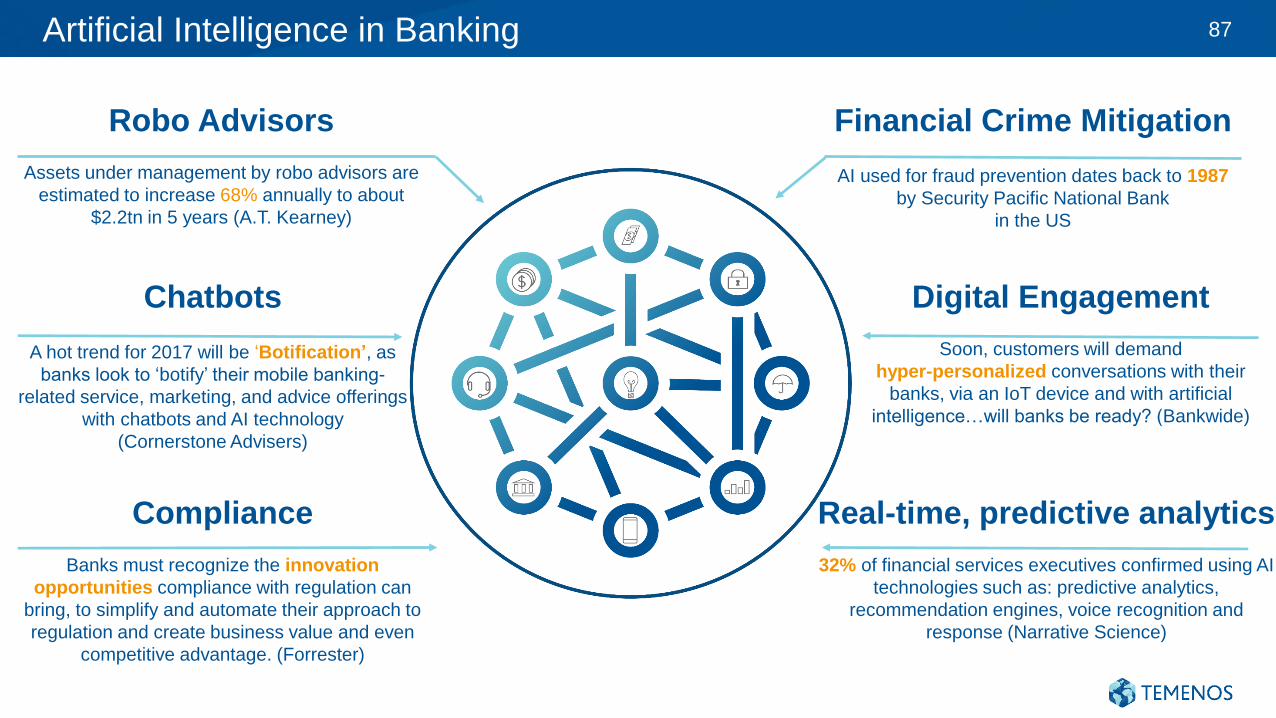
Artificial Intelligence in Banking
Robo Advisors
Assets under management by robo advisors are
estimated to increase 68% annually to about
$2.2tn in 5 years (A.T. Kearney)
Chatbots
A hot trend for 2017 will be ‘Botification’, as
banks look to ‘botify’ their mobile banking-
related service, marketing, and advice offerings
with chatbots and AI technology
(Cornerstone Advisers)
Financial Crime Mitigation
AI used for fraud prevention dates back to 1987
by Security Pacific National Bank
in the US
Digital Engagement
Soon, customers will demand
hyper-personalized conversations with their
banks, via an IoT device and with artificial
intelligence…will banks be ready? (Bankwide)
Real-time, predictive analytics
32% of financial services executives confirmed using AI
technologies such as: predictive analytics,
recommendation engines, voice recognition and
response (Narrative Science)
Compliance
Banks must recognize the innovation
opportunities compliance with regulation can
bring, to simplify and automate their approach to
regulation and create business value and even
competitive advantage. (Forrester)
87
Mobile APIInternet ATMBranch AgentCall Centre
ChannelsUXP Platform
Ris
k a
nd
Co
mp
lian
ce
An
aly
tics
Interaction Framework
Inte
gra
tion F
ram
ew
ork
Data Framework
Front Office360° Single
Customer View
Back Office
Digital Engagement
Product BuilderCore Banking Payments
Customer Data
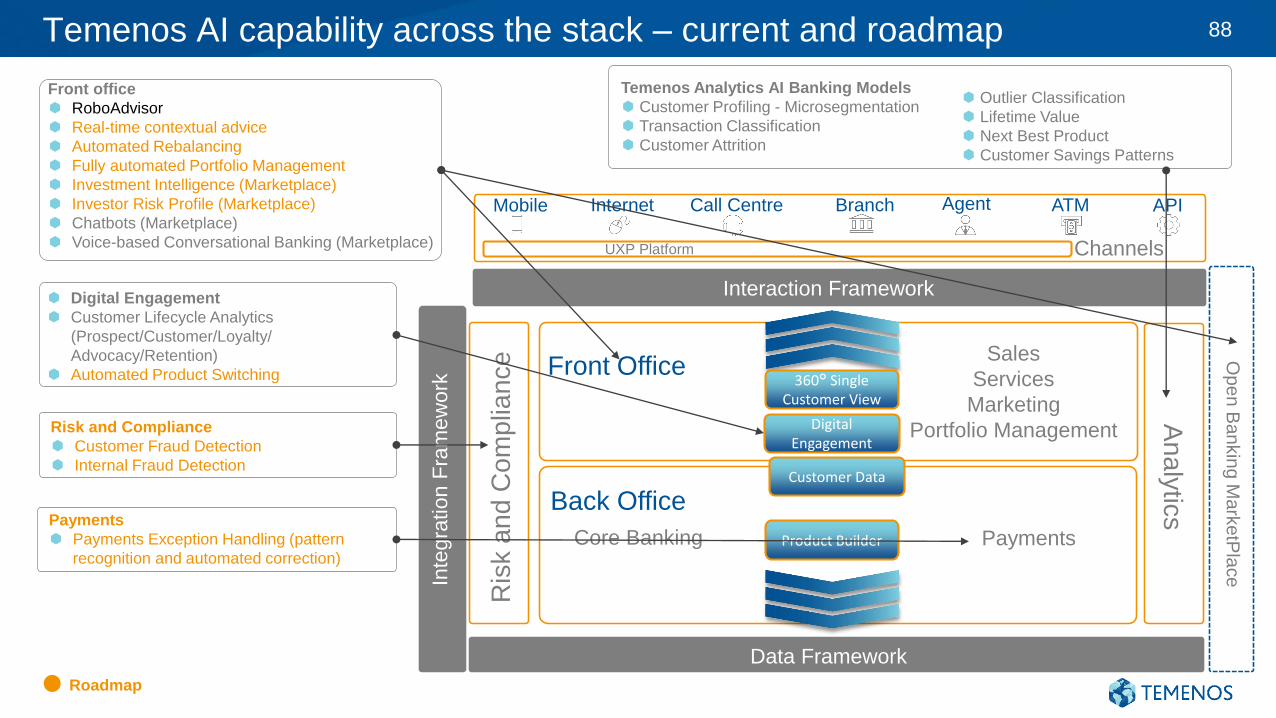
Temenos AI capability across the stack – current and roadmap
Risk and Compliance
Customer Fraud Detection
Internal Fraud Detection
Digital Engagement
Customer Lifecycle Analytics
(Prospect/Customer/Loyalty/
Advocacy/Retention)
Automated Product Switching
Payments
Payments Exception Handling (pattern
recognition and automated correction)
Front office
RoboAdvisor
Real-time contextual advice
Automated Rebalancing
Fully automated Portfolio Management
Investment Intelligence (Marketplace)
Investor Risk Profile (Marketplace)
Chatbots (Marketplace)
Voice-based Conversational Banking (Marketplace)
Temenos Analytics AI Banking Models
Customer Profiling - Microsegmentation
Transaction Classification
Customer Attrition
Sales
Services
Marketing
Portfolio Management
Op
en
Ba
nkin
g M
ark
etP
lace
Outlier Classification
Lifetime Value
Next Best Product
Customer Savings Patterns
88
Roadmap
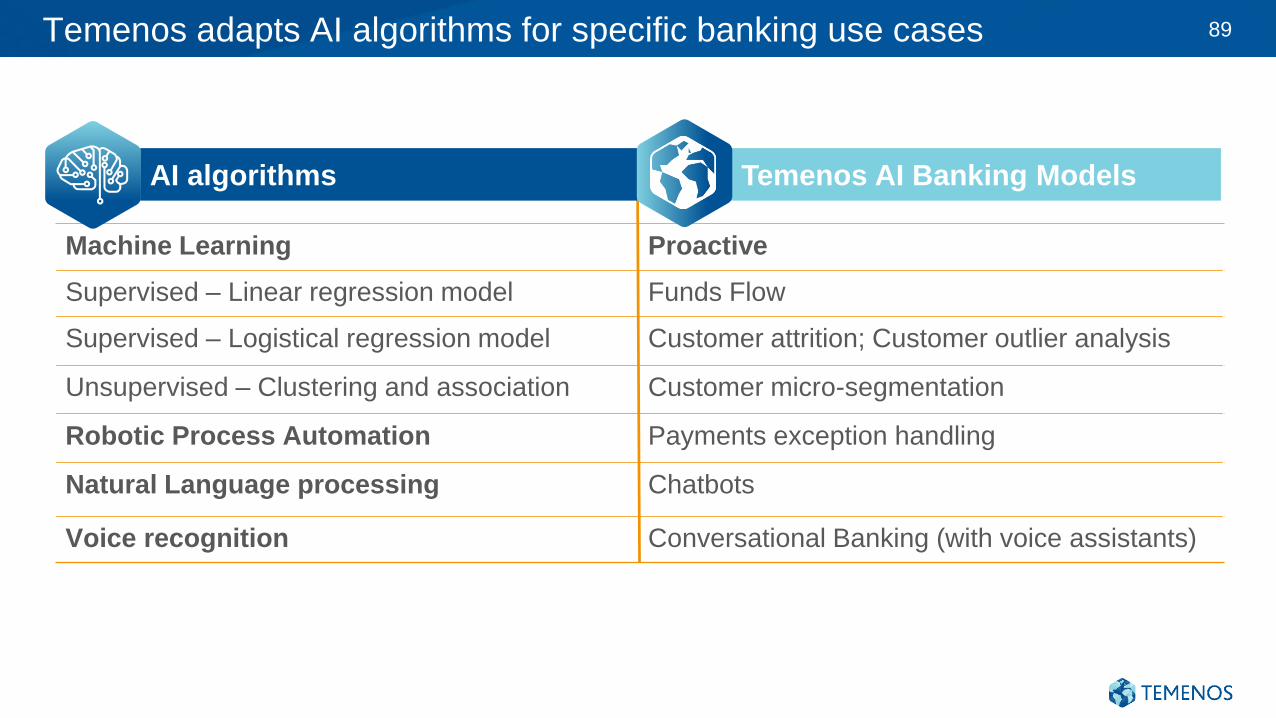
Machine Learning Proactive
Supervised – Linear regression model Funds Flow
Supervised – Logistical regression model Customer attrition; Customer outlier analysis
Unsupervised – Clustering and association Customer micro-segmentation
Robotic Process Automation Payments exception handling
Natural Language processing Chatbots
Voice recognition Conversational Banking (with voice assistants)
AI algorithms Temenos AI Banking Models
Temenos adapts AI algorithms for specific banking use cases 89

90
Creating
shareholder value
Max Chuard, CFO, COO
14 February 2018
1. Creating shareholder value
2. Drivers of growth
3. Medium term targets
Agenda
Creating
shareholder
value
d
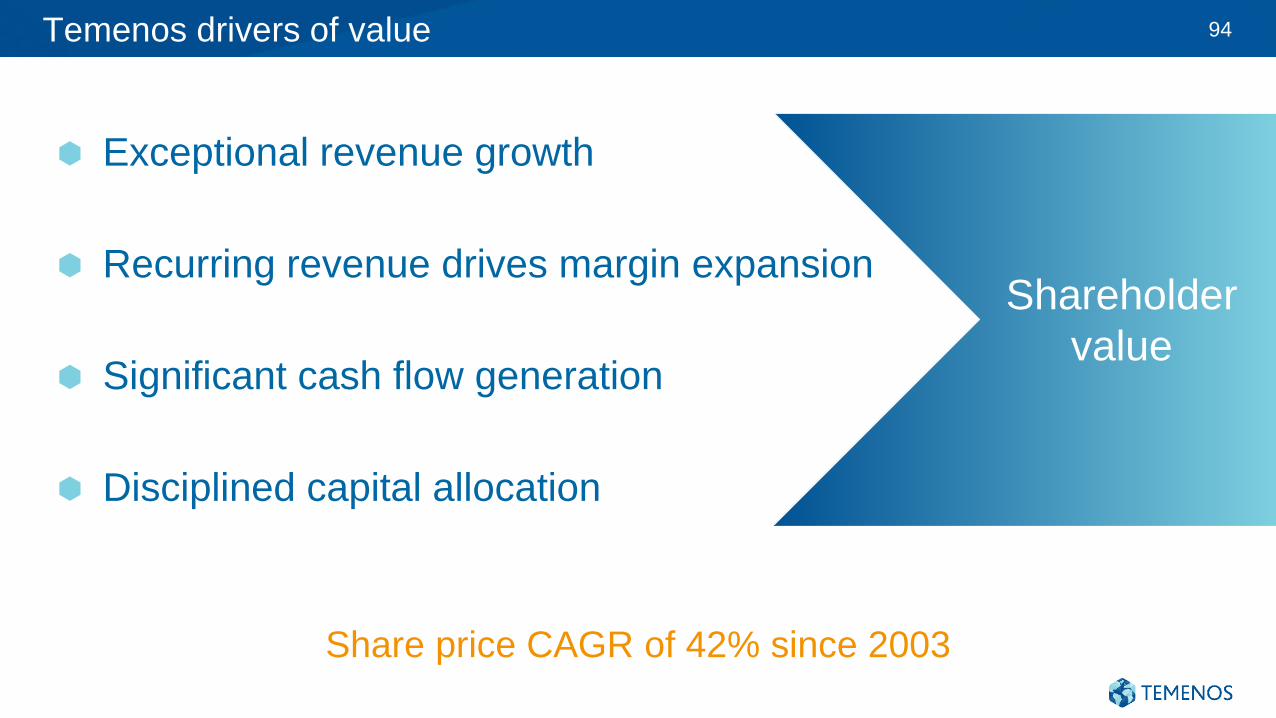
Exceptional revenue growth
Recurring revenue drives margin expansion
Significant cash flow generation
Disciplined capital allocation
Temenos drivers of value 94
Shareholder
value
Share price CAGR of 42% since 2003
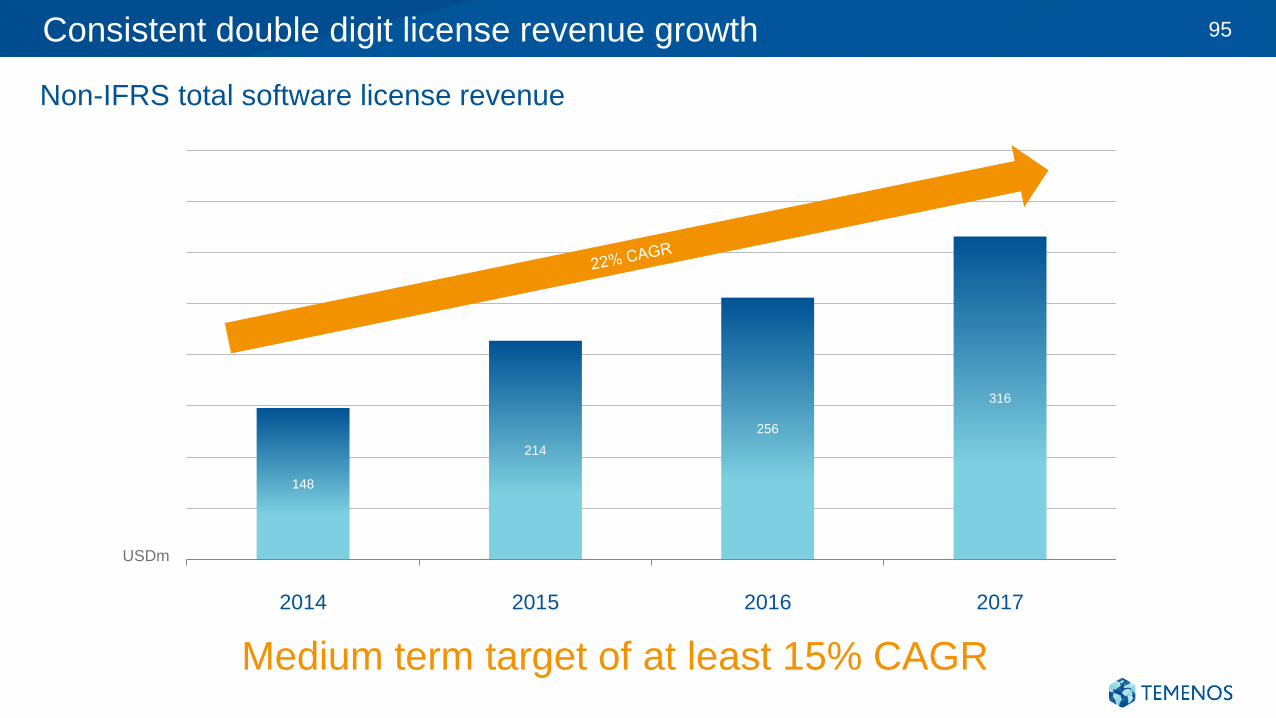
148
214
256
316
2014 2015 2016 2017
Consistent double digit license revenue growth 95
Non-IFRS total software license revenue
Medium term target of at least 15% CAGR
USDm
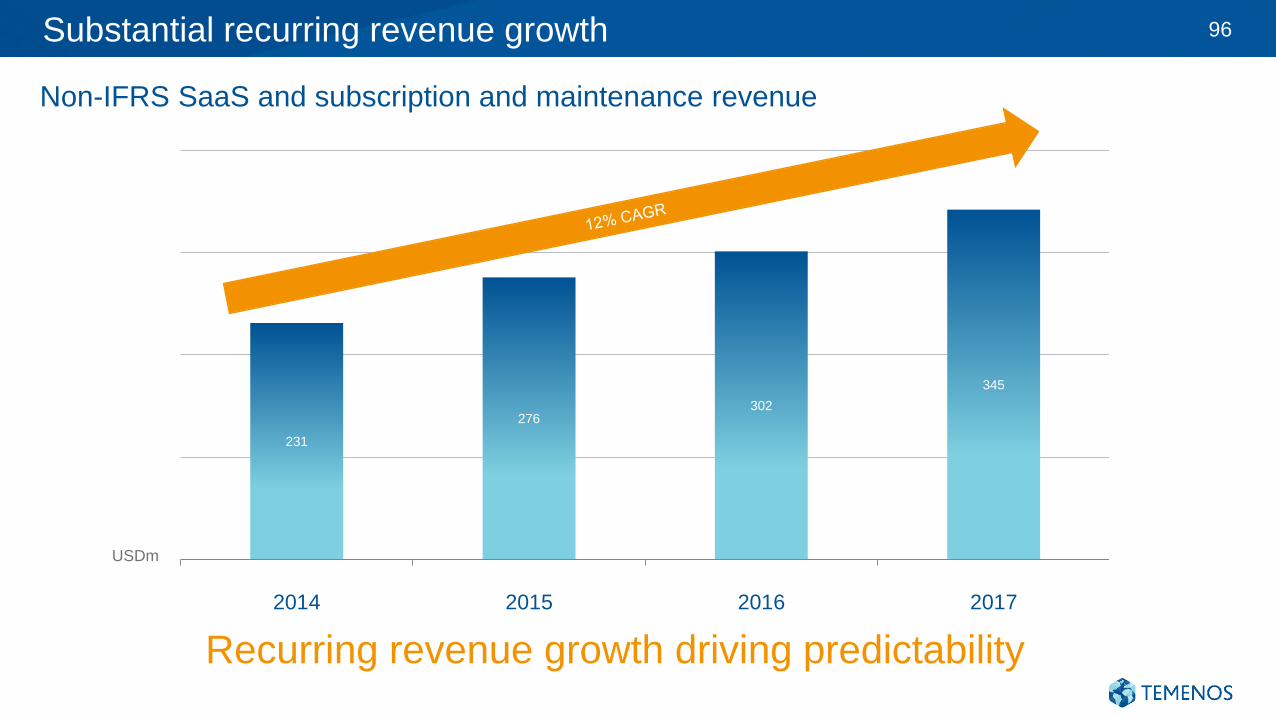
231
276302
345
2014 2015 2016 2017
Substantial recurring revenue growth 96
Non-IFRS SaaS and subscription and maintenance revenue
USDm
Recurring revenue growth driving predictability
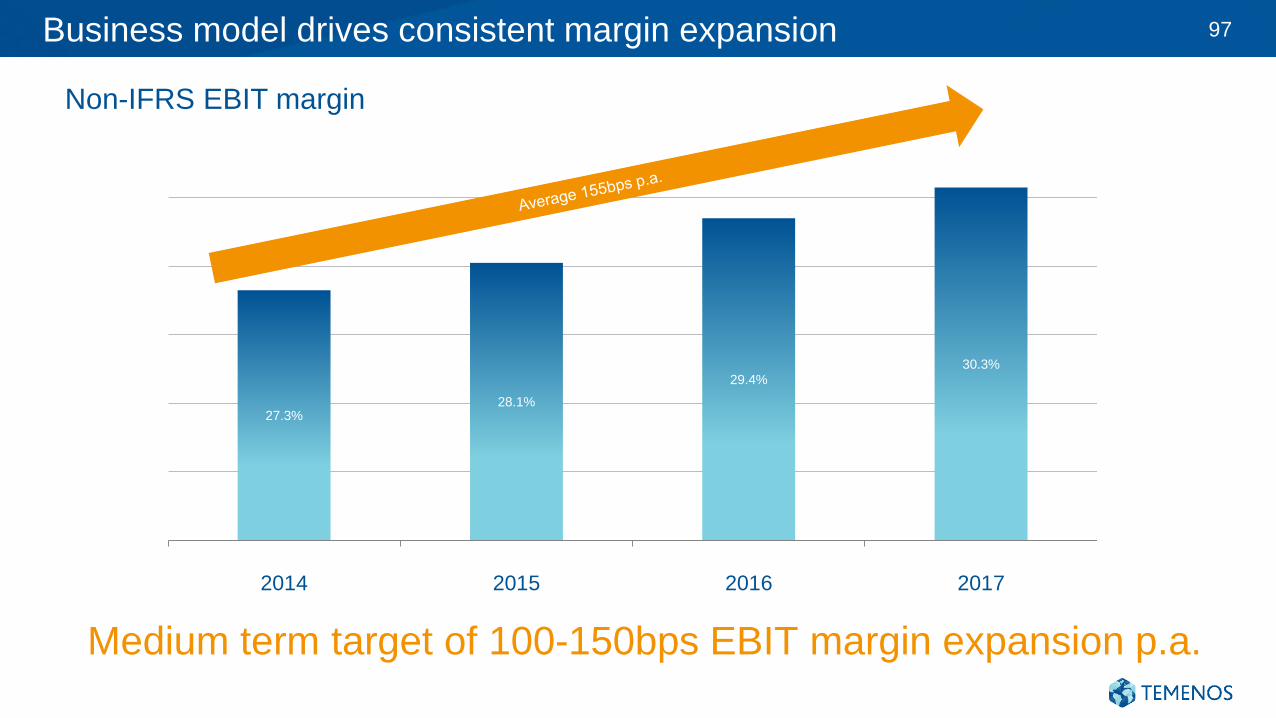
27.3%28.1%
29.4%30.3%
2014 2015 2016 2017
Business model drives consistent margin expansion 97
Non-IFRS EBIT margin
Medium term target of 100-150bps EBIT margin expansion p.a.
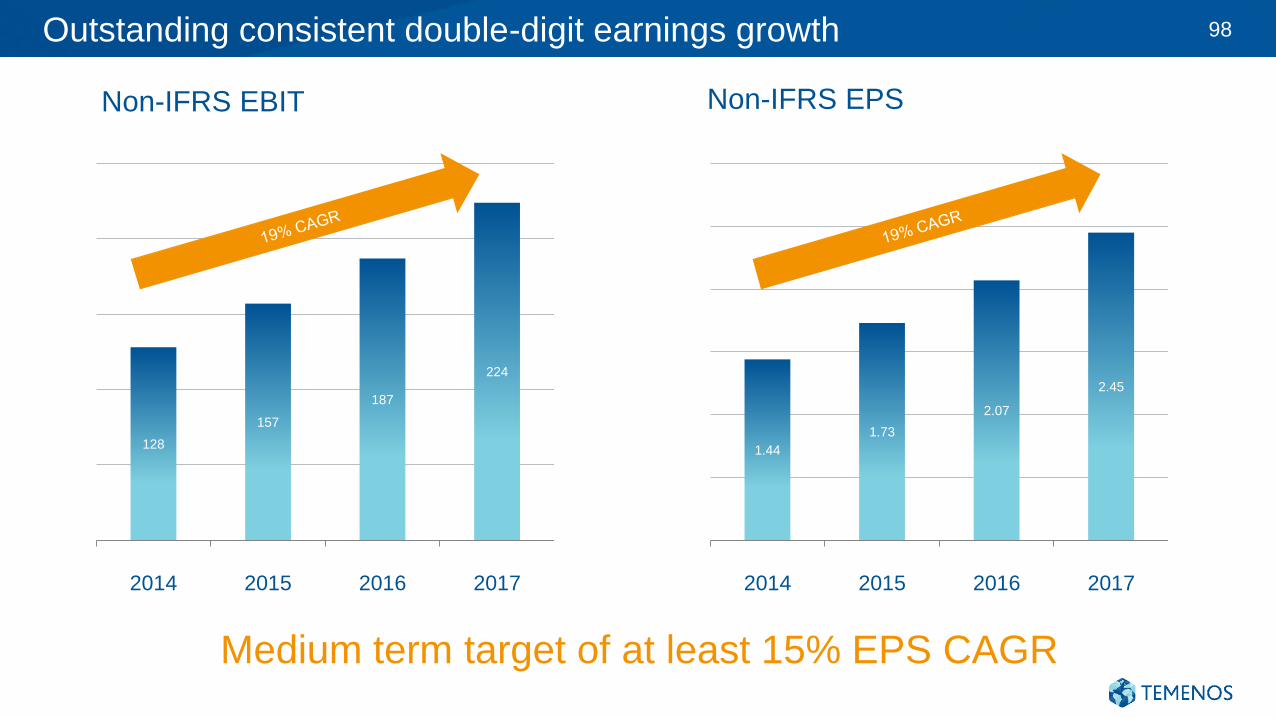
1.44
1.73
2.07
2.45
2014 2015 2016 2017
Outstanding consistent double-digit earnings growth 98
Non-IFRS EBIT
Medium term target of at least 15% EPS CAGR
Non-IFRS EPS
128
157
187
224
2014 2015 2016 2017
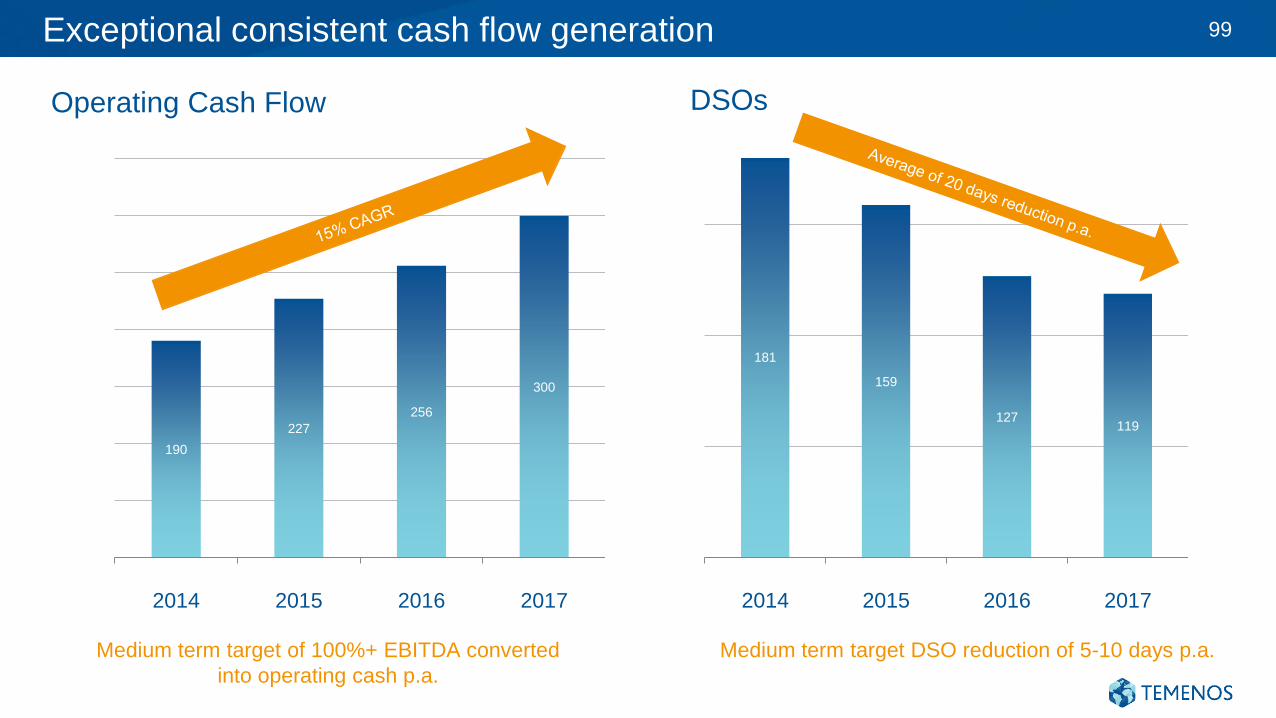
Exceptional consistent cash flow generation 99
Operating Cash Flow
190
227
256
300
2014 2015 2016 2017
Medium term target of 100%+ EBITDA converted
into operating cash p.a.
181
159
127119
2014 2015 2016 2017
DSOs
Medium term target DSO reduction of 5-10 days p.a.
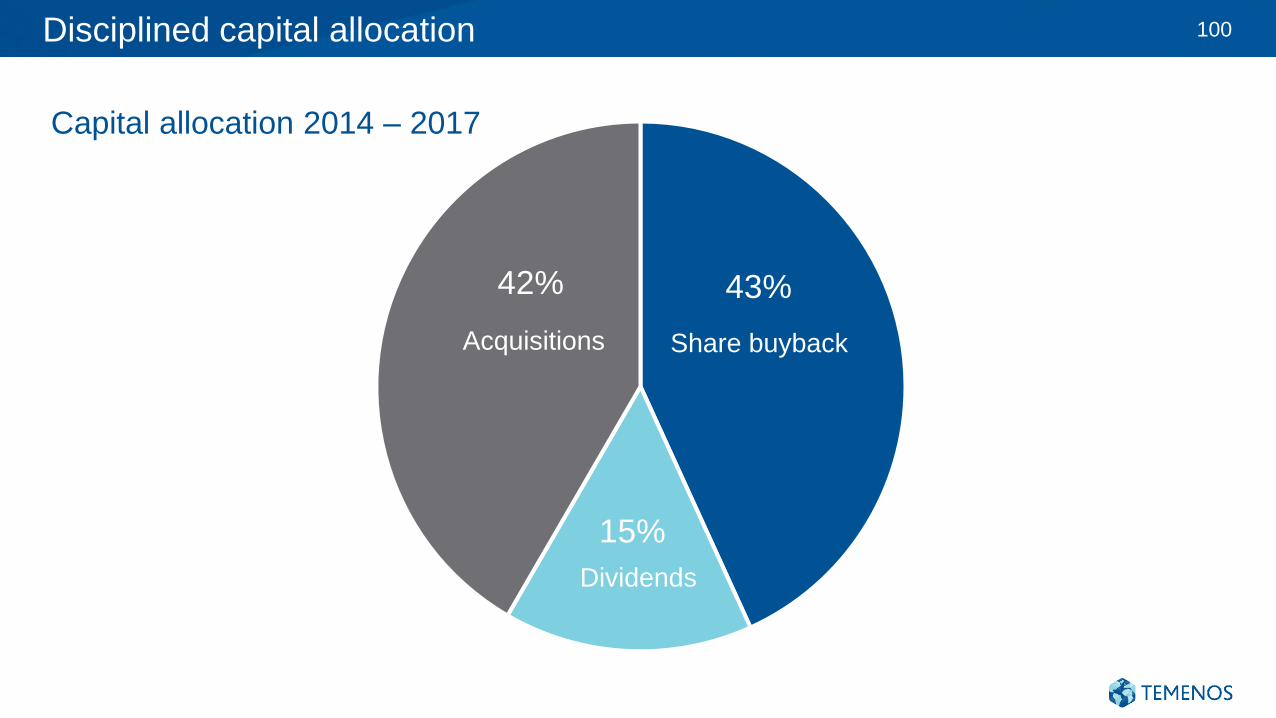
Disciplined capital allocation
43%
15%
42%
Acquisitions Share buyback
Dividends
100
Capital allocation 2014 – 2017
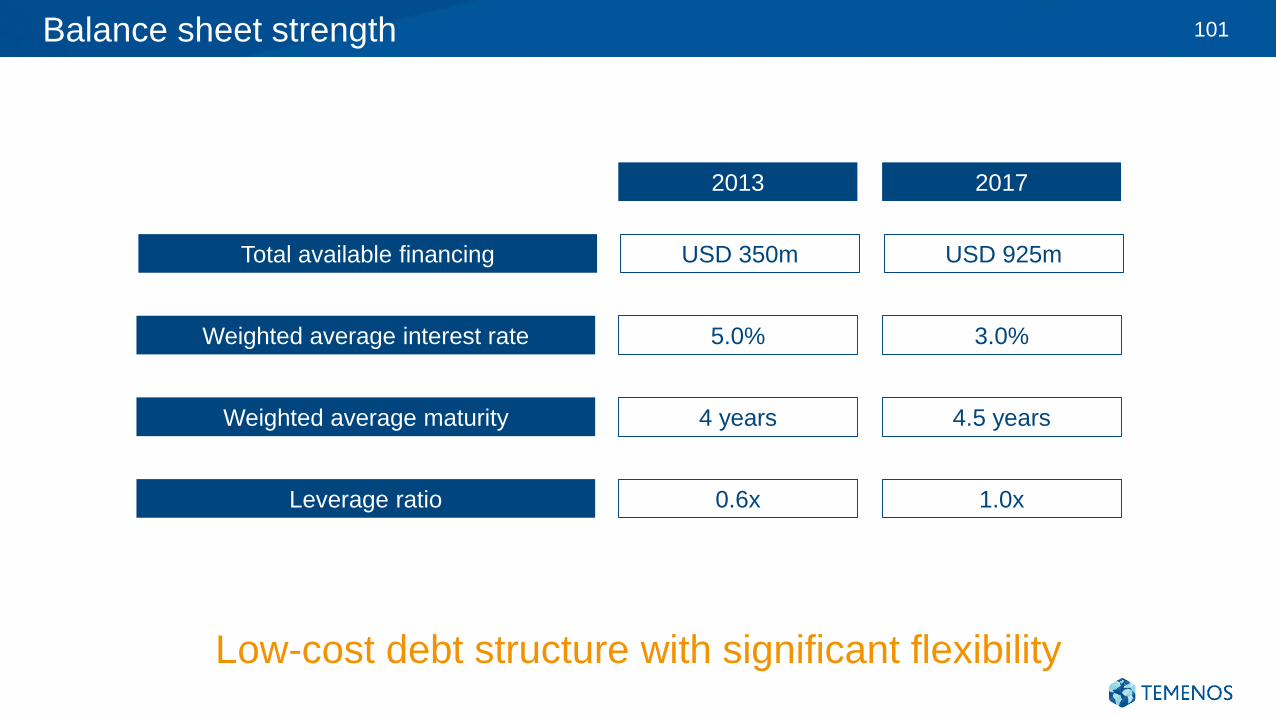
Balance sheet strength 101
Weighted average interest rate 3.0%5.0%
Total available financing USD 925mUSD 350m
Leverage ratio 1.0x0.6x
Weighted average maturity 4.5 years4 years
20172013
Low-cost debt structure with significant flexibility
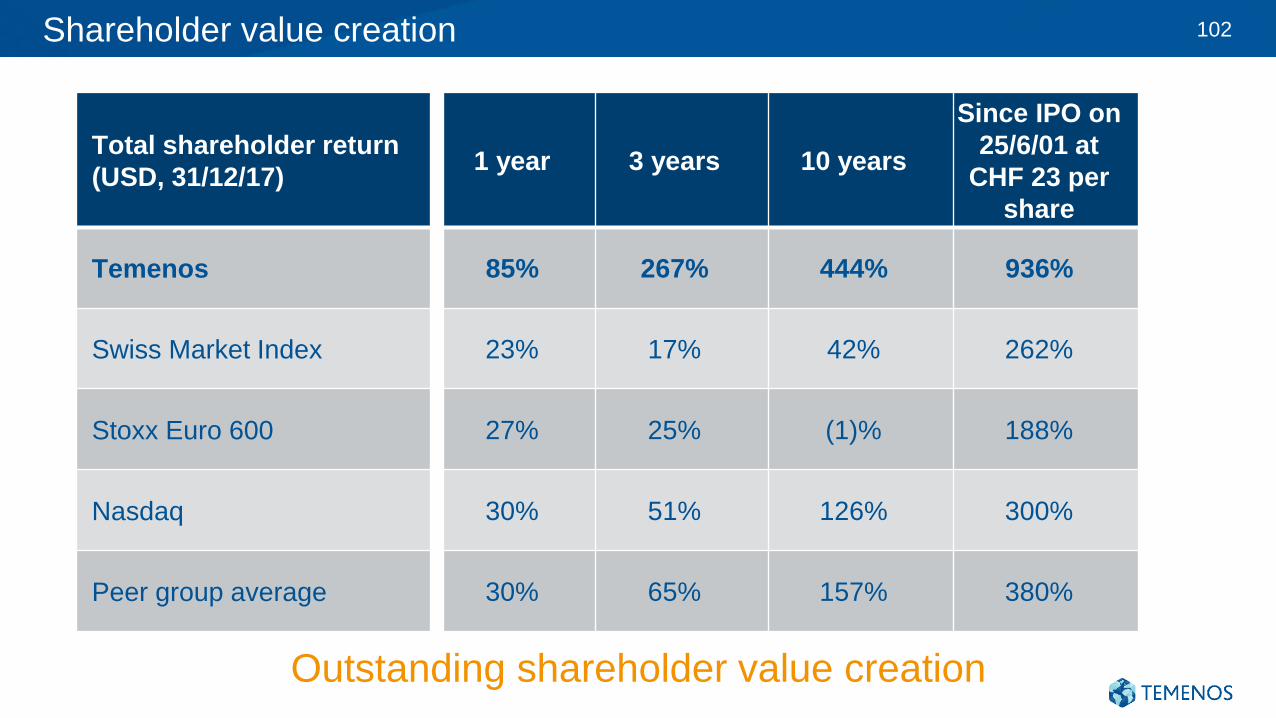
Shareholder value creation 102
Total shareholder return
(USD, 31/12/17)1 year 3 years 10 years
Since IPO on
25/6/01 at
CHF 23 per
share
Temenos 85% 267% 444% 936%
Swiss Market Index 23% 17% 42% 262%
Stoxx Euro 600 27% 25% (1)% 188%
Nasdaq 30% 51% 126% 300%
Peer group average 30% 65% 157% 380%
Outstanding shareholder value creation
Drivers of
growth
0.0
2.0
4.0
6.0
8.0
10.0
12.0
14.0
16.0
2007 2013 2017 Medium term
Core banking Front Office Channels Payments Fund Admin Compliance Origination
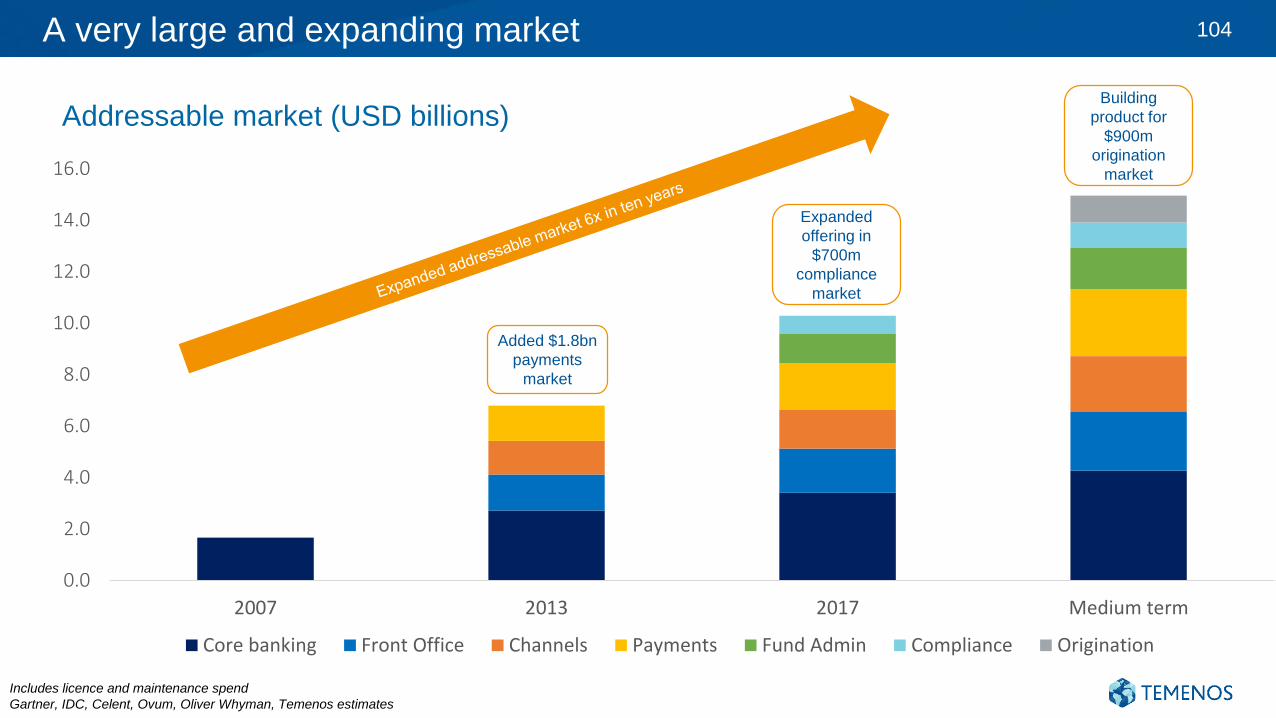
A very large and expanding market 104
Addressable market (USD billions)
Includes licence and maintenance spend
Gartner, IDC, Celent, Ovum, Oliver Whyman, Temenos estimates
Added $1.8bn
payments
market
Expanded
offering in
$700m
compliance
market
Building
product for
$900m
origination
market
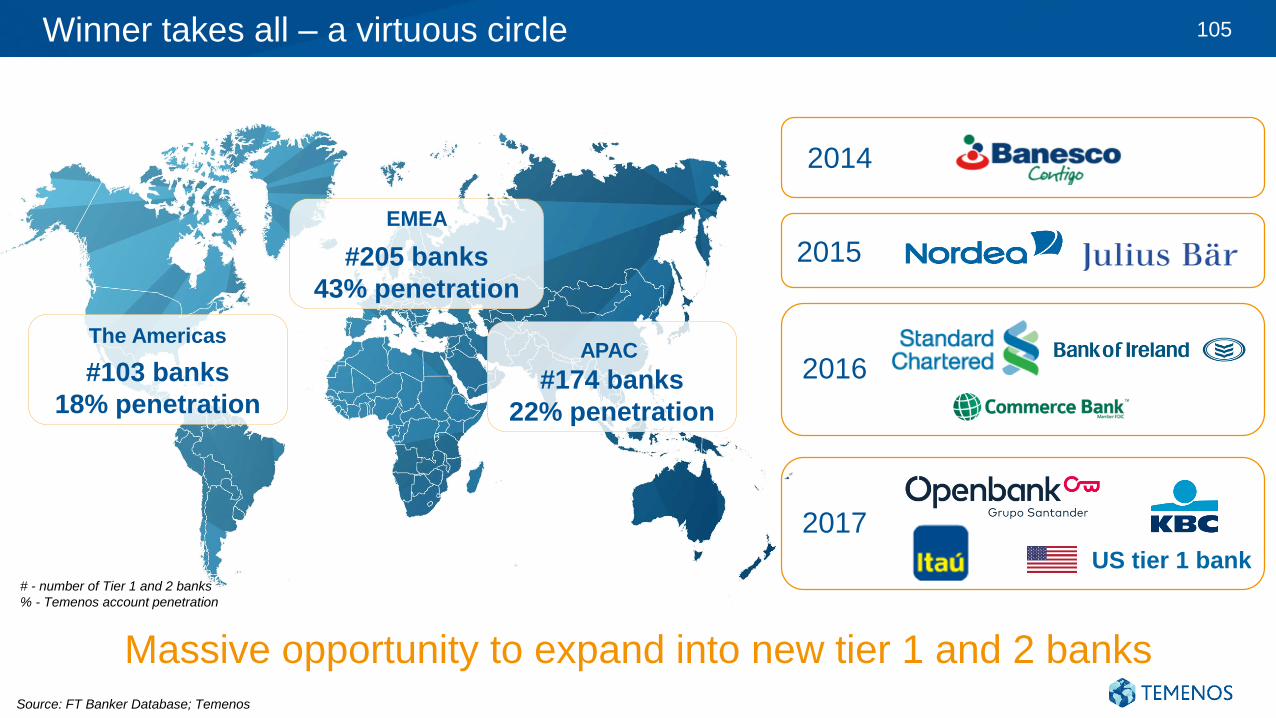
Winner takes all – a virtuous circle 105
#103 banks
18% penetration
#205 banks
43% penetration
#174 banks
22% penetration
Source: FT Banker Database; Temenos
# - number of Tier 1 and 2 banks
% - Temenos account penetration
The Americas
EMEA
APAC
Massive opportunity to expand into new tier 1 and 2 banks
2014
$27m$44m
2015
2016
US tier 1 bank
2017
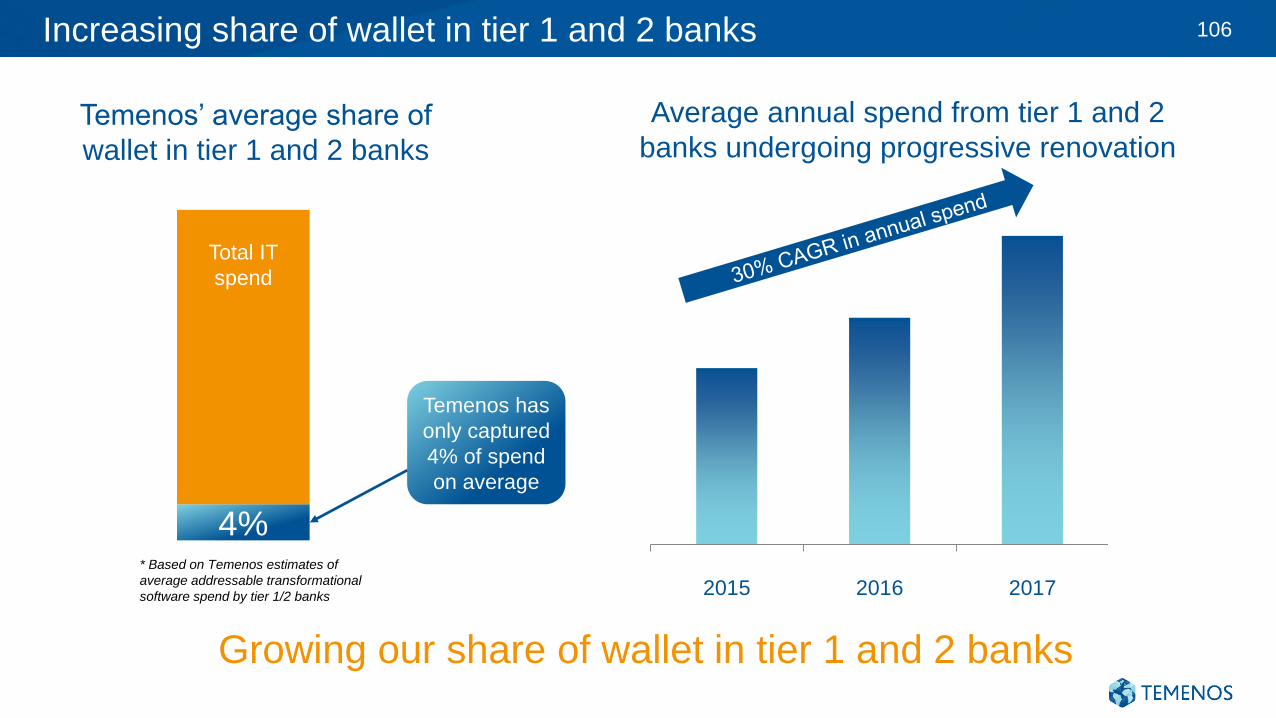
Increasing share of wallet in tier 1 and 2 banks 106
Average annual spend from tier 1 and 2
banks undergoing progressive renovation
2015 2016 2017
Growing our share of wallet in tier 1 and 2 banks
4%
Temenos’ average share of
wallet in tier 1 and 2 banks
* Based on Temenos estimates of
average addressable transformational
software spend by tier 1/2 banks
Temenos has
only captured
4% of spend
on average
Total IT
spend
Tier 1 & 2 Tier 3, 4 & 5
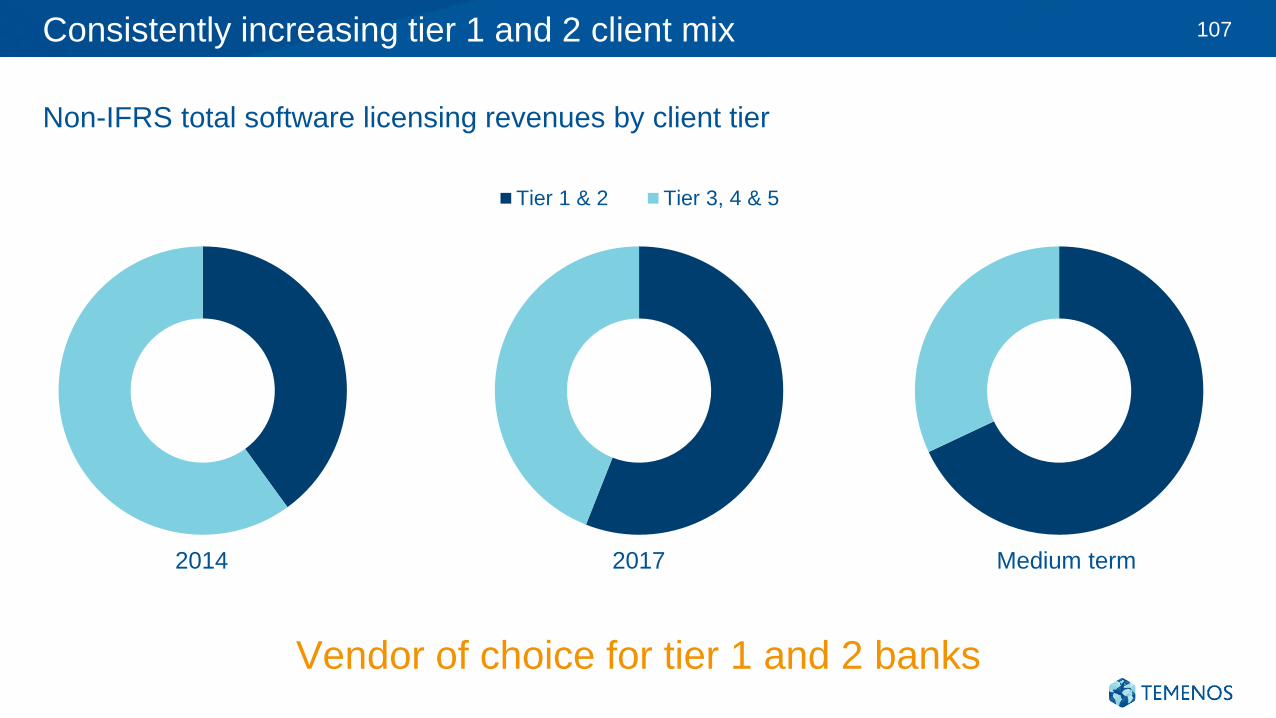
Consistently increasing tier 1 and 2 client mix 107
2014 2017 Medium term
Non-IFRS total software licensing revenues by client tier
Vendor of choice for tier 1 and 2 banks
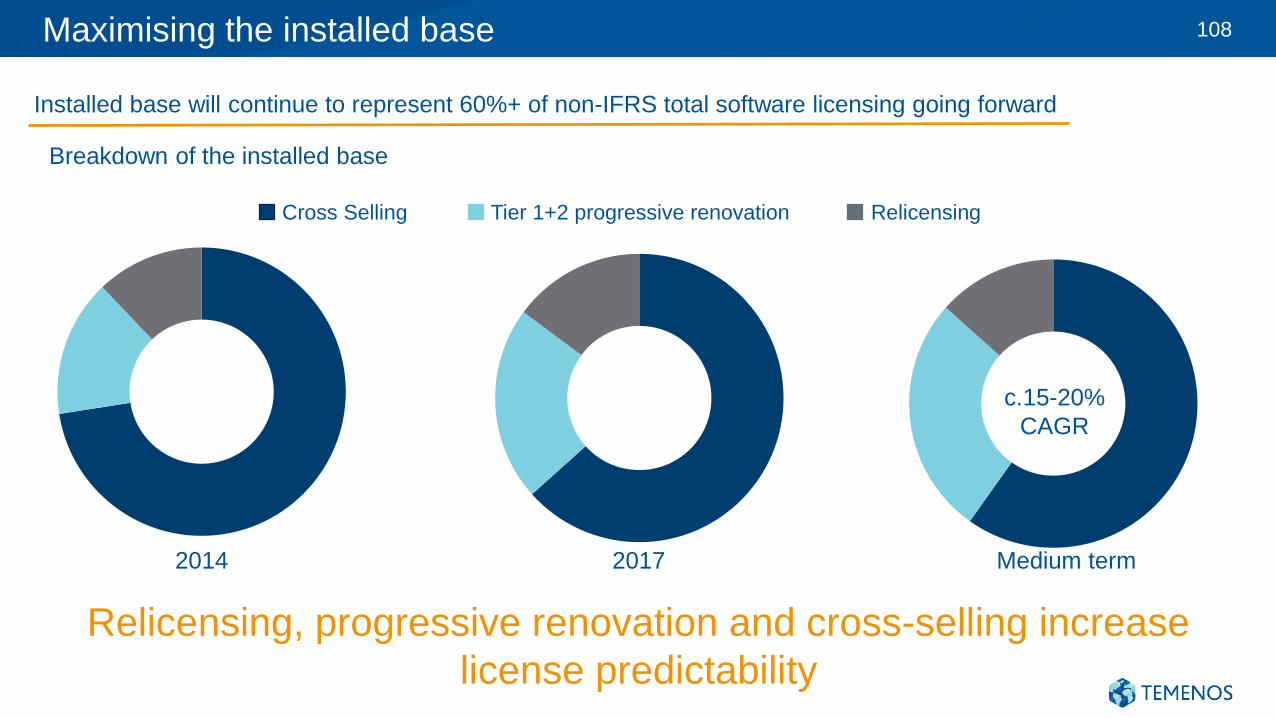
Maximising the installed base 108
2014 2017 Medium term
Installed base will continue to represent 60%+ of non-IFRS total software licensing going forward
Breakdown of the installed base
c.15-20%
CAGR
Cross Selling Tier 1+2 progressive renovation Relicensing
Relicensing, progressive renovation and cross-selling increase
license predictability
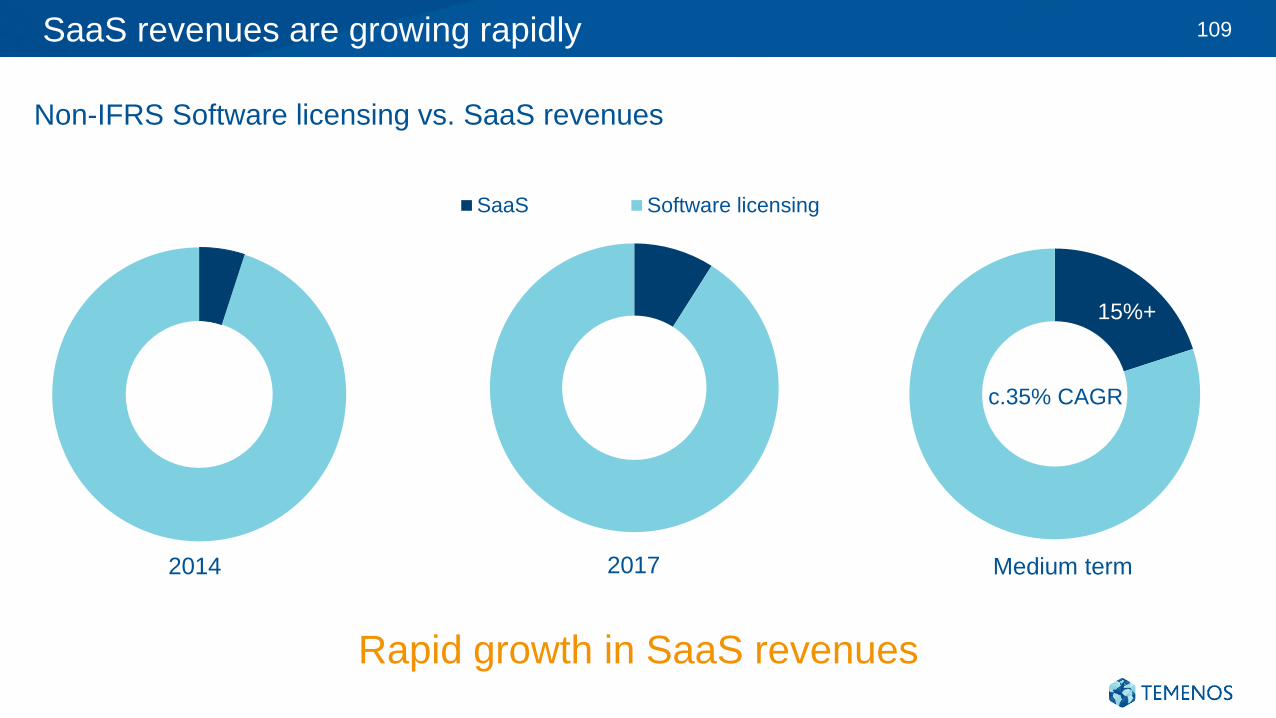
SaaS revenues are growing rapidly 109
SaaS Software licensing
2014 2017 Medium term
Non-IFRS Software licensing vs. SaaS revenues
c.35% CAGR
15%+
Rapid growth in SaaS revenues
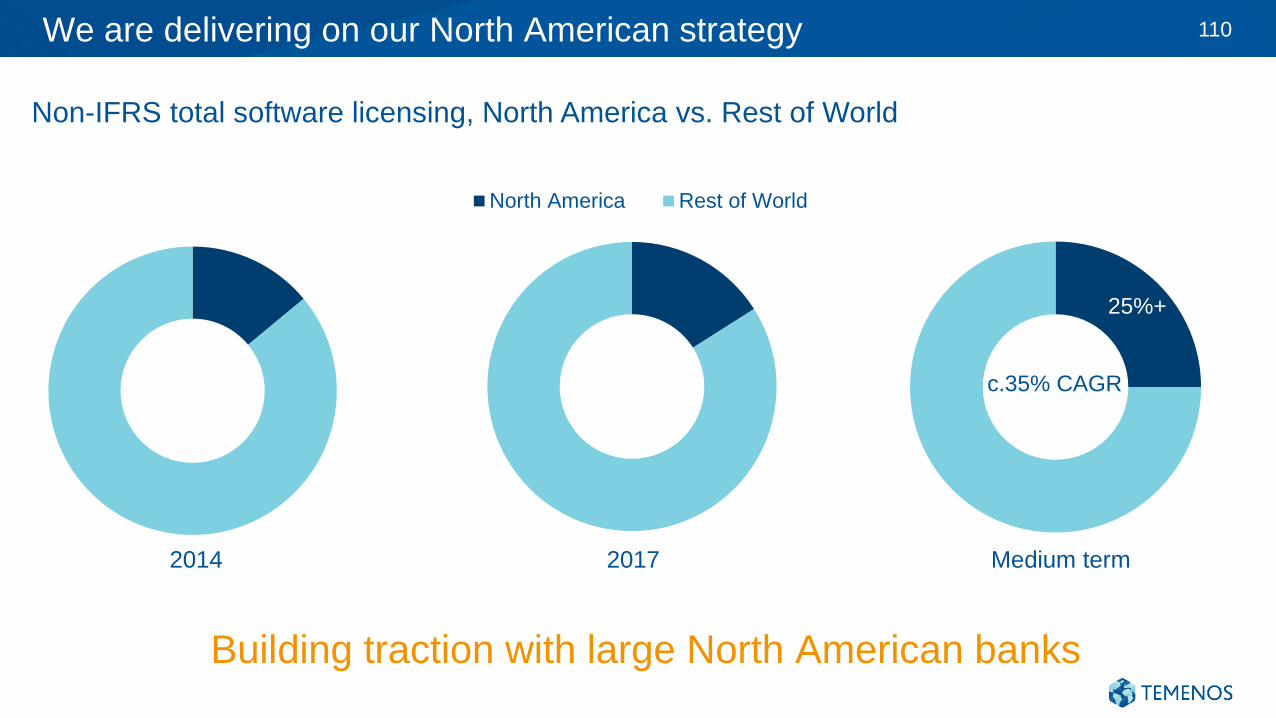
We are delivering on our North American strategy 110
North America Rest of World
2014 2017 Medium term
Non-IFRS total software licensing, North America vs. Rest of World
c.35% CAGR
25%+
Building traction with large North American banks
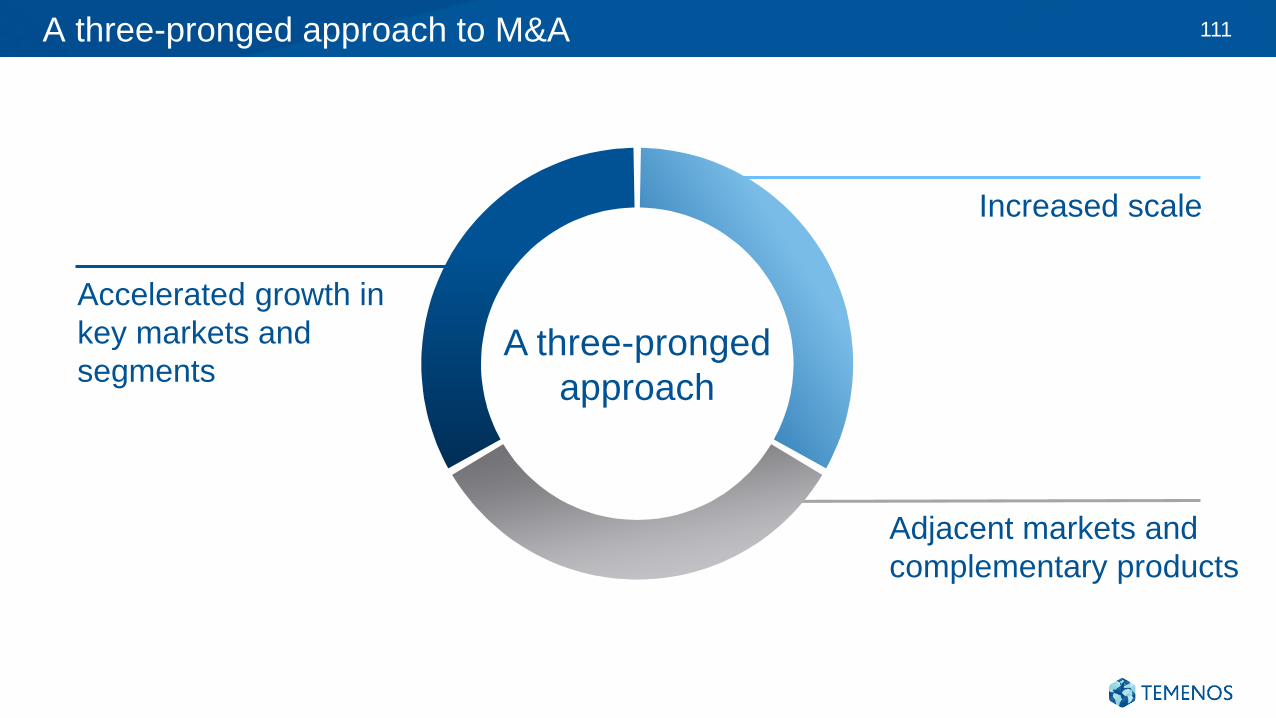
A three-pronged approach to M&A 111
A three-pronged
approach
Accelerated growth in
key markets and
segments
Increased scale
Adjacent markets and
complementary products
Medium term
targets
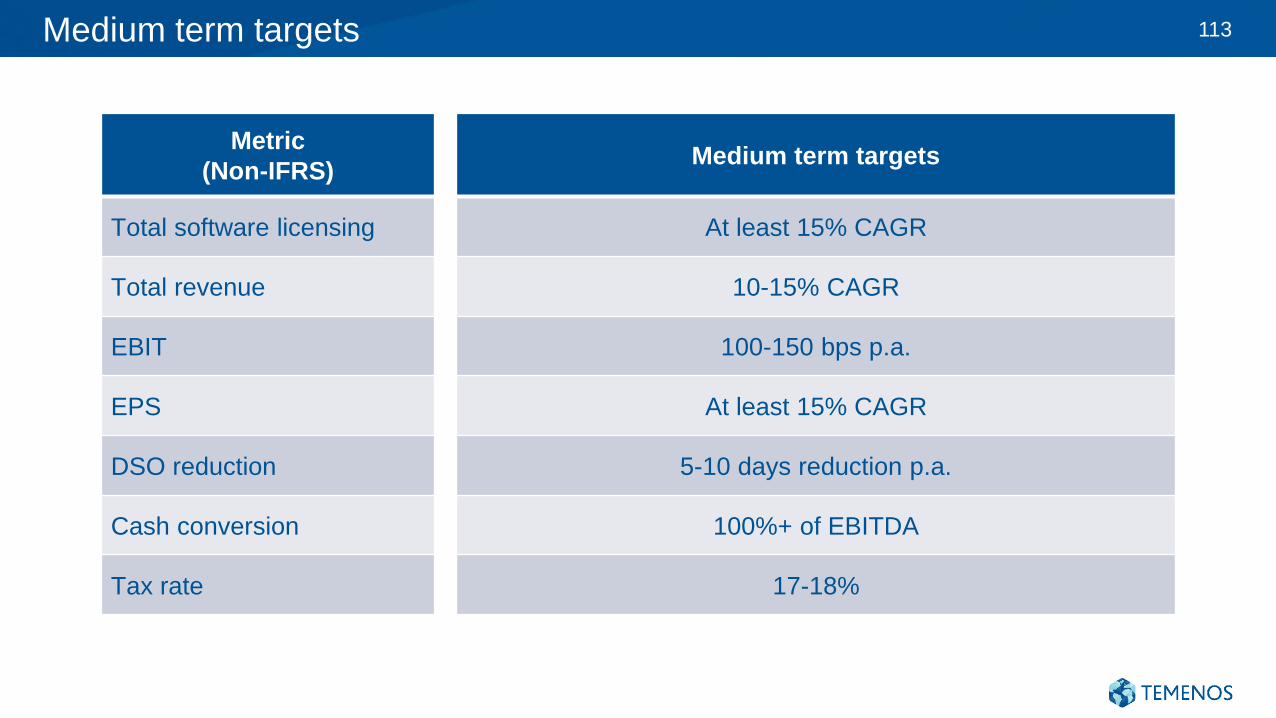
Medium term targets 113
Metric
(Non-IFRS)Medium term targets
Total software licensing At least 15% CAGR
Total revenue 10-15% CAGR
EBIT 100-150 bps p.a.
EPS At least 15% CAGR
DSO reduction 5-10 days reduction p.a.
Cash conversion 100%+ of EBITDA
Tax rate 17-18%
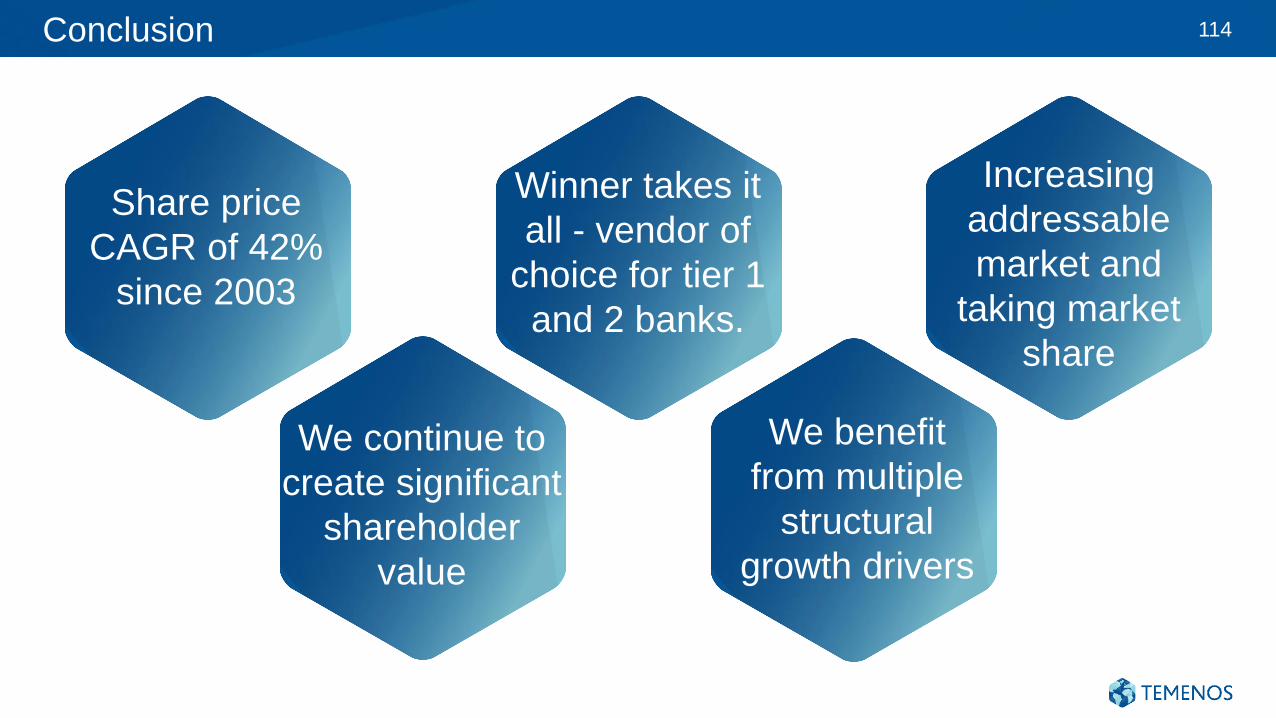
Conclusion 114
Shareholder
value
Share price
CAGR of 42%
since 2003
Winner takes it
all - vendor of
choice for tier 1
and 2 banks.
Increasing
addressable
market and
taking market
share
We continue to
create significant
shareholder
value
We benefit
from multiple
structural
growth drivers
www.temenos.com


