Applied Mathematical Sciences, Vol. 8, 2014, no. 140, 6951 - 6961
HIKARI Ltd, www.m-hikari.com http://dx.doi.org/10.12988/ams.2014.48616
Psychovisual Threshold on Large Tchebichef
Moment for Image Compression
Nur Azman Abu
Faculty of Information and Communication Technology
Universiti Teknikal Malaysia Melaka, Melaka 76100, Malaysia
Ferda Ernawan
Faculty of Information and Communication Technology
Universiti Teknikal Malaysia Melaka, Melaka 76100, Malaysia
and
Faculty of Computer Science, Universitas Dian Nuswantoro
Semarang 50131, Indonesia
Copyright ©2014 Nur Azman Abu and Ferda Ernawan. This is an open access article
distributed under the Creative Commons Attribution License, which permits unrestricted use,
distribution, and reproduction in any medium, provided the original work is properly cited.
Abstract
JPEG standard transforms an 8×8 image pixel into a frequency domain. The
discontinuities of the intensity image between adjacent image blocks cause the
visual artifacts due to inter-block correlations in image reconstruction. The
blocking artifacts appear by the pixel intensity value discontinuities which occur
along block boundaries. This research proposes the psychovisual threshold on
large Tchebichef moment to minimize the blocking artifacts. The psychovisual
threshold is practically the best measure for the optimal amount of frequency
image signals in the image coding. The psychovisual threshold is a basic element
prior to generating quantization tables in image compression. The psychovisual
threshold on the large Tchebichef moments has given significant improvements in
the quality of image output. The experimental results show that the smooth
psychovisual threshold on the large discrete Tchebichef moment produces high
quality image output and largely free of any visual artifacts.
Keywords: TMT Quantization, Psychovisual Threshold, Tchebichef Moment
Transform, Image Compression
6952 Nur Azman Abu and Ferda Ernawan
1 Introduction
The JPEG image compression implements a basic 8×8 block transform coding.
The block transform coding suffers noticeable quality image degradations near
boundary blocks causes blocking artifact [1]. The most noticeable degradations on
the block transform coding are often visually observable at high compression
ratios [2]. Since the 8×8 blocks of image pixels are encoded separately, the
correlation among spatially adjacent blocks provides boundary blocks when the
image is reconstructed [3]. The block-size on the transform coding gives a
significant effect to the quality of image compression. This experiment mainly
focuses the block-size of the discrete transform and an optimal quantization
values assigned to the frequency image signals. Previously, a psychovisual
threshold has been investigated on 8×8 Tchebichef image compression [4]. In this
paper, the same concept of the psychovisual threshold on 8×8 Tchebichef
moments is adopted to develop the psychovisual threshold on 256×256
Tchebichef moment in image compression. The smooth psychovisual threshold is
an input to generating 256×256 Tchebichef quantization table for lossy image
compression. In this paper, the large 256×256 Tchebichef Moment Transform
(TMT) has been chosen here since TMT has not been practically explored on
large image compression. TMT has been widely used in various image processing
applications. For examples, they are used in image watermarking [5], image
compression [6-10] and image dithering [11].
2 Orthonormal Tchebichef Moment Transform
In this experiment, the contribution of the discrete orthonormal Tchebichef
moment to the image quality shall be explored for image compression. The
discrete orthonormal Tchebichef moment provides a compact support on the large
image block [12]. On large image block, an accumulation of numerical error gets
reduced down due to larger moment order. The discrete orthonormal Tchebichef
transform has energy compactness properties on the large image block. For a
given set {tn(x)} of input value (image intensity values) of size N=256, the
forward orthonormal Tchebichef transform of order m + n is given as follows
[12]: 1 1 1 1
0 0 0 0
( ) ( )( , ) ( ) ( , ) ( )
( , ) ( , )
M N M Nm n
mn m n
x y x y
t x t yT f x y k x f x y k y
m M n N
For m = 0, 1, 2, ..., M-1 and ( , )f x y denotes the intensity value of an image at
the pixel position x and y. The ( )nt x is defined using the following recursive
relation:
1 1 2 1 3 2( ) ( ) ( ) ( ),n n n nt x xt x t x t x
for n = 2, 3, ..., N-1 and x = 0, 1, ..., N-1. Where
Psychovisual threshold on large Tchebichef moment 6953
2
1 2 2
2 4 1n
n N n
,
2
2 2 2
(1 ) 4 1N n
n N n
,
2 2
3 2 2
( 1) 2 1 ( 1)
2 3
n n N n
n n N n
The starting values for the above recursion are obtained from the equations as
follows: 0
1( ) ,t x
N
1 2
3( ) (2 1 ) ,
( 1)t x x N
N N
The recurrence relation to compute the polynomials ( )nt x is given as follows:
(1 )(1) 1 (0),
1n n
n nt t
N
1 2( ) ( 1) ( 2),n n nt x t x t x
For n=1, 2, ..., N-1 and x=2, 3, ..., 12
N
, where
1
( 1) (2 1)( 1),
( )
n n x x N x
x N x
2
( 1)( 1),
( )
x x N
x N x
The above definition uses following scale factor for the polynomial of degree n: 2 2 2 2 2( 1)( 2 )...( )
( , )2 1
N N N N nn N
n
The set ( )nt x
has a squared-norm given by 1
2
0
( , ) ( ) 1.0N
n
i
n N t i
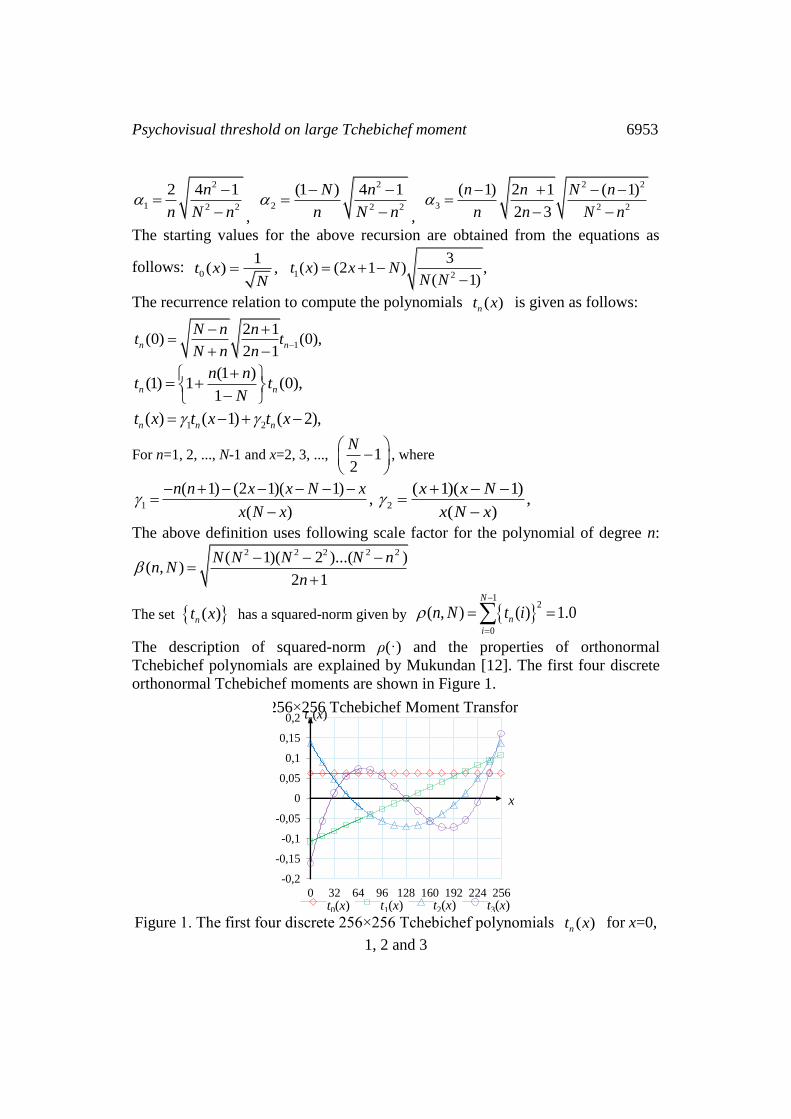
The description of squared-norm ρ(·) and the properties of orthonormal
Tchebichef polynomials are explained by Mukundan [12]. The first four discrete
orthonormal Tchebichef moments are shown in Figure 1.
Figure 1. The first four discrete 256×256 Tchebichef polynomials ( )nt x for x=0,
1, 2 and 3
-0,2
-0,15
-0,1
-0,05
0
0,05
0,1
0,15
0,2
0 32 64 96 128 160 192 224 256
tn(x)
x
256×256 Tchebichef Moment Transform
t0(x) t1(x) t2(x) t3(x)
1
2 1(0) (0),
2 1n n
N n nt t
N n n
6954 Nur Azman Abu and Ferda Ernawan
The inverse TMT image reconstruction from its moments is given as follows:
1
0
1
0
)()(),(~
M
m
N
n
nmnm ykTxkyxf
For m, n = 0, 1, 2, ..., N-1. Where ( , )f x y denotes the reconstructed intensity
distribution and ,M N denote the maximum order of moments being used.
3 Experimental Designs
In this quantitative experiment, 80 images (24-bit RGB with 512×512 pixels) [13]
are chosen to be tested and analyzed in order to develop psychovisual threshold in
image compression. In past project work, psychovisual threshold has been
investigated on 8×8 discrete transform [14-16]. First, the sample RGB image is
converted into YCbCr colour space. An image is divided into the 256×256 block
of image pixels. Each block of the image pixels is transformed by a
two-dimensional 256×256 TMT. Based on the discrete orthonormal Tchebichef
moments above, a compact representation of the moment coefficient K(S×S) is
given as follows:
0 1 1
0 1 1
0 1 1
0 1 1
(0) (0) (0)
(1) (1) (1)
(2) (2) (2)
( 1) ( 1) ( 1)
S
S
S S S
S
k k k
k k k
K k k k
k S k S k S
The image block matrix by F(256×256) with f (x, y) denotes the intensity value of the
image pixels on each colour component: (0,0) (0,1) (0, 1)
(1,0) (1,1) (1, 1)
(2,0) (2,1) (2, 1)
( 1,0) ( 1,1) ( 1, 1)
S S
f f f S
f f f S
F f f f S
f S f S f S S
The matrix T(S×S) of moments is defined using matrix size S=256 above as follows:
(256 256) (256 256) (256 256) (256 256)
TT K F K
This process is repeated for every block in the original image to generate TMT
frequency coefficient. The inverse moment relation of the reconstructed block
image from the above moments is given as follows:
(256 256) (256 256) (256 256) (256 256)
TG K T K
where G(256×256) denotes the matrix image of the reconstructed intensity value. In
this quantitative experiment, the contribution of each 256×256 TMT coefficient is
investigated by incrementing it on each frequency order. The effect of
incrementing TMT coefficient is measured by the reconstruction error per pixel.
Psychovisual threshold on large Tchebichef moment 6955
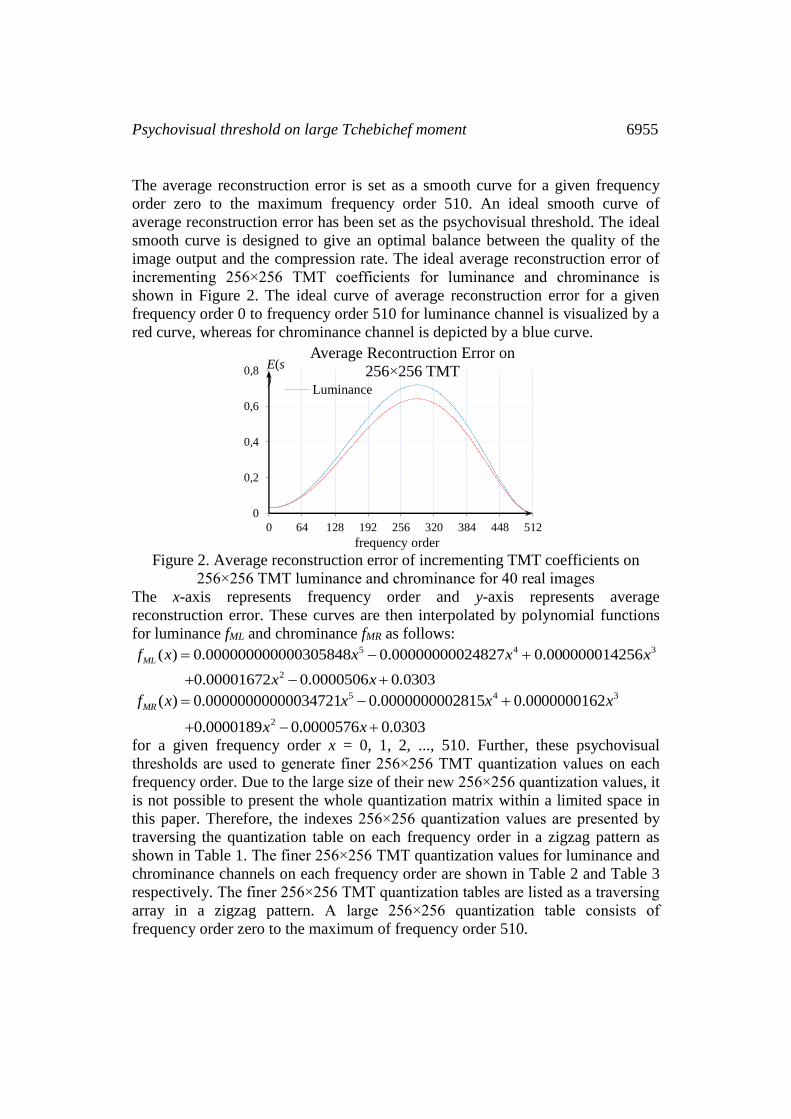
The average reconstruction error is set as a smooth curve for a given frequency
order zero to the maximum frequency order 510. An ideal smooth curve of
average reconstruction error has been set as the psychovisual threshold. The ideal
smooth curve is designed to give an optimal balance between the quality of the
image output and the compression rate. The ideal average reconstruction error of
incrementing 256×256 TMT coefficients for luminance and chrominance is
shown in Figure 2. The ideal curve of average reconstruction error for a given
frequency order 0 to frequency order 510 for luminance channel is visualized by a
red curve, whereas for chrominance channel is depicted by a blue curve.
Figure 2. Average reconstruction error of incrementing TMT coefficients on
256×256 TMT luminance and chrominance for 40 real images
The x-axis represents frequency order and y-axis represents average
reconstruction error. These curves are then interpolated by polynomial functions
for luminance fML and chrominance fMR as follows: 5 4 3
2
0.000000000000305848 0.00000000024827 0.000000014256
0.00001672 0.0000506 0.03
(
03
)ML x x x
x
f
x
x
5 4 3
2
( ) 0.00000000000034721 0.0000000002815 0.0000000162
0.0000189 0.0000576 0.0303
MRf x x x x
x x
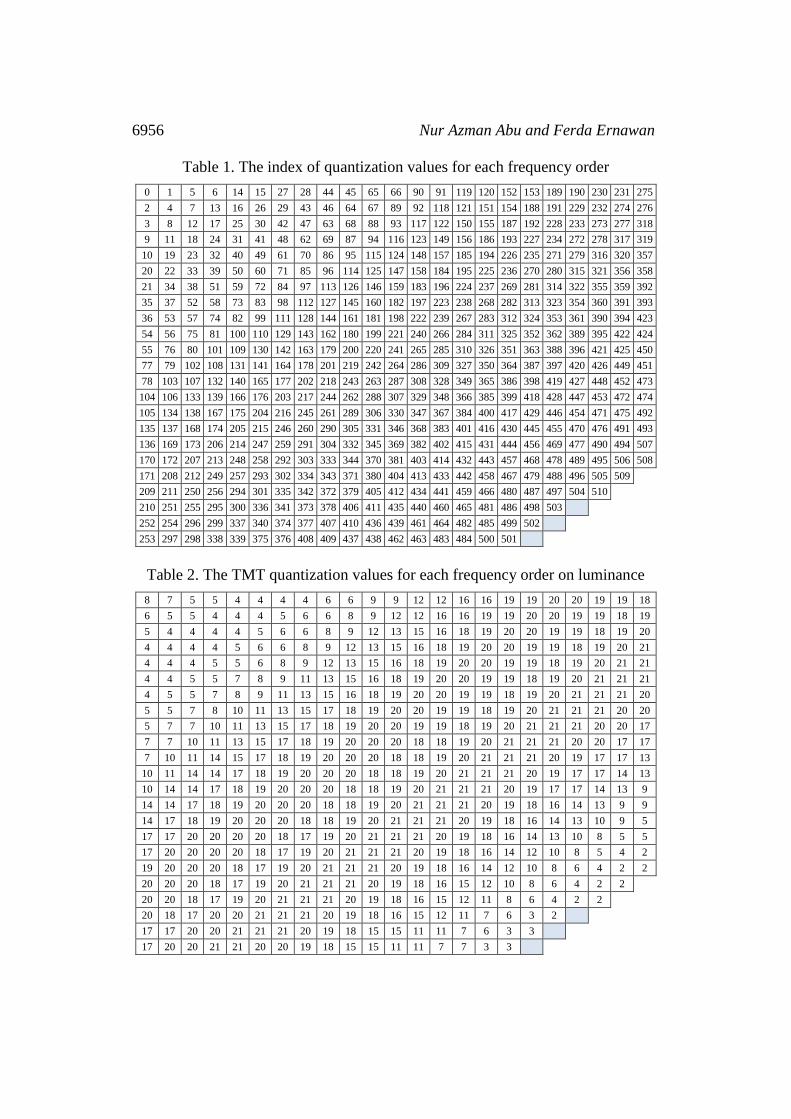
for a given frequency order x = 0, 1, 2, ..., 510. Further, these psychovisual
thresholds are used to generate finer 256×256 TMT quantization values on each
frequency order. Due to the large size of their new 256×256 quantization values, it
is not possible to present the whole quantization matrix within a limited space in
this paper. Therefore, the indexes 256×256 quantization values are presented by
traversing the quantization table on each frequency order in a zigzag pattern as
shown in Table 1. The finer 256×256 TMT quantization values for luminance and
chrominance channels on each frequency order are shown in Table 2 and Table 3
respectively. The finer 256×256 TMT quantization tables are listed as a traversing
array in a zigzag pattern. A large 256×256 quantization table consists of
frequency order zero to the maximum of frequency order 510.
0
0,2
0,4
0,6
0,8
0 64 128 192 256 320 384 448 512
Average Recontruction Error on
256×256 TMTLuminance
frequency order
s
E(s
)
6956 Nur Azman Abu and Ferda Ernawan
Table 1. The index of quantization values for each frequency order
0 1 5 6 14 15 27 28 44 45 65 66 90 91 119 120 152 153 189 190 230 231 275
2 4 7 13 16 26 29 43 46 64 67 89 92 118 121 151 154 188 191 229 232 274 276
3 8 12 17 25 30 42 47 63 68 88 93 117 122 150 155 187 192 228 233 273 277 318
9 11 18 24 31 41 48 62 69 87 94 116 123 149 156 186 193 227 234 272 278 317 319
10 19 23 32 40 49 61 70 86 95 115 124 148 157 185 194 226 235 271 279 316 320 357
20 22 33 39 50 60 71 85 96 114 125 147 158 184 195 225 236 270 280 315 321 356 358
21 34 38 51 59 72 84 97 113 126 146 159 183 196 224 237 269 281 314 322 355 359 392
35 37 52 58 73 83 98 112 127 145 160 182 197 223 238 268 282 313 323 354 360 391 393
36 53 57 74 82 99 111 128 144 161 181 198 222 239 267 283 312 324 353 361 390 394 423
54 56 75 81 100 110 129 143 162 180 199 221 240 266 284 311 325 352 362 389 395 422 424
55 76 80 101 109 130 142 163 179 200 220 241 265 285 310 326 351 363 388 396 421 425 450
77 79 102 108 131 141 164 178 201 219 242 264 286 309 327 350 364 387 397 420 426 449 451
78 103 107 132 140 165 177 202 218 243 263 287 308 328 349 365 386 398 419 427 448 452 473
104 106 133 139 166 176 203 217 244 262 288 307 329 348 366 385 399 418 428 447 453 472 474
105 134 138 167 175 204 216 245 261 289 306 330 347 367 384 400 417 429 446 454 471 475 492
135 137 168 174 205 215 246 260 290 305 331 346 368 383 401 416 430 445 455 470 476 491 493
136 169 173 206 214 247 259 291 304 332 345 369 382 402 415 431 444 456 469 477 490 494 507
170 172 207 213 248 258 292 303 333 344 370 381 403 414 432 443 457 468 478 489 495 506 508
171 208 212 249 257 293 302 334 343 371 380 404 413 433 442 458 467 479 488 496 505 509
209 211 250 256 294 301 335 342 372 379 405 412 434 441 459 466 480 487 497 504 510
210 251 255 295 300 336 341 373 378 406 411 435 440 460 465 481 486 498 503
252 254 296 299 337 340 374 377 407 410 436 439 461 464 482 485 499 502
253 297 298 338 339 375 376 408 409 437 438 462 463 483 484 500 501
Table 2. The TMT quantization values for each frequency order on luminance
8 7 5 5 4 4 4 4 6 6 9 9 12 12 16 16 19 19 20 20 19 19 18
6 5 5 4 4 4 5 6 6 8 9 12 12 16 16 19 19 20 20 19 19 18 19
5 4 4 4 4 5 6 6 8 9 12 13 15 16 18 19 20 20 19 19 18 19 20
4 4 4 4 5 6 6 8 9 12 13 15 16 18 19 20 20 19 19 18 19 20 21
4 4 4 5 5 6 8 9 12 13 15 16 18 19 20 20 19 19 18 19 20 21 21
4 4 5 5 7 8 9 11 13 15 16 18 19 20 20 19 19 18 19 20 21 21 21
4 5 5 7 8 9 11 13 15 16 18 19 20 20 19 19 18 19 20 21 21 21 20
5 5 7 8 10 11 13 15 17 18 19 20 20 19 19 18 19 20 21 21 21 20 20
5 7 7 10 11 13 15 17 18 19 20 20 19 19 18 19 20 21 21 21 20 20 17
7 7 10 11 13 15 17 18 19 20 20 20 18 18 19 20 21 21 21 20 20 17 17
7 10 11 14 15 17 18 19 20 20 20 18 18 19 20 21 21 21 20 19 17 17 13
10 11 14 14 17 18 19 20 20 20 18 18 19 20 21 21 21 20 19 17 17 14 13
10 14 14 17 18 19 20 20 20 18 18 19 20 21 21 21 20 19 17 17 14 13 9
14 14 17 18 19 20 20 20 18 18 19 20 21 21 21 20 19 18 16 14 13 9 9
14 17 18 19 20 20 20 18 18 19 20 21 21 21 20 19 18 16 14 13 10 9 5
17 17 20 20 20 20 18 17 19 20 21 21 21 20 19 18 16 14 13 10 8 5 5
17 20 20 20 20 18 17 19 20 21 21 21 20 19 18 16 14 12 10 8 5 4 2
19 20 20 20 18 17 19 20 21 21 21 20 19 18 16 14 12 10 8 6 4 2 2
20 20 20 18 17 19 20 21 21 21 20 19 18 16 15 12 10 8 6 4 2 2
20 20 18 17 19 20 21 21 21 20 19 18 16 15 12 11 8 6 4 2 2
20 18 17 20 20 21 21 21 20 19 18 16 15 12 11 7 6 3 2
17 17 20 20 21 21 21 20 19 18 15 15 11 11 7 6 3 3
17 20 20 21 21 20 20 19 18 15 15 11 11 7 7 3 3
Psychovisual threshold on large Tchebichef moment 6957
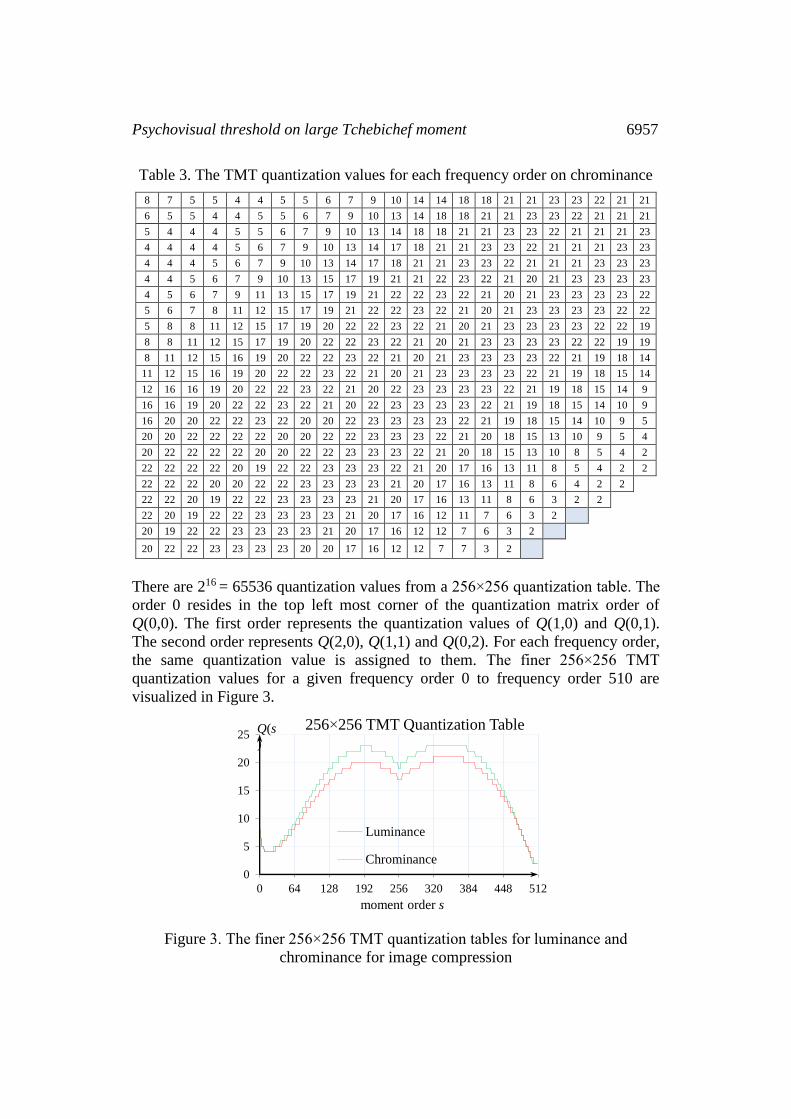
Table 3. The TMT quantization values for each frequency order on chrominance
8 7 5 5 4 4 5 5 6 7 9 10 14 14 18 18 21 21 23 23 22 21 21
6 5 5 4 4 5 5 6 7 9 10 13 14 18 18 21 21 23 23 22 21 21 21
5 4 4 4 5 5 6 7 9 10 13 14 18 18 21 21 23 23 22 21 21 21 23
4 4 4 4 5 6 7 9 10 13 14 17 18 21 21 23 23 22 21 21 21 23 23
4 4 4 5 6 7 9 10 13 14 17 18 21 21 23 23 22 21 21 21 23 23 23
4 4 5 6 7 9 10 13 15 17 19 21 21 22 23 22 21 20 21 23 23 23 23
4 5 6 7 9 11 13 15 17 19 21 22 22 23 22 21 20 21 23 23 23 23 22
5 6 7 8 11 12 15 17 19 21 22 22 23 22 21 20 21 23 23 23 23 22 22
5 8 8 11 12 15 17 19 20 22 22 23 22 21 20 21 23 23 23 23 22 22 19
8 8 11 12 15 17 19 20 22 22 23 22 21 20 21 23 23 23 23 22 22 19 19
8 11 12 15 16 19 20 22 22 23 22 21 20 21 23 23 23 23 22 21 19 18 14
11 12 15 16 19 20 22 22 23 22 21 20 21 23 23 23 23 22 21 19 18 15 14
12 16 16 19 20 22 22 23 22 21 20 22 23 23 23 23 22 21 19 18 15 14 9
16 16 19 20 22 22 23 22 21 20 22 23 23 23 23 22 21 19 18 15 14 10 9
16 20 20 22 22 23 22 20 20 22 23 23 23 23 22 21 19 18 15 14 10 9 5
20 20 22 22 22 22 20 20 22 22 23 23 23 22 21 20 18 15 13 10 9 5 4
20 22 22 22 22 20 20 22 22 23 23 23 22 21 20 18 15 13 10 8 5 4 2
22 22 22 22 20 19 22 22 23 23 23 22 21 20 17 16 13 11 8 5 4 2 2
22 22 22 20 20 22 22 23 23 23 23 21 20 17 16 13 11 8 6 4 2 2
22 22 20 19 22 22 23 23 23 23 21 20 17 16 13 11 8 6 3 2 2
22 20 19 22 22 23 23 23 23 21 20 17 16 12 11 7 6 3 2
20 19 22 22 23 23 23 23 21 20 17 16 12 12 7 6 3 2
20 22 22 23 23 23 23 20 20 17 16 12 12 7 7 3 2
There are 216 = 65536 quantization values from a 256×256 quantization table. The
order 0 resides in the top left most corner of the quantization matrix order of
Q(0,0). The first order represents the quantization values of Q(1,0) and Q(0,1).
The second order represents Q(2,0), Q(1,1) and Q(0,2). For each frequency order,
the same quantization value is assigned to them. The finer 256×256 TMT
quantization values for a given frequency order 0 to frequency order 510 are
visualized in Figure 3.
Figure 3. The finer 256×256 TMT quantization tables for luminance and
chrominance for image compression
0
5
10
15
20
25
0 64 128 192 256 320 384 448 512
256×256 TMT Quantization Table
Luminance
Chrominance
moment order s
Q(s
)
6958 Nur Azman Abu and Ferda Ernawan
The smoother 256×256 TMT quantization table on the luminance channel is
designed to take smaller values than chrominance channel. The investigation
results show the contribution of the TMT coefficients to the reconstruction error is
mainly concentrated on the middle frequency order. The effect of incrementing
TMT coefficients on the middle frequency order gives a significant reconstruction
error. According to Figure 3, there are two hills in the 256×256 TMT quantization
tables. The impact of incrementing TMT coefficients on the middle frequency
order produces a higher average reconstruction error than other frequency orders.
In addition, the contribution of the TMT coefficients on the middle frequency
order provides less effect to the compression rate. Therefore, the finer 256×256
TMT quantization tables from the psychovisual threshold on the middle frequency
order are designed to generate lower quantization values.
4 Experimental Results
The smoother 256×256 TMT quantization tables from the psychovisual threshold
are tested in image compression. The 80 images are evaluated in image
compression. The 80 images are classified into 40 real images and 40 graphical
images.
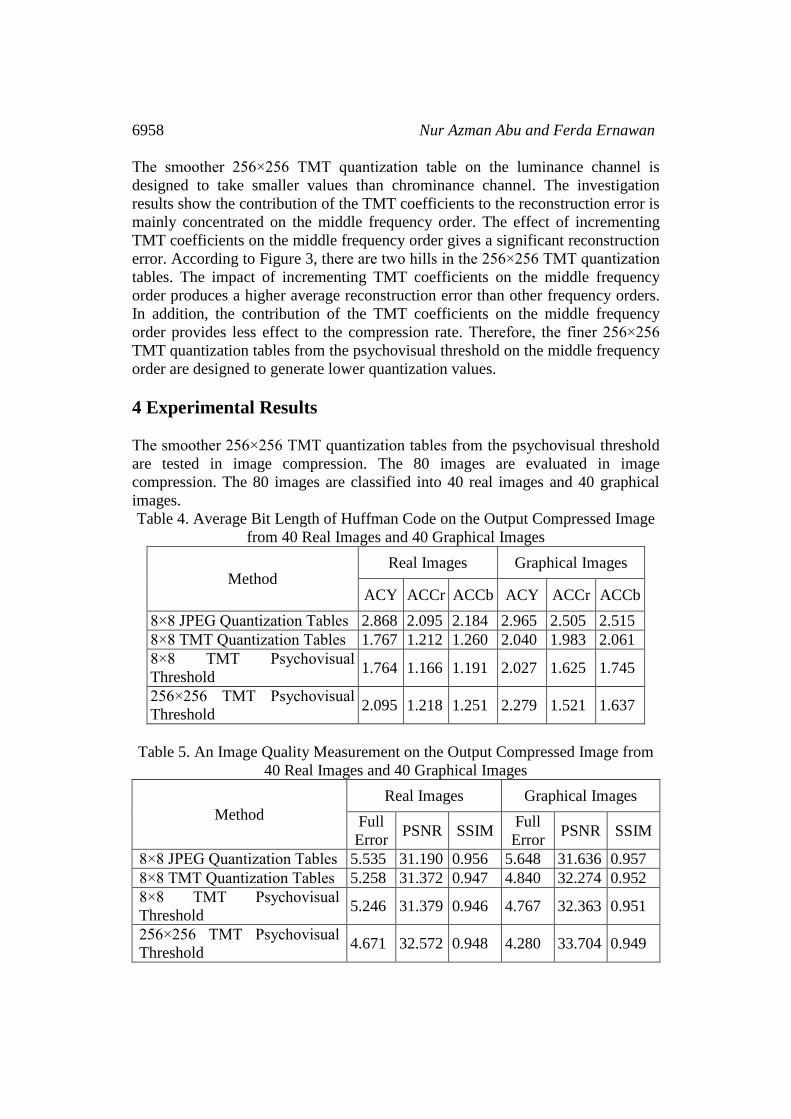
Table 4. Average Bit Length of Huffman Code on the Output Compressed Image
from 40 Real Images and 40 Graphical Images
Method Real Images Graphical Images
ACY ACCr ACCb ACY ACCr ACCb
8×8 JPEG Quantization Tables 2.868 2.095 2.184 2.965 2.505 2.515
8×8 TMT Quantization Tables 1.767 1.212 1.260 2.040 1.983 2.061
8×8 TMT Psychovisual
Threshold 1.764 1.166 1.191 2.027 1.625 1.745
256×256 TMT Psychovisual
Threshold 2.095 1.218 1.251 2.279 1.521 1.637
Table 5. An Image Quality Measurement on the Output Compressed Image from
40 Real Images and 40 Graphical Images
Method
Real Images Graphical Images
Full
Error PSNR SSIM
Full
Error PSNR SSIM
8×8 JPEG Quantization Tables 5.535 31.190 0.956 5.648 31.636 0.957
8×8 TMT Quantization Tables 5.258 31.372 0.947 4.840 32.274 0.952
8×8 TMT Psychovisual
Threshold 5.246 31.379 0.946 4.767 32.363 0.951
256×256 TMT Psychovisual
Threshold 4.671 32.572 0.948 4.280 33.704 0.949
Psychovisual threshold on large Tchebichef moment 6959
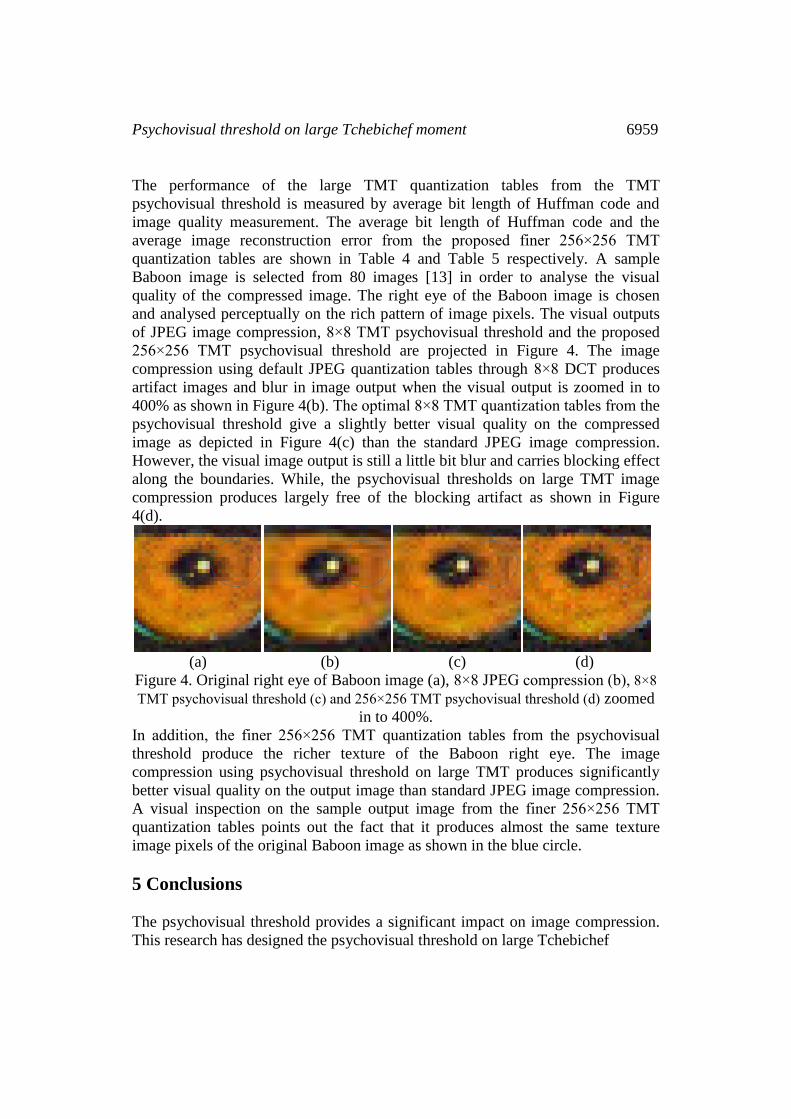
The performance of the large TMT quantization tables from the TMT
psychovisual threshold is measured by average bit length of Huffman code and
image quality measurement. The average bit length of Huffman code and the
average image reconstruction error from the proposed finer 256×256 TMT
quantization tables are shown in Table 4 and Table 5 respectively. A sample
Baboon image is selected from 80 images [13] in order to analyse the visual
quality of the compressed image. The right eye of the Baboon image is chosen
and analysed perceptually on the rich pattern of image pixels. The visual outputs
of JPEG image compression, 8×8 TMT psychovisual threshold and the proposed
256×256 TMT psychovisual threshold are projected in Figure 4. The image
compression using default JPEG quantization tables through 8×8 DCT produces
artifact images and blur in image output when the visual output is zoomed in to
400% as shown in Figure 4(b). The optimal 8×8 TMT quantization tables from the
psychovisual threshold give a slightly better visual quality on the compressed
image as depicted in Figure 4(c) than the standard JPEG image compression.
However, the visual image output is still a little bit blur and carries blocking effect
along the boundaries. While, the psychovisual thresholds on large TMT image
compression produces largely free of the blocking artifact as shown in Figure
4(d).
(a) (b) (c) (d)
Figure 4. Original right eye of Baboon image (a), 8×8 JPEG compression (b), 8×8
TMT psychovisual threshold (c) and 256×256 TMT psychovisual threshold (d) zoomed
in to 400%.
In addition, the finer 256×256 TMT quantization tables from the psychovisual
threshold produce the richer texture of the Baboon right eye. The image
compression using psychovisual threshold on large TMT produces significantly
better visual quality on the output image than standard JPEG image compression.
A visual inspection on the sample output image from the finer 256×256 TMT
quantization tables points out the fact that it produces almost the same texture
image pixels of the original Baboon image as shown in the blue circle.
5 Conclusions
The psychovisual threshold provides a significant impact on image compression.
This research has designed the psychovisual threshold on large Tchebichef
6960 Nur Azman Abu and Ferda Ernawan
moments for image compression. The psychovisual threshold is practically the
best measure on an optimal amount of frequency image signals to be lossy
encoded. This quantitative experiment shows the critical role of psychovisual
threshold as a basic primitive to generate quantization table in image compression.
The finer large Tchebichef quantization tables can then be generated from the
psychovisual threshold. The psychovisual threshold on large Tchebichef moment
has made significant improvement in the Tchebichef image compression
performance. The smoother large Tchebichef quantization tables from the
psychovisual threshold produce better visual quality of the output image and
smaller average bit length of Huffman code than standard JPEG image
compression. At the same time, the psychovisual threshold on large Tchebichef
moments manages to overcome the blocking effect which often occurs in standard
JPEG image compression. This psychovisual threshold is designed to support
practical image compression for high fidelity digital images in the near future.
Acknowledgements. The authors would like to express a very special thanks to
Ministry of Education, Malaysia for providing financial support by Fundamental
Research Grant Scheme (FRGS/2012/FTMK/SG05/03/1/F00141).
References
[1] S. Lee and S.J. Park, A new image quality assessment method to detect and
measure strength of blocking artifacts, Signal Processing: Image
Communication, 27 (1) (2012), 031-038.
[2] J. Singh, S. Singh, D. Singh and M. Uddin, Detection method and filters for
blocking effect reduction of highly compressed images, Signal Processing:
Image Communication, 26 (8) (2011), 493-506.
[3] J. Singh, S. Singh, D. Singh and M. Uddin, A signal adaptive filter for
blocking effect reduction of JPEG compressed images, International Journal
of Electronics and Communications, 65 (10) (2011), 827– 839.
[4] F. Ernawan, N.A. Abu and N. Suryana, An optimal Tchebichef moment
quantization using psychovisual threshold for image compression, Advanced
Science Letters, 20 (1) (2014), 070-074.
[5] N.A. Abu, F. Ernawan, N. Suryana and S. Sahib, Image watermarking using
psychovisual threshold over the edge, Information and Communication
Technology, 7804 (2013), 519-527.
[6] F. Ernawan, N.A. Abu and N. Suryana, TMT quantization table generation
based on psychovisual threshold for image compression, International
Conference of Information and Communication Technology (ICoICT 2013),
(2013), 202-207.
Psychovisual threshold on large Tchebichef moment 6961
[7] N.A. Abu, F. Ernawan and S. Sahib, Psychovisual model on discrete
orthonormal transform, International Conference on Mathematical Sciences
and Statistics (ICMSS 2013), (2013), 309-314.
[8] F. Ernawan, N.A. Abu and N. Suryana, A psychovisual threshold for
generating quantization process in Tchebichef moment image compression,
Journal of Computers, 9 (3) (2014), 702-710.
[9] F. Ernawan, N.A. Abu and N. Suryana, Adaptive Tchebichef moment
transform image compression using psychovisual model, Journal of Computer
Science, 9 (6) (2013), 716-725.
[10] F. Ernawan, E. Noersasongko and N.A. Abu, An efficient 2×2 Tchebichef
moments for mobile image compression, International Symposium on
Intelligent Signal Processing and Communication System (ISPACS 2011),
(2011), 001-005.
[11] N.A. Abu, F. Ernawan and N. Suryana, An image dithering via Tchebichef
moment transform, Journal of Computer Science, 9 (7) (2013), 811-820.
[12] R. Mukundan, Some computational aspects of discrete orthonormal moments,
IEEE Transactions on Image Processing, 13 (8) (2004), 1055-1059.
[13] R. Rodriguez-Sanchez, J. Martinez-Baena, A. Garrido, J.A. Garcia, J.
Fdez-Valdivia, M.C. Aranda, Computer Vision Group, University of Granada,
[Online], (2002), Available: http://decsai.ugr.es/cvg/dbimagenes/c512.php. [14] N.A. Abu, F. Ernawan and N. Suryana, A generic psychovisual error
threshold for the quantization table generation on JPEG image compression,
9th International Colloquium on Signal Processing and its Applications,
(2013), 039-043.
[15] F. Ernawan, N.A. Abu and N. Suryana, An adaptive JPEG image
compression using psychovisual model, Advanced Science Letters, 20 (1)
(2014), 026-031.
[16] F. Ernawan, N.A. Abu and N. Suryana, Integrating a smooth psychovisual
threshold into an adaptive JPEG image compression, Journal of Computers, 9
(3) (2014), 644-653.
Received: August 11, 2014


