Phytoplankton Cell Lysis Associated withPolyunsaturated Aldehyde Release in the NorthernAdriatic SeaFrancois Ribalet1¤, Mauro Bastianini2, Charles Vidoudez3, Francesco Acri2, John Berges4,
Adrianna Ianora1, Antonio Miralto1, Georg Pohnert3, Giovanna Romano1, Thomas Wichard3,
Raffaella Casotti1*
1 Stazione Zoologica Anton Dohrn di Napoli, Napoli, Italy, 2 ISMAR CNR Istituto Scienze Marine, Venezia, Italy, 3 Friedrich Schiller University Jena, Institute for Inorganic
and Analytical Chemistry, Jena School for Microbial Communication, Jena, Germany, 4 Department of Biological Sciences and School of Freshwater Sciences, University of
Wisconsin-Milwaukee, Milwaukee, Wisconsin, United States of America
Abstract
Diatoms are able to react to biotic and abiotic stress, such as competition, predation and unfavorable growth conditions, byproducing bioactive compounds including polyunsaturated aldehydes (PUAs). PUAs have been shown to act against grazersand either enhance or inhibit the growth of different phytoplankton and bacteria both in culture and in the field. Presenceof nanomolar concentrations of dissolved PUAs in seawater has been reported in the North Adriatic Sea (Mediterranean),suggesting that these compounds are released in seawater following diatom cell lysis. However, the origin of the PUAs andtheir effects on natural phytoplankton assemblages remain unclear. Here we present data from four oceanographic cruisesthat took place during diatom blooms in the northern Adriatic Sea where concentrations of particulate and dissolved PUAswere monitored along with phytoplankton cell lysis. Cell lysis was positively correlated with both concentrations ofparticulate and dissolved PUAs (R = 0.69 and R = 0.77, respectively), supporting the hypothesis that these compounds arereleased by cell lysis. However, the highest concentration of dissolved PUAs (2.53 nM) was measured when cell lysis washigh (0.24 d21) but no known PUA-producing diatoms were detected, suggesting either that other organisms can producePUAs or that PUA-producing enzymes retain activity extracellularly after diatom cells have lysed. Although in situconcentrations of dissolved PUAs were one to three orders of magnitude lower than those typically used in laboratoryculture experiments, we argue that concentrations produced in the field could induce similar effects to those observed inculture and therefore may help shape plankton community composition and function in the oceans.
Citation: Ribalet F, Bastianini M, Vidoudez C, Acri F, Berges J, et al. (2014) Phytoplankton Cell Lysis Associated with Polyunsaturated Aldehyde Release in theNorthern Adriatic Sea. PLoS ONE 9(1): e85947. doi:10.1371/journal.pone.0085947
Editor: Tilmann Harder, University of New South Wales, Australia
Received September 9, 2013; Accepted December 4, 2013; Published January 31, 2014
Copyright: � 2014 Ribalet et al. This is an open-access article distributed under the terms of the Creative Commons Attribution License, which permitsunrestricted use, distribution, and reproduction in any medium, provided the original author and source are credited.
Funding: The project was funded by INTERREG – GRANT EU INTERREG III Italy-Slovenian Project. Biological Oceanography of the Northern Adriatic (OBAS 2003-2006), the Volkswagen Foundation, the Swiss National Fonds and the VECTOR Project. This work was also part of the PhD project of FR funded by the StazioneZoologica Anton Dohrn (SZN) under the Associate Research Center PhD Program of The Open University, Milton Keynes, UK. The funders had no role in studydesign, data collection and analysis, decision to publish, or preparation of the manuscript.
Competing Interests: Co-author Adrianna Ianora is a PLOS ONE Editorial Board member. This does not alter the authors9 adherence to all the PLOS ONE policieson sharing data and materials.
* E-mail: [email protected]
¤ Current address: School of Oceanography, University of Washington, Seattl Washington, United States of America
Introduction
Diatoms are ubiquitous organisms, responsible for about one
fifth of the photosynthesis on Earth [1]. They have developed
sophisticated regulatory mechanisms to perceive changes in
environmental conditions and respond accordingly [2]. Some of
these mechanisms rely upon the production of bioactive molecules,
the most well-known being the polyunsaturated fatty acid
derivatives, called oxylipins [3–5].
In higher plants, oxylipins play an important role in acclimation
to environmental stresses due to wounding, grazing by predators
or competition for limiting nutrients [6] and can trigger several
physiological responses, ranging from inducing cell division to cell
lysis depending on the levels of oxylipins produced [7]. Similar to
plants [8], diatom oxylipins such as polyunsaturated aldehydes
(PUAs) are associated with a chemical defense system that impairs
the reproductive success of copepods and other invertebrates [3,5],
inhibits the growth of cultured phytoplankton [9,10] and affects
growth in bacteria communities both in culture [11,12] and in the
field [13].
Diatoms produce PUAs in at least three steps. First, chloroplast-
membrane-localized glycolipids and plasma-membrane-localized
phospholipids are hydrolyzed to generate free polyunsaturated
fatty acids (PUFAs) [14,15]. Then, the free PUFAs are acted on by
lipoxygenases that generate hydroxyperoxy fatty acids. Finally,
hydropeoxy fatty acids are transformed into PUAs [16,17]. In
contrast to plants, diatom-derived PUAs are almost never found in
intact cells but are synthesized mainly after membrane disruption
[18]. PUA production takes place as long as enzymes are in
contact with precursor free fatty acids and is not inhibited by the
amount of PUAs produced [19].
PLOS ONE | www.plosone.org 1 January 2014 | Volume 9 | Issue 1 | e85947
e,
Diatom PUAs appear to be part of a nitric-oxide-based stress
surveillance system that mediates intracellular communication
involved in regulating stress response to unfavorable environmen-
tal conditions [4]. PUA production and release in the water
remains low under optimal growth conditions, but increases as
conditions become poorer, e.g., nutrients become limiting [20,21].
Such a surveillance mechanism depends upon the amount of PUA
produced. High PUA exposure triggers cell lysis in exponentially-
growing diatoms while lower exposures induce resistance, leading
to decreasing effects in successive exposures [4]. In contrast, PUAs
can accelerate cell lysis in diatoms in the late stationary phase of
growth, even if they have been exposed to PUAs previously [22].
In nature, this surveillance mechanism would confer an advantage
to PUA-producing diatoms at the peak of the bloom, when
nutrient conditions progressively become limiting, by inhibiting
the growth of competitors. Later on, when resources become
depleted and cells begin to lyse, large PUAs releases could induce a
synchronized cell lysis, leading to the sharp declines of diatoms
commonly observed in nature [23].
The relevance of culture experiments has been questioned
because PUA concentrations are typically orders of magnitude
higher than those predicted in the field [24]. However, Dittami et
al. [25] have shown that repeated application of low doses (20 nM)
of octadienal caused cell lysis of a non PUA-producing Thalassiosira
rotula strain (CCMP 1018), a concentration that is in the same
range as that reported by Vidoudez et al. [26] in surface water
during blooms of the diatom Skeletonema marinoi in the northern
Adriatic Sea (Mediterranean). At present our understanding of the
dynamics of PUA releases and effects on natural phytoplankton
assemblages is very poor.
Here we present data from an extended field survey of PUAs in
the northern Adriatic Sea (Mediterranean) that was carried out
during March 2002, 2004, 2005 and 2006. We measured
phytoplankton cell lysis along with the concentrations of PUAs
produced after chemical or mechanical disruption of the cells
(hereafter termed ‘‘particulate PUAs’’) as well as dissolved PUAs
present in seawater. Our results show that cell lysis is positively
correlated with particulate and dissolved concentrations of PUAs,
supporting the hypothesis that these compounds are released in
seawater following cell lysis.
Methods
Four oceanographic cruises were conducted in the North
Adriatic Sea in March 2002, 2004, 2005 and 2006 aboard the RV
Urania and RV Dallaporta. Samples were taken at the surface using 5
or 10-L Niskin bottles from stations located along three transects
(Fig. 1). Only transect 2, located at the Po river mouth, was
sampled in March 2002. In March 2005 and 2006, two coastal
stations were sampled every 3 h for 27h in order to investigate the
dynamics of PUA production and cell lysis over a diel cycle.
Permission to operate at the sampling stations was given by the
Harbour Master Stations (Capitanerie di Porto) of Venice and
Ravenna, Italy. The work did not involve any endangered or
protected biological species.
Oceanographic dataDissolved inorganic nutrients (phosphate, silicic acid, nitrite and
nitrate) were analyzed by colorimetry with an autoanalyzer
(Systea-Alliance) according to Grasshoff et al. (1999)[27]. Because
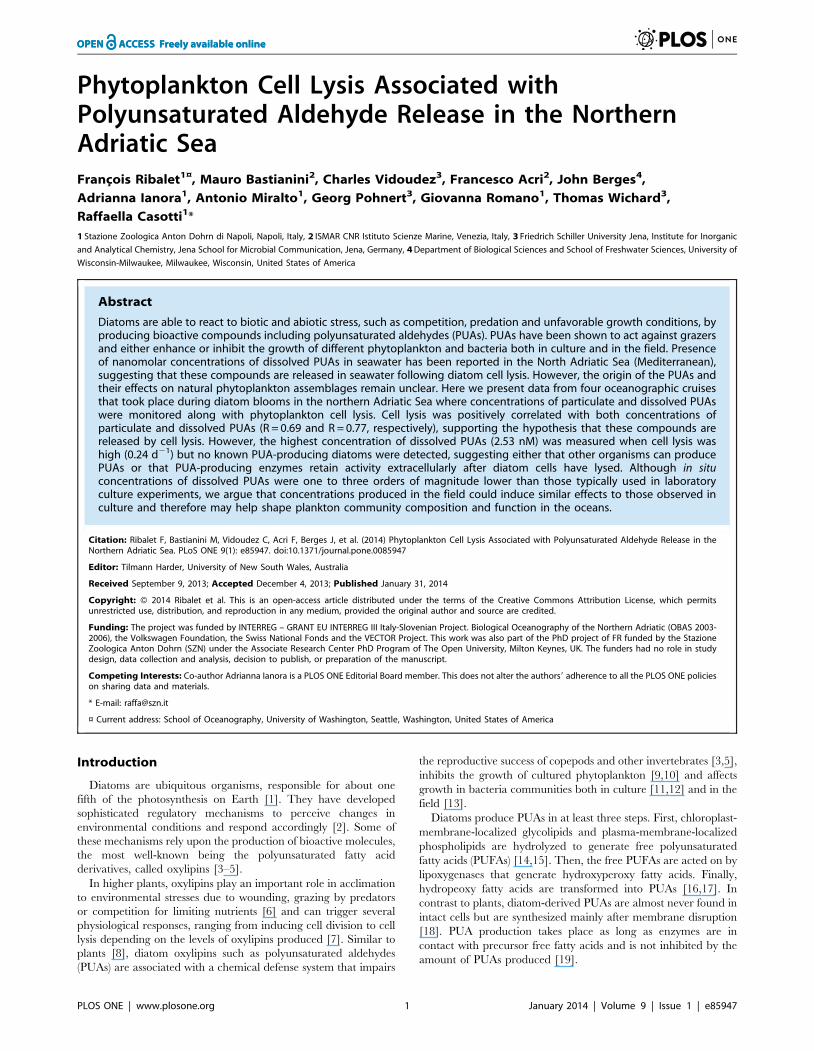
Figure 1. Chlorophyll a distribution and station location in the North Adriatic Sea. Chlorophyll a (mg L21) was determined from SeaWifsdatasets (http://gdata1.sci.gsfc.nasa.gov/). Sampling stations are indicaed with black crossses along three transects, transect 1 (north), transect 2 andtransect 3 (south). Transect were sampled in March a) 2002, b) 2004, c) 2005 and d) 2006.doi:10.1371/journal.pone.0085947.g001
Phytoplankton Lysis and PUAs
PLOS ONE | www.plosone.org 2 January 2014 | Volume 9 | Issue 1 | e85947
nitrite concentrations were always very low (,0.3 mM), dissolved
inorganic nitrogen (DIN) concentrations were expressed as the
sum of the nitrite and nitrate. Samples for particulate C and N
(POC and PON, respectively) were filtered on acidified pre-
combusted (450uC, 24 h) GF/F filters and stored at 280uC until
analysis with a CHN elemental analyzer (Perkin Elmer 2400).
Phytoplankton cell numbers and species composition were
determined on fixed samples (buffered formaldehyde 2%) after
concentration by sedimentation [28], using an inverted micro-
scope (Zeiss Axiovert 35). Samples for chlorophyll a analysis were
obtained by gentle filtration (,100 mm Hg) onto GF/F filters and
storage at 280uC until further analysis. The filters were ground in
100% methanol and the extract injected into a Beckman System
Gold HPLC. Monthly averages of satellite-determined chlorophyll
a distribution were obtained from SeaWIFS data (http://gdata1.
sci.gsfc.nasa.gov/).
Measurements of cell lysisPhytoplankton lysis rates were estimated following an improved
version [29] of the esterase method [30]. The method is based on
the assumption that esterases are strictly intracellular enzymes that
are released only by cell lysis; esterase activity is measured as
increased fluorescence due to cleavage of fluorescein diacetate
(FDA). Dissolved esterase activity (DEA) was measured in 0.22 mm
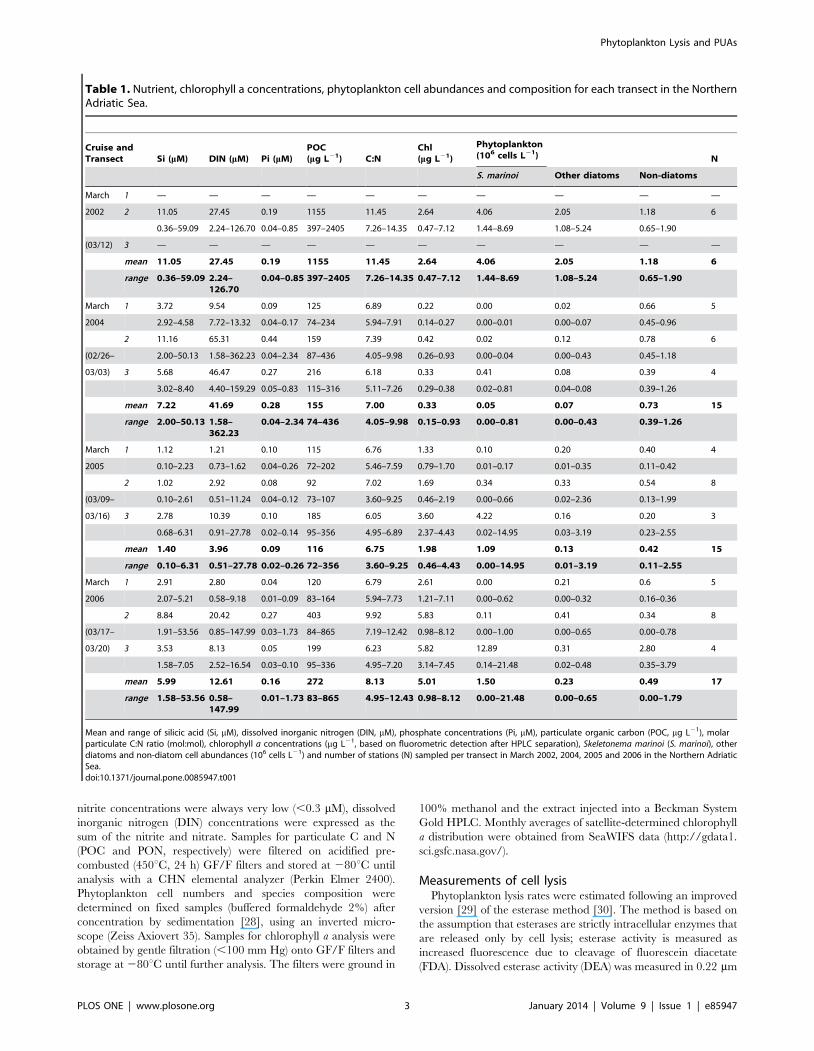
Table 1. Nutrient, chlorophyll a concentrations, phytoplankton cell abundances and composition for each transect in the NorthernAdriatic Sea.
Cruise andTransect Si (mM) DIN (mM) Pi (mM)
POC(mg L21) C:N
Chl(mg L21)
Phytoplankton(106 cells L21) N
S. marinoi Other diatoms Non-diatoms
March 1 — — — — — — — — — —
2002 2 11.05 27.45 0.19 1155 11.45 2.64 4.06 2.05 1.18 6
0.36–59.09 2.24–126.70 0.04–0.85 397–2405 7.26–14.35 0.47–7.12 1.44–8.69 1.08–5.24 0.65–1.90
(03/12) 3 — — — — — — — — — —
mean 11.05 27.45 0.19 1155 11.45 2.64 4.06 2.05 1.18 6
range 0.36–59.09 2.24–126.70
0.04–0.85 397–2405 7.26–14.35 0.47–7.12 1.44–8.69 1.08–5.24 0.65–1.90
March 1 3.72 9.54 0.09 125 6.89 0.22 0.00 0.02 0.66 5
2004 2.92–4.58 7.72–13.32 0.04–0.17 74–234 5.94–7.91 0.14–0.27 0.00–0.01 0.00–0.07 0.45–0.96
2 11.16 65.31 0.44 159 7.39 0.42 0.02 0.12 0.78 6
(02/26– 2.00–50.13 1.58–362.23 0.04–2.34 87–436 4.05–9.98 0.26–0.93 0.00–0.04 0.00–0.43 0.45–1.18
03/03) 3 5.68 46.47 0.27 216 6.18 0.33 0.41 0.08 0.39 4
3.02–8.40 4.40–159.29 0.05–0.83 115–316 5.11–7.26 0.29–0.38 0.02–0.81 0.04–0.08 0.39–1.26
mean 7.22 41.69 0.28 155 7.00 0.33 0.05 0.07 0.73 15
range 2.00–50.13 1.58–362.23
0.04–2.34 74–436 4.05–9.98 0.15–0.93 0.00–0.81 0.00–0.43 0.39–1.26
March 1 1.12 1.21 0.10 115 6.76 1.33 0.10 0.20 0.40 4
2005 0.10–2.23 0.73–1.62 0.04–0.26 72–202 5.46–7.59 0.79–1.70 0.01–0.17 0.01–0.35 0.11–0.42
2 1.02 2.92 0.08 92 7.02 1.69 0.34 0.33 0.54 8
(03/09– 0.10–2.61 0.51–11.24 0.04–0.12 73–107 3.60–9.25 0.46–2.19 0.00–0.66 0.02–2.36 0.13–1.99
03/16) 3 2.78 10.39 0.10 185 6.05 3.60 4.22 0.16 0.20 3
0.68–6.31 0.91–27.78 0.02–0.14 95–356 4.95–6.89 2.37–4.43 0.02–14.95 0.03–3.19 0.23–2.55
mean 1.40 3.96 0.09 116 6.75 1.98 1.09 0.13 0.42 15
range 0.10–6.31 0.51–27.78 0.02–0.26 72–356 3.60–9.25 0.46–4.43 0.00–14.95 0.01–3.19 0.11–2.55
March 1 2.91 2.80 0.04 120 6.79 2.61 0.00 0.21 0.6 5
2006 2.07–5.21 0.58–9.18 0.01–0.09 83–164 5.94–7.73 1.21–7.11 0.00–0.62 0.00–0.32 0.16–0.36
2 8.84 20.42 0.27 403 9.92 5.83 0.11 0.41 0.34 8
(03/17– 1.91–53.56 0.85–147.99 0.03–1.73 84–865 7.19–12.42 0.98–8.12 0.00–1.00 0.00–0.65 0.00–0.78
03/20) 3 3.53 8.13 0.05 199 6.23 5.82 12.89 0.31 2.80 4
1.58–7.05 2.52–16.54 0.03–0.10 95–336 4.95–7.20 3.14–7.45 0.14–21.48 0.02–0.48 0.35–3.79
mean 5.99 12.61 0.16 272 8.13 5.01 1.50 0.23 0.49 17
range 1.58–53.56 0.58–147.99
0.01–1.73 83–865 4.95–12.43 0.98–8.12 0.00–21.48 0.00–0.65 0.00–1.79
Mean and range of silicic acid (Si, mM), dissolved inorganic nitrogen (DIN, mM), phosphate concentrations (Pi, mM), particulate organic carbon (POC, mg L21), molarparticulate C:N ratio (mol:mol), chlorophyll a concentrations (mg L21, based on fluorometric detection after HPLC separation), Skeletonema marinoi (S. marinoi), otherdiatoms and non-diatom cell abundances (106 cells L21) and number of stations (N) sampled per transect in March 2002, 2004, 2005 and 2006 in the Northern AdriaticSea.doi:10.1371/journal.pone.0085947.t001
Phytoplankton Lysis and PUAs
PLOS ONE | www.plosone.org 3 January 2014 | Volume 9 | Issue 1 | e85947
filtrates (Steriflip-GP filter Unit, Millipore, Milano, IT) and
particulate esterase activity (PEA) was measured on untreated
samples, after correction for non-enzymatic hydrolysis of FDA
(measured after removing all esterases from the sample using a ,
10 kDa centrifuge filter (Amicon Ultra-4 PLGC Ultracel-PL
Membrane, Millipore, IT, Milan). Decay rates of DEA were
measured in each sample at t = 0 (performed no later than 30
minutes after water collection) and after 24 h incubation of the
0.22 mm filtrate in the dark at in-situ temperature (maintained by
thermostat baths). All measurements were performed under
standardized conditions: 0.1 mL of Tris–HCl (pH 8.0; final
concentrations 0.5 mM) with EDTA (final concentrations 0.5 mM)
and 20 ml of FDA (FDA, Sigma-Aldrich Inc., Milano, IT, diluted
in acetone; final concentration 20 mM) were added at time t = 0
into 1.9 mL of sample. The increase in fluorescence of the samples
was recorded (excitation = 490 nm, emission = 520 nm) following
an incubation at 20uC for 60 min using a CaryEclipse (Varian)
fluorometer. Fluorescence was converted into fluorescein concen-
tration using an internal standard (Fluorescein, Sigma-Aldrich
Inc., Milano, IT) that was added (final concentration 5 nM)
immediately to the sample after the measurement at time t = 60
min. Esterase activities were measured in three replicates
(coefficient of variation averaged 5%). The cell lysis rate was
calculated as the decrease in PEA with time due to the production
of DEA during cell lysis (produced on an hourly basis) using the
following equations [29]:
m(d{1)~DEAprod
PEA|24
where DEAprod~DEA
T1=2
|0:5 and T1/2 represents the DEA
turnover time, calculated from the esterase decay rate measured in
each sample.
In situ quantification of PUAsSince PUAs are particularly reactive and volatile, they are
extracted by procedures based on the transformation of PUAs into
more stable products, such as ethyl ester by the Wittig reaction
with carbetoxyethylidene-triphenylphosphorane (CET-TPP)
[31,32], or pentafluorobenzyl-oxime derivative by O-(2,3,4,5,6-
pentafluorobenzyl) hydroxylamine hydrochloride (PFBHA?HCl)
[24]. The quantification of particulate PUA concentration was
performed following the method of d’Ippolito et al. [31] in March
2002 and 2004 and the method of Wichard et al. [24] in March
2005 and 2006. For the d’Ippolito et al. method, cells were
collected by centrifugation (1200g, 10 minutes) and the pellet was
frozen in liquid nitrogen and stored at 280uC until further
Table 2. Phytoplankton species composition and cell abundances for each transect in the Northern Adriatic Sea.
Species Cell abundances (103 cells L21)
March 2002 March 2004 March 2005 March 2006
1 2 3 Total 1 2 3 Total 1 2 3 Total 1 2 3 Total
Bacillariophyceae — 6118 — 6118 27 139 498 115 305 673 4377 1221 208 514 13194 1737
Chaetoceros affinis — — — — 0 0 0 0 46 17 9 25 0 0 147 16
Chaetoceros calcitrans — — — — 10 2 9 7 1 34 0 15 0 0 0 0
Chaetoceros compressus — — — — 0 0 0 0 0 14 6 7 0 392 0 144
Chaetoceros spp. — — — — 2 2 13 3 88 172 84 209 27 0 0 6
Leptocylindrus danicus — — — — 0 0 0 0 30 35 30 32 0 0 0 0
Navicula spp. — — — — 0 7 0 2 3 4 1 3 21 1 0 5
Pseudonitzschiadelicatissima
— — — — 0 0 0 0 1 2 0 1 0 0 98 11
Skeletonema marinoi — 4065 — 4065 3 16 414 47 105 339 4219 1087 1 108 12889 1504
Stephanodiscus spp. — — — — 0 0 0 0 0 0 0 0 125 0 0 28
Thalassiosira spp. — — — — 0 3 17 3 2 28 4 14 0 0 0 0
Unidentified — — — — 3 51 26 24 0 0 2 1 0 0 0 0
Dinophyceae — 39 — 39 20 13 20 17 16 15 9 14 1 20 50 19
Alexandrium minutum — — — — 0 0 0 0 0 0 0 0 0 0 49 5
Prorocentrum minimum — — — — 3 3 0 3 2 2 2 2 0 19 0 13
Unidentified — — — — 10 8 9 10 8 7 5 7 0 0 0 0
Prymnesiophyceae — 14 — 14 158 125 35 157 26 15 13 19 1 80 98 65
Emiliania huxleyi — — — — 156 124 35 156 25 15 10 17 1 79 98 64
Cryptophyceae — 40 — 40 100 95 99 111 40 89 49 63 1 1 343 39
Prasinophyceae — 0 — 0 8 4 4 6 0 0 0 0 0 0 0 0
Other flagellates — 1081 — 1081 377 539 242 441 317 417 125 319 256 318 2401 536
Total — 7294 — 7294 689 920 886 849 704 1210 4573 1636 466 853 15989 2231
Species composition and mean of phytoplankton cell abundances (103 cells L21) per transect in March 2002, 2004, 2005 and 2006 in the Northern Adriatic Sea. Speciesare shown only if their mean per transect were once higher than 56103 cells L21. Values are the total of all counted cells for the group, including the species notpresented here. In March 2002, species were identified at the class level, except for the diatom S. marinoi.doi:10.1371/journal.pone.0085947.t002
Phytoplankton Lysis and PUAs
PLOS ONE | www.plosone.org 4 January 2014 | Volume 9 | Issue 1 | e85947
analysis. PUAs were then analyzed according to [31]. For the
Wichard et al. method, cells were concentrated on a 1.2 mm GF/C
filter (Whatmann, Dassel, DE) under moderate vacuum (,500
mbar). Cells were rinsed with 1 mL of 25 mM PFBHA (Roth,
Karlsruhe, DE) solution in Tris-HCl 100 mM, pH 7.2. The cell
suspension was then transferred to a 4 mL glass vial (Macherey-
Nagel, Duren, DE) and five microlitres of internal standard
(benzaldehyde, 1 mM in methanol, Sigma-Aldrich, DE) was
added. The samples were incubated 1 h at room temperature and
successively frozen in liquid nitrogen and stored at 280uC until
further analysis. Concentrations of PUAs were then analyzed by
gas chromatography–mass spectrometry following Wichard et al.
method [24]. Particulate concentration of PUAs was calculated by
dividing the amount of PUAs produced after mechanical cell
disruption by the number of known-PUA producing diatom cells
(mainly Skeletonema marinoi) [33].
The quantification of dissolved PUAs was performed in March
2006 following the method of Vidoudez and Pohnert [22]. One
liter of surface seawater was gently filtered through 1–2 cm layer of
dry commercial washed sea sand using a Buchner funnel with two
layers of 25 mm Whatman filter paper. The filtered seawater,
together with 5 mL of internal standard (1 mM Benzaldehyde in
methanol), was run through a C18 cartridge column (Chroma-
bond C18 ec, Machery-Nagel, Duren, DE) and the PUAs eluted
by adding 6 ml of the derivatizing reagent (25 mM PFBHA in
methanol). The samples were incubated 1 h at room temperature
and then frozen in liquid nitrogen and stored at 280uC until
further analysis. Concentrations of PUAs were then analyzed by
Table 3. Esterase activity, lysis rate, concentrations of particulate and dissolved polyunsaturated aldehydes for each transect in theNorthern Adriatic Sea.
Cruise andTransect
NEH(nM h21)
DEA(nM h21)
PEA(nM h21)
LR1
(d21)
Particulate PUA concentration(fmol cell21) Dissolved PUA concentration (nM)
7:2 8:2 8:3 Total 7:2 8:2 8:3 Total
March 1 — — — — — — — — — — —
2002 2 — 5.20 13.00 0.17 1.21 0.10 0.45 1.76 — — — —
3.60–8.51 5.21–33.00 0.09–0.24 0.18–1.75 0.00–0.22 0.02–1.20 0.23–2.51
(03/12) 3 — — — — — — — — — — — —
mean — 5.20 13.00 0.17 1.21 0.10 0.45 1.76 — — — —
range 3.60–8.51 5.21–33.00 0.09–0.24 0.18–1.75 0.00–0.22 0.02–1.20 0.23–2.51
March 1 10.87 7.93 46.83 0.06 — — — — — — — —
2004 7.98–15.44 4.73–10.41 15.99–76.89 0.03–0.09
2 13.68 9.81 18.30 0.17 0.42 0.16 0.16 0.74 — — — —
(02/26– 11.23–15.96 3.35–20.77 5.08–42.69 0.14–0.24 0.04–0.96 0.00–0.66 0.04–0.40 0.08–1.89
03/03) 3 14.79 19.11 27.74 0.20 — — — — — — — —
12.11–17.07 11.27–31.60 17.03–38.12 0.16–0.24
mean 13.04 11.66 30.33 0.14 0.42 0.16 0.16 0.74 — — — —
range 7.97–17.07 3.35–31.60 5.08–76.89 0.03–0.24 0.04–0.96 0.00–0.66 0.04–0.40 0.08–1.89
March 1 12.38 7.23 18.24 0.13 1.00 0.01 0.05 1.06 — — — —
2005 11.84–13.12 3.55–9.65 13.54–24.89 0.08–0.20 0.53–1.83 0.00–0.05 0.00–0.20 0.52–2.08
2 13.52 9.30 16.68 0.21 1.01 0.02 0.05 1.08 — — — —
(03/09– 3.16–19.20 5.53–17.70 6.14–31.77 0.12–0.31 0.05–2.54 0.00–0.07 0.00–0.08 0.06–2.54
03/16) 3 9.96 15.08 24.73 0.21 0.81 0.15 0.16 1.12 — — — —
7.69–13.30 12.67–18.14 19.20–29.43 0.17–0.24 0.00–0.45 0.00–0.31 0.00–0.30 0.00–1.91
mean 12.51 9.90 18.70 0.19 0.96 0.05 0.08 1.09 — — — —
range 3.16–19.20 3.55–18.14 6.14–31.77 0.08–0.31 0.00–2.54 0.00–0.45 0.00–0.30 0.00–2.54
March 1 11.81 2.95 10.01 0.09 0.18 0.03 0.00 0.21 0.19 0.19 0.23 0.61
2006 8.76–13.16 0.72–4.82 2.22–14.63 0.07–0.12 0.00–0.28 0.00–0.09 0.00–0.00 0.00–0.35
2 13.01 5.65 8.40 0.21 0.23 1.13 0.07* 1.43 0.04 0.84 0.21* 1.09
(03/17– 10.26–19.23 1.53–17.77 2.76–17.41 0.08–0.38 0.00–1.12 0.00–5.37 0.00–0.56* 0.00–5.37 0.00–0.18 0.00–2.40 0.00–0.80* 0.06–2.53
03/20) 3 14.54 3.09 7.38 0.13 0.30 0.11 0.00 0.42 0.05 0.08 0.03* 0.17
10.88–17.69 1.09–6.92 4.32–13.14 0.08–0.17 0.00–0.85 0.00–0.32 0.00–0.00 0.00–1.17 0.00–0.16 0.03–0.12 0.02–0.05* 0.13–0.22
mean 13.04 4.25 8.63 0.16 0.24 0.68 0.04 0.96 0.05 0.57 0.16 0.79
range 8.76–19.23 0.72–17.77 2.22–17.41 0.07–0.38 0.00–1.12 0.00–5.37 0.00–0.56 0.00–5.37 0.00–0.19 0.00–2.40 0.00–0.80 0.06–2.53
1Lysis rate calculated according to Riegman & Winter 2003.Mean and range of percent of non-enzymatic hydrolysis (NEH, nM h21) of fluorescein to esterase activity, particulate and dissolved esterase activity (PEA and DEA, nMh21, both corrected from NEH), lysis rate (LR, d21) and concentrations of particulate (fmol cell21) and dissolved (nM) polyunsaturated aldehyde (PUAs) (7:2, 8:2 and 8:3for heptadienal, octadienal and octatrienal, respectively) per transect in March 2002, 2004, 2005 and 2006 in the Northern Adriatic Sea. * Traces of decatrienal were alsodetected.doi:10.1371/journal.pone.0085947.t003
Phytoplankton Lysis and PUAs
PLOS ONE | www.plosone.org 5 January 2014 | Volume 9 | Issue 1 | e85947
gas chromatography–mass spectrometry following Wichard et al.
method [24].
Statistical AnalysesLysis rates were compared with PUA concentrations using
reduced major axis model II regression [34]. A permutation test
was performed to determine the significance of the slopes and to
calculate the Pearson coefficients of correlation. Statistical analyses
were performed using the R computing environment (R Core
Team, 2013), and judging significance at the 95% confidence
level.
Results
In all cruises, satellite-based chlorophyll a concentrations
indicate that the highest phytoplankton biomass in the North
Adriatic Sea occurred in the Po river plume along the western
coastline of transects 2 and 3 (Fig. 1). The same was true for
inorganic nutrients, with the highest concentrations observed in
the Po river plume (Table 1). The mean of molar particulate
organic C:N ratios along transect 1 were close to the Redfield ratio
(6.6) (6.89, 6.76, 6.79 for March 2004, 2005 and 2006,
respectively) (Table 1). High C:N ratios were observed along
transect 2 in March 2002 and 2006 (11.45 and 9.92, respectively),
which were associated with high POC concentrations (1155 and
403 mg L21, respectively). The phytoplankton community was
mainly composed of diatoms in March 2002, 2005 and 2006,
representing 84, 75 and 78% of all counted cells (Table 1). The
diatom Skeletonema marinoi dominated the diatom community
numerically, with mean abundances of 4.06, 1.09 and 1.506106
cells L21 representing 66, 89 and 87% of all diatom cells in March
2002, 2005 and 2006, respectively (Table 1), except along transects
1 and 2 in March 2006 where the diatom community was
dominated by Stephanodiscus spp. and Chaetoceros compressus, respec-
tively (Table 2). In March 2004, the phytoplankton assemblage
was dominated by the prymnesiophyte Emiliania huxleyi, while
diatom cell abundance was an order of magnitude lower than
other years (Table 1 and 3).
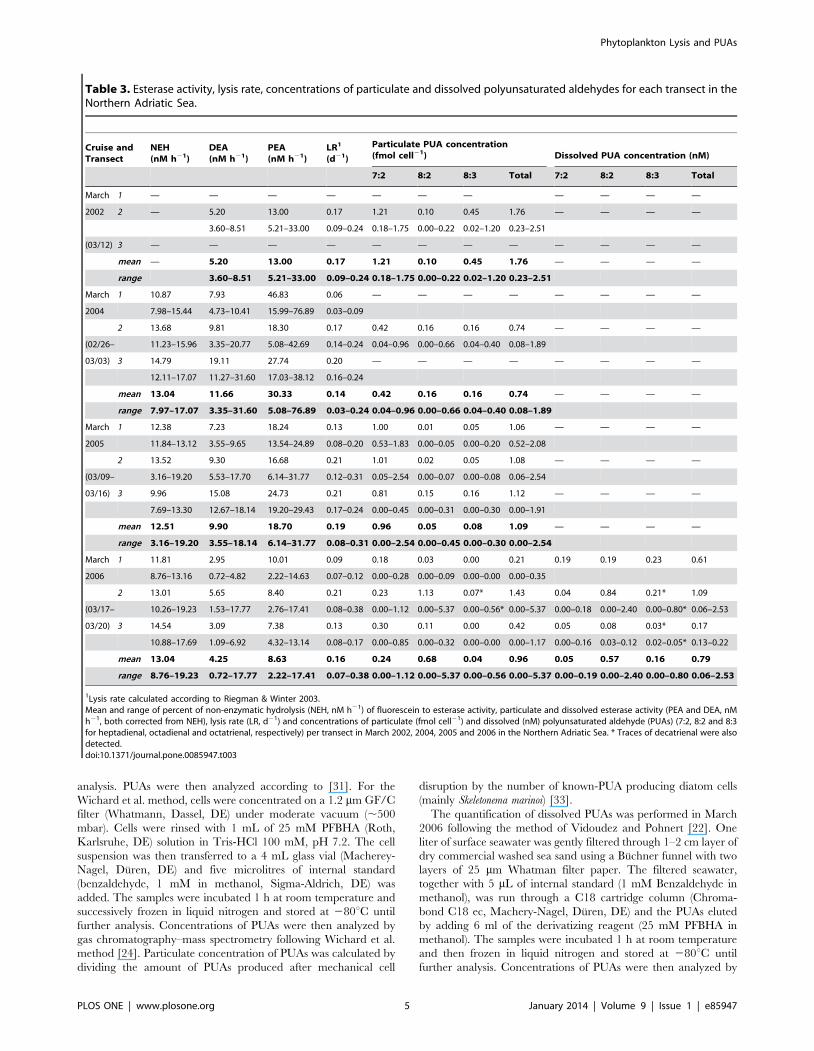
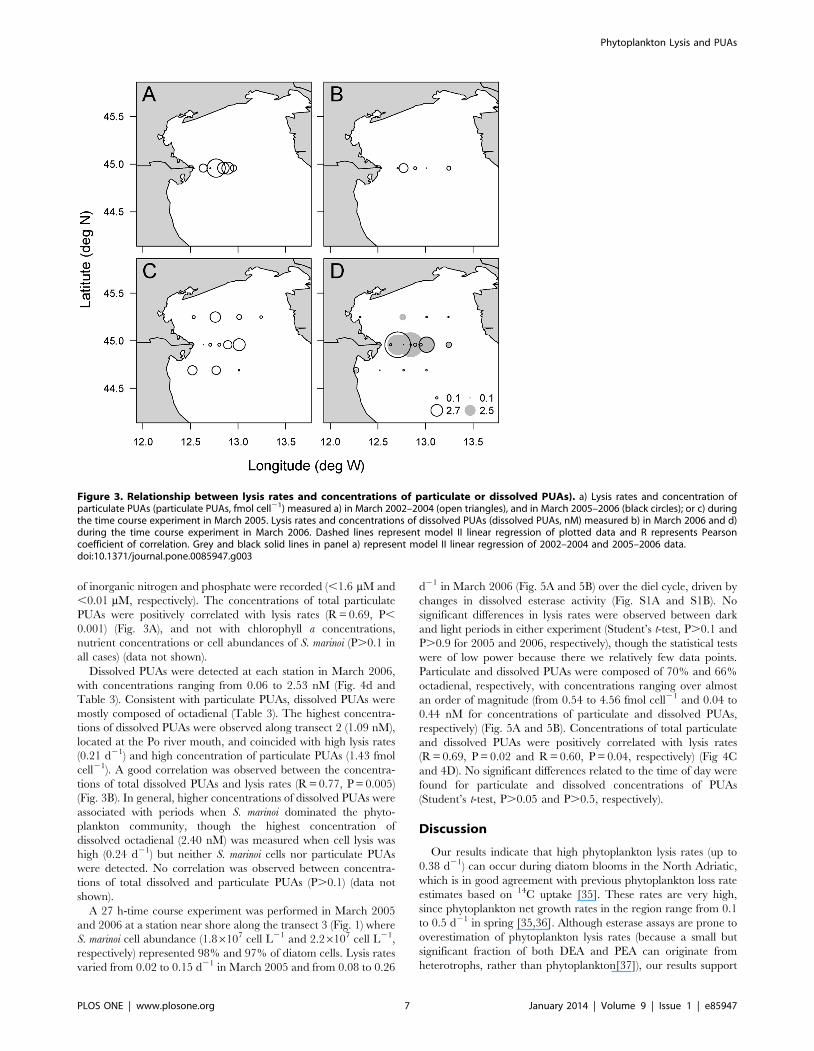
Lysis rates ranged from 0.03 to 0.38 d21, with an average of
0.1660.01 d21 (Fig. 2). Transect 1 showed lower mean lysis rate
values (0.06, 0.13, 0.09 d21, in March 2004, 2005 and 2006,
respectively) than those obtained in transect 2 (0.17, 0.17, 0.21,
0.21 d21, in March 2002, 2004, 2005 and 2006, respectively) or
transect 3 (0.20, 0.21, 0.13 d21, in March 2004, 2005 and 2006,
respectively) (Fig. 2 and Table 1, ANOVA, P,0.05). Concentra-
tions of total particulate PUAs were highly variable with values
ranging from undetectable amount to 5.37 fmol cell21, with a
mean of 1.16 fmol cell21 (Table 3). Particulate heptadienal
represented, on average, 68% of the total PUAs while octadienal
and octatrienal represented only 18% and 13%, respectively
(Table 3). Compositions of particulate PUAs changed in March
2006 along transect 2, with octadienal and heptadienal represent-
ing 79% and 16% of the total PUAs (Table 3). Concentrations of
total particulate PUAs in March 2004 (0.74 fmol cell21) was
significantly lower than March 2002 (1.76 fmol cell21), 2005 (1.09
fmol cell21) and 2006 (0.96 fmol cell21) (Tukey Multiple
Comparison post-test, P,0.05) (Table 3). The highest concentra-
tion of particulate PUAs (5.37 fmol cell21, composed exclusively of
octadienal) was observed in March 2006 along transect 2 near the
Po river mouth, where the diatom community was dominated by
Chaetoceros compressus (76%) (Table 2) and where low concentrations
Figure 2. Lysis rates in the North Adriatic Sea. Lysis rate (d21), calculated using the esterase method [29] in March a) 2002, b) 2004, c) 2005 andd) 2006. The diameter of the symbols is proportional to the measurement.doi:10.1371/journal.pone.0085947.g002
Phytoplankton Lysis and PUAs
PLOS ONE | www.plosone.org 6 January 2014 | Volume 9 | Issue 1 | e85947
of inorganic nitrogen and phosphate were recorded (,1.6 mM and
,0.01 mM, respectively). The concentrations of total particulate
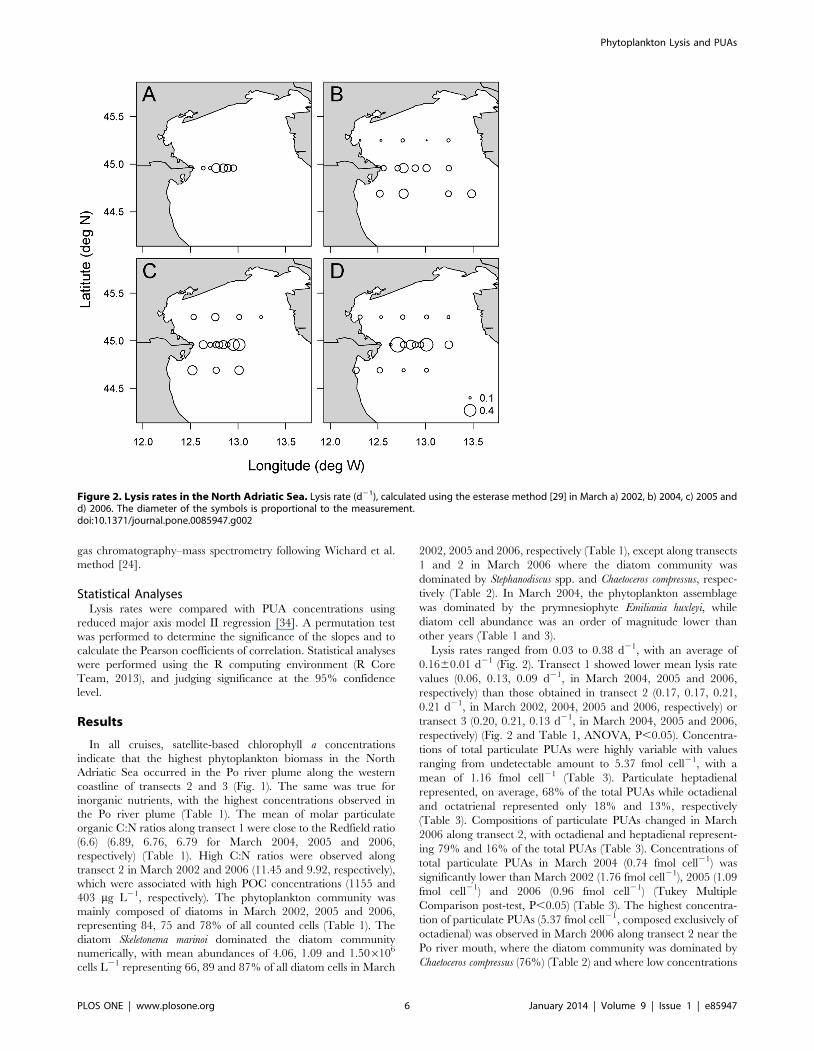
PUAs were positively correlated with lysis rates (R = 0.69, P,
0.001) (Fig. 3A), and not with chlorophyll a concentrations,
nutrient concentrations or cell abundances of S. marinoi (P.0.1 in
all cases) (data not shown).
Dissolved PUAs were detected at each station in March 2006,
with concentrations ranging from 0.06 to 2.53 nM (Fig. 4d and
Table 3). Consistent with particulate PUAs, dissolved PUAs were
mostly composed of octadienal (Table 3). The highest concentra-
tions of dissolved PUAs were observed along transect 2 (1.09 nM),
located at the Po river mouth, and coincided with high lysis rates
(0.21 d21) and high concentration of particulate PUAs (1.43 fmol
cell21). A good correlation was observed between the concentra-
tions of total dissolved PUAs and lysis rates (R = 0.77, P = 0.005)
(Fig. 3B). In general, higher concentrations of dissolved PUAs were
associated with periods when S. marinoi dominated the phyto-
plankton community, though the highest concentration of
dissolved octadienal (2.40 nM) was measured when cell lysis was
high (0.24 d21) but neither S. marinoi cells nor particulate PUAs
were detected. No correlation was observed between concentra-
tions of total dissolved and particulate PUAs (P.0.1) (data not
shown).
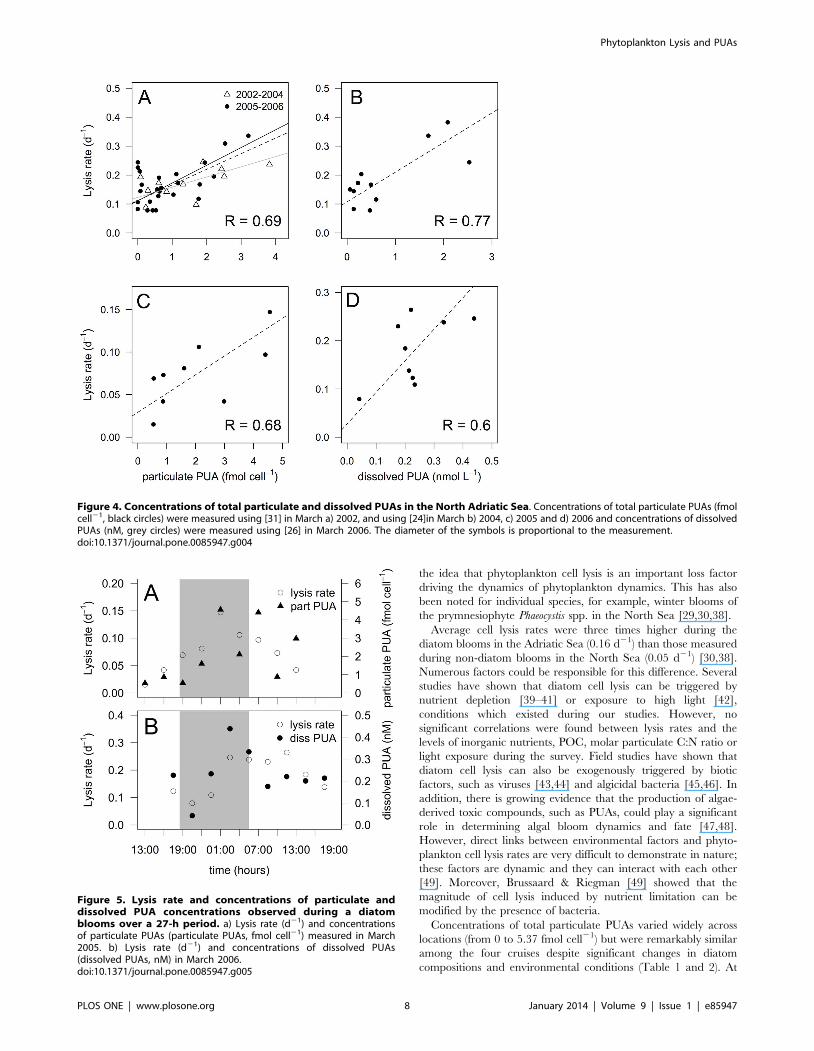
A 27 h-time course experiment was performed in March 2005
and 2006 at a station near shore along the transect 3 (Fig. 1) where
S. marinoi cell abundance (1.86107 cell L21 and 2.26107 cell L21,
respectively) represented 98% and 97% of diatom cells. Lysis rates
varied from 0.02 to 0.15 d21 in March 2005 and from 0.08 to 0.26
d21 in March 2006 (Fig. 5A and 5B) over the diel cycle, driven by
changes in dissolved esterase activity (Fig. S1A and S1B). No
significant differences in lysis rates were observed between dark
and light periods in either experiment (Student’s t-test, P.0.1 and
P.0.9 for 2005 and 2006, respectively), though the statistical tests
were of low power because there we relatively few data points.
Particulate and dissolved PUAs were composed of 70% and 66%
octadienal, respectively, with concentrations ranging over almost
an order of magnitude (from 0.54 to 4.56 fmol cell21 and 0.04 to
0.44 nM for concentrations of particulate and dissolved PUAs,
respectively) (Fig. 5A and 5B). Concentrations of total particulate
and dissolved PUAs were positively correlated with lysis rates
(R = 0.69, P = 0.02 and R = 0.60, P = 0.04, respectively) (Fig 4C
and 4D). No significant differences related to the time of day were
found for particulate and dissolved concentrations of PUAs
(Student’s t-test, P.0.05 and P.0.5, respectively).
Discussion
Our results indicate that high phytoplankton lysis rates (up to
0.38 d21) can occur during diatom blooms in the North Adriatic,
which is in good agreement with previous phytoplankton loss rate
estimates based on 14C uptake [35]. These rates are very high,
since phytoplankton net growth rates in the region range from 0.1
to 0.5 d21 in spring [35,36]. Although esterase assays are prone to
overestimation of phytoplankton lysis rates (because a small but
significant fraction of both DEA and PEA can originate from
heterotrophs, rather than phytoplankton[37]), our results support
Figure 3. Relationship between lysis rates and concentrations of particulate or dissolved PUAs). a) Lysis rates and concentration ofparticulate PUAs (particulate PUAs, fmol cell21) measured a) in March 2002–2004 (open triangles), and in March 2005–2006 (black circles); or c) duringthe time course experiment in March 2005. Lysis rates and concentrations of dissolved PUAs (dissolved PUAs, nM) measured b) in March 2006 and d)during the time course experiment in March 2006. Dashed lines represent model II linear regression of plotted data and R represents Pearsoncoefficient of correlation. Grey and black solid lines in panel a) represent model II linear regression of 2002–2004 and 2005–2006 data.doi:10.1371/journal.pone.0085947.g003
Phytoplankton Lysis and PUAs
PLOS ONE | www.plosone.org 7 January 2014 | Volume 9 | Issue 1 | e85947
the idea that phytoplankton cell lysis is an important loss factor
driving the dynamics of phytoplankton dynamics. This has also
been noted for individual species, for example, winter blooms of
the prymnesiophyte Phaeocystis spp. in the North Sea [29,30,38].
Average cell lysis rates were three times higher during the
diatom blooms in the Adriatic Sea (0.16 d21) than those measured
during non-diatom blooms in the North Sea (0.05 d21) [30,38].
Numerous factors could be responsible for this difference. Several
studies have shown that diatom cell lysis can be triggered by
nutrient depletion [39–41] or exposure to high light [42],
conditions which existed during our studies. However, no
significant correlations were found between lysis rates and the
levels of inorganic nutrients, POC, molar particulate C:N ratio or
light exposure during the survey. Field studies have shown that
diatom cell lysis can also be exogenously triggered by biotic
factors, such as viruses [43,44] and algicidal bacteria [45,46]. In
addition, there is growing evidence that the production of algae-
derived toxic compounds, such as PUAs, could play a significant
role in determining algal bloom dynamics and fate [47,48].
However, direct links between environmental factors and phyto-
plankton cell lysis rates are very difficult to demonstrate in nature;
these factors are dynamic and they can interact with each other
[49]. Moreover, Brussaard & Riegman [49] showed that the
magnitude of cell lysis induced by nutrient limitation can be
modified by the presence of bacteria.
Concentrations of total particulate PUAs varied widely across
locations (from 0 to 5.37 fmol cell21) but were remarkably similar
among the four cruises despite significant changes in diatom
compositions and environmental conditions (Table 1 and 2). At
Figure 4. Concentrations of total particulate and dissolved PUAs in the North Adriatic Sea. Concentrations of total particulate PUAs (fmolcell21, black circles) were measured using [31] in March a) 2002, and using [24]in March b) 2004, c) 2005 and d) 2006 and concentrations of dissolvedPUAs (nM, grey circles) were measured using [26] in March 2006. The diameter of the symbols is proportional to the measurement.doi:10.1371/journal.pone.0085947.g004
Figure 5. Lysis rate and concentrations of particulate anddissolved PUA concentrations observed during a diatomblooms over a 27-h period. a) Lysis rate (d21) and concentrationsof particulate PUAs (particulate PUAs, fmol cell21) measured in March2005. b) Lysis rate (d21) and concentrations of dissolved PUAs(dissolved PUAs, nM) in March 2006.doi:10.1371/journal.pone.0085947.g005
Phytoplankton Lysis and PUAs
PLOS ONE | www.plosone.org 8 January 2014 | Volume 9 | Issue 1 | e85947
stations where S. marinoi dominated the diatom community,
particulate PUAs were mainly composed of heptadienal, and, to a
minor extent, octadienal and octatrienal (Table 3), in good
agreement with field observations in the region [50]. In March
2006, particulate PUAs along transect 2 were mainly composed of
octadienal, with trace of decatrienal, which may be due to the high
numbers of Chaetoceros compressus (Table 2), a known octadienal and
decatrienal-producing species [33].
Total dissolved PUAs ranged from 0 to 2.53 nM (Table 3),
which is about 2 orders of magnitude lower than concentrations
measured in S. marinoi cultures (.200 nM ) [22] but in good
agreement with previous in situ measurements in the region [50].
The highest concentrations of dissolved PUAs were measured
when cell lysis was high (0.24 d21) but at these times, no
particulate PUAs were detected. This result is consistent with
previous work during S. marinoi blooms showing that traces of
dissolved heptadienal and octadienal were found at several stations
where no particulate PUAs were detected [26]. In the latter study,
one possible explanation is that not all PUA-producing organisms
were collected; samples for particulate PUAs were collected using
GF/C filters (nominal pore size 1.2 mm). Thus smaller cells such as
picoplankton and bacteria were under-sampled, and both groups
have been reported to contain small amounts of particulate
heptadienal [26]. An alternative explanation is that, at the point of
sampling, all PUA producing species had already lysed, leaving
dissolved PUAs as the only pool. Finally, preliminary results show
that lipoxygenases, key enzymes for PUA production, are still
active 48 h after being released in seawater [51], suggesting that
free enzymes could still produce PUAs after cells have disap-
peared.
Positive correlations between both concentrations of particulate
and dissolved PUAs and lysis rates along transects and over the 27-
h time course experiments (Fig. 3) suggest a tight coupling between
the three variables. We hypothesize that the positive correlation
between concentrations of particulate PUAs and lysis rates results
because particulate PUAs in diatoms increase under physiological
stress, as observed in cultures [20,25], and diatom cell lysis
similarly occurs in response to stress (e.g., nutrient limitation).
Together with the fact that the composition of particulate and
dissolved PUAs is very similar, the correlation between dissolved
PUAs and lysis rates support the hypothesis that PUAs are released
in seawater following cell lysis. An alternative hypothesis is that
grazing results in dissolved PUA in the seawater. However, micro-
scale examination has failed to detect production of dissolved
PUAs around the mouths of grazing copepods [52].
Dissolved PUA concentrations and cell lysis are also correlated,
raising the question of whether concentrations of dissolved PUAs
are high enough to induce phytoplankton cell lysis. Although
diatom cell growth can be inhibited by nanomolar PUA
concentrations in culture [25], cell lysis has been shown to occur
only when cells are exposed to micromolar PUA concentrations
[4,9,10]. The concentrations of dissolved PUAs during the survey
would therefore be at least one order of magnitude lower than the
toxic levels established in cultures, suggesting that PUA concen-
trations were probably not high enough to induce cell lysis.
However, bulk measurements of PUAs in seawater may not reflect
the local concentrations in the vicinity of the PUA-releasing cells.
Based on a simple diffusion model, micromolar concentrations of
PUAs would be found at 1 mm-distance from a single S. marinoi
cells (see [10] for more details). Methods for the quantification of
microscale chemical gradients, such as the surface plasmon
resonance detection method coupled with antibodies [53], will
be needed to determine the ecological consequences of PUAs on
the structure and dynamics of diatom populations.
Supporting Information
Figure S1 Lysis rate and dissolved esterase activitymeasured during a diatom blooms over a 27-h period.Lysis rate (d-1) and dissolved esterase activity (EA, nM h-1)
measured a) in March 2005 and b) March 2006.
(TIFF)
Acknowledgements
We thank the captain and crew of the Dallaporta and Urania vessel for their
services, Christophe Brunet for chlorophyll a data and Daniele Cassin for
CHN analyses. This work is part of the PhD project of FR funded by the
Stazione Zoologica Anton Dohrn (SZN) under the Associate Research
Center PhD Program of The Open University, Milton Keynes, UK.
Author Contributions
Conceived and designed the experiments: FR RC JB. Performed the
experiments: FR MB CV TW RC. Analyzed the data: FR MB CV FA GR
TW. Contributed reagents/materials/analysis tools: AI AM GP GR RC.
Wrote the paper: FR JB RC.
References
1. Nelson D, Treguer P, Brzezinski M, Leynaert A, Queguiner B (1995) Production
and dissolution of biogenic silica in the ocean: Revised global estimates,
comparison with regional data and relationship to biogenic sedimentation.
Global Biogeochemical Cycles 9: 359–372.
2. Pohnert G, Steinke M, Tollrian R (2007) Chemical cues, defence metabolites
and the shaping of pelagic interspecific interactions. Trends in Ecology and
Evolution 22: 198–204. doi:10.1016/j.tree.2007.01.005.
3. Ianora A, Miralto A, Poulet S, Carotenuto Y, Buttino I, et al. (2004) Aldehyde
suppression of copepod recruitment in blooms of a ubiquitous planktonic
diatom. Nature 429: 403–407.
4. Vardi A, Formiggini F, Casotti R, de Martino A, Ribalet F, et al. (2006) A stress
surveillance system based on calcium and nitric oxide in marine diatoms. PLoS
Biology 4: 411–419. doi:10.1371/journal.pbio.0040060.
5. Miralto A, Barone G, Romano G, Poulet S, Ianora A, et al. (1999) The insidious
effect of diatoms on copepod reproduction. Nature 402: 173–176.
6. Matsui K (2006) Green leaf volatiles: hydroperoxide lyase pathway of oxylipin
metabolism. Current Opinion in Plant Biology 9: 274–280.
7. Spiteller G (2003) The relationship between changes in the cell wall, lipid
peroxidation, proliferation, senescence and cell death. Physiologia Plantarum
119: 5–18. doi:10.1034/j.1399-3054.2003.00097.x.
8. Feussner I, Wasternack C (2002) The Lipoxygenase Pathway. Annual Reviews
of Plant Biology 53: 275–297. doi:10.1146/annurev.arplant.53.100301.135248.
9. Casotti R, Mazza S, Brunet C, Vantrepotte V, Ianora A, et al. (2005) Growth
inhibition and toxicity of the diatom aldehyde 2-trans,4-trans decadienal on
Thalassiosira weissflogii (Bacillariophyceae). Journal of Phycology 41: 7–20.
10. Ribalet F, Berges J, Ianora A, Casotti R (2007) Growth inhibition of cultured
marine phytoplankton by toxic algal-derived polyunsaturated aldehydes. Aquatic
Toxicology 85: 219–227.
11. Adolph S, Bach S, Blondel M, Cueff A, Moreau M, et al. (2004) Cytotoxicity of
diatom-derived oxylipins in organisms belonging to different phyla. Journal of
Experimental Biology 207: 2935–2946. doi:10.1242/jeb.01105.
12. Ribalet F, Intertaglia L, Lebaron P, Casotti R (2008) Differential effect of three
polyunsaturated aldehydes on marine bacterial isolates. Aquatic Toxicology 86:
249–255. doi:10.1016/j.aquatox.2007.11.005.
13. Balestra C, Alonso-Saez L, Gasol J, Casotti R (2011) Group-specific effects on
coastal bacterioplankton of polyunsaturated aldehydes produced by diatoms.
Aquatic Microbial Ecology 63: 123–131. doi:10.3354/ame01486.
14. Pohnert G (2002) Phospholipase A2 activity triggers the wound-activated
chemical defense in the diatom Thalassiosira rotula. Plant Physiol 129: 103–111.
15. d’Ippolito G, Tucci S, Cutignano A, Romano G, Cimino G, et al. (2004) The
role of complex lipids in the synthesis of bioactive aldehydes of the marine
diatom Skeletonema costatum. Biochimica et Biophysica Acta - Molecular and
Cell Biology of Lipids 1686: 100–107.
16. Wichard T, Pohnert G (2006) Formation of halogenated medium chain
hydrocarbons by a lipoxygenase/hydroperoxide halolyase-mediated transfor-
Phytoplankton Lysis and PUAs
PLOS ONE | www.plosone.org 9 January 2014 | Volume 9 | Issue 1 | e85947
mation in planktonic microalgae. Journal of the American Chemical Society
128: 7114–7115.17. Barofsky A, Pohnert G (2007) Biosynthesis of Polyunsaturated Short Chain
Aldehydes in the Diatom Thalassiosira rotula. Organic Letters 9: 1017–1020.
18. Pohnert G (2000) Wound-activated chemical defense in unicellular planktonicalgae. Angewandte Chemie, International Edition in English 39: 4352–4354.
19. Fontana A, d’Ippolito G, Cutignano A, Miralto A, Ianora A, et al. (2007)Chemistry of oxylipin pathways in marine diatoms. Pure and Applied Chemistry
79: 475–484.
20. Ribalet F, Wichard T, Pohnert G, Ianora A, Miralto A, et al. (2007) Age andnutrient limitation enhance polyunsaturated aldehyde production in marine
diatoms. Phytochemistry 68: 2059–2067.21. Ribalet F, Vidoudez C, Cassin D, Pohnert G, Ianora A, et al. (2009) High
Plasticity in the Production of Diatom-derived Polyunsaturated Aldehydes underNutrient Limitation: Physiological and Ecological Implications. Protist 160: 444–
451.
22. Vidoudez C, Pohnert G (2008) Growth phase-specific release of polyunsaturatedaldehydes by the diatom Skeletonema marinoi. Journal of Plankton Research 30:
1305–1313. doi:10.1093/plankt/fbn085.23. Conley DJ, Malone TC (1992) Annual cycle of dissolved silicate in Chesapeake
Bay: implications for the production and fate of phytoplankton biomass. Marine
Ecology Progress Series 81: 121–128.24. Wichard T, Poulet S, Pohnert G (2005) Determination and quantification of a,
b, g, d- unsaturated aldehydes as pentafluorobenzyl-oxime derivates in diatomcultures and natural phytoplankton populations: Application in marine field
studies. Journal of Chromatography B 814: 155–161.25. Dittami SM, Wichard T, Malzahn AM, Pohnert G, Boersma M, et al. (2010)
Culture conditions affect fatty acid content along with wound-activated
production of polyunsaturated aldehydes in Thalassiosira rotula (Coscinodisco-phyceae). Nova Hedwigia 136: 231–248. doi:10.1127/1438-9134/2010/0136-
0231.26. Vidoudez C, Casotti R, Bastianini M, Pohnert G (2011) Quantification of
Dissolved and Particulate Polyunsaturated Aldehydes in the Adriatic Sea.
Marine Drugs 9: 500. Available: http://www.ncbi.nlm.nih.gov/pmc/articles/PMC3124968/?tool = pubmed.
27. Grasshoff K, Kremling K, Ehrhardt M (1999) Methods of Seawater Analysis. In:Grasshoff K, Kremling K, Ehrhardt M, editors. Wiley Online Library.
Weinheim, Germany: Wiley-VCH Verlag GmbH. p. 660. doi:10.1002/9783527613984.fmatter.
28. Utermohl H (1958) Zur Vervollkommnung der quantitativen Phytoplankton-
methodik. Mitt Int Verein Theor Angew Limnol 9: 1–38.29. Riegman R, Winter C (2003) Lysis of plankton in the non-stratified southern
North Sea during summer and autumn 2000. Acta Oecologica 24: 133–138.30. van Boekel W, Hansen F, Riegman R, Bak R (1992) Lysis-induced decline of a
Phaeocystis spring bloom and coupling with the microbial foodweb. Marine
Ecology Progress Series 81: 269–276.31. d’Ippolito G, Iadiccio O, Romano G, Fontana A (2002) Detection of short-chain
aldehydes in marine organisms: the diatom Thalassiosira rotula. TetrahedronLetters 43: 6137–6140.
32. d’Ippolito G, Romano G, Iadicicco O, Miralto A, Ianora A, et al. (2002) Newbirth-control aldehydes from the marine diatom Skeletonema costatum:
characterization and biogenesis. Tetrahedron Letters 43: 6133–6136.
33. Wichard T, Poulet S, Halsband-Lenk C, Albaina A, Harris R, et al. (2005)Survey of the chemical defence potential of diatoms: screening of fifty one
species for a, b, g, d-unsaturated aldehydes. Journal of Chemical Ecology 31:949–958.
34. Laws EA, Archie JW (1981) Appropriate use of regression analysis in marine
biology. Marine Biology 65: 13–16. doi:10.1007/BF00397062.35. Pugnetti A, Acri F, Alberighi L, Barletta D, Bastianini M, et al. (2004)
Phytoplankton photosynthetic activity and growth rates in the NW Adriatic Sea.Chemistry and Ecology 20: 399–409.
36. Socal G, Pugnetti A, Alberighi L, Acri F (2002) Observations on phytoplankton
productivity in relation to hydrography in the Northern Adriatic. Chemistry and
Ecology 18: 61–73. doi: 10.1080/02757540212686.
37. Agusti S, Satta M, Mura M, Benavent E (1998) Dissolved esterase activity as a
tracer of phytoplankton lysis: Evidence of high phytoplankton lysis rates in the
northwestern Mediterranean. Limnology and Oceanography 43: 1836–1849.
38. Brussaard C, Riegman R, Noordeloos M, Cadee G, Wittte H, et al. (1995)
Effects of grazing, sedimentation and phytoplankton cell lysis on the structure of
a coastal pelagic food web. Marine Ecology Progress Series 123: 259–271.
39. Brussaard C, Noordeloos A, Riegman R (1997) Autolysis kinetics of the marine
diatom Ditylum brightwellii (Bacillariophyceae) under nitrogen and phosphorus
limitation and starvation. Journal of Phycology 33: 980–987. doi:10.1111/
j.0022-3646.1997.00980.x.
40. Berges J, Falkowski P (1998) Physiological stress and cell death in marine
phytoplankton: Induction of proteases in response to nitrogen or light limitation.
Limnology and Oceanography 43: 129–135.
41. Bidle K, Bender S (2008) Iron Starvation and Culture Age Activate
Metacaspases and Programmed Cell Death in the Marine Diatom Thalassiosira
pseudonana. Eukaryotic Cell 7: 223–236. doi:10.1128/ec.00296-07.
42. Rijstenbil J (2002) Assessment of oxidative stress in the planktonic diatom
Thalassiosira pseudonana in response to UVA and UVB radiation. Journal of
Plankton Research 24: 1277–1288.
43. Nagasaki K, Tomaru Y, Katanozaka N, Shirai Y, Nishida K, et al. (2004)
Isolation and characterization of a novel single-stranded RNA virus infecting the
bloom-forming diatom Rhizosolenia setigera. Applied and Environmental
Microbiology 70: 704–711. doi: 10.1128/AEM.70.2.704-711.2004.
44. Nagasaki K, Tomaru Y, Takao Y, Nishida K, Shirai Y, et al. (2005) Previously
unknown virus infects marine diatom. Applied and Environmental Microbiology
71: 3528–3535. doi: 10.1128/AEM.71.7.3528-3535.2005.
45. Mitsutani A, Takesue K, Kirita M, Ishida Y (1992) Lysis of Skeletonema
costatum by Cytophaga sp. isolated from the coastal water of the Ariake Sea.
Nippon Suisan Gakkaishi 58: 2159–2169.
46. Imai I, Ishida Y, Hata Y (1993) Killing of marine phytoplankton by a gliding
bacterium Cytophaga sp., isolated from the coastal sea of Japan. Marine Biology
116: 527–532. doi: 10.1007/BF00355470.
47. Landsberg J (2002) The effects of harmful algal blooms on aquatic organisms.
Reviews in Fisheries Science 10: 113–390.
48. Legrand C, Rengefors K, Fistarol G, Graneli E (2003) Allelopathy in
phytoplankton - biochemical, ecological and evolutionary aspects. Phycologia
42: 406–419.
49. Brussaard C, Riegman R (1998) Influence of bacteria on phytoplankton cell
mortality with phosphorus or nitrogen as the algal-growth limiting nutrient.
Aquatic Microbial Ecology 14: 271–280.
50. Vidoudez C, Nejstgaard JC, Jakobsen HH, Pohnert G (2011) Dynamics of
Dissolved and Particulate Polyunsaturated Aldehydes in Mesocosms Inoculated
with Different Densities of the Diatom Skeletonema marinoi. Marine Drugs 9:
345–358. doi:10.3390/md9030345.
51. Fontana A, d’Ippolito G, Cutignano A, Romano G, Lamari N, et al. (2007)
LOX-induced lipid peroxidation as mechanism responsible for the detrimental
effect of marine diatoms on zooplankton grazers. ChemBioChem 8: 1810–1818.
doi: 10.1002/cbic.200700269.
52. Wichard T, Gerecht A, Boersma M, Poulet SA, Wiltshire K, et al. (2007) Lipid
and Fatty Acid Composition of Diatoms Revisited: Rapid Wound-Activated
Change of Food Quality Parameters Influences Herbivorous Copepod
Reproductive Success. ChemBioChem 8: 1146–1153. doi:10.1002/
cbic.200700053.
53. Soelberg SD, Stevens RC, Limaye AP, Furlong CE (2009) Surface Plasmon
Resonance Detection Using Antibody-Linked Magnetic Nanoparticles for
Analyte Capture, Purification, Concentration, and Signal Amplification.
Analytical Chemistry 81: 2357–2363. doi:10.1021/ac900007c.
Phytoplankton Lysis and PUAs
PLOS ONE | www.plosone.org 10 January 2014 | Volume 9 | Issue 1 | e85947


