
National Irrigation Water QualityProgram Data-SynthesisData Base
U.S. GEOLOGICAL SURVEYOpen-File Report 00–513
U.S. GEOLOGICAL SURVEYU.S. FISH AND WILDLIFE SERVICEBUREAU OF RECLAMATIONBUREAU OF INDIAN AFFAIRS

Report Documentation Page Form ApprovedOMB No. 0704-0188
Public reporting burden for the collection of information is estimated to average 1 hour per response, including the time for reviewing instructions, searching existing data sources, gathering andmaintaining the data needed, and completing and reviewing the collection of information. Send comments regarding this burden estimate or any other aspect of this collection of information,including suggestions for reducing this burden, to Washington Headquarters Services, Directorate for Information Operations and Reports, 1215 Jefferson Davis Highway, Suite 1204, ArlingtonVA 22202-4302. Respondents should be aware that notwithstanding any other provision of law, no person shall be subject to a penalty for failing to comply with a collection of information if itdoes not display a currently valid OMB control number.
1. REPORT DATE 2000
2. REPORT TYPE N/A
3. DATES COVERED -
4. TITLE AND SUBTITLE National Irrigation Water Quality Program Data-Synthesis Data Base
5a. CONTRACT NUMBER
5b. GRANT NUMBER
5c. PROGRAM ELEMENT NUMBER
6. AUTHOR(S) 5d. PROJECT NUMBER
5e. TASK NUMBER
5f. WORK UNIT NUMBER
7. PERFORMING ORGANIZATION NAME(S) AND ADDRESS(ES) U.S. Department of the Interior 1849 C Street, NW Washington, DC 20240
8. PERFORMING ORGANIZATIONREPORT NUMBER
9. SPONSORING/MONITORING AGENCY NAME(S) AND ADDRESS(ES) 10. SPONSOR/MONITOR’S ACRONYM(S)
11. SPONSOR/MONITOR’S REPORT NUMBER(S)
12. DISTRIBUTION/AVAILABILITY STATEMENT Approved for public release, distribution unlimited
13. SUPPLEMENTARY NOTES The original document contains color images.
14. ABSTRACT
15. SUBJECT TERMS
16. SECURITY CLASSIFICATION OF: 17. LIMITATION OF ABSTRACT
SAR
18. NUMBEROF PAGES
40
19a. NAME OFRESPONSIBLE PERSON
a. REPORT unclassified
b. ABSTRACT unclassified
c. THIS PAGE unclassified
Standard Form 298 (Rev. 8-98) Prescribed by ANSI Std Z39-18

National Irrigation Water Quality ProgramData-Synthesis Data Base
By Ralph L. Seiler and Joseph P. Skorupa
U.S. GEOLOGICAL SURVEY
Carson City, Nevada2001
Prepared in cooperation:U.S. GEOLOGICAL SURVEYU.S. FISH AND WILDLIFE SERVICEBUREAU OF RECLAMATIONBUREAU OF INDIAN AFFAIRS
Open-File Report 00–513

U.S. DEPARTMENT OF THE INTERIORGALE A. NORTON, Secretary
U.S. GEOLOGICAL SURVEYCHARLES G. GROAT, Director
Any use of trade, product, or firm names in this publication is for descriptivepurposes only and does not imply endorsement by the U.S. Government
For additional information Copies of this report can becontact: purchased from:
District Chief U.S. Geological Survey U.S. Geological Survey Information Services333 West Nye Lane, Room 203 Building 810Carson City, NV 89706–0866 Box 25286, Federal Center
Denver, CO 80225–0286
email: [email protected]
http://nevada.usgs.gov

CONTENTS
Abstract.................................................................................................................................................................................. 1Introduction............................................................................................................................................................................ 1Purpose and Scope................................................................................................................................................................. 4Contents of Data Base ........................................................................................................................................................... 4
Data-Base Bias ........................................................................................................................................................... 5Structure of Data Base ........................................................................................................................................................... 5
Data Structure............................................................................................................................................................. 5Data Dictionary and Discussion of Attributes ........................................................................................................... 7
Data Sources and Retrieval.................................................................................................................................................... 7Area and Site Tables .................................................................................................................................................. 8Water and Bottom-Sediment Tables .......................................................................................................................... 8Biological Tables ....................................................................................................................................................... 8
Manipulation of Data............................................................................................................................................................. 8Data-Base Quality-Assurance Procedures ............................................................................................................................. 9
Water Data ................................................................................................................................................................. 9Bottom-Sediment Data............................................................................................................................................... 10Biological Data........................................................................................................................................................... 10
Dissemination ........................................................................................................................................................................ 10References Cited .................................................................................................................................................................... 10
Figures
1. Map showing National Irrigation Water Quality Program study areas and data-collection sites .......................... 22. Schematic of structure and linking attributes of National Irrigation Water Quality Program data base ............... 6
Table
1. Reconnaissance and detailed area studies used as data sources for National Irrigation Water QualityProgram data base .................................................................................................................................................. 3
Appendices
A. Data dictionary for National Irrigation Water Quality Program data base ............................................................ 16B. Codes used for fixed-value attributes in National Irrigation Water Quality Program data base ........................... 32
CONTENTS III

CONVERSION FACTORS, WATER-QUALITY UNITS, AND VERTICAL DATUM
Multiply By To obtain
acre 4,047 square meter
cubic foot per second (ft3/s) 0.02832 cubic meter per second
foot (ft) 0.3048 meter
inch (in.) 25.4 millimeter
mile (mi) 1.609 kilometer
square mile (mi2) 2.590 square kilometer
ton per day (t/d) 0.9072 megagram per day
Water-quality units used in this report:
g/kg gram per kilogram mg/kg milligram per kilogram
µg/g microgram per gram mg/L milligram per liter
µg/kg microgram per kilogram mm millimeter
µg/L microgram per liter mV millivolt
µS/cm microsiemen per centimeter pCi/L picocuries per liter
Temperature: Degrees Celsius (οC) can be converted to degrees Fahrenheit (οF) by using the formula οF = [1.8(οC)]+32.
Sea level: In this report, “sea level” refers to the National Geodetic Vertical Datum of 1929 (NGVD of 1929, formerly called “Sea-Level Datum of 1929”), which is derived from a general adjustment of the first-order leveling networks of the United States and Canada.
IV National Irrigation Water Quality Program Data-Synthesis Data Base

National Irrigation Water Quality ProgramData-Synthesis Data Base
By Ralph L. Seiler and Joseph P. Skorupa
ABSTRACT
Under the National Irrigation Water Quality Program (NIWQP) of the U.S. Department of the Interior, researchers investigated contamination caused by irrigation drainage in 26 areas in the Western United States from 1986 to 1993. From 1992 to 1995, a comprehensive relational data base was built to organize data collected during the 26-area investigations. The data base provided the basis for analysis and synthesis of these data to identify common features of contaminated areas and hence dominant biologic, geologic, climatic, chemical, and physiographic factors that have resulted in contamination of water and biota inirrigated areas in the Western United States.
Included in the data base are geologic, hydrologic, climatological, chemical, and cultural data that describe the 26 study areas in 14 Western States. The data base contains information on 1,264 sites from which water and bottom sediment were collected. It also contains chemical data from 6,903 analyses of surface water, 914 analyses of ground water, 707 analyses of inorganic constitu-ents in bottom sediments, 223 analyses of orga-nochlorine pesticides in bottom sediments, 8,217 analyses of inorganic constituents in biota, and 1,088 analyses for organic constituents in biota.
The data base is available to the public and can be obtained at the NIWQP homepage <http://www.usbr.gov/niwqp> as dBase III tables for personal-computer systems or as American Stan-dard Code for Information Exchange structured query language (SQL) command and data files for SQL data bases.
INTRODUCTION
In the early 1980's, national headlines announced that selenium carried by irrigation drain water was causing mortality, congenital deformities, and repro-ductive failure in waterfowl at Kesterson National Wildlife Refuge, western San Joaquin Valley, Calif. The National Irrigation Water Quality Program (NIWQP) of the U.S. Department of the Interior (DOI) was created in October 1985 after the U.S. Congress and environmental groups expressed concern thatirrigation-induced contamination of water and biota might occur elsewhere in the Western United States. From 1986 to 1993, 26 areas in the Western United States (fig. 1, table 1) were investigated to determine the existence, magnitude, and causes of contamination related to irrigation drainage in these areas.
Preliminary analysis of results from the NIWQP studies showed that many of the sites that exhibitirrigation-induced water-quality problems have com-mon geologic, hydrologic, and climatic characteristics (Sylvester and others, 1988). The National Research Council reviewed the NIWQP (National Research Council, 1991) and suggested the need for systems analysis to identify and address the linkages among these characteristics.
In 1992, the DOI began a 5-year data-synthesis project to assess data collected by the completed and ongoing NIWQP investigations. The overall objective of the data-synthesis project was to identify common-alities of the 26 NIWQP study areas and dominant bio-logic, geologic, climatic, chemical, and physiographic factors that result in contamination of water and biota in irrigated areas of the Western United States. A key step in the data-synthesis project was the construction of a relational data base to organize the data collected during the NIWQP investigations.
ABSTRACT 1

2 National Irrigation Water Quality Program Data-Synthesis Data Base
120°
45°
40°
35°
30°
115°110° 105° 100°
95°
EXPLANATION
Data-collection site for National Irrigation Water Quality Program study area—Letter is area identifier (table 1)
T
Kesterson National Wildlife Refuge, San Joaquin Valley, Calif.
0 250 500 MILES
0 250 500 KILOMETERS
State boundaries from TIGER/Line digital data, 1:100,000, 1992; coastlines and hydrology from U.S. Geological Survey digital data, 1:2,000,000, 1970Albers Equal-Area Conic projectionStandard parallels 29°30' and 45°30', central meridian 96°00'
X
AB
C
D
E
F
G
H
J
K
L
M
N
O
Q
R
S
T
U
V
W
Y
Z
P
I
WASHINGTON
OREGON
CALIFORNIA
NEVADA
ARIZONA
UTAH
IDAHO
MONTANA
WYOMING
COLORADO
NEWMEXICO
TEXAS
OKLAHOMA
KANSAS
NEBRASKA
SOUTHDAKOTA
NORTHDAKOTA
G U L FO F
M E X I C O
PA
CI
FI
CO
CE
AN
M E X I C O
C A N A D A
Figure 1. National Irrigation Water Quality Program study areas and data-collection sites.

INTRODUCTION 3
1Used in figure 1 to show locations of study areas.2See above list for specific area names corresponding to these identifiers.
TABLE 1. Reconnaissance and detailed area studies used as data sources for National Irrigation Water Quality Program (NIWQP) data base
[—, no reference]
NIWQP study area References
Identifier1 Name Reconnaissance studies Detailed studies
Reports describing specific NIWQP study areas
A American Falls Reservoir, Idaho Low and Mullins, 1990 —
B Angostura Reclamation Unit, South Dakota Greene and others, 1990 —
C Belle Fourche Reclamation Project, South Dakota Roddy and others, 1991 —
D Columbia River Basin, Washington Embry and Block, 1995 —
E Dolores–Ute Mountain area, Colorado Butler and others, 1995 —
F Gunnison River Basin–Grand Valley Project, Colorado Butler and others, 1991 Butler and others, 1994.
G Humboldt River area, Nevada Seiler and others, 1993 —
H Kendrick Reclamation Project, Wyoming Peterson and others, 1988 See, Naftz, and others, 1992; See, Peterson, and Ramirez, 1992.
I Klamath Basin Refuge Complex, California-Oregon Sorenson and Schwarzbach, 1991 MacCoy, 1994.
J Lower Colorado River valley, California-Arizona Radtke and others, 1988 —
K Lower Rio Grande valley, Texas Wells and others, 1988 —
L Malheur National Wildlife Refuge, Oregon Rinella and Schuler, 1992 —
M Middle Arkansas River Basin, Colorado–Kansas Mueller and others, 1991 —
N Middle Green River Basin, Utah Stephens and others, 1988 Peltz and Waddell, 1991; Stephensand others, 1992.
O Middle Rio Grande, New Mexico Ong and others, 1992 —
P Milk River Basin, Montana Lambing and others, 1988 —
Q Owyhee-Vale Reclamation Project areas, Oregon–Idaho Rinella and others, 1994 —
R Pine River area, Colorado Butler and others, 1993 —
S Riverton Reclamation Project, Wyoming Peterson and others, 1991 —
T Sacramento Refuge Complex, California Dileanis and others, 1992 —
U Salton Sea area, California Setmire and others, 1990 Schroeder and others, 1993.
V San Juan River area, New Mexico Blanchard and others, 1993 —
W Stillwater Wildlife Management Area, Nevada Hoffman and others, 1990 Rowe and others, 1991; Lico, 1992; Hallock and Hallock, 1993; Hoffman, 1994.
X Sun River area, Montana Knapton and others, 1988 Lambing and others, 1994.
Y Tulare Lake Bed area, California Schroeder and others, 1988 —
Z Vermejo Project area, New Mexico Bartolino and others, 1996 —
Reports describing multiple NIWQP study areas
H, J, K, N, P, U, W, X, Z
(2) Severson and others, 1987 —
A, B, C, F, I, L, M, O, S, T
(2) Harms and others, 1990 —
C, E, G, Q, R, U, V, W
(2) Stewart and others, 1992 —

The Ingres data-base management system (here-after referred to as Ingres data base) was chosen because it is relational and uses the American National Standards Institute (ANSI) standard structured query language (SQL).
The NIWQP data base has been made available for scientists using different types of computer sys-tems. SQL was chosen to disseminate the data base because applications written in SQL are portable to many hardware platforms and will be for many years to come. The NIWQP data base also is available to indi-viduals using personal-computer (PC) data-base man-agement systems that may or may not support SQL. Although the data-synthesis team did not use dBase III for data analysis, dBase III files were chosen to dissem-inate the data base because most PC data-base manage-ment systems can read dBase III files, and because utilities were available to create the dBase III files.
PURPOSE AND SCOPE
This report describes the structure and content of the NIWQP data base, provides a data dictionary and describes how the data base was built and quality assured. The report does not include an analysis of the data contained in the data base but does include a brief summary of the types and numbers of analyses in the data base and a discussion of bias in the data base. The report also provides a list of published sources of data used to create the data base.
CONTENTS OF DATA BASE
The data base contains chemical analyses of sam-ples that were collected as part of NIWQP investiga-tions. The information used to construct the data base was derived primarily from the reports listed in table 1. Physiographic and cultural data that describe the study areas and individual data-collection sites and some water and biological data that were not collected as part of a NIWQP investigation also were included in the NIWQP data base. (An attribute in the data base indi-cates which samples were collected as part of NIWQP investigations.)
Some samples from NIWQP sampling sites have been collected and analyzed by the U.S. Geological Survey (USGS) as part of other programs. For sites used by NIWQP investigators, all water analyses made
by the USGS during the period 1986 through 1993 were included in the data base regardless of whether they were collected as part of the NIWQP or for another program. These additional data were entered in the NIWQP data base exactly as retrieved from the National Water Information System (NWIS) data base.
The NIWQP data base contains more than 30 attributes for physiographic, geologic, hydrologic, climatological, agricultural, chemical, and cultural data (app. A) that collectively describe each of the 26 study areas. More than 440 attributes store values for concen-trations of chemicals in water, bottom sediment, and biota. Samples for chemical analysis of water and (or) bottom sediment were collected at 1,264 data-collec-tion sites in 14 Western States. Of these 1,264 sites, 705 were river, stream, canal, or surface-drain sites, 348 were ground-water sites, and 211 were lake or pond sites. Also, 130 of the 1,264 are reference sites, and the remainder are sites affected in some way by irrigation drainage.
The data base includes 6,903 chemical analyses of surface water; of these 6,903 analyses, 1,661 include all major constituents, and most of these 1,661 also include trace elements. Some specific contaminants are represented by thousands of analyses, for instance, the data base contains 2,507 analyses of dissolved sele-nium and 545 analyses of total selenium. Also included are more than 100 analyses of organochlorine pesti-cides such as dichloro-diphenyl-trichloroethane (DDT) in water and almost 200 analyses of herbicides such as 2,4 dichlorophenoxyacetic acid (240). Analyses of nutrients include 1,408 for nitrate and 562 for phos-phate.
Inorganic constituents in bottom sediment are represented by 707 analyses of samples collected at 324 sites. Although for some study areas only one size fraction was analyzed, typically, both fine (less than 0.062 mm) and coarse (less than 2-millimeter) fractions were analyzed. The data base also includes 223 analy-ses for organochlorine pesticides such as DDT and 36 analyses for organophosphates such as parathion in bottom sediments.
Inorganic constituents in biota are represented by 8,217 analyses, including 2,410 from fish tissue, 751 from invertebrate tissue, and 1,086 from plant material. The data base contains 3,913 analyses of bird tissue, of which 1,235 are of bird livers and 2,051 are of bird eggs. Also included are a few analyses of periphyton and of tissues from reptiles, amphibians, and mammals.
4 National Irrigation Water Quality Program Data-Synthesis Data Base

Data-Base Bias
The NIWQP data base is biased in three ways that preclude its use for calculating baseline conditions in the Western United States:
1. Study areas were selected because of their potential to have irrigation-induced water-quality problems. Those study areas that were contaminated were further investigated. This approach results in a bias toward contaminated samples.
2. Within each study area, the sampling sites were not selected randomly. In some areas, many of the sampling sites were selected along main channels of large rivers because of the availability of historical data for these sites. This approach results in a bias toward uncon-taminated samples in some areas because contaminants in main-channel sites tend to be more diluted. In other areas, many sites were selected for complete chemical analyses after field measurements indicated that they likely were contaminated. This approach results in a bias toward contaminated samples in other areas.
3. Within a study area, not all sites were sampled at the same frequency. During process-oriented investigations, typically the most contaminated sites were sampled more frequently than the least contaminated sites. This approach results in a bias toward con-taminated samples.
STRUCTURE OF DATA BASE
Data Structure
The data base was designed so that relations among contaminant concentrations in water, bottom sediment, and biota can be explored. A diagram of the data structure of the NIWQP data base and the relations between the tables is shown in figure 2. Names of attributes and of tables shown in the diagram are explained in appendix A.
The AREA table within the data base contains information describing the 26 NIWQP study areas and associated subareas. For a given study area, the data in the table include amounts of evaporation and precipita-tion, general information about the geology and hydrol-ogy, the principal crop, and the amount of irrigated land.
The tables are linked by several key attributes (fig. 2). The AREA table is linked to the SITE table by the “area” and “sub_area” attributes, and in turn, the SITE table is linked to the other tables (in different matrix groups) by the “site_id” attribute. The SITE table contains all the primary site information, includ-ing the geographic location, the type of site, and whether the site is a reference site or is in or down-stream from irrigated lands.
The tabulated chemical data are classified by type of sample matrix: water, bottom sediment, or biota. These matrix groups are cross-referenced by the link-ing attribute “site_id.” Additionally, in the tables con-taining chemical data from water samples, splits of the same sample are linked through the “site_id,” “samp_date,” “samp_time,” and “matrix” attributes.
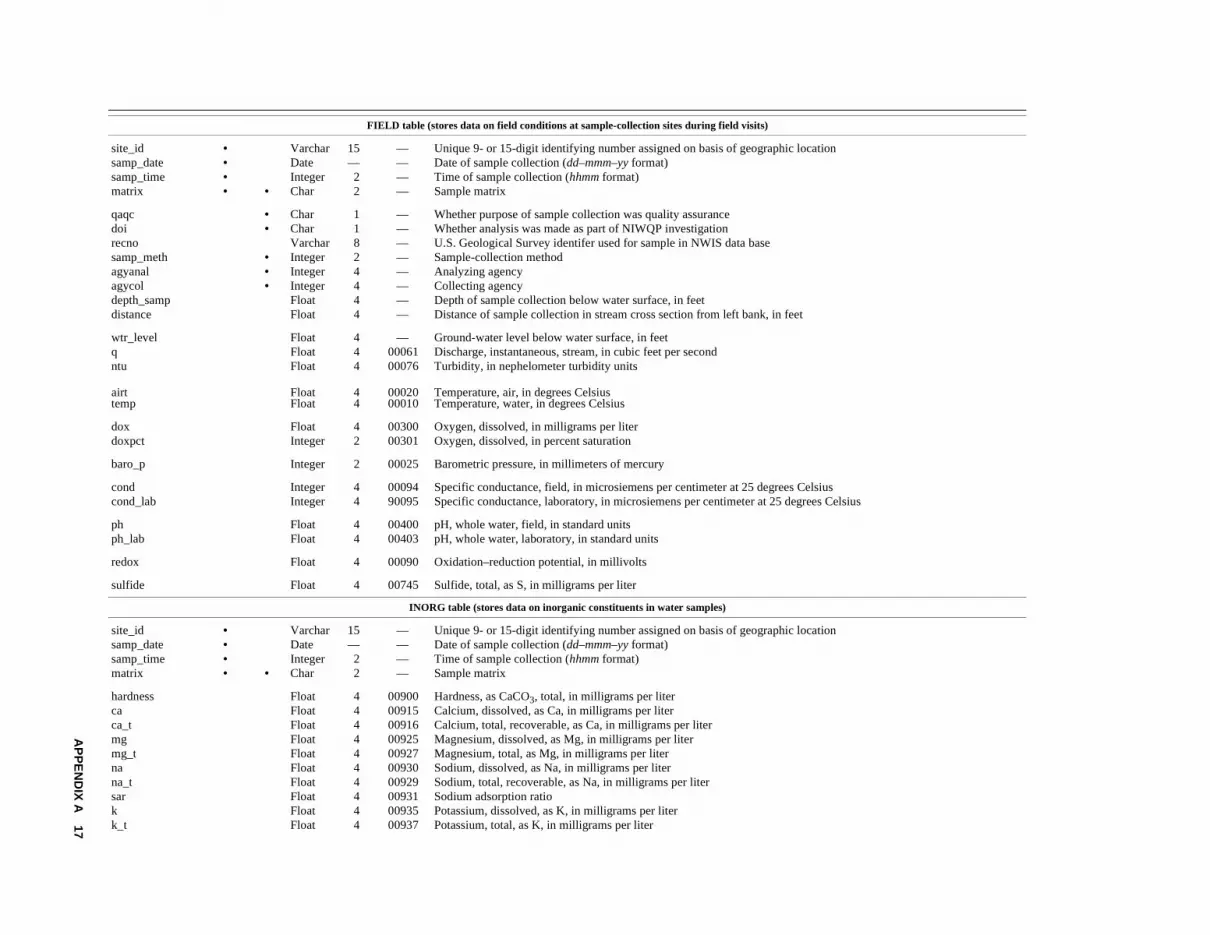
The following tables (app. A) contain chemical data and related information from analyses of water samples:
• FIELD — Time-dependent data collected dur-ing the site visit (for example, pH and specific conductance) and corresponding laboratory values. Also contains metadata concerning the sampling and analysis and includes linking attributes that connect it to the SITE table (“site_id”) and to other tables within the same matrix group (“matrix”);
• INORG — Time-dependent data on inorganic chemicals and physical parameters measured in the laboratory (for example, major ions and filtered and total trace elements);
• ISOTOPE — Time-dependent data on stable and radioactive isotopes (for example, deute-rium, tritium, and gross alpha and beta radio-activity);
• NUTRIENT — Time-dependent data on nutrients (for example, biochemical oxygen demand, nitrogen, and orthophosphate);
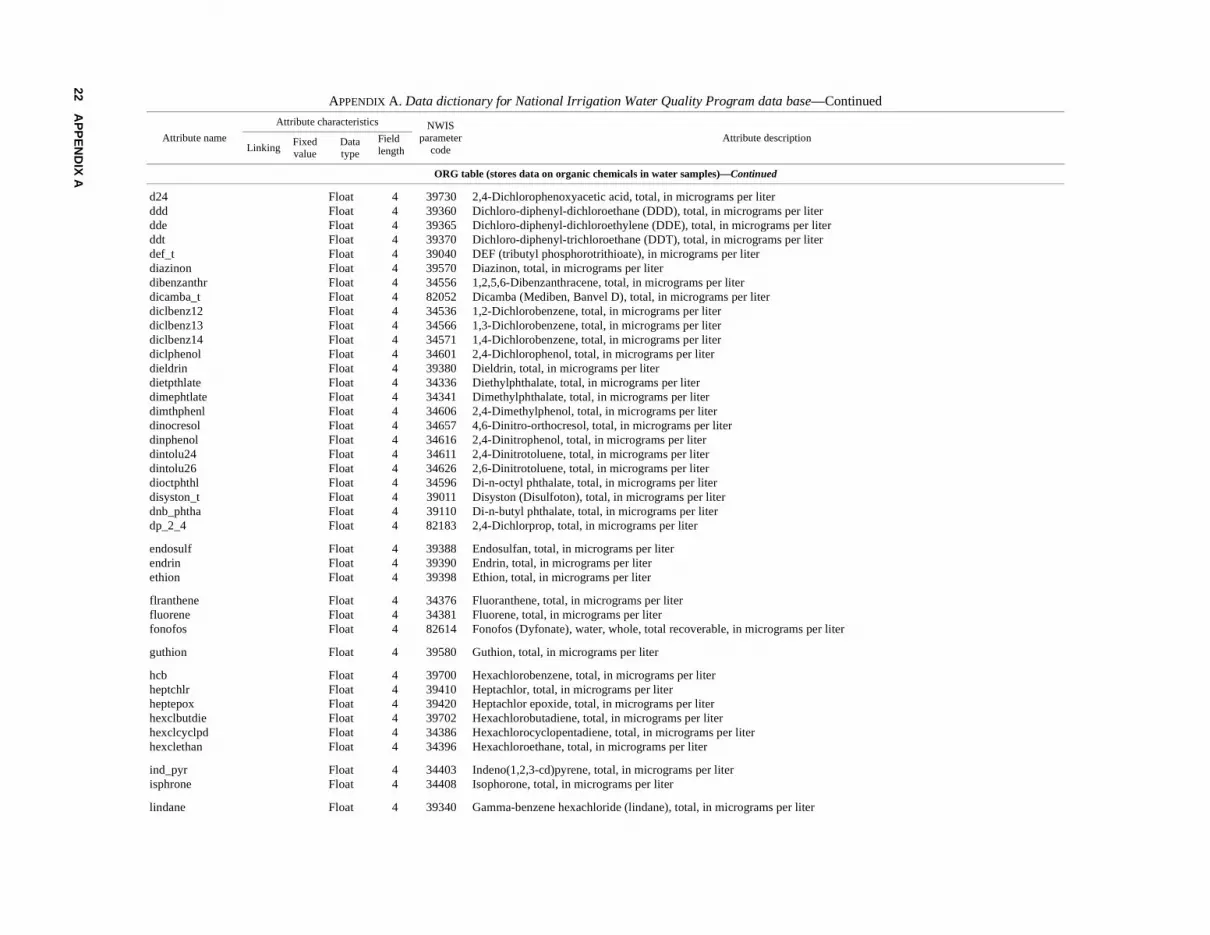
• ORG — Time-dependent data on organic chemicals (principally pesticides); and
• SEDIMENT — Time-dependent chemical data and physical characteristics of sediment (for example, suspended arsenic, suspended-sediment fall diameter, and suspended-sedi-ment discharge).
STRUCTURE OF DATA BASE 5

6 Natio
nal Irrig
ation
Water Q
uality P
rog
ram D
ata-Syn
thesis D
ata Base
EXPLANATION
Linking attribute
Data table
Matrix GroupWATER
AREAS
Area, Sub_area
SITE
Site_id
FIELD INORGBM ORGBM INORGBIO ORGBIO TAXON
Site_id, samp-date, samp-time, matrix
NUTRIENTSEDIMENTISOTOPEORGINORG
Site_id
AREA
BIOTABOTTOM
INORGBM
AREA
Area, Sub_area
SITE
Site_id
ISOTOPE
Linking attribute
Data table
Matrix Group (BOTTOM and BIOTA)
AREAS
Area, Sub_area
SITE
Site_id
FIELD INORGBM ORGBM INORGBIO ORGBIO TAXON
Site_id, samp-date, samp-time, matrix
NUTRIENTSEDIMENTISOTOPEORGINORG
Site_id
AREA
BIOTABOTTOM
INORGBM
AREA
Area, Sub_area
SITE
Site_id
ISOTOPE
WATER
Figure 2. Structure and linking attributes of National Irrigation Water Quality Program data base.

The following tables (app. A) contain chemical data from analyses of bottom-sediment samples and related information:
• INORGBM — Time-dependent data on inor-ganic constituents in bottom sediment (for example, size fraction and concentrations of organic carbon and trace elements); and
• ORGBM — Time-dependent data on organic constituents in bottom sediment (principally pesticides, but also includes concentrations of organic carbon).
The INORGBM and ORGBM tables are not linked to other tables of chemical data because time of sample collection is not available for the INORGBM table and because the data-synthesis team was not exploring relations between concentrations of inor-ganic and organic constituents in samples of bottom sediment. It is likely, however, that bottom-sediment samples collected from the same location on the same date represent the same environmental matrix and could be joined using the “site_id” and “samp_date” attributes.
The following tables contain chemical data from analyses of biological samples and related information:
• INORGBIO — Time-dependent data on inor-ganic constituents in biological samples (for example, species, tissue, moisture content, and trace-element concentrations); and
• ORGBIO — Time-dependent data on organic constituents (principally pesticides) in biologi-cal samples (for example, species, tissue, moisture content, and DDT).
The INORGBIO and ORGBIO tables are not linked to each other because the analyses may not be of the same organism even if the species, tissues, dates, and locations of sample collection are the same.
The table TAXON provides information about the taxonomic classification of biological samples represented in the data base. In the INORGBIO and ORGBIO tables, biological samples are classified by the common name most frequently used in the NIWQP reports. The TAXON table is not linked to other tables and has only one attribute in common with the other tables. The attribute “niwqp_name” in the TAXON table relates scientific and common names to the common name “species” used in the INORGBIO and ORGBIO tables.
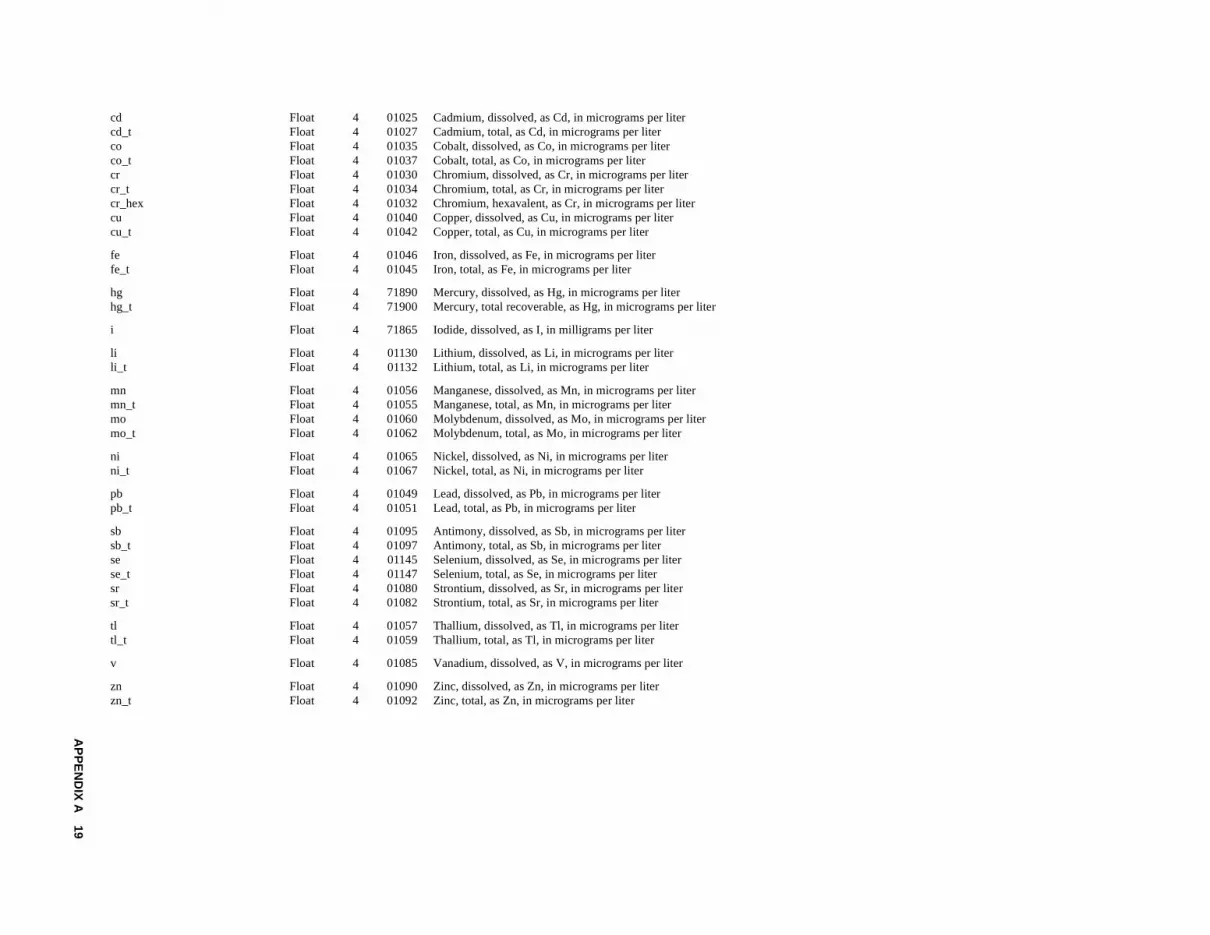
Data Dictionary and Discussion of Attributes
A data dictionary (apps. A and B) was created to describe the NIWQP data base. The dictionary pro-vides a complete inventory of the data attributes and their characteristics and definitions. It also functions as a directory to show the location and format of the data—to help the user access the information in the data base.
To the extent possible, attributes were given descriptive names. However, in one of the program-ming languages used to create the data base, attribute names could not exceed 16 characters and this limita-tion carried over into the SQL data bases. This limita-tion resulted in cryptic names for some organic chemicals. Attribute names for inorganic constituents are based on their chemical symbols. Notable excep-tions are some of the attributes involving arsenic and dissolved oxygen (for example, “ars” and “dox”) because “AS” and “DO” are key words reserved by SQL.
For bottom-sediment and biotic samples, the attribute names end in “_bm” and “_bio,” respectively, to indicate the matrix (for example, selenium in bottom sediment is “se_bm,” and selenium in biological material, “se_bio”). Matrix for water samples is not indicated in the attribute names. (Total-selenium concentrations in water are “se_t”; filtered-selenium concentrations in water are simply “se.”)
Although not listed in appendix A, a “remarks” attribute of character-type is associated with almost every listed attribute. This attribute of length one indi-cates if the value for the associated attribute is less than the method reporting limit by the code “<.” The naming convention for such remarks attributes is to add the suffix “_r” to the name of the attribute with which it is associated.
DATA SOURCES AND RETRIEVAL
The NIWQP data base was created by gathering data from published reports (table 1), digital data bases, and analytical-laboratory data sheets for biological samples. After retrieval, the data were stored in P-STAT (P-Stat Inc., 1990) files on a Prime minicom-puter at the USGS office in Carson City, Nev. P-STAT is an interactive computing system for files manage-ment, data modification, and statistical analysis. The data were manipulated and prepared using P-STAT before being imported into the Ingres data base on Data General workstations.
DATA SOURCES AND RETRIEVAL 7

Area and Site Tables
Data describing the 26 study areas for the AREA table were obtained from published reports (table 1) or directly from knowledgeable study-team members who had investigated an area. Geology and free-water-surface evaporation-rates data were obtained by plot-ting the locations of the data-collection sites on appro-priate thematic maps of the United States (King and Beikman, 1974; Farnsworth and others, 1982). Values for the derived attributes were determined from National, rather than local, maps to maintain consis-tency among the 26 study areas. An American Standard Code for Interface Exchange (ASCII) file containing the data was created by using a text editor and was imported into a P-STAT file on the USGS Prime com-puter.
Data describing the individual data-collection sites for the SITE table were obtained from published reports, from the USGS NWIS data-base site files, and directly from study-team members. Lists of unique site-identification numbers for the data-collection sites were obtained from the published reports or from the USGS team leader of each investigation. Site data, such as altitude, latitude, longitude, and site name, were retrieved from NWIS files, if available. For bottom-sediment sites without NWIS data, the site data were obtained from published reports.
Water and Bottom-Sediment Tables
Chemical data for water samples (FIELD, INORG, ISOTOPE, NUTRIENT, SEDIMENT, and ORG tables) and pesticide data for bottom-sediment samples (ORGBM table) were obtained from the NWIS data base. All chemical analyses made from 1986 to the date of the final retrieval were obtained from lists of unique site-identification numbers for the data-collection sites.
Inorganic-chemical data for bottom sediment (INORGBM) were obtained from Severson and others (1987), Harms and others (1990) and Stewart and others (1992). Although the data are stored in USGS data bases, it was impractical to transfer some of the data electronically. ASCII data files were created from tables in the two earlier reports by scanning the pub-lished data and applying optical-character-recognition software to the resulting files. Data from Stewart and others (1992) were uploaded directly from the floppy
disk provided with the report. Some unpublished USGS data (R.C. Severson, U.S. Geological Survey, written commun., 1994) provided directly to the authors as ASCII files on floppy disk were imported into P-STAT files.
Biological Tables
Chemical data for biological samples (INORG-BIO and ORGBIO tables) were obtained directly from the analytical-laboratory data sheets and entered into a spreadsheet on a PC. Although much of the data were available in PC-based spreadsheets and data bases at individual U.S. Fish and Wildlife Service (USFWS) field offices, obtaining the data from analytical-labora-tory data sheets expedited importing the data into the Ingres data base and subsequent quality assurance of the data. Because the order of analyses and variables in data from the USFWS field offices did not match the order on the laboratory data sheets, data transfer and quality assurance were slow. Converting the field spreadsheets and data bases to a consistent format for input into the NIWQP data base was particularly labor intensive.
MANIPULATION OF DATA
After chemical data for water, bottom sediment, and biota were gathered from the various sources, they were manipulated on the USGS Prime minicomputer using P-STAT software. Data manipulation involved organizing the attributes, correcting errors in the NIWQP data, and preparing the data for creation of the Ingres data base. Duplicate analyses or empty records retrieved from the NWIS data base were deleted from the NIWQP data base.
Attributes were added to the data base, given descriptive names, and ordered. Variables added to the data base included those describing the data-collection sites (attributes “area,” “sub_area,” “source,” “back-ground”) and those describing individual analyses (“doi,” “qaqc”). Chemical attributes in the NWIS data base are identified only by nondescriptive numbers called parameter codes; in the NIWQP data base, all attributes are identified by descriptive names and are ordered by name and grouped by type (trace elements, isotopes, pesticides, etc.).
8 National Irrigation Water Quality Program Data-Synthesis Data Base

In the NWIS data base, analytes from different matrices can be combined under one analysis. For example, pesticides in bottom sediment can be in the same analysis as trace elements in water. For the NIWQP data base, analyses that combined analytes from different matrices were manipulated so that each record represents only one matrix.
In the NWIS data base, some replicate analyses are not identified as being quality-assurance samples. Instead, sample times were used to differentiate repli-cate quality-assurance samples. Some analyses in the NWIS data base contain some values that represent duplicates and some that do not. For the NIWQP data base, when duplicate or triplicate sets of analyses were identified, the first analysis in time was classified as the environmental sample and the others as quality-assur-ance samples. Analytes that were not replicated in both samples were moved from the quality-assurance sam-ple to the environmental sample in the NIWQP data base.
SQL command files were written to create Ingres tables and read ASCII data files to populate them.
DATA-BASE QUALITY-ASSURANCE PROCEDURES
The NIWQP data base was checked carefully to assure that all analyses in the published reports (table 1) were included in the data base. Data also were checked to ensure that retrieval and manipulation of the data had not introduced errors, especially systematic errors. In one case, for example, data manipulation had resulted in the loss of “<” symbols. Errors discovered during quality assurance were investigated and cor-rected. The causes of systematic errors were identified and eliminated, and all affected analyses rechecked and corrected if needed.
As part of the quality-assurance procedures, NIWQP data values also were checked to ensure that they matched published values. If errors so identified were small and within a few percent of each other, the values in the NIWQP data base were corrected to match the values in the NWIS data base, the USGS data reports, and the USFWS analytical-laboratory data sheets. For larger differences, the senior author of the published data report (table 1) was contacted and the reasons for the discrepancy were investigated. For the NIWQP data base, all differences between published data reports and the source data bases were considered
to be the result of transcription error or typographic errors introduced during subsequent word processing. In cases where the NWIS data base was in error, the value in the NWIS data base was corrected. It was the responsibility of the authors of the individual study-area reports and the analytical laboratories to update the NWIS data base as well as the data reports if errors were found.
Water Data
For each NIWQP study area, 20 percent of the water-quality analyses were verified completely against the published data reports. For a given area, every fifth analysis was selected systematically for verification. All data in the NIWQP data base for the selected analyses were compared with the correspond-ing published values.
Not all data collected during the NIWQP investi-gations were published, and therefore some of the data in the NIWQP data base could not be checked against published reports. Examples of unpublished data include some analytical results in which all the values were less than the analytical reporting limit. Addition-ally, some field values for water samples were not pub-lished if the principal reason for the site visit was collection of bottom sediment.
Agreement between data in the NWIS and NIWQP data bases and the published reports is very good. For example, when more than 2,000 individual data values from analyses of 93 samples from the Still-water Wildlife Management Area (Nevada) were checked, only 5 discrepancies were found. In the San Juan River area (New Mexico), only 1 discrepancy was found in more than 400 individual values for 11 sam-ples. The reason for the good match is probably that, for most of the published data reports, the water-quality tables were essentially data dumps from NWIS that received only minimal word processing. Many of the discrepancies were related to word-processing errors and insufficient verification. For example, the negative sign in δD and δ18O values had been converted to “<” symbols in one of the data reports on the Kendrick Rec-lamation Project (Wyoming).
DATA-BASE QUALITY-ASSURANCE PROCEDURES 9
Bottom-Sediment Data
Because relatively few analyses of bottom sedi-ment were done, all values for selenium, arsenic, and molybdenum in the <0.062 fraction were checked against published values. In addition, all constituents were checked in two randomly chosen analyses from each study area. If these checks revealed a dispropor-tionately high number of errors in a study area then all values for all analyses from that study area were checked.
In a small number of cases, values in the NIWQP data base and reports from the analytical laboratory did not match values in the later published NIWQP reports. In these cases, values from the reports from the analyt-ical laboratory were used. Tables in those reports were considered more reliable than those in the NIWQP reports because they are essentially data dumps from the USGS analytical-laboratory data base. Usually the errors were minor and involved differences in rounding or missing “<” symbols. In one case, however, signifi-cant errors were found in a published source: The values for several elements were scrambled during word processing of the San Juan River area (NewMexico) report (Blanchard and others, 1993).
Biological Data
As discussed in the section “Biological Tables,” the biological data in the NIWQP data base were retrieved from the original laboratory reports. Those reports were checked for agreement with published data reports (table 1), for accuracy of wet-weight to dry-weight conversions, for sampling dates (if not reported in published reports), and, in some cases, to verify the taxonomic identification of individual sam-ples. After data from each original laboratory report were entered into the master spreadsheet and made to conform to uniform conventions for data rounding and the reporting of values below detection limits, each analytical value was verified individually for keypad-entry errors by other members of the data-entry team. Thus, each datum entry ultimately was reviewed for accuracy by no fewer than three people.
DISSEMINATION
The NIWQP data base is static and is not being updated as new results from ongoing NIWQP investi-gations become available. The data base is available as a set of Microsoft Access files and as a set of SQL commands and associated ASCII data files from the NIWQP home-page on the World Wide Web <http://www.usbr.gov/niwqp>.
REFERENCES CITED
Bartolino, J.R., Garrabrant, L.A., Wilson, Mark, and Lusk, J.D., 1996, Reconnaissance investigation of water qual-ity, bottom sediment, and biota associated with irriga-tion drainage in the Vermejo Project area and the Maxwell National Wildlife Refuge, Colfax County, northeastern New Mexico, 1993: U.S. Geological Sur-vey Water-Resources Investigations Report 96-4157, 89 p.
Blanchard, P.J., Roy, R.R., and O'Brien, T.F., 1993, Recon-naissance investigation of water quality, bottom sedi-ment, and biota associated with irrigation drainage in the San Juan River area, San Juan County, northwestern New Mexico, 1990–91: U.S. Geological Survey Water-Resources Investigations Report 93-4065, 141 p.
Butler, D.L., Kreuger, R.P., Campbell-Osmundson, Barbara, and Jenson, E.G., 1995, Reconnaissance investigation of water quality, bottom sediment, and biota associated with irrigation drainage in the Dolores Project area, southwestern Colorado and southeastern Utah, 1990–91: U.S. Geological Survey Water-Resources Investi-gations Report 94-4041, 126 p.
Butler, D.L., Krueger, R.P., Osmundson, B.C., Thompson, A.L., Formea, J.J., and Wickman, D.W., 1993, Recon-naissance investigation of water quality, bottom sedi-ment, and biota associated with irrigation drainage in the Pine River Project area, southern Ute Indian Reser-vation, southwestern Colorado and northwestern New Mexico, 1988–89: U.S. Geological Survey Water-Resources Investigations Report 92-4188, 105 p.
10 National Irrigation Water Quality Program Data-Synthesis Data Base

Butler, D.L., Krueger, R.P., Osmundson, B.C., Thompson, A.L., and McCall, S.K., 1991, Reconnaissance investi-gation of water quality, bottom sediment and biota associated with irrigation drainage in the Gunnison and Uncompahgre River Basins and at Sweitzer Lake, west-central Colorado, 1988–89: U.S. Geological Survey Water-Resources Investigations Report 91-4103, 99 p.
Butler, D.L., Wright, W.G., Hahn, D.A., Krueger, R.P., and Osmundson, B.C., 1994, Physical, chemical, and bio-logical data for detailed study of irrigation drainage in the Uncompahgre Project area and in the Grand Valley, west-central Colorado, 1991–92: U.S. GeologicalSurvey Open-File Report 94-110, 146 p.
Dileanis, P.D., Sorenson, S.K., Schwarzbach, S.E., and Maurer, T.C., 1992, Reconnaissance investigation of water quality, bottom sediment, and biota associated with irrigation drainage in the Sacramento National Wildlife Refuge Complex, California, 1988–89: U.S. Geological Survey Water-Resources Investigations Report 92-4036, 79 p.
Embry, S.S., and Block, E.K., 1995, Reconnaissance inves-tigation of water quality, bottom sediment, and biota associated with irrigation drainage in the Columbia Basin Project, Washington, 1991–92: U.S. Geological Survey Water-Resources Investigations Report 95-4007, 144 p.
Farnsworth, R.K., Thompson, E.S., and Peck, E.L., 1982, Evaporation atlas for the contiguous 48 United States: National Oceanic and Atmospheric Administration Technical Report NWS 33, 26 p., 4 sheets, scale 1:5,000,000.
Greene, E.A., Sowards, C.L., and Hansmann, E.W., 1990, Reconnaissance investigation of water quality, bottom sediment, and biota associated with irrigation drainage in the Angostura Reclamation Unit, southwestern South Dakota, 1988–89: U.S. Geological Survey Water-Resources Investigations Report 90-4152, 75 p.
Hallock, R.J., and Hallock, L.L., eds., 1993, Detailed study of irrigation drainage in and near wildlife management areas, west-central Nevada, 1987–90—Part B, Effect on biota in Stillwater and Fernley Wildlife Manage-ment Areas and other nearby wetlands: U.S. Geological Survey Water-Resources Investigations Report 92-4024-B, 84 p.
Harms, T.F., Stewart, K.C., Briggs, P.H., Hageman, P.L., and Papp, C.S.E., 1990, Chemical results for bottom material for Department of the Interior irrigation drain-age task group studies, 1988–89: U.S. Geological Sur-vey Open-File Report 90-50, 47 p.
Hoffman, R.J., 1994, Detailed study of irrigation drainage in and near wildlife management areas, west-central Nevada, 1987–90—Part C, Summary of irrigation-drainage effects on water quality, bottom sediment, and biota: U.S. Geological Survey Water-Resources Investigations Report 92-4024-C, 32 p.
Hoffman, R.J., Hallock, R.J., Rowe, T.G., Lico, M.S., Burge, H.L., and Thompson, S.P., 1990, Reconnaissance investigation of water quality, bottom sediment, and biota associated with irrigation drainage in and near Stillwater Wildlife Management Area, Churchill County, Nevada, 1986–87: U.S. Geological Survey Water-Resources Investigations Report 89-4105, 150 p.
King, P.B., and Beikman, H.M., 1974, comps., Geologic map of the United States (exclusive of Alaska and Hawaii): U.S. Geological Survey, three sheets, scale 1:2,500,000.
Knapton, J.R., Jones, W.E., and Sutphin, J.W., 1988, Recon-naissance investigation of water quality, bottom sedi-ment, and biota associated with irrigation drainage in the Sun River area, west-central Montana, 1986–87: U.S. Geological Survey Water-Resources Investiga-tions Report 87-4244, 78 p.
Lambing, J.H., Jones, W.E., and Sutphin, J.W., 1988, Recon-naissance investigation of water quality, bottom sedi-ment, and biota associated with irrigation drainage in the Bowdoin National Wildlife Refuge and adjacent areas of the Milk River Basin, northeastern Montana, 1986–87: U.S. Geological Survey Water-Resources Investigations Report 87-4243, 71 p.
Lambing, J.H., Nimick, D.A., Knapton, J.R., and Palawski, D.U., 1994, Physical, chemical, and biological data for detailed study of the Sun River Irrigation Project, Free-zout Lake Wildlife Management Area, and Benton Lake National Wildlife Refuge, west-central Montana, 1990–92, with selected data for 1987–89: U.S. Geolog-ical Survey Open-File Report 94-120, 171 p.
Lico, M.S., 1992, Detailed study of irrigation drainage in and near wildlife management areas, west-central Nevada, 1987–90—Part A, Water quality, sediment composi-tion, and hydrogeochemical processes in Stillwater and Fernley Wildlife Management Areas: U.S. Geological Survey Water-Resources Investigations Report 92-4024-A, 65 p.
Low, W.H., and Mullins, W.H., 1990, Reconnaissance investigations of water quality, bottom sediment, and biota associated with irrigation drainage in the American Falls Reservoir area, Idaho, 1988–89: U.S. Geological Survey Water-Resources Investigations Report 90-4120, 78 p.
REFERENCES CITED 11

MacCoy, D.E., 1994, Physical, chemical, and biological data for detailed study of irrigation drainage in the Klamath Basin, California and Oregon, 1990–92: U.S. Geologi-cal Survey Open-File Report 93-497, 168 p.
Mueller, D.K., DeWeese, L.R., Garner, A.J., and Spruill, T.B., 1991, Reconnaissance investigation of water quality, bottom sediment, and biota associated withirrigation drainage in the Middle Arkansas River Basin, Colorado and Kansas, 1988–89: U.S. Geological Survey Water-Resources Investigations Report 91-4060, 84 p.
National Research Council, 1991, Interim report—Review of the National Irrigation Water Quality Program: Washington, D.C., National Research Council, 22 p.
Ong, Kim, O'Brien, T.F., and Rucker, M.D., 1992, Recon-naissance investigation of water quality, bottom sedi-ment, and biota associated with irrigation drainage in the middle Rio Grande valley and Bosque del Apache National Wildlife Refuge, New Mexico, 1988–89: U.S. Geological Survey Water-Resources Investigations Report 91-4036, 113 p.
Peltz, L.A., and Waddell, Bruce, 1991, Physical, chemical, and biological data for detailed study of irrigation drainage in the middle Green River Basin, Utah, 1988–89, with selected data for 1982–87: U.S. Geological Survey Open-File Report 91-530, 213 p.
Peterson, D.A., Harms, T.F., Ramirez, P., Jr., Allen, G.T., and Christenson, A.H., 1991, Reconnaissance investi-gation of water quality, bottom sediment, and biota associated with irrigation drainage in the Riverton Rec-lamation Project, Wyoming, 1988–89: U.S. Geological Survey Water-Resources Investigations Report 90-4187, 84 p.
Peterson, D.A., Jones, W.E., and Morton, A.G., 1988, Reconnaissance investigation of water quality, bottom sediment, and biota associated with irrigation drainage in the Kendrick Reclamation Project area, Wyoming, 1986–87: U.S. Geological Survey Water-Resources Investigations Report 87-4255, 57 p.
P-Stat Inc., 1990, P-Stat user’s manual: Princeton, New Jersey, P-Stat Inc., 1405 p.
Radtke, D.B., Kepner, W.G., and Effertz, R.J., 1988, Recon-naissance investigation of water quality, bottom sedi-ment, and biota associated with irrigation drainage in the lower Colorado River valley, Arizona, California, and Nevada, 1986–87: U.S. Geological Survey Water-Resources Investigations Report 88-4002, 77 p.
Rinella, F.A., Mullins, W.H., and Schuler, C.A., 1994, Reconnaissance investigation of water quality, bottom sediment, and biota associated with irrigation drainage in the Owyhee and Vale Projects, Oregon and Idaho, 1990–91: U.S. Geological Survey Water-Resources Investigations Report 93-4156, 101 p.
Rinella, F.A., and Schuler, C.A., 1992, Reconnaissance investigation of water quality, bottom sediment, and biota associated with irrigation drainage in the Malheur National Wildlife Refuge, Harney County, Oregon, 1988–89: U.S. Geological Survey Water-Resources Investigations Report 91-4085, 106 p.
Roddy, W.R., Greene, E.A., and Sowards, C.L., 1991, Reconnaissance investigation of water quality, bottom sediment, and biota associated with irrigation drainage in the Bell Fourche Reclamation Project, western South Dakota, 1988–89: U.S. Geological Survey Water-Resources Investigations Report 90-4192, 113 p.
Rowe, T.G., Lico, M.S., Hallock, R.J., Maest, A.S., and Hoffman, R.J., 1991, Physical, chemical, and biological data for detailed study of irrigation drainage in and near Stillwater, Fernley, and Humboldt Wildlife Manage-ment Areas and Carson Lake, west-central Nevada, 1987–89: U.S. Geological Survey Open-File Report 91-185, 199 p.
Schroeder, R.A., Palawski, D.U., and Skorupa, J.P., 1988, Reconnaissance investigation of water quality, bottom sediment, and biota associated with irrigation drainage in the Tulare Lake Bed area, southern San Joaquin Valley, California, 1986–87: U.S. Geological Survey Water-Resources Investigations Report 88-4001, 86 p.
Schroeder, R.A., Rivera, Mick, and others, 1993, Physical, chemical, and biological data for detailed study ofirrigation drainage in the Salton Sea area, California, 1988–90: U.S. Geological Survey Open-File Report 93-83, 179 p.
See, R.B., Naftz, D.L., Peterson, D.A., Crock, J.G., Erdman, J.A., Severson, R.C., Ramirez, P., Jr., and Armstrong, J.A., 1992, Detailed study of selenium in soil, represen-tative plants, water, bottom sediment, and biota in the Kendrick Reclamation Project area, Wyoming, 1988–90: U.S. Geological Survey Water-Resources Investi-gations Report 91-4131, 142 p.
See, R.B., Peterson, D.A., and Ramirez, P., Jr., 1992, Physi-cal, chemical, and biological data for detailed study of irrigation drainage in the Kendrick Reclamation Project area, Wyoming, 1988–90: U.S. Geological Survey Open-File Report 91-533, 272 p.
12 National Irrigation Water Quality Program Data-Synthesis Data Base

Seiler, R.L., Ekechukwu, G.A., and Hallock, R.J., 1993, Reconnaissance investigation of water quality, bottom sediment, and biota associated with irrigation drainage in and near Humboldt Wildlife Management Area, Churchill and Pershing Counties, Nevada, 1990–91: U.S. Geological Survey Water-Resources Investiga-tions Report 93-4072, 115 p.
Setmire, J.G., Wolfe, J.C., and Stroud, R.K., 1990, Recon-naissance investigation of water quality, bottom sedi-ment, and biota associated with irrigation drainage in the Salton Sea area, California, 1986–87: U.S. Geolog-ical Survey Water-Resources Investigations Report 89-4102, 68 p.
Severson, R.C., Wilson, S.A., and McNeal, J.M., 1987, Analysis of bottom material collected at nine areas in the Western United States for the DOI irrigation task group: U.S. Geological Survey Open-File Report 87-490, 24 p.
Sorenson, S.K., and Schwarzbach, S.E., 1991, Reconnais-sance investigation of water quality, bottom sediment, and biota associated with irrigation drainage in the Klamath Basin, California and Oregon, 1988–89: U.S. Geological Survey Water-Resources Investigations Report 90-4203, 64 p.
Stephens, D.W., Waddell, Bruce, and Miller, J.B., 1988, Reconnaissance investigation of water quality, bottom sediment, and biota associated with irrigation drainage in the middle Green River Basin, Utah, 1986–87: U.S. Geological Survey Water-Resources Investigations Report 88-4011, 70 p.
Stephens, D.W., Waddell, Bruce, Peltz, L.A., and Miller, J.B., 1992, Detailed study of selenium and selectedelements in water, bottom sediment, and biota associ-ated with irrigation drainage in the middle Green River Basin, Utah, 1988–90: U.S. Geological Survey Water-Resources Investigations Report 92-4084, 164 p.
Stewart, K.C., Fey, D.L., Hageman, P.L., Kennedy, K.R., Love, A.H., McGregor, R.E., Papp, C.S.E., Peacock, T.R., Sharkey, J.D., Vaughn, R.B., and Welsch, E.P., 1992, Results of chemical analysis for sediments from Department of the Interior National Irrigation Water Quality Program studies, 1988–1990: U.S. Geological Survey Open-File Report 92-443, 38 p.
Sylvester, M.A., Deason, J.P., Feltz, H.R., and Engberg, R.A., 1988, Preliminary results of the Department of the Interior’s irrigation-drainage studies, in Hay, D.R., ed., Planning now for irrigation and drainage in the 21st Century—Proceedings of the American Society of Civil Engineers Irrigation Division meeting, July 18–21, 1988, Lincoln, Neb.: New York, N.Y., American Society of Civil Engineers, p. 665–677.
Wells, F.C., Jackson, G.A., and Rogers, W.J., 1988, Recon-naissance investigation of water quality, bottom sedi-ment, and biota associated with irrigation drainage in the lower Rio Grande valley and Laguna Atascosa National Wildlife Refuge, Texas, 1986–87: U.S. Geo-logical Survey Water-Resources Investigations Report 87-4277, 89 p.
REFERENCES CITED 13

14 National Irrigation Water Quality Program Data-Synthesis Data Base

REFERENCES CITED 15
APPENDICES

16
APPENDIX A. Data dictionary for National Irrigation Water Quality Program data base
[Acceptable codes for fixed-value attributes are explained in appendix B. Char, fixed-length character string of 1 to 2,000 characters; date, formatted-date data type; ddd–mm–ss, degrees–minutes–seconds longitude f-day (24-hour clock) format; integer, 4-byte ter Information System; smallint, 2-byte
)
ource materials
n
study area covered by that report. If gation reports, both names are used and
a
t)mat)
AP
PE
ND
IX A
format; dd–mm–ss, degrees–minutes–seconds latitude format; dd–mmm–yy, day–month–year date format; float, floating-point data type; hhmm, hour–minute time-ointeger data type; mmdd, month–day date format; mm/dd/yy, month/day/year date format; NIWQP, National Irrigation Water Quality Program; NWIS, National Wainteger data type; varchar, varying-length character string of 1 to 2,000 characters. —, not applicable]
Attribute name
Attribute characteristics NWISparameter
codeAttribute description
LinkingFixedvalue
Datatype
Fieldlength
AREA table (stores data on regional study areas)
area • • Varchar 10 — Abbreviated name identifying NIWQP study areasub_area • • Varchar 10 — Abbreviated name identifying subarea within NIWQP study areabasin_size Float 4 — Size of contributing drainage basin, in square miles
fwse Float 4 — Range of free-water-surface evaporation, in inches (Farnsworth and others, 1982avgfwse Float 4 — Average free-water-surface evaporation, in inches (Farnsworth and others, 1982)
avgprecip Float 4 — Average annual precipitation (middle of precip attribute), in inchesprecip Varchar 10 — Range of precipitation given in NIQWP report (table 1), in inchesyrprecip Float 4 — Precipitation during year of data collection, in inches
geology • Char 25 — Geologic units in study area (King and Beikman, 1974)mining • Char 1 — Whether mining occurs in study arease_source Char 40 — Specific geologic information given in NIWQP reports (table 1) about selenium s
basin • Char 1 — Whether lakes in basin are terminal or flowthroughdrains Char 1 — Whether drains are buried or open
crop Varchar 11 — Principal irrigated crop in study areairr_acres Float 4 — Amount of irrigated land within area or subarea, in acresirr_end Char 4 — Typical month and day irrigation ends, in mmdd formatirr_start Char 4 — Typical month and day irrigation begins, in mmdd formatpesticides • Char 1 — Whether pesticides are in heavy use in area
remarks Varchar 36 — Comments about study area
SITE table (stores data on sample-collection sites)
site_id • Varchar 15 — Unique 9- or 15-digit identifying number assigned on basis of geographic locatioarea • • Varchar 10 — Abbreviated name identifying NIWQP study areasub_area • • Varchar 10 — Abbreviated name identifying subarea within NIWQP study areasite_name Varchar 51 — Descriptive name of data-collection sitesite Varchar 9 — Identifying name or number used in published report (table 1) and unique within
different names for same site were used in reconnaissance- and detailed-investiidentifier from reconnaissance report is enclosed in parentheses.
site_type • Varchar 2 — Whether site is surface-water, ground-water, or other type of site
background • Char 1 — Whether site is upgradient or downgradient from effects of irrigation in study aresource • Char 1 — Whether site represents source water for irrigation in study area
latitude Char 6 — Latitude of data-collection site, in degrees, minutes, and seconds (ddmmss formalongitude Char 7 — Longitude of data-collection site, in degrees, minutes, and seconds (dddmmss foraltitude Float 4 — Altitude of data-collection site, in feet
drain_area Float 4 — Drainage area of surface-water data-collection site, in square mileswell_depth Float 4 — Well depth of ground-water data-collection site, in feet below land surfacesitegeology • Char 5 — Generalized geology at sampling sitesitefwse Float 4 — Free-water-surface evaporation rate at site, in inchesdistance Float 4 — Distance of sample collection in stream cross section from left bank, in feet
AP
PE
ND
IX A
17
FIELD table (stores data on field conditions at sample-collection sites during field visits)
site_id • Varchar 15 — Unique 9- or 15-digit identifying number assigned on basis of geographic locationsamp_date • Date — — Date of sample collection (dd–mmm–yy format)
s
samp_time • Integer 2 — Time of sample collection (hhmm format)matrix • • Char 2 — Sample matrix
qaqc • Char 1 — Whether purpose of sample collection was quality assurancedoi • Char 1 — Whether analysis was made as part of NIWQP investigationrecno Varchar 8 — U.S. Geological Survey identifer used for sample in NWIS data basesamp_meth • Integer 2 — Sample-collection methodagyanal • Integer 4 — Analyzing agencyagycol • Integer 4 — Collecting agencydepth_samp Float 4 — Depth of sample collection below water surface, in feetdistance Float 4 — Distance of sample collection in stream cross section from left bank, in feet
wtr_level Float 4 — Ground-water level below water surface, in feetq Float 4 00061 Discharge, instantaneous, stream, in cubic feet per secondntu Float 4 00076 Turbidity, in nephelometer turbidity units
airt Float 4 00020 Temperature, air, in degrees Celsiustemp Float 4 00010 Temperature, water, in degrees Celsius
dox Float 4 00300 Oxygen, dissolved, in milligrams per literdoxpct Integer 2 00301 Oxygen, dissolved, in percent saturation
baro_p Integer 2 00025 Barometric pressure, in millimeters of mercury
cond Integer 4 00094 Specific conductance, field, in microsiemens per centimeter at 25 degrees Celsiuscond_lab Integer 4 90095 Specific conductance, laboratory, in microsiemens per centimeter at 25 degrees Celsiu
ph Float 4 00400 pH, whole water, field, in standard unitsph_lab Float 4 00403 pH, whole water, laboratory, in standard units
redox Float 4 00090 Oxidation–reduction potential, in millivolts
sulfide Float 4 00745 Sulfide, total, as S, in milligrams per liter
INORG table (stores data on inorganic constituents in water samples)
site_id • Varchar 15 — Unique 9- or 15-digit identifying number assigned on basis of geographic locationsamp_date • Date — — Date of sample collection (dd–mmm–yy format)samp_time • Integer 2 — Time of sample collection (hhmm format)matrix • • Char 2 — Sample matrix
hardness Float 4 00900 Hardness, as CaCO3, total, in milligrams per literca Float 4 00915 Calcium, dissolved, as Ca, in milligrams per literca_t Float 4 00916 Calcium, total, recoverable, as Ca, in milligrams per litermg Float 4 00925 Magnesium, dissolved, as Mg, in milligrams per litermg_t Float 4 00927 Magnesium, total, as Mg, in milligrams per literna Float 4 00930 Sodium, dissolved, as Na, in milligrams per literna_t Float 4 00929 Sodium, total, recoverable, as Na, in milligrams per litersar Float 4 00931 Sodium adsorption ratiok Float 4 00935 Potassium, dissolved, as K, in milligrams per literk_t Float 4 00937 Potassium, total, as K, in milligrams per liter

18A
PP
EN
DIX
A
se—Continued
tion
iterlligrams per liter in milligrams per literr liter
s per liter, as CaCO3, in milligrams per literams per liter
ms per literrams per liter per literiterigrams per literilligrams per literams per literer liter
ter
ligrams per litern milligrams per liter
APPENDIX A. Data dictionary for National Irrigation Water Quality Program data ba
Attribute name
Attribute characteristics NWISparameter
codeAttribute descrip
LinkingFixedvalue
Datatype
Fieldlength
INORG table (stores data on inorganic constituents in water samples)—Continued
alk Float 4 00410 Alkalinity, titration to pH 4.5, field, as CaCO3, in milligrams per lalk_co3_it Float 4 99430 Alkalinity, carbonate, incremental titration, field, as CaCO3, in mialk_dis_it Float 4 39086 Alkalinity, total, dissolved, incremental titration, field, as CaCO3,alk_it Float 4 00419 Alkalinity, incremental titration, field, as CaCO3, in milligrams pealk_lab Float 4 90410 Alkalinity, titration to pH 4.5, laboratory, as CaCO3, in milligramalk_ww_fe Float 4 00417 Alkalinity, water, whole, total, fixed-endpoint titration, laboratoryalk_ww_gt Float 4 29813 Alkalinity, water, whole, gran titration, field, as CaCO3, in milligr
co3 Float 4 00445 Carbonate, total, fixed-endpoint titration, field, as CO3, in milligraco3_ft Float 4 00452 Carbonate, dissolved, incremental titration, field, as CO3, in milligco3_it Float 4 00447 Carbonate, total, incremental titration, field, as CO3, in milligramsco3_it_2 Float 4 99445 Carbonate, incremental titration, field, as CO3, in milligrams per lhco3 Float 4 00440 Bicarbonate, total, fixed-endpoint titration, field, as HCO3, in millhco3_ft Float 4 00453 Bicarbonate, dissolved, incremental titration, field, as HCO3, in mhco3_it Float 4 00450 Bicarbonate, total, incremental titration, field, as HCO3, in milligrhco3_it_2 Float 4 99440 Bicarbonate, incremental titration, field, as HCO3, in milligrams p
so4 Float 4 00945 Sulfate, dissolved, as SO4, in milligrams per literso4_unc Float 4 99890 Sulfate, water, dissolved, uncorrected, as SO4, in milligrams per licl Float 4 00940 Chloride, dissolved, as Cl, in milligrams per literf Float 4 00950 Fluoride, dissolved, as F, in milligrams per liter
si Float 4 00955 Silica, dissolved, as SiO2, in milligrams per liter
ds_sum Float 4 70301 Solids, sum of constituents, dissolved, in milligrams per literres105_t Float 4 00500 Solids, residue on evaporation at 105 degrees Celsius, total, in milres180 Float 4 70300 Solids, residue on evaporation at 180 degrees Celsius, dissolved, i
ag Float 4 01075 Silver, dissolved, as Ag, in micrograms per literag_t Float 4 01077 Silver, total, as Ag, in micrograms per literal Float 4 01106 Aluminum, dissolved, as Al, in micrograms per literal_t Float 4 01105 Aluminum, total, as Al, in micrograms per literars Float 4 01000 Arsenic, dissolved, as As, in micrograms per literars_t Float 4 01002 Arsenic, total, as As, in micrograms per liter
b Float 4 01020 Boron, dissolved, as B, in micrograms per literb_t Float 4 01022 Boron, total, as B, in micrograms per literba Float 4 01005 Barium, dissolved, as Ba, in micrograms per literba_t Float 4 01007 Barium, total, as Ba, in micrograms per literbe Float 4 01010 Beryllium, dissolved, as Be, in micrograms per literbe_t Float 4 01012 Beryllium, total, as Be, in micrograms per literbr Float 4 71870 Bromide, dissolved, as Br, in milligrams per liter
AP
PE
ND
IX A
19
cd Float 4 01025 Cadmium, dissolved, as Cd, in micrograms per litercd_t Float 4 01027 Cadmium, total, as Cd, in micrograms per literco Float 4 01035 Cobalt, dissolved, as Co, in micrograms per literco_t Float 4 01037 Cobalt, total, as Co, in micrograms per liter
cr Float 4 01030 Chromium, dissolved, as Cr, in micrograms per litercr_t Float 4 01034 Chromium, total, as Cr, in micrograms per litercr_hex Float 4 01032 Chromium, hexavalent, as Cr, in micrograms per litercu Float 4 01040 Copper, dissolved, as Cu, in micrograms per litercu_t Float 4 01042 Copper, total, as Cu, in micrograms per literfe Float 4 01046 Iron, dissolved, as Fe, in micrograms per literfe_t Float 4 01045 Iron, total, as Fe, in micrograms per liter
hg Float 4 71890 Mercury, dissolved, as Hg, in micrograms per literhg_t Float 4 71900 Mercury, total recoverable, as Hg, in micrograms per liter
i Float 4 71865 Iodide, dissolved, as I, in milligrams per liter
li Float 4 01130 Lithium, dissolved, as Li, in micrograms per literli_t Float 4 01132 Lithium, total, as Li, in micrograms per liter
mn Float 4 01056 Manganese, dissolved, as Mn, in micrograms per litermn_t Float 4 01055 Manganese, total, as Mn, in micrograms per litermo Float 4 01060 Molybdenum, dissolved, as Mo, in micrograms per litermo_t Float 4 01062 Molybdenum, total, as Mo, in micrograms per liter
ni Float 4 01065 Nickel, dissolved, as Ni, in micrograms per literni_t Float 4 01067 Nickel, total, as Ni, in micrograms per liter
pb Float 4 01049 Lead, dissolved, as Pb, in micrograms per literpb_t Float 4 01051 Lead, total, as Pb, in micrograms per liter
sb Float 4 01095 Antimony, dissolved, as Sb, in micrograms per litersb_t Float 4 01097 Antimony, total, as Sb, in micrograms per literse Float 4 01145 Selenium, dissolved, as Se, in micrograms per literse_t Float 4 01147 Selenium, total, as Se, in micrograms per litersr Float 4 01080 Strontium, dissolved, as Sr, in micrograms per litersr_t Float 4 01082 Strontium, total, as Sr, in micrograms per liter
tl Float 4 01057 Thallium, dissolved, as Tl, in micrograms per litertl_t Float 4 01059 Thallium, total, as Tl, in micrograms per liter
v Float 4 01085 Vanadium, dissolved, as V, in micrograms per liter
zn Float 4 01090 Zinc, dissolved, as Zn, in micrograms per literzn_t Float 4 01092 Zinc, total, as Zn, in micrograms per liter

20A
PP
EN
DIX
A
ued
ion
r
ter
rams per liter
rograms per liter
ion
iterer
APPENDIX A. Data dictionary for National Irrigation Water Quality Program data base—Contin
Attribute name
Attribute characteristics NWISparameter
codeAttribute description
LinkingFixedvalue
Datatype
Fieldlength
ISOTOPE table (stores data on inorganic isotopes in water samples)
site_id • Varchar 15 — Unique 9- or 15-digit identifying number assigned on basis of geographic locatsamp_date • Date — — Date of sample collection (dd–mmm–yy format)samp_time • Integer 2 — Time of sample collection (hhmm format)matrix • • Char 2 — Sample matrix
alpha_ugl Float 4 80030 Gross alpha radioactivity, dissolved, as natural U, in micrograms per literalpha_ugl_t Float 4 80040 Gross alpha radioactivity, total, suspended, as natural U, in micrograms per lite
beta_cs Float 4 03516 Gross beta radioactivity, suspended, as Cs-137, in picocuries per literbeta_sr Float 4 80050 Gross beta radioactivity, dissolved, as Sr/Y-90, in picocuries per liter
c13 Float 4 82081 Carbon-13/12 ratio, in permil
deut Float 4 82082 Hydrogen-2/1 ratio, in permil
k40 Float 4 82068 Potassium-40, dissolved, as K-40, in picocuries per liter
o18 Float 4 82085 Oxygen-18/16 ratio, in permil
ra_226_pcl Float 4 09511 Radium-226, dissolved, radon method, in picocuries per literra_226_plcht Float 4 09510 Radium-226, dissolved, planchet count, in picocuries per liter
radon_t Float 4 82303 Radon-222, total, in picocuries per literradon_t_2sig Float 4 76002 Radon-222, 2-sigma-precision estimate, water, whole, total, in picocuries per li
s34 Float 4 82086 Sulfur-34/32 ratio, in permil
trit Integer 2 07000 Tritium, total, in picocuries per litertrit_2sig Float 4 75985 Tritium, 2-sigma-precision estimate, water, whole, total, in picocuries per liter
u Float 4 22703 Uranium, natural, dissolved, as U, in micrograms per literu_2sig Float 4 75990 Uranium, natural, 2-sigma-precision estimate, water, dissolved, as U, in microgu_ext_ugl Float 4 80020 Uranium, dissolved, as U, extraction fluorometric, in micrograms per literu_t Float 4 28011 Uranium, natural, total, as U, in micrograms per literu_t_2sig Float 4 75993 Uranium, natural, 2-sigma-precision estimate, water, whole, total, as U, in mic
NUTRIENT table (stores data on nutrients in water samples)
site_id • Varchar 15 — Unique 9- or 15-digit identifying number assigned on basis of geographic locatsamp_date • Date — — Date of sample collection (dd–mmm–yy format)samp_time • Integer 2 — Time of sample collection (hhmm format)matrix • • Char 2 — Sample matrix
bod Float 4 00310 Oxygen demand, biochemical, 5-day, at 20 degrees Celsius, in milligrams per lcod Float 4 00340 Oxygen demand, chemical, 0.25 N potassium dichromate, in milligrams per lit
doc Float 4 00681 Carbon, organic, dissolved, as C, in milligrams per litertoc Float 4 00680 Carbon, organic, total, as C, in milligrams per liter
cn_d Float 4 00723 Cyanide, dissolved, as CN, in milligrams per litercn_t Float 4 00720 Cyanide, total, as CN, in milligrams per liter

AP
PE
ND
IX A
21
n Float 4 00602 Nitrogen, dissolved, as N, in milligrams per litern_tot Float 4 00600 Nitrogen, total, as N, in milligrams per liternitr_t Float 4 71887 Nitrogen, total, as NO3, in milligrams per literno2 Float 4 00613 Nitrogen, nitrite, dissolved, as N, in milligrams per liter
no2_t Float 4 00615 Nitrogen, nitrite, total, as N, in milligrams per literno2_no3 Float 4 00631 Nitrogen, nitrite plus nitrate, dissolved, as N, in milligrams per literno2_no3_t Float 4 00630 Nitrogen, nitrite plus nitrate, total, as N, in milligrams per litern_kjel Float 4 00625 Nitrogen, Kjeldahl (ammonia plus organic), total, as N, in milligrams per litern_org_t Float 4 00605 Nitrogen, organic, total, as N, in milligrams per liternh3 Float 4 00608 Nitrogen, ammonia, dissolved, as N, in miiligrams per liternh3_org Float 4 00623 Nitrogen, ammonia plus organic, dissolved, as N, in milligrams per liternh3_union Smallint 2 00619 Nitrogen, ammonia, un-ionized, as N, in milligrams per liternh3_nh4 Float 4 00610 Nitrogen, ammonia, and ammonium, total, as N, in milligrams per liternh4_nh4 Float 4 71846 Nitrogen, ammonia, dissolved, as NH4, in milligrams per literp Float 4 00666 Phosphorus, dissolved, as P, in milligrams per literp_t Float 4 00665 Phosphorus, total, as P, in milligrams per literphos_t Float 4 71886 Phosphorus, total, as PO4, in milligrams per literpo4 Float 4 00671 Phosphorus, orthophosphate, dissolved, as P, in milligrams per literp_hyd Float 4 00677 Phosphorus, hydrolyzable plus orthophosphate, dissolved, as P, in milligrams per literp_ortho Float 4 70507 Phosphorus, orthophosphate, total, as P, in milligrams per liter
ORG table (stores data on organic chemicals in water samples)
site_id • Varchar 15 — Unique 9- or 15-digit identifying number assigned on basis of geographic locationsamp_date • Date — — Date of sample collection (dd–mmm–yy format)samp_time • Integer 2 — Time of sample collection (hhmm format)matrix • • Char 2 — Sample matrix
acenaphthene Float 4 34205 Acenaphthene, total, in micrograms per literacenaphthylene Float 4 34200 Acenaphthylene, total, in micrograms per literalachlor Float 4 77825 Alachlor, total recoverable, in micrograms per literaldrin Float 4 39330 Aldrin, total, in micrograms per literametryne Float 4 82184 Ametryne, total, in micrograms per literanthracene Float 4 34220 Anthracene, total, in micrograms per literatrazine Float 4 39630 Atrazine, total, in micrograms per liter
b2ethxphth Float 4 39100 Bis(2-ethylhexyl) phthalate, total, in micrograms per literbenzanthra Float 4 34526 Benzo(a)anthracene, total, in micrograms per literbenzapyrene Float 4 34247 Benzo(a)pyrene, total, in micrograms per literbenzbfluorant Float 4 34230 Benzo(b)fluoranthene, total, in micrograms per literbenzkfluorant Float 4 34242 Benzo(k)fluoranthene, total, in micrograms per literbenzperyln Float 4 34521 Benzo(g,h,i)perylene, total, in micrograms per literbis2chlorethox Float 4 34278 Bis(2-chloroethoxy) methane, total, in micrograms per literbis2chlorisopr Float 4 34283 Bis(2-chloroisopropyl) ether, total, in micrograms per literbis2chloroethy Float 4 34273 Bis(2-chloroethyl) ether, total, in micrograms per literbrphphethr Float 4 34636 4-Bromophenyl phenyl ether, total, in micrograms per liter
chlordane Float 4 39350 Chlordane, technical and met, total, in micrograms per literchrysene Float 4 34320 Chrysene, total, in micrograms per literclnaphthal Float 4 34581 2-Chloronaphthalene, total, in micrograms per literclphenol Float 4 34586 2-Chlorophenol, total, in micrograms per literclphnlphenethr Float 4 34641 4-Chlorophenyl phenyl ether, total, in micrograms per literclpyrifos_t Float 4 38932 Chlorpyrifos, total, recoverable, in micrograms per litercyanazine Float 4 81757 Cyanazine, total, in micrograms per litercyprazine_t Float 4 82187 Cyprazine total, in micrograms per liter
22A
PP
EN
DIX
A
ntinued
r
APPENDIX A. Data dictionary for National Irrigation Water Quality Program data base—Co
Attribute name
Attribute characteristics NWISparameter
codeAttribute description
LinkingFixedvalue
Datatype
Fieldlength
ORG table (stores data on organic chemicals in water samples)—Continued
d24 Float 4 39730 2,4-Dichlorophenoxyacetic acid, total, in micrograms per literddd Float 4 39360 Dichloro-diphenyl-dichloroethane (DDD), total, in micrograms per literdde Float 4 39365 Dichloro-diphenyl-dichloroethylene (DDE), total, in micrograms per literddt Float 4 39370 Dichloro-diphenyl-trichloroethane (DDT), total, in micrograms per literdef_t Float 4 39040 DEF (tributyl phosphorotrithioate), in micrograms per literdiazinon Float 4 39570 Diazinon, total, in micrograms per literdibenzanthr Float 4 34556 1,2,5,6-Dibenzanthracene, total, in micrograms per literdicamba_t Float 4 82052 Dicamba (Mediben, Banvel D), total, in micrograms per literdiclbenz12 Float 4 34536 1,2-Dichlorobenzene, total, in micrograms per literdiclbenz13 Float 4 34566 1,3-Dichlorobenzene, total, in micrograms per literdiclbenz14 Float 4 34571 1,4-Dichlorobenzene, total, in micrograms per literdiclphenol Float 4 34601 2,4-Dichlorophenol, total, in micrograms per literdieldrin Float 4 39380 Dieldrin, total, in micrograms per literdietpthlate Float 4 34336 Diethylphthalate, total, in micrograms per literdimephtlate Float 4 34341 Dimethylphthalate, total, in micrograms per literdimthphenl Float 4 34606 2,4-Dimethylphenol, total, in micrograms per literdinocresol Float 4 34657 4,6-Dinitro-orthocresol, total, in micrograms per literdinphenol Float 4 34616 2,4-Dinitrophenol, total, in micrograms per literdintolu24 Float 4 34611 2,4-Dinitrotoluene, total, in micrograms per literdintolu26 Float 4 34626 2,6-Dinitrotoluene, total, in micrograms per literdioctphthl Float 4 34596 Di-n-octyl phthalate, total, in micrograms per literdisyston_t Float 4 39011 Disyston (Disulfoton), total, in micrograms per literdnb_phtha Float 4 39110 Di-n-butyl phthalate, total, in micrograms per literdp_2_4 Float 4 82183 2,4-Dichlorprop, total, in micrograms per liter
endosulf Float 4 39388 Endosulfan, total, in micrograms per literendrin Float 4 39390 Endrin, total, in micrograms per literethion Float 4 39398 Ethion, total, in micrograms per liter
flranthene Float 4 34376 Fluoranthene, total, in micrograms per literfluorene Float 4 34381 Fluorene, total, in micrograms per literfonofos Float 4 82614 Fonofos (Dyfonate), water, whole, total recoverable, in micrograms per lite
guthion Float 4 39580 Guthion, total, in micrograms per liter
hcb Float 4 39700 Hexachlorobenzene, total, in micrograms per literheptchlr Float 4 39410 Heptachlor, total, in micrograms per literheptepox Float 4 39420 Heptachlor epoxide, total, in micrograms per literhexclbutdie Float 4 39702 Hexachlorobutadiene, total, in micrograms per literhexclcyclpd Float 4 34386 Hexachlorocyclopentadiene, total, in micrograms per literhexclethan Float 4 34396 Hexachloroethane, total, in micrograms per liter
ind_pyr Float 4 34403 Indeno(1,2,3-cd)pyrene, total, in micrograms per literisphrone Float 4 34408 Isophorone, total, in micrograms per liter
lindane Float 4 39340 Gamma-benzene hexachloride (lindane), total, in micrograms per liter

AP
PE
ND
IX A
23
malathion Float 4 39530 Malathion, total, in micrograms per litermbas Float 4 38260 Methylene blue active substances, in milligrams per litermethomyl Float 4 39051 Methomyl, total, in micrograms per litermethoxchlr Float 4 39480 Methoxychlor, total, in micrograms per liter
metolachlor Float 4 82612 Metolachlor, total recoverable, in micrograms per litermetribuzin Float 4 82611 Metribuzin, total recoverable, in micrograms per litermirex Float 4 39755 Mirex, total, in micrograms per litermparathion Float 4 39600 Methyl parathion, total, in micrograms per litermtrithion Float 4 39790 Methyl trithion, total, in micrograms per liternaphthalene Float 4 34696 Naphthalene, total, in micrograms per liternbb_phth Float 4 34292 N-Butylbenzyl phthlate, total, in micrograms per liternitrphenol4 Float 4 34646 4-Nitrophenol, total, in micrograms per liternsodimeth.t Float 4 34438 N-nitrosodimethylamine, total, in micrograms per liternsodiphenyl.t Float 4 34433 N-nitrosodiphenylamine, total, in micrograms per literntrobenzen Float 4 34447 Nitrobenzene, total, in micrograms per literntrphenol2 Float 4 34591 2-Nitrophenol, total, in micrograms per liter
parathion Float 4 39540 Parathion, total, in micrograms per literpcb Float 4 39516 Polychlorinated biphyenyls, total, in micrograms per literpclmcresol Float 4 34452 Parachlorometacresol, total, in micrograms per literpcn Float 4 39250 Naphthalenes, polychlorinated, total, in micrograms per literpcn_d Float 4 82360 Naphthalenes, polychlorinated, dissolved, in micrograms per literpcp Float 4 39032 Pentachlorophenol, total, in micrograms per literperthane Float 4 39034 Perthane, total, in micrograms per literphenol Float 4 34694 Phenol (C6H5OH), total, in micrograms per literphnanthren Float 4 34461 Phenanthrene, total, in micrograms per literphorate_t Float 4 39023 Phorate, total, in micrograms per literpicloram Float 4 39720 Picloram (Tordon, Amdon), total, in micrograms per literprometone Float 4 39056 Prometone, total, in micrograms per literprometryne Float 4 39057 Prometryne, total, in micrograms per literpropazine Float 4 39024 Propazine, total, in micrograms per literpropham Float 4 39052 Propham, total, in micrograms per literpyrene Float 4 34469 Pyrene, total, in micrograms per liter
sevin Float 4 39750 Sevin (Carbaryl), total, in micrograms per litersilvex Float 4 39760 Silvex, total, in micrograms per litersimazine Float 4 39055 Simazine, total, in micrograms per litersimetone_t Float 4 82188 Simetone, total, in micrograms per litersimetryne Float 4 39054 Simetryne, total, in micrograms per liter
t245 Float 4 39740 2,4,5-Trichlorophenoxyacetic acid, total, in micrograms per litertoxaphene Float 4 39400 Toxaphene, total, in micrograms per litertriclbenze Float 4 34551 1,2,4-Trichlorobenzene, total, in micrograms per litertriclphenl Float 4 34621 2,4,6-Trichlorophenol, total, in micrograms per litertrifluralin Float 4 39030 Trifluralin, total recoverable, in micrograms per litertrithion Float 4 39786 Trithion, total, in micrograms per liter

24A
PP
EN
DIX
A
ued
ion
in percent in percent in percent in percent in percent in percent in percent in percent in percentn percent
APPENDIX A. Data dictionary for National Irrigation Water Quality Program data base—Contin
Attribute name
Attribute characteristics NWISparameter
codeAttribute description
LinkingFixedvalue
Datatype
Fieldlength
SEDIMENT table (stores data on suspended sediment and bed material)
site_id • Varchar 15 — Unique 9- or 15-digit identifying number assigned on basis of geographic locatsamp_date • Date — — Date of sample collection (dd–mmm–yy format)samp_time • Integer 2 — Time of sample collection (hhmm format)matrix • • Char 2 — Sample matrix (water, bottom sediment, or biota)
res105_sus Float 4 00530 Solids, residue at 105 degrees Celsius, suspended, in milligrams per liter
beta_cs_sus Float 4 03516 Gross beta radioactivity, suspended, as Cs-137, in picocuries per literbeta_r_sus Float 4 80060 Gross beta radioactivity, suspended, total, as Sr/Y-90, in picocuries per liter
ag_sus Float 4 01076 Silver, suspended, as Ag, in micrograms per literas_t_sus Float 4 01001 Arsenic, suspended, total, as As, in micrograms per literba_rec_sus Float 4 01006 Barium, suspended, recoverable, as Ba, in micrograms per litercd_sus Float 4 01026 Cadmium, suspended, as Cd, in micrograms per litercr_sus Float 4 01031 Chromium, suspended, as Cr, in micrograms per literco_sus Float 4 01036 Cobalt, suspended, as Co, in micrograms per litercu_rec_sus Float 4 01041 Copper, suspended, recoverable, as Cu, in micrograms per literfe_rec_sus Float 4 01044 Iron, suspended, recoverable, as Fe, in micrograms per literhg_rec_sus Float 4 71895 Mercury, suspended, recoverable, as Hg , in micrograms per litermn_rec_sus Float 4 01054 Manganese, suspended, recoverable, as Mn, in micrograms per liternh3_org_sus Float 4 00624 Nitrogen, ammonia plus organic, suspended, total, as N, in milligrams per literpb_rec_sus Float 4 01050 Lead, suspended, recoverable, as Pb, in micrograms per literse_sus Float 4 01146 Selenium, suspended, total, as Se, in micrograms per litersoc Float 4 00689 Carbon, organic, suspended, as C, in milligrams per literzn_rec_sus Float 4 01091 Zinc, suspended, recoverable, as Zn, in micrograms per liter
bm_fdiam_002 Float 4 80294 Sediment, bed material, distilled-water fall diameter less than 0.002 millimeter,sbm_fdiam_004 Float 4 80157 Sediment, bed material, distilled-water fall diameter less than 0.004 millimeter,bm_fdiam_008 Float 4 80293 Sediment, bed material, distilled-water fall diameter less than 0.008 millimeter,bm_fdiam_016 Float 4 80282 Sediment, bed material, distilled-water fall diameter less than 0.016 millimeter,bm_fdiam_031 Float 4 80283 Sediment, bed material, distilled-water fall diameter less than 0.031 millimeter,sbm_fdiam_062 Float 4 80158 Sediment, bed material, distilled-water fall diameter less than 0.062 millimeter,sbm_fdiam_125 Float 4 80159 Sediment, bed material, distilled-water fall diameter less than 0.125 millimeter,sbm_fdiam_250 Float 4 80160 Sediment, bed material, distilled-water fall diameter less than 0.250 millimeter,sbm_fdiam_500 Float 4 80161 Sediment, bed material, distilled-water fall diameter less than 0.500 millimeter,sbm_fdiam_1 Float 4 80162 Sediment, bed material, distilled-water fall diameter less than 1.00 millimeter, i
sbm_sdiam_062 Float 4 80164 Sediment, bed material, sieve diameter less than 0.062 millimeter, in percentsbm_sdiam_125 Float 4 80165 Sediment, bed material, sieve diameter less than 0.125 millimeter, in percentsbm_sdiam_250 Float 4 80166 Sediment, bed material, sieve diameter less than 0.250 millimeter, in percentsbm_sdiam_500 Float 4 80167 Sediment, bed material, sieve diameter less than 0.500 millimeter, in percentsbm_sdiam_1 Float 4 80168 Sediment, bed material, sieve diameter less than 1.00 millimeter, in percentsbm_sdiam_2 Float 4 80169 Sediment, bed material, sieve diameter less than 2.00 millimeters, in percentsbm_sdiam_4 Float 4 80170 Sediment, bed material, sieve diameter less than 4.00 millimeters, in percentsbm_sdiam_8 Float 4 80171 Sediment, bed material, sieve diameter less than 8.00 millimeters, in percentsbm_sdiam_16 Float 4 80172 Sediment, bed material, sieve diameter less than 16.0 millimeters, in percentsbm_sdiam_32 Float 4 80173 Sediment, bed material, sieve diameter less than 32.0 millimeters, in percent

AP
PE
ND
IX A
25
sfdiam_002 Integer 2 70337 Sediment, suspended, distilled-water fall diameter less than 0.002 millimeter, in percentsfdiam_004 Integer 2 70338 Sediment, suspended, distilled-water fall diameter less than 0.004 millimeter, in percentsfdiam_008 Integer 2 70339 Sediment, suspended, distilled-water fall diameter less than 0.008 millimeter, in percentsfdiam_016 Integer 2 70340 Sediment, suspended, distilled-water fall diameter less than 0.016 millimeter, in percent
er liter
vered by report. If , both names are used and
sfdiam_031 Float 4 70341 Sediment, suspended, distilled-water fall diameter less than 0.031 millimeter, in percentsfdiam_062 Integer 2 70342 Sediment, suspended, distilled-water fall diameter less than 0.062 millimeter, in percentsfdiam_125 Integer 2 70343 Sediment, suspended, distilled-water fall diameter less than 0.125 millimeter, in percentsfdiam_250 Integer 2 70344 Sediment, suspended, distilled-water fall diameter less than 0.250 millimeter, in percentsfdiam_500 Integer 2 70345 Sediment, suspended, distilled-water fall diameter less than 0.500 millimeter, in percentsfdiam_1 Integer 2 70346 Sediment, suspended, distilled-water fall diameter less than 1.00 millimeter, in percentsfdiam_2 Float 4 70347 Sediment, suspended, distilled-water fall diameter less than 2.00 millimeters, in percent
ssdiam_lt062 Integer 2 70331 Sediment, suspended, sieve diameter less than 0.062 millimeter, in percentssdiam_lt125 Integer 2 70332 Sediment, suspended, sieve diameter less than 0.125 millimeter, in percentssdiam_lt250 Float 4 70333 Sediment, suspended, sieve diameter less than 0.250 millimeter, in percentssdiam_lt500 Float 4 70334 Sediment, suspended, sieve diameter less than 0.500 millimeter, in percentssdiam_lt1 Float 4 70335 Sediment, suspended, sieve diameter less than 1.00 millimeter, in percent
ss_conc_lt062 Float 4 80222 Sediment, suspended, concentration, sieve diameter less than 0.062 millimeter, in milligrams psed_t Float 4 80180 Sediment, total, concentration, in milligrams per litersed_q Float 4 80156 Sediment discharge, total, suspended plus bed material, in tons per daysus_sed Integer 2 80154 Sediment, suspended, concentration, in milligrams per litersus_sed_q Float 4 80155 Sediment discharge, suspended, in tons per day
INORGBM table (stores data on inorganic constituents in bottom material)
site_id • Varchar 15 — Unique 9- or 15-digit identifying number assigned on basis of geographic locationsamp_date • Date — — Date of sample collection (dd–mmm–yy format)matrix • • Char 2 — Sample matrixsite Varchar 9 — Identifying name or number used in published report (table 1) and unique within study area co
different names for same site were used in reconnaissance- and detailed-investigation reportsidentifier from reconnaissance report is enclosed in parentheses.
prime_id Varchar 8 — Laboratory identifier used in original U.S. Geological Survey data reports (table 1)qaqc • • Char 1 — Whether purpose of sample collection was quality assurancefraction • • Varchar 6 — Size-fraction of sample material
ag_bm Integer 2 — Silver, total, in bottom material, as Ag, in micrograms per gramal_bm Float 4 — Aluminum, total, in bottom material, as Al, in percentas_bm Float 4 — Arsenic, in bottom material, as As, in micrograms per gramau_bm Integer 2 — Gold, in bottom material, as Au, in micrograms per gram
b_xw_bm Float 4 — Boron, hot-water-extractable, in bottom material, as B, in micrograms per literba_bm Integer 2 — Barium, total, in bottom material, as Ba, in micrograms per grambe_bm Integer 2 — Beryllium, total, in bottom material, as Be, in micrograms per grambi_bm Integer 2 — Bismuth, total, in bottom material, as Bi, in micrograms per gram
c_co3_bm Float 4 — Carbon, carbonate, in bottom material, as C, in percentc_org_bm Float 4 — Carbon, organic, in bottom material, as C, in percentc_tot_bm Float 4 — Carbon, total, in bottom material, as C, in percentca_bm Float 4 — Calcium, recoverable from bottom material, as Ca, in percentcd_bm Integer 2 — Cadmium, total, in bottom material, as Cd, in micrograms per gramce_bm Integer 2 — Cerium, total, in bottom material, as Ce, in micrograms per gramco_bm Integer 2 — Cobalt, total, in bottom material, as Co, in micrograms per gramcr_bm Integer 2 — Chromium, total, in bottom material, as Cr, in micrograms per gramcu_bm Integer 2 — Copper, total, in bottom material, as Cu, in micrograms per gram

26A
PP
EN
DIX
A
ntinued
cation
APPENDIX A. Data dictionary for National Irrigation Water Quality Program data base—Co
Attribute name
Attribute characteristics NWISparameter
codeAttribute description
LinkingFixedvalue
Datatype
Fieldlength
INORGBM table (stores data on inorganic constituents in bottom material)—Continued
fe_bm Float 4 01170 Iron, total, in bottom material, as Fe, in percent
ga_bm Integer 2 — Gallium, total, in bottom material, as Ga, in micrograms per gram
hg_bm Float 4 71921 Mercury, in bottom material, as Hg, in micrograms per gram
k_bm Float 4 00938 Potassium, in bottom material, as K, in percent
la_bm Integer 2 — Lanthanum, total, in bottom material, as La, in micrograms per gramli_bm Integer 2 01133 Lithium, in bottom material, as Li, in micrograms per gram
mg_bm Float 4 00924 Magnesium, in bottom material, as Mg, in percentmn_bm Integer 2 01053 Manganese, total, in bottom material, as Mn, in micrograms per grammo_bm Integer 2 01063 Molybdenum, total, in bottom material, as Mo, in micrograms per gram
na_bm Float 4 00934 Sodium, in bottom material, as Na, in percentnb_bm Integer 2 — Niobium, total, in bottom material, as Nb, in micrograms per gramnd_bm Integer 2 — Neodymium, total, in bottom material, as Nd, in micrograms per gramni_bm Integer 2 01068 Nickel, total, in bottom material, as Ni, in micrograms per gram
p_bm Float 4 00668 Phosphorus, total, in bottom material, as P, in percentpb_bm Integer 2 01052 Lead, total, in bottom material, as Pb, in micrograms per gram
sc_bm Integer 2 82317 Scandium, total, in bottom material, as Sc, in micrograms per gramse_bm Float 4 01148 Selenium, total, in bottom material, as Se, in micrograms per gramsr_bm Integer 2 01083 Strontium, total, in bottom material, as Sr, in micrograms per gram
th_bm Integer 2 82313 Thorium, total, in bottom material, as Th, in micrograms per kilogramti_bm Float 4 01153 Titanium, total, in bottom material, as Ti, in micrograms per gram
u_bm Float 4 22707 Uranium, natural, total, in bottom material, as U, in micrograms per gram
v_bm Integer 2 01088 Vanadium, total, in bottom material, as V, in micrograms per gram
y_bm Integer 2 — Yttrium, total, in bottom material, as Y, in micrograms per gramyb_bm Integer 2 82311 Ytterbium, total, in bottom material, as Yb, in micrograms per kilogram
zn_bm Integer 2 01093 Zinc, total, in bottom material, as Zn, in micrograms per gram
ORGBM table (stores data on organic chemicals and nitrogen in bottom material)
site_id • Varchar 15 — Unique 9- or 15-digit identifying number assigned on basis of geographic losamp_date • Date — — Date of sample collection (dd–mmm–yy format)samp_time • Integer 2 — Time of sample collection (hhmm format)matrix • • Char 2 — Sample matrix
acenaphthen_bm Float 4 34208 Acenaphthene, in bottom material, in micrograms per kilogramacenaphthyl_bm Float 4 34203 Acenaphthylene, in bottom material, in micrograms per kilogramaldrin_bm Float 4 39333 Aldrin, in bottom material, dry weight, in micrograms per kilogramanthracene_bm Float 4 34223 Anthracene, in bottom material, in micrograms per kilogram

AP
PE
ND
IX A
27
b2ethxphth_bm Float 4 39102 Bis(2-ethylhexyl) phthalate, in bottom material, in micrograms per kilogrambenzapyren_bm Float 4 34250 Benzo(a)pyrene, total, in bottom material, in micrograms per kilogrambenzbflrant_bm Float 4 34233 Benzo(b)fluoranthene, total, in bottom material, in micrograms per kilogrambenzkflrant_bm Float 4 34245 Benzo(k)fluoranthene, total, in bottom material, in micrograms per kilogram
rams per kilogram
ramramram
kilogram, in grams per kilogramilogram
grams per kilogramms per kilogramrams per kilogramms per kilogram
benzperyln_bm Float 4 34524 Benzo(g,h,i) perylene(1,12-Benzoperylene), in bottom material, in microgbis2cleth_e_bm Float 4 34276 Bis(2-chloroethyl) ether, in bottom material, in micrograms per kilogrambis2cleth_m_bm Float 4 34281 Bis(2-chloroethoxy) methane, in bottom material, in micrograms per kilogbis2cliso_e_bm Float 4 34286 Bis(2-chloroisopropyl) ether, in bottom material, in micrograms per kilogbrphphethr_bm Float 4 34639 4-Bromophenyl phenyl ether, in bottom material, in micrograms per kilog
c_inorg_bm Float 4 00686 Carbon, inorganic, in bottom material, as C, in grams per kilogramc_org_bm Float 4 30243 Carbon, organic, in bottom material, as C, in percentc_org_t_bm Float 4 00687 Carbon, organic, total, in bottom material, as C, dry weight, in grams per c_tot_bm Float 4 00693 Carbon, inorganic plus organic, total, in bottom material, as C, dry weightchlordane_bm Float 4 39351 Chlordane, technical, in bottom material, dry weight, in micrograms per kchrysene_bm Float 4 34323 Chrysene, in bottom material, in micrograms per kilogramclnaphthal_bm Float 4 34584 2-Chloronaphthalene, in bottom material, in micrograms per kilogramclphenol_bm Float 4 34589 2-Chlorophenol, in bottom material, in micrograms per kilogram
d24_bm Float 4 39731 2,4-Dichlorophenoxyacetic acid, in bottom material, dry weight, in microddd_bm Float 4 39363 Dichloro-diphenyl-dichloroethane (DDD), in bottom material, in microgradde_bm Float 4 39368 Dichloro-diphenyl-dichloroethylene (DDE), in bottom material, in microgddt_bm Float 4 39373 Dichloro-diphenyl-trichloroethane (DDT), in bottom material, in microgradiazinon_bm Float 4 39571 Diazinon, in bottom material, dry weight, in micrograms per kilogramdibenzanthr_bm Float 4 34559 1,1,5,6-Dibenzanthracene, in bottom material, in micrograms per kilogramdicamba_bm Float 4 38931 Dicamba, in bottom material, dry weight, in micrograms per kilogramdiclbenz12_bm Float 4 34539 1,2-Dichlorobenzene, in bottom material, in micrograms per kilogramdiclbenz13_bm Float 4 34569 1,3-Dichlorobenzene, in bottom material, in micrograms per kilogramdiclbenz14_bm Float 4 34574 1,4-Dichlorobenzene, in bottom material, in micrograms per kilogramdiclphenol_bm Float 4 34604 2,4-Dichlorophenol, in bottom material, in micrograms per kilogramdieldrin_bm Float 4 39383 Dieldrin, in bottom material, dry weight, in micrograms per kilogramdietpthlate_bm Float 4 34339 Diethyl phthalate, in bottom material, in micrograms per kilogramdimephtlate_bm Float 4 34344 Dimethyl phthalate in bottom material, in micrograms per kilogramdimthphenl_bm Float 4 34609 2,4-Dichlorprop, in bottom material, in micrograms per kilogramdinocresol_bm Float 4 34660 4,6-Dinitro-orthocresol, in bottom material, in micrograms per kilogramdinphenol_bm Float 4 34619 2,4-Dinitrophenol, in bottom material, in micrograms per kilogramdintolu24_bm Float 4 34614 2,4-Dinitro-toluene, in bottom material, in micrograms per kilogramdintolu26_bm Float 4 34629 2,6-Dinitro-toluene, in bottom material, in micrograms per kilogramdioctphthl_bm Float 4 34599 Di-n-octyl phthalate, in bottom material, in micrograms per kilogramdnb_phtha_bm Float 4 39112 Di-n-butyl phthalate, in bottom material, in micrograms per kilogram
endosulf_bm Float 4 39389 Endosulfan, in bottom material, dry weight, in micrograms per kilogramendrin_bm Float 4 39393 Endrin, in bottom material, dry weight, in micrograms per kilogramethion_bm Float 4 39399 Ethion, in bottom material, dry weight, in micrograms per kilogram
flranthene_bm Float 4 34379 Fluoranthene, in bottom material, in micrograms per kilogramfluorene_bm Float 4 34384 Fluorene, in bottom material, in micrograms per kilogram

28A
PP
EN
DIX
A
ntinued
gram
gram
micrograms per kilogram
am
, in milligrams per kilograms per kilogramilligrams per kilogram
er kilogram
ms per kilogram
grams per kilogram
APPENDIX A. Data dictionary for National Irrigation Water Quality Program data base—Co
Attribute name
Attribute characteristics NWISparameter
codeAttribute description
LinkingFixedvalue
Datatype
Fieldlength
ORGBM table (stores data on organic chemicals and nitrogen in bottom material)—Continued
hcb_bm Float 4 39701 Hexachlorobenzene, in bottom material, dry weight, in micrograms per kiloheptchlr_bm Float 4 39413 Heptachlor, in bottom material, dry weight, in micrograms per kilogramheptepox_bm Float 4 39423 Heptachlor epoxide, in bottom material, dry weight, in micrograms per kilohexclbutdie_bm Float 4 39705 Hexachlorobutadiene, in bottom material, in micrograms per kilogramhexclcyclpd_bm Float 4 34389 Hexachlorocyclopentadiene, in bottom material, in micrograms per kilogramhexclethan_bm Float 4 34399 Hexachloroethane, in bottom material, in micrograms per kilogram
ind_pyr_bm Float 4 34406 Indeno (1,2,3-cd) pyrene, in bottom material, in micrograms per kilogramisphrone_bm Float 4 34411 Isophorone, in bottom material, in micrograms per kilogram
lindane_bm Float 4 39343 Gamma-benzene hexachloride (lindane), in bottom material, dry weight, in
malathion_bm Float 4 39531 Malathion, in bottom material, dry weight, in micrograms per kilogrammethoxchlr_bm Float 4 39481 Methoxychlor, in bottom material, dry weight, in micrograms per kilogrammirex_bm Float 4 39758 Mirex, in bottom material, dry weight, in micrograms per kilogrammparathion_bm Float 4 39601 Methyl parathion, in bottom material, dry weight, in micrograms per kilogrmtrithion_bm Float 4 39791 Methyl trithion, in bottom material, dry weight, in micrograms per kilogram
naphthalen_bm Float 4 34445 Naphthalene, in bottom material, in micrograms per kilogramnbb_phth_bm Float 4 34295 N-Butylbenzyl phthalate, in bottom material, in micrograms per kilogramnh3org_t_bm Float 4 00626 Nitrogen, ammonia plus organic, total, in bottom material, as N, dry weightnh3_t_bm Float 4 00611 Nitrogen, ammonia, total, in bottom material, as N, dry weight, in milligramno2no3_t_bm Float 4 00633 Nitrogen, nitrite plus nitrate, total, in bottom material, as N, dry weight, in mnitrobenzen_bm Float 4 34450 Nitrobenzene, in bottom material, in micrograms per kilogramnitrphenol2_bm Float 4 34594 2-Nitrophenol, in bottom material, in micrograms per kilogramnitrphenol4_bm Float 4 34649 4-Nitrophenol, in bottom material, in micrograms per kilogramnsodiphynyl_bm Float 4 34436 N-Nitrosodiphenylamine, in bottom material, in micrograms per kilogram
parathion_bm Float 4 39541 Parathion, dry weight, in bottom material, in micrograms per kilogrampcb_bm Float 4 39519 Polychlorinated biphenyls, in bottom material, dry weight, in micrograms ppclmcresol_bm Float 4 34455 Parachlorometacresol, in bottom material, in micrograms per kilogrampclphenol_bm Float 4 39061 Pentachlorophenol, in bottom material, in micrograms per kilogrampcn_bm Float 4 39251 Naphthalenes, polychlorinated, in bottom material, dry weight, in micrograperthane_bm Float 4 81886 Perthane, in bottom material, in micrograms per kilogramphenol_bm Float 4 34695 Phenol (C6H5OH), in bottom material, in micrograms per kilogramphnanthren_bm Float 4 34464 Phenanthrene, in bottom material, in micrograms per kilogrampicloram_bm Float 4 38930 Picloram, in bottom material, dry weight, in micrograms per kilogrampyrene_bm Float 4 34472 Pyrene, in bottom material, in micrograms per kilogram
silvex_bm Float 4 39761 Silvex, in bottom material, dry weight, in micrograms per kilogram
t245_bm Float 4 39741 2,4,5-Trichlorophenoxyacetic acid, in bottom material, dry weight, in microtoxaphene_bm Float 4 39403 Toxaphene, in bottom material, dry weight, in micrograms per kilogramtriclbenze_bm Float 4 34554 1,2,4-Trichlorobenzene, in bottom material, in micrograms per kilogramtriclphenl_bm Float 4 34624 2,4,6-Trichlorophenol, in bottom material, in micrograms per kilogramtrithion_bm Float 4 39787 Trithion, in bottom material, dry weight, in micrograms per kilogram

AP
PE
ND
IX A
29
INORGBIO table (stores data on sample matrix and inorganic constituents in biotic samples)
site_id • Varchar 15 — Identification for nearest appropriate site where surface-water samples were collected. Blank indicates no match between biological-sampling location and water-sampling site.
N table, this appendix).
area • • Varchar 10 — Abbreviated name identifying NIWQP study areasubarea • • Varchar 10 — Abbreviated name identifying subarea within NIWQP study arealocation Varchar 64 — Biologist-designated sampling location within study area
category • Char 17 — Broad taxonomic category of sample, such as plant or birdspecies Varchar 35 — Standardized common name of organism used in NIWQP data base (see section on TAXO
samp_date Date — — Date of sample collection (mm/dd/yy format)year Varchar 7 — Last two digits of year sample was collected (00–99, of 1900’s)month Integer 2 — Month sample was collected (01–12)day Integer 2 — Day sample was collected (unknown if missing)
compos_n Float 4 — Number of individuals in composite sample
life_stage Varchar 16 — Life stage of sample (for example, juvenile) if appropriatetissue Varchar 20 — Tissue analyzed (for example, liver, whole body)
moisture Float 4 — Moisture content of sample, in percent
ag_bio Float 4 — Silver, in biological material, as Ag, dry weight, in micrograms per gramal_bio Float 4 — Aluminum, in biological material, as Al, dry weight, in micrograms per gramas_bio Float 4 — Arsenic, in biological material, as As, dry weight, in micrograms per gram
b_bio Float 4 — Boron, in biological material, as B, dry weight, in micrograms per gramba_bio Float 4 — Barium, in biological material, as Ba, dry weight, in micrograms per grambe_bio Float 4 — Beryllium, in biological material, as Be, dry weight, in micrograms per gram
cd_bio Float 4 — Cadmium, in biological material, as Cd, dry weight, in micrograms per gramco_bio Float 4 — Cobalt, in biological material, as Co, dry weight, in micrograms per gramcr_bio Float 4 — Chromium, in biological material, as Cr, dry weight, in micrograms per gramcu_bio Float 4 — Copper, in biological material, as Cu, dry weight, in micrograms per gram
fe_bio Float 4 — Iron, in biological material, as Fe, dry weight, in micrograms per gram
hg_bio Float 4 — Mercury, in biological material, as Hg, dry weight, in micrograms per grammg_bio Float 4 — Magnesium, in biological material, as Mg, dry weight, in micrograms per grammn_bio Float 4 — Manganese, in biological material, as Mn, dry weight, in micrograms per grammo_bio Float 4 — Molybdenum, in biological material, as Mo, dry weight, in micrograms per gram
ni_bio Float 4 — Nickel, in biological material, as Ni, dry weight, in micrograms per gram
pb_bio Float 4 — Lead, in biological material, as Pb, dry weight, in micrograms per gram
sb_bio Float 4 — Antimony, in biological material, as Sb, dry weight, in micrograms per gramse_bio Float 4 — Selenium, in biological material, as Se, dry weight, in micrograms per gramsn_bio Float 4 — Tin, in biological material, as Sn, dry weight, in micrograms per gramsr_bio Float 4 — Strontium, in biological material, as Sr, dry weight, in micrograms per gram
tl_bio Float 4 — Thallium, in biological material, as Tl, dry weight, in micrograms per gram
v_bio Float 4 — Vanadium, in biological material, as V, dry weight, in micrograms per gram
zn_bio Float 4 — Zinc, in biological material, as Zn, dry weight, in micrograms per gram

30A
PP
EN
DIX
A
ntinued
collected. Blank indicates no match between
tion on TAXON table, this appendix)
gramr gramr gram
ram
ams per grams per gram
ms per gram, in micrograms per gramms per gram
rograms per grammicrograms per gram
APPENDIX A. Data dictionary for National Irrigation Water Quality Program data base—Co
Attribute name
Attribute characteristics NWISparameter
codeAttribute description
LinkingFixedvalue
Datatype
Fieldlength
ORGBIO table (stores data on sample matrix and organic chemicals in biotic samples)
site_id • Varchar 15 — Identification for nearest appropriate site where surface-water samples werebiological-sampling location and water-sampling site.
area • • Varchar 10 — Abbreviated name identifying NIWQP study areasubarea • • Varchar 10 — Abbreviated name identifying subarea within NIWQP study arealocation Varchar 30 — Biologist-designated sampling location within study area
category • Char 10 — Broad taxonomic category of sample, such as plant, or birdspecies Varchar 30 — Standardized common name of organism used in NIWQP data base (see sec
samp_date Date — — Date of sample collection (mm/dd/yy format)year Varchar 7 — Last two digits of year sample was collected (00–99, of 1900’s)month Integer 2 — Numeric value for month sample was collectedday Integer 2 — Day sample was collected (unknown if missing)
compos_n Float 4 — Number of individuals in composite sample
life_stage Varchar 30 — Life stage of sample (for example, juvenile) if appropriatetissue Varchar 30 — Tissue analyzed (for example, liver, whole body)
moisture Float 4 — Moisture content of sample, in percentlipid Float 4 — Lipid content of sample, in percent
acenaphthe_bio Float 4 — Acenaphthene, in biological material, wet weight, in micrograms per gramacenaphthy_bio Float 4 — Acenaphthylene, in biological material, wet weight, in micrograms per gramaldrin_bio Float 4 — Aldrin, in biological material, wet weight, in micrograms per gramanthracene_bio Float 4 — Anthracene, in biological material, wet weight, in micrograms per gramarchlr1248_bio Float 4 — Arochlor 1248, in biological material, wet weight, in micrograms per gramarchlr1254_bio Float 4 — Arochlor 1254, in biological material, wet weight, in micrograms per gramarchlr1260_bio Float 4 — Arochlor 1260, in biological material, wet weight, in micrograms per gram
benzaanthr_bio Float 4 — Benzo(a)anthracene, in biological material, wet weight, in micrograms per benzbflran_bio Float 4 — Benzo(b)fluoranthene, in biological material, wet weight, in micrograms pebenzkflran_bio Float 4 — Benzo(k)fluoranthene, in biological material, wet weight, in micrograms pebenzoapyre_bio Float 4 — Benzo(a)pyrene, in biological material, wet weight, in micrograms per grambenzoepyre_bio Float 4 — Benzo(e)pyrene, in biological material, wet weight, in micrograms per grambenzperyln_bio Float 4 — Benzo(ghi)perylene, in biological material, wet weight, in micrograms per g
bhc_alpha_bio Float 4 — Alpha-benzene hexachloride, in biological material, wet weight, in microgrbhc_beta_bio Float 4 — Beta-benzene hexachloride, in biological material, wet weight, in microgrambhc_delta_bio Float 4 — Delta-benzene hexachloride, in biological material, wet weight, in micrograbhc_gamma_bio Float 4 — Gamma-benzene hexachloride (lindane), in biological material, wet weightbhc_total_bio Float 4 — Benzene hexachloride, total, in biological material, wet weight, in microgra
chlord_bio Float 4 — Chlordane, in biological material, wet weight, in micrograms per gramchlord_a_bio Float 4 — Alpha chlordane (cis-Chlordane), in biological material, wet weight, in micchlord_g_bio Float 4 — Gamma chlordane (trans-Chlordane), in biological material, wet weight, in chrysene_bio Float 4 — Chrysene, in biological material, wet weight, in micrograms per gram
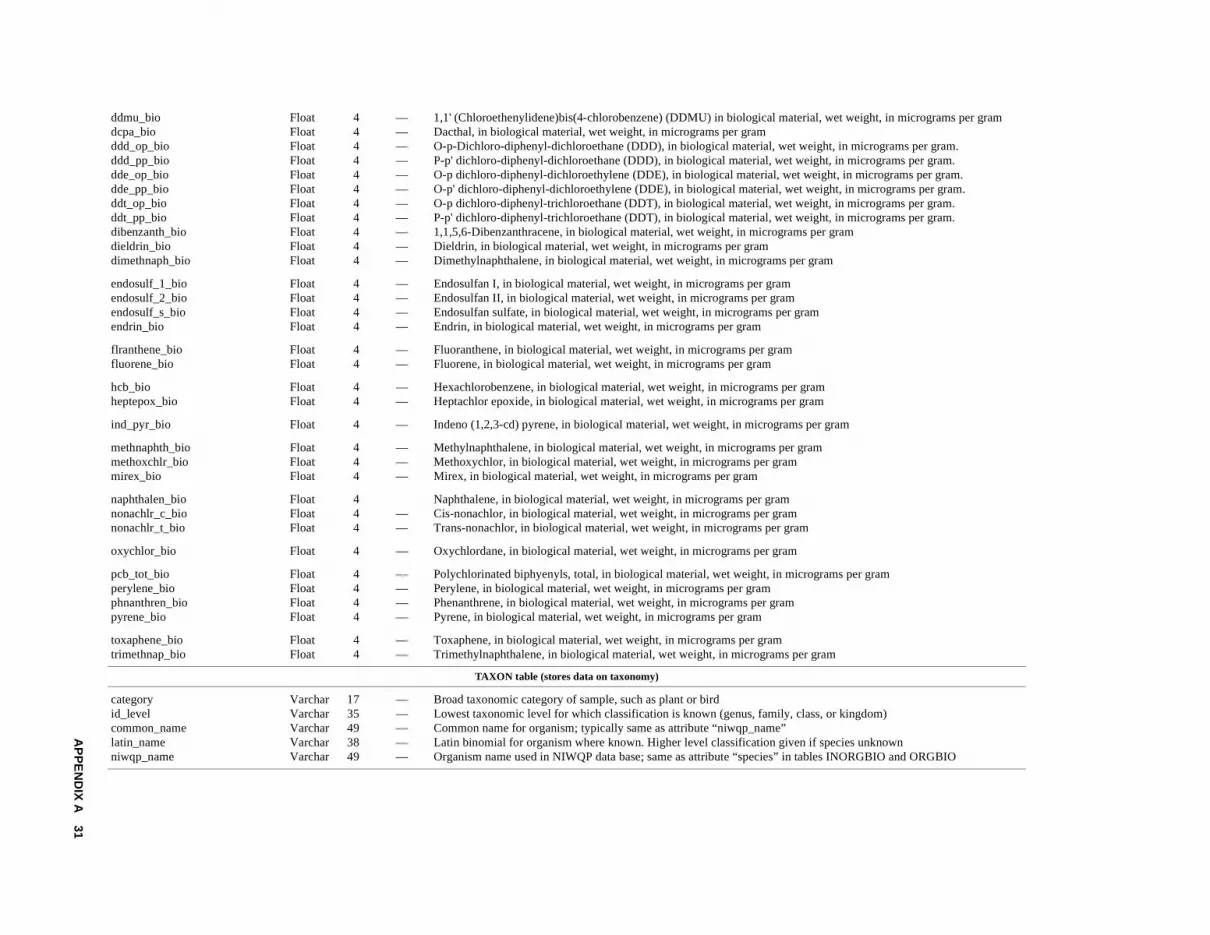
AP
PE
ND
IX A
31
ddmu_bio Float 4 — 1,1' (Chloroethenylidene)bis(4-chlorobenzene) (DDMU) in biological material, wet weight, in micrograms per gramdcpa_bio Float 4 — Dacthal, in biological material, wet weight, in micrograms per gram ddd_op_bio Float 4 — O-p-Dichloro-diphenyl-dichloroethane (DDD), in biological material, wet weight, in micrograms per gram.ddd_pp_bio Float 4 — P-p' dichloro-diphenyl-dichloroethane (DDD), in biological material, wet weight, in micrograms per gram.
rograms per gram.rograms per gram.grams per gram.grams per gram.
am
m)
nownIO and ORGBIO
dde_op_bio Float 4 — O-p dichloro-diphenyl-dichloroethylene (DDE), in biological material, wet weight, in micdde_pp_bio Float 4 — O-p' dichloro-diphenyl-dichloroethylene (DDE), in biological material, wet weight, in micddt_op_bio Float 4 — O-p dichloro-diphenyl-trichloroethane (DDT), in biological material, wet weight, in microddt_pp_bio Float 4 — P-p' dichloro-diphenyl-trichloroethane (DDT), in biological material, wet weight, in microdibenzanth_bio Float 4 — 1,1,5,6-Dibenzanthracene, in biological material, wet weight, in micrograms per gramdieldrin_bio Float 4 — Dieldrin, in biological material, wet weight, in micrograms per gramdimethnaph_bio Float 4 — Dimethylnaphthalene, in biological material, wet weight, in micrograms per gram
endosulf_1_bio Float 4 — Endosulfan I, in biological material, wet weight, in micrograms per gramendosulf_2_bio Float 4 — Endosulfan II, in biological material, wet weight, in micrograms per gramendosulf_s_bio Float 4 — Endosulfan sulfate, in biological material, wet weight, in micrograms per gramendrin_bio Float 4 — Endrin, in biological material, wet weight, in micrograms per gram
flranthene_bio Float 4 — Fluoranthene, in biological material, wet weight, in micrograms per gramfluorene_bio Float 4 — Fluorene, in biological material, wet weight, in micrograms per gram
hcb_bio Float 4 — Hexachlorobenzene, in biological material, wet weight, in micrograms per gramheptepox_bio Float 4 — Heptachlor epoxide, in biological material, wet weight, in micrograms per gram
ind_pyr_bio Float 4 — Indeno (1,2,3-cd) pyrene, in biological material, wet weight, in micrograms per gram
methnaphth_bio Float 4 — Methylnaphthalene, in biological material, wet weight, in micrograms per grammethoxchlr_bio Float 4 — Methoxychlor, in biological material, wet weight, in micrograms per grammirex_bio Float 4 — Mirex, in biological material, wet weight, in micrograms per gram
naphthalen_bio Float 4 Naphthalene, in biological material, wet weight, in micrograms per gramnonachlr_c_bio Float 4 — Cis-nonachlor, in biological material, wet weight, in micrograms per gramnonachlr_t_bio Float 4 — Trans-nonachlor, in biological material, wet weight, in micrograms per gram
oxychlor_bio Float 4 — Oxychlordane, in biological material, wet weight, in micrograms per gram
pcb_tot_bio Float 4 — Polychlorinated biphyenyls, total, in biological material, wet weight, in micrograms per grperylene_bio Float 4 — Perylene, in biological material, wet weight, in micrograms per gramphnanthren_bio Float 4 — Phenanthrene, in biological material, wet weight, in micrograms per grampyrene_bio Float 4 — Pyrene, in biological material, wet weight, in micrograms per gram
toxaphene_bio Float 4 — Toxaphene, in biological material, wet weight, in micrograms per gramtrimethnap_bio Float 4 — Trimethylnaphthalene, in biological material, wet weight, in micrograms per gram
TAXON table (stores data on taxonomy)
category Varchar 17 — Broad taxonomic category of sample, such as plant or birdid_level Varchar 35 — Lowest taxonomic level for which classification is known (genus, family, class, or kingdocommon_name Varchar 49 — Common name for organism; typically same as attribute “niwqp_name”latin_name Varchar 38 — Latin binomial for organism where known. Higher level classification given if species unkniwqp_name Varchar 49 — Organism name used in NIWQP data base; same as attribute “species” in tables INORGB
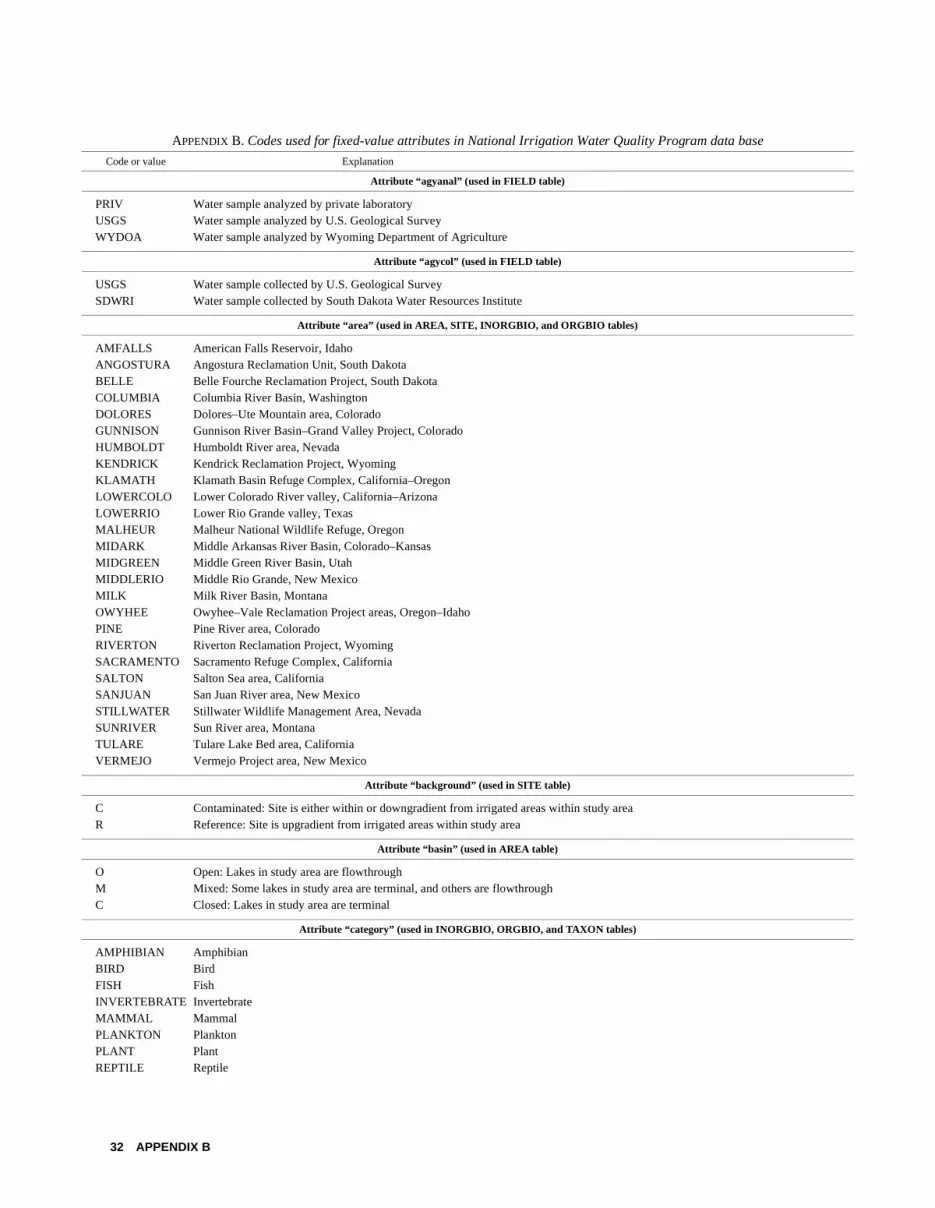
PUW
US
AABCDGHKKLLMMMMMOPRSSSSSTV
CR
OMC
ABFIMPPR
APPENDIX B. Codes used for fixed-value attributes in National Irrigation Water Quality Program data base
Code or value Explanation
Attribute “agyanal” (used in FIELD table)
RIV Water sample analyzed by private laboratorySGS Water sample analyzed by U.S. Geological SurveyYDOA Water sample analyzed by Wyoming Department of Agriculture
Attribute “agycol” (used in FIELD table)
SGS Water sample collected by U.S. Geological SurveyDWRI Water sample collected by South Dakota Water Resources Institute
Attribute “area” (used in AREA, SITE, INORGBIO, and ORGBIO tables)
MFALLS American Falls Reservoir, IdahoNGOSTURA Angostura Reclamation Unit, South DakotaELLE Belle Fourche Reclamation Project, South DakotaOLUMBIA Columbia River Basin, WashingtonOLORES Dolores–Ute Mountain area, ColoradoUNNISON Gunnison River Basin–Grand Valley Project, ColoradoUMBOLDT Humboldt River area, NevadaENDRICK Kendrick Reclamation Project, WyomingLAMATH Klamath Basin Refuge Complex, California–OregonOWERCOLO Lower Colorado River valley, California–ArizonaOWERRIO Lower Rio Grande valley, TexasALHEUR Malheur National Wildlife Refuge, OregonIDARK Middle Arkansas River Basin, Colorado–KansasIDGREEN Middle Green River Basin, UtahIDDLERIO Middle Rio Grande, New MexicoILK Milk River Basin, MontanaWYHEE Owyhee–Vale Reclamation Project areas, Oregon–IdahoINE Pine River area, ColoradoIVERTON Riverton Reclamation Project, WyomingACRAMENTO Sacramento Refuge Complex, CaliforniaALTON Salton Sea area, CaliforniaANJUAN San Juan River area, New MexicoTILLWATER Stillwater Wildlife Management Area, NevadaUNRIVER Sun River area, MontanaULARE Tulare Lake Bed area, CaliforniaERMEJO Vermejo Project area, New Mexico
Attribute “background” (used in SITE table)
Contaminated: Site is either within or downgradient from irrigated areas within study areaReference: Site is upgradient from irrigated areas within study area
Attribute “basin” (used in AREA table)
Open: Lakes in study area are flowthroughMixed: Some lakes in study area are terminal, and others are flowthroughClosed: Lakes in study area are terminal
Attribute “category” (used in INORGBIO, ORGBIO, and TAXON tables)
MPHIBIAN AmphibianIRD BirdISH FishNVERTEBRATE Invertebrate
AMMAL MammalLANKTON PlanktonLANT PlantEPTILE Reptile
32 APPENDIX B

YN
<<
TTTTTT
U s
UUUUU
XX
BBGISSSS
YN
YN
YN
APPENDIX B. Codes used for fixed-value attributes in National Irrigation Water Quality Program data base—Continued
Code or value Explanation
Attribute “doi” (used in FIELD table)
Yes: Sample was collected as part of NIWQP investigationNo: Sample was not collected as part of NIWQP investigation
Attribute “fraction” (used in INORGBM table)
2.0 Bottom material of particle size less than 2 millimeters0.062 Bottom material of particle size less than 0.062 millimeter
Attribute “geology” (used in AREA table; same codes as for “sitegeology”; listed generally in age order; units modified after King and Beikman, 1974)
Quaternary volcanic and sedimentary deposits:Stratified sedimentary deposits
V Volcanic rocksTertiary volcanic and sedimentary deposits:
PV Nonfelsic volcanic rocks (Pliocene)PC Continental sedimentary deposits (Pliocene)MF Felsic volcanic rocks (Miocene)MV Nonfelsic volcanic rocks (Miocene)EC Continental sedimentary deposits (Eocene)XC Continental sedimentary deposits (Paleocene)
Upper Cretaceous stratified, mainly marine, sedimentary rocks:K Undivided (includes Tuscaloosa, Woodbine, Eagle Ford, Austin, Taylor, and Navarro Groups; locally includes Lower Cretaceou
rocks not mapped separately).
K4 Navarro GroupK3, UK3A Taylor GroupK2 Austin and Eagle Ford Groups, undividedK1 Woodbine and Tuscaloosa Groups, undivided (locally includes Lower Cretaceous rocks not mapped separately)PZ Upper Paleozoic stratified, mainly marine, sedimentary rocks
Early Proterozoic metamorphic and igneous rocks: G Plutonic and intrusive granitic rocksM Orthogneiss and paragneiss
Attribute “matrix” (used in FIELD, INORG, ISOTOPE, NUTRIENT, ORG, SEDIMENT, INORGBM, and ORGBM tables)
C Borehole coringM Bottom materialW Ground water
W Interstitial waterC Salt crustO SoilS Suspended sedimentW Surface water
Attribute “mining” (used in AREA table)
Yes: Mining activities are reported for study areaNo: Mining activities are not reported for study area
Attribute “pesticides” (used in AREA table)
Yes: Heavy pesticide use is reported for study areaNo: Heavy pesticide use is not reported for study area
Attribute “qaqc” (used in FIELD and INORGBM tables)
Yes: Sample was collected and(or) analyzed for quality-assurance purposesNo: Sample was not collected and(or) analyzed specifically for quality-assurance purposes but for routine environmental monitoring
APPENDIX B 33

EEEGMOSSSTVWO
TTTTTT
U s
UUUUU
XX
DGLSS
YN
APPENDIX B. Codes used for fixed-value attributes in National Irrigation Water Quality Program data base—Continued
Code or value Explanation
Attribute “samp_meth” (used in FIELD table)
DI Equal-discharge incrementTR Equal transit rate (integrated discharge)WI Equal-width incrementRAB Grab (dip)VERT Multiple verticalTB Open-top bailerQZ Squeeze pumpUBM Submersible pumpVERT Single verticalHIEF ThiefDORN Van DornB Weighted bottleTHER Method other than those listed above
Attribute “sitegeology” (used in SITE table; same codes as for “geology”; listed generally in age order; units modified after King and Beikman, 1974)
Quaternary volcanic and sedimentary deposits:Stratified sedimentary deposits
V Volcanic rocksTertiary volcanic and sedimentary deposits:
PV Nonfelsic volcanic rocks (Pliocene)PC Continental sedimentary deposits (Pliocene)MF Felsic volcanic rocks (Miocene)MV Nonfelsic volcanic rocks (Miocene)EC Continental sedimentary deposits (Eocene)XC Continental sedimentary deposits (Paleocene)
Upper Cretaceous stratified, mainly marine, sedimentary rocks:K Undivided (includes Tuscaloosa, Woodbine, Eagle Ford, Austin, Taylor, and Navarro Groups; locally includes Lower Cretaceou
rocks not mapped separately).
K4 Navarro GroupK3, UK3A Taylor GroupK2 Austin and Eagle Ford Groups, undividedK1 Woodbine and Tuscaloosa Groups, undivided (locally includes Lower Cretaceous rocks not mapped separately)PZ Upper Paleozoic stratified, mainly marine, sedimentary rocks
Early Proterozoic metamorphic and igneous rocks: G Plutonic and intrusive granitic rocksM Orthogneiss and paragneiss
Attribute “site_type” (used in SITE table)
R DrainW Ground waterK Lake or pondP SpringW Surface water
Attribute “source” (used in SITE table)
Yes: Site represents source water for irrigationNo: Site does not represent source water for irrigation
34 APPENDIX B

APPENDIX B. Codes used for fixed-value attributes in National Irrigation Water Quality Program data base—Continued
Code or value Explanation
Attribute “sub_area” (used in AREA, SITE, INORGBIO, AND ORGBIO tables; study-area name precedes colon)
AMFALLS American Falls Reservoir, Idaho (no subarea)ANGOSTURA Angostura Reclamation Unit, South Dakota (no subarea)BELLE Belle Fourche Reclamation Project, South Dakota (no subarea)COLUMBIA Columbia River Basin, Washington (no subarea)DOLORES Dolores–Ute Mountain area, Colorado (no subarea)GRANDVALLE Grand Valley subarea of Gunnison River Basin–Grand Valley Project, ColoradoUNCOMPAHGR Uncompahgre Project subarea of Gunnison River Basin–Grand Valley Project, ColoradoHUMBOLDT Humboldt River area, Nevada (no subarea)KENDRICK Kendrick Reclamation Project, Wyoming (no subarea)KLAMATH Klamath Basin Refuge Complex, California–Oregon (no subarea)LOWERCOLO Lower Colorado River valley, California–Arizona (no subarea)LOWERRIO Lower Rio Grande valley, Texas (no subarea)MALHEUR Malheur National Wildlife Refuge, Oregon (no subarea)MIDARK Middle Arkansas River Basin, Colorado–Kansas (no subarea)OURAY Ouray subarea of Middle Green River Basin, UtahPARIETTE Pariette subarea of Middle Green River Basin, UtahSTEWART Stewart subarea of Middle Green River Basin, UtahMIDDLERIO Middle Rio Grande, New Mexico (no subarea)MILK Milk River Basin, Montana (no subarea)OWYHEE Owyhee–Vale Reclamation Project areas, Oregon–Idaho (no subarea)PINE Pine River area, Colorado (no subarea)RIVERTON Riverton Reclamation Project, Wyoming (no subarea)SACDELCOL Sacramento, Delevan, and Colusa National Wildlife Refuges in Sacramento Refuge Complex, CaliforniaBUTTESUTTE Butte Sink National Wildlife Management Area and Sutter National Wildlife Refuge in Sacramento Refuge Complex, CaliforniaSALTON Salton Sea area, California (no subarea)SANJUAN San Juan River area, New Mexico (no subarea)CARSONLAKE Carson Lake subarea of Stillwater Wildlife Management Area, NevadaFERNLEY Fernley subarea of Stillwater Wildlife Management Area, NevadaMASSIE Massie Slough subarea of Stillwater Wildlife Management Area, NevadaSTILLWATER Stillwater subarea of Stillwater Wildlife Management Area, NevadaBENTONLAKE Benton Lake National Wildlife Refuge in Sun River area, MontanaFREEZOUT Freezout Lake National Wildlife Refuge in Sun River area, MontanaGREENFIELD Greenfield Irrigation Division subarea of Sun River area, MontanaTULARE Tulare Lake Bed area, California (no subarea)VERMEJO Vermejo Project area, New Mexico (no subarea)
APPENDIX B 35


