Download - Kinetic simulations of a plasma thruster
IOP PUBLISHING PLASMA SOURCES SCIENCE AND TECHNOLOGY
Plasma Sources Sci. Technol. 17 (2008) 024003 (16pp) doi:10.1088/0963-0252/17/2/024003
Kinetic simulations of a plasma thrusterF Taccogna1, R Schneider1, S Longo2 and M Capitelli2
1 Max-Planck-Institut fur Plasmaphysik, Wendelsteinstrasse 1, 17491 Greifswald, Germany2 Dip. di Chimica, Universita’ degli Studi di Bari and IMIP-CNR Sect. Bari, via Orabona 4,70126 Bari, Italy
E-mail: [email protected]
Received 14 September 2007, in final form 23 November 2007Published 1 May 2008Online at stacks.iop.org/PSST/17/024003
AbstractThe modelling of the Hall thruster SPT-100 is a very important issue in view of the increasingimportance of such propulsion devices in space applications. Only kinetic models caninvestigate the rich variety of physical mechanisms involved in the Hall discharge and in theplume emitted from the thruster. This paper collects a number of differentparticle-in-cell/Monte Carlo collision models which have been able to reveal differentphenomena related to the peculiar physics of Hall thruster, such as sheath instability, azimuthalfluctuations and plume backflow.
(Some figures in this article are in colour only in the electronic version)
1. The Hall thruster
Stationary plasma thrusters (SPT) [1], also known as Halleffect thrusters (HET) or thrusters with closed electron drift,are ion thrusters with high specific impulse and low thrust thatmake them suitable for satellite station keeping or orbit transfer.
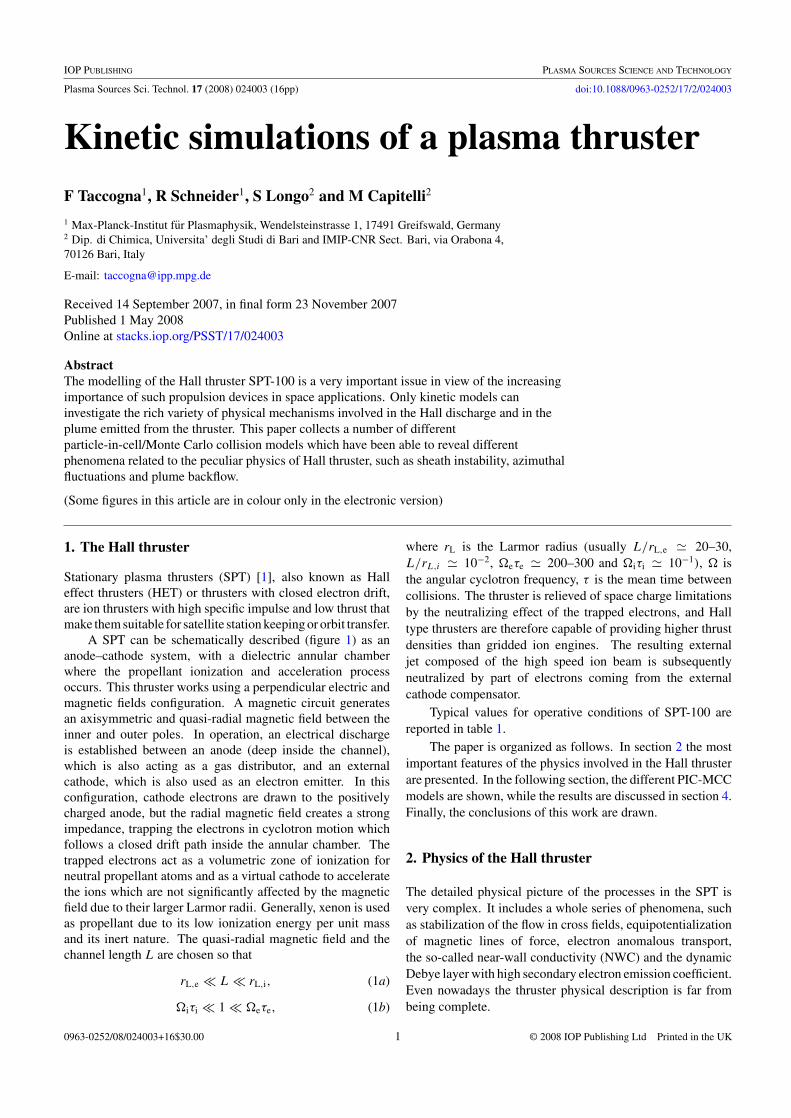
A SPT can be schematically described (figure 1) as ananode–cathode system, with a dielectric annular chamberwhere the propellant ionization and acceleration processoccurs. This thruster works using a perpendicular electric andmagnetic fields configuration. A magnetic circuit generatesan axisymmetric and quasi-radial magnetic field between theinner and outer poles. In operation, an electrical dischargeis established between an anode (deep inside the channel),which is also acting as a gas distributor, and an externalcathode, which is also used as an electron emitter. In thisconfiguration, cathode electrons are drawn to the positivelycharged anode, but the radial magnetic field creates a strongimpedance, trapping the electrons in cyclotron motion whichfollows a closed drift path inside the annular chamber. Thetrapped electrons act as a volumetric zone of ionization forneutral propellant atoms and as a virtual cathode to acceleratethe ions which are not significantly affected by the magneticfield due to their larger Larmor radii. Generally, xenon is usedas propellant due to its low ionization energy per unit massand its inert nature. The quasi-radial magnetic field and thechannel length L are chosen so that
rL,e � L � rL,i, (1a)
�iτi � 1 � �eτe, (1b)
where rL is the Larmor radius (usually L/rL,e � 20–30,L/rL,i � 10−2, �eτe � 200–300 and �iτi � 10−1), � isthe angular cyclotron frequency, τ is the mean time betweencollisions. The thruster is relieved of space charge limitationsby the neutralizing effect of the trapped electrons, and Halltype thrusters are therefore capable of providing higher thrustdensities than gridded ion engines. The resulting externaljet composed of the high speed ion beam is subsequentlyneutralized by part of electrons coming from the externalcathode compensator.
Typical values for operative conditions of SPT-100 arereported in table 1.
The paper is organized as follows. In section 2 the mostimportant features of the physics involved in the Hall thrusterare presented. In the following section, the different PIC-MCCmodels are shown, while the results are discussed in section 4.Finally, the conclusions of this work are drawn.
2. Physics of the Hall thruster
The detailed physical picture of the processes in the SPT isvery complex. It includes a whole series of phenomena, suchas stabilization of the flow in cross fields, equipotentializationof magnetic lines of force, electron anomalous transport,the so-called near-wall conductivity (NWC) and the dynamicDebye layer with high secondary electron emission coefficient.Even nowadays the thruster physical description is far frombeing complete.
0963-0252/08/024003+16$30.00 1 © 2008 IOP Publishing Ltd Printed in the UK
Plasma Sources Sci. Technol. 17 (2008) 024003 F Taccogna et al
Figure 1. Schematic representations of the discharge chamber andplume region of the SPT-100 thruster.
Table 1. Operative parameters of SPT-100.
Column length L = 2.5 cmInternal cylinder radius rin = 3.5 cmExternal cylinder radius rout = 5 cmPropellant mass flow rate m = 3 mg s−1
Input power P = 960 WDischarge voltage VD = 300 VDischarge current ID = 3.2 AMax radial magnetic field Br,max = 150 G
2.1. The thermalized potential concept and the accelerationmechanism
The magnetic field is the most important parameter in thedesign of a Hall thruster. In addition to the effect on theplasma stability requiring a peek at the exit plane of the channeldB/dz > 0, there is also an effect of the curvature of magneticforce lines, based on the ‘equipotentialization’ of the magneticforce lines. Neglecting electron inertia and Ohmic resistance,the momentum balance for the electrons takes the form
∇[φ − kBTe
eln
(ne
ne,0
)]= ve × B, (2)
where � is the plasma potential, kB the Boltzmann constant,Te, ne and ve the electron temperature, density and velocity,respectively, and e the elementary charge. Equation (2)shows that the function inside square brackets, know as‘thermalized potential’, is constant along the magnetic fieldlines. Therefore, it also follows that magnetic field lines areplasma equipotentials with accuracy of the order of kBTe/e.
This approximate relation between magnetic field and plasmaequipotential lines is a valuable design tool for controllingplasma flow. The geometry of force lines (convex towards theanode) is chosen such that it provides repulsion of ions fromthe walls thus reducing the channel erosion and focusing theion beam. On the basis of the magnetic field topology,three regions can be distinguished inside the SPT channel:the near-anode region where the ionization is low and thecurrent is carried mostly by electrons or by an ion backflow;the ionization zone where the current is maintained both byelectrons going to the anode and ions going to the SPT outlet;the acceleration zone between the ionization zone and thechannel exit where the current is carried predominantly by ions.
2.2. The space charge saturated sheaths. Secondary electronemission
The presence of an insulator as wall material has a profoundeffect on the plasma within a Hall type thruster. After an impactwith dielectric walls, high energy electrons are absorbed andrelease less energetic secondary electrons that are more firmlyconfined by the magnetic field. The result is that the dielectricwall limits the temperature of the electrons confined into thechannel. By limiting the electron temperature, a smoothcontinuous variation of the plasma potential results and thevalidity of the equipotentialization principle from equation (2)is guaranteed.
At the same time, the lateral sheath changes its classicalcharacter. In fact, under the emission of secondary electronsfrom the wall, the voltage sheath drop ��s is given by [2]
�φs = −kBTe
eln
[(1 − �)
√M
2πm
], (3)
where m and M are the electron and Xe mass, respectively,� is the integral value of the secondary electron emissioncoefficient γ calculated over the distribution function ofimpacting electrons considered as Maxwellian. The mostimportant effect of secondary electrons emitted from the wallis to reduce the voltage drop through the sheath, increasingthe number of electrons reaching the wall. As a consequence,the loss of electron energy increases, reducing the electrontemperature into the channel. However, in SPT the picturebecomes much more complex. First, the distribution functionsof electrons hitting the surface and secondary electrons emittedfrom the walls are essentially non-Maxwellian. Second, theelectrons in the SPT have energies in the range 15–20 eV(necessary to ionize Xe) and most of the ceramics used tomake the thruster walls (BN, SiO2, Al2O3) at these energieshave γ ∼ 1. Under these conditions, the classical Debyelayer seems to disappear and transform into a non-monotonicbehaviour (double layer structure). A potential well formsclose to the wall which traps a fraction of the secondaryelectrons (space charge saturation regime). Moreover, forhigher electron energies (high voltage discharge), it losesits static character becoming a structure oscillating in space(extended in a region with size larger than Debye length)and time (on the GHz range), producing the so-called sheathinstability [3, 4]. Finally, electron–wall interaction is alsorelated to the electron anomalous conductivity.
2
Plasma Sources Sci. Technol. 17 (2008) 024003 F Taccogna et al
2.3. The anomalous electron conductivity
One of the most important open questions in the physics of Halldischarge concerns the electron cross-field mobility. Classicaldiffusion theory based on collision-induced transport, i.e.electron–neutral collisions (cross mobility µ⊥ ∝ B−2)underestimates the cross-field transport, and numerical modelsof the discharge usually invoke an adjustable diffusioncoefficient to achieve acceptable results. Moreover, thecomprehension of this phenomenon is vital for the optimizationof this device. The reason for this enhanced cross-fieldtransport is nowadays a subject of considerable and continueddebate. However, it is well accepted to attribute the anomalouselectron cross-field transport to three different sources.
– fluctuation-induced transport (fit): this kind of diffusion canbe divided into two classes which depend on the characterof the fluctuating azimuthal electric field Eθ [5]. Denotingthe kth Fourier space component of the electric field byEk = |Ek| exp[iφk(t)], in one case φk(t) is a statistical functionof time and the anomalous diffusion coefficient depends onthe correlation time of the electric field fluctuations [6],while in the second case, the electric field is made up ofa superposition of coherent waves φk(t) = −ωt + kθθ andthe anomalous diffusion arises from a resonance of particlesand waves which move along θ with the same velocityvphase ≈ vd = Ez/Br . For this reason, one is interestedin high frequency (1–50 MHz) short wavelength oscillationsin the plasma properties, which have been already detectedfrom experiments [7–11], numerical model [12,13] and linearstability analysis [14–19]. The origin of these HF fluctuationsis certain types of instabilities, among which the most probablecandidates are
(a) micro-instabilities (sheath [3, 4], stream oranisotropy [20]);
(b) resistive instability [15] (electrostatic lower hybrid waves)due to the coupling with the electron drift flow in thepresence of electron collisions;
(c) axial gradient-driven instability [16], identified as aRayleigh type;
(d) electron drift instability [19] based on the resonancebetween kθVd and the cyclotron harmonics n�e in thefrequency range �i � ω � �e, occurring for veryshort wavelengths close to or even below the electrongyroradius rL.
The anomalous axial electron current results from
jez,fit = eneEθ
Br
, (4)
which leads to a Bohm-type [21, 22] anomalous conductivityµ⊥ ∝ B−1;–wall-induced transport (wit): the electron–wall interactions(the so-called NWC [23, 24]) coming from a non-specularreflection or emission of electrons which leave the wallsfollowing another spiral trajectory displaced towards theanode. This creates a classical conductivity varying like B−2:
jez,wit = 2m
e
ne
H
√kTe
M
Ez
B2r
�
1 − �, (5)
where H = rout −rin is the channel width. In reality, the NWCis a more complex phenomenon including in non-linear waynumerous effects:
(a) secondary electron beam emitted from the wall andinducing secondaries on the opposite wall [24] (� issubstituted in equation (5) by an effective value �eff =�p/[1 + α(�p − �s)]), where α is the electron penetrationcoefficient from one wall to the opposite;
(b) macroroughness on the surface [25];
(c) ion-wall recombination [26] leading to an additionalcorrecting factor 2
√(Te/TXe) in equation (5);
(d) photoelectron emission from the wall due to UV radiation[27];
(e) sheath oscillations as recently demonstrated by MonteCarlo calculations [28].
–gradient-induced transport (git): non-local effect due to smalllength scale of gradients leading to a distortion of the gyro-motion, known as neoclassical conductivity.
Recently [29] it has been suggested that the general beliefthat Bohm-like anomalous conductivity was dominant outsidethe thruster channel whereas electron–wall conductivityprevails inside the channel is not valid. It has been concludedthat only the plasma azimuthal fluctuations are responsiblefor anomalous electron transport inside and outside the Hallthruster channel. Nevertheless, changing the wall materialof Hall thrusters results in significant plasma parameters andelectron axial current changes [30–32]. Then, there arestrong arguments to conclude that the azimuthal fluctuationscould be induced by surface effects. Finally, concerningthe neoclassical gradient-induced transport, it has beendemonstrated to have a negligible effect on the enhancementof the electron axial current inside the thruster channel [33].
2.4. Plasmadynamics of the plume. Near- and far-fieldregions
A major concern in the use of SPT-100 is the possibledamage their plumes may cause to the host spacecraft andto communication interference of satellites. Indeed, SPT-100,in operation produces, besides high energy ions and electronsemitted to neutralize the positive space charge, also neutralunionized propellant atoms and low energy ions created bycharge exchange (CX) collisions between ions and atoms inwhich electrons are transferred or by electron impact ionizationof neutral atoms. These particles are more influenced by theself-consistent electric fields that cause slow ions to propagateradially (reducing the efficiency) and to flow upstream, whilegaining energy. Finally, a very important region is the verynear-field region of the plume (up to 10 cm from the exit plane).In fact, in this region, there are many new aspects to takeinto account as plasma–wall interaction, magnetic field effect,non-isothermal electrons, electron–neutral collisions, cathodelocation, etc.
3
Plasma Sources Sci. Technol. 17 (2008) 024003 F Taccogna et al
3. PIC-MCC models
The complexity, up to the kinetic level, of the physics of SPT,in addition to the experimental difficulties in the investigationof such a small and surface-dominated plasma device andthe ability to simulate a wider variety of external ambientconditions, makes the use of numerical experiments [34,35] afundamental tool in understanding and optimizing this thruster.
Models of Hall thrusters have been developed using fluid[36–38] and hybrid fluid-particle approaches [39–42]. Aquestion which cannot be resolved by these models, and whichin fact strongly limits the reliability of their results, is the strongdeparture from the Maxwellian distribution of electrons (due tolow collisionality), the electron transport and the important roleof electron–wall interaction. As a result, SPT performance isaffected by both the state of the wall surface and the propertiesof plasma structures on Debye and electron-Larmor scales.The ideal numerical model would be a self-consistent particlemodel for all the species in three dimensions. Nowadays,such a model is unpractical because it would need too largeconsiderable amount of computation time. In order to keep thefully kinetic character of the model, it is necessary to reducethe dimensionality of the system.
3.1. 2D(r,z). General overview and the self-similarityprinciple
Nevertheless, additional tricks are necessary in order to speedup the execution of the code. Previous fully kinetic PIC codesused an artificial electron to ion mass ratio [43] and/or anartificial vacuum permittivity constant [44]. The smaller heavyparticle mass, for speeding up the neutrals and ions, decreasesthe number of iterations necessary to reach convergence, butat the same time it changes the ratio between electron and ioncurrent, a fundamental parameter for the anomalous electrontransport and thruster efficiency, modifying completely thedischarge characteristics. The larger permittivity constantdecreases the plasma frequency and increases the Debyelength, hence the computational time step and the requiredgrid cell size increase. This trick changes dramatically thepeculiar space and time scales of the plasma state making itimpossible to recover the original system.
Our proposal in the 2D(r, z) [45–50] model (axial-symmetry is considered neglecting all azimuthal gradients)is based on the reduction of the geometrical dimension ofthe thruster preserving more rigorously the values of therelevant parameters governing the physics of the discharge.This creates a more self-similar copy of the original system[51], invariant under the transformation. All the basicplasma characteristics in Hall discharge devices rely heavilyon the neutral ionization by electron impact and on theelectron confinement, therefore during the channel reductionthe Knudsen and Hall parameters must remain unchanged:
λeN
L= const; ωp
νeN= const; rL,e
L= const;
ωp
�e= const. (6)
Table 2. Scaling laws of self-similar system (un-scaled quantitiesare designed with asterisk).
Quantities Scaling laws
Length L = ζL∗
Particle density n = ζ−1n∗
Electric potential V = ζV ∗
Electric field E = E∗
Magnetic field B = ζ−1/2B∗
Mass flow rate m = ζ m∗
Velocity v = ζ 1/2v∗
Current I = ζ 3/2I ∗
Temperature T = ζT ∗
From these relations a number of scaling laws follows(summarized in table 2).
The total simulation time (on the order of neutral transittime TN) scales linearly with the length of the channel, whilethe time step �te, as imposed by the stability criterion of thenumerical method used to integrate the equations of motion,scales as the plasma oscillation period, that is, with the inverseof the square root of the density. Therefore, reducing the lineardimension L of the discharge by a factor ζ ∈ [0, 1], it leadsto a reduced number of PIC cycles NPIC necessary to reach asteady state given by
NPIC = TN
�te≈ L
√n = ς1/2N∗
PIC, (7)
where the asterisk is referred to the un-scaled system. TheDebye parameter is conserved: λD/L ∼ 1. This resultsin no reduction in the number of mesh cells necessary tocover the entire domain, and keep the physics of plasma–walltransition unchanged. Moreover, the ratio of plasma frequencyto electron cyclotron frequency is also conserved. This is animportant parameter for the plasma fluctuation dynamics inmagnetic confinement systems. Its conservation guarantees acorrect evaluation of UHF oscillations inside the channel andthe related anomalous electron transport.
In addition to the reduction of the number of total PICcycles, the number of real particles in the scaled systemNp,real = nVol = ζ 2N∗
p,real is reduced, allowing a betterstatistics in the simulation. Nevertheless, limitations inthe geometrical reduction are necessary. First, the plasmaparameter ND, the number of particles in a Debye sphere,is unavoidably reduced while PIC validity is based on therequirement that collective effects are dominant over thecollisional one, that is
ND � 1; ln ND
ND� 1. (8)
Furthermore, the ratio between surface and volume isunavoidably changed leading to the possible increasing of thesurface effects (i.e. secondary electron emission) in the reducedsystem. Finally, gradient-driven instabilities could appear dueto the fact that some plasma parameters scale differently fromthe size of the system.
Before the simulation (domain reported in figure 2) begins,we fix all the parameters that remain constant during the
4
Plasma Sources Sci. Technol. 17 (2008) 024003 F Taccogna et al
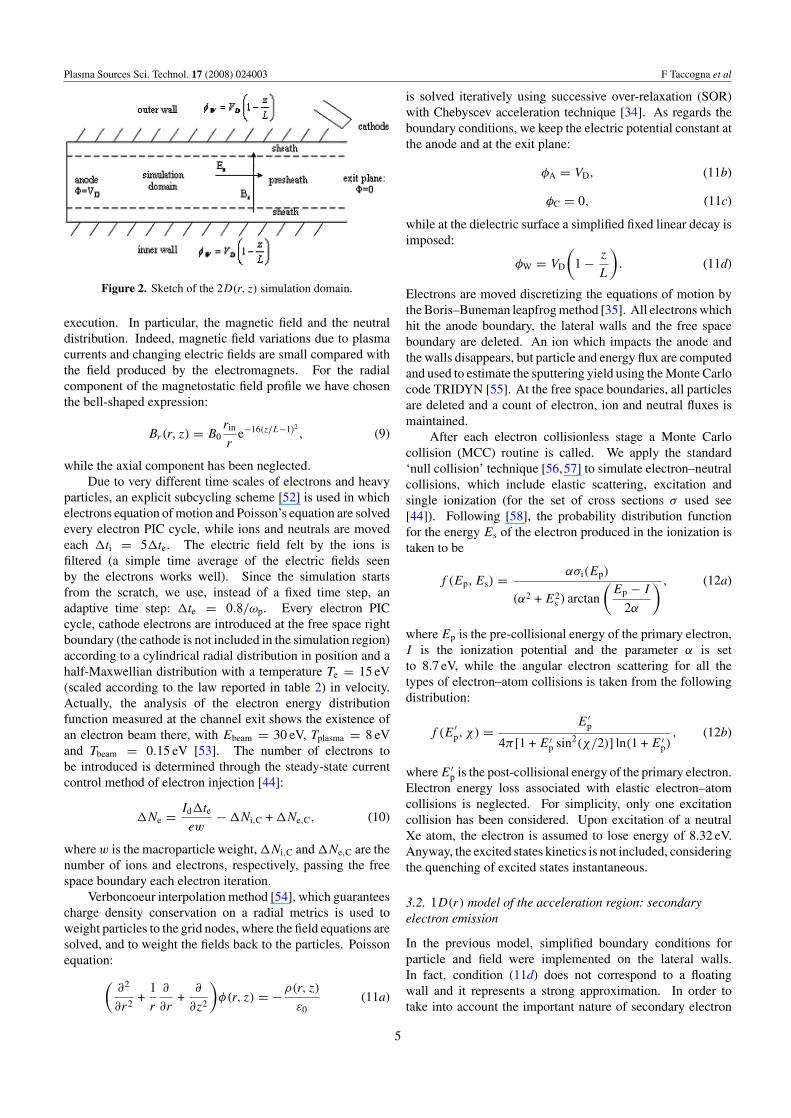
Figure 2. Sketch of the 2D(r, z) simulation domain.
execution. In particular, the magnetic field and the neutraldistribution. Indeed, magnetic field variations due to plasmacurrents and changing electric fields are small compared withthe field produced by the electromagnets. For the radialcomponent of the magnetostatic field profile we have chosenthe bell-shaped expression:
Br(r, z) = B0rin
re−16(z/L−1)2
, (9)
while the axial component has been neglected.Due to very different time scales of electrons and heavy
particles, an explicit subcycling scheme [52] is used in whichelectrons equation of motion and Poisson’s equation are solvedevery electron PIC cycle, while ions and neutrals are movedeach �ti = 5�te. The electric field felt by the ions isfiltered (a simple time average of the electric fields seenby the electrons works well). Since the simulation startsfrom the scratch, we use, instead of a fixed time step, anadaptive time step: �te = 0.8/ωp. Every electron PICcycle, cathode electrons are introduced at the free space rightboundary (the cathode is not included in the simulation region)according to a cylindrical radial distribution in position and ahalf-Maxwellian distribution with a temperature Te = 15 eV(scaled according to the law reported in table 2) in velocity.Actually, the analysis of the electron energy distributionfunction measured at the channel exit shows the existence ofan electron beam there, with Ebeam = 30 eV, Tplasma = 8 eVand Tbeam = 0.15 eV [53]. The number of electrons tobe introduced is determined through the steady-state currentcontrol method of electron injection [44]:
�Ne = Id�te
ew− �Ni,C + �Ne,C, (10)
where w is the macroparticle weight, �Ni,C and �Ne,C are thenumber of ions and electrons, respectively, passing the freespace boundary each electron iteration.
Verboncoeur interpolation method [54], which guaranteescharge density conservation on a radial metrics is used toweight particles to the grid nodes, where the field equations aresolved, and to weight the fields back to the particles. Poissonequation:(
∂2
∂r2+
1
r
∂
∂r+
∂
∂z2
)φ(r, z) = −ρ(r, z)
ε0(11a)
is solved iteratively using successive over-relaxation (SOR)with Chebyscev acceleration technique [34]. As regards theboundary conditions, we keep the electric potential constant atthe anode and at the exit plane:
φA = VD, (11b)
φC = 0, (11c)
while at the dielectric surface a simplified fixed linear decay isimposed:
φW = VD
(1 − z
L
). (11d)
Electrons are moved discretizing the equations of motion bythe Boris–Buneman leapfrog method [35]. All electrons whichhit the anode boundary, the lateral walls and the free spaceboundary are deleted. An ion which impacts the anode andthe walls disappears, but particle and energy flux are computedand used to estimate the sputtering yield using the Monte Carlocode TRIDYN [55]. At the free space boundaries, all particlesare deleted and a count of electron, ion and neutral fluxes ismaintained.
After each electron collisionless stage a Monte Carlocollision (MCC) routine is called. We apply the standard‘null collision’ technique [56,57] to simulate electron–neutralcollisions, which include elastic scattering, excitation andsingle ionization (for the set of cross sections σ used see[44]). Following [58], the probability distribution functionfor the energy Es of the electron produced in the ionization istaken to be
f (Ep, Es) = ασi(Ep)
(α2 + E2s ) arctan
(Ep − I
2α
) , (12a)
where Ep is the pre-collisional energy of the primary electron,I is the ionization potential and the parameter α is setto 8.7 eV, while the angular electron scattering for all thetypes of electron–atom collisions is taken from the followingdistribution:
f (E′p, χ) = E′
p
4π [1 + E′p sin2(χ/2)] ln(1 + E′
p), (12b)
where E′p is the post-collisional energy of the primary electron.
Electron energy loss associated with elastic electron–atomcollisions is neglected. For simplicity, only one excitationcollision has been considered. Upon excitation of a neutralXe atom, the electron is assumed to lose energy of 8.32 eV.Anyway, the excited states kinetics is not included, consideringthe quenching of excited states instantaneous.
3.2. 1D(r) model of the acceleration region: secondaryelectron emission
In the previous model, simplified boundary conditions forparticle and field were implemented on the lateral walls.In fact, condition (11d) does not correspond to a floatingwall and it represents a strong approximation. In order totake into account the important nature of secondary electron
5
Plasma Sources Sci. Technol. 17 (2008) 024003 F Taccogna et al
emission and floating potential condition of the dielectriclateral wall a 1D(r) [59–63] model of the accelerationregion of the discharge has been developed. The simulationhas been done per unit length in transverse direction foraxial-symmetry. The ‘local-field approximation’ is appliedneglecting the effects of axial gradients based on the fact thatin the acceleration part of the channel, the electron radialdynamics is much faster than the axial one due to the radialmagnetic field impedance. Concerning the ions, the situationis completely different, because their dynamics is mostlyaxial and radial. Ions are created by ionization and lost bywall recombination and axial upstream flow (towards the exitplane). Therefore, the total simulation time has to be limitedto the ion residence time in the acceleration region estimatedto be Ti ≈ 5 µs. In order to keep high the statistical quality ofthe simulation a non-uniform radial grid is implemented. Dueto cylindrical metrics, in order to have a constant volume, theradial cell size must be proportional to the radial position:
�r(j) = (√
j −√
j − 1)�r(1) j = 2, . . . , Nr, (13)
where �r(1) = H/√
N r, with H = (rout − rin) the channelwidth and Nr the number of grid points. In this way, the averagenumber of particles per cell varies between 5 and 100. Thetimestep �t is chosen such that ωp�t = 0.3.
The prescribed values used as input parameters,characteristic for the acceleration region, are neutral densitynN = 2 × 10¹⁸ m−3 (again neutral dynamics is not consideredand neutrals are treated as a fixed background); axial electricfield Ez = 104 V m−1; radial magnetic field Br,in = 150 G(non-uniform, see equation (9)). The simulation starts witha uniform distribution of electrons and ions along the radialdomain with a density np = 0.8 × 10¹⁷ m−3. Velocitiesare sampled from a Maxwellian distribution with initialtemperatures Te = 1 eV and Ti = 0.1 eV. The discharge is self-sustained with electrons created by bulk ionization and surfaceemission. The contribution from the cathode neutralizer isneglected due to the fact that in the acceleration region thecurrent is carried mostly by ions. The Poisson equation incylindrical radial coordinate r:(
∂2
∂r2+
1
r
∂
∂r
)φ(r) = −ρ(r)
ε0(14a)
is discretized and solved directly using the Thomas tridiagonalalgorithm [64]. For this purpose, a fixed Dirichelet boundarycondition �wo = 0 V is used at the outer wall as referencepotential, while the inner surface can float electrically withrespect to the plasma such that the total current to the surfaceis zero (zero-current condition). The electric field (Neumanncondition) at the wall is proportional to the net charge σwi
which has accumulated on the surface (the possible surfaceconductivity of the dielectric is neglected):
∂φ
∂r
∣∣∣∣wi
= Er,wi = −σwi
ε0. (14b)
The same bulk collision methodology of the 2D(r, z)
model is used, while concerning the boundary module, when anelectron strikes the dielectric wall, a Monte Carlo probabilistic
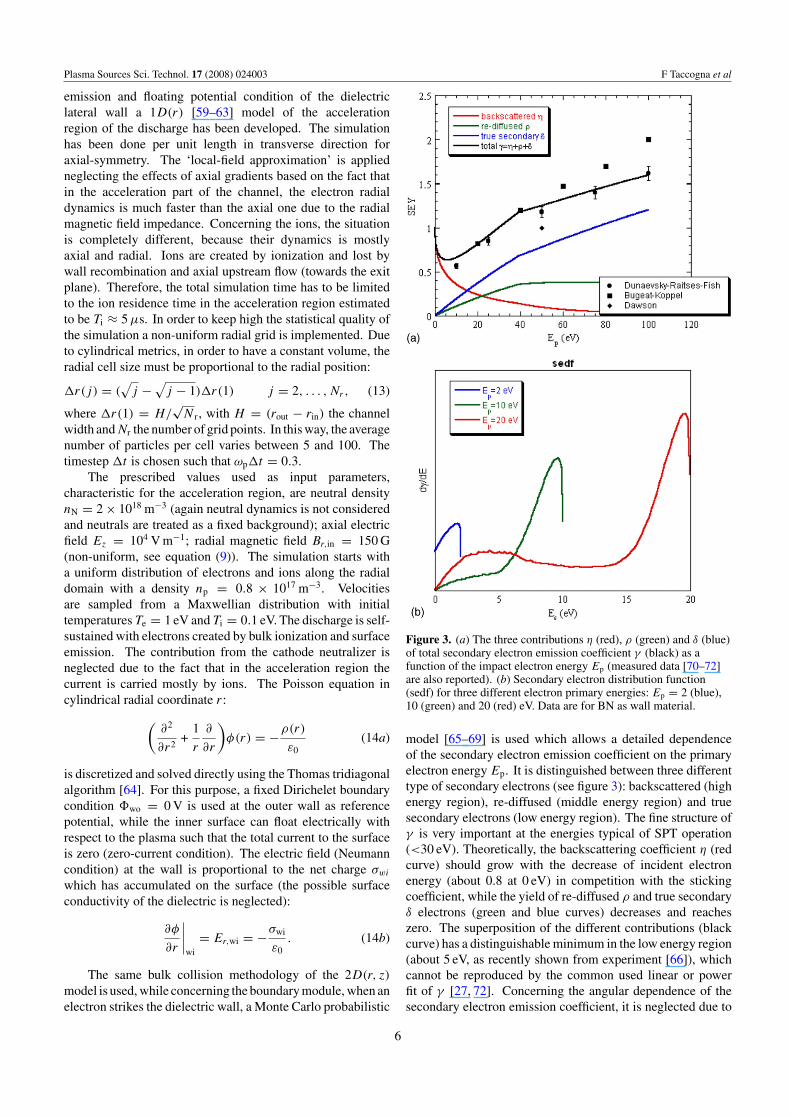
Figure 3. (a) The three contributions η (red), ρ (green) and δ (blue)of total secondary electron emission coefficient γ (black) as afunction of the impact electron energy Ep (measured data [70–72]are also reported). (b) Secondary electron distribution function(sedf) for three different electron primary energies: Ep = 2 (blue),10 (green) and 20 (red) eV. Data are for BN as wall material.
model [65–69] is used which allows a detailed dependenceof the secondary electron emission coefficient on the primaryelectron energy Ep. It is distinguished between three differenttype of secondary electrons (see figure 3): backscattered (highenergy region), re-diffused (middle energy region) and truesecondary electrons (low energy region). The fine structure ofγ is very important at the energies typical of SPT operation(<30 eV). Theoretically, the backscattering coefficient η (redcurve) should grow with the decrease of incident electronenergy (about 0.8 at 0 eV) in competition with the stickingcoefficient, while the yield of re-diffused ρ and true secondaryδ electrons (green and blue curves) decreases and reacheszero. The superposition of the different contributions (blackcurve) has a distinguishable minimum in the low energy region(about 5 eV, as recently shown from experiment [66]), whichcannot be reproduced by the common used linear or powerfit of γ [27, 72]. Concerning the angular dependence of thesecondary electron emission coefficient, it is neglected due to
6
Plasma Sources Sci. Technol. 17 (2008) 024003 F Taccogna et al
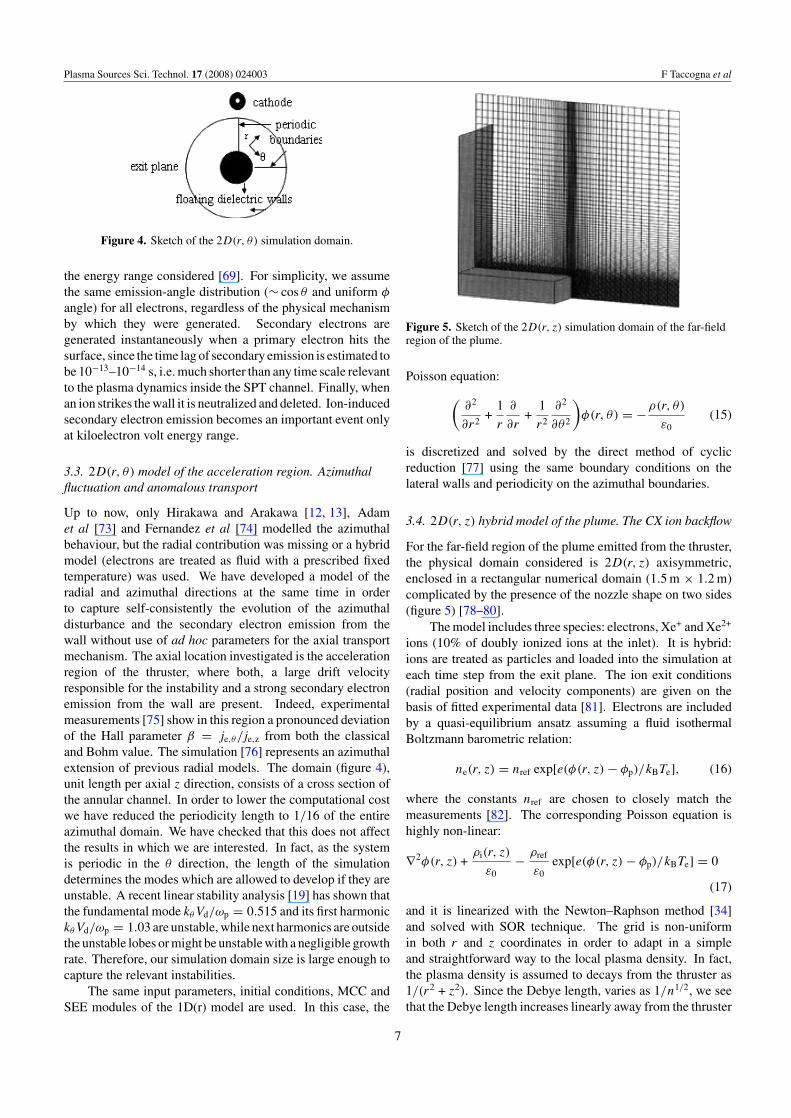
Figure 4. Sketch of the 2D(r, θ) simulation domain.
the energy range considered [69]. For simplicity, we assumethe same emission-angle distribution (∼ cos θ and uniform φ
angle) for all electrons, regardless of the physical mechanismby which they were generated. Secondary electrons aregenerated instantaneously when a primary electron hits thesurface, since the time lag of secondary emission is estimated tobe 10−13–10−14 s, i.e. much shorter than any time scale relevantto the plasma dynamics inside the SPT channel. Finally, whenan ion strikes the wall it is neutralized and deleted. Ion-inducedsecondary electron emission becomes an important event onlyat kiloelectron volt energy range.
3.3. 2D(r, θ) model of the acceleration region. Azimuthalfluctuation and anomalous transport
Up to now, only Hirakawa and Arakawa [12, 13], Adamet al [73] and Fernandez et al [74] modelled the azimuthalbehaviour, but the radial contribution was missing or a hybridmodel (electrons are treated as fluid with a prescribed fixedtemperature) was used. We have developed a model of theradial and azimuthal directions at the same time in orderto capture self-consistently the evolution of the azimuthaldisturbance and the secondary electron emission from thewall without use of ad hoc parameters for the axial transportmechanism. The axial location investigated is the accelerationregion of the thruster, where both, a large drift velocityresponsible for the instability and a strong secondary electronemission from the wall are present. Indeed, experimentalmeasurements [75] show in this region a pronounced deviationof the Hall parameter β = je,θ /je,z from both the classicaland Bohm value. The simulation [76] represents an azimuthalextension of previous radial models. The domain (figure 4),unit length per axial z direction, consists of a cross section ofthe annular channel. In order to lower the computational costwe have reduced the periodicity length to 1/16 of the entireazimuthal domain. We have checked that this does not affectthe results in which we are interested. In fact, as the systemis periodic in the θ direction, the length of the simulationdetermines the modes which are allowed to develop if they areunstable. A recent linear stability analysis [19] has shown thatthe fundamental mode kθVd/ωp = 0.515 and its first harmonickθVd/ωp = 1.03 are unstable, while next harmonics are outsidethe unstable lobes or might be unstable with a negligible growthrate. Therefore, our simulation domain size is large enough tocapture the relevant instabilities.
The same input parameters, initial conditions, MCC andSEE modules of the 1D(r) model are used. In this case, the
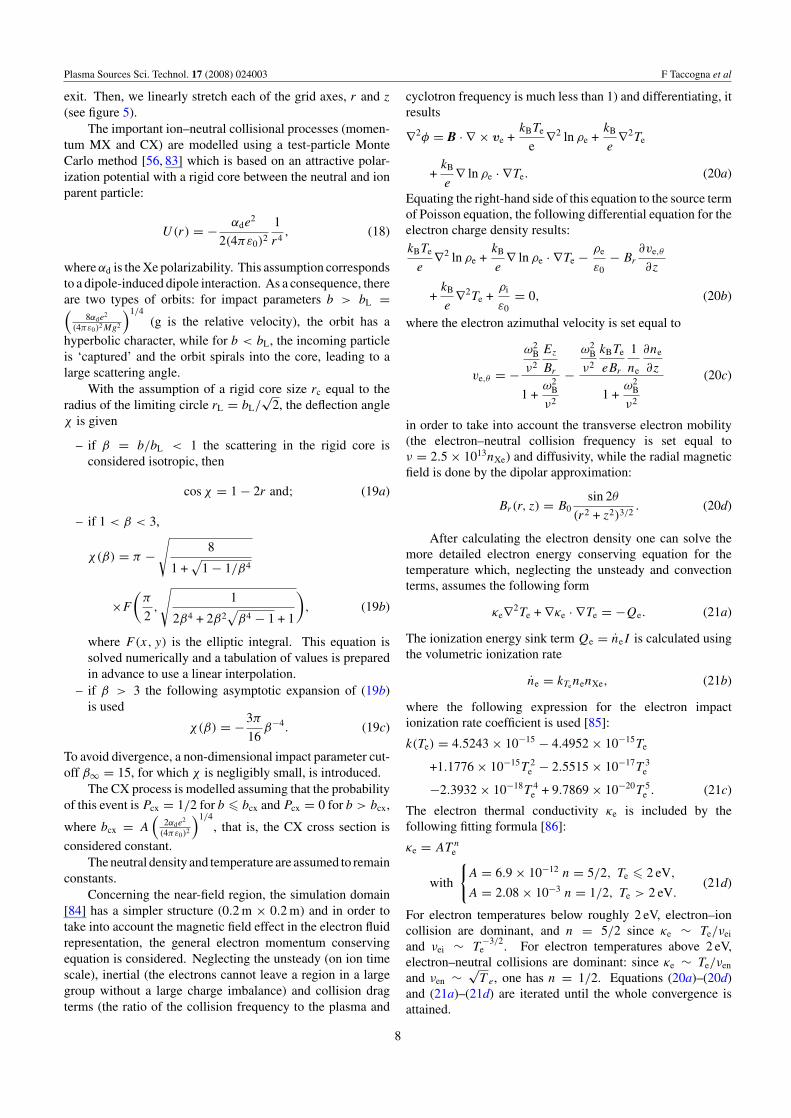
Figure 5. Sketch of the 2D(r, z) simulation domain of the far-fieldregion of the plume.
Poisson equation:
(∂2
∂r2+
1
r
∂
∂r+
1
r2
∂2
∂θ2
)φ(r, θ) = −ρ(r, θ)
ε0(15)
is discretized and solved by the direct method of cyclicreduction [77] using the same boundary conditions on thelateral walls and periodicity on the azimuthal boundaries.
3.4. 2D(r, z) hybrid model of the plume. The CX ion backflow
For the far-field region of the plume emitted from the thruster,the physical domain considered is 2D(r, z) axisymmetric,enclosed in a rectangular numerical domain (1.5 m × 1.2 m)complicated by the presence of the nozzle shape on two sides(figure 5) [78–80].
The model includes three species: electrons, Xe+ and Xe2+
ions (10% of doubly ionized ions at the inlet). It is hybrid:ions are treated as particles and loaded into the simulation ateach time step from the exit plane. The ion exit conditions(radial position and velocity components) are given on thebasis of fitted experimental data [81]. Electrons are includedby a quasi-equilibrium ansatz assuming a fluid isothermalBoltzmann barometric relation:
ne(r, z) = nref exp[e(φ(r, z) − φp)/kBTe], (16)
where the constants nref are chosen to closely match themeasurements [82]. The corresponding Poisson equation ishighly non-linear:
∇2φ(r, z) +ρi(r, z)
ε0− ρref
ε0exp[e(φ(r, z) − φp)/kBTe] = 0
(17)
and it is linearized with the Newton–Raphson method [34]and solved with SOR technique. The grid is non-uniformin both r and z coordinates in order to adapt in a simpleand straightforward way to the local plasma density. In fact,the plasma density is assumed to decays from the thruster as1/(r2 + z2). Since the Debye length, varies as 1/n1/2, we seethat the Debye length increases linearly away from the thruster
7
Plasma Sources Sci. Technol. 17 (2008) 024003 F Taccogna et al
exit. Then, we linearly stretch each of the grid axes, r and z
(see figure 5).The important ion–neutral collisional processes (momen-
tum MX and CX) are modelled using a test-particle MonteCarlo method [56, 83] which is based on an attractive polar-ization potential with a rigid core between the neutral and ionparent particle:
U(r) = − αde2
2(4πε0)2
1
r4, (18)
where αd is the Xe polarizability. This assumption correspondsto a dipole-induced dipole interaction. As a consequence, thereare two types of orbits: for impact parameters b > bL =(
8αde2
(4πε0)2Mg2
)1/4(g is the relative velocity), the orbit has a
hyperbolic character, while for b < bL, the incoming particleis ‘captured’ and the orbit spirals into the core, leading to alarge scattering angle.
With the assumption of a rigid core size rc equal to theradius of the limiting circle rL = bL/
√2, the deflection angle
χ is given
– if β = b/bL < 1 the scattering in the rigid core isconsidered isotropic, then
cos χ = 1 − 2r and; (19a)
– if 1 < β < 3,
χ(β) = π −√
8
1 +√
1 − 1/β4
×F
(π
2,
√1
2β4 + 2β2√
β4 − 1 + 1
), (19b)
where F(x, y) is the elliptic integral. This equation issolved numerically and a tabulation of values is preparedin advance to use a linear interpolation.
– if β > 3 the following asymptotic expansion of (19b)is used
χ(β) = −3π
16β−4. (19c)
To avoid divergence, a non-dimensional impact parameter cut-off β∞ = 15, for which χ is negligibly small, is introduced.
The CX process is modelled assuming that the probabilityof this event is Pcx = 1/2 for b � bcx and Pcx = 0 for b > bcx,
where bcx = A(
2αde2
(4πε0)2
)1/4, that is, the CX cross section is
considered constant.The neutral density and temperature are assumed to remain
constants.Concerning the near-field region, the simulation domain
[84] has a simpler structure (0.2 m × 0.2 m) and in order totake into account the magnetic field effect in the electron fluidrepresentation, the general electron momentum conservingequation is considered. Neglecting the unsteady (on ion timescale), inertial (the electrons cannot leave a region in a largegroup without a large charge imbalance) and collision dragterms (the ratio of the collision frequency to the plasma and
cyclotron frequency is much less than 1) and differentiating, itresults
∇2φ = B · ∇ × ve +kBTe
e∇2 ln ρe +
kB
e∇2Te
+kB
e∇ ln ρe · ∇Te. (20a)
Equating the right-hand side of this equation to the source termof Poisson equation, the following differential equation for theelectron charge density results:kBTe
e∇2 ln ρe +
kB
e∇ ln ρe · ∇Te − ρe
ε0− Br
∂ve,θ
∂z
+kB
e∇2Te +
ρi
ε0= 0, (20b)
where the electron azimuthal velocity is set equal to
ve,θ = −ω2
B
ν2
Ez
Br
1 +ω2
B
ν2
−ω2
B
ν2
kBTe
eBr
1
ne
∂ne
∂z
1 +ω2
B
ν2
(20c)
in order to take into account the transverse electron mobility(the electron–neutral collision frequency is set equal toν = 2.5 × 10¹³nXe) and diffusivity, while the radial magneticfield is done by the dipolar approximation:
Br(r, z) = B0sin 2θ
(r2 + z2)3/2. (20d)
After calculating the electron density one can solve themore detailed electron energy conserving equation for thetemperature which, neglecting the unsteady and convectionterms, assumes the following form
κe∇2Te + ∇κe · ∇Te = −Qe. (21a)
The ionization energy sink term Qe = neI is calculated usingthe volumetric ionization rate
ne = kTenenXe, (21b)
where the following expression for the electron impactionization rate coefficient is used [85]:
k(Te) = 4.5243 × 10⁻¹⁵ − 4.4952 × 10⁻¹⁵Te
+1.1776 × 10⁻¹⁵T 2e − 2.5515 × 10⁻¹⁷T 3
e
−2.3932 × 10⁻¹⁸T 4e + 9.7869 × 10⁻²⁰T 5
e . (21c)
The electron thermal conductivity κe is included by thefollowing fitting formula [86]:
κe = AT ne
with
{A = 6.9 × 10⁻¹² n = 5/2, Te � 2 eV,
A = 2.08 × 10⁻³ n = 1/2, Te > 2 eV.(21d)
For electron temperatures below roughly 2 eV, electron–ioncollision are dominant, and n = 5/2 since κe ∼ Te/νei
and νei ∼ T−3/2
e . For electron temperatures above 2 eV,electron–neutral collisions are dominant: since κe ∼ Te/νen
and νen ∼ √T e, one has n = 1/2. Equations (20a)–(20d)
and (21a)–(21d) are iterated until the whole convergence isattained.
8
Plasma Sources Sci. Technol. 17 (2008) 024003 F Taccogna et al
4. Results and discussion
4.1. 2D(r, z) discharge: acceleration mechanism andvalidation and limit of the scaling scheme
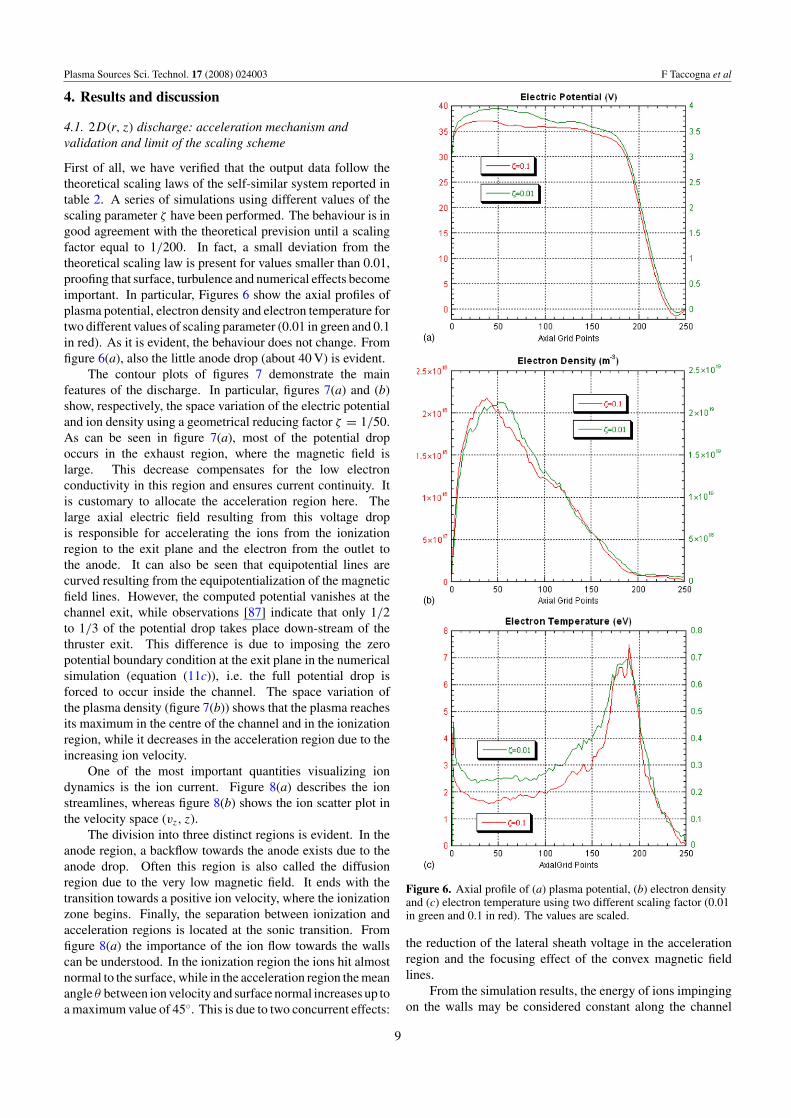
First of all, we have verified that the output data follow thetheoretical scaling laws of the self-similar system reported intable 2. A series of simulations using different values of thescaling parameter ζ have been performed. The behaviour is ingood agreement with the theoretical prevision until a scalingfactor equal to 1/200. In fact, a small deviation from thetheoretical scaling law is present for values smaller than 0.01,proofing that surface, turbulence and numerical effects becomeimportant. In particular, Figures 6 show the axial profiles ofplasma potential, electron density and electron temperature fortwo different values of scaling parameter (0.01 in green and 0.1in red). As it is evident, the behaviour does not change. Fromfigure 6(a), also the little anode drop (about 40 V) is evident.
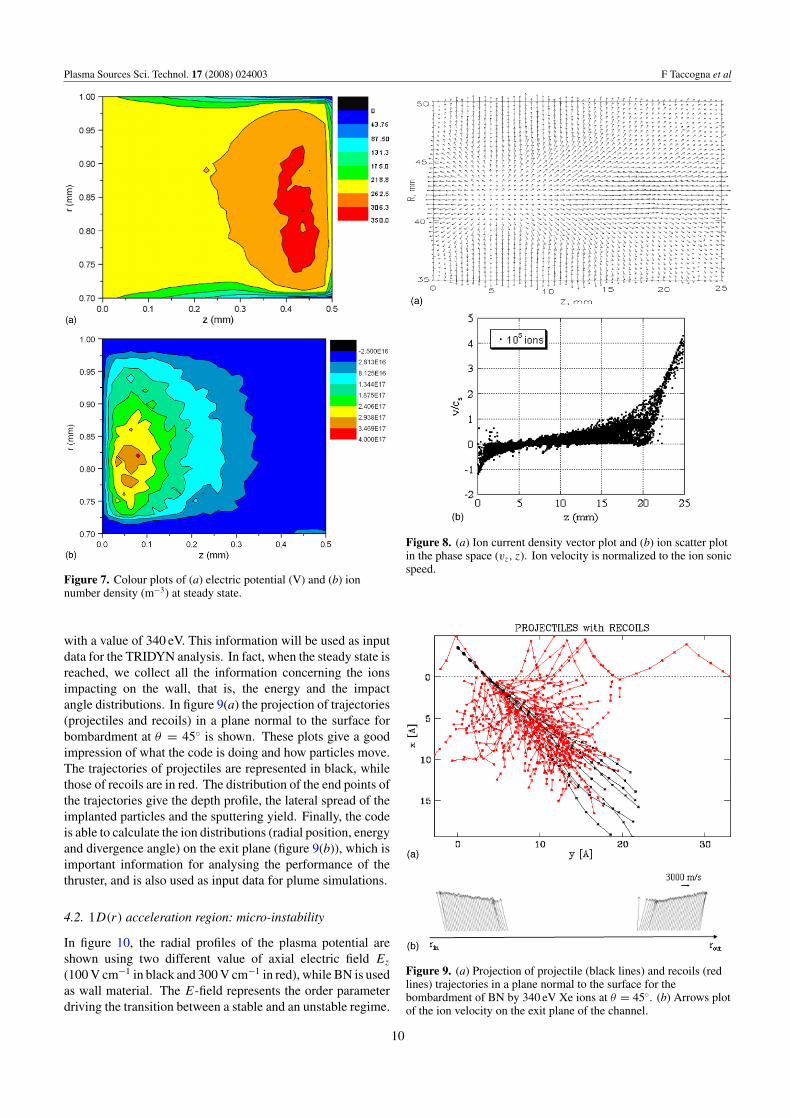
The contour plots of figures 7 demonstrate the mainfeatures of the discharge. In particular, figures 7(a) and (b)show, respectively, the space variation of the electric potentialand ion density using a geometrical reducing factor ζ = 1/50.As can be seen in figure 7(a), most of the potential dropoccurs in the exhaust region, where the magnetic field islarge. This decrease compensates for the low electronconductivity in this region and ensures current continuity. Itis customary to allocate the acceleration region here. Thelarge axial electric field resulting from this voltage dropis responsible for accelerating the ions from the ionizationregion to the exit plane and the electron from the outlet tothe anode. It can also be seen that equipotential lines arecurved resulting from the equipotentialization of the magneticfield lines. However, the computed potential vanishes at thechannel exit, while observations [87] indicate that only 1/2to 1/3 of the potential drop takes place down-stream of thethruster exit. This difference is due to imposing the zeropotential boundary condition at the exit plane in the numericalsimulation (equation (11c)), i.e. the full potential drop isforced to occur inside the channel. The space variation ofthe plasma density (figure 7(b)) shows that the plasma reachesits maximum in the centre of the channel and in the ionizationregion, while it decreases in the acceleration region due to theincreasing ion velocity.
One of the most important quantities visualizing iondynamics is the ion current. Figure 8(a) describes the ionstreamlines, whereas figure 8(b) shows the ion scatter plot inthe velocity space (vz, z).
The division into three distinct regions is evident. In theanode region, a backflow towards the anode exists due to theanode drop. Often this region is also called the diffusionregion due to the very low magnetic field. It ends with thetransition towards a positive ion velocity, where the ionizationzone begins. Finally, the separation between ionization andacceleration regions is located at the sonic transition. Fromfigure 8(a) the importance of the ion flow towards the wallscan be understood. In the ionization region the ions hit almostnormal to the surface, while in the acceleration region the meanangle θ between ion velocity and surface normal increases up toa maximum value of 45◦. This is due to two concurrent effects:
Figure 6. Axial profile of (a) plasma potential, (b) electron densityand (c) electron temperature using two different scaling factor (0.01in green and 0.1 in red). The values are scaled.
the reduction of the lateral sheath voltage in the accelerationregion and the focusing effect of the convex magnetic fieldlines.
From the simulation results, the energy of ions impingingon the walls may be considered constant along the channel
9
Plasma Sources Sci. Technol. 17 (2008) 024003 F Taccogna et al
Figure 7. Colour plots of (a) electric potential (V) and (b) ionnumber density (m−3) at steady state.
with a value of 340 eV. This information will be used as inputdata for the TRIDYN analysis. In fact, when the steady state isreached, we collect all the information concerning the ionsimpacting on the wall, that is, the energy and the impactangle distributions. In figure 9(a) the projection of trajectories(projectiles and recoils) in a plane normal to the surface forbombardment at θ = 45◦ is shown. These plots give a goodimpression of what the code is doing and how particles move.The trajectories of projectiles are represented in black, whilethose of recoils are in red. The distribution of the end points ofthe trajectories give the depth profile, the lateral spread of theimplanted particles and the sputtering yield. Finally, the codeis able to calculate the ion distributions (radial position, energyand divergence angle) on the exit plane (figure 9(b)), which isimportant information for analysing the performance of thethruster, and is also used as input data for plume simulations.
4.2. 1D(r) acceleration region: micro-instability
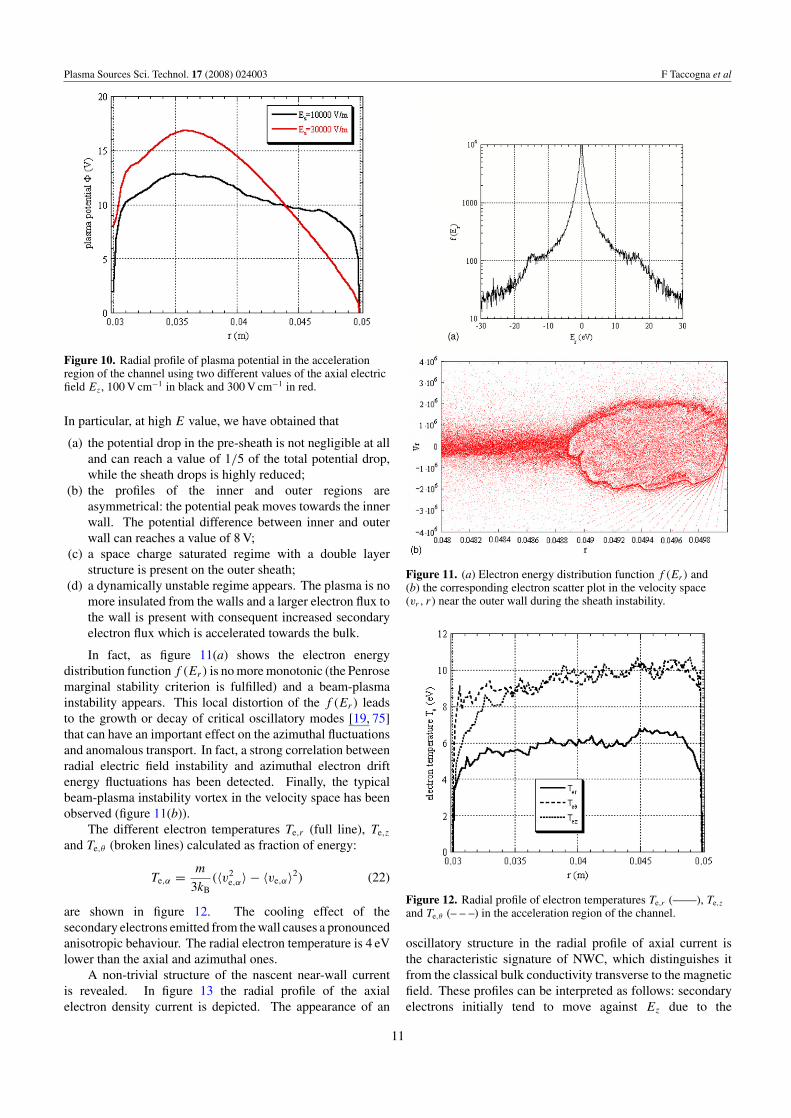
In figure 10, the radial profiles of the plasma potential areshown using two different value of axial electric field Ez
(100 V cm−1 in black and 300 V cm−1 in red), while BN is usedas wall material. The E-field represents the order parameterdriving the transition between a stable and an unstable regime.
Figure 8. (a) Ion current density vector plot and (b) ion scatter plotin the phase space (vz, z). Ion velocity is normalized to the ion sonicspeed.
Figure 9. (a) Projection of projectile (black lines) and recoils (redlines) trajectories in a plane normal to the surface for thebombardment of BN by 340 eV Xe ions at θ = 45◦. (b) Arrows plotof the ion velocity on the exit plane of the channel.
10
Plasma Sources Sci. Technol. 17 (2008) 024003 F Taccogna et al
Figure 10. Radial profile of plasma potential in the accelerationregion of the channel using two different values of the axial electricfield Ez, 100 V cm−1 in black and 300 V cm−1 in red.
In particular, at high E value, we have obtained that
(a) the potential drop in the pre-sheath is not negligible at alland can reach a value of 1/5 of the total potential drop,while the sheath drops is highly reduced;
(b) the profiles of the inner and outer regions areasymmetrical: the potential peak moves towards the innerwall. The potential difference between inner and outerwall can reaches a value of 8 V;
(c) a space charge saturated regime with a double layerstructure is present on the outer sheath;
(d) a dynamically unstable regime appears. The plasma is nomore insulated from the walls and a larger electron flux tothe wall is present with consequent increased secondaryelectron flux which is accelerated towards the bulk.
In fact, as figure 11(a) shows the electron energydistribution function f (Er) is no more monotonic (the Penrosemarginal stability criterion is fulfilled) and a beam-plasmainstability appears. This local distortion of the f (Er) leadsto the growth or decay of critical oscillatory modes [19, 75]that can have an important effect on the azimuthal fluctuationsand anomalous transport. In fact, a strong correlation betweenradial electric field instability and azimuthal electron driftenergy fluctuations has been detected. Finally, the typicalbeam-plasma instability vortex in the velocity space has beenobserved (figure 11(b)).
The different electron temperatures Te,r (full line), Te,z
and Te,θ (broken lines) calculated as fraction of energy:
Te,α = m
3kB(〈v2
e,α〉 − 〈ve,α〉2) (22)
are shown in figure 12. The cooling effect of thesecondary electrons emitted from the wall causes a pronouncedanisotropic behaviour. The radial electron temperature is 4 eVlower than the axial and azimuthal ones.
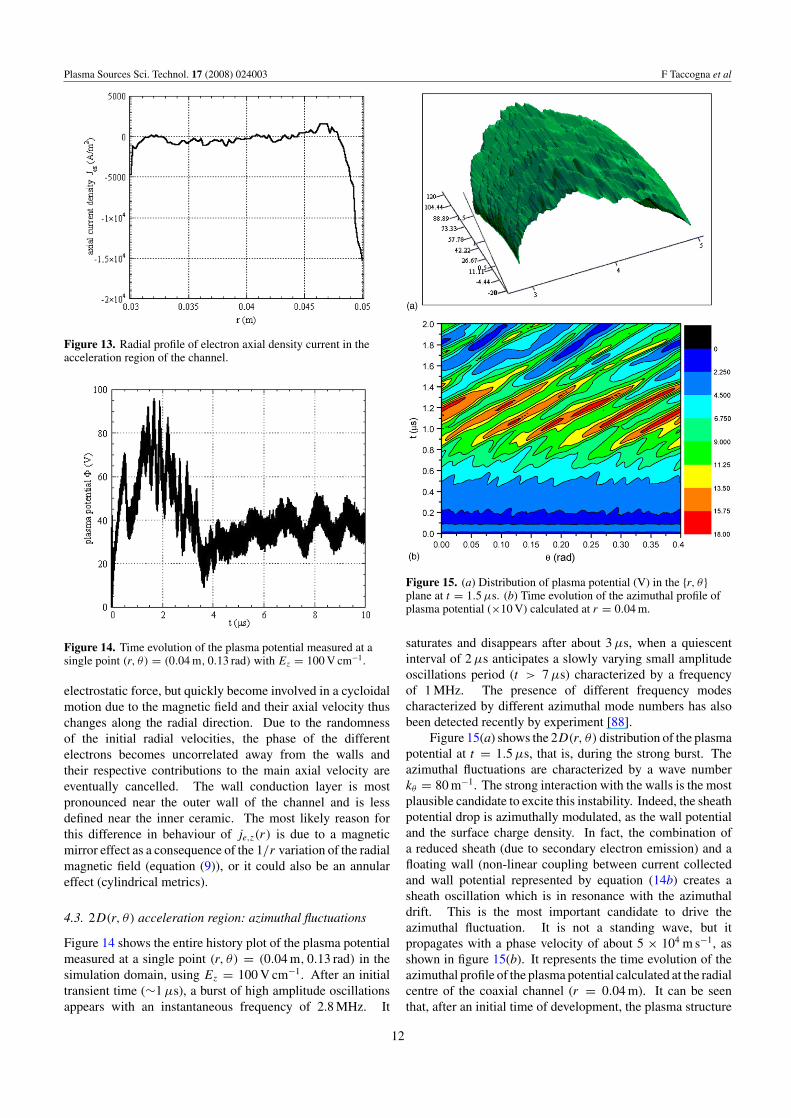
A non-trivial structure of the nascent near-wall currentis revealed. In figure 13 the radial profile of the axialelectron density current is depicted. The appearance of an
Figure 11. (a) Electron energy distribution function f (Er) and(b) the corresponding electron scatter plot in the velocity space(vr , r) near the outer wall during the sheath instability.
Figure 12. Radial profile of electron temperatures Te,r (——), Te,z
and Te,θ (– – –) in the acceleration region of the channel.
oscillatory structure in the radial profile of axial current isthe characteristic signature of NWC, which distinguishes itfrom the classical bulk conductivity transverse to the magneticfield. These profiles can be interpreted as follows: secondaryelectrons initially tend to move against Ez due to the
11
Plasma Sources Sci. Technol. 17 (2008) 024003 F Taccogna et al
Figure 13. Radial profile of electron axial density current in theacceleration region of the channel.
Figure 14. Time evolution of the plasma potential measured at asingle point (r, θ) = (0.04 m, 0.13 rad) with Ez = 100 V cm−1.
electrostatic force, but quickly become involved in a cycloidalmotion due to the magnetic field and their axial velocity thuschanges along the radial direction. Due to the randomnessof the initial radial velocities, the phase of the differentelectrons becomes uncorrelated away from the walls andtheir respective contributions to the main axial velocity areeventually cancelled. The wall conduction layer is mostpronounced near the outer wall of the channel and is lessdefined near the inner ceramic. The most likely reason forthis difference in behaviour of je,z(r) is due to a magneticmirror effect as a consequence of the 1/r variation of the radialmagnetic field (equation (9)), or it could also be an annulareffect (cylindrical metrics).
4.3. 2D(r, θ) acceleration region: azimuthal fluctuations
Figure 14 shows the entire history plot of the plasma potentialmeasured at a single point (r, θ) = (0.04 m, 0.13 rad) in thesimulation domain, using Ez = 100 V cm−1. After an initialtransient time (∼1 µs), a burst of high amplitude oscillationsappears with an instantaneous frequency of 2.8 MHz. It
Figure 15. (a) Distribution of plasma potential (V) in the {r, θ}plane at t = 1.5 µs. (b) Time evolution of the azimuthal profile ofplasma potential (×10 V) calculated at r = 0.04 m.
saturates and disappears after about 3 µs, when a quiescentinterval of 2 µs anticipates a slowly varying small amplitudeoscillations period (t > 7 µs) characterized by a frequencyof 1 MHz. The presence of different frequency modescharacterized by different azimuthal mode numbers has alsobeen detected recently by experiment [88].
Figure 15(a) shows the 2D(r, θ) distribution of the plasmapotential at t = 1.5 µs, that is, during the strong burst. Theazimuthal fluctuations are characterized by a wave numberkθ = 80 m−1. The strong interaction with the walls is the mostplausible candidate to excite this instability. Indeed, the sheathpotential drop is azimuthally modulated, as the wall potentialand the surface charge density. In fact, the combination ofa reduced sheath (due to secondary electron emission) and afloating wall (non-linear coupling between current collectedand wall potential represented by equation (14b) creates asheath oscillation which is in resonance with the azimuthaldrift. This is the most important candidate to drive theazimuthal fluctuation. It is not a standing wave, but itpropagates with a phase velocity of about 5 × 10⁴ m s−1, asshown in figure 15(b). It represents the time evolution of theazimuthal profile of the plasma potential calculated at the radialcentre of the coaxial channel (r = 0.04 m). It can be seenthat, after an initial time of development, the plasma structure
12
Plasma Sources Sci. Technol. 17 (2008) 024003 F Taccogna et al
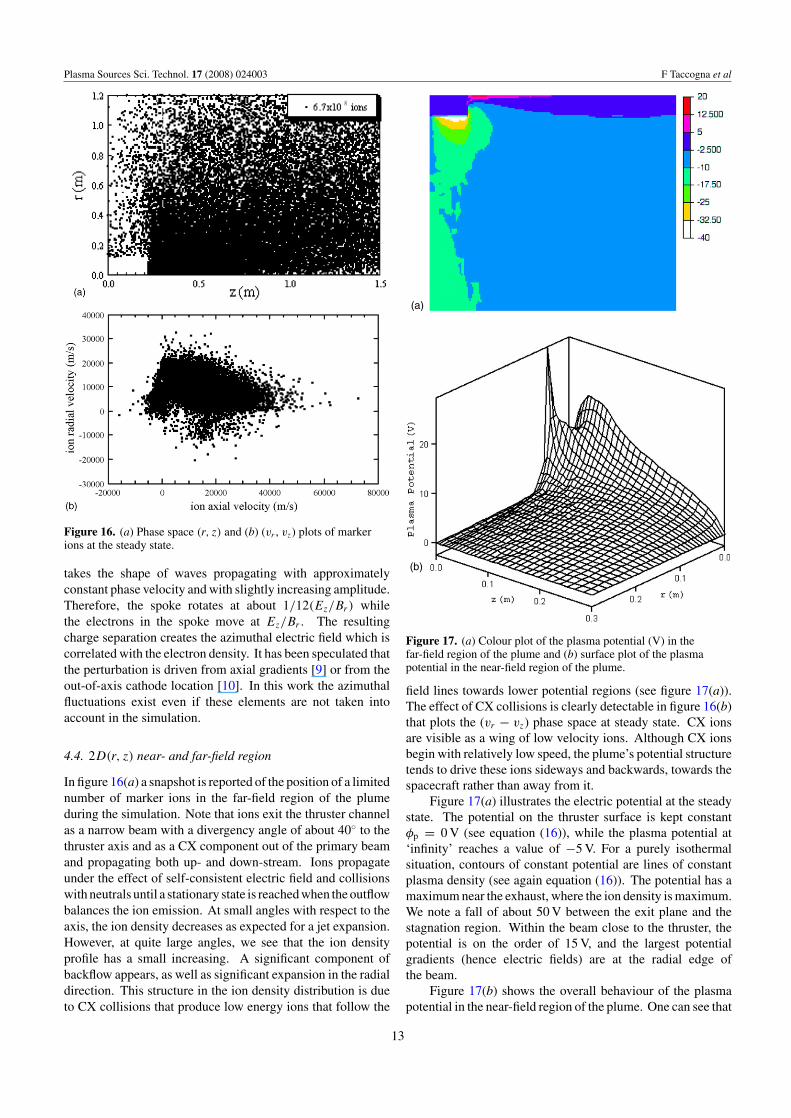
Figure 16. (a) Phase space (r, z) and (b) (vr , vz) plots of markerions at the steady state.
takes the shape of waves propagating with approximatelyconstant phase velocity and with slightly increasing amplitude.Therefore, the spoke rotates at about 1/12(Ez/Br) whilethe electrons in the spoke move at Ez/Br . The resultingcharge separation creates the azimuthal electric field which iscorrelated with the electron density. It has been speculated thatthe perturbation is driven from axial gradients [9] or from theout-of-axis cathode location [10]. In this work the azimuthalfluctuations exist even if these elements are not taken intoaccount in the simulation.
4.4. 2D(r, z) near- and far-field region
In figure 16(a) a snapshot is reported of the position of a limitednumber of marker ions in the far-field region of the plumeduring the simulation. Note that ions exit the thruster channelas a narrow beam with a divergency angle of about 40◦ to thethruster axis and as a CX component out of the primary beamand propagating both up- and down-stream. Ions propagateunder the effect of self-consistent electric field and collisionswith neutrals until a stationary state is reached when the outflowbalances the ion emission. At small angles with respect to theaxis, the ion density decreases as expected for a jet expansion.However, at quite large angles, we see that the ion densityprofile has a small increasing. A significant component ofbackflow appears, as well as significant expansion in the radialdirection. This structure in the ion density distribution is dueto CX collisions that produce low energy ions that follow the
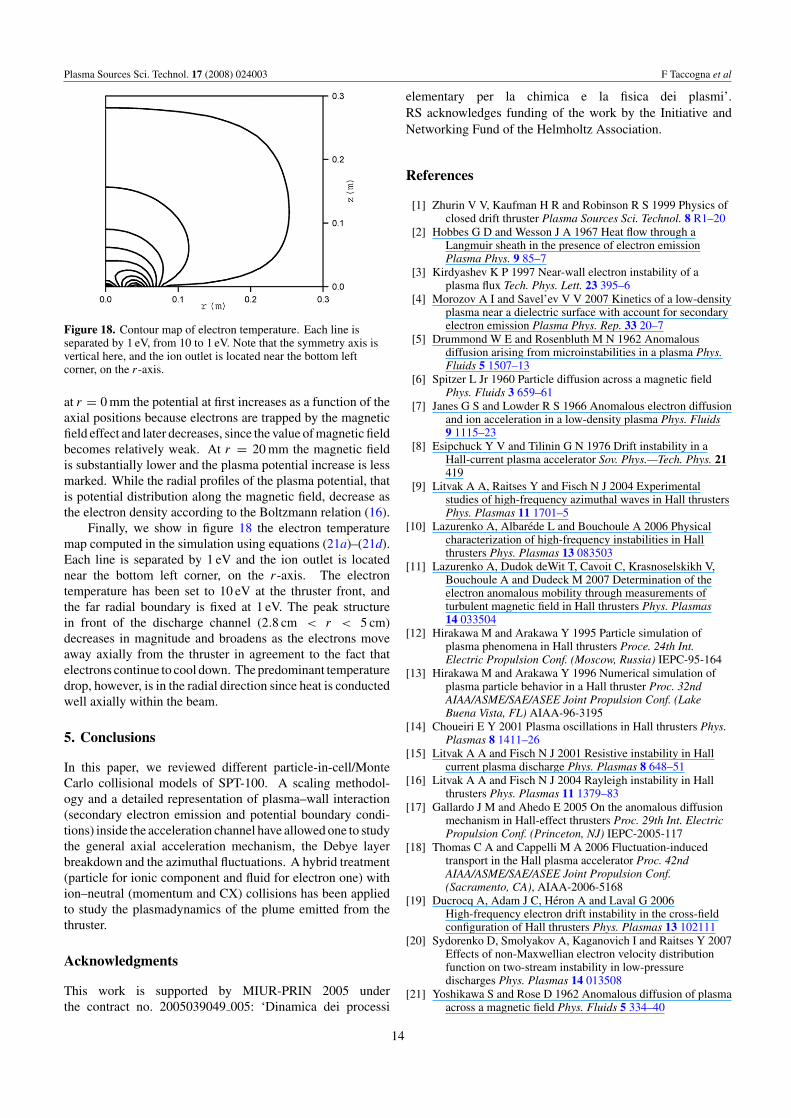
Figure 17. (a) Colour plot of the plasma potential (V) in thefar-field region of the plume and (b) surface plot of the plasmapotential in the near-field region of the plume.
field lines towards lower potential regions (see figure 17(a)).The effect of CX collisions is clearly detectable in figure 16(b)that plots the (vr − vz) phase space at steady state. CX ionsare visible as a wing of low velocity ions. Although CX ionsbegin with relatively low speed, the plume’s potential structuretends to drive these ions sideways and backwards, towards thespacecraft rather than away from it.
Figure 17(a) illustrates the electric potential at the steadystate. The potential on the thruster surface is kept constantφp = 0 V (see equation (16)), while the plasma potential at‘infinity’ reaches a value of −5 V. For a purely isothermalsituation, contours of constant potential are lines of constantplasma density (see again equation (16)). The potential has amaximum near the exhaust, where the ion density is maximum.We note a fall of about 50 V between the exit plane and thestagnation region. Within the beam close to the thruster, thepotential is on the order of 15 V, and the largest potentialgradients (hence electric fields) are at the radial edge ofthe beam.
Figure 17(b) shows the overall behaviour of the plasmapotential in the near-field region of the plume. One can see that
13
Plasma Sources Sci. Technol. 17 (2008) 024003 F Taccogna et al
Figure 18. Contour map of electron temperature. Each line isseparated by 1 eV, from 10 to 1 eV. Note that the symmetry axis isvertical here, and the ion outlet is located near the bottom leftcorner, on the r-axis.
at r = 0 mm the potential at first increases as a function of theaxial positions because electrons are trapped by the magneticfield effect and later decreases, since the value of magnetic fieldbecomes relatively weak. At r = 20 mm the magnetic fieldis substantially lower and the plasma potential increase is lessmarked. While the radial profiles of the plasma potential, thatis potential distribution along the magnetic field, decrease asthe electron density according to the Boltzmann relation (16).
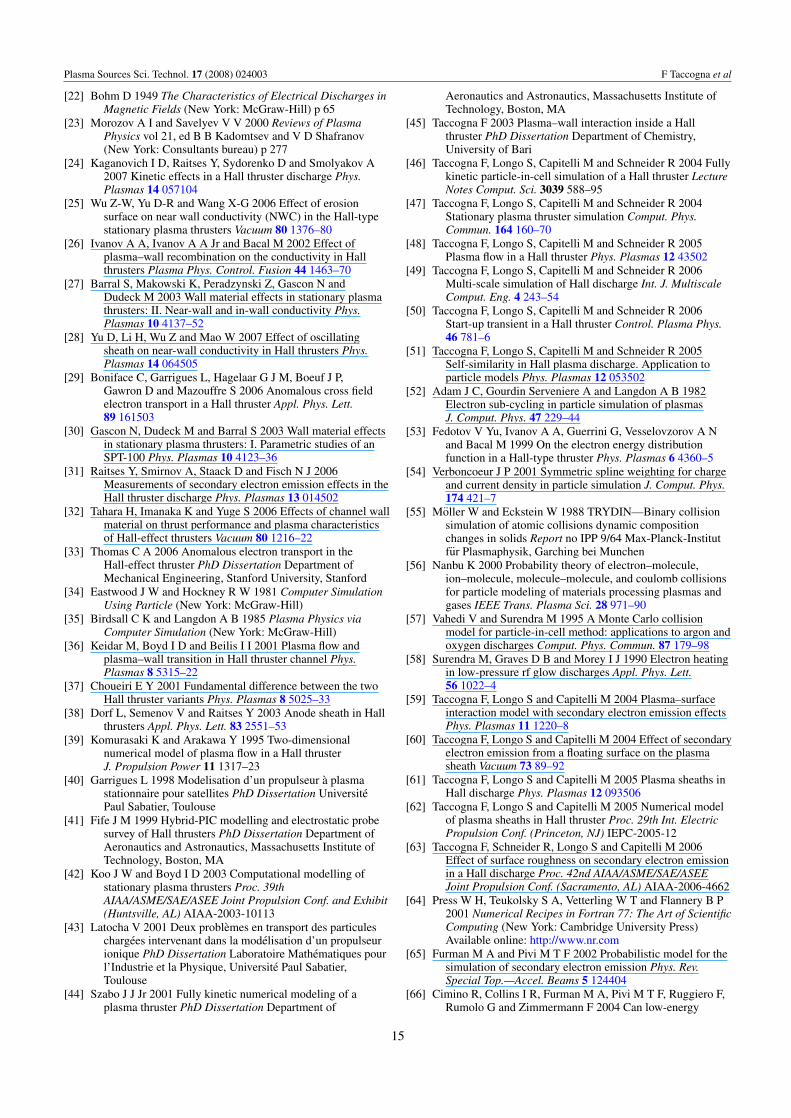
Finally, we show in figure 18 the electron temperaturemap computed in the simulation using equations (21a)–(21d).Each line is separated by 1 eV and the ion outlet is locatednear the bottom left corner, on the r-axis. The electrontemperature has been set to 10 eV at the thruster front, andthe far radial boundary is fixed at 1 eV. The peak structurein front of the discharge channel (2.8 cm < r < 5 cm)decreases in magnitude and broadens as the electrons moveaway axially from the thruster in agreement to the fact thatelectrons continue to cool down. The predominant temperaturedrop, however, is in the radial direction since heat is conductedwell axially within the beam.
5. Conclusions
In this paper, we reviewed different particle-in-cell/MonteCarlo collisional models of SPT-100. A scaling methodol-ogy and a detailed representation of plasma–wall interaction(secondary electron emission and potential boundary condi-tions) inside the acceleration channel have allowed one to studythe general axial acceleration mechanism, the Debye layerbreakdown and the azimuthal fluctuations. A hybrid treatment(particle for ionic component and fluid for electron one) withion–neutral (momentum and CX) collisions has been appliedto study the plasmadynamics of the plume emitted from thethruster.
Acknowledgments
This work is supported by MIUR-PRIN 2005 underthe contract no. 2005039049 005: ‘Dinamica dei processi
elementary per la chimica e la fisica dei plasmi’.RS acknowledges funding of the work by the Initiative andNetworking Fund of the Helmholtz Association.
References
[1] Zhurin V V, Kaufman H R and Robinson R S 1999 Physics ofclosed drift thruster Plasma Sources Sci. Technol. 8 R1–20
[2] Hobbes G D and Wesson J A 1967 Heat flow through aLangmuir sheath in the presence of electron emissionPlasma Phys. 9 85–7
[3] Kirdyashev K P 1997 Near-wall electron instability of aplasma flux Tech. Phys. Lett. 23 395–6
[4] Morozov A I and Savel’ev V V 2007 Kinetics of a low-densityplasma near a dielectric surface with account for secondaryelectron emission Plasma Phys. Rep. 33 20–7
[5] Drummond W E and Rosenbluth M N 1962 Anomalousdiffusion arising from microinstabilities in a plasma Phys.Fluids 5 1507–13
[6] Spitzer L Jr 1960 Particle diffusion across a magnetic fieldPhys. Fluids 3 659–61
[7] Janes G S and Lowder R S 1966 Anomalous electron diffusionand ion acceleration in a low-density plasma Phys. Fluids9 1115–23
[8] Esipchuck Y V and Tilinin G N 1976 Drift instability in aHall-current plasma accelerator Sov. Phys.—Tech. Phys. 21419
[9] Litvak A A, Raitses Y and Fisch N J 2004 Experimentalstudies of high-frequency azimuthal waves in Hall thrustersPhys. Plasmas 11 1701–5
[10] Lazurenko A, Albarede L and Bouchoule A 2006 Physicalcharacterization of high-frequency instabilities in Hallthrusters Phys. Plasmas 13 083503
[11] Lazurenko A, Dudok deWit T, Cavoit C, Krasnoselskikh V,Bouchoule A and Dudeck M 2007 Determination of theelectron anomalous mobility through measurements ofturbulent magnetic field in Hall thrusters Phys. Plasmas14 033504
[12] Hirakawa M and Arakawa Y 1995 Particle simulation ofplasma phenomena in Hall thrusters Proce. 24th Int.Electric Propulsion Conf. (Moscow, Russia) IEPC-95-164
[13] Hirakawa M and Arakawa Y 1996 Numerical simulation ofplasma particle behavior in a Hall thruster Proc. 32ndAIAA/ASME/SAE/ASEE Joint Propulsion Conf. (LakeBuena Vista, FL) AIAA-96-3195
[14] Choueiri E Y 2001 Plasma oscillations in Hall thrusters Phys.Plasmas 8 1411–26
[15] Litvak A A and Fisch N J 2001 Resistive instability in Hallcurrent plasma discharge Phys. Plasmas 8 648–51
[16] Litvak A A and Fisch N J 2004 Rayleigh instability in Hallthrusters Phys. Plasmas 11 1379–83
[17] Gallardo J M and Ahedo E 2005 On the anomalous diffusionmechanism in Hall-effect thrusters Proc. 29th Int. ElectricPropulsion Conf. (Princeton, NJ) IEPC-2005-117
[18] Thomas C A and Cappelli M A 2006 Fluctuation-inducedtransport in the Hall plasma accelerator Proc. 42ndAIAA/ASME/SAE/ASEE Joint Propulsion Conf.(Sacramento, CA), AIAA-2006-5168
[19] Ducrocq A, Adam J C, Heron A and Laval G 2006High-frequency electron drift instability in the cross-fieldconfiguration of Hall thrusters Phys. Plasmas 13 102111
[20] Sydorenko D, Smolyakov A, Kaganovich I and Raitses Y 2007Effects of non-Maxwellian electron velocity distributionfunction on two-stream instability in low-pressuredischarges Phys. Plasmas 14 013508
[21] Yoshikawa S and Rose D 1962 Anomalous diffusion of plasmaacross a magnetic field Phys. Fluids 5 334–40
14
Plasma Sources Sci. Technol. 17 (2008) 024003 F Taccogna et al
[22] Bohm D 1949 The Characteristics of Electrical Discharges inMagnetic Fields (New York: McGraw-Hill) p 65
[23] Morozov A I and Savelyev V V 2000 Reviews of PlasmaPhysics vol 21, ed B B Kadomtsev and V D Shafranov(New York: Consultants bureau) p 277
[24] Kaganovich I D, Raitses Y, Sydorenko D and Smolyakov A2007 Kinetic effects in a Hall thruster discharge Phys.Plasmas 14 057104
[25] Wu Z-W, Yu D-R and Wang X-G 2006 Effect of erosionsurface on near wall conductivity (NWC) in the Hall-typestationary plasma thrusters Vacuum 80 1376–80
[26] Ivanov A A, Ivanov A A Jr and Bacal M 2002 Effect ofplasma–wall recombination on the conductivity in Hallthrusters Plasma Phys. Control. Fusion 44 1463–70
[27] Barral S, Makowski K, Peradzynski Z, Gascon N andDudeck M 2003 Wall material effects in stationary plasmathrusters: II. Near-wall and in-wall conductivity Phys.Plasmas 10 4137–52
[28] Yu D, Li H, Wu Z and Mao W 2007 Effect of oscillatingsheath on near-wall conductivity in Hall thrusters Phys.Plasmas 14 064505
[29] Boniface C, Garrigues L, Hagelaar G J M, Boeuf J P,Gawron D and Mazouffre S 2006 Anomalous cross fieldelectron transport in a Hall thruster Appl. Phys. Lett.89 161503
[30] Gascon N, Dudeck M and Barral S 2003 Wall material effectsin stationary plasma thrusters: I. Parametric studies of anSPT-100 Phys. Plasmas 10 4123–36
[31] Raitses Y, Smirnov A, Staack D and Fisch N J 2006Measurements of secondary electron emission effects in theHall thruster discharge Phys. Plasmas 13 014502
[32] Tahara H, Imanaka K and Yuge S 2006 Effects of channel wallmaterial on thrust performance and plasma characteristicsof Hall-effect thrusters Vacuum 80 1216–22
[33] Thomas C A 2006 Anomalous electron transport in theHall-effect thruster PhD Dissertation Department ofMechanical Engineering, Stanford University, Stanford
[34] Eastwood J W and Hockney R W 1981 Computer SimulationUsing Particle (New York: McGraw-Hill)
[35] Birdsall C K and Langdon A B 1985 Plasma Physics viaComputer Simulation (New York: McGraw-Hill)
[36] Keidar M, Boyd I D and Beilis I I 2001 Plasma flow andplasma–wall transition in Hall thruster channel Phys.Plasmas 8 5315–22
[37] Choueiri E Y 2001 Fundamental difference between the twoHall thruster variants Phys. Plasmas 8 5025–33
[38] Dorf L, Semenov V and Raitses Y 2003 Anode sheath in Hallthrusters Appl. Phys. Lett. 83 2551–53
[39] Komurasaki K and Arakawa Y 1995 Two-dimensionalnumerical model of plasma flow in a Hall thrusterJ. Propulsion Power 11 1317–23
[40] Garrigues L 1998 Modelisation d’un propulseur a plasmastationnaire pour satellites PhD Dissertation UniversitePaul Sabatier, Toulouse
[41] Fife J M 1999 Hybrid-PIC modelling and electrostatic probesurvey of Hall thrusters PhD Dissertation Department ofAeronautics and Astronautics, Massachusetts Institute ofTechnology, Boston, MA
[42] Koo J W and Boyd I D 2003 Computational modelling ofstationary plasma thrusters Proc. 39thAIAA/ASME/SAE/ASEE Joint Propulsion Conf. and Exhibit(Huntsville, AL) AIAA-2003-10113
[43] Latocha V 2001 Deux problemes en transport des particuleschargees intervenant dans la modelisation d’un propulseurionique PhD Dissertation Laboratoire Mathematiques pourl’Industrie et la Physique, Universite Paul Sabatier,Toulouse
[44] Szabo J J Jr 2001 Fully kinetic numerical modeling of aplasma thruster PhD Dissertation Department of
Aeronautics and Astronautics, Massachusetts Institute ofTechnology, Boston, MA
[45] Taccogna F 2003 Plasma–wall interaction inside a Hallthruster PhD Dissertation Department of Chemistry,University of Bari
[46] Taccogna F, Longo S, Capitelli M and Schneider R 2004 Fullykinetic particle-in-cell simulation of a Hall thruster LectureNotes Comput. Sci. 3039 588–95
[47] Taccogna F, Longo S, Capitelli M and Schneider R 2004Stationary plasma thruster simulation Comput. Phys.Commun. 164 160–70
[48] Taccogna F, Longo S, Capitelli M and Schneider R 2005Plasma flow in a Hall thruster Phys. Plasmas 12 43502
[49] Taccogna F, Longo S, Capitelli M and Schneider R 2006Multi-scale simulation of Hall discharge Int. J. MultiscaleComput. Eng. 4 243–54
[50] Taccogna F, Longo S, Capitelli M and Schneider R 2006Start-up transient in a Hall thruster Control. Plasma Phys.46 781–6
[51] Taccogna F, Longo S, Capitelli M and Schneider R 2005Self-similarity in Hall plasma discharge. Application toparticle models Phys. Plasmas 12 053502
[52] Adam J C, Gourdin Serveniere A and Langdon A B 1982Electron sub-cycling in particle simulation of plasmasJ. Comput. Phys. 47 229–44
[53] Fedotov V Yu, Ivanov A A, Guerrini G, Vesselovzorov A Nand Bacal M 1999 On the electron energy distributionfunction in a Hall-type thruster Phys. Plasmas 6 4360–5
[54] Verboncoeur J P 2001 Symmetric spline weighting for chargeand current density in particle simulation J. Comput. Phys.174 421–7
[55] Moller W and Eckstein W 1988 TRYDIN—Binary collisionsimulation of atomic collisions dynamic compositionchanges in solids Report no IPP 9/64 Max-Planck-Institutfur Plasmaphysik, Garching bei Munchen
[56] Nanbu K 2000 Probability theory of electron–molecule,ion–molecule, molecule–molecule, and coulomb collisionsfor particle modeling of materials processing plasmas andgases IEEE Trans. Plasma Sci. 28 971–90
[57] Vahedi V and Surendra M 1995 A Monte Carlo collisionmodel for particle-in-cell method: applications to argon andoxygen discharges Comput. Phys. Commun. 87 179–98
[58] Surendra M, Graves D B and Morey I J 1990 Electron heatingin low-pressure rf glow discharges Appl. Phys. Lett.56 1022–4
[59] Taccogna F, Longo S and Capitelli M 2004 Plasma–surfaceinteraction model with secondary electron emission effectsPhys. Plasmas 11 1220–8
[60] Taccogna F, Longo S and Capitelli M 2004 Effect of secondaryelectron emission from a floating surface on the plasmasheath Vacuum 73 89–92
[61] Taccogna F, Longo S and Capitelli M 2005 Plasma sheaths inHall discharge Phys. Plasmas 12 093506
[62] Taccogna F, Longo S and Capitelli M 2005 Numerical modelof plasma sheaths in Hall thruster Proc. 29th Int. ElectricPropulsion Conf. (Princeton, NJ) IEPC-2005-12
[63] Taccogna F, Schneider R, Longo S and Capitelli M 2006Effect of surface roughness on secondary electron emissionin a Hall discharge Proc. 42nd AIAA/ASME/SAE/ASEEJoint Propulsion Conf. (Sacramento, AL) AIAA-2006-4662
[64] Press W H, Teukolsky S A, Vetterling W T and Flannery B P2001 Numerical Recipes in Fortran 77: The Art of ScientificComputing (New York: Cambridge University Press)Available online: http://www.nr.com
[65] Furman M A and Pivi M T F 2002 Probabilistic model for thesimulation of secondary electron emission Phys. Rev.Special Top.—Accel. Beams 5 124404
[66] Cimino R, Collins I R, Furman M A, Pivi M T F, Ruggiero F,Rumolo G and Zimmermann F 2004 Can low-energy
15
Plasma Sources Sci. Technol. 17 (2008) 024003 F Taccogna et al
electrons affect high-energy physics accelerators? Phys.Rev. Lett. 93 014801
[67] Dennison J R, Sim A and Thomson D 2006 Evolution of theelectron yield curves of insulators as a function ofimpinging electron fluence and energy IEEE Trans. PlasmaSci. 34 2204–18
[68] Clerc S, Dennison J R, Hoffmann R and Abbott J 2006 On thecomputation of secondary electron emission models IEEETrans. Plasma Sci. 34 2219–25
[69] Shih A and Hor C 1993 Secondary emission properties as afunction of the electron incidence angle IEEE Trans.Electron Devices 40 824–9
[70] Dawson P H 1966 Secondary electron emission yields of someceramics J. Appl. Phys. 37 3644–5
[71] Bugeat J P and Koppel C 1995 Development of a secondgeneration of SPT Proc. 23rd Int. Conf. on ElectricPropulsion (Moscow, Russia) IEPC 95–35
[72] Dunaevsky A, Raitses Y and Fisch N J 2003 Secondaryelectron emission from dielectric materials of a Hall thrusterwith segmented electrodes Phys. Plasmas 10 2574–7
[73] Adam J C, Heron A and Laval G 2004 Study of stationaryplasma thrusters using two-dimensional fully kineticsimulations Phys. Plasmas 11 295–305
[74] Fernandez E, Knoll A and Cappelli M A 2006 Anaxial-azimuthal hybrid simulation of coaxial Hall thrustersProc. 42nd AIAA/ASME/SAE/ASEE Joint Propulsion Conf.(Sacramento, AL) AIAA-2006-4329
[75] Meezan N B 2002 Electron transport in a coaxial Halldischarge PhD Dissertation Department of MechanicalEngineering, Stanford University, Stanford
[76] Taccogna F, Schneider R, Longo S and Capitelli M 2007 Fullykinetic 2D(r, θ) model of a Hall discharge Proc. 43rdAIAA/ASME/SAE/ASEE Joint Propulsion Conf. (Cincinnati,OH) AIAA-2006-5211
[77] Swarztrauber P N 1974 A direct method for the discretesolution of separable elliptic equations SIAM J. Numer.Anal. 11 1136–50. See also http://www.cisl.ucar.edu/css/software/fishpack/
[78] Taccogna F, Longo S and Capitelli M 2000 Particle incell/Monte Carlo model of the SPT-100 plume
Technical Report No WP 6.2 Advanced prediction methodsfor plume flows ESA/ESTEC contract no 12736/97/NL/PA
[79] Taccogna F, Longo S and Capitelli M 2000 Particle incell/Monte Carlo model of an electric thruster Proc. 31stAIAA Plasmadynamics and Lasers Conf. (Denver, CO)AIAA-2000-2345
[80] Taccogna F, Longo S and Capitelli M 2002 Particle-in-cellwith test-particle Monte Carlo (PIC/TPMC) Simulation ofSPT-100 exhaust plumes J. Spacecr. Rockets 39409–19
[81] Boccaletto L 1999 Electric thruster technologies SPT-100 ioninflow data Technical report No WP-3 ESA/ESTEC12736/97/NL/PA
[82] Kim S W 1999 Experimental investigation of plasmaparameters and species-dependent ion energy distribution inthe plasma exhaust plume of a Hall thruster PhDDissertation Department of Areospace Engineering,University of Michigan
[83] Nanbu K and Kitatani Y 1995 An ion–neutral species collisionmodel for particle simulation of glow discharge J. Phys. D:Appl. Phys. 28 324–30
[84] Taccogna F, Longo S and Capitelli M 2004 Very-near-fieldplume simulation of a stationary plasma thruster Eur. Phys.J. Appl. Phys. 28 113–22
[85] Colonna G, Pietanza L D and Capitelli M 2000 A collisionalradiative model for Xe electrical thrusters Proc. 31st AIAAPlasmadynamics and Lasers Conf. (Denver, CO)AIAA-2000-2349
[86] Samanta Roy R I 1995 Numerical simulation of ion thrusterplume backflow for spacecraft contamination assessmentPhD Dissertation Department of Aeronautics andAstronautics, Massachusetts Institute of Technology,Boston, MA
[87] Haas J M and Gallimore A D 2001 Internal plasma profiles ina laboratory-model Hall thruster Phys. Plasmas 8 652–60
[88] Kurzyna J, Mazouffre A, Lazurenko A, Albarede L,Bonhomme G, Makowski K, Dudeck M and Peradzynski Z2007 Spectral analysis of Hall-effect thruster plasmaoscillations based on the empirical mode decompositionPhys. Plasmas 12 123506
16


