MASTER’S THESIS MAY 15th 2018
International Strategic Investments
A study of considerations associated with Royal Unibrew’s expansion into Spain
JONAS MØLLER SØRENSEN
Study number: 38721
KASPER FRIIS MARTINSEN
Study number: 47281
SUPERVISOR: STEEN RASMUSSEN
NUMBER OF CHARACTERS: 247.143
COPENHAGEN BUSINESS SCHOOL M.Sc. in Economics and Business Administration
Cand.merc. International Business & Cand.merc. Finance and Investments
i
Executive Summary
International investments have become a major part of operating a multinational enterprise
(MNE), since such investments come in many forms. Investment in the form of international
expansion is of special interest to this thesis. The thesis is focusing around a potential
international expansion of Royal Unibrew into Spain, where the question of entry strategy is
covered. In order to investigate this, a macro economical analysis of Spain is performed, along
with an analysis of the competitiveness within the beer industry and with special focus on the
beer industry in Spain. An internal analysis is performed as well to provide an insight into the
resources of Royal Unibrew. The analysis shows various ownership advantages, location
advantages and internationalization advantages, which ultimately lead to foreign direct
investment (FDI) in the form of merger and acquisition being the optimal entry strategy. This
leads to a due diligence process, in order to find the best possible candidates for such an
international acquisition.
After a comprehensive search process, the total number of candidates at 795 is limited to 551. A
selection process with certain screening criteria narrows the data sample down to eight potential
candidates. Based on the eight candidates a two-level evaluation hierarchy is created using an
analytic hierarchy process (AHP) with roots in multi criteria decision making (MCDM), where
the first level of the hierarchy includes four aspects and the second level includes nine different
criteria. By using certain intensity of importance between each aspect and criterion, comparison
matrices are calculated to determine the weights of the aspects and criteria. These are assessed
both subjectively and objectively and determine the final ranking of the candidates. This way,
by taking the importance of each aspect and criteria into account, the top ranking candidates
for an international acquisition by Royal Unibrew are the Spanish breweries Font Salem, S.L.
followed by Hijos de Rivera, S.A. and Estrella de Levante Fabrica de Cerverza, S.A. A discussion
of methods and further action points for Royal Unibrew are finally discussed, as the results of
this thesis should not determine which candidate to use for an expansion, but be the foundation
for a more extensive research of the top ranked candidates.
ii
Table of Contents
Part I ................................................................................................................................................. 1
1. Introduction ................................................................................................................................. 1
1.1 Research Question ............................................................................................................ 3
1.2 Purpose .............................................................................................................................. 3
1.3 Motivation ......................................................................................................................... 4
1.4 Structure of the Thesis ...................................................................................................... 4
1.5 Delimitation ....................................................................................................................... 6
2. Corporate Overview .................................................................................................................... 6
2.1 Royal Unibrew - History ................................................................................................... 7
2.1.1 A Brief Flashback to Where It All Began .............................................................. 7
2.1.2 Acquisitions as the Main Strategy for Growth ...................................................... 7
2.1.3 Partnerships Reinforces the Positions in Core Markets ........................................ 8
2.2 Royal Unibrew – Today .................................................................................................... 8
2.2.1 Products & Brands ................................................................................................. 9
2.2.2 Corporate Strategy ................................................................................................. 10
2.2.3 Financial Performance & Shareholder Information .............................................. 11
3. Methodology ............................................................................................................................... 13
3.1 Philosophy ......................................................................................................................... 14
3.2 Approach ........................................................................................................................... 14
3.3 Strategy .............................................................................................................................. 15
3.4 Choice ................................................................................................................................ 16
3.5 Time Horizon .................................................................................................................... 16
3.6 Techniques and Procedures .............................................................................................. 17
3.6.1 Data Collection ...................................................................................................... 17
3.6.2 Validity ................................................................................................................... 19
3.6.3 Reliability ............................................................................................................... 20
4. Theoretical Background .............................................................................................................. 21
4.1 PESTEL Framework ......................................................................................................... 21
4.1.1 Political Landscape ................................................................................................. 22
iii
4.1.2 Economical Landscape ........................................................................................... 22
4.1.3 Socio-Cultural Landscape ...................................................................................... 22
4.1.4 Technological Landscape ....................................................................................... 23
4.1.5 Environmental Landscape ...................................................................................... 23
4.1.6 Legal Landscape ..................................................................................................... 23
4.1.7 Critique .................................................................................................................. 24
4.2 Porter’s Five Forces ........................................................................................................... 24
4.2.1 Threat of New Entrants .......................................................................................... 25
4.2.2 Threat of Substitutes .............................................................................................. 26
4.2.3 Bargaining Power of Suppliers ............................................................................... 26
4.2.4 Bargaining Power of Buyers ................................................................................... 26
4.2.5 Rivalry Among Existing Competitors .................................................................... 27
4.2.6 Critique ................................................................................................................... 27
4.3 VRIO Framework ............................................................................................................. 27
4.3.1 Value Creation ....................................................................................................... 28
4.3.2 Rarity ...................................................................................................................... 29
4.3.3 Imitability ............................................................................................................... 29
4.3.4 Organization .......................................................................................................... 30
4.3.5 Competitive Implications and Economic Performance ......................................... 30
4.3.6 Critique ................................................................................................................... 31
4.4 The Eclectic (OLI) Paradigm ............................................................................................ 31
4.4.1 Ownership Advantages .......................................................................................... 32
4.4.2 Location Advantages .............................................................................................. 33
4.4.3 Internalization Advantages ..................................................................................... 33
4.4.4 Critique ................................................................................................................... 34
4.5 Mergers & Acquisition – A Review of the Pre-Acquisition Process .................................. 35
4.5.1 The Process of a Merger and Acquisition .............................................................. 35
4.5.2 Motives for Doing International Mergers and Acquisition .................................... 35
4.5.3 The Search Process and Preliminary Screening .................................................... 37
4.5.4 Evaluation of the Candidates ................................................................................. 37
4.5.5 Country Specific Evaluation Determinants ............................................................ 37
4.5.6 Candidate Specific Evaluation Determinants ........................................................ 38
4.6 Multi Criteria Decision Making ........................................................................................ 41
iv
4.6.1 Analytical Hierarchy Process .................................................................................. 41
4.6.2 Critique ................................................................................................................... 46
4.7 Relevance of the Models and Frameworks ....................................................................... 47
Part II ..................................................................................................................................................... 49
5. External Analysis ......................................................................................................................... 49
5.1 PESTEL Analysis .............................................................................................................. 49
5.1.1 Political Landscape ................................................................................................. 49
5.1.2 Economical Landscape ........................................................................................... 51
5.1.3 Socio-Cultural Landscape ...................................................................................... 53
5.1.4 Technological Landscape ....................................................................................... 55
5.1.5 Environmental Landscape ...................................................................................... 56
5.1.6 Legal Landscape ..................................................................................................... 57
5.2 Porter’s Five Forces Analysis ............................................................................................. 58
5.2.1 Threat of New Entrants .......................................................................................... 58
5.2.2 Threat of Substitutes .............................................................................................. 59
5.2.3 Bargaining Power of Suppliers ............................................................................... 61
5.2.4 Bargaining Power of Buyers ................................................................................... 62
5.2.5 Rivalry Among Existing Competitors .................................................................... 63
6. Internal Analysis .......................................................................................................................... 65
6.1 VRIO Analysis .................................................................................................................. 65
6.1.1 Intangible Assets ..................................................................................................... 65
6.1.2 Tangible Assets ....................................................................................................... 69
6.1.3 Competitive Implications and Economic Performance ......................................... 71
7. OLI Analysis ................................................................................................................................ 74
7.1 Ownership Advantages ..................................................................................................... 74
7.2 Location Advantages ......................................................................................................... 77
7.3 Internationalization Advantages ....................................................................................... 80
7.3.1 FDI versus Export, Licensing & Outsourcing ........................................................ 81
8. Preliminary Conclusion ............................................................................................................... 83
9. The Due Diligence Process – Pre-Acquisition ............................................................................ 85
9.1 The Motives for Doing M&A – Royal Unibrew ............................................................... 85
9.2 Search Process and Data Selection ................................................................................... 85
v
9.2.1 The Search Process ................................................................................................ 86
9.2.2 The Selection Process ............................................................................................. 86
9.2.3 Data for Assessing the Aspects ................................................................................ 87
9.2.4 Validity ................................................................................................................... 87
9.2.5 Reliability ............................................................................................................... 88
9.3 Preliminary Screening ....................................................................................................... 88
9.3.1 Screening Criteria .................................................................................................. 89
9.4 The Evaluation Process ..................................................................................................... 90
9.4.1 Defining the Problem ............................................................................................. 90
9.4.2 The Evaluation Hierarchy ..................................................................................... 90
9.4.3 Management ........................................................................................................... 91
9.4.4 Financial Performance ........................................................................................... 92
9.4.5 Marketing ............................................................................................................... 93
9.4.6 Products .................................................................................................................. 93
9.4.7 Definition of Variables and Abbreviations ............................................................. 94
9.4.8 Determining the Comparison Matrices ................................................................. 95
9.4.9 Rating Mode .......................................................................................................... 98
9.4.10 Evaluation of the Subjectively Assessed Determinants ........................................ 100
9.4.11 Decile Method – Transformation of Quantitative Numbers ............................... 109
9.5 Ranking the Candidates .................................................................................................... 111
Part III .................................................................................................................................................... 113
10. Discussion .................................................................................................................................. 113
10.1 Discussion of the Results ................................................................................................. 113
10.2 The Next Steps for Royal Unibrew ................................................................................. 116
11. Conclusion ................................................................................................................................. 118
12. List of References ...................................................................................................................... 121
vi
Appendices ................................................................................................................................................ 140
Appendix 1: Overview of Royal Unibrew ............................................................................... 140
Appendix 2: Interview questions for Royal Unibrew .............................................................. 141
Appendix 3: Interview with Royal Unibrew ........................................................................... 142
Appendix 4: Interview questions for Carlsberg ....................................................................... 150
Appendix 5: Interview with Carlsberg .................................................................................... 151
Appendix 6: Hijos de Rivera, S.A. .......................................................................................... 155
Appendix 7: Font Salem, S.L. ................................................................................................. 157
Appendix 8: Comanñia Cervecera Damm, S.L. ..................................................................... 159
Appendix 9: Cervezas Mahou, S.L. ........................................................................................ 161
Appendix 10: La Zaragozana, S.A. ......................................................................................... 163
Appendix 11: Cervezas San Miguel, S.L. ................................................................................ 165
Appendix 12: Estrella de Levante Fabrica De Cerveza, S.A. ................................................. 167
Appendix 13: Penibetica de Cervezas y Bebidas, S.L. ............................................................ 169
Appendix 14: E-Mail: Subjectively Assessed Weights - Aspects and Criteria ......................... 171
Appendix 15: Comparison Matrices Calculation .................................................................... 172
Appendix 16: Decile Method Calculation ............................................................................... 174
Appendix 17: Final Ranking Calculation ................................................................................ 175
1
Part I Introduction, company description, methodology and theoretical background
The first part of the thesis contains an introduction with research question, purpose, motivation,
structure and delimitation, which will present the scope and possibilities of the thesis. A
company overview is then presented to give an insight into the history and to present the
current situation of Royal Unibrew. Lastly, methodology and theoretical background is
presented to describe the approach and foundation of the study.
1. Introduction
Globalization has since its arrival created lots of opportunities for companies to expand their
activities abroad. Borders have been easier for firms to overcome, as well as the costs have been
reduced (Shimizy et al., 2004). However, expanding activities internationally also raises various
kinds of risks and factors that need to be assessed. These risks are highly correlated to the
commitment level and entry mode that the company chooses to pursue. For example, the risk is
much higher when committing capital into a plant compared with only choosing to export
products to the given country (Peng & Meyer, 2011). By expanding their activities abroad,
companies often achieve competitive advantages, such as economies of scales and scope,
multinational tax planning, and low-cost labor or raw materials access. Often this kind of
expansion is seen in mature markets as a way of generating growth (Butler, 2016).
The beverage industry can be classified as a mature market and is facing increasing competition
as new products are introduced to the market continuously (Brewers of Europe, 2017).
Consumers are becoming more aware of what they drink, and demand healthier beverages as
well as more diversified products (Euromonitor, 2018). Within the beer industry, the main
categories, pilsner and other mainstream beers, have stagnated through the last decade (Statista,
2018a). Even though trends towards low or non-alcoholic and specialty beers have been seen in
the overall beer market, the market is characterized by its matureness and its major players.
2
Therefore, market growth presumably happens through acquisitions of other established firms
(Yip, 1992).
Royal Unibrew has through the last two decades established itself as an international market
player. The growth of Royal Unibrew is highly due to the international acquisitions, which have
been completed through the years since their IPO in 1998. Over 65% percent of their revenue
is generated outside their host country, Denmark. In fact, their market in Finland is the biggest
generator of their turnover (Royal Unibrew, 2018). Royal Unibrew operates in the beverage
market and provides different products with beers and soft drinks being their evidently highest
contributors to the overall turnover (Royal Unibrew, 2018). Given a stagnated turnover, Royal
Unibrew is interested in making an international expansion in order to increase their market
growth. According to an executive of Royal Unibrew, Simon Andersson, Spain is of special
interest to the company (Andersson, 2018).
Spain is the fourth largest producer of beers and only surpassed by Germany, UK and Poland.
In addition, the overall consumption of beers ranks as the third highest in Europe. Where other
countries have experienced stagnation or even a decrease in the consumption of beers, Spain
has had a slight increase. In fact, it has increased with almost 10% in the period from 2010-
2016 (Brewers of Europe, 2017). Spain is the fourth largest country in Europe (Euromonitor,
2018), which makes the total production and consumption of beers in the top of Europe.
Moreover, Spain is the most visited country in Europe, and given the fact that the level of
tourism affects the consumption of beer positively, it makes Spain particularly interesting for an
international expansion (Eurostat, 2017b). Furthermore, the Spanish economy is expected to
grow (Eurostat, 2017), and the Spanish beer market is expected to expand its market share in
the market of alcoholic beverages (Euromonitor, 2017a). Thus, Spain has positive trends within
the beer industry and therefore might be an attractive market for an international expansion.
3
1.1 Research question For Royal Unibrew’s continuous growth, new markets must be entered to grow significantly,
since the overall beer industry has reached a plateau. As Spain is one of the most beer
consuming countries in Europe, it might be an extremely interesting market to enter for Royal
Unibrew. This leads to the following research question:
What entry strategy is the most appropriate for Royal Unibrew in Spain
and how should they pursue it?
Three sub-questions have been established in order to answer the research question and provide
a suiting structure of the research:
1. Why should Royal Unibrew enter Spain?
The purpose of this question is to examine whether there is a strategic fit between Royal
Unibrew and Spain. In other words, whether Royal Unibrew can derive from any
advantages associated with the Spanish market.
2. How should Royal Unibrew enter Spain?
The purpose of this question is to determine the best entry strategy for Royal Unibrew
into Spain based on the outcome of the strategic fit.
3. What considerations are associated with the entry strategy of choice?
The purpose of this question is to examine how Royal Unibrew can act on the entry
strategy found via sub question two.
1.2 Purpose The purpose of this thesis is to determine the best entry strategy for Royal Unibrew if expanding
into Spain and to analyze the different possible targets for such an entry. Since the thesis seeks
to examine future consequences of this phenomenon, the purpose can be classified as predictive
(Olsen & Pedersen, 1999). The purpose of this predictive study is to apply theory to a practical
situation (Olsen & Pedersen, 1999). Often studies either focus on investigating the entry mode
4
for a given company in one or more countries, but do not act on the entry mode chosen. This
thesis attempts to set up a framework, which uses well-known strategic models in order to
determine the entry mode, and hereafter modifies a well-known decision tool, used to ease an
action on the best suited one.
1.3 Motivation The motivation behind this thesis comes from the increasing attention to international business
and organizations need for expansion in order to gain market share and becoming a
multinational enterprise (MNE) (Peng & Meyer, 2011). More and more literature and
organizations are attentive to, and even engaged in, such expansions (Bertrand & Zuniga, 2006),
which make it a field with many interesting theories. Examining the most suiting entry mode for
Royal Unibrew if expanding into Spain and thereafter analyzing the most optimal way to do so,
is of great relevance to applied business and economics. Furthermore, the thesis also seeks to be
of relevance to academics that might wish to further develop this framework of international
expansion, or even challenge this thesis on its methods and conclusion.
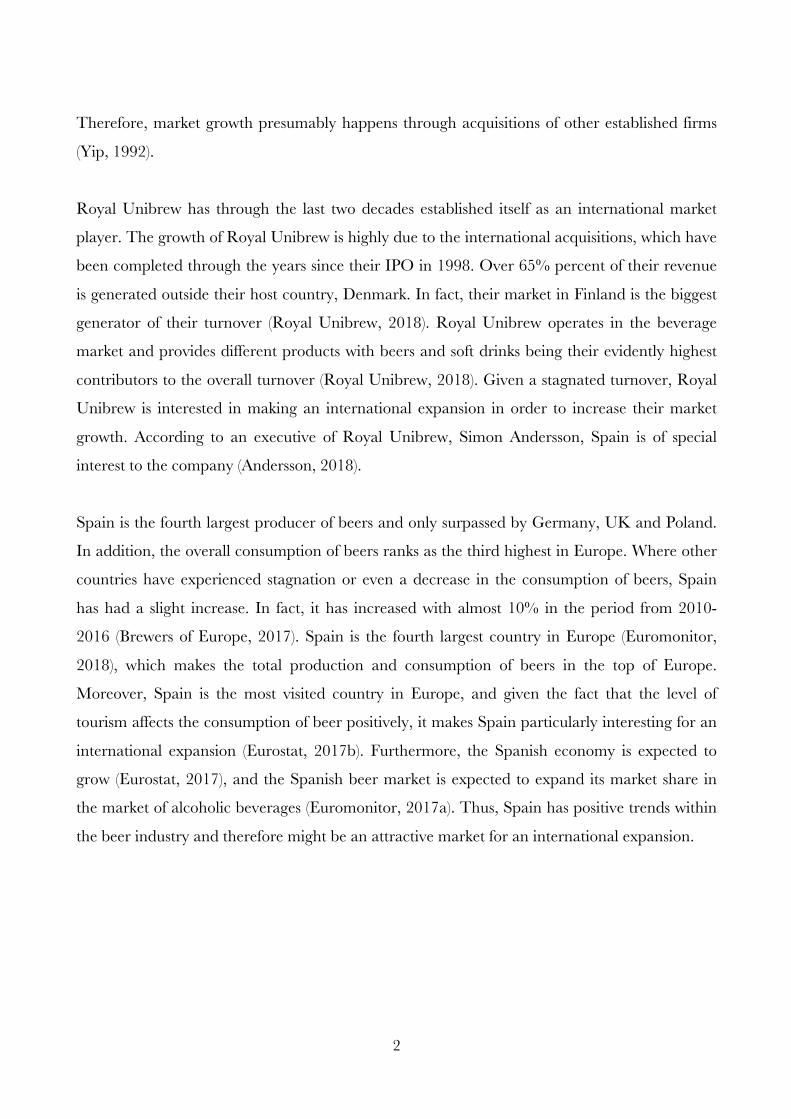
1.4 Structure of the Thesis The thesis is structured in three parts in order to provide an overview and make the contents of
the thesis clearer. The first part of the thesis contains an introduction and research question, a
company overview, methodology and theory. This part outlines the issue and empirical interest
in the research needed for engaging in the analysis. The second part of the thesis begins with a
strategic analysis, which contains both an external and internal analysis as well as a discussion of
the findings, in the OLI framework. The external analysis consists of a PESTEL and Porter’s
Five Forces analysis in order to obtain a macro view of Spain with special focus on the beer
market and an assessment of the competitiveness within the beer industry. The internal analysis
consists of a VRIO analysis of the resources of Royal Unibrew. Both the external and internal
strategic analysis will provide the background analysis needed for a discussion of the strategic fit
between Royal Unibrew and Spain, using an OLI analysis to assess ownership-, location- and
internalization advantages associated with a foreign investment in Spain.
5
The second part includes a due diligence process, with focus on the part of pre-acquisition.
First, the process of searching for candidates and excluding those without the necessary data
available for further analysis is completed. After completion of the search for candidates, a
preliminary screening will be performed based on theoretical and practical relevant criteria in
order to further narrow down the targets of a potential acquisition. Lastly, via an AHP-
approach, different evaluation aspects and criteria will be assessed for each candidate to achieve
the final rank of these.
The third part of the thesis consists of a discussion of the result gained and ultimately a
conclusion and final remarks stressing the most important points and findings of the analysis in
regards to the research question and attached sub-questions.
Figure 1: Structure of the Thesis
Source: Own creation
6
1.5 Delimitation The thesis is delimited to only examine the market in Spain. This particular country has been
chosen in cooperation with Royal Unibrew, as they pointed out that this market is one of the
most relevant markets, in which they do not already have activities (Appendix 3). Royal
Unibrew operates in many different submarkets to the beverage market as well as in few
markets within the food industry. However, the focus in this thesis lies on their business within
the beer markets only. This is due to two reasons: firstly, the beer industry is undergoing an
exciting development as the overall market is matured and only low growth rates are present.
Innovation is therefore essential for maintaining market positions, and market growth is merely
based on acquisitions or mergers in such mature markets (Yip, 1992). Secondly, the internal and
external analyses will be much more relevant as it will be able to go further in depth with the
details of the analyzed factors.
Yet, the limitations will diminish the number of possible targets, which are analyzed since only
breweries of beers in Spain will be considered in the screening. Consequently, greater matches
may exist in other countries or within other industries. Furthermore, only the pre-acquisition
phase of a merger and acquisition process will be analyzed. As consequence, the phase after the
acquisition will only be briefly touched upon when discussing the next steps for Royal Unibrew
(see section 9.2).
2. Corporate Overview
This chapter seeks to give a company description of Royal Unibrew in order to gain a better
overview of the company subject to this thesis. In pursuing this, the history of the organization
will be presented along with the current market position. Furthermore, the corporate strategy
and financial performance will be outlined.
7
2.1 Royal Unibrew – History
To gain an insight into where Royal Unibrew is today, it is beneficial to gain an insight in the
history and thereby how Royal Unibrew came to where the company is now. Royal Unibrew
has an interesting history with mergers as well as acquisitions and partnerships (Royal Unibrew,
2018).
2.1.1 A Brief Flashback to Where It All Began Royal Unibrew is a Danish-based producer of beverages and is the second largest brewery in
Denmark. The company is a result of different mergers and acquisitions through the years. Back
in 1989, the company was founded by a merger between Jyske Bryggerier A/S (later Ceres
Bryggerier A/S) and Faxe Bryggeri A/S under the name Bryggerierne Faxe Jyske A/S and
made the company the second largest provider of beverages in Denmark (Andersson, 2018). In
1992 the name was changed to Bryggerigruppen A/S and through the 90’s the company
exported almost three times the amount of beers as they did ten years earlier. Moreover,, the
brand, Ceres, became the largest import brand in Italy and ‘Der grosse Däne’ was the preferred
foreign beer in Germany. Meanwhile, the position as the world’s third largest malt drink brand
was established through the export to the Caribbean countries (Andersson 2018).
2.1.2 Acquisitions as the Main Strategy for Growth The IPO in 1998 on the Copenhagen Stock Exchange opened the opportunity for public
investors, which provided the company with capital to make acquisitions outside of Denmark.
Shortly after the IPO, the company carried out their first acquisitions, and acquired the Tauras
Brewery and Kalnapilio, which both were located in Lithaunia. Tauras brewery was at that
time the only brewery in the capital of Lithaunia, and added to Kalnapilio, the two breweries
provided approximately half of the beer consumption in Lithaunia. The purchases were a result
of a strongly increased export to the Baltic Area (Andersson, 2018).
At home, the company merged with the Albani Bryggerierne, who was in possession of Maribo
Bryghus A/S, which produces the most sold beer on Lolland-Falster, Maribo Pilsner. In 2005
the company was finally renamed Royal Unibrew. Simultaneously, Royal Unibrew expanded
their activities to include Latvia and Poland with the acquisition of Lacplesa as well as Brok-
8
Strzelec. Royal Unibrew’s position was even further strengthened with the purchases of Lomza
and Livu Alus in 2007, and through these acquisitions market leader positions were established.
Outside of Europe, Royal Unibrew also invested in Caribbean breweries, which were used for
production of malt beverages (Andersson, 2018).
A significant acquisition was completed, when Royal Unibrew purchased Oy Hartwall Ab in
Finland back in 2013, which amounted to a purchase price of 2.8 billion DKK, and by far the
largest acquisition made by Royal Unibrew. Oy Hartwall Ab was, and still is, the second largest
brewery in Finland and contributed at that time with approximately 40% of the total revenue of
Royal Unibrew (Royal Unibrew, 2018). The latest acquisition was made earlier this year, when
Royal Unibrew reinforced their niche activities in Italy by buying the soft drink producing
company Terme di Crodo from the well-known alcoholic beverage provider, Campari. Terme
di Crodo produces the soft drink LemonSoda, which is a market leader on the Italian market.
The deal went through the 2nd of January and the new subsidiary is expected to increase the
total turnover in Italy with over 300 million DKK (Royal Unibrew, 2018). In appendix 1 an
overview of Royal Unibrew can be found explaining the company structure.
2.1.3 Partnerships Reinforces the Positions in Core Markets Through the years, Royal Unibrew has made partnerships with various actors in different
countries (Royal Unibrew, 2018). The most impactful are the agreements made with Pepsico
and Heineken. Pepsico is the fifth largest producer of food and beverages, hereunder the second
largest producer of soft drinks, and Heineken is the second largest brewery in the world (Statista,
2018b). Both agreements include the rights for Royal Unibrew to sell, distribute and produce
their products in Royal Unibrew’s main markets and have been applicable since the 00’s. The
partnership with Heineken began in 2002 (Royal Unibrew, 2018b).
2.2 Royal Unibrew – Today At present, Royal Unibrew employs 2,299 employees, who are located on three different
continents. The acquisitions together with the agreed partnerships have established Royal
Unibrew as a strong international beverage provider. The headquarter is located in Faxe,
9
Denmark, where it all began a hundred years ago. Their core markets include Denmark,
Germany, Finland, Italy, Baltics and Caribbean (Royal Unibrew, 2018).
In general, the beverage market is dominated by large players as The Coca Cola Co.,
Anheuser-Busch InBev, and PepsiCo Inc (Statista 2018d). The total revenue of both the non-
alcoholic and alcoholic market for beverages has increased over the last eight years (Statista
2018a; Statista 2018e). However, the market for pilsner, which is the most sold category within
the beer market, has reached a plateau over the last ten years (Berlingske Business, 2017).
Therefore, beer producers have changed their focus, and the beer market now contains very
diversified kinds of beers. Specialty beers, such as Indian Pale Ale (IPA) etc., have been highly
requested by the consumers and is expected to grow from a market share of approximately 10%
in 2012 to 30% in 2020 (Børsen, 2017). Besides the progress within craft and specialty beers,
beers with no alcohol or less than 0,5% alcohol are sold in an increasing amount. This is due to
the fact that consumers are more consistently demanding healthier beverages (Royal Unibrew,
2018).
2.2.1 Products & Brands Royal Unibrew’s product portfolio is well diversified and includes beers, soft drinks, spring
water, and malt beverages as main categories. These products are spread among many different
brands that operate within Royal Unibrew and can be divided into three main segments. One
segment consists of craft and specialty beer brands, which generate 2% of the revenue.
Another segment is mainstream brands, which includes Royal Pilsner, Faxe Kondi etc., and
stands for 67% of the total sales. The last segment is premium and super-premium brands. An
example from this category is the Ceres Premium Ale sold in Italy and this segment contributes
with 31% of the turnover (Royal Unibrew, 2018). In order to follow the trend within non-
alcoholic beers, Royal Unibrew has also launched Royal Free.
10
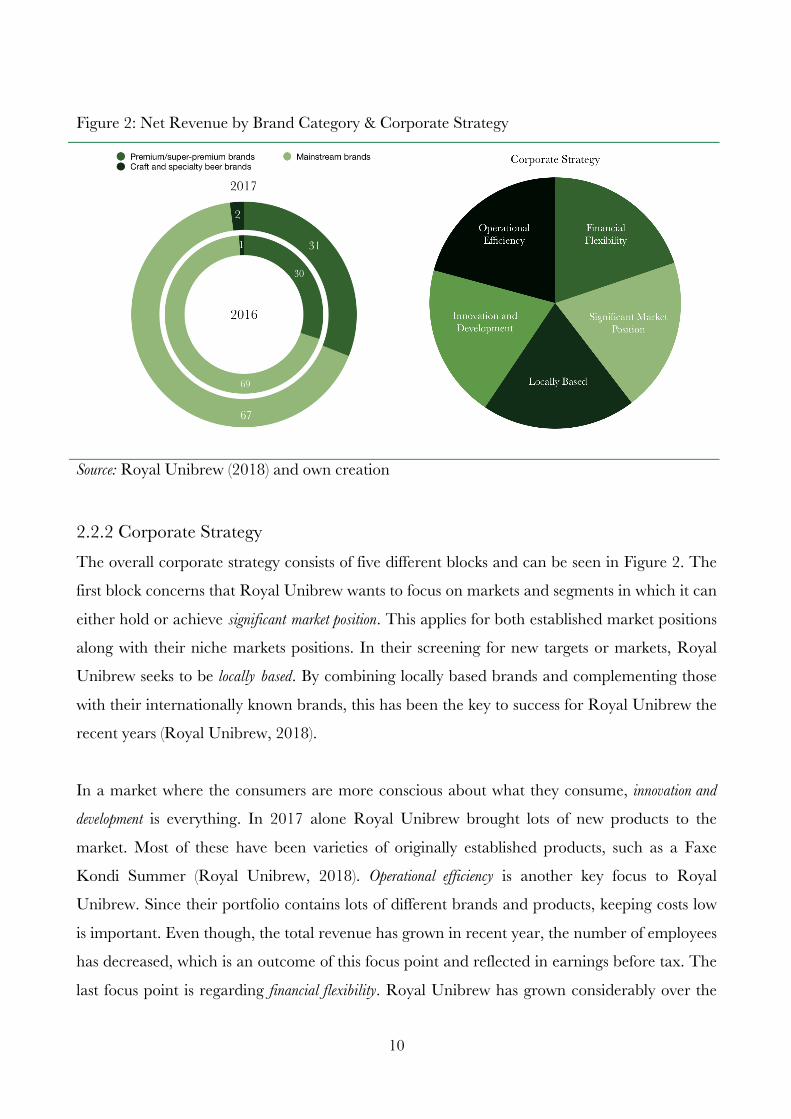
Figure 2: Net Revenue by Brand Category & Corporate Strategy
Source: Royal Unibrew (2018) and own creation
2.2.2 Corporate Strategy The overall corporate strategy consists of five different blocks and can be seen in Figure 2. The
first block concerns that Royal Unibrew wants to focus on markets and segments in which it can
either hold or achieve significant market position. This applies for both established market positions
along with their niche markets positions. In their screening for new targets or markets, Royal
Unibrew seeks to be locally based. By combining locally based brands and complementing those
with their internationally known brands, this has been the key to success for Royal Unibrew the
recent years (Royal Unibrew, 2018).
In a market where the consumers are more conscious about what they consume, innovation and
development is everything. In 2017 alone Royal Unibrew brought lots of new products to the
market. Most of these have been varieties of originally established products, such as a Faxe
Kondi Summer (Royal Unibrew, 2018). Operational efficiency is another key focus to Royal
Unibrew. Since their portfolio contains lots of different brands and products, keeping costs low
is important. Even though, the total revenue has grown in recent year, the number of employees
has decreased, which is an outcome of this focus point and reflected in earnings before tax. The
last focus point is regarding financial flexibility. Royal Unibrew has grown considerably over the
11
past two decades, and this has been primarily due to acquisitions and mergers. Only as a
consequence of financial flexibility, these have been achievable (Royal Unibrew, 2018). In
appendix 1 an overview of Royal Unibrew can be found explaining where they operate, as
presented by Andersson (2018).
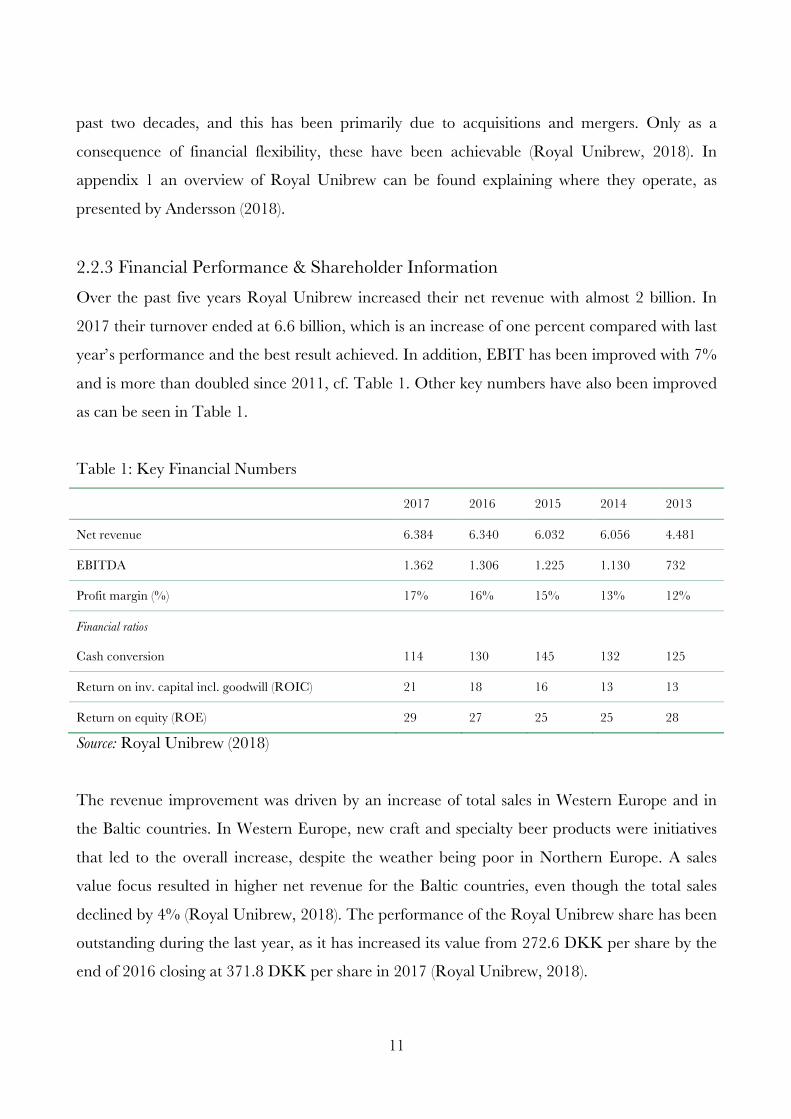
2.2.3 Financial Performance & Shareholder Information Over the past five years Royal Unibrew increased their net revenue with almost 2 billion. In
2017 their turnover ended at 6.6 billion, which is an increase of one percent compared with last
year’s performance and the best result achieved. In addition, EBIT has been improved with 7%
and is more than doubled since 2011, cf. Table 1. Other key numbers have also been improved
as can be seen in Table 1.
Table 1: Key Financial Numbers
2017 2016 2015 2014 2013
Net revenue 6.384 6.340 6.032 6.056 4.481
EBITDA 1.362 1.306 1.225 1.130 732
Profit margin (%) 17% 16% 15% 13% 12%
Financial ratios
Cash conversion 114 130 145 132 125
Return on inv. capital incl. goodwill (ROIC) 21 18 16 13 13
Return on equity (ROE) 29 27 25 25 28
Source: Royal Unibrew (2018)
The revenue improvement was driven by an increase of total sales in Western Europe and in
the Baltic countries. In Western Europe, new craft and specialty beer products were initiatives
that led to the overall increase, despite the weather being poor in Northern Europe. A sales
value focus resulted in higher net revenue for the Baltic countries, even though the total sales
declined by 4% (Royal Unibrew, 2018). The performance of the Royal Unibrew share has been
outstanding during the last year, as it has increased its value from 272.6 DKK per share by the
end of 2016 closing at 371.8 DKK per share in 2017 (Royal Unibrew, 2018).
12
Royal Unibrew is listed on NASDAQ OMX Copenhagen and is placed in the Midcap index.
At the end of 2017, approximately 17,000 shareholders were registered containing 88% of the
52,700,000 total shares. Noticeable, only one investor owns more than 5% of the shares, namely
Chr. Augustinius Fabrikker A/S (Royal Unibrew, 2018). Royal Unibrew’s financial policies
include maintaining an equity level of at least 30%, the ratio of net interest bearing debt (NIBD)
to earnings before tax, depreciations and amortization (EBITDA) to be less than 2.5 times
(Royal Unibrew, 2018).
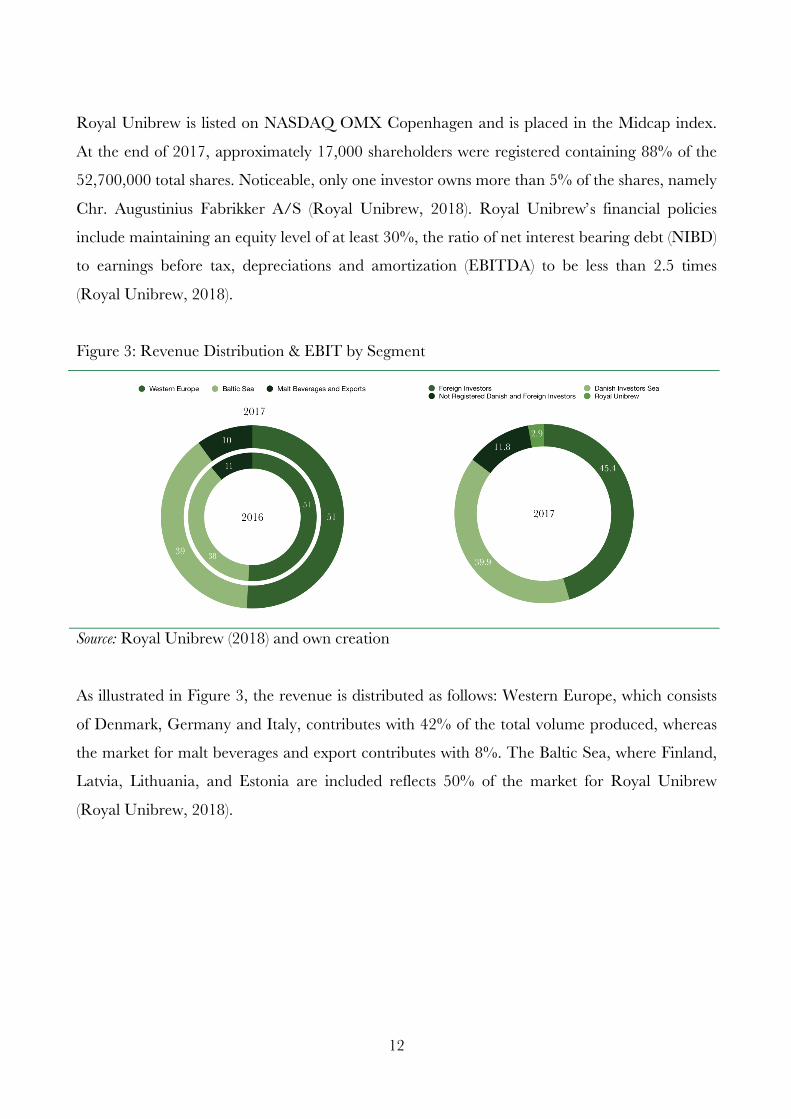
Figure 3: Revenue Distribution & EBIT by Segment
Source: Royal Unibrew (2018) and own creation
As illustrated in Figure 3, the revenue is distributed as follows: Western Europe, which consists
of Denmark, Germany and Italy, contributes with 42% of the total volume produced, whereas
the market for malt beverages and export contributes with 8%. The Baltic Sea, where Finland,
Latvia, Lithuania, and Estonia are included reflects 50% of the market for Royal Unibrew
(Royal Unibrew, 2018).
13
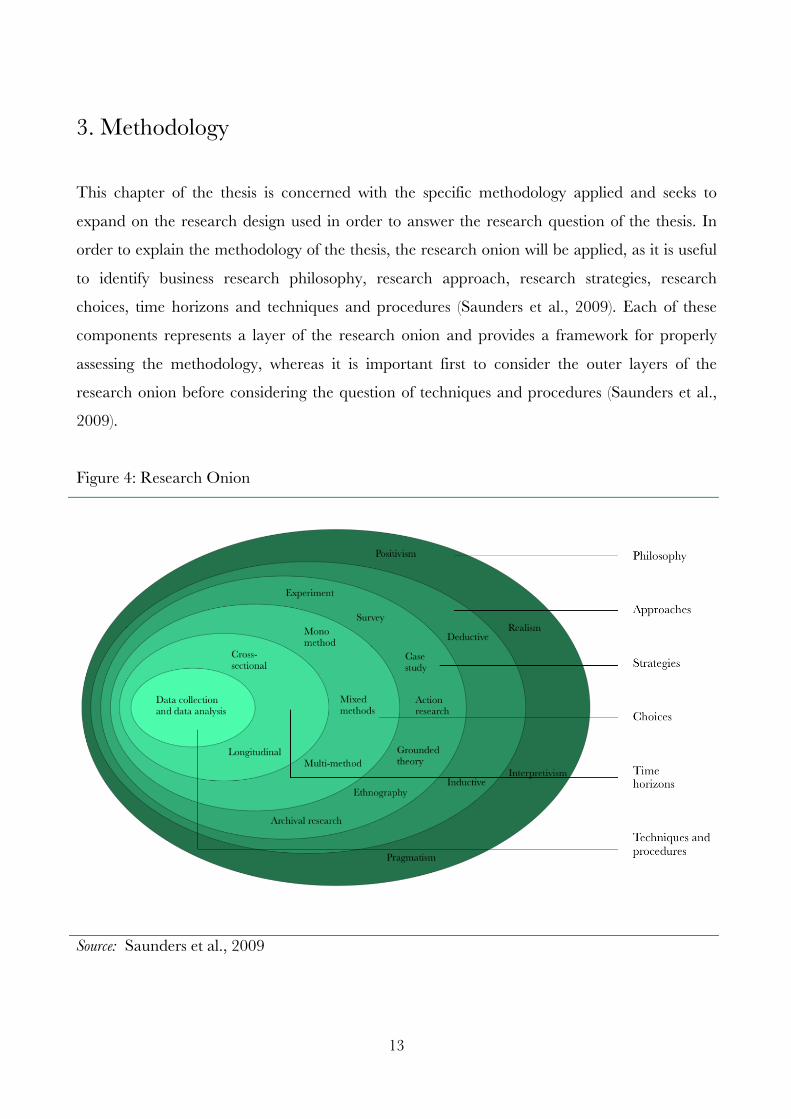
3. Methodology
This chapter of the thesis is concerned with the specific methodology applied and seeks to
expand on the research design used in order to answer the research question of the thesis. In
order to explain the methodology of the thesis, the research onion will be applied, as it is useful
to identify business research philosophy, research approach, research strategies, research
choices, time horizons and techniques and procedures (Saunders et al., 2009). Each of these
components represents a layer of the research onion and provides a framework for properly
assessing the methodology, whereas it is important first to consider the outer layers of the
research onion before considering the question of techniques and procedures (Saunders et al.,
2009).
Figure 4: Research Onion
Source: Saunders et al., 2009
14
By peeling one layer at a time of the research onion, the methodology can be explained starting
with the philosophy and ending with data collection and data analysis (Saunders et al., 2009).
3.1 Philosophy The research philosophy refers to the way one views the world and based on this philosophy
shapes the research strategy (Saunders et al., 2009). This is important to consider in order to
understand what is actually being done and to understand what is in fact being investigated
(Johnson & Clark, 2006). Furthermore, within the outer layer of the research onion, the
question about ontology, epistemology and axiology is important as well (Saunders et al., 2009).
Ontology refers to the basic view of the world, for instance, whether the world can be seen as a
fair picture of event or as a complex phenomenon (Olsen & Pedersen, 1999). Epistemology
refers to how the researcher thinks is acceptable knowledge (Saunders et al., 2009), and how the
subject field should be studied (Olsen & Pedersen, 1999). Axiology refers to how the researchers
view the role of values in the research conducted (Saunders et al., 2009).
This thesis emerges from pragmatism where the ontology is external, multiple and the view of
the thesis is chosen based on what answers the research question the best and thereby is the
researchers view of the nature of reality (Andersen, 2008; Saunders et al., 2009). The
epistemology of pragmatism is that both observable phenomena and subjective meanings can be
sufficient, since it is the research question that is in focus, and whatever answers the research
question is accepted (Saunders et al., 2009). Furthermore, values play a large role when it comes
to interpreting results and both objective and subjective points of view are adopted (Saunders et
al., 2009).
3.2 Approach The research approach refers to the question of how the research is structured and the use of
either deduction or induction (Saunders et al., 2009). A deductive approach means that the
researcher develops theory and seeks to design a research strategy in order to obtain an answer
to the theory. Having an inductive approach refers to collecting data and afterwards developing
a theory based on the data collected (Saunders et al., 2009).
15
This thesis is structured with a deductive research approach, since the work emerges from
existing theories, and conclusions will be based on these theories (Andersen, 2008). As such, a
general knowledge is used on a single phenomenon. In this case, theories, models and
framework are used to describe and analyze the situation of an international expansion of Royal
Unibrew, both strategically and from an acquirer’s point of view (Andersen, 2008). In the
pursued of doing so, a highly structured methodology is applied and, furthermore, the facts of
this thesis are enable to be measured quantitative (Saunders et al., 2009).
Based on the philosophy and research approach, the research strategy, collection techniques
and procedures will be affected, and thereby go into another layer of the research onion
(Saunders et al., 2009).
3.3 Strategy The research strategy can be useful for explorative, descriptive, explanatory and predictive
research (Yin, 2003), and can take the form of seven different strategies: experiment, survey,
case study, action research, grounded theory, ethnography and archival research (Saunders et
al., 2009). The strategies can be equally good and therefore no strategy is necessarily better than
the other (Saunders et al., 2009). Due to the limits of the thesis, only the relevant research will
be assessed.
This thesis takes the form of a case study, since the research focuses on a phenomenon within
the constraints of real life, where the expansion of Royal Unibrew is a phenomenon, which is
very real in the sense that it might happen at some point in the future (Yin, 2009). Furthermore,
several sources of information are used to enlighten the phenomenon (Yin, 2009), and this thesis
will not gather reliable information in a more broad sense (Flyvbjerg, 2004). Applicable for this
thesis is that the research focuses on a single organization, Royal Unibrew, which essentially
makes the case study a single case study (Kruuse, 2007). Including this, the thesis represents a
new combination of already known conditions, which have not been subject to a further analysis
(Yin, 2009). Besides being a single case study, the thesis also takes a holistic approach. Due to
the fact that Royal Unibrew, as a whole, is subject to the research and analysis of this thesis, and
16
not several sub-units as well, it can be argued that a holistic approach is present (Saunders et al.,
2009).
3.4 Choice The question of research choice refers to the way the researcher chooses to combine
quantitative and qualitative techniques and procedures (Saunders et al., 2009). The researcher
can either choose a mono method, multi-method or mixed methods approach. The mono
method refers to combining a single data collection technique with the same data analysis
procedure (Saunders et al., 2009). The multi-method approach refers to a multiple data
collection technique, but with only a single analysis procedure. Finally, the mixed methods
approach, where both quantitative and qualitative data techniques and analysis procedure are
used (Saunders et al., 2009).
This thesis uses a mixed methods approach, since both quantitative and qualitative data
techniques are being used. These specific techniques are described in the section 3.6.
Furthermore, both quantitative and qualitative procedures are used in order to assess and
analyze the data collected.
3.5 Time horizon When it comes to time horizon of the research it can either be cross-sectional or longitudinal,
and in both cases horizon is independent from the research strategy (Saunders et al., 2009). The
cross-sectional time horizon refers to a particular time, where the researcher studies over a short
period of time (Saunders et al., 2009). The longitudinal time horizon refers to a period of time,
in which the researcher can study a change or development (Saunders et al., 2009).
In this thesis a cross-sectional approach is used, since it is interesting to examine what expansion
options Royal Unibrew has now. This way the research is a “snapshot” taken at a particular
time and therefore not over a longer period of time (Saunders et al., 2009). Given the limitations
of this thesis, the research would not allow a longitudinal time horizon, since there would not be
a sufficient amount of time available to conduct such an analysis (Saunders et al., 2009).
17
3.6 Techniques and procedures The techniques and procedures of this thesis are both qualitative and quantitative. The
qualitative techniques and procedures make a link to reality in order to find a connection
between what is studied and how things are in the real world (Olsen & Pedersen, 1999). The
quantitative techniques and procedure supply an overview over large existing data samples,
which are thereafter interpreted (Olsen & Pedersen, 1999).
3.6.1 Data Collection The data collection can also be divided into qualitative and quantitative sections, since data is
collected using different methods (Olsen & Pedersen, 1999).
3.6.1.1 Qualitative Data Collection
Data collection for the qualitative techniques and procedures are primarily in the form of
interviews. Two interviews are performed: the first interview is with Simon Andersson, Head of
Controlling in Group Finance of Royal Unibrew, and took place in Royal Unibrew
headquarters in Faxe. This interview serves the thesis as an internal interview of Royal
Unibrew. The questions, which were sent beforehand to Simon, can be seen in Appendix 2 and
a transcript of the interview can be seen in Appendix 3. The second interview is with Iben
Marie Bason, Marketing Director of Carlsberg. This interview serves the thesis as an expert
interview of the beer industry. The questions, which were sent beforehand to Iben, can be seen
in Appendix 4 and a transcript of the interview can be seen in Appendix 5. Both interviews
undergo the same technique and procedure and therefore this will only be outlined once.
Both interviews are active interviews, which according to Holstein and Gubrium (2004) all
interviews are, and a two-way conversation, which makes the interview interactional and
constructive (Holstein & Gubrium, 2004). Both interviews are semi structured, since the
questions are main questions or themes, which are presented in an interview guide. This
interview guide is sent beforehand to the interviewee and based on the interview, other
questions are improvised during the interviews. However, the main theme is followed during the
entire interview (Justesen & Mik-Meyer, 2013). This is also called open interviews, where no
standardized answers exist (Andersen, 2008). The data is collected by the researchers of this
18
thesis and the interviewee reacts to the questions asked, which makes both interviews primary
stimuli data (Andersen, 2008).
Both interviews are classified as research interview, since the purpose of both interviews are to
gain a deeper understanding of behaviour, motives and personality of companies within the
beer industry (Kvale, 1979). However, this form of interview can bring along challenges since
the interviewer must listen, interpret the answers and ask probing follow-up questions
(Andersen, 2008). Furthermore, a bias may exist in part of the interview since the answers from
Royal Unibrew may be pre-formed. This adds a restriction to the interview and may prohibit a
pure answer (Holstein & Gubrium, 2004).
Furthermore, secondary data exists in the form of an e-mail from Simon Andersson received
after the interview containing information about weights of the various determinants (Appendix
14). This data is classified as primary literature under the category of secondary literature
(Andersen, 2008). Furthermore, annual reports, various publications and websites have been
used for the analysis. This data also classifies as secondary literature under the category of
secondary data (Andersen, 2008).
3.6.1.2 Quantitative Data Collection
Data collection for the quantitative techniques and procedures is in the form of document
analysis of various annual reports and statistical data. Furthermore, it is in the form of data
subtracted from the database Orbis. The data is thereby collected by others and is therefore
secondary data (Andersen, 2008). Furthermore, the data from Orbis can is qualified as register
data, since data is established in relation to registration and control (Andersen, 2008). The
specific data selection technique regarding data from Orbis is explained later in the thesis in 9.2
and will therefore be described shortly in this section. A specific data population is selected
serving as the master data, which essentially is too large for a thorough analysis due to the
number of breweries and parameters. Moreover, a viewing of the data population is done in
order to inspect for obvious errors and missing information (Andersen, 2008). Given the
limitations of the thesis, a sample of this data is selected based on certain criteria explained in
section 9.2.
19
3.6.2 Validity Validity has to do with the quality of the research (Olsen & Pedersen, 1999), and refers to
whether the thesis actually researches what it appears to be researching (Saunders et al., 2009).
In other words, validity says something about the connection between the theory and how
relevant the empirical foundation is (Andersen, 2008).
3.6.2.1 Validity for Qualitative Data
Validity is the most important category of quality, since it concerns whether or not the thesis is
clear enough (Saunders et al., 2009). The validity of the qualitative data begins with the
questions of technical validity, which refers to whether a correct data representation is used
(Olsen & Pedersen, 1999). Given Simon Andersson’s seniority in Royal Unibrew, the technical
validity is fairly high, since he knows how various departments and how Royal Unibrew as a
whole, operate (Andersson, 2018). Moreover, Iben Marie Bason’s responsibilities as Marketing
Director indicate a high technical validity as well. The technical validity for the secondary data
is high as well, since the annual reports, various publications and websites used are accurate and
containing information needed for the analysis.
However, as mentioned earlier, there might be a bias present since the interviewees received the
questions beforehand. This might have changed the answers as opposed to a more honest
answer, where the interviewees would not have time to think of an answer prior to the interview
(Holstein & Gubrium, 2004). Due to the fact that the thesis has a predictive purpose, the
internal validity is low, since internal validity is high for cause coherent studies (Olsen &
Pedersen, 1999).
3.6.2.2 Validity for Quantitative Data
The validity of the quantitative data refers to the technical and statistical validity (Olsen &
Pedersen, 1999). The technical and statistical validity for the various annual reports and
statistical data is very high, since correct data is used, and can, to some extent, be used in other
studies as well and conclusion can be drawn from these documents (Andersen, 2008). This
specific validity regarding the data from Orbis is explained in section 9.1.5.
20
3.6.3 Reliability Reliability also has to do with the quality of the research (Olsen & Pedersen, 1999), and refers to
the consistency of the data collection techniques and procedures (Easterby-Smith et al., 2008),
which in other word means how accurate and precise the research is and to what extent the
techniques and procedures are affected by coincidences (Andersen, 2008).
3.6.3.1 Reliability for Qualitative Data
The reliability of the qualitative data obtained via the interviews is fair, since both interviewees
answer the interview questions to the best of their ability. This also applies for the e-mail from
Simon Andersson. Furthermore, both respondents have a high seniority within the beer
industry and thereby make the answers reliable (Anderson, 2018; Bason, 2018). However, the
reliability is not as high as possible, since a new interview might show slightly different results
due to coincidences. This way, if the interviews were performed at a different time, the
interviewee might be in a different mood, more energized, less stressed etc., which would make
the outcome different and thereby a presence of subject or participant error (Saunders et al.,
2009). Furthermore, since the interviews are semi-structured and therefore somewhat
improvised, the answers to the interview questions would vary every time a new interview is
performed. This form of interviews brings along challenges for the interviewer who has to listen,
interpret the answers and elaborating questions back (Andersen, 2008). Thereby, the interviews
are subject to coincidence, which might give slightly changed answers if a new interview is
performed. However, the reliability for the secondary data is very high, since the data is
prepared beforehand with no factors involved that could change the answer and the data would
be the same each time.
3.6.3.2 Reliability for Quantitative Data
The reliability of the quantitative data refers to the accuracy of the data and whether it is
quantifiable. Furthermore, it refers to whether the data will suffice as a valid representation of
the data population. For the annual reports and statistical data the reliability is high, since data
is accurate and since data is collected by various corporations and experts in collecting data, the
data will suffice as a valid representation of the population (Olsen & Pedersen, 1999). The
specific reliability regarding the data from Orbis is explained in section 9.1.6.
21
4. Theoretical Background
The theoretical background of the first part of the analysis consists of the PESTEL framework,
Porter’s Five Forces, the VRIO framework and the eclectic paradigm (OLI). These models
make up the background for the strategic analysis of the thesis. Furthermore, the review of the
pre-acquisition phase lays the foundation of the structure and determinants used in the second
part of the analysis. Moreover, the AHP approach provides the method used in achieving the
ranking results gained in the pre-acquisition phase
4.1 PESTEL Framework The PESTEL framework is a framework that can be used to analyse the macro-economic
factors (Peng & Nunes, 2007), and to help understand the environment in which an
organization operates and thereby help the organization to take advantage of opportunities and
overcome threats (Issa et al., 2010). When analysing the business environment, the PESTEL
framework analyses all relevant physical or social components outside an organization (Duncan,
1972). According to Lynch (2009) it is important to perform an environmental analysis in order
to obtain a competitive advantage.
The PESTEL framework consists of different aspects, each a macro-economical factor needed
to understand the business environment: political, economical, socio-cultural, technological,
environmental and legal (Yüksel, 2012). With these components it is also possible to perform an
analysis, which provides data that can help an organization to predict situations, which may
occur in the future (Dinçer, 2004). An organization’s competitors, suppliers, customers etc. all
operate within the macro environment, which consists of various forces having an impact on
opportunities and threats. These forces can not be controlled and may affect an organization in
different ways, and it is therefore important to monitor the forces (Kotler et al., 2012).
Furthermore, within each macro-economical factor there are many different aspects to consider
and it is therefore important to prioritize these aspects in order to focus on those having the
highest impact on the industry, market or country (Peng & Nunes, 2007).
22
4.1.1 Political Landscape The first component of the PESTEL framework is the political aspect, which concerns
government regulations and legal matters. The organization must pay attention to the laws and
regulations within their own country or within the country subject to an international expansion
(Issa et al., 2010). These laws and regulations are referred to as government intervention and
political factors such as tax policies, tariffs, trading laws, corruption, political stability etc.
(Kotler et al., 2012). Activities, such as these, in the political aspect of the macro environmental
analysis can both create opportunities and challenges for an organization, which speak to the
relevance of an analysis of the external environment, since the organization needs to be aware
of ongoing situations and potential changes (Kotler et al., 2012).
4.1.2 Economical Landscape The economical aspect refers to economical factors that may influence the business of an
organization and therefore an important part of the analysis of the external environment (Issa et
al., 2010). The economic factors include economic cycles, world trade, exchange rates, interest
rates, commodity prices etc. The same as the political aspect of the PESTEL framework, it is
important to be aware of the current situation and potential changes (Gupta, 2013). It is argued
that this factor is the most important one in terms of attractiveness for potential new investments
(Perera, 2017). Even though it is impossible to change the economic situation it is possible to be
aware of the factors to perform better decision-making. Besides analysing the economic
environment of a country, it can also be relevant to perform an analysis of the industry of a
certain organization, where, for instance, consumer trends can be an important part (Marmol,
2015).
4.1.3 Socio-cultural Landscape The socio-cultural aspect of the PESTEL framework refers to demographic and demographic
habits (Gupta, 2013). The demographic of the macro-economic environment includes
population growth rate, age distribution, inequality and also culture and health (Babatunde &
Adebisi, 2012). The socio-cultural aspect affects the demand of consumers and organizations are
thus heavily affected by the changes in the socio-cultural environment (Babatunde & Adebisi,
2012). It is therefore important for an organization to understand, not only the demographics,
23
but also the demographic habits of a country and market in order to perform successfully
(Marmol, 2015).
4.1.4 Technological Landscape The technological environment refers to technological change on products, processes and
distribution channels (Gupta, 2013), and also includes R&D activities, technology incentives and
also the rate of technological change (Babatunde & Adebisi, 2012). Furthermore, technical
upgrades, infrastructure and competency are all things to consider within this aspect, and given
the relevance of technology in most businesses it is important to consider this in the macro-
economic analysis (Perera, 2017). The aspects of the technological environment can be used to
determine certain entry barriers, minimum efficient product level and can also be important in
regards to outsourcing. Furthermore, change in the technological environment can promote
innovations, but at the same time be very costly for organizations (Babatunde & Adebisi, 2012).
This aspect of the PESTEL framework can be argued to be one of the most important ones for
a technology-based industry (Perera, 2017).
4.1.5 Environmental Landscape The environmental aspect of the PESTEL refers to the environment and sustainable
development and given the recent attention to these factors over the past decades, due to global
warming, averga carbon footprint (Perera, 2017), it is therefore later added to the original PEST
framework (Marmol, 2015). This aspect includes the climate, pollution, wasted disposal and
energy use (Marmol, 2015). This aspect is of particular importance for manufacturing
businesses, due to potential pollution and chemical reactions, and an organization producing
their product in an eco-friendly way can consider this a competitive advantage (Perera, 2017).
4.1.6 Legal Landscape The legal aspect refers to laws of the country of interest, rules, principles and guidelines (Perera,
2017), and it is therefore important to understand the legislation to avoid acting against the law
(Marmol, 2015). Furthermore, business legislation is also relevant for an organization and has
the purpose to protect the organization from unfair competition, to protect consumers from
unfair business practices, to protect from unruly business behaviour and to charge organization
24
with potential social costs caused by the organization (Kotler et al., 2012). To follow the
legislation can even be an advantage for an organization, when the stakeholder sees the
organization being legally bound and thereby promotes ethical business (Perera, 2017).
4.1.7 Critique The PESTEL framework has received critique for being a framework where the outcome of the
analysis is quickly outdated, especially for technology-based organizations (Wolfe & Buchwald,
2000). Given that the framework provides an analysis of the macro-economical environment it
involves many variables, and it might be very difficult and time consuming to cover all the
variables. Even though it might be possible to determine what variables have an impact on the
macro-economical environment, it is hard to determine the exact impact the variables have
(Marmol, 2015). Furthermore, the framework may require other types of analysis such as
regression and trend analysis. Besides this, the outcome of the PESTEL analysis can be distorted
due to false findings in such analysis (Perera, 2017).
4.2 Porter’s Five Forces Porter’s Five Forces was first introduced in the 1980’s by Michael E. Porter (Dobbs, 2012) and is
a theory consisting of five competitive forces, which organizations need to be aware of in order
to gain a market position where they are less vulnerable to the rivalry within an industry (Porter,
1979). Essentially, Porter (2008) argues that competition goes beyond the rivals of an industry
and therefore includes other factors as well. The five forces consist of threats of new entrants,
threat of substitutes, bargaining power of suppliers, bargaining power of buyers and rivalry
among existing competitors (Porter. 1979). These five forces define the structure of all industries
and these forces combined define the potential of an industry (Porter, 2008). The five forces
determine the intensity and competition within an industry and is therefore an important part of
the strategy formulation of an organization (Aron & Waalewijn, 1999). However, it is important
to focus on the variables of an industry, which most companies have in common, since the
variables of an analysis of the industry can vary (Dälken, 2014).
25
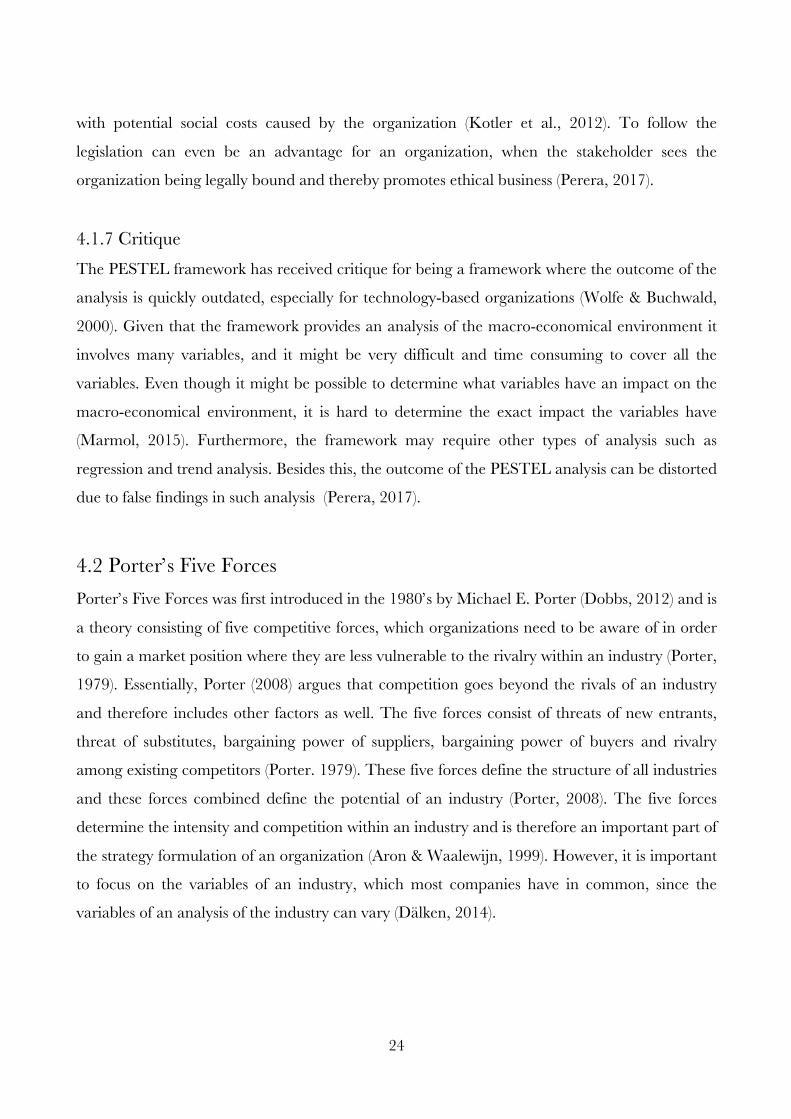
Figure 5: Porter’s Five Forces
Source: Porter, M. E. (1979)
As illustrated above the four forces: threat of entrants, threat of substitutes, bargaining power of
suppliers and bargaining power of buyers all affect the rivalry in the industry, which combined
make up the five competitive forces (Porter, 1979).
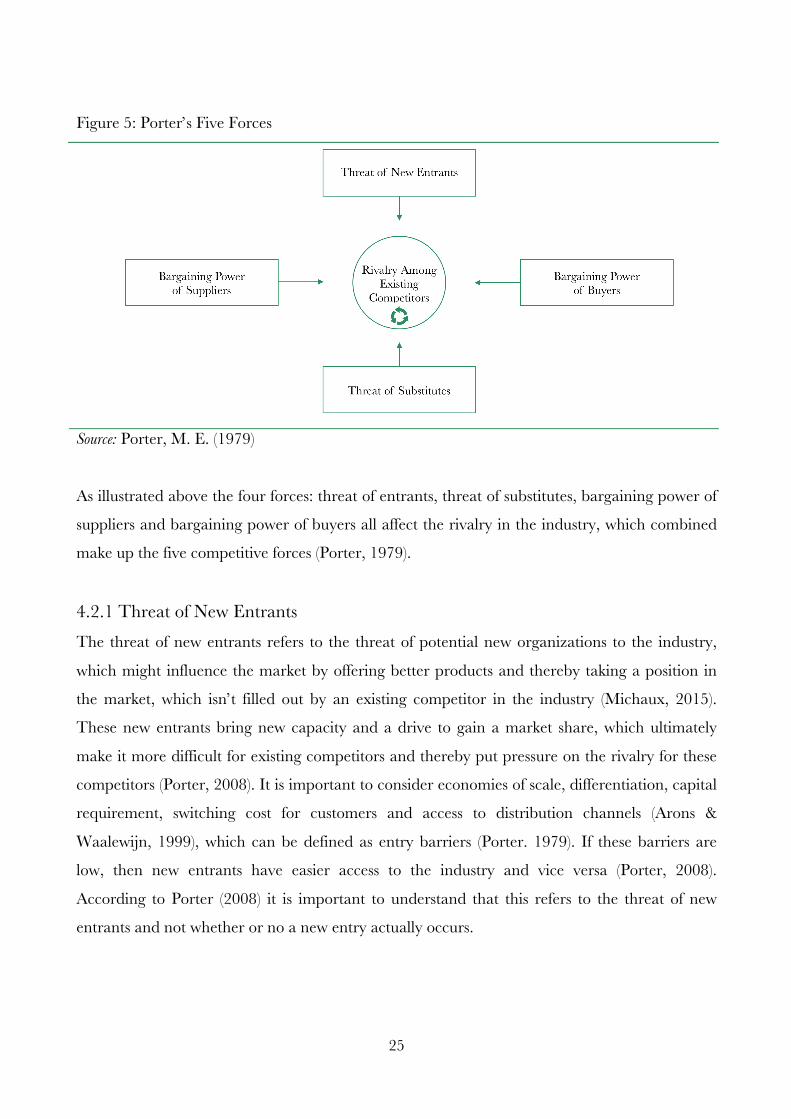
4.2.1 Threat of New Entrants The threat of new entrants refers to the threat of potential new organizations to the industry,
which might influence the market by offering better products and thereby taking a position in
the market, which isn’t filled out by an existing competitor in the industry (Michaux, 2015).
These new entrants bring new capacity and a drive to gain a market share, which ultimately
make it more difficult for existing competitors and thereby put pressure on the rivalry for these
competitors (Porter, 2008). It is important to consider economies of scale, differentiation, capital
requirement, switching cost for customers and access to distribution channels (Arons &
Waalewijn, 1999), which can be defined as entry barriers (Porter. 1979). If these barriers are
low, then new entrants have easier access to the industry and vice versa (Porter, 2008).
According to Porter (2008) it is important to understand that this refers to the threat of new
entrants and not whether or no a new entry actually occurs.
26
4.2.2 Threat of Substitutes The threat of substitutes refers to the threat of products and services similar to what already
exist within the industry (Porter, 2008). These substitute products are often based on different
technology (Arons & Waalewijn, 1999), but basically satisfy similar needs, only in a more
innovative way (Michaux, 2015). The threat of substitutes is therefore dependent on how
replaceable the products in an industry is (Mintzberg et al., 2009). It is important to pay special
attention to substitutes, since they sometimes can be hard to identify (Porter, 2008). Substitutes
may not appear as a typical industry product (Porter, 2008), and may only depend on a
potential shift in technology (Arons & Waalewijn, 1999). Substitutes can affect the market share
and put pressure on prices (Michaux, 2015) and basically, the better the substitute is, the tighter
the rivalry within the industry is (Porter, 2008).
4.2.3 Bargaining Power of Suppliers The bargaining power of suppliers refers to the power the suppliers possess over organizations
within an industry (Michaux, 2015). This power can be seen when suppliers choose to raise
prices or reduce quality (Arons & Waalewijn, 1999). This way, suppliers can gain more
profitability from the industry, when the organizations within the industry aren’t able to reject
price increases (Porter, 2008). The bargaining power of suppliers are most significant when
there are only a few suppliers within the industry, when the product supplied is unique, if there
is a threat for the supplier to perform forward integration (Porter, 1979), if the customer group
isn’t important to the suppliers, which means that they have buyers from different industries or
if the product is very important to the business of the organization (Arons & Waalewijn, 1999).
4.2.4 Bargaining Power of Buyers The bargaining power of customers refers to the power customers have over price and quality of
a product (Porter, 2008), and is thereby defined by customers’ ability to negotiate (Cadait,
2015). If the bargaining power of buyers is high, it can be necessary for organizations to lower
the price of their product or provide a better quality, which influence the profitability of the
industry (Porter, 2008). The bargaining power of buyers is high if there are very few buyers, the
product is standardized and therefore easy to buy elsewhere, buyers can integrate backward and
thereby produce it themselves, the quality of the buyers’ product is only limited affected by the
27
industry product (Porter, 2008), the buyers are well informed and it also depends on how willing
the buyers are to experiment with alternatives (Mintzberg et al., 2009).
4.2.5 Rivalry Among Existing Competitors Rivalry among existing competitors refers to price discounting, new products introduced to the
market, improvement, advertising (Porter, 2008) and aggressiveness (Aron & Waalewijn, 1999).
When the rivalry is intense within the industry it can affect how well organizations are doing
within the industry (Dälken, 2014). When the rivalry among existing competitors is intense, it is
most likely that organizations will match offers given by their competitors (Aron & Waalewijn,
1999). The rivalry is most intense if the competitors roughly are of equal size, the growth of the
industry is slow, exit barriers are high, competitors are very committed, firms cannot read each
others’ signals, and if products are nearly identical (Porter, 2008).
4.2.6 Critique Even though Porter’s Five Forces is widely used by many analysts, it is still subject to criticism,
and is criticised for having no justification for the model having precisely these five forces.
(O'shaughnessy, 1984). Furthermore, the model is criticized for not taking time into account,
and this might be an issue since industries can rapidly change (Dälken, 2014). Moreover, using
the model does not guarantee a competitive advantage (Aktouf, 2004), and forces of the industry
can not explain all changes in the industry and it is more important to stay innovative and
collaborative (Grant, 2011).
4.3 VRIO Framework In order to assess the value creating resources of a firm, the VRIO framework helps determine
the usefulness of these resources (Peng & Meyer, 2011). This framework was introduced by
Barney, J. B. who starts by defining strategy as the pattern of resources and capability
allocation. With this definition he refers to what helps the performance of a firm to maintain or
improve (Barney 1991). This definition was developed in the Resource Based View of the
organization, which explains how strategic assets add to the competitive advantage of an
organization (Jugdev et al., 2007). By focusing on the characteristics of the resources and
differentiate from other views by not focusing as much on the relationship between the various
28
resources that an organization may possess and how the organization is structured and
organized (Wiklund & Shephard, 2003). Basically, this means that an organization is seen as a
group of resources, which can be categorized into different categories (Barney, 1991). Penrose
(1959) even identifies resources as bundles of potential services. Thereby, the Resource Based
View contributes to the internal analysis and explains why organizations are different and how
organizations can achieve a sustainable advantage (Wernerfelt, 1984).
The VRIO framework thereby emerges from the Resource Based View and focuses on four
aspects of an organizations resources, which are value creation (V), rarity (R), imitability (I) and
organization (O) (Peng & Meyer, 2011). The Resource Based View, in this way, states that an
organization that posseses valuable, rare and inimitability resources has the potential of having a
competitive advantage and the possibility to outperform competitors (Wiklund & Shephard,
2003). Although it is important for a company to possess such resources, it is equally important
to be able to manage to make use and take advantage of these resources (Barney, 1991). In
other words, the competitive advantage and outstanding performance of an organization comes
from the firm-specific resources and not from profit market positioning (Wernerfelt, 1984).
Within the Resource Based View it is important to distinguish between an organization’s
primary resources and their capabilities, where the primary resources are the organizations
tangible and intangible assets along with human resources and where capabilities refer to the
organization’s ability to use these resources to achieve their targets (Peng & Meyer, 2011).
According to Amit and Schoemaker (1993), the organization must have adequate capabilities in
order to take advantage of their resources. Within the VRIO framework, the four aspects play
an important role in categorisation of the resources and are as such a necessity to assess whether
the resource is valuable, rare, difficult to imitate and exploited by the organization (Barnes,
1997).
4.3.1 Value Creation An important question within the Resource Based View is whether or not the resource adds
value, which means if the resource enables the organization to seize an opportunity or deal with
a possible threat (Peng & Meyer, 2011). This basically means that with valuable resources an
29
organization can make profits and prevent losses (Miller & Shamsie, 1996). Only a value
creating resource can lead to competitive advantage and should a resource be non-value
creating, it can lead to competitive disadvantage and thus the resources and an organizations
performance are correlated (Peng & Meyer, 2011). What is important to be aware of is, that
even though an organization has a value creating resource and the capability to seize
opportunities, and thereby gain a competitive advantage in the home country, it may not be
easy to transfer their capabilities abroad (Peng & Meyer, 2011).
4.3.2 Rarity Besides being value creating, a resource also needs to be rare in order to lead to a competitive
advantage. Otherwise the resource will only lead to a competitive parity with normal economic
performance and rarity is thereby about having something that other organizations do not have
(Peng & Meyer, 2011). If other organizations have the same value creating resources, it is very
likely that they will use them in a similar way and thereby have the same strategy in order to
seize opportunities. It is, as such, not possible for any of the organizations to achieve a
competitive advantage by using such a resource (Barney & Zajac, 1994).
4.3.3 Imitability Even though an organization is able to create a competitive advantage from a resource that is
value creating and rare, this will only be temporary if the resource is imitable (Peng & Meyer,
2011). If an organization’s competitors are able easily to imitate the resource, they would have
opportunities and thus the competitive advantage would disappear (Cardeal & António, 2012).
When it comes to imitating a resource it is easier to imitate a tangible resource rather than an
intangible capability, although imitation in general is difficult (Peng & Meyer, 2011). This is due
to casual ambiguity, which means that it is difficult to identify the casual determinants of an
organization’s normal performance. This is due to the fact that a lot of organizations have
certain patterns, which are difficult to model (Peng & Meyer, 2011). Furthermore, multinational
enterprises (MNE’s) have what is called a social complexity, which makes it hard, even for
managers within the MNE, to determine exactly what makes the organization successful (Peng
& Meyer, 2011). This is due to having many employees in different countries and it is very
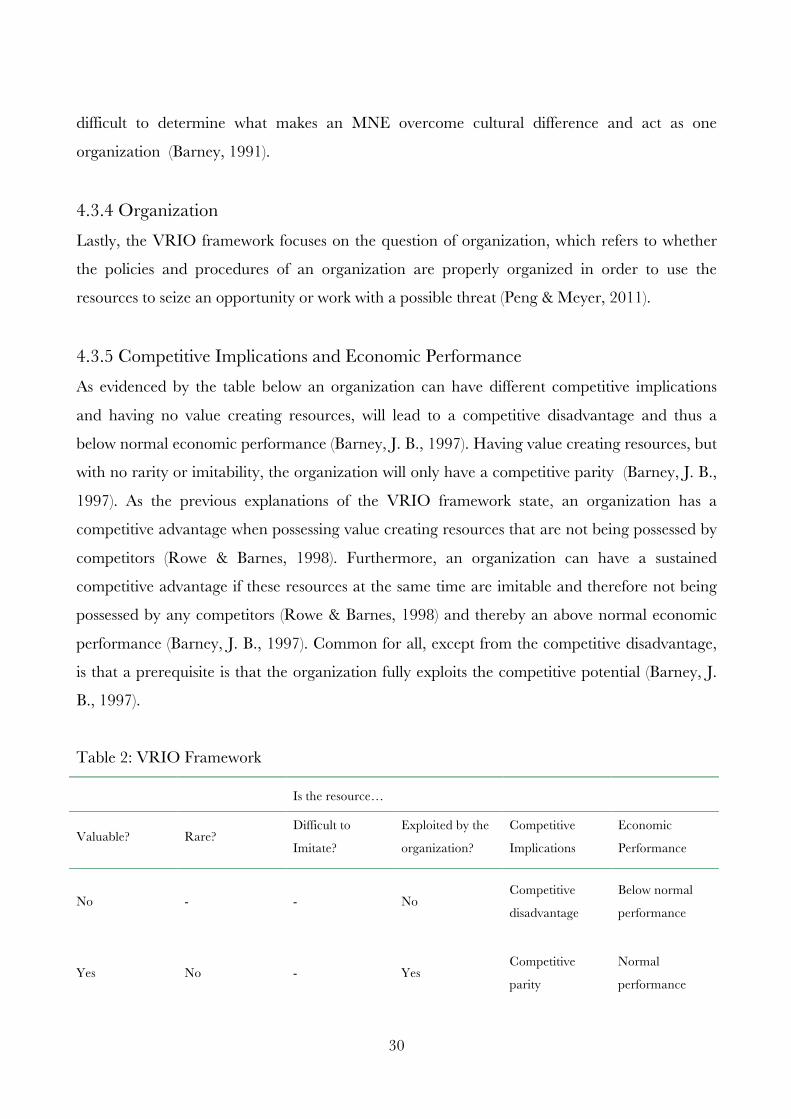
30
difficult to determine what makes an MNE overcome cultural difference and act as one
organization (Barney, 1991).
4.3.4 Organization Lastly, the VRIO framework focuses on the question of organization, which refers to whether
the policies and procedures of an organization are properly organized in order to use the
resources to seize an opportunity or work with a possible threat (Peng & Meyer, 2011).
4.3.5 Competitive Implications and Economic Performance As evidenced by the table below an organization can have different competitive implications
and having no value creating resources, will lead to a competitive disadvantage and thus a
below normal economic performance (Barney, J. B., 1997). Having value creating resources, but
with no rarity or imitability, the organization will only have a competitive parity (Barney, J. B.,
1997). As the previous explanations of the VRIO framework state, an organization has a
competitive advantage when possessing value creating resources that are not being possessed by
competitors (Rowe & Barnes, 1998). Furthermore, an organization can have a sustained
competitive advantage if these resources at the same time are imitable and therefore not being
possessed by any competitors (Rowe & Barnes, 1998) and thereby an above normal economic
performance (Barney, J. B., 1997). Common for all, except from the competitive disadvantage,
is that a prerequisite is that the organization fully exploits the competitive potential (Barney, J.
B., 1997).
Table 2: VRIO Framework
Is the resource…
Valuable? Rare? Difficult to
Imitate?
Exploited by the
organization?
Competitive
Implications
Economic
Performance
No - - No Competitive
disadvantage
Below normal
performance
Yes No - Yes Competitive
parity
Normal
performance
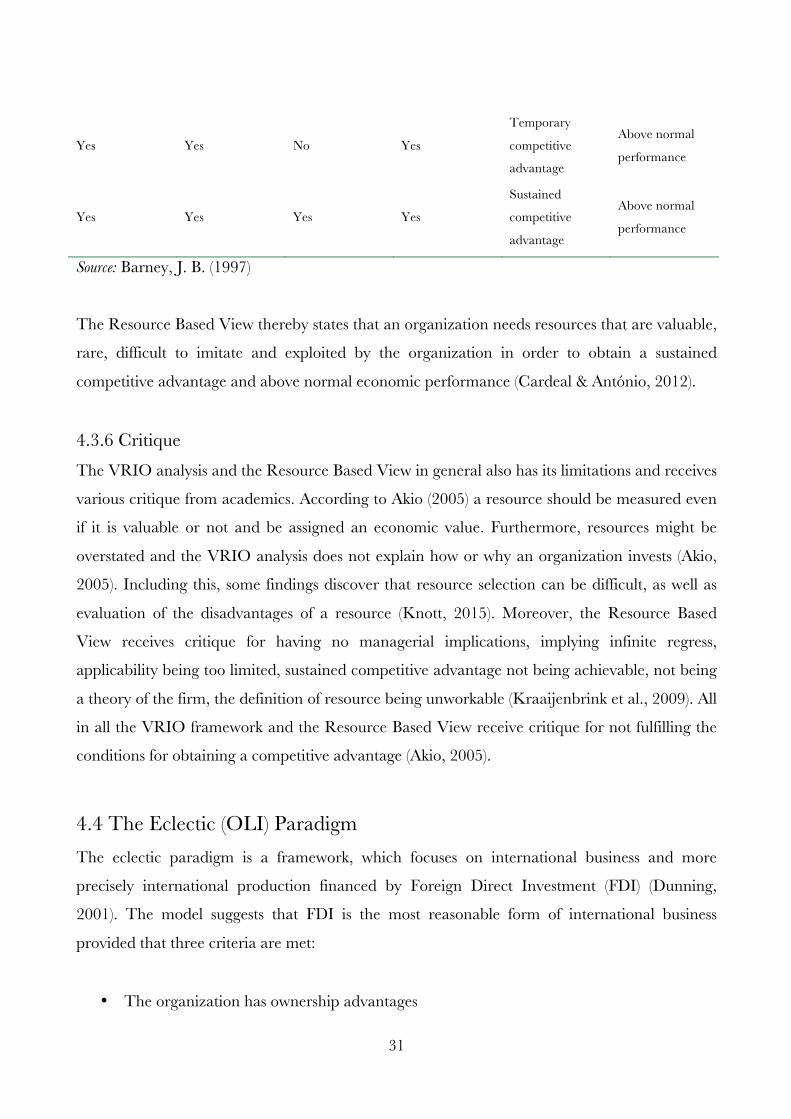
31
Yes Yes No Yes
Temporary
competitive
advantage
Above normal
performance
Yes Yes Yes Yes
Sustained
competitive
advantage
Above normal
performance
Source: Barney, J. B. (1997)
The Resource Based View thereby states that an organization needs resources that are valuable,
rare, difficult to imitate and exploited by the organization in order to obtain a sustained
competitive advantage and above normal economic performance (Cardeal & António, 2012).
4.3.6 Critique The VRIO analysis and the Resource Based View in general also has its limitations and receives
various critique from academics. According to Akio (2005) a resource should be measured even
if it is valuable or not and be assigned an economic value. Furthermore, resources might be
overstated and the VRIO analysis does not explain how or why an organization invests (Akio,
2005). Including this, some findings discover that resource selection can be difficult, as well as
evaluation of the disadvantages of a resource (Knott, 2015). Moreover, the Resource Based
View receives critique for having no managerial implications, implying infinite regress,
applicability being too limited, sustained competitive advantage not being achievable, not being
a theory of the firm, the definition of resource being unworkable (Kraaijenbrink et al., 2009). All
in all the VRIO framework and the Resource Based View receive critique for not fulfilling the
conditions for obtaining a competitive advantage (Akio, 2005).
4.4 The Eclectic (OLI) Paradigm The eclectic paradigm is a framework, which focuses on international business and more
precisely international production financed by Foreign Direct Investment (FDI) (Dunning,
2001). The model suggests that FDI is the most reasonable form of international business
provided that three criteria are met:
• The organization has ownership advantages
32
• The local context provides location advantages
• The firm’s activities are better managed within a multinational firm, which refers to
internationalization advantages
These three conditions thereby make up the other name for the eclectic paradigm: the OLI
framework (Peng & Meyer, 2011). However, if these conditions aren’t met it might be more
beneficial to engage in international business by exporting, licensing or offshore outsourcing
(Peng & Meyer, 2011). Furthermore, Dunning (1993) identifies four different types of
international production, which are natural resource seekers, market seeker, efficiency seekers
and strategic asset or capability seekers. The OLI Framework was developed by Dunning, J. H.
in 1973 by first introducing the O and L of the model and later introducing the I in order to
explain the activities of an organization outside its national boundaries (Dunning, 2001).
Important to understand about the OLI framework is that it is, in fact, a framework and not a
theory, which would help the analyst identify the needed theories for the analysis (Itaka, 1991).
In order to better understand the OLI framework one must look into the three forces of the
paradigm (Dunning, 2001).
4.4.1 Ownership Advantages Ownership advantages refer to the competitive advantages that an organization possesses,
which other organizations do not. These advantages thereby come from the resources of the
organization and from the organization’s capabilities to exploit these resources in order to
perform better than its competitors (Dunning, 2001). An organization is able to use these
resources across borders so that the organization can have a competitive advantage outside of
the national borders. The ownership advantages of an organization need to be used
internationally in order to overcome challenges when performing FDI. When FDI is performed
it is very common that the organization performing the FDI, has a disadvantage due to the
liability of outsidership (Peng & Meyer, 2011). However, not all resources can be used
internationally, or are at least difficult to transfer from home country to host country. These
resources are called location-bound resources and organizations with such resources have a
higher possibility to grow domestically (Peng & Meyer, 2011).
33
4.4.2 Location Advantages Location advantages refer to the advantages associated with a specific location that would not
be able to be obtained in the home market (Dunning, 2001), such as access to local markets, raw
material and resources (Peng & Meyer, 2011). Thereby, the question of location advantages of a
specific host country is very important when it comes to FDI (Dunning, 1998). As mentioned in
the earlier section, organizations engaging in international business will naturally have a
disadvantage due to the liability of outsidership and this stresses the importance of location
advantages, since the organization wouldn’t be able to overcome the liability of outsidership
without these (Peng & Meyer, 2011). In order to overcome this liability, organizations need to
be aware of different types of advantages associated with the specific location (Dunning, 1988;
Peng & Meyer, 2011).
Organizations need to be aware of market advantage by looking into future demand as well as
large and growing markets (Peng & Meyer, 2011). Furthermore, it is important to look at
market failure and distortions, for example government interventions (Dunning, 1988).
Location-bound resources is another important advantage to consider, where a specific location
might have better access to natural resources, human capital and infrastructure (Peng & Meyer,
2011). Furthermore, agglomeration is a factor to consider as well, which refers to the
advantages, which arise from clustering. Such advantages are in the form of knowledge spillover
among organizations, which are located close to each other, a more skilled labor force and
suppliers and buyers who may locate themselves near the clustering (Peng & Meyer, 2011).
Lastly, the institutional environments can be considered a location advantage, where potential
free access for foreign investors, the level of corruption and bureaucracy are important factors
(Peng & Meyer, 2011).
4.4.3 Internalization Advantages Internalization advantages refer to whether and how organizations choose to locate activities
outside the home country (Dunning, 2001) As mentioned earlier, an organization can choose to
internalize using different entry strategies, whereas the OLI framework presents the three
conditions to an FDI (Peng & Meyer, 2011). Besides FDI an organization can choose exporting,
licensing or outsourcing as an entry strategy (Peng & Meyer, 2011). With only ownership
34
advantages, and no location or internalization advantages, an organization chooses to export.
However, export deals are very specific to a business relationship and therefore can be exploited
by the other party of the relationship (Hennart, 1988). This can be avoided with FDI since
instead the partnership only one organization will conduct business in both countries (Peng &
Meyer, 2011).
Compared to FDI, licensing lacks direct management due to the fact that another organization
has the right to sell ones product, which means that there exists a risk that the licensee uses the
knowledge in a way that was not agreed (Hill et al., 1990). Besides this, it can be difficult to
transfer knowledge, since it might not be documented knowledge, but knowledge that requires
the organization licensing to facilitate and make sure everything is as it should be. Furthermore,
it can be difficult to control the use of the product, all of which can be avoided with FDI (Peng
& Meyer, 2011). Instead of transferring knowledge, an organization can also choose to transfer
activities in order for them to be returned to the organization, which is called offshore
outsourcing (Peng & Meyer, 2011). However, compared to FDI, offshoring outsourcing should
involve simple and common activities in order to avoid investing in a service where the end
product is incorrect. Furthermore, the service provider can use the knowledge and provide the
service for competitors of the organization. Lastly, the issue of monitoring is more difficult with
offshore outsourcing than FDI and can be costly as well (Peng & Meyer, 2011).
The significance of the advantages is likely to be context specific and vary across industries,
regions, and countries and among firms (Dunning, 2001).
4.4.4 Critique The OLI framework has received critique for not being predictive due to the large number of
variables identified by the paradigm. Due to the large number of variables within the
components of the OLI framework it is almost impossible for the paradigm to be exact and
predictive, since the margin for error is large (Dunning, 2001). Furthermore, some academics
believe that the components of the OLI framework are interdependent in such a way that
location advantages may have an impact on ownership advantages. This distorts the purpose of
the paradigm, since the different advantages should be analysed independently (Dunning,
35
2001). Including this, it has been argued that the eclectic paradigm does not give any guidance
on dynamics of the internationalisation (Dunning, 2001). According to Itaki (1991) there exists a
redundancy of the ownership advantages, since it originates from the internalization, Moreover,
it is not possible to separate ownership advantages and location advantages, since ownership
advantages are influenced by the location advantages (Itaki, 2991). Lastly, Eden (2003) criticizes
the framework for not taking timing into account, since timing issues are increasingly being paid
attention to within international business and strategy.
4.5 Mergers & Acquisitions – A Review of the Pre-Acquisition Process This section will strive to explain the process when undergoing a merger or acquisition (M&A).
Moreover, the most common motives and the most relevant determinants for assessing a
candidate in an international setting will be presented.
4.5.1 The process of a Merger and Acquisition The assessment and decision process is named due diligence process (Haspslagh & Jemison,
1991; Very & Schweiger 2001; Angwin 2001; Lesser, 2000). The process can be divided into
pre-acquisition and post-acquisition (Harvey & Lusch, 1995). In the pre-acquisition phase, the
acquisitive firm starts with describing the objective and motives behind the acquisition (Tsao,
2009). After describing the motives and objective behind the acquisition, the acquirer starts
searching and screening for possible targets, based on suitable criteria (Sudarsanam, 2003).
Next, the targets which survived the screening are evaluated based on criteria such as, strategic
fit and financial assessment, including assessment of tangible and intangible assets (Haspslagh &
Jemison, 1991; Ahammad & Glaister, 2013; Harvey & Lusch, 1998). If the acquirer and the
target agree on the terms and the takeover becomes a reality, the process moves forward to the
post-acquisition phase (Ahammad & Glaister, 2013). In this phase, the integration of IT-
systems, aligning strategies etc. are examples of important tasks for the integration team (Quah
& Young, 2005).
4.5.2 Motives for Doing International M&A Globalization has led M&A to become a normal strategy for expanding business activities
internationally (Shimizu et al., 2004). The number of transactions of international M&As
36
represents an increasing role in worldwide M&A activities (Bertrand & Zuniga. 2006).
According to Walter and Barney (1990), a crucial determinant to obtain and maintain
competitive advantages in a global market is to acquire competitors, suppliers or do a strategic
merger cross-border.
Acquisitions are particularly relevant for firms, which operate within mature markets with low
growth rates (Yip, 1992). In these markets, economies of scope and scale as well as the demand
from customers globally are the main motives for cross-border expansions (Yip, 1992; Porter,
1986; Levitt, 1983; Carney). Relatively, research has shown that acquisitions are the best
suitable strategy for exploiting these motives (Kapferer, 1997; Levitt, 1983; Yip, 1992; Lynch,
2006).
Acquisitions are most often related to growth in revenue (BCG, 2015; Capron, 1999; Hitt et al.,
2001). However, profitability margin does not grow accordingly. Boston Consultant Group
(2015) found in their research that non-acquisitive firms increase revenue and EBITDA
relatively, whereas acquisitive firms increase revenue at faster rates, but cannot perform at the
bottom line proportionally (BCG, 2015). As a result, even though firms grow in revenue, in 50-
66% of the transactions, the acquisitions destroy value of the firm in the short-term, which have
become a rule of thumb when describing acquisitions (BCG, 2015; Hitt et al., 2001). However,
M&A contributes to other elements than the financials of the acquirer. Synergies, better
utilization of capacities, broader market segment and market reach, entry barriers are becoming
easier to overcome as well as a stronger market position have been found as results of M&A
(Weston et al., 2004; Bruner, 2004; Harrison et. Al 2001; Burkart & Panunzi, 2006). By
acquiring another firm, the acquirer also gains the knowledge that can accelerate the idea phase
and innovation of future products or services (Cloodt et al., 2006; Ranft & Lord 2000). If the
type of knowledge acquired is similar to what is already known, it can be integrated effortlessly
within the organizational framework, and hereby the knowledge lost during M&A is reduced
(Cloodt et. al., 2006).
37
4.5.3 The Search Process and Preliminary Screening DePamphilis (2013) argues that the search after candidates should include reflection on which
market segment that the acquirer desires that their potential target should operate within.
Harvey & Lusch (1998) argues that the acquirer should go through a comprehensive structured
search, with key words such as geographical location, primary operation etc. They elaborate
and stress that the acquirer should not rely its search on insider’s clues, as they may not be
presented to the most attractive transactions. Instead, the potential candidates may exist beyond
the acquirer’s intuition (Harvey & Lusch, 1995).
When the result of the search has been reached, the acquirer should establish a more target
specific screening criteria (Tsao, 2013). Within the financials, screening criteria such as the
targets that are short in profitability and highly levered in terms of high debt-to-equity ratio
should be considered less attractive and therefore, these should be excluded from the candidate
list (Tsao, 2013; DePamphilis, 2013; Sudarsanam, 2003). The wished size of the targeted firm is
a central factor to evaluate, when screening for targets (Datta, 1991). Larger organizations are
often associated with higher complexity, which complicates the integration process during the
post-acquisition phase. Therefore, acquirers must consider the maximum and minimum size of
the candidates they will find interesting (Datta, 1991). When the undesired candidates have
been excluded, the acquirer should now end up with a reasonable number of candidates (Tsao,
2009). These should now individually be evaluated based on more specific criteria
(DePamphilis, 2013; Tsao 2009).
4.5.5 Country Specific Evaluation Determinants Cross-border M&As are considered much more risky than domestic ones, as common issues
with political impact and regulatory, differences in language, and cultural differences (Angwin &
Savill, 1997; ATKearney 2013; BCG 2015). It is therefore critical for the acquiring firm to
assess these factors (Angwin, 2001). Angwin (2001) elaborates further and mentions also tax
complications, danger of expropriation of the firm’s assets, exchange rates etc., as factors to
evaluate before entering a cross-border M&A. Kissin and Herrera (1990) agree in these factors
and add debt to equity ratio as one of the factors to evaluate, as foreign government can impose
restrictions on the firm and thereby influence the capital structure and the financing options.
38
Kang (1993) studied the Japanese M&A activities in the American market. He found that
several factors increased the interest in acquiring U.S firms during the research period. The
exchange rate of American Dollar depreciated significantly compared to the Japanese Yen,
reinforcing the Japanese purchasing power towards their possible U.S targets. In addition,
corporate tax rates were lowered in the U.S. Investments (Kang, 1993). Kang (1993) concludes
that these macro economical features must be assessed when assessing the candidate’s location.
4.5.6 Candidate Specific Evaluation Determinants The financial performance and status of the target firm is of great interest (AT Kearney, 2013;
Epstein, 2005). Epstein (2005) argues that formal financial review of assets, the firm’s revenue
performance and expenses development must be considered when performing due diligence. In
the research the determinants of successful M&A, KPMG (2007) finds that price earnings ratio
(P/E) of the target was statistically significant in affecting the acquisition outcome in regards to
success or failure. Their results show acquisitions of a target with P/E lower than average
produced higher return. As tangible assets to evaluate in the pre-acquisition process, Harvey
and Lusch (1995) mention plant equipment, patents and the technology used by the target. If
the candidate does not match the acquirer technology level, the outcome of the acquisition is
affected negatively (Harvey & Lusch, 1995). Another important determinant is the IS-system,
which the target uses. Alignment of these systems is one of the major challenges in the
integration process after the transaction and thereby an important factor for success (Hedman &
Sarker 2015).
As opposed to financial and tangible determinants, research found that more subjectively
assessed factors are crucial for the decision making (Carr et al., 1994; Slagmulder et al., 1995;
Butler, 1991; Van Cauwenbergh et al., 1996; Epstein 2005; Harvey & Lusch, 1995). This is due
to the fact that argumentation for acquisitions should not only contribute to economic value but
also the compliance with the acquirer’s strategy (Adler, 2000; Carr et al., 1994). Heller (2000)
supports this argument, in which he argues that a successful takeover relies on the strategic fit
between the acquirer and the acquired. According to Hubbard (2001) strategic fit is vital in
being able to capitalize on mutual synergies. Strategic fit involves the target to be aligned with
39
the overall corporate strategy of the acquirer as well as strategic objectives such as market
penetration, market entry or vertical expansion etc. (Hubbard, 2001). Haspelagh & Jemison
(1991) support this view and argue that maintaining this fit between the two firms is a main issue
when acquiring a firm.
Many researchers have focused their study on the impact of cultural fit (Chatterjee et at. 1992;
Sarala & Vaara, 2010; Stahl & Voigt, 2008; Weber et al. 1996; Weber, 1996; Weber et al.,
2011). The success of an acquisition relies on the degree of cultural fit (Heller, 2000; Cartwright
& Cooper, 1992) since cultural fit enables the acquirer to exploit the synergies that may exist
(Weber et al., 1996). In cross-border M&A, cultural differences may be higher, as the national
culture might also differ in addition to the organizational culture (Duncan & Mtar, 2006).
However, Stahl and Voigt (2008) find that the impact of cultural fit is often non-conclusive.
Besides the strategic and cultural fit, competitive advantages can also arise from the seniority of
the employees, know-how and the capabilities of the target’s distributors, advertising agents etc.
(Harvey & Lusch 1995; Hall, 1992; Porter, 1985). Furthermore, the product loyalty of the firm,
the reputation of the company and its individual brands do all impact the forecast of the
company’s future revenue (Harvey & Lusch, 1995; Hall, 1992). Hall (1993) adds intellectual
property rights, trade secrets and patents to the evaluation list. Harvey & Lusch (1995) support
these factors as they argue that these all will have an apparent impact on the acquisition in the
future. Another issue, which is important to assess is whether product line complement or
substitute the ones of the acquisitive firm as well as the quality of the products (DePamphilis,
2013; Pike et al. 1989).
In their research, Anslinger & Copeland (1996) find that the talent of the management team in
the target firm represents a key factor in the outcome of a successful acquisition as 65% of
acquisitions that were successful reported the management team as the most contributing factor
to the success. Marks and Mirvis (2001) support this finding and argue that besides assessing the
management team, the acquiring firm should also assess the managers who might end up in
more decisive positions in the future. Furthermore, Ahammad & Glaister (2013) find that an
extensive assessment of employees’ efficiency contributes to a successful acquisition.
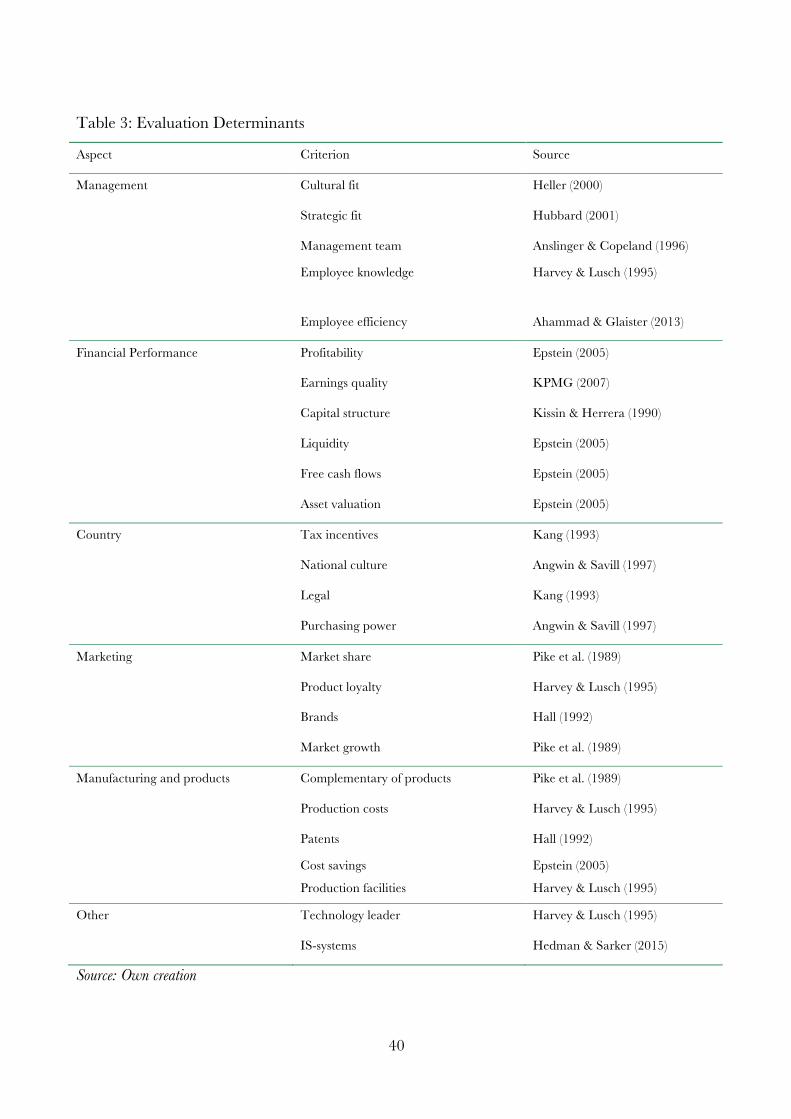
40
Table 3: Evaluation Determinants
Aspect Criterion Source
Management Cultural fit Heller (2000)
Strategic fit Hubbard (2001)
Management team Anslinger & Copeland (1996)
Employee knowledge
Harvey & Lusch (1995)
Employee efficiency Ahammad & Glaister (2013)
Financial Performance Profitability Epstein (2005)
Earnings quality KPMG (2007)
Capital structure Kissin & Herrera (1990)
Liquidity Epstein (2005)
Free cash flows Epstein (2005)
Asset valuation Epstein (2005)
Country Tax incentives Kang (1993)
National culture Angwin & Savill (1997)
Legal Kang (1993)
Purchasing power Angwin & Savill (1997)
Marketing Market share Pike et al. (1989)
Product loyalty Harvey & Lusch (1995)
Brands Hall (1992)
Market growth Pike et al. (1989)
Manufacturing and products Complementary of products Pike et al. (1989)
Production costs Harvey & Lusch (1995)
Patents Hall (1992)
Cost savings
Production facilities
Epstein (2005)
Harvey & Lusch (1995)
Other Technology leader Harvey & Lusch (1995)
IS-systems Hedman & Sarker (2015)
Source: Own creation
41
4.6 Multi Criteria Decision Making The multi criteria decision-marking (MCDM) approach was introduced during the 1970’s as a
method for aggregating the gathered information used to evaluate decisions (Hwang & Yoon,
1981). Thus, the method is used for structuring and solving issues regarding decision problems,
which have attached multiple criteria (Majumder, 2015). In the approach, the researcher
chooses a number of aspects with attached criteria, thus the model can contain different types of
depth-levels (Tsao, 2009). The method is generally used in ex ante issues, where the future
values are not known or available (Adler et al., 2002). Many different methods have been
developed based on this approach (Majumder, 2015), and one of the most well-known is the
analytical hierarchy process (Saaty, 1980)
4.6.1 Analytical Hierarchy Process The analytical hierarchy process (AHP) was developed by T. L. Saaty during the 70s and has its
roots in the multi criteria decision-making world (Triantaphyllo & Mann, 1995). The method
has been used in various settings, as the flexibility of the method enables the decision maker to
adapt it to their own preferences (Bhushan & Rai, 2004). Saaty (1987) argues that decision
makers needed a tool for deriving relatively weights in their decision processes. AHP contains
four steps (Saaty, 2008). Firstly, the problem must be defined and the kind of knowledge that is
desired to obtain through the decision process must be described (Saaty, 1980). The next step is
about decomposition (Saaty, 1987). Here, the problem is structured by using a hierarchy, which
can be divided into numerous levels (see Figure 6). The goal of the decision is placed at the top
of the hierarchy. Next level contains the aspects chosen. The criteria related to each aspect are
placed in the level below the aspects. The candidates, which the decision maker wishes to
distinguish between, are represented in the bottom of the hierarchy. If the decision maker
wishes to, they can add or remove levels. AHP assumes no dependency between the elements,
as is usually seen in MCDM-methods (Saaty, 1987).
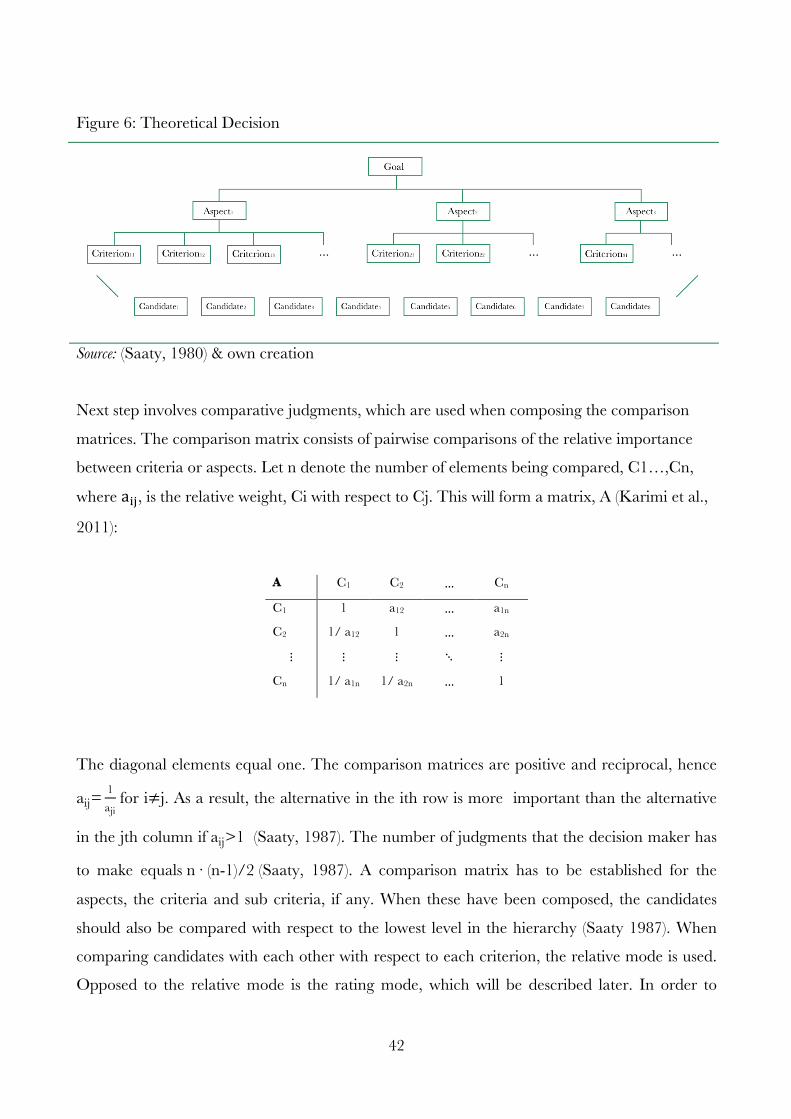
42
Figure 6: Theoretical Decision
Source: (Saaty, 1980) & own creation
Next step involves comparative judgments, which are used when composing the comparison
matrices. The comparison matrix consists of pairwise comparisons of the relative importance
between criteria or aspects. Let n denote the number of elements being compared, C1…,Cn,
where a!", is the relative weight, Ci with respect to Cj. This will form a matrix, A (Karimi et al.,
2011):
A C1 C2 … Cn
C1 1 a12 … a1n
C2 1/ a12 1 … a2n
⋮ ⋮ ⋮ ⋱ ⋮
Cn 1/ a1n 1/ a2n … 1
The diagonal elements equal one. The comparison matrices are positive and reciprocal, hence
aij=1aji
for i≠j. As a result, the alternative in the ith row is more important than the alternative
in the jth column if aij>1 (Saaty, 1987). The number of judgments that the decision maker has
to make equals n ∙ (n-1)/2 (Saaty, 1987). A comparison matrix has to be established for the
aspects, the criteria and sub criteria, if any. When these have been composed, the candidates
should also be compared with respect to the lowest level in the hierarchy (Saaty 1987). When
comparing candidates with each other with respect to each criterion, the relative mode is used.
Opposed to the relative mode is the rating mode, which will be described later. In order to
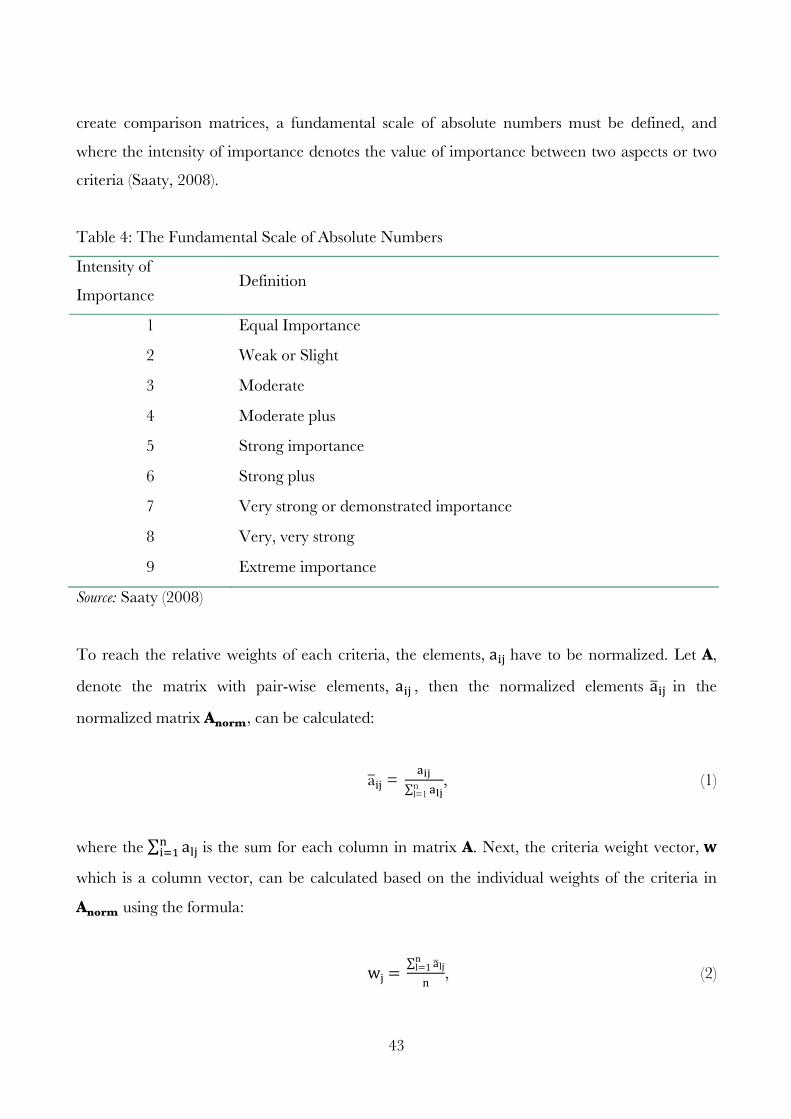
43
create comparison matrices, a fundamental scale of absolute numbers must be defined, and
where the intensity of importance denotes the value of importance between two aspects or two
criteria (Saaty, 2008).
Table 4: The Fundamental Scale of Absolute Numbers
Intensity of
Importance Definition
1 Equal Importance
2 Weak or Slight
3 Moderate
4 Moderate plus
5 Strong importance
6 Strong plus
7 Very strong or demonstrated importance
8 Very, very strong
9 Extreme importance
Source: Saaty (2008)
To reach the relative weights of each criteria, the elements, a!" have to be normalized. Let A,
denote the matrix with pair-wise elements, a!" , then the normalized elements a!" in the
normalized matrix Anorm, can be calculated:
aij = !!"!!"n
l=1, (1)
where the a!"!!!! is the sum for each column in matrix A. Next, the criteria weight vector, 𝐰
which is a column vector, can be calculated based on the individual weights of the criteria in
Anorm using the formula:
wj = aljn
l=1n
, (2)
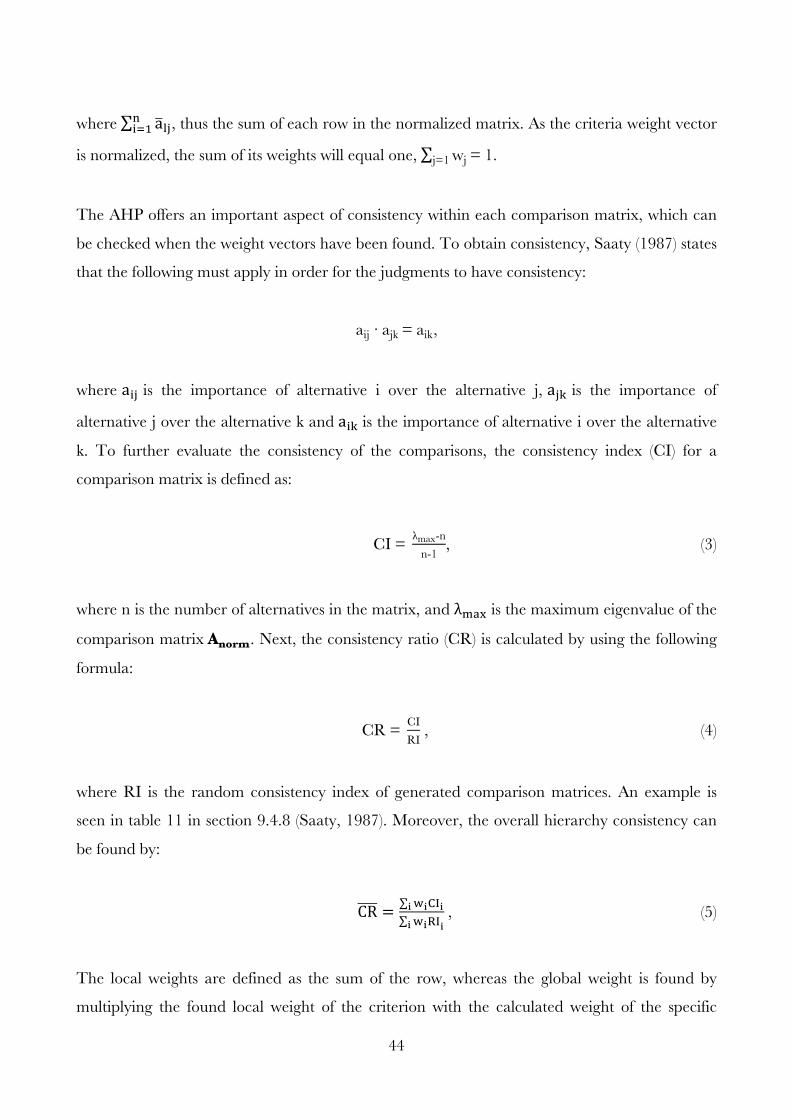
44
where a!"!!!! , thus the sum of each row in the normalized matrix. As the criteria weight vector
is normalized, the sum of its weights will equal one, wjj=1 = 1.
The AHP offers an important aspect of consistency within each comparison matrix, which can
be checked when the weight vectors have been found. To obtain consistency, Saaty (1987) states
that the following must apply in order for the judgments to have consistency:
aij ∙ ajk = aik,
where a!" is the importance of alternative i over the alternative j, a!" is the importance of
alternative j over the alternative k and a!" is the importance of alternative i over the alternative
k. To further evaluate the consistency of the comparisons, the consistency index (CI) for a
comparison matrix is defined as:
CI = λmax-nn-1
, (3)
where n is the number of alternatives in the matrix, and λ!"# is the maximum eigenvalue of the
comparison matrix Anorm. Next, the consistency ratio (CR) is calculated by using the following
formula:
CR = CIRI
, (4)
where RI is the random consistency index of generated comparison matrices. An example is
seen in table 11 in section 9.4.8 (Saaty, 1987). Moreover, the overall hierarchy consistency can
be found by:
CR = !!!!!!!!!"! !
, (5)
The local weights are defined as the sum of the row, whereas the global weight is found by
multiplying the found local weight of the criterion with the calculated weight of the specific
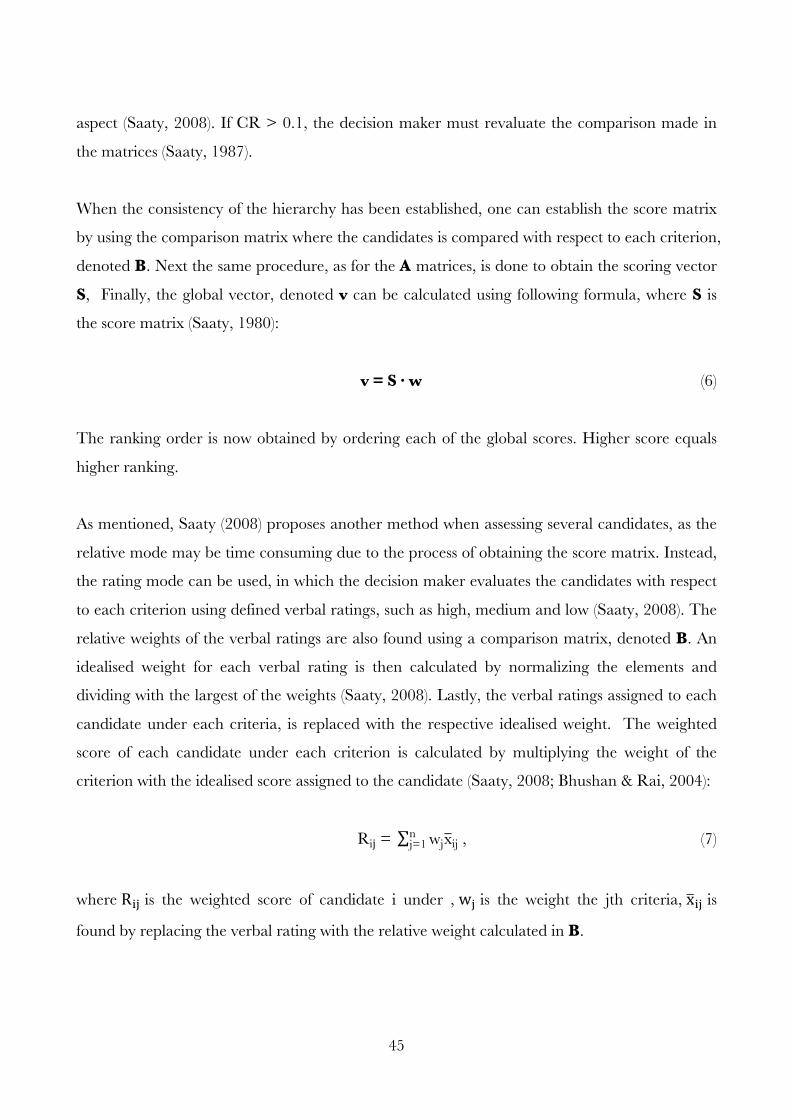
45
aspect (Saaty, 2008). If CR > 0.1, the decision maker must revaluate the comparison made in
the matrices (Saaty, 1987).
When the consistency of the hierarchy has been established, one can establish the score matrix
by using the comparison matrix where the candidates is compared with respect to each criterion,
denoted B. Next the same procedure, as for the A matrices, is done to obtain the scoring vector
S, Finally, the global vector, denoted v can be calculated using following formula, where S is
the score matrix (Saaty, 1980):
v = S ∙ w (6)
The ranking order is now obtained by ordering each of the global scores. Higher score equals
higher ranking.
As mentioned, Saaty (2008) proposes another method when assessing several candidates, as the
relative mode may be time consuming due to the process of obtaining the score matrix. Instead,
the rating mode can be used, in which the decision maker evaluates the candidates with respect
to each criterion using defined verbal ratings, such as high, medium and low (Saaty, 2008). The
relative weights of the verbal ratings are also found using a comparison matrix, denoted B. An
idealised weight for each verbal rating is then calculated by normalizing the elements and
dividing with the largest of the weights (Saaty, 2008). Lastly, the verbal ratings assigned to each
candidate under each criteria, is replaced with the respective idealised weight. The weighted
score of each candidate under each criterion is calculated by multiplying the weight of the
criterion with the idealised score assigned to the candidate (Saaty, 2008; Bhushan & Rai, 2004):
Rij = wjxijnj=1 , (7)
where R!" is the weighted score of candidate i under , w! is the weight the jth criteria, x!" is
found by replacing the verbal rating with the relative weight calculated in B.
46
4.6.2 Critique
A key issue in the approach of MCDM is the assumption of independent criteria (Carlsson &
Füller, 1996). Most often criteria contain a certain degree of conflicting interests and thereby
interdependency among these exists (Yager, 1988; Zeleny, 1982; Wang & Lee, 2011). This will
challenge the decision-making, as there may not exist an optimal result due to lack of a solution
where all the criteria are satisfied (Carlsson & Füller, 1996; Zeleny, 1982).
Zeleny (1982) does present other issues of the approach. He argues that time pressure often
decreases the number of criteria, which the decision-makers choose to assess. One of the
strengths of the MCDM-approach can also be viewed as the method’s weakness, as the
decision-makers must subjectively weight the different criteria, which may result in biased
results (Adler et al., 2002). On the other hand this makes the method flexible and therefore a
great tool for decision-making in various settings (Adler et al., 2002). Zeleny (1982) argues that
the number of criteria will depend on the knowledge and experience, which the decision-maker
possesses regarding the problem. Thus, more knowledge equals more criteria and opposite
(Zeleny, 1982). This results in less need for the MCDM-approach, as the decision-maker might
not be able to utilize the multiple criteria depending on the decision maker’s knowledge (Zeleny,
1982).
Given the roots of AHP in MCDM, the AHP is subject to the same critique points (Hartwich,
1999). Including this, an important issue is that the results using the AHP should be taken lightly
(Triantaphyllo & Mann, 1995). Furthermore, the closer the results are to each other, the more
careful one should be when interpreting the results (Triantaphyllo & Mann, 1995). AHP
received critique for not supplying any guidance on how to structure the problem being solved
and how to form the levels of the hierarchy of criteria (Hartwich, 1999). Also, it is believed that
the process does not meet the minimal properties of subset choice consistency, which means that
a rank reversal can occur by adding or removing a criterion (Belton & Gear, 1983; Whitaker,
2007). However, Whitaker (2007) describes these critique point as being negative consequences
of the distributive nature of the otherwise simple and useful process (Whitaker, 2007). According
to Triantaphyllo & Mann (1995) the AHP, as well as the MCDM approach, should be used as a
decision supporting tool and not the only method in making the final decision.
47
4.7 Relevance of the Models and Frameworks
The models and framework, representing the theoretical background of the thesis, all serve an
individual purpose and are therefore relevant to the thesis. However, important for the findings
of the thesis, is the relationship between the theories. The different theories need to complement
each other well. The external analysis will generate a macro economical view. However, even
though the PESTEL analysis covers many variables, it receives critique for being too wide
(Marmol, 2015). Many aspects of the PESTEL analysis might be superficial and irrelevant
instead of focusing on the relevant aspects of the analysis. Porter’s Five Forces complement the
PESTEL analysis by providing a more focused analysis on the competitiveness of the industry
(Porter, 2008). This provides the background for further analysis and enables the thesis to
answer the question of how Royal Unibrew should be positioned in Spain (Porter, 2008). Given
the critique of Porter’s Five Forces not guaranteeing a competitive advantage (Aktouf, 2004), a
look into the resources of Royal Unibrew can be beneficial, which is why an internal analysis
using the Resource Based View is relevant.
The internal analysis using the VRIO framework gives an overview of the resources providing
Royal Unibrew with a competitive advantage and also gives an understanding of the
competencies of Royal Unibrew. Seeing Royal Unibrew as a group of resources provides a view
not possible with the theoretical background of the external analysis, since it explains why Royal
Unibrew is different from its competitors (Wernerfelt, 1984). Thus, it provides a view within the
organization, which is needed in order to answer the research question of the thesis, and the
VRIO analysis is thereby relevant to the thesis and complements other models in the theoretical
background well.
The eclectic paradigm provides a framework for a discussion about ownership-, location-, and
internalization advantages (Peng & Meyer, 2011) based on the findings in external and internal
analyses. This way, the OLI framework supports the theoretical background by using the
previous analysis in order to arrive at a conclusion of the strategic fit between Royal Unibrew
and Spain. Given the critique of the paradigms predictive skills, a previous thorough analysis of
the variables is required, which makes the external and internal analyses essential to the OLI
framework. This way, the external and internal analyeis provides the analysis of certain
48
paradigms and the OLI framework raises the relevance of the findings, which makes the models
in the theoretical background of the strategic analysis interdependent.
With numerous M&A methods, the MCDM approach provides a structured method for
collecting information for the due diligence process pre-acquisition (Majumder, 2015). The
MCDM-approach enables the decision maker to choose among different aspects and
underlying criteria to assess. For example, marketing can be assessed by using underlying
criteria such as brand awareness, consumer loyalty etc. (Tsao, 2009). These can be assessed in
order to give a nuanced picture of the overall marketing rating (Tsao, 2013). Extensive research
has proven to be a decisive factor for the success of M&As (Posnock, 2002). The MCDM
approach can thus be of help in achieving success in the due diligence process, as the decision-
maker can adjust the model by adding multiple levels (Tsao, 2009). Equally important, AHP
enables the decision maker to assess both physical and psychological events. More specifically,
AHP is designed to assess both quantitative and qualitative measures. In M&A, both tangibles
events such as asset valuation and profitability measures, and intangibles measures, such as
culture and strategic fit need to be evaluated. In addition, AHP enables the decision maker to
weigh the criteria relatively in accordance to their relevance of the aspect (Kahraman, 2008;
Saaty, 1980). Hence, if the decision maker includes a criterion, which has less importance
compared to other, the final ranking of candidates will take this opinion into account.
49
Part I I External-, internal- and pre-acquisition process
The second part of the thesis contains the analysis, where the empirical background is analyzed
using the theoretical background of the thesis. The second part is divided into a strategic
analysis and a pre-acquisition analysis. The strategic analysis contains an external-, internal
analysis, which will provide the foundation for a discussion regarding the strategic fit between
Royal Unibrew and Spain. This will be summarized in a preliminary conclusion. Next, the pre-
acquisition process including the search for candidates, preliminary screening, which results in a
ranking list, will be carried out.
5. External Analysis
The external analysis consists of a PESTEL analysis and Porter’s Five Forces analysis, which
combined will generate a macroeconomic view of Spain with special focus on the beer market
and an assessment of the competitiveness within the beer industry. This will ultimately become
part of the background analysis needed for a discussion of the strategic fit between Royal
Unibrew and Spain.
5.1 PESTEL Analysis In this chapter, macro economical factors, which affect Royal Unibrew’s possible entry into
Spain will be examined and analyzed using the PESTEL framework. The PESTEL framework
will be the first part of the external analysis, where attention will be given to each factor of the
framework, in accordance with their relevance and contribution to later analysis.
5.1.1 Political Landscape For defining the political landscape of Spain, the political structure is important to consider, and
Spain is a hereditary constitutional monarchy (European Commission, 2016). Spain has a
decentralized system with 17 autonomous regions with self-government rights, which was the
50
constitution of choice in 1978, and was last amended in 2011. Furthermore, Spain is a member
of the European Union (EU), and has been since 1986 (European Commission, 2016). The
membership in EU has strengthened the Spanish economy in regards to a growing GDP, lower
debt, reduced inflation and decreasing unemployment rates (Ryan, 2006).
Spain ranks 19th in the 2017 Democracy Index by The Economist Intelligence Unit, which is
mainly due to acceptance in the transfer of power and civil liberties being protected (The
Economist, 2018a). When a government is elected, not many controls are performed. Besides
this, there is not much confidence in political parties, since it is still a young democracy (The
Economist, 2018a). The political stability is important to assess (Bason, 2018), and due to recent
declaration of an independent Catalonia, Spain is in a political crisis. However, it is uncertain
whether Catalonia will leave Spain (Thomsen, 2017). Given the political crisis, the economic
and social environment has worsened in the richer regions of Spain. Furthermore, the People’s
Party, one of the four major political parties, has lost support and shifted to Ciuadadanos, which
may lead to less parliamentary support (The Economist, 2018a). Lastly, the declaration of
independence of Catalonia might affect Spain’s relations to EU, as EU views the declaration as
an internal matter (The Economist, 2018a). As a possible consequence of political instability,
firms can experience blocked funds, disruptions or in worst case, expropriation (Butler, 2016).
The level of corruption in Spanish democracy has increased since 1970 and is believed to be
one of the most essential problems in Spain (Robles-Ehea & Delgado-Fernández, 2014).
Especially since a new corruption scandal emerges whenever there has been an anti-corruption
initiative (Norén, 2017). Corruption in Spain comes in a variety of types and there has over the
years been illegal commissions with bribery, illegal party funding, inappropriate use of public
funds, embezzlement, fraud, unlawful source of income, tax evasion etc. (Robles-Ehea &
Delgado-Fernández, 2014). According to (Norén, 2017) the problem with such corruption does
not lie in government agencies or public services, but with the political parties. However, voters
are not that affected by corruption, since they might benefit due to a short-term increase in
welfare, since the corrupt politicians will act in the interest of the people (Berechet, 2014). Yet,
countries with low corruption is more likely to have foreign direct investment (FDI) inflows,
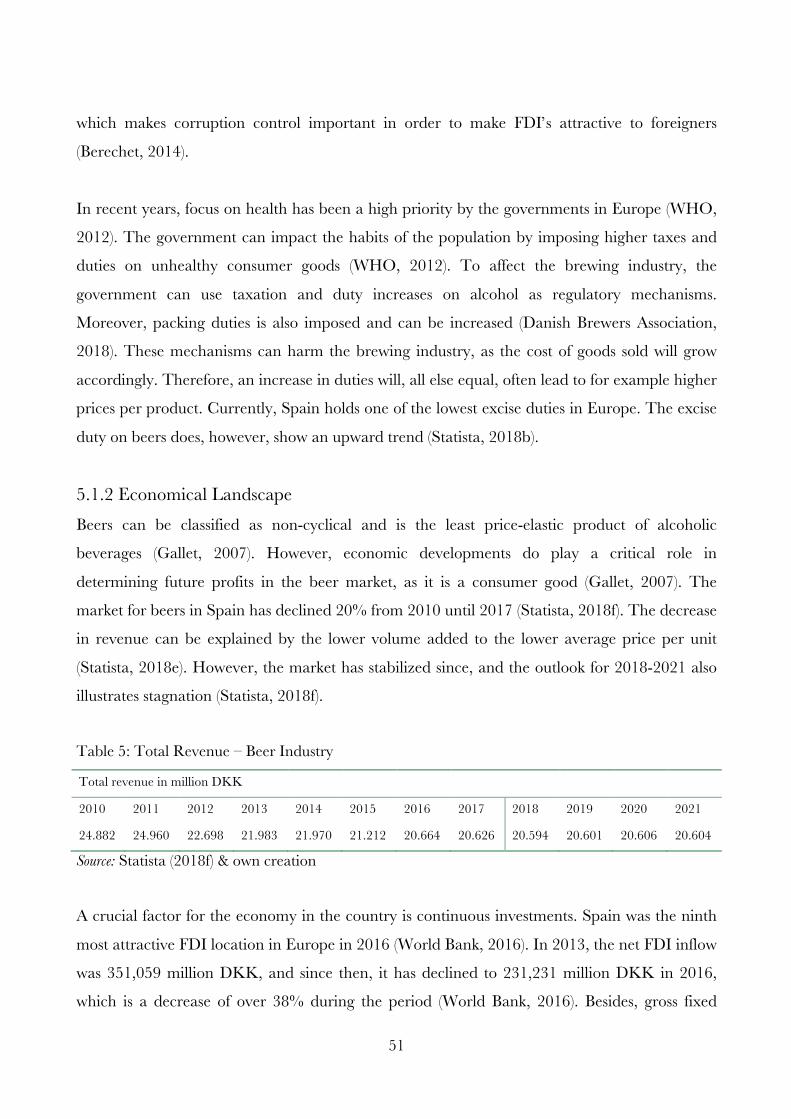
51
which makes corruption control important in order to make FDI’s attractive to foreigners
(Berechet, 2014).
In recent years, focus on health has been a high priority by the governments in Europe (WHO,
2012). The government can impact the habits of the population by imposing higher taxes and
duties on unhealthy consumer goods (WHO, 2012). To affect the brewing industry, the
government can use taxation and duty increases on alcohol as regulatory mechanisms.
Moreover, packing duties is also imposed and can be increased (Danish Brewers Association,
2018). These mechanisms can harm the brewing industry, as the cost of goods sold will grow
accordingly. Therefore, an increase in duties will, all else equal, often lead to for example higher
prices per product. Currently, Spain holds one of the lowest excise duties in Europe. The excise
duty on beers does, however, show an upward trend (Statista, 2018b).
5.1.2 Economical Landscape Beers can be classified as non-cyclical and is the least price-elastic product of alcoholic
beverages (Gallet, 2007). However, economic developments do play a critical role in
determining future profits in the beer market, as it is a consumer good (Gallet, 2007). The
market for beers in Spain has declined 20% from 2010 until 2017 (Statista, 2018f). The decrease
in revenue can be explained by the lower volume added to the lower average price per unit
(Statista, 2018e). However, the market has stabilized since, and the outlook for 2018-2021 also
illustrates stagnation (Statista, 2018f).
Table 5: Total Revenue – Beer Industry
Total revenue in million DKK
2010 2011 2012 2013 2014 2015 2016 2017 2018 2019 2020 2021
24.882 24.960 22.698 21.983 21.970 21.212 20.664 20.626 20.594 20.601 20.606 20.604
Source: Statista (2018f) & own creation
A crucial factor for the economy in the country is continuous investments. Spain was the ninth
most attractive FDI location in Europe in 2016 (World Bank, 2016). In 2013, the net FDI inflow
was 351,059 million DKK, and since then, it has declined to 231,231 million DKK in 2016,
which is a decrease of over 38% during the period (World Bank, 2016). Besides, gross fixed
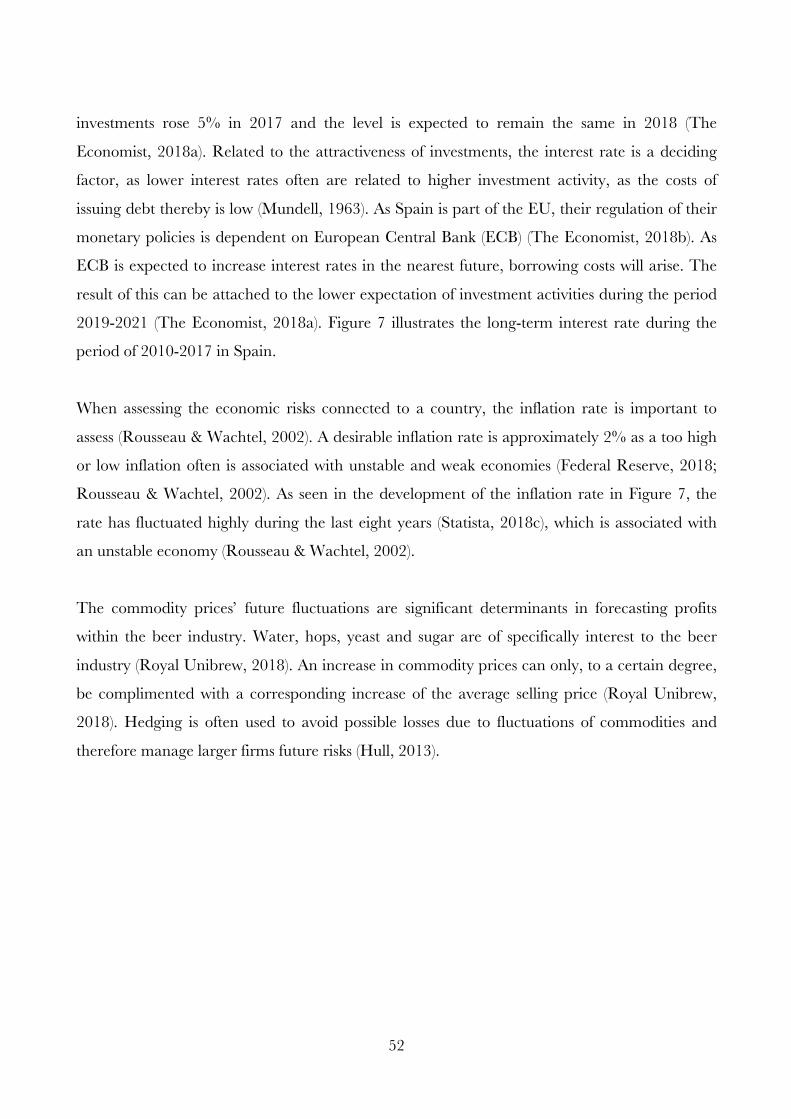
52
investments rose 5% in 2017 and the level is expected to remain the same in 2018 (The
Economist, 2018a). Related to the attractiveness of investments, the interest rate is a deciding
factor, as lower interest rates often are related to higher investment activity, as the costs of
issuing debt thereby is low (Mundell, 1963). As Spain is part of the EU, their regulation of their
monetary policies is dependent on European Central Bank (ECB) (The Economist, 2018b). As
ECB is expected to increase interest rates in the nearest future, borrowing costs will arise. The
result of this can be attached to the lower expectation of investment activities during the period
2019-2021 (The Economist, 2018a). Figure 7 illustrates the long-term interest rate during the
period of 2010-2017 in Spain.
When assessing the economic risks connected to a country, the inflation rate is important to
assess (Rousseau & Wachtel, 2002). A desirable inflation rate is approximately 2% as a too high
or low inflation often is associated with unstable and weak economies (Federal Reserve, 2018;
Rousseau & Wachtel, 2002). As seen in the development of the inflation rate in Figure 7, the
rate has fluctuated highly during the last eight years (Statista, 2018c), which is associated with
an unstable economy (Rousseau & Wachtel, 2002).
The commodity prices’ future fluctuations are significant determinants in forecasting profits
within the beer industry. Water, hops, yeast and sugar are of specifically interest to the beer
industry (Royal Unibrew, 2018). An increase in commodity prices can only, to a certain degree,
be complimented with a corresponding increase of the average selling price (Royal Unibrew,
2018). Hedging is often used to avoid possible losses due to fluctuations of commodities and
therefore manage larger firms future risks (Hull, 2013).
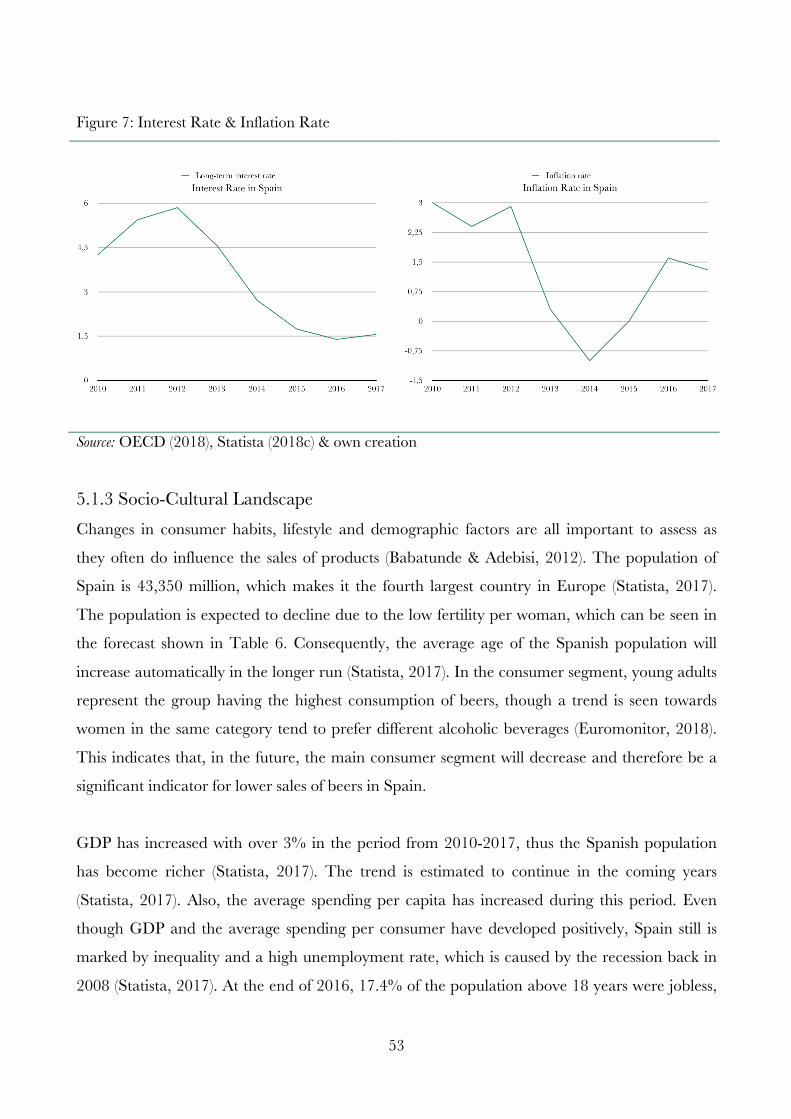
53
Figure 7: Interest Rate & Inflation Rate
Source: OECD (2018), Statista (2018c) & own creation
5.1.3 Socio-Cultural Landscape Changes in consumer habits, lifestyle and demographic factors are all important to assess as
they often do influence the sales of products (Babatunde & Adebisi, 2012). The population of
Spain is 43,350 million, which makes it the fourth largest country in Europe (Statista, 2017).
The population is expected to decline due to the low fertility per woman, which can be seen in
the forecast shown in Table 6. Consequently, the average age of the Spanish population will
increase automatically in the longer run (Statista, 2017). In the consumer segment, young adults
represent the group having the highest consumption of beers, though a trend is seen towards
women in the same category tend to prefer different alcoholic beverages (Euromonitor, 2018).
This indicates that, in the future, the main consumer segment will decrease and therefore be a
significant indicator for lower sales of beers in Spain.
GDP has increased with over 3% in the period from 2010-2017, thus the Spanish population
has become richer (Statista, 2017). The trend is estimated to continue in the coming years
(Statista, 2017). Also, the average spending per capita has increased during this period. Even
though GDP and the average spending per consumer have developed positively, Spain still is
marked by inequality and a high unemployment rate, which is caused by the recession back in
2008 (Statista, 2017). At the end of 2016, 17.4% of the population above 18 years were jobless,
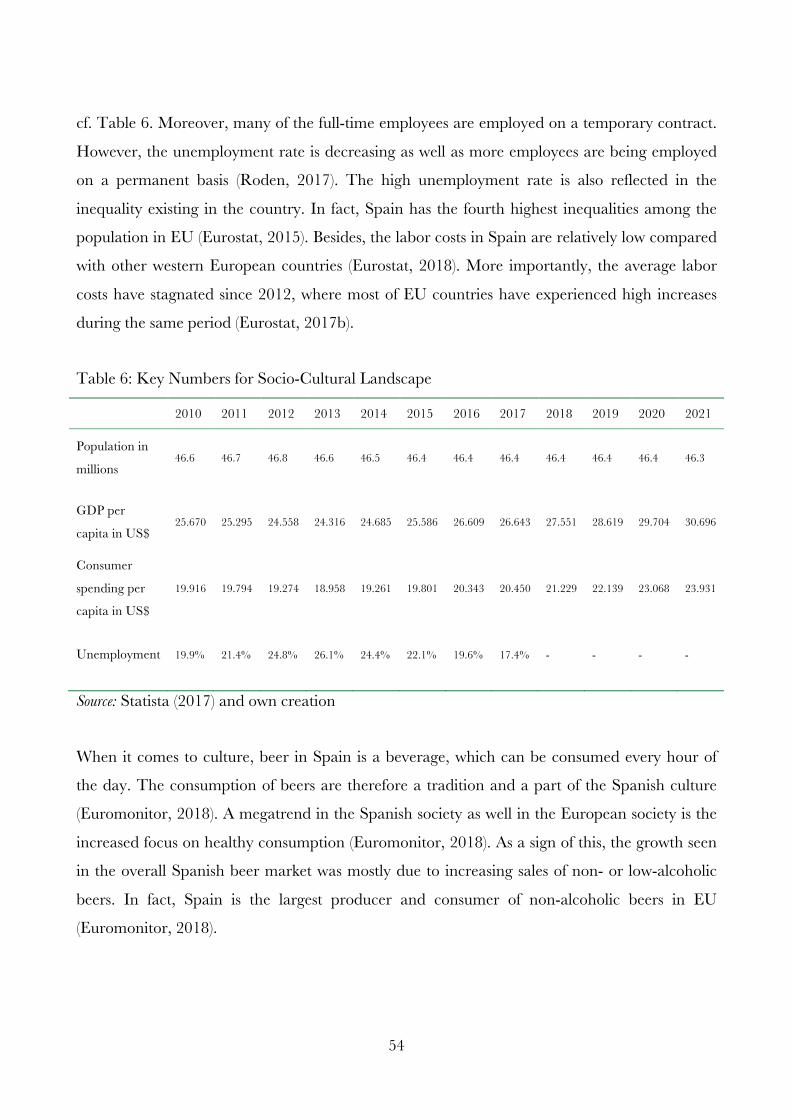
54
cf. Table 6. Moreover, many of the full-time employees are employed on a temporary contract.
However, the unemployment rate is decreasing as well as more employees are being employed
on a permanent basis (Roden, 2017). The high unemployment rate is also reflected in the
inequality existing in the country. In fact, Spain has the fourth highest inequalities among the
population in EU (Eurostat, 2015). Besides, the labor costs in Spain are relatively low compared
with other western European countries (Eurostat, 2018). More importantly, the average labor
costs have stagnated since 2012, where most of EU countries have experienced high increases
during the same period (Eurostat, 2017b).
Table 6: Key Numbers for Socio-Cultural Landscape
2010 2011 2012 2013 2014 2015 2016 2017 2018 2019 2020 2021
Population in
millions 46.6 46.7 46.8 46.6 46.5 46.4 46.4 46.4 46.4 46.4 46.4 46.3
GDP per
capita in US$ 25.670 25.295 24.558 24.316 24.685 25.586 26.609 26.643 27.551 28.619 29.704 30.696
Consumer
spending per
capita in US$
19.916 19.794 19.274 18.958 19.261 19.801 20.343 20.450 21.229 22.139 23.068 23.931
Unemployment 19.9% 21.4% 24.8% 26.1% 24.4% 22.1% 19.6% 17.4% - - - -
Source: Statista (2017) and own creation
When it comes to culture, beer in Spain is a beverage, which can be consumed every hour of
the day. The consumption of beers are therefore a tradition and a part of the Spanish culture
(Euromonitor, 2018). A megatrend in the Spanish society as well in the European society is the
increased focus on healthy consumption (Euromonitor, 2018). As a sign of this, the growth seen
in the overall Spanish beer market was mostly due to increasing sales of non- or low-alcoholic
beers. In fact, Spain is the largest producer and consumer of non-alcoholic beers in EU
(Euromonitor, 2018).
55
5.1.4 Technological Landscape The technological landscape of Spain is changing and evolving with a focus on innovation and
advanced solutions within many industries (Buisán, 2013). Spain ranks as 23th in the world on
Bloomberg’s innovation index, which aggregates evaluations of R&D, manufacturing, Hi-tech
companies, education, research personnel, and patents in countries worldwide (Bloomberg,
2016). Besides, Spain is a world leader within infrastructure, both in terms of railways and roads
(Ministerio de Asuntos Exteriores Y de Cooperacion, 2014). Furthermore, Spain has increased
the amount of resources for R&D and focuses on unique scientific and technical infrastructures
in order to continue being leading (Buisán, 2013; Ministerio De Economía Y Competitividad,
2018).
Regarding renewable energy, Spain is a world leader within hydroelectrical-, solar-, and wind
energy, as they rank in the top ten on a global base (Ministerio de Asuntos Exteriores Y de
Cooperacion, 2014). However, Spain is experiencing low business innovation compared with
other OECD countries, which affects productivity negatively (OECD, 2017). In order to put
further focus on innovation and technology, the Ministry of Science and Innovation in Spain
has developed a strategy, which is planned to be implemented from 2013 to 2020 (Buisán,
2013). This new strategy focuses on economic policy measures and seeks to affect multiple
industries. The strategy involves, among other things, recognizing and promoting talent in
research, development, innovation, scientific and technical research etc. (Buisán, 2013). The
goal of this strategy is, for example to make sure Spain is a world leader within knowledge, to
better the international view of science, and technology system and to create an attractive
climate for R&D investments (Buisán, 2013). These goals are important since innovative
business investment is very important for the productivity growth (OECD, 2017).
However, Spain are facing challenges within innovation and technology such as the current
growth model being based on industries with low innovation, not many resources for innovative
organizations from financial sector and little coordination between educational system and what
organizations actually need (Buisán, 2013). However, the “Innverte” programme of Centro de
Desarrollo Tecnológico industrial (CDTI) plans to invest in technology- based companies in an
attempt to support innovation (OECD, 2017).
56
5.1.5 Environmental Landscape
In ISO 14001 (an international standard for environment management) certificates for
management systems, Spain is ranked as first in EU (Ministerio de Asuntos Exteriores Y de
Cooperacion, 2014). In addition, with regards to integrated water cycle management, Spain is a
world leader in every phase of the cycle (Ministerio de Asuntos Exteriores Y de Cooperacion,
2014). As Spain is a member of EU, the emissions of carbon dioxide (CO2) are therefore heavily
regulated. In 2020, the GHG emission must be reduced by 20% compared with the level in
1990 respectively (OECD, 2017 p. 43). Currently, Spain ranks eighteenth on the Greenhouse
Gas Rankings. Breweries produce lots of CO2, and it is therefore a concern for the brewing
industry to reduce the emission (Royal Unibrew, 2018). Spain is leading in regards to solar
energy, hydroelectric energy and wind power as mentioned in section 5.1.5. In this regard,
brewers can reduce the costs by using renewable energy, as it will be a cheaper alternative to
fossil fuel in the nearest future (Dudley, 2018). The CO2 discharge per capita has been
decreasing through the years, which indicates that the Spaniards have been more aware of the
pollution effect of gases (World Bank, 2016). Accordingly, the brewing industry must provide
greener produced products to satisfy the Spanish consumers in the future.
The consumption of beers is highly dependent on the weather, as sunshine and high degrees of
Celsius are positively correlated with the sales of beers (Royal Unibrew, 2018). This is also seen
geographically in the total consumption of beers in Spain, as the Southern inhabitants lean
towards consuming more alcoholic beverages than people living in the Northern part of Spain
(Euromonitor, 2018). Moreover, the weather in Spain is very stable, and the daily hours of sun
ranks as one of the highest in Europe (Kjær, 2016). Along with the stable and sunny weather
follows tourism and Spain is the most visited country in Europe (Eurostat, 2017b). Tourism
contributes with 172 billion Euros of Spain’s total GDP and is therefore a very important part
the Spanish economy (Statista, 2018f). Moreover, this contribution is expected to increase
during the next ten years (Statista, 2018f). The agriculture of Spain represents also an important
part of the economy. In fact, Spain is the fifth largest producer of crops (Eurostat, 2017a).
57
5.1.6 Legal Landscape The legal drinking age as well as the legal purchasing age refers to when and under what
circumstances it is possible to consume and purchase alcohol in Spain. The minimum drinking
age in Spain prohibits anyone less than 16 years to drink alcohol and purchasing age laws
prohibit anyone less than 18 years to purchase alcohol. However, those under 16 years may
purchase beer and wine if they are accompanied by their parents (ICAP, 2002). Besides the limit
age, consumption of alcoholic beverages in public areas and at sports games is prohibited.
These factors can possibly impact the future level of consumption (GOV, 2018) and therefore
should be a concern for the brewery industry if the trend of more restrictions continues.
Due to the membership of the EU, Spain is subjected to regulations and legislation on alcohol
marketing (STAP, 2007). However, these regulations and legislation are in the form of national
laws and self-regulations, which emerge from recommendations from the European Council on
promotion marketing and retailing of beer (STAP, 2007). Spain has both statutory and non-
statutory regulations and bans regarding time, location, media channel and type of product
(STAP, 2007). More specifically, Spain bans certain elements of marketing of beer on the
grounds of the recommendation of the European Council, such as the use of style associated
with youth culture, featuring children or other young looking models in the promotion and
encouraging children to drink and advertising during sporting events (STAP, 2007).
Spain is the ninth most open economy to FDI’s as mentioned in section 5.1.2, where the foreign
investments regulation of Spain emerges from liberalization and does not favor members of EU
over non-members (Navarro & Ventoso, 2014). When making an FDI by subsidiary, the
company has legal standing under Spanish law and a certain degree of freedom in regards to
decision making (Navarro & Ventoso, 2014). When making an FDI by branch, there exists a
separate legal entity and therefore compliance with every Spanish law is not required. However,
a notarial deed executed in Spain is necessary (Navarro & Ventoso, 2014). Foreign investors can
be subjected to a merger control, which means that the deal must be notified and execution held
until they have obtained approval from the authorities (Navarro & Ventoso, 2014). However,
Spain is a member of the International Centre of Settlement of Investment Disputes (ICSID),
which means that facilities will be provided during any disputes (Navarro & Ventoso, 2014).
58
5.2 Porter’s Five Forces Analysis In this section, the rivalry among existing competitors, which affect Royal Unibrew’s possible
entry in Spain will be examined and analyzed using Porter’s Five Forces. Porter’s Five Forces
will be the second part of the external analysis, where attention will be given, to each
component of the framework, in accordance with their relevance and contribution to later
analysis. Given the delimitation of the thesis, the Porter’s Five Forces analysis will be focused on
the European market, with special focus on the Spanish market.
5.2.1 Threat of New Entrants When operating within the beer industry, assessing the threat of new entrants is of high
importance (Porter, 1979). Especially since the brewery market is consolidated with low or no
growth. Hence, new entrants gain market shares from existing firms (Bason, 2018). Firstly, the
threat of new small entrants will be assessed followed by an assessment of new major
competitors.
Since 2010, the number of active breweries has been doubled to a total number of 9,381 in
2016 (Brewers of Europe, 2017). During this year, over a thousand new breweries were
established, where 56 were Spanish alone. All 56 new breweries were microbreweries (Brewers
of Europe, 2017). The ingredients used for production in a brewery are available for everyone
to an affordable price. Therefore, anyone can begin brewing their own beers at low costs
(Bason, 2018). Know-how of brewing can be obtained through simple guides available online
(Bason, 2018). However, approximately 98% of the total sales of beers are sold through retail
stores, in which only the fastest traded brands are supplied (Euromonitor, 2017c). Thus, it is
very easy to start brewing beers, nonetheless difficult for an individual or small brewery to gain
a foothold in the market (Bason, 2018).
In the Spanish market, the premium beers are sold at high prices with larger margins compared
with pilsners. This is one of the reasons for the increase in microbreweries, as the market for
specialty beer in Spain is attractive (Marketline, 2015). As a result, the threat of new small
entrants is very high, as new microbreweries are continuously founded. The requirements to do
this are limited and therefore not that difficult to carry out (Bason, 2018). However, if a new
59
entrant chooses this entry mode, it will be difficult to obtain significant a market share as the
specialty and craft beer only represent a small part of the overall beer market in Spain
(Euromonitor, 2017c).
To establish a large brewery and acquire substantial market share, new entrants must invest
heavily in production plants. Besides, the large players have established distribution channels,
know-how, and other activities in running a large company (Bason, 2018). Moreover, to
maintain stable sales, it requires high spending used on marketing and campaigns (Ebneth &
Theuvsen, 2006). Hence, the entry requires lots of capital, which increases the entry barrier
significantly (Bason, 2018). In addition, the brewery market is very consolidated cf. section 5.2.
In fact, the three largest companies represent a market share of approximately 75% of the
market in Spain (Euromonitor, 2017c). In such markets, economies of scale do represent an
important determinant for maintaining market shares, since prices on mainstream beers are
lowered (Cockerill, 1977). This means that the producers of mainstream beers compete on
material costs and operating expenditures. Due to the excessive costs and the consolidated
market, firms in the market only grow substantially through acquisitions or through alliances
(Andersson, 2018). In sum, this indicates that the threat of new major entrants is very low, but
the threat of existing large firms growing larger is important to be considered.
5.2.2 Threat of Substitutes
When assessing the threat of substitutes, the substitutes must first be defined. Substitutes can be
both directly and indirectly related to the firm’s products (Porter, 2008). To begin with, the
direct substitutes are analyzed and afterwards the indirect substitutes.
The beer market is a submarket to the market for alcoholic beverages. In this market, wine,
spirits and cider also exist (Euromonitor, 2017b). In 2016, beer represented 75% of the
consumption in the market. At the same time, 12% of the consumption was wine while cider
and ready-to-drink beverages only represented 4% of the total market (Euromonitor, 2017b).
The overall alcoholic beverage market in Europe has, as the beer market, also stagnated and is
forecasted to deliver low growth rates in the future cf. section 5.1.2 This indicates, that an
increase in sales of wine will create a decrease in the other substitutes. This is for example seen
60
in Denmark, where the consumption of beers has declined (Danish Brewers Association, 2018).
In contrast, the consumption of wine in the same period has increased. In the retailer stores,
these alcoholic beverages are often placed next to each other as retailers want to provide
customers with a vast variety of products within the same category (Bason, 2018). However,
beer can be consumed at all times during the day, whereas wine often is consumed along a meal
(Bason, 2018).
As mentioned in section 5.1.3, consumers are more aware of what they consume. According to
Bason (2018), when assessing substitutes, it is important to assess the trends, which are currently
imprinted in the market as these act as indirect substitutes. For example, the lunch beer is
outdated in most European countries even though it has been a tradition for a long time.
Instead it has been replaced with coffee (Bason, 2018). This indicates that the threat of
substitutes includes a healthier lifestyle, which indirectly navigates consumers towards healthier
beverages with no alcohol. Bason (2018) elaborates by stating that it often is the surroundings,
which are a determining factor of the consumption of beers cf. section 5.1.5 for the importance
of the weather on the consumption of beer).
Spain is one of the wine countries represented in Europe. Wine is therefore of high demand in
Spain compared to the general distribution of consumption of alcoholic beverages. In fact, beer
only contributed with 73% to the total market share while wine has 20% of the market share
(Euromonitor, 2017a). This distribution of market share between the categories has only varied
with low percentages during the period 2011-2016. Yet, the trend towards more beer
consumption relatively, is seen. In restaurants, wine is sometimes sold exclusively over beers, or
promoted more than beers due to for example, higher margins and better complementation of
their menus (Marketline, 2015) On the other hand, beers are widely sold in pubs and dominate
wine and other spirits.
In general, the threat of substitutes can be assessed as medium to high. The beer market still
dominates the market for alcoholic beverages significantly both in Europe and in Spain locally
and is expected to do so in the coming years (Euromonitor, 2017a; Euromonitor, 2017b).
However, different alcoholic substitutes do emerge all the time. In addition, traditions for
61
consuming beers have been weakened, and new ones included healthier lifestyles are a threat to
the market since consumers can replace the alcoholic beverages with non-alcoholic ones.
5.2.3 Bargaining Power of Suppliers The question of bargaining power of suppliers begins with what is supplied. The raw materials
needed for producing beer is usually water, sugar, malts and hops and thereby products of
agriculture (Bason, 2018). Usually, the number of suppliers for these raw materials is large
(European Commission, 2016). However, these raw materials depend on a good harvest (Bason,
2018). Certain suppliers are better than others, since they process the raw materials in different
ways and quality might take time to produce (Bason, 2018). This way, the demand of some
breweries affects the bargaining power of suppliers. A company such as Carlsberg uses only
female hops, as opposed to male hops, which makes the bargaining power of suppliers of female
hops greater. Some companies use only organic raw materials, which makes the supply
narrower (Bason, 2018). The more unique the product delivered, the higher the bargaining
power of the suppliers (Porter, 1979). However, as mentioned earlier, there are usually a lot of
suppliers of raw materials, which speak to the bargaining power of suppliers of raw materials
being fairly low (Porter, 1979).
The same goes for suppliers of packaging material such as cans, bottles and labels (Bason, 2018).
According to Bason (2018), the number of suppliers of cans, bottles and labels are fairly high
within the beer industry, which indicates that the bargaining power of the suppliers is low.
However, if the brewery wishes very specific products, the number of suppliers is significantly
lower than if a standard product is sufficient (Bason, 2018). The bargaining power of the
suppliers will then increase (Porter, 1979).
The number of suppliers relative to the number of breweries is low and therefore difficult to
answer the question about the bargaining power of the supplier. However, many breweries are
microbreweries (Bason, 2018). It is very easy to start a brewery since the formula for making
beer is available to everyone. Most cities have their own brewery, which makes the number of
breweries very high. However, it can be very difficult to gain foothold and actually sell the beer,
especially since the retail market are consolidated (Bason, 2018). In Spain the number of
62
breweries is 795 in 2018, where many of these are small breweries (Statista, 2018f) and thus
does not affect the bargaining power of the suppliers towards the larger breweries, but does,
however, give a very high bargaining power of the suppliers towards the small breweries, since
this customer group is not that important to the supplier (Porter, 1979).
The bargaining power of the suppliers vary depending on what type of product they deliver,
however, the overall bargaining power is fairly low, since many suppliers can deliver the raw
materials that breweries need in order to produce beer (Bason, 2018). This means that if the
supplier should choose to raise the prices of their products, it is easy for the brewery to switch to
another supplier (Porter, 1979).
5.2.4 Bargaining Power of Buyers
The question of bargaining power of the buyers begins with the number of products available.
The number of breweries and brands are extremely high on a global scale and impressively high
in Europe as well (MarketLine, 2016). As a result, the competitors compete on price in many of
the segments, as the buyers are price dependent (Bason, 2018). Ultimately, this can have an
impact on the quality of the beer as well, since breweries wish to differentiate from its
competitors and thereby often must deliver a better quality than offered from the competitors
(Bason, 2018). However, there are other elements, which play a role in the bargaining power of
the buyers. Since some breweries might wish to differentiate in quality, the breweries, which
make a product of better quality therefore weaken the bargaining power of the buyers, since the
product is more unique and harder to find (Porter, 2008). Thus, there exists a certain degree of
product loyalty (Bason, 2018)
The uniqueness of a product is also what creates preferences and brand loyalty, and within the
beer industry there exists a certain brand loyalty (Bason, 2018). Due to this brand loyalty, the
consumer does not just choose anything when they purchase beer, which decreases the
bargaining power of the buyers (Porter, 2008). The buyers are not as easily affected by changes
in prices or quality, however, according to Bason (2018), there is a limit to the loyalty of the
consumers and they will change to another brand if the price and quality does not live up to
their demands.
63
It is important to understand that buyers of the beers are, in most cases, retail stores, bars and
restaurants and not the actual end consumers (Bason, 2018; Euromonitor, 2017). The
bargaining power of these buyers is relevant as well and refers to the price and quality of the
product. The bargaining power of the retail stores, bars and restaurants is strengthened due to
the fact that it is through these channels that most of the beer is sold (Bason, 2018). In order to
gain more profit, these buyers want a fair price for the product and a good quality in order to
sell the product fast (Bason, 2018). However, as mentioned earlier it is the end consumers that
control the market and the end consumers that set the demand and therefore the bargaining
power of the retail stores, restaurants and bars depend on the demand and how fast certain
products sell (Bason, 2018). This way, the bargaining power of the retail stores, restaurants and
bars are affected by brand loyalty and the end consumers’ willingness to buy the beer. The
bargaining power of the end consumers and retail stores, restaurants and bars are therefore
closely related.
The market controls the price of beer and it is consumers that shape the demand, and therefore
the consumers have a very large impact on the market (Bason, 2018). Moreover, given the large
number of breweries and beer brands the bargaining power of the buyers is fairly high, despite
of the presence of brand loyalty. Ultimately, this high bargaining power affects the industry so
that the breweries will have to be very attentive to prices and quality (Porter, 2008).
5.2.5 Rivalry Among Existing Competitors Rivalry among existing competitors is important as well in order to determine the
competitiveness in the beer industry and begins with the question of presence of existing
competitors (Porter, 1979). As mentioned earlier, there exists many breweries and brands, not
only in the world, but even in Europe the number is very high (Marketline, 2016). These
existing breweries sell domestically, export to foreign countries and often perform FDI to gain
more market share (Euromonitor, 2017c).
As mentioned earlier, the large number of competitors within the industry affects the price and
quality of the products and thereby makes the competitors more aggressive (Aron & Waalewijn,
64
1999). The beer market is decentralized with many small and local brands, which accumulated
have a very large market share (Bason, 2018). This way the large brands only make up part of
the market and small breweries are thereby important as well to the rivalry among existing
competitors.
In Spain the largest companies within the beer industry are Heineken with a market share of
30.9%, Grupo Mahou-San Miguel with a market share of 29.6% and Damm with a market
share of 13.9% (Euromonitor, 2017c). These are the three largest beer companies in Spain with
a combined market share of 74.4%. The remaining 25.6% is represented by smaller companies.
However, the market share of the brands is consolidated where Cruzcampo, owned by
Heineken, is the market leader in Spain with a market share of 11.7 %, Estrella Damm, owned
by Damm, with a market share of 7.8%, Mahou Clasica, owned by Mahou, with a market share
of 7.6% and San Miguel Especial, owned by Mahou, with a market share of 7.2%
(Euromonitor, 2017cc). The rivalry between these largest companies is quite intense given the
almost equal size of the companies. However, the consolidation with only a few large companies
makes the rivalry less intense (Porter, 2008).
Furthermore, the sale of beer by category is pilsner with 13.8 billion EUR, lager with 11.9
billion EUR, non-alcoholic beer with 1.7 billion EUR dark beer with 129.9 million EUR and
stout with 78.2 million EUR (Euromonitor, 2017c). Furthermore, these beers are mostly
exported to the Dominican Republic, France and the Netherlands and the total value of imports
amount to 269.6 million EUR (Euromonitor, 2017c).
The prospects of the beer industry in Spain predict an economic growth, which essentially could
lead to an increase in the sales of beer due to an anticipated increase in disposable income
(Euromonitor, 2017c). The price of the beer will continuously be an important factor for the
consumer and the average price per unit is expected to fall due to increased price competition
among the existing competitors (Euromonitor, 2017c). The attention to the quality and
ingredients will most likely be increased, since consumers are becoming more aware of health
(Euromonitor, 2017c). Consumers are also becoming more concerned about the number
calories that they consume (Bason, 2018), a trend that is seen especially amoung younger
65
women, which are reducing their beer consumption or switching to non-alcoholic beverages as
mentioned in section 5.1.3. According to Bason (2018) a trend in specialty beers is also
plausible. As seen in regards to pilsners many large breweries have banded up and achieved
synergies by focusing on pilsners, which is plausible for the specialty beers as well (Bason, 2018).
6. Internal Analysis
The internal analysis consists of a VRIO analysis, which will give an overview of the resources
providing Royal Unibrew with a competitive advantage and thus provide an understanding of
the competencies of Royal Unibrew as well. This will ultimately provide the final part of the
background analysis needed for a discussion of the strategic fit between Royal Unibrew and
Spain.
6.1 VRIO Analysis In the following section, Royal Unibrew’s key competencies and resources will be identified.
Once identified, it will via the VRIO framework be assessed whether they provide a competitive
advantage or disadvantage. If the resources or competencies give a competitive advantage, this
will be analyzed to decide if it is temporary or sustainable. The resources will be divided into
tangible and intangible resources. Furthermore, only the most relevant resources have been
chosen to be assessed and finally, the resources’ competitive implication will be discussed.
6.1.1 Intangible Resources Often intangible resources represent most of the competitive advantageous resources, as these
are difficult to imitate (Peng & Meyer, 2011). In the following, five intangible resources will be
evaluated.
6.1.1.1 Human Resources
According to Andersson (2018), the most valuable resource existing in Royal Unibrew is the
employees and also the culture that comes with having the employees. Royal Unibrew consists
66
of 2,399 employees on a worldwide basis and most of these are based in the Headquarter in
Faxe, Denmark. Even though the number of employees has been reduced, the performance of
Royal Unibrew has improved significantly in the same period (Royal Unibrew, 2018). The
employees of the company are the drivers of the business and therefore the most important
value creators. Among the employees, Andersson (2018) highlights the brew masters and the
sales representatives as key figures in Royal Unibrew’s daily operation. The brew masters decide
the composition of new beers (Andersson 2018). To increase the growth and reinforce their
current position, Royal Unibrew must be innovative and launch new products continuously.
Hereby, the brew masters create value for Royal Unibrew (Andersson 2018).
The culture in Royal Unibrew is characterized by a high seniority among the employees
(Andersson 2018). Andersson (2018) describes the culture as either employees who are
employed and shortly after leave the company, or as in most of the cases, employees who stay
with the company for a long time. Simon Andersson has been employed for over 14 years
himself. Often high seniority creates a high degree of expertise among the employees, which
improves operational efficiency and therefore contributes to value creation for Royal Unibrew
(Hutchens, 1989).
In Denmark, employees change jobs very often compared to other countries (Business 2017).
This indicates that firms that have such high seniority as well as know-how is rare. According to
Andersson (2018), this culture is very difficult to imitate as it takes time to establish such a
culture, in which many actions from the human resource department and the management
team are initiated to retain the employees. For example, as Andersson (2018) points out, the
company offers great flexibility for employees to move between various positions within the
company. One of the main reasons for employees to search for jobs outside their current
company, is to seek new challenges, which in this case can be found within the company. This
flexibility can be one of the reasons for high seniority (Business, 2017).
6.1.1.2 Kissmeyer
Anders Kissmeyer is a worldwide known brewer. In 2011, he was announced as the world’s best
brewer and acknowledged as the third most important brewer in the Danish brewing history
67
(Royal Unibrew, 2018). Royal Unibrew started collaboration with him and his microbrewery in
2016, and he is now in charge of the innovation and development of new specialty and craft
beers. Since then, this relationship has created value for Royal Unibrew in the form of increased
turnover (Andersson 2018). This sort of collaboration is not costly to imitate, but it is difficult to
establish and therefore rare since there do not exist many brewers with his reputation and
knowledge. (Andersson 2018). As Royal Unibrew provides Kissmeyer with the resources he
needs, and distributes and promotes his products, they are able to capture the value he provides.
For example, several new Kissmeyer products were launched during 2017, and more will come
in 2018 (Royal Unibrew, 2018).
6.1.1.4 Brands
Royal Unibrew is a merger and acquirer of many old breweries and therefore holds various
different brands, which they have chosen to keep in their product portfolio (Royal Unibrew,
2018). Since a memorable history contributes to create a strong brand (Boatwright et. al., 2009),
the brands of Royal Unibrew appear robust. An example is Ceres, which is a strong brown ale
produced in Denmark and then exported to Italy. Its entry in Italy was back in 1960’s, where it
was loaded into Tulip-truck, a Danish modern processing firm, as ‘an accessory’ to the ham.
Later, the truck was considerably loaded with more beers than ham and Royal Unibrew took
over the distribution channel (Andersson, 2018). Now, Ceres is the most sold imported beer in
Italy (Royal Unibrew, 2018b). According to Andersson (2018) Royal Unibrew really does care
about their brands and mentions them as one of the most valuable resources.
Strong brands are not easy to establish, which is exemplified by the history of Royal Unibrew
and their long journey to establish the brands that they have now. This speaks to the rarity of
brand value and emphasizes that Royal Unibrew is special, since they have so many strong
brands. Arguably, many strong brands exist within the beer industry, which is a strong
argument for brands not being a rare resource. However, a brand value in the scale of Royal
Unibrew can be argued to be rare given the long journey of establishing the brands, which also
speaks to the imitability of this resource. It is not possible for other breweries to just obtain or
acquire such strong brand values and this makes brands inimitable as resource for Royal
Unibrew. Lastly, Royal Unibrew succeeds in exploiting the brand, which is evidenced by their
68
initiative to support the rock music industry in Denmark and name a new stadium in
Copenhagen: Royal Arena (Royal Unibrew, 2018).
6.1.1.5 Marketing
The marketing of Royal Unibrew refers to the use of the brand values and is therefore closely
related to the previous section. Marketing is of great interest to Royal Unibrew as they wish to
reach the consumers, which involves complying with the rules of responsible marketing and
consumptions of beverages and no violations of marketing legislation were noted in 2017 (Royal
Unibrew, 2018). Royal Unibrew even participates in local and international cooperation within
the beer industry, in order to influence legislation to make sure that the conditions for marketing
of beer does not suffer (Royal Unibrew, 2018). In order to reach consumers, while complying
with the rules of responsible marketing, Royal Unibrew uses different marketing channels, such
as social media (Andersson, 2018). However, many competitors of Royal Unibrew use
marketing through these channels and the marketing from the competitors are, in most markets,
tough (Royal Unibrew, 2018). This speaks to the rarity of the marketing resource of Royal
Unibrew, or more precisely the lack of it.
However, some parts of the marketing of Royal Unibrew can arguably be classified as rare. As
part of the history of Royal Unibrew, a limestone quarry is located near Faxe. This limestone
quarry is quite unique with special minerals and is used as part of the marketing strategy
(Andersson, 2018). Furthermore, as mentioned in the earlier section, Royal Unibrew supports
rock music in Denmark and named the stadium Royal Arena (Royal Unibrew, 2018). This type
of marketing is more rare and therefore pushes the marketing resource towards a sustained
competitive advantage (Barney, 1991). Interesting about the marketing situation of Royal
Unibrew is, as mentioned in the earlier section, the many brands. This way, the poor marketing
of one brand will not affect the brand value of Royal Unibrew as a whole, which is in itself, very
rare. All this shows that the marketing resource is well exploited by Royal Unibrew, however,
given these arguments for the marketing resource to be classified as rare, the resource is not
rare, which make the question of imitability inadequate (Barney, 1991).
69
6.1.1.6 Partnership with Heineken Brewery A/S
In 2007, Royal Unibrew initiated a partnership with Heineken, where Royal Unibrew have
obtained the license to distribute and sell their products in Denmark. Later in 2013, the
agreement was extended and expanded to also include the Baltics and Finland until 2023
(Royal Unibrew, 2018b). This creates value for Royal Unibrew by expanding their product
portfolio and has a positive impact on their revenue (Royal Unibrew, 2018). Also, the
partnership opens opportunities for entering new markets with one of the strongest brands in
the beer industry, which is an advantage (Andersson, 2018). As Royal Unibrew are the only
eligible distributor of Heineken’s products in Denmark, Finland, and the Baltics, this
partnership is unique in these specific countries (Royal Unibrew, 2018). Even though Heineken
have similar partnerships with other companies in other countries, the number are limited and
can therefore be considered rare (Heineken 2018). In other words, competitors are not able to
initiate the same partnership. However, partnerships among other firms with other major beer
breweries have been agreed by competitors to enhance their positions. With 5 breweries and a
significant market share in the applied countries (Andersson, 2018), Royal Unibrew has the
organization and capabilities to exploit this partnership to its potential.
6.1.2 Tangible resources In contrast to intangible resources, tangible resources often only represent a temporary
competitive advantage, since these are easier to imitate (Peng & Meyer, 2011). In the following
three tangible resources will be evaluated.
6.1.2.1 Breweries – Large plants and microbreweries
Royal Unibrew owns and operates several large breweries and microbreweries. Breweries are
the core in production of beers and thereby definitely value creating. The number of
microbreweries increases rapidly as the demand for specialty beers has increased (Birkedal,
2014). Hence, the microbreweries, which Royal Unibrew owns, create value, but are no rarity
among the operators on the beer market. Nevertheless, the large brewery plants are more of a
rarity, since only the large competitors are in possession of these (Andersson, 2018). Royal
Unibrew owns automated warehouses, which make the breweries more rare, since modern
technology makes the daily tasks faster and leaner. This is expensive and therefore more rare
70
than regular warehouses (Andersson, 2018). In Denmark, most of the largest brewery plants
were built from the 1850’s to the 1950’s, as many of them has closed down there is only a
limited number still existing (Andersson, 2018). Thus, to achieve a brewery, a company must
either take over another company, or build a new one themselves. However, the costs associated
with investing in a new large brewery are significantly higher than many of Royal Unibrew’s
smaller competitors can afford. Consequently, being in possession of that many breweries is
evaluated as rare and challenging to imitate.
6.1.2.2 Financial Resources and Performance
In 2005 and 2007, Royal Unibrew acquired three companies in Poland, which were not
successful. Royal Unibrew was near bankruptcy, but has since then recovered remarkably
(Andersson, 2018). According to Andersson (2018) this event was the deciding factor for having
financial flexibility as one of their main strategic focus points. Andersson (2018) points out that
their financial performance is strong compared to their competitors since their earnings before
taxes are comparatively high. Royal Unibrew accomplished an EBIT margin of 16.7% in 2017,
whereas their main rival in Denmark, Carlsberg, only managed an EBIT margin of 11% in
2016 which was their best result since 2013, where the EBIT-margin was below 13%
(Carlsberg, 2017).
Most large breweries are privately owned (Bloomberg, 2018). As Royal Unibrew is a listed firm,
the costs of raising new funds either through debt or equity is often less costly and more easily
done compared with private firms (Brav, 2009). Hence, this flexibility can be seen as an
advantage. As IPO’s often is a costly process (Pagano et al., 1998), the financial flexibility
attached with being a listed firm is not easy to imitate. In addition, Royal Unibrew has low
gearing, whereas private firms often are levered higher than public ones (Brav, 2009; Royal
Unibrew, 2018). Royal Unibrew’s policy is to have an equity ratio on at least 30%, which limits
the debt issue to this point. The reason for this desired capital structure is the intention of
operating at a level where it is possible to maintain financial flexibility. Furthermore, it is also
with the objective of possessing the possibility to act on opportunities and still be independent of
the liabilities owed to the corporation’s banks (Royal Unibrew, 2018).
71
In total, Royal Unibrew’s financial resources can be seen as a valuable resource, rare in that
sense, that their financial performance is comparatively higher than competitors, as well as their
opportunity for raising funds, if needed, is greater than some of their competitors’. As financial
performance is not easy to imitate, and an IPO will be costly to initiate for competitors, the
resource is found hard to imitate. During the years, Royal Unibrew has been able to take
advantage of their strong financial position, which is seen through their acquisitions of several
targets, their massive investment end research and development, and their payout of dividends
to their shareholders (Royal Unibrew, 2018). Thus, the company has the competencies and
ability to use this resource.
6.1.2.3 Yeast Strains
In general, a beer consists of the ingredients malt, water, hops and yeast. These commodities are
according to Andersson (2018), available to all its competitors. Thus, the commodities cannot be
evaluated as rare. Instead, the composition of the components makes the beer unique.
Andersson (2018) points out their yeast strains as one of the valuable resources that Royal
Unibrew possesses. The yeast strains are unique in its composition of the yeast and one of the
main factors in deciding the taste of the beer (Andersson, 2018). However, many competitors
use their own yeast strains and Heineken even developed a unique yeast cell that they use in
their products, which gives their products a great taste (Anderson 2018). Therefore, the yeas
strains are not rare, especially since the ingredients are not costly. This makes the question of
imitability inadequate. Given that yeast strains are one of the main factors in deciding the taste
of the beer, Royal Unibrew exploits the resource.
6.1.3 Competitive Implications and Economic Performance The human resources employed at Royal Unibrew give them a sustainable competitive
advantage according to Barney (1997) as they fulfill all four criteria. Accordingly, their human
resources contribute to an economical performance, which is higher than average (Barney
1991). The culture with high seniority created through the years, enables Royal Unibrew to
maintain a prominent level of expertise and knowledge among the employees. As long as this
culture is found in the company, the implications apply.
72
The collaboration with Kissmeyer is also a sustainable competitive advantage as he provides
expertise and figures as promotion of Royal Unibrew’s products. As the partnership expands
Royal Unibrew’s product portfolio and revenue, the resource is considered value generating and
hereby contributes to a performance above usual (Royal Unibrew, 2018). As it is the case for the
agreement with Kissmeyer, the partnership with Heineken has to be extended repeatedly to
maintain the position as a sustainable competitive advantage. Both relationships are exclusive,
and therefore both rare and inimitable. Though, similar collaborations between competitors
and other well-known brewers might exist. Moreover, it is necessary that these partnerships are
renewed frequently for these resources to continuously provide a sustainable advantage.
Furthermore, the exclusiveness of the agreement is important to maintain as well.
The competitive implication of brands as resource will ultimately be a sustained competitive
advantage, since this resource is valuable, rare, inimitable, and exploited by Royal Unibrew. In
other words, brands are a crucial resource of Royal Unibrew and a large part of their strength
as a market competitor. Given the sustained competitive advantage, the corresponding
economic performance is above normal. Marketing and brands are closely related. However,
the competitive implication and economic performance are quite different. Given that the
marketing resource is only valuable and not rare nor imitable, the competitive implication
results in a competitive parity. This competitive implication does not mean that the resource is
dispensable. However, the resource is not as important as resources with temporary or a
sustained competitive advantage (Barney, 1997). The economic performance for marketing as a
resource is by definition normal.
Major competitors to Royal Unibrew have access to their own breweries. The breweries of the
major competitors are of a certain scale, which are about the same size as the breweries of
Royal Unibrew. This way, if only the major competitors are taken into account, the resource of
breweries is not rare. However, microbreweries and smaller brewery companies do nott have
access to plants with the size and numbers as Royal Unibrew and in that aspect, these plants are
more or less exceptional and rare. Therefore, the resource provides a competitive advantage,
which implies an economic performance above normal compared with these competitors.
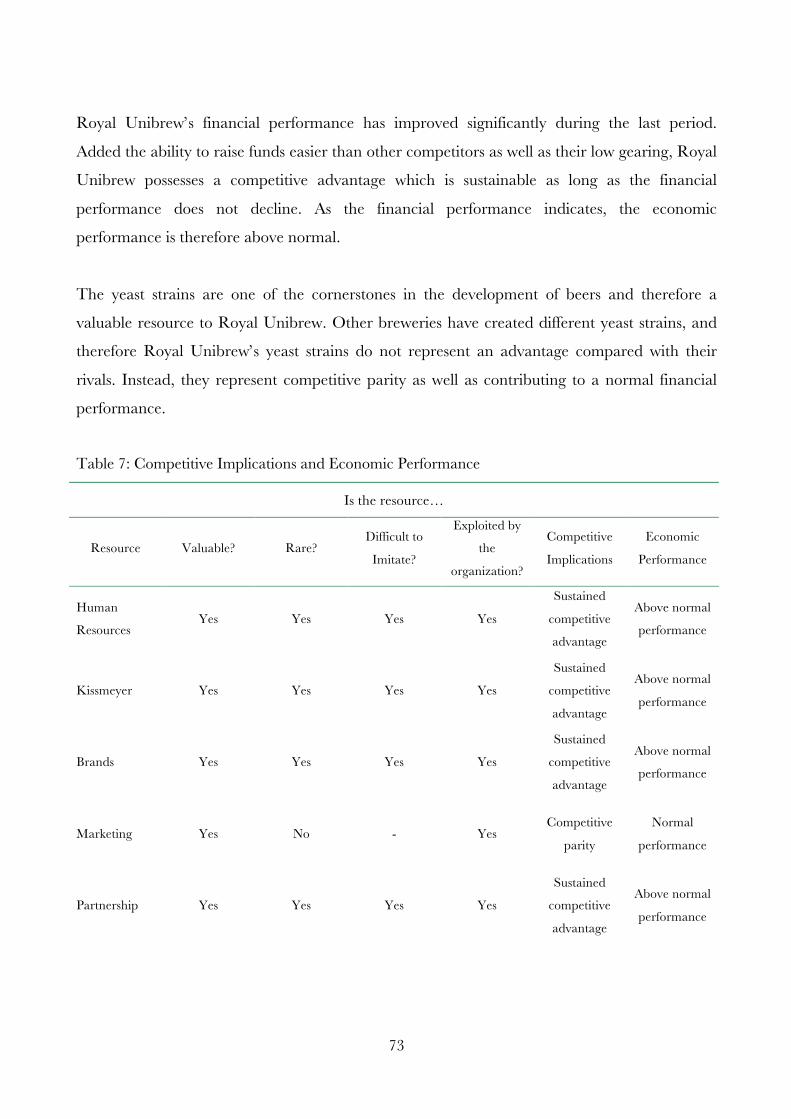
73
Royal Unibrew’s financial performance has improved significantly during the last period.
Added the ability to raise funds easier than other competitors as well as their low gearing, Royal
Unibrew possesses a competitive advantage which is sustainable as long as the financial
performance does not decline. As the financial performance indicates, the economic
performance is therefore above normal.
The yeast strains are one of the cornerstones in the development of beers and therefore a
valuable resource to Royal Unibrew. Other breweries have created different yeast strains, and
therefore Royal Unibrew’s yeast strains do not represent an advantage compared with their
rivals. Instead, they represent competitive parity as well as contributing to a normal financial
performance.
Table 7: Competitive Implications and Economic Performance
Is the resource…
Resource Valuable? Rare? Difficult to
Imitate?
Exploited by
the
organization?
Competitive
Implications
Economic
Performance
Human
Resources Yes Yes Yes Yes
Sustained
competitive
advantage
Above normal
performance
Kissmeyer Yes Yes Yes Yes
Sustained
competitive
advantage
Above normal
performance
Brands Yes Yes Yes Yes
Sustained
competitive
advantage
Above normal
performance
Marketing Yes No - Yes Competitive
parity
Normal
performance
Partnership Yes Yes Yes Yes
Sustained
competitive
advantage
Above normal
performance
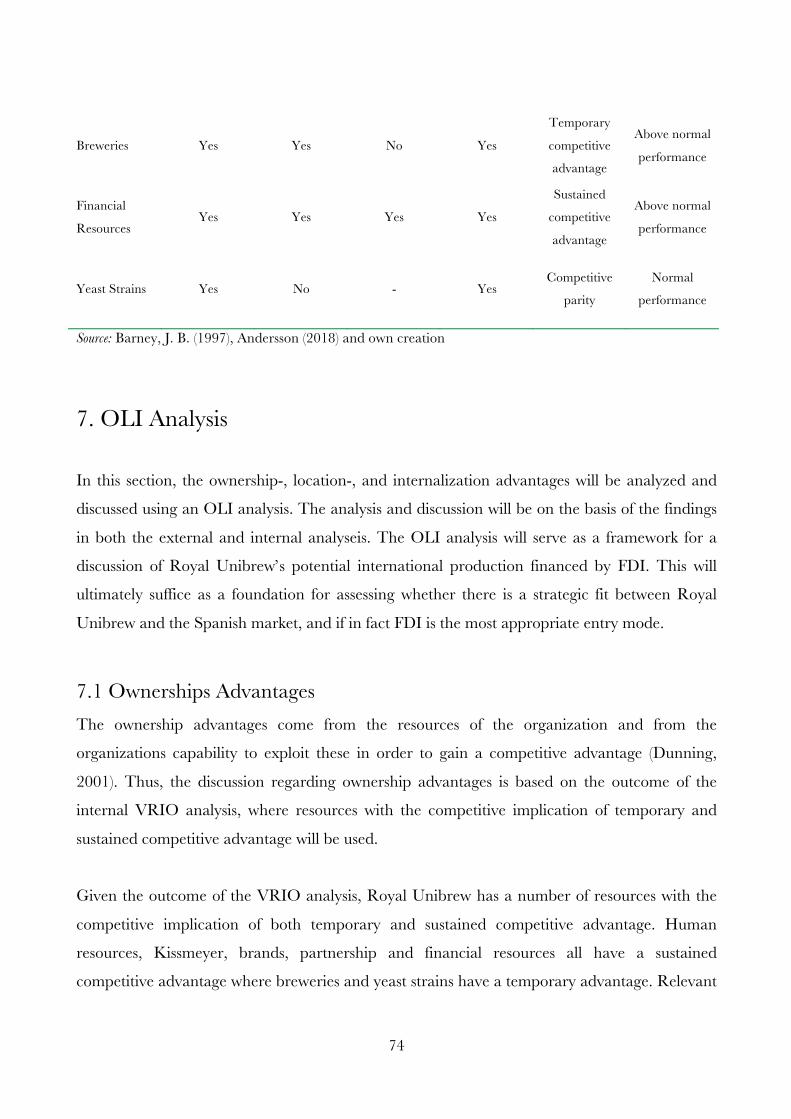
74
Breweries Yes Yes No Yes
Temporary
competitive
advantage
Above normal
performance
Financial
Resources Yes Yes Yes Yes
Sustained
competitive
advantage
Above normal
performance
Yeast Strains Yes No - Yes Competitive
parity
Normal
performance
Source: Barney, J. B. (1997), Andersson (2018) and own creation
7. OLI Analysis
In this section, the ownership-, location-, and internalization advantages will be analyzed and
discussed using an OLI analysis. The analysis and discussion will be on the basis of the findings
in both the external and internal analyseis. The OLI analysis will serve as a framework for a
discussion of Royal Unibrew’s potential international production financed by FDI. This will
ultimately suffice as a foundation for assessing whether there is a strategic fit between Royal
Unibrew and the Spanish market, and if in fact FDI is the most appropriate entry mode.
7.1 Ownerships Advantages
The ownership advantages come from the resources of the organization and from the
organizations capability to exploit these in order to gain a competitive advantage (Dunning,
2001). Thus, the discussion regarding ownership advantages is based on the outcome of the
internal VRIO analysis, where resources with the competitive implication of temporary and
sustained competitive advantage will be used.
Given the outcome of the VRIO analysis, Royal Unibrew has a number of resources with the
competitive implication of both temporary and sustained competitive advantage. Human
resources, Kissmeyer, brands, partnership and financial resources all have a sustained
competitive advantage where breweries and yeast strains have a temporary advantage. Relevant
75
for a potential FDI is the resources’ ability to be used internationally and help Royal Unibrew to
overcome the liability of outsidership often associated with FDIs (Peng & Meyer, 2011).
Human resources are the most valuable resource of Royal Unibrew and therefore a resource
needed internationally. Arguably, the human resources, hereunder the culture as well as the
employees, might be difficult to transfer internationally. Culture is not easy to copy (Stahl &
Voigt, 2004). If an already existing brewery across borders is acquired, the employees in the
acquired company might have a completely different company culture, work ethic and other
procedures (Angwin & Savill, 1997). Therefore, it will be challenging for Royal Unibrew to
develop a similar culture internationally. However, Royal Unibrew has a history with several
numbers of mergers and acquisition. An experience in such an international matter has proved
to increase the success rate of such implementations (Collins et al., 2009), it will be possible to
gain an ownership advantage with this resource.
Given that the resource of Kissmeyer is defined as collaboration between Royal Unibrew and
Anders Kissmeyer, it will be difficult to exploit internationally when engaging in an FDI. Since
Kissmeyer is a brewer who has his own microbrewery this resource is a location-bound
resource, which thereby has the possibility to grow domestically (Peng & Meyer, 2011).
However, since the collaboration with Kissmeyer entails him being in charge of innovation and
development, new recipes for new products can be produced internationally and thereby
exploited this way. This also applies to the yeast strains of Royal Unibrew, which has a
competitive parity, and is an ingredient for making the beer. The yeast strains are what makes
the beer unique and could be used internationally by using the know-how in Spain.
Arguably, both the innovation and development of Kissmeyer and the yeast strains could be
expensive for Royal Unibrew since new recipes could entail new facilities or new raw materials.
However, financial resources make this possible, since this resource can be used internationally.
This makes the financial recourse crucial for Royal Unibrew, since it provides flexibility needed
for investment, such as new facilities. Furthermore, the financial resources are important when
engaging in FDI. This way, Royal Unibrew is less depending on organic growth and is able to
expand through acquisition. Moreover, most importantly, the financial resources enable Royal
76
Unibrew to commit capital into an FDI. In conclusion, given the financial resources that Royal
Unibrew possesses, it would be possible to exploit the innovation and development of Kissmeyer
when entering Spain through an FDI, since any potential costs associated with the exploitation
can be managed.
The brands owned by Royal Unibrew, and the brand of Royal Unibrew itself, could be an
ownership advantage if the brands were internationally recognized when entering a new market
However, since the beer market mostly consists of small local breweries, it is not likely that the
brands of Royal Unibrew are known. Furthermore, as with the previous acquisitions of Royal
Unibrew, it is not the brands owned by Royal Unibrew, or the brand of Royal Unibrew itself,
which is produced and sold in a new market. It is an already existing brand which is already on
the market in the given country. This way, the brands will not be an effective resource and do
not represent an ownership advantage, since the brands are location-bound. However, the
brands of Royal Unibrew are quite strong, which gives the sustained competitive advantage.
This speaks to the ability of Royal Unibrew to create or recognize a strong brand, which
eventually, will provide an ownership advantage and therefore can be used internationally if
Royal Unibrew were to engage in FDI.
Partnership with Heineken Brewery A/S is an important resource as well for Royal Unibrew,
which creates value by expanding their portfolio and generates revenue. This resource has
already been used internationally in the Baltics and Finland, and it is therefore possible that
Royal Unibrew can gain license to distribute and sell products of Heineken in other countries.
Given the rarity of this resource, due to the limited number of companies with such a license,
Royal Unibrew is arguably likely to gain such a license in other countries. Such a license would
also mean that the competitive advantage would increase and the market position would be
stronger. Furthermore, the partnership with Heineken can be a great asset when used
internationally in regards to the use of distribution channels.
Breweries are a resource with a temporary competitive advantage and since this resource is
located on specific geographically location it is arguably a location-bound resource. It is very
difficult to exploit breweries internationally. However, a potential FDI could involve an
77
acquisition of a new brewery. This new brewery would then suffice in international exploitation,
but would be location-bound as well regarding the geographical location. Arguably, the
breweries of Royal Unibrew could be exploited internationally if they were to engage in export.
By exporting beers produced at the breweries in Denmark, the resource is thereby used
internationally and not just suitable for domestic growth.
7.2 Location Advantages
The advantages of expanding the activities of a business to a foreign market are highly
correlated to the location advantages. These advantages contribute to help foreigners to
overcome the liabilities of outsidership (Peng & Meyer, 2011). In particular, Royal Unibrew’s
location advantages of expanding their activities to Spain will be assessed in the following.
Tourism affects the consumption of beer and other alcoholic beverages. As Spain is the most
visited country in Europe (Eurostat, 2017b), the tourists’ effect on the sales of beers represent a
considerable location advantage. The important determinant, weather, thus represents a direct
and indirect influence on the consumption of beers. Good weather increases the consumption of
beers, but also influences the number of tourists during the year. As the sun hours in Spain are
higher than in most other European countries and in fact more stable than Royal Unibrew’s
home markets, the weather is to consider as a strong locational advantage. Due to the stable
weather, uncertainty when forecasting the revenue in Spain is relatively lower, as the bad
weather in Northern Europe was the reason for lower turnover than expected (Royal Unibrew,
2018).
The water in Spain is not as pure as in most Northern European countries, which requires the
water to be purified before infused into the brewing process (Bason, 2018). This is of high
importance since water is essential in the brewery of beers as it represents 92% of the beer, in
average (Brewers of Europe, 2018). However, Spain is leading within water cycle management,
and therefore this should not be considered a disadvantage.
Agriculture provides all the raw materials used in producing beers. As Spain is the fifth largest
producer of crops, and in general has one of the largest agricultures in Europe, this indicates
that there are lots of suppliers (Eurostat, 2017a).
78
Royal Unibrew focuses on environmental and climate issues and are a self-proclaimed front-
runner (Royal Unibrew, 2018). During the last five years, they have accomplished reduction of
their energy and water consumption. The CO2-emission per capita has been decreased and in
general more focus is seen, among the Spaniards on the climate and environment. As Spain is
leading within the use of renewable energy, one of the location advantages may include lower
costs of running the daily operation as renewable energy will be cheaper than fossil fuels in the
longer run (Leary, 2018). The distribution of products from the production plant to the retail
store is very important (Andersson, 2018). As Spain is leading in the area of infrastructure, this
can be seen as a location advantage.
Spain is the ninth most attractive country for FDIs, which is due to, for instance, their
regulation and legislation on the area that give lots of freedom for foreign investors. Despite this,
the current political situation is instable. When operating in a highly regulated industry as the
brewery industry (Bason, 2018), an unstable government is not desirable. Added to the unstable
political situation is also the level of corruption in Spain. This level is relatively high compared
with its peers, in fact, one of the highest levels of corruption among the OECD-countries. In
total, the political situation is a disadvantage.
Spain is the fourth largest country in Europe. Accordingly, both the total production and
consumption of beers are in the top of Europe. Hence, the beer market in Spain is huge.
Moreover, the market is expected to grow with slow rates whilst other markets within the
brewery industry are expected to stagnate completely or even decrease in total sales.
Furthermore, the forecast of the distribution of sales within the different alcoholic beverages
shows that beer will maintain and expand its share of that particular market in Spain, which
definitely is a large location advantage.
Besides the positive trend within the beer market, the overall Spanish economy is also expected
to improve, as it has in the recent years. GDP in Spain has recently been largely increasing. In
fact, the average real GDP growth rate of the countries in Europe was 2.3%, while Spain did
manage a growth of 3.1% (Eurostat, 2017). Accordingly, the spending per capita in Spain has
79
also increased. Overall, the economic situation in Spain appears as a locational advantage. The
Spanish market is booming with new microbreweries. Over 5% of the total active breweries
were established in 2017. This indicates that the entry barriers in Spain are quite low for this
type of breweries. In addition, it also indicates that the expectations for the market are positive,
since there is market share to gain for new entrants. Spain has three large players in the market,
which add up to represent 75% of the market. In Denmark, Carlsberg has 53% of the market,
while Royal Unibrew has acquired 23% based on total volume (Euromonitor, 2017). Regarding
brands, the Spanish market is much more diversified when it comes to market share, which
again indicates that there is a better chance for new entrants.
Spaniards perceive beer as a beverage that can be consumed every day in the week and at all
time during the day. As a result, beers belong to traditions of the Spaniards and are integrated
in the culture. This gives several advantages when targeting the Spaniards as potential
consumers of Royal Unibrew’s products as the attitude is positive towards brewers, and is
therefore a location advantage. However, marketing in Spain is highly regulated, which makes
the entry for newcomers more difficult, which therefore is a disadvantage.
Duties related to alcohol and package materials represent decisive determinants on the final
price of the product. Spain has the fifth lowest excise duties in Europe, which is 0.75 DKK per
liter. In comparison, the same excise duty in Denmark is 2.71 DKK (Brewers of Europe, 2017).
Added the countries’ VAT, the total duty is 0.97 DKK in Spain and 3.39 DKK in Denmark. If
the average selling prices in supermarkets in the large cities from 2017 are compared, the
average beer is sold at a price of 9.6 DKK in Denmark while the average selling price in Spain
is approximately 5.4 DKK (Statista, 2016b). This results in the fact that the average margin is
18% in Spain and 39% in Denmark. Thus, the margin in Spain appears to be significantly
lower than in Denmark and also lower compared to most of the other countries in Europe
(Statista, 2016b). However, the excise duties have increased recently, though not relatively more
than other countries in Europe (Brewers of Europe, 2017). Thus, the low excise duties and VAT
represent location advantages.
80
Along with the lower costs due to duties and VAT, the average Spanish wages are considerable
low compared with most other developed countries (Statista, 2016a). In total this contributes to
lower production costs as well as an improved bottom line. The unemployment rate in Spain is
17.4%, which indicates that there is no lack of workforce and new hires should be easy to do.
7.3 Internalization advantages
The question of internalization advantages begins with the questions of motives of Royal
Unibrew. Given that Royal Unibrew chooses to engage in international investments in order to
penetrate the market by supplying beer (Andersson, 2018), Royal Unibrew can be considered a
market seeker (Dunning, 1973). The market seeker’s motive is the most common motive, along
with resource seeking, and market seekers believe that engaging in FDI is important for
accessing the new market (Dunning, 1973). This way of thinking corresponds with Royal
Unibrew’s way of thinking, which is evidenced by their history of mergers and acquisitions
(Royal Unibrew, 2018). Despite this way of thinking, Royal Unibrew also exports beers to
various countries (Royal Unibrew, 2018), however, this does not contradict the market seeker
motive, since a part of their five stage strategy is to be locally based, but also to have a
significant market position (Royal Unibrew, 2018), which is strengthened by export. It could be
argued that Royal Unibrew also is a resource seeker, given the acquisition completed in Latvia
and Lithuania, where the labor costs are considerably low (Eurostat, 2018). However, the lower
labor costs are only considered a location advantage in Spain and not the motive for engaging
in FDI itself, as these are not significantly low. Another criterion for being a resource seeker is to
expand activities due to gaining access to physical resources including minerals and agriculture
(Dunning, 2001). However, the ingredients used in beers are common in most countries, and
more importantly, common in Royal Unibrew’s current markets.
In order to be a market seeker and to be locally based, Royal Unibrew needs to engage in FDI.
However, FDI might not be the most suitable entry mode for Royal Unibrew, since they instead
can choose to export, license or outsource (Peng & Meyer, 2011). In order to find the most
suitable entry mode for Royal Unibrew into Spain, an FDI entry, as opposed to one of the other
alternatives, will be discussed.
81
7.3.1 FDI versus Export, Licensing & Outsourcing Resources that are better exploited by engaging in FDI than other entry modes have a certain
internalization advantages (Peng & Meyer, 2011). The internalization advantages compared to
export, licensing and outsourcing are many in the case of Royal Unibrew and the Spanish
market. The internalization advantages associated with human resources of Royal Unibrew are
in the form of a dedicated workforce, which can be exploited by opening a brewery in Spain
and hire employees and create the same dedication and corporate culture as in Denmark.
However, it will require substantial financial resources to build a new brewery. An engagement
in FDI by an acquisition of an existing brewery might therefore be more beneficial. The
internalization advantages are present here as well, since Royal Unibrew would be able to
implement their corporate culture into the Spanish brewery. Even though this might be difficult
it is possible to exploit both human resources and the corporate culture of Royal Unibrew.
Human resources are also exploited by export, however, the employee resource will not be
exploited as much as with an FDI in the form of acquisition.
The internalization advantages associated with the yeast strains of Royal Unibrew are small, but
present. As mentioned earlier, Royal Unibrew might benefit from using the yeast strains in
foreign production, since it is used to make the beer unique. Should the FDI be in the form of
an acquisition of an existing brewery in Spain, the internalization advantages from yeast strains
will be limited, since it would be the beer of the acquired brewery that would be produced.
However, it is still possible to use the yeast strains that Royal Unibrew owns when it comes to
production in Spain. For both licensing and outsourcing the yeast strains resource would not be
exploited properly, since the strains are developed and owned by Royal Unibrew and a part of
their production. However, the know-how of Kissmeyer could be very useful if engaging in an
FDI in the form of merger and acquisition, since the know-how could be transferable to a new
brewery. Especially, as mentioned earlier, given the financial resources that Royal Unibrew
possesses.
The internalization advantages are therefore present for both the yeast strains and Kissmeyer
collaboration. In this case, licensing and outsourcing does not make sense, since the yeast strains
owned by Royal Unibrew only holds a competitive parity. Competitors subject to the licensing
82
could thereby imitate the yeast strains. Furthermore, a risk associated with outsourcing is the
outcome of the product being incorrect and the service provider selling the same product or
service to competitors of Royal Unibrew (Peng & Meyer, 2011).
In the Spanish market, Heineken is represented as the market leader with 30.9% of the market
share. In addition, their brand Cruzcampo has acquired 11.7% of the market shares. The
partnership between Royal Unibrew and Heineken represents a sustainable competitive
advantage which is not locally bounded. However, since Heineken already operates in Spain,
this partnership can not be expanded to Spain. Instead, Royal Unibrew may be able to enter a
strategic alliance with Heineken in Spain. By Heineken being a market leader in the Spanish
market, a strategic alliance can provide a great foundation when penetrating the market for
Royal Unibrew. Even though Royal Unibrew prefers their own distribution channels and
suppliers (Andersson, 2018), the strategic alliance can include an agreement about using the
same distributions channels, which would be beneficial for export of Royal Unibrew’s own
products, as Heineken might not be interested in licensing Royal Unibrew’s products
themselves. If the agreement also would include use of suppliers and know-how of the Spanish
market, an FDI will be more appropriate. As this agreement has been seen before in Latvia,
where Heineken assisted in the entry of the market (Andersson 2018), it is a possibility that it
can happen in Spain as well.
The internalization advantages from the brands of Royal Unibrew can be derived from Royal
Unibrew’s ability to choose a brand with potential, gain a strong brand value and exploit this
brand value. By building a brewery of their own, Royal Unibrew can strengthen their brand in
Spain, however, this require substantial financial resources. Alternatively, if Royal Unibrew
engages in FDI by acquiring an existing brewery in Spain, they exploit the resource of their
brands’ know-how by making an existing brand even stronger in Spain. By exporting or
licensing, the brand of Royal Unibrew would be strengthened as well, however, the strategic
goal of being locally based would not be present.
As for the financial resources of Royal Unibrew, the internalization advantages lie in Royal
Unibrew being able to acquire, for example, a new brewery in Spain. The financial resources
83
are then used to expand the market share of the European beer market and thereby strengthen
the market position of Royal Unibrew. This way, the financial resources are exploited better
compared to export, since financial resources used in expanding export might generate organic
growth, but market share would be gained more slowly. The same goes for licensing, where
Royal Unibrew would not be locally based. Exploiting the financial resources by outsourcing
part of the organization’s activities would not be optimal compared to the internalization
advantages associated with FDI.
8. Preliminary Conclusion
Royal Unibrew has a number of value adding resources, which bring a competitive advantage
and ultimately provide ownership advantages. These ownership advantages can be used by
Royal Unibrew to overcome the challenges associated with an international expansion, for
example the liability of outsidership (Peng & Meyer, 2011). Furthermore, Royal Unibrew has a
number of location advantages discovered using PESTEL and Porter’s Five Forces. Spain
thereby holds certain advantages that Royal Unibrew would not be able to obtain in the home
market (Peng & Meyer, 2011). Lastly, internalization advantages are detected using FDI as an
entry mode into Spain. This entry mode holds advantages over exporting, licensing and
outsourcing, since export deals can be exploited by the other party of the relationship (Peng &
Meyer, 2011). Furthermore, performing export will miss certain exploitation opportunities of
the resources.
By performing an FDI over licensing Royal Unibrew would be locally based, which is part of
the overall strategy (Royal Unibrew, 2018). By performing licensing, Royal Unibrew would lack
direct management and might experience difficulties in the transfer of knowledge and the
transfer of activities is therefore more suited. Also, certain resources, such as the yeast strains,
would not be exploited by using licensing as an entry mode. By engaging in outsourcing Royal
Unibrew would not be locally based either, resources would not be exploited and the end
product might end up being incorrect or the service provider selling the same product to
competitors (Peng & Meyer, 2011).
84
Based on the outcomes of the analysis and discussion there is a strategic fit between Royal
Unibrew and Spain. Furthermore, since Royal Unibrew possesses ownership-, location- and
internalization advantages the most appropriate entry mode for Royal Unibrew into Spain is
FDI (Dunning, 1991).
It is important to distinguish the method of FDI, since there are a variety of different FDIs, such
as opening a subsidiary, joint venture, mergers and acquisition etc. (Duce, 2003). The history of
Royal Unibrew shows a number of acquisitions of breweries has taken place in Finland,
Lithuania, Latvia etc. (Royal Unibrew, 2018). Furthermore, Royal Unibrew has carried out
mergers and acquisitions of other companies than beer manufacturers in Italy, Denmark etc.
(Andersson, 2018). Given the history of Royal Unibrew merger or acquisition appears to be the
answer to the question of entry strategy. However, this conclusion lacks an empirical
foundation. Although, based on the strategic analysis, a merger or acquisition might rightful
choice.
A merger or acquisition is in line with the strategic goals of Royal Unibrew. Firstly, as
mentioned earlier, an FDI lives up to the strategy of being locally based, which also is the case
for merger or acquisition. This way, a merger or acquisition is in line with the DNA of Royal
Unibrew, since the expansion is not due to organic growth. Secondly, the strategic goal of
having a significant market position, speaks to a merger or acquisition due to the
competitiveness of Spain and the location advantages of Royal Unibrew. Spain is a mature
market with many existing competitors.
Given Spain being a mature market and the strategic goal of having a significant market
position, the establishment of a subsidiary is not the best entry strategy. As the Spanish market is
mature, the significant market position would be very difficult to obtain, especially considering
the market leaders’ position as well as the total number of breweries in Spain. Arguably, the
ownership advantages would enable Royal Unibrew to overcome the liability of outsidership
and thereby be able to gain a significant market share faster than some competitors. However,
85
given the history and DNA of Royal Unibrew and the competitiveness and strategic goals of
Royal Unibrew, the best entry strategy would be through a merger or acquisition.
In order to find a suitable candidate for a merger or an acquisition, the pre-acquisition process
will be carried out in the next section.
9. The Due Diligence Process – Pre-acquisition
In this section, Royal Unibrew’s motive for expanding their activities abroad will be presented.
Afterwards, the search process will be described and carried out. Next, the screening criteria are
discussed, and the final candidates are evaluated and presented. An AHP-approach will be used
for defining the evaluation criteria and the candidates will be evaluated. Before the final ranking,
the ratings given to the individual candidates will be transformed into the same scale using
deciles as thresholds, and lastly the ranking of the final candidates will take place.
9.1 The Motivation for Doing M&A – Royal Unibrew The motivation behind Royal Unibrew performing M&A is to penetrate the Spanish market.
Moreover, as Andersson (2018) argues, the future M&A must provide increased value for their
shareholders, and it must also provide Royal Unibrew with further growth in their businesses
(Andersson, 2018). These motives are in line with some of the most common behind a M&A cf.
section 4.5.2, and the profile of a market seeker was found to be the most appropriate for Royal
Unibrew, and is aligned with these statements.
9.2 Search Process and Data Selection This section is about the data selection process and presents the search process for possible
targets, which may be attractive to Royal Unibrew. Firstly, the database as well as the data
extracted will be presented. Afterwards, the data used to assess the aspects in the analysis is
presented. Lastly, a brief assessment of the validity and reliability of the data will be discussed.
86
9.2.1 The Search Process As Harvey & Lusch (1998) suggest, the search for possible candidates should not rely on clues
from insiders. Instead, the acquirer should make a comprehensive research into what
geographic location is wanted as well as industry wanted, etc. In the search for possible targets
for Royal Unibrew in the Spanish market, the database Orbis has been used for collected data
regarding the existing breweries in Spain. According to Orbis, there exist 551 active breweries
in Spain in 2016. All of these are either pure breweries or are also producers of other beverages,
but have beers as their main industry. As mentioned earlier, the number of breweries in 2018 is
795. However, no data is available for the remaining breweries (Orbis, 2018). The number of
breweries in 2016 has been validated by other databases, hereunder Marketline and
Euromonitor. The search criteria used in Orbis, inspired by section 4.5.
• Breweries must be actively managed
• Firms must be manufacturers of beer
• Breweries must be located in Spain
When candidates have been found in the search process, the data selection process excludes
those with no data available.
9.2.2 The Selection Process The selection process follows the following steps: Firstly, breweries that had no data available in
the Orbis database were pulled out of the sample. The reason for this is that in order to conduct
the analysis, the aspects assessed require information regarding the financial performance,
number of employees, main exchange information etc. In order to validate that no information
was available for the excluded breweries, these were further investigated by using other
databases, hereunder Bloomberg and MarketLine. Next, as the financial key numbers, such as
revenue, EBITDA, etc. from 2016 or later, are necessary for conducting the analysis, all
breweries where any of the figures were not availablewere excluded from the list of possible
targets. When conducting assessment of the firms’ financial performance, recent numbers are
more desirable as it gives a more precise picture of the current situation. The selection process
reduced the number of breweries from 551 to 179.
87
9.2.3 Data for Assessing the Aspects The aspects chosen for the analysis are employees and management team, financial
performance, marketing and products. These aspects in this section and the belonging criteria
will be presented later in section 9.4.
9.2.3.1 Aspect 1: Employee & Management Team
Data used for aspect 1 is found using the database Orbis, where data for the eight different
candidates are assessed one by one. Key numbers, such as profit per employee, operating
revenue per employee, cost per employee and average costs per employee, are used in order to
gain an understanding of the productivity level and exploitation of labor.
9.2.3.2 Aspect 2 & 3: Financial Performance & Marketing
The relevant financial data have been extracted from Orbis. As the firms are privately owned,
data and information are much less available compared to listed firms (Capron & Shen, 2007).
The numbers used are from 2016, as these are the latest available.
9.1.3.3 Aspect 4: Products
Data used for aspect 4 is found by accessing the websites of the eight candidates and thereby
gain an insight into the product portfolio of each of the candidates. Each candidate owns a
website with an explicit presentation of the products offered and the more diverse the product
portfolio, the better the chances are for Royal Unibrew to penetrate the market.
9.2.4 Validity The validity of the quantitative data refers to the first three aspects, and begins with the
technical validity (Olsen & Pedersen, 1999). Data validity and reliability used in aspect 4 can be
found in section 3.6.2 regarding qualitative data. The technical validity is fairly high for the
quantitative data, since the financial data subtracted from the database represent the needed
parameters. However, given that the amount of these parameters could be endless, the technical
validity is lowered due to the limitations of this thesis. Relevant for the validity of the
quantitative data is the question of statistical validity, which refers to whether the data sample
used, in the analysis, is large enough to represent the data population and whether the data is
88
subtracted correctly (Olsen & Pedersen, 1999). Given the specific data selection the statistical
validity is moderate, since only 551 breweries were extracted and only 179 breweries contained
the information necessary for the analysis. As a consequence, better matches for Royal Unibrew
may be found among these unknown and excluded breweries, which lower the validity.
However, the excluded breweries, due to lack of information and including breweries
established between 2016 and 2018, are likely to be primarily very small breweries and would
therefore have been excluded in the preliminary screening, cf. section 8.2.1. Moreover, the
missing breweries are assumed to be missing because of their minimal size and therefore
assumed not to be interesting for Royal Unibrew.
9.2.5 Reliability The reliability of the quantitative data is fairly high given that the data is accurate and
quantifiable. Since the quantitative data is not based on surveys or interviews, but financial and
statistical data, no bias exists. This way, there are no respondents affected by any kind of bias,
which could affect the data quality (Olsen & Pedersen, 1999). Furthermore, the methods used
for collecting the data are standardized procedures (Andersen, 2008). This way, the one
responsible for collecting the data for the database Orbis does not have a negative influence on
the reliability and the data collection as the database would be the same each time collection
was executed (Olsen & Pedersen, 1999). A new study might select different exclusion criteria in
the data selection process, which might vary the outcome (Olsen & Pedersen, 1999). However,
given the limitations of the thesis, the data selection will suffice as a valid representation of the
data population.
9.3 Preliminary screening
In order to reach more relevant targets attractive to Royal Unibrew, the next step is a
preliminary screening. The purpose of this section is to reduce the number of targets from the
selection process, which resulted in 179 candidates, to a manageable size that can be
investigated further and in more detail.
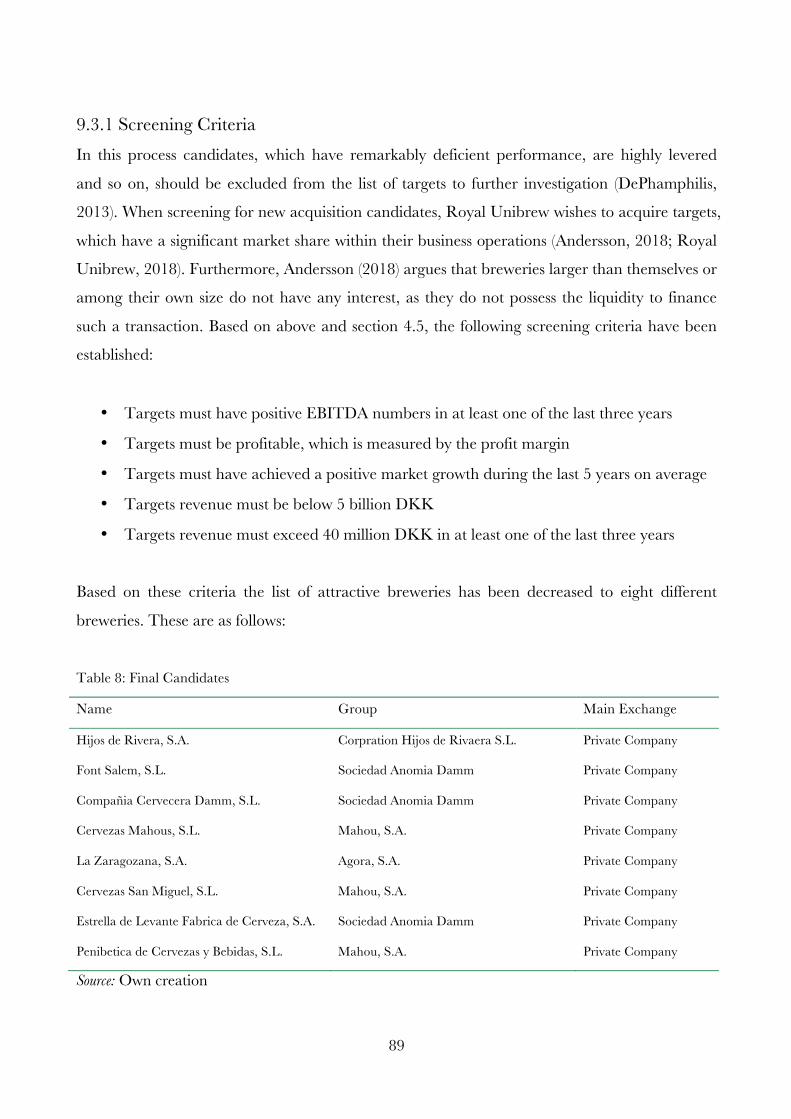
89
9.3.1 Screening Criteria In this process candidates, which have remarkably deficient performance, are highly levered
and so on, should be excluded from the list of targets to further investigation (DePhamphilis,
2013). When screening for new acquisition candidates, Royal Unibrew wishes to acquire targets,
which have a significant market share within their business operations (Andersson, 2018; Royal
Unibrew, 2018). Furthermore, Andersson (2018) argues that breweries larger than themselves or
among their own size do not have any interest, as they do not possess the liquidity to finance
such a transaction. Based on above and section 4.5, the following screening criteria have been
established:
• Targets must have positive EBITDA numbers in at least one of the last three years
• Targets must be profitable, which is measured by the profit margin
• Targets must have achieved a positive market growth during the last 5 years on average
• Targets revenue must be below 5 billion DKK
• Targets revenue must exceed 40 million DKK in at least one of the last three years
Based on these criteria the list of attractive breweries has been decreased to eight different
breweries. These are as follows:
Table 8: Final Candidates
Name Group Main Exchange
Hijos de Rivera, S.A. Corpration Hijos de Rivaera S.L. Private Company
Font Salem, S.L. Sociedad Anomia Damm Private Company
Compañia Cervecera Damm, S.L. Sociedad Anomia Damm Private Company
Cervezas Mahous, S.L. Mahou, S.A. Private Company
La Zaragozana, S.A. Agora, S.A. Private Company
Cervezas San Miguel, S.L. Mahou, S.A. Private Company
Estrella de Levante Fabrica de Cerveza, S.A. Sociedad Anomia Damm Private Company
Penibetica de Cervezas y Bebidas, S.L. Mahou, S.A. Private Company
Source: Own creation
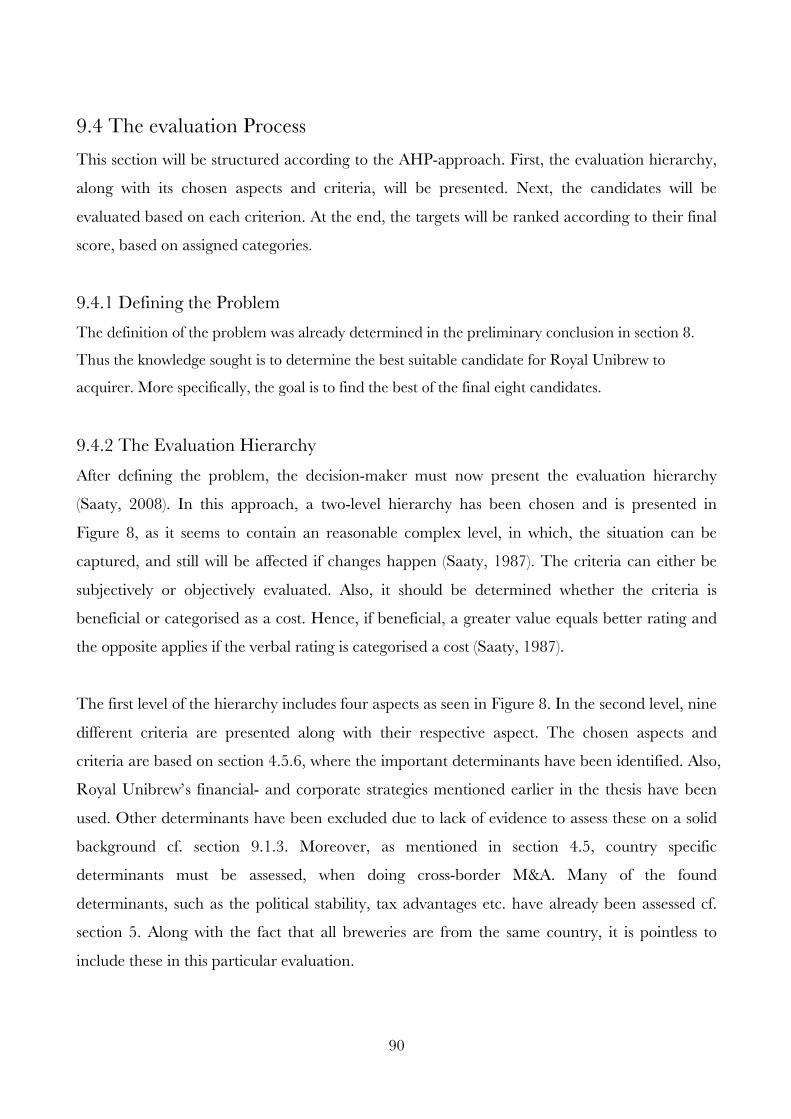
90
9.4 The evaluation Process This section will be structured according to the AHP-approach. First, the evaluation hierarchy,
along with its chosen aspects and criteria, will be presented. Next, the candidates will be
evaluated based on each criterion. At the end, the targets will be ranked according to their final
score, based on assigned categories.
9.4.1 Defining the Problem The definition of the problem was already determined in the preliminary conclusion in section 8.
Thus the knowledge sought is to determine the best suitable candidate for Royal Unibrew to
acquirer. More specifically, the goal is to find the best of the final eight candidates.
9.4.2 The Evaluation Hierarchy After defining the problem, the decision-maker must now present the evaluation hierarchy
(Saaty, 2008). In this approach, a two-level hierarchy has been chosen and is presented in
Figure 8, as it seems to contain an reasonable complex level, in which, the situation can be
captured, and still will be affected if changes happen (Saaty, 1987). The criteria can either be
subjectively or objectively evaluated. Also, it should be determined whether the criteria is
beneficial or categorised as a cost. Hence, if beneficial, a greater value equals better rating and
the opposite applies if the verbal rating is categorised a cost (Saaty, 1987).
The first level of the hierarchy includes four aspects as seen in Figure 8. In the second level, nine
different criteria are presented along with their respective aspect. The chosen aspects and
criteria are based on section 4.5.6, where the important determinants have been identified. Also,
Royal Unibrew’s financial- and corporate strategies mentioned earlier in the thesis have been
used. Other determinants have been excluded due to lack of evidence to assess these on a solid
background cf. section 9.1.3. Moreover, as mentioned in section 4.5, country specific
determinants must be assessed, when doing cross-border M&A. Many of the found
determinants, such as the political stability, tax advantages etc. have already been assessed cf.
section 5. Along with the fact that all breweries are from the same country, it is pointless to
include these in this particular evaluation.
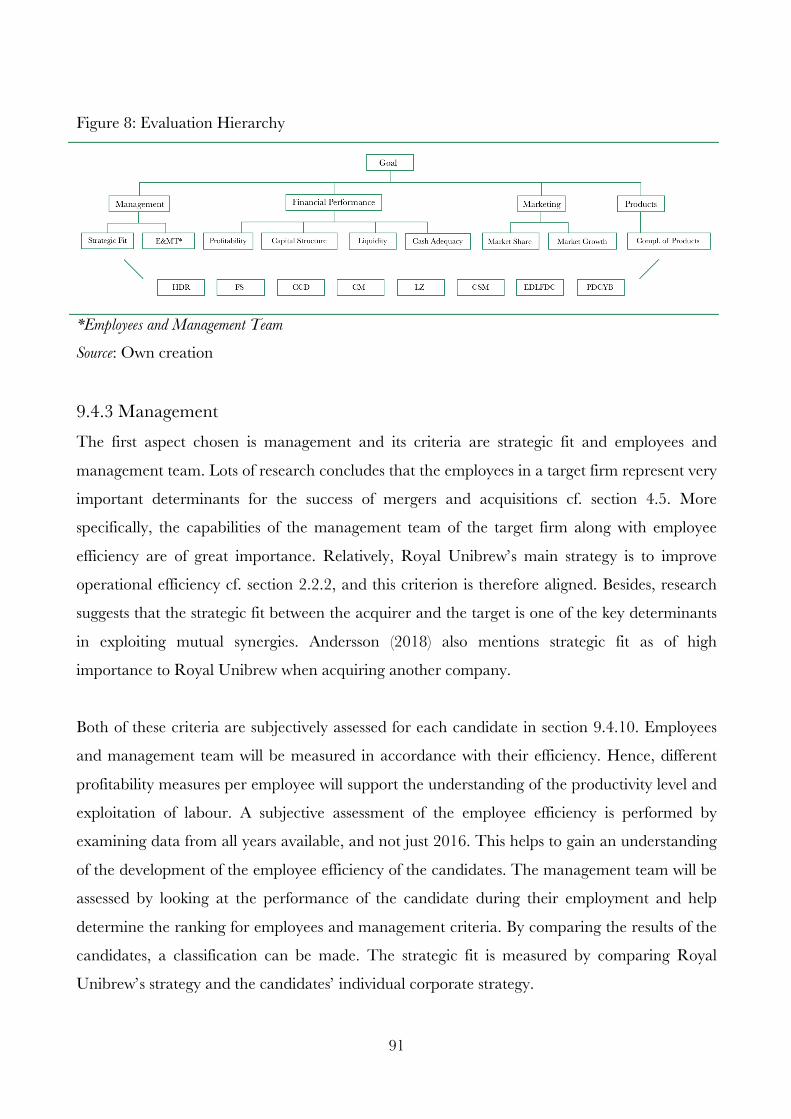
91
Figure 8: Evaluation Hierarchy
*Employees and Management Team
Source: Own creation
9.4.3 Management The first aspect chosen is management and its criteria are strategic fit and employees and
management team. Lots of research concludes that the employees in a target firm represent very
important determinants for the success of mergers and acquisitions cf. section 4.5. More
specifically, the capabilities of the management team of the target firm along with employee
efficiency are of great importance. Relatively, Royal Unibrew’s main strategy is to improve
operational efficiency cf. section 2.2.2, and this criterion is therefore aligned. Besides, research
suggests that the strategic fit between the acquirer and the target is one of the key determinants
in exploiting mutual synergies. Andersson (2018) also mentions strategic fit as of high
importance to Royal Unibrew when acquiring another company.
Both of these criteria are subjectively assessed for each candidate in section 9.4.10. Employees
and management team will be measured in accordance with their efficiency. Hence, different
profitability measures per employee will support the understanding of the productivity level and
exploitation of labour. A subjective assessment of the employee efficiency is performed by
examining data from all years available, and not just 2016. This helps to gain an understanding
of the development of the employee efficiency of the candidates. The management team will be
assessed by looking at the performance of the candidate during their employment and help
determine the ranking for employees and management criteria. By comparing the results of the
candidates, a classification can be made. The strategic fit is measured by comparing Royal
Unibrew’s strategy and the candidates’ individual corporate strategy.
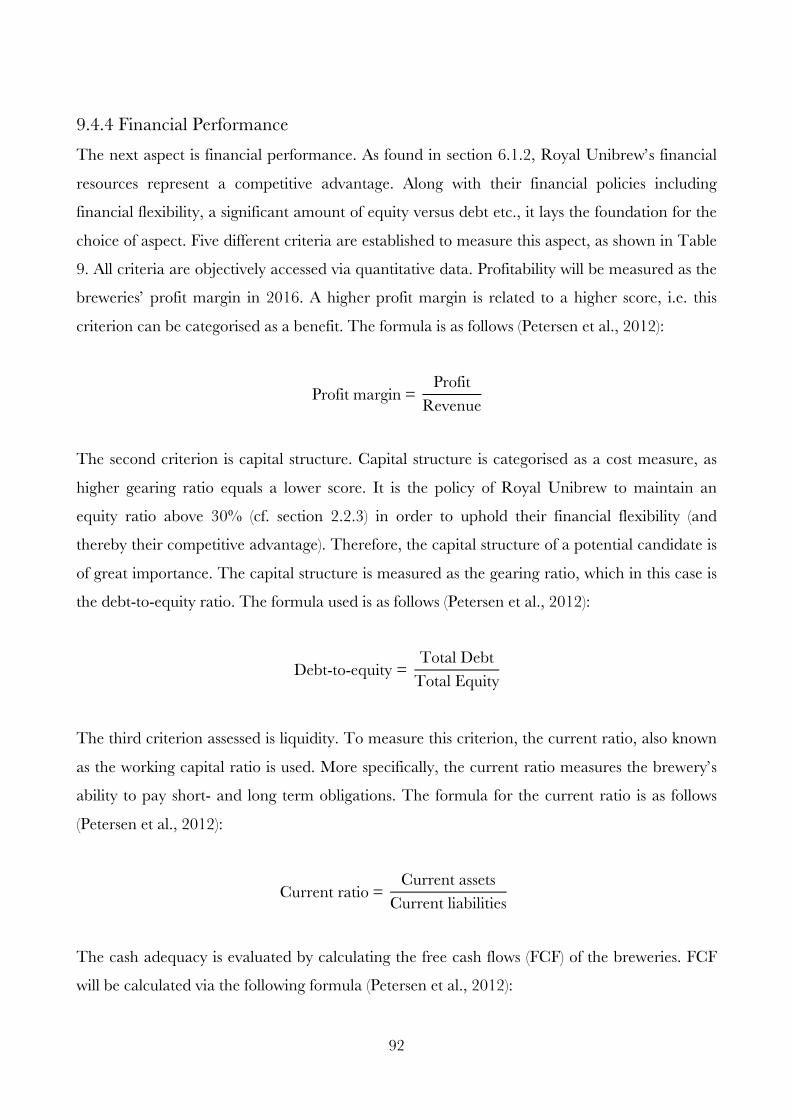
92
9.4.4 Financial Performance The next aspect is financial performance. As found in section 6.1.2, Royal Unibrew’s financial
resources represent a competitive advantage. Along with their financial policies including
financial flexibility, a significant amount of equity versus debt etc., it lays the foundation for the
choice of aspect. Five different criteria are established to measure this aspect, as shown in Table
9. All criteria are objectively accessed via quantitative data. Profitability will be measured as the
breweries’ profit margin in 2016. A higher profit margin is related to a higher score, i.e. this
criterion can be categorised as a benefit. The formula is as follows (Petersen et al., 2012):
Profit margin = ProfitRevenue
The second criterion is capital structure. Capital structure is categorised as a cost measure, as
higher gearing ratio equals a lower score. It is the policy of Royal Unibrew to maintain an
equity ratio above 30% (cf. section 2.2.3) in order to uphold their financial flexibility (and
thereby their competitive advantage). Therefore, the capital structure of a potential candidate is
of great importance. The capital structure is measured as the gearing ratio, which in this case is
the debt-to-equity ratio. The formula used is as follows (Petersen et al., 2012):
Debt-to-equity = Total Debt
Total Equity
The third criterion assessed is liquidity. To measure this criterion, the current ratio, also known
as the working capital ratio is used. More specifically, the current ratio measures the brewery’s
ability to pay short- and long term obligations. The formula for the current ratio is as follows
(Petersen et al., 2012):
Current ratio = Current assets
Current liabilities
The cash adequacy is evaluated by calculating the free cash flows (FCF) of the breweries. FCF
will be calculated via the following formula (Petersen et al., 2012):
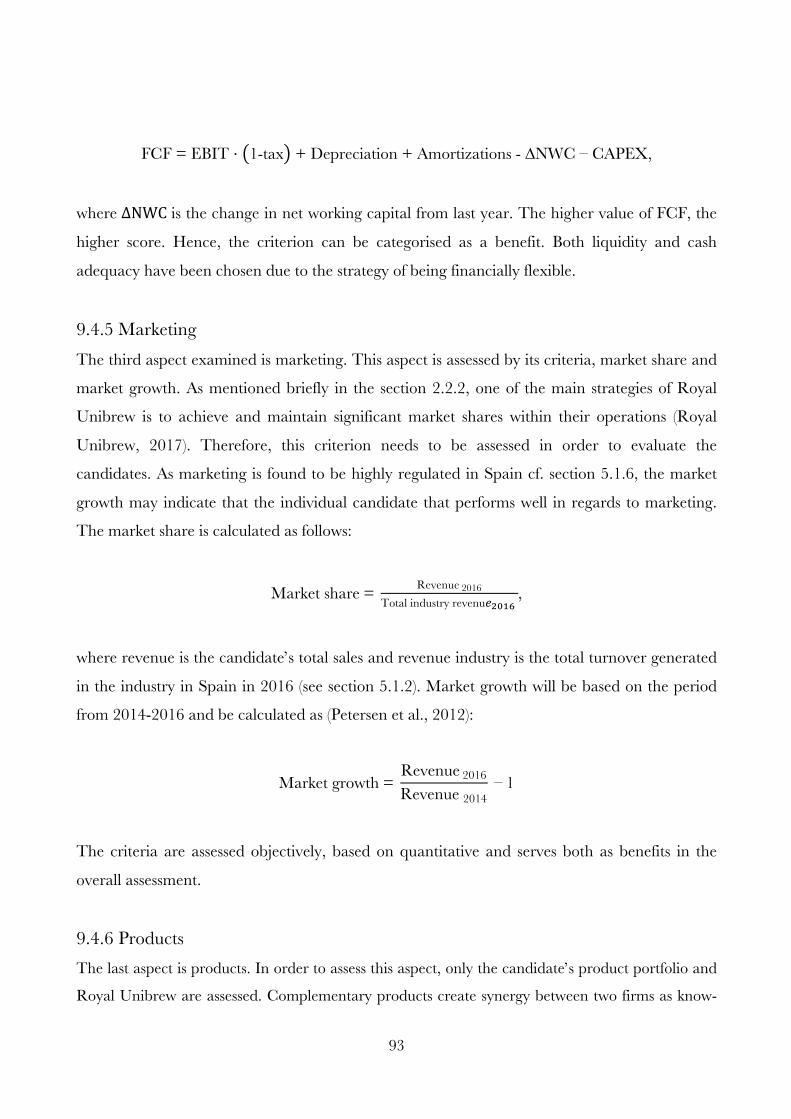
93
FCF = EBIT ⋅ 1-tax + Depreciation + Amortizations - ∆NWC – CAPEX,
where ∆NWC is the change in net working capital from last year. The higher value of FCF, the
higher score. Hence, the criterion can be categorised as a benefit. Both liquidity and cash
adequacy have been chosen due to the strategy of being financially flexible.
9.4.5 Marketing The third aspect examined is marketing. This aspect is assessed by its criteria, market share and
market growth. As mentioned briefly in the section 2.2.2, one of the main strategies of Royal
Unibrew is to achieve and maintain significant market shares within their operations (Royal
Unibrew, 2017). Therefore, this criterion needs to be assessed in order to evaluate the
candidates. As marketing is found to be highly regulated in Spain cf. section 5.1.6, the market
growth may indicate that the individual candidate that performs well in regards to marketing.
The market share is calculated as follows:
Market share = Revenue 2016Total industry revenu!!"#$
,
where revenue is the candidate’s total sales and revenue industry is the total turnover generated
in the industry in Spain in 2016 (see section 5.1.2). Market growth will be based on the period
from 2014-2016 and be calculated as (Petersen et al., 2012):
Market growth = Revenue 2016
Revenue 2014 – 1
The criteria are assessed objectively, based on quantitative and serves both as benefits in the
overall assessment.
9.4.6 Products The last aspect is products. In order to assess this aspect, only the candidate’s product portfolio and
Royal Unibrew are assessed. Complementary products create synergy between two firms as know-
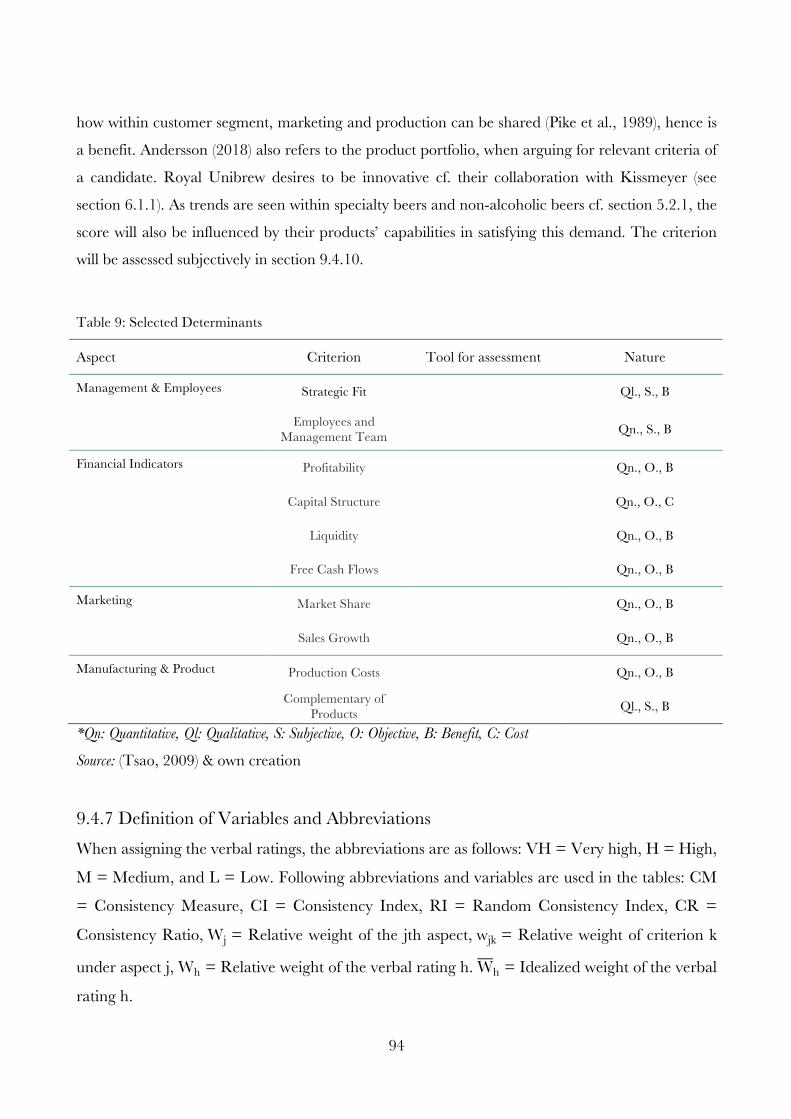
94
how within customer segment, marketing and production can be shared (Pike et al., 1989), hence is
a benefit. Andersson (2018) also refers to the product portfolio, when arguing for relevant criteria of
a candidate. Royal Unibrew desires to be innovative cf. their collaboration with Kissmeyer (see
section 6.1.1). As trends are seen within specialty beers and non-alcoholic beers cf. section 5.2.1, the
score will also be influenced by their products’ capabilities in satisfying this demand. The criterion
will be assessed subjectively in section 9.4.10.
Table 9: Selected Determinants
Aspect Criterion Tool for assessment Nature
Management & Employees Strategic Fit Ql., S., B
Employees and Management Team Qn., S., B
Financial Indicators Profitability Qn., O., B
Capital Structure Qn., O., C
Liquidity Qn., O., B
Free Cash Flows Qn., O., B
Marketing Market Share Qn., O., B
Sales Growth Qn., O., B
Manufacturing & Product Production Costs Qn., O., B
Complementary of Products Ql., S., B
*Qn: Quantitative, Ql: Qualitative, S: Subjective, O: Objective, B: Benefit, C: Cost
Source: (Tsao, 2009) & own creation
9.4.7 Definition of Variables and Abbreviations When assigning the verbal ratings, the abbreviations are as follows: VH = Very high, H = High,
M = Medium, and L = Low. Following abbreviations and variables are used in the tables: CM
= Consistency Measure, CI = Consistency Index, RI = Random Consistency Index, CR =
Consistency Ratio, Wj = Relative weight of the jth aspect, wjk = Relative weight of criterion k
under aspect j, Wh = Relative weight of the verbal rating h. Wh = Idealized weight of the verbal
rating h.
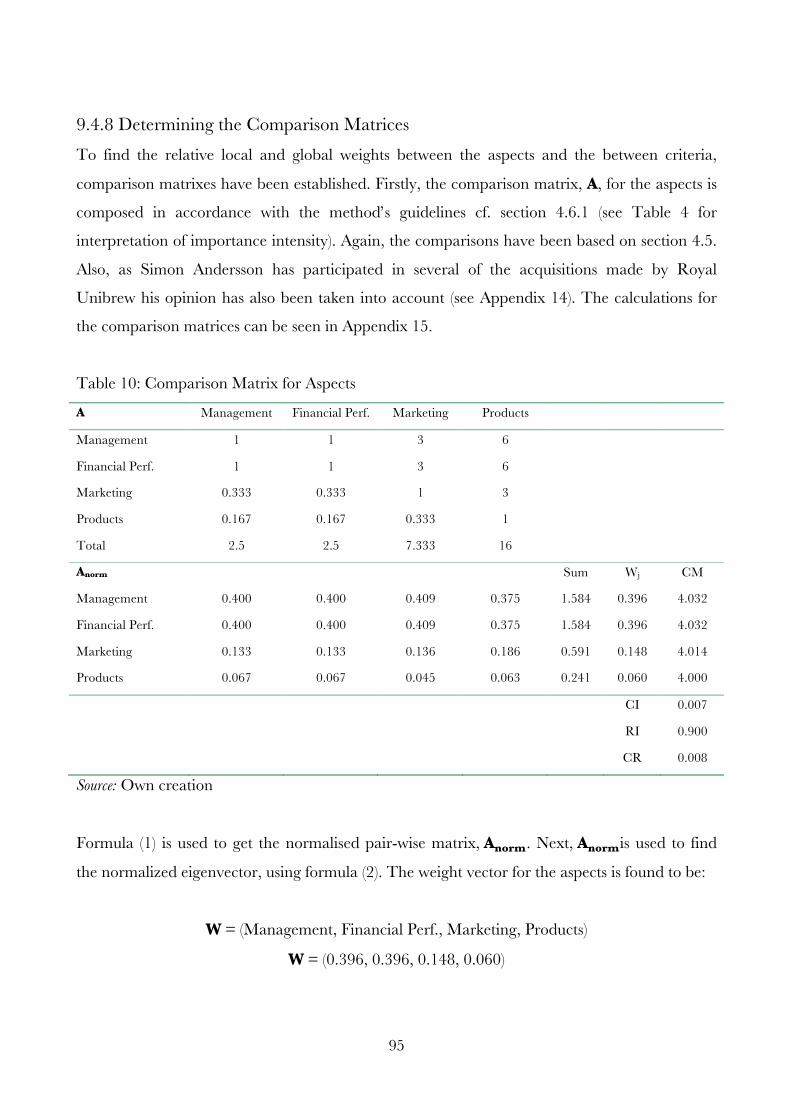
95
9.4.8 Determining the Comparison Matrices To find the relative local and global weights between the aspects and the between criteria,
comparison matrixes have been established. Firstly, the comparison matrix, A, for the aspects is
composed in accordance with the method’s guidelines cf. section 4.6.1 (see Table 4 for
interpretation of importance intensity). Again, the comparisons have been based on section 4.5.
Also, as Simon Andersson has participated in several of the acquisitions made by Royal
Unibrew his opinion has also been taken into account (see Appendix 14). The calculations for
the comparison matrices can be seen in Appendix 15.
Table 10: Comparison Matrix for Aspects
A Management Financial Perf. Marketing Products
Management 1 1 3 6
Financial Perf. 1 1 3 6
Marketing 0.333 0.333 1 3
Products 0.167 0.167 0.333 1
Total 2.5 2.5 7.333 16
Anorm Sum Wj CM
Management 0.400 0.400 0.409 0.375 1.584 0.396 4.032
Financial Perf. 0.400 0.400 0.409 0.375 1.584 0.396 4.032
Marketing 0.133 0.133 0.136 0.186 0.591 0.148 4.014
Products 0.067 0.067 0.045 0.063 0.241 0.060 4.000
CI 0.007
RI 0.900
CR 0.008
Source: Own creation
Formula (1) is used to get the normalised pair-wise matrix, Anorm. Next, Anormis used to find
the normalized eigenvector, using formula (2). The weight vector for the aspects is found to be:
W = (Management, Financial Perf., Marketing, Products)
W = (0.396, 0.396, 0.148, 0.060)
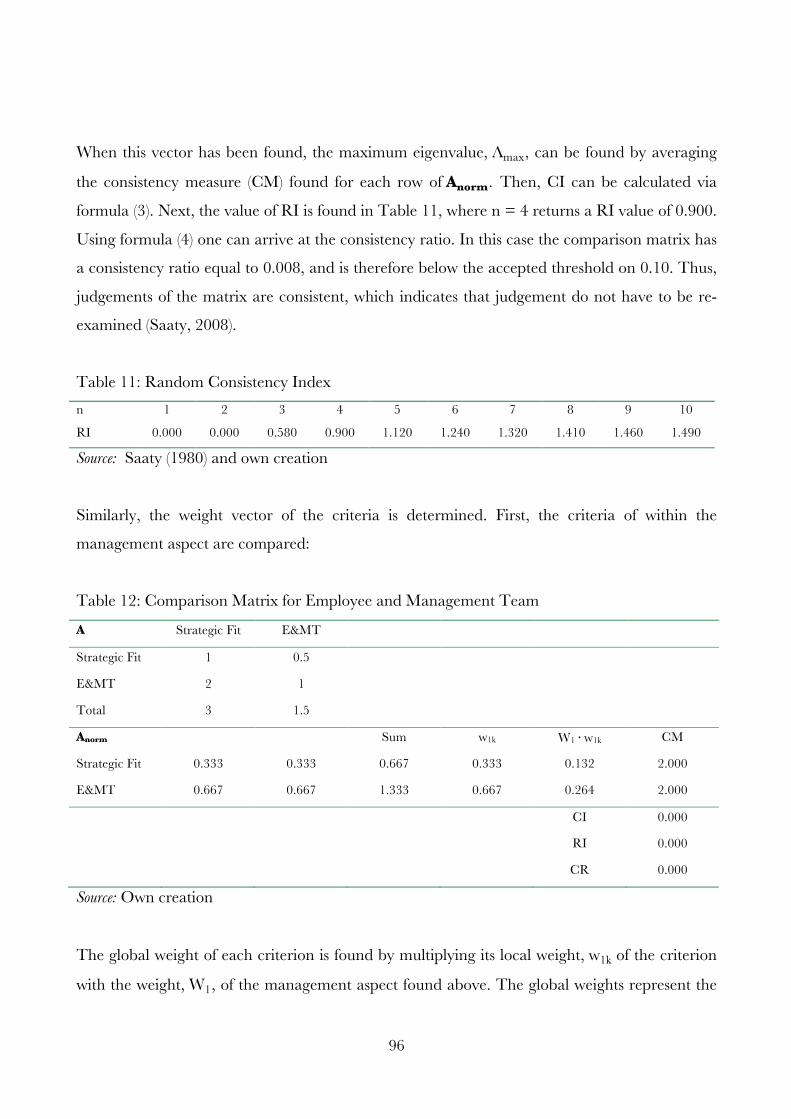
96
When this vector has been found, the maximum eigenvalue, Λmax, can be found by averaging
the consistency measure (CM) found for each row of Anorm. Then, CI can be calculated via
formula (3). Next, the value of RI is found in Table 11, where n = 4 returns a RI value of 0.900.
Using formula (4) one can arrive at the consistency ratio. In this case the comparison matrix has
a consistency ratio equal to 0.008, and is therefore below the accepted threshold on 0.10. Thus,
judgements of the matrix are consistent, which indicates that judgement do not have to be re-
examined (Saaty, 2008).
Table 11: Random Consistency Index n 1 2 3 4 5 6 7 8 9 10
RI 0.000 0.000 0.580 0.900 1.120 1.240 1.320 1.410 1.460 1.490
Source: Saaty (1980) and own creation
Similarly, the weight vector of the criteria is determined. First, the criteria of within the
management aspect are compared:
Table 12: Comparison Matrix for Employee and Management Team
A Strategic Fit E&MT
Strategic Fit 1 0.5
E&MT 2 1
Total 3 1.5
Anorm Sum w1k W1 ∙ w1k CM
Strategic Fit 0.333 0.333 0.667 0.333 0.132 2.000
E&MT 0.667 0.667 1.333 0.667 0.264 2.000
CI 0.000
RI 0.000
CR 0.000
Source: Own creation
The global weight of each criterion is found by multiplying its local weight, w1k of the criterion
with the weight, W1, of the management aspect found above. The global weights represent the
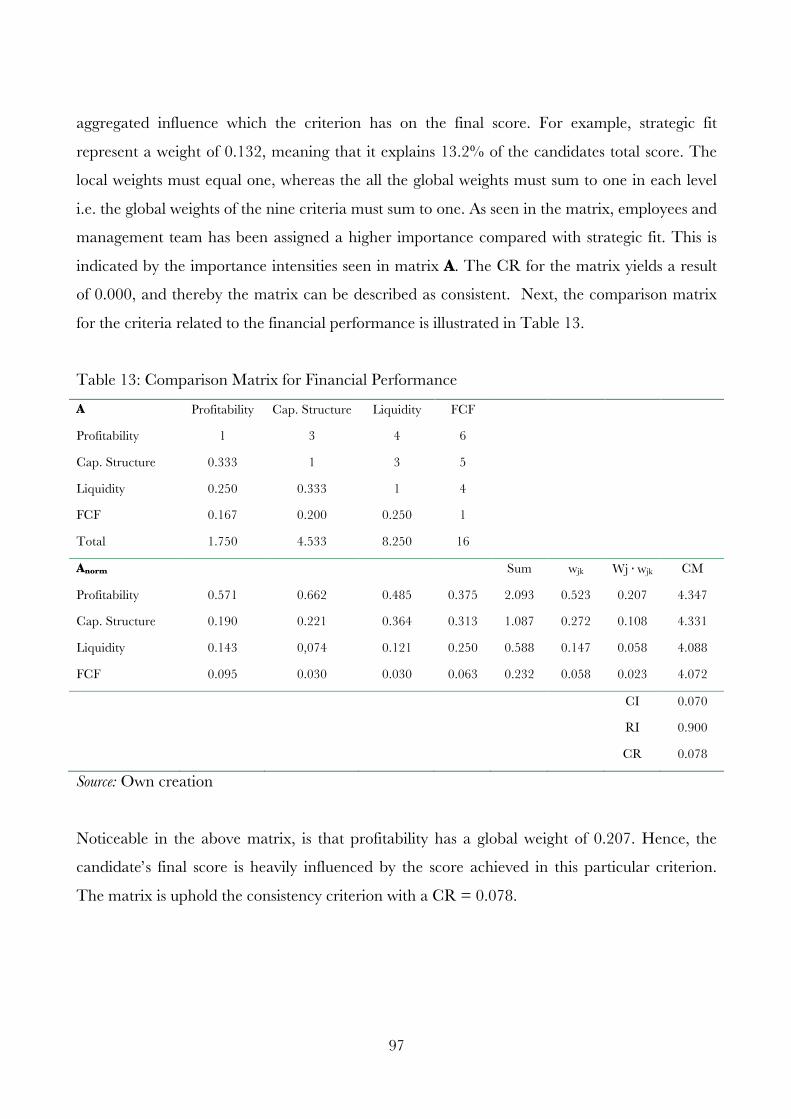
97
aggregated influence which the criterion has on the final score. For example, strategic fit
represent a weight of 0.132, meaning that it explains 13.2% of the candidates total score. The
local weights must equal one, whereas the all the global weights must sum to one in each level
i.e. the global weights of the nine criteria must sum to one. As seen in the matrix, employees and
management team has been assigned a higher importance compared with strategic fit. This is
indicated by the importance intensities seen in matrix A. The CR for the matrix yields a result
of 0.000, and thereby the matrix can be described as consistent. Next, the comparison matrix
for the criteria related to the financial performance is illustrated in Table 13.
Table 13: Comparison Matrix for Financial Performance
A Profitability Cap. Structure Liquidity FCF
Profitability 1 3 4 6
Cap. Structure 0.333 1 3 5
Liquidity 0.250 0.333 1 4
FCF 0.167 0.200 0.250 1
Total 1.750 4.533 8.250 16
Anorm Sum wjk Wj ∙ wjk CM
Profitability 0.571 0.662 0.485 0.375 2.093 0.523 0.207 4.347
Cap. Structure 0.190 0.221 0.364 0.313 1.087 0.272 0.108 4.331
Liquidity 0.143 0,074 0.121 0.250 0.588 0.147 0.058 4.088
FCF 0.095 0.030 0.030 0.063 0.232 0.058 0.023 4.072
CI 0.070
RI 0.900
CR 0.078
Source: Own creation
Noticeable in the above matrix, is that profitability has a global weight of 0.207. Hence, the
candidate’s final score is heavily influenced by the score achieved in this particular criterion.
The matrix is uphold the consistency criterion with a CR = 0.078.
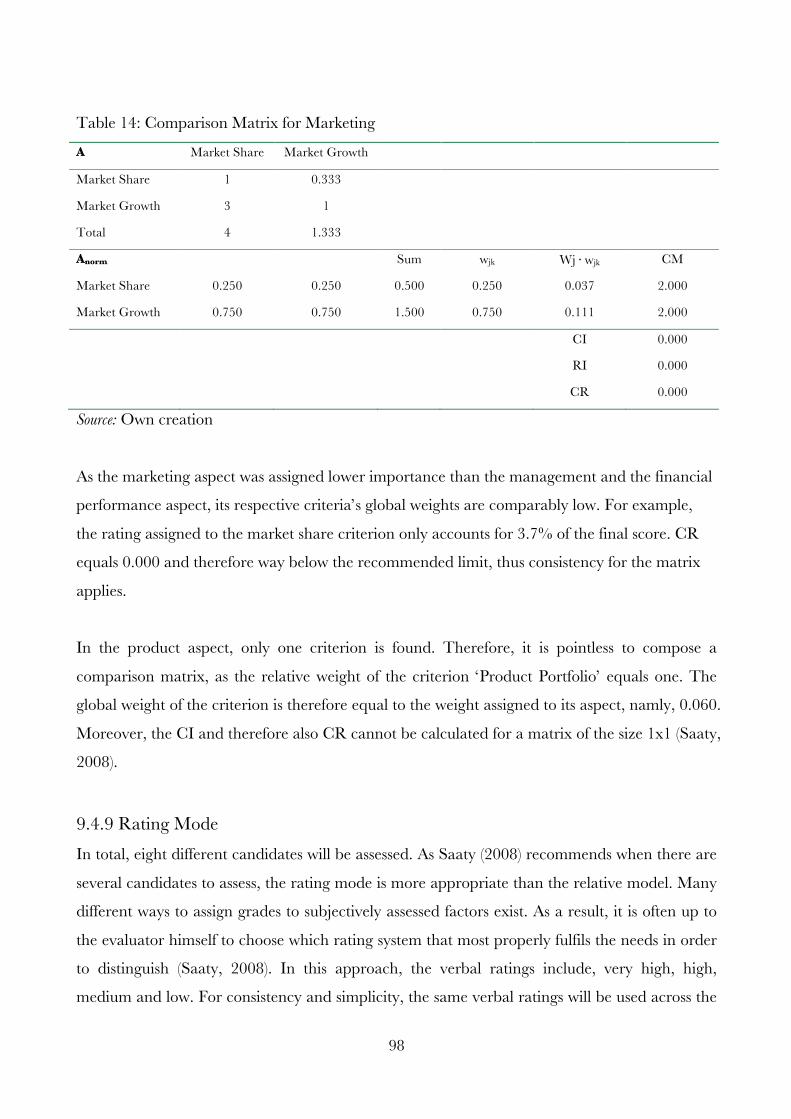
98
Table 14: Comparison Matrix for Marketing
A Market Share Market Growth
Market Share 1 0.333
Market Growth 3 1
Total 4 1.333
Anorm Sum wjk Wj ∙ wjk CM
Market Share 0.250 0.250 0.500 0.250 0.037 2.000
Market Growth 0.750 0.750 1.500 0.750 0.111 2.000
CI 0.000
RI 0.000
CR 0.000
Source: Own creation
As the marketing aspect was assigned lower importance than the management and the financial
performance aspect, its respective criteria’s global weights are comparably low. For example,
the rating assigned to the market share criterion only accounts for 3.7% of the final score. CR
equals 0.000 and therefore way below the recommended limit, thus consistency for the matrix
applies.
In the product aspect, only one criterion is found. Therefore, it is pointless to compose a
comparison matrix, as the relative weight of the criterion ‘Product Portfolio’ equals one. The
global weight of the criterion is therefore equal to the weight assigned to its aspect, namly, 0.060.
Moreover, the CI and therefore also CR cannot be calculated for a matrix of the size 1x1 (Saaty,
2008).
9.4.9 Rating Mode In total, eight different candidates will be assessed. As Saaty (2008) recommends when there are
several candidates to assess, the rating mode is more appropriate than the relative model. Many
different ways to assign grades to subjectively assessed factors exist. As a result, it is often up to
the evaluator himself to choose which rating system that most properly fulfils the needs in order
to distinguish (Saaty, 2008). In this approach, the verbal ratings include, very high, high,
medium and low. For consistency and simplicity, the same verbal ratings will be used across the
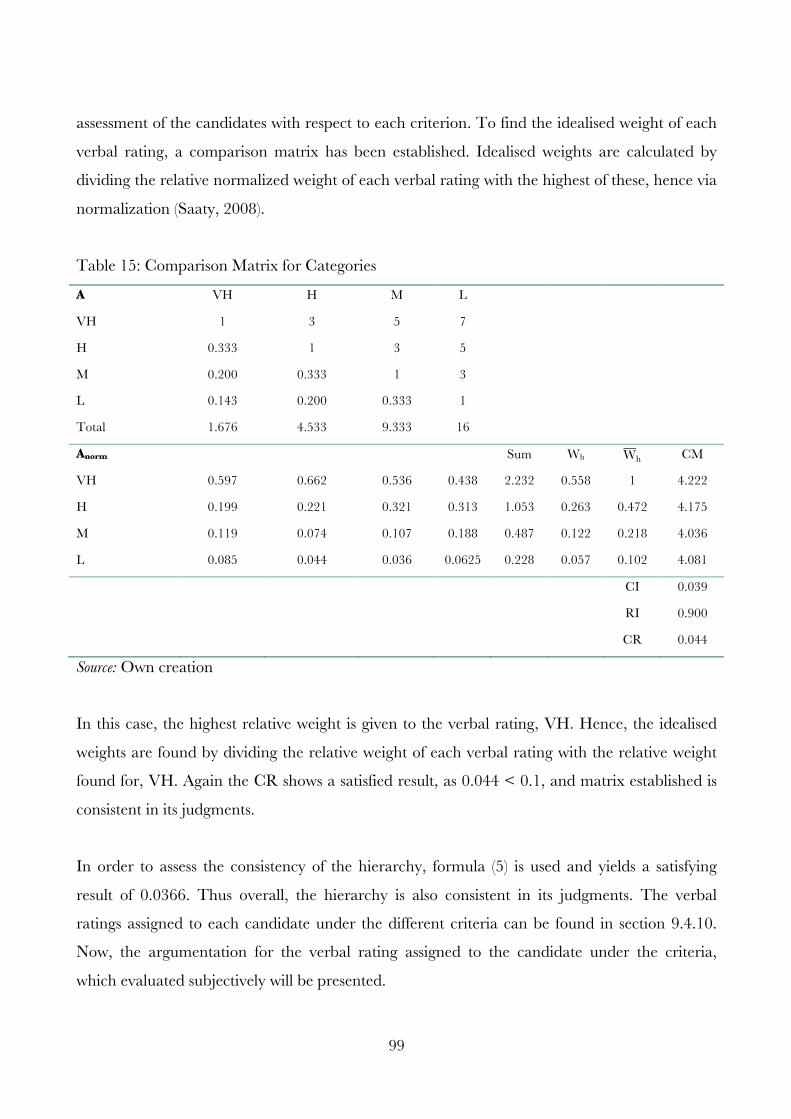
99
assessment of the candidates with respect to each criterion. To find the idealised weight of each
verbal rating, a comparison matrix has been established. Idealised weights are calculated by
dividing the relative normalized weight of each verbal rating with the highest of these, hence via
normalization (Saaty, 2008).
Table 15: Comparison Matrix for Categories
A VH H M L
VH 1 3 5 7
H 0.333 1 3 5
M 0.200 0.333 1 3
L 0.143 0.200 0.333 1
Total 1.676 4.533 9.333 16
Anorm Sum Wh Wh CM
VH 0.597 0.662 0.536 0.438 2.232 0.558 1 4.222
H 0.199 0.221 0.321 0.313 1.053 0.263 0.472 4.175
M 0.119 0.074 0.107 0.188 0.487 0.122 0.218 4.036
L 0.085 0.044 0.036 0.0625 0.228 0.057 0.102 4.081
CI 0.039
RI 0.900
CR 0.044
Source: Own creation
In this case, the highest relative weight is given to the verbal rating, VH. Hence, the idealised
weights are found by dividing the relative weight of each verbal rating with the relative weight
found for, VH. Again the CR shows a satisfied result, as 0.044 < 0.1, and matrix established is
consistent in its judgments.
In order to assess the consistency of the hierarchy, formula (5) is used and yields a satisfying
result of 0.0366. Thus overall, the hierarchy is also consistent in its judgments. The verbal
ratings assigned to each candidate under the different criteria can be found in section 9.4.10.
Now, the argumentation for the verbal rating assigned to the candidate under the criteria,
which evaluated subjectively will be presented.
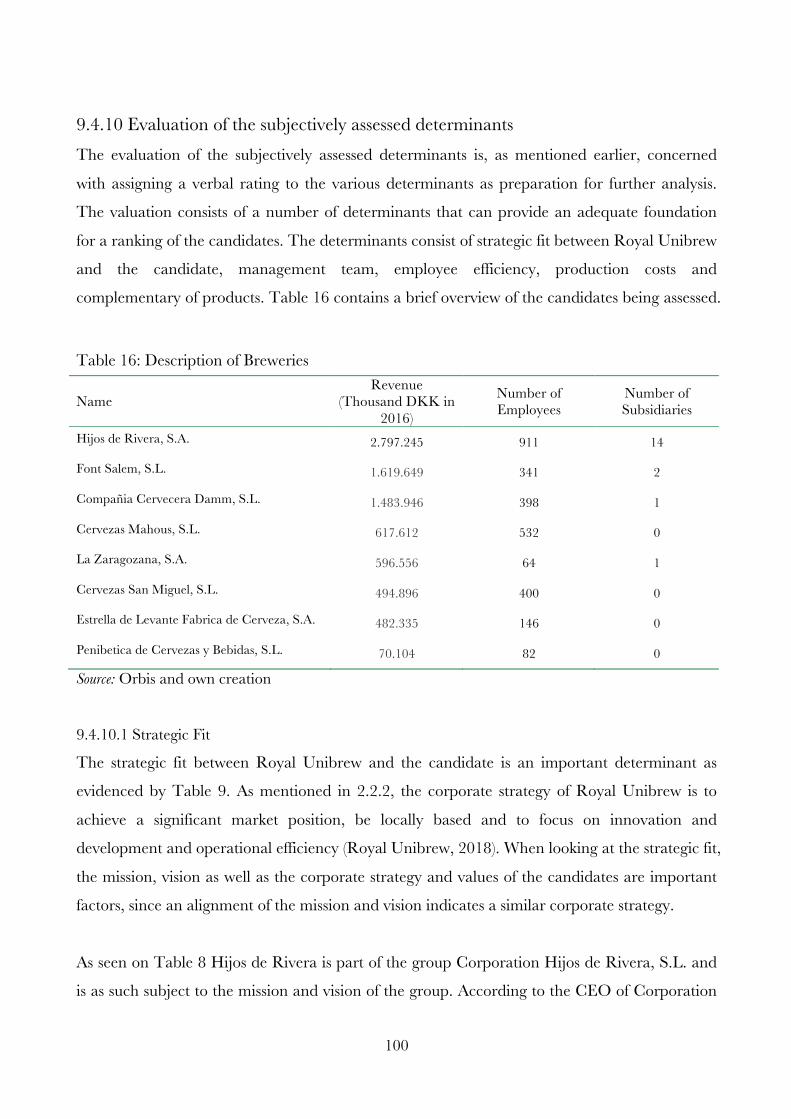
100
9.4.10 Evaluation of the subjectively assessed determinants The evaluation of the subjectively assessed determinants is, as mentioned earlier, concerned
with assigning a verbal rating to the various determinants as preparation for further analysis.
The valuation consists of a number of determinants that can provide an adequate foundation
for a ranking of the candidates. The determinants consist of strategic fit between Royal Unibrew
and the candidate, management team, employee efficiency, production costs and
complementary of products. Table 16 contains a brief overview of the candidates being assessed.
Table 16: Description of Breweries
Name Revenue
(Thousand DKK in 2016)
Number of Employees
Number of Subsidiaries
Hijos de Rivera, S.A. 2.797.245 911 14
Font Salem, S.L. 1.619.649 341 2
Compañia Cervecera Damm, S.L. 1.483.946 398 1
Cervezas Mahous, S.L. 617.612 532 0
La Zaragozana, S.A. 596.556 64 1
Cervezas San Miguel, S.L. 494.896 400 0
Estrella de Levante Fabrica de Cerveza, S.A. 482.335 146 0
Penibetica de Cervezas y Bebidas, S.L. 70.104 82 0
Source: Orbis and own creation
9.4.10.1 Strategic Fit
The strategic fit between Royal Unibrew and the candidate is an important determinant as
evidenced by Table 9. As mentioned in 2.2.2, the corporate strategy of Royal Unibrew is to
achieve a significant market position, be locally based and to focus on innovation and
development and operational efficiency (Royal Unibrew, 2018). When looking at the strategic fit,
the mission, vision as well as the corporate strategy and values of the candidates are important
factors, since an alignment of the mission and vision indicates a similar corporate strategy.
As seen on Table 8 Hijos de Rivera is part of the group Corporation Hijos de Rivera, S.L. and
is as such subject to the mission and vision of the group. According to the CEO of Corporation
101
Hijos de Rivera, S.L. their strategy and vision of the company is to be premium and
differentiated from their competitors (Rivera, 2015). They strive to differentiate from the
competitors by creating premium beer and communicating differently (Rivera, 2015).
Furthermore, Hijos de Rivera has worked intensively on national distribution prior to 2015 and
later been implementing international expansion into the pipeline with subsidiaries in Brazil, the
United States, China, Japan etc. (Rivera, 2015). The corporate strategy of Hijos de Rivera
aligns to as certain extent with Royal Unibrew’s strategy about achieving a significant market
position and operational efficiency (Royal Unibrew, 2018). However, being locally based is an
important strategy of Royal Unibrew, especially when it comes to an international expansion,
and with Hijos de Rivera focusing more on international expansion themselves, the exploitation
of the location advantages of Spain is not a priority. The strategic fit between the two
companies is classified as medium (M).
Font Salem, S.L., Compañia Cervecera Damm, S.L. and Estrelle de Levante Fabrica de
Cerveza S.L. belong to Sociedad Anomia Damm as evidenced by Table 8. The mission of
Sociedad Anomia Damm is to reach satisfaction from consumers, customers, shareholders and
partners as well as being competitive and financially successful (Group Damm, 2015).
Furthermore, the vision of the group is to be the leading national corporation manufacturing
and distributing beer in Spain and internationally with technological efficiency, and respect for
the environment and the applying laws (Group Damm, 2015). Lastly, the values of the group
are engagement, innovation, creativity, cooperation and social responsibility (Group Damm,
2015).
The mission, vision and values of Sociedad Anomia Damm are therefore very similar to the
strategic goals of Royal Unibrew. Even though Sociedad Anomia Damm is focusing on their
domestic presence, the national success is an important goal as well, which corresponds with
Royal Unibrew’s strategy of being locally based. This way, the exploitation of the location
advantages for Spain is a priority and a good opportunity for Royal Unibrew and corresponds
to the internationalisation advantages, discussed in section 7.3, as well. Given the similarity
between the goals, the strategic fit between Sociedad Anomia Damm and Royal Unibrew can
be classified as very high (VH).
102
Cervezas Mahous, S.L, Cervezas San Miguel, S.L. and Penibetica de Cervezas y Bebidas, S.L.
belong to the Mahou, S.A. group as evidenced by Table 8. The mission of Mahou, S.A. is to
make their brands form part of the best moments in their customers’ day, whereas their vision is
to be an independent brewer recognised for leading the category in the Spanish market, a solid
international presence, brewing top quality as well as top quality marketing and generate
sustainable value (Mahou-San Miguel, 2018). This mission and vision align with Royal
Unibrew’s strategy of having a significant market position as well as being operational efficient.
However, the breweries belonging to the Mahou, S.A group have an international presence as
well (Mahou-San Miguel, 2018). Being locally based in Spain is therefore more difficult given
the needed attention to international operations and the exploitation of the location advantages
are not fully exploited. The strategic fit between the candidates belonging to Mahoua, S.A. can
however be classified as high (H).
La Zaragozana belongs to the group Agora, S.A. as can be seen by Table 8. The mission, vision
and values of the groups are to achieve independence (Grupo Agora, 2018). According to
Grupo Agora (2018) 30% of the beers produced in Spain are produced by a large multinational
corporation. However, Grupo Agora is committed to local preferences and tradition. Despite
being one of the oldest breweries in Spain, they are still one of the smallest due to the fact that
they make the products they want to and not what the market dictates (Grupo Agora, 2018).
Moreover, quality and passion are of great importance to the group as well.
The goal of Agora, S.A. of being locally based and adapting to local taste are very important fits
for Royal Unibrew. However, by committing so much to being locally bound and ignoring the
industry trends, the group is not living up to its full potential regarding financial and market
positions. Furthermore, not paying attention to what the market dictates shows inadequate
innovation and development. The location advantages of Spain can thereby be fully exploited,
however, the internationalization advantages for Royal Unibrew might not be. Advantages such
as partnership and brands might not be fully exploited either. This way, despite Royal
Unibrew’s opportunity of being locally based, the remaining strategic fit between Royal
Unibrew and Agora, S.A. is classified low (L).
103
9.4.10.2 Employees and Management Team
The profit per employee of Hijos de Rivera in 2016 is 2,797,245 thousand DKK and operating
revenue per employee is 5,359 thousand DKK. Both numbers have been relatively steady since
2012 despite the fact that the number of employees has been increasing. Prior to 2012 these
numbers have been increasing (Appendix 6). Furthermore, the cost of employees is 9.36% of
the operating revenue with an average cost per employee of 502 thousand DKK, and, as
evidenced by Appendix 6, the costs of employees have been declining since 2012. Hijos de
Rivera got a new Managing Director in 2012 where Ignacio Rivera Quintana took the position
(Appendix 6). Even though the profit per employee and operating revenue per employee have
been at a steady stage since Quintana became Managing Director, the operating revenue has
been increasing every year (Appendix 6). Included in the management team is Human
Resources Director Paul Tran since 2016 and Marketing Director Jose Cabanas since 2015.
However, even though the operating revenue increased from 2015 to 2016, it is difficult to draw
any conclusions related to Tran and Cabanas due to the short period of time of employment.
The above is evidence that the human resources of Hijos de Rivera are exploited well and
provides Royal Unibrew with an opportunity to better exploit the internationalization
advantages associated with their own human resources. The employees of Hijos de Rivera, S.A.
can thereby be classified as high (H).
Font Salem, S.L. has experienced an increasing profit per employee from 2009 to 2016 despite
the fact that the number of employees has decreased during the same period of time. The
operating revenue has not had the same steady increase, which was at its highest in 2012 and
2013 (Appendix 7). The costs of employees as a percentage of the operating revenue have been
declining since 2013, as well as the total average cost per employee has been declining in the
same period (Appendix 7). Font Salem got a new General Manager in 2015 and was hired after
the operating revenue had decreased for 4 years in a row (Appendix 7). From 2015 to 2016
Font Salem has experienced a small increase in operating revenue. However, it is difficult to
determine the classification of the management team of Font Salem, S.A. due to the limited
time of employment. This resource is well exploited and provides a foundation for
internationalization advantages of Royal Unibrew to be exploited as well. The classification of
the employees is evaluated to be high (H).
104
The profit per employee of Compañia Cervecera Damm, S.L. has decreased since 2013 and is
at 362 thousand DKK in 2016 and operating revenue 1,483,946 thousand DKK in 2016
(Appendix 8). Compañia Cervecera Damm, S.L. has not been able to increase or maintain the
efficiency of their employees despite the fact that the number of employees has decreased during
the same period of time. The costs of employees in 2016 was 11.42% of the operating revenue
and has been decreasing since 2013, as well as the average cost per employee has been
decreasing during the same period of time and is at 426 thousand DKK in 2016 (Appendix 8).
The management team consists of Jorge Villavecchia Barnach Calbo who took the position of
General Manager in 2017 and Jaume Alemanv who took the position of Marketing Director in
2017 (Appendix 8). Given the difficulties with maintaining the efficiency of their employees it
might be more difficult for Royal Unibrew to exploit internationalization advantages associated
with human resources. The employees of Compañia Cervecera Damm, S.L. are thereby
classified as medium (M).
Cervezas Mahous, S.L. has experienced a drastically declining profit per employee. Although
data only being available back to 2014, the profit per employee has declined by 63% and is at
104 thousand DKK (Appendix 9). Similarly, the operating revenue per employee has been
declining from 3,324 thousand DKK to 1,161 thousand DKK despite having the same number
of employees and the same costs of employees around 55% of the operating revenue (Appendix
9). However, the profit per employee has decreased drastically from 2014 to 2015 from 338
thousand DKK to 104 thousand DKK (Appendix 9). Due to insufficient data it is difficult to
evaluate the management team of Cervezas Mahou, S.L. The employees are thereby classified
as low (L).
The profit per employee of La Zaragozana, S.A. has been at a somewhat steady stage since
2006 around 496 thousand DKK and is at 873 thousand DKK in 2016. However, the
operating revenue per employee has been decreasing during the same period of time and is
9,321 thousand DKK in 2016 (Appendix 10), which indicates an increase in total costs. The
costs of employees have been decreasing since 2006 from 14.45% of the operating revenue in
2006 to 10.40% in 2016. However, the average cost per employee has increased since 2006
from 379 thousand DKK to 417 thousand DKK in 2016 (Appendix 10). La Zaragozana has 3
105
General Managers where Jonathan Stordy took the position in 2017, however, Jorge Roehrich
Saporta took the position in 2010 and Fleix Santiago Longas took the position in 2014
(Appendix 10). The Financial Manager Juan Jose Sanz Perez took the position in 2005 and
Marketing Director Enrique Torquet took his position in 2007, and La Zaragozana has
experienced an increase in operating revenue since (Appendix 10). Given the decrease in profit
per employee and increase in average cost per employee it might be a challenge for Royal
Unibrew to exploit the internationalization advantages associated with human resources. The
employees of La Zaragozana can thereby be classified as medium (M).
Despite data only being available back to 2014 Cervezas San Miguel, S.L. has experienced a
decrease in the profit per employee, especially from 2014 to 2015 with a decrease of 65% and a
loss of 108 employees (Appendix 11). During that period of time the operating revenue per
employee decreased a lot as well. However the costs of employees have been steady around
45% of the operating revenue (Appendix 11). Similarly, the average cost per employee is
declining as well from 2014 to 2015 and is 569 thousand DKK in 2016 (Appendix 11). Due to
insufficient data it is difficult to evaluate the management team of Cervezas Mahou, S.L.. Given
the large decrease in profit per employee it might too be a challenge for Royal Unibrew to
exploit the internationalization advantages associated with human resources. The employees
are thereby classified as low (L).
The profit per employee of Estrella de Levante Fabrica Cerveza, S.A. is 275 thousand DKK in
2016 and has been increasing since 2007. The profit per employee is at its peak along with 2013,
which is quite good since the number of employees has decreased since 2007 (Appendix 12).
The operating revenue per employee has been increasing during the period of time and is 3,304
thousand DKK in 2016. The efficiency of the employees has thereby increased during that
period of time and is now at its highest. Especially the costs of employees measured in
percentage of operating revenue have been decreasing since 2007, as well as the average cost
per employee has been decreasing (Appendix 12). Estrella de Levante Fabrica Cerveza, S.A. has
a management team consisting of a General Manager Patricio Valverde Esnin since 2006,
Financial Manager Pau Furriol Fornelis since 2006, Commerciel Director Xaviar Pladellorens
since 2006 and Production Director Carlos Gomez since 21208. The remaining management
106
team took the position after 2015 (Appendix 12). Given the increasing profit per employee with
a decreasing number of employ12es since 2007 and increasing operational revenue since 2007
(Appendix 12), it provides a foundation for internationalization advantages of Royal Unibrew to
be exploited as well. The employees of Estrella de Levante Fabrica Cerveza, S.A can thereby
be classified as very high (VH).
Penibetica de Cervezas y Bedibas, S.L. has experienced high volatility in the profit per
employee since 2007, however, it is quite low in 2016 at 65 thousand DKK compared to
previous years. The number of employees is practically unchanged since 2007 (Appendix 13).
The operating revenue per employee has varied as well since 2007, however, decreased during
the last 4 years and is at 855 thousand DKK in 2016. Even though the operating revenue has
decreased the last few years, the costs of employees has increased substantially and is 42.32% of
the operating revenue in 2016, which is fairly high compared to 13.88% of the operating
revenue in 2013 (Appendix 13). The average cost per employee has been fairly steady around
350 thousand DKK since 2007. Due to insufficient data it is difficult to evaluate the
management team of Cervezas Mahou, S.L.. It might prove to be a challenge for Royal
Unibrew to exploit the internationalization advantages and the employees are thereby classified
as medium (M).
9.4.10.3 Product Portfolio
The product portfolio of the candidates gives an indication of how Royal Unibrew can enter the
Spanish market. The more diverse the product portfolio is, the better the chances of penetrating
the market.
Hijos de Rivera, S.A. focuses primarily on a few beers that can be classified as lager, specialty
beers and non-alcoholic (Hijos de Rivera, 2018). This product portfolio is very limited, since
there are no pilsners, ales or other beer types. Furthermore, the number of beers is very limited
with Estrella Galcia and 1906 Reserva Especial being the top products (Hijos de Rivera).
Although, a plausible trend of specialty beers (Bason, 2018) speaks positively to the product
portfolio, the classification of the product portfolio is low (L). More impressive is the product
portfolio of Font Salem, S.A. with pilsners, such as Cintra, a variety of lagers, such as Prima and
107
Tagus and specialty beers (Font Salem, 2018). However, no non-alcoholic beers is considered
negative given the trend of more focus on health, as mentioned in section 5.1.3. This leads to a
classification of the product portfolio of medium (M).
Compañia Cervecera Damm, S.A. operates with an impressive product portfolio with lagers,
such as Daura and Voll-Damm, and non-alcoholic beer (Compañia Cervecera Damm, 2018).
Furthermore, the product portfolio consists of the wheat beer Inedit and a Damm Lemon,
which belongs to the Shandy category (Compañia Cervecera Damm, 2018). Given the diverse
product portfolio, Compañia Cervecera Damm, S.A. can react to various trends in the Spanish
market. This leads to a classification of the product portfolio as high (H). Cevzas Mahou, S.L.
has a product portfolio with limited brands. Mahou beer, however, comes in many variants
such as pilsner, lager, non-alcoholic, specialty and as fruit beer (Cervezas Mahou, 2018). Besides
this, Barrica belongs in the product portfolio and is a stout beer (Cervezas Mahou, 2018).
Cevzas Mahou, S.L. are thus prepared for meeting the current trends within the Spanish beer
market. Given the large variety of beer, but limited variety of brands, the classification of the
product portfolio is high (H).
The product portfolio of La Zaragoza consists of the Ambar beer that comes in different
varieties such as special beer Ambar Especial, export, wheat Ambar Caesaraugusta, non-
alcoholic Ambar Manzana, fruit beer Ambar Radler and Ambar Lemon (La Zaragozana, 2018).
The limited selection of brands, but large variety of beer types, and therefore ability to meet
current trends, leads to a classification of the product portfolio as high (H). The product
portfolio of Cervezas San Miguel, S.A. is more diversified with San Miguel brand in a large
variety such as specialty beer 1516, non-alcoholic, gluten free and pilsner. Moreover, san
Miguel offers an ecological beer San Miguel Eco committed to the environment by containing
ecologically grown malt and hops. As part of the portfolio are lager Selecta and Shandy (San
Miguel, 2018). With the entire product portfolio, especially gluten free beer, the product
portfolio leads to a classification of the product portfolio as very high (VH), given the trend of
more focus on health.
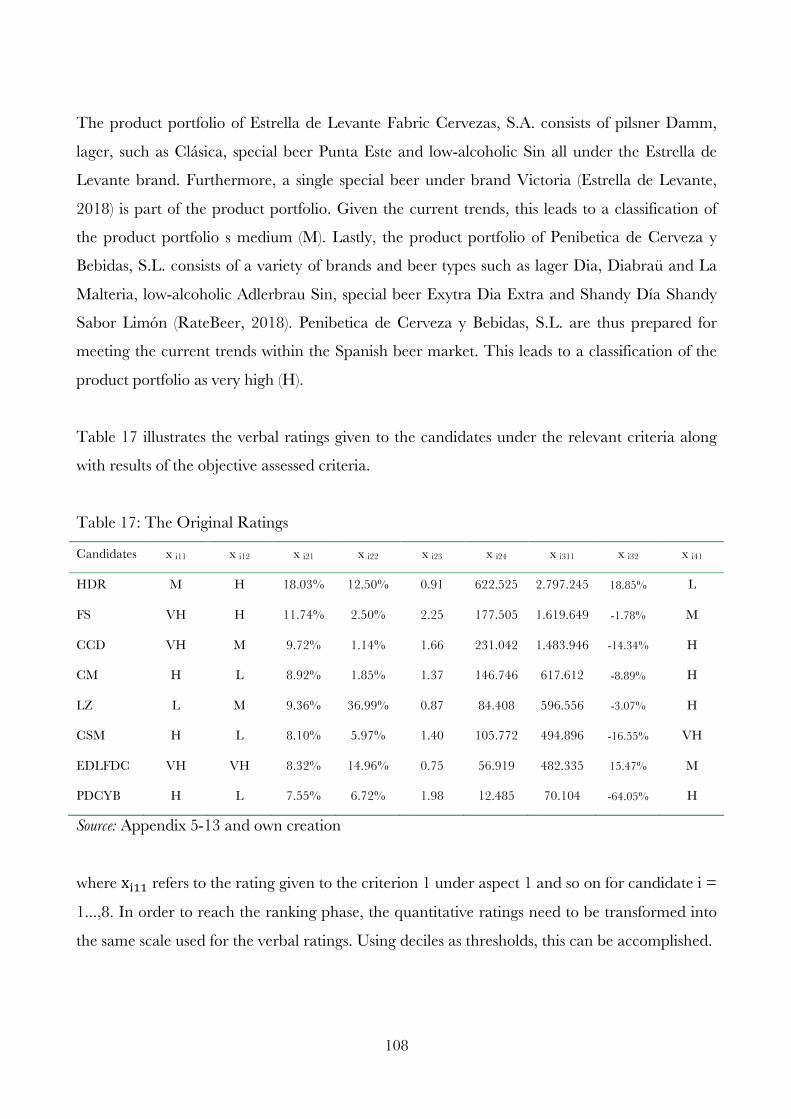
108
The product portfolio of Estrella de Levante Fabric Cervezas, S.A. consists of pilsner Damm,
lager, such as Clásica, special beer Punta Este and low-alcoholic Sin all under the Estrella de
Levante brand. Furthermore, a single special beer under brand Victoria (Estrella de Levante,
2018) is part of the product portfolio. Given the current trends, this leads to a classification of
the product portfolio s medium (M). Lastly, the product portfolio of Penibetica de Cerveza y
Bebidas, S.L. consists of a variety of brands and beer types such as lager Dia, Diabraü and La
Malteria, low-alcoholic Adlerbrau Sin, special beer Exytra Dia Extra and Shandy Día Shandy
Sabor Limón (RateBeer, 2018). Penibetica de Cerveza y Bebidas, S.L. are thus prepared for
meeting the current trends within the Spanish beer market. This leads to a classification of the
product portfolio as very high (H).
Table 17 illustrates the verbal ratings given to the candidates under the relevant criteria along
with results of the objective assessed criteria.
Table 17: The Original Ratings
Candidates x i11 x i12 x i21 x i22 x i23 x i24 x i311 x i32 x i41
HDR M H 18.03% 12.50% 0.91 622.525 2.797.245 18.85% L
FS VH H 11.74% 2.50% 2.25 177.505 1.619.649 -1.78% M
CCD VH M 9.72% 1.14% 1.66 231.042 1.483.946 -14.34% H
CM H L 8.92% 1.85% 1.37 146.746 617.612 -8.89% H
LZ L M 9.36% 36.99% 0.87 84.408 596.556 -3.07% H
CSM H L 8.10% 5.97% 1.40 105.772 494.896 -16.55% VH
EDLFDC VH VH 8.32% 14.96% 0.75 56.919 482.335 15.47% M
PDCYB H L 7.55% 6.72% 1.98 12.485 70.104 -64.05% H
Source: Appendix 5-13 and own creation
where x!"" refers to the rating given to the criterion 1 under aspect 1 and so on for candidate i =
1...,8. In order to reach the ranking phase, the quantitative ratings need to be transformed into
the same scale used for the verbal ratings. Using deciles as thresholds, this can be accomplished.
109
9.4.11 Decile Method – Transformation of Quantitative Numbers The quantitative ratings need to be aligned with the same scale as used for the verbal ratings.
Inspired by Tsao (2009), the quantitative ratings can be transformed using the Decile Method
(Newbold et al., 2013):
Di = l + hj iN10
– c, (14)
where l is the lower boundary of deciles group,i = 1…,9 represent the decile’s number, h is the
width of decile group, f is frequency of decile group, N is total number of observations and c is
the cumulative preceding decile group. The verbal ratings are cut at the second, fifth and eight
deciles, so that the bottom 20% belongs to L, between 20 - 50% belongs to M, between 50 –
80% belongs to H and the top 20% belongs to VH for a benefit and vice versa for a cost (Tsao,
2009):
xijk=
L, xijk ≤ D2,
M, D2 <xijk ≤D5,
H, D5 <xijk ≤ D8,
VH, xijk> D8,
xijk∈ B,
xijk=
VH, xijk ≤ 0.2,
H, 0,2 <xijk ≤0.5,
M, 0,5 <xijk ≤ 0.8,
L, xijk> 0.8,
xijk∈ C,
where the xijk is the transformed rating for candidate i under criterion k with respect to the jth
aspect, xijk is the original rating, L, M, H, VH represent the verbal ratings, Di denotes the
deciles. Benefit is marked with B and costs are marked with C (see Table 9 for classification, B
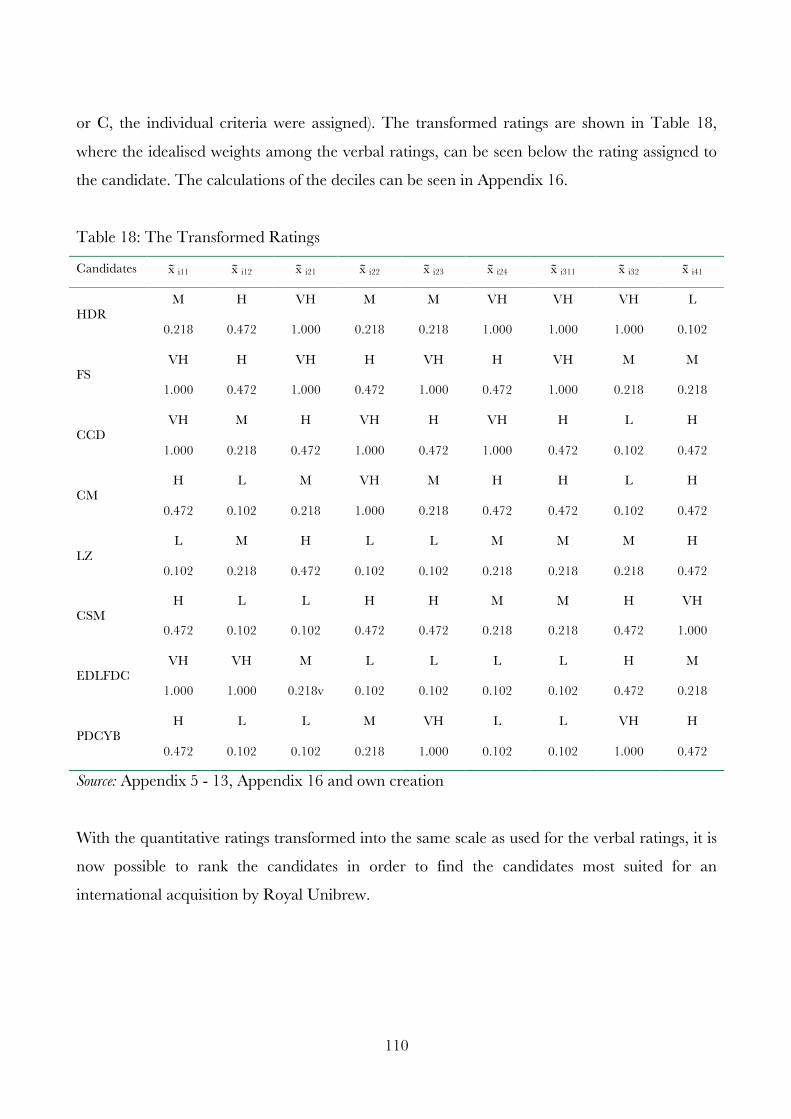
110
or C, the individual criteria were assigned). The transformed ratings are shown in Table 18,
where the idealised weights among the verbal ratings, can be seen below the rating assigned to
the candidate. The calculations of the deciles can be seen in Appendix 16.
Table 18: The Transformed Ratings
Candidates x i11 x i12 x i21 x i22 x i23 x i24 x i311 x i32 x i41
HDR M H VH M M VH VH VH L
0.218 0.472 1.000 0.218 0.218 1.000 1.000 1.000 0.102
FS VH H VH H VH H VH M M
1.000 0.472 1.000 0.472 1.000 0.472 1.000 0.218 0.218
CCD VH M H VH H VH H L H
1.000 0.218 0.472 1.000 0.472 1.000 0.472 0.102 0.472
CM H L M VH M H H L H
0.472 0.102 0.218 1.000 0.218 0.472 0.472 0.102 0.472
LZ L M H L L M M M H
0.102 0.218 0.472 0.102 0.102 0.218 0.218 0.218 0.472
CSM H L L H H M M H VH
0.472 0.102 0.102 0.472 0.472 0.218 0.218 0.472 1.000
EDLFDC VH VH M L L L L H M
1.000 1.000 0.218v 0.102 0.102 0.102 0.102 0.472 0.218
PDCYB H L L M VH L L VH H
0.472 0.102 0.102 0.218 1.000 0.102 0.102 1.000 0.472
Source: Appendix 5 - 13, Appendix 16 and own creation
With the quantitative ratings transformed into the same scale as used for the verbal ratings, it is
now possible to rank the candidates in order to find the candidates most suited for an
international acquisition by Royal Unibrew.
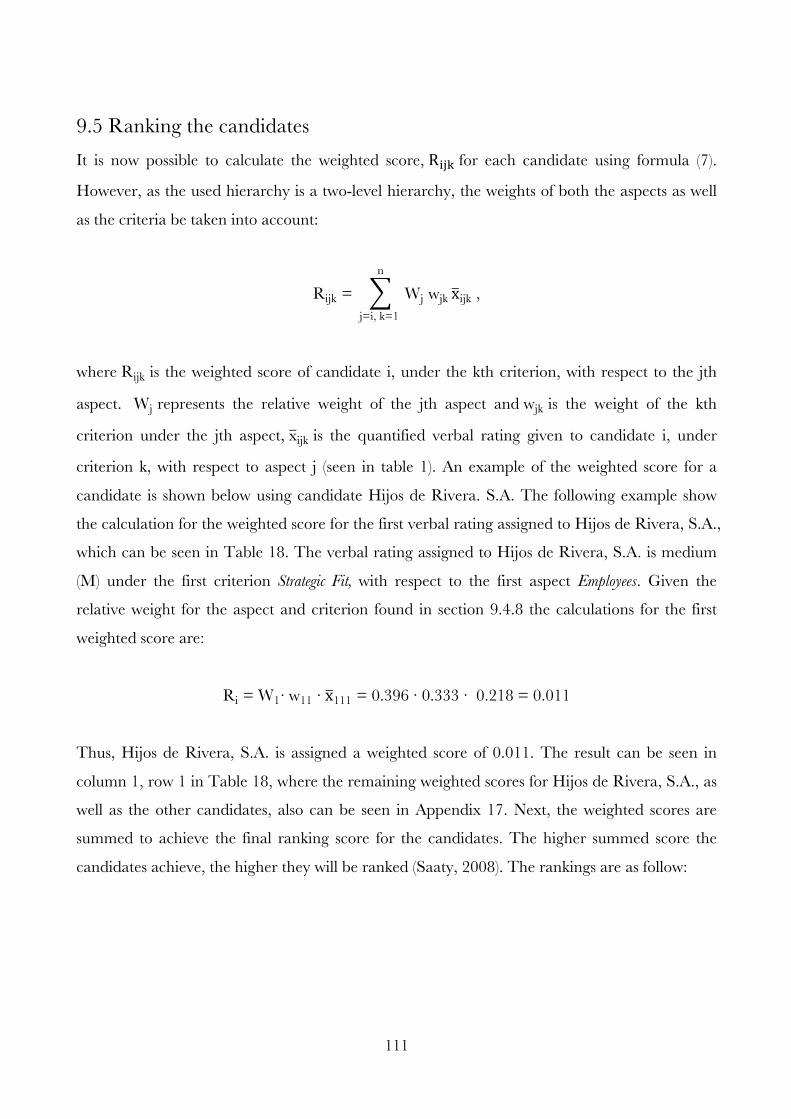
111
9.5 Ranking the candidates It is now possible to calculate the weighted score, R!"# for each candidate using formula (7).
However, as the used hierarchy is a two-level hierarchy, the weights of both the aspects as well
as the criteria be taken into account:
Rijk = Wj wjk
n
j=i, k=1
xijk ,
where Rijk is the weighted score of candidate i, under the kth criterion, with respect to the jth
aspect. Wj represents the relative weight of the jth aspect and wjk is the weight of the kth
criterion under the jth aspect, xijk is the quantified verbal rating given to candidate i, under
criterion k, with respect to aspect j (seen in table 1). An example of the weighted score for a
candidate is shown below using candidate Hijos de Rivera. S.A. The following example show
the calculation for the weighted score for the first verbal rating assigned to Hijos de Rivera, S.A.,
which can be seen in Table 18. The verbal rating assigned to Hijos de Rivera, S.A. is medium
(M) under the first criterion Strategic Fit, with respect to the first aspect Employees. Given the
relative weight for the aspect and criterion found in section 9.4.8 the calculations for the first
weighted score are:
Ri = W1⋅ w11 ⋅ x111 = 0.396 ∙ 0.333 ∙ 0.218 = 0.011
Thus, Hijos de Rivera, S.A. is assigned a weighted score of 0.011. The result can be seen in
column 1, row 1 in Table 18, where the remaining weighted scores for Hijos de Rivera, S.A., as
well as the other candidates, also can be seen in Appendix 17. Next, the weighted scores are
summed to achieve the final ranking score for the candidates. The higher summed score the
candidates achieve, the higher they will be ranked (Saaty, 2008). The rankings are as follow:
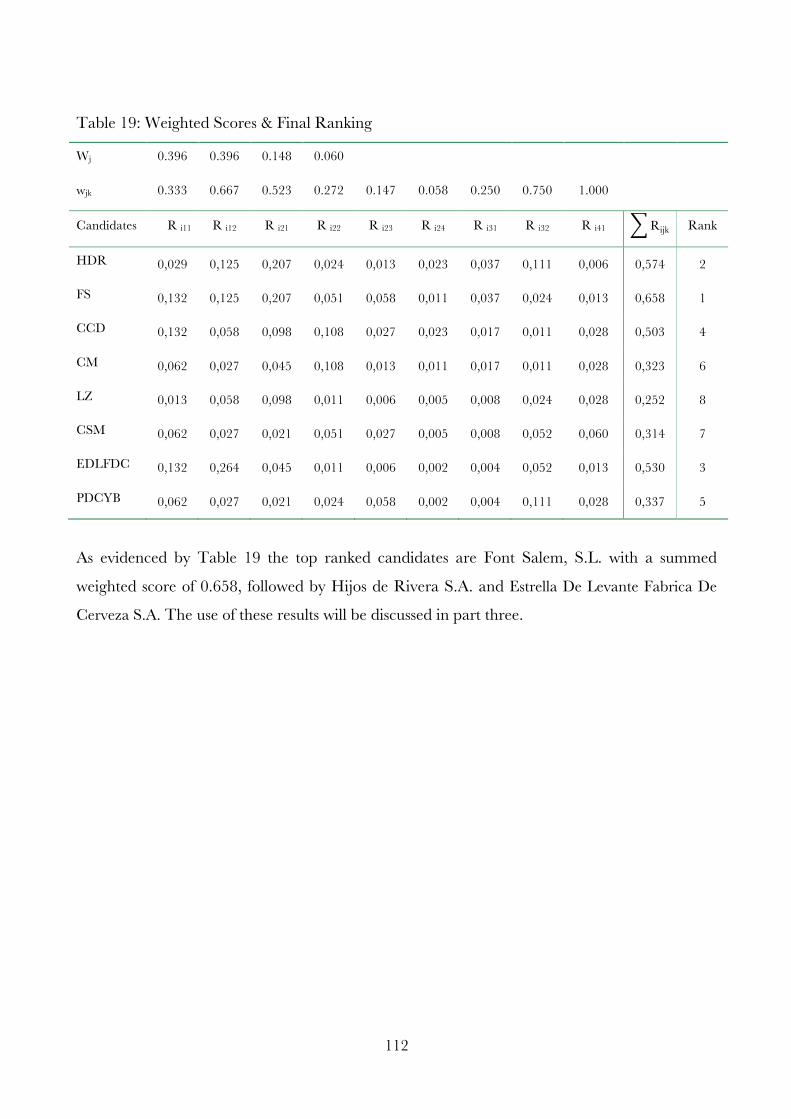
112
Table 19: Weighted Scores & Final Ranking
Wj 0.396 0.396 0.148 0.060
wjk 0.333 0.667 0.523 0.272 0.147 0.058 0.250 0.750 1.000
Candidates R i11 R i12 R i21 R i22 R i23 R i24 R i31 R i32 R i41 Rijk Rank
HDR 0,029 0,125 0,207 0,024 0,013 0,023 0,037 0,111 0,006 0,574 2
FS 0,132 0,125 0,207 0,051 0,058 0,011 0,037 0,024 0,013 0,658 1
CCD 0,132 0,058 0,098 0,108 0,027 0,023 0,017 0,011 0,028 0,503 4
CM 0,062 0,027 0,045 0,108 0,013 0,011 0,017 0,011 0,028 0,323 6
LZ 0,013 0,058 0,098 0,011 0,006 0,005 0,008 0,024 0,028 0,252 8
CSM 0,062 0,027 0,021 0,051 0,027 0,005 0,008 0,052 0,060 0,314 7
EDLFDC 0,132 0,264 0,045 0,011 0,006 0,002 0,004 0,052 0,013 0,530 3
PDCYB 0,062 0,027 0,021 0,024 0,058 0,002 0,004 0,111 0,028 0,337 5
As evidenced by Table 19 the top ranked candidates are Font Salem, S.L. with a summed
weighted score of 0.658, followed by Hijos de Rivera S.A. and Estrella De Levante Fabrica De
Cerveza S.A. The use of these results will be discussed in part three.
113
Part I I I Discussion and Conclusion
The third part of thesis contains a discussion, where results of the analysis, methods used for
finding the results and next steps for Royal Unibrew will be discussed. Furthermore, the third
part contains a conclusion where findings of the analysis and relevant points of the discussion
will be presented.
10. Discussion
In this section, the interpretation of the results gained in the analysis will be covered. Moreover, the
methods used to obtain the results will be discussed as well as the next steps for Royal Unibrew to
take.
9.1 Discussion of Results In the analysis of the different potential candidates, Font Salem, S.L. achieved the highest ranking
followed by Hijos de Rivera and Estrella De Levante Fabrica De Cerveza S.A. as illustrated in
Table 19. This result does not state that Royal Unibrew must acquire Font Salem, S.L. as the
ranking of the candidates only serves as an indication for the best suited candidate. Instead, a more
extensive research of the top candidates is required to find the candidate, which is the best fit for
Royal Unibrew (Tsao, 2009). This extensive research may include considerations regarding
transaction strategies, the transaction price based on a valuation of the candidate, potential
obstacles for the success of the transaction such as ownership structure, and more importantly, the
overall fit (Sudarsanam, 2003).
As Tsao (2013) finds in his research, the results of a method using an MCDM-approach depend on
the decision maker. This is due to the fact that many of the decisions lie on the evaluator’s
preference for ranking method, evaluation hierarchy, elements of criteria and so forth (Tsao, 2013).
However, applying this method to other research studies is possible as the frames established
provide a generalised method for assessing candidates. This means that others can follow the steps
114
and use them as a guideline. Moreover, having made subjective choices during the process enables
the evaluator to embellish the format of the result to the advantage of the evaluator, which
contributes to the results being much more intuitive and easy for the evaluator to interpret.
In the analysis, eight different candidates are evaluated using a two-level hierarchy including four
aspects with a total number of nine criteria. In constructing such a hierarchy, the guidelines
established are criticized for not being sufficient, and leaves the decision maker in a vague position
(Hartwich, 1999). A critique point of the hierarchy used in the analysis is that the product aspect
only contains one criterion, and thereby does not utilize the possibilities offered by AHP. However,
to keep consistency and simplicity in the calculations and in the hierarchy, this way of structuring
the product aspect was chosen.
Another determinant of the results is the chosen measure used to evaluate the criteria. For the
financial terms, different choices of the measurements used, may have changed the final outcome of
the ranking list. For example, the criterion of liquidity can also be measured by the quick ratio, cash
ratio, and cash conversion cycle (Petersen & Plenborg, 2012). Even though, the different kinds of
measurements all are supposed to measure the liquidity of the firm, the results may change the
verbal rating assigned to the candidate. The same applies to the profitability criterion as the
profitability of a firm can be measured by different margins such as the gross margin, operating
margin etc. Return on equity (ROE) and return on assets (ROA) are also alternative measures for
the profitability (Petersen & Plenborg, 2012). However, the measures used on this thesis of both the
liquidity and profitability are among the mostly used in this regard (Petersen & Plenborg, 2012).
When evaluating the strategic fit, the corporate structure of the candidate would also have been
important. The specific strategy for market entry, market penetration and vertical expansion could
be important to consider as well to further strengthen the understanding of strategic fit between
Royal Unibrew and the candidate (Hubbard, 2001). Employees and management team are
evaluated on their efficiency ratios. However, a deeper insight into the company culture would have
been beneficial as well. An insight in the company culture would help understand what it is that
drive the employees and motivates them to perform their best (Hall, 1992). Lastly, more information
regarding the product portfolio could be useful as well. For example, the sales numbers of certain
products could help gain an understanding of which products need the most attention in regards to
marketing or production changes.
115
In the due diligence process, the acquisitive firm creates an internal team. The internal team often
consists of several executives as well as technical professionals (Tsao, 2009). In the analysis, Simon
Andersson acts as an ‘internal team’ (see section 4.5 for the function of internal team) and as the
analysis also has taken his statements regarding the most important determinants for Royal
Unibrew into account, these may suffer from bias. More optimally, different opinions from
executives within Royal Unibrew could have been included in the development of the screening
criteria, evaluation hierarchy, and the comparison matrices.
The rating mode is used to evaluate the candidates instead of the relative model due to the fact that
the evaluation contained several candidates. However, when using the rating mode, the results are
less accurate (Saaty, 2008). Although, the results are very close to the ones that would have been
obtained using the relative model. In the analysis, the different measures used to evaluate the
criteria provided different scales. For example, the current ratio yields results in ratios, profit margin
is measured in percent, and the strategic fit is evaluated using verbal ratings. Saaty (2008) does not
provide any guidelines for aligning these scales, but instead, he uses different scales for each
criterion assessed. Using deciles as thresholds for transforming these measures into the verbal rating
scale provided simplicity and consistency in the analysis. However, when transforming quantitative
data into categorized data, as it is done via the decile method, information is often lost (Newbold et
al., 2013). Moreover, the results may contain bias and therefore may not give the correct picture of
the results provided by the transformation. Thus this method of transforming quantitative measures
into a subjectively determined verbal rating system establishes guidelines for the assessor to follow,
and therefore represents a way of generalizing the method of aligning the different scales often
obtained when using AHP.
The yielded results were achieved with matrices and the hierarchy as a whole is consistent in the
judgments used. However, the matrices rely heavily on subjective comparisons of the individual
aspects and criteria, making the results highly influenced by the important intensities assigned to the
elements in these matrices. The decision maker can conduct a sensitivity analysis to see how the
ranking results would have changed if the weights of the criteria and aspects vary. In this way, the
robustness of the results obtained in the analysis can be verified (Mu & Pereyra-Rojas, 2017). One of
the critique points of the AHP-approach is the one concerning rank reversal (Belton & Gear, 1983).
In order to further check the robustness of the results, one of the breweries could be removed or a
new one could be added. Hence, if the ranking order changed in a non-logical way, for example, if
116
a brewery removed ranked third and the brewery ranked second is after the removal ranked sixth),
rank reversal has occurred.
All of the final candidates are private companies. Privately-owned firms bring a difficult challenge in
regards to obtaining relevant information as mentioned in section 9.2.2. As a result, the criteria
which contain a subjective assessment are evaluated on limited data. The problem is addressed by
few other researchers in relation to mergers and acquisitions (Capron & Shen, 2007). In their studies,
they find that the lack of information creates a narrower search for the acquirer and as a result, the
valuation of the candidates’ assets may be misleading and therefore the risk of an overbid increases,
when being compared to listed firms. Also, Capron and Shen (2007) argue that the available
information on listed firms contributes to the assets already being valued for potential buyers by the
market. Hence, the opportunities for creating more value in a privately-owned firm are more
common versus listed firms (Capron & Shen, 2007). Koeplin et al. (2000) also support this view and
elaborate that due to the lack of information and the illiquidity of a privately-owned firm,
investment bankers often use a discounted price for the private companies versus its listed peers. As
all the breweries on the candidate list are private breweries, Royal Unibrew should focus on this
issue, when negotiating the price of one of the candidates.
9.2 The Next Steps for Royal Unibrew If Royal Unibrew chooses to move forward, the transaction can take place when the terms have
been agreed upon. When the transaction has been completed, the last phase is to be initiated,
namely the post-acquisition phase (Collins et al., 2009). The main focus for the acquirer is now to
achieve the established motives for doing the transaction, which may include increasing shareholder
value, expanding markets, and utilization of synergies between the acquirer and the acquired firm
(Harvey & Lusch, 1998). As the motivation for Royal Unibrew was to create more value for the
shareholders along with increasing market size and exploiting the existing synergies cf. section 9.1
this will be the key focus areas. The post-acquisition phase concerns primarily the integration of the
acquirers IS-systems, strategy etc. (Collins et al., 2009). The integration team is in charge and
consists primarily of the internal team established prior to the acquisition. One of the key issues
related to this phase includes the fact that the due diligence, taking place before the transaction has
been completed, often only reveals the ‘top of the iceberg’ (Posnock, 2002). Hence, the target’s

117
actual condition and whether the condition is worse than anticipated, will be revealed in this phase
and this is often a major challenge to the integration team (Posnock, 2002).
As mention in section 4.5 mergers and acquisitions destroy shareholder value more often than they
create value. In order to obtain the goal of creating shareholder value, Royal Unibrew must be able
utilize the success giving determinants. As Royal Unibrew has completed several acquisitions and
mergers in the past, the probability of the next one being successful is relatively high, as prior
experience in doing acquisitions contributes positively to the success rate (Duncan & Mtar, 2006).
118
11. Conclusion
Royal Unibrew has established themselves as an international player through the last two decades
and has experienced growth as a result of international acquisitions. The acquisitions have
expanded the markets of Royal Unibrew to include Finland, Italy, Baltics and led to strong positions
in these markets. In order to further expand their activities, Spain is of special interest to Royal
Unibrew. This is due to Spain is being the fourth largest producer of beer and has an overall
consumption of beer ranked third highest in Europe. This way, Spain is an attractive choice for an
international expansion.
Royal Unibrew holds ownership advantages, since many of their resources have the competitive
implication of both temporary and sustained competitive advantage. Human resources,
collaboration with renowned brew master Kissmeyer, brands, partnerships and financial resources
all have a sustained competitive advantage, where breweries and yeast strains have a temporary
advantage. Human resources provide the most important resource according to Royal Unibrew
themselves, and thereby the biggest ownership advantages as well. There are also several location
advantages of Spain, where parameters as tourism, agriculture, FDI attraction, demographics and
market trends, can help Royal Unibrew to overcome the liability of outsidership. Spain thereby
holds certain advantages that Royal Unibrew would not be able to obtain in the home market. Thus,
a strategic fit exist between Royal Unibrew and Spain.
Given both ownership advantages of Royal Unibrew and location advantages of Spain the
internalization advantages associated with such an international expansion are present as well. For
example, human resources, yeast strains, Kissmeyer collaboration, Heineken partnership, brand
knowledge and financial resources all provide internationalization advantages. Since the motive of
Royal Unibrew can be considered market seeking, most of the resources of Royal Unibrew are
better exploited using FDI compared with export, licensing and outsourcing. By performing an FDI
over licensing Royal Unibrew would be locally based, which is part of the overall strategy.
Furthermore, by performing licensing, Royal Unibrew would lack direct management and might
experience difficulties in the transfer of knowledge meaning that the transfer of activities therefore is
more suited. Lastly, by engaging in outsourcing, Royal Unibrew would not be locally based either,
resources would not be exploited and the end product might risk being incorrect or the service
119
provider might sell the same product to competitors. FDI is thereby the entry mode of choice in
regards to an international expansion to Spain.
It is important to distinguish between the methods of FDI. Given the history of Royal Unibrew with
several mergers and acquisitions behind them, this appears to be the most optimal entry strategy.
This entry strategy is in line with strategic goals of Royal Unibrew and internationalization
advantages can be fully exploited. A due diligence process is therefore necessary to determine
exactly which candidates that will be of interest for Royal Unibrew.
The M&A process consists of two overall phases; the pre-acquisition and the post-acquisition phase.
First the motivation for acquiring another firm must be stressed. Royal Unibrew’s motivation
behind doing M&A is to penetrate the Spanish market, to increase the value for their shareholders
and provide further growth to the business. Based on several search criteria, numerous potential
candidates were found. However, due to lack of relevant data and information on some of the
candidates, the number decreased remarkably. Unattractive candidates were excluded based on
screening criteria, in order to further narrow the number of candidates down to a manageable size.
This process decreased the number of candidate down to eight attractive candidates.
The AHP approach was used in order to establish relevant evaluation hierarchy to assess and find
the most attractive candidate out of the final ones. The evaluation hierarchy established contained
four different aspects and nine individual criteria. Both the criteria and the aspects were found on
the basis of relevant determinants for a successful acquisition. Since the analysis contained several
candidates, it was found that the rating mode was more appropriate to use than the relative model
even though the relative model yields more precise results. As a result, the candidates were assigned
a verbal rating under the subjectively assessed criteria, using a scale consisting of very high, high,
medium and low.
In the pair-wise comparisons of the aspects, the financial aspect as well as the management aspect
was found to have the highest relative weights. As a result, the criteria within these aspects were
weighted higher than the ones in the marketing and product aspects. Thereby, the ratings assigned
to the candidates under these criteria have comparably less influence on the final score. The
consistency of each comparison matrix used yielded satisfying results, and therefore indicated that
the judgments used to compare each of the criteria and the aspects were consistent. Moreover, the
120
overall hierarchy’s consistency ratio was also below the recommended threshold. Hence, the
combined judgments in hierarchy can be classified as consistent.
The AHP approach contains many subjective decisions in order to reach the final result. Therefore,
the robustness of the results can be discussed. However, the AHP-approach is a great tool for
ranking candidates in an M&A setting as the decision maker can assign weights to each aspect and
criterion. Hereby, a more nuanced picture of the results can be obtained. Moreover, as with the
analysis carried out in this thesis, evaluation of candidates contains both subjective and objective
criteria, which can easily be done with AHP and with the modification proposed in this thesis.
A modification of the AHP-approach was used in order to establish simplicity and consistency when
rating the candidates under each criterion. Firstly, the same scale was used when the criteria should
be subjectively assessed were evaluated. Next, the objectively assessed criteria yielded results in
scales which where individually different from each other as well as from the scale of the verbal
ratings. In order to align all the scales, deciles were used as thresholds to assign a corresponding
verbal rating to the different measures.
With all the ratings aligned into the same scale, the final rankings were obtainable. The final
rankings showed that Font de Salem S.L., followed by Hijos de Rivera, S.A. and Estrella de Levante
Fabrica de Cerverza, S.A. were the top candidates. However, before the final transaction, Royal
Unibrew must carry out a more extensive research of each of the top candidate in order to find the
best match.
121
12. List of References
Adler, N., Friedmann, L., Sinuany-Stern, Z. (2002). Review of Ranking Methods in the Data
Envelopment Analysis Context. European Journal of Operational Research, 140, 249–265.
Adler, R. W. (2000). Strategic investment decision appraisal techniques: The old and the new.
Business Horizons, 43(6), 15-22.
Ahammad, M. F. & Glaister, K. W. (2013). The pre-acquisition evaluation of target firms and cross
border acquisition performance. International Business Review, 22, 894-904.
Akio, T. (2005). The critical assessment of the ressouce-based view of strategic management: the
source of heterogeneity of the firm. Ritsuumeikan Intrnational Affairs, 3, 125-149.
Aktouf, O. (2004). The false expectations of Michael Porter's strategic management framework.
Revista Universidad & Empresa, 6(6), 9-4.
Amit R. & Schoemaker P. J. H. (1993). Strategic assets and organizational rent. Stratetic Management.
Journal, 14(1), 33-46.
Angwin, D. (2001). Mergers and acquisitions across European borders: National perspectives on
pre-acquisition due diligence and the use of professional advisors. Journal of World Business, 36(1), 32–
57.
Angwin, D., & Savill, B. (1997). Strategic perspectives on European cross-border acquisitions: A
view from top European executives. European Management Journal, 15(4), 423–435.
Arons, H. S. & Waalewijn, P. (1999). A knowledge base representing Porter’ Five Forces model.
Rotterdam, The Netherland, 1-6.
ATKearney (2013). M&A deal evaluation: Challengin Metrics Myths. ATKearny, Inc., 1-11.
122
Babatunde, D. O. &Adebasi, A. O. (2012). Strategic environmentl scanning and organization
performance in a competitive business environment. Economic Insights, 66(1).
Barney J. (1991). Firm resources and sustained competitive advantage. Journal of Management, 17, 99–
120.
Barney, J. B. (1997). Gaining and Sustaining Competitive Advantage. Don Mills, Ontario: Addison-Wesley
Publishing Company.
Belton V., Gear, A.E. (1983) On a shortcoming of Saaty’s method of analytic hierarchies. Omega,
11(3), 227–230.
Berechet, C. (2014). Legal and political environment in Spain. Civismo, 1-8.
Bertrand, O., & Zuniga, M. P. (2006). R&D and M&A: Are cross-border M&A different? An
investigation on OECD countries. International Journal of Industrial Organization, 24, 401–423.
Birkedal, K., Eljær, B., Nielsen, K., Sloth, K. (2014). Danmark har verdensrekord i bryggerier.
Danmarks Radio Nyheder. Retrieved from https://www.dr.dk/nyheder/indland/danmark-har-
verdensrekord-i-bryggerier
Bloomberg (2015). The Bloomberg Innovation Index. Bloomberg. Retrieved form
https://www.bloomberg.com/graphics/2015-innovative-countries/
Bloomberg (2018). Bloomberg Professional. Available at: Subscription Service (Accessed: 22 March
2018).
Brav, O. (2009). Access to Capital, Capital Structure, and the Funding of the Firm. Journal of
Finance, 64(1), 263-308.
Boatwright, P., Cagan, J., Kapur, D., & Saltiel, A. (2009). A step-by-sted process to build valued
brands. Journal of Product and Brand Management, 18(1), 38-49.
123
Brewers of Europe (2017). Beer statistics – 2017 edition. Retrieved from
https://www.brewersofeurope.org/uploads/mycmsfiles/documents/publications/2017/Statistics-
201712-001.pdf
Bruner R.F. (2004). Where M&A pays and where it strays: a survey of research. J Appl Corp Finance,
16(4), 63–76.
Buisán, M. (2013). Innovation and technology in Spain. Consejero Económico Y Comercial – Officina
Económica Y Comercial De La Embajada De España En Miami, 1-18.
Burkart M. & Panunzi F (2006). Takeovers. Working Paper no. 118, European Corporate Governance
Institute.
Bhushan, Navneet, & Rai, Kanwal. (2003). Strategic decision making: Applying the analytic hierarchy process.
England: Springer-Verlag UK.
Berlignske Business (2015). Carlsberg direktør: Så meget vokser markedet for specialøl, Berlingske
tidende. Retrieved from https://www.business.dk/foedevarer/
Berlingske Business (2017). Danskerne skifter og søger job som aldrig før. Berlingske tidende. Retrieved
from https://www.business.dk/karriere/danskerne-skifter-og-soeger-job-som-aldrig-foer
Butler, K. C. (2016). Multinational Finance – Evaluating the Opportunities, Costs, and Risks of Multinational
Operations. Sixth Edition. Wiley.
Børsen, Ritzau (2017). Royal Unibrew satser stort på specialøl – citat, Børsen, 11. December.
Retrieved from
http://penge.borsen.dk/artikel/19/109546/.html
Capron, L. (1999). The long-term performance of horizontal acquisitions. Strategic Management
Journal, 20(987)–1018.
124
Capron, L. & Shen, J. (2007). Acquisitions of private vs. public firms: Private information, target
selection, and acquirer returns. Strategic Management Journal, 28(9), 891-911.
Carlsberg (2017). Carlsberg annual report 2016. Retrieved from
https://carlsberggroup.com/media/10899/carlsberg-group-annual-report-2016.pdf
Carney W. J. (2009). Mergers and Acquisitions: The Essentials. New York: Aspen Publishers.
Cardeal, N. &António, N. (2012). Valuable, rare, inimitable resources and organization (VRIO)
resources orvaluable, rare, inimitable resources (VRI) capabilities: What leads to competitive
advantage? African Journal of Business Management, 6(37), 10159-10170.
Carr, C., Tomkins, C., & Bayliss, B. (1994). Strategic investment decisions: A comparison of UK and German
practices in the motor components industry. Aldershot: Avebury.
Cartwright, S., & Cooper, C. L. (1992). Managing mergers, acquisitions and strategic alliances integrating
people and cultures. Oxford: Butterworth-Heinemann.
Cervezas Mahou (2018). Cervezas. Retreived from https://www.mahou.es/cervezas/
Cervezas San Miguel (2018). Cervezas. Retreived from
https://www.sanmiguel.es/cervezas/
Chatterjee, S. Lubatkin, M. H. Schweiger, D. M. & Weber, Y. (1992). Cultural differences and
shareholders value: Explaining the variability in the performance of related mergers.
Cockerill A. (1977) Economies of Scale, Industrial Structure and Efficiency: The Brewing
Industry in Nine Nations. In: Jacquemin A.P., de Jong H.W. (Ed.), Welfare aspects of industrial
markets. Nijenrode Studies in Economics, 2. Springer, Boston, MA.
Collins, J. D., Holcomb, T. R, Certo, S. T., Hitt, M. A. & Lester, R. H. (2009). Learning by doing:
Cross-border mergers and acquisitions. Journal of Business Research, 62(12), 1329-1334.
125
Compañia Cervecera Damm (2018). Cervezas. Retreived from
http://damm.es/wps/portal/webdamm/home/cervezasdamm/!ut/p/z1/jY_RC4IwEMb_Gh_zZ
llYbyNICEUCpbWXmDanMJ3MpeBf38KnIKl7u7vfd993QIEAbdlQC2Zq1TJp-xvd3VEQ-
p6foAh5lzXCWZIl6T47hZkH118Afa8XCiM4z8Cy3iZY6_gYC6AdM9WqbksFpOB64BPrH6xpb
Ab6h42QKp8_wm2-Cew9zUuuuXaf2o4rY7r-4CAHjePoCqWE5G6hGgd9k1SqN0A-
SegaMkVlupVDhF87kxTK/dz/d5/L2dBISEvZ0FBIS9nQSEh/
Danish Brewery Association (2018). Ølafgift. Retrieved from
http://www.bryggeriforeningen.dk/ol/ol-afgifter/ol-olafgift/
DePamphilis, D. (2013). Mergers, acquisitions, and other restructuring activities: An integrated approach to
process, tools, cases, and solutions. Seventh Edition. Amsterdam: Academic Press.
Dinçer, Ö. (2004). Stratejik yönetim ve işletme politikası. Beta Yayınları, İstanbul.
Duce M. (2003). Definitios of foreign direct investments (FDI): a methodological note. Bank for
International Settlements, 1-16.
Dudley, D. (2018). Renewable Energy Will Be Consistently Cheaper Than Fossil Fuels By 2020,
Report Claims, Forbes Business. Retrieved from
https://www.forbes.com/sites/dominicdudley/2018/01/13/renewable-energy-cost-effective-fossil-
fuels-2020/#b493ab44ff2e
Duncan, C., & Mtar, M. (2006). Determinants of international acquisition success: Lessons from
FirstGroup in North America. European Management Journal, 24(6), 396–410.
Duncan, R. B. (1972). Characteristics of organizational environments and perceived environmental
uncertainty. Administrative science quarterly, 313-327.
Dunning, J. H. (1988). The eclectc paradigm of international production: a restatement and some
possible extensions. International Journal of Business, 1-31.
126
Dunning, J.H. (1993). Multinational enterprises and the global economy. Wokingham, UK: Addison-Wesley
Publishing Company.
Dunning, J. H. (1998). Location and the multinational enterprise: a neglected factor. Journal of
International Business Studies, 29(1), 45-66.
Dunning, J. H. (2001). The eclectic paradigm (OLI) paradigm of international production: Past,
Present and Future. International Journal of Business, 8(2), 173-190.
Easterby-Smith, M., Thorpe, R. Jackson, P. and Lowe, A. (2008) Management Research. Third
Edition. Sage: London.
Ebneth, Oliver, Theuvsen, Ludwig (2006), Globalization of the Brewing Industry Trends,
Perspectives and Strategies.
Eden, L. (2003). A critical reflection and some conclusions on OLI. In: Cantwell, J., Narula, R. (Ed.),
International Business and the Eclectic Paradigm – Developing the OLI Framework. Routledge, London and
New York, 277–297.
Epstein, M. J. (2005). The determinants and evaluation of merger success. Business Horizons. 48, 37-
46.
Estrelle De Levante (2018). Cervezas. Retreived from
http://www.estrelladelevante.es/?check=1
Euromonitor (2017a). Alcoholic Drinks – Country Report: Spain – June 2017. Retrieved from
http://www.portal.euromonitor.com.esc-web.lib.cbs.dk/portal/analysis/tab
Euromonitor (2017b). Alcoholic Drinks – Europe – June 2017. Retrieved from
http://www.portal.euromonitor.com.esc-web.lib.cbs.dk/portal/analysis/tab
Euromonitor (2017c). Beer in Spain – Country Report – June 2017. Retrieved from
http://www.portal.euromonitor.com.esc-web.lib.cbs.dk/portal/analysis/tab
127
Euromonitor (2018). Market sizes, Total Volume, Year-on-Year Growth. Retrieved from
http://www.portal.euromonitor.com.esc-web.lib.cbs.dk/Portal/Pages/Statistics/Statistics.aspx
European Commision (2016). Common Agricultural Policies – Spain. Agricultural and Rural
Development, 1-6.
Eurostat (2015). At risk of poverty rate and threshold. Retrieved from
http://ec.europa.eu/eurostat/statisticsexplained/index.php/Income_distribution_statistics/da
Eurostat (2017a). Agriculture Production - Crops. Retrieved from
http://ec.europa.eu/eurostat/statistics-explained/index.php/Agricultural_production_-_crops
Eurostat (2017b). Labour costs in the EU - Hourly labour costs ranged from €4.4 to €42.0 across the
EU Member States in 2016. Retrieved from
http://ec.europa.eu/eurostat/documents/2995521/7968159/3-06042017-AP EN.pdf/6e303587-
baf8-44ca-b4ef-7c891c3a7517
Eurostat (2017c). Tourism Statistics. Retrieved from
http://ec.europa.eu/eurostat/statistics-explained/index.php/Tourism_statistics
Eurostat (2018). Estimated hourly labour costs, 2017. Retrieved from
http://ec.europa.eu/eurostat/statistics-
explained/index.php?title=File:Estimated_hourly_labour_costs,_2017_(EUR)_CORR_2.png
Federal Reserve (2018). What is an acceptable level of inflation? Retrieved from
https://www.federalreserve.gov/faqs/economy_14400.htm
Font Salem (2018). Marcas Propias. Retreived from
http://fontsalem.com/marcas-propias/
Flyvbjerg, B. (2004). Five misunderstandings about case-study research in Clive Seale, Giampietro
Gobo, Jaber F. Gubrium and David Silverman Qualitative Research Practice: Concise Paperback Edition.
London and Thousand Oaks. Calidfornisa: Sage.
128
Carlsson, C. & Füller, R. (1996). Fuzzy multiple decision making: Recent developments. Fuzzy Sets
and Systems, 78, 139–153.
Gallet, C. A. (2007). The demand for alcohol: a meta-analysis of elasticities. Australian Journal of
Agriculture and Resource, 51, 121-135.
Cloodt, M., Hagedoorn, J., & Van Kranenburg, H. (2006). Mergers and acquisitions: Their effort
on the innovative performance of companies in high-tech industries. Research Policy, 35, 642-654.
Grant, R., B. Butler, et al. (2011). Contemporary strategic management: An Australasian
perspective, John Wiley and Son Australia.
Grupo Agora (2018). Agora Group Values. Retreived from
http://www.agoragrupo.com/en/values/
Grupo Damm (2018). Font Salem Informe Integrado 2015. Retreived from
http://www.damm.es/wps/wcm/connect/webdamm/618b7e36-38ab-439c-8e85-
b6875e59c97e/Informe+integrado+2014-
2015.pdf?MOD=AJPERES&ContentCache=NONE&CACHE=NONE&CACHEID=618b7e36-
38ab-439c-8e85-b6875e59c97e
Gupta, A. (2013). Environment & PEST analysis: an approach to external business environment.
International Joiurnal of Modern Social Sciences, 2(1), 34-43.
Hall, R. (1992). The strategic analysis of intangible resources. Strategic Management Journal,
13, 135-144.
Hall, R. (1993). A framework linking intangible resources and capabilities to sustainable competitive
advantage. Strategic Management Journal, 14, 607-618.
Harvey, M. G., & Lusch, R. F. (1998). Beyond traditional due diligence for mergers and
acquisitions in the 21st century. Review of Business, 19(3), 17–21.
129
Hartwich, F. (1999). Weighing of Agricultural Research Results: Strength and Limitations of the
Analytical Hierarchy Process (AHP). Universität Hohenheim.
Haspeslagh, P. C., & Jemison, D. B. (1991). Managing acquisitions, creating value through corporate renewal.
New York: The Free Press. International Mergers and Acquisitions Activity since 1990: Recent
Research and Quantitative Analysis.
Heller, R. (2000). Managing Revolution: A horizontal future for mergers. Management Today February,
5–8.
Hennart, J. F. (1988). Upstream vertical integration in the aluminium and tin industries. JEBO, 281-
199.
Hijos de Rivera (2018). Cervezas. Retreived from http://www.corporacionhijosderivera.com
Hill, C.W.L., Hwang, P. & C. Kim (1990). An eclectic theory of the choice of international entry
mode, SMJ, 11, 117-128.
Hitt M. A., Ireland D. R., & Harrison J. S. (2001). Mergers and acquisitions: a value creating or value-
destroying strategy?, In Hitt M. A, Freeman E. R. and Harrison J. S. (Ed.), The Blackwell Handbook of
Strategic Management. Oxford: Blackwell, 384–408.
Holstein, J. A. & Gubrium, J. F. (2004). The active interview in David Silverman Qualitative Research:
Theory, Method and Practice. Second Edition. Great Britain. SAGE Publications Limited.
Hubbard, N. (2001) Acquisition Strategy and Implementation. Second Edition. Palgrave, Basingstoke.
Hull, J. (2013). Options, futures, and other derivatives. Eight Edition. Upper Saddle River, NJ: Pearson
Education.
Hutchens, R. M. (1989). Seniority, Wages and Productivity: A Turbulent Decade. Journal of Economic
Perspectives, 3(4).
130
Hwang, C. L., & Yoon, K. (1981). Multiple attribute decision making:Methods and applications. NY:
Springer-Verlag.
ICAP (2002). Drinking age limits. Internation Cetner for Alcohol Policies, 1-8.
Issa, T., Chang, V. & Issa, T. (2010). Sustainable business strategies and PESTEL framework. Curtin
University of Technology, 1-8.
Itaki, M. (1991). A Critical Assessment of the Eclectic Theory of the Multinational
Enterprise. Journal of International Business Studies, 22(3), 445-460.
Johnson, P. and Clark, M. (2006). Mapping the terrain: an overview of business and management research
methodologies. In P. Johnson and M. Clark. (Ed.), Business and Management Research Methodologies.
London: Sage.
Jugdev, K., Marthur, G. & Fung, T. S. (2007). Project management assests and their relationsips
with the project management capability of the firm. International Journal of Project Management, 25, 560-
568.
Justesen, L. & Mik-Meyer, N. (2013). Kvalitative metoder. First Edition, Hans Reitzels Forlag �
O'shaughnessy, J. (1984). Competitive marketing: a strategic approach. Boston: Allen & Unwin.
Kahraman, C., & SpringerLink. (2008). Fuzzy Multi-Criteria Decision Making: Theory and Applications
with Recent Developments (Springer Optimization and Its Applications 16). Boston, MA: Springer US.
Kang, J. (1993). The international market for corporate control: Mergers and acquisitions of U.S.
firms by Japanese firms. Journal of Financial Economics, 34, 345-371.
Kapferer, J.-N. (1997). Strategic brand management. Second Edition. London: Kogan Page.
Karimi, A, R,, Mehrdadi, N., Hasemian, S. J. Bidhendi, G. R., Moghaddam R. T. (2011) Selection
of wastewater treatment process based on the analytical hierarchy process and fuzzy analytical
hierarchy process methods. International Journal of Environment Science and Technology, 8,(2), 267-280.
131
Kissin, W. D., & Herrera, J. (1990). International mergers and acquisitions. The Journal of Business
Strategy, 11(4), 51–55.
Kjær, K. (2016). Her får du flest solskinstimer for pengene. TV2 Penge. Retrieved from
http://nyheder.tv2.dk/penge/2016-05-17-her-faar-du-flest-solskinstimer-for-pengene
Knott, P. JJ. (2015). Does VRIO help managers evaluate a firm’s resources? University of Canterbury,
1-18.
Koeplin, J., Sarin, A., & Shapiro, A. (2000). The Private Company Discount. Journal of Applied
Corporate Finance, 12(4), 94-101.
Kraaijenbrink, J. Spender, J. C. & Groen, A. (2009). The resource-based view: a review and
assessment of its critiques. Munich Personal RePEc Archive, 1-44.
Kvale, S. (1979). Det kvalitative forskningsinterview – antatser til en fænomenologisk-hermenuetisk
forståelsesform. In T. Broch et al. Kvalitative metoder i dansk samfundsforskning. København: Byt fra
Samfundsvidenskaberne.
Kotler, P., Keller, K. L., Brady, M., Goodman, M. & Hansen, T.(2016). Marketing Management.
Second Edition. Pearson Education Limited.
Kruuse, E. (2007). Kvalitative forskningsmetoder i psykologi og beslægtede fag. Sixth Edition. København:
Dansk Psykologisk Forlag.
La Zaragozana (2018). Cervezas. Retreived from https://ambar.com/cervezas/
Lee, C.-F. & Wang,. S.-Y. (2011). Fuzzy multi-criteria decision-making for evaluating mutual fund
strategies. Applied Economics, 43, 3405-3414
Leary, K. (2018). Renewable energy will be cheaper than fossil fuels by 2020, according to new
research. Business Insider. Retrieved from
132
http://www.businessinsider.com/renewable-energy-will-be-cheaper-than-fossil-fuels-by-2020-2018-
1?r=US&IR=T&IR=T
Lesser, H. (2000). Some practical suggestions for the M&A due diligence process (Part I). Practical
Lawyer, 46(6), 47–62.
Levitt, T. (1983). The globalization of markets. Harvard Business Review, 61(3), 92–102.
Lynch, R. (2006). International Acquisition and Other Growth Strategies: Some Lessons from the
Food and Drink Industry. Thunderbold International Business Review, 48(5). 605-622.
Lynch, R. (2009). Strategic management. England: Pearson Education Limited.
Mahou-San Miguel (2018). Mahou-San Miguel Annual report 2014. Retreived from
https://www.mahou-sanmiguel.com/en-gb/documents/mahou-san-miguel-2014-annual-
report.pdf
Majumder, M. (2015). Impact of Urbanization on Water Shortage in Face of Climatic Aberrations. First
Edition. Springer Singapore.
MarketLine (2015). Beer in Spain. Industry Profile Report, 1-37.
MarketLine (2016). Global Beer and Cider. Industry Profile Report, 1-37.
Marmol, T. (2015). PESTLE Analysis: understanding and plan for your business environment. Business
50minutes.
Michaux, S. (2015). Porter’s Five Forces. Business 50minutes.
Miller D, Shamsie J (1996). The resource-based view of the firm in two environments: The
Hollywood film studios from 1936 to 1965. Acad. Manage. J. 39(3), 519-543.�
133
Ministerio de Asuntos Exteriorers y de Coorperacion (2014). Spain, High-Tech Country. Gobierno
De España, 1-17.
Ministerio de Economía y Competitividad (2018). Unique scientific and technical infrastructures
(ICTS). Gobierno De España, 1-117.
Mintzberg, H. Ahlenstrand,, B. & Lampel, J. (2009). Strategy Safari. Second Edition. Great Britain.
Pearson Education Limited.
Mundell, R. (1963). Inflation and Real Interest. Journal of Political Economy, 71(3), 280-283.
Navarro & Ventoso (2014). Spain in Calvin S. Goldmans, The Foreign Investment Regulation Review.
First Edition. Law Business Research Limited.
Newbold, Paul, Carlson, William L, & Thorne, Betty. (2013). Statistics for business and economics. Eigth
Edition. (Global Edition). Harlow: Pearson Education.
Norén, F. (2017). Corruption in Spain: perceptions versus reality. Civismo, 1-4
European Union (2016). eGovernment in Spain. ISA, 1-64.
OECD (2017). Spain. OECD Economic Surveys, 1-57.
OECD (2018). Long-term interest rates. Retrieved from
https://data.oecd.org/interest/long-term-interest-rates.htm#indicator-chart
Olsen, P. B. & Pedersen, K. (1999). Kvalitetsbeskrivelse in Poul Bitsch Olsen and Kaare Pedersen
Problemorienteret projektarbejde – en værktøjsbog. Third Edition. Frederiksberg: Samfundslitteratur.
Pagano, M., Panetta, F., Zing, L. (1998). Why Do Companies Go Public? An Empirical Analysis.
Journal of Finance, 53(1), 27-64.
134
Peng, G. C. A. & Nunes, M. B. (2007). Using PEST analysis as a tool for refining and focusing
contexts for information systems research. European Conference on Research Methodology for Business and
Management Studies, 229-236.
Peng, M. & Meyer, K. (2011). International Business. South-Western Cengage Learning, London.
Penrose E. T. (1959). The Theory of the Growth of the Firm. Third Edition. John Wiley Sons: New York.
Perera, R. (2017). The PESTLE analysis. First Edition. Nerdynaut.
Petersen, Christian V, & Plenborg, Thomas. (2012). Financial statement analysis: Valuation: Credit
analysis: Executive compensation. Harlow: Pearson.
Pike, R. H., Sharp, J., & Price, D. (1989). AMT investment in the large UK firm. International
Journal of Operations and Production Management, 9(2), 13-26.
Porter, M. E. (1979). How competitive forces shape strategy. Harvard Business Review, 137-145.
Porter, M. E. (1985). Competitive Advantage. New York: Free Press.
Porter, M. E. (2008). The five competitive forces that shape strategy. Harvard Business Review, 86(1),
78-93.�
Posnock, S. (2002). Due diligence: The buyer’s perspective. Folio: The Magazine for Magazine
Management, 77–79.
Quah, P. & Young, S. (2005). Post-acquisition Management: A Phases Approach for Cross-border
M&As. European Management Journal, 23(1), 65-75.
RateBeer (2018). Penibetica de Cervezas. Retreived from
https://www.ratebeer.com/brewers/penibetica-de-cervezas/4584/
Rivera (2015). Interview with Ignacio Rivera, CEO of Hijos de Rivera SAU. Retrieved from
135
https://www.brandsofspain.com/brands-news/interview-ignacio-rivera-ceo-hijos-de-rivera-sau/
Robles-Egea, A. & Delgado-Fernández, S. (2014). Corruption in democratic Spain. Causes, cases
and consequences. ECPR General Conference Glasgow 2014, 1-37.
Roden, Lee (2017). Spain one of the worst EU countries for income inequality: report. The Local
Europe AB. Retrieved from https://www.thelocal.es/20171124/spain-one-of-the-worst-eu-countries-
for-income-inequality-report
Rousseau, & Wachtel. (2002). Inflation thresholds and the finance–growth nexus. Journal of
International Money and Finance, 21(6), 777-793.
Rowe, W. G. & Barnes, J. G. (1998). Relationship Marketing and Sustained Competitive
Addvantage. Journal of Market Focused Management, 2, 281-297.
Royal Unibrew (2018). Royal Unibrew annual report 2017. Retrieved from
http://investor.royalunibrew.com/annuals.cfm
Royal Unibrew (2018b). Royal Unibrew in brief . Retrieved from
http://www.royalunibrew.com/about-us/royal-unibrew-brief/
Ryan, C. (2006). The impact of the European Union on Sain. Digital Commons,1-20
Saaty, T. L. (1977). A Scaling Method for Priorities in Hierarchical Structures. Journal of
Mathematical Psychology, 15, 234-281.
Saaty, T. L. (2008). Decision making with the analytical hierarchy process. International Journal Service
Sciences, 1(1), 83-98.
Sarala, R. M. & Vaara, E.(2010). Cultural differences, convergence and crossconvergence as
explanations of knowledge transfer in international acquisitions. Journal of International Business, 41,
1365-1390.
136
Saunders, M., Lewis, P. & Thornhill, A. (2009). Research methods for business students. Fifth Edition.
Great Britain. Pearson Education Limited.
Shimizu, K., H., M. A., Vaidyanath, D., & Pisano, V. (2004). Theoretical foundations of
crossborder mergers and acquisitions: A review of current research for the future. Journal of
International Management, 10, 307-353.
Slagmulder, R., Bruggeman, W., & Wassenhove, L. V. (1995). An empirical study of capital
budgeting practices for strategic investments in CIM technologies. International Journal of Production
Economics, 40, 121-152.
Stahl, G. K. and Voigt, A. (2004). Impact of cultural differences on merger and acquisition
performance - A critical research review and an integrative model. Advances in Mergers and Acquisitions,
4, 51-82.
Stahl, G. K. & Voigt, A. (2008). Do cultural differences matter in the mergers and acquisitions? A
tentative model and examination. Organization Science, 19(1), 160-176.
STAP (2007). Regulation of alcohol marketing in Europe. National Foundation for Alcohol Prevention, 1-
65.
Statista GmbH (2016a). Average annual net earning salary of singles in selected European Union
(EU) countries in 2016 [Homepage]. Retrieved from
https://www.statista.com/statistics/557638/average-salaries-of-singles-in-european-union/
Statista GmbH (2016b). Average price for a 33cl bottle of beer in supermarkets in the European
Union (EU) in 2016, by city [Homepage]. Retrieved from https://www-statista-com.esc-
web.lib.cbs.dk:8443/study/48400/spain/
Statista GmbH (2017). Country Report – Spain 2017 [Homepage]. Retrieved from https://www-
statista-com.esc-web.lib.cbs.dk:8443/study/48400/spain/
137
Statista GmbH (2018a). Alcoholic drinks – Europe [Homepage]. Retrieved from
https://www.statista.com/outlook/10000000/102/alcoholic-drinks/europe#
Statista GmbH (2018b). Excise tax added to beer – Europe [Homepage]. Retrieved from
https://www-statista-com.esc-web.lib.cbs.dk:8443/statistics/444183/beer-excise-rates-europe/
Statista GmbH (2018c). Inflation annual rate - Spain[Homepage]. Retrieved from https://www-
statista-com.esc-web.lib.cbs.dk:8443/statistics/469865/annual-inflation-rate-in-spain/
Statista GmbH (2018d). Leading beverage companies worldwide based on net sales [Homepage].
Retrieved from https://www.statista.com/statistics/307963/leading-beverage-companies-
worldwide-based-on-net-sales/
Statista GmbH (2018e). Non-Alcoholic drinks – Europe [Homepage]. Retrieved from
https://www.statista.com/outlook/20000000/102/non-alcoholic-drinks/europe
Statista GmbH (2018f). Total Revenue Beer Industry – Spain [Homepage]. Retrieved from
https://www-statista-com.esc-
web.lib.cbs.dk:8443/outlook/10010000/153/beer/spain#marketStudy
Statista GmbH (2018g) Total travel and tourism contribution to GDP. Retrieved from:
https://www.statista.com/statistics/640440/travel-tourism-total-gdp-contribution-spain/
The Economist (2018a). Country Report - Spain. The Economist Intelligence Unit. Retrieved from
https://ukshop.economist.com/products/country-report-spain
The Economist (2018b). EIU Global Forecast – Higher interest rates are coming. The Economist
Intelligence Unit. Retrieved from http://country.eiu.com.esc-
web.lib.cbs.dk/ArticleIndustry.aspx?articleid=36427787&Country=Spain&topic=Industry&subtopi
c=Consumer%20goods
138
Thomsen, P. B. (2017). Barcelona fyldt med demonstranter: Catalonien er en del af Spanien. DR.dk.
Retrieved from https://www.dr.dk/nyheder/udland/barcelona-fyldt-med-demonstranter-
catalonien-er-en-del-af-spanien
Triantaphyllou E, Mann SH. Using the analytic hierarchy process for decision making in
engineering applications: Some challenges. International Journal of Industrial �Engineering:
Applications and Practice 1995, 2(1), 35–44.
Van Cauwenbergh, A., Durinck, E., Martens, R., Laveren, E., & Bogaert, I. (1996). On the role of
function of formal analysis in strategic investment decision processes. Management Accounting Research,
7(2), 169-184.
Very, P., & Schweiger, D. M. (2001). The acquisition process as a learning process: Evidence from a
study of critical problems and solutions in domestic and crossborder deals. Journal of World Business,
36(1), 11–31.
Walter, G. A., & Barney, J. B. (1990). Management objectives in mergers and acquisitions. Strategic
Management Journal, 11(1), 79-86
Weber, Y, Shenkar, O. & Raveh, A. (1996). National and corporate culture fit in
mergers/acquisitions: An exploratory study. Management Science, 42(8), 1215-1227.
Wernerfelt, B. (1984). A resource based view of the firm. Strategic Management Journal, 5(2), 171-80.
Weston J. F., Mitchell M. L., & Mulherin J. H. (2004). Takeover, restructuring and corporate governance.
Fourth Edition. New Jersey: Prentice Hall.
Whitaker R (2007). Criticisms of the analytic hierarchy process: Why they often make no sense.
Math Comput Modelling, 46, 948–961.
WHO (2012). Sundhed 2020: En fælleseuropæisk politisk ramme til styrkelse af indsatsen for
sundhed og velvære på tværs af regering og samfund. World Health Organization – Europe. 62.
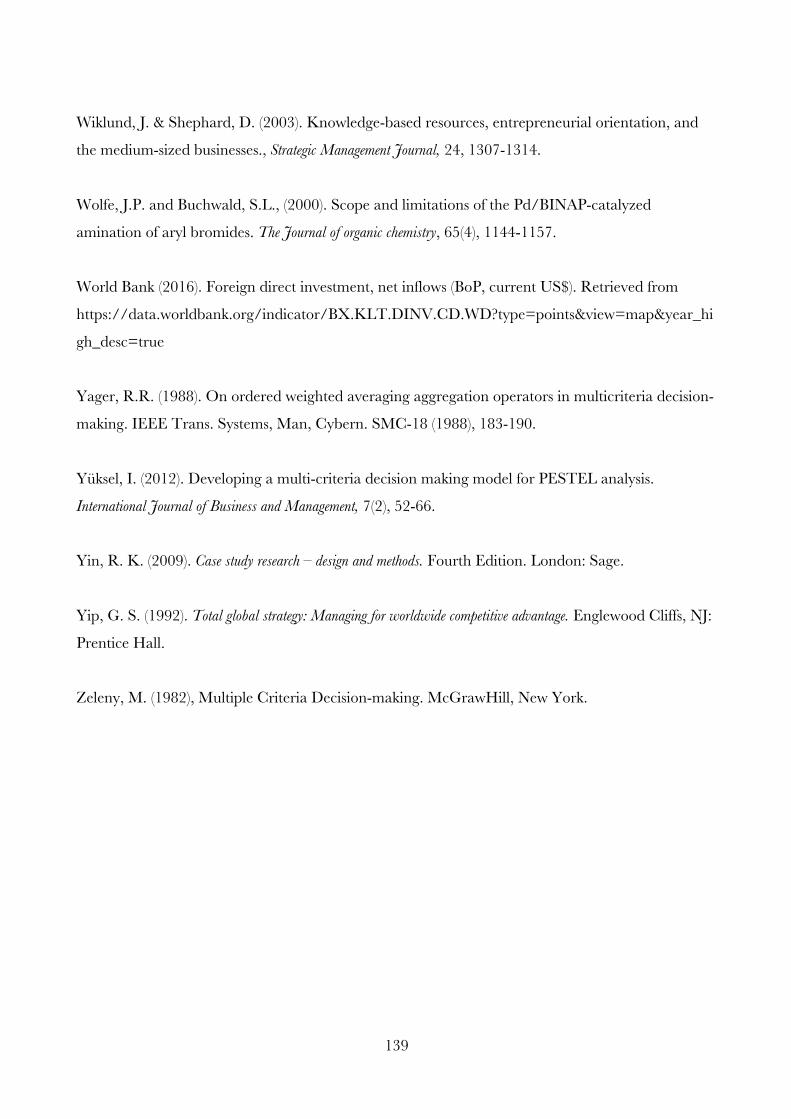
139
Wiklund, J. & Shephard, D. (2003). Knowledge-based resources, entrepreneurial orientation, and
the medium-sized businesses., Strategic Management Journal, 24, 1307-1314.
Wolfe, J.P. and Buchwald, S.L., (2000). Scope and limitations of the Pd/BINAP-catalyzed
amination of aryl bromides. The Journal of organic chemistry, 65(4), 1144-1157.
World Bank (2016). Foreign direct investment, net inflows (BoP, current US$). Retrieved from
https://data.worldbank.org/indicator/BX.KLT.DINV.CD.WD?type=points&view=map&year_hi
gh_desc=true
Yager, R.R. (1988). On ordered weighted averaging aggregation operators in multicriteria decision-
making. IEEE Trans. Systems, Man, Cybern. SMC-18 (1988), 183-190.
Yüksel, I. (2012). Developing a multi-criteria decision making model for PESTEL analysis.
International Journal of Business and Management, 7(2), 52-66.
Yin, R. K. (2009). Case study research – design and methods. Fourth Edition. London: Sage.
Yip, G. S. (1992). Total global strategy: Managing for worldwide competitive advantage. Englewood Cliffs, NJ:
Prentice Hall.
Zeleny, M. (1982), Multiple Criteria Decision-making. McGrawHill, New York.
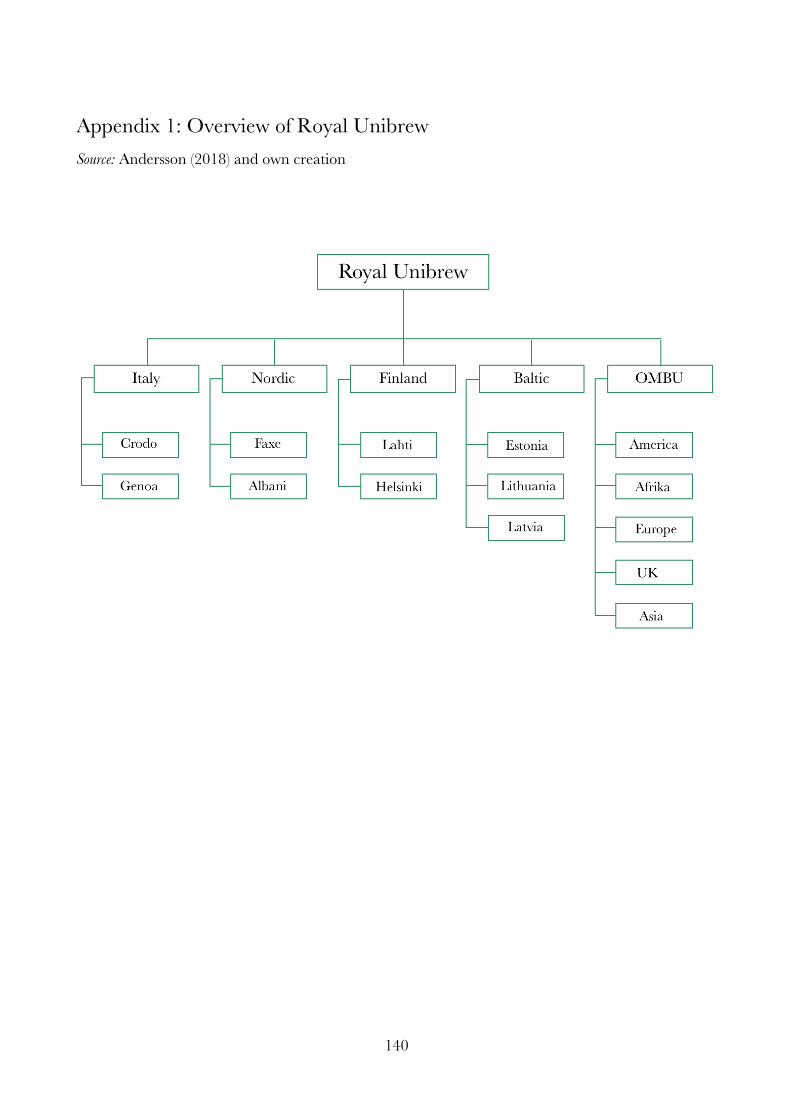
140
Appendix 1: Overview of Royal Unibrew Source: Andersson (2018) and own creation
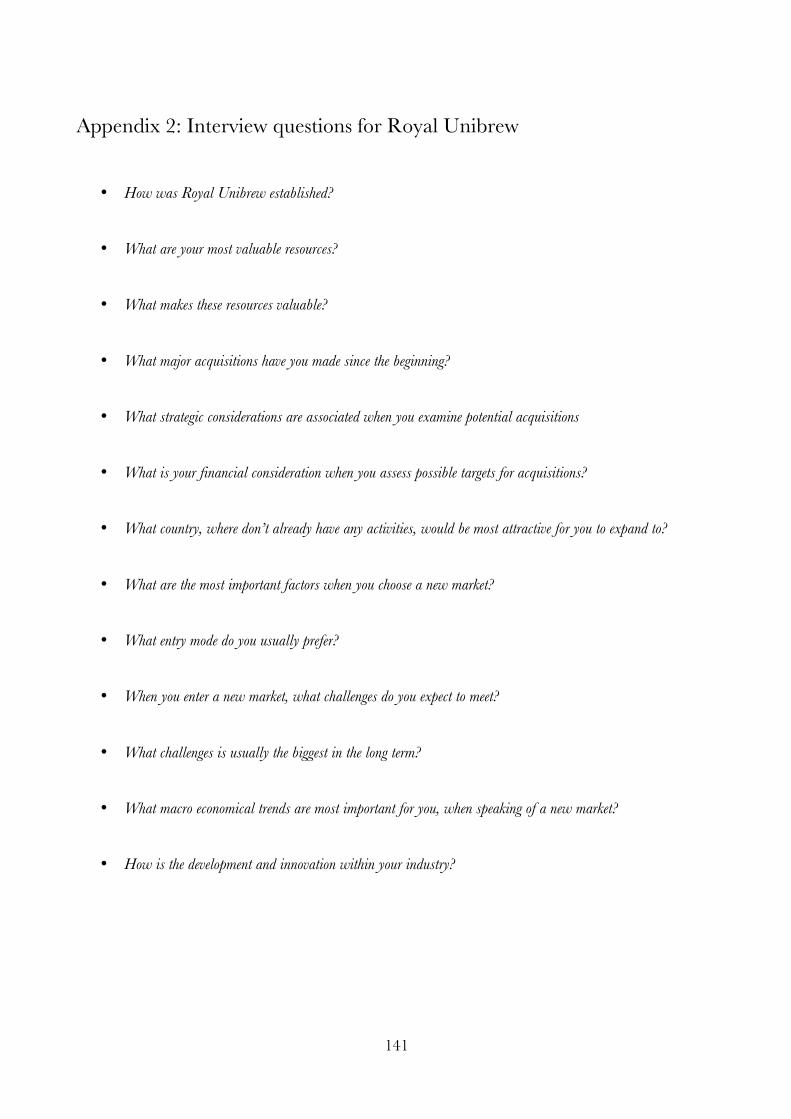
141
Appendix 2: Interview questions for Royal Unibrew
• How was Royal Unibrew established?
• What are your most valuable resources?
• What makes these resources valuable?
• What major acquisitions have you made since the beginning?
• What strategic considerations are associated when you examine potential acquisitions
• What is your financial consideration when you assess possible targets for acquisitions?
• What country, where don’t already have any activities, would be most attractive for you to expand to?
• What are the most important factors when you choose a new market?
• What entry mode do you usually prefer?
• When you enter a new market, what challenges do you expect to meet?
• What challenges is usually the biggest in the long term?
• What macro economical trends are most important for you, when speaking of a new market?
• How is the development and innovation within your industry?
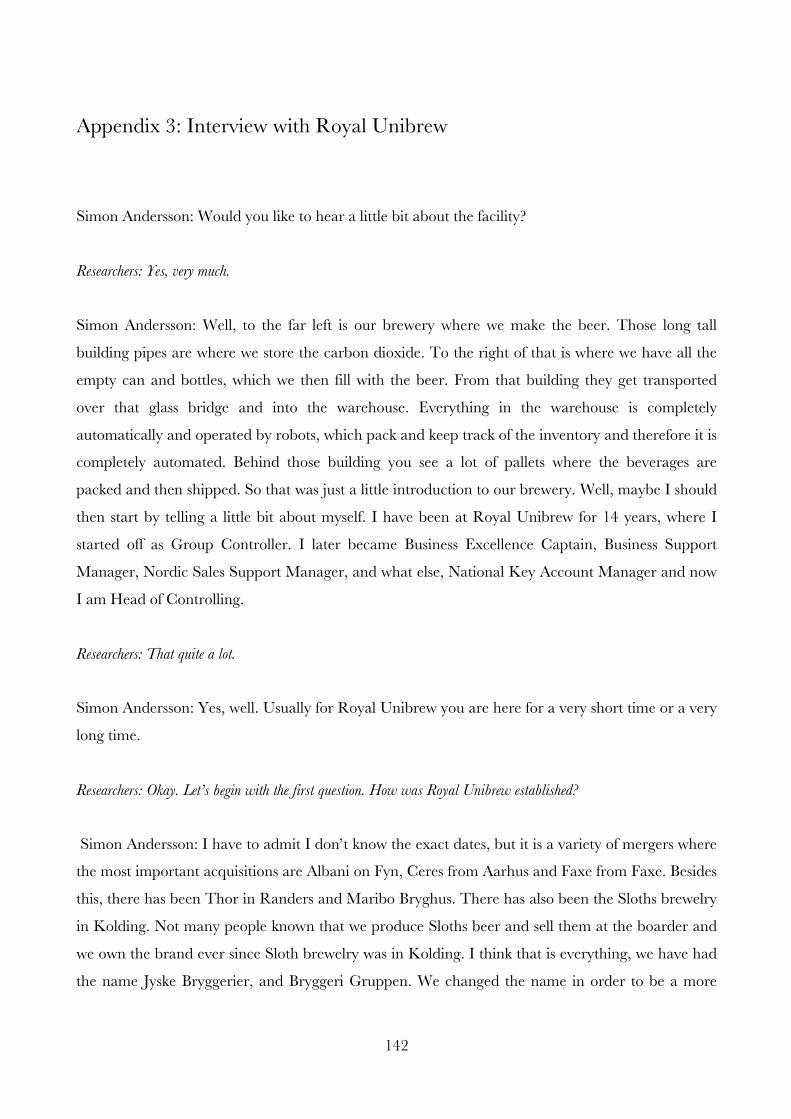
142
Appendix 3: Interview with Royal Unibrew
Simon Andersson: Would you like to hear a little bit about the facility?
Researchers: Yes, very much.
Simon Andersson: Well, to the far left is our brewery where we make the beer. Those long tall
building pipes are where we store the carbon dioxide. To the right of that is where we have all the
empty can and bottles, which we then fill with the beer. From that building they get transported
over that glass bridge and into the warehouse. Everything in the warehouse is completely
automatically and operated by robots, which pack and keep track of the inventory and therefore it is
completely automated. Behind those building you see a lot of pallets where the beverages are
packed and then shipped. So that was just a little introduction to our brewery. Well, maybe I should
then start by telling a little bit about myself. I have been at Royal Unibrew for 14 years, where I
started off as Group Controller. I later became Business Excellence Captain, Business Support
Manager, Nordic Sales Support Manager, and what else, National Key Account Manager and now
I am Head of Controlling.
Researchers: That quite a lot.
Simon Andersson: Yes, well. Usually for Royal Unibrew you are here for a very short time or a very
long time.
Researchers: Okay. Let’s begin with the first question. How was Royal Unibrew established?
Simon Andersson: I have to admit I don’t know the exact dates, but it is a variety of mergers where
the most important acquisitions are Albani on Fyn, Ceres from Aarhus and Faxe from Faxe. Besides
this, there has been Thor in Randers and Maribo Bryghus. There has also been the Sloths brewelry
in Kolding. Not many people known that we produce Sloths beer and sell them at the boarder and
we own the brand ever since Sloth brewelry was in Kolding. I think that is everything, we have had
the name Jyske Bryggerier, and Bryggeri Gruppen. We changed the name in order to be a more
143
international player 8 to 10 years ago. It was hard for the big international companies to pronounce
Bryggerigruppen and the English Brewelry Group referred to our competitors as well, since it was
mistaken as a term within the industry. So we changed the name to something that made a bit more
sense. Most of the breweries are from the 1800s and it is more or less the same situation for
Carlsberg. Many breweries was founded during this period.
Researcher: What are your most valuable resources?
Simon Andersson: What do you means exactly when you say resources? Can you give me some
examples on what you are looking for?
Researchers: It could be employees, brand, breweries, supply chain and so on. Basically what makes
you unique?
Simon Andersson: There is no doubt that our employees are the reason behind the success. They
are the reason that we have any products to sell, so our employees are our most valuable resource.
Besides this, w everything else realise have relatively strong brands perhaps some of the most strang
brands in Denmark, where Faxe Kondi is the most strong. Besides this, We have very big physical
units, our breweries. We have our big brewery here in Faxe. We also have a brewery in Odense and
the rest are closed down, because they have been sold. Maribo brewery has been sold, as well as
Ceres and Thor. Outside of Denmark we have a brewery in Litauen in Kannapolis. We also have a
juice factory in Riga in Latvia and then we have a smaller brewery in Latvia in Liepaja by the water.
Then we have a large brewery in Finland In Lahti and then we have just bought an Italian brewery
in Campari, which is quite new, since we just got the keys it the 2nd of January. The rest of the
places are export, but that it typically produces in Denmark, either here in here or in Odense.
Speaking of resources, we also have a limestone quarry here in Faxe, and the water it quite unique
with special minerals. Our water Egekilde also comes from springs located in southern Sealand. So
it is not just tap water, but actual spring water.
Researchers: What makes these resources valuable,? However, we already talks about his...
Simon Andersson: If I need to elaborate on that, then it is connected to our brand which we protect.
We a lot energy in protecting our brand and hw we use marketing. The way that everybody use
144
marketing has changed a lot in recent years, since social media is used much more. Every brand has
its own Facebook page and Instagram profile and maybe even Snapchat. So we try to stay relevant
by using this as well.
Researchers: What strategic considerations are associated when you examine potential acquisitions? We know you have
five strategies you try to live up to: locally based, significant market position etc.
Simon Andersson: Is it okay if I draw something on the bard?
Researchers: Yes, of course.
Simon Draws on a white board and continues:
Simon Anderson: We have five business units today where is our home base and goes under the
category Nordic and this category also contains Sweden, Norway, Iceland etc. It also covers business
in Germany. Baltic is Estonia, Latvia and Lithuania. The last one, which is only export, is Italy,
where we only have a sales office in Genoa and production in Crodo. In Finland we have
production in Lahti and sales in Helsinki. In Denmark we have Faxe, which is production and
everything else really. We also have production in Odense, which is Albani. We also have overseas
market business units (OMBU), which is what we call Americas, which is US, but also Canada and
Caribbean. Besides this, we have Africa in OMBU and also, what we call Europe. Europe and UK.
We call ourselves a multi beverage company, which we are because we don’t only make beer or
soda. We also have water and ready-to-drink (RTD) like Tempt Cider, which is an alcoholic soda.
We also have juice, which we produce in Riga, but also sells in Finland and Latvia and so on. In
Finland we have the liquor part, which is where we distribute all major liquor brands. Besides this,
we have some coffee we sell in Finland and we also sell malt drinks.
Our biggest categories are beer, sodas, malt and water. We are market leaders in Finland and
Baltics, when it comes to water. We are number two in beer in Nordic and Finland. We are number
two in soda in Denmark and Finland.
Researchers: How big are your businesses for beer, soda and water revenue wise?
145
Simon Andersson: There should be some numbers in our annual report, but these are two major
categories and they are close to 50/50 and the rest have a small amount. What is exiting is malt
drinks and we feel we have the world’s strongest malt drink. It is very unique and we have three
brands: Vitamalt, Supermalt and Powermalt. We have three brands because our previous
acquisitions have had their own brand Ceres had Vitamalt, Albani had Supermalt and Faxe had
Powermalt. In Africa we sell many Powermalt and in UK we sell many Supermalt. Vitamalt is more
Americas, even though you can find them all in every market. Malt drinks is a market in growth and
here there live many people. We are in many large markets, but with a small share, but also in
smaller countries but with a bigger share. For example, we have countries where we have 80%
market share of their malt drinks. Malt drinks are their soda drinks. They consume malt drinks as
we consume soda drinks. Malt drinks is sweet and without alcohol since you stop the fermentation
process.
Researchers: What is your financial consideration when you assess possible targets for acquisitions?
If we look at Danmark, a mature market with Carlsberg, us Harboe, and smaller Svaneke, and lots
of microbreweries, which are more and more popular these days. Of course, we will not be able to
acquire Harboe, since the authorities would not allow it due to the size of Harboe. Therefore, if we
wanted to buy anything in Denmark it will be relatively small businesses. In Finland have we bought
Hartwall, the second largest brewery there, which is very much similar to our business. Heineken,
who has their expertise within the beer industry, owned it. Hartwall had over the years become a
“multi beverage” company, and therefore Heineken wanted to sell the company. We acquired the
company with a good price. The company had the same customer segment, and the same product
portfolio, which generated great synergies. Besides Hartwall, Carlsberg and the finnish brewery Olvi,
which means that the market is somewhat divided in three pieces. Therefore, in this market new
targets would be small business as well. In Baltics, we are relatively small player. Here we are
number three on the market, with Olvi and Carlsberg dominating the market as well. In Baltics, we
have acquired one of Carlsberg’s breweries since they had become to large in market share, and
therefore were forced to sell market shares. This was our entry to the market, and later we also have
acquired a juice company. If we look at Italy, we have acquired a small soft drink business, which
contributes with 4-5% of our business. Thus, a relatively small business compared to Hartwall,
which almost was larger than us at the time we bought them.
146
We have also owned three breweries in Poland, which added together had 5% of the Polish beer
market. Carlberg had 10%. It went all wrong, since the market is, as the German market,
dominated by many players, which makes it hard to compete against. We lost approx. 500 millions
in this venture. In this period, we were near bankruptcy. Our share price was around 28 DKK per
share, compared with the approx. 400 DKK today including 5 share splits, which makes the share
price increase above 2000%. Some employees have earned a lot.
If we turn to our export markets we have offices with 8 employees in London as well as an office in
France. In Africa we have lots of salesmen. In America we operate from Florida. In Asia, we are
very small and have currently no intention in growing in that particular market. Carlsberg and
Heineken are very interested in that market. Thus, if you want to look for possible new markets to
enter, Europe is definitely the most interesting market right now. America in to long of a distance.
With that in mind, it could happen in the future.
Researcher: it is more the exporting part for now and in the nearest future
Simon Andersson: Yes it is. We are very strong in Europe and therefore most obvious. With that
said, the brewery industry is a consolidated market, which makes it very difficult to find new targets.
We are continuously informed about new targets from extern sources. However, we do not want to
buy a new target, only to buy a new target. We want to be sure that the buy creates great return for
our investors.
Researcher: Which entry mode do you prefer when expanding to new markets?
Simon Andersson: When we expand, we focus on our main competencies such as beer, soft drinks
and Malt. Alcohol businesses, such as the wine industry, are not interesting for us. When we look at
a new target, we assess its brands and their market positions. Of course it will be difficult to acquire
the number one on the market because of AB Indev, the world’s largest brewery concern. They are
a merger of the world’s largest and second largest breweries, and therefore have the market leader
positions in most markets. Hereafter come, Heineken and Carlsberg etc. and we are long down the
rank list. Therefore, we are a small concern compared to them and this limits our opportunities and
we need to be more agile than they have to be. However, our financial performance is significantly
better than most of the top breweries, which makes us very attractive.
147
Researchers: Regarding distribution channels, what do you prefer?
Simon Andersson: We do prefer to use our own distribution channels.
Researchers: This means as few as possible extern vendors and distributions channels?
Simon Andersson: Yes, exactly. Regarding synergies, when buying targets, sales synergies are very
important. In research of new markets, we look at markets, which are low in sales, but trending.
Here we can buy cheaply. In markets where sales are high, and the trend is upward going, the price
is high as well. However, we assess this at the time. We initiate an intern process with due diligence
and extern consultants to help us on this matter.
Researchers: What are the risks and challenges in the longer run?
Simon Andersson: In Italy, we are unique. We sell the Ceres Premium Ale which is an expensive
beer. Everyone in Italy knows the beer. It is not the most sold beer in Italy and it can be compared
to a specialty beer in Denmark. The Italians drink the beer from the bottle and not served in a glass,
since they want to be seen drinking the beer. The company we just acquired has the same status,
however within soft drinks. Both products are sold at restaurants. As both products are premium
products, they complement each other very nicely. LemonSoda has 23% fruit as ingredients, and all
the citrons are from Sicilia. All in all, the complementary synergy has been deciding factor in
choosing these companies, as the customer segment is very much the same for both of them.
However, we hope to sell beers to those we do not sell soft drinks yet and opposite as well.
Researchers: As you just mentioned regarding the citrons for LemonSoda are unique and from Sicilia, which makes the
product premium, is this also applied for your beer products?
Simon Andersson: No. Everyone can brew beers and it is more the processes that can be unique, for
example which yeast you use. Heineken has developed a unique yeast cell, which has been the
history of their products and what they are known for. No one else uses that yeast cell. We have also
our own yeast strain, as we have developed through the years. Besides the yeast, water and humble
are available to all, and therefore the commodities in not unique for us, but the way brewery experts
use the composition of the these is unique for the taste. We have made an agreement with
148
Kissmeyer, who were the founder of Nørrebro Bryghus, a great success of a microbrewery. Not long
ago he was pointed out as the best brewery master in the world. He is now a part of the
development of new beers. When we introduce new products to markets all over the world,
primarily craft beers, consumers want him to sign their beers. For example in Canada they know
him.
If we turn back to the Ceres strong ale, it is within top ten of beer brands in Italy. The knowledge of
the brand can roughly be compared to the knowledge of Ferrari. It is produced in Denmark and
imported to Italy, which is a part of the brand as it can be associated with Vikings.
Researcers: What trends do you see in the market currently?
We have established a microbrewery in Albany brewery in Odense, where can eat food and drink
specialty beers while looking through a glass window to see the production process of the beers. This
have also been done in Hartwall in Finland. Our focus here is to introduce lots of new specialty
beers.
Researcher: So it is the market for specialty beers, which will be the driver for higher turnover?
Simon Andersson: Yes, the market in Europe for non-specialty beers are stagnated or even decreasing and
we do not believe that it will do otherwise in the future. Water is the most consumed liquid whereas tea is the
second, and beers are the third.
Researcher: Which new market would be interesting for you to enter?
Simon Andersson: If it is possible to unite the North, hereunder Denmark, Finland, Norway and Sweden,
this will be fantastic due to synergies within logistic, production freight etc. In addition, the customer segment
is the same and the brands could be sold across the countries. Hansa Borg and Spendrup in Sweden are
family owned. Therefore, they have different interests and are not easily acquired. And the German market
is a giant market with lots of different breweries and therefore difficult to acquire significant market shares.
US have too many actors as in Germany to be interesting right now. Spain, France and Italy would definitely
be interesting market to enter. In fact, Spain would be a great opportunity. In Spain, three major actors
imprint the market. Heineken distributes a brand named Cruzcalbu, which we sold in Denmark not long ago.
Else it is Estrella and San Miguel, which control the market.
149
Researchers: If we look at your corporate strategies, one of them concerns financial flexibility. How is your financial
foundation?
The financial foundation for new acquirements is there. We do have a low gearing, approx. 1 times
(so 50/50 debt/equity ratio). However, since the failure in Poland, we are much more aware of the
risks and research much more extensively when screening for new targets.
Researchers: If we stay within your corporate strategies, one of them concerns locally based and significant market
positions. How is this seen?
Simon Andersson: If we look at Italy and Ceres, it is actually an import history as it starts back in
the 60’s. Back then, a Danish firm named Tulip sold ham to the Italians and with in the trucks, a
small percentage was also beers. Through the years, the relationship changed such as the beers filled
more and more in the trucks. In the end, Tulip abandoned their position in Italy and we continued
our business. This is a great example of if you underplay your position, you end up with significant
market shares since no one ‘keeps an eye’ on you. Hereby the brand has created its own history and
not just pure marketing. This has created an approx. 80 % of the market share within strong ale in
Italy. However, it is not the most consumed segment of beers. Nonetheless, it is a very profitable
segment due to high prices.
150
Appendix 4: Interview questions for Carlsberg
• Who do you see as the biggest competitors in the beer industry?
• What do you see as substitutes for beer?
• What entry barriers do you see for the beer industry?
• How would you describe the bargaining power of buyers?
• How many suppliers are there for the beer industry? Countless or is the market dominated by a few big ones?
• How would you describe the bargaining power of suppliers?
• In relation to the political situation in Spain, how could that affect the beer industry directly or indirectly?
• Are there any specific laws to be aware if a brewery attempts to enter the Spanish market?
• How do you see technology in Spain in regards to the beer industry?
• How is the beer culture in Spain?
• Are Spain concerned with the environment and the size of their carbon footprint?
151
Appendix 5: Interview with Carlsberg
Researchers: What is your role in Carlsberg?
Iben Marie Bason: I am Marketing Director in Carlsberg, which in a way tells what it is I do. I am handling
product prices, where we are and what we are selling and so on, or the team, which I am sitting with, does it.
Researchers: How long have you been with Carlsberg?
Iben Marie Bason: I have been there 1,5 years I think.
Researchers: How do you see the competition on the beer market?
Iben Marie Bason: Are we talking Europe, Denmark, Spain or what?
Researchers: We are talking Europe.
Iben Marie Bason: I think the competition is quite high with a lot of consolidation throughout the years. The
large competitors have collected very much… Beer is a very decentralized category and there exist many
small local beer brands everywhere, so the large beer volume is not made of the large brands but is just as
much made of the smaller brands. Then there are a few large beer brands that you know like Corona and all
these, but there are many local brands which we do not necessary know in other countries.
Researchers: And what about the future competition? There is a lot regarding special beers and microbreweries, which are currently
booming. Do you see that as a potential opportunity?
Iben Marie Bason: Yes. There is a lot going on there and I think it is very natural. So far it has really been
one thing where many have gone the pilsner-way, which is something that happen when the big breweries
brands up and consolidate and synergies emerges. That makes the product supply very uniformed and
sometimes there are a lot and sometimes there are few. There is always an opposite trend to a trend.
Researchers: What about substitutes? Do you for example see a trend where consumer substitutes pilsners with non-alcoholic beers
and so on?
152
Iben Marie Bason: Basically, you look a people’s need, and not specific beers, but instead focus on why
people drink. What is the need and where do people drink, and by asking these questions you can find a lot
of your answers. By first asking yourself why people drink and then ask what people drink to satisfy that need.
I think there are a lot of trends who affect this, for instants, moderation where you focus on consumption of
alcohol. People are more aware of how much they drink and how many calories they consume. For example,
the lunch beer is not a part of the Danish market anymore and that we see the same in other countries in
Europe. So it is general things like this that affect why and what people drink. People are not necessarily
drinking less, but at least on different time during the day. Maybe the weekend is a more interesting time to
drink for some people. If you look at why people drink then the answer might be because of the beer, but
instead what is around of the beer. The social component and the togetherness and nowadays men does not
necessarily meet over a beer, but maybe a cup of coffee, which makes coffee an important substitute. This
way it is important to look at why people drink and not what they drink.
Researchers: Besides coffee, what do you see as substitutes?
Iben Marie Bason: There exist many substitutes and it depends on where you are. Wine is has been more
and more popular during the last couple of years and I think it is because beer has not been trying to make
itself interesting and relevant. Beer is represented in everyday grocery stores and is therefore easier to pick
one in the super market. It is more normal to pare a wine with food than it is to compare beer with food. You
do not use the category the same way.
Researchers: How do you see the bargaining power of the buyers? Is there a loyalty towards brands or do consumers choose
whatever?
Iben Marie Bason: I definitely think there is a certain loyalty towards brands and not just choose whatever.
There has been a huge price war where Royal Unibrew and Carlsberg have supported well. It is the market
that sets the prices so beer has been used as a traffic category, which does not do anything for the category,
or the brands. But if the price of a beer is suddenly raises very much for no apparent reason, then the brand
will of course lose customers. In that sense, the loyalty is only limited since very few buyers would stick with
their favorite brand of beer regardless of the price. After all, it is the customer that is the demand part and
the demand part, as you know, controls a whole lot when it comes to business. This is just the en consumer.
The buyers of the industry is of course also restaurants, bars and of course retail stores, where most of the
beer is sold through.
Researchers: So if a brand raises the prices you would see that the price elasticity is crucial in regards to what brands you would
choose?
153
Iben Marie Bason: Yes, of course. Beer can be more than what it is today.
Researchers: In regards to suppliers, you have suppliers for water, malt, sugar and other raw materials needed to produce the beer.
Is there a lot of suppliers or are the different companies using the same suppliers?
Iben Marie Bason: A lot of the raw materials are depended on a harvest and due to that it is not possible to
just start a production of hops. It takes time to produce a certain amount and quality. Certain suppliers are
better than others, in regards to raw materials, since the processing is different. Carlberg, for example, only
uses she hops, which has a different taste than the he hops. So the selective process of raw materials is, among
other things, what makes the difference. Usually there are a lot of the same suppliers used on some things,
but certainly not for everything. For example, organic raw materials are harder to get.
Researchers: So, besides the ingredients to make beer, are there any other materials that needs to be supplied to the beer industry?
Iben Marie Bason: Yes, of course. There is the packaging of the beer, which means cans and glass bottles,
labels that needs to be printed on the bottle. These are important as well.
Researchers: And how many suppliers are there relative to breweries?
Iben Marie Bason: Well, of course comparing to the number of breweries there are many, many breweries,
as I mentioned before, so it is difficult to answer. If we forget, for a second, the large numbers of breweries
then there are many companies that can supply cans and glass bottles as well as labels printed to the bottle.
At least we don’t see it as an issue. Again, just as raw materials for the beer, if you want something very very
special then the option are limited, but if you are looking for a sort of normal cans, then there are many
possibilities.
Researchers: How about the entry barriers to the industry? Where are not only talking about small microbreweries, but also large
breweries.
Iben Marie Bason: Well, everybody can brew beer. I mean, you can do it at home if you like. So, entry
barriers, in that sense, are incredibly low. Almost every small city has their own brewery, so it is very easy in
that way. On the other hand, it is very difficult to gain foothold especially since the retail are so consolidated
and only wants a few brands. This way just because it is easy to brew beer, does not mean that you can sell it
easily. For large breweries, investing in large production plants do of course require lots of capital.
Researchers: In relation to the political situation in Spain, how could that affect the beer industry directly or indirectly?
154
Iben Marie Bason: Well, if you look a Muslim countries then non-alcoholic is a big opportunity, because they
do not drink alcohol, but they want to be a part of the community and get together and drink a beer. This is
of course not political, but more religious, but security in a country is of interest as well. Certain industry
securities such as tariff securities. Carlsberg went in to Russia and made a large bet 10 – 15 years ago, and
that still hurts. It is about how you make the global footprint and what is associated with this. There a some
certain countries like Western Europe, but there is not that much growth. Then there are certain
geographical bets where we bets everything on that market and sometime it does not holds up. So the
political reflection means a lot. In regards to Spain they are experiencing some instability due to the
independence of Catalonia. If this will affect beer market is difficult to say, but what is certain is that
instability brings instability to the business. I am afraid that you have to answer one last questions now, since
we are running out of time.
Researchers: When looking at a new country, are there any environmental challenges associated with this?
Iben Marie Bason: Of course we look at environmental challenges. We look at what load we cover, what
work force we bring, how are local work conditions and how are our work principles. We also have to
interpret what the ethical principles are and how are things done and how do we do this best and how can
we have a competitive advantage from this. It could be salaries, work hours, work conditions, water
discharge: how clean should d it be. Carlsberg has had some cases where we get cleaner water than what is in
the river to begin with. So it always interesting to see how it is, but I definitely think that you need to be
concerned with this. It is never at a still stand, it always changes so you can’t just test it once. It might also be
difficult to get honest inputs.
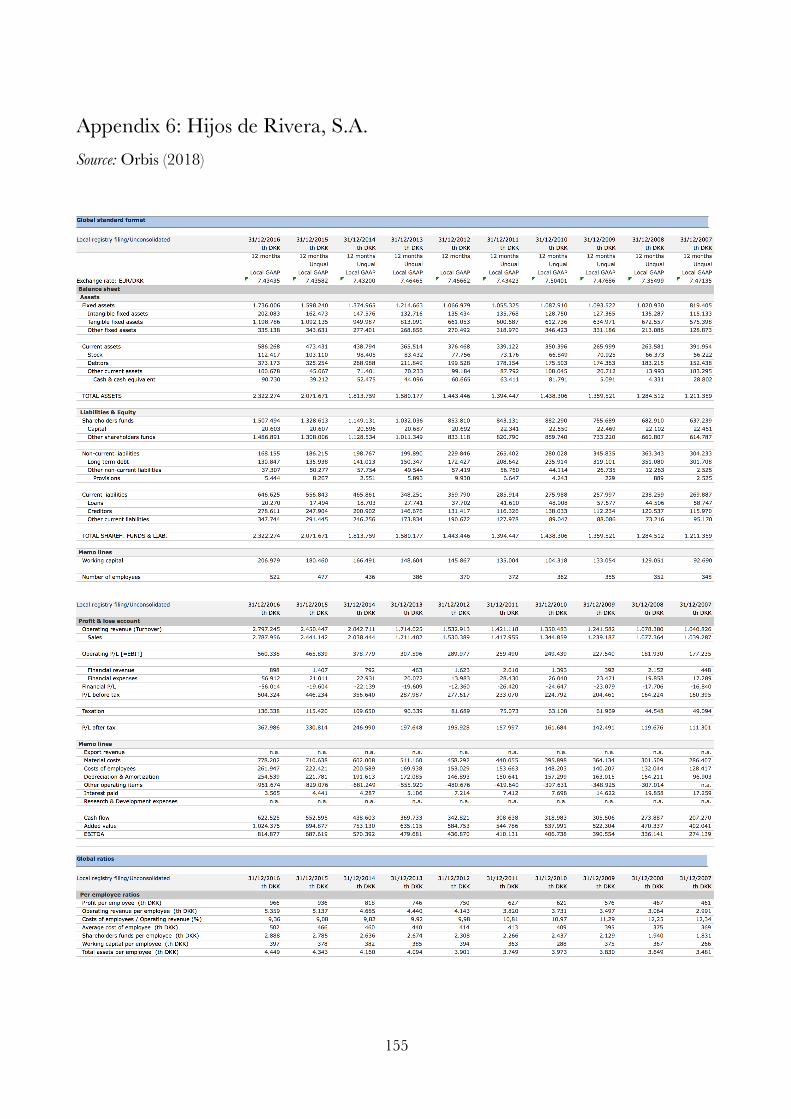
155
Appendix 6: Hijos de Rivera, S.A. Source: Orbis (2018)
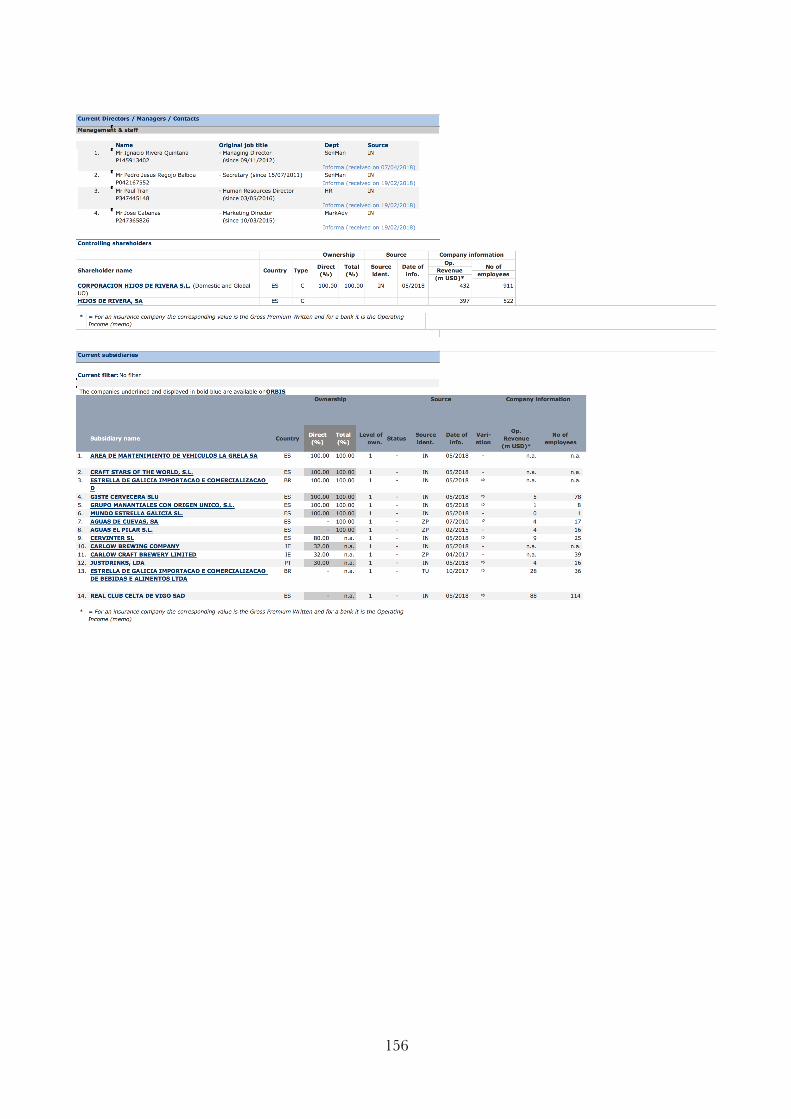
156
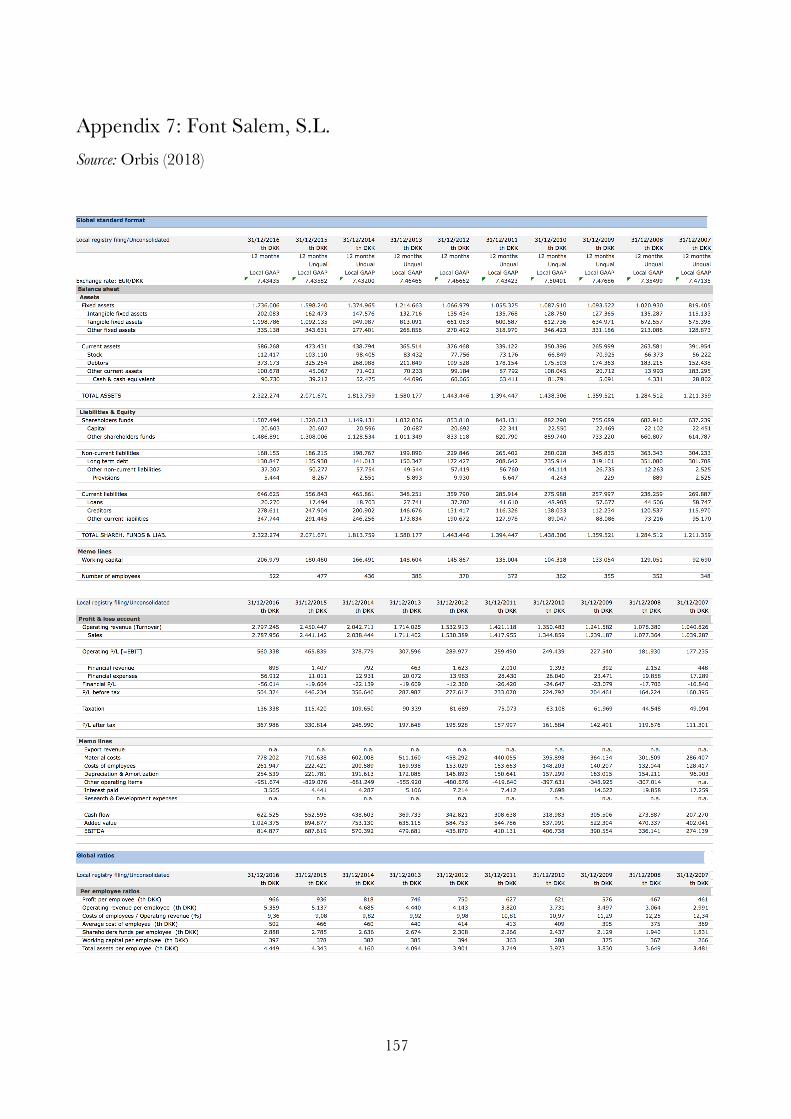
157
Appendix 7: Font Salem, S.L. Source: Orbis (2018)
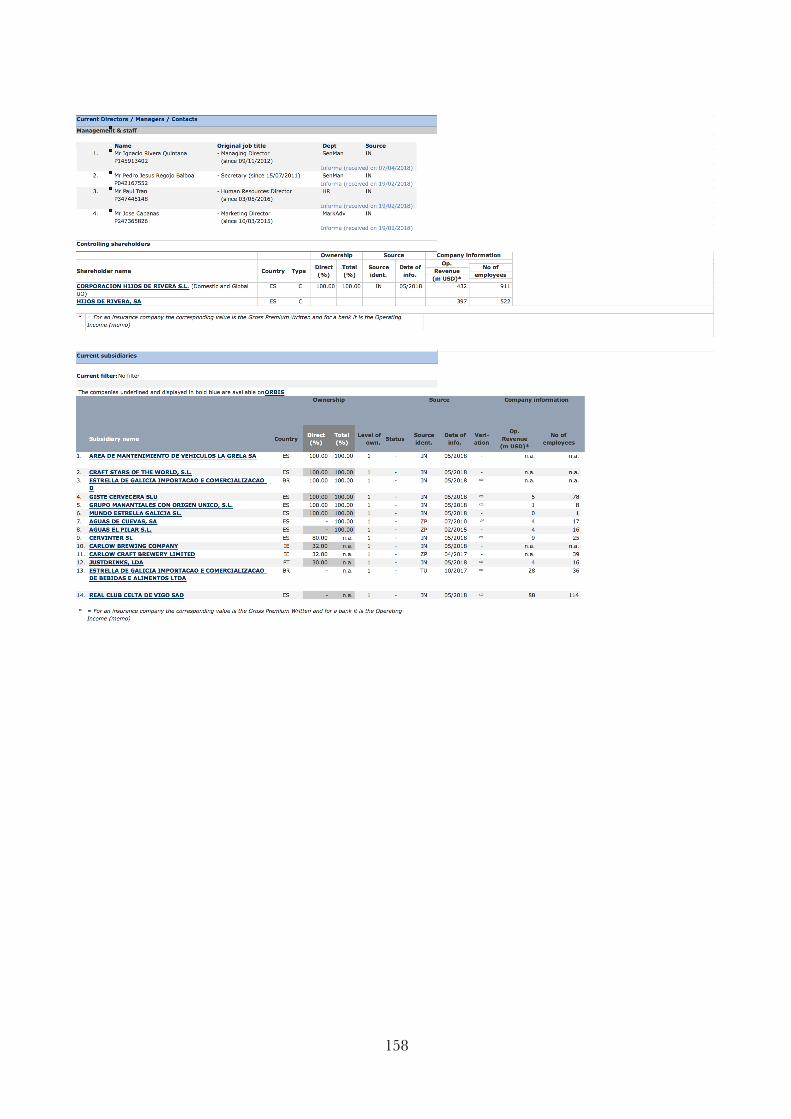
158
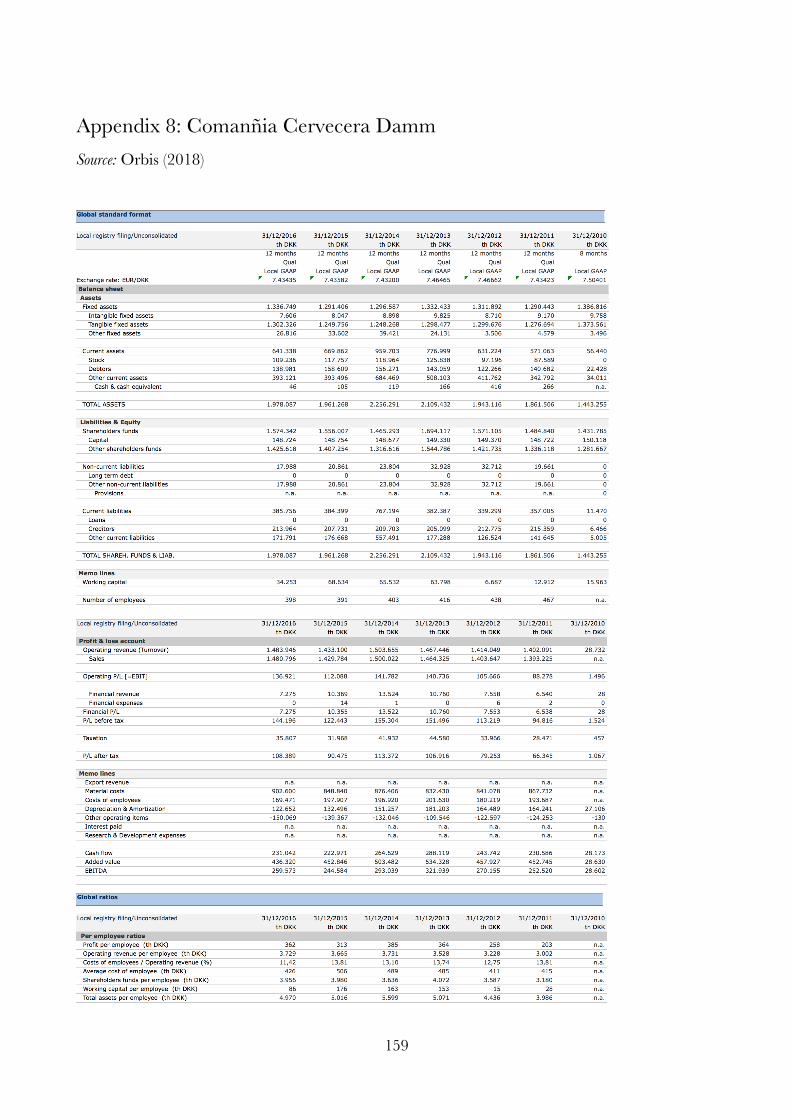
159
Appendix 8: Comanñia Cervecera Damm Source: Orbis (2018)
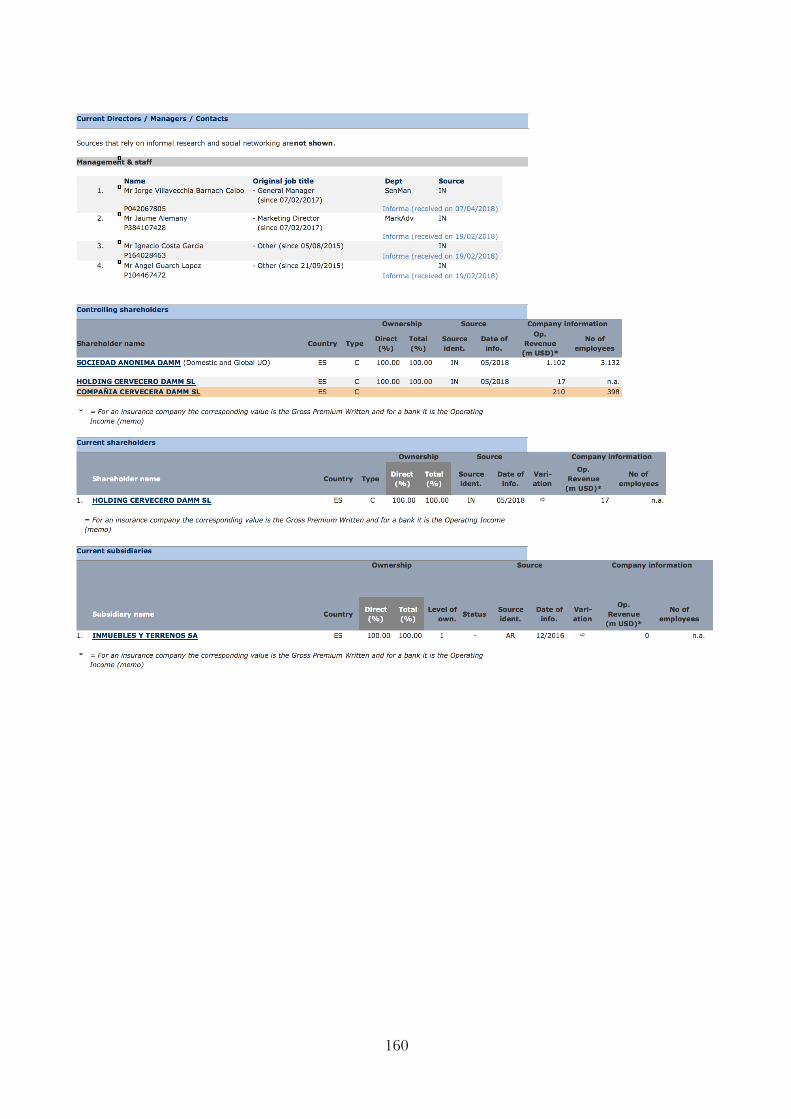
160
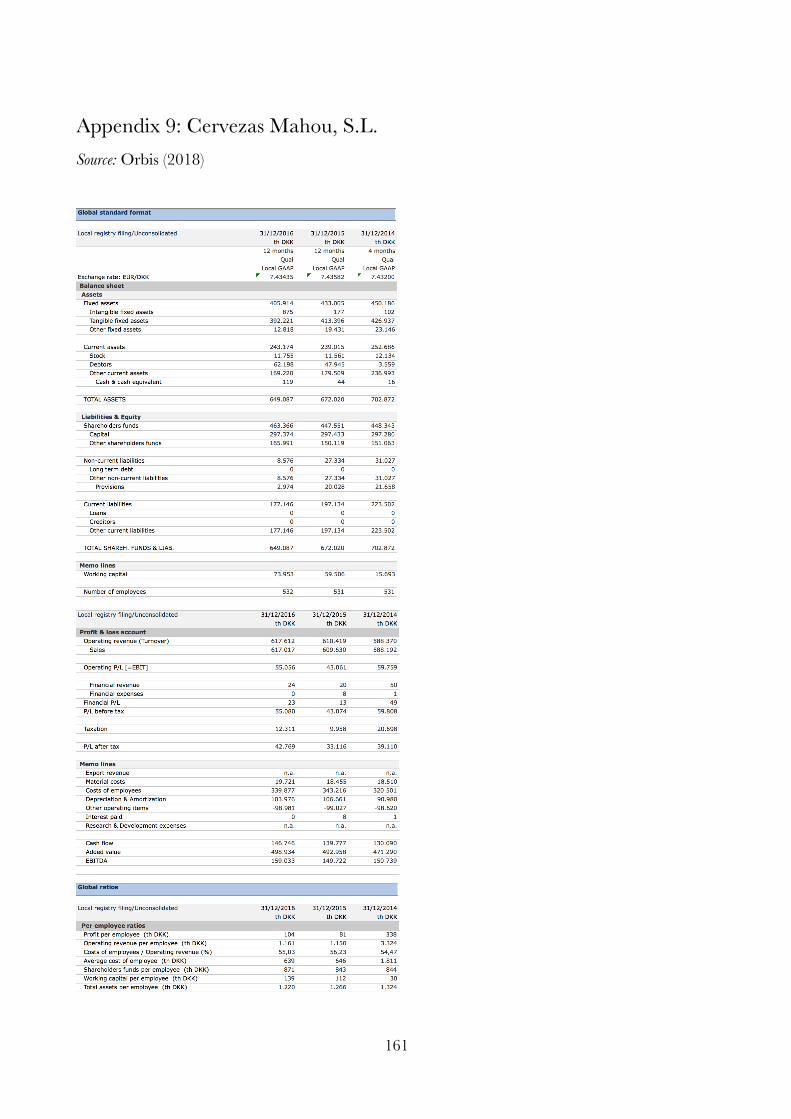
161
Appendix 9: Cervezas Mahou, S.L. Source: Orbis (2018)
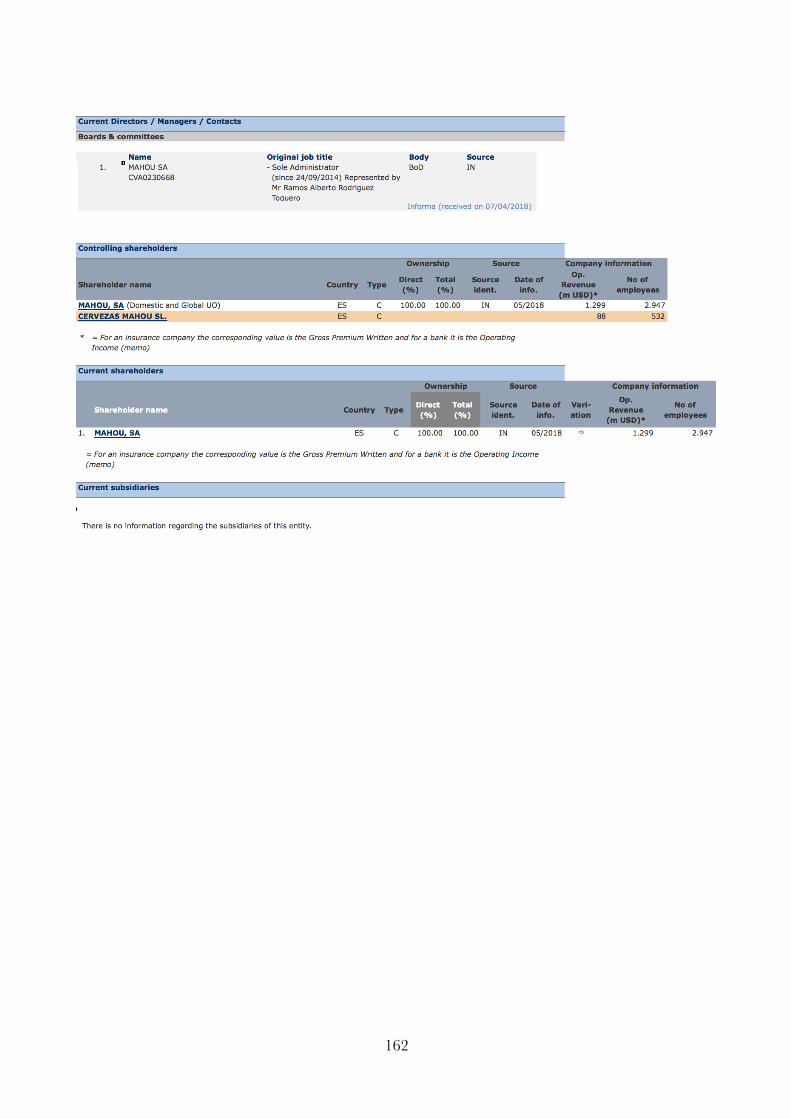
162
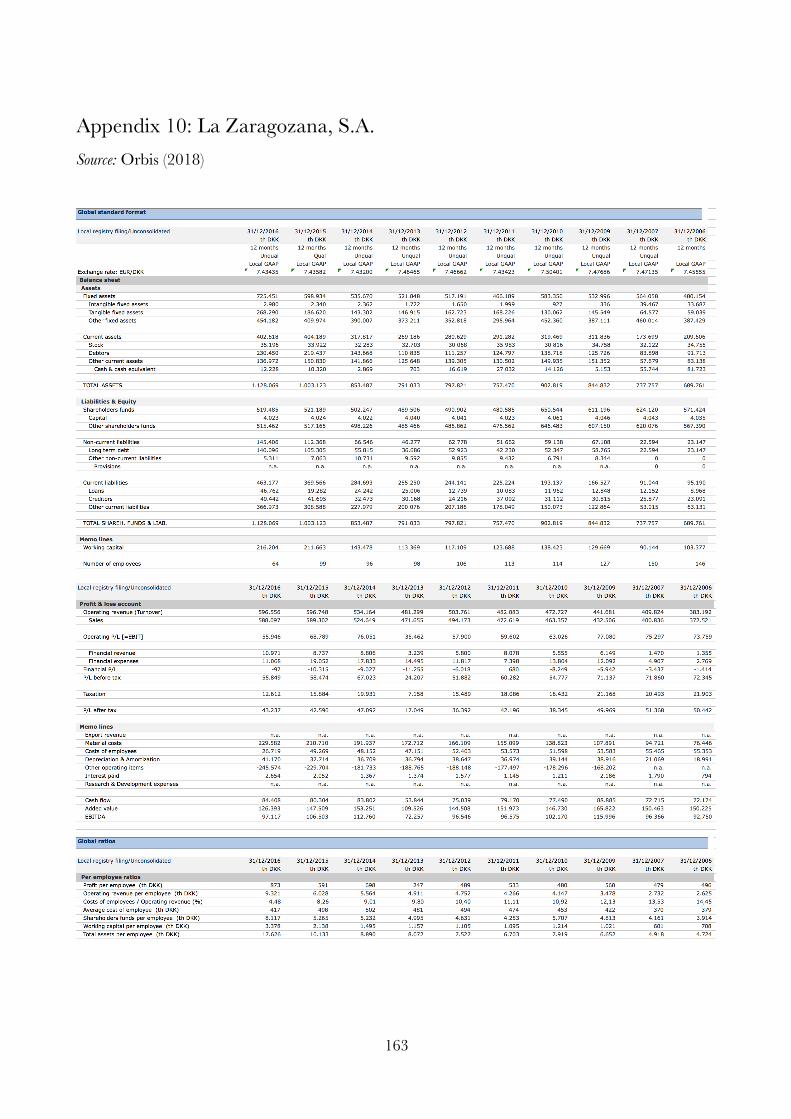
163
Appendix 10: La Zaragozana, S.A. Source: Orbis (2018)
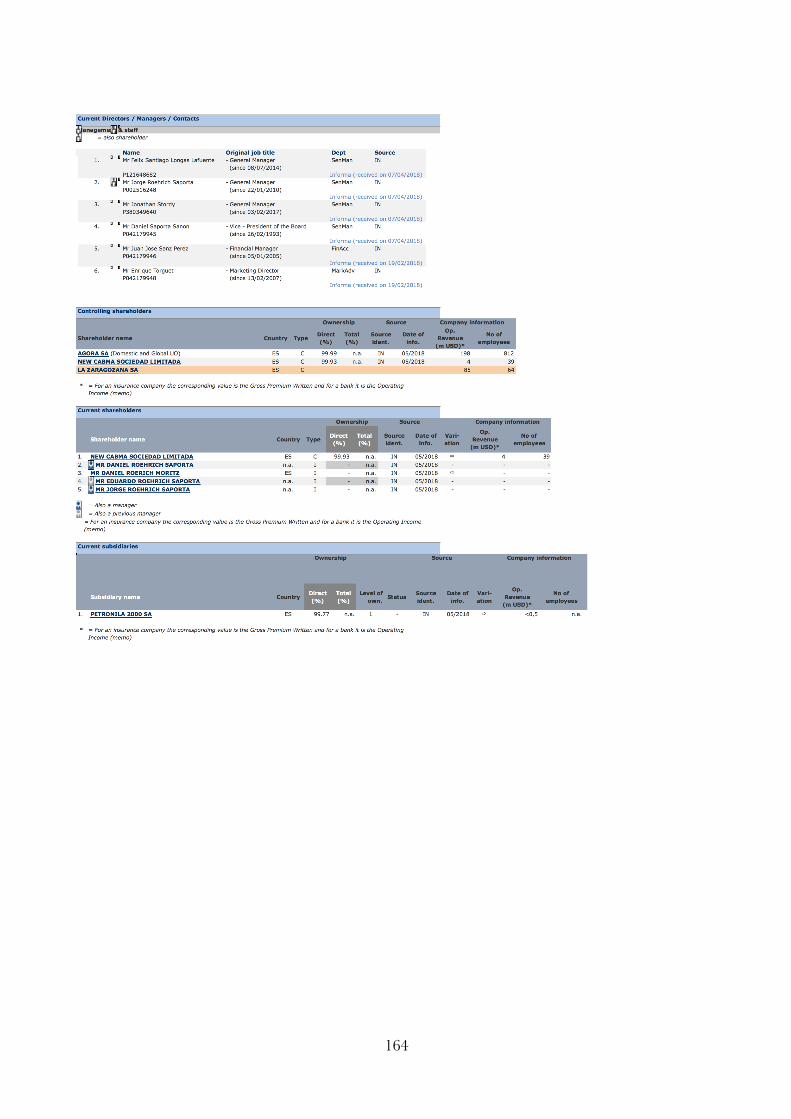
164
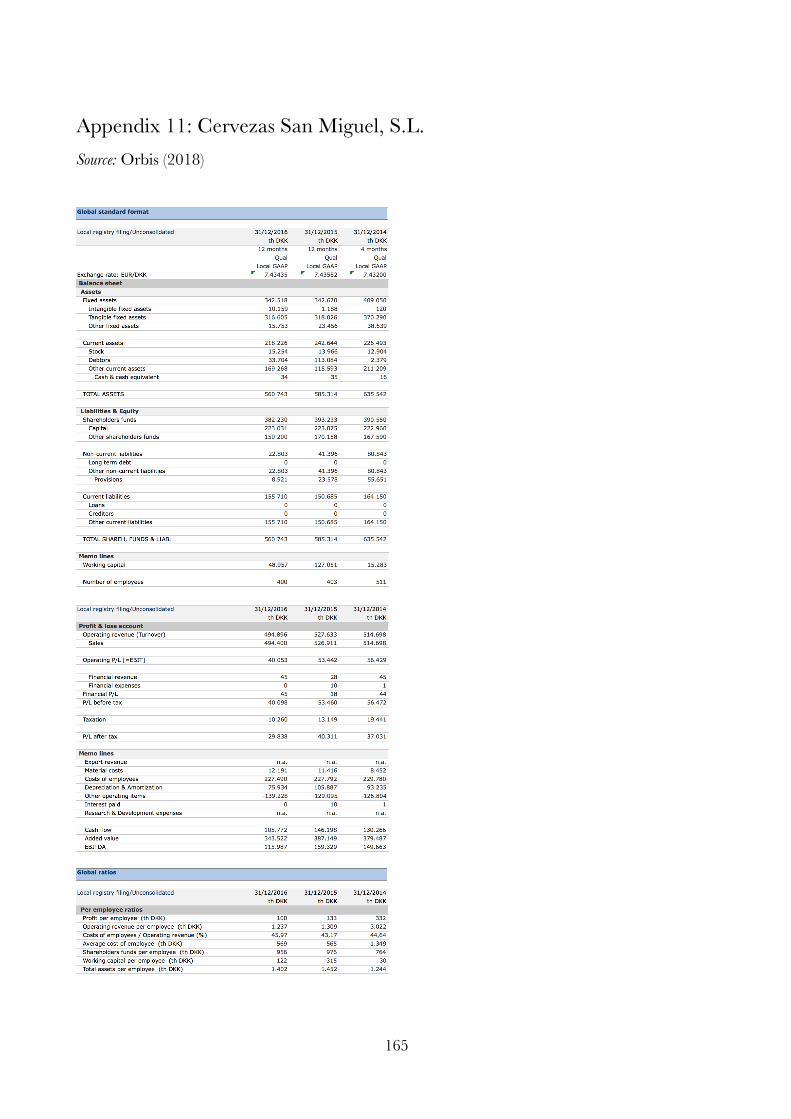
165
Appendix 11: Cervezas San Miguel, S.L. Source: Orbis (2018)
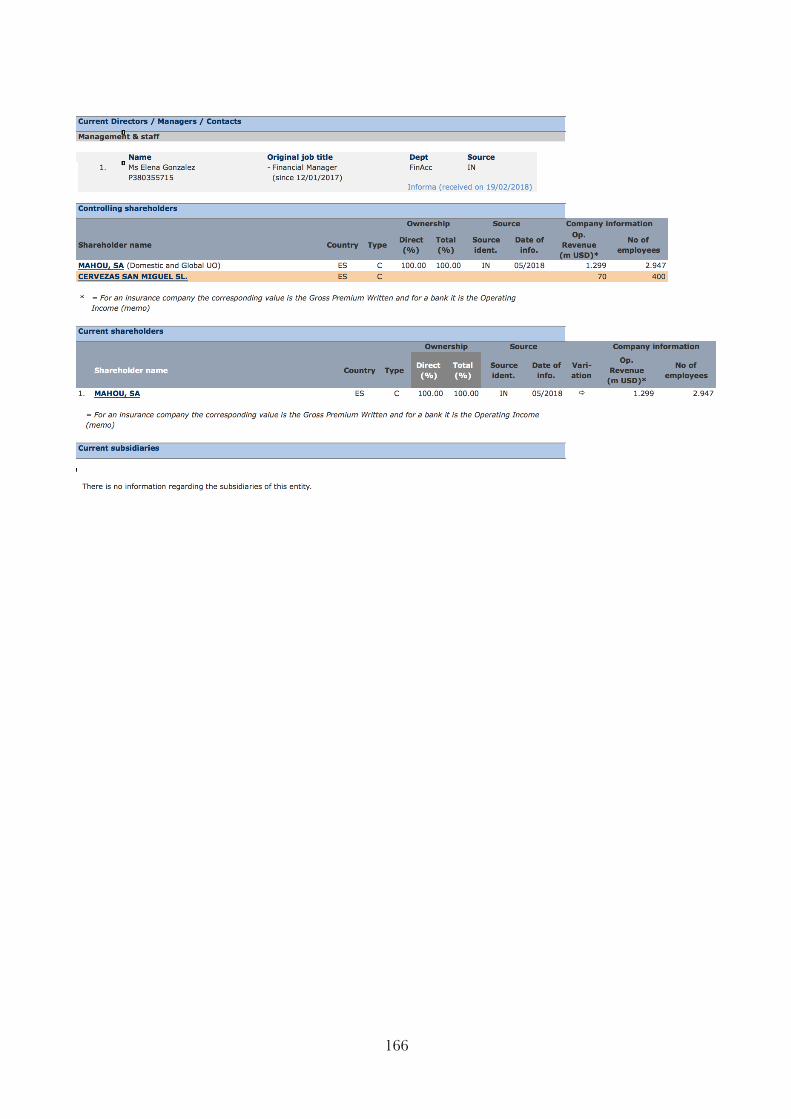
166
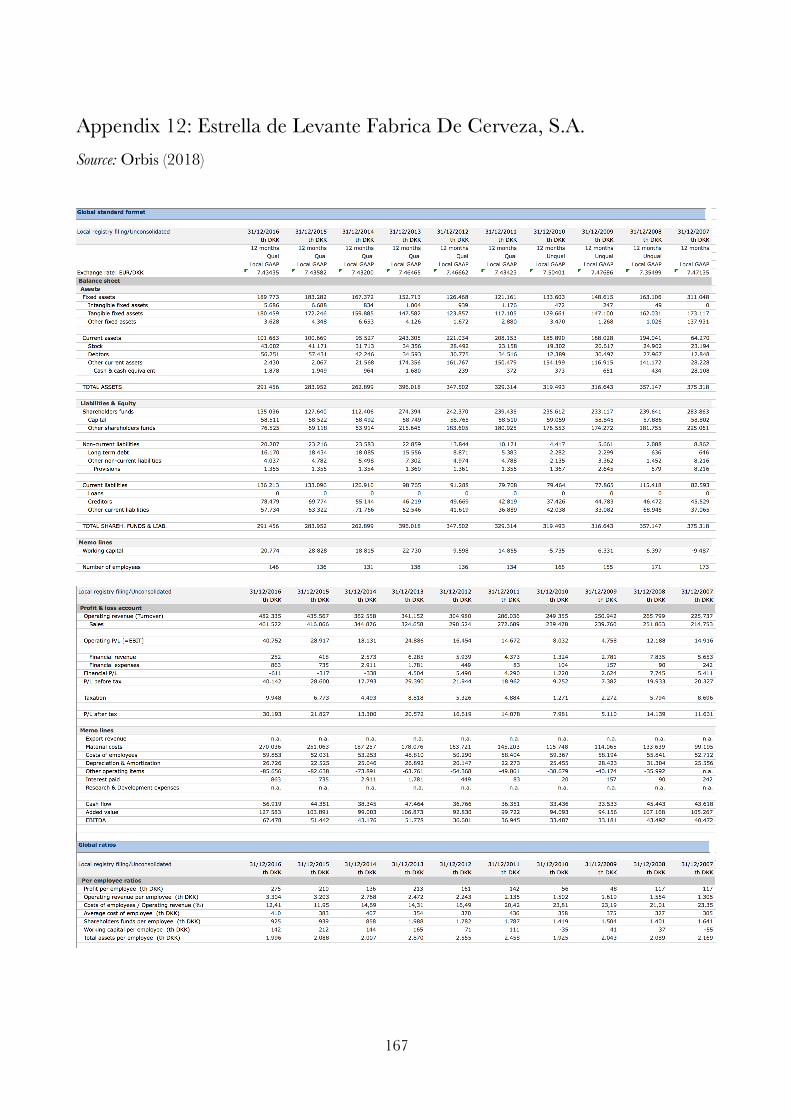
167
Appendix 12: Estrella de Levante Fabrica De Cerveza, S.A. Source: Orbis (2018)
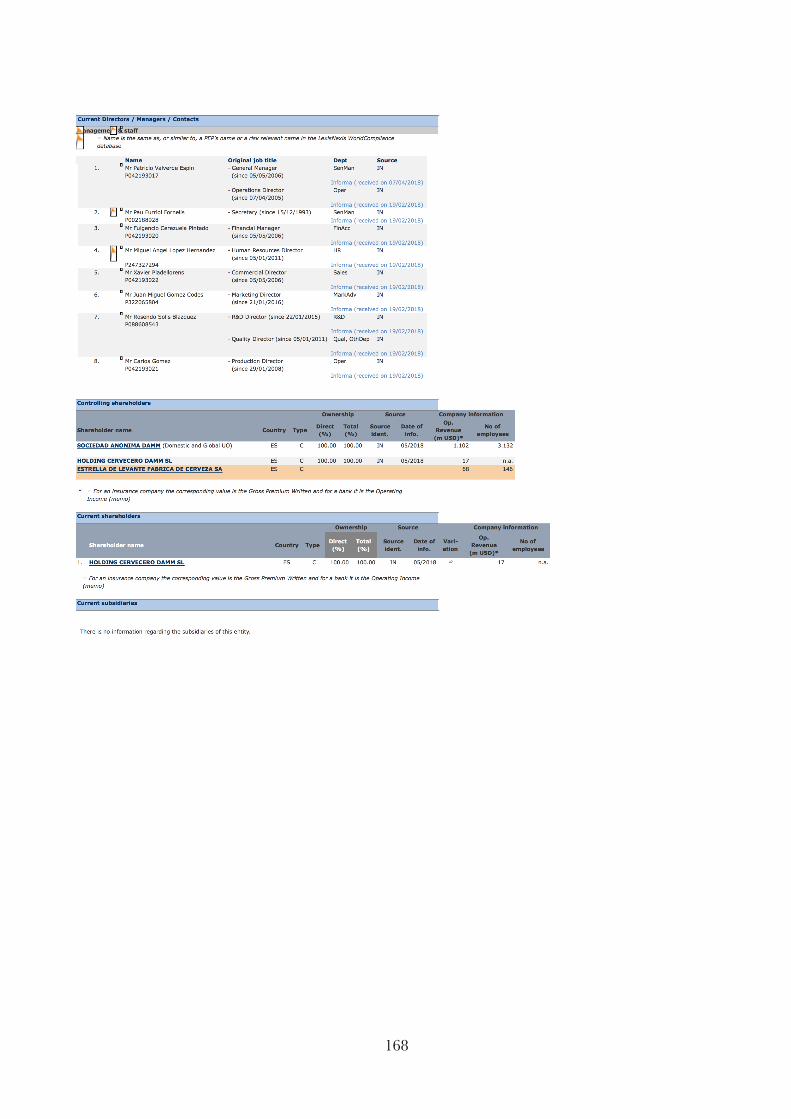
168
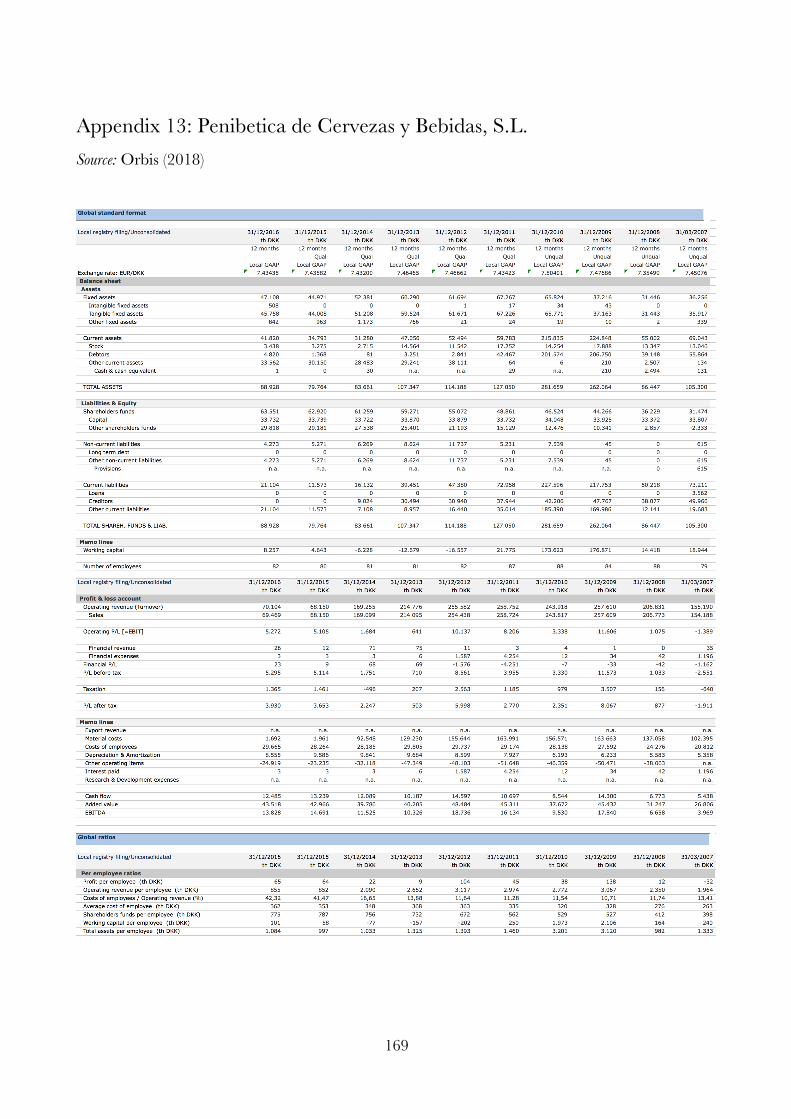
169
Appendix 13: Penibetica de Cervezas y Bebidas, S.L. Source: Orbis (2018)
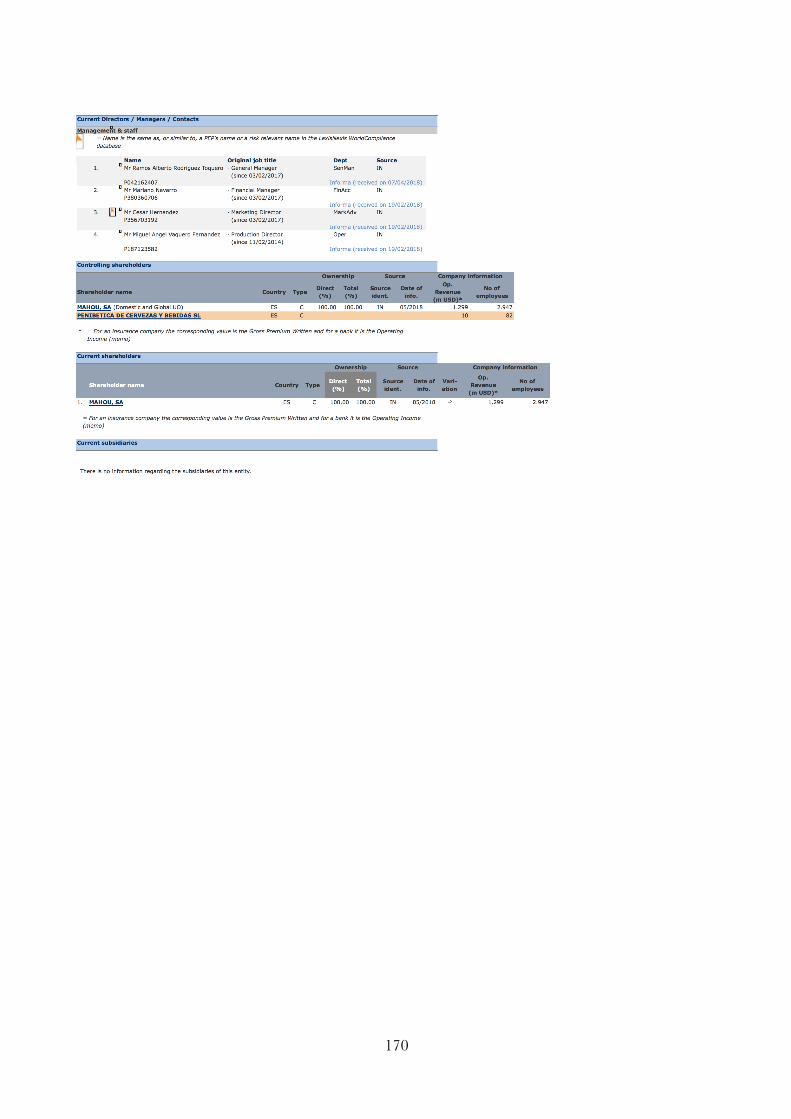
170
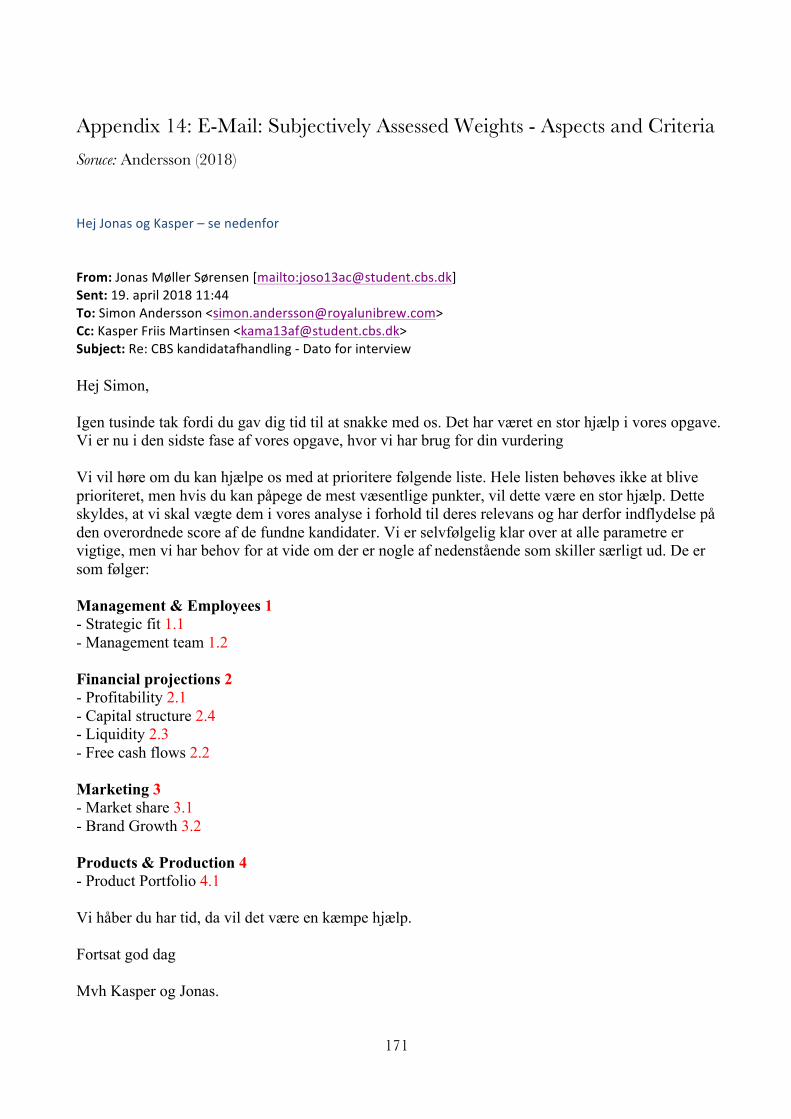
171
Appendix 14: E-Mail: Subjectively Assessed Weights - Aspects and Criteria Soruce: Andersson (2018)
HejJonasogKasper–senedenfor From:JonasMøllerSørensen[mailto:[email protected]]Sent:19.april201811:44To:SimonAndersson<[email protected]>Cc:KasperFriisMartinsen<[email protected]>Subject:Re:CBSkandidatafhandling-Datoforinterview Hej Simon, Igen tusinde tak fordi du gav dig tid til at snakke med os. Det har været en stor hjælp i vores opgave. Vi er nu i den sidste fase af vores opgave, hvor vi har brug for din vurdering Vi vil høre om du kan hjælpe os med at prioritere følgende liste. Hele listen behøves ikke at blive prioriteret, men hvis du kan påpege de mest væsentlige punkter, vil dette være en stor hjælp. Dette skyldes, at vi skal vægte dem i vores analyse i forhold til deres relevans og har derfor indflydelse på den overordnede score af de fundne kandidater. Vi er selvfølgelig klar over at alle parametre er vigtige, men vi har behov for at vide om der er nogle af nedenstående som skiller særligt ud. De er som følger: Management & Employees 1 - Strategic fit 1.1 - Management team 1.2 Financial projections 2 - Profitability 2.1 - Capital structure 2.4 - Liquidity 2.3 - Free cash flows 2.2 Marketing 3 - Market share 3.1 - Brand Growth 3.2 Products & Production 4 - Product Portfolio 4.1 Vi håber du har tid, da vil det være en kæmpe hjælp. Fortsat god dag Mvh Kasper og Jonas.
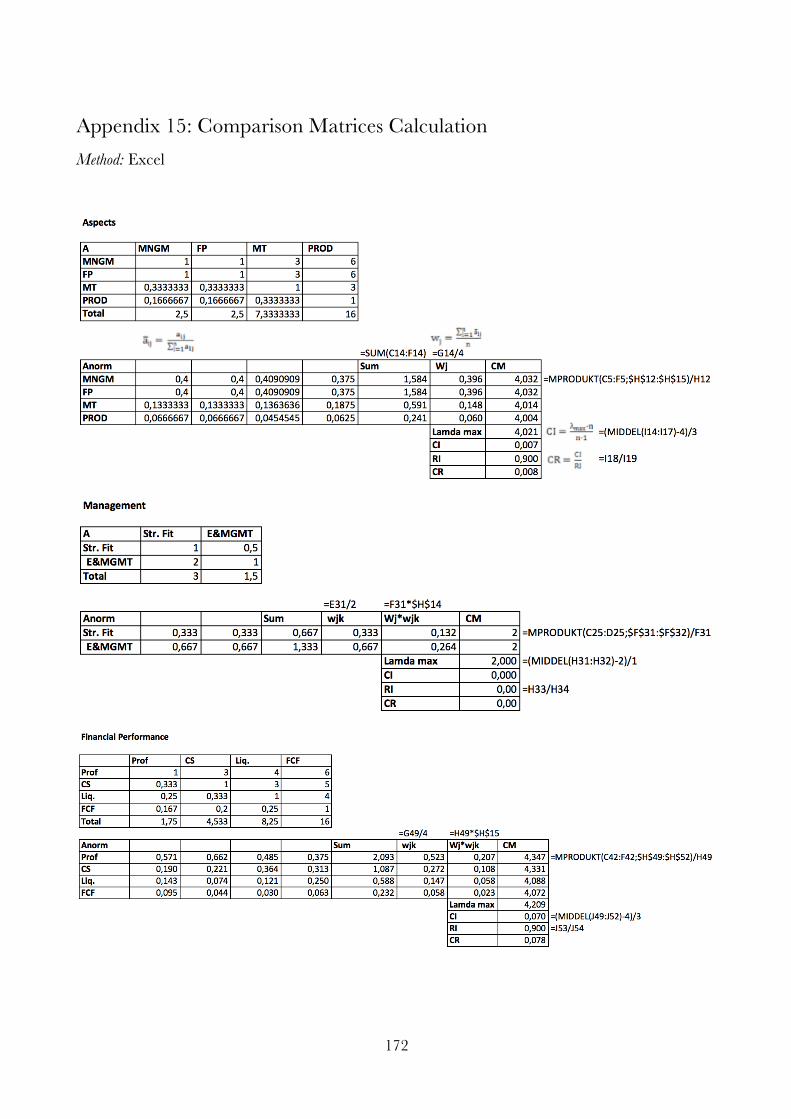
172
Appendix 15: Comparison Matrices Calculation Method: Excel
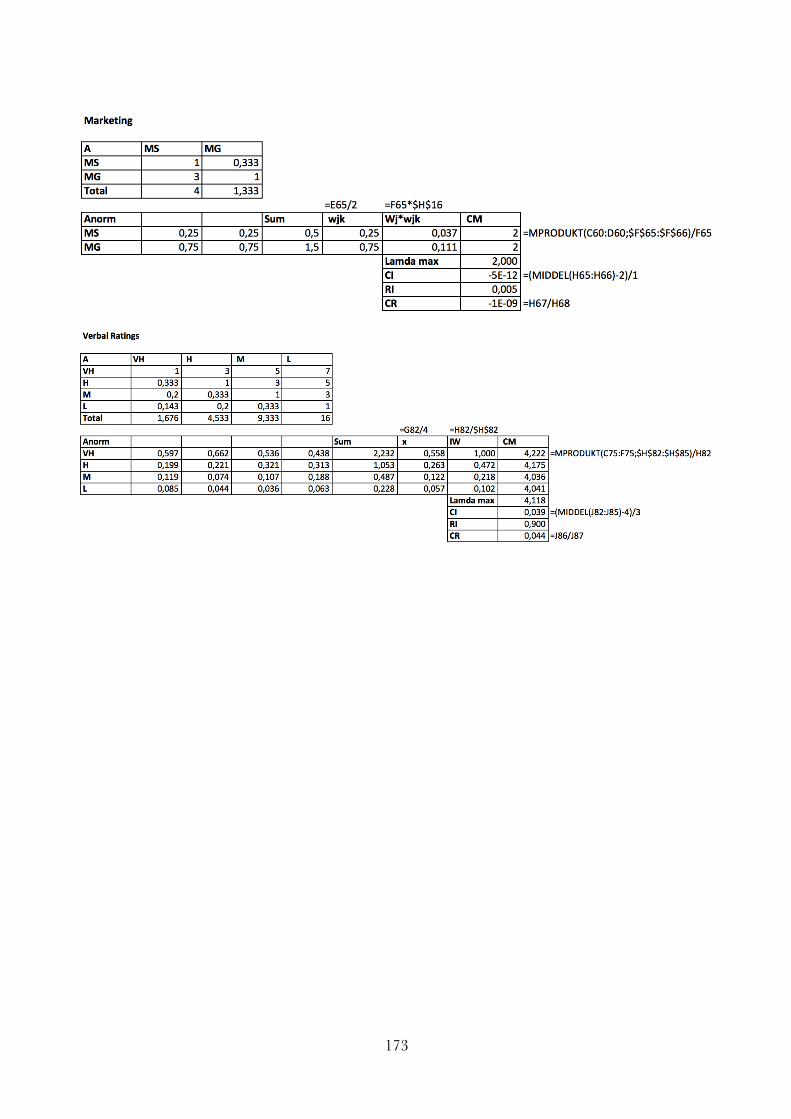
173
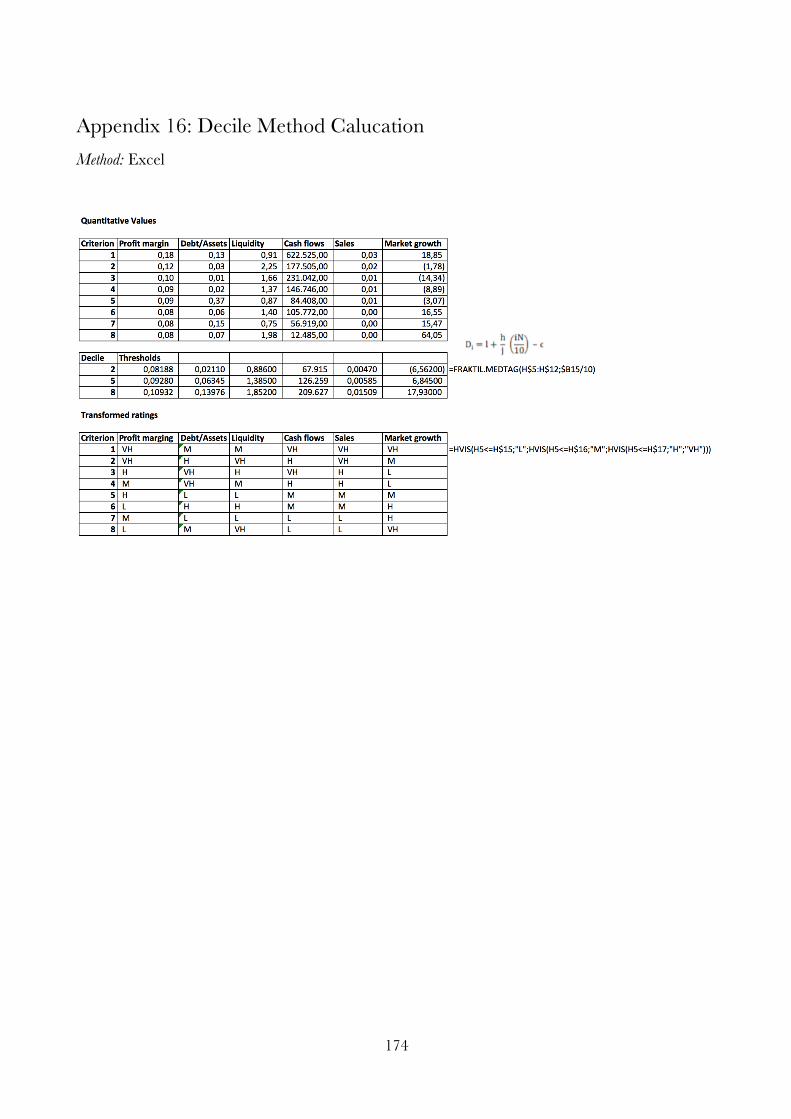
174
Appendix 16: Decile Method Calucation Method: Excel
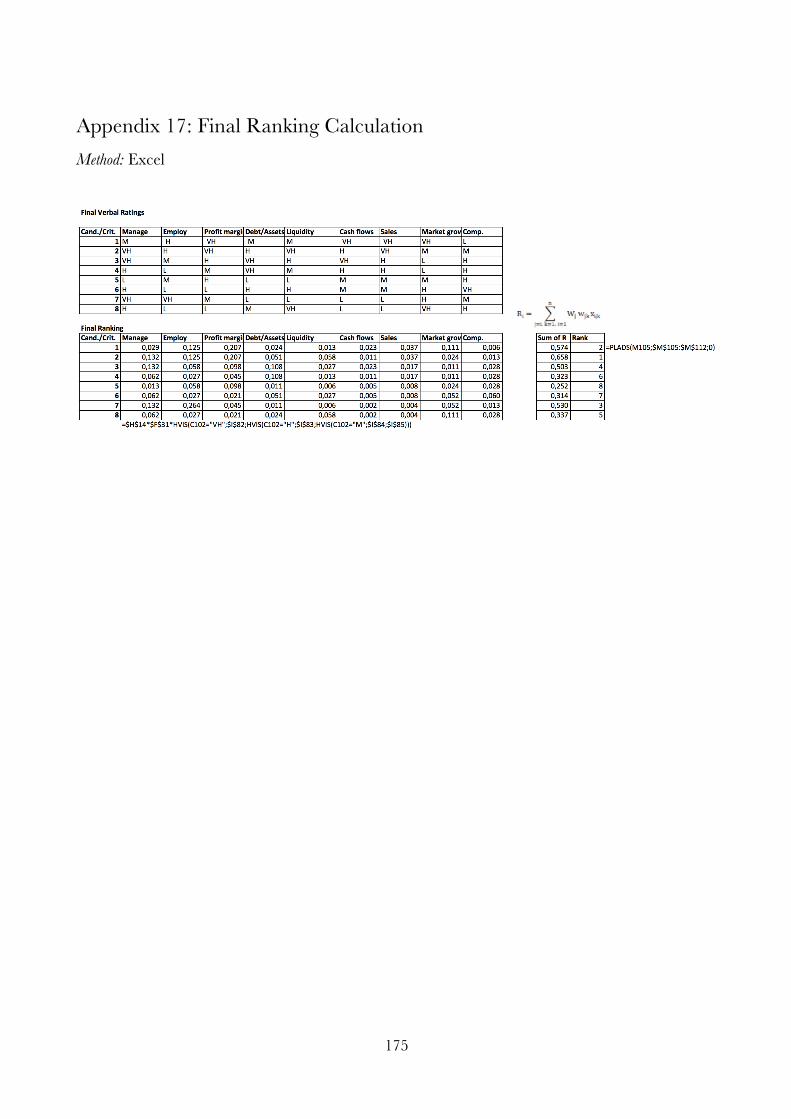
175
Appendix 17: Final Ranking Calculation Method: Excel


