IgE, Allergy, and Risk of Glioma: Update from the San FranciscoBay Area Adult Glioma Study in the Temozolomide Era
Joseph L. Wiemels1, David Wilson2, Chirag Patel3, Joseph Patoka1, Lucie McCoy1, TerriRice1, Judith Schwartzbaum4, Amy Heimberger5, John H. Sampson6, Susan Chang1,Michael Prados1, John K. Wiencke1, and Margaret Wrensch11 Departments of Neurosurgery and Epidemiology and Biostatistics, UCSF2 UCSF/UC Berkeley Joint Medical Program, Ohio State University3 Department of Neurosurgery, Stanford, Ohio State University4 Department of Epidemiology, Ohio State University5 Department of Neurosurgery, University of Texas MD Anderson Cancer Center6 Department of Pathology, Duke University Medical Center
AbstractThe consistently observed inverse relationship of allergic conditions with glioma risk and ourprevious demonstration that IgE levels also were lower in glioma patients than controls suggest thatatopic allergy may be related to a mechanism that inhibits or prevents glioma. We sought to extendthese results with a new and larger series of patients (n=535 with questionnaire data; 393 with IgEmeasures) and controls (n=532 with questionnaire data; 470 with IgE measures). As expected, gliomacases were less likely than controls to report history of allergies (among self-reported cases, OR =0.59, 95% CI: 0.41–0.85). IgE levels also were lower in glioma cases versus controls (OR per unitlog IgE=0.89, 95% CI (0.82–0.98). However, this inverse relationship was only apparent amongcases receiving temozolomide, a treatment which became part of the “standard of care” forglioblastoma patients during the study period. Among patients receiving temozolomide, IgE levelsin cases whose blood samples were obtained within 30 days of diagnosis were slightly higher thancontrols, while IgE levels in cases whose blood sample was obtained >60 days after diagnosis weresignificantly lower than controls (OR = 0.80; 95% CI: 0.71–0.89). Thus, while our results robustlyconfirm the inverse association between allergy and glioma, the results for IgE are affected bytemozolomide treatments which may have influenced IgE levels. These results have implications forthe study of immunologic factors in glioma as well as for immunotherapy protocols for treatingglioma.
INTRODUCTIONApproximately 14,000 patients are diagnosed with a glioma each year in the United States.The etiology of adult glioma is largely unknown and is thought to be multi-factorial; variousgenetic, infectious and immunological factors have been implicated1. Recent epidemiologicalstudies have reported that adults with glioma are 1.5 to 4-fold less likely than controls to reporta variety of allergies2–6, which ranks the lack of allergies among the most consistent risk factorsfor glioma reported to date. In addition, we previously reported an inverse relationship between
Address requests for reprints to Joseph Wiemels, 1 Irving Street, AC-34, University of California San Francisco, San Francisco, CA94143-0441; email: [email protected].
NIH Public AccessAuthor ManuscriptInt J Cancer. Author manuscript; available in PMC 2010 April 29.
Published in final edited form as:Int J Cancer. 2009 August 1; 125(3): 680–687. doi:10.1002/ijc.24369.
NIH
-PA Author Manuscript
NIH
-PA Author Manuscript
NIH
-PA Author Manuscript
immunoglobulin E (IgE), a biomarker for atopic allergy, and glioma risk7. We found poorconcordance between self-reported allergy and IgE levels, and the strongest IgE-gliomaassociation was observed among the least prevalent allergen – food IgE7. In addition, gliomapatients who had elevated levels of IgE had approximately 8 months longer survival thanindividuals with lower or undetectable levels8, demonstrating potential clinical significance.
The goal of this current study was to utilize new population-based cases and controls to confirmour previous reports of an inverse relationship between self-reported allergy, IgE levels andglioma risk. However, during the new subject recruitment period, the standard of care forglioblastoma changed to include treatment with temozolomide (Temodar)9, a chemotherapyagent. Therefore, in addition to replicating our previous studies, the current analysis providesthe first opportunity to evaluate the relationship between self-reported allergies, IgE levels andglioma risk in patients treated with temozolomide.
MATERIALS AND METHODSSubjects, interviews, and specimen collection
Histologically confirmed gliomas (International Classification of Diseases for Oncology,morphology codes 9380–9481) diagnosed from November 2001 to September 2004 wereidentified using the Northern California Rapid Case Ascertainment program and included inthis study. Eligible cases were aged 20 or older, had pathologically confirmed glioma, andresided in the 6 county San Francisco Bay Area, (Alameda, Contra Costa, Marin, San Mateo,San Francisco, and Santa Clara). Controls aged 20 years or older from the same residentialarea as cases were identified using random digit dialing and were frequency matched to casesbased on age, gender and ethnicity. The University of California San Francisco Committee onHuman Research approved the methods for this study (IRB approval H6539-04956-21A). Wecall this ascertainment series, “Series 3” to distinguish it from the previous recruitments, Series1 (1992–4) and Series 2 (1997–2000).
In-person interviews with cases (or their proxies) and controls lasted approximately two hoursand used a structured questionnaire and show cards. Subjects were offered a brief telephoneinterview if they declined the full in-person interview. The allergy history assessment questionswere very similar to the ones we used for our Series 2 glioma study5.
Detailed information regarding history of allergies was collected in tabular form on 8questionnaire pages. Data were collected by asking “Have you ever had reactions to” thefollowing allergens: house dust, mold or mildew, pollens, poison oak/ivy, stinging or bitinginsects, eggs, dairy products, shellfish, wheat, peanuts or peanut butter, other nuts, soy, alcohol,coffee, other foods, toiletry items (soaps/detergents), cosmetics, deodorant, (perfumes/colognes/aftershave), cats, dogs, other animals, prescription and non-prescription drugs,tobacco smoke, and wool. Additional spaces were included in the questionnaire for “other”items that the patient identified as allergens but were not specifically asked for by name by theinterviewer. Interviewers prompted subjects with show cards for each of the general allergencategories. For a “yes” response, the interviewer then asked whether the allergens producedany of the following symptoms also listed on show cards (runny nose, burning/watery eyes,sneezing/congestion, wheezing/asthma, rash/hives, itching, swelling/inflammation, nausea/vomiting, diarrhea, headaches, anaphylactic shock, other: specify).
The questionnaire also asked extensive information about family and personal medical historyincluding asthma and eczema, demography, drugs used, and other personal informationincluding smoking and diet.
Wiemels et al. Page 2
Int J Cancer. Author manuscript; available in PMC 2010 April 29.
NIH
-PA Author Manuscript
NIH
-PA Author Manuscript
NIH
-PA Author Manuscript
Blood and sera were collected either at the time of interview or at a later time. Participantswere asked on a separate blood draw questionnaire at that time about currently used medicationsand chemo- and radiation therapy. For analytical purposes, medications were classified intoseventeen categories (Supplementary Table 1).
Treatment information (such as, temozolomide, other chemotherapy, biopsy versus resection,radiation therapy) for the brain tumor was obtained through medical record abstraction andSEER registry data. Additional information on drug treatments was obtained with a shortquestionnaire asking for a list of current medications that were being given at the time of blooddraw.
We attempted to obtain pathological specimens for all glioma cases which were then reviewedand classified by an academic neuropathologist. To date, 484/535 cases have been reviewed,including 365 of 396 with IgE measurements. Kenneth Aldape (MD Anderson, n=318) or TarikTihan (UCSF, n=43), or both (n=4) reviewed these cases.
IgE measurementsIgE levels were assessed using a standardized clinical instrument designed for this purpose:Pharmacia Diagnostics UniCAP fluorescent “sandwich” assay10. Total, food, and respiratoryallergens were measured. We compare some of the IgE measurements from an earlier seriesto the current series in the results section of this paper to help to clarify the basis of differencesobserved; please see the earlier papers5, 7 for details about Series 2 subjects and methods. IgElevels were determined at only a single time point for all SF Bay Area patients.
Longitudinal (Repeated) IgE MeasurementsWe examined the stability of IgE measurements in a single patient at six time points over onemonth. This patient was not a part of the SF Bay Area Glioma Study. This patient who hasbeen previously reported by Heimberger, et al.11, had completed a 6-week daily temozolomidecourse with radiation therapy, a six-week EGFRvIII vaccine course without temozolomide,and three prior 1-month cycles with 5 days on temozolomide followed by 23 days off. On the23rd day (when blood cell counts recovered) the EGFRvIII vaccine was administered. Bloodfor the current study was drawn during the 16th treatment cycle of sequential temozolomideand EGFRvIII vaccine. The patient did not have a history of atopic allergy prior to surgery.
Statistical methodsOdds ratios (OR) for cases versus controls reporting a history of allergy were estimated withlogistic regression, controlling for age, gender, and ethnicity (white/non-white), education(college education) and smoking history. Odds ratios were estimated for all cases versuscontrols, self-reporting cases versus controls, and proxy-reported cases versus controls. Oddsratios also were computed for having any versus no history of allergy, by numbers of allergiesreported (none, 1–3 and 4 or more), and by route/source of exposure, respiratory or food.Descriptive statistics and odds ratios were computed with SAS12.
IgE quantities were compared in cases versus controls based on the following categories:. 1)For total IgE, IgE levels > 100 kU/L are clinically “elevated”, 25–100 kU/L “borderline,” and< 25 kU/L “normal”; 2) for food and respiratory IgE, < 0.35 kU/L are termed “non-elevated,”and ≥ 0.35 kU/L, “elevated.” Continuous measures were determined by measuringfluorescence against the standard curve with known quantity inputs; these data also were logtransformed to improve normality. Measures of IgE that fell under the lower limit were adjustedto 0.35 kU/L. Quartiles of IgE levels based on those of controls also were created.
Wiemels et al. Page 3
Int J Cancer. Author manuscript; available in PMC 2010 April 29.
NIH
-PA Author Manuscript
NIH
-PA Author Manuscript
NIH
-PA Author Manuscript
Control for potential bias and confoundersA common difficulty for retrospective interview studies is the potential for reporting bias; thatis, patients with disease might be more or less likely to recall, to fabricate, or to be promptedby interviewers to supply information that might have contributed to the etiology of theirdisease. This seems unlikely to happen for history of allergies which would not be commonlythought to affect glioma, or if they were, might be thought to be positively associated ratherthan negatively. Another bias could come from an estimate of lifetime incidence of allergy thatmay be biased by the age of the individual; that is, older individuals might provide less accurateinformation. Also, proxies might be less likely to know of and report temporally distant orminor allergies. To help control for these potential biases, odds ratios were adjusted for age,gender, and ethnicity, and results emphasize associations for self-reported cases. Odds ratioswere also adjusted by education level attained (college degree/no college degree). Finally, tocontrol for potential confounders, odds ratios were computed stratifying by tumorhistopathology (glioblastoma or other glioma histologies), by self/proxy status, and bytemozolomide treatment status, where indicated.
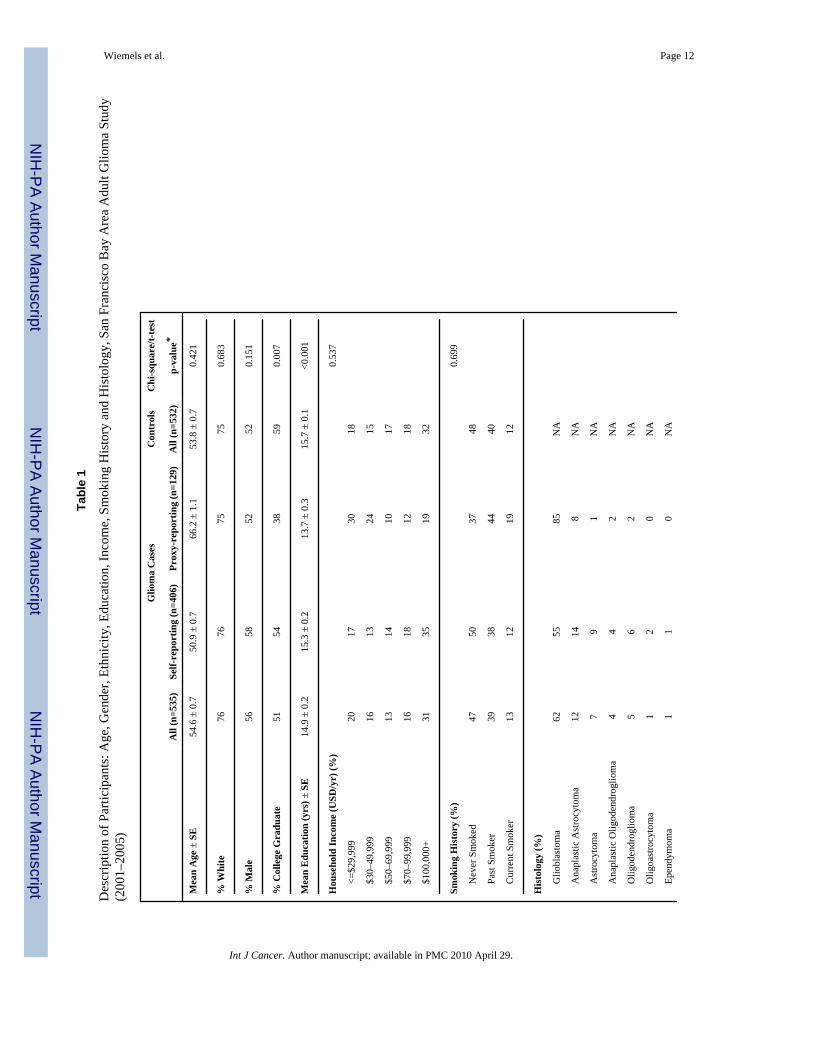
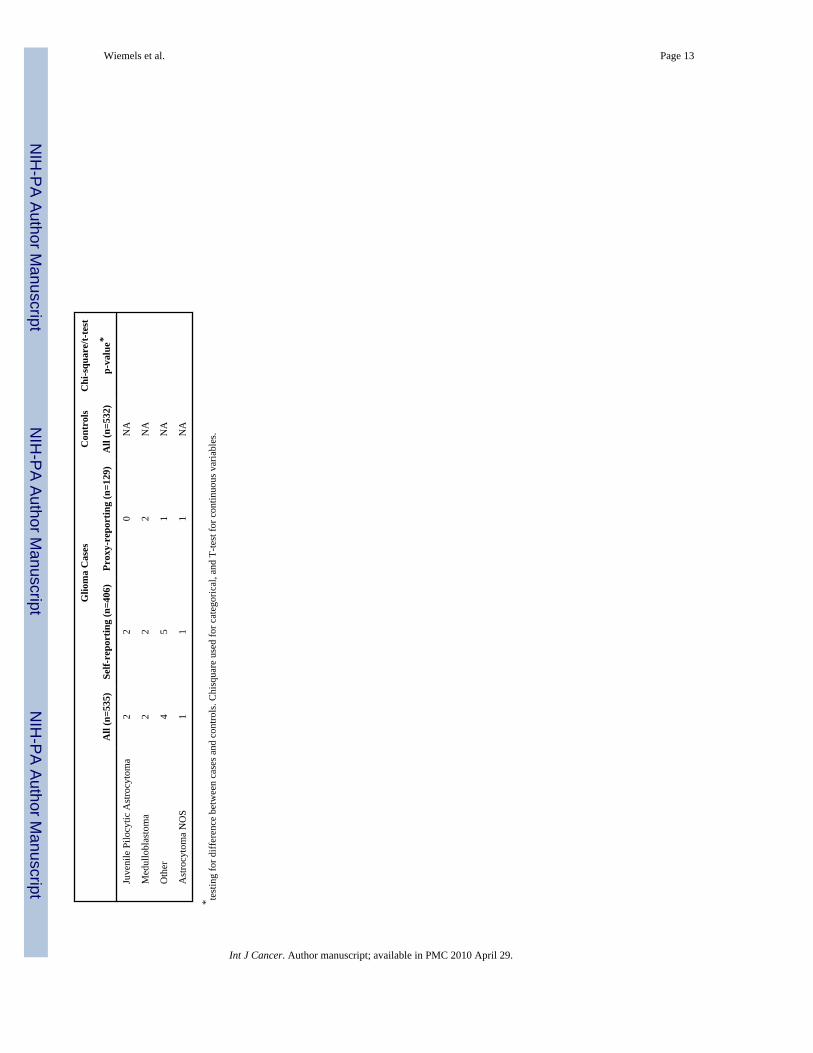
RESULTSOf the 745 eligible cases, full interviews were obtained for 535 cases (72%) and abbreviatedinterviews for 27 (4%). Of the remaining eligible cases, there were language problems (n=3),the subject’s physician refused contact with the subject (n=4), the subject or a proxy could notbe located (n=15), the subject or proxy refused (n=97), or they were not reported through RapidCase Ascertainment (n=64). Of the 10,952 phone numbers dialed to obtain controls, 6%(n=600) identified an eligible control, 2,477 refused information before or after studyintroduction (23%) and the remaining numbers (71%) either had no response after 10 calls(25.7%) or did not identify an eligible subject due to language barrier (5.8%), business/fax/modem line (9.1%), line out of service (12.2%), etc. Of eligible controls, 92% (n=565) agreedto participate either in the full (n=532) or an abbreviated (n=33) interview. For the currentanalysis only subjects completing the full interview were included leaving 535 cases alongwith 532 controls (Table 1). For 129 of the 535 enrolled cases (24.2%), questionnaire data wasreported by a proxy. Additional information on the distribution of ethnic groups, sex, age,education, income, smoking status, proxy status and histopathological diagnosis for cases andcontrols are presented in Table 1.
Cases and controls did not differ significantly by age, percent white, sex, total years ofeducation, or smoking history. Controls were more likely to have a college degree, (p=0.007,χ2). Within the cases, the proxy-reporting cases were significantly older than self-reportingcases (66 vs. 51 years, respectively p < 0.001), had a lower percentage of college graduates(38% vs. 54%, respectively p = 0.001), lower reported income (p < 0.001), significantlydifferent smoking status (p = 0.019), and a higher percentage of glioblastoma multiformediagnoses (p < 0.001). Proxy reporting and self-reporting cases did not differ by ethnicity orsex.
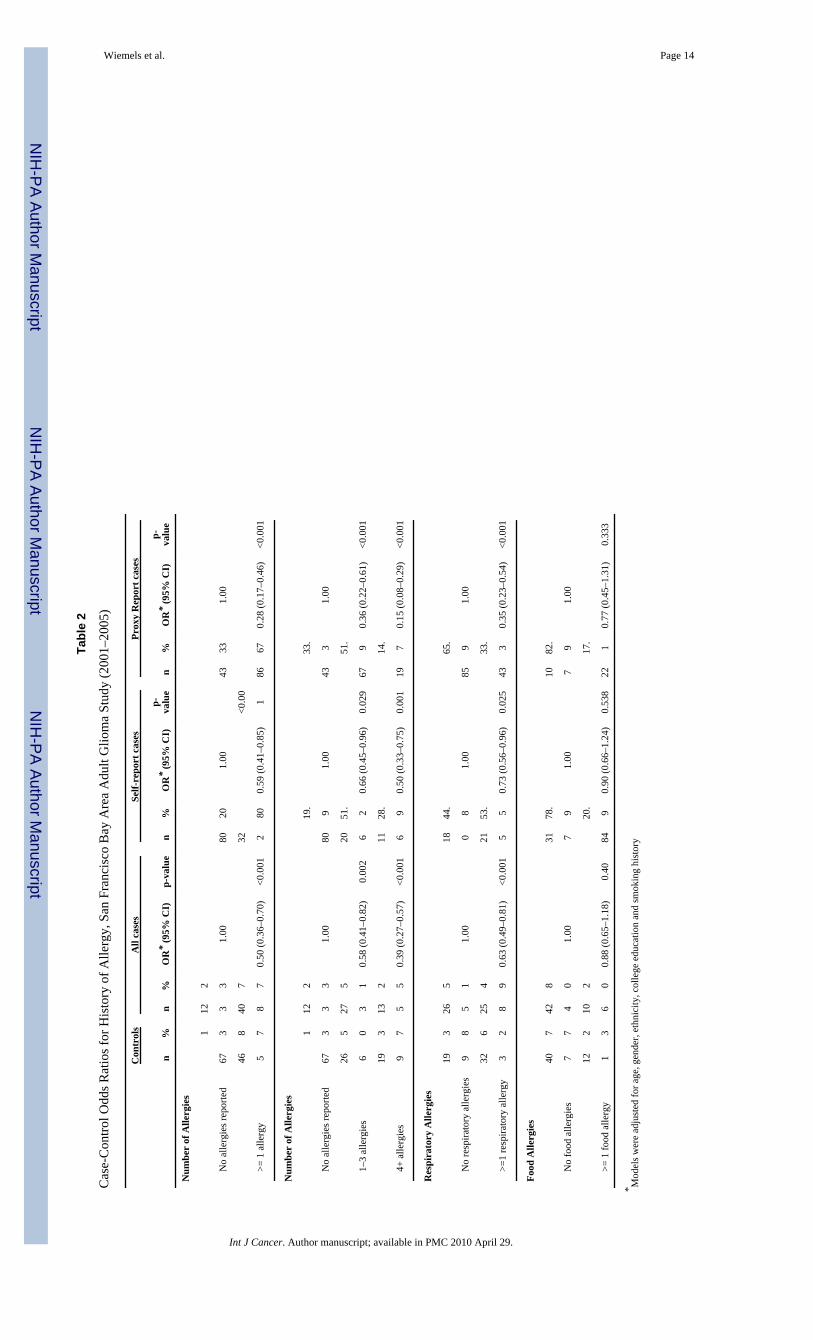
Allergy and GliomaGlioma patients reported significantly fewer allergies than controls when pooled (OR = 0.50,95% CI: 0.36–0.70, Table 2) or separated by proxy or self-reporting patients (OR = 0.28, 95%CI: 0.17–0.46, and OR =0.59, 95% CI: 0.41–0.85, respectively, Table 2). Adjustments weremade for age, gender and ethnicity (white/non-white), college education and smoking history,which did not substantively change any allergy or IgE odds ratios. ORs were 0.58 for subjectsreporting 1–3 allergies and 0.39 for subjects reporting 4 or more allergies, suggestive of a dose-response. There was a significant deficit of history of respiratory but not food allergies in casescompared to controls (Table 2).
Wiemels et al. Page 4
Int J Cancer. Author manuscript; available in PMC 2010 April 29.
NIH
-PA Author Manuscript
NIH
-PA Author Manuscript
NIH
-PA Author Manuscript
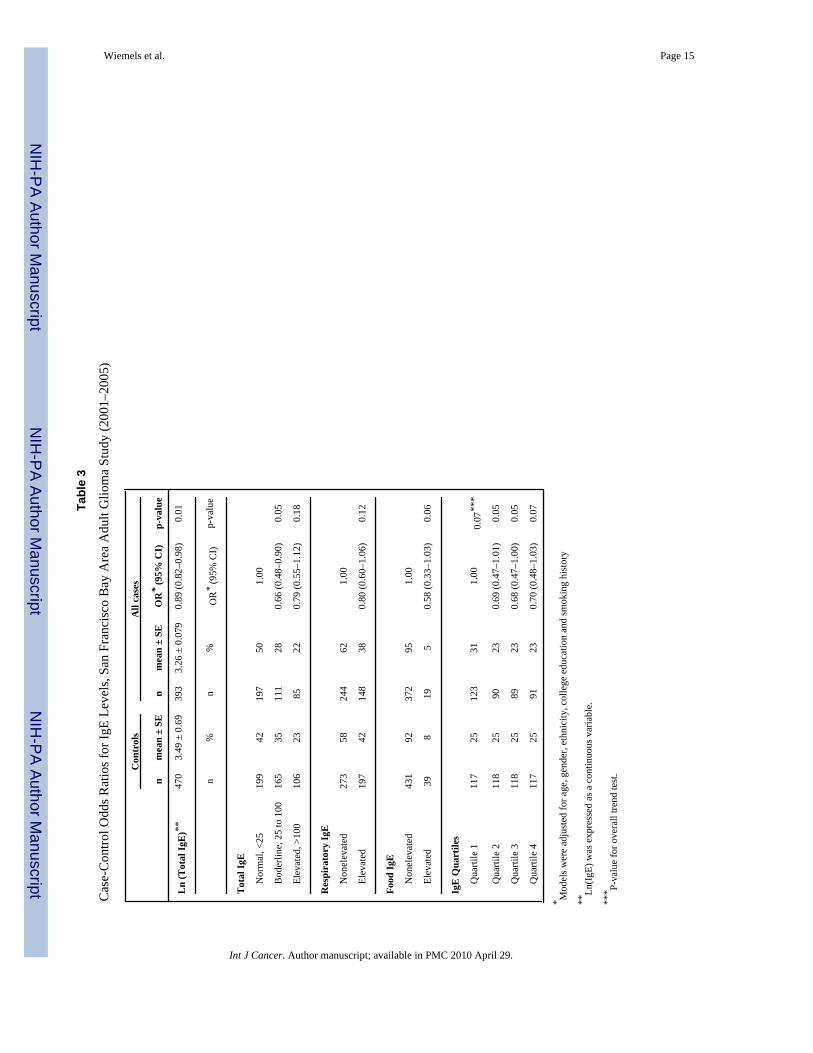
Serum IgE and GliomaTotal IgE levels were available for 393 cases and 470 controls. The mean log transformedserum IgE levels were lower for cases (3.26 ± 0.08) than for controls (3.49 ± 0.07). The case-control OR was 0.89 (95% CI: 0.82–0.98) for each unit of increase in log IgE. When clinicalcategorical IgE levels were considered, IgE levels were lower among cases than controls, butfailed to reveal a dose response. Categorical food and respiratory IgE yielded odds ratios lowerthan 1 (OR = 0.58 and 0.80, respectively), but in either case the 95% confidence intervalsincluded 1 and were not significant (Table 3).
We noted that in the current series, time from blood draw to laboratory processing was onaverage one day faster than the prior series (median 1 day between draw and freezing, asopposed to 2 day in prior series). This time is not different between cases and controls, but wetested whether it would have any difference to measured IgE levels. Sera from 3 healthyvolunteers were drawn into multiple red-top tubes and stored at room temperature for 0, 1, 2,3, and 4 days, then processed and frozen. IgEs were measured from the frozen sera; in all casesmeasurements did not decrease over time and IgE levels scored within 5% of the original “0time” measurement, indicating that there is no detectable degradation of IgE in wholecoagulated blood over the variable time frames that samples are processed. One of the threevolunteers displayed “elevated” IgE, one high “borderline,” and the third, “normal.”
Since we were able to ascertain and interview cases in the current series an average of 43 daysfaster than the previous series (the average time from diagnosis to blood draw was 69 days inSeries 3 vs. 112 days in Series 27), we also considered whether bloods drawn closer to the timeof diagnosis had higher IgE levels, more similar to control levels. For patients takingtemozolomide, there was an inverse relationship between IgE levels and time betweendiagnosis and blood draw; for cases not treated with temozolomide, the IgE levels were highestwithin 30 days of diagnosis but there was no additional decrease in levels >60 days fromdiagnosis (Figure 1).
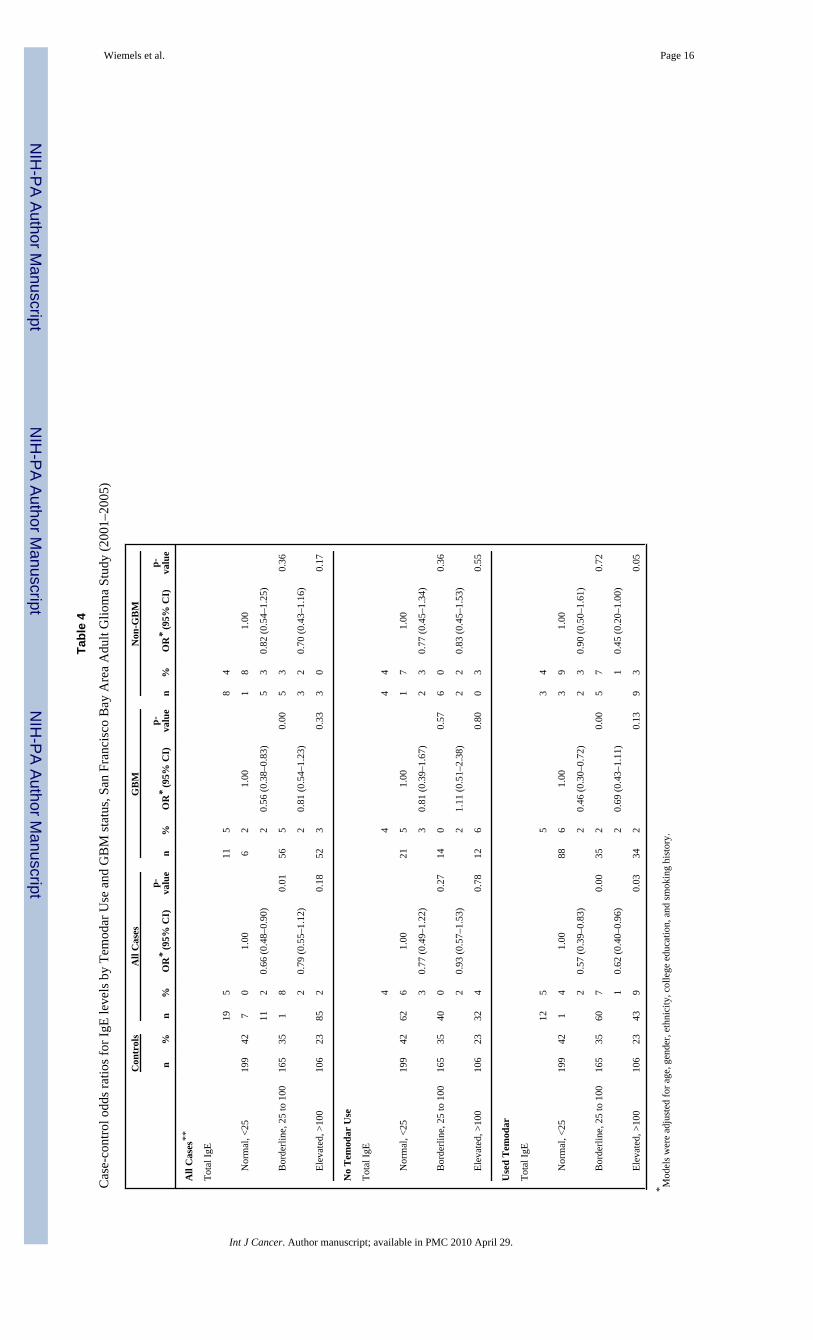
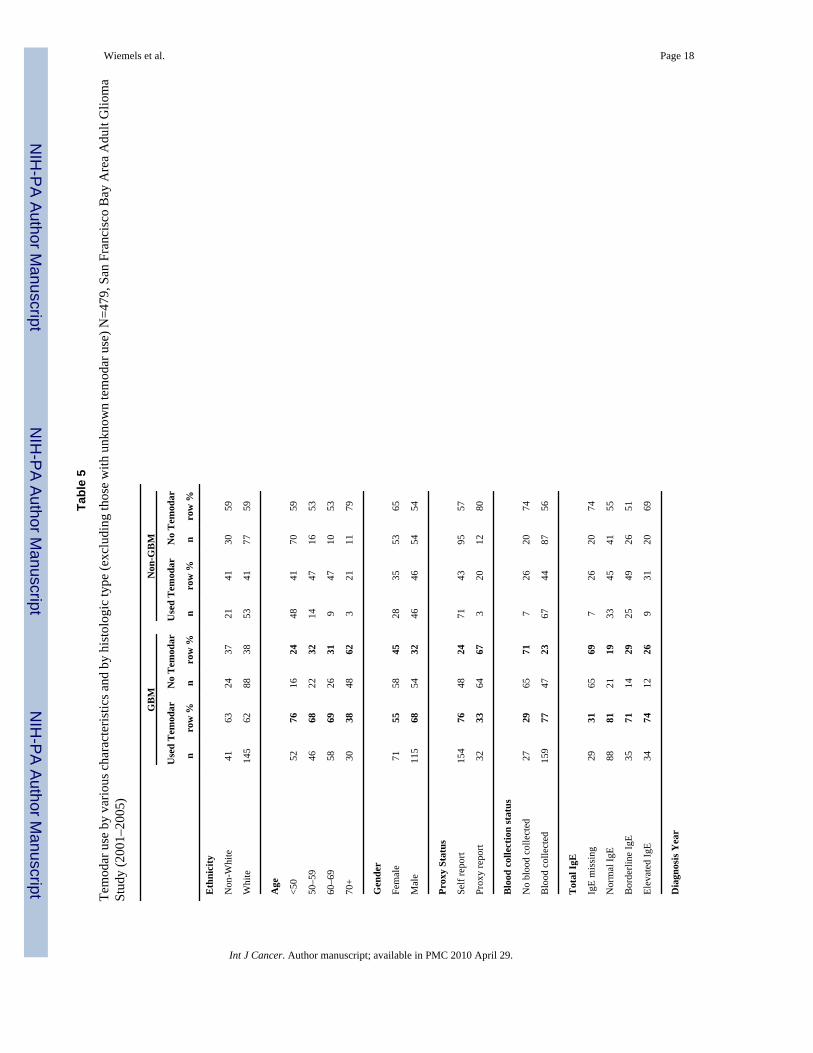
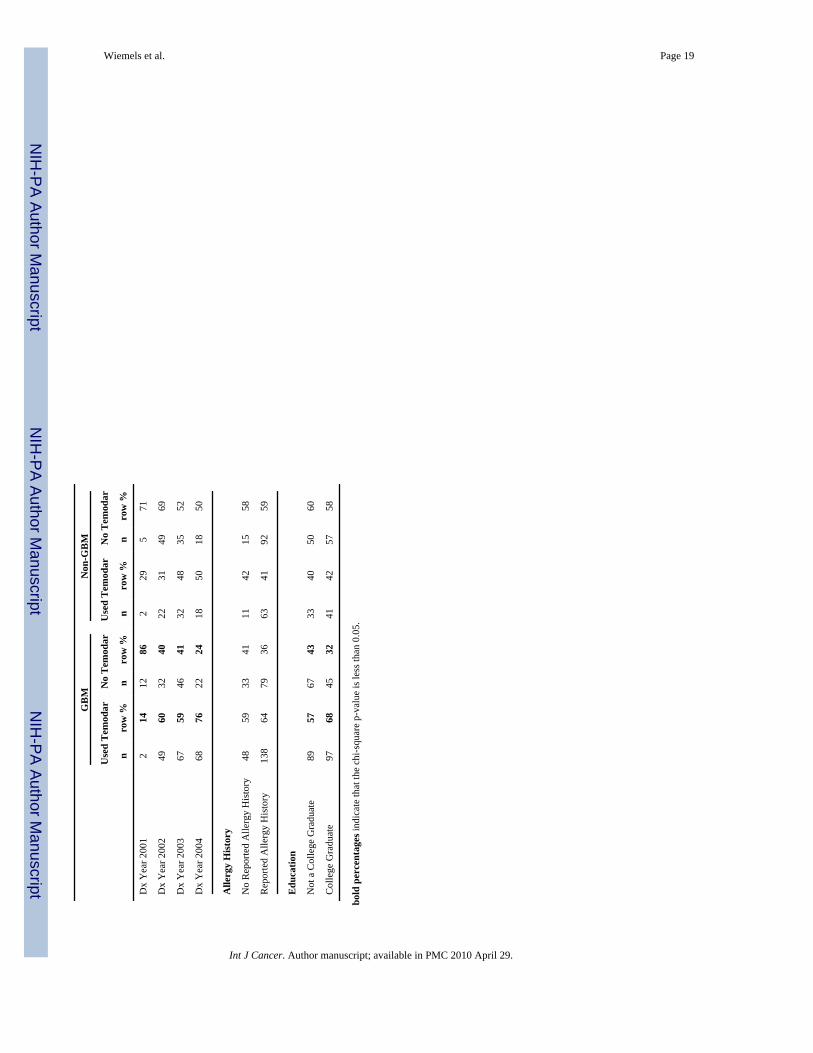
Glioma medicationsMost medications were prescribed to too few patients to substantially bias the case-controlodds ratios (see Supplementary Table 1). However, large numbers of cases took temozolomideand dexamethasone. Those that were prescribed temozolomide (63% of our patient population)demonstrated significantly lower IgE levels; least square mean (LS mean) of IgE fortemozolomide patients was 3.14 (SE = 0.13) compared to those not taking temozolomide (LSmean = 3.61, P = 0.006). Only the temozolomide-treated cases had lower IgE levels comparedto controls, and this relationship held true for both glioblastoma and lower grade gliomas (Table4). Patients taking temozolomide were more likely to be self-reporting and younger, but werenot significantly different with regards to gender, ethnicity, or income (Table 5). Our studyascertainment period intersected closely with the introduction of temozolomide, as only 14%of glioblastoma cases were on the drug early in this case series, and 76% near the end (Table5). IgE levels of people taking this drug were substantially lower with increasing time sincediagnosis (Figure 1). Cases taking dexamethosome at the time of blood draw had a ln IgE meanof 3.32, and when temozolomide treated patients were removed, 3.47. For temozolomide-treated patients not on dexamethosone (only 33 patients), the mean ln IgE was 3.08. We didnot detect significant effects of other medications, or other therapies on IgE levels (includingsurgery and radiation) when statistically adjusted for temozolomide treatment (data not shown).
Cohort effectsBesides the introduction of temozolomide, another difference between our two series pertainsto the birth cohort of participants. We note that the greatest difference between cases andcontrols in Series 2 is the age 53–65 central age tertile, OR = 0.58 (95% CI: 0.45–0.76,
Wiemels et al. Page 5
Int J Cancer. Author manuscript; available in PMC 2010 April 29.
NIH
-PA Author Manuscript
NIH
-PA Author Manuscript
NIH
-PA Author Manuscript
Supplementary Table 2). The median age of these controls is age 59, which corresponds to amedian birthdate of 1939. For Series 3, the corresponding cohort tertile shifts 9 years forwardwith a median birthdate of 1948. Individuals within this same age tertile in Series 3, who werenot treated with temozolomide, did not demonstrate reduced IgE (OR = 0.94, 95% CI:0.70–1.26, Supplementary Table 2).
SeasonalityWe analyzed whether there were differences in seasonality of blood draws. Due to recruitingschedules, slightly more controls were ascertained in January-April time frame. Pollen levelsare highest in our study area (San Francisco Bay Area) in the months of March-June. However,when we included the season of blood draw variable in the case-control model, ORs were notchanged (data not shown). We also considered the question, “Have you had an allergic reactionin the past month?” An answer “yes” to this question was not predictive for high IgE levelsamong controls (data not shown).
Repeated measurementsWe performed repeat measurements for a single patient who was not part of the SF Bay AreaGlioma Study. IgE levels in this patient remained nearly constant at 30 kUnits/liter, which isa clinical “low borderline” level for allergy. This patient did not have any history of allergy,and the IgE were not reactive to respiratory (Phadiotop) or food (Fx5) allergens (data notshown). Given that IgE half-life in serum is only 36 hours, this indicated that IgE productionis not sensitive to the hematotoxic or hemato-recovery cycles induced by the temozolomidetreatments. The steady state of IgE is a contrast to varied T-regulatory cell, CD8+ cell counts,and other immune cell counts measured with the same blood samples (Supplementary Table4, and reference 11).
DISCUSSIONThis manuscript describes a case-control replication study in which, due to a change in thestandard of care, the majority of cases received an immune-modulating factor: temozolomide.The inverse association of self-reported allergy and glioma (including a dose-response) herewas nearly exactly the same as our previous series, indicating a robust association5, 7. IgElevels were also inversely related to glioma although far more weakly than we previouslyobserved and most of the inverse relationship was confined to analyses including only caseswho had received temozolomide as a treatment. This inverse association may also be impactedby length of temozolomide treatment (Figure 1). Despite this introduction of temozolomide asthe standard of care, the prevalence of elevated IgE levels among cases was paradoxicallyincreased in the current series (Series 3), reducing IgE case control differences observedpreviously7. Self-reported allergies were more frequent in the current series among cases (20%in Series 3 vs. 13% in Series 2), suggesting some potential cohort differences between theSeries, which may also impact IgE levels. Both new treatments and a potential new cohort ofindividuals in Series 3 have then complicated this replication study with regards to IgE as avariable impacting glioma status.
During the early stages of glioma treatment, temozolomide is given daily, typically over thesame time course as radiation treatments. Following initial treatment, temozolomide isprescribed in 5-day “on” and 23 day “off” recovery periods. It appears to be during thissubsequent period that IgE levels were lower, and case-control odds ratios become significant(Figure 1, Supplementary Table 3). As these were cross-sectional data, the possibility remainsthat the lower levels were due to other unmeasured factors. A similar loss of immune functionparameters (CD4 T-helper cells) was found in a study of melanoma patients treated withtemozolomide over a longer period13. CD4 cells were not significantly lost after the first
Wiemels et al. Page 6
Int J Cancer. Author manuscript; available in PMC 2010 April 29.
NIH
-PA Author Manuscript
NIH
-PA Author Manuscript
NIH
-PA Author Manuscript
treatment cycle but became more severe with subsequent cycles13, mirroring the lymphopeniaeffect noticed in glioblastoma patients9 and the fall in IgE shown here (Figure 1). Whethertemozolomide may actively suppress IgE levels cannot be answered with the current data seriesand requires a study of repeat measurements during therapy. The one patient with repeatmeasurements here indicated that IgE levels are stable over a one month period during laterstages of treatment, and are not sensitive to changes in T-regulatory cells among other celltypes (Supplementary Table 4). This patient does not inform what happens to IgE during initialtherapy, which is a question that will require additional studies.
We did not detect case-control differences in IgE levels with cases not treated withtemozolomide, who comprised 37% of the patient cohort. No significant differences in gender,income, ethnicity, or histopathological diagnosis were found among patients who did not taketemozolomide compared to those who did (Table 5). However, there was a strong inverseassociation of temozolomide therapy and age – older individuals were less likely to beprescribed temozolomide. In our previous series the relationship between IgE and case-controlstatus was weakest in the oldest tertile (Supplementary Table 2). Assuming a similar profilefor the current Series 3, we would expect less of an IgE difference between older cases andcontrols, which constitute the bulk of the patients not treated with temozolomide. This factor,combined with unknown clinical considerations directing the decision not to treat withtemozolomide, make it difficult to compare the temozolomide treated and untreated patients.Like our previous study, we did not detect significant effects from dexamethosone on IgElevels, nor other medications outside of the cytotoxic chemotherapeutics.
A remaining possible explanation on IgE differences between the two cohorts may be that thepatients themselves are fundamentally different in Series 3, having grown up in the post-WorldWar II era. Interestingly, the prevalence of childhood allergies is quite different between thesegroups, reported at 13% in Series 2 and 20% in Series 3 (P = 0.02). This corresponds to therise of suburbanization in the United States with concomitant rise in the prevalence ofallergies14–16. Indeed, the average of 50 years of age for those with IgE measurements inSeries 3 corresponds to birthdates between 1950 and 1954, which puts the bulk of participantsat a post-WWII birth when modern trends including reduced exposure to microbes andendotoxins, intestinal parasites, and increased use in antibiotics, affected the prevalence ofallergies and potentially affected the allergic axis in the interaction with brain tumors. Theincreases in allergies are attributed to the “hygiene hypothesis” which posits that the immunesystem has not had a normal early modulation from frequent infections, making it vulnerableto overreact to other environmental antigens17. This enhanced predisposition to overreact issometimes referred to as the “missing immune deviation” hypothesis, since humans are bornwith a strong Th2-allergic-phenotype which is poised to develop balanced immunity inresponse to frequent infections early in life18. If the immune deviation to a balanced Th1/Th2immune system does not occur early in life, then lifetime risk of allergic disease is increased.Our control population had the same IgE distribution in the current series as the prior series7,indicating that profound population shifts have not taken place; however, our cases had higherIgE levels in the current series. It may be possible that these cases are reacting to their tumoror to temozolomide treatment (initially) with higher IgE levels due to an enhancedpredisposition to allergies due to their birth in the modern era. Further studies on a possiblecohort effect are warranted.
For the current series we obtained sera from a higher proportion of cases than for our priorseries – and ascertained them somewhat closer to diagnosis. We were also able to transport theblood on average one day faster (one vs. two days) from the field to the laboratory. We assessedwhether time since diagnosis and transit time for blood was related to IgE levels, with nosignificant relationship found (when excluding patients who took temozolomide). We alsoperformed a reconstruction experiment in the laboratory to assess whether IgE levels are
Wiemels et al. Page 7
Int J Cancer. Author manuscript; available in PMC 2010 April 29.
NIH
-PA Author Manuscript
NIH
-PA Author Manuscript
NIH
-PA Author Manuscript
affected by storing whole blood at room temperature. IgE levels did not perceptibly changeduring a four day period that blood was stored at room temperature. We also note that theimprovement in transport time affected both cases and controls equally, so is unlikely to playa role in case-control differences. It is therefore highly unlikely that our improvement ofsampling techniques would explain any differences between Series 2 and 3.
While we have emphasized the differences between the series, it is also important to note thatmany results were similar. Respiratory IgE had similar odds ratios in both series and reportedrespiratory allergy odds ratios were also similar and significant. In both series we observedmuch stronger odds ratios among proxy-compared to self-reported individuals; in both Seriesthis is likely the result of reporting bias. Proxies may not know about allergies, amplifying theodds ratios; therefore self-report odds ratios are likely to be closer to the truth (Table 2). Case-control ORs for self-reported food allergies also did not differ between the series; however,one key difference was found in the relationship of food IgE between the two series (OR =0.12 vs 0.88, respectively, Series 2 and 3). The Series 2 result may be a false positive findingdue to small numbers. The relationship of reported respiratory allergens is more robust; itexhibited virtually the same relationship in both reports. This finding should refocus attentionon allergens and allergic responses that enter via the nasal route, and away from the digestiveroute, which was not confirmed in the current analysis (Series 3). Interestingly, cytokines andother peptides administered intranasally can enter the brain directly19, presenting a possibledirect effect on intracranial immune responses from respiratory allergy pathophysiology.
In sum, our current results on reported allergy and glioma are quite similar to our and othersprevious reports. Although we still observed overall that cases had lower levels of IgE thancontrols, the effect was only apparent in the temozolomide treated patients, and our cross-sectional analysis suggests that the lower levels of IgE in the patients could possibly be due totemozolomide treatment. To address differences between the series to the extent possible, weconsidered recruitment and sampling changes and differences in the population ascertained,including the later birth cohort of the Series 3 population. Our efforts do not fully explain thedifferences between the series, and cast some uncertainty on the capacity of IgE as an adequatebiomarker to illuminate an immunologic mechanism that suppresses glioma, at least in thecurrent temozolomide era. Less clear is the reason for an overall higher IgE levels in gliomapatients compared to the previous series, which occurred despite the temozolomide IgEsuppression that may take place over the course of treatment. This IgE suppression mirrors theloss of T-helper cell function as studied in a temozolomide-treated melanoma cohort13 andserves as a warning to those developing immune-mediated glioma treatments. Definitiveevaluation of the role of IgE as a biomarker of glioma risk awaits results from a large cohortstudy that collects serum before diagnosis. Additionally, the complete effects of temozolomideand other therapies on IgE await the analysis of serial samples obtained before and throughoutglioma therapy.
Supplementary MaterialRefer to Web version on PubMed Central for supplementary material.
AcknowledgmentsThanks to the Northern California Cancer Center for glioma patient case finding and to the pathology departments ofAlexian Hospital, Alta Bates Medical Center, Brookside, California Pacific Medical Center, DR Pinole, Eden Hospital,El Camino Hospital, Good Samaritan, Highland Hospital, John Muir, Kaiser Redwood City, Kaiser San Francisco,Kaiser Santa Teresa, Los Gatos Hospital, Los Medanos Hospital, Marin General, Merrithew, Mills Peninsula Hospital,Mt. Diablo Hospital, Mt. Zion Medical Center, Naval Hospital, O’Connor Hospital, Ralph K Davies Medical Center,Saint Louise, San Francisco General, San Jose, San Leandro, San Mateo County, San Ramon Valley, Santa ClaraValley, Sequoia, Seton Medical Center, St. Francis, St. Lukes, St. Rose, Stanford, Summit, UC San Francisco, ValleyLivermore, Veterans Palo Alto, Veterans SF, and Washington Hospital for providing tumor specimens for review.
Wiemels et al. Page 8
Int J Cancer. Author manuscript; available in PMC 2010 April 29.
NIH
-PA Author Manuscript
NIH
-PA Author Manuscript
NIH
-PA Author Manuscript
NIH grants CA52689, CA097257, CA89032, ES06717, and ES04705. JLW is a Scholar of the Leukemia andLymphoma Society of America.
Supported by NIH grants, R01CA52689 and P50CA097257. JLW is a Scholar of the Leukemia and Lymphoma Societyof America.
References1. Wrensch M, Minn Y, Chew T, Bondy M, Berger MS. Epidemiology of primary brain tumors: current
concepts and review of the literature. Neuro-oncol 2002;4:278–99. [PubMed: 12356358]2. Brenner AV, Linet MS, Fine HA, Shapiro WR, Selker RG, Black PM, Inskip PD. History of allergies
and autoimmune diseases and risk of brain tumors in adults. Int J Cancer 2002;99:252–9. [PubMed:11979441]
3. Schlehofer B, Blettner M, Preston-Martin S, Niehoff D, Wahrendorf J, Arslan A, Ahlbom A, ChoiWN, Giles GG, Howe GR, Little J, Menegoz F, et al. Role of medical history in brain tumourdevelopment. Results from the international adult brain tumour study. Int J Cancer 1999;82:155–60.[PubMed: 10389745]
4. Schwartzbaum J, Jonsson F, Ahlbom A, Preston-Martin S, Lonn S, Soderberg KC, Feychting M. Cohortstudies of association between self-reported allergic conditions, immune-related diagnoses and gliomaand meningioma risk. Int J Cancer 2003;106:423–8. [PubMed: 12845684]
5. Wiemels JL, Wiencke JK, Sison JD, Miike R, McMillan A, Wrensch M. History of allergies amongadults with glioma and controls. Int J Cancer 2002;98:609–15. [PubMed: 11920623]
6. Linos E, Raine T, Alonso A, Michaud D. Atopy and risk of brain tumors: a meta-analysis. J Natl CancerInst 2007;99:1544–50. [PubMed: 17925535]
7. Wiemels JL, Wiencke JK, Patoka J, Moghadassi M, Chew T, McMillan A, Miike R, Barger G, WrenschM. Reduced immunoglobulin E and allergy among adults with glioma compared with controls. CancerRes 2004;64:8468–73. [PubMed: 15548720]
8. Wrensch M, Wiencke J, Wiemels J, Miike R, Patoka J, Moghadassi M, McMillan A, Kelsey K, AldapeK, Lamborn KR, Parsa A, Sison JD, et al. Serum IgE, tumor EGFR expression and inheritedpolymorphisms associated with glioma survival. Cancer Res 2006;66:4531–41. [PubMed: 16618782]
9. Stupp R, Mason WP, van den Bent MJ, Weller M, Fisher B, Taphoorn MJ, Belanger K, Brandes AA,Marosi C, Bogdahn U, Curschmann J, Janzer RC, et al. Radiotherapy plus concomitant and adjuvanttemozolomide for glioblastoma. N Engl J Med 2005;352:987–96. [PubMed: 15758009]
10. Szeinbach SL, Barnes JH, Sullivan TJ, Williams PB. Precision and accuracy of commerciallaboratories’ ability to classify positive and/or negative allergen-specific IgE results. Ann AllergyAsthma Immunol 2001;86:373–81. [PubMed: 11345278]
11. Heimberger AB, Sun W, Hussain SF, Dey M, Crutcher L, Aldape K, Gilbert M, Hassenbusch SJ,Sawaya R, Schmittling B, Archer GE, Mitchell DA, et al. Immunological responses in a patient withglioblastoma multiforme treated with sequential courses of temozolomide and immunotherapy: casestudy. Neuro Oncol 2008;10:98–103. [PubMed: 18079360]
12. SAS/STAT User’s Guide. 6. Cary, NC: SAS Institute, Inc; 1990.13. Rietschel P, Wolchok JD, Krown S, Gerst S, Jungbluth AA, Busam K, Smith K, Orlow I, Panageas
K, Chapman PB. Phase II study of extended-dose temozolomide in patients with melanoma. J ClinOncol 2008;26:2299–304. [PubMed: 18467721]
14. Anderson HR, Gupta R, Strachan DP, Limb ES. 50 years of asthma: UK trends from 1955 to 2004.Thorax 2007;62:85–90. [PubMed: 17189533]
15. Isolauri E, Huurre A, Salminen S, Impivaara O. The allergy epidemic extends beyond the past fewdecades. Clin Exp Allergy 2004;34:1007–10. [PubMed: 15248842]
16. Von Hertzen LC, Haahtela T. Asthma and atopy-the price of affluence? Allergy 2004;59:124–37.[PubMed: 14763924]
17. Schaub B, Lauener R, von Mutius E. The many faces of the hygiene hypothesis. J Allergy ClinImmunol 2006;117:969–77. [PubMed: 16675321]
18. Romagnani S. Coming back to a missing immune deviation as the main explanatory mechanism forthe hygiene hypothesis. J Allergy Clin Immunol 2007;119:1511–3. [PubMed: 17556059]
Wiemels et al. Page 9
Int J Cancer. Author manuscript; available in PMC 2010 April 29.
NIH
-PA Author Manuscript
NIH
-PA Author Manuscript
NIH
-PA Author Manuscript
19. Thorne RG, Hanson LR, Ross TM, Tung D, Frey WH 2nd. Delivery of interferon-beta to the monkeynervous system following intranasal administration. Neuroscience 2008;152:785–97. [PubMed:18304744]
Wiemels et al. Page 10
Int J Cancer. Author manuscript; available in PMC 2010 April 29.
NIH
-PA Author Manuscript
NIH
-PA Author Manuscript
NIH
-PA Author Manuscript
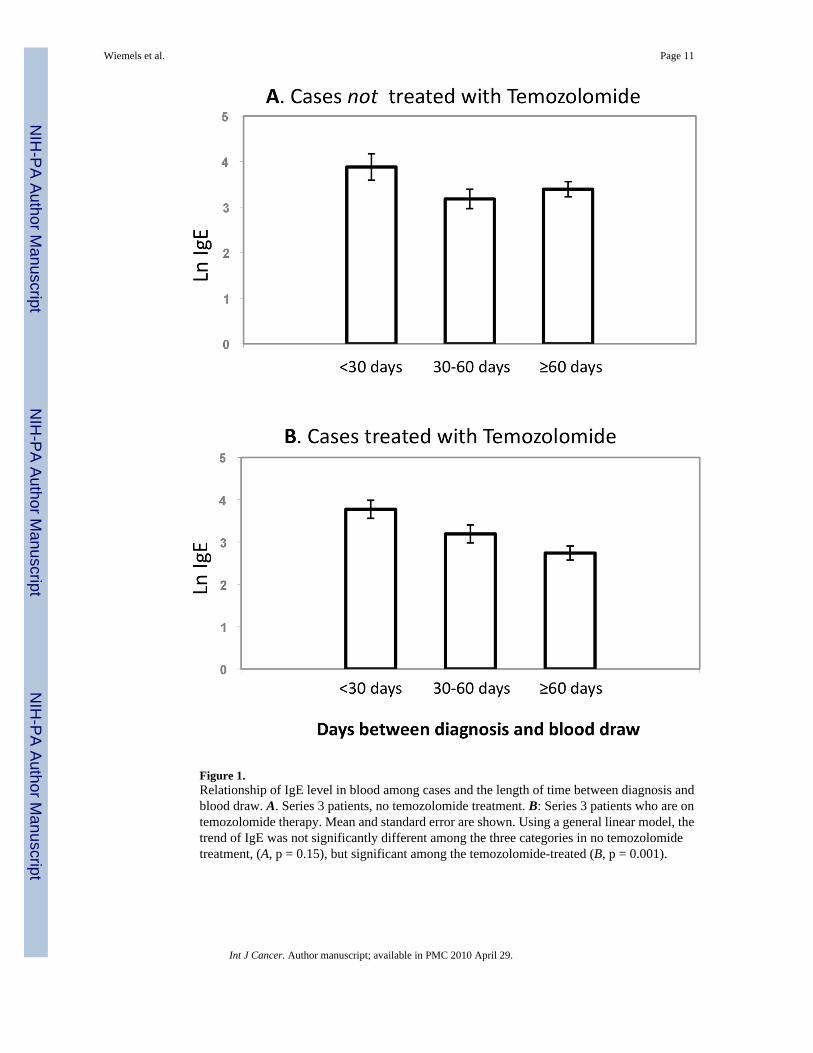
Figure 1.Relationship of IgE level in blood among cases and the length of time between diagnosis andblood draw. A. Series 3 patients, no temozolomide treatment. B: Series 3 patients who are ontemozolomide therapy. Mean and standard error are shown. Using a general linear model, thetrend of IgE was not significantly different among the three categories in no temozolomidetreatment, (A, p = 0.15), but significant among the temozolomide-treated (B, p = 0.001).
Wiemels et al. Page 11
Int J Cancer. Author manuscript; available in PMC 2010 April 29.
NIH
-PA Author Manuscript
NIH
-PA Author Manuscript
NIH
-PA Author Manuscript
NIH
-PA Author Manuscript
NIH
-PA Author Manuscript
NIH
-PA Author Manuscript
Wiemels et al. Page 12
Tabl
e 1
Des
crip
tion
of P
artic
ipan
ts: A
ge, G
ende
r, Et
hnic
ity, E
duca
tion,
Inco
me,
Sm
okin
g H
isto
ry a
nd H
isto
logy
, San
Fra
ncis
co B
ay A
rea
Adu
lt G
liom
a St
udy
(200
1–20
05)
Glio
ma
Cas
esC
ontr
ols
Chi
-squ
are/
t-tes
t
All
(n=5
35)
Self-
repo
rtin
g (n
=406
)Pr
oxy-
repo
rtin
g (n
=129
)A
ll (n
=532
)p-
valu
e*
Mea
n A
ge ±
SE
54.6
± 0
.750
.9 ±
0.7
66.2
± 1
.153
.8 ±
0.7
0.42
1
% W
hite
7676
7575
0.68
3
% M
ale
5658
5252
0.15
1
% C
olle
ge G
radu
ate
5154
3859
0.00
7
Mea
n E
duca
tion
(yrs
) ± S
E14
.9 ±
0.2
15.3
± 0
.213
.7 ±
0.3
15.7
± 0
.1<0
.001
Hou
seho
ld In
com
e (U
SD/y
r) (%
)0.
537
<=
$29,
999
2017
3018
$3
0–49
,999
1613
2415
$5
0–69
,999
1314
1017
$7
0–99
,999
1618
1218
$1
00,0
00+
3135
1932
Smok
ing
His
tory
(%)
0.69
9
N
ever
Sm
oked
4750
3748
Pa
st S
mok
er39
3844
40
C
urre
nt S
mok
er13
1219
12
His
tolo
gy (%
)
G
liobl
asto
ma
6255
85N
A
A
napl
astic
Ast
rocy
tom
a12
148
NA
A
stro
cyto
ma
79
1N
A
A
napl
astic
Olig
oden
drog
liom
a4
42
NA
O
ligod
endr
oglio
ma
56
2N
A
O
ligoa
stro
cyto
ma
12
0N
A
Ep
endy
mom
a1
10
NA
Int J Cancer. Author manuscript; available in PMC 2010 April 29.
NIH
-PA Author Manuscript
NIH
-PA Author Manuscript
NIH
-PA Author Manuscript
Wiemels et al. Page 13
Glio
ma
Cas
esC
ontr
ols
Chi
-squ
are/
t-tes
t
All
(n=5
35)
Self-
repo
rtin
g (n
=406
)Pr
oxy-
repo
rtin
g (n
=129
)A
ll (n
=532
)p-
valu
e*
Ju
veni
le P
ilocy
tic A
stro
cyto
ma
22
0N
A
M
edul
lobl
asto
ma
22
2N
A
O
ther
45
1N
A
A
stro
cyto
ma
NO
S1
11
NA
* test
ing
for d
iffer
ence
bet
wee
n ca
ses a
nd c
ontro
ls. C
hisq
uare
use
d fo
r cat
egor
ical
, and
T-te
st fo
r con
tinuo
us v
aria
bles
.
Int J Cancer. Author manuscript; available in PMC 2010 April 29.
NIH
-PA Author Manuscript
NIH
-PA Author Manuscript
NIH
-PA Author Manuscript
Wiemels et al. Page 14
Tabl
e 2
Cas
e-C
ontro
l Odd
s Rat
ios f
or H
isto
ry o
f Alle
rgy,
San
Fra
ncis
co B
ay A
rea
Adu
lt G
liom
a St
udy
(200
1–20
05)
Con
trol
sA
ll ca
ses
Self-
repo
rt c
ases
Prox
y R
epor
t cas
es
n%
n%
OR
* (9
5% C
I)p-
valu
en
%O
R*
(95%
CI)
p-va
lue
n%
OR
* (9
5% C
I)p-
valu
e
Num
ber
of A
llerg
ies
112
2
N
o al
lerg
ies r
epor
ted
673
33
1.00
8020
1.00
4333
1.00
468
407
32<0
.00
>=
1 a
llerg
y5
78
70.
50 (0
.36–
0.70
)<0
.001
280
0.59
(0.4
1–0.
85)
186
670.
28 (0
.17–
0.46
)<0
.001
Num
ber
of A
llerg
ies
112
219
.33
.
N
o al
lerg
ies r
epor
ted
673
33
1.00
809
1.00
433
1.00
265
275
2051
.51
.
1–
3 al
lerg
ies
60
31
0.58
(0.4
1–0.
82)
0.00
26
20.
66 (0
.45–
0.96
)0.
029
679
0.36
(0.2
2–0.
61)
<0.0
01
193
132
1128
.14
.
4+
alle
rgie
s9
75
50.
39 (0
.27–
0.57
)<0
.001
69
0.50
(0.3
3–0.
75)
0.00
119
70.
15 (0
.08–
0.29
)<0
.001
Res
pira
tory
Alle
rgie
s
193
265
1844
.65
.
N
o re
spira
tory
alle
rgie
s9
85
11.
000
81.
0085
91.
00
326
254
2153
.33
.
>=
1 re
spira
tory
alle
rgy
32
89
0.63
(0.4
9–0.
81)
<0.0
015
50.
73 (0
.56–
0.96
)0.
025
433
0.35
(0.2
3–0.
54)
<0.0
01
Food
Alle
rgie
s
407
428
3178
.10
82.
N
o fo
od a
llerg
ies
77
40
1.00
79
1.00
79
1.00
122
102
20.
17.
>=
1 fo
od a
llerg
y1
36
00.
88 (0
.65–
1.18
)0.
4084
90.
90 (0
.66–
1.24
)0.
538
221
0.77
(0.4
5–1.
31)
0.33
3
* Mod
els w
ere
adju
sted
for a
ge, g
ende
r, et
hnic
ity, c
olle
ge e
duca
tion
and
smok
ing
hist
ory
Int J Cancer. Author manuscript; available in PMC 2010 April 29.
NIH
-PA Author Manuscript
NIH
-PA Author Manuscript
NIH
-PA Author Manuscript
Wiemels et al. Page 15
Tabl
e 3
Cas
e-C
ontro
l Odd
s Rat
ios f
or Ig
E Le
vels
, San
Fra
ncis
co B
ay A
rea
Adu
lt G
liom
a St
udy
(200
1–20
05)
Con
trol
sA
ll ca
ses
nm
ean
± SE
nm
ean
± SE
OR
* (9
5% C
I)p-
valu
e
Ln
(Tot
al Ig
E)*
*47
03.
49 ±
0.6
939
33.
26 ±
0.0
790.
89 (0
.82–
0.98
)0.
01
n%
n%
OR
* (9
5% C
I)p-
valu
e
Tot
al Ig
E
N
orm
al, <
2519
942
197
501.
00
B
oder
line,
25
to 1
0016
535
111
280.
66 (0
.48–
0.90
)0.
05
El
evat
ed, >
100
106
2385
220.
79 (0
.55–
1.12
)0.
18
Res
pira
tory
IgE
N
onel
evat
ed27
358
244
621.
00
El
evat
ed19
742
148
380.
80 (0
.60–
1.06
)0.
12
Food
IgE
N
onel
evat
ed43
192
372
951.
00
El
evat
ed39
819
50.
58 (0
.33–
1.03
)0.
06
IgE
Qua
rtile
s
Q
uarti
le 1
117
2512
331
1.00
0.07
***
Q
uarti
le 2
118
2590
230.
69 (0
.47–
1.01
)0.
05
Q
uarti
le 3
118
2589
230.
68 (0
.47–
1.00
)0.
05
Q
uarti
le 4
117
2591
230.
70 (0
.48–
1.03
)0.
07
* Mod
els w
ere
adju
sted
for a
ge, g
ende
r, et
hnic
ity, c
olle
ge e
duca
tion
and
smok
ing
hist
ory
**Ln
(IgE
) was
exp
ress
ed a
s a c
ontin
uous
var
iabl
e.
*** P-
valu
e fo
r ove
rall
trend
test
.
Int J Cancer. Author manuscript; available in PMC 2010 April 29.
NIH
-PA Author Manuscript
NIH
-PA Author Manuscript
NIH
-PA Author Manuscript
Wiemels et al. Page 16
Tabl
e 4
Cas
e-co
ntro
l odd
s rat
ios f
or Ig
E le
vels
by
Tem
odar
Use
and
GB
M st
atus
, San
Fra
ncis
co B
ay A
rea
Adu
lt G
liom
a St
udy
(200
1–20
05)
Con
trol
sA
ll C
ases
GB
MN
on-G
BM
n%
n%
OR
* (9
5% C
I)p-
valu
en
%O
R*
(95%
CI)
p-va
lue
n%
OR
* (9
5% C
I)p-
valu
e
All
Cas
es**
Tota
l IgE
195
115
84
N
orm
al, <
2519
942
70
1.00
62
1.00
18
1.00
112
0.66
(0.4
8–0.
90)
20.
56 (0
.38–
0.83
)5
30.
82 (0
.54–
1.25
)
B
orde
rline
, 25
to 1
0016
535
18
0.01
565
0.00
53
0.36
20.
79 (0
.55–
1.12
)2
0.81
(0.5
4–1.
23)
32
0.70
(0.4
3–1.
16)
El
evat
ed, >
100
106
2385
20.
1852
30.
333
00.
17
No
Tem
odar
Use
Tota
l IgE
44
44
N
orm
al, <
2519
942
626
1.00
215
1.00
17
1.00
30.
77 (0
.49–
1.22
)3
0.81
(0.3
9–1.
67)
23
0.77
(0.4
5–1.
34)
B
orde
rline
, 25
to 1
0016
535
400
0.27
140
0.57
60
0.36
20.
93 (0
.57–
1.53
)2
1.11
(0.5
1–2.
38)
22
0.83
(0.4
5–1.
53)
El
evat
ed, >
100
106
2332
40.
7812
60.
800
30.
55
Use
d T
emod
ar
Tota
l IgE
125
53
4
N
orm
al, <
2519
942
14
1.00
886
1.00
39
1.00
20.
57 (0
.39–
0.83
)2
0.46
(0.3
0–0.
72)
23
0.90
(0.5
0–1.
61)
B
orde
rline
, 25
to 1
0016
535
607
0.00
352
0.00
57
0.72
10.
62 (0
.40–
0.96
)2
0.69
(0.4
3–1.
11)
10.
45 (0
.20–
1.00
)
El
evat
ed, >
100
106
2343
90.
0334
20.
139
30.
05
* Mod
els w
ere
adju
sted
for a
ge, g
ende
r, et
hnic
ity, c
olle
ge e
duca
tion,
and
smok
ing
hist
ory.
Int J Cancer. Author manuscript; available in PMC 2010 April 29.

NIH
-PA Author Manuscript
NIH
-PA Author Manuscript
NIH
-PA Author Manuscript
Wiemels et al. Page 17**
Incl
udes
cas
es w
ith u
nkno
wn
Tem
odar
stat
us (3
5 to
tal).
Int J Cancer. Author manuscript; available in PMC 2010 April 29.
NIH
-PA Author Manuscript
NIH
-PA Author Manuscript
NIH
-PA Author Manuscript
Wiemels et al. Page 18
Tabl
e 5
Tem
odar
use
by
vario
us c
hara
cter
istic
s and
by
hist
olog
ic ty
pe (e
xclu
ding
thos
e w
ith u
nkno
wn
tem
odar
use
) N=4
79, S
an F
ranc
isco
Bay
Are
a A
dult
Glio
ma
Stud
y (2
001–
2005
)
GB
MN
on-G
BM
Use
d T
emod
arN
o T
emod
arU
sed
Tem
odar
No
Tem
odar
nro
w %
nro
w %
nro
w %
nro
w %
Eth
nici
ty
Non
-Whi
te41
6324
3721
4130
59
Whi
te14
562
8838
5341
7759
Age
<50
5276
1624
4841
7059
50–5
946
6822
3214
4716
53
60–6
958
6926
319
4710
53
70+
3038
4862
321
1179
Gen
der
Fem
ale
7155
5845
2835
5365
Mal
e11
568
5432
4646
5454
Prox
y St
atus
Self
repo
rt15
476
4824
7143
9557
Prox
y re
port
3233
6467
320
1280
Blo
od c
olle
ctio
n st
atus
No
bloo
d co
llect
ed27
2965
717
2620
74
Blo
od c
olle
cted
159
7747
2367
4487
56
Tot
al Ig
E
IgE
mis
sing
2931
6569
726
2074
Nor
mal
IgE
8881
2119
3345
4155
Bor
derli
ne Ig
E35
7114
2925
4926
51
Elev
ated
IgE
3474
1226
931
2069
Dia
gnos
is Y
ear
Int J Cancer. Author manuscript; available in PMC 2010 April 29.
NIH
-PA Author Manuscript
NIH
-PA Author Manuscript
NIH
-PA Author Manuscript
Wiemels et al. Page 19
GB
MN
on-G
BM
Use
d T
emod
arN
o T
emod
arU
sed
Tem
odar
No
Tem
odar
nro
w %
nro
w %
nro
w %
nro
w %
Dx
Yea
r 200
12
1412
862
295
71
Dx
Yea
r 200
249
6032
4022
3149
69
Dx
Yea
r 200
367
5946
4132
4835
52
Dx
Yea
r 200
468
7622
2418
5018
50
Alle
rgy
His
tory
No
Rep
orte
d A
llerg
y H
isto
ry48
5933
4111
4215
58
Rep
orte
d A
llerg
y H
isto
ry13
864
7936
6341
9259
Edu
catio
n
Not
a C
olle
ge G
radu
ate
8957
6743
3340
5060
Col
lege
Gra
duat
e97
6845
3241
4257
58
bold
per
cent
ages
indi
cate
that
the
chi-s
quar
e p-
valu
e is
less
than
0.0
5.
Int J Cancer. Author manuscript; available in PMC 2010 April 29.


