
Hydrophobic Solvation: A 2D IR SpectroscopicInquest
ARTEM A. BAKULIN,† CHUNGWEN LIANG,†
THOMAS LA COUR JANSEN,† DOUWE A. WIERSMA,†
HUIB J. BAKKER,‡ AND MAXIM S. PSHENICHNIKOV†,*†Zernike Institute for Advanced Materials, University of Groningen, Nijenborgh
4, 9747 AG Groningen, The Netherlands, ‡FOM-Institute for Atomic andMolecular Physics, Kruislaan 407, 1098 SJ Amsterdam, The Netherlands
RECEIVED ON JANUARY 19, 2009
C O N S P E C T U S
For decades, the enigma of the hydrophobic force has captured the imagination ofscientists. In particular, Frank and Evans’ idea that the hydrophobic effect was
mainly due to some kind of “iceberg” formation around a hydrophobic solute stim-ulated many experiments and molecular dynamics simulation studies. A better under-standing of hydrophobic interactions will aid understanding in many contexts includingprotein structural dynamics and functioning in biological systems.
In this Account, we present results of two-dimensional infrared (2D IR) spectros-copy experiments on the OH-stretch vibrational mode of water molecules near hydro-phobic groups in concentrated solutions with tetramethylurea (TMU). The frequencyof the OH vibration is a sensitive probe for environmental dynamics and, in partic-ular, for the strength of the hydrogen bond. Two-dimensional IR spectroscopy cantrace time correlations of the vibrational frequency at the scale of hundreds of fem-toseconds and thus provides valuable insight into the effect of hydrophobic soluteson the dynamics of a hydrogen-bond network. We compare the 2D spectroscopicresults with molecular dynamics (MD) simulations to obtain a microscopic picture ofhydrophobic solvation.
We observe two different types of hydrogen-bond dynamics in the water/TMU mix-tures. We attribute the “fast” (∼100 fs) dynamics to highly coordinated water molec-ular-jump reorientations and assigned the “slow” (>1 ps) dynamics to water trans-lational motions that are strongly suppressed by the TMU molecules. Moleculardynamics simulations demonstrate a clear correlation between the slowed dynamics and the translational mobility of water.This finding indicates that the molecular-jump reorientations are switched off near hydrophobic groups. The fifth water mol-ecule, which is required to form a defect state in the tetrahedral surroundings, cannot approach the hydrogen-bonded pairto initiate the molecular jump. As a result, the rate of the jumping events sharply decreases, which, in turn, strongly slowsthe rotation of the water molecules. Our findings suggest that water molecules in the hydrophobic solvation shell do notexhibit an increased tetrahedral ordering compared with the bulk but that the hydrogen-bond dynamics in the two casesare different. This result also indicates that consideration of a hydrogen bond’s dynamics could be critical for its definition.
Introduction
Ever since Langmuir suggested that hydrophobic-
ity is an important factor for folding proteins into
compact globular structures,1 physical and pro-
tein chemists have been actively engaged in
experiments to get a grasp of the hydrophobic
force. A particularly appealing model for hydro-
phobic hydration was provided by Frank and
Evans,2 who suggested that the large entropy loss
on dissolution of a small apolar molecule in water
is due to the formation of an ordered water struc-
ture around the solute, coined by them as “ice-
berg”.3 This evocative iceberg model has, since its
Vol. 42, No. 9 September 2009 1229-1238 ACCOUNTS OF CHEMICAL RESEARCH 1229Published on the Web 08/14/2009 www.pubs.acs.org/acr10.1021/ar9000247 CCC: $71.50 © 2009 American Chemical Society

launch in 1945, inspired many researchers to explore hydra-
tion dynamics in small molecules4 and proteins,5 both exper-
imentally and by molecular dynamics simulation studies.6
It is difficult, if not impossible, to obtain dynamical infor-
mation about hydrophobic solvation by traditional structural
methods. Neutron diffraction,7,8 for instance, cannot discrim-
inate between structures fluctuating in time and (quasi-)static
structures with a distribution of conformations, because this
technique inherently integrates observables in time. NMR
experiments have shown that the rotational diffusion of water
molecules in a hydrophobic surrounding on average slows
compared with neat water.9-11 However, NMR lacks adequate
temporal resolution to detect the rotational motions directly,
and therefore the time-integrated correlation time constant of
the whole solution can be determined. This average time con-
stant can be translated into a rotation time of the hydration
shell only assuming a certain size of this hydration shell and
that the bulk is not affected.
Although ultrafast optical experiments can, in principle,
selectively map out the dynamics of a strongly coupled water
layer to a hydrophobic molecule by exploiting vibrational cou-
pling effects,12,13 such experiments have not been reported
yet. Rezus and Bakker, however, recently demonstrated that
in concentrated solutions of amphiphilic molecules carrying
several hydrophobic groups, the observed bimodal decay of
the rotational anisotropy (which is a measure for water rota-
tions) of a water vibration can be exploited to distinguish the
dynamics of water in the hydration layer from that of water in
the bulk.14,15 In these experiments, the rotational anisotropy
partly decays with a time constant of 2.5 ps and then levels
off for times longer than 10 ps. While the decay time was
independent of the solute concentration, the offset level scaled
linearly with concentration at low solute concentrations and
saturated at high concentrations. This effect was attributed to
“freezing” of the rotational water dynamics in the vicinity of
the hydrophobic groups. The mechanism behind this immo-
bilization was suggested to be the molecular jump mecha-
nism proposed by Laage and Hynes.16 In this model,
reorientational motions of water molecules do not occur in
Brownian-like small diffusional steps but in large (∼60°), quick
(∼200 fs), but relatively seldom (once in 2-3 ps) angular
jumps. This highly concerted mechanism involves the
approach of a fifth hydrogen-bonded partner of the rotating
water molecule and the temporary formation of a bifurcated
hydrogen bond. Reorientational freezing was thus explained
as resulting from a steric effect: the hydrophobic solute pre-
vents a fifth water molecule from approaching a tetrahedrally
coordinated water molecule.14,15
This interpretation triggered some controversy because
classical MD simulations,17 as well as a temperature-depen-
dent NMR study11 of water in hydrophobic environments, pre-
dicted no signature of water being significantly immobilized in
the solvation shell. In particular, according to the MD simula-
tions,17 the hydrophobic groups only take away a part of the
solid angle in which a water rotational jump could have
occurred (“excluded volume” picture), which leads to a rather
moderate slowdown of the reorientation (only by 50%).
Therefore, it was concluded that hydrophobic groups should
only be weak water reorientation retardants.
It is important to realize that rotational anisotropy mea-
surements are sensitive to the rate of switching16 rather than
to an individual switching event that takes 200 fs to occur.
However, given one order of difference between the two time
constants, there could be many other processes competing
with the molecular-jump switching (like librations or O · · · O
bending), which can partially contribute to the loss of anisot-
ropy. Therefore, the molecular-jump hypothesis calls for an
independent verification by directly observing the switching
event itself. A number of recent studies have demonstrated
that the frequency of an OH/OD oscillator is a more sensitive
probe of environmental fluctuations than the direction of its
dipole moment.18,19 MD simulations predict that the fre-
quency sweep during the switching event is ∼100 cm-1 and
that the switching probability increases drastically at blue-
shifted frequencies.20,21 The frequency sweep magnitude of
100 cm-1 and switching time of ∼200 fs require an adequate
balance between temporal and frequency resolution. This is
provided by femtosecond 2D IR correlation spectros-
copy12,13,22,23 as was demonstrated in pioneering 2D IR
experiments on molecular switching in water by Tokmakoff
and co-workers.20
In this Account, we report on a 2D IR spectroscopic study
of the OH stretching mode of water molecules in the vicinity
of the hydrophobic groups of tetramethylurea (TMU). We dem-
onstrate that, regardless of the TMU concentration, there are
two different kinds of spectral dynamics: extremely fast (<200
fs) in the blue wing of the OH-absorption spectrum and con-
siderably slower (>1 ps) in the central part of the spectrum.
The fast dynamics, which are characteristic for the molecular-
jump type of OH-bond switching, are active even at the low-
est water concentrations. The slow (>1 ps) translational
dynamics are strongly suppressed by the presence of the TMU
molecules. The magnitude of this suppression is in perfect cor-
respondence with the rotational water immobilization data,
previously measured in the transient anisotropy experi-
ments.14,15 We also present MD simulations that show a clear
Hydrophobic Solvation Bakulin et al.
1230 ACCOUNTS OF CHEMICAL RESEARCH 1229-1238 September 2009 Vol. 42, No. 9

correlation between the slowed dynamics and translationalwater mobility. These simulations provide a molecular basis
for the hypothesis of the switched-off molecular-jump reori-
entations near hydrophobic groups: the fifth water molecule,
which is required to form a defect state, cannot approach the
hydrogen-bonded pair to initiate the molecular jump. Conse-
quently, the rate of the jumping events sharply decreases,
which leads to rotational immobilization of water. Our find-
ings strongly suggest that water molecules in a hydrophobic
solvation shell do not possess an increased tetrahedral order-
ing compared with the bulk; rather their dynamics are differ-
ent than those in the bulk water.
Experimental ApproachThe essence of 2D spectroscopy can be best explained24 in
terms of a multiple pulse hole-burning experiment (Figure 1).
In such an experiment two ultrashort pulses, separated by a
certain time delay, generate a population grating (in frequency
space)25 in the absorption spectrum of the sample, in other
words, burn multiple holes in the absorption line. These holes
evolve in time and shift toward the equilibrium position
because of spectral diffusion. As a result, the holes widen,
while their central frequencies shift to the absorption center
(color map in the central panels). Consequently, different holes
begin to overlap spectrally, and therefore the resulting hole
pattern read by the delayed “probe” pulse is not identical to
the imprinted one (left panels). Increasing the time delay
between the excitation pulses leads to a finer grating and to
increased blurring of the holes. For a given separation
between the excitation pulses, this fading also occurs for a
longer probe delay (called the waiting time). In both cases, the
correlation between the initial and final frequency modula-
tion is reduced (Figure 1a,b). Multiple hole-burning experi-
ments, performed for all possible excitation pulse delays,
result in a single 2D spectrum, which represents the correla-
tion between the initial excitation frequency along the hori-
zontal ω1-axis and the probe frequency along the vertical
ω3-axis (contour lines in Figure 1). Such mapping balances the
required temporal and frequency resolution in monitoring the
spectral diffusion processes with the ultimate temporal reso-
lution determined by the excitation probe pulse duration.
The light source for the 2D IR experiments was an optical
parametric amplifier providing 70 fs pulses centered about the
OH stretching mode of the HDO molecule at 3410 cm-1. Data
acquisition and processing were performed as described by
Fayer and co-workers.26 As a sample, we used a mixture of
TMU (Aldricht, 99% pure), heavy water (Aldricht, 99.9% pure),
and isotopically substituted water HDO, which formed a thin
∼40 µm film in a wire-guided jet. In all experiments, the HDO
concentration in D2O was kept as low as 5% to avoid effects
of intra- and intermolecular coupling of OH oscillators. For
sake of simplicity, the HDO/D2O mixture will be referred to as
water. To quantify the TMU concentration, we, following ref
15, introduce a parameter w that equals the ratio of the num-
ber of TMU and water molecules; w ranged from 0 to 1. All
experiments were carried out at ambient temperature.
Experimental ResultsFigure 2 shows the IR absorption spectra of the samples in the
OH-stretch spectral region at different TMU concentrations. For
concentrations w e 0.1 (i.e., less than 1 TMU molecule per 10
water molecules), the spectra are virtually indistinguishable
FIGURE 1. Two-dimensional correlation spectroscopy as a multiple hole-burning process for short (a) and long (b) delays between theexcitation pulses. The upper panels show the photoexcitation spectrum, while the left panels depict the result of the spectral evolution of theburnt holes (color map in the central panels) due to spectral diffusion during the waiting time T. The dashed curves are given for directcomparison of written and read spectral holes. The contour lines show the normalized 2D spectrum resulting from multiple measurementsfor numerous excitation pulse separations.
Hydrophobic Solvation Bakulin et al.
Vol. 42, No. 9 September 2009 1229-1238 ACCOUNTS OF CHEMICAL RESEARCH 1231
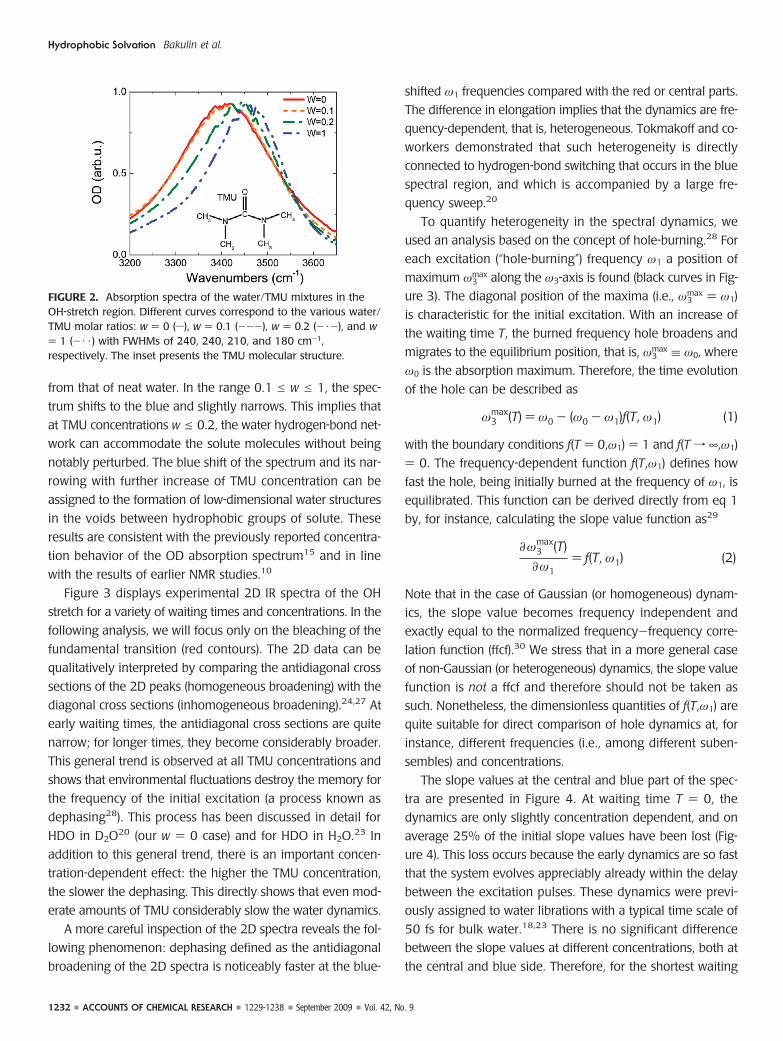
from that of neat water. In the range 0.1 e w e 1, the spec-
trum shifts to the blue and slightly narrows. This implies that
at TMU concentrations w e 0.2, the water hydrogen-bond net-
work can accommodate the solute molecules without being
notably perturbed. The blue shift of the spectrum and its nar-
rowing with further increase of TMU concentration can be
assigned to the formation of low-dimensional water structures
in the voids between hydrophobic groups of solute. These
results are consistent with the previously reported concentra-
tion behavior of the OD absorption spectrum15 and in line
with the results of earlier NMR studies.10
Figure 3 displays experimental 2D IR spectra of the OH
stretch for a variety of waiting times and concentrations. In the
following analysis, we will focus only on the bleaching of the
fundamental transition (red contours). The 2D data can be
qualitatively interpreted by comparing the antidiagonal cross
sections of the 2D peaks (homogeneous broadening) with the
diagonal cross sections (inhomogeneous broadening).24,27 At
early waiting times, the antidiagonal cross sections are quite
narrow; for longer times, they become considerably broader.
This general trend is observed at all TMU concentrations and
shows that environmental fluctuations destroy the memory for
the frequency of the initial excitation (a process known as
dephasing28). This process has been discussed in detail for
HDO in D2O20 (our w ) 0 case) and for HDO in H2O.23 In
addition to this general trend, there is an important concen-
tration-dependent effect: the higher the TMU concentration,
the slower the dephasing. This directly shows that even mod-
erate amounts of TMU considerably slow the water dynamics.
A more careful inspection of the 2D spectra reveals the fol-
lowing phenomenon: dephasing defined as the antidiagonal
broadening of the 2D spectra is noticeably faster at the blue-
shifted ω1 frequencies compared with the red or central parts.
The difference in elongation implies that the dynamics are fre-
quency-dependent, that is, heterogeneous. Tokmakoff and co-
workers demonstrated that such heterogeneity is directly
connected to hydrogen-bond switching that occurs in the blue
spectral region, and which is accompanied by a large fre-
quency sweep.20
To quantify heterogeneity in the spectral dynamics, we
used an analysis based on the concept of hole-burning.28 For
each excitation (“hole-burning”) frequency ω1 a position of
maximum ω3max along the ω3-axis is found (black curves in Fig-
ure 3). The diagonal position of the maxima (i.e., ω3max ) ω1)
is characteristic for the initial excitation. With an increase of
the waiting time T, the burned frequency hole broadens and
migrates to the equilibrium position, that is, ω3max ≡ ω0, where
ω0 is the absorption maximum. Therefore, the time evolution
of the hole can be described as
with the boundary conditions f(T ) 0,ω1) ) 1 and f(T f ∞,ω1)
) 0. The frequency-dependent function f(T,ω1) defines how
fast the hole, being initially burned at the frequency of ω1, is
equilibrated. This function can be derived directly from eq 1
by, for instance, calculating the slope value function as29
Note that in the case of Gaussian (or homogeneous) dynam-
ics, the slope value becomes frequency independent and
exactly equal to the normalized frequency-frequency corre-
lation function (ffcf).30 We stress that in a more general case
of non-Gaussian (or heterogeneous) dynamics, the slope value
function is not a ffcf and therefore should not be taken as
such. Nonetheless, the dimensionless quantities of f(T,ω1) are
quite suitable for direct comparison of hole dynamics at, for
instance, different frequencies (i.e., among different suben-
sembles) and concentrations.
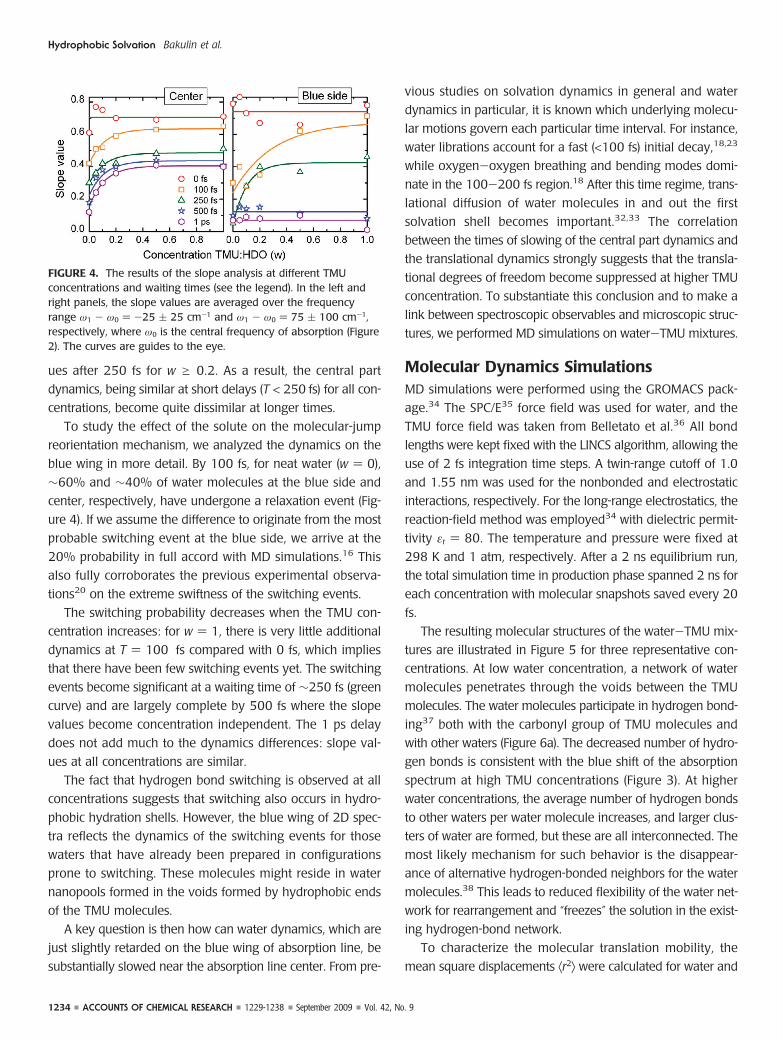
The slope values at the central and blue part of the spec-
tra are presented in Figure 4. At waiting time T ) 0, the
dynamics are only slightly concentration dependent, and on
average 25% of the initial slope values have been lost (Fig-
ure 4). This loss occurs because the early dynamics are so fast
that the system evolves appreciably already within the delay
between the excitation pulses. These dynamics were previ-
ously assigned to water librations with a typical time scale of
50 fs for bulk water.18,23 There is no significant difference
between the slope values at different concentrations, both at
the central and blue side. Therefore, for the shortest waiting
FIGURE 2. Absorption spectra of the water/TMU mixtures in theOH-stretch region. Different curves correspond to the various water/TMU molar ratios: w ) 0 (s), w ) 0.1 (---), w ) 0.2 (- ·-), and w) 1 (- · · ) with FWHMs of 240, 240, 210, and 180 cm-1,respectively. The inset presents the TMU molecular structure.
ω3max(T) ) ω0 - (ω0 - ω1)f(T, ω1) (1)
∂ω3max(T)
∂ω1) f(T, ω1) (2)
Hydrophobic Solvation Bakulin et al.
1232 ACCOUNTS OF CHEMICAL RESEARCH 1229-1238 September 2009 Vol. 42, No. 9

times, the dynamics behind the observed line shapes can be
regarded as homogeneous and concentration independent.
At longer waiting times, the behaviors at the center and
blue side of the absorption line become different. At waiting
times of 100 and 250 fs, a notable dephasing in the blue part
of the 2D spectra (Figure 4) is observed, which is also concen-
tration dependent. For neat water (i.e., w ) 0), this behavior
was previously interpreted as a manifestation of the hydrogen-
bond switching mechanism.20 The switching of weakly
bonded (and thus higher-frequency) oscillators to the strong-
ly bonded configuration is accompanied by a frequency sweep
from the blue to the line center, which results in a remark-
able decrease of the slope value.
The spectral dynamics at the center part of the spectrum
(Figure 4a) are very different from those at the blue side. In
neat water (w ) 0), molecules excited at the central frequency
become almost equilibrated within ∼1 ps. The difference
between the dynamics in the central and blue spectrum wings
arises because the hydrogen bonds are stronger at lower fre-
quencies, which leads to suppression of the molecular-jump
reorientation mechanism.31 Only after some time, the fre-
quency of the OH oscillator drifts to the blue region due to
spectral diffusion, at which point the molecular jump mecha-
nism becomes effective.31 However, with an increase of the
TMU concentration, the equilibration dynamics slow signifi-
cantly. For instance, there is very little change in the slope val-
FIGURE 3. 2D absorption spectra of water-TMU solutions at different waiting times T and concentrations w. All spectra are normalized totheir maximal values. The red-colored contours represent bleaching of the ground state and stimulated emission from the first excited state.The blue-colored part depicts the induced excited-state absorption, which is shifted by ∼190 cm-1 along the ω3-axis due to theanharmonicity of the OH stretch vibration. The isocontours are drawn at 10% steps of the maximal amplitude. Thick black curves connectmaxima at each ω1 cross section.
Hydrophobic Solvation Bakulin et al.
Vol. 42, No. 9 September 2009 1229-1238 ACCOUNTS OF CHEMICAL RESEARCH 1233
ues after 250 fs for w g 0.2. As a result, the central part
dynamics, being similar at short delays (T < 250 fs) for all con-
centrations, become quite dissimilar at longer times.
To study the effect of the solute on the molecular-jump
reorientation mechanism, we analyzed the dynamics on the
blue wing in more detail. By 100 fs, for neat water (w ) 0),
∼60% and ∼40% of water molecules at the blue side and
center, respectively, have undergone a relaxation event (Fig-
ure 4). If we assume the difference to originate from the most
probable switching event at the blue side, we arrive at the
20% probability in full accord with MD simulations.16 This
also fully corroborates the previous experimental observa-
tions20 on the extreme swiftness of the switching events.
The switching probability decreases when the TMU con-
centration increases: for w ) 1, there is very little additional
dynamics at T ) 100 fs compared with 0 fs, which implies
that there have been few switching events yet. The switching
events become significant at a waiting time of ∼250 fs (green
curve) and are largely complete by 500 fs where the slope
values become concentration independent. The 1 ps delay
does not add much to the dynamics differences: slope val-
ues at all concentrations are similar.
The fact that hydrogen bond switching is observed at all
concentrations suggests that switching also occurs in hydro-
phobic hydration shells. However, the blue wing of 2D spec-
tra reflects the dynamics of the switching events for those
waters that have already been prepared in configurations
prone to switching. These molecules might reside in water
nanopools formed in the voids formed by hydrophobic ends
of the TMU molecules.
A key question is then how can water dynamics, which are
just slightly retarded on the blue wing of absorption line, be
substantially slowed near the absorption line center. From pre-
vious studies on solvation dynamics in general and water
dynamics in particular, it is known which underlying molecu-
lar motions govern each particular time interval. For instance,
water librations account for a fast (<100 fs) initial decay,18,23
while oxygen-oxygen breathing and bending modes domi-
nate in the 100-200 fs region.18 After this time regime, trans-
lational diffusion of water molecules in and out the first
solvation shell becomes important.32,33 The correlation
between the times of slowing of the central part dynamics and
the translational dynamics strongly suggests that the transla-
tional degrees of freedom become suppressed at higher TMU
concentration. To substantiate this conclusion and to make a
link between spectroscopic observables and microscopic struc-
tures, we performed MD simulations on water-TMU mixtures.
Molecular Dynamics SimulationsMD simulations were performed using the GROMACS pack-
age.34 The SPC/E35 force field was used for water, and the
TMU force field was taken from Belletato et al.36 All bond
lengths were kept fixed with the LINCS algorithm, allowing the
use of 2 fs integration time steps. A twin-range cutoff of 1.0
and 1.55 nm was used for the nonbonded and electrostatic
interactions, respectively. For the long-range electrostatics, the
reaction-field method was employed34 with dielectric permit-
tivity εr ) 80. The temperature and pressure were fixed at
298 K and 1 atm, respectively. After a 2 ns equilibrium run,
the total simulation time in production phase spanned 2 ns for
each concentration with molecular snapshots saved every 20
fs.
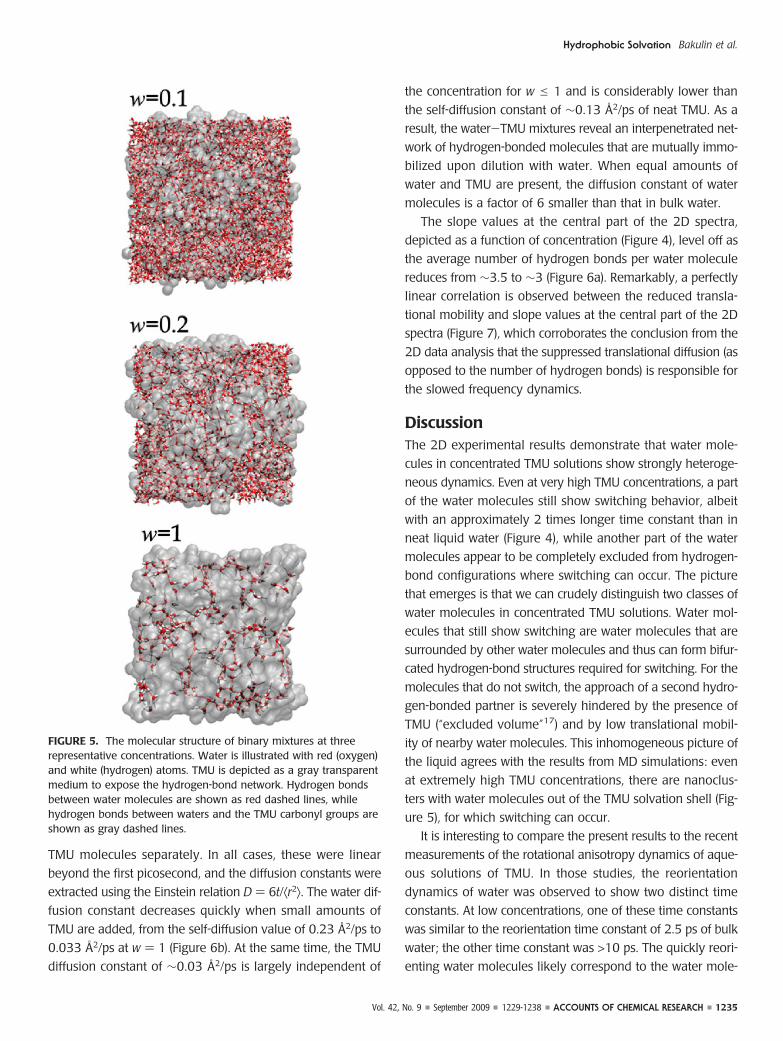
The resulting molecular structures of the water-TMU mix-
tures are illustrated in Figure 5 for three representative con-
centrations. At low water concentration, a network of water
molecules penetrates through the voids between the TMU
molecules. The water molecules participate in hydrogen bond-
ing37 both with the carbonyl group of TMU molecules and
with other waters (Figure 6a). The decreased number of hydro-
gen bonds is consistent with the blue shift of the absorption
spectrum at high TMU concentrations (Figure 3). At higher
water concentrations, the average number of hydrogen bonds
to other waters per water molecule increases, and larger clus-
ters of water are formed, but these are all interconnected. The
most likely mechanism for such behavior is the disappear-
ance of alternative hydrogen-bonded neighbors for the water
molecules.38 This leads to reduced flexibility of the water net-
work for rearrangement and “freezes” the solution in the exist-
ing hydrogen-bond network.
To characterize the molecular translation mobility, the
mean square displacements ⟨r2⟩ were calculated for water and
FIGURE 4. The results of the slope analysis at different TMUconcentrations and waiting times (see the legend). In the left andright panels, the slope values are averaged over the frequencyrange ω1 - ω0 ) -25 ( 25 cm-1 and ω1 - ω0 ) 75 ( 100 cm-1,respectively, where ω0 is the central frequency of absorption (Figure2). The curves are guides to the eye.
Hydrophobic Solvation Bakulin et al.
1234 ACCOUNTS OF CHEMICAL RESEARCH 1229-1238 September 2009 Vol. 42, No. 9
TMU molecules separately. In all cases, these were linear
beyond the first picosecond, and the diffusion constants were
extracted using the Einstein relation D ) 6t/⟨r2⟩. The water dif-
fusion constant decreases quickly when small amounts of
TMU are added, from the self-diffusion value of 0.23 Å2/ps to
0.033 Å2/ps at w ) 1 (Figure 6b). At the same time, the TMU
diffusion constant of ∼0.03 Å2/ps is largely independent of
the concentration for w e 1 and is considerably lower than
the self-diffusion constant of ∼0.13 Å2/ps of neat TMU. As a
result, the water-TMU mixtures reveal an interpenetrated net-
work of hydrogen-bonded molecules that are mutually immo-
bilized upon dilution with water. When equal amounts of
water and TMU are present, the diffusion constant of water
molecules is a factor of 6 smaller than that in bulk water.
The slope values at the central part of the 2D spectra,
depicted as a function of concentration (Figure 4), level off as
the average number of hydrogen bonds per water molecule
reduces from ∼3.5 to ∼3 (Figure 6a). Remarkably, a perfectly
linear correlation is observed between the reduced transla-
tional mobility and slope values at the central part of the 2D
spectra (Figure 7), which corroborates the conclusion from the
2D data analysis that the suppressed translational diffusion (as
opposed to the number of hydrogen bonds) is responsible for
the slowed frequency dynamics.
DiscussionThe 2D experimental results demonstrate that water mole-
cules in concentrated TMU solutions show strongly heteroge-
neous dynamics. Even at very high TMU concentrations, a part
of the water molecules still show switching behavior, albeit
with an approximately 2 times longer time constant than in
neat liquid water (Figure 4), while another part of the water
molecules appear to be completely excluded from hydrogen-
bond configurations where switching can occur. The picture
that emerges is that we can crudely distinguish two classes of
water molecules in concentrated TMU solutions. Water mol-
ecules that still show switching are water molecules that are
surrounded by other water molecules and thus can form bifur-
cated hydrogen-bond structures required for switching. For the
molecules that do not switch, the approach of a second hydro-
gen-bonded partner is severely hindered by the presence of
TMU (“excluded volume”17) and by low translational mobil-
ity of nearby water molecules. This inhomogeneous picture of
the liquid agrees with the results from MD simulations: even
at extremely high TMU concentrations, there are nanoclus-
ters with water molecules out of the TMU solvation shell (Fig-
ure 5), for which switching can occur.
It is interesting to compare the present results to the recent
measurements of the rotational anisotropy dynamics of aque-
ous solutions of TMU. In those studies, the reorientation
dynamics of water was observed to show two distinct time
constants. At low concentrations, one of these time constants
was similar to the reorientation time constant of 2.5 ps of bulk
water; the other time constant was >10 ps. The quickly reori-
enting water molecules likely correspond to the water mole-
FIGURE 5. The molecular structure of binary mixtures at threerepresentative concentrations. Water is illustrated with red (oxygen)and white (hydrogen) atoms. TMU is depicted as a gray transparentmedium to expose the hydrogen-bond network. Hydrogen bondsbetween water molecules are shown as red dashed lines, whilehydrogen bonds between waters and the TMU carbonyl groups areshown as gray dashed lines.
Hydrophobic Solvation Bakulin et al.
Vol. 42, No. 9 September 2009 1229-1238 ACCOUNTS OF CHEMICAL RESEARCH 1235

cules that show switching, while the slowly reorienting
molecules correspond to the water molecules that we observe
to be excluded from switching. To explore this comparison, we
plot the central part slope values at T ) 1 ps together with the
end level (offset) of the anisotropy observed in refs 14 and 15
as a function of the concentration TMU. The result is given in
Figure 8: the slope values and the end level of the anisot-
ropy show perfect correspondence. This finding strongly sug-
gests that water molecules that are excluded from switching
are indeed the same as those showing a very slow reorienta-
tion, even at low concentrations of TMU. This fraction
increases linearly with the concentration of TMU, which shows
that these water molecules must be part of the hydration
shells of the TMU molecules. MD simulations confirm that at
the lowest TMU concentration these water molecules form
clathrate-like structures around the methyl groups. At higher
concentrations, the fraction of slowed water was observed to
saturate, especially for TMU solutions (Figure 3 of ref 14 and
Figure 8b of ref 15). This means that at high concentrations
the number of slowed OH groups per solute molecule
decreases. In refs 14 and15, this effect was explained from
the overlap of the hydration shells of the solute molecules.
However, here we find that this saturation is due to the for-
mation of water nanoclusters. At very high concentrations of
TMU, the reorientation of the fast reorienting water molecules
was observed to somewhat slow in comparison to that of neat
liquid water:15 from 2.5 to ∼3.5 ps at w ) 1. This agrees very
well with the fact that we also observe the switching time get-
ting longer for those water molecules (Figure 4, right panel).
In recent MD simulations,17 it was found that all water mol-
ecules in solutions of amphiphilic compounds undergo switch-
ing albeit somewhat more slowly than in the bulk because
part of the volume is excluded for the approach of a new
hydrogen-bonded partner. At low concentrations of TMU, this
effect is expected to lead to a maximum slowing of the switch-
ing and the reorientation by a factor of 2 only. This result
clearly does not agree with the present findings that show a
much stronger effect of hydrophobic molecules on the dynam-
FIGURE 6. The averaged number of hydrogen bonds (HB) per water molecule (a) and the translational diffusion constants (b) as functions ofconcentration of the TMU-water binary mixture. Open and filled symbols stand for water and TMU, respectively.
FIGURE 7. Linear correlation between the slope values in thecentral part of the 2D spectra (T ) 1 ps) and diffusion constants asderived from MD simulations.
FIGURE 8. Slope values (circles) at the absorption line centers(averaged over the frequency range of ω1 - ω0 ) -50 ( 50 cm-1)at the waiting time T ) 1 ps and the anisotropy offset (diamonds)from ref 15 as functions of concentration. The solid curve is a guideto the eye.
Hydrophobic Solvation Bakulin et al.
1236 ACCOUNTS OF CHEMICAL RESEARCH 1229-1238 September 2009 Vol. 42, No. 9

ics of the hydration shell. We thus conclude that the effect of
hydrophobic groups is 2-fold. These molecular groups not
only exclude part of the volume available for switching but
fundamentally change the hydrogen-bond dynamics of the
solvating water molecules. This can be associated with the for-
mation of a more “rigid” water-solute structure where the
average number of hydrogen bonds is lower (Figure 6a) but
the translational mobility decreases. This explanation is sup-
ported by the suppressed translational mobility of water (Fig-
ure 6b) and its excellent correlation to the hydrogen-bond
dynamics (Figure 7).
NMR studies also indicate that water molecules in the sol-
vation shells of hydrophobic molecule show different hydro-
gen-bond dynamics from neat liquid water. For instance, in
temperature-dependent NMR studies, it was found that the
activation energy for reorientation in the hydration shell was
approximately two times higher than the activation energy of
the reorientation in bulk liquid water.11,39 This shows that at
low temperatures (a part of) the hydration shells form rela-
tively rigid hydrogen-bonded structures, which become much
less rigid when the temperature is increased.
The strong effects of hydrophobic molecular groups on the
hydrogen-bond and orientational dynamics do not find their
counterpart in the structure of the liquid. Neutron scattering
studies show that hydrophobic solutes have surprising little
effect on the oxygen-oxygen distances.7,8 Apparently, water
molecules can change their hydrogen-bond dynamics and
lose their reorientation ability without strongly disrupting the
local structure (i.e., the oxygen-oxygen distance). It should be
noted, however, that the fraction of water molecules that are
slowed is relatively small: only two water molecules per
methyl group14 are affected. The effects of hydrophobic sol-
utes on water dynamics are thus very short ranged, and it is
to be expected that a change of the oxygen-oxygen distance
would require a much longer range effect, involving many
hydration shells.
Concluding RemarksIn this Account, 2D IR spectroscopy and MD simulations have
been used to study hydrophobic solvation. The utilization of
2D spectroscopy allowed us to combine a ∼70 fs temporal
resolution with high spectral selectivity. As a result, we suc-
ceeded in the separation of two different types of hydrogen-
bond dynamics in water/TMU mixtures. The first type, “fast”
(∼100 fs) dynamics, are connected to the molecular-jump
water reorientation, while the second type, “slow” dynamics,
are associated with translational mobility of water. According
to our results, molecular-jump reorientations are still possi-
ble at least for some water molecules in the solution. How-
ever, the rate of the reorientation events decreases
dramatically due to a substantial decrease in the water trans-
lational mobility near the hydrophobic groups.
When Frank and Evans coined the term “iceberg”, they
referred to a microscopic region around a hydrophobic mol-
ecule, in which “water molecules are tied together in some
sort of quasi-solid structure”.2 Later, the word “iceberg” often
began to be taken literally: the hydrating water molecules
were assumed to form an ice-like structure, that is, more tet-
rahedrally ordered than bulk water. This picture was not sup-
ported by theoreticians40 and experimentalists8,11 alike who
came to the conclusion that the hydrogen bonds in the hydra-
tion shell of nonpolar solutes are either more broken or do not
differ much from those in bulk water.11 On the other hand,
NMR9,10 and time-resolved IR studies14,15 indicated that the
rotational mobility of water molecules in a hydrophobic sol-
vation shell decreases, bearing some reminiscence to iceberg
formation. The 2D IR experiments and MD simulations pre-
sented in this Account seem to resolve this contradiction. The
water molecules in the hydrophobic shell are not ice-like fro-
zen because they have at least librational degrees of freedom
and some of them can even rotate. However, their transla-
tional mobility is severely compromised and therefore defect
configurations required for molecular switching are lacking, in
agreement with results of rotational anisotropy experiments.
In this respect, our 2D spectroscopic inquest also provides a
microscopic foundation for a previously published empirical
model,41 which proposed that the hydrogen-bond network
around hydrophobic groups is not more rigid compared with
the bulk but that the hydrogen bond dynamics in the two
cases are different. This proposition echoes a recent point
regarding the question of whether a hydrogen bond can be
defined without considering its dynamics.42
This work is part of the research program of the “Stichting voor
Fundamenteel Onderzoek der Materie (FOM)”, which is finan-
cially supported by the “Nederlandse Organisatie voor Weten-
schappelijk Onderzoek (NWO)”. We would like to thank
Damien Laage and Casey Hynes for many useful discussions
and for making ref 17 available to us prior to publication.
BIOGRAPHICAL INFORMATION
Artem A. Bakulin (M.S. Physics, 2005, Moscow State Univer-sity) is a Ph.D. student at the University of Groningen. His researchincludes 2D correlation spectroscopy and ultrafast spectroscopyof conjugated polymers.
Hydrophobic Solvation Bakulin et al.
Vol. 42, No. 9 September 2009 1229-1238 ACCOUNTS OF CHEMICAL RESEARCH 1237

Chungwen Liang (M.S. Physics, 2008, Fudan University) is aPh.D. student at the University of Groningen and works on mem-brane protein channels with molecular dynamics simulation meth-ods and modeling their multidimensional spectra.
Thomas la Cour Jansen (M.S. Chemistry, 1998, University ofCopenhagen; Ph.D. Chemistry, 2002, University of Groningen) isa researcher at the University of Groningen and develops meth-ods for modeling multidimensional spectra.
Douwe A. Wiersma (M.S. Chemistry, 1967, and Ph.D. Chemis-try, 1969, University of Groningen; Postdoctoral Fellow at Uni-versity of Pennsylvania, 1969-1971) is professor of physicalchemistry at the University of Groningen and interested in theapplication of femtosecond four-wave-mixing spectroscopies toliquid state dynamics.
Huib J. Bakker (M.S. Chemistry, 1987, Free University of Amster-dam; Ph.D. Physics, 1991, University of Amsterdam and Insti-tute for Atomic and Molecular Physics, AMOLF; postdoctoralfellow at the Technical University of Aachen, 1991-1994) is agroup leader at AMOLF and a professor of physical chemistry atthe University of Amsterdam. His research work includes the spec-troscopic study of the structure and ultrafast dynamics of waterinteracting with ions and (bio)molecular systems and the mech-anism of proton transfer in aqueous media.
Maxim S. Pshenichnikov (M.S. Physics, 1983, and Ph.D. Phys-ics, 1987, Moscow State University; postdoctoral fellow at Uni-versity of Groningen, 1992-1995) is a researcher at theUniversity of Groningen. He is interested in applications of fem-tosecond spectroscopy to dynamics of liquids and polymers and(non)linear single-molecule microscopy.
FOOTNOTES
*To whom correspondence should be addressed. E-mail: [email protected].
REFERENCES1 Langmuir, I. Molecular Layers. Pilgrim Trust Lecture. Proc. R. Soc. London, Ser. A
1939, 170, 1–39.2 Frank, H. S.; Evans, M. W. Free Volume and Entropy in Condensed Systems.
J. Chem. Phys. 1945, 13, 507–532.3 Franks, F. Water: A Comprehensive Treatise; Plenum Press: New York, 1972.4 Takano, K.; Yamagata, Y.; Yutani, K. Buried water molecules contribute to the
conformational stability of a protein. Protein Eng. 2003, 16, 5–9.5 Zou, Q.; Bennion, B. J.; Daggett, V.; Murphy, K. P. The molecular mechanism of
stabilization of proteins by TMAO and its ability to counteract the effects of urea.J. Am. Chem. Soc. 2002, 124, 1192–1202.
6 Widom, B.; Bhimalapuram, P.; Koga, K. The hydrophobic effect. Phys. Chem. Chem.Phys. 2003, 5, 3085–3093.
7 Bezzabotnov, V. Y.; Cser, L.; Grosz, T.; Jancso, G.; Ostanevich, Y. M. Small-AngleNeutron-Scattering in Aqueous-Solutions of Tetramethylurea. J. Phys. Chem. 1992,96, 976–982.
8 Dixit, S.; Crain, J.; Poon, W. C. K.; Finney, J. L.; Soper, A. K. Molecular SegregationObserved in a Concentrated Alcohol-Water Solution. Nature 2002, 416, 829–832.
9 Wachter, W.; Buchner, R.; Hefter, G. Hydration of Tetraphenylphosphonium andTetraphenylborate Ions by Dielectric Relaxation Spectroscopy. J. Phys. Chem. B2006, 110, 5147–5154.
10 Shimizu, A.; Fumino, K.; Yukiyasu, K.; Taniguchi, Y. NMR Studies on DynamicBehavior of Water Molecule in Aqueous Denaturant Solutions at 25 degrees C:Effects of Guanidine Hydrochloride, Urea and Alkylated Ureas. J. Mol. Liq. 2000, 85,269–278.
11 Qvist, J.; Halle, B. Thermal Signature of Hydrophobic Hydration Dynamics. J. Am.Chem. Soc. 2008, 130, 10345–10353.
12 Hamm, P.; Lim, M. H.; Hochstrasser, R. M. Structure of the Amide I Band ofPeptides Measured by Femtosecond Nonlinear-Infrared Spectroscopy. J. Phys.Chem. B 1998, 102, 6123–6138.
13 Mukamel, S. Multidimensional Femtosecond Correlation Spectroscopies ofElectronic and Vibrational Excitations. Annu. Rev. Phys. Chem. 2000, 51, 691–729.
14 Rezus, Y. L. A.; Bakker, H. J. Observation of Immobilized Water Molecules aroundHydrophobic Groups. Phys. Rev. Lett. 2007, 99, 148301.
15 Rezus, Y. L. A.; Bakker, H. J. Strong Slowing down of Water Reorientation inMixtures of Water and Tetramethylurea. J. Phys. Chem. A 2008, 112, 2355–2361.
16 Laage, D.; Hynes, J. T. A Molecular Jump Mechanism of Water Reorientation.Science 2006, 311, 832–835.
17 Laage, D.; Stirnemann, G.; Hynes, J. T. Why Water Reorientation Slows downwithout Iceberg Formation around Hydrophobic Solutes. J. Phys. Chem. B 2009,113, 2428–2435.
18 Fecko, C. J.; Eaves, J. D.; Loparo, J. J.; Tokmakoff, A.; Geissler, P. L. UltrafastHydrogen-Bond Dynamics in the Infrared Spectroscopy of Water. Science 2003,301, 1698–1702.
19 Asbury, J. B.; Steinel, T.; Fayer, M. D. Hydrogen Bond Networks: Structure andEvolution after Hydrogen Bond Breaking. J. Phys. Chem. B 2004, 108, 6544–6554.
20 Eaves, J. D.; Loparo, J. J.; Fecko, C. J.; Roberts, S. T.; Tokmakoff, A.; Geissler,P. L. Hydrogen Bonds in Liquid Water Are Broken Only Fleetingly. Proc. Natl. Acad.Sci. U.S.A. 2005, 102, 13019–13022.
21 Laage, D.; Hynes, J. T. On the Molecular Mechanism of Water Reorientation. J.Phys. Chem. B 2008, 112, 14230–14242.
22 Jonas, D. M. Two-Dimensional Femtosecond Spectroscopy. Annu. Rev. Phys. Chem.2003, 54, 425–463.
23 Zheng, J.; Kwak, K.; Fayer, M. D. Ultrafast 2D IR Vibrational Echo Spectroscopy.Acc. Chem. Res. 2007, 40, 75–83.
24 Lazonder, K.; Pshenichnikov, M. S.; Wiersma, D. A. Easy Interpretation of OpticalTwo-Dimensional Correlation Spectra. Opt. Lett. 2006, 31, 3354–3356.
25 Wiersma, D. A.; Duppen, K. Picosecond Holographic-Grating Spectroscopy. Science1987, 237, 1147–1154.
26 Park, S.; Kwak, K.; Fayer, M. D. Ultrafast 2D-IR Vibrational Echo Spectroscopy: AProbe of Molecular Dynamics. Laser Phys. Lett. 2007, 4, 704–718.
27 Roberts, S. T.; Loparo, J. J.; Tokmakoff, A. Characterization of spectral diffusionfrom two-dimensional line shapes. J. Chem. Phys. 2006, 125, 084502.
28 Mukamel, S. Principles of Nonlinear Optical Spectroscopy; Oxford University Press:New York, 1999.
29 Kraemer, D.; Cowan, M. L.; Paarmann, A.; Huse, N.; Nibbering, E. T. J.; Elsaesser,T.; Miller, R. J. D. Temperature Dependence of the Two-Dimensional InfraredSpectrum of Liquid H2O. Proc. Natl. Acad. Sci. U.S.A. 2008, 105, 437–442.
30 Kwak, K.; Rosenfeld, D. E.; Fayer, M. D. Taking Apart the Two-Dimensional InfraredVibrational Echo Spectra: More Information and Elimination of Distortions. J. Chem.Phys. 2008, 128, 204505.
31 Bakker, H. J.; Rezus, Y. L. A.; Timmer, R. L. A. Molecular Reorientation of LiquidWater Studied with Femtosecond Midinfrared Spectroscopy. J. Phys. Chem. A 2008,112, 11523–11534.
32 Jimenez, R.; Fleming, G. R.; Kumar, P. V.; Maroncelli, M. Femtosecond SolvationDynamics of Water. Nature 1994, 369, 471–473.
33 Nigro, B.; Re, S.; Laage, D.; Rey, R.; Hynes, J. T. On the Ultrafast InfraredSpectroscopy of Anion Hydration Shell Hydrogen Bond Dynamics. J. Phys. Chem. A2006, 110, 11237–11243.
34 Lindahl, E.; Hess, B.; van der Spoel, D. GROMACS 3.0: A Package for MolecularSimulation and Trajectory Analysis. J. Mol. Model. 2001, 7, 306–317.
35 Berendsen, H. J. C.; Grigera, J. R.; Straatsma, T. P. The Missing Term in EffectivePair Potentials. J. Phys. Chem. 1987, 91, 6269–6271.
36 Belletato, P.; Freitas, L. C. G.; Areas, E. P. G.; Santos, P. S. Computer Simulation ofLiquid Tetramethylurea and Its Aqueous Solution. Phys. Chem. Chem. Phys. 1999,1, 4769–4776.
37 The standard geometrical definition of the hydrogen bond was used: the O · · · Odistance is shorter that 3.5 Å and the O · · · OH angle is smaller than 30°.
38 Sciortino, F.; Geiger, A.; Stanley, H. E. Effect of Defects on Molecular Mobility inLiquid Water. Nature 1991, 354, 218–221.
39 Nakahara, M.; Wakai, C.; Yoshimoto, Y.; Matubayasi, N. Dynamics of HydrophobicHydration of Benzene. J. Phys. Chem. 1996, 100, 1345–1349.
40 Graziano, G.; Lee, B. On the Intactness of Hydrogen Bonds around Nonpolar SolutesDissolved in Water. J. Phys. Chem. B 2005, 109, 8103–8107.
41 Muller, N. Search for a Realistic View of Hydrophobic Effects. Acc. Chem. Res.1990, 23, 23–28.
42 Tokmakoff, A. Shining Light on the Rapidly Evolving Structure of Water. Science2007, 317, 54–55.
Hydrophobic Solvation Bakulin et al.
1238 ACCOUNTS OF CHEMICAL RESEARCH 1229-1238 September 2009 Vol. 42, No. 9


