243
GEOTECHNICAL RECONNAISSANCE OF THE
2010 DARFIELD (CANTERBURY) EARTHQUAKE
Editors: Misko Cubrinovski1, Russell A. Green
2
Contributing authors (alphabetical order):
John Allen3, Scott Ashford
4, Elisabeth Bowman
1, Brendon
Bradley1, Brady Cox
5, Misko Cubrinovski
1, Russell A. Green
2,
Tara Hutchinson6, Edward Kavazanjian
7, Rolando Orense
8,
Michael Pender8, Mark Quigley
1, Liam Wotherspoon
8
SUMMARY
On 4 September 2010, a magnitude Mw 7.1 earthquake struck the Canterbury region on the South Island
of New Zealand. The epicentre of the earthquake was located in the Darfield area about 40 km west of
the city of Christchurch. Extensive damage was inflicted to lifelines and residential houses due to
widespread liquefaction and lateral spreading in areas close to major streams, rivers and wetlands
throughout Christchurch and Kaiapoi. Unreinforced masonry buildings also suffered extensive damage
throughout the region. Despite the severe damage to infrastructure and residential houses, fortunately, no
deaths occurred and only two injuries were reported in this earthquake. From an engineering viewpoint,
one may argue that the most significant aspects of the 2010 Darfield Earthquake were geotechnical in
nature, with liquefaction and lateral spreading being the principal culprits for the inflicted damage.
Following the earthquake, an intensive geotechnical reconnaissance was conducted to capture evidence
and perishable data from this event. The surveys were performed on foot, by car and from a helicopter
over a period of six days. A broad-brush field reconnaissance was conducted in the first two days,
followed by pin-point investigations at specific locations including detailed site inspections and field
testing using: Dynamic Cone Penetration Test (DCPT), Swedish Weight Sounding (SWS), and Spectral
Analysis of Surface Waves (SASW).
This paper summarizes the observations and preliminary findings from this early reconnaissance work.
1 University of Canterbury, Christchurch, New Zealand
2 Virginia Tech, Blacksburg, VA, USA
3 TRI/Environmental, Inc., Austin, TX, USA
4 Oregon State University, Corvallis, OR, USA
5 University of Arkansas, Fayetteville, AR, USA
6 University of California, San Diego, CA, USA
7 Arizona State University, Tempe, AZ, USA
8 University of Auckland, Auckland, New Zealand
BULLETIN OF THE NEW ZEALAND SOCIETY FOR EARTHQUAKE ENGINEERING, Vol. 43, No. 4, December 2010
244
1. INTRODUCTION
On 4 September 2010, a magnitude Mw 7.1 earthquake struck
the Canterbury region on the South Island of New Zealand.
The epicentre of the earthquake was located in the Darfield
area about 40 km west of the city of Christchurch. Extensive
damage occurred to unreinforced masonry buildings
throughout the region during the mainshock and subsequent
large aftershocks. Particularly extensive damage was inflicted
to lifelines and residential houses due to widespread
liquefaction and lateral spreading in areas close to major
streams, rivers and wetlands throughout Christchurch and
Kaiapoi. Despite the severe damage to infrastructure and
residential houses, fortunately, no deaths occurred and only
two injuries were reported in this earthquake. From an
engineering viewpoint, one may argue that the most
significant aspects of the 2010 Darfield Earthquake were
geotechnical in nature, with liquefaction and lateral spreading
being the principal culprits for the inflicted damage.
Following the earthquake, a geotechnical reconnaissance was
conducted over a period of six days (10–15 September 2010)
by a team of geotechnical/earthquake engineers and geologists
from New Zealand and USA (GEER team: Geo-engineering
Extreme Event Reconnaissance). The team included the
following members:
Assoc. Prof. Misko Cubrinovski – NZ Lead (University of
Canterbury, Christchurch, New Zealand)
Assoc. Prof. Russell A. Green – US Lead (Virginia Tech,
Blacksburg, VA, USA)
Mr. Tom Algie – (University of Auckland, Auckland, New
Zealand)
Mr. John Allen – (TRI/Environmental, Inc., Austin, TX,
USA)
Prof. Scott Ashford – (Oregon State University, Corvallis,
OR, USA)
Mr. Jawad Arefi – (University of Canterbury, Christchurch,
New Zealand)
Dr. Elisabeth Bowman – (University of Canterbury,
Christchurch, New Zealand)
Dr. Brendon Bradley – (University of Canterbury,
Christchurch, New Zealand)
Assist. Prof. Brady Cox – (University of Arkansas,
Fayetteville, AR, USA)
Mr. William Godwin – (Fugro William Lettis and
Associates, Inc., Walnut Creek, CA, USA)
Prof. Tara Hutchinson – (University of California, San
Diego, CA, USA)
Prof. Edward Kavazanjian – (Arizona State University,
Tempe, AZ, USA)
Dr. Tam Larkin – (University of Auckland, Auckland, New
Zealand)
Dr. Rolando Orense – (University of Auckland, Auckland,
New Zealand)
Prof. Michael Pender – (University of Auckland, Auckland,
New Zealand)
Dr. Mark Quigley – (University of Canterbury, Christchurch,
New Zealand)
Ms. Kelly Robinson – (University of Canterbury,
Christchurch, New Zealand)
Mr. Merrick Taylor – (University of Canterbury,
Christchurch, New Zealand)
Dr. Thomas Wilson – (University of Canterbury,
Christchurch, New Zealand)
Dr. Liam Wotherspoon – (University of Auckland,
Auckland, New Zealand)
The following JGS (Japanese Geotechnical Society) members
from Japan also participated in the reconnaissance team from
13 to 15 September 2010:
Prof. Mitsu Okamura – JGS Lead (Ehime University,
Matsuyama, Japan)
Assoc. Prof. Takashi Kiyota – (Institute of Industrial
Science, University of Tokyo, Tokyo, Japan)
Assoc. Prof. Hirofumi Toyota – (Nagaoka University of
Technology, Nagaoka, Japan)
The NZ, GEER and JGS members worked as one team and
shared resources, information and logistics in order to conduct
a thorough and efficient reconnaissance covering a large area
over a very limited time period. This paper summarises the
key evidence and findings from the reconnaissance. Any
opinions, findings, and conclusions or recommendations
expressed in this paper are those of the authors and do not
necessarily reflect the views of the associated organisations
and funding agencies.
2. GEOLOGICAL ASPECTS
2.1 Summary
At 4:35 am on September 4th NZ Standard Time (16:35 Sept
3rd UTC) the rupture of a previously unrecognized strike-slip
fault beneath the Canterbury Plains of New Zealand‟s South
Island produced a Mw 7.1 earthquake. Although this
earthquake caused widespread damage to the Canterbury
region, it also allowed documenting the dynamics and effects
of a major strike-slip fault rupture in the fortuitous absence of
death or major injuries. The low relief and well maintained
agricultural landscape of the Canterbury Plains has provided
an ideal environment to characterise even the most subtle of
earthquake-related ground deformation at high resolution. This
chapter summarizes the basic geological context and ground
rupture characteristics of the earthquake.
2.2 Geological context for the
Darfield (Canterbury) earthquake
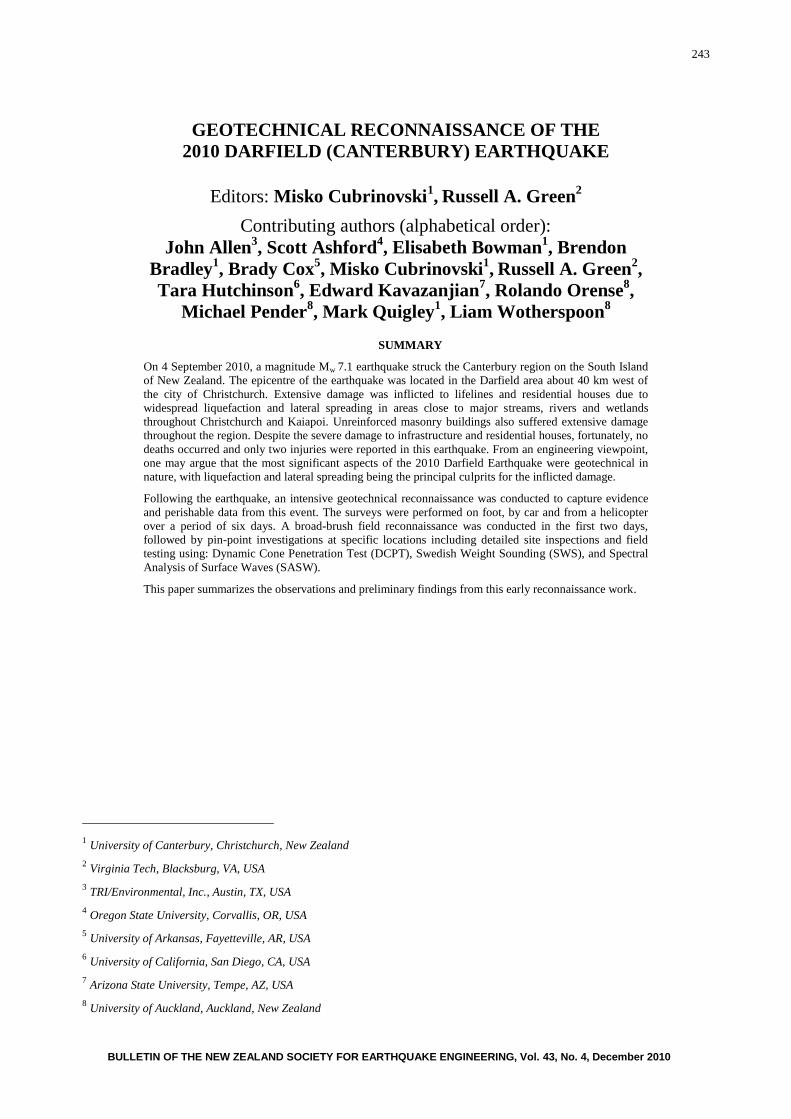
The tectonic plate boundary between the Australian (A) and
Pacific (P) Plates passes through the South Island of New
Zealand, where subduction of the Hikurangi Plateau to the
north transitions into a continent-continent collision zone
associated with the collision of the Chatham Rise with
continental crust of the Australian Plate (Figure 2.1). The A
and P plates converge obliquely at 48–39 mm/yr in New
Zealand. The resultant collision zone between these plates is
not a line on a map; rather it is a distributed zone of active
faults each with their own capability of generating large
earthquakes throughout/around New Zealand. The
Marlborough Fault Zone consists of a series of large,
„transpressional‟ faults that record primarily right-lateral
displacement with a component of shortening, resulting in
mountain uplift. These faults ultimately link to the Alpine
Fault, which accommodates ~70-75% of the total relative plate
boundary motion between the A-P Plates with a values of 27 ±
5 mm/ yr of strike-slip and 5–10 mm/yr of dip-slip (Norris &
Cooper 2001). The remaining ~30% of A-P plate motion is
accommodated by slip on a series of faults throughout the
Southern Alps and Canterbury Plains. The Greendale Fault,
which was the source of the 2010 Darfield (Canterbury)
earthquake, is one of these structures, although it was not
recognized prior to this earthquake. Much of the motion is
likely taken up on the other big faults, such as the Porter‟s
Pass Fault, which has a slip rate of 3-7 mm/yr (3–5 mm/yr;
e.g. Cowan et al. 1996; Howard et al. 2005; 7 mm/yr; Wallace
et al., 2007). Modelling of GPS-derived velocity fields
suggests a strain rate of ~2 mm/yr of WNW oriented
245
permanent contraction for the region east of the Porter‟s Pass
Fault to offshore of Christchurch that hosts the Greendale
Fault (“Canterbury Block”; Wallace et al., 2007). There are
several structures in this region, both expressed at the surface
and „hidden‟ beneath the surface, that pose an earthquake
hazard to Christchurch (e.g., Hororata Fault, Hororata
anticline, Springbank Fault, Bobby‟s Creek Fault, Greendale
Fault). E-W trending faults are present throughout Canterbury
and offshore on the Chatham Rise, and some of these are now
'active' faults (i.e. faults that have had large earthquakes in the
last ~10,000 yrs and/or have the potential to generate
earthquakes in the modern setting). In a general sense, E-W
trending faults like the Greendale fault tend to be strike-slip
dominated faults (e.g., Porter‟s Pass Fault; Bobby‟s Creek
Fault, Ashley Fault) while NE-SW to N-S trending faults tend
to be reverse-slip dominated faults with smaller components
of strike-slip (e.g., Springfield Fault, Springbank Fault,
Hororata Fault). As is clear from this recent earthquake, it is
important to obtain more information on the locations of all
active faults beneath the Canterbury Plains (via geophysical
and mapping investigations) and earthquake histories of all
faults (via mapping and paleoseismic analysis) in order to
better understand the risk that these structures pose to the
Canterbury region (Pettinga et al., 2001).
2.3 The September 2010 Darfield (Canterbury)
Earthquake
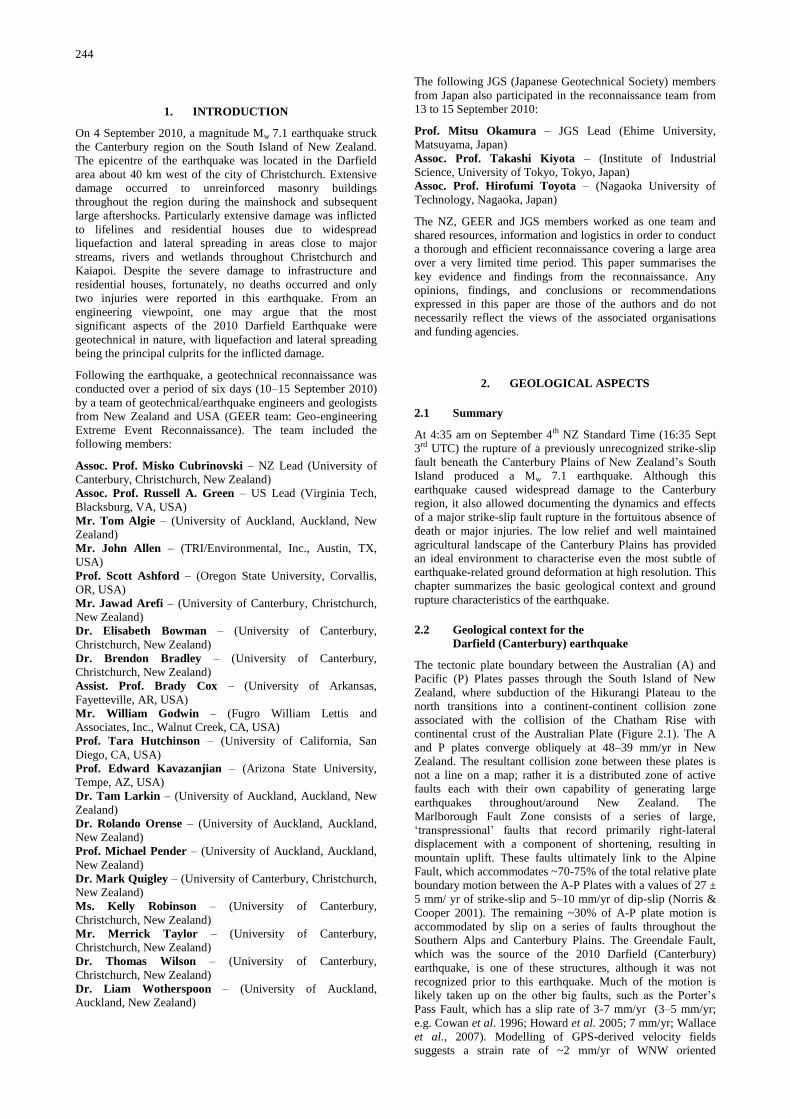
The epicentre of the Darfield Earthquake was located
approximately 10 km southeast of the town of Darfield (Figure
2.2) with a focal depth of ~10 km. Preliminary USGS and
global centroid moment tensor solutions indicated the
mainshock was associated with almost pure dextral (right-
lateral) strike-slip slip on a subvertical nearly E-W striking
fault plane. The event produced a ≥ 28 km long, dextral strike-
slip surface rupture trace, aligned approximately west-east
(Figure 2.2). Using data from New Zealand national and
strong-motion seismic networks, GNS seismologists have
proposed that the rupture process involved a component of
reverse faulting at depth. In the month following the
mainshock, the region has incurred thousands of aftershocks
of ML > 2 including eleven aftershocks of ML ≥ 5.0. A ML 5.2
aftershock on September 8th (NZST) located ~7 km southeast
of the Christchurch city centre at a depth of ~6 km caused
further damage to city infrastructure. The frequency of ML > 2
aftershocks has decreased by an order of magnitude since the
days immediately following the mainshock although the
possibility of M ≥ 5 earthquakes still remains, as the region
adjusts to the crustal deformation associated with the
mainshock.
Aftershock distributions proximal to the E-W trending part of
the Greendale fault are dominated by ~E-W trending dextral
strike-slip mechanisms, as expected from kinematic analysis
of the patterns of ground rupture. A NE-trending cloud of
aftershocks west of the Greendale fault, between Hororata and
the Rakaia River is dominated by ~NE trending thrust fault
mechanisms. A NE-trending cloud of aftershocks north of the
Greendale fault, between Darfield and the Waimakariri River
is a mixture of ~NE trending thrust fault and strike-slip fault
mechanisms. A NNW-trending swarm of seismicity from ~5
km north of Rolleston south to Lincoln consists of a mixture
of NW-trending normal fault mechanisms and (probably) E-W
trending dextral strike slip mechanisms.
The NE and NW trending belts of seismicity are consistent
with field observations of subtle deformation in these
localities although these aspects require further research.
Figure 2.1: A-P plate boundary through New Zealand
and convergence rates of P relative to A
Plate. (Image courtesy of Jarg Pettinga).
Figure 2.2: Aerial image of the Christchurch area with
the surface fault rupture and the epicentre of
the Darfield earthquake are denoted. The
image is ~117 km across.
2.4 Characteristics of the surface fault rupture
The zone of identified surface rupture extends from ~4 km
WNW of the hamlet of Greendale for about 28 km to an
eastern tip ~2 km NW of the town of Rolleston (Figure 2.2).
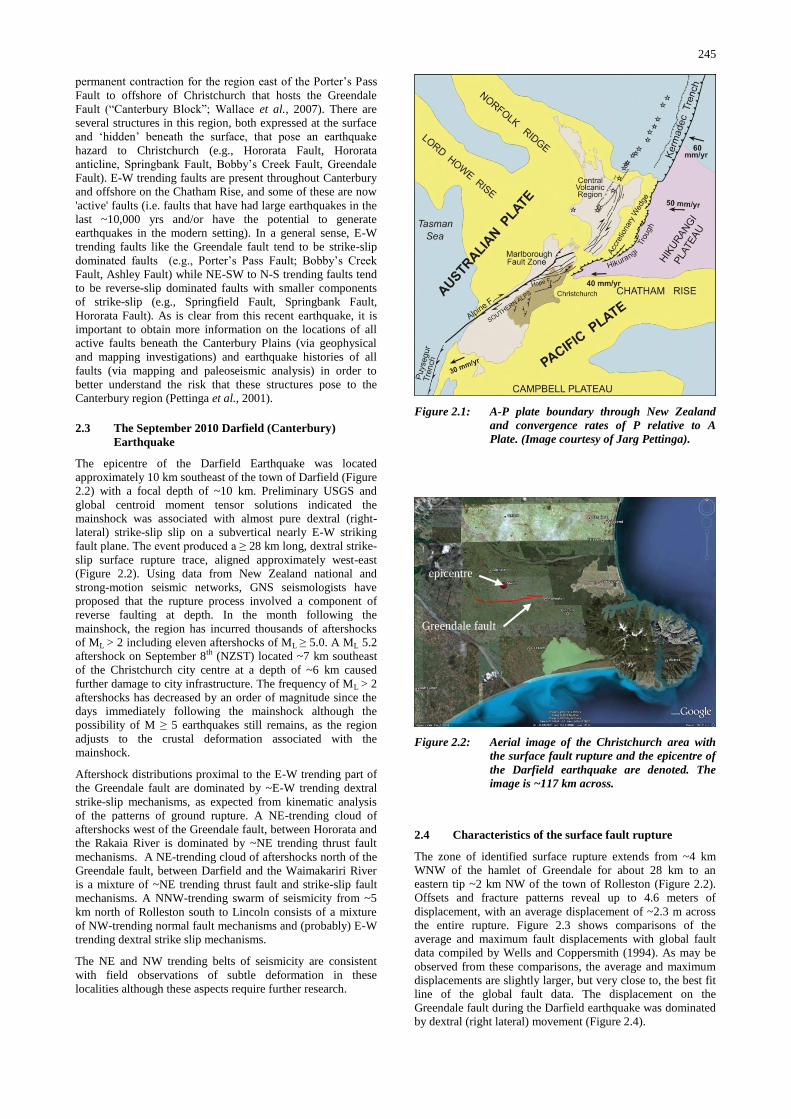
Offsets and fracture patterns reveal up to 4.6 meters of
displacement, with an average displacement of ~2.3 m across
the entire rupture. Figure 2.3 shows comparisons of the
average and maximum fault displacements with global fault
data compiled by Wells and Coppersmith (1994). As may be
observed from these comparisons, the average and maximum
displacements are slightly larger, but very close to, the best fit
line of the global fault data. The displacement on the
Greendale fault during the Darfield earthquake was dominated
by dextral (right lateral) movement (Figure 2.4).
Greendale fault
epicentre
246
Figure 2.3: Comparisons of average (top) and maximum (bottom) surface rupture displacements for the Darfield
earthquake with global fault data compiled by Wells and Coppersmith (1994). (Global fault data courtesy of Don Wells).
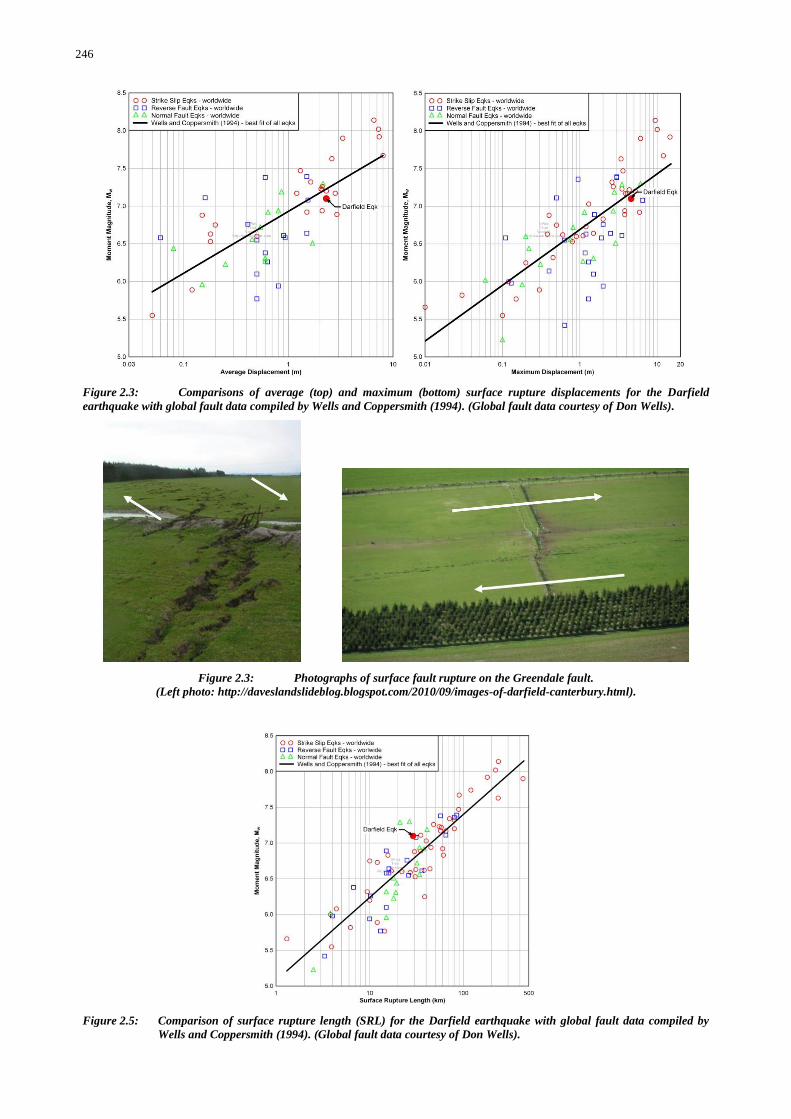
Figure 2.3: Photographs of surface fault rupture on the Greendale fault.
(Left photo: http://daveslandslideblog.blogspot.com/2010/09/images-of-darfield-canterbury.html).
Figure 2.5: Comparison of surface rupture length (SRL) for the Darfield earthquake with global fault data compiled by
Wells and Coppersmith (1994). (Global fault data courtesy of Don Wells).
247
Vertical offsets of up to ~1 m occur at constraining or
releasing bends. Oblique east-side down slip on the NW-
striking western portion of the fault resulted in partial
diversion of the Hororata River. The gross morphology of the
fault is that of a series of E-W striking, NE-stepping surface
traces that in detail consist of ESE-trending Riedel fractures
with right-lateral displacements, SE-trending extensional
fractures, SSE- to S-trending Riedel' fractures with left-lateral
displacements, and NE-striking thrusts and folds. Offsets as
small as 10-50 mm were able to be mapped due to the
numerous straight features (e.g., roads, fences) crossing the
fault. As a consequence, the Greendale fault surface rupture
length (SRL) has been measured to a high level of confidence.
However, when the SRL is plotted against Moment Magnitude
(Mw), and compared to global fault data (Figure 2.5), the
Greendale SRL seems remarkably short for an earthquake of
Mw 7.1. This is likely because much of the fault rupture
occurred beneath the surface without any clear surface
topographic expression. An ENE trending, ≥ 6 km long line of
broken fences and roads ~2 km south of Prebbleton indicates
that the rupture process may have been complex and involved
additional faults; this hypothesis is currently being tested with
further geological mapping and shallow crustal geophysics.
The eastern end of the fault north of Rolleston is undergoing
creep at the surface, suggesting that the subsurface extent of
the Greendale Fault rupture may extend further to the east then
the mapped surface rupture. There is no seismological
evidence to support the continuation of the fault into
Christchurch City and post-earthquake creep along faults is an
expected and well documented phenomenon. Ongoing
research and mapping of deformation throughout the region
will provide additional constraints on the spatial pattern of
surface rupture.
2.5 History of the Greendale fault
Given the E-W strike of the Greendale Fault, it is very likely
that this fault first formed during crustal extension more than
50 to 60 million years ago, when the shape of New Zealand
(aka Zealandia) was much different from today. The
Greendale Fault ruptured primarily across alluvial plains of
the „Burnham‟ surface, abandoned by rivers at the end of the
Last Glaciation (Forsyth et al. 2008). No evidence of previous
faulting had been recognized, either prior to the earthquake or
in retrospective examination of pre-earthquake aerial
photographs. However, thorough cultivation of the Canterbury
Plains following the arrival of Europeans in the mid 1800s,
some detail of the original river channel form has been
subdued. Vertical offset along much of the new fault trace was
minimal, given the strike-slip dominated movement, it is
probable that previous earthquakes had small vertical-to-
lateral displacements that would have evolved with time into
isolated small hills that would not be easily recognizable as
fault scarps. It is also possible that previous earthquakes did
not produce surface rupture, as was the case for the 2010 Mw
7.0 Haiti earthquake, which shows no evidence for faulting at
the surface. For these reasons, it is important to be cautious
when drawing conclusions on the long term earthquake history
of the Greendale Fault based on aerial photographs. Future
research into „paleo-liquefaction‟ features and fault trenching
will hopefully yield datasets relevant to understanding the
long-term history of this fault. Other, possibly analogous
faults (e.g., Bobby‟s Creek Fault, Ashley Fault) have
Holocene earthquake recurrence intervals ranging from 1,000-
4,000 yrs.
2.6 Geomorphology of Soil Deposits
in the Christchurch Area
The Canterbury Plains, about 160 km long and of varying
width, are New Zealand‟s largest areas of flat land. The plains
have been formed by the overlapping fans of glacier-fed rivers
originating from the Southern Alps. The plains are often
described as fertile, but the soils are variable. Most are derived
from the greywacke of the mountains or from loess (fine
sediment blown from riverbeds). In addition, clay and
volcanic rock are present near Christchurch from the Port Hills
slopes of the Banks Peninsula.
The city of Christchurch is located at the coast of the
Canterbury Plains adjacent to an extinct volcanic complex
forming Banks Peninsula. Most of the city was developed on
swamp, beach dune sand, estuaries and lagoons, which have
now been drained (Brown et al., 1995). The two main rivers,
Avon and Heathcote, which originate from springs in western
Christchurch, meander through the city and act as main
drainage system. The Waimakariri River with its catchment in
the Southern Alps, regularly flooded Christchurch prior to
stopbank construction and river realignment, which began
shortly after the city was established in 1850.
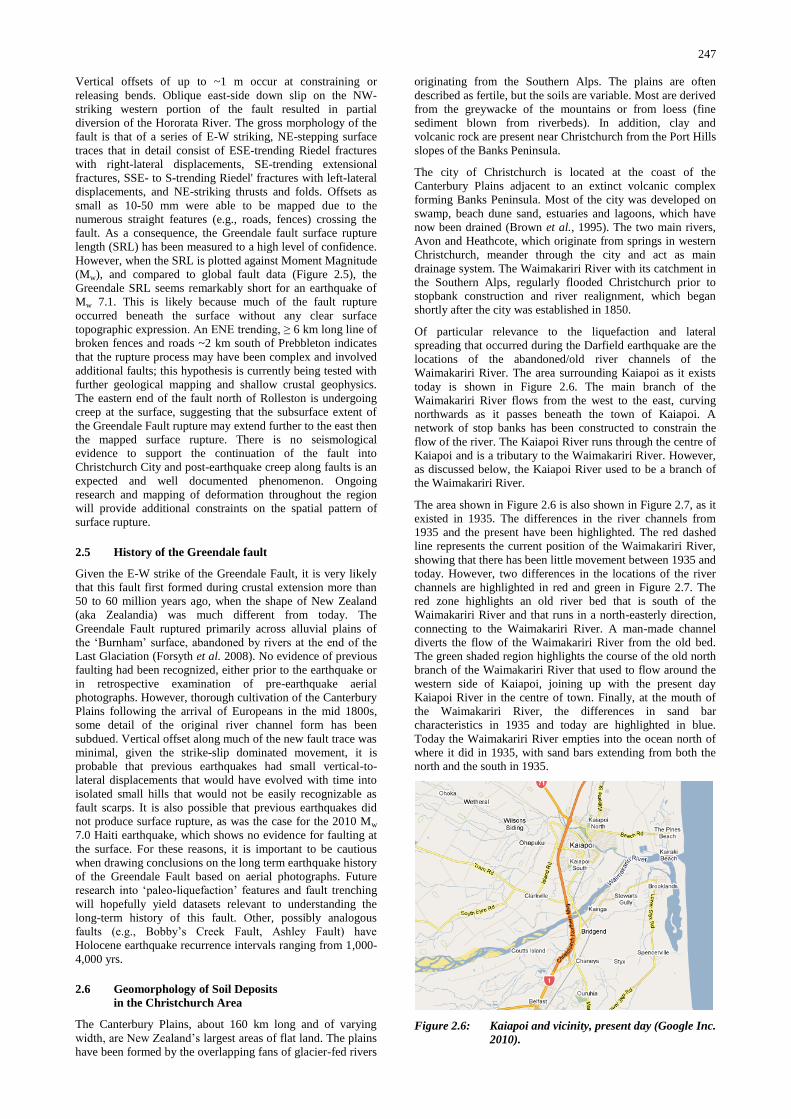
Of particular relevance to the liquefaction and lateral
spreading that occurred during the Darfield earthquake are the
locations of the abandoned/old river channels of the
Waimakariri River. The area surrounding Kaiapoi as it exists
today is shown in Figure 2.6. The main branch of the
Waimakariri River flows from the west to the east, curving
northwards as it passes beneath the town of Kaiapoi. A
network of stop banks has been constructed to constrain the
flow of the river. The Kaiapoi River runs through the centre of
Kaiapoi and is a tributary to the Waimakariri River. However,
as discussed below, the Kaiapoi River used to be a branch of
the Waimakariri River.
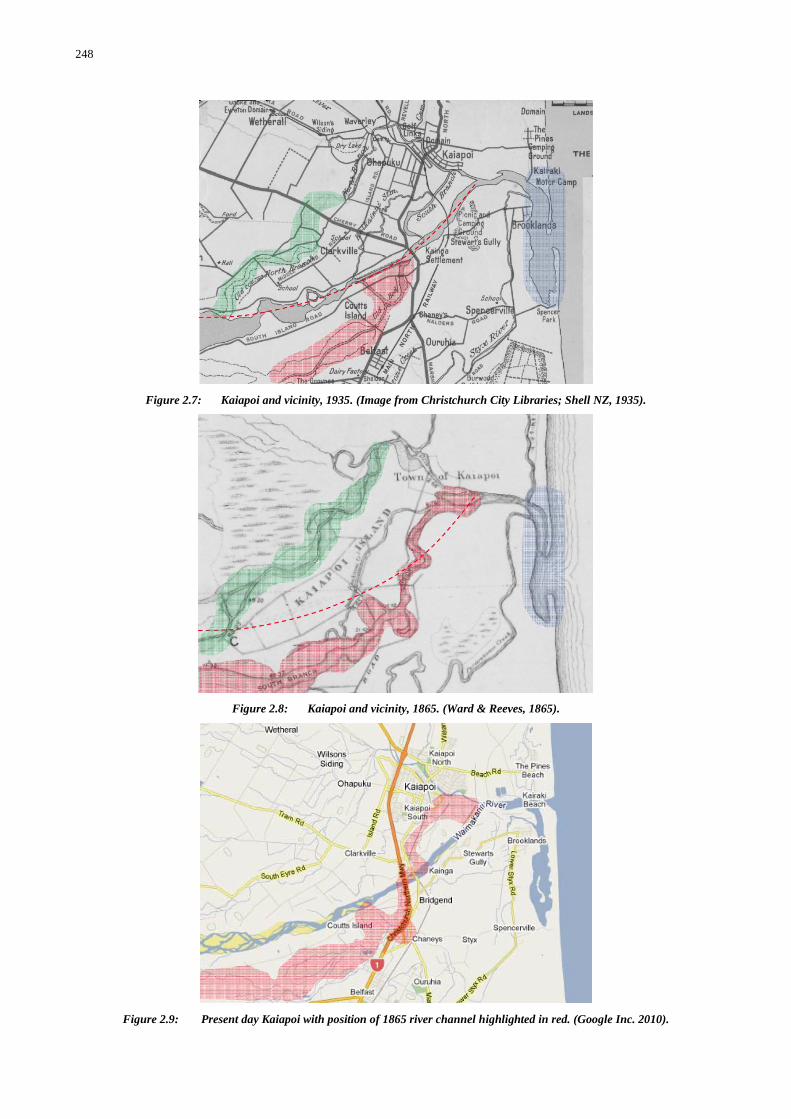
The area shown in Figure 2.6 is also shown in Figure 2.7, as it
existed in 1935. The differences in the river channels from
1935 and the present have been highlighted. The red dashed
line represents the current position of the Waimakariri River,
showing that there has been little movement between 1935 and
today. However, two differences in the locations of the river
channels are highlighted in red and green in Figure 2.7. The
red zone highlights an old river bed that is south of the
Waimakariri River and that runs in a north-easterly direction,
connecting to the Waimakariri River. A man-made channel
diverts the flow of the Waimakariri River from the old bed.
The green shaded region highlights the course of the old north
branch of the Waimakariri River that used to flow around the
western side of Kaiapoi, joining up with the present day
Kaiapoi River in the centre of town. Finally, at the mouth of
the Waimakariri River, the differences in sand bar
characteristics in 1935 and today are highlighted in blue.
Today the Waimakariri River empties into the ocean north of
where it did in 1935, with sand bars extending from both the
north and the south in 1935.
Figure 2.6: Kaiapoi and vicinity, present day (Google Inc.
2010).
248
Figure 2.7: Kaiapoi and vicinity, 1935. (Image from Christchurch City Libraries; Shell NZ, 1935).
Figure 2.8: Kaiapoi and vicinity, 1865. (Ward & Reeves, 1865).
Figure 2.9: Present day Kaiapoi with position of 1865 river channel highlighted in red. (Google Inc. 2010).
249
The 1865 position of the south branch of the Waimakariri
River is superimposed onto the present day map of the region
in Figure 2.9. The old channel covers a large area on the
eastern side of South Kaiapoi, coming from the south along
the present-day railway line. South of the present-day
Waimakariri River, the old channel covers a large part of the
Coutts Island area on both sides of State Highway 1, extending
west across farms and golf courses on the landside of the
present day stopbanks. The implications of the location of the
old river channel on the observed liquefaction and lateral
spreading that occurred during Darfield Earthquake are
discussed in subsequent chapters.
3. SEISMOLOGICAL ASPECTS
3.1 Regional seismicity and historical earthquakes
New Zealand straddles the boundary of the Australian and
Pacific plates, where relative plate motion is obliquely
convergent across the plate boundary at about 50 mm/yr in the
north of the country, 40 mm/yr in the centre, and 30 mm/yr in
the south (DeMets et al. 1994). The complex faulting
associated with the changing orientation of the subduction
zones in the northeast and southwest, causes predominantly
dextral faulting through the axial tectonic belt in the centre of
the country.
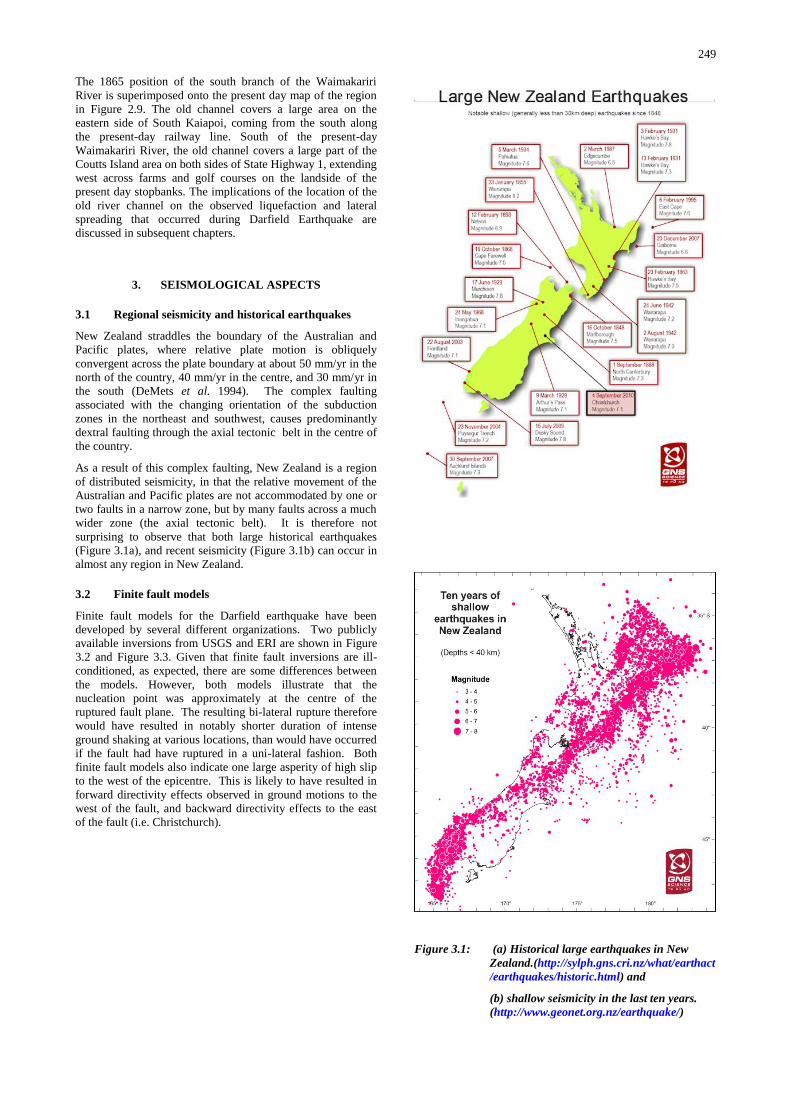
As a result of this complex faulting, New Zealand is a region
of distributed seismicity, in that the relative movement of the
Australian and Pacific plates are not accommodated by one or
two faults in a narrow zone, but by many faults across a much
wider zone (the axial tectonic belt). It is therefore not
surprising to observe that both large historical earthquakes
(Figure 3.1a), and recent seismicity (Figure 3.1b) can occur in
almost any region in New Zealand.
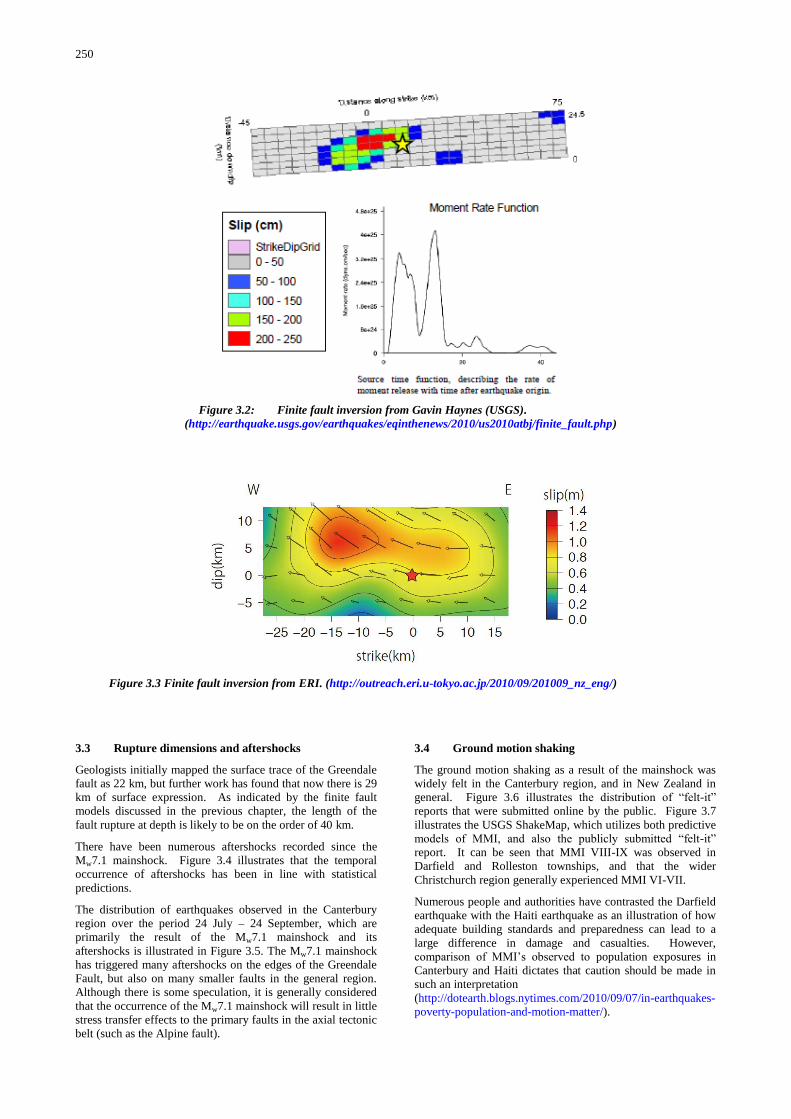
3.2 Finite fault models
Finite fault models for the Darfield earthquake have been
developed by several different organizations. Two publicly
available inversions from USGS and ERI are shown in Figure
3.2 and Figure 3.3. Given that finite fault inversions are ill-
conditioned, as expected, there are some differences between
the models. However, both models illustrate that the
nucleation point was approximately at the centre of the
ruptured fault plane. The resulting bi-lateral rupture therefore
would have resulted in notably shorter duration of intense
ground shaking at various locations, than would have occurred
if the fault had have ruptured in a uni-lateral fashion. Both
finite fault models also indicate one large asperity of high slip
to the west of the epicentre. This is likely to have resulted in
forward directivity effects observed in ground motions to the
west of the fault, and backward directivity effects to the east
of the fault (i.e. Christchurch).
Figure 3.1: (a) Historical large earthquakes in New
Zealand.(http://sylph.gns.cri.nz/what/earthact
/earthquakes/historic.html) and
(b) shallow seismicity in the last ten years.
(http://www.geonet.org.nz/earthquake/)
250
3.3 Rupture dimensions and aftershocks
Geologists initially mapped the surface trace of the Greendale
fault as 22 km, but further work has found that now there is 29
km of surface expression. As indicated by the finite fault
models discussed in the previous chapter, the length of the
fault rupture at depth is likely to be on the order of 40 km.
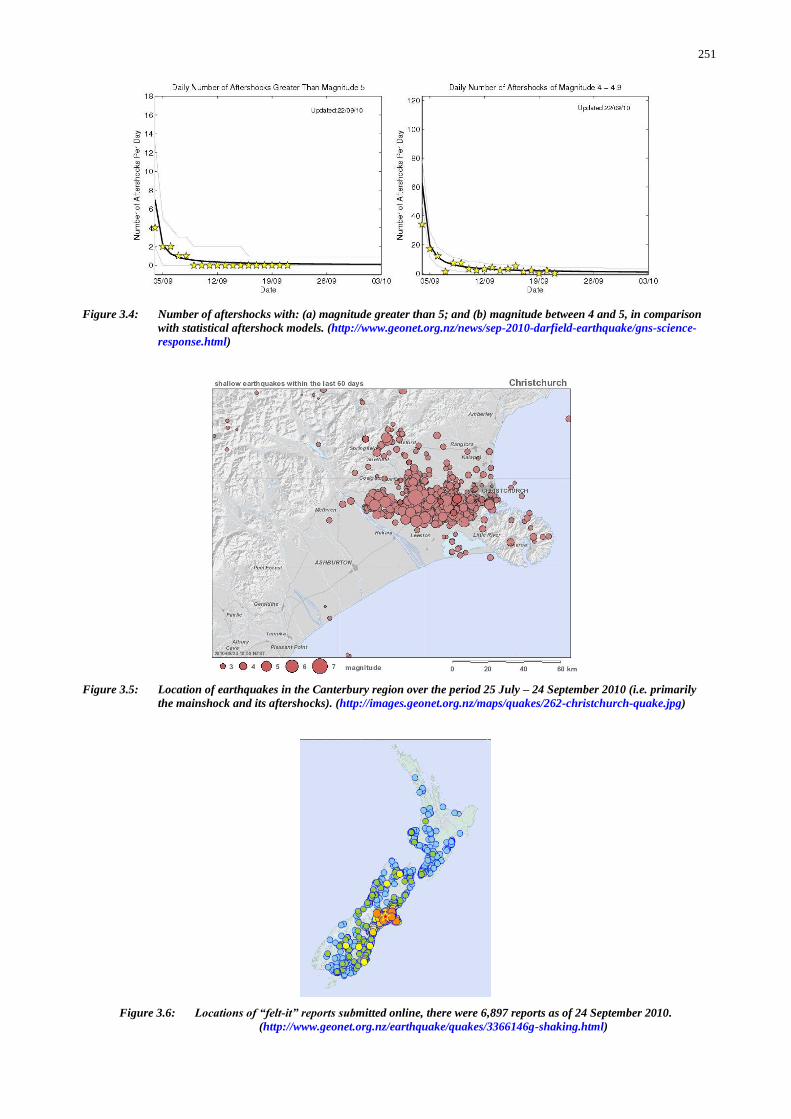
There have been numerous aftershocks recorded since the
Mw7.1 mainshock. Figure 3.4 illustrates that the temporal
occurrence of aftershocks has been in line with statistical
predictions.
The distribution of earthquakes observed in the Canterbury
region over the period 24 July – 24 September, which are
primarily the result of the Mw7.1 mainshock and its
aftershocks is illustrated in Figure 3.5. The Mw7.1 mainshock
has triggered many aftershocks on the edges of the Greendale
Fault, but also on many smaller faults in the general region.
Although there is some speculation, it is generally considered
that the occurrence of the Mw7.1 mainshock will result in little
stress transfer effects to the primary faults in the axial tectonic
belt (such as the Alpine fault).
3.4 Ground motion shaking
The ground motion shaking as a result of the mainshock was
widely felt in the Canterbury region, and in New Zealand in
general. Figure 3.6 illustrates the distribution of “felt-it”
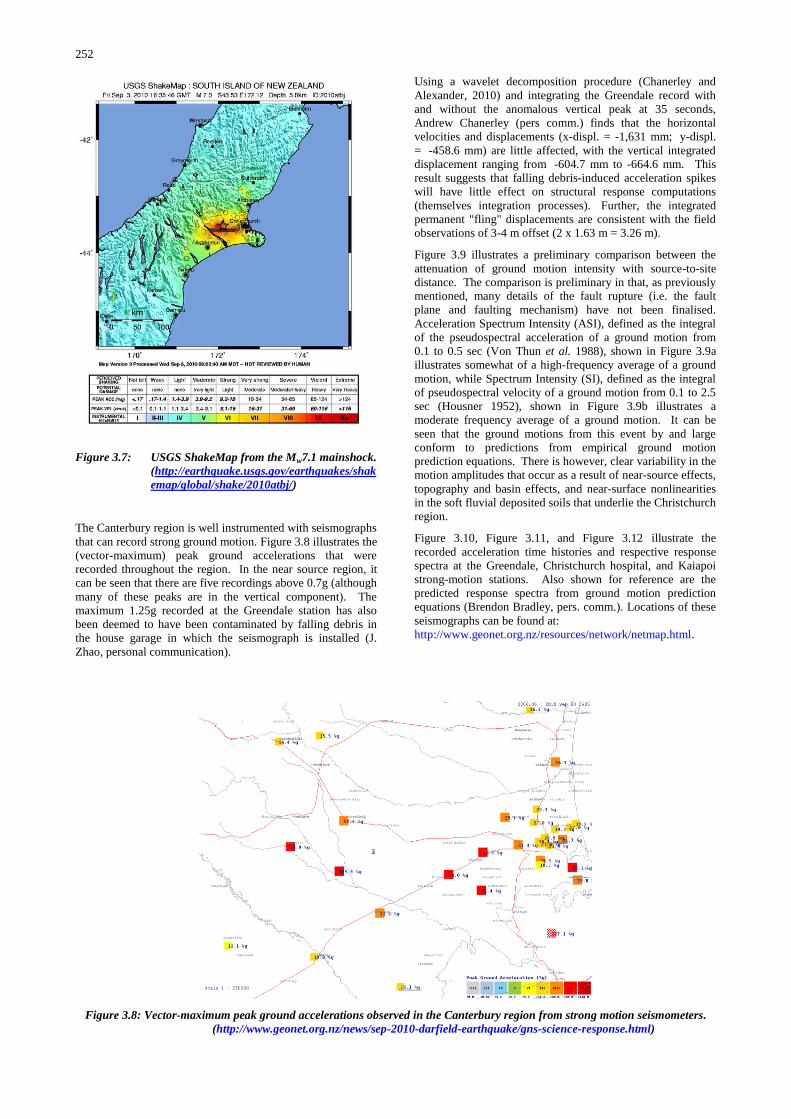
reports that were submitted online by the public. Figure 3.7
illustrates the USGS ShakeMap, which utilizes both predictive
models of MMI, and also the publicly submitted “felt-it”
report. It can be seen that MMI VIII-IX was observed in
Darfield and Rolleston townships, and that the wider
Christchurch region generally experienced MMI VI-VII.
Numerous people and authorities have contrasted the Darfield
earthquake with the Haiti earthquake as an illustration of how
adequate building standards and preparedness can lead to a
large difference in damage and casualties. However,
comparison of MMI‟s observed to population exposures in
Canterbury and Haiti dictates that caution should be made in
such an interpretation
(http://dotearth.blogs.nytimes.com/2010/09/07/in-earthquakes-
poverty-population-and-motion-matter/).
Figure 3.2: Finite fault inversion from Gavin Haynes (USGS).
(http://earthquake.usgs.gov/earthquakes/eqinthenews/2010/us2010atbj/finite_fault.php)
Figure 3.3 Finite fault inversion from ERI. (http://outreach.eri.u-tokyo.ac.jp/2010/09/201009_nz_eng/)
251
Figure 3.4: Number of aftershocks with: (a) magnitude greater than 5; and (b) magnitude between 4 and 5, in comparison
with statistical aftershock models. (http://www.geonet.org.nz/news/sep-2010-darfield-earthquake/gns-science-
response.html)
Figure 3.5: Location of earthquakes in the Canterbury region over the period 25 July – 24 September 2010 (i.e. primarily
the mainshock and its aftershocks). (http://images.geonet.org.nz/maps/quakes/262-christchurch-quake.jpg)
Figure 3.6: Locations of “felt-it” reports submitted online, there were 6,897 reports as of 24 September 2010.
(http://www.geonet.org.nz/earthquake/quakes/3366146g-shaking.html)
252
Figure 3.7: USGS ShakeMap from the Mw7.1 mainshock.
(http://earthquake.usgs.gov/earthquakes/shak
emap/global/shake/2010atbj/)
The Canterbury region is well instrumented with seismographs
that can record strong ground motion. Figure 3.8 illustrates the
(vector-maximum) peak ground accelerations that were
recorded throughout the region. In the near source region, it
can be seen that there are five recordings above 0.7g (although
many of these peaks are in the vertical component). The
maximum 1.25g recorded at the Greendale station has also
been deemed to have been contaminated by falling debris in
the house garage in which the seismograph is installed (J.
Zhao, personal communication).
Using a wavelet decomposition procedure (Chanerley and
Alexander, 2010) and integrating the Greendale record with
and without the anomalous vertical peak at 35 seconds,
Andrew Chanerley (pers comm.) finds that the horizontal
velocities and displacements (x-displ. = -1,631 mm; y-displ.
= -458.6 mm) are little affected, with the vertical integrated
displacement ranging from -604.7 mm to -664.6 mm. This
result suggests that falling debris-induced acceleration spikes
will have little effect on structural response computations
(themselves integration processes). Further, the integrated
permanent "fling" displacements are consistent with the field
observations of 3-4 m offset (2 x 1.63 m = 3.26 m).
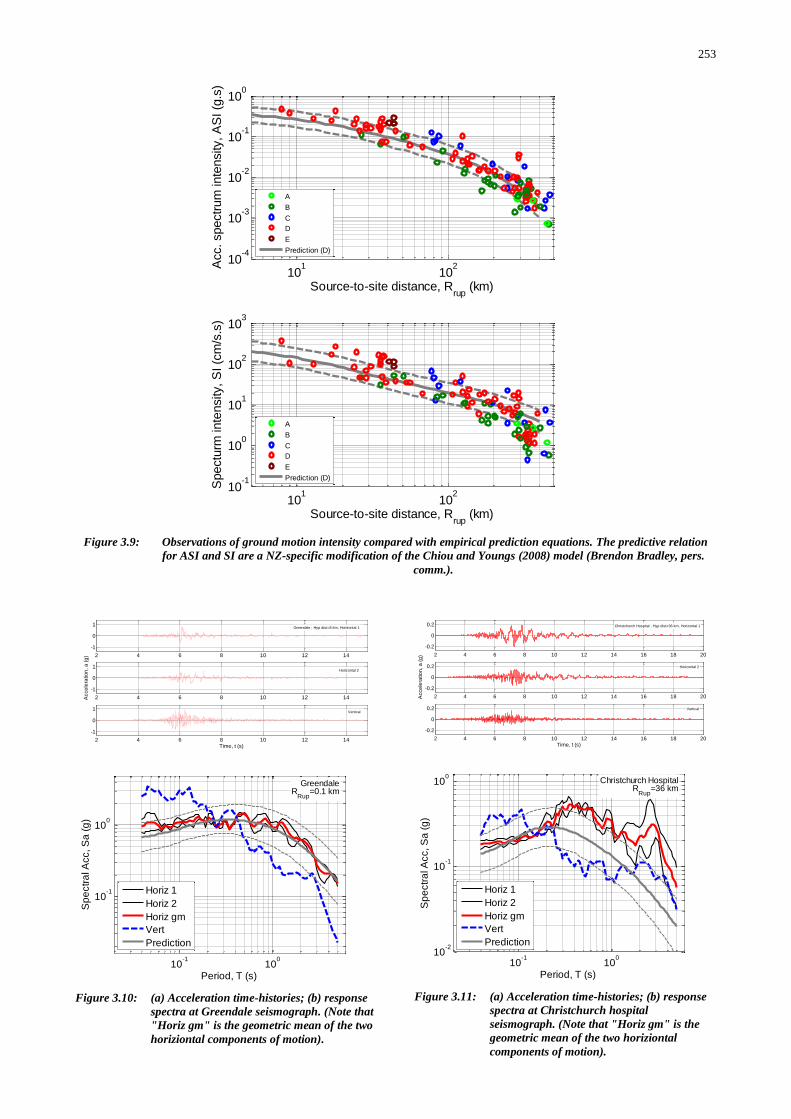
Figure 3.9 illustrates a preliminary comparison between the
attenuation of ground motion intensity with source-to-site
distance. The comparison is preliminary in that, as previously
mentioned, many details of the fault rupture (i.e. the fault
plane and faulting mechanism) have not been finalised.
Acceleration Spectrum Intensity (ASI), defined as the integral
of the pseudospectral acceleration of a ground motion from
0.1 to 0.5 sec (Von Thun et al. 1988), shown in Figure 3.9a
illustrates somewhat of a high-frequency average of a ground
motion, while Spectrum Intensity (SI), defined as the integral
of pseudospectral velocity of a ground motion from 0.1 to 2.5
sec (Housner 1952), shown in Figure 3.9b illustrates a
moderate frequency average of a ground motion. It can be
seen that the ground motions from this event by and large
conform to predictions from empirical ground motion
prediction equations. There is however, clear variability in the
motion amplitudes that occur as a result of near-source effects,
topography and basin effects, and near-surface nonlinearities
in the soft fluvial deposited soils that underlie the Christchurch
region.
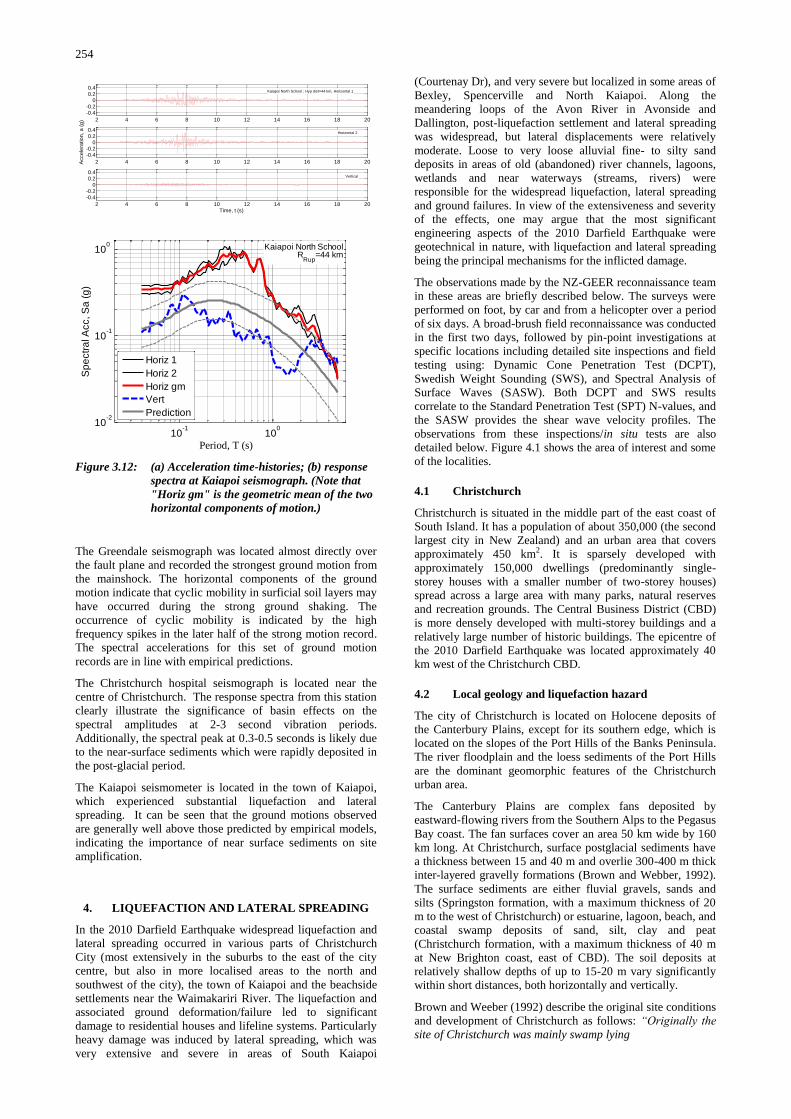
Figure 3.10, Figure 3.11, and Figure 3.12 illustrate the
recorded acceleration time histories and respective response
spectra at the Greendale, Christchurch hospital, and Kaiapoi
strong-motion stations. Also shown for reference are the
predicted response spectra from ground motion prediction
equations (Brendon Bradley, pers. comm.). Locations of these
seismographs can be found at:
http://www.geonet.org.nz/resources/network/netmap.html.
Figure 3.8: Vector-maximum peak ground accelerations observed in the Canterbury region from strong motion seismometers.
(http://www.geonet.org.nz/news/sep-2010-darfield-earthquake/gns-science-response.html)
253
2 4 6 8 10 12 14
-1
0
1Greendale ; Hyp dist=8 km, Horizontal 1
2 4 6 8 10 12 14
-1
0
1
Acce
lera
tio
n, a
(g
)
Horizontal 2
2 4 6 8 10 12 14
-1
0
1
Time, t (s)
Vertical
10-1
100
10-1
100
Sp
ectr
al A
cc, S
a (
g)
GreendaleR
Rup=0.1 km
Period, T (s)
Horiz 1
Horiz 2
Horiz gm
Vert
Prediction
Figure 3.10: (a) Acceleration time-histories; (b) response
spectra at Greendale seismograph. (Note that
"Horiz gm" is the geometric mean of the two
horiziontal components of motion).
2 4 6 8 10 12 14 16 18 20
-0.2
0
0.2 Christchurch Hospital ; Hyp dist=36 km, Horizontal 1
2 4 6 8 10 12 14 16 18 20
-0.2
0
0.2
Acce
lera
tio
n, a
(g
)
Horizontal 2
2 4 6 8 10 12 14 16 18 20
-0.2
0
0.2
Time, t (s)
Vertical
10-1
100
10-2
10-1
100
Sp
ectr
al A
cc, S
a (
g)
Period, T (s)
Christchurch HospitalR
Rup=36 km
Horiz 1
Horiz 2
Horiz gm
Vert
Prediction
Figure 3.11: (a) Acceleration time-histories; (b) response
spectra at Christchurch hospital
seismograph. (Note that "Horiz gm" is the
geometric mean of the two horiziontal
components of motion).
101
102
10-4
10-3
10-2
10-1
100
Source-to-site distance, Rrup
(km)
Acc. spectr
um
inte
nsity, A
SI (g
.s)
A
B
C
D
E
Prediction (D)
101
102
10-1
100
101
102
103
Source-to-site distance, Rrup
(km)
Spectu
rm inte
nsity, S
I (c
m/s
.s)
A
B
C
D
E
Prediction (D)
Figure 3.9: Observations of ground motion intensity compared with empirical prediction equations. The predictive relation
for ASI and SI are a NZ-specific modification of the Chiou and Youngs (2008) model (Brendon Bradley, pers.
comm.).
254
2 4 6 8 10 12 14 16 18 20
-0.4-0.2
00.20.4
Kaiapoi North School ; Hyp dist=44 km, Horizontal 1
2 4 6 8 10 12 14 16 18 20
-0.4-0.2
00.20.4
Acce
lera
tio
n, a
(g
)
Horizontal 2
2 4 6 8 10 12 14 16 18 20
-0.4-0.2
00.20.4
Time, t (s)
Vertical
10-1
100
10-2
10-1
100
Sp
ectr
al A
cc, S
a (
g)
Kaiapoi North SchoolR
Rup=44 km
Horiz 1
Horiz 2
Horiz gm
Vert
Prediction
Period, T (s)
Figure 3.12: (a) Acceleration time-histories; (b) response
spectra at Kaiapoi seismograph. (Note that
"Horiz gm" is the geometric mean of the two
horizontal components of motion.)
The Greendale seismograph was located almost directly over
the fault plane and recorded the strongest ground motion from
the mainshock. The horizontal components of the ground
motion indicate that cyclic mobility in surficial soil layers may
have occurred during the strong ground shaking. The
occurrence of cyclic mobility is indicated by the high
frequency spikes in the later half of the strong motion record.
The spectral accelerations for this set of ground motion
records are in line with empirical predictions.
The Christchurch hospital seismograph is located near the
centre of Christchurch. The response spectra from this station
clearly illustrate the significance of basin effects on the
spectral amplitudes at 2-3 second vibration periods.
Additionally, the spectral peak at 0.3-0.5 seconds is likely due
to the near-surface sediments which were rapidly deposited in
the post-glacial period.
The Kaiapoi seismometer is located in the town of Kaiapoi,
which experienced substantial liquefaction and lateral
spreading. It can be seen that the ground motions observed
are generally well above those predicted by empirical models,
indicating the importance of near surface sediments on site
amplification.
4. LIQUEFACTION AND LATERAL SPREADING
In the 2010 Darfield Earthquake widespread liquefaction and
lateral spreading occurred in various parts of Christchurch
City (most extensively in the suburbs to the east of the city
centre, but also in more localised areas to the north and
southwest of the city), the town of Kaiapoi and the beachside
settlements near the Waimakariri River. The liquefaction and
associated ground deformation/failure led to significant
damage to residential houses and lifeline systems. Particularly
heavy damage was induced by lateral spreading, which was
very extensive and severe in areas of South Kaiapoi
(Courtenay Dr), and very severe but localized in some areas of
Bexley, Spencerville and North Kaiapoi. Along the
meandering loops of the Avon River in Avonside and
Dallington, post-liquefaction settlement and lateral spreading
was widespread, but lateral displacements were relatively
moderate. Loose to very loose alluvial fine- to silty sand
deposits in areas of old (abandoned) river channels, lagoons,
wetlands and near waterways (streams, rivers) were
responsible for the widespread liquefaction, lateral spreading
and ground failures. In view of the extensiveness and severity
of the effects, one may argue that the most significant
engineering aspects of the 2010 Darfield Earthquake were
geotechnical in nature, with liquefaction and lateral spreading
being the principal mechanisms for the inflicted damage.
The observations made by the NZ-GEER reconnaissance team
in these areas are briefly described below. The surveys were
performed on foot, by car and from a helicopter over a period
of six days. A broad-brush field reconnaissance was conducted
in the first two days, followed by pin-point investigations at
specific locations including detailed site inspections and field
testing using: Dynamic Cone Penetration Test (DCPT),
Swedish Weight Sounding (SWS), and Spectral Analysis of
Surface Waves (SASW). Both DCPT and SWS results
correlate to the Standard Penetration Test (SPT) N-values, and
the SASW provides the shear wave velocity profiles. The
observations from these inspections/in situ tests are also
detailed below. Figure 4.1 shows the area of interest and some
of the localities.
4.1 Christchurch
Christchurch is situated in the middle part of the east coast of
South Island. It has a population of about 350,000 (the second
largest city in New Zealand) and an urban area that covers
approximately 450 km2. It is sparsely developed with
approximately 150,000 dwellings (predominantly single-
storey houses with a smaller number of two-storey houses)
spread across a large area with many parks, natural reserves
and recreation grounds. The Central Business District (CBD)
is more densely developed with multi-storey buildings and a
relatively large number of historic buildings. The epicentre of
the 2010 Darfield Earthquake was located approximately 40
km west of the Christchurch CBD.
4.2 Local geology and liquefaction hazard
The city of Christchurch is located on Holocene deposits of
the Canterbury Plains, except for its southern edge, which is
located on the slopes of the Port Hills of the Banks Peninsula.
The river floodplain and the loess sediments of the Port Hills
are the dominant geomorphic features of the Christchurch
urban area.
The Canterbury Plains are complex fans deposited by
eastward-flowing rivers from the Southern Alps to the Pegasus
Bay coast. The fan surfaces cover an area 50 km wide by 160
km long. At Christchurch, surface postglacial sediments have
a thickness between 15 and 40 m and overlie 300-400 m thick
inter-layered gravelly formations (Brown and Webber, 1992).
The surface sediments are either fluvial gravels, sands and
silts (Springston formation, with a maximum thickness of 20
m to the west of Christchurch) or estuarine, lagoon, beach, and
coastal swamp deposits of sand, silt, clay and peat
(Christchurch formation, with a maximum thickness of 40 m
at New Brighton coast, east of CBD). The soil deposits at
relatively shallow depths of up to 15-20 m vary significantly
within short distances, both horizontally and vertically.
Brown and Weeber (1992) describe the original site conditions
and development of Christchurch as follows: “Originally the
site of Christchurch was mainly swamp lying
255
CBD
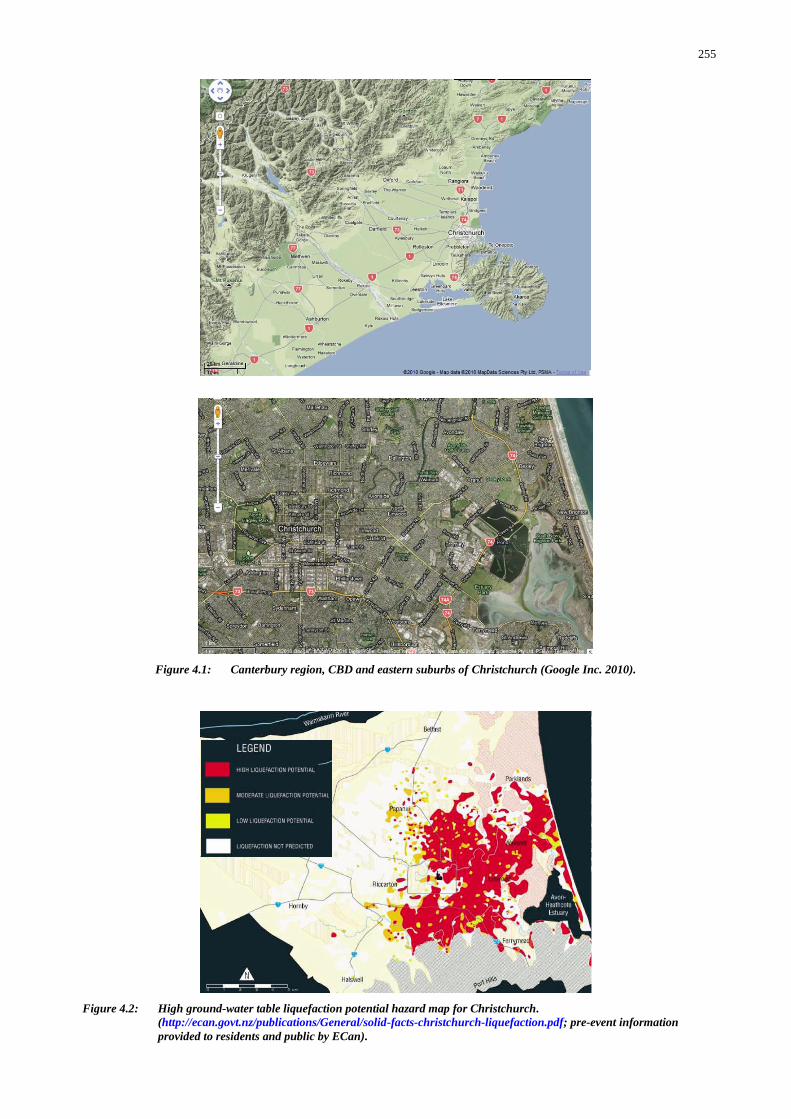
Figure 4.1: Canterbury region, CBD and eastern suburbs of Christchurch (Google Inc. 2010).
Figure 4.2: High ground-water table liquefaction potential hazard map for Christchurch.
(http://ecan.govt.nz/publications/General/solid-facts-christchurch-liquefaction.pdf; pre-event information
provided to residents and public by ECan).
256
behind beach dune sand; estuaries and lagoons, and gravel,
sand and silt of river channel and flood deposits of the coastal
Waimakariri River flood plain. The Waimakariri River
regularly flooded Christchurch prior to stopbank construction
and river realignment. Since European settlement in the
1850s, extensive drainage and infilling of swamps has been
undertaken.” Brown and Webber also state that surface
deposits are actively accumulating and that the present day
river channel deposits are excluded from the above-mentioned
Christchurch and Springston formations.
Canterbury has an abundant water supply through open-
channels (rivers, streams) and very rich aquifers. The
dominant features of present day Christchurch are the Avon
and Heathcote rivers that originate from springs in western
Christchurch, meander through the city, and feed the estuary at
the southeast end of the city. The ground water table is deepest
at the west end of the city (at about 5 m depth), gradually
increases heading east, and approaches the ground surface
near the coastline. The water table is within 1.0-1.5 m of the
ground surface for most of the city east of the CBD.
The high liquefaction hazard in Christchurch was known prior
to the earthquake, as illustrated by the liquefaction hazard map
(Figure 4.2) and information provided by the Environment
Canterbury (ECan: http://ecan.govt.nz/publications/General/
solid-facts-christchurch-liquefaction.pdf) to residents, based
on a study from 2004.
4.3 Liquefaction manifestation during the Darfield
earthquake
The Darfield Earthquake caused widespread liquefaction in
the eastern suburbs of Christchurch along the Avon River,
particularly in Avonside, Dallington, Burwood and Bexley.
Other suburbs, particularly to the east and northeast of CBD,
were also affected by liquefaction, but to a lesser extent.
Widespread liquefaction also occurred in Halswell, at the
southwest end of the city. Pockets of limited or partial
liquefaction were observed in various parts of Christchurch,
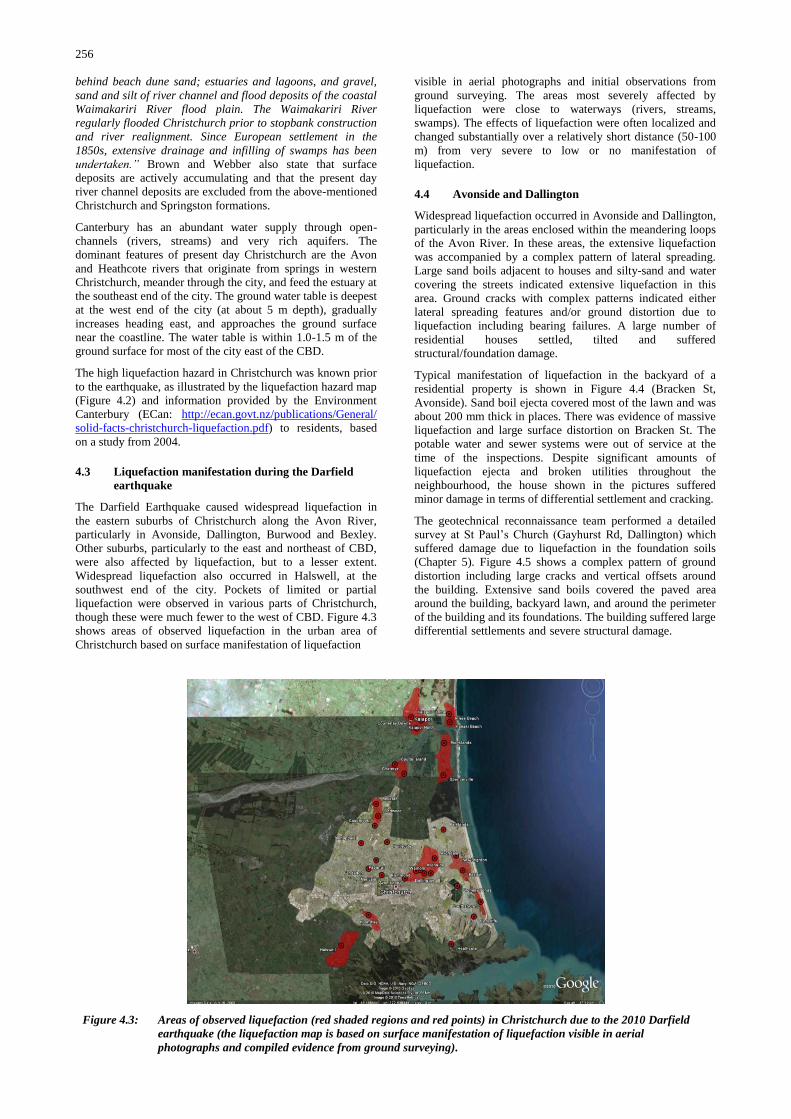
though these were much fewer to the west of CBD. Figure 4.3
shows areas of observed liquefaction in the urban area of
Christchurch based on surface manifestation of liquefaction
visible in aerial photographs and initial observations from
ground surveying. The areas most severely affected by
liquefaction were close to waterways (rivers, streams,
swamps). The effects of liquefaction were often localized and
changed substantially over a relatively short distance (50-100
m) from very severe to low or no manifestation of
liquefaction.
4.4 Avonside and Dallington
Widespread liquefaction occurred in Avonside and Dallington,
particularly in the areas enclosed within the meandering loops
of the Avon River. In these areas, the extensive liquefaction
was accompanied by a complex pattern of lateral spreading.
Large sand boils adjacent to houses and silty-sand and water
covering the streets indicated extensive liquefaction in this
area. Ground cracks with complex patterns indicated either
lateral spreading features and/or ground distortion due to
liquefaction including bearing failures. A large number of
residential houses settled, tilted and suffered
structural/foundation damage.
Typical manifestation of liquefaction in the backyard of a
residential property is shown in Figure 4.4 (Bracken St,
Avonside). Sand boil ejecta covered most of the lawn and was
about 200 mm thick in places. There was evidence of massive
liquefaction and large surface distortion on Bracken St. The
potable water and sewer systems were out of service at the
time of the inspections. Despite significant amounts of
liquefaction ejecta and broken utilities throughout the
neighbourhood, the house shown in the pictures suffered
minor damage in terms of differential settlement and cracking.
The geotechnical reconnaissance team performed a detailed
survey at St Paul‟s Church (Gayhurst Rd, Dallington) which
suffered damage due to liquefaction in the foundation soils
(Chapter 5). Figure 4.5 shows a complex pattern of ground
distortion including large cracks and vertical offsets around
the building. Extensive sand boils covered the paved area
around the building, backyard lawn, and around the perimeter
of the building and its foundations. The building suffered large differential settlements and severe structural damage.
Figure 4.3: Areas of observed liquefaction (red shaded regions and red points) in Christchurch due to the 2010 Darfield
earthquake (the liquefaction map is based on surface manifestation of liquefaction visible in aerial
photographs and compiled evidence from ground surveying).
257
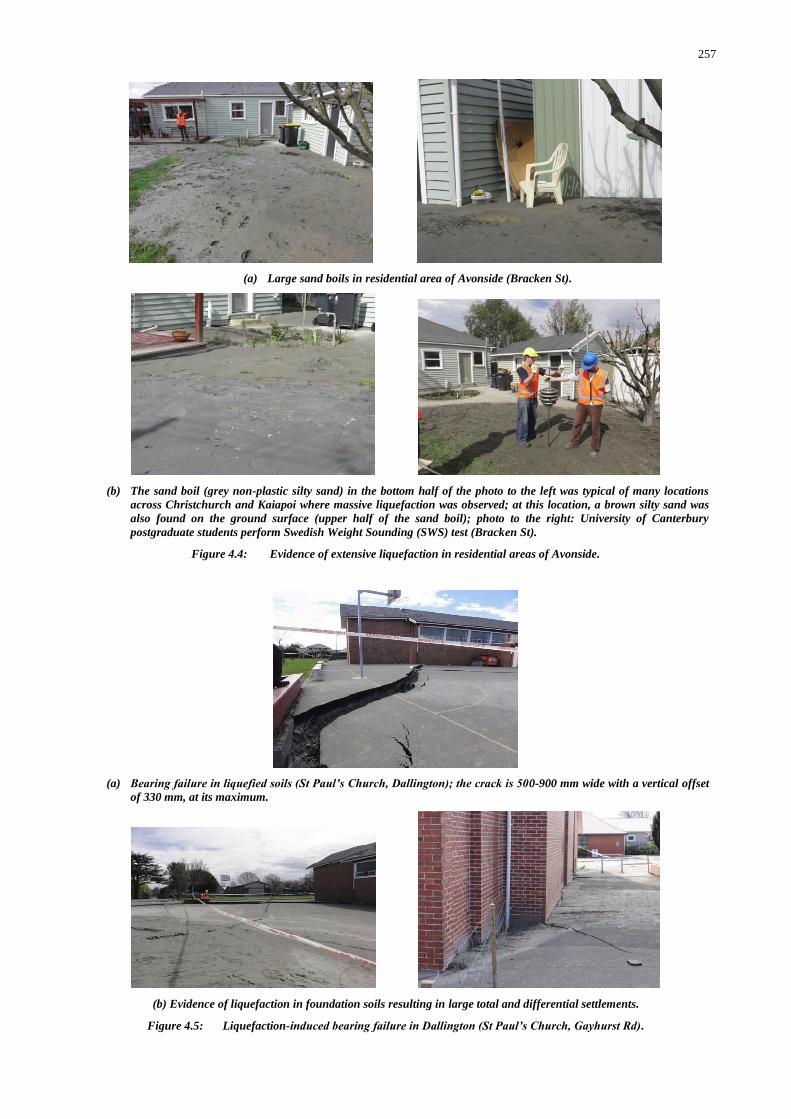
(a) Large sand boils in residential area of Avonside (Bracken St).
(b) The sand boil (grey non-plastic silty sand) in the bottom half of the photo to the left was typical of many locations
across Christchurch and Kaiapoi where massive liquefaction was observed; at this location, a brown silty sand was
also found on the ground surface (upper half of the sand boil); photo to the right: University of Canterbury
postgraduate students perform Swedish Weight Sounding (SWS) test (Bracken St).
Figure 4.4: Evidence of extensive liquefaction in residential areas of Avonside.
(a) Bearing failure in liquefied soils (St Paul’s Church, Dallington); the crack is 500-900 mm wide with a vertical offset
of 330 mm, at its maximum.
(b) Evidence of liquefaction in foundation soils resulting in large total and differential settlements.
Figure 4.5: Liquefaction-induced bearing failure in Dallington (St Paul’s Church, Gayhurst Rd).
258
Specifically, the northwest side of the building was ripped in
half due to a combination of differential settlement and lateral
movement. This site is centrally located in a meandering loop
of the Avon River and bounded by the river on all sides at
distances of about 150-250 m, except to the north/northeast.
There was apparent evidence of lateral spreading in this area,
despite being located more than 150 m from the free-face of
the river. (Note, however, that this distance is not necessarily
anomalous. Evidence of lateral spreading has been found at
distances of up to 2 km from a free-face in the New Madrid,
Missouri, USA, area (Obermeier, S.F., per. comm.). These
features manifested during the 1811-1812 earthquakes that
occurred in that region.) The tension cracks and fissures
around the building were much bigger than those near the
river channel, and hence it is possible that they are not directly
related only to the lateral spreading. Further investigations are
required to clarify these details.
Ten days after the event, the team performed Swedish Weight
Sounding (SWS) tests at Bracken St and in the backyard of St
Paul‟s Church. SWS is a simple manually operated penetration
test under a dead-load of 100 kg in which the number of half-
rotations required for a 25 cm penetration of a rod (screw
point) is recorded (JIS, 1995). One of the advantages of the
SWS test which was heavily utilized in this investigation is the
ability to perform the test within a confined space in
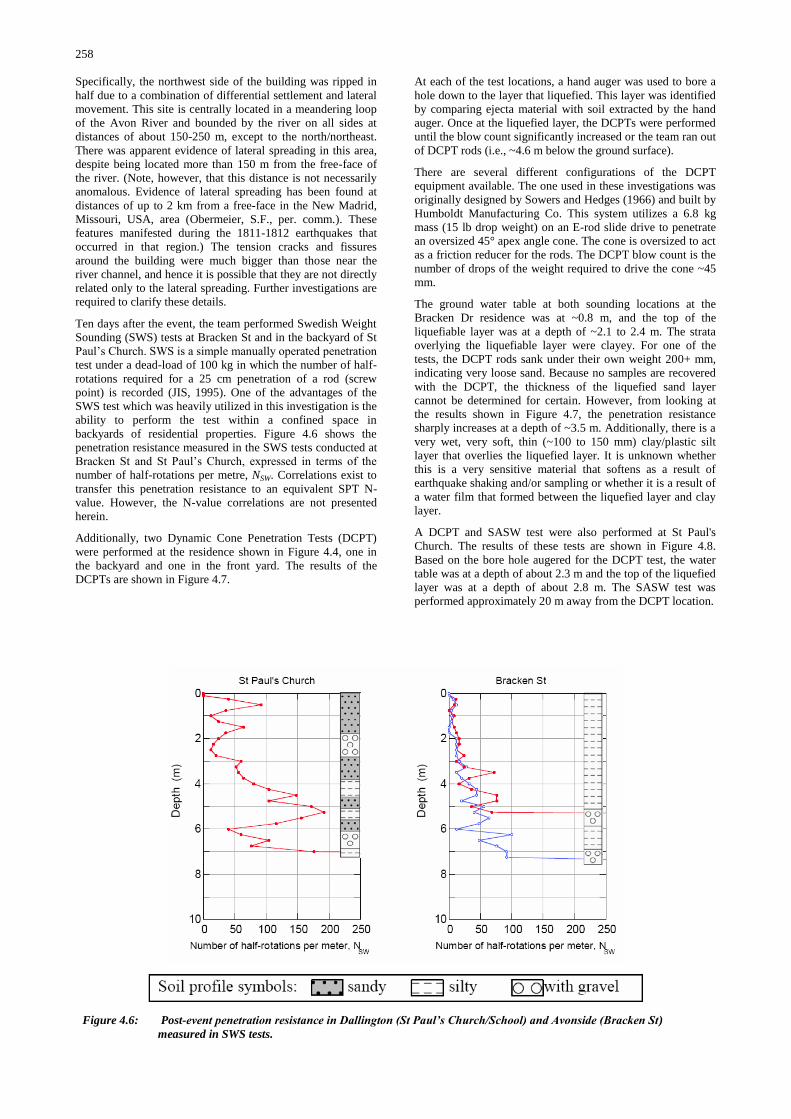
backyards of residential properties. Figure 4.6 shows the
penetration resistance measured in the SWS tests conducted at
Bracken St and St Paul‟s Church, expressed in terms of the
number of half-rotations per metre, NSW. Correlations exist to
transfer this penetration resistance to an equivalent SPT N-
value. However, the N-value correlations are not presented
herein.
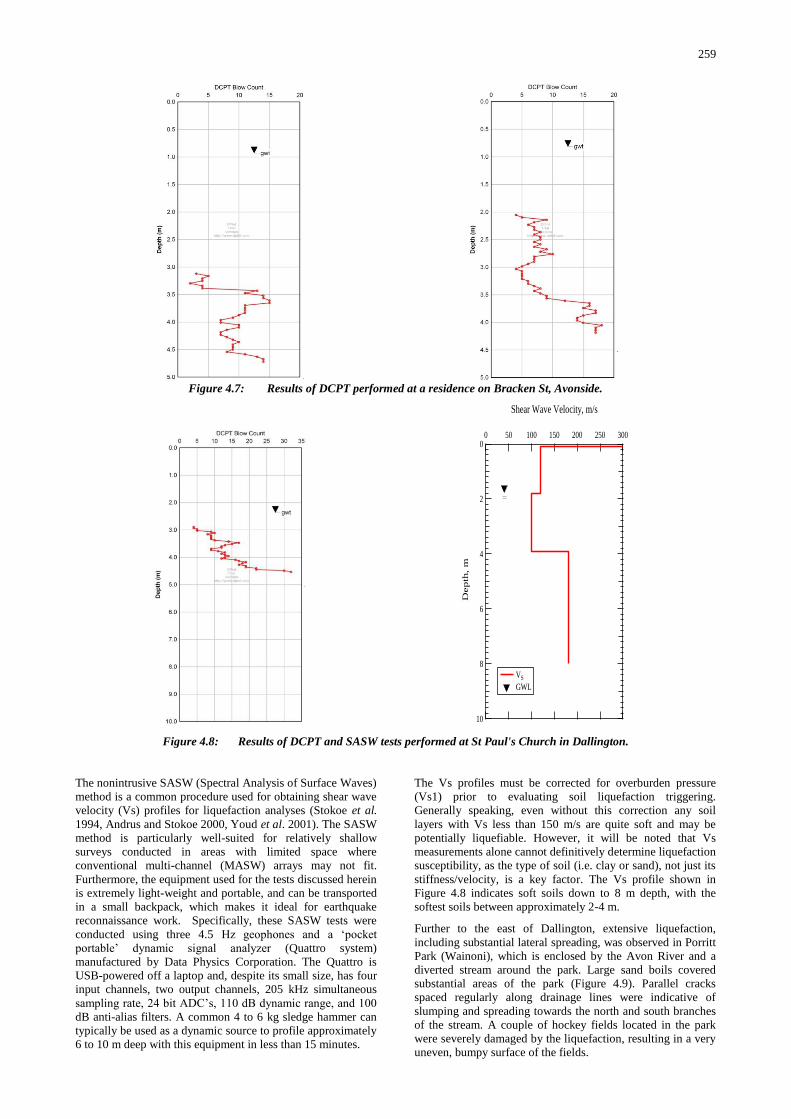
Additionally, two Dynamic Cone Penetration Tests (DCPT)
were performed at the residence shown in Figure 4.4, one in
the backyard and one in the front yard. The results of the
DCPTs are shown in Figure 4.7.
At each of the test locations, a hand auger was used to bore a
hole down to the layer that liquefied. This layer was identified
by comparing ejecta material with soil extracted by the hand
auger. Once at the liquefied layer, the DCPTs were performed
until the blow count significantly increased or the team ran out
of DCPT rods (i.e., ~4.6 m below the ground surface).
There are several different configurations of the DCPT
equipment available. The one used in these investigations was
originally designed by Sowers and Hedges (1966) and built by
Humboldt Manufacturing Co. This system utilizes a 6.8 kg
mass (15 lb drop weight) on an E-rod slide drive to penetrate
an oversized 45° apex angle cone. The cone is oversized to act
as a friction reducer for the rods. The DCPT blow count is the
number of drops of the weight required to drive the cone ~45
mm.
The ground water table at both sounding locations at the
Bracken Dr residence was at ~0.8 m, and the top of the
liquefiable layer was at a depth of ~2.1 to 2.4 m. The strata
overlying the liquefiable layer were clayey. For one of the
tests, the DCPT rods sank under their own weight 200+ mm,
indicating very loose sand. Because no samples are recovered
with the DCPT, the thickness of the liquefied sand layer
cannot be determined for certain. However, from looking at
the results shown in Figure 4.7, the penetration resistance
sharply increases at a depth of ~3.5 m. Additionally, there is a
very wet, very soft, thin (~100 to 150 mm) clay/plastic silt
layer that overlies the liquefied layer. It is unknown whether
this is a very sensitive material that softens as a result of
earthquake shaking and/or sampling or whether it is a result of
a water film that formed between the liquefied layer and clay
layer.
A DCPT and SASW test were also performed at St Paul's
Church. The results of these tests are shown in Figure 4.8.
Based on the bore hole augered for the DCPT test, the water
table was at a depth of about 2.3 m and the top of the liquefied
layer was at a depth of about 2.8 m. The SASW test was
performed approximately 20 m away from the DCPT location.
Figure 4.6: Post-event penetration resistance in Dallington (St Paul’s Church/School) and Avonside (Bracken St)
measured in SWS tests.
259
The nonintrusive SASW (Spectral Analysis of Surface Waves)
method is a common procedure used for obtaining shear wave
velocity (Vs) profiles for liquefaction analyses (Stokoe et al.
1994, Andrus and Stokoe 2000, Youd et al. 2001). The SASW
method is particularly well-suited for relatively shallow
surveys conducted in areas with limited space where
conventional multi-channel (MASW) arrays may not fit.
Furthermore, the equipment used for the tests discussed herein
is extremely light-weight and portable, and can be transported
in a small backpack, which makes it ideal for earthquake
reconnaissance work. Specifically, these SASW tests were
conducted using three 4.5 Hz geophones and a „pocket
portable‟ dynamic signal analyzer (Quattro system)
manufactured by Data Physics Corporation. The Quattro is
USB-powered off a laptop and, despite its small size, has four
input channels, two output channels, 205 kHz simultaneous
sampling rate, 24 bit ADC‟s, 110 dB dynamic range, and 100
dB anti-alias filters. A common 4 to 6 kg sledge hammer can
typically be used as a dynamic source to profile approximately
6 to 10 m deep with this equipment in less than 15 minutes.
The Vs profiles must be corrected for overburden pressure
(Vs1) prior to evaluating soil liquefaction triggering.
Generally speaking, even without this correction any soil
layers with Vs less than 150 m/s are quite soft and may be
potentially liquefiable. However, it will be noted that Vs
measurements alone cannot definitively determine liquefaction
susceptibility, as the type of soil (i.e. clay or sand), not just its
stiffness/velocity, is a key factor. The Vs profile shown in
Figure 4.8 indicates soft soils down to 8 m depth, with the
softest soils between approximately 2-4 m.
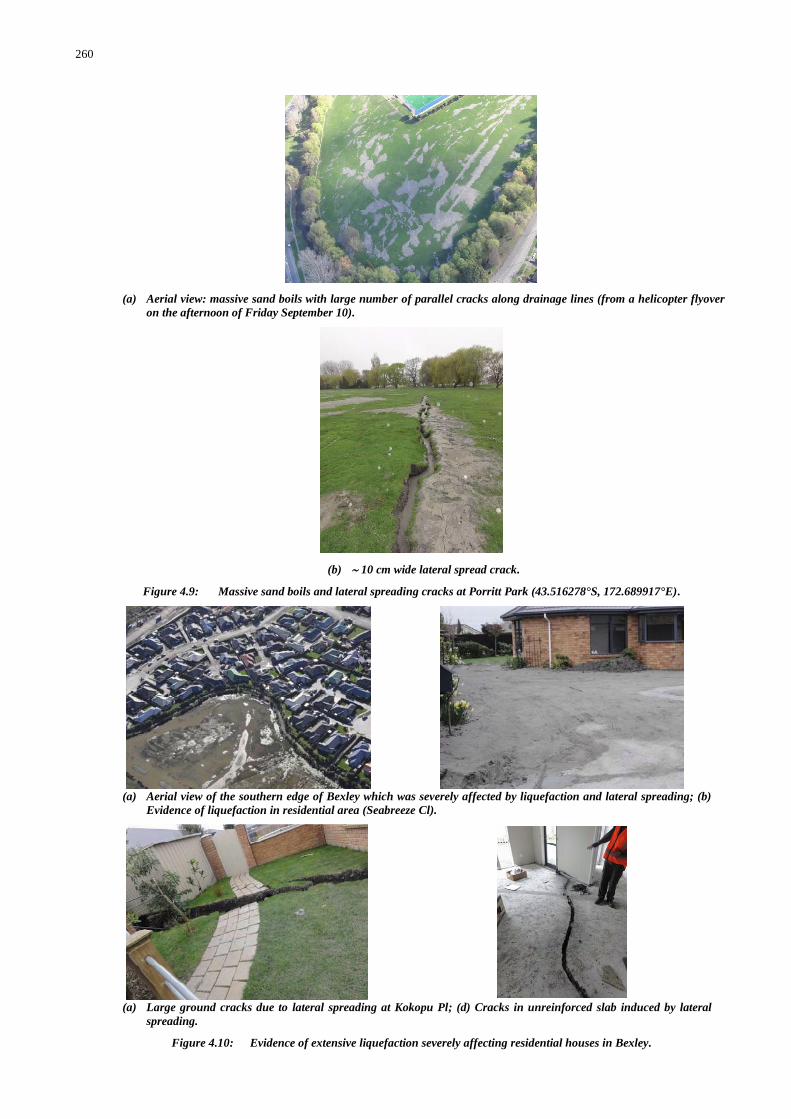
Further to the east of Dallington, extensive liquefaction,
including substantial lateral spreading, was observed in Porritt
Park (Wainoni), which is enclosed by the Avon River and a
diverted stream around the park. Large sand boils covered
substantial areas of the park (Figure 4.9). Parallel cracks
spaced regularly along drainage lines were indicative of
slumping and spreading towards the north and south branches
of the stream. A couple of hockey fields located in the park
were severely damaged by the liquefaction, resulting in a very
uneven, bumpy surface of the fields.
Figure 4.7: Results of DCPT performed at a residence on Bracken St, Avonside.
10
8
6
4
2
0
Dep
th,
m
300250200150100500
Shear Wave Velocity, m/s
VS
GWL
Figure 4.8: Results of DCPT and SASW tests performed at St Paul's Church in Dallington.
260
(a) Aerial view: massive sand boils with large number of parallel cracks along drainage lines (from a helicopter flyover
on the afternoon of Friday September 10).
(b) 10 cm wide lateral spread crack.
Figure 4.9: Massive sand boils and lateral spreading cracks at Porritt Park (43.516278°S, 172.689917°E).
(a) Aerial view of the southern edge of Bexley which was severely affected by liquefaction and lateral spreading; (b)
Evidence of liquefaction in residential area (Seabreeze Cl).
(a) Large ground cracks due to lateral spreading at Kokopu Pl; (d) Cracks in unreinforced slab induced by lateral
spreading.
Figure 4.10: Evidence of extensive liquefaction severely affecting residential houses in Bexley.
261
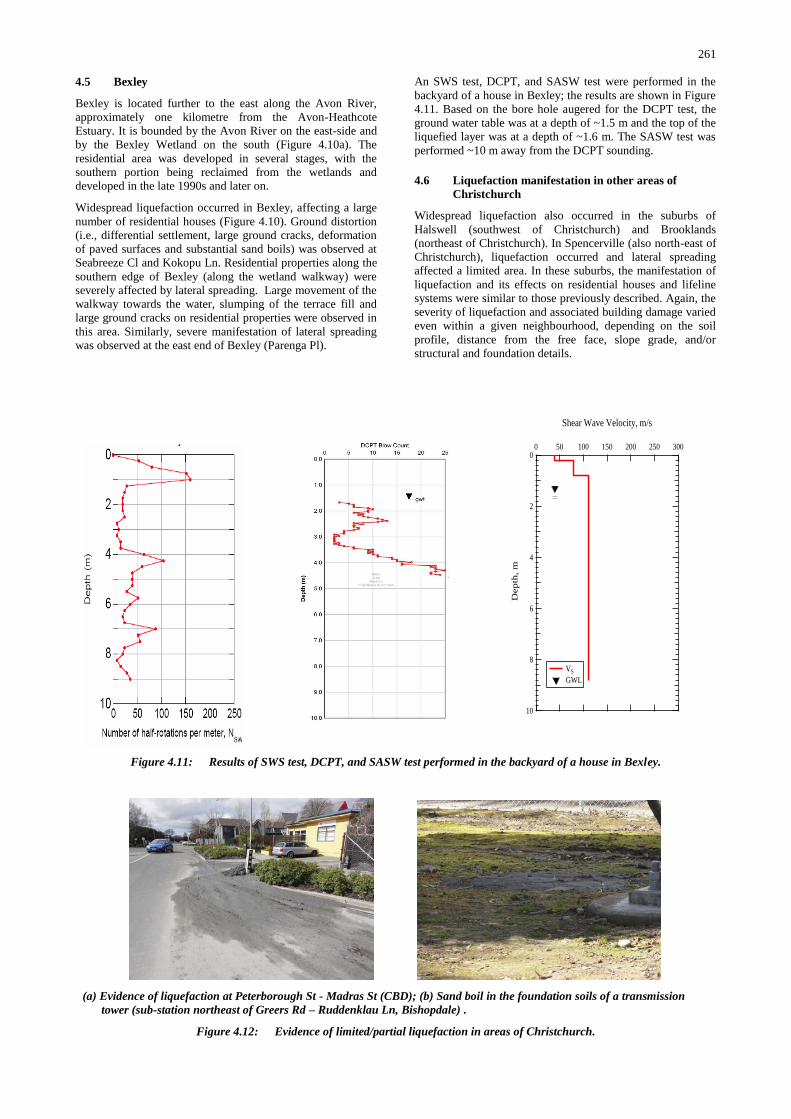
4.5 Bexley
Bexley is located further to the east along the Avon River,
approximately one kilometre from the Avon-Heathcote
Estuary. It is bounded by the Avon River on the east-side and
by the Bexley Wetland on the south (Figure 4.10a). The
residential area was developed in several stages, with the
southern portion being reclaimed from the wetlands and
developed in the late 1990s and later on.
Widespread liquefaction occurred in Bexley, affecting a large
number of residential houses (Figure 4.10). Ground distortion
(i.e., differential settlement, large ground cracks, deformation
of paved surfaces and substantial sand boils) was observed at
Seabreeze Cl and Kokopu Ln. Residential properties along the
southern edge of Bexley (along the wetland walkway) were
severely affected by lateral spreading. Large movement of the
walkway towards the water, slumping of the terrace fill and
large ground cracks on residential properties were observed in
this area. Similarly, severe manifestation of lateral spreading
was observed at the east end of Bexley (Parenga Pl).
An SWS test, DCPT, and SASW test were performed in the
backyard of a house in Bexley; the results are shown in Figure
4.11. Based on the bore hole augered for the DCPT test, the
ground water table was at a depth of ~1.5 m and the top of the
liquefied layer was at a depth of ~1.6 m. The SASW test was
performed ~10 m away from the DCPT sounding.
4.6 Liquefaction manifestation in other areas of
Christchurch
Widespread liquefaction also occurred in the suburbs of
Halswell (southwest of Christchurch) and Brooklands
(northeast of Christchurch). In Spencerville (also north-east of
Christchurch), liquefaction occurred and lateral spreading
affected a limited area. In these suburbs, the manifestation of
liquefaction and its effects on residential houses and lifeline
systems were similar to those previously described. Again, the
severity of liquefaction and associated building damage varied
even within a given neighbourhood, depending on the soil
profile, distance from the free face, slope grade, and/or
structural and foundation details.
10
8
6
4
2
0
Dep
th,
m
300250200150100500
Shear Wave Velocity, m/s
VS
GWL
Figure 4.11: Results of SWS test, DCPT, and SASW test performed in the backyard of a house in Bexley.
(a) Evidence of liquefaction at Peterborough St - Madras St (CBD); (b) Sand boil in the foundation soils of a transmission
tower (sub-station northeast of Greers Rd – Ruddenklau Ln, Bishopdale) .
Figure 4.12: Evidence of limited/partial liquefaction in areas of Christchurch.
262
Limited or partial liquefaction was observed at numerous
locations across the city, which manifested as scattered and
relatively small (or within limited area) sand boils. In these
places there was damage to roads, footpaths, and driveways as
well as some house damage, but the liquefaction effects were
moderate or mild. Figure 4.12 shows typical manifestation of
limited liquefaction in CBD (Peterborough St) and in the
backyard of a power sub-station on Greers Rd in Bishopdale.
Other areas where liquefaction of limited extent was observed
include Belfast (Engelfield Rd, near Main North Rd),
Redwood (Barnes Rd, near Main North Rd), Fendalton
(Queens Av), vicinity of English Park in St Alban‟s (Cranford
St, Westminster St, Courtenay St, Trafalgar St, Sheppard St)
and Burwood (DeVille Pl and DeBlog Pl). These areas of
partial/limited liquefaction are shown in the liquefaction map
in Figure 4.3.
The geotechnical reconnaissance team also conducted a quick
drive-through reconnaissance along the Heathcote River,
specifically targeting areas that were denoted as having high-
potential for liquefaction-induced damage on the ECan
liquefaction hazard maps (http://ecan.govt.nz/publications/
General/solid-facts-christchurch-liquefaction.pdf). However,
there was very little evidence of ground distortion and
liquefaction in this area, with only a few sand boils found in a
period of about two hours of drive-through and on foot
surveys.
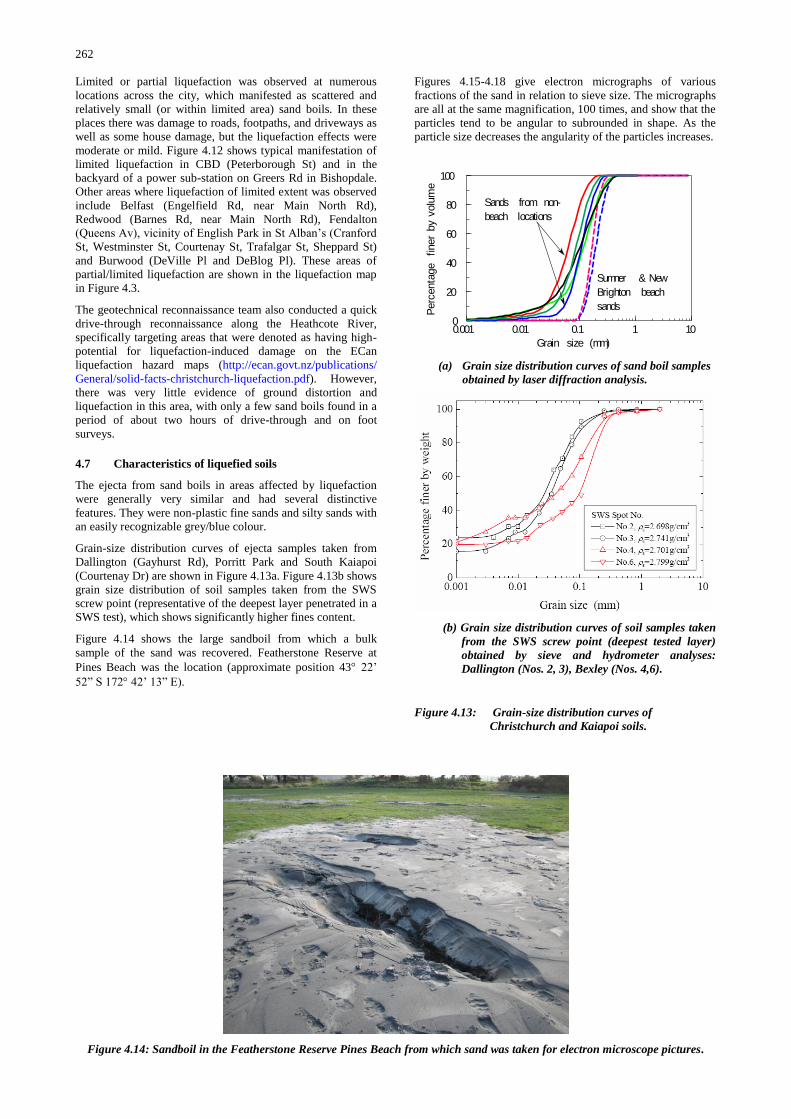
4.7 Characteristics of liquefied soils
The ejecta from sand boils in areas affected by liquefaction
were generally very similar and had several distinctive
features. They were non-plastic fine sands and silty sands with
an easily recognizable grey/blue colour.
Grain-size distribution curves of ejecta samples taken from
Dallington (Gayhurst Rd), Porritt Park and South Kaiapoi
(Courtenay Dr) are shown in Figure 4.13a. Figure 4.13b shows
grain size distribution of soil samples taken from the SWS
screw point (representative of the deepest layer penetrated in a
SWS test), which shows significantly higher fines content.
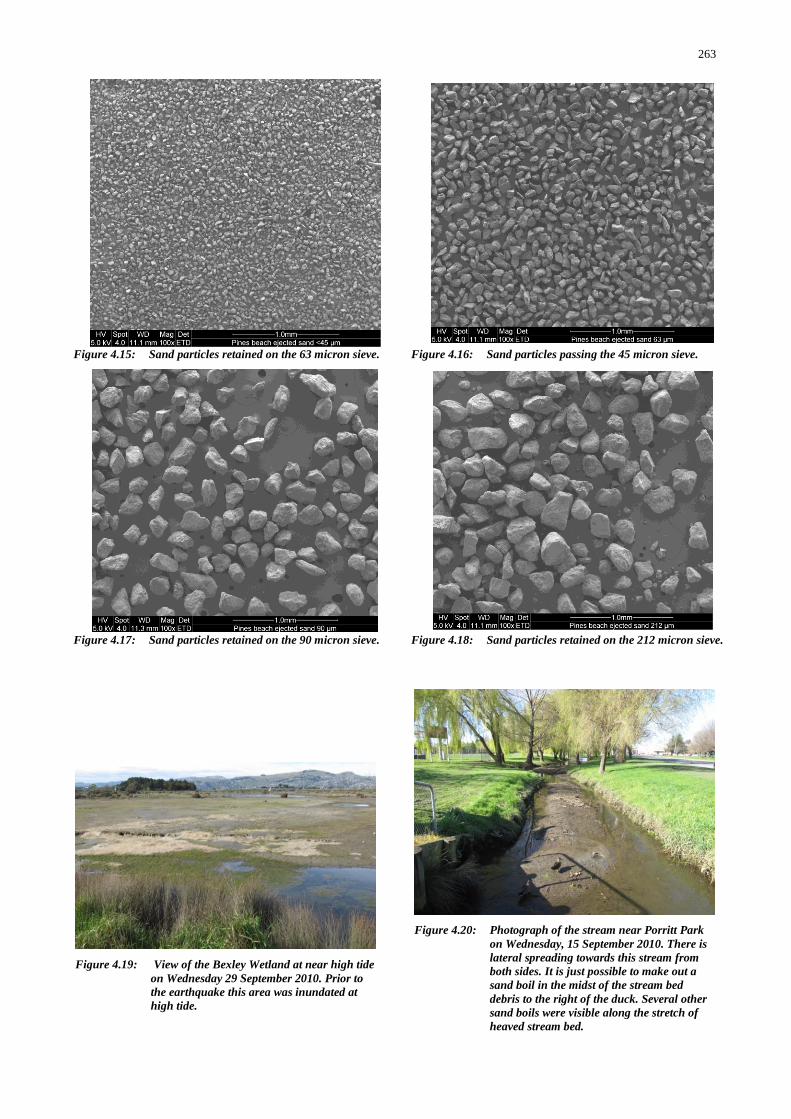
Figure 4.14 shows the large sandboil from which a bulk
sample of the sand was recovered. Featherstone Reserve at
Pines Beach was the location (approximate position 43 22‟
52” S 172 42‟ 13” E).
Figures 4.15-4.18 give electron micrographs of various
fractions of the sand in relation to sieve size. The micrographs
are all at the same magnification, 100 times, and show that the
particles tend to be angular to subrounded in shape. As the
particle size decreases the angularity of the particles increases.
0.001 0.01 0.1 1 100
20
40
60
80
100
Grain size (mm)
Perc
enta
ge
finer
by
volu
me
Sumner & New
Brighton beach
sands
Sands from non-
beach locations
(a) Grain size distribution curves of sand boil samples
obtained by laser diffraction analysis.
(b) Grain size distribution curves of soil samples taken
from the SWS screw point (deepest tested layer)
obtained by sieve and hydrometer analyses:
Dallington (Nos. 2, 3), Bexley (Nos. 4,6).
Figure 4.13: Grain-size distribution curves of
Christchurch and Kaiapoi soils.
Figure 4.14: Sandboil in the Featherstone Reserve Pines Beach from which sand was taken for electron microscope pictures.
263
Figure 4.19: View of the Bexley Wetland at near high tide
on Wednesday 29 September 2010. Prior to
the earthquake this area was inundated at
high tide.
Figure 4.20: Photograph of the stream near Porritt Park
on Wednesday, 15 September 2010. There is
lateral spreading towards this stream from
both sides. It is just possible to make out a
sand boil in the midst of the stream bed
debris to the right of the duck. Several other
sand boils were visible along the stretch of
heaved stream bed.
Figure 4.15: Sand particles retained on the 63 micron sieve. Figure 4.16: Sand particles passing the 45 micron sieve.
Figure 4.17: Sand particles retained on the 90 micron sieve. Figure 4.18: Sand particles retained on the 212 micron sieve.
264
4.8 Effects of liquefaction and lateral spreading on
streambeds and wetlands
Residents of the Bexley area commented on the effect of the
earthquake on the Bexley Wetlands. Figure 4.19 shows a view
from walking path around the south of the subdivision.
Many sand boils are seen in the bed of the wetland area (at
high tide on 29 September) which was inundated at high tide
prior to the earthquake. Stream beds were also noticed to be
heaved (Figure 4.20). A local resident confirmed that this was
not how the stream bed appeared prior to the earthquake. In
some places it was necessary to clear the stream bed soon after
the earthquake.
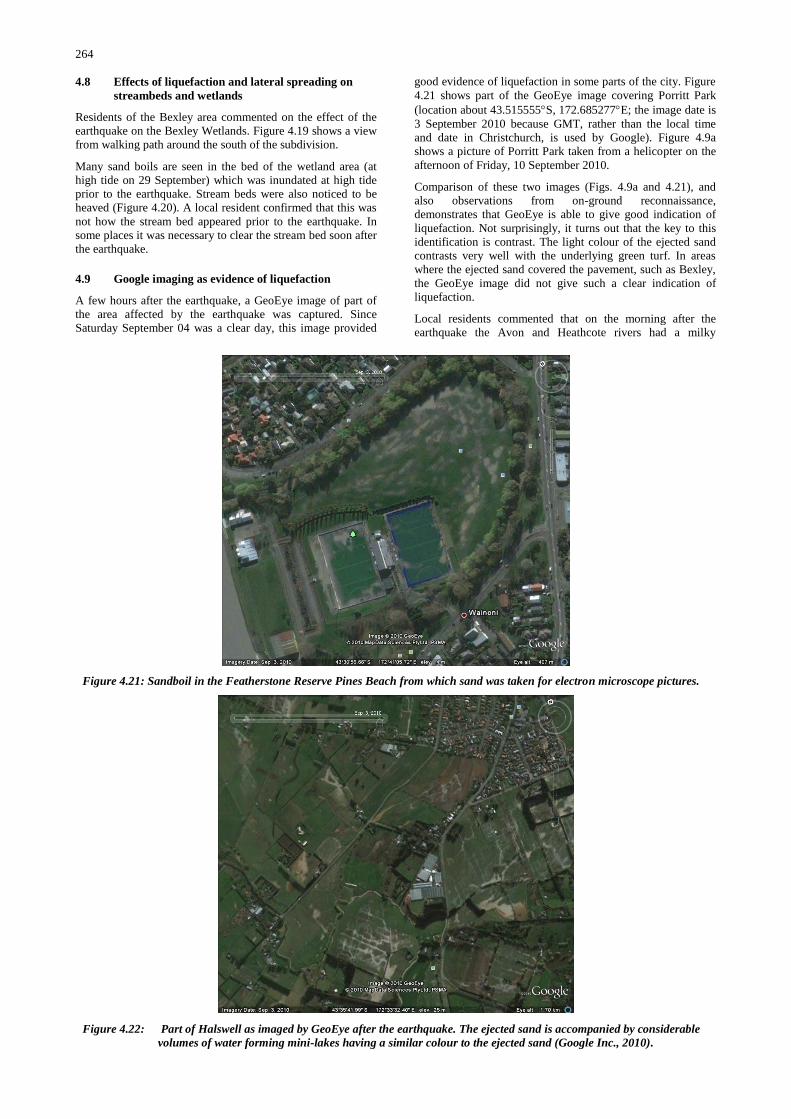
4.9 Google imaging as evidence of liquefaction
A few hours after the earthquake, a GeoEye image of part of
the area affected by the earthquake was captured. Since
Saturday September 04 was a clear day, this image provided
good evidence of liquefaction in some parts of the city. Figure
4.21 shows part of the GeoEye image covering Porritt Park
(location about 43.515555S, 172.685277E; the image date is
3 September 2010 because GMT, rather than the local time
and date in Christchurch, is used by Google). Figure 4.9a
shows a picture of Porritt Park taken from a helicopter on the
afternoon of Friday, 10 September 2010.
Comparison of these two images (Figs. 4.9a and 4.21), and
also observations from on-ground reconnaissance,
demonstrates that GeoEye is able to give good indication of
liquefaction. Not surprisingly, it turns out that the key to this
identification is contrast. The light colour of the ejected sand
contrasts very well with the underlying green turf. In areas
where the ejected sand covered the pavement, such as Bexley,
the GeoEye image did not give such a clear indication of
liquefaction.
Local residents commented that on the morning after the
earthquake the Avon and Heathcote rivers had a milky
Figure 4.21: Sandboil in the Featherstone Reserve Pines Beach from which sand was taken for electron microscope pictures.
Figure 4.22: Part of Halswell as imaged by GeoEye after the earthquake. The ejected sand is accompanied by considerable
volumes of water forming mini-lakes having a similar colour to the ejected sand (Google Inc., 2010).
265
appearance. This is because the ejected sand contained enough
fine material (typically 10 % finer than about 50 microns) to
stay in suspension for some time when mixed with water. A
GeoEye image of part of the Halswell area is shown in Figure
4.22. Extrapolating from Figure 4.21, this figure suggests that
there are some areas of Halswell where extensive liquefaction
occurred. However, discussions with local residents revealed
that a considerable volume of water came to the ground
surface along with ejected sand, and this water took on a
milky colour. So, the ejected sand could not be distinguished
from the water in the satellite image. Some days after the
earthquake this water had subsided.
In conclusion, comparison of the GeoEye image with on-
ground reconnaissance confirms that, provided there is enough
colour contrast between the ejecta and the surrounding ground,
the satellite image gives a useful indication of liquefaction.
However, when large volumes of water are ejected with the
sand there may be a false indication of the amount of ejecta
present.
4.10 Town of Kaiapoi
The town of Kaiapoi (population ~10,000; area ~5 km2) is
situated about 17 km north of Christchurch, near the north-
eastern end of the Canterbury Plains. At Kaiapoi, recent
Holocene sediments, approximately 100 m thick, overlie 300-
400 m of late Pleistocene sands and gravels, which in turn rest
on rock and a greywacke basement rock (Brown and Webber,
1992; Berrill et al., 1994).
Present day Kaiapoi is divided into North Kaiapoi and South
Kaiapoi by the Kaiapoi River (Figure 4.23). At the southeast
end of Kaiapoi, the Waimakariri River meets the Kaiapoi
River. The Waimakariri River and its abandoned channels
significantly influenced liquefaction susceptibility of Kaiapoi.
As discussed in the Geology chapter of this report and in
Berrill et al. (1994), before 1868, the Waimakariri River had
two branches. The north branch flowed in the channel of the
present Kaiapoi River, and the south branch flowed in the now
abandoned channel that was located between the present
Kaiapoi River and Waimakariri River channels (Figure 2.9).
Several old meander loops of pre-1868 Waimakariri River
have deposited loose silty sands both north and south of the
present Kaiapoi River. Also, the ground water table is
generally shallow within 1-2 m of the ground surface.
Figure 4.23: Map of present day Kaiapoi (Google Inc.,
2010).
Parts of North Kaiapoi liquefied during the 1901 Cheviot
Earthquake. Berrill et al. (1994) provide an excellent summary
of the liquefaction that occurred in Kaiapoi during the 1901
event. Particularly, they presented historical evidence of the
occurrence of liquefaction in the northeast section of Kaiapoi,
at the east end of Charles and Sewell streets.
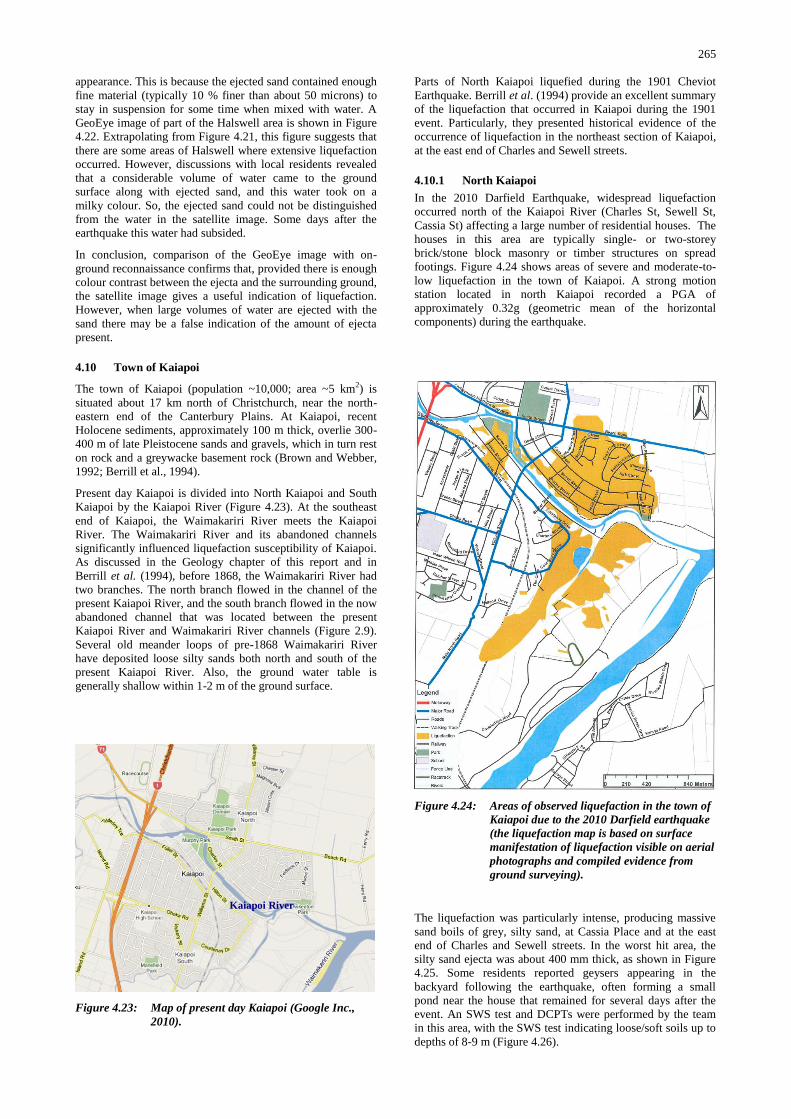
4.10.1 North Kaiapoi
In the 2010 Darfield Earthquake, widespread liquefaction
occurred north of the Kaiapoi River (Charles St, Sewell St,
Cassia St) affecting a large number of residential houses. The
houses in this area are typically single- or two-storey
brick/stone block masonry or timber structures on spread
footings. Figure 4.24 shows areas of severe and moderate-to-
low liquefaction in the town of Kaiapoi. A strong motion
station located in north Kaiapoi recorded a PGA of
approximately 0.32g (geometric mean of the horizontal
components) during the earthquake.
Figure 4.24: Areas of observed liquefaction in the town of
Kaiapoi due to the 2010 Darfield earthquake
(the liquefaction map is based on surface
manifestation of liquefaction visible on aerial
photographs and compiled evidence from
ground surveying).
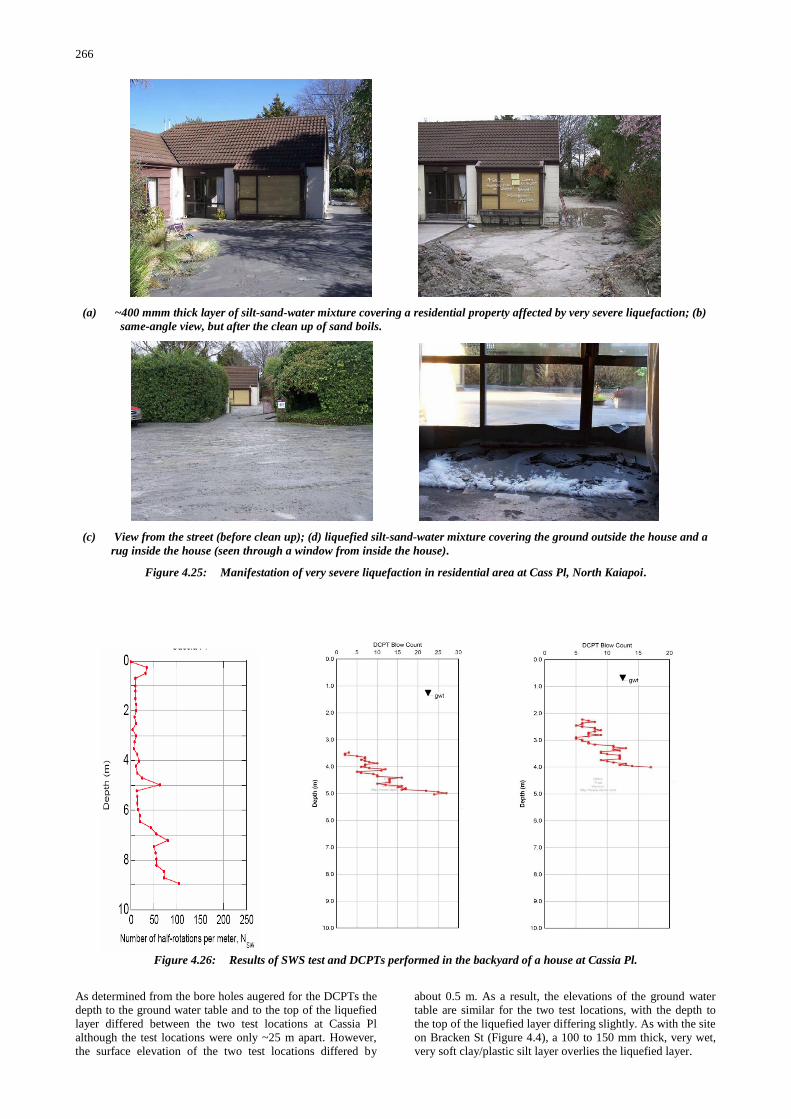
The liquefaction was particularly intense, producing massive
sand boils of grey, silty sand, at Cassia Place and at the east
end of Charles and Sewell streets. In the worst hit area, the
silty sand ejecta was about 400 mm thick, as shown in Figure
4.25. Some residents reported geysers appearing in the
backyard following the earthquake, often forming a small
pond near the house that remained for several days after the
event. An SWS test and DCPTs were performed by the team
in this area, with the SWS test indicating loose/soft soils up to
depths of 8-9 m (Figure 4.26).
Kaiapoi River
266
As determined from the bore holes augered for the DCPTs the
depth to the ground water table and to the top of the liquefied
layer differed between the two test locations at Cassia Pl
although the test locations were only ~25 m apart. However,
the surface elevation of the two test locations differed by
about 0.5 m. As a result, the elevations of the ground water
table are similar for the two test locations, with the depth to
the top of the liquefied layer differing slightly. As with the site
on Bracken St (Figure 4.4), a 100 to 150 mm thick, very wet,
very soft clay/plastic silt layer overlies the liquefied layer.
(a) ~400 mmm thick layer of silt-sand-water mixture covering a residential property affected by very severe liquefaction; (b)
same-angle view, but after the clean up of sand boils.
(c) View from the street (before clean up); (d) liquefied silt-sand-water mixture covering the ground outside the house and a
rug inside the house (seen through a window from inside the house).
Figure 4.25: Manifestation of very severe liquefaction in residential area at Cass Pl, North Kaiapoi.
Figure 4.26: Results of SWS test and DCPTs performed in the backyard of a house at Cassia Pl.
267
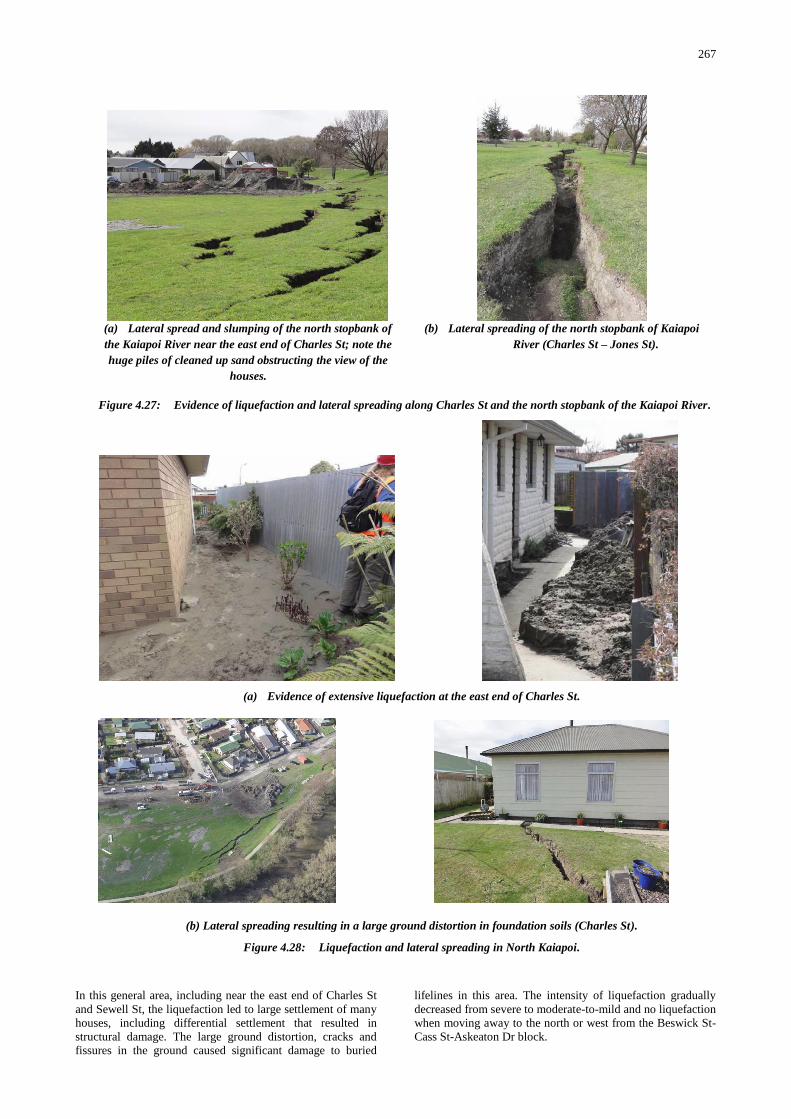
In this general area, including near the east end of Charles St
and Sewell St, the liquefaction led to large settlement of many
houses, including differential settlement that resulted in
structural damage. The large ground distortion, cracks and
fissures in the ground caused significant damage to buried
lifelines in this area. The intensity of liquefaction gradually
decreased from severe to moderate-to-mild and no liquefaction
when moving away to the north or west from the Beswick St-
Cass St-Askeaton Dr block.
(a) Lateral spread and slumping of the north stopbank of
the Kaiapoi River near the east end of Charles St; note the
huge piles of cleaned up sand obstructing the view of the
houses.
(b) Lateral spreading of the north stopbank of Kaiapoi
River (Charles St – Jones St).
Figure 4.27: Evidence of liquefaction and lateral spreading along Charles St and the north stopbank of the Kaiapoi River.
(a) Evidence of extensive liquefaction at the east end of Charles St.
(b) Lateral spreading resulting in a large ground distortion in foundation soils (Charles St).
Figure 4.28: Liquefaction and lateral spreading in North Kaiapoi.
268
The area along the Pegasus Bay Walkway (from the Kaiapoi
Visitor Information Centre on the east to Askeaton Park on the
west) was affected by significant lateral spreading with large
cracks and fissures in the sloping ground towards Charles St
(Figure 4.27). Residential houses in this area were affected
both by liquefaction and lateral spreading (Figure 4.28). The
reconnaissance team carried out detailed ground surveys of
lateral spreading along several profiles at this location which
will be presented in future more detailed publications. In
addition two bore holes were made using a hand auger.
However, the profile largely consisted of random fill
(gravels/cobbles and wood), making it difficult to advance the
auger. One of the bore holes went down to a depth of ~5.5 m,
yet a thick liquefied layer could not be found. However, thin
(< 100 mm) alternating layers of loose saturated sand and very
wet, very soft clay/plastic silt were encountered, particularly
near a large lateral spread crack (Figure 4.27b). This lateral
spread crack had no traces of ejecta in and/or immediately
near it. This crack was closer to the river than ones that were
filled with ejecta, which were an additional 30 m further from
the river. It is possible, that the overlying soil layers slid on
these alternating layers of loose sand and clay/plastic silt that
likely liquefied/softened during the earthquake shaking.
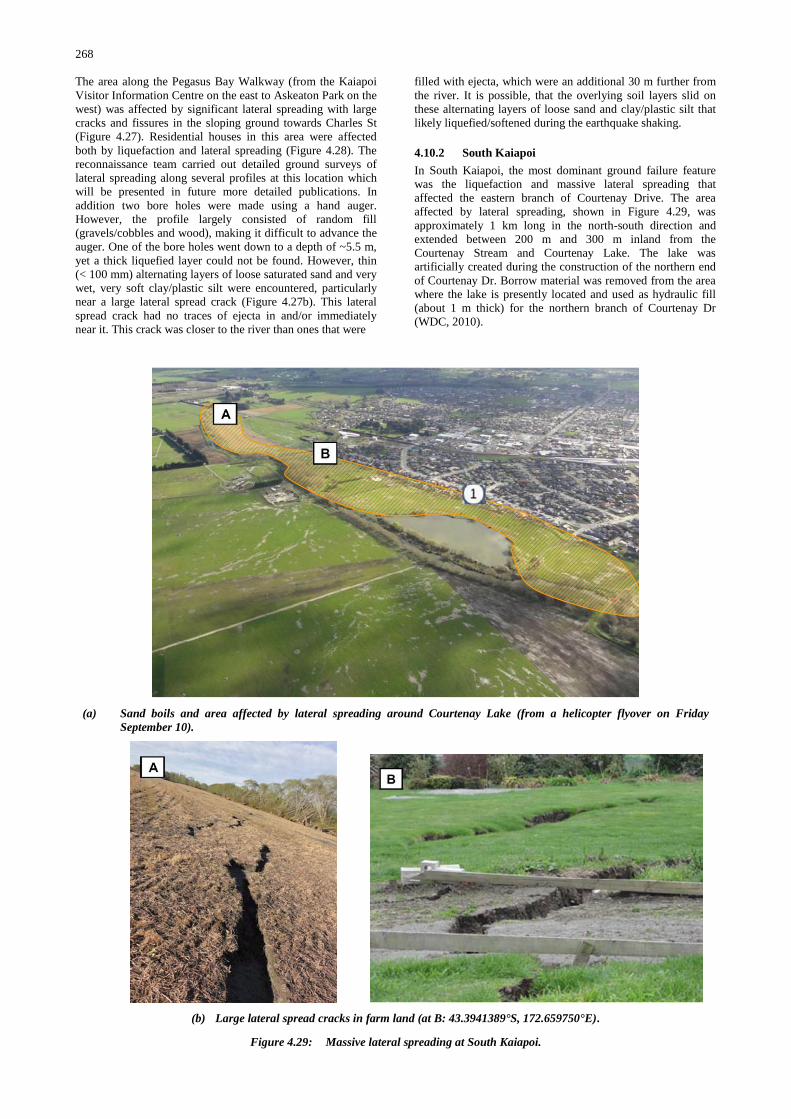
4.10.2 South Kaiapoi
In South Kaiapoi, the most dominant ground failure feature
was the liquefaction and massive lateral spreading that
affected the eastern branch of Courtenay Drive. The area
affected by lateral spreading, shown in Figure 4.29, was
approximately 1 km long in the north-south direction and
extended between 200 m and 300 m inland from the
Courtenay Stream and Courtenay Lake. The lake was
artificially created during the construction of the northern end
of Courtenay Dr. Borrow material was removed from the area
where the lake is presently located and used as hydraulic fill
(about 1 m thick) for the northern branch of Courtenay Dr
(WDC, 2010).
(a) Sand boils and area affected by lateral spreading around Courtenay Lake (from a helicopter flyover on Friday
September 10).
(b) Large lateral spread cracks in farm land (at B: 43.3941389°S, 172.659750°E).
Figure 4.29: Massive lateral spreading at South Kaiapoi.
269
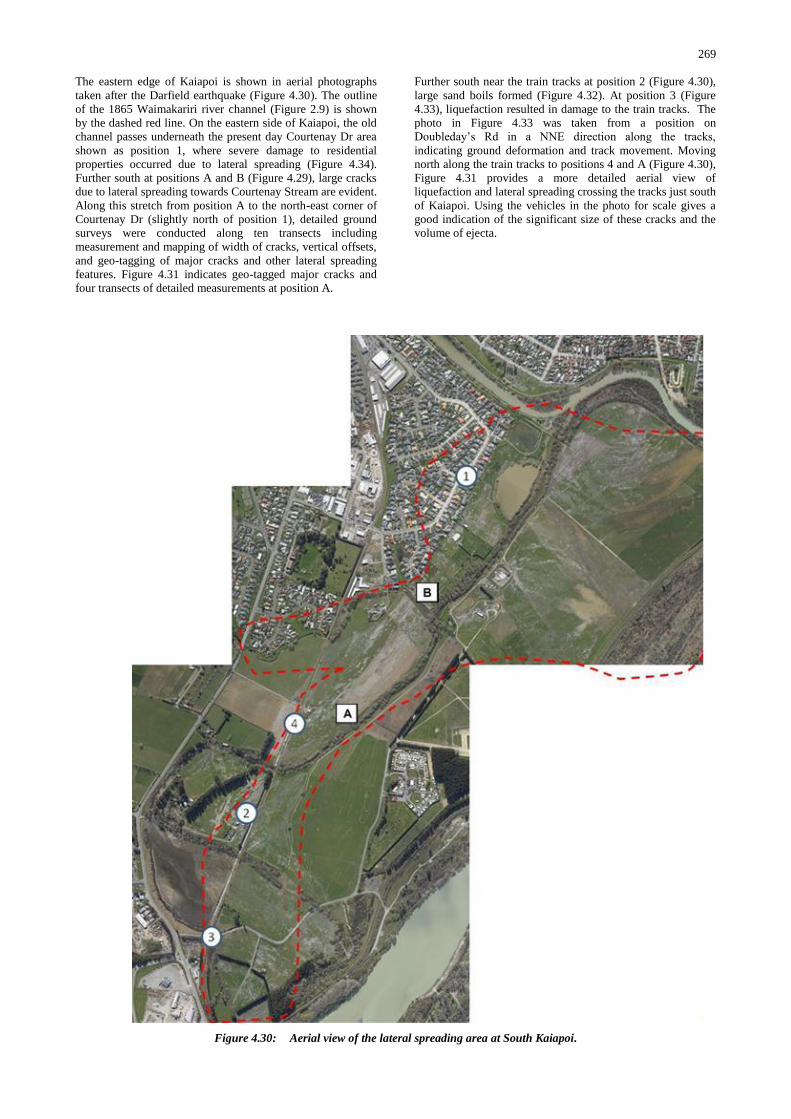
The eastern edge of Kaiapoi is shown in aerial photographs
taken after the Darfield earthquake (Figure 4.30). The outline
of the 1865 Waimakariri river channel (Figure 2.9) is shown
by the dashed red line. On the eastern side of Kaiapoi, the old
channel passes underneath the present day Courtenay Dr area
shown as position 1, where severe damage to residential
properties occurred due to lateral spreading (Figure 4.34).
Further south at positions A and B (Figure 4.29), large cracks
due to lateral spreading towards Courtenay Stream are evident.
Along this stretch from position A to the north-east corner of
Courtenay Dr (slightly north of position 1), detailed ground
surveys were conducted along ten transects including
measurement and mapping of width of cracks, vertical offsets,
and geo-tagging of major cracks and other lateral spreading
features. Figure 4.31 indicates geo-tagged major cracks and
four transects of detailed measurements at position A.
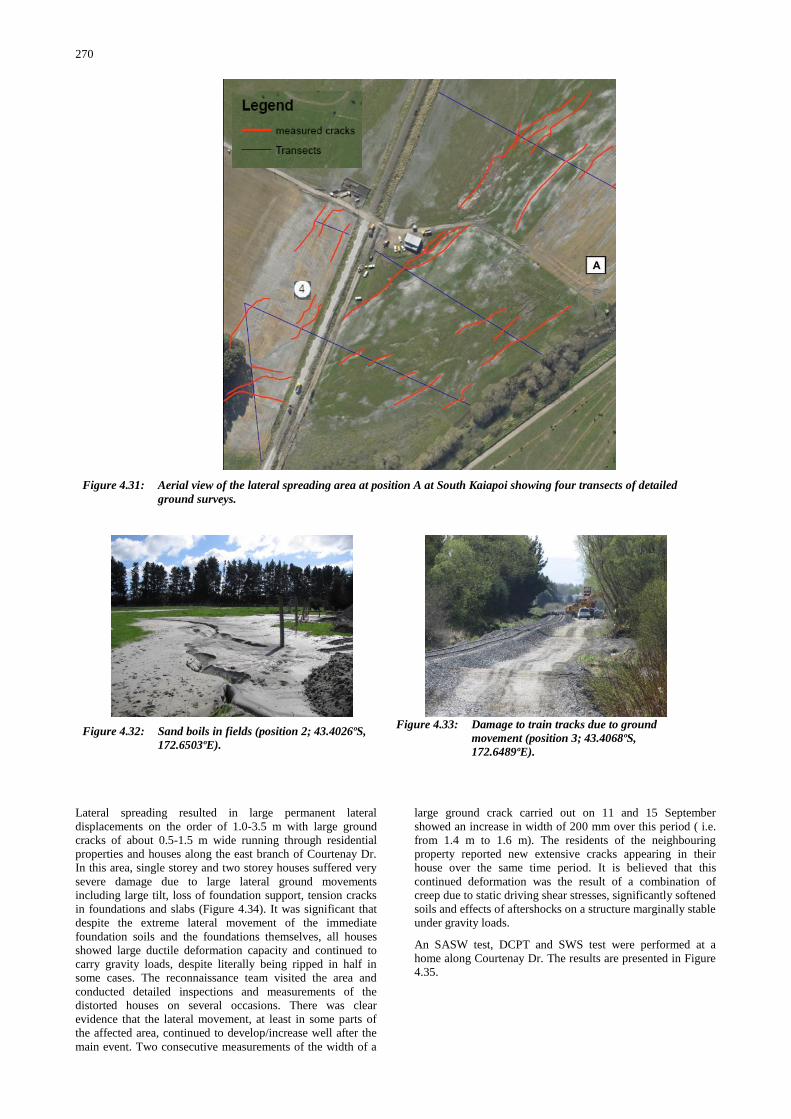
Further south near the train tracks at position 2 (Figure 4.30),
large sand boils formed (Figure 4.32). At position 3 (Figure
4.33), liquefaction resulted in damage to the train tracks. The
photo in Figure 4.33 was taken from a position on
Doubleday‟s Rd in a NNE direction along the tracks,
indicating ground deformation and track movement. Moving
north along the train tracks to positions 4 and A (Figure 4.30),
Figure 4.31 provides a more detailed aerial view of
liquefaction and lateral spreading crossing the tracks just south
of Kaiapoi. Using the vehicles in the photo for scale gives a
good indication of the significant size of these cracks and the
volume of ejecta.
Figure 4.30: Aerial view of the lateral spreading area at South Kaiapoi.
270
Lateral spreading resulted in large permanent lateral
displacements on the order of 1.0-3.5 m with large ground
cracks of about 0.5-1.5 m wide running through residential
properties and houses along the east branch of Courtenay Dr.
In this area, single storey and two storey houses suffered very
severe damage due to large lateral ground movements
including large tilt, loss of foundation support, tension cracks
in foundations and slabs (Figure 4.34). It was significant that
despite the extreme lateral movement of the immediate
foundation soils and the foundations themselves, all houses
showed large ductile deformation capacity and continued to
carry gravity loads, despite literally being ripped in half in
some cases. The reconnaissance team visited the area and
conducted detailed inspections and measurements of the
distorted houses on several occasions. There was clear
evidence that the lateral movement, at least in some parts of
the affected area, continued to develop/increase well after the
main event. Two consecutive measurements of the width of a
large ground crack carried out on 11 and 15 September
showed an increase in width of 200 mm over this period ( i.e.
from 1.4 m to 1.6 m). The residents of the neighbouring
property reported new extensive cracks appearing in their
house over the same time period. It is believed that this
continued deformation was the result of a combination of
creep due to static driving shear stresses, significantly softened
soils and effects of aftershocks on a structure marginally stable
under gravity loads.
An SASW test, DCPT and SWS test were performed at a
home along Courtenay Dr. The results are presented in Figure
4.35.
Figure 4.31: Aerial view of the lateral spreading area at position A at South Kaiapoi showing four transects of detailed
ground surveys.
Figure 4.32: Sand boils in fields (position 2; 43.4026ºS,
172.6503ºE).
Figure 4.33: Damage to train tracks due to ground
movement (position 3; 43.4068ºS,
172.6489ºE).
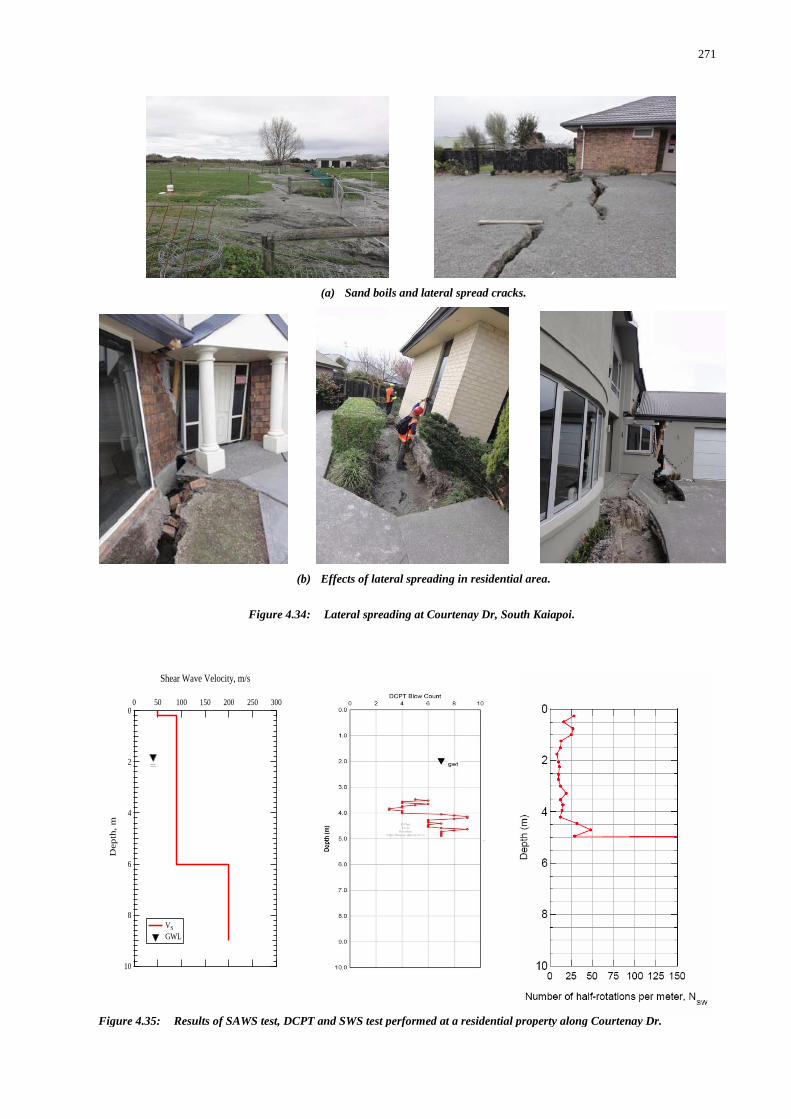
271
(a) Sand boils and lateral spread cracks.
(b) Effects of lateral spreading in residential area.
Figure 4.34: Lateral spreading at Courtenay Dr, South Kaiapoi.
10
8
6
4
2
0
Depth
, m
300250200150100500
Shear Wave Velocity, m/s
VS
GWL
Figure 4.35: Results of SAWS test, DCPT and SWS test performed at a residential property along Courtenay Dr.
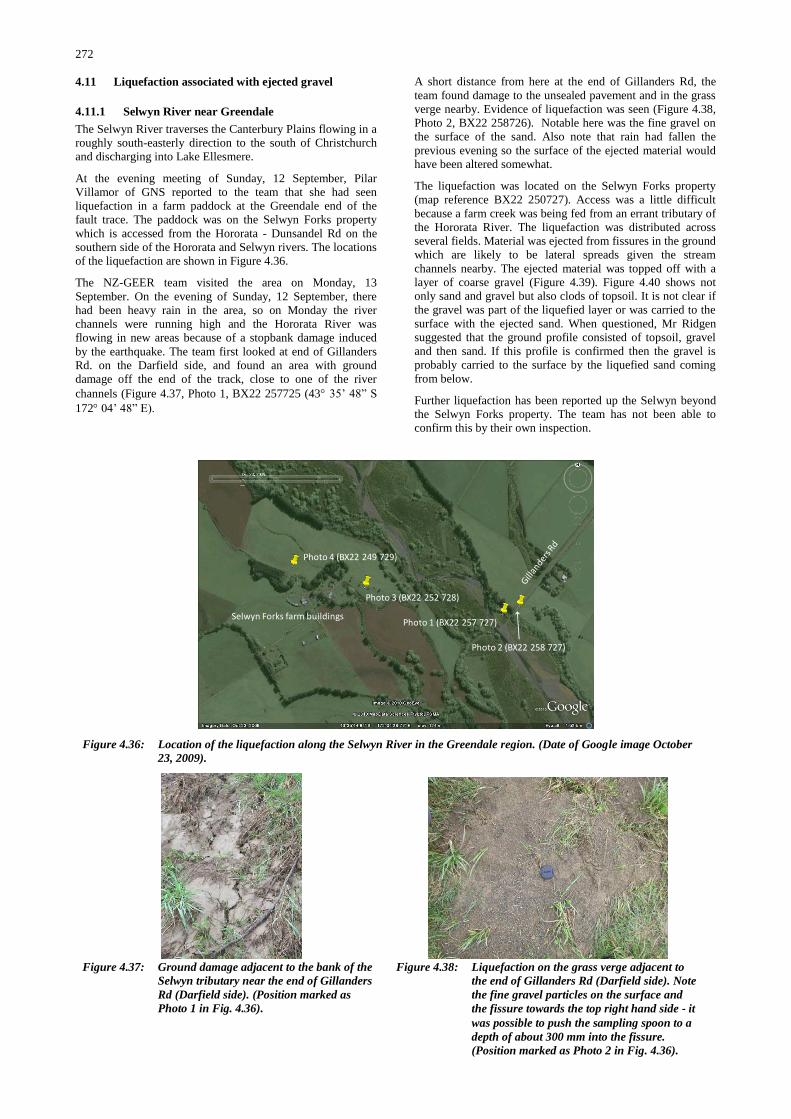
272
4.11 Liquefaction associated with ejected gravel
4.11.1 Selwyn River near Greendale
The Selwyn River traverses the Canterbury Plains flowing in a
roughly south-easterly direction to the south of Christchurch
and discharging into Lake Ellesmere.
At the evening meeting of Sunday, 12 September, Pilar
Villamor of GNS reported to the team that she had seen
liquefaction in a farm paddock at the Greendale end of the
fault trace. The paddock was on the Selwyn Forks property
which is accessed from the Hororata - Dunsandel Rd on the
southern side of the Hororata and Selwyn rivers. The locations
of the liquefaction are shown in Figure 4.36.
The NZ-GEER team visited the area on Monday, 13
September. On the evening of Sunday, 12 September, there
had been heavy rain in the area, so on Monday the river
channels were running high and the Hororata River was
flowing in new areas because of a stopbank damage induced
by the earthquake. The team first looked at end of Gillanders
Rd. on the Darfield side, and found an area with ground
damage off the end of the track, close to one of the river
channels (Figure 4.37, Photo 1, BX22 257725 (43 35‟ 48” S
172 04‟ 48” E).
A short distance from here at the end of Gillanders Rd, the
team found damage to the unsealed pavement and in the grass
verge nearby. Evidence of liquefaction was seen (Figure 4.38,
Photo 2, BX22 258726). Notable here was the fine gravel on
the surface of the sand. Also note that rain had fallen the
previous evening so the surface of the ejected material would
have been altered somewhat.
The liquefaction was located on the Selwyn Forks property
(map reference BX22 250727). Access was a little difficult
because a farm creek was being fed from an errant tributary of
the Hororata River. The liquefaction was distributed across
several fields. Material was ejected from fissures in the ground
which are likely to be lateral spreads given the stream
channels nearby. The ejected material was topped off with a
layer of coarse gravel (Figure 4.39). Figure 4.40 shows not
only sand and gravel but also clods of topsoil. It is not clear if
the gravel was part of the liquefied layer or was carried to the
surface with the ejected sand. When questioned, Mr Ridgen
suggested that the ground profile consisted of topsoil, gravel
and then sand. If this profile is confirmed then the gravel is
probably carried to the surface by the liquefied sand coming
from below.
Further liquefaction has been reported up the Selwyn beyond
the Selwyn Forks property. The team has not been able to
confirm this by their own inspection.
Selwyn Forks farm buildingsPhoto 1 (BX22 257 727)
Photo 2 (BX22 258 727)
Photo 3 (BX22 252 728)
Photo 4 (BX22 249 729)
Figure 4.36: Location of the liquefaction along the Selwyn River in the Greendale region. (Date of Google image October
23, 2009).
Figure 4.37: Ground damage adjacent to the bank of the
Selwyn tributary near the end of Gillanders
Rd (Darfield side). (Position marked as
Photo 1 in Fig. 4.36).
Figure 4.38: Liquefaction on the grass verge adjacent to
the end of Gillanders Rd (Darfield side). Note
the fine gravel particles on the surface and
the fissure towards the top right hand side ‐ it was possible to push the sampling spoon to a
depth of about 300 mm into the fissure.
(Position marked as Photo 2 in Fig. 4.36).
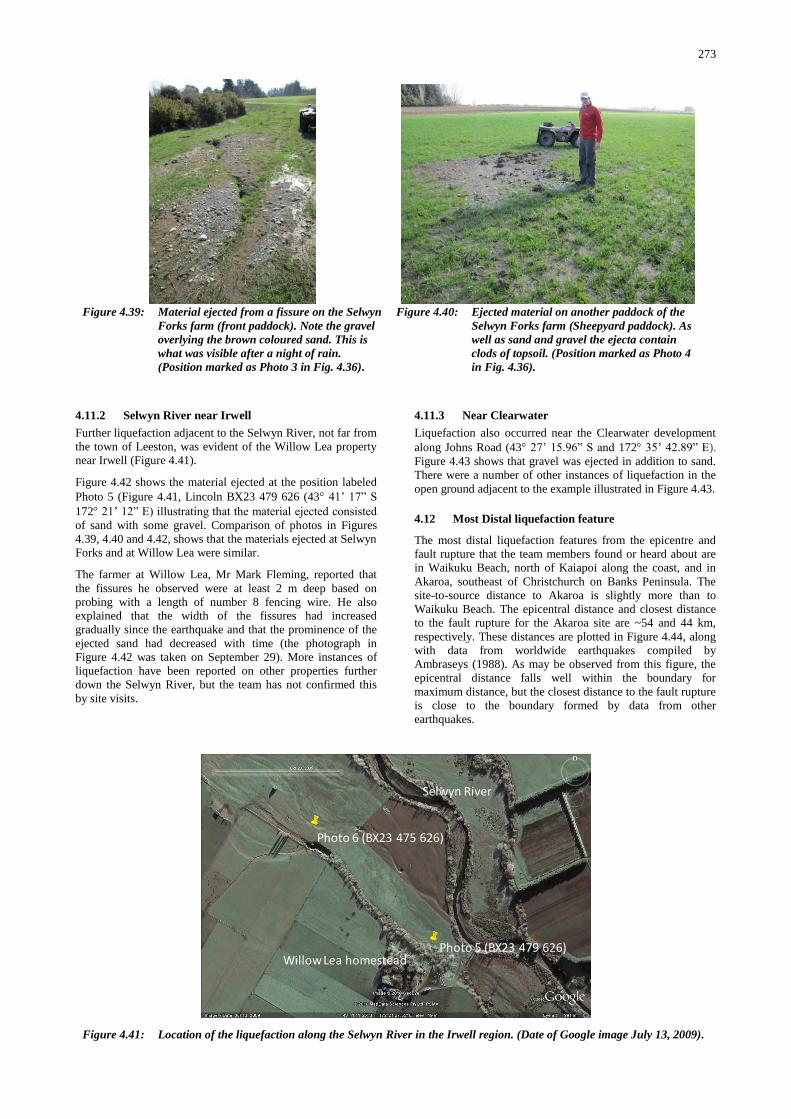
273
4.11.2 Selwyn River near Irwell
Further liquefaction adjacent to the Selwyn River, not far from
the town of Leeston, was evident of the Willow Lea property
near Irwell (Figure 4.41).
Figure 4.42 shows the material ejected at the position labeled
Photo 5 (Figure 4.41, Lincoln BX23 479 626 (43 41‟ 17” S
172 21‟ 12” E) illustrating that the material ejected consisted
of sand with some gravel. Comparison of photos in Figures
4.39, 4.40 and 4.42, shows that the materials ejected at Selwyn
Forks and at Willow Lea were similar.
The farmer at Willow Lea, Mr Mark Fleming, reported that
the fissures he observed were at least 2 m deep based on
probing with a length of number 8 fencing wire. He also
explained that the width of the fissures had increased
gradually since the earthquake and that the prominence of the
ejected sand had decreased with time (the photograph in
Figure 4.42 was taken on September 29). More instances of
liquefaction have been reported on other properties further
down the Selwyn River, but the team has not confirmed this
by site visits.
4.11.3 Near Clearwater
Liquefaction also occurred near the Clearwater development
along Johns Road (43 27‟ 15.96” S and 172 35‟ 42.89” E).
Figure 4.43 shows that gravel was ejected in addition to sand.
There were a number of other instances of liquefaction in the
open ground adjacent to the example illustrated in Figure 4.43.
4.12 Most Distal liquefaction feature
The most distal liquefaction features from the epicentre and
fault rupture that the team members found or heard about are
in Waikuku Beach, north of Kaiapoi along the coast, and in
Akaroa, southeast of Christchurch on Banks Peninsula. The
site-to-source distance to Akaroa is slightly more than to
Waikuku Beach. The epicentral distance and closest distance
to the fault rupture for the Akaroa site are ~54 and 44 km,
respectively. These distances are plotted in Figure 4.44, along
with data from worldwide earthquakes compiled by
Ambraseys (1988). As may be observed from this figure, the
epicentral distance falls well within the boundary for
maximum distance, but the closest distance to the fault rupture
is close to the boundary formed by data from other
earthquakes.
Figure 4.39: Material ejected from a fissure on the Selwyn
Forks farm (front paddock). Note the gravel
overlying the brown coloured sand. This is
what was visible after a night of rain.
(Position marked as Photo 3 in Fig. 4.36).
Figure 4.40: Ejected material on another paddock of the
Selwyn Forks farm (Sheepyard paddock). As
well as sand and gravel the ejecta contain
clods of topsoil. (Position marked as Photo 4
in Fig. 4.36).
Willow Lea homestead
Selwyn River
Photo 5 (BX23 479 626)
Photo 6 (BX23 475 626)
Figure 4.41: Location of the liquefaction along the Selwyn River in the Irwell region. (Date of Google image July 13, 2009).
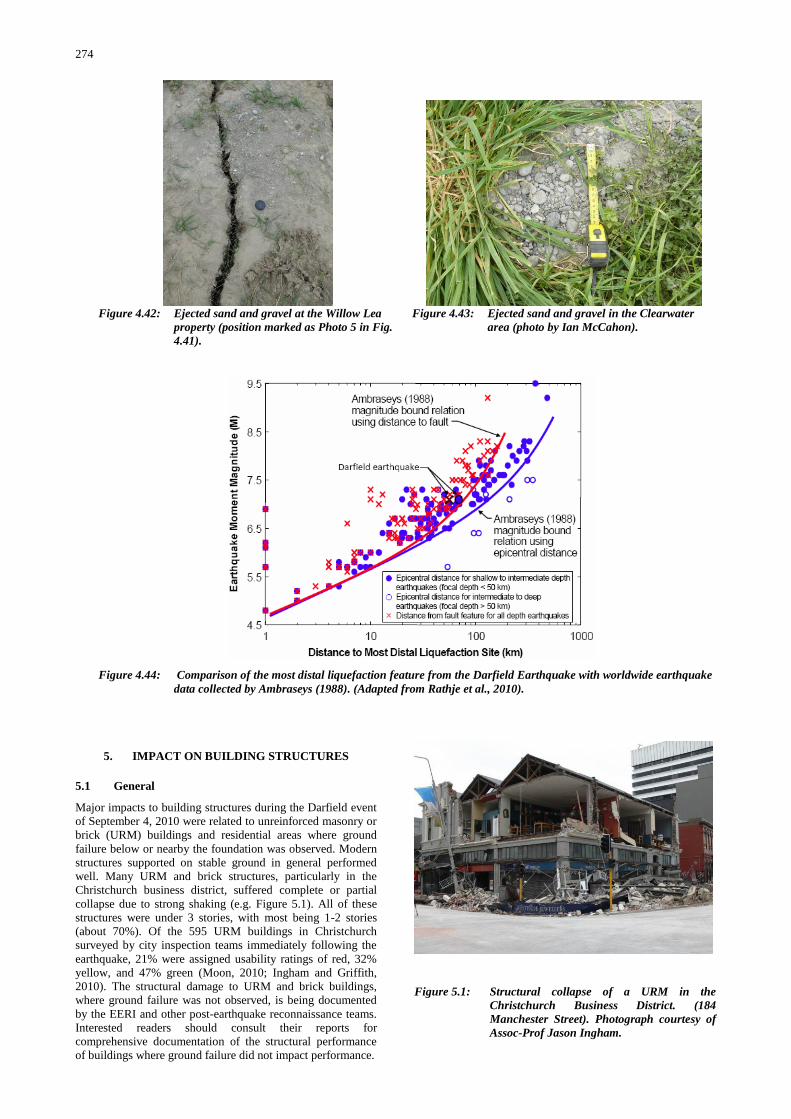
274
5. IMPACT ON BUILDING STRUCTURES
5.1 General
Major impacts to building structures during the Darfield event
of September 4, 2010 were related to unreinforced masonry or
brick (URM) buildings and residential areas where ground
failure below or nearby the foundation was observed. Modern
structures supported on stable ground in general performed
well. Many URM and brick structures, particularly in the
Christchurch business district, suffered complete or partial
collapse due to strong shaking (e.g. Figure 5.1). All of these
structures were under 3 stories, with most being 1-2 stories
(about 70%). Of the 595 URM buildings in Christchurch
surveyed by city inspection teams immediately following the
earthquake, 21% were assigned usability ratings of red, 32%
yellow, and 47% green (Moon, 2010; Ingham and Griffith,
2010). The structural damage to URM and brick buildings,
where ground failure was not observed, is being documented
by the EERI and other post-earthquake reconnaissance teams.
Interested readers should consult their reports for
comprehensive documentation of the structural performance
of buildings where ground failure did not impact performance.
Figure 5.1: Structural collapse of a URM in the
Christchurch Business District. (184
Manchester Street). Photograph courtesy of
Assoc-Prof Jason Ingham.
Figure 4.42: Ejected sand and gravel at the Willow Lea
property (position marked as Photo 5 in Fig.
4.41).
Figure 4.43: Ejected sand and gravel in the Clearwater
area (photo by Ian McCahon).
Figure 4.44: Comparison of the most distal liquefaction feature from the Darfield Earthquake with worldwide earthquake
data collected by Ambraseys (1988). (Adapted from Rathje et al., 2010).
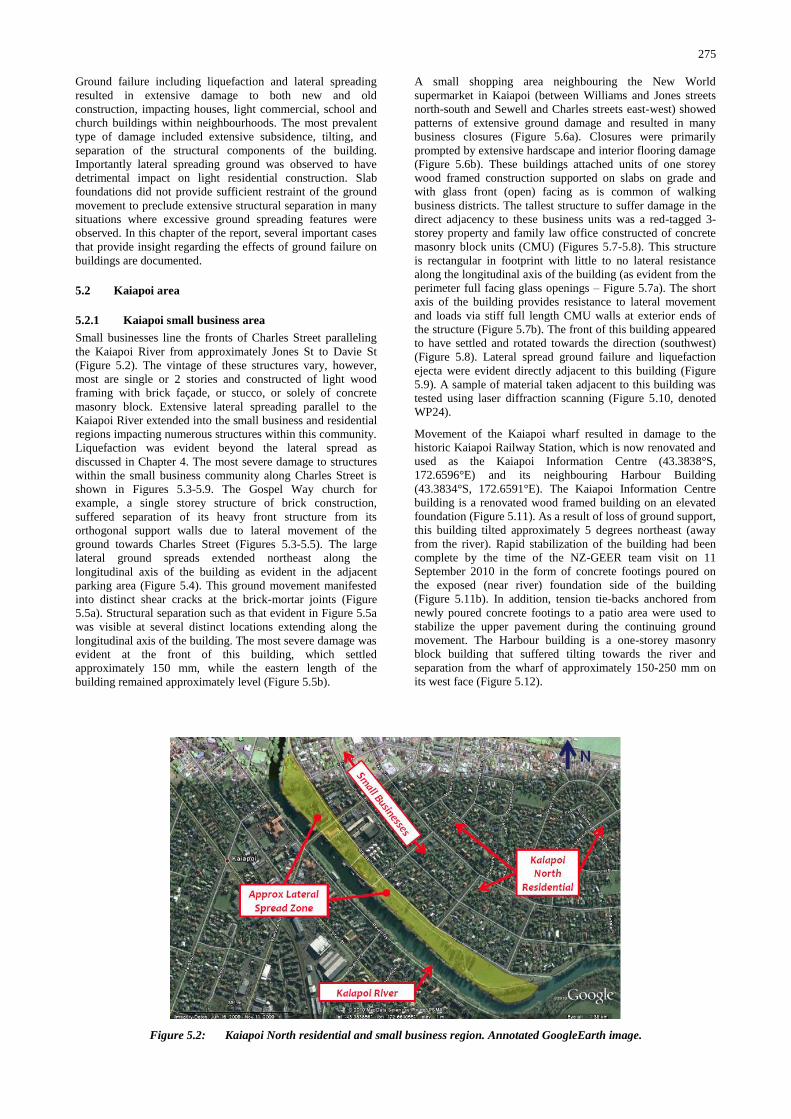
275
Ground failure including liquefaction and lateral spreading
resulted in extensive damage to both new and old
construction, impacting houses, light commercial, school and
church buildings within neighbourhoods. The most prevalent
type of damage included extensive subsidence, tilting, and
separation of the structural components of the building.
Importantly lateral spreading ground was observed to have
detrimental impact on light residential construction. Slab
foundations did not provide sufficient restraint of the ground
movement to preclude extensive structural separation in many
situations where excessive ground spreading features were
observed. In this chapter of the report, several important cases
that provide insight regarding the effects of ground failure on
buildings are documented.
5.2 Kaiapoi area
5.2.1 Kaiapoi small business area
Small businesses line the fronts of Charles Street paralleling
the Kaiapoi River from approximately Jones St to Davie St
(Figure 5.2). The vintage of these structures vary, however,
most are single or 2 stories and constructed of light wood
framing with brick façade, or stucco, or solely of concrete
masonry block. Extensive lateral spreading parallel to the
Kaiapoi River extended into the small business and residential
regions impacting numerous structures within this community.
Liquefaction was evident beyond the lateral spread as
discussed in Chapter 4. The most severe damage to structures
within the small business community along Charles Street is
shown in Figures 5.3-5.9. The Gospel Way church for
example, a single storey structure of brick construction,
suffered separation of its heavy front structure from its
orthogonal support walls due to lateral movement of the
ground towards Charles Street (Figures 5.3-5.5). The large
lateral ground spreads extended northeast along the
longitudinal axis of the building as evident in the adjacent
parking area (Figure 5.4). This ground movement manifested
into distinct shear cracks at the brick-mortar joints (Figure
5.5a). Structural separation such as that evident in Figure 5.5a
was visible at several distinct locations extending along the
longitudinal axis of the building. The most severe damage was
evident at the front of this building, which settled
approximately 150 mm, while the eastern length of the
building remained approximately level (Figure 5.5b).
A small shopping area neighbouring the New World
supermarket in Kaiapoi (between Williams and Jones streets
north-south and Sewell and Charles streets east-west) showed
patterns of extensive ground damage and resulted in many
business closures (Figure 5.6a). Closures were primarily
prompted by extensive hardscape and interior flooring damage
(Figure 5.6b). These buildings attached units of one storey
wood framed construction supported on slabs on grade and
with glass front (open) facing as is common of walking
business districts. The tallest structure to suffer damage in the
direct adjacency to these business units was a red-tagged 3-
storey property and family law office constructed of concrete
masonry block units (CMU) (Figures 5.7-5.8). This structure
is rectangular in footprint with little to no lateral resistance
along the longitudinal axis of the building (as evident from the
perimeter full facing glass openings – Figure 5.7a). The short
axis of the building provides resistance to lateral movement
and loads via stiff full length CMU walls at exterior ends of
the structure (Figure 5.7b). The front of this building appeared
to have settled and rotated towards the direction (southwest)
(Figure 5.8). Lateral spread ground failure and liquefaction
ejecta were evident directly adjacent to this building (Figure
5.9). A sample of material taken adjacent to this building was
tested using laser diffraction scanning (Figure 5.10, denoted
WP24).
Movement of the Kaiapoi wharf resulted in damage to the
historic Kaiapoi Railway Station, which is now renovated and
used as the Kaiapoi Information Centre (43.3838°S,
172.6596°E) and its neighbouring Harbour Building
(43.3834°S, 172.6591°E). The Kaiapoi Information Centre
building is a renovated wood framed building on an elevated
foundation (Figure 5.11). As a result of loss of ground support,
this building tilted approximately 5 degrees northeast (away
from the river). Rapid stabilization of the building had been
complete by the time of the NZ-GEER team visit on 11
September 2010 in the form of concrete footings poured on
the exposed (near river) foundation side of the building
(Figure 5.11b). In addition, tension tie-backs anchored from
newly poured concrete footings to a patio area were used to
stabilize the upper pavement during the continuing ground
movement. The Harbour building is a one-storey masonry
block building that suffered tilting towards the river and
separation from the wharf of approximately 150-250 mm on
its west face (Figure 5.12).
Figure 5.2: Kaiapoi North residential and small business region. Annotated GoogleEarth image.
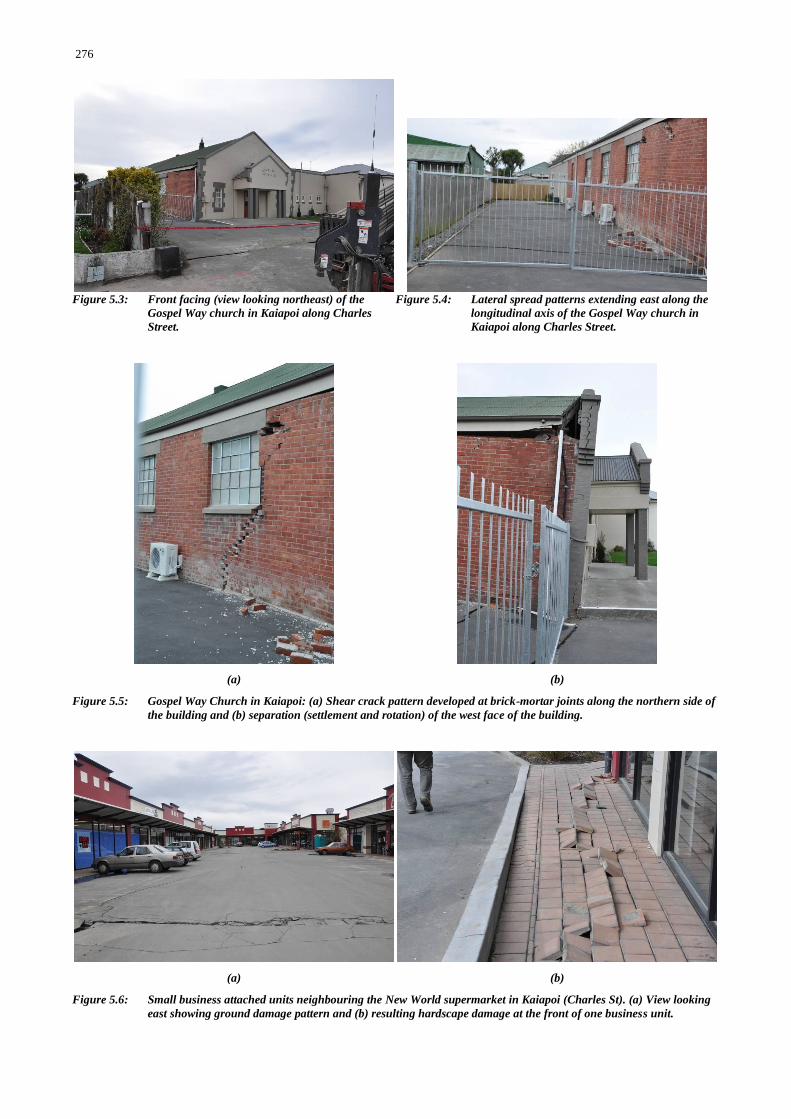
276
Figure 5.3: Front facing (view looking northeast) of the
Gospel Way church in Kaiapoi along Charles
Street.
Figure 5.4: Lateral spread patterns extending east along the
longitudinal axis of the Gospel Way church in
Kaiapoi along Charles Street.
(a) (b)
Figure 5.5: Gospel Way Church in Kaiapoi: (a) Shear crack pattern developed at brick-mortar joints along the northern side of
the building and (b) separation (settlement and rotation) of the west face of the building.
(a) (b)
Figure 5.6: Small business attached units neighbouring the New World supermarket in Kaiapoi (Charles St). (a) View looking
east showing ground damage pattern and (b) resulting hardscape damage at the front of one business unit.
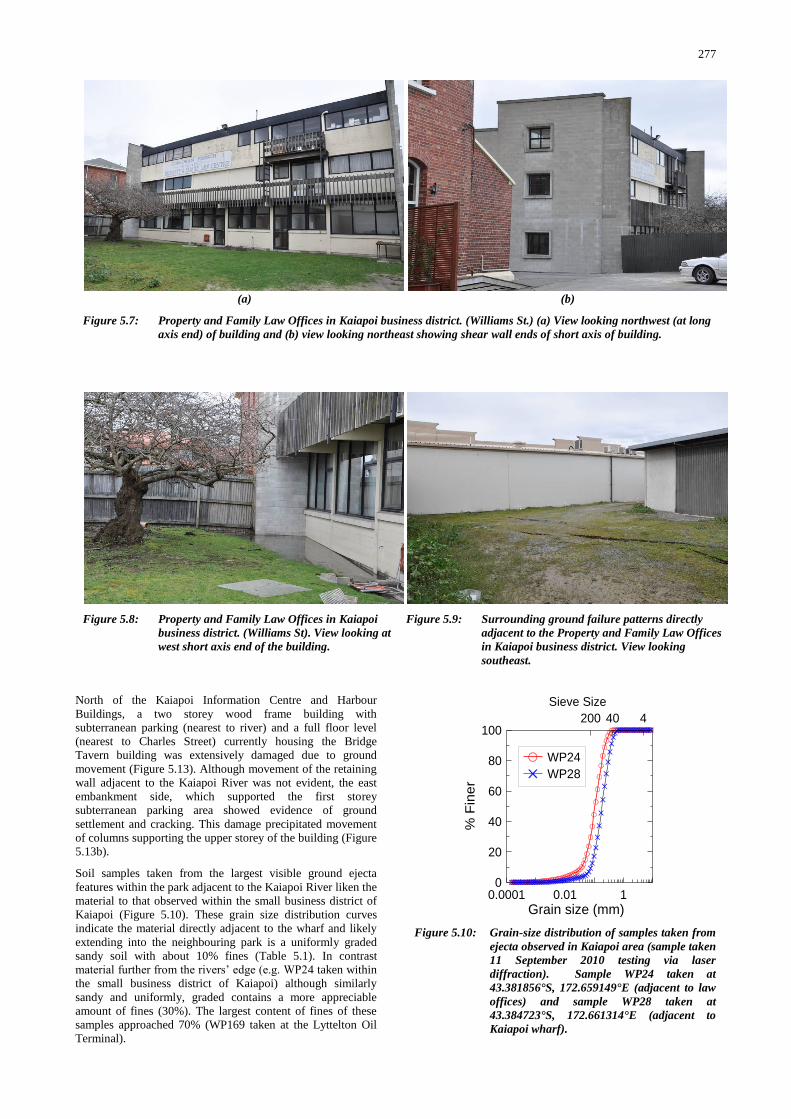
277
North of the Kaiapoi Information Centre and Harbour
Buildings, a two storey wood frame building with
subterranean parking (nearest to river) and a full floor level
(nearest to Charles Street) currently housing the Bridge
Tavern building was extensively damaged due to ground
movement (Figure 5.13). Although movement of the retaining
wall adjacent to the Kaiapoi River was not evident, the east
embankment side, which supported the first storey
subterranean parking area showed evidence of ground
settlement and cracking. This damage precipitated movement
of columns supporting the upper storey of the building (Figure
5.13b).
Soil samples taken from the largest visible ground ejecta
features within the park adjacent to the Kaiapoi River liken the
material to that observed within the small business district of
Kaiapoi (Figure 5.10). These grain size distribution curves
indicate the material directly adjacent to the wharf and likely
extending into the neighbouring park is a uniformly graded
sandy soil with about 10% fines (Table 5.1). In contrast
material further from the rivers‟ edge (e.g. WP24 taken within
the small business district of Kaiapoi) although similarly
sandy and uniformly, graded contains a more appreciable
amount of fines (30%). The largest content of fines of these
samples approached 70% (WP169 taken at the Lyttelton Oil
Terminal).
0.0001 0.01 1
Grain size (mm)
0
20
40
60
80
100
% F
ine
r
WP24
WP28
440200
Sieve Size
0.0001 0.01 1
Grain size (mm)
0
20
40
60
80
100
% F
ine
r
WP104
440200
Sieve Size
0.0001 0.01 1
Grain size (mm)
0
20
40
60
80
100
% F
ine
r
WP169
440200
Sieve Size
Figure 5.10: Grain-size distribution of samples taken from
ejecta observed in Kaiapoi area (sample taken
11 September 2010 testing via laser
diffraction). Sample WP24 taken at
43.381856°S, 172.659149°E (adjacent to law
offices) and sample WP28 taken at
43.384723°S, 172.661314°E (adjacent to
Kaiapoi wharf).
(a) (b)
Figure 5.7: Property and Family Law Offices in Kaiapoi business district. (Williams St.) (a) View looking northwest (at long
axis end) of building and (b) view looking northeast showing shear wall ends of short axis of building.
Figure 5.8: Property and Family Law Offices in Kaiapoi
business district. (Williams St). View looking at
west short axis end of the building.
Figure 5.9: Surrounding ground failure patterns directly
adjacent to the Property and Family Law Offices
in Kaiapoi business district. View looking
southeast.
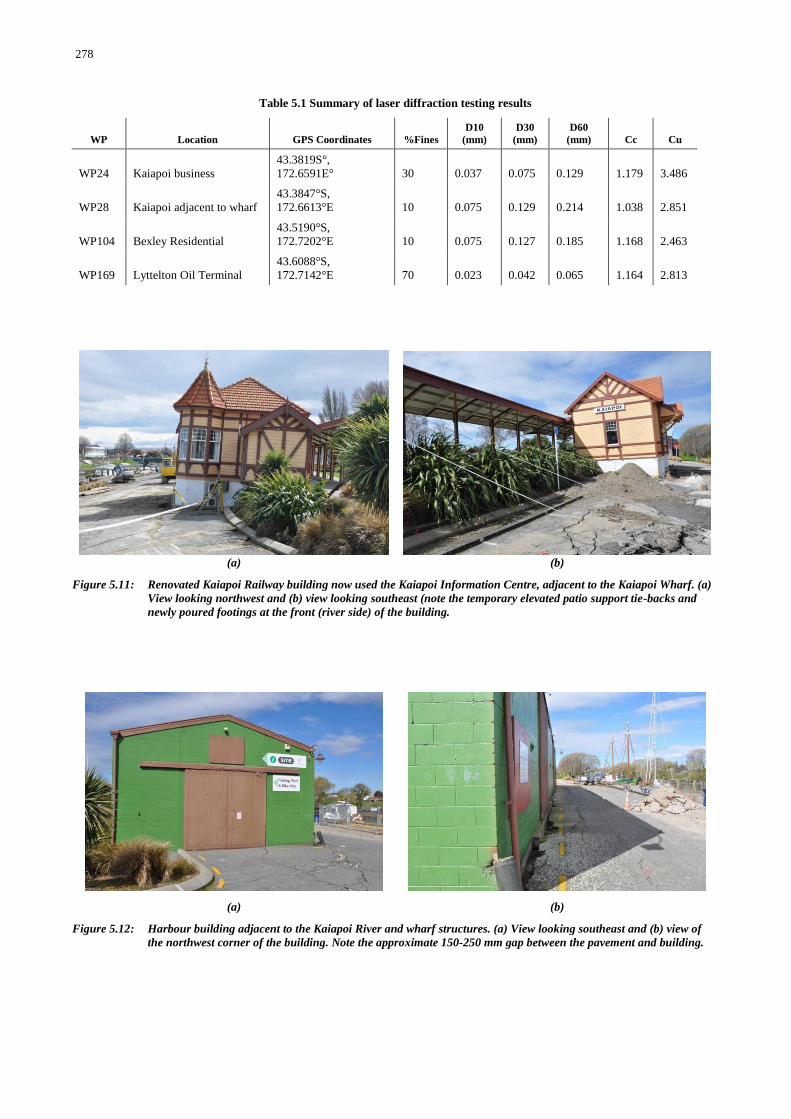
278
Table 5.1 Summary of laser diffraction testing results
WP Location GPS Coordinates %Fines
D10
(mm)
D30
(mm)
D60
(mm) Cc Cu
WP24 Kaiapoi business
43.3819S°,
172.6591E° 30 0.037 0.075 0.129 1.179 3.486
WP28 Kaiapoi adjacent to wharf
43.3847°S,
172.6613°E 10 0.075 0.129 0.214 1.038 2.851
WP104 Bexley Residential
43.5190°S,
172.7202°E 10 0.075 0.127 0.185 1.168 2.463
WP169 Lyttelton Oil Terminal
43.6088°S,
172.7142°E 70 0.023 0.042 0.065 1.164 2.813
(a) (b)
Figure 5.11: Renovated Kaiapoi Railway building now used the Kaiapoi Information Centre, adjacent to the Kaiapoi Wharf. (a)
View looking northwest and (b) view looking southeast (note the temporary elevated patio support tie-backs and
newly poured footings at the front (river side) of the building.
(a) (b)
Figure 5.12: Harbour building adjacent to the Kaiapoi River and wharf structures. (a) View looking southeast and (b) view of
the northwest corner of the building. Note the approximate 150-250 mm gap between the pavement and building.
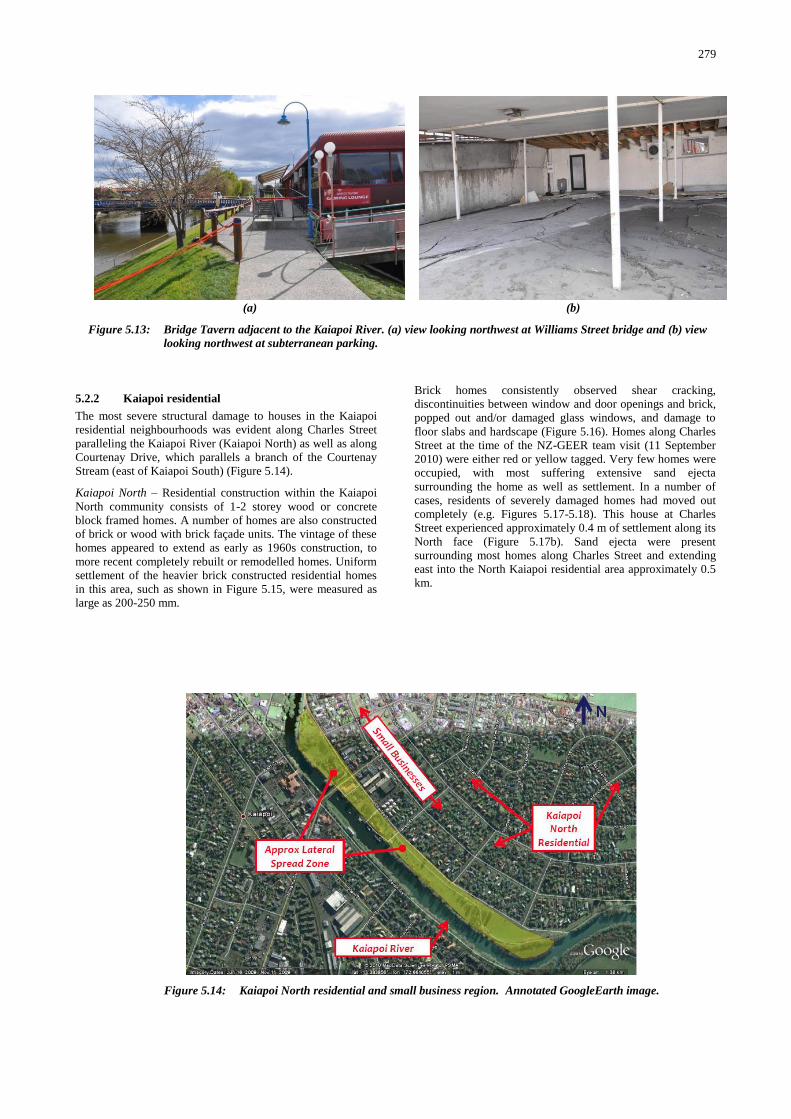
279
5.2.2 Kaiapoi residential
The most severe structural damage to houses in the Kaiapoi
residential neighbourhoods was evident along Charles Street
paralleling the Kaiapoi River (Kaiapoi North) as well as along
Courtenay Drive, which parallels a branch of the Courtenay
Stream (east of Kaiapoi South) (Figure 5.14).
Kaiapoi North – Residential construction within the Kaiapoi
North community consists of 1-2 storey wood or concrete
block framed homes. A number of homes are also constructed
of brick or wood with brick façade units. The vintage of these
homes appeared to extend as early as 1960s construction, to
more recent completely rebuilt or remodelled homes. Uniform
settlement of the heavier brick constructed residential homes
in this area, such as shown in Figure 5.15, were measured as
large as 200-250 mm.
Brick homes consistently observed shear cracking,
discontinuities between window and door openings and brick,
popped out and/or damaged glass windows, and damage to
floor slabs and hardscape (Figure 5.16). Homes along Charles
Street at the time of the NZ-GEER team visit (11 September
2010) were either red or yellow tagged. Very few homes were
occupied, with most suffering extensive sand ejecta
surrounding the home as well as settlement. In a number of
cases, residents of severely damaged homes had moved out
completely (e.g. Figures 5.17-5.18). This house at Charles
Street experienced approximately 0.4 m of settlement along its
North face (Figure 5.17b). Sand ejecta were present
surrounding most homes along Charles Street and extending
east into the North Kaiapoi residential area approximately 0.5
km.
(a) (b)
Figure 5.13: Bridge Tavern adjacent to the Kaiapoi River. (a) view looking northwest at Williams Street bridge and (b) view
looking northwest at subterranean parking.
Figure 5.14: Kaiapoi North residential and small business region. Annotated GoogleEarth image.
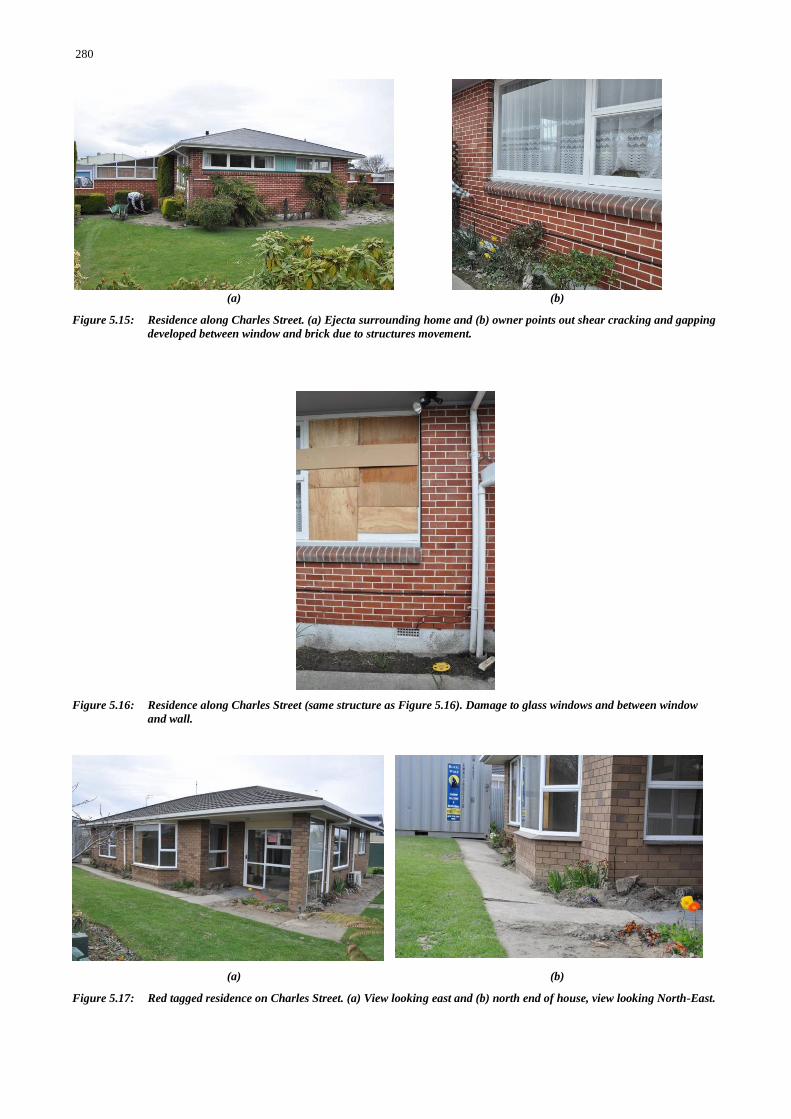
280
(a) (b)
Figure 5.15: Residence along Charles Street. (a) Ejecta surrounding home and (b) owner points out shear cracking and gapping
developed between window and brick due to structures movement.
Figure 5.16: Residence along Charles Street (same structure as Figure 5.16). Damage to glass windows and between window
and wall.
(a) (b)
Figure 5.17: Red tagged residence on Charles Street. (a) View looking east and (b) north end of house, view looking North-East.
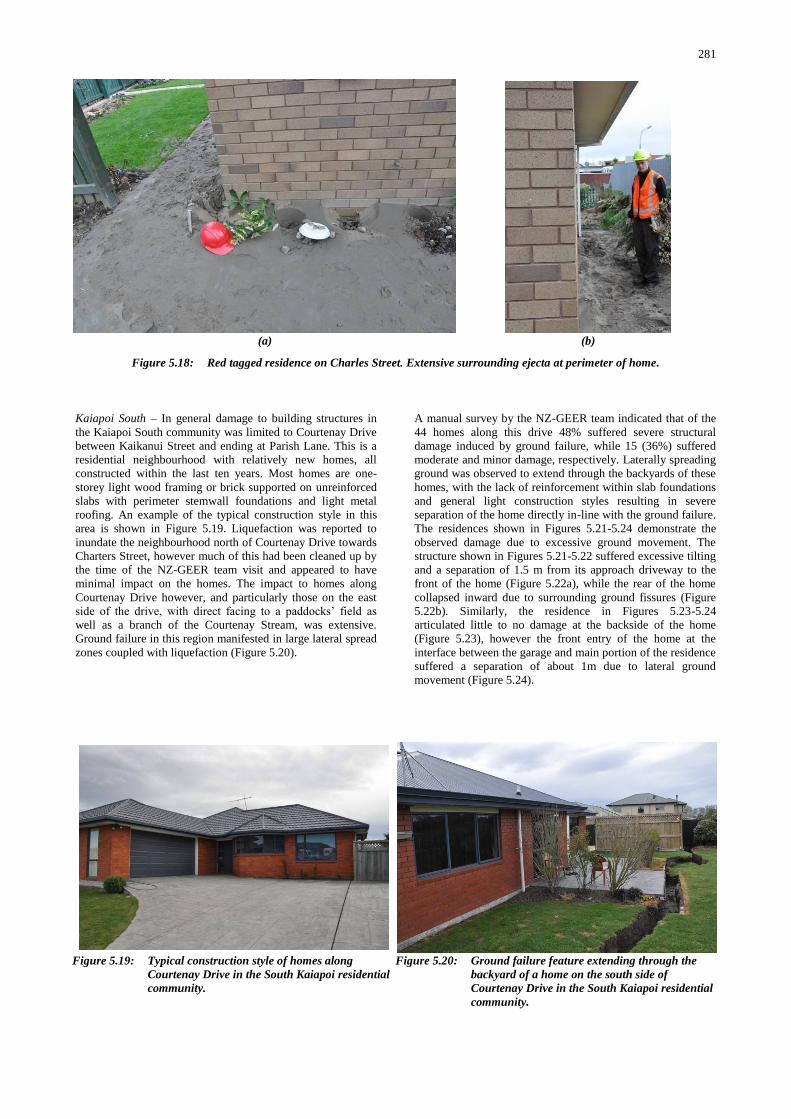
281
Kaiapoi South – In general damage to building structures in
the Kaiapoi South community was limited to Courtenay Drive
between Kaikanui Street and ending at Parish Lane. This is a
residential neighbourhood with relatively new homes, all
constructed within the last ten years. Most homes are one-
storey light wood framing or brick supported on unreinforced
slabs with perimeter stemwall foundations and light metal
roofing. An example of the typical construction style in this
area is shown in Figure 5.19. Liquefaction was reported to
inundate the neighbourhood north of Courtenay Drive towards
Charters Street, however much of this had been cleaned up by
the time of the NZ-GEER team visit and appeared to have
minimal impact on the homes. The impact to homes along
Courtenay Drive however, and particularly those on the east
side of the drive, with direct facing to a paddocks‟ field as
well as a branch of the Courtenay Stream, was extensive.
Ground failure in this region manifested in large lateral spread
zones coupled with liquefaction (Figure 5.20).
A manual survey by the NZ-GEER team indicated that of the
44 homes along this drive 48% suffered severe structural
damage induced by ground failure, while 15 (36%) suffered
moderate and minor damage, respectively. Laterally spreading
ground was observed to extend through the backyards of these
homes, with the lack of reinforcement within slab foundations
and general light construction styles resulting in severe
separation of the home directly in-line with the ground failure.
The residences shown in Figures 5.21-5.24 demonstrate the
observed damage due to excessive ground movement. The
structure shown in Figures 5.21-5.22 suffered excessive tilting
and a separation of 1.5 m from its approach driveway to the
front of the home (Figure 5.22a), while the rear of the home
collapsed inward due to surrounding ground fissures (Figure
5.22b). Similarly, the residence in Figures 5.23-5.24
articulated little to no damage at the backside of the home
(Figure 5.23), however the front entry of the home at the
interface between the garage and main portion of the residence
suffered a separation of about 1m due to lateral ground
movement (Figure 5.24).
(a) (b)
Figure 5.18: Red tagged residence on Charles Street. Extensive surrounding ejecta at perimeter of home.
Figure 5.19: Typical construction style of homes along
Courtenay Drive in the South Kaiapoi residential
community.
Figure 5.20: Ground failure feature extending through the
backyard of a home on the south side of
Courtenay Drive in the South Kaiapoi residential
community.
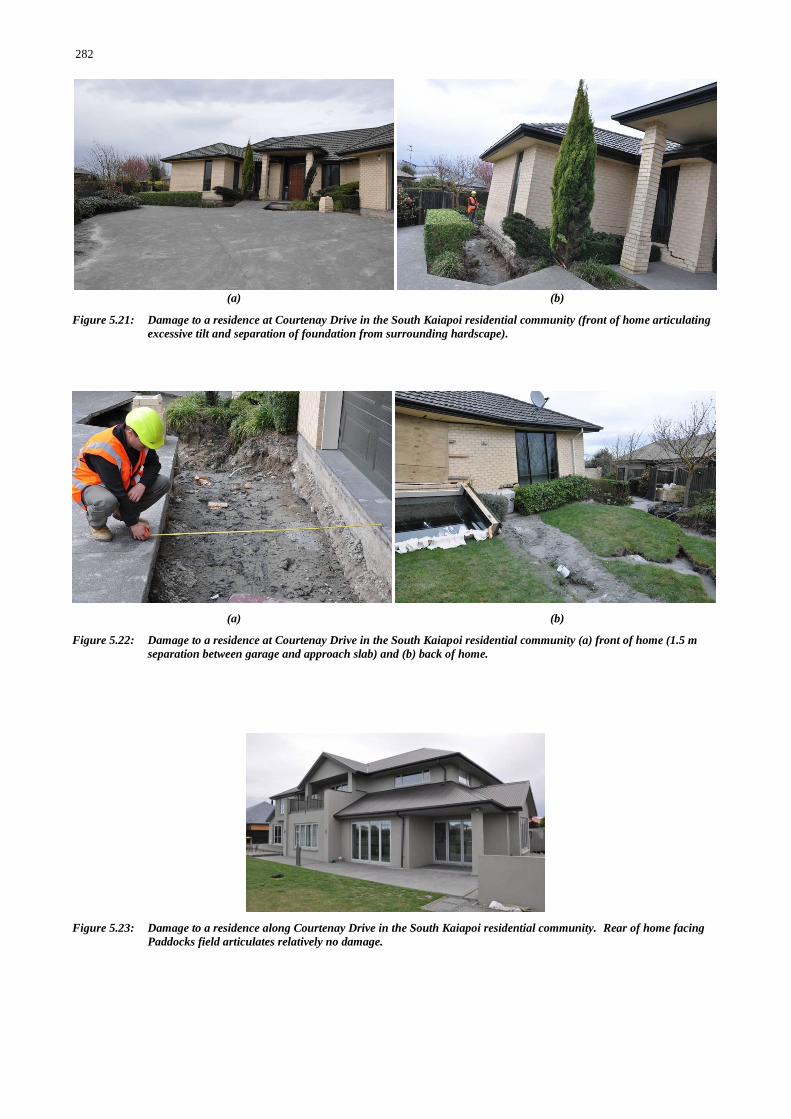
282
(a) (b)
Figure 5.21: Damage to a residence at Courtenay Drive in the South Kaiapoi residential community (front of home articulating
excessive tilt and separation of foundation from surrounding hardscape).
(a) (b)
Figure 5.22: Damage to a residence at Courtenay Drive in the South Kaiapoi residential community (a) front of home (1.5 m
separation between garage and approach slab) and (b) back of home.
Figure 5.23: Damage to a residence along Courtenay Drive in the South Kaiapoi residential community. Rear of home facing
Paddocks field articulates relatively no damage.
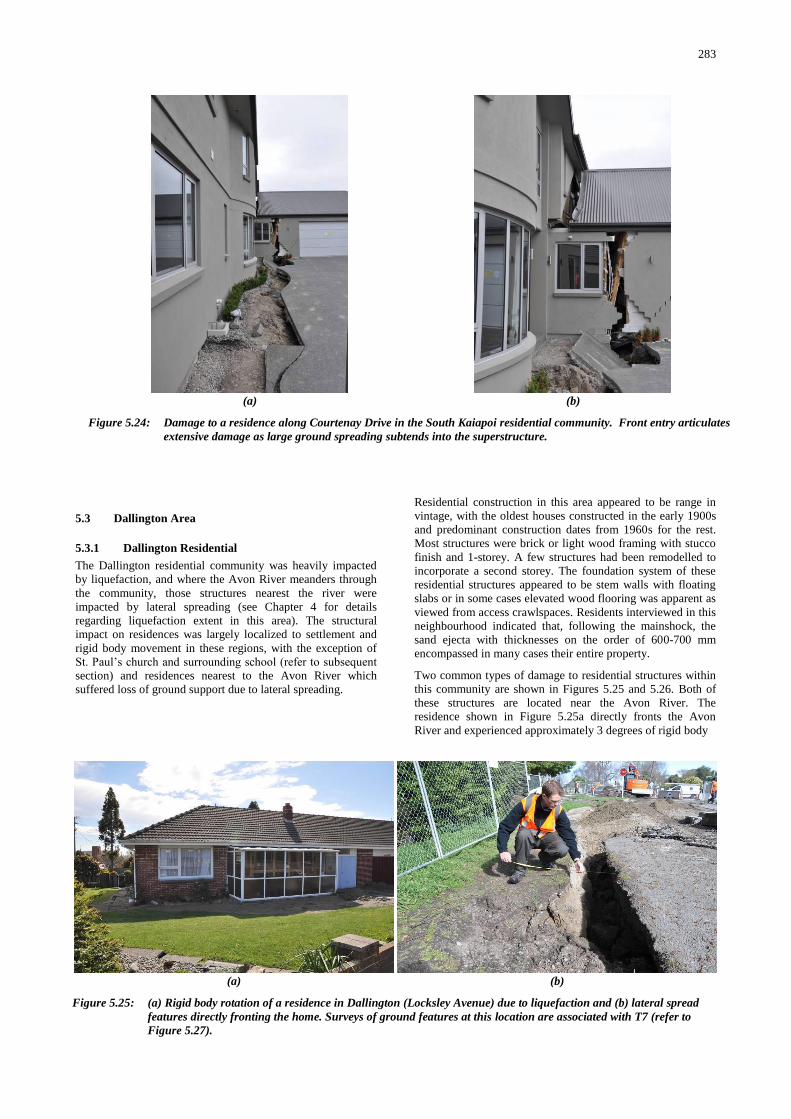
283
5.3 Dallington Area
5.3.1 Dallington Residential
The Dallington residential community was heavily impacted
by liquefaction, and where the Avon River meanders through
the community, those structures nearest the river were
impacted by lateral spreading (see Chapter 4 for details
regarding liquefaction extent in this area). The structural
impact on residences was largely localized to settlement and
rigid body movement in these regions, with the exception of
St. Paul‟s church and surrounding school (refer to subsequent
section) and residences nearest to the Avon River which
suffered loss of ground support due to lateral spreading.
Residential construction in this area appeared to be range in
vintage, with the oldest houses constructed in the early 1900s
and predominant construction dates from 1960s for the rest.
Most structures were brick or light wood framing with stucco
finish and 1-storey. A few structures had been remodelled to
incorporate a second storey. The foundation system of these
residential structures appeared to be stem walls with floating
slabs or in some cases elevated wood flooring was apparent as
viewed from access crawlspaces. Residents interviewed in this
neighbourhood indicated that, following the mainshock, the
sand ejecta with thicknesses on the order of 600-700 mm
encompassed in many cases their entire property.
Two common types of damage to residential structures within
this community are shown in Figures 5.25 and 5.26. Both of
these structures are located near the Avon River. The
residence shown in Figure 5.25a directly fronts the Avon
River and experienced approximately 3 degrees of rigid body
(a) (b)
Figure 5.24: Damage to a residence along Courtenay Drive in the South Kaiapoi residential community. Front entry articulates
extensive damage as large ground spreading subtends into the superstructure.
(a) (b)
Figure 5.25: (a) Rigid body rotation of a residence in Dallington (Locksley Avenue) due to liquefaction and (b) lateral spread
features directly fronting the home. Surveys of ground features at this location are associated with T7 (refer to
Figure 5.27).
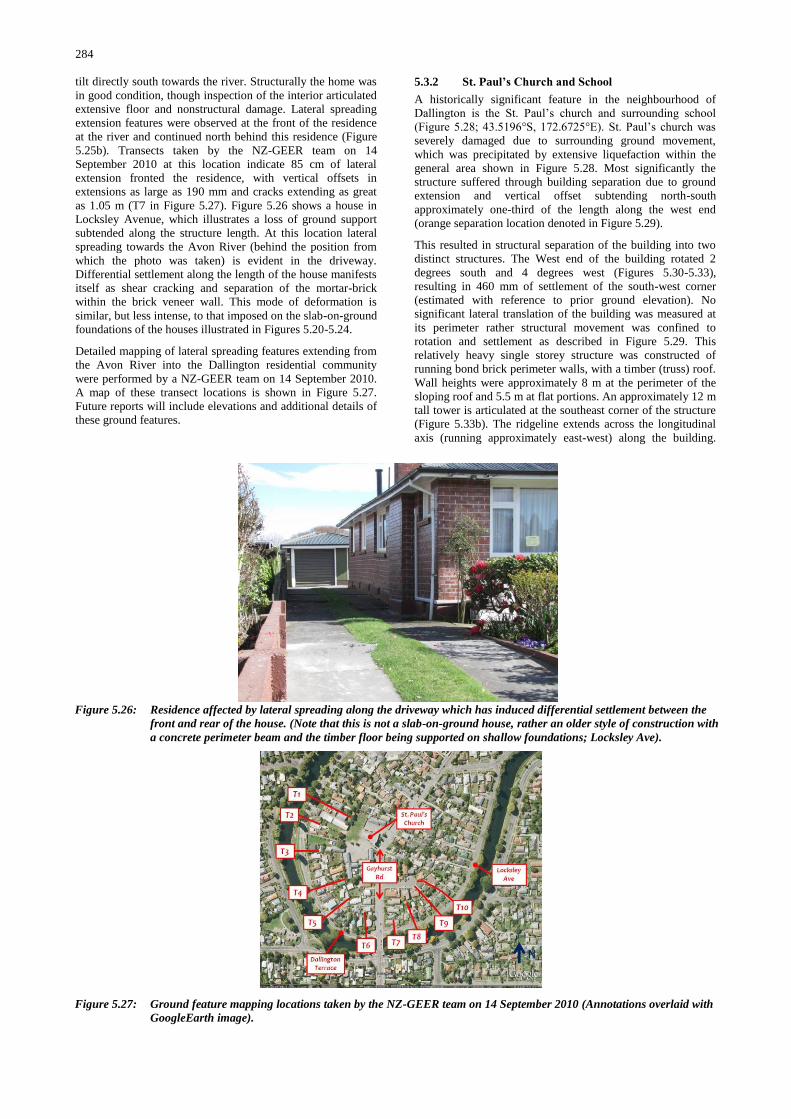
284
tilt directly south towards the river. Structurally the home was
in good condition, though inspection of the interior articulated
extensive floor and nonstructural damage. Lateral spreading
extension features were observed at the front of the residence
at the river and continued north behind this residence (Figure
5.25b). Transects taken by the NZ-GEER team on 14
September 2010 at this location indicate 85 cm of lateral
extension fronted the residence, with vertical offsets in
extensions as large as 190 mm and cracks extending as great
as 1.05 m (T7 in Figure 5.27). Figure 5.26 shows a house in
Locksley Avenue, which illustrates a loss of ground support
subtended along the structure length. At this location lateral
spreading towards the Avon River (behind the position from
which the photo was taken) is evident in the driveway.
Differential settlement along the length of the house manifests
itself as shear cracking and separation of the mortar-brick
within the brick veneer wall. This mode of deformation is
similar, but less intense, to that imposed on the slab-on-ground
foundations of the houses illustrated in Figures 5.20-5.24.
Detailed mapping of lateral spreading features extending from
the Avon River into the Dallington residential community
were performed by a NZ-GEER team on 14 September 2010.
A map of these transect locations is shown in Figure 5.27.
Future reports will include elevations and additional details of
these ground features.
5.3.2 St. Paul’s Church and School
A historically significant feature in the neighbourhood of
Dallington is the St. Paul‟s church and surrounding school
(Figure 5.28; 43.5196°S, 172.6725°E). St. Paul‟s church was
severely damaged due to surrounding ground movement,
which was precipitated by extensive liquefaction within the
general area shown in Figure 5.28. Most significantly the
structure suffered through building separation due to ground
extension and vertical offset subtending north-south
approximately one-third of the length along the west end
(orange separation location denoted in Figure 5.29).
This resulted in structural separation of the building into two
distinct structures. The West end of the building rotated 2
degrees south and 4 degrees west (Figures 5.30-5.33),
resulting in 460 mm of settlement of the south-west corner
(estimated with reference to prior ground elevation). No
significant lateral translation of the building was measured at
its perimeter rather structural movement was confined to
rotation and settlement as described in Figure 5.29. This
relatively heavy single storey structure was constructed of
running bond brick perimeter walls, with a timber (truss) roof.
Wall heights were approximately 8 m at the perimeter of the
sloping roof and 5.5 m at flat portions. An approximately 12 m
tall tower is articulated at the southeast corner of the structure
(Figure 5.33b). The ridgeline extends across the longitudinal
axis (running approximately east-west) along the building.
Figure 5.26: Residence affected by lateral spreading along the driveway which has induced differential settlement between the
front and rear of the house. (Note that this is not a slab-on-ground house, rather an older style of construction with
a concrete perimeter beam and the timber floor being supported on shallow foundations; Locksley Ave).
Figure 5.27: Ground feature mapping locations taken by the NZ-GEER team on 14 September 2010 (Annotations overlaid with
GoogleEarth image).
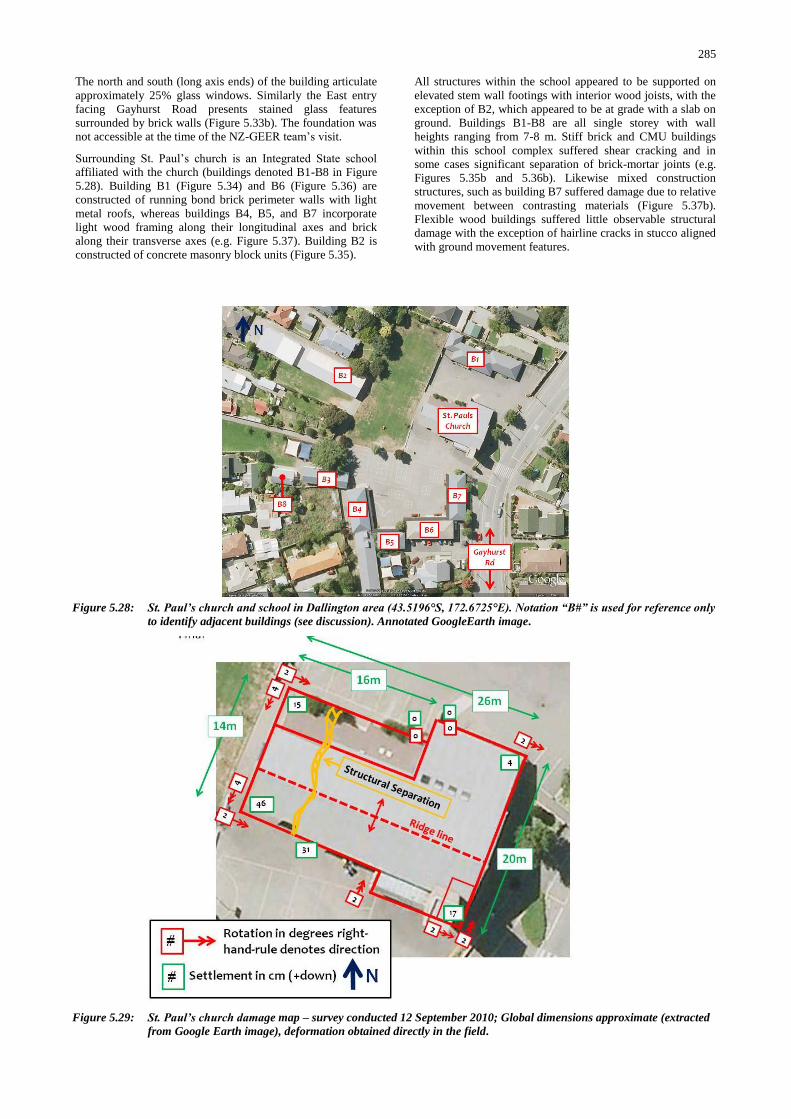
285
The north and south (long axis ends) of the building articulate
approximately 25% glass windows. Similarly the East entry
facing Gayhurst Road presents stained glass features
surrounded by brick walls (Figure 5.33b). The foundation was
not accessible at the time of the NZ-GEER team‟s visit.
Surrounding St. Paul‟s church is an Integrated State school
affiliated with the church (buildings denoted B1-B8 in Figure
5.28). Building B1 (Figure 5.34) and B6 (Figure 5.36) are
constructed of running bond brick perimeter walls with light
metal roofs, whereas buildings B4, B5, and B7 incorporate
light wood framing along their longitudinal axes and brick
along their transverse axes (e.g. Figure 5.37). Building B2 is
constructed of concrete masonry block units (Figure 5.35).
All structures within the school appeared to be supported on
elevated stem wall footings with interior wood joists, with the
exception of B2, which appeared to be at grade with a slab on
ground. Buildings B1-B8 are all single storey with wall
heights ranging from 7-8 m. Stiff brick and CMU buildings
within this school complex suffered shear cracking and in
some cases significant separation of brick-mortar joints (e.g.
Figures 5.35b and 5.36b). Likewise mixed construction
structures, such as building B7 suffered damage due to relative
movement between contrasting materials (Figure 5.37b).
Flexible wood buildings suffered little observable structural
damage with the exception of hairline cracks in stucco aligned
with ground movement features.
Figure 5.28: St. Paul’s church and school in Dallington area (43.5196°S, 172.6725°E). Notation “B#” is used for reference only
to identify adjacent buildings (see discussion). Annotated GoogleEarth image.
Figure 5.29: St. Paul’s church damage map – survey conducted 12 September 2010; Global dimensions approximate (extracted
from Google Earth image), deformation obtained directly in the field.
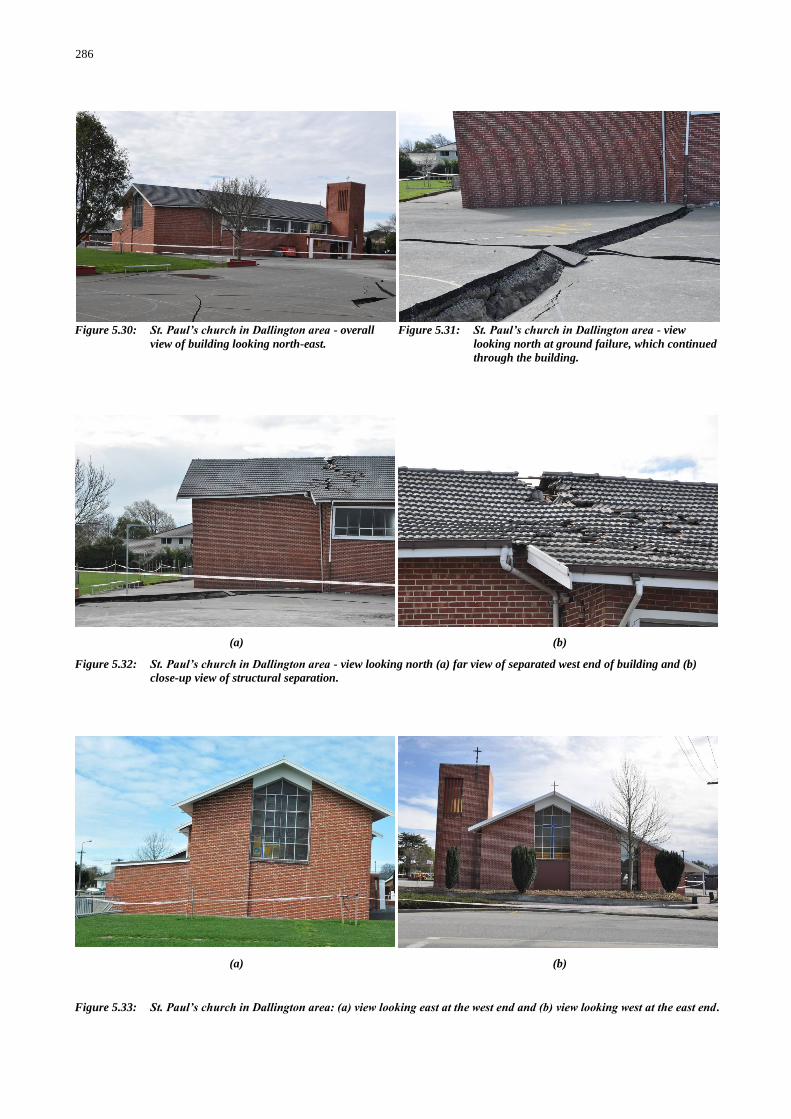
286
Figure 5.30: St. Paul’s church in Dallington area - overall
view of building looking north-east.
Figure 5.31: St. Paul’s church in Dallington area - view
looking north at ground failure, which continued
through the building.
(a) (b)
Figure 5.32: St. Paul’s church in Dallington area - view looking north (a) far view of separated west end of building and (b)
close-up view of structural separation.
(a) (b)
Figure 5.33: St. Paul’s church in Dallington area: (a) view looking east at the west end and (b) view looking west at the east end.
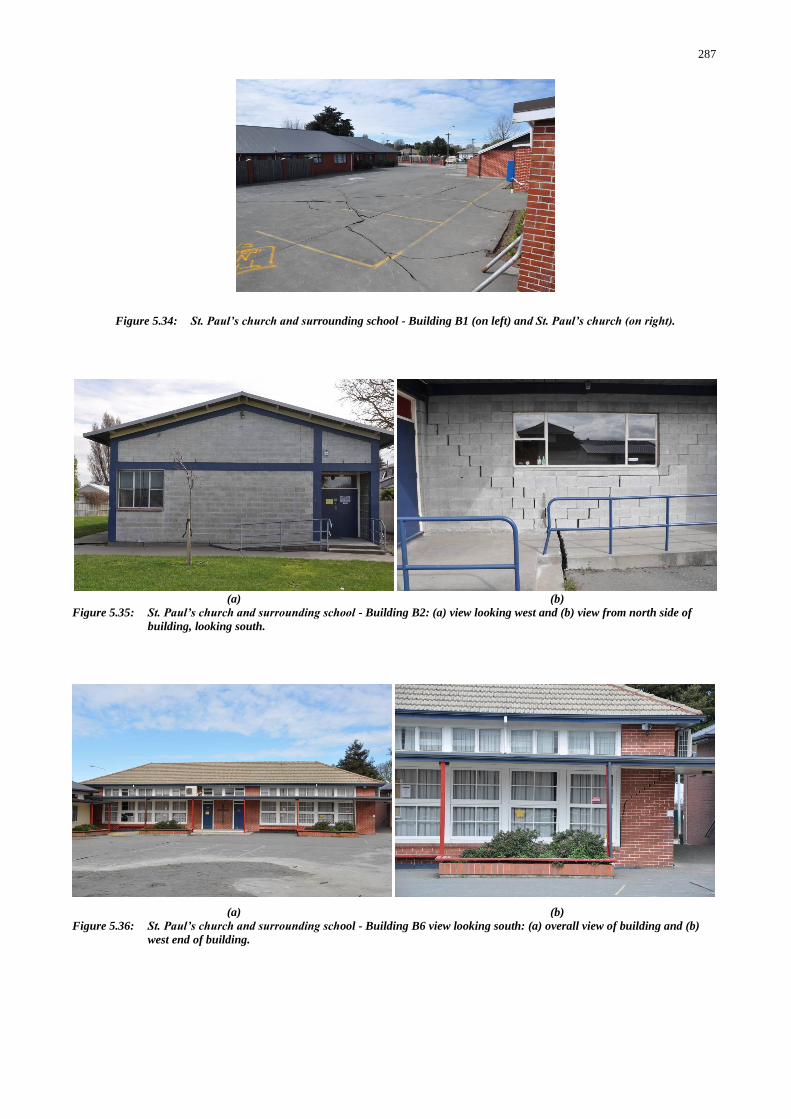
287
Figure 5.34: St. Paul’s church and surrounding school - Building B1 (on left) and St. Paul’s church (on right).
(a) (b)
Figure 5.35: St. Paul’s church and surrounding school - Building B2: (a) view looking west and (b) view from north side of
building, looking south.
(a) (b)
Figure 5.36: St. Paul’s church and surrounding school - Building B6 view looking south: (a) overall view of building and (b)
west end of building.
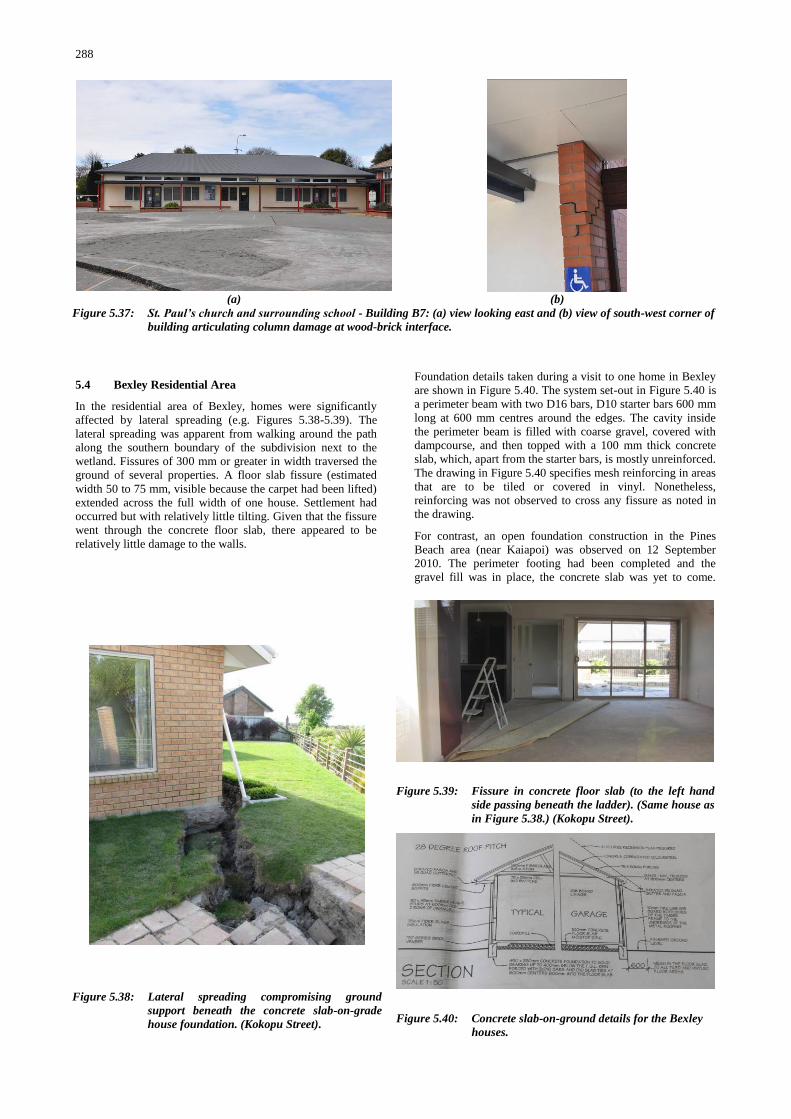
288
5.4 Bexley Residential Area
In the residential area of Bexley, homes were significantly
affected by lateral spreading (e.g. Figures 5.38-5.39). The
lateral spreading was apparent from walking around the path
along the southern boundary of the subdivision next to the
wetland. Fissures of 300 mm or greater in width traversed the
ground of several properties. A floor slab fissure (estimated
width 50 to 75 mm, visible because the carpet had been lifted)
extended across the full width of one house. Settlement had
occurred but with relatively little tilting. Given that the fissure
went through the concrete floor slab, there appeared to be
relatively little damage to the walls.
Foundation details taken during a visit to one home in Bexley
are shown in Figure 5.40. The system set-out in Figure 5.40 is
a perimeter beam with two D16 bars, D10 starter bars 600 mm
long at 600 mm centres around the edges. The cavity inside
the perimeter beam is filled with coarse gravel, covered with
dampcourse, and then topped with a 100 mm thick concrete
slab, which, apart from the starter bars, is mostly unreinforced.
The drawing in Figure 5.40 specifies mesh reinforcing in areas
that are to be tiled or covered in vinyl. Nonetheless,
reinforcing was not observed to cross any fissure as noted in
the drawing.
For contrast, an open foundation construction in the Pines
Beach area (near Kaiapoi) was observed on 12 September
2010. The perimeter footing had been completed and the
gravel fill was in place, the concrete slab was yet to come.
(a) (b)
Figure 5.37: St. Paul’s church and surrounding school - Building B7: (a) view looking east and (b) view of south-west corner of
building articulating column damage at wood-brick interface.
Figure 5.39: Fissure in concrete floor slab (to the left hand
side passing beneath the ladder). (Same house as
in Figure 5.38.) (Kokopu Street).
Figure 5.38: Lateral spreading compromising ground
support beneath the concrete slab-on-grade
house foundation. (Kokopu Street).
Figure 5.40: Concrete slab-on-ground details for the Bexley
houses.
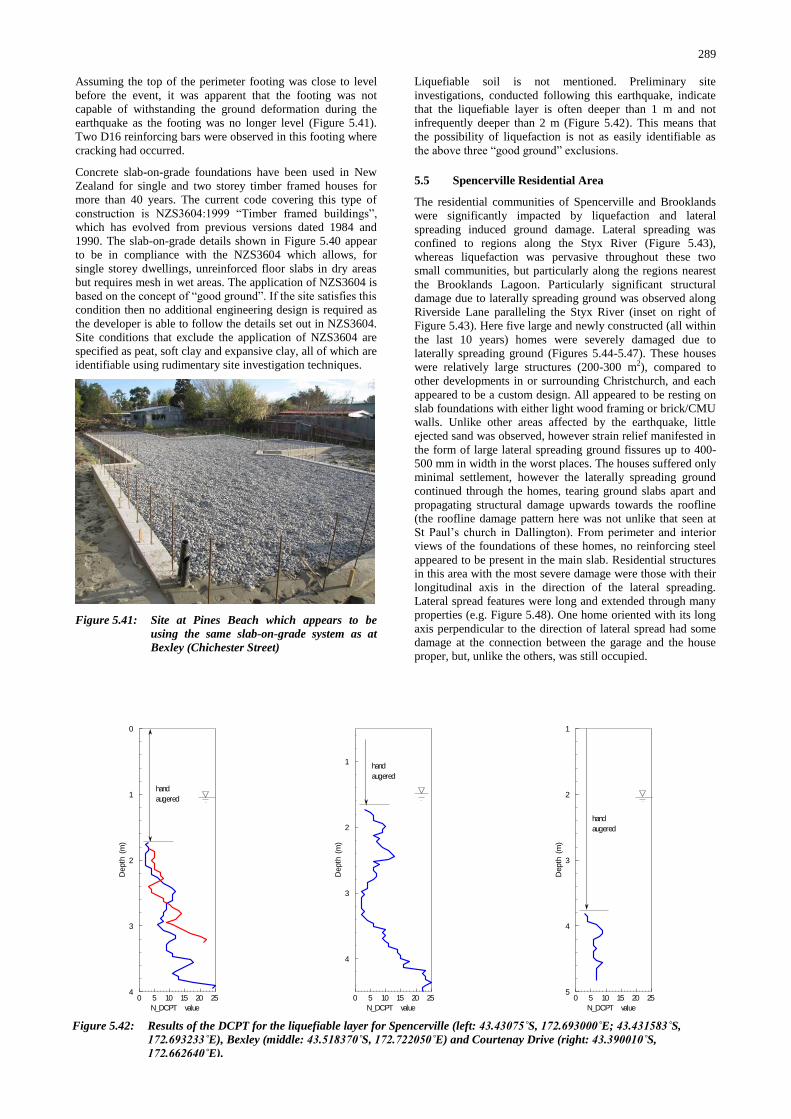
289
Assuming the top of the perimeter footing was close to level
before the event, it was apparent that the footing was not
capable of withstanding the ground deformation during the
earthquake as the footing was no longer level (Figure 5.41).
Two D16 reinforcing bars were observed in this footing where
cracking had occurred.
Concrete slab-on-grade foundations have been used in New
Zealand for single and two storey timber framed houses for
more than 40 years. The current code covering this type of
construction is NZS3604:1999 “Timber framed buildings”,
which has evolved from previous versions dated 1984 and
1990. The slab-on-grade details shown in Figure 5.40 appear
to be in compliance with the NZS3604 which allows, for
single storey dwellings, unreinforced floor slabs in dry areas
but requires mesh in wet areas. The application of NZS3604 is
based on the concept of “good ground”. If the site satisfies this
condition then no additional engineering design is required as
the developer is able to follow the details set out in NZS3604.
Site conditions that exclude the application of NZS3604 are
specified as peat, soft clay and expansive clay, all of which are
identifiable using rudimentary site investigation techniques.
Figure 5.41: Site at Pines Beach which appears to be
using the same slab-on-grade system as at
Bexley (Chichester Street)
Liquefiable soil is not mentioned. Preliminary site
investigations, conducted following this earthquake, indicate
that the liquefiable layer is often deeper than 1 m and not
infrequently deeper than 2 m (Figure 5.42). This means that
the possibility of liquefaction is not as easily identifiable as
the above three “good ground” exclusions.
5.5 Spencerville Residential Area
The residential communities of Spencerville and Brooklands
were significantly impacted by liquefaction and lateral
spreading induced ground damage. Lateral spreading was
confined to regions along the Styx River (Figure 5.43),
whereas liquefaction was pervasive throughout these two
small communities, but particularly along the regions nearest
the Brooklands Lagoon. Particularly significant structural
damage due to laterally spreading ground was observed along
Riverside Lane paralleling the Styx River (inset on right of
Figure 5.43). Here five large and newly constructed (all within
the last 10 years) homes were severely damaged due to
laterally spreading ground (Figures 5.44-5.47). These houses
were relatively large structures (200-300 m2), compared to
other developments in or surrounding Christchurch, and each
appeared to be a custom design. All appeared to be resting on
slab foundations with either light wood framing or brick/CMU
walls. Unlike other areas affected by the earthquake, little
ejected sand was observed, however strain relief manifested in
the form of large lateral spreading ground fissures up to 400-
500 mm in width in the worst places. The houses suffered only
minimal settlement, however the laterally spreading ground
continued through the homes, tearing ground slabs apart and
propagating structural damage upwards towards the roofline
(the roofline damage pattern here was not unlike that seen at
St Paul‟s church in Dallington). From perimeter and interior
views of the foundations of these homes, no reinforcing steel
appeared to be present in the main slab. Residential structures
in this area with the most severe damage were those with their
longitudinal axis in the direction of the lateral spreading.
Lateral spread features were long and extended through many
properties (e.g. Figure 5.48). One home oriented with its long
axis perpendicular to the direction of lateral spread had some
damage at the connection between the garage and the house
proper, but, unlike the others, was still occupied.
0 5 10 15 20 25
0
1
2
3
4
N_DCPT value
Depth
(m)
hand
augered
0 5 10 15 20 25
1
2
3
4
N_DCPT value
Depth
(m)
hand
augered
0 5 10 15 20 25
1
2
3
4
5
N_DCPT value
Depth
(m)
hand
augered
Figure 5.42: Results of the DCPT for the liquefiable layer for Spencerville (left: 43.43075˚S, 172.693000˚E; 43.431583˚S,
172.693233˚E), Bexley (middle: 43.518370˚S, 172.722050˚E) and Courtenay Drive (right: 43.390010˚S,
172.662640˚E).
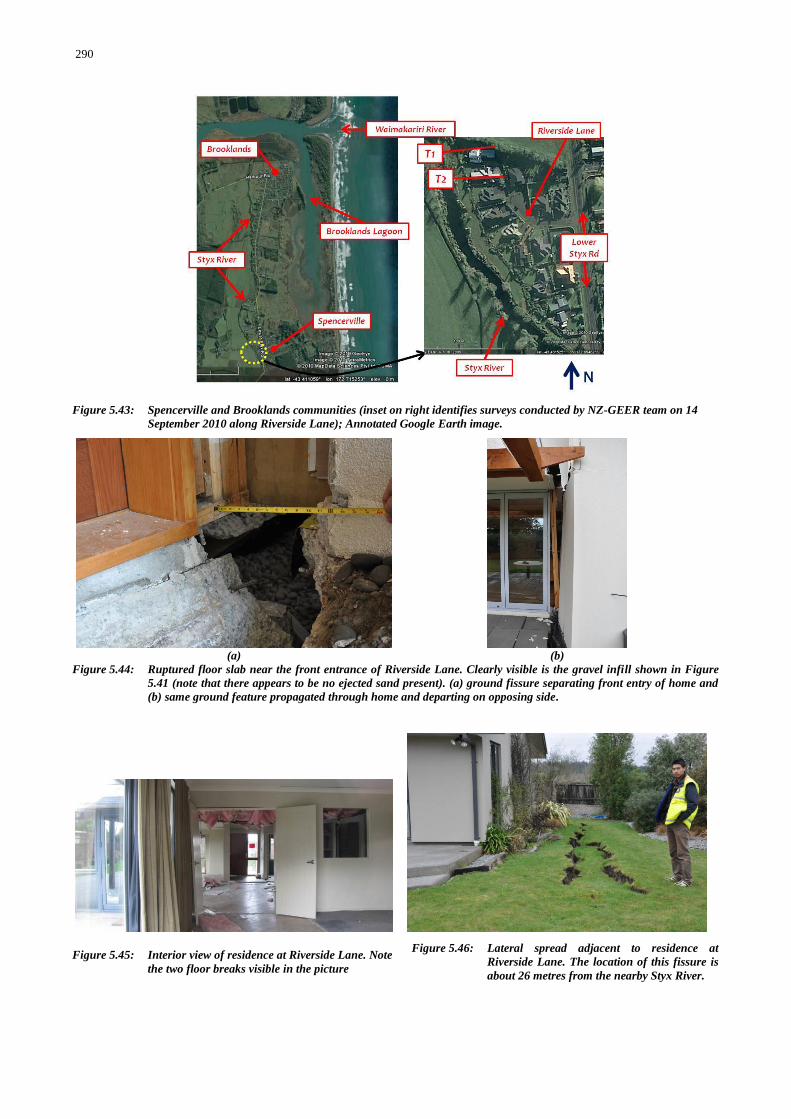
290
Figure 5.43: Spencerville and Brooklands communities (inset on right identifies surveys conducted by NZ-GEER team on 14
September 2010 along Riverside Lane); Annotated Google Earth image.
(a) (b)
Figure 5.44: Ruptured floor slab near the front entrance of Riverside Lane. Clearly visible is the gravel infill shown in Figure
5.41 (note that there appears to be no ejected sand present). (a) ground fissure separating front entry of home and
(b) same ground feature propagated through home and departing on opposing side.
Figure 5.45: Interior view of residence at Riverside Lane. Note
the two floor breaks visible in the picture
Figure 5.46: Lateral spread adjacent to residence at
Riverside Lane. The location of this fissure is
about 26 metres from the nearby Styx River.
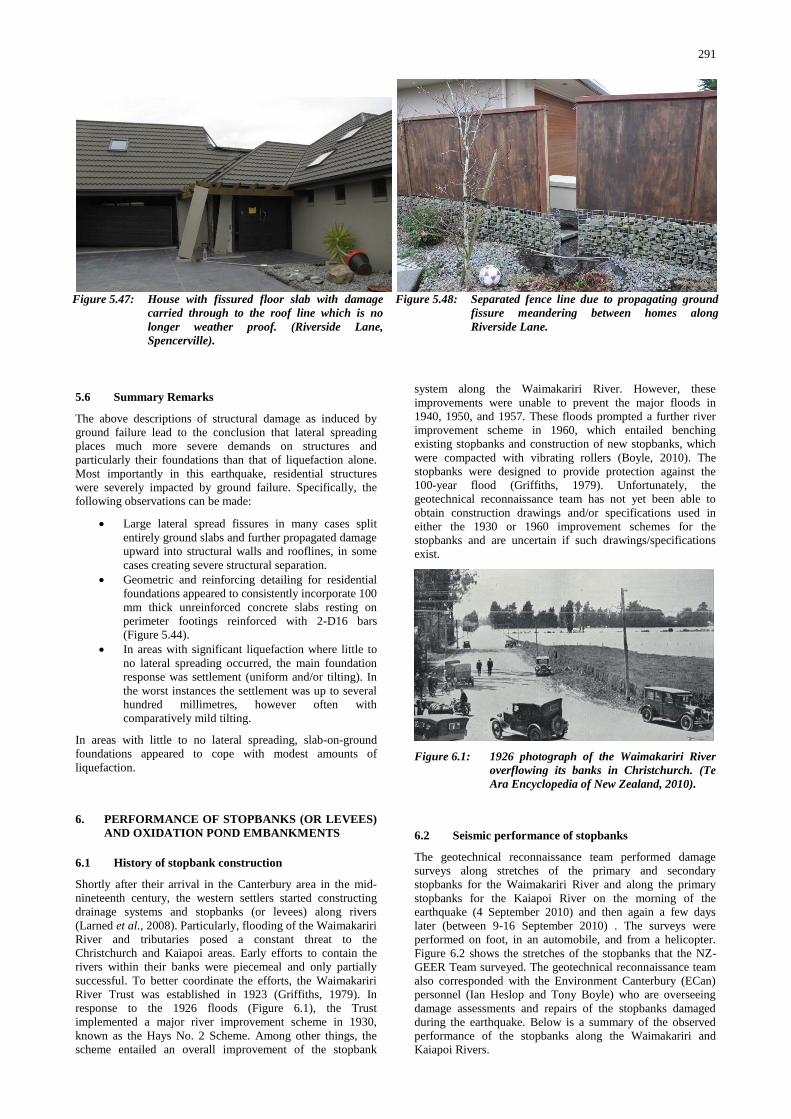
291
5.6 Summary Remarks
The above descriptions of structural damage as induced by
ground failure lead to the conclusion that lateral spreading
places much more severe demands on structures and
particularly their foundations than that of liquefaction alone.
Most importantly in this earthquake, residential structures
were severely impacted by ground failure. Specifically, the
following observations can be made:
Large lateral spread fissures in many cases split
entirely ground slabs and further propagated damage
upward into structural walls and rooflines, in some
cases creating severe structural separation.
Geometric and reinforcing detailing for residential
foundations appeared to consistently incorporate 100
mm thick unreinforced concrete slabs resting on
perimeter footings reinforced with 2-D16 bars
(Figure 5.44).
In areas with significant liquefaction where little to
no lateral spreading occurred, the main foundation
response was settlement (uniform and/or tilting). In
the worst instances the settlement was up to several
hundred millimetres, however often with
comparatively mild tilting.
In areas with little to no lateral spreading, slab-on-ground
foundations appeared to cope with modest amounts of
liquefaction.
6. PERFORMANCE OF STOPBANKS (OR LEVEES)
AND OXIDATION POND EMBANKMENTS
6.1 History of stopbank construction
Shortly after their arrival in the Canterbury area in the mid-
nineteenth century, the western settlers started constructing
drainage systems and stopbanks (or levees) along rivers
(Larned et al., 2008). Particularly, flooding of the Waimakariri
River and tributaries posed a constant threat to the
Christchurch and Kaiapoi areas. Early efforts to contain the
rivers within their banks were piecemeal and only partially
successful. To better coordinate the efforts, the Waimakariri
River Trust was established in 1923 (Griffiths, 1979). In
response to the 1926 floods (Figure 6.1), the Trust
implemented a major river improvement scheme in 1930,
known as the Hays No. 2 Scheme. Among other things, the
scheme entailed an overall improvement of the stopbank
system along the Waimakariri River. However, these
improvements were unable to prevent the major floods in
1940, 1950, and 1957. These floods prompted a further river
improvement scheme in 1960, which entailed benching
existing stopbanks and construction of new stopbanks, which
were compacted with vibrating rollers (Boyle, 2010). The
stopbanks were designed to provide protection against the
100-year flood (Griffiths, 1979). Unfortunately, the
geotechnical reconnaissance team has not yet been able to
obtain construction drawings and/or specifications used in
either the 1930 or 1960 improvement schemes for the
stopbanks and are uncertain if such drawings/specifications
exist.
Figure 6.1: 1926 photograph of the Waimakariri River
overflowing its banks in Christchurch. (Te
Ara Encyclopedia of New Zealand, 2010).
6.2 Seismic performance of stopbanks
The geotechnical reconnaissance team performed damage
surveys along stretches of the primary and secondary
stopbanks for the Waimakariri River and along the primary
stopbanks for the Kaiapoi River on the morning of the
earthquake (4 September 2010) and then again a few days
later (between 9-16 September 2010) . The surveys were
performed on foot, in an automobile, and from a helicopter.
Figure 6.2 shows the stretches of the stopbanks that the NZ-
GEER Team surveyed. The geotechnical reconnaissance team
also corresponded with the Environment Canterbury (ECan)
personnel (Ian Heslop and Tony Boyle) who are overseeing
damage assessments and repairs of the stopbanks damaged
during the earthquake. Below is a summary of the observed
performance of the stopbanks along the Waimakariri and
Kaiapoi Rivers.
Figure 5.47: House with fissured floor slab with damage
carried through to the roof line which is no
longer weather proof. (Riverside Lane,
Spencerville).
Figure 5.48: Separated fence line due to propagating ground
fissure meandering between homes along
Riverside Lane.
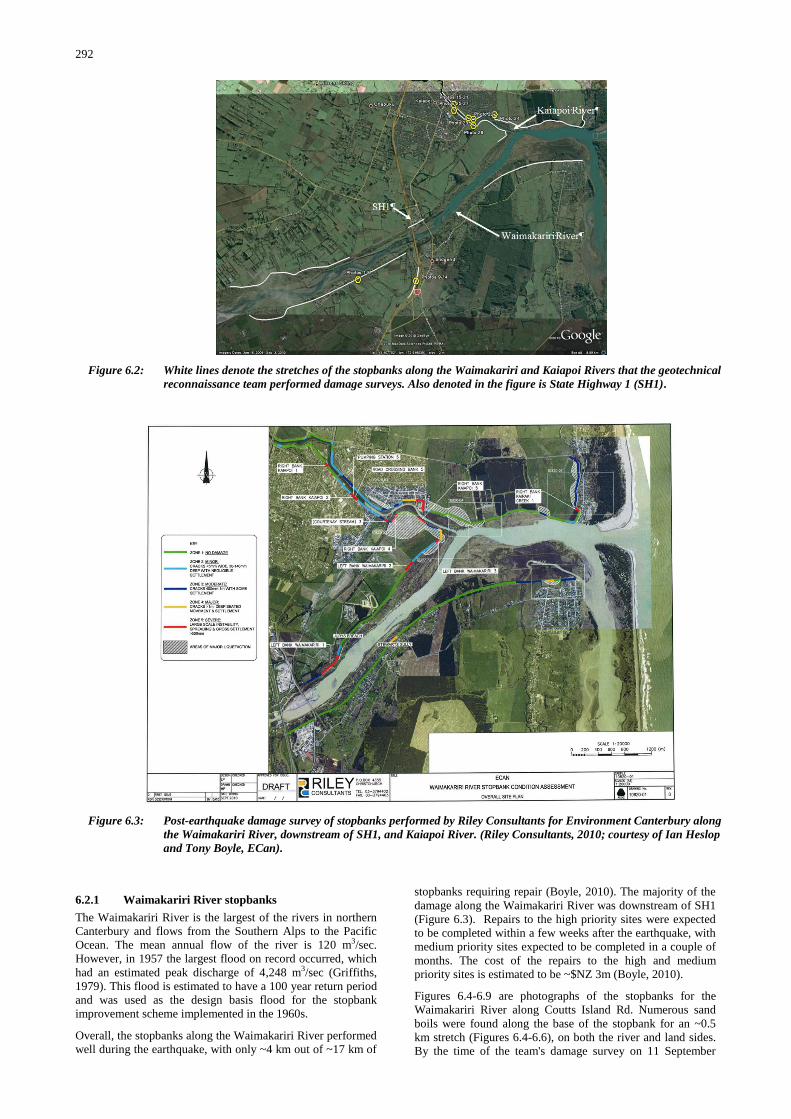
292
6.2.1 Waimakariri River stopbanks
The Waimakariri River is the largest of the rivers in northern
Canterbury and flows from the Southern Alps to the Pacific
Ocean. The mean annual flow of the river is 120 m3/sec.
However, in 1957 the largest flood on record occurred, which
had an estimated peak discharge of 4,248 m3/sec (Griffiths,
1979). This flood is estimated to have a 100 year return period
and was used as the design basis flood for the stopbank
improvement scheme implemented in the 1960s.
Overall, the stopbanks along the Waimakariri River performed
well during the earthquake, with only ~4 km out of ~17 km of
stopbanks requiring repair (Boyle, 2010). The majority of the
damage along the Waimakariri River was downstream of SH1
(Figure 6.3). Repairs to the high priority sites were expected
to be completed within a few weeks after the earthquake, with
medium priority sites expected to be completed in a couple of
months. The cost of the repairs to the high and medium
priority sites is estimated to be ~$NZ 3m (Boyle, 2010).
Figures 6.4-6.9 are photographs of the stopbanks for the
Waimakariri River along Coutts Island Rd. Numerous sand
boils were found along the base of the stopbank for an ~0.5
km stretch (Figures 6.4-6.6), on both the river and land sides.
By the time of the team's damage survey on 11 September
Figure 6.2: White lines denote the stretches of the stopbanks along the Waimakariri and Kaiapoi Rivers that the geotechnical
reconnaissance team performed damage surveys. Also denoted in the figure is State Highway 1 (SH1).
Figure 6.3: Post-earthquake damage survey of stopbanks performed by Riley Consultants for Environment Canterbury along
the Waimakariri River, downstream of SH1, and Kaiapoi River. (Riley Consultants, 2010; courtesy of Ian Heslop
and Tony Boyle, ECan).
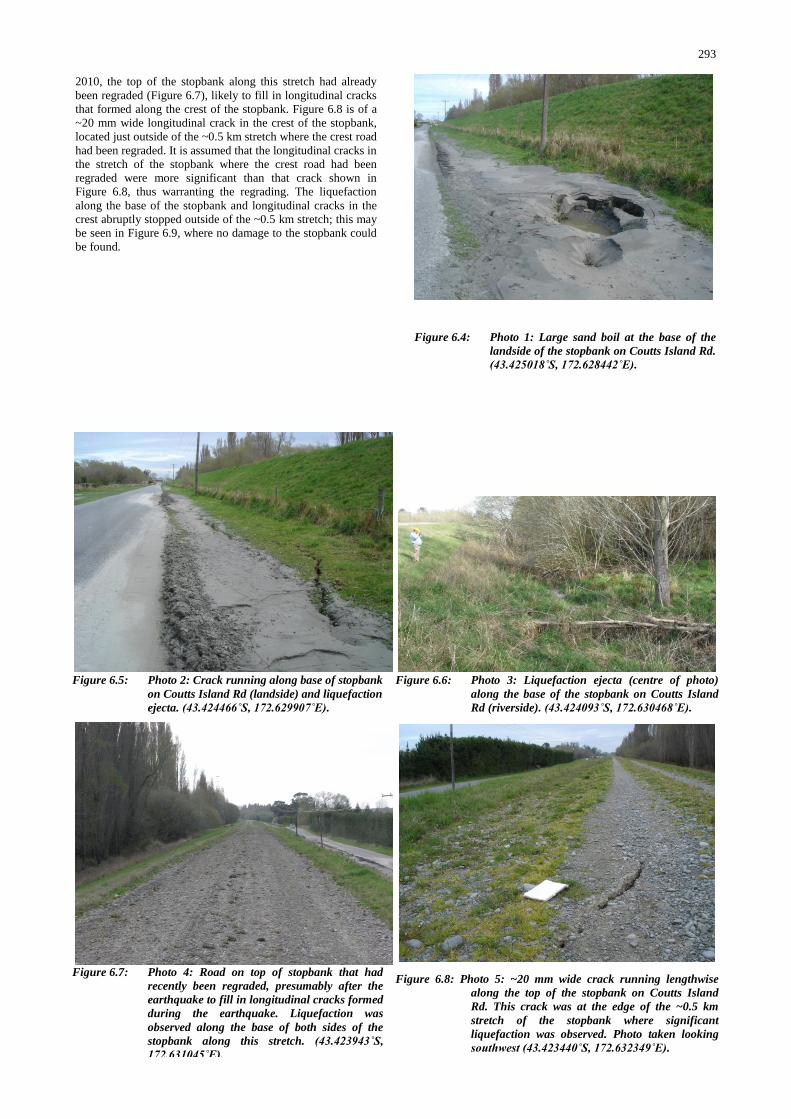
293
2010, the top of the stopbank along this stretch had already
been regraded (Figure 6.7), likely to fill in longitudinal cracks
that formed along the crest of the stopbank. Figure 6.8 is of a
~20 mm wide longitudinal crack in the crest of the stopbank,
located just outside of the ~0.5 km stretch where the crest road
had been regraded. It is assumed that the longitudinal cracks in
the stretch of the stopbank where the crest road had been
regraded were more significant than that crack shown in
Figure 6.8, thus warranting the regrading. The liquefaction
along the base of the stopbank and longitudinal cracks in the
crest abruptly stopped outside of the ~0.5 km stretch; this may
be seen in Figure 6.9, where no damage to the stopbank could
be found.
Figure 6.4: Photo 1: Large sand boil at the base of the
landside of the stopbank on Coutts Island Rd.
(43.425018˚S, 172.628442˚E).
Figure 6.5: Photo 2: Crack running along base of stopbank
on Coutts Island Rd (landside) and liquefaction
ejecta. (43.424466˚S, 172.629907˚E).
Figure 6.6: Photo 3: Liquefaction ejecta (centre of photo)
along the base of the stopbank on Coutts Island
Rd (riverside). (43.424093˚S, 172.630468˚E).
Figure 6.7: Photo 4: Road on top of stopbank that had
recently been regraded, presumably after the
earthquake to fill in longitudinal cracks formed
during the earthquake. Liquefaction was
observed along the base of both sides of the
stopbank along this stretch. (43.423943˚S,
172.631045˚E).
Figure 6.8: Photo 5: ~20 mm wide crack running lengthwise
along the top of the stopbank on Coutts Island
Rd. This crack was at the edge of the ~0.5 km
stretch of the stopbank where significant
liquefaction was observed. Photo taken looking
southwest (43.423440˚S, 172.632349˚E).
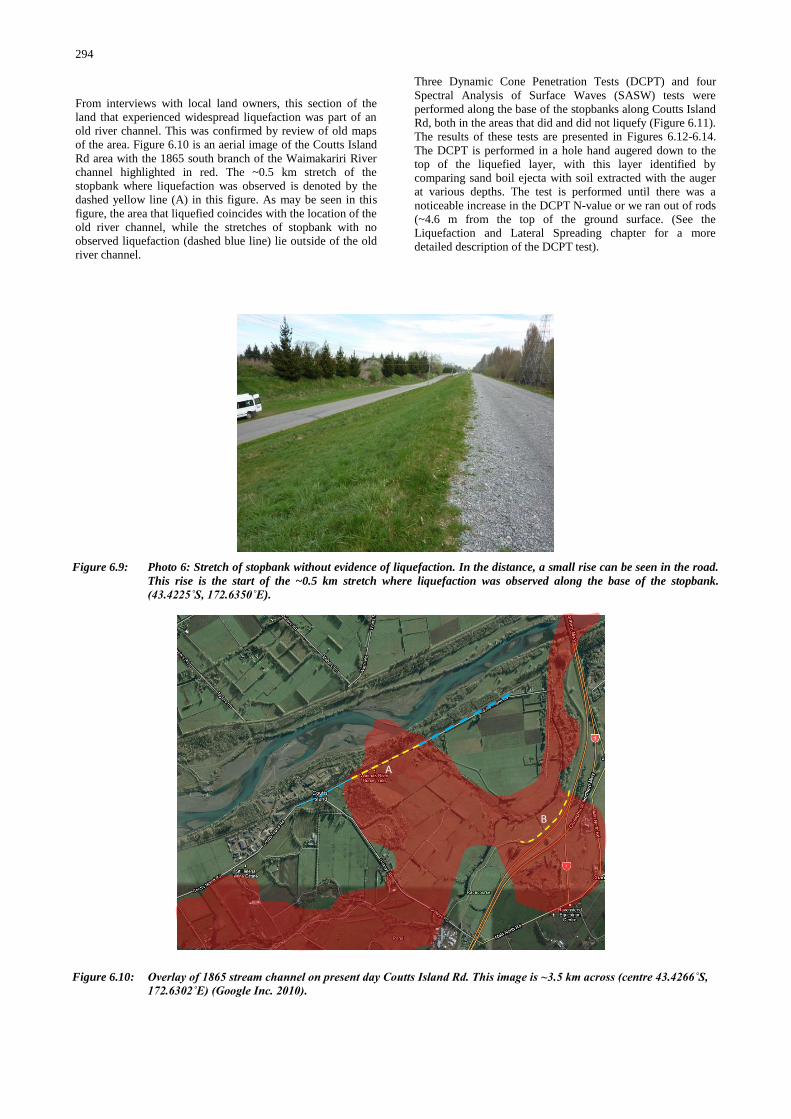
294
From interviews with local land owners, this section of the
land that experienced widespread liquefaction was part of an
old river channel. This was confirmed by review of old maps
of the area. Figure 6.10 is an aerial image of the Coutts Island
Rd area with the 1865 south branch of the Waimakariri River
channel highlighted in red. The ~0.5 km stretch of the
stopbank where liquefaction was observed is denoted by the
dashed yellow line (A) in this figure. As may be seen in this
figure, the area that liquefied coincides with the location of the
old river channel, while the stretches of stopbank with no
observed liquefaction (dashed blue line) lie outside of the old
river channel.
Three Dynamic Cone Penetration Tests (DCPT) and four
Spectral Analysis of Surface Waves (SASW) tests were
performed along the base of the stopbanks along Coutts Island
Rd, both in the areas that did and did not liquefy (Figure 6.11).
The results of these tests are presented in Figures 6.12-6.14.
The DCPT is performed in a hole hand augered down to the
top of the liquefied layer, with this layer identified by
comparing sand boil ejecta with soil extracted with the auger
at various depths. The test is performed until there was a
noticeable increase in the DCPT N-value or we ran out of rods
(~4.6 m from the top of the ground surface. (See the
Liquefaction and Lateral Spreading chapter for a more
detailed description of the DCPT test).
Figure 6.9: Photo 6: Stretch of stopbank without evidence of liquefaction. In the distance, a small rise can be seen in the road.
This rise is the start of the ~0.5 km stretch where liquefaction was observed along the base of the stopbank.
(43.4225˚S, 172.6350˚E).
A
B
Figure 6.10: Overlay of 1865 stream channel on present day Coutts Island Rd. This image is ~3.5 km across (centre 43.4266˚S,
172.6302˚E) (Google Inc. 2010).
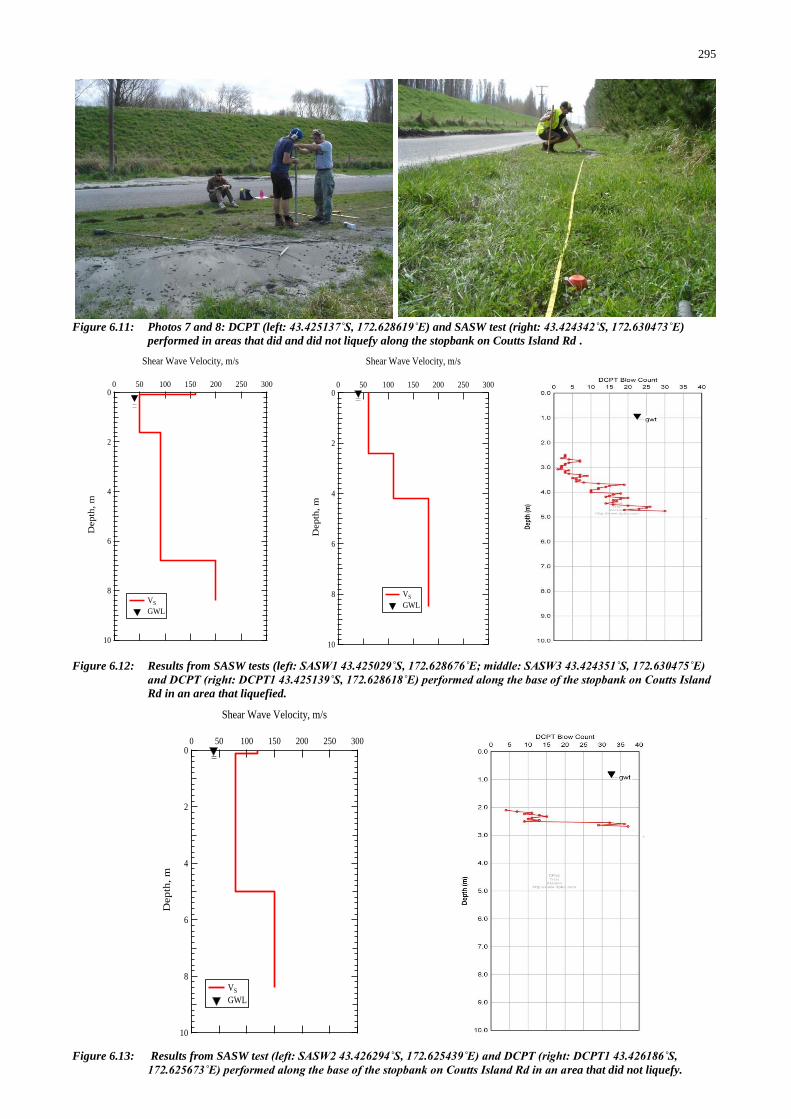
295
Figure 6.11: Photos 7 and 8: DCPT (left: 43.425137˚S, 172.628619˚E) and SASW test (right: 43.424342˚S, 172.630473˚E)
performed in areas that did and did not liquefy along the stopbank on Coutts Island Rd .
10
8
6
4
2
0
Dep
th,
m
300250200150100500
Shear Wave Velocity, m/s
VS
GWL
10
8
6
4
2
0
Dep
th,
m
300250200150100500
Shear Wave Velocity, m/s
VS
GWL
Figure 6.12: Results from SASW tests (left: SASW1 43.425029˚S, 172.628676˚E; middle: SASW3 43.424351˚S, 172.630475˚E)
and DCPT (right: DCPT1 43.425139˚S, 172.628618˚E) performed along the base of the stopbank on Coutts Island
Rd in an area that liquefied.
10
8
6
4
2
0
Depth
, m
300250200150100500
Shear Wave Velocity, m/s
VS
GWL
Figure 6.13: Results from SASW test (left: SASW2 43.426294˚S, 172.625439˚E) and DCPT (right: DCPT1 43.426186˚S,
172.625673˚E) performed along the base of the stopbank on Coutts Island Rd in an area that did not liquefy.
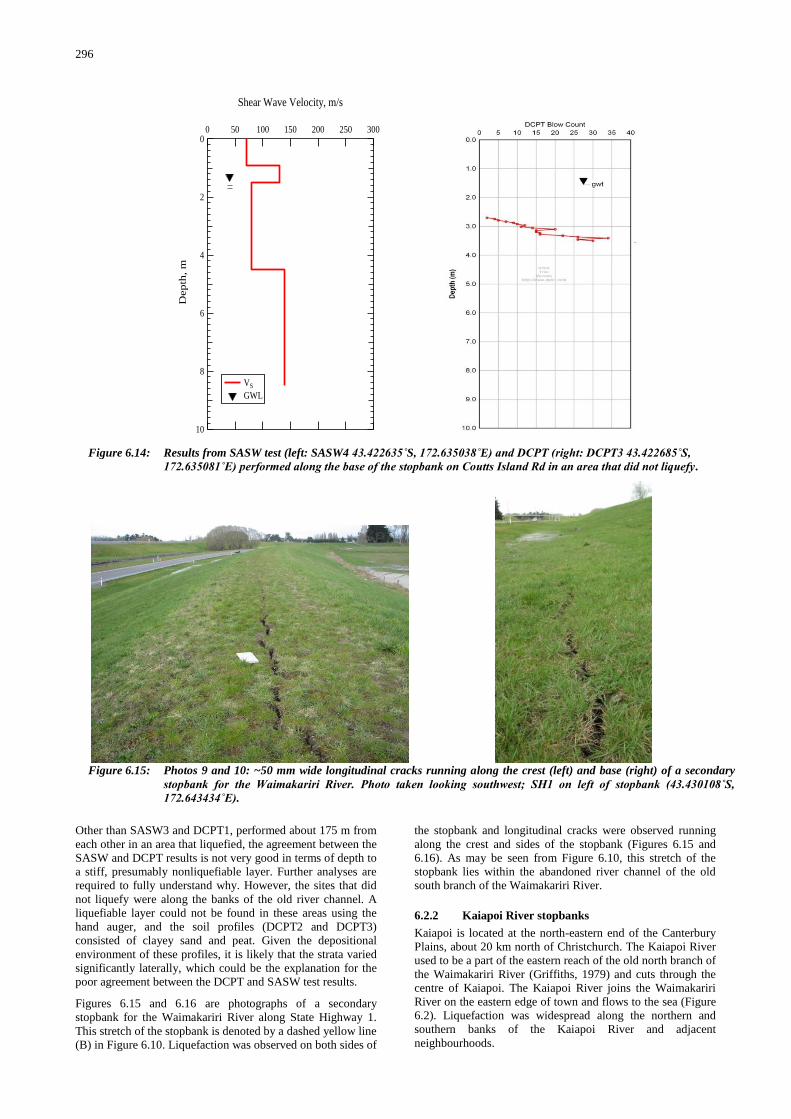
296
Other than SASW3 and DCPT1, performed about 175 m from
each other in an area that liquefied, the agreement between the
SASW and DCPT results is not very good in terms of depth to
a stiff, presumably nonliquefiable layer. Further analyses are
required to fully understand why. However, the sites that did
not liquefy were along the banks of the old river channel. A
liquefiable layer could not be found in these areas using the
hand auger, and the soil profiles (DCPT2 and DCPT3)
consisted of clayey sand and peat. Given the depositional
environment of these profiles, it is likely that the strata varied
significantly laterally, which could be the explanation for the
poor agreement between the DCPT and SASW test results.
Figures 6.15 and 6.16 are photographs of a secondary
stopbank for the Waimakariri River along State Highway 1.
This stretch of the stopbank is denoted by a dashed yellow line
(B) in Figure 6.10. Liquefaction was observed on both sides of
the stopbank and longitudinal cracks were observed running
along the crest and sides of the stopbank (Figures 6.15 and
6.16). As may be seen from Figure 6.10, this stretch of the
stopbank lies within the abandoned river channel of the old
south branch of the Waimakariri River.
6.2.2 Kaiapoi River stopbanks
Kaiapoi is located at the north-eastern end of the Canterbury
Plains, about 20 km north of Christchurch. The Kaiapoi River
used to be a part of the eastern reach of the old north branch of
the Waimakariri River (Griffiths, 1979) and cuts through the
centre of Kaiapoi. The Kaiapoi River joins the Waimakariri
River on the eastern edge of town and flows to the sea (Figure
6.2). Liquefaction was widespread along the northern and
southern banks of the Kaiapoi River and adjacent
neighbourhoods.
10
8
6
4
2
0
Dep
th,
m
300250200150100500
Shear Wave Velocity, m/s
VS
GWL
Figure 6.14: Results from SASW test (left: SASW4 43.422635˚S, 172.635038˚E) and DCPT (right: DCPT3 43.422685˚S,
172.635081˚E) performed along the base of the stopbank on Coutts Island Rd in an area that did not liquefy.
Figure 6.15: Photos 9 and 10: ~50 mm wide longitudinal cracks running along the crest (left) and base (right) of a secondary
stopbank for the Waimakariri River. Photo taken looking southwest; SH1 on left of stopbank (43.430108˚S,
172.643434˚E).
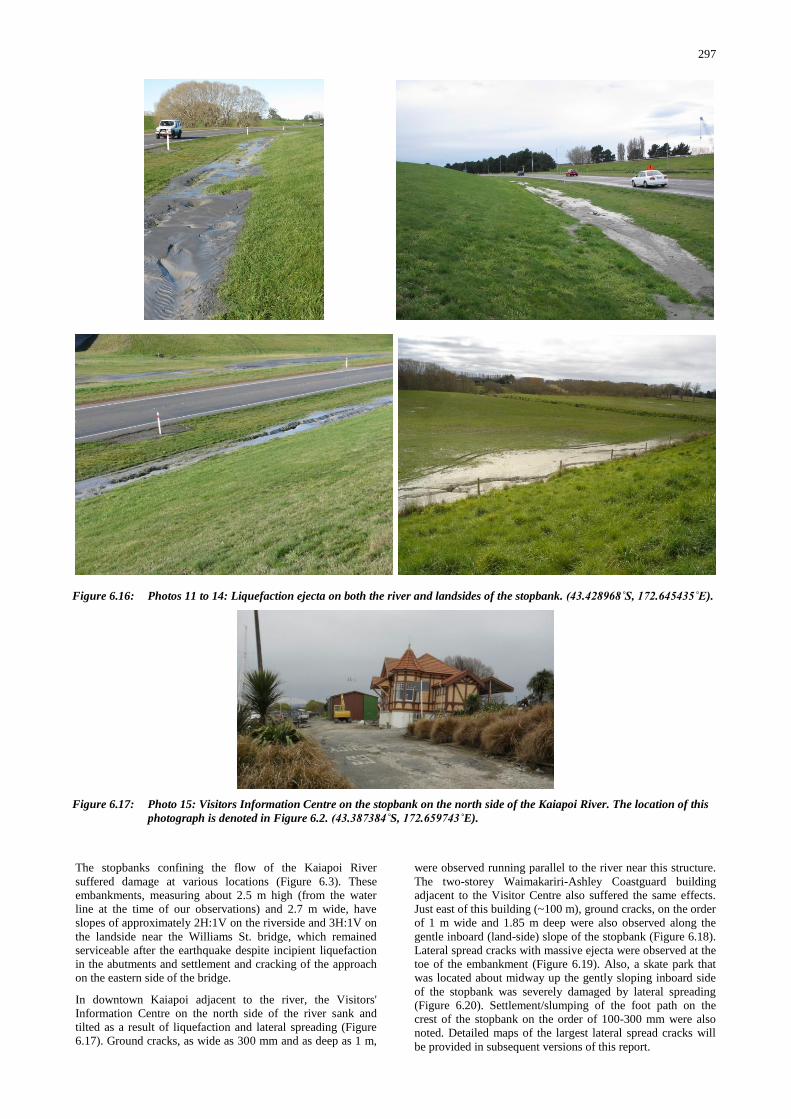
297
The stopbanks confining the flow of the Kaiapoi River
suffered damage at various locations (Figure 6.3). These
embankments, measuring about 2.5 m high (from the water
line at the time of our observations) and 2.7 m wide, have
slopes of approximately 2H:1V on the riverside and 3H:1V on
the landside near the Williams St. bridge, which remained
serviceable after the earthquake despite incipient liquefaction
in the abutments and settlement and cracking of the approach
on the eastern side of the bridge.
In downtown Kaiapoi adjacent to the river, the Visitors'
Information Centre on the north side of the river sank and
tilted as a result of liquefaction and lateral spreading (Figure
6.17). Ground cracks, as wide as 300 mm and as deep as 1 m,
were observed running parallel to the river near this structure.
The two-storey Waimakariri-Ashley Coastguard building
adjacent to the Visitor Centre also suffered the same effects.
Just east of this building (~100 m), ground cracks, on the order
of 1 m wide and 1.85 m deep were also observed along the
gentle inboard (land-side) slope of the stopbank (Figure 6.18).
Lateral spread cracks with massive ejecta were observed at the
toe of the embankment (Figure 6.19). Also, a skate park that
was located about midway up the gently sloping inboard side
of the stopbank was severely damaged by lateral spreading
(Figure 6.20). Settlement/slumping of the foot path on the
crest of the stopbank on the order of 100-300 mm were also
noted. Detailed maps of the largest lateral spread cracks will
be provided in subsequent versions of this report.
Figure 6.16: Photos 11 to 14: Liquefaction ejecta on both the river and landsides of the stopbank. (43.428968˚S, 172.645435˚E).
Figure 6.17: Photo 15: Visitors Information Centre on the stopbank on the north side of the Kaiapoi River. The location of this
photograph is denoted in Figure 6.2. (43.387384˚S, 172.659743˚E).
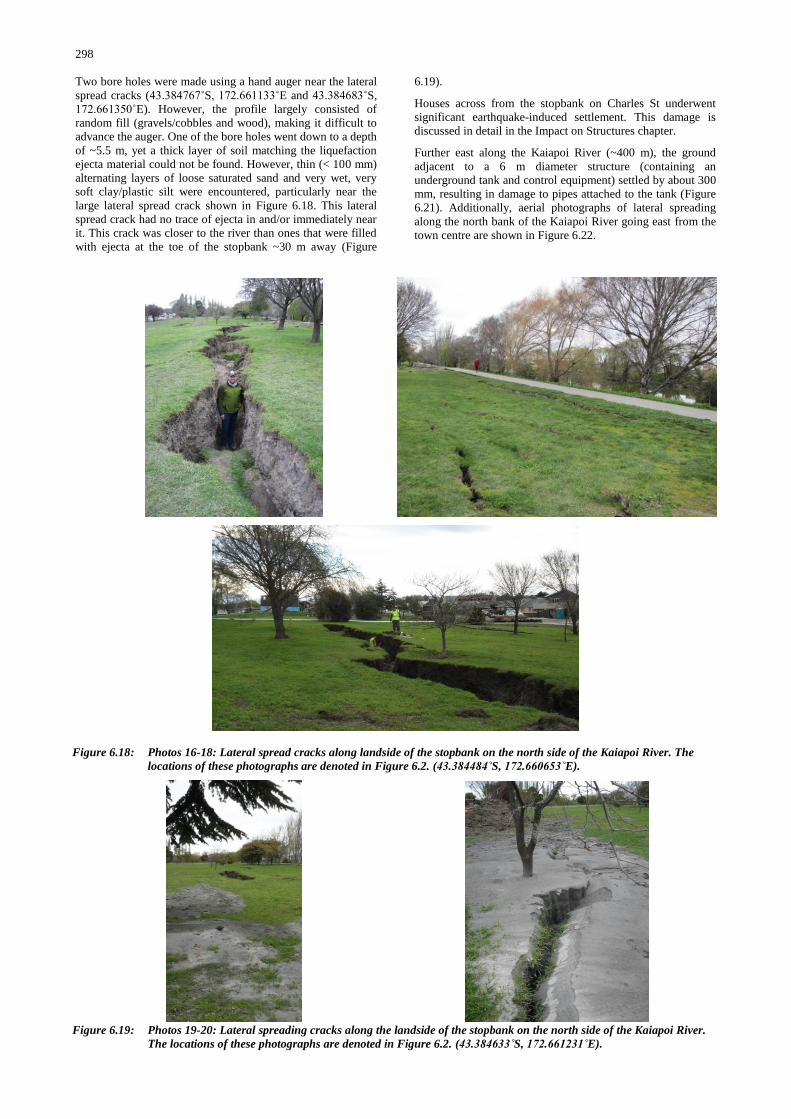
298
Two bore holes were made using a hand auger near the lateral
spread cracks (43.384767˚S, 172.661133˚E and 43.384683˚S,
172.661350˚E). However, the profile largely consisted of
random fill (gravels/cobbles and wood), making it difficult to
advance the auger. One of the bore holes went down to a depth
of ~5.5 m, yet a thick layer of soil matching the liquefaction
ejecta material could not be found. However, thin (< 100 mm)
alternating layers of loose saturated sand and very wet, very
soft clay/plastic silt were encountered, particularly near the
large lateral spread crack shown in Figure 6.18. This lateral
spread crack had no trace of ejecta in and/or immediately near
it. This crack was closer to the river than ones that were filled
with ejecta at the toe of the stopbank ~30 m away (Figure
6.19).
Houses across from the stopbank on Charles St underwent
significant earthquake-induced settlement. This damage is
discussed in detail in the Impact on Structures chapter.
Further east along the Kaiapoi River (~400 m), the ground
adjacent to a 6 m diameter structure (containing an
underground tank and control equipment) settled by about 300
mm, resulting in damage to pipes attached to the tank (Figure
6.21). Additionally, aerial photographs of lateral spreading
along the north bank of the Kaiapoi River going east from the
town centre are shown in Figure 6.22.
Figure 6.18: Photos 16-18: Lateral spread cracks along landside of the stopbank on the north side of the Kaiapoi River. The
locations of these photographs are denoted in Figure 6.2. (43.384484˚S, 172.660653˚E).
Figure 6.19: Photos 19-20: Lateral spreading cracks along the landside of the stopbank on the north side of the Kaiapoi River.
The locations of these photographs are denoted in Figure 6.2. (43.384633˚S, 172.661231˚E).
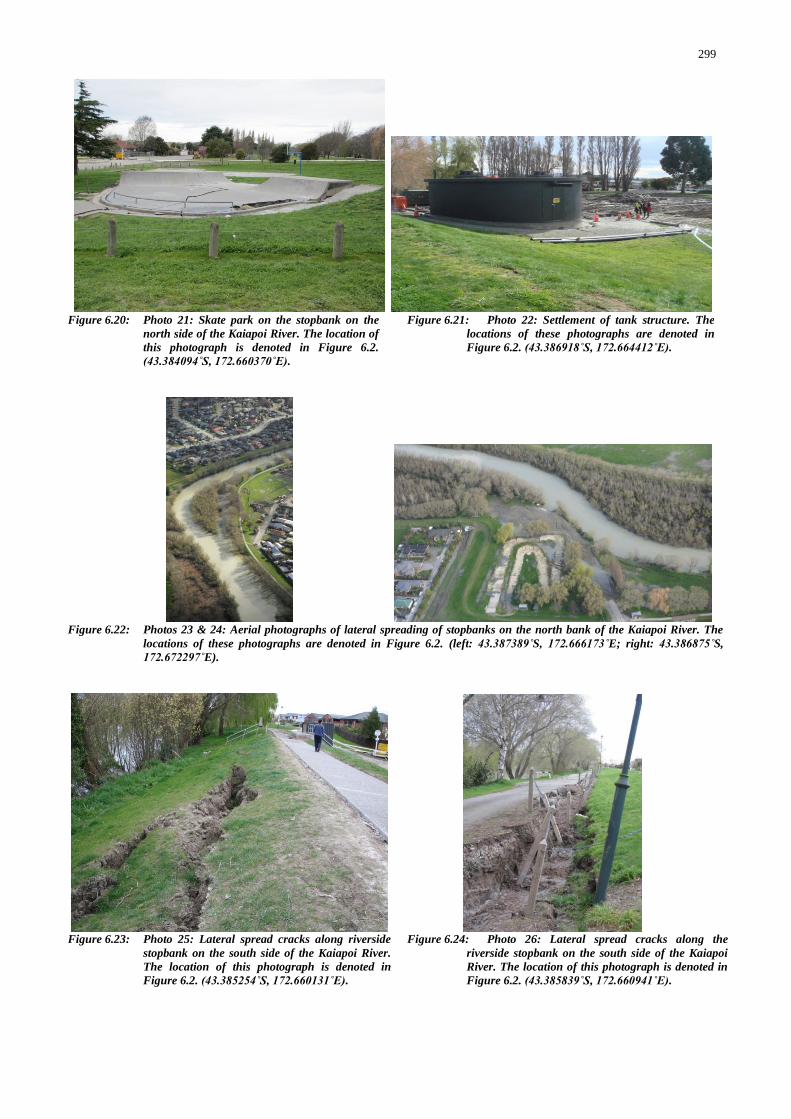
299
Figure 6.20: Photo 21: Skate park on the stopbank on the
north side of the Kaiapoi River. The location of
this photograph is denoted in Figure 6.2.
(43.384094˚S, 172.660370˚E).
Figure 6.21: Photo 22: Settlement of tank structure. The
locations of these photographs are denoted in
Figure 6.2. (43.386918˚S, 172.664412˚E).
Figure 6.22: Photos 23 & 24: Aerial photographs of lateral spreading of stopbanks on the north bank of the Kaiapoi River. The
locations of these photographs are denoted in Figure 6.2. (left: 43.387389˚S, 172.666173˚E; right: 43.386875˚S,
172.672297˚E).
Figure 6.23: Photo 25: Lateral spread cracks along riverside
stopbank on the south side of the Kaiapoi River.
The location of this photograph is denoted in
Figure 6.2. (43.385254˚S, 172.660131˚E).
Figure 6.24: Photo 26: Lateral spread cracks along the
riverside stopbank on the south side of the Kaiapoi
River. The location of this photograph is denoted in
Figure 6.2. (43.385839˚S, 172.660941˚E).
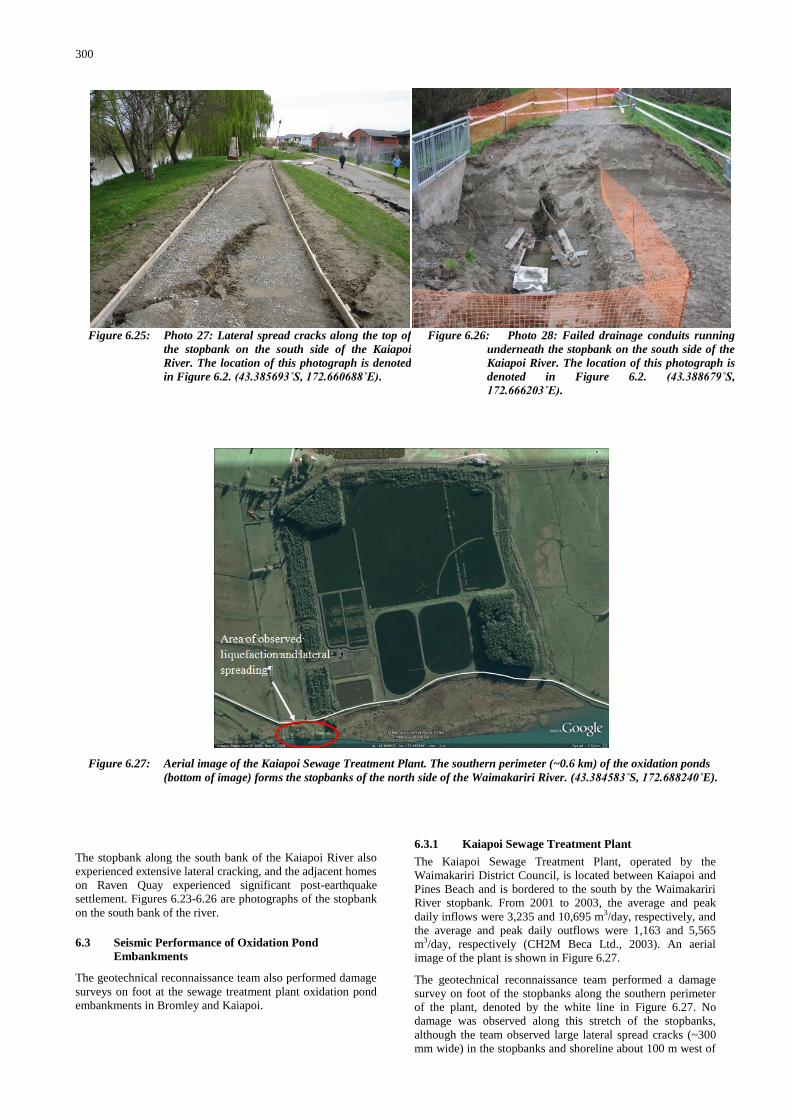
300
The stopbank along the south bank of the Kaiapoi River also
experienced extensive lateral cracking, and the adjacent homes
on Raven Quay experienced significant post-earthquake
settlement. Figures 6.23-6.26 are photographs of the stopbank
on the south bank of the river.
6.3 Seismic Performance of Oxidation Pond
Embankments
The geotechnical reconnaissance team also performed damage
surveys on foot at the sewage treatment plant oxidation pond
embankments in Bromley and Kaiapoi.
6.3.1 Kaiapoi Sewage Treatment Plant
The Kaiapoi Sewage Treatment Plant, operated by the
Waimakariri District Council, is located between Kaiapoi and
Pines Beach and is bordered to the south by the Waimakariri
River stopbank. From 2001 to 2003, the average and peak
daily inflows were 3,235 and 10,695 m3/day, respectively, and
the average and peak daily outflows were 1,163 and 5,565
m3/day, respectively (CH2M Beca Ltd., 2003). An aerial
image of the plant is shown in Figure 6.27.
The geotechnical reconnaissance team performed a damage
survey on foot of the stopbanks along the southern perimeter
of the plant, denoted by the white line in Figure 6.27. No
damage was observed along this stretch of the stopbanks,
although the team observed large lateral spread cracks (~300
mm wide) in the stopbanks and shoreline about 100 m west of
Figure 6.25: Photo 27: Lateral spread cracks along the top of
the stopbank on the south side of the Kaiapoi
River. The location of this photograph is denoted
in Figure 6.2. (43.385693˚S, 172.660688˚E).
Figure 6.26: Photo 28: Failed drainage conduits running
underneath the stopbank on the south side of the
Kaiapoi River. The location of this photograph is
denoted in Figure 6.2. (43.388679˚S,
172.666203˚E).
Figure 6.27: Aerial image of the Kaiapoi Sewage Treatment Plant. The southern perimeter (~0.6 km) of the oxidation ponds
(bottom of image) forms the stopbanks of the north side of the Waimakariri River. (43.384583˚S, 172.688240˚E).
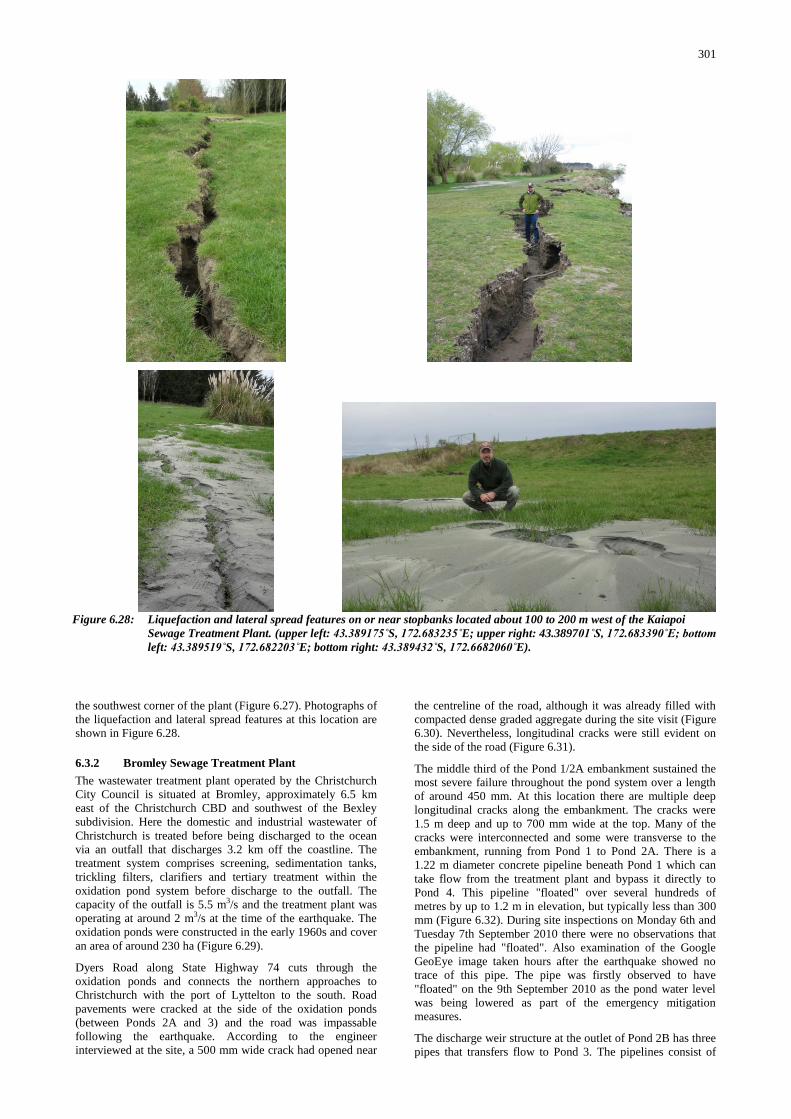
301
the southwest corner of the plant (Figure 6.27). Photographs of
the liquefaction and lateral spread features at this location are
shown in Figure 6.28.
6.3.2 Bromley Sewage Treatment Plant
The wastewater treatment plant operated by the Christchurch
City Council is situated at Bromley, approximately 6.5 km
east of the Christchurch CBD and southwest of the Bexley
subdivision. Here the domestic and industrial wastewater of
Christchurch is treated before being discharged to the ocean
via an outfall that discharges 3.2 km off the coastline. The
treatment system comprises screening, sedimentation tanks,
trickling filters, clarifiers and tertiary treatment within the
oxidation pond system before discharge to the outfall. The
capacity of the outfall is 5.5 m3/s and the treatment plant was
operating at around 2 m3/s at the time of the earthquake. The
oxidation ponds were constructed in the early 1960s and cover
an area of around 230 ha (Figure 6.29).
Dyers Road along State Highway 74 cuts through the
oxidation ponds and connects the northern approaches to
Christchurch with the port of Lyttelton to the south. Road
pavements were cracked at the side of the oxidation ponds
(between Ponds 2A and 3) and the road was impassable
following the earthquake. According to the engineer
interviewed at the site, a 500 mm wide crack had opened near
the centreline of the road, although it was already filled with
compacted dense graded aggregate during the site visit (Figure
6.30). Nevertheless, longitudinal cracks were still evident on
the side of the road (Figure 6.31).
The middle third of the Pond 1/2A embankment sustained the
most severe failure throughout the pond system over a length
of around 450 mm. At this location there are multiple deep
longitudinal cracks along the embankment. The cracks were
1.5 m deep and up to 700 mm wide at the top. Many of the
cracks were interconnected and some were transverse to the
embankment, running from Pond 1 to Pond 2A. There is a
1.22 m diameter concrete pipeline beneath Pond 1 which can
take flow from the treatment plant and bypass it directly to
Pond 4. This pipeline "floated" over several hundreds of
metres by up to 1.2 m in elevation, but typically less than 300
mm (Figure 6.32). During site inspections on Monday 6th and
Tuesday 7th September 2010 there were no observations that
the pipeline had "floated". Also examination of the Google
GeoEye image taken hours after the earthquake showed no
trace of this pipe. The pipe was firstly observed to have
"floated" on the 9th September 2010 as the pond water level
was being lowered as part of the emergency mitigation
measures.
The discharge weir structure at the outlet of Pond 2B has three
pipes that transfers flow to Pond 3. The pipelines consist of
Figure 6.28: Liquefaction and lateral spread features on or near stopbanks located about 100 to 200 m west of the Kaiapoi
Sewage Treatment Plant. (upper left: 43.389175˚S, 172.683235˚E; upper right: 43.389701˚S, 172.683390˚E; bottom
left: 43.389519˚S, 172.682203˚E; bottom right: 43.389432˚S, 172.6682060˚E).
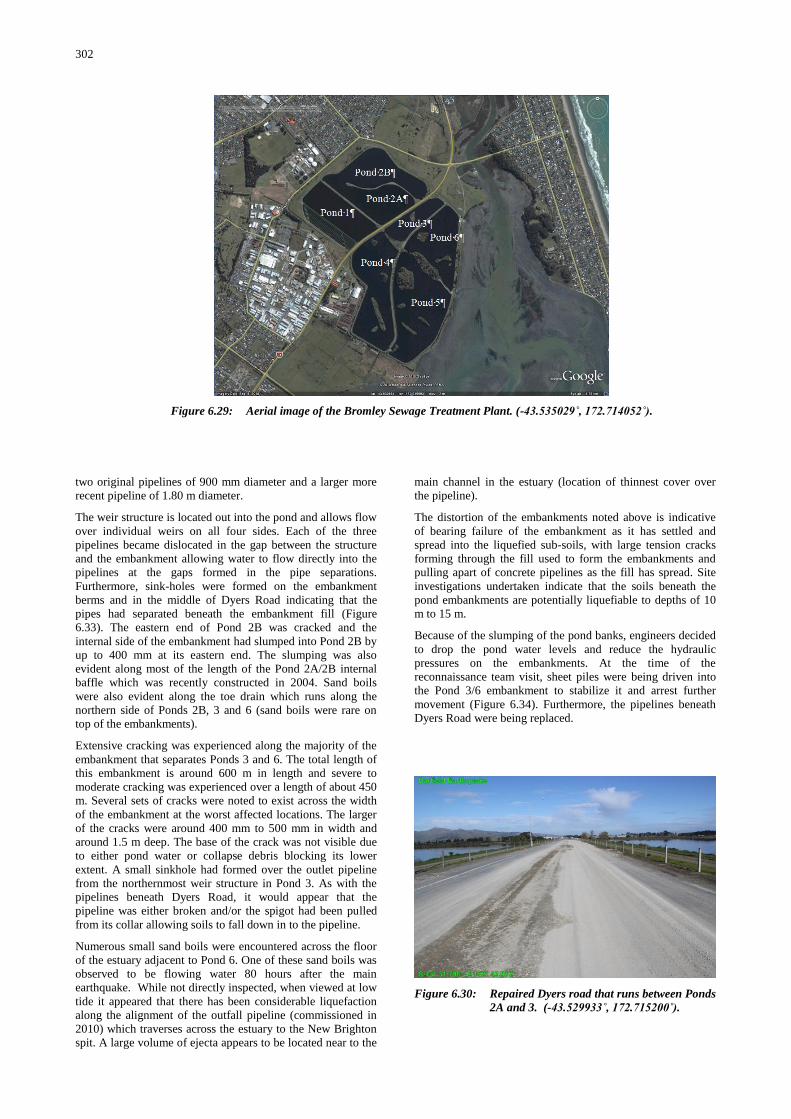
302
two original pipelines of 900 mm diameter and a larger more
recent pipeline of 1.80 m diameter.
The weir structure is located out into the pond and allows flow
over individual weirs on all four sides. Each of the three
pipelines became dislocated in the gap between the structure
and the embankment allowing water to flow directly into the
pipelines at the gaps formed in the pipe separations.
Furthermore, sink-holes were formed on the embankment
berms and in the middle of Dyers Road indicating that the
pipes had separated beneath the embankment fill (Figure
6.33). The eastern end of Pond 2B was cracked and the
internal side of the embankment had slumped into Pond 2B by
up to 400 mm at its eastern end. The slumping was also
evident along most of the length of the Pond 2A/2B internal
baffle which was recently constructed in 2004. Sand boils
were also evident along the toe drain which runs along the
northern side of Ponds 2B, 3 and 6 (sand boils were rare on
top of the embankments).
Extensive cracking was experienced along the majority of the
embankment that separates Ponds 3 and 6. The total length of
this embankment is around 600 m in length and severe to
moderate cracking was experienced over a length of about 450
m. Several sets of cracks were noted to exist across the width
of the embankment at the worst affected locations. The larger
of the cracks were around 400 mm to 500 mm in width and
around 1.5 m deep. The base of the crack was not visible due
to either pond water or collapse debris blocking its lower
extent. A small sinkhole had formed over the outlet pipeline
from the northernmost weir structure in Pond 3. As with the
pipelines beneath Dyers Road, it would appear that the
pipeline was either broken and/or the spigot had been pulled
from its collar allowing soils to fall down in to the pipeline.
Numerous small sand boils were encountered across the floor
of the estuary adjacent to Pond 6. One of these sand boils was
observed to be flowing water 80 hours after the main
earthquake. While not directly inspected, when viewed at low
tide it appeared that there has been considerable liquefaction
along the alignment of the outfall pipeline (commissioned in
2010) which traverses across the estuary to the New Brighton
spit. A large volume of ejecta appears to be located near to the
main channel in the estuary (location of thinnest cover over
the pipeline).
The distortion of the embankments noted above is indicative
of bearing failure of the embankment as it has settled and
spread into the liquefied sub-soils, with large tension cracks
forming through the fill used to form the embankments and
pulling apart of concrete pipelines as the fill has spread. Site
investigations undertaken indicate that the soils beneath the
pond embankments are potentially liquefiable to depths of 10
m to 15 m.
Because of the slumping of the pond banks, engineers decided
to drop the pond water levels and reduce the hydraulic
pressures on the embankments. At the time of the
reconnaissance team visit, sheet piles were being driven into
the Pond 3/6 embankment to stabilize it and arrest further
movement (Figure 6.34). Furthermore, the pipelines beneath
Dyers Road were being replaced.
Figure 6.30: Repaired Dyers road that runs between Ponds
2A and 3. (-43.529933˚, 172.715200˚).
Figure 6.29: Aerial image of the Bromley Sewage Treatment Plant. (-43.535029˚, 172.714052˚).
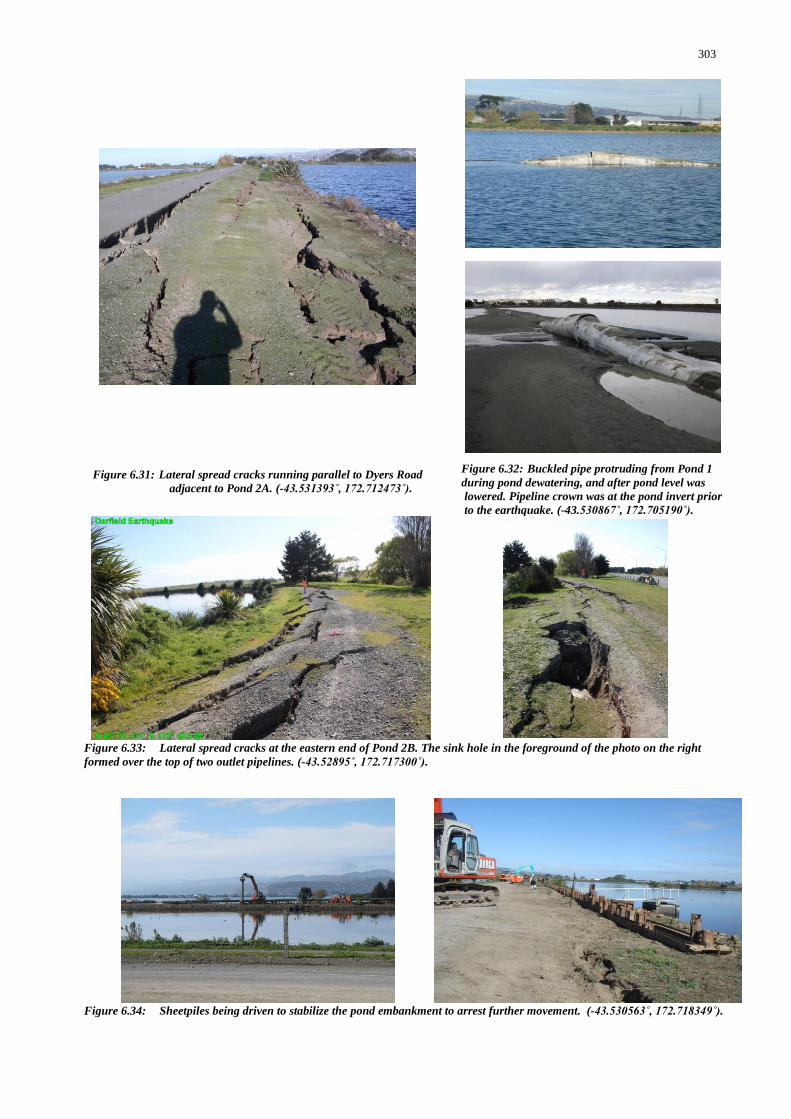
303
Figure 6.31: Lateral spread cracks running parallel to Dyers Road
adjacent to Pond 2A. (-43.531393˚, 172.712473˚).
Figure 6.32: Buckled pipe protruding from Pond 1
during pond dewatering, and after pond level was
lowered. Pipeline crown was at the pond invert prior
to the earthquake. (-43.530867˚, 172.705190˚).
Figure 6.33: Lateral spread cracks at the eastern end of Pond 2B. The sink hole in the foreground of the photo on the right
formed over the top of two outlet pipelines. (-43.52895˚, 172.717300˚).
Figure 6.34: Sheetpiles being driven to stabilize the pond embankment to arrest further movement. (-43.530563˚, 172.718349˚).
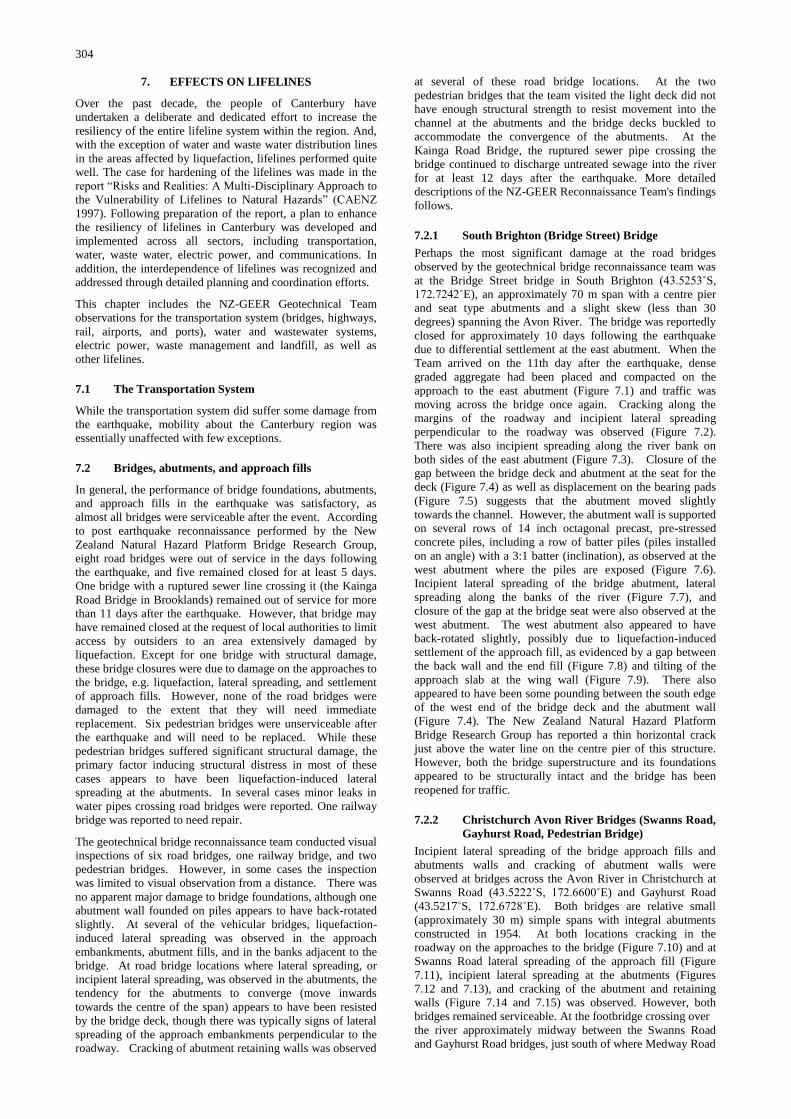
304
7. EFFECTS ON LIFELINES
Over the past decade, the people of Canterbury have
undertaken a deliberate and dedicated effort to increase the
resiliency of the entire lifeline system within the region. And,
with the exception of water and waste water distribution lines
in the areas affected by liquefaction, lifelines performed quite
well. The case for hardening of the lifelines was made in the
report “Risks and Realities: A Multi-Disciplinary Approach to
the Vulnerability of Lifelines to Natural Hazards” (CAENZ
1997). Following preparation of the report, a plan to enhance
the resiliency of lifelines in Canterbury was developed and
implemented across all sectors, including transportation,
water, waste water, electric power, and communications. In
addition, the interdependence of lifelines was recognized and
addressed through detailed planning and coordination efforts.
This chapter includes the NZ-GEER Geotechnical Team
observations for the transportation system (bridges, highways,
rail, airports, and ports), water and wastewater systems,
electric power, waste management and landfill, as well as
other lifelines.
7.1 The Transportation System
While the transportation system did suffer some damage from
the earthquake, mobility about the Canterbury region was
essentially unaffected with few exceptions.
7.2 Bridges, abutments, and approach fills
In general, the performance of bridge foundations, abutments,
and approach fills in the earthquake was satisfactory, as
almost all bridges were serviceable after the event. According
to post earthquake reconnaissance performed by the New
Zealand Natural Hazard Platform Bridge Research Group,
eight road bridges were out of service in the days following
the earthquake, and five remained closed for at least 5 days.
One bridge with a ruptured sewer line crossing it (the Kainga
Road Bridge in Brooklands) remained out of service for more
than 11 days after the earthquake. However, that bridge may
have remained closed at the request of local authorities to limit
access by outsiders to an area extensively damaged by
liquefaction. Except for one bridge with structural damage,
these bridge closures were due to damage on the approaches to
the bridge, e.g. liquefaction, lateral spreading, and settlement
of approach fills. However, none of the road bridges were
damaged to the extent that they will need immediate
replacement. Six pedestrian bridges were unserviceable after
the earthquake and will need to be replaced. While these
pedestrian bridges suffered significant structural damage, the
primary factor inducing structural distress in most of these
cases appears to have been liquefaction-induced lateral
spreading at the abutments. In several cases minor leaks in
water pipes crossing road bridges were reported. One railway
bridge was reported to need repair.
The geotechnical bridge reconnaissance team conducted visual
inspections of six road bridges, one railway bridge, and two
pedestrian bridges. However, in some cases the inspection
was limited to visual observation from a distance. There was
no apparent major damage to bridge foundations, although one
abutment wall founded on piles appears to have back-rotated
slightly. At several of the vehicular bridges, liquefaction-
induced lateral spreading was observed in the approach
embankments, abutment fills, and in the banks adjacent to the
bridge. At road bridge locations where lateral spreading, or
incipient lateral spreading, was observed in the abutments, the
tendency for the abutments to converge (move inwards
towards the centre of the span) appears to have been resisted
by the bridge deck, though there was typically signs of lateral
spreading of the approach embankments perpendicular to the
roadway. Cracking of abutment retaining walls was observed
at several of these road bridge locations. At the two
pedestrian bridges that the team visited the light deck did not
have enough structural strength to resist movement into the
channel at the abutments and the bridge decks buckled to
accommodate the convergence of the abutments. At the
Kainga Road Bridge, the ruptured sewer pipe crossing the
bridge continued to discharge untreated sewage into the river
for at least 12 days after the earthquake. More detailed
descriptions of the NZ-GEER Reconnaissance Team's findings
follows.
7.2.1 South Brighton (Bridge Street) Bridge
Perhaps the most significant damage at the road bridges
observed by the geotechnical bridge reconnaissance team was
at the Bridge Street bridge in South Brighton (43.5253˚S,
172.7242˚E), an approximately 70 m span with a centre pier
and seat type abutments and a slight skew (less than 30
degrees) spanning the Avon River. The bridge was reportedly
closed for approximately 10 days following the earthquake
due to differential settlement at the east abutment. When the
Team arrived on the 11th day after the earthquake, dense
graded aggregate had been placed and compacted on the
approach to the east abutment (Figure 7.1) and traffic was
moving across the bridge once again. Cracking along the
margins of the roadway and incipient lateral spreading
perpendicular to the roadway was observed (Figure 7.2).
There was also incipient spreading along the river bank on
both sides of the east abutment (Figure 7.3). Closure of the
gap between the bridge deck and abutment at the seat for the
deck (Figure 7.4) as well as displacement on the bearing pads
(Figure 7.5) suggests that the abutment moved slightly
towards the channel. However, the abutment wall is supported
on several rows of 14 inch octagonal precast, pre-stressed
concrete piles, including a row of batter piles (piles installed
on an angle) with a 3:1 batter (inclination), as observed at the
west abutment where the piles are exposed (Figure 7.6).
Incipient lateral spreading of the bridge abutment, lateral
spreading along the banks of the river (Figure 7.7), and
closure of the gap at the bridge seat were also observed at the
west abutment. The west abutment also appeared to have
back-rotated slightly, possibly due to liquefaction-induced
settlement of the approach fill, as evidenced by a gap between
the back wall and the end fill (Figure 7.8) and tilting of the
approach slab at the wing wall (Figure 7.9). There also
appeared to have been some pounding between the south edge
of the west end of the bridge deck and the abutment wall
(Figure 7.4). The New Zealand Natural Hazard Platform
Bridge Research Group has reported a thin horizontal crack
just above the water line on the centre pier of this structure.
However, both the bridge superstructure and its foundations
appeared to be structurally intact and the bridge has been
reopened for traffic.
7.2.2 Christchurch Avon River Bridges (Swanns Road,
Gayhurst Road, Pedestrian Bridge)
Incipient lateral spreading of the bridge approach fills and
abutments walls and cracking of abutment walls were
observed at bridges across the Avon River in Christchurch at
Swanns Road (43.5222˚S, 172.6600˚E) and Gayhurst Road
(43.5217˚S, 172.6728˚E). Both bridges are relative small
(approximately 30 m) simple spans with integral abutments
constructed in 1954. At both locations cracking in the
roadway on the approaches to the bridge (Figure 7.10) and at
Swanns Road lateral spreading of the approach fill (Figure
7.11), incipient lateral spreading at the abutments (Figures
7.12 and 7.13), and cracking of the abutment and retaining
walls (Figure 7.14 and 7.15) was observed. However, both
bridges remained serviceable. At the footbridge crossing over
the river approximately midway between the Swanns Road
and Gayhurst Road bridges, just south of where Medway Road
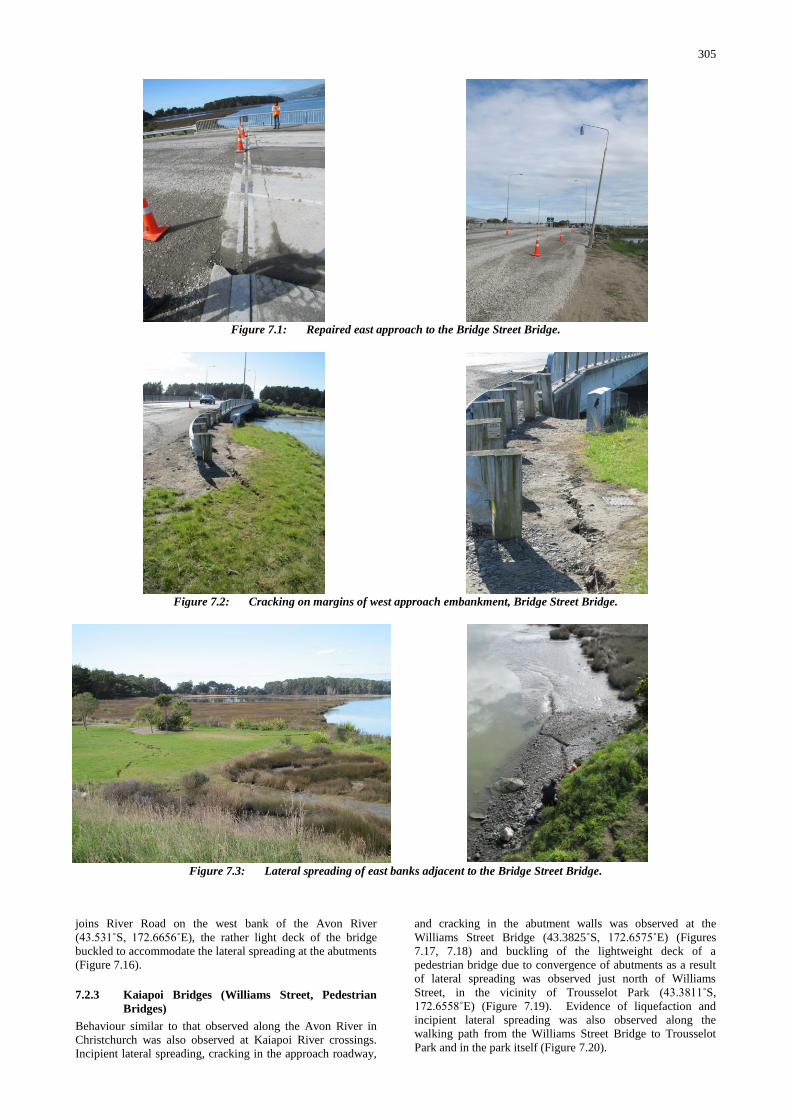
305
joins River Road on the west bank of the Avon River
(43.531˚S, 172.6656˚E), the rather light deck of the bridge
buckled to accommodate the lateral spreading at the abutments
(Figure 7.16).
7.2.3 Kaiapoi Bridges (Williams Street, Pedestrian
Bridges)
Behaviour similar to that observed along the Avon River in
Christchurch was also observed at Kaiapoi River crossings.
Incipient lateral spreading, cracking in the approach roadway,
and cracking in the abutment walls was observed at the
Williams Street Bridge (43.3825˚S, 172.6575˚E) (Figures
7.17, 7.18) and buckling of the lightweight deck of a
pedestrian bridge due to convergence of abutments as a result
of lateral spreading was observed just north of Williams
Street, in the vicinity of Trousselot Park (43.3811˚S,
172.6558˚E) (Figure 7.19). Evidence of liquefaction and
incipient lateral spreading was also observed along the
walking path from the Williams Street Bridge to Trousselot
Park and in the park itself (Figure 7.20).
Figure 7.1: Repaired east approach to the Bridge Street Bridge.
Figure 7.2: Cracking on margins of west approach embankment, Bridge Street Bridge.
Figure 7.3: Lateral spreading of east banks adjacent to the Bridge Street Bridge.
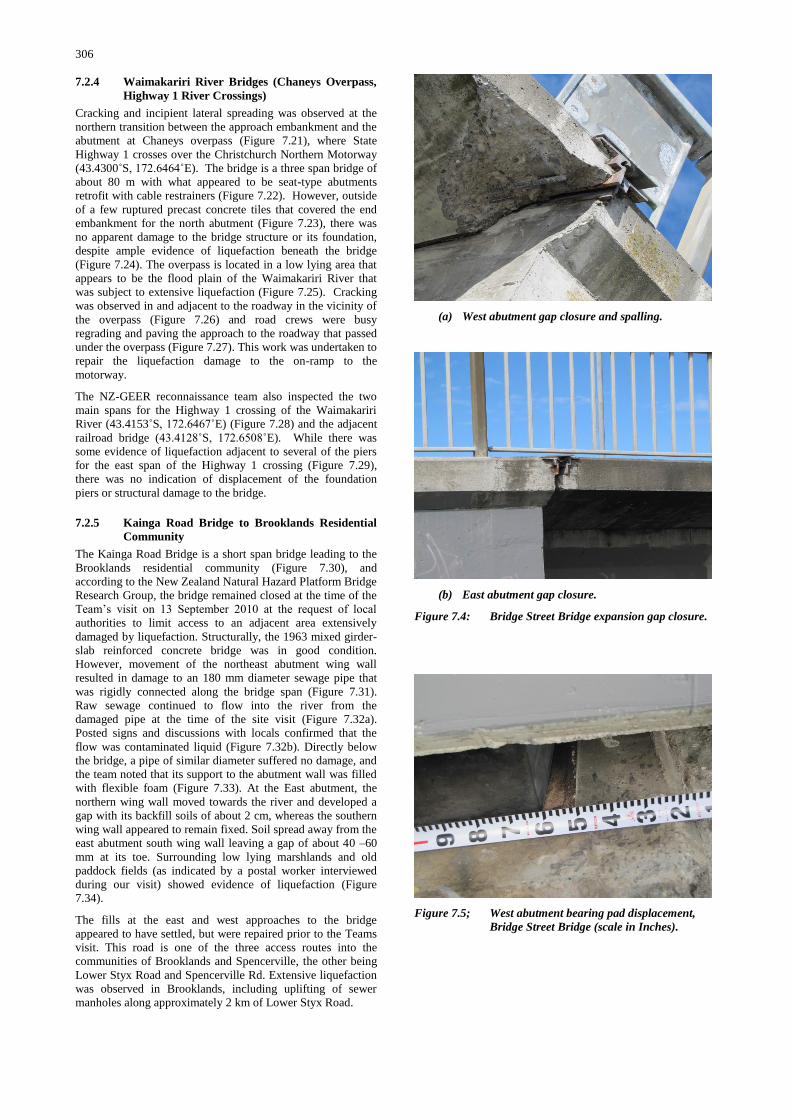
306
7.2.4 Waimakariri River Bridges (Chaneys Overpass,
Highway 1 River Crossings)
Cracking and incipient lateral spreading was observed at the
northern transition between the approach embankment and the
abutment at Chaneys overpass (Figure 7.21), where State
Highway 1 crosses over the Christchurch Northern Motorway
(43.4300˚S, 172.6464˚E). The bridge is a three span bridge of
about 80 m with what appeared to be seat-type abutments
retrofit with cable restrainers (Figure 7.22). However, outside
of a few ruptured precast concrete tiles that covered the end
embankment for the north abutment (Figure 7.23), there was
no apparent damage to the bridge structure or its foundation,
despite ample evidence of liquefaction beneath the bridge
(Figure 7.24). The overpass is located in a low lying area that
appears to be the flood plain of the Waimakariri River that
was subject to extensive liquefaction (Figure 7.25). Cracking
was observed in and adjacent to the roadway in the vicinity of
the overpass (Figure 7.26) and road crews were busy
regrading and paving the approach to the roadway that passed
under the overpass (Figure 7.27). This work was undertaken to
repair the liquefaction damage to the on-ramp to the
motorway.
The NZ-GEER reconnaissance team also inspected the two
main spans for the Highway 1 crossing of the Waimakariri
River (43.4153˚S, 172.6467˚E) (Figure 7.28) and the adjacent
railroad bridge (43.4128˚S, 172.6508˚E). While there was
some evidence of liquefaction adjacent to several of the piers
for the east span of the Highway 1 crossing (Figure 7.29),
there was no indication of displacement of the foundation
piers or structural damage to the bridge.
7.2.5 Kainga Road Bridge to Brooklands Residential
Community
The Kainga Road Bridge is a short span bridge leading to the
Brooklands residential community (Figure 7.30), and
according to the New Zealand Natural Hazard Platform Bridge
Research Group, the bridge remained closed at the time of the
Team‟s visit on 13 September 2010 at the request of local
authorities to limit access to an adjacent area extensively
damaged by liquefaction. Structurally, the 1963 mixed girder-
slab reinforced concrete bridge was in good condition.
However, movement of the northeast abutment wing wall
resulted in damage to an 180 mm diameter sewage pipe that
was rigidly connected along the bridge span (Figure 7.31).
Raw sewage continued to flow into the river from the
damaged pipe at the time of the site visit (Figure 7.32a).
Posted signs and discussions with locals confirmed that the
flow was contaminated liquid (Figure 7.32b). Directly below
the bridge, a pipe of similar diameter suffered no damage, and
the team noted that its support to the abutment wall was filled
with flexible foam (Figure 7.33). At the East abutment, the
northern wing wall moved towards the river and developed a
gap with its backfill soils of about 2 cm, whereas the southern
wing wall appeared to remain fixed. Soil spread away from the
east abutment south wing wall leaving a gap of about 40 –60
mm at its toe. Surrounding low lying marshlands and old
paddock fields (as indicated by a postal worker interviewed
during our visit) showed evidence of liquefaction (Figure
7.34).
The fills at the east and west approaches to the bridge
appeared to have settled, but were repaired prior to the Teams
visit. This road is one of the three access routes into the
communities of Brooklands and Spencerville, the other being
Lower Styx Road and Spencerville Rd. Extensive liquefaction
was observed in Brooklands, including uplifting of sewer
manholes along approximately 2 km of Lower Styx Road.
(a) West abutment gap closure and spalling.
(b) East abutment gap closure.
Figure 7.4: Bridge Street Bridge expansion gap closure.
Figure 7.5; West abutment bearing pad displacement,
Bridge Street Bridge (scale in Inches).
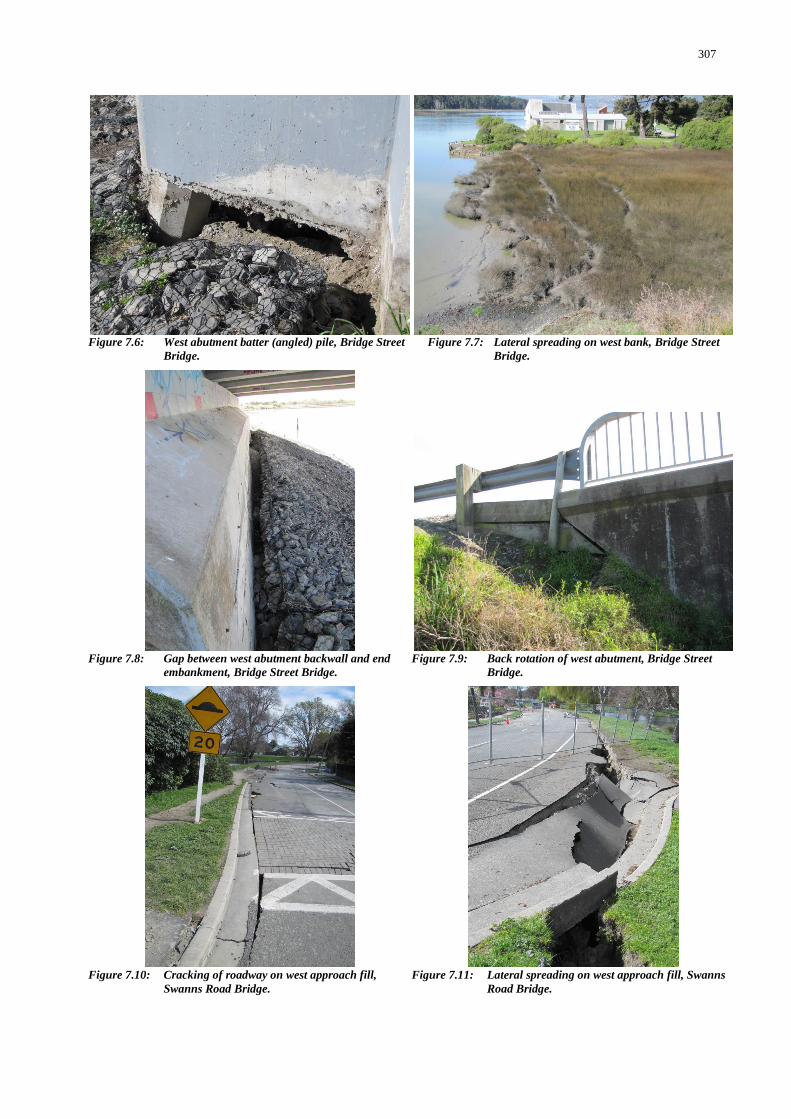
307
Figure 7.6: West abutment batter (angled) pile, Bridge Street
Bridge.
Figure 7.7: Lateral spreading on west bank, Bridge Street
Bridge.
Figure 7.8: Gap between west abutment backwall and end
embankment, Bridge Street Bridge.
Figure 7.9: Back rotation of west abutment, Bridge Street
Bridge.
Figure 7.10: Cracking of roadway on west approach fill,
Swanns Road Bridge.
Figure 7.11: Lateral spreading on west approach fill, Swanns
Road Bridge.
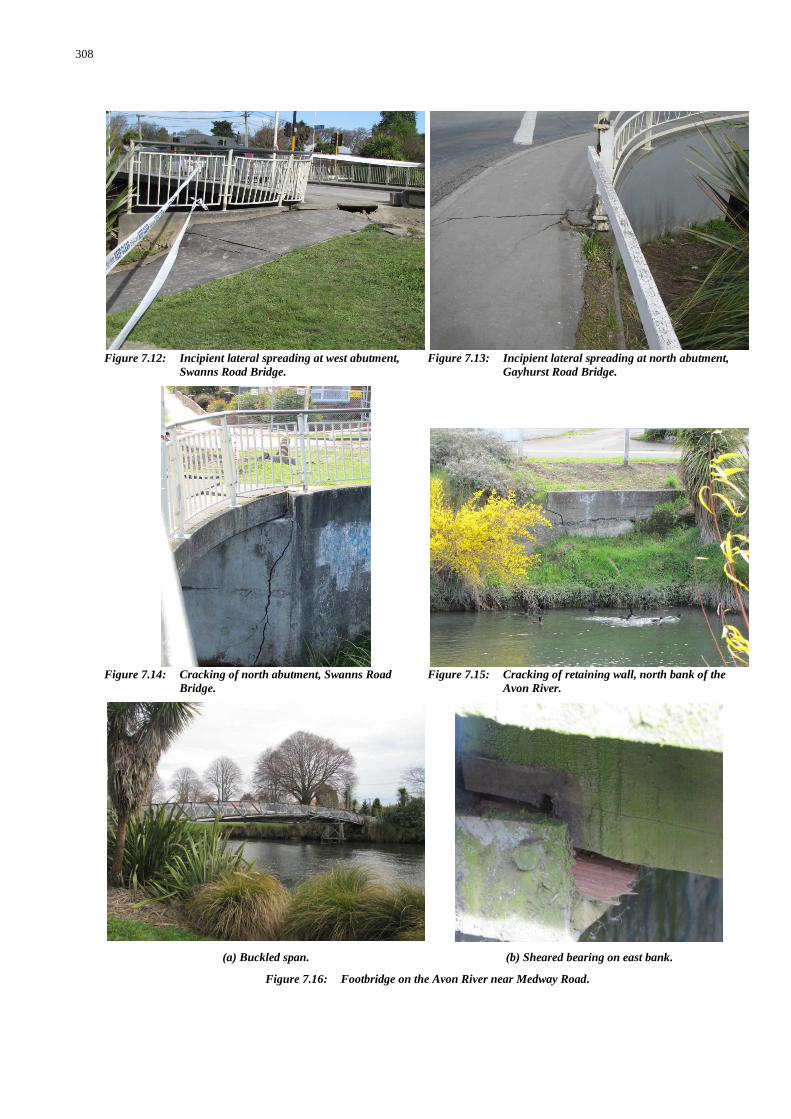
308
Figure 7.12: Incipient lateral spreading at west abutment,
Swanns Road Bridge.
Figure 7.13: Incipient lateral spreading at north abutment,
Gayhurst Road Bridge.
Figure 7.14: Cracking of north abutment, Swanns Road
Bridge.
Figure 7.15: Cracking of retaining wall, north bank of the
Avon River.
(a) Buckled span. (b) Sheared bearing on east bank.
Figure 7.16: Footbridge on the Avon River near Medway Road.
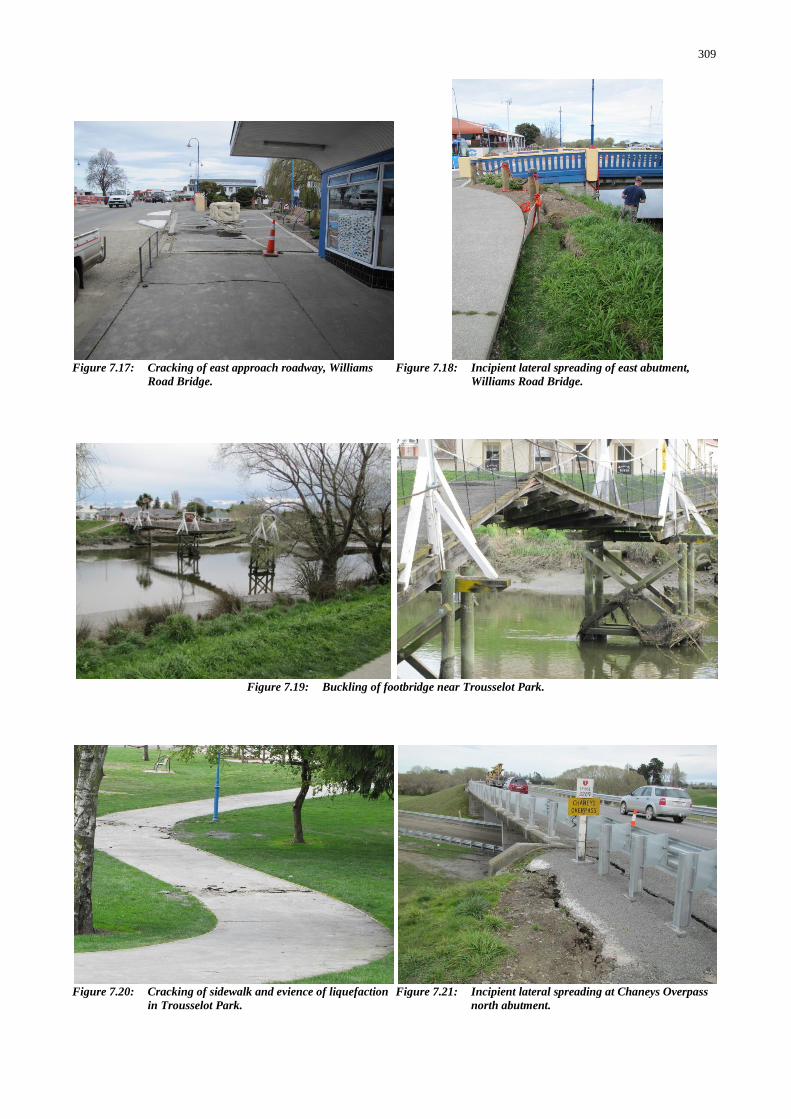
309
Figure 7.17: Cracking of east approach roadway, Williams
Road Bridge.
Figure 7.18: Incipient lateral spreading of east abutment,
Williams Road Bridge.
Figure 7.19: Buckling of footbridge near Trousselot Park.
Figure 7.20: Cracking of sidewalk and evience of liquefaction
in Trousselot Park.
Figure 7.21: Incipient lateral spreading at Chaneys Overpass
north abutment.
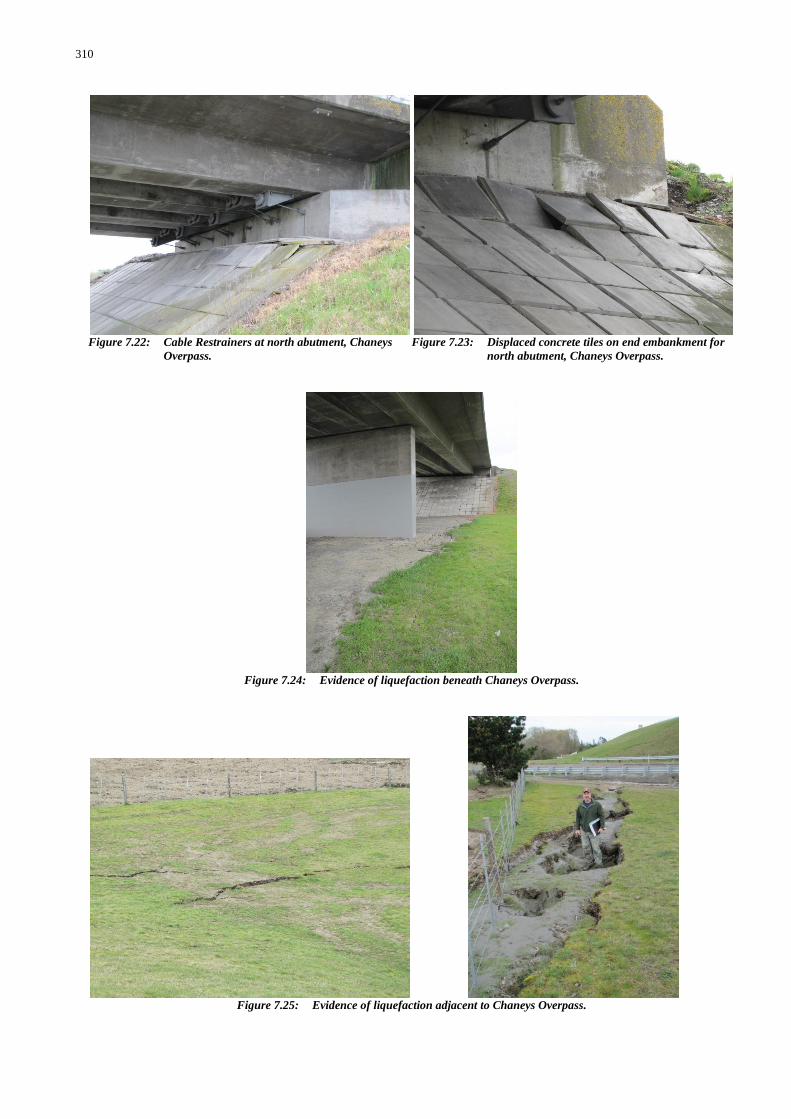
310
Figure 7.22: Cable Restrainers at north abutment, Chaneys
Overpass.
Figure 7.23: Displaced concrete tiles on end embankment for
north abutment, Chaneys Overpass.
Figure 7.24: Evidence of liquefaction beneath Chaneys Overpass.
Figure 7.25: Evidence of liquefaction adjacent to Chaneys Overpass.
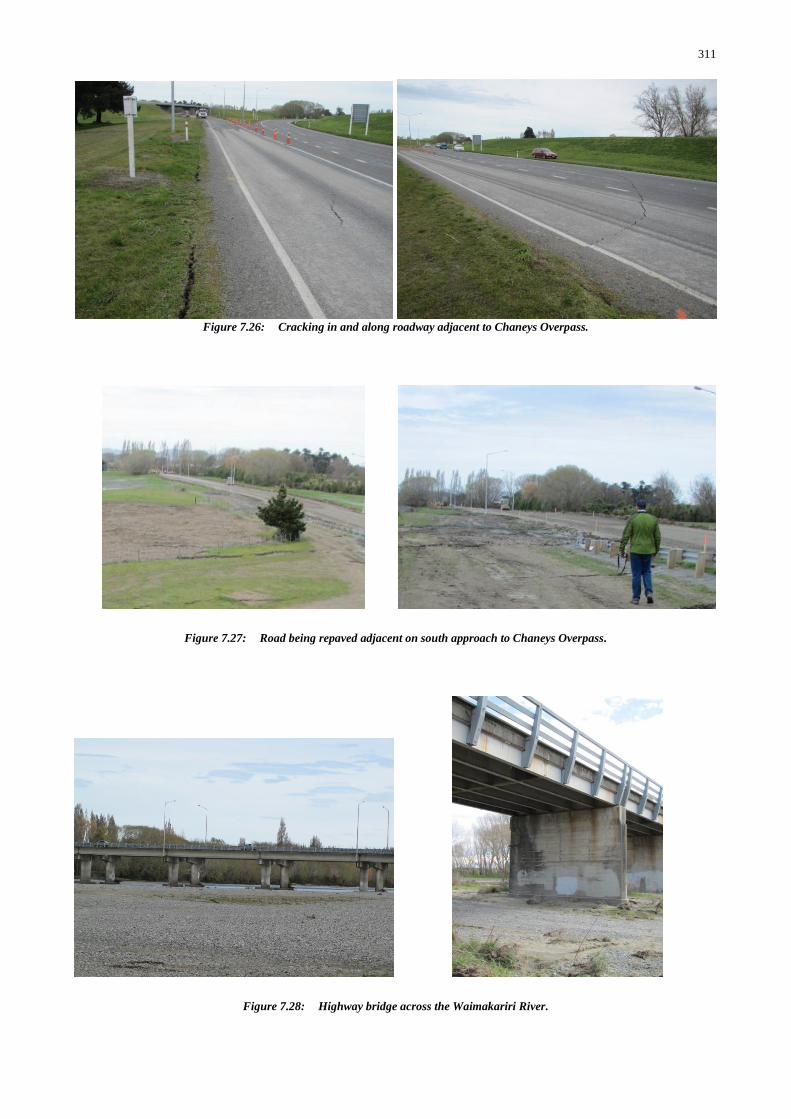
311
Figure 7.26: Cracking in and along roadway adjacent to Chaneys Overpass.
Figure 7.27: Road being repaved adjacent on south approach to Chaneys Overpass.
Figure 7.28: Highway bridge across the Waimakariri River.
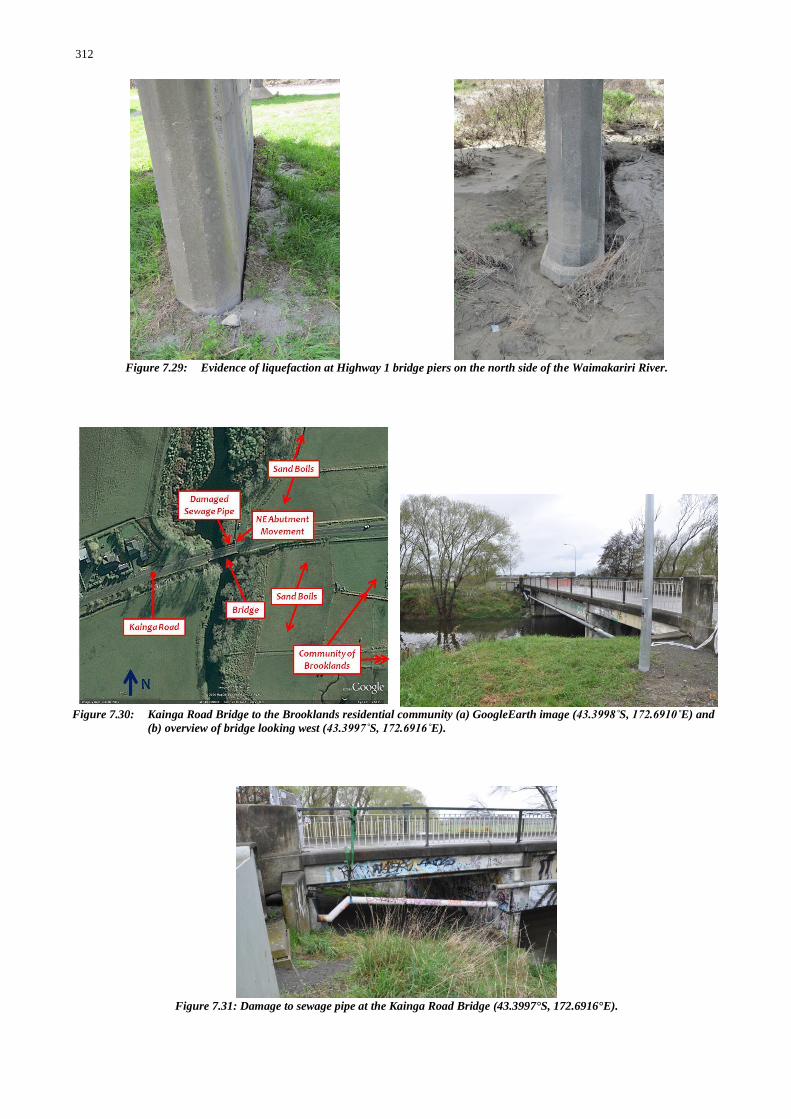
312
Figure 7.29: Evidence of liquefaction at Highway 1 bridge piers on the north side of the Waimakariri River.
Figure 7.30: Kainga Road Bridge to the Brooklands residential community (a) GoogleEarth image (43.3998˚S, 172.6910˚E) and
(b) overview of bridge looking west (43.3997˚S, 172.6916˚E).
Figure 7.31: Damage to sewage pipe at the Kainga Road Bridge (43.3997°S, 172.6916°E).
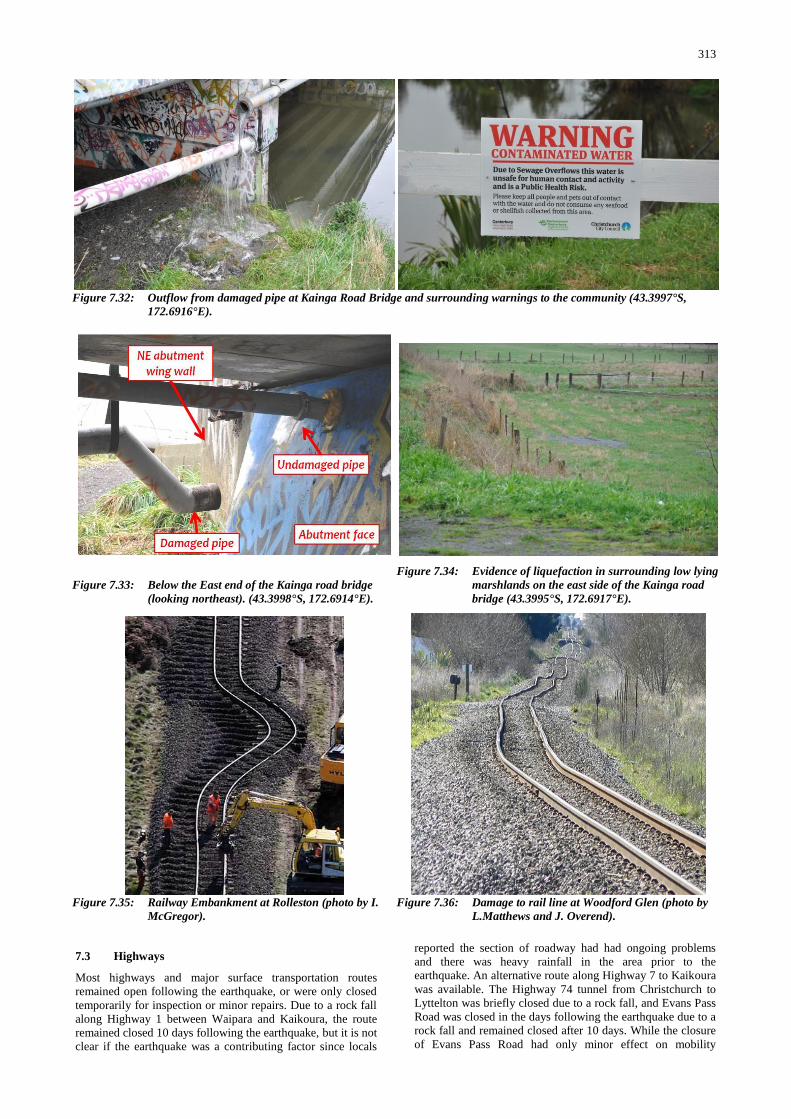
313
7.3 Highways
Most highways and major surface transportation routes
remained open following the earthquake, or were only closed
temporarily for inspection or minor repairs. Due to a rock fall
along Highway 1 between Waipara and Kaikoura, the route
remained closed 10 days following the earthquake, but it is not
clear if the earthquake was a contributing factor since locals
reported the section of roadway had had ongoing problems
and there was heavy rainfall in the area prior to the
earthquake. An alternative route along Highway 7 to Kaikoura
was available. The Highway 74 tunnel from Christchurch to
Lyttelton was briefly closed due to a rock fall, and Evans Pass
Road was closed in the days following the earthquake due to a
rock fall and remained closed after 10 days. While the closure
of Evans Pass Road had only minor effect on mobility
Figure 7.32: Outflow from damaged pipe at Kainga Road Bridge and surrounding warnings to the community (43.3997°S,
172.6916°E).
Figure 7.33: Below the East end of the Kainga road bridge
(looking northeast). (43.3998°S, 172.6914°E).
Figure 7.34: Evidence of liquefaction in surrounding low lying
marshlands on the east side of the Kainga road
bridge (43.3995°S, 172.6917°E).
Figure 7.35: Railway Embankment at Rolleston (photo by I.
McGregor).
Figure 7.36: Damage to rail line at Woodford Glen (photo by
L.Matthews and J. Overend).
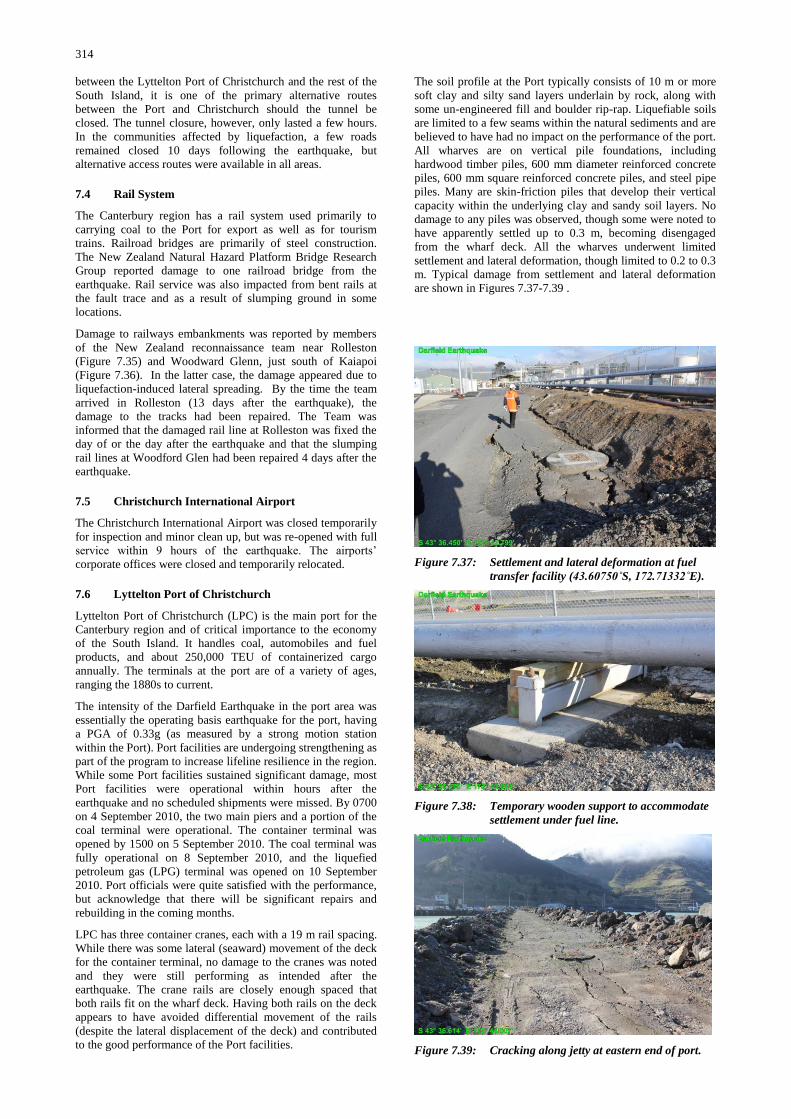
314
between the Lyttelton Port of Christchurch and the rest of the
South Island, it is one of the primary alternative routes
between the Port and Christchurch should the tunnel be
closed. The tunnel closure, however, only lasted a few hours.
In the communities affected by liquefaction, a few roads
remained closed 10 days following the earthquake, but
alternative access routes were available in all areas.
7.4 Rail System
The Canterbury region has a rail system used primarily to
carrying coal to the Port for export as well as for tourism
trains. Railroad bridges are primarily of steel construction.
The New Zealand Natural Hazard Platform Bridge Research
Group reported damage to one railroad bridge from the
earthquake. Rail service was also impacted from bent rails at
the fault trace and as a result of slumping ground in some
locations.
Damage to railways embankments was reported by members
of the New Zealand reconnaissance team near Rolleston
(Figure 7.35) and Woodward Glenn, just south of Kaiapoi
(Figure 7.36). In the latter case, the damage appeared due to
liquefaction-induced lateral spreading. By the time the team
arrived in Rolleston (13 days after the earthquake), the
damage to the tracks had been repaired. The Team was
informed that the damaged rail line at Rolleston was fixed the
day of or the day after the earthquake and that the slumping
rail lines at Woodford Glen had been repaired 4 days after the
earthquake.
7.5 Christchurch International Airport
The Christchurch International Airport was closed temporarily
for inspection and minor clean up, but was re-opened with full
service within 9 hours of the earthquake. The airports‟
corporate offices were closed and temporarily relocated.
7.6 Lyttelton Port of Christchurch
Lyttelton Port of Christchurch (LPC) is the main port for the
Canterbury region and of critical importance to the economy
of the South Island. It handles coal, automobiles and fuel
products, and about 250,000 TEU of containerized cargo
annually. The terminals at the port are of a variety of ages,
ranging the 1880s to current.
The intensity of the Darfield Earthquake in the port area was
essentially the operating basis earthquake for the port, having
a PGA of 0.33g (as measured by a strong motion station
within the Port). Port facilities are undergoing strengthening as
part of the program to increase lifeline resilience in the region.
While some Port facilities sustained significant damage, most
Port facilities were operational within hours after the
earthquake and no scheduled shipments were missed. By 0700
on 4 September 2010, the two main piers and a portion of the
coal terminal were operational. The container terminal was
opened by 1500 on 5 September 2010. The coal terminal was
fully operational on 8 September 2010, and the liquefied
petroleum gas (LPG) terminal was opened on 10 September
2010. Port officials were quite satisfied with the performance,
but acknowledge that there will be significant repairs and
rebuilding in the coming months.
LPC has three container cranes, each with a 19 m rail spacing.
While there was some lateral (seaward) movement of the deck
for the container terminal, no damage to the cranes was noted
and they were still performing as intended after the
earthquake. The crane rails are closely enough spaced that
both rails fit on the wharf deck. Having both rails on the deck
appears to have avoided differential movement of the rails
(despite the lateral displacement of the deck) and contributed
to the good performance of the Port facilities.
The soil profile at the Port typically consists of 10 m or more
soft clay and silty sand layers underlain by rock, along with
some un-engineered fill and boulder rip-rap. Liquefiable soils
are limited to a few seams within the natural sediments and are
believed to have had no impact on the performance of the port.
All wharves are on vertical pile foundations, including
hardwood timber piles, 600 mm diameter reinforced concrete
piles, 600 mm square reinforced concrete piles, and steel pipe
piles. Many are skin-friction piles that develop their vertical
capacity within the underlying clay and sandy soil layers. No
damage to any piles was observed, though some were noted to
have apparently settled up to 0.3 m, becoming disengaged
from the wharf deck. All the wharves underwent limited
settlement and lateral deformation, though limited to 0.2 to 0.3
m. Typical damage from settlement and lateral deformation
are shown in Figures 7.37-7.39 .
Figure 7.37: Settlement and lateral deformation at fuel
transfer facility (43.60750˚S, 172.71332˚E).
Figure 7.38: Temporary wooden support to accommodate
settlement under fuel line.
Figure 7.39: Cracking along jetty at eastern end of port.
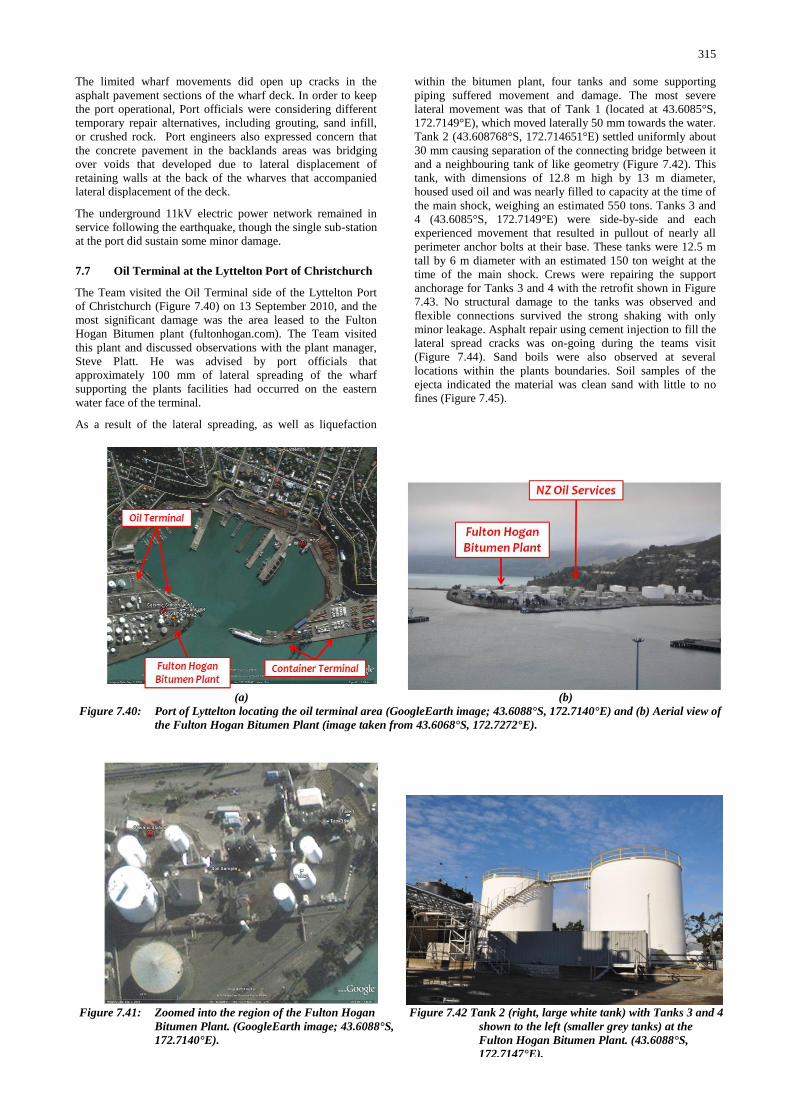
315
The limited wharf movements did open up cracks in the
asphalt pavement sections of the wharf deck. In order to keep
the port operational, Port officials were considering different
temporary repair alternatives, including grouting, sand infill,
or crushed rock. Port engineers also expressed concern that
the concrete pavement in the backlands areas was bridging
over voids that developed due to lateral displacement of
retaining walls at the back of the wharves that accompanied
lateral displacement of the deck.
The underground 11kV electric power network remained in
service following the earthquake, though the single sub-station
at the port did sustain some minor damage.
7.7 Oil Terminal at the Lyttelton Port of Christchurch
The Team visited the Oil Terminal side of the Lyttelton Port
of Christchurch (Figure 7.40) on 13 September 2010, and the
most significant damage was the area leased to the Fulton
Hogan Bitumen plant (fultonhogan.com). The Team visited
this plant and discussed observations with the plant manager,
Steve Platt. He was advised by port officials that
approximately 100 mm of lateral spreading of the wharf
supporting the plants facilities had occurred on the eastern
water face of the terminal.
As a result of the lateral spreading, as well as liquefaction
within the bitumen plant, four tanks and some supporting
piping suffered movement and damage. The most severe
lateral movement was that of Tank 1 (located at 43.6085°S,
172.7149°E), which moved laterally 50 mm towards the water.
Tank 2 (43.608768°S, 172.714651°E) settled uniformly about
30 mm causing separation of the connecting bridge between it
and a neighbouring tank of like geometry (Figure 7.42). This
tank, with dimensions of 12.8 m high by 13 m diameter,
housed used oil and was nearly filled to capacity at the time of
the main shock, weighing an estimated 550 tons. Tanks 3 and
4 (43.6085°S, 172.7149°E) were side-by-side and each
experienced movement that resulted in pullout of nearly all
perimeter anchor bolts at their base. These tanks were 12.5 m
tall by 6 m diameter with an estimated 150 ton weight at the
time of the main shock. Crews were repairing the support
anchorage for Tanks 3 and 4 with the retrofit shown in Figure
7.43. No structural damage to the tanks was observed and
flexible connections survived the strong shaking with only
minor leakage. Asphalt repair using cement injection to fill the
lateral spread cracks was on-going during the teams visit
(Figure 7.44). Sand boils were also observed at several
locations within the plants boundaries. Soil samples of the
ejecta indicated the material was clean sand with little to no
fines (Figure 7.45).
(a) (b)
Figure 7.40: Port of Lyttelton locating the oil terminal area (GoogleEarth image; 43.6088°S, 172.7140°E) and (b) Aerial view of
the Fulton Hogan Bitumen Plant (image taken from 43.6068°S, 172.7272°E).
Figure 7.41: Zoomed into the region of the Fulton Hogan
Bitumen Plant. (GoogleEarth image; 43.6088°S,
172.7140°E).
Figure 7.42 Tank 2 (right, large white tank) with Tanks 3 and 4
shown to the left (smaller grey tanks) at the
Fulton Hogan Bitumen Plant. (43.6088°S,
172.7147°E).
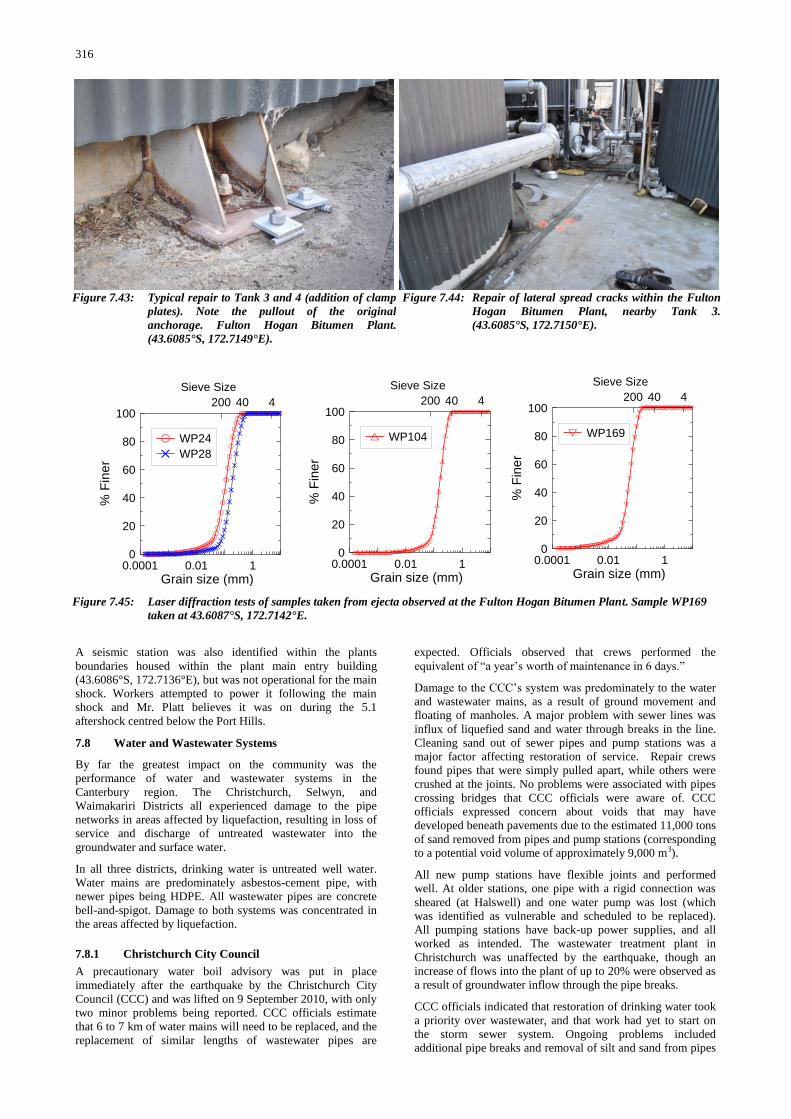
316
A seismic station was also identified within the plants
boundaries housed within the plant main entry building
(43.6086°S, 172.7136°E), but was not operational for the main
shock. Workers attempted to power it following the main
shock and Mr. Platt believes it was on during the 5.1
aftershock centred below the Port Hills.
7.8 Water and Wastewater Systems
By far the greatest impact on the community was the
performance of water and wastewater systems in the
Canterbury region. The Christchurch, Selwyn, and
Waimakariri Districts all experienced damage to the pipe
networks in areas affected by liquefaction, resulting in loss of
service and discharge of untreated wastewater into the
groundwater and surface water.
In all three districts, drinking water is untreated well water.
Water mains are predominately asbestos-cement pipe, with
newer pipes being HDPE. All wastewater pipes are concrete
bell-and-spigot. Damage to both systems was concentrated in
the areas affected by liquefaction.
7.8.1 Christchurch City Council
A precautionary water boil advisory was put in place
immediately after the earthquake by the Christchurch City
Council (CCC) and was lifted on 9 September 2010, with only
two minor problems being reported. CCC officials estimate
that 6 to 7 km of water mains will need to be replaced, and the
replacement of similar lengths of wastewater pipes are
expected. Officials observed that crews performed the
equivalent of “a year‟s worth of maintenance in 6 days.”
Damage to the CCC‟s system was predominately to the water
and wastewater mains, as a result of ground movement and
floating of manholes. A major problem with sewer lines was
influx of liquefied sand and water through breaks in the line.
Cleaning sand out of sewer pipes and pump stations was a
major factor affecting restoration of service. Repair crews
found pipes that were simply pulled apart, while others were
crushed at the joints. No problems were associated with pipes
crossing bridges that CCC officials were aware of. CCC
officials expressed concern about voids that may have
developed beneath pavements due to the estimated 11,000 tons
of sand removed from pipes and pump stations (corresponding
to a potential void volume of approximately 9,000 m3).
All new pump stations have flexible joints and performed
well. At older stations, one pipe with a rigid connection was
sheared (at Halswell) and one water pump was lost (which
was identified as vulnerable and scheduled to be replaced).
All pumping stations have back-up power supplies, and all
worked as intended. The wastewater treatment plant in
Christchurch was unaffected by the earthquake, though an
increase of flows into the plant of up to 20% were observed as
a result of groundwater inflow through the pipe breaks.
CCC officials indicated that restoration of drinking water took
a priority over wastewater, and that work had yet to start on
the storm sewer system. Ongoing problems included
additional pipe breaks and removal of silt and sand from pipes
Figure 7.43: Typical repair to Tank 3 and 4 (addition of clamp
plates). Note the pullout of the original
anchorage. Fulton Hogan Bitumen Plant.
(43.6085°S, 172.7149°E).
Figure 7.44: Repair of lateral spread cracks within the Fulton
Hogan Bitumen Plant, nearby Tank 3.
(43.6085°S, 172.7150°E).
0.0001 0.01 1
Grain size (mm)
0
20
40
60
80
100
% F
ine
r
WP24
WP28
440200
Sieve Size
0.0001 0.01 1
Grain size (mm)
0
20
40
60
80
100
% F
ine
r
WP104
440200
Sieve Size
0.0001 0.01 1
Grain size (mm)
0
20
40
60
80
100
% F
ine
r
WP169
440200
Sieve Size
Figure 7.45: Laser diffraction tests of samples taken from ejecta observed at the Fulton Hogan Bitumen Plant. Sample WP169
taken at 43.6087°S, 172.7142°E.
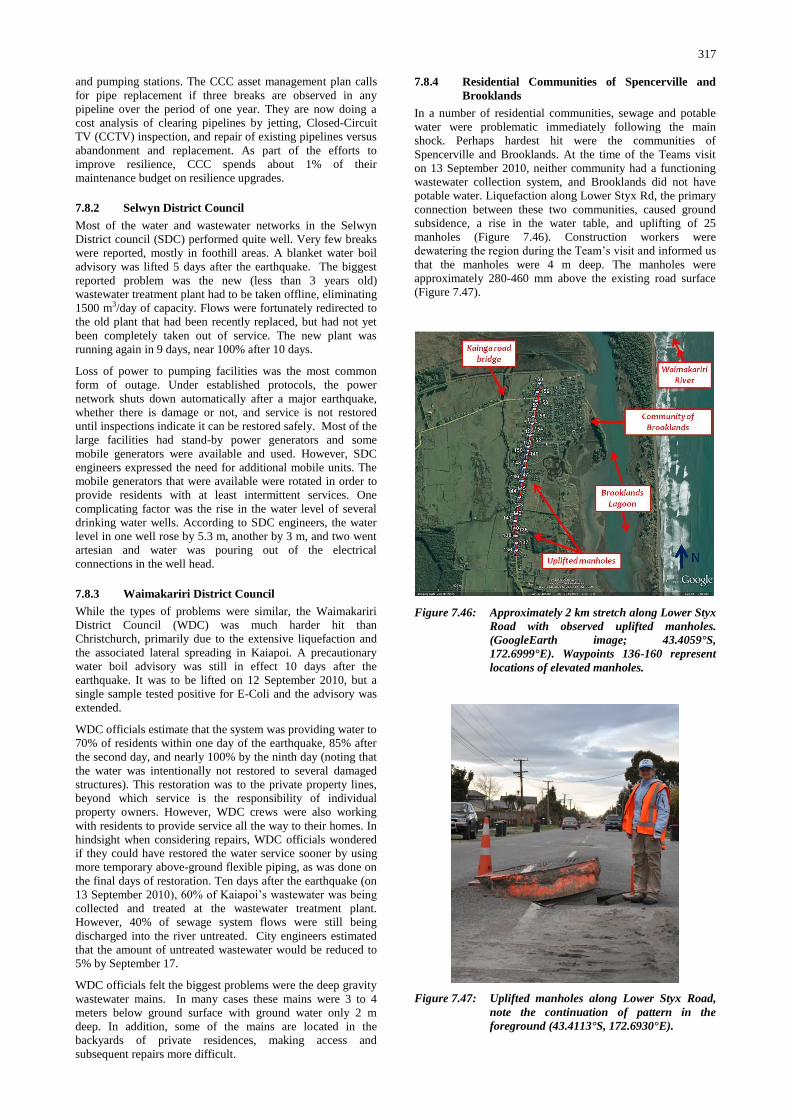
317
and pumping stations. The CCC asset management plan calls
for pipe replacement if three breaks are observed in any
pipeline over the period of one year. They are now doing a
cost analysis of clearing pipelines by jetting, Closed-Circuit
TV (CCTV) inspection, and repair of existing pipelines versus
abandonment and replacement. As part of the efforts to
improve resilience, CCC spends about 1% of their
maintenance budget on resilience upgrades.
7.8.2 Selwyn District Council
Most of the water and wastewater networks in the Selwyn
District council (SDC) performed quite well. Very few breaks
were reported, mostly in foothill areas. A blanket water boil
advisory was lifted 5 days after the earthquake. The biggest
reported problem was the new (less than 3 years old)
wastewater treatment plant had to be taken offline, eliminating
1500 m3/day of capacity. Flows were fortunately redirected to
the old plant that had been recently replaced, but had not yet
been completely taken out of service. The new plant was
running again in 9 days, near 100% after 10 days.
Loss of power to pumping facilities was the most common
form of outage. Under established protocols, the power
network shuts down automatically after a major earthquake,
whether there is damage or not, and service is not restored
until inspections indicate it can be restored safely. Most of the
large facilities had stand-by power generators and some
mobile generators were available and used. However, SDC
engineers expressed the need for additional mobile units. The
mobile generators that were available were rotated in order to
provide residents with at least intermittent services. One
complicating factor was the rise in the water level of several
drinking water wells. According to SDC engineers, the water
level in one well rose by 5.3 m, another by 3 m, and two went
artesian and water was pouring out of the electrical
connections in the well head.
7.8.3 Waimakariri District Council
While the types of problems were similar, the Waimakariri
District Council (WDC) was much harder hit than
Christchurch, primarily due to the extensive liquefaction and
the associated lateral spreading in Kaiapoi. A precautionary
water boil advisory was still in effect 10 days after the
earthquake. It was to be lifted on 12 September 2010, but a
single sample tested positive for E-Coli and the advisory was
extended.
WDC officials estimate that the system was providing water to
70% of residents within one day of the earthquake, 85% after
the second day, and nearly 100% by the ninth day (noting that
the water was intentionally not restored to several damaged
structures). This restoration was to the private property lines,
beyond which service is the responsibility of individual
property owners. However, WDC crews were also working
with residents to provide service all the way to their homes. In
hindsight when considering repairs, WDC officials wondered
if they could have restored the water service sooner by using
more temporary above-ground flexible piping, as was done on
the final days of restoration. Ten days after the earthquake (on
13 September 2010), 60% of Kaiapoi‟s wastewater was being
collected and treated at the wastewater treatment plant.
However, 40% of sewage system flows were still being
discharged into the river untreated. City engineers estimated
that the amount of untreated wastewater would be reduced to
5% by September 17.
WDC officials felt the biggest problems were the deep gravity
wastewater mains. In many cases these mains were 3 to 4
meters below ground surface with ground water only 2 m
deep. In addition, some of the mains are located in the
backyards of private residences, making access and
subsequent repairs more difficult.
7.8.4 Residential Communities of Spencerville and
Brooklands
In a number of residential communities, sewage and potable
water were problematic immediately following the main
shock. Perhaps hardest hit were the communities of
Spencerville and Brooklands. At the time of the Teams visit
on 13 September 2010, neither community had a functioning
wastewater collection system, and Brooklands did not have
potable water. Liquefaction along Lower Styx Rd, the primary
connection between these two communities, caused ground
subsidence, a rise in the water table, and uplifting of 25
manholes (Figure 7.46). Construction workers were
dewatering the region during the Team‟s visit and informed us
that the manholes were 4 m deep. The manholes were
approximately 280-460 mm above the existing road surface
(Figure 7.47).
Figure 7.46: Approximately 2 km stretch along Lower Styx
Road with observed uplifted manholes.
(GoogleEarth image; 43.4059°S,
172.6999°E). Waypoints 136-160 represent
locations of elevated manholes.
Figure 7.47: Uplifted manholes along Lower Styx Road,
note the continuation of pattern in the
foreground (43.4113°S, 172.6930°E).
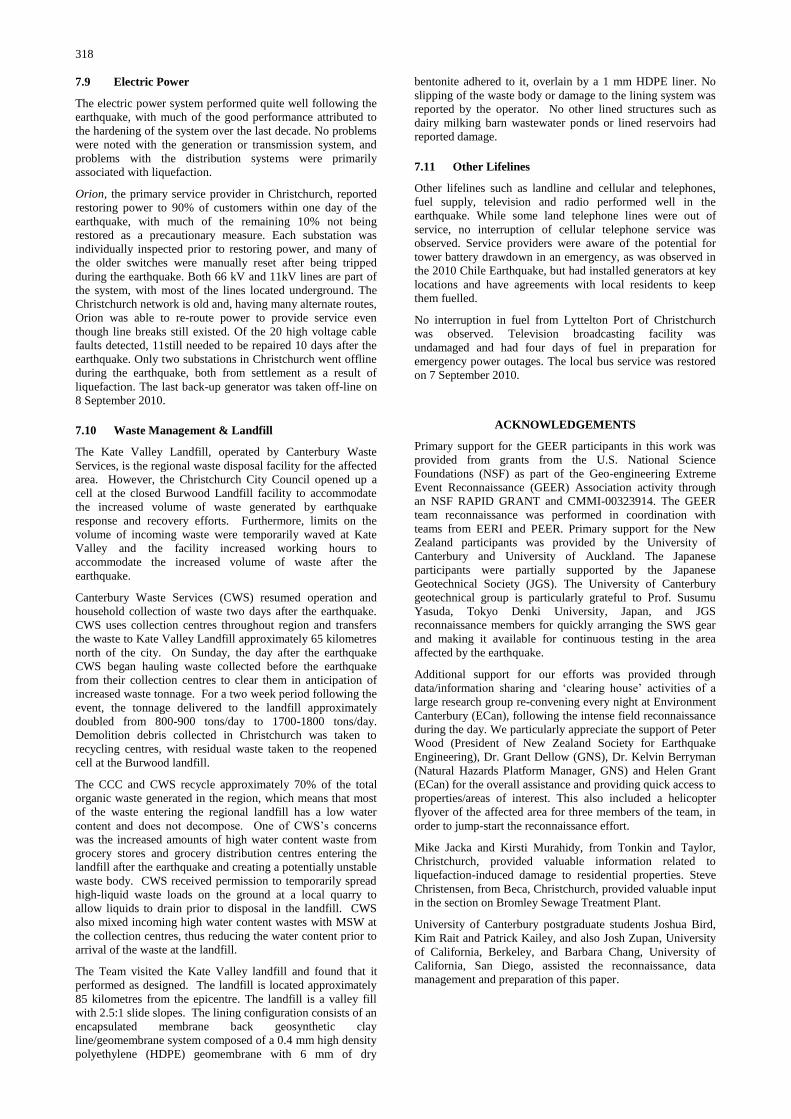
318
7.9 Electric Power
The electric power system performed quite well following the
earthquake, with much of the good performance attributed to
the hardening of the system over the last decade. No problems
were noted with the generation or transmission system, and
problems with the distribution systems were primarily
associated with liquefaction.
Orion, the primary service provider in Christchurch, reported
restoring power to 90% of customers within one day of the
earthquake, with much of the remaining 10% not being
restored as a precautionary measure. Each substation was
individually inspected prior to restoring power, and many of
the older switches were manually reset after being tripped
during the earthquake. Both 66 kV and 11kV lines are part of
the system, with most of the lines located underground. The
Christchurch network is old and, having many alternate routes,
Orion was able to re-route power to provide service even
though line breaks still existed. Of the 20 high voltage cable
faults detected, 11still needed to be repaired 10 days after the
earthquake. Only two substations in Christchurch went offline
during the earthquake, both from settlement as a result of
liquefaction. The last back-up generator was taken off-line on
8 September 2010.
7.10 Waste Management & Landfill
The Kate Valley Landfill, operated by Canterbury Waste
Services, is the regional waste disposal facility for the affected
area. However, the Christchurch City Council opened up a
cell at the closed Burwood Landfill facility to accommodate
the increased volume of waste generated by earthquake
response and recovery efforts. Furthermore, limits on the
volume of incoming waste were temporarily waved at Kate
Valley and the facility increased working hours to
accommodate the increased volume of waste after the
earthquake.
Canterbury Waste Services (CWS) resumed operation and
household collection of waste two days after the earthquake.
CWS uses collection centres throughout region and transfers
the waste to Kate Valley Landfill approximately 65 kilometres
north of the city. On Sunday, the day after the earthquake
CWS began hauling waste collected before the earthquake
from their collection centres to clear them in anticipation of
increased waste tonnage. For a two week period following the
event, the tonnage delivered to the landfill approximately
doubled from 800-900 tons/day to 1700-1800 tons/day.
Demolition debris collected in Christchurch was taken to
recycling centres, with residual waste taken to the reopened
cell at the Burwood landfill.
The CCC and CWS recycle approximately 70% of the total
organic waste generated in the region, which means that most
of the waste entering the regional landfill has a low water
content and does not decompose. One of CWS‟s concerns
was the increased amounts of high water content waste from
grocery stores and grocery distribution centres entering the
landfill after the earthquake and creating a potentially unstable
waste body. CWS received permission to temporarily spread
high-liquid waste loads on the ground at a local quarry to
allow liquids to drain prior to disposal in the landfill. CWS
also mixed incoming high water content wastes with MSW at
the collection centres, thus reducing the water content prior to
arrival of the waste at the landfill.
The Team visited the Kate Valley landfill and found that it
performed as designed. The landfill is located approximately
85 kilometres from the epicentre. The landfill is a valley fill
with 2.5:1 slide slopes. The lining configuration consists of an
encapsulated membrane back geosynthetic clay
line/geomembrane system composed of a 0.4 mm high density
polyethylene (HDPE) geomembrane with 6 mm of dry
bentonite adhered to it, overlain by a 1 mm HDPE liner. No
slipping of the waste body or damage to the lining system was
reported by the operator. No other lined structures such as
dairy milking barn wastewater ponds or lined reservoirs had
reported damage.
7.11 Other Lifelines
Other lifelines such as landline and cellular and telephones,
fuel supply, television and radio performed well in the
earthquake. While some land telephone lines were out of
service, no interruption of cellular telephone service was
observed. Service providers were aware of the potential for
tower battery drawdown in an emergency, as was observed in
the 2010 Chile Earthquake, but had installed generators at key
locations and have agreements with local residents to keep
them fuelled.
No interruption in fuel from Lyttelton Port of Christchurch
was observed. Television broadcasting facility was
undamaged and had four days of fuel in preparation for
emergency power outages. The local bus service was restored
on 7 September 2010.
ACKNOWLEDGEMENTS
Primary support for the GEER participants in this work was
provided from grants from the U.S. National Science
Foundations (NSF) as part of the Geo-engineering Extreme
Event Reconnaissance (GEER) Association activity through
an NSF RAPID GRANT and CMMI-00323914. The GEER
team reconnaissance was performed in coordination with
teams from EERI and PEER. Primary support for the New
Zealand participants was provided by the University of
Canterbury and University of Auckland. The Japanese
participants were partially supported by the Japanese
Geotechnical Society (JGS). The University of Canterbury
geotechnical group is particularly grateful to Prof. Susumu
Yasuda, Tokyo Denki University, Japan, and JGS
reconnaissance members for quickly arranging the SWS gear
and making it available for continuous testing in the area
affected by the earthquake.
Additional support for our efforts was provided through
data/information sharing and „clearing house‟ activities of a
large research group re-convening every night at Environment
Canterbury (ECan), following the intense field reconnaissance
during the day. We particularly appreciate the support of Peter
Wood (President of New Zealand Society for Earthquake
Engineering), Dr. Grant Dellow (GNS), Dr. Kelvin Berryman
(Natural Hazards Platform Manager, GNS) and Helen Grant
(ECan) for the overall assistance and providing quick access to
properties/areas of interest. This also included a helicopter
flyover of the affected area for three members of the team, in
order to jump-start the reconnaissance effort.
Mike Jacka and Kirsti Murahidy, from Tonkin and Taylor,
Christchurch, provided valuable information related to
liquefaction-induced damage to residential properties. Steve
Christensen, from Beca, Christchurch, provided valuable input
in the section on Bromley Sewage Treatment Plant.
University of Canterbury postgraduate students Joshua Bird,
Kim Rait and Patrick Kailey, and also Josh Zupan, University
of California, Berkeley, and Barbara Chang, University of
California, San Diego, assisted the reconnaissance, data
management and preparation of this paper.
319
REFERENCES
Andrus, R.D., and Stokoe II, K.H. (2000). Liquefaction
resistance of soils from shear wave velocity. Journal of
Geotechnical and Geoenvironmental Engineering, ASCE
126(11):1015-1025.
Ambraseys, N.N. (1988). Engineering Seismology.
Earthquake Engineering and Structural Dynamics, 17: 1-
105.
Berrill, J.B., Mulqueen, P.C. and Ooi, E.T.C. (1994).
Liquefaction at Kaiapoi in the 1901 Cheviot, New
Zealand, Earthquake. Bulletin of the New Zealand Society
for Earthquake Engineering, 27(3): 178-189.
Boyle, Tony (2010). Personal Communication, 27 September
2010.
Brown, L.J. and Weeber, J.H. (1992). Geology of the
Christchurch Urban Area. Institute of Geological and
Nuclear Sciences.
CH2m Beca Ltd. (2003). Kaiapoi Sewage Treatment Plant –
Assessment of Environmental Effects for Discharge to
Land, Report prepared for Waimakariri District Council.
Chanerley, A.A. and Alexander, N.A. (2010). Obtaining
estimates of the low-frequency „fling‟, instrument tilts
and displacement timeseries using wavelet
decomposition, Bull. Earthquake Eng., 8: 231–255.
Chiou, B.S.J. and Youngs, R.R. (2008). An NGA Model for
the average horizontal component of peak ground motion
and response spectra, Earthquake Spectra, 24: 173-215.
Cowan, H., Nicol, A. and Tonkin, P. (1996). A comparison of
historical and paleoseismicity in a newly formed fault
zone and a mature fault zone, North Canterbury, New
Zealand. J. geophys. Res., 101: 6021–6036.
DeMets, C., Gordon, R. G., Argus, D. F. and Stein, S. (1994).
Effect of recent revisions to the geomagnetic time scale
on estimates of current plate motion. Geophysical
Research Letters, 21: 2191-2194.
Engineering Darfield Earthquake Blog. (http://
db.nzsee.org.nz:8080/en/web/lfe-darfield-
2010/home)
Environment Canterbury (ECan): http://ecan.govt.nz/
publications/General/solid-facts-christchurch-
liquefaction.pdf
Forsyth, P., Barrell, D. and Jongens, R. (2008). Geology of the
Christchurch area. GNS QMap, 1:2500 000 Geological
Map 16, P. 67.
Google Inc. Google Earth, [map] (2010). Generated by Liam
Wotherspoon: using Google Earth. http://www.
google.com/earth/index.html (generated October 5,
2010).
Griffiths, G.A. (1979). Recent Sedimentation History of the
Waimakariri River, New Zealand. Journal of Hydrology
(New Zealand), 18: 6-28.
Housner, G.W. (1952). Spectrum Intensities of Strong-Motion
Earthquakes. Proc. Symp. Eathquake and Blast Effects on
Structures, Engineering Research Institute, Los Angeles.
Howard, M., Nicol, A., Campbell, J. and Pettinga, J.R. (2005).
Holocene paleoearthquakes on the strike- slip Porters
Pass Fault, Canterbury, New Zealand, N.Z. J. Geol. and
Geophys., 48: 59–74.
Ingham, J. and Griffith, M. (2010). Performance of
unreinforced masonry buildings in the Darfield
Earthquake (First impressions). Reported at the New
Zealand Society for Earthquake Engineering meeting.
Japanese Standards Association (1975). Japanese Industrial
Standard: Method of Swedish Weight Sounding – JIS A
1221 (1975), 1995 Revision.
Larned, S.T., Hicks, D.M., Schmidt, J., Davey, A.J.H., Dey,
K., Scarsbrook, M., Arscott, D.B. and Woods, R.A.
(2008). The Selwyn River of New Zealand: A Benchmark
System for Alluvial Plain Rivers. River Research and
Applications, 24: 1-21.
Moon, L. (2010). Initial assessment of unreinforced masonry
buildings performance in the 2010 Darfield Earthquake.
Reported at the New Zealand Society for Earthquake
Engineering Darfield Earthquake Blog.
(http://db.nzsee.org.nz:8080/en/web/lfe-darfield-
2010/home)
Norris, R.J. and Cooper, A.F. (2001). Late Quaternary slip
rates and slip partitioning on the Alpine Fault, New
Zealand. J. Structural Geol., 23: 507– 520.
NZ Aerial Mapping (2010). NZ Aerial Mapping. Kaiapoi, [air
photo]. Wellington, New Zealand.
Palermo et al. (2010) Preliminary Bridge Findings. report by
the Darfield Earthquake Natural Hazard Platform Bridge
Research Group.
Plan of portion of the plains of Canterbury, [map]. 1:126,720.
Christchurch, NZ: Ward & Reeves, 1865.
Pettinga, J.R., Yetton, M.D., Van Dissen, R.J. and Downes,
G.L. (2001). Earthquake source identification and
characterisation for the Canterbury region, South Island,
New Zealand. Bull. of the N.Z. Soc. For Earthquake
Engineering, 34(4): 282–317.
Quigley, M., P. Villamor, K. Furlong, J. Beavan, R. Van
Dissen, N. Litchfield, T. Stahl, B. Duffy, E. Bilderback,
D. Noble, D. Barrell, R. Jongens, A. Klahn, A. Smith, T.
Wilson, S. Cox and J. Ristau. Mw 7.1 Earthquake on
Unknown Strike-slip Fault Rattles New Zealand‟s South
Island. EOS, Transactions, America Geophysical Union
(in review).
Rathje, E., Bachhuber, J., Cox, B., French, J., Green, R.,
Olson, S., Rix, G., Wells, D. and Suncar, O. (2010).
Geotechnical Engineering Reconnaissance of the 2010
Haiti Earthquake. GEER Association
http://www.geerassociation.org/GEER_Post%
20EQ%20Reports/Haiti_2010/Cover_Haiti10.
html, Report No. GEER-021.
Robb, J.A. (1974). An Ecological Study of the Bromley
Oxidation Ponds and Surrounding Environs, PhD Thesis,
University of Canterbury.
Shell New Zealand (1935). Christchurch and area, [map]
1:63,360. Wellington, New Zealand.
Stokoe II, K.H., Wright, S.G., Bay, J.A. and Roesset, J.M.
(1994). Characterization of geotechnical sites by SASW
method, p. 1-24. In R.D. Woods (Ed.). Geophysical
characterization of sites, IBH Oxford Press, New Delhi.
Te Ara Encyclopedia of New Zealand (2010).
http://www.teara.govt.nz/en/floods/6/7.
320
Von Thun, J., Roehm, L., Scott, G. and Wilson, J. (1988).
Earthquake Ground Motions for Design and Analysis of
Dams, Earthquake Engineering and Soil Dynamics II -
Recent Advances in Ground Motion Evaluation,
Geotechnical Special Publication, 20: 463-481.
Waimakariri District Council (2010). Personal
Communication, 29 September 2010.
Wallace, L., Beavan, J., McCaffrey, R., Berryman, K. and
Denys, P. (2007). Balancing the plate motion budget in
the South Island, New Zealand using GPS, geological and
seismological data. Geophys. J. Int., 168: 332–352.
Ward and Reeves (1985). Plan of portion of the plains of
Canterbury, [map] 1:126,720 (1865). Christchurch, New
Zealand.
Wells, D.L. and Coppersmith, K.J. (1994). New Empirical
Relations among Magnitude, Rupture Length, Rupture
Width, Rupture Area, and Surface Displacement. Bulletin
of the Seismological Society of America, 84(4): 974-1002.
Youd, T.L., Idriss, I.M. et al. (2001). Liquefaction resistance
of soils: summary report from the 1996 NCEER and 1998
NCEER/NSF workshops on evaluation of liquefaction
resistance of soils. Journal of Geotechnical and
Geoenvironmental Engineering, 127: 297-313.


