
Seediscussions,stats,andauthorprofilesforthispublicationat:https://www.researchgate.net/publication/264560486
ExperimentalstudyofthecrackdepthratiothresholdtoanalyzetheslowcrackgrowthbycreepofhighdensityPolyEthylenepipes
ARTICLEinINTERNATIONALJOURNALOFPRESSUREVESSELSANDPIPING·OCTOBER2014
ImpactFactor:1.28·DOI:10.1016/j.ijpvp.2014.07.002
READS
150
5AUTHORS,INCLUDING:
L.Laiarinandrasana
MINESParisTech
73PUBLICATIONS443CITATIONS
SEEPROFILE
LucatelliJean-Marc
VeoliaEnvironment
10PUBLICATIONS9CITATIONS
SEEPROFILE
J.M.Brossard
VeoliaEnvironment
29PUBLICATIONS153CITATIONS
SEEPROFILE
Allin-textreferencesunderlinedinbluearelinkedtopublicationsonResearchGate,
lettingyouaccessandreadthemimmediately.
Availablefrom:L.Laiarinandrasana
Retrievedon:03February2016

lable at ScienceDirect
International Journal of Pressure Vessels and Piping 122 (2014) 22e30
Contents lists avai
International Journal of Pressure Vessels and Piping
journal homepage: www.elsevier .com/locate/ i jpvp
Experimental study of the crack depth ratio threshold to analyze theslow crack growth by creep of high density polyethylene pipes
Lucien Laiarinandrasana a, *, Cl�emence Devilliers a, b, Jean Marc Lucatelli b, c,Emmanuelle Gaudichet-Maurin b, Jean Michel Brossard b
a Centre des Mat�eriaux, MINES ParisTech, CNRS UMR 7633, BP 87, F 91003 Evry Cedex, Franceb VEOLIA Environnement Recherche et Innovation, Centre de Recherche de Maisons-Laffitte, Chemin de la Digue, 78603 Maisons-Laffitte, Francec CAE Caen, Laboratoire Mat�eriaux, 40 Avenue de la 1�ere Arm�ee Française, 14000 Caen, France
a r t i c l e i n f o
Article history:Received 16 April 2013Received in revised form24 July 2014Accepted 28 July 2014Available online 7 August 2014
Keywords:PolyethyleneFractureCreepShallow crackOxidationLifetime
* Corresponding author. Tel.: þ33 1 60 76 30 64; faE-mail address: lucien.laiarina
(L. Laiarinandrasana).
http://dx.doi.org/10.1016/j.ijpvp.2014.07.0020308-0161/© 2014 Elsevier Ltd. All rights reserved.
a b s t r a c t
To assess the durability of drinking water connection pipes subjected to oxidation and slow crack growth,a comprehensive database was constructed on a novel specimen geometry: the pre-cracked NOL ring.
135 tests were carried out consisting of initial crack depth ratio ranging from 0.08 to 0.6; single ordouble longitudinal cracks: tensile with steady strain rate and creep loading. A threshold value of thecrack depth ratio of 0.2, induced by the oxidation was determined by analyzing several mechanicalparameters. This threshold value was shown to be independent on the strain rate effects, single or doublecrack configuration and the kind of loading: tensile or creep. Creep test results with crack depth ratiolarger than 0.2 were then utilized to establish a failure assessment diagram. A methodology allowing theprediction of residual lifetime of in-service pipes was proposed, using this diagram.
© 2014 Elsevier Ltd. All rights reserved.
1. Introduction
To avoid the use of lead in the pipes for drinking water supply, alarge replacement of previous installation by polymeric materialswas carried out in the last decades. The engineering componentsunder study consist of connection pipes that are made of HighDensity PolyEthylene (HDPE). Premature failures were observed onsome of these pipes.
Investigations of fractured pipes highlighted that longitudinalcracks were the origin of the failures.
In addition, the internal wall where the principal crack wasobserved to initiate was mapped with micro-cracks networks. Choiet al. [1,2] reported that these networkswere likely to appear after aperiod of oxidation of the internal wall. The same phenomenawereobserved by Devilliers et al. [3] and they were attributed to stresscorrosion cracking. Indeed, long term chemical aging of these pipeslead to the presence of a thin oxidized layer (~200 mm)mapping theinternal wall. This oxidized layer is composed of brittle HDPE
x: þ33 1 60 76 31 [email protected]
material and the micro-cracks network. The crack depth is of theorder of magnitude of the thickness of the oxidized layer for a wallthickness of 4 mm. Attention is paid here to these shallow cracksthat appeared during the service due to oxidation of the internalwall. One aim of this work is to experimentally investigate theirharmfulness, by means of the determination of a crack depth ratiothreshold beyond which the initial crack can no longer be consid-ered as small crack with its effects in term of fracture mechanicsinvestigations. Actually, the approach utilized here is similar to theexperimental investigation carried out by Sumpter [4] to addressthe constraint effects in fracture of metals. The toughness of thematerial was then plotted as a function of the crack depth ratio onsingle edge notch bending (SENB) specimen.
The observations of the fracture surfaces from a failed pipe,showed striations called discontinuous bands. These patterns,reproduced by Ben Hadj Hamouda et al. [5] on laboratory speci-mens by applying creep load, allowed a better understanding of themechanisms of creep crack growth. Many studies were theninterested in modeling slow crack growths by using fracture me-chanics concepts [5e8]. To the authors' best knowledge, these latterstudies did not consider any interaction between fracture me-chanics and oxidation. The main concerns were the prediction ofthe residual lifetime of HDPE structures containing defects

Fig. 1. NOL ring experimental setup: a) NOL ring (dashed black line) mounted on theloadline of the testing machine, the displacement is applied by the half cylinders(dashed blue line); b) definition of the crack depth ratio a/t. (For interpretation of thereferences to color in this figure legend, the reader is referred to the web version of thisarticle.)
L. Laiarinandrasana et al. / International Journal of Pressure Vessels and Piping 122 (2014) 22e30 23
susceptible to initiate and propagate. The investigations were car-ried out on pre-cracked laboratory specimens, such as FNCT andDENT [5], with generally an initial crack depth ratio of about 0.5.The extension of the study to the real structure consisted of a pieceof pipe containing an external longitudinal crack [5] subjected to asteady internal pressure. This is essentially due to the difficulty toimplant a regular defect on the internal wall, similar to the oneinduced by oxidation. To overcome this difficulty, the present paperattempts to use an intermediate specimen called NOL ring [9] forwhich the initial purpose was to study themechanical behavior of apipe in the transverse direction. The alternative solution suggestedhere consists of an incorporation of internal longitudinal cracks onthese rings. Therefore, the crack would propagate in the throughthickness transverse direction. In fact, Rozental et al. [10] used theNOL ring to assess the degradation of in service pipes. The idea wasto test the degraded pipes i.e.with the oxidized layer containing themicro-cracks network. The values of the ductility (strain at failure)were then supposed to identify the stage of the degradation of thepipes. Additional works on this methodology were carried out byLaiarinandrasana et al. [11] resulting in that the stress state in thecross-section of the NOL ring cannot be considered as homoge-neous. Therefore, the real stressestrain curve of the materialcannot be studied using this kind of structure, unless the in-vestigations were coupled with a finite element analysis (FEA).Moreover, it was demonstrated that the influence of the thinoxidized layer on the overall response of the ring was negligible,due to the small ratio between the oxidized layer and the wallthicknesses.
The motivation of the present work is three folds:
- construct a comprehensive database related to pre-cracked NOLring tests;
- investigate the existence of a threshold value of the crack depthratio beyond which the crack induced by the oxidation cannotbe supposed to be a shallow one;
- establish a creep failure assessment diagram allowing for theprediction of the durability of a pipe, using the selected exper-imental data compatiblewith the tools of fracturemechanics, i.e.deep crack.
To this end, the first part of the paper is devoted to the testprocedure, giving some details about the material under investi-gation, the specimen and the testing machine. Then, for tensiletests with steady strain rate, the results are given in terms of en-gineering stressestrain curve shapes. The crack depth ratio limit issought by examining the evolution of the peak stress, the plateaustrain and two energy densities. The obtained value is then sub-jected to discussion by considering the effects of the strain rate, theinternal diameter, the double cracks.
For the creep tests, the opening displacement reached at theonset of the tertiary creep stage seems to be relevant to determinethe threshold value of the crack depth ratio. Experimental datawhere the crack depth ratios were larger than this threshold valuewere then selected to establish a creep failure assessment diagramallowing for the prediction of residual lifetime of pipes containingdefect.
2. Experimental procedure
2.1. Material and specimen
This work is devoted to a grade of High Density PolyEthylene(HDPE) used in pipes for drinking water supply. The main physico-chemical characteristics, already published in previous work [11],can be summarized as follows: the index of crystallinity is about
55%, the glass transition temperature was estimated at�110 �C, themelting point Tm ¼ 127 �C and the number average molar massMn ¼ 10.2 kg/mol. The HDPE under study is a semi-crystallinepolymer. In order to reveal the expected spherulitic microstruc-ture, a sample was cryo-microtomed and chemically etched beforebeing examined by Scanning Electron Microscopy. Etching partlyeliminated the amorphous phase. Only the “skeleton” of the crys-tallite parts remained, giving an idea of the spherulite meandiameter of 2 mm. It is to be mentioned that the present work wasconcerned with this form of HDPE used in pipes for supply ofdrinking water.
Several pipes were supplied. The characteristic dimensions wereas follows: length¼ 500mm; internal diameter f0¼ 22 and 36mm,and wall thickness t ¼ 3 and 4 mm. From these pipes, the NOL ring[9,11] specimens ofW¼ 10mmwide were first extracted. A specificcracking setup was designed in order to control the pre-crack bypushing razor blade onto the internal wall. Single or double pre-crack(s) were considered, parallel to the pipe axis (longitudinalcrack). Various crack depth ratios a/twere investigated. The noveltywith these pre-cracked rings is due to its relevance to:
- the configuration of the crack in the pipe (longitudinal andinternal);
- the applied steady load featuring in-service sustained internalpressure;
- that this is an intermediate geometry between the classicalfracture mechanics specimens and the engineering structuresuch as a pipe.
2.2. Tensile and creep tests
Tensile and creep tests were carried out thanks to a classicaltesting machine. Fig. 1 sketches the details of the loadline. Thedisplacement is applied on the half cylinders (dashed blue line)

L. Laiarinandrasana et al. / International Journal of Pressure Vessels and Piping 122 (2014) 22e3024
mounted in the internal diameter of the ring (dashed black line).This applied displacement as well as the load were measuredduring the test. Tensile tests were carried out at three crossheadspeeds: 10, 50 and 100 mm/min. Creep tests were conducted withapplied net stress ranging from 5 to 12 MPa. Some tests wereperformed with a video camera to provide some pictures at criticalevents during the tests.
3. Tensile tests results
3.1. Stressestrain curves
Fig. 2 illustrates the shapes of the stressestrain curve obtainedduring tensile tests. The engineering stress and strain were definedas, respectively, the measured load divided by the initial net sectionW(t � a) and the crosshead displacement divided by the initialinternal diameter f0.
Fig. 2a shows that three trends of the stressestrain curve can bedistinguished, depending on the a/t value. The curve correspondingto the specific case of un-cracked ring specimen (solid line; a/t ¼ 0)already reported in Ref. [11] was superimposed to the others. Notethat for un-cracked rings, the engineering stress was modified asthe load divided by the total cross section of the ring(Wt ¼ 10 � 4.5 ¼ 45 mm2). The corresponding stressestrain curveexhibits a peak stress, then a post-yielding stress softening fol-lowed by a plateau before a drop down of the stress correspondingto the failure of the specimen. It can be noticed that conversely towhat is currently reported in the literature [10], there is only oneoccurrence of the yield stress, due to the fixture of the half-cylinders [11].
It can be noticed that the shape of the stressestrain curve ofspecimens provided with small values of a/t as shown by squaresymbols was similar to that encountered with un-cracked ring. Thistrend, where a significant plateau is observed, will be considered asrelative to ductile-type stressestrain curve, noted as “D-type”.Conversely, the brittle-type (B-type) stressestrain curve consists ofa continuous stress decrease after the peak stress (full circles).
Fig. 2. Stress strain curves for internal pre-cracked NOL ring with
Indeed, in this case the crack is supposed to growafter the initiationphase around the peak stress. Between these two configurations, amixed case was reported as transition-type (T-type) curve. It can benoted that although the stiffness is kept unchanged, the peak stressgradually decreases from D-type to B-type curve.
Fig. 2b illustrates the classification of the curves and the corre-sponding total number of conducted tests. The range of a/t dealingwith each type of curve is given as well. For the two extreme cases(D- and B-type curves) the deformed shapes of the NOL ring in thevicinity of the crack tip are shown in Fig. 3. It can be noticed that forB-type, small neck extension is exhibited whereas for D-type thereis essentially homogeneous neck extension in between the two halfcylinders. Note that in Fig. 3a, the deformation state is similar towhat is observed in full (with no crack) specimens.
As mentioned previously the aim here is to better understandthe effects of the crack depth ratio a/t on the stressestrain curvecharacteristic parameters such as the peak stress, the plateau strainand the energy densities (Ei and Ep), as sketched in Fig. 4. This al-lows the determination of a threshold value of the crack depth ratioaccording to the kind of a given characteristic parameter. For thesake of clarity, only 20 experimental results dealing with a cross-head speed of 50 mm/min were selected (Table 1) for the peakstress analysis. D-, T- and B-types are represented by full squares,triangles and circles respectively.
3.2. Determination of the crack depth ratio threshold (a/t)th
Several mechanical parameters were investigated to determinethe threshold value of the crack depth ratio. These parameters wereselected or calculated from the abovementioned stressestraincurves. Then their values were plotted as a function of the crackdepth ratios.
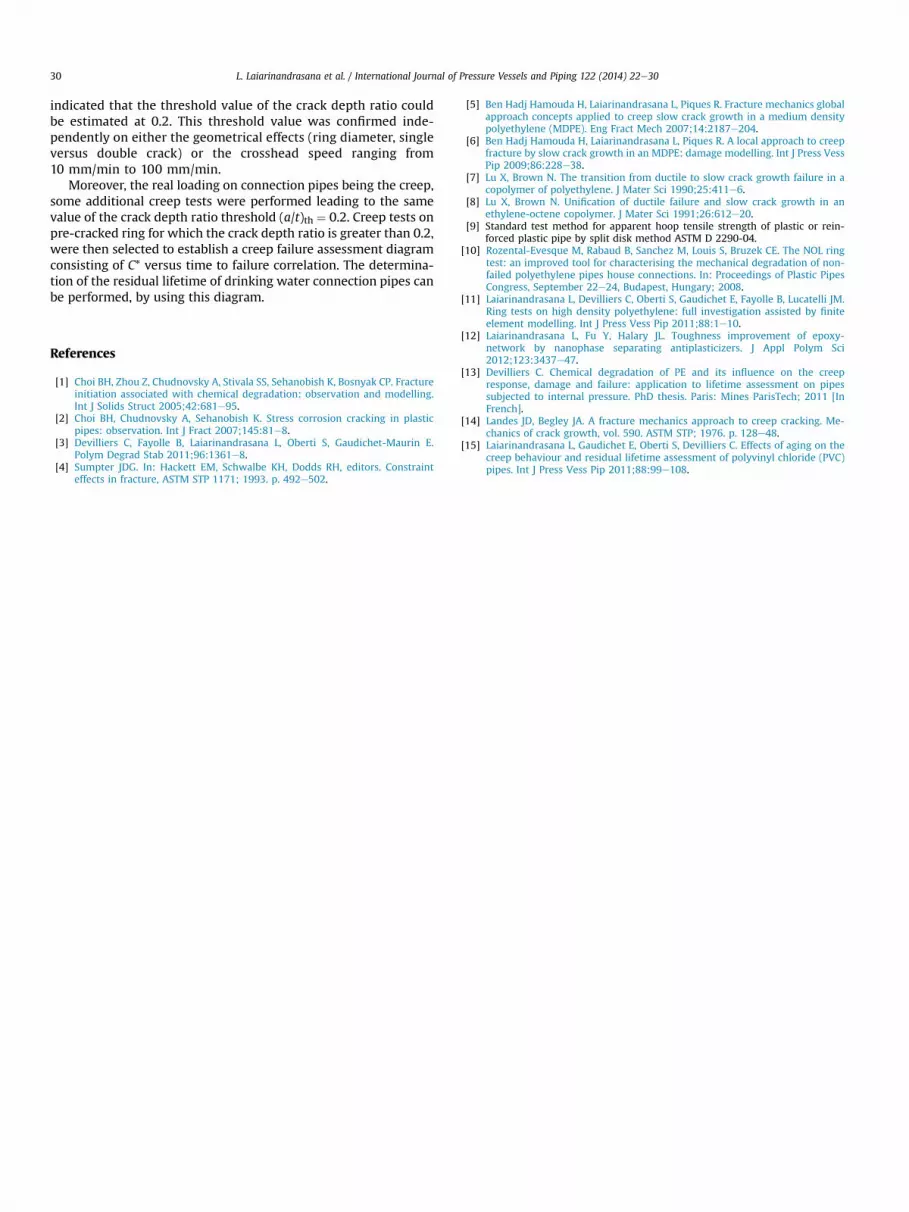
3.2.1. Peak stressFig. 5a displays the peak net stress in function of the crack depth
ratio. Arrows indicate the range of a/t where the type of stresse-strain curvewas observed. B-type curve corresponding to a/t� 0.18
Ductile-type, Mixed: Transition-type and Brittle-like curve.
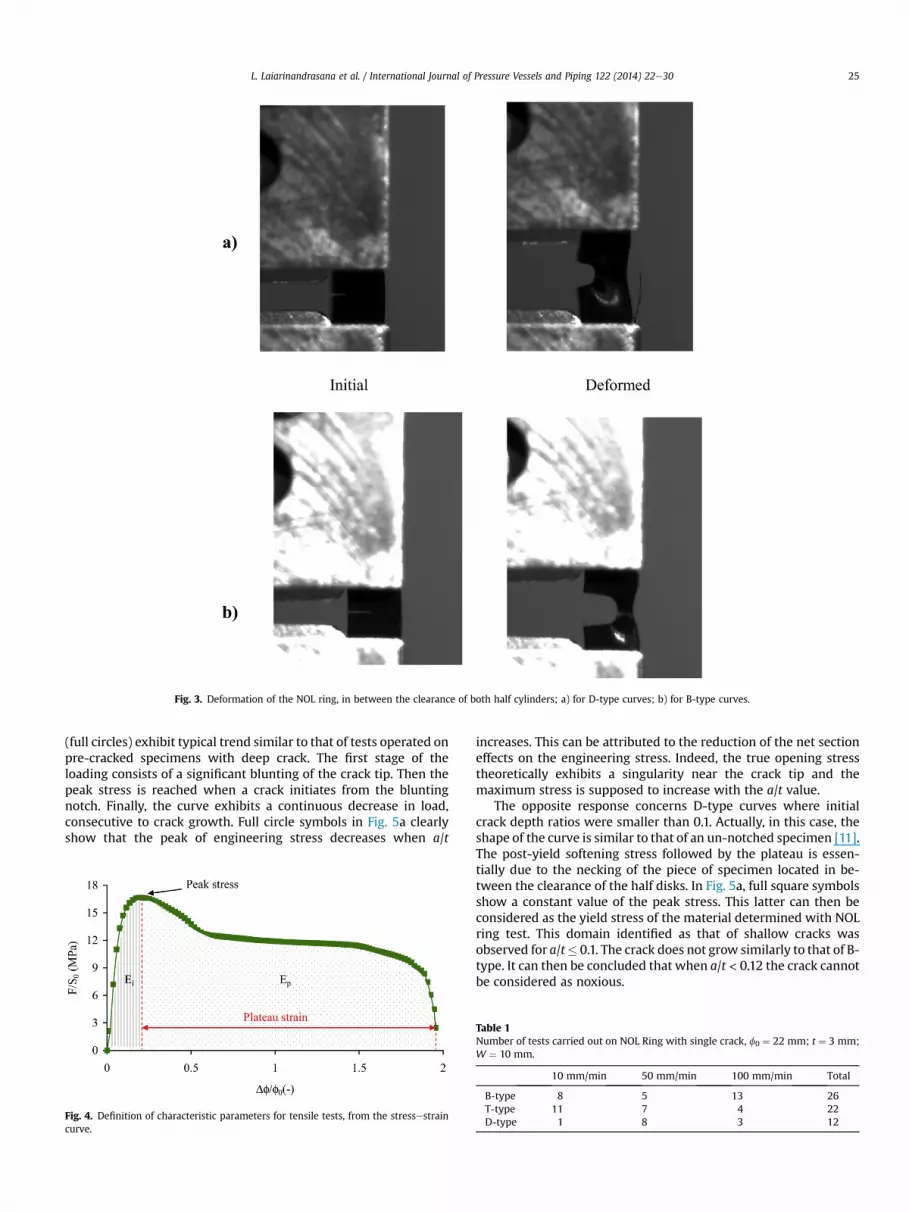
Fig. 3. Deformation of the NOL ring, in between the clearance of both half cylinders; a) for D-type curves; b) for B-type curves.
L. Laiarinandrasana et al. / International Journal of Pressure Vessels and Piping 122 (2014) 22e30 25
(full circles) exhibit typical trend similar to that of tests operated onpre-cracked specimens with deep crack. The first stage of theloading consists of a significant blunting of the crack tip. Then thepeak stress is reached when a crack initiates from the bluntingnotch. Finally, the curve exhibits a continuous decrease in load,consecutive to crack growth. Full circle symbols in Fig. 5a clearlyshow that the peak of engineering stress decreases when a/t
Fig. 4. Definition of characteristic parameters for tensile tests, from the stressestraincurve.
increases. This can be attributed to the reduction of the net sectioneffects on the engineering stress. Indeed, the true opening stresstheoretically exhibits a singularity near the crack tip and themaximum stress is supposed to increase with the a/t value.
The opposite response concerns D-type curves where initialcrack depth ratios were smaller than 0.1. Actually, in this case, theshape of the curve is similar to that of an un-notched specimen [11].The post-yield softening stress followed by the plateau is essen-tially due to the necking of the piece of specimen located in be-tween the clearance of the half disks. In Fig. 5a, full square symbolsshow a constant value of the peak stress. This latter can then beconsidered as the yield stress of the material determined with NOLring test. This domain identified as that of shallow cracks wasobserved for a/t� 0.1. The crack does not grow similarly to that of B-type. It can then be concluded that when a/t < 0.12 the crack cannotbe considered as noxious.
Table 1Number of tests carried out on NOL Ring with single crack, f0 ¼ 22 mm; t ¼ 3 mm;W ¼ 10 mm.
10 mm/min 50 mm/min 100 mm/min Total
B-type 8 5 13 26T-type 11 7 4 22D-type 1 8 3 12
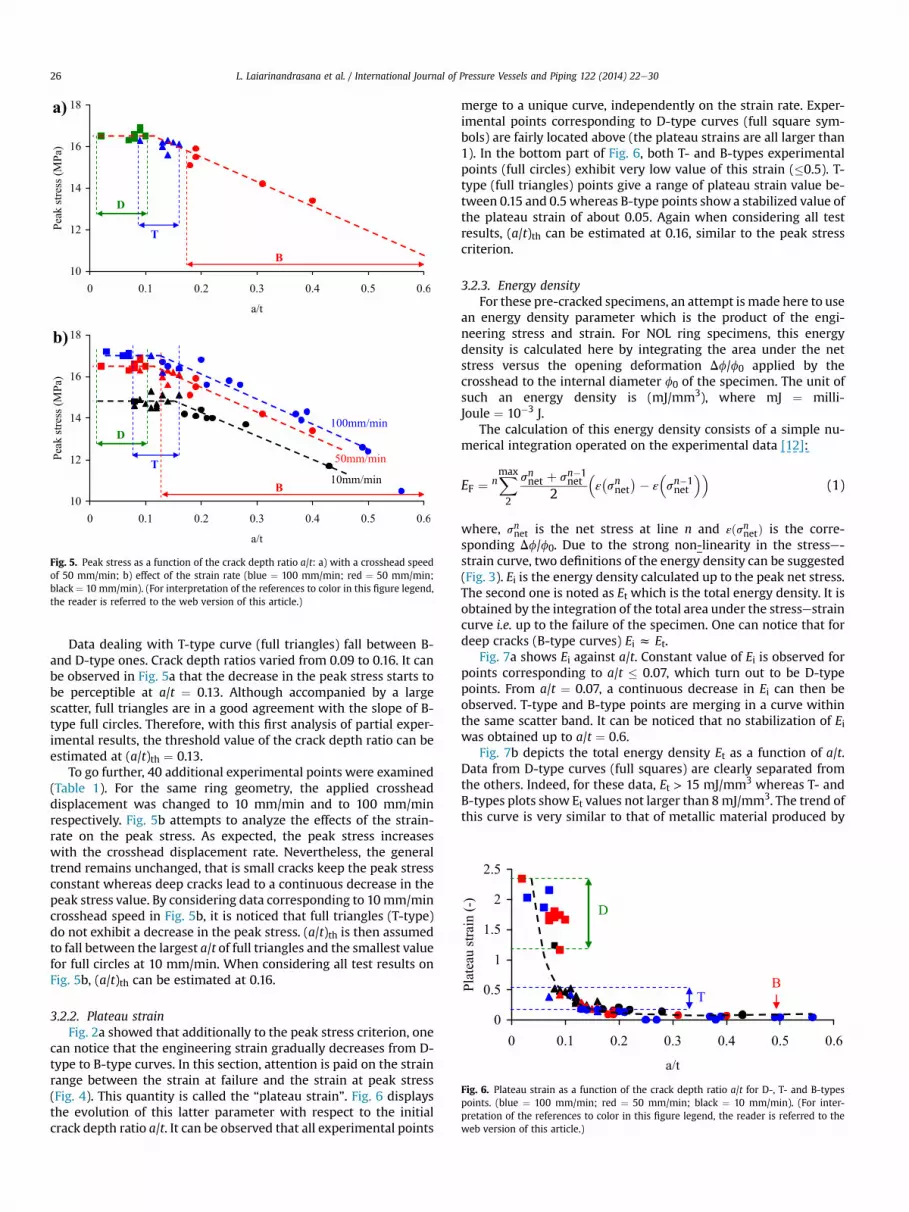
Fig. 5. Peak stress as a function of the crack depth ratio a/t: a) with a crosshead speedof 50 mm/min; b) effect of the strain rate (blue ¼ 100 mm/min; red ¼ 50 mm/min;black ¼ 10 mm/min). (For interpretation of the references to color in this figure legend,the reader is referred to the web version of this article.)
Fig. 6. Plateau strain as a function of the crack depth ratio a/t for D-, T- and B-typespoints. (blue ¼ 100 mm/min; red ¼ 50 mm/min; black ¼ 10 mm/min). (For inter-pretation of the references to color in this figure legend, the reader is referred to theweb version of this article.)
L. Laiarinandrasana et al. / International Journal of Pressure Vessels and Piping 122 (2014) 22e3026
Data dealing with T-type curve (full triangles) fall between B-and D-type ones. Crack depth ratios varied from 0.09 to 0.16. It canbe observed in Fig. 5a that the decrease in the peak stress starts tobe perceptible at a/t ¼ 0.13. Although accompanied by a largescatter, full triangles are in a good agreement with the slope of B-type full circles. Therefore, with this first analysis of partial exper-imental results, the threshold value of the crack depth ratio can beestimated at (a/t)th ¼ 0.13.
To go further, 40 additional experimental points were examined(Table 1). For the same ring geometry, the applied crossheaddisplacement was changed to 10 mm/min and to 100 mm/minrespectively. Fig. 5b attempts to analyze the effects of the strain-rate on the peak stress. As expected, the peak stress increaseswith the crosshead displacement rate. Nevertheless, the generaltrend remains unchanged, that is small cracks keep the peak stressconstant whereas deep cracks lead to a continuous decrease in thepeak stress value. By considering data corresponding to 10mm/mincrosshead speed in Fig. 5b, it is noticed that full triangles (T-type)do not exhibit a decrease in the peak stress. (a/t)th is then assumedto fall between the largest a/t of full triangles and the smallest valuefor full circles at 10 mm/min. When considering all test results onFig. 5b, (a/t)th can be estimated at 0.16.
3.2.2. Plateau strainFig. 2a showed that additionally to the peak stress criterion, one
can notice that the engineering strain gradually decreases from D-type to B-type curves. In this section, attention is paid on the strainrange between the strain at failure and the strain at peak stress(Fig. 4). This quantity is called the “plateau strain”. Fig. 6 displaysthe evolution of this latter parameter with respect to the initialcrack depth ratio a/t. It can be observed that all experimental points
merge to a unique curve, independently on the strain rate. Exper-imental points corresponding to D-type curves (full square sym-bols) are fairly located above (the plateau strains are all larger than1). In the bottom part of Fig. 6, both T- and B-types experimentalpoints (full circles) exhibit very low value of this strain (�0.5). T-type (full triangles) points give a range of plateau strain value be-tween 0.15 and 0.5 whereas B-type points showa stabilized value ofthe plateau strain of about 0.05. Again when considering all testresults, (a/t)th can be estimated at 0.16, similar to the peak stresscriterion.
3.2.3. Energy densityFor these pre-cracked specimens, an attempt is made here to use
an energy density parameter which is the product of the engi-neering stress and strain. For NOL ring specimens, this energydensity is calculated here by integrating the area under the netstress versus the opening deformation Df/f0 applied by thecrosshead to the internal diameter f0 of the specimen. The unit ofsuch an energy density is (mJ/mm3), where mJ ¼ milli-Joule ¼ 10�3 J.
The calculation of this energy density consists of a simple nu-merical integration operated on the experimental data [12]:
EF ¼ nXmax
2
snnet þ sn�1net
2
�ε
�snnet
�� ε
�sn�1net
��(1)
where, snnet is the net stress at line n and εðsnnetÞ is the corre-sponding Df/f0. Due to the strong non-linearity in the stresse-strain curve, two definitions of the energy density can be suggested(Fig. 3). Ei is the energy density calculated up to the peak net stress.The second one is noted as Et which is the total energy density. It isobtained by the integration of the total area under the stressestraincurve i.e. up to the failure of the specimen. One can notice that fordeep cracks (B-type curves) Ei z Et.
Fig. 7a shows Ei against a/t. Constant value of Ei is observed forpoints corresponding to a/t � 0.07, which turn out to be D-typepoints. From a/t ¼ 0.07, a continuous decrease in Ei can then beobserved. T-type and B-type points are merging in a curve withinthe same scatter band. It can be noticed that no stabilization of Eiwas obtained up to a/t ¼ 0.6.
Fig. 7b depicts the total energy density Et as a function of a/t.Data from D-type curves (full squares) are clearly separated fromthe others. Indeed, for these data, Et > 15 mJ/mm3 whereas T- andB-types plots show Et values not larger than 8mJ/mm3. The trend ofthis curve is very similar to that of metallic material produced by

Fig. 7. Energy density against a/t crack depth ratio (blue ¼ 100 mm/min; red ¼ 50 mm/min; black ¼ 10 mm/min): a) Energy density at peak stress (Ei); b) Total energy density(Et). (For interpretation of the references to color in this figure legend, the reader isreferred to the web version of this article.)
Fig. 8. Total energy density Et against a/t crack depth ratio, effects of the internaldiameter/thickness (hollow symbols). (blue ¼ 100 mm/min; red ¼ 50 mm/min;black ¼ 10 mm/min). (For interpretation of the references to color in this figure legend,the reader is referred to the web version of this article.)
Table 3Number of tests carried out on NOL Ring withdouble cracks, f0 ¼ 20 mm; t ¼ 5 mm;W ¼ 10 mm.
15 mm/min
B-type 5T-type 9D-type 0
L. Laiarinandrasana et al. / International Journal of Pressure Vessels and Piping 122 (2014) 22e30 27
Sumpter [4] for constraint effects study. The author determinedthen the crack depth ratio threshold value of 0.25. Here, thethreshold value of a/t according to Et parameter can be estimated at(a/t)th ¼ 0.18.
3.3. Effects of the ring geometry
In this section, it is assumed that Et is the relevant parameter todetermine (a/t)th. The following discussions focus on the de-pendency of the (a/t)th value on the geometrical effects (internaldiameter/thickness, double cracks versus single crack).
3.3.1. Effects of internal diameterTable 2 details the additional tests that attempts to examine the
effects of both internal diameter and thickness on the crack depthratio threshold. 75 test results were then added to the previousanalyzed experimental data. With an internal diameter off0 ¼ 36 mm, a wall thickness of t ¼ 4 mm and at two crossheadspeed of 10 mm/min and 50 mm/min, the stressestrain curvesanalyses lead to 45, 11 and 19 curves corresponding respectively toB-, T- and D-type curves. These additional points were super-imposed in Fig. 8 where Et is plotted with respect to a/t. The newpoints are symbolized as hollow squares, triangles and circles for
Table 2Number of tests carried out on NOL Ring with single crack, f0 ¼ 36 mm; t ¼ 4 mm;W ¼ 10 mm.
10 mm/min 50 mm/min Total
B-type 27 18 45T-type 7 4 11D-type 5 14 19
D-, T- and B-type curves respectively. It is shown that Et is slightlyunderestimated with the large diameter NOL ring. Therefore, forlarge diameter specimens, a/t value for Et stabilization is less than0.18. It can be concluded that increasing the internal diameter doesnot affect the threshold value of (a/t)th ¼ 0.18.
3.3.2. Effects of double pre-cracksNew rings (f0 ¼ 20 mm, t ¼ 5 mm, W ¼ 10 mm) were provided
to incorporate two diametrical cracks within their internal diam-eter. The aim is here to analyze the effects of the specimen geom-etry which exhibits (rz) symmetry in a cylindrical coordinates(Table 3). The crosshead speed was fixed at 15 mm/min. During thetests, it was observed that the effects of bending on the piece of thering located in between the two half cylinders were less pro-nounced than for single cracked specimen. This means that for theloading here the stress states within the net section is more intension than under bending. Only T- and B-type responses wereobserved, with 9 and 5 results respectively. Fig. 9 shows the
Fig. 9. Total energy density Et against a/t crack depth ratio, effects of the double cracks(blue ¼ 100 mm/min; red ¼ 50 mm/min; black ¼ 10 mm/min). (Key: hollow di-amonds: double cracks with T-type curve; full diamonds: double cracks with B-typecurve).

L. Laiarinandrasana et al. / International Journal of Pressure Vessels and Piping 122 (2014) 22e3028
location of additional experimental points (full and hollow di-amonds for respectively B-type and T-type). They are still in a goodagreement with the previous points. It can then be deduced that (a/t)th¼ 0.18 is the best value to make sure that the NOL ring tests leadto relevant data for fracture mechanics approach. In other words, aslong as (a/t) is less than 0.18, the nocivity of these defects is noteffective. Moreover, all data corresponding to a/t > 0.18 can beutilized to apply fracture mechanics concepts.
4. Creep tests results
Actually, HDPE connection pipes used for drinking water supplyare subjected to creep due to the internal pressure during theirservice. To better understand what changes when creep loading isconsidered, the same approach as for tensile tests was applied, byusing the same testing machine. To this end, creep tests withvarious applied net stresses ranging from 5 to 12 MPa were carriedout (Table 4). The creep displacement was recorded, as well as thetime to failure tF. It was noticed that in the case of creep crack tests,no distinction into B-, T- or D-types according to the crack depthratio could be made on the creep displacement curve against thecreep time. Indeed, for all test cases, the creep displacement curvesexhibited the three classical stages (Fig.10). The creep displacementrate in during the crack tip bluntinge that is in the creep secondarystage e is systematically calculated. This parameter is of primeimportance to the fracture mechanics for creeping solids conceptsand it will be used in the following.
To better understand how the ring deforms during the creeptests and to find out which parameter would be relevant to deter-mine the crack depth ratio threshold, pictures of deformed rings areshown in Fig. 11. Two crack depth ratios of the NOL ring wereconcerned: 0.18 and 0.36. For shallow cracks, the gage lengthsignificantly and homogeneously deforms. The ring has lost itscurvature around the crack, so that the piece of NOL ring specimenseems to be straightly deformed. For deep crack, the overalldeformation is rather limited and the localization around the crack
Fig. 10. Typical creep opening displacement curve for HDPE NOL ring tested at roomtemperature, snet ¼ 12 MPa.
Table 4Number of creep tests carried out on NOL Ring, f0 ¼ 20 mm; t ¼ 5 mm;W ¼ 10 mm.
5 MPa � F/Snet � 12 MPa
Single crack 20Double cracks 4
is evidenced. In this case, the net section is clearly subjected tobending.
The two deformed shapes of NOL ring differ in the amount of theopening displacement. The creep displacement at the onset of thetertiary stage (Fig. 10) was then explored. The evolution of thisparameter with respect to the crack depth ratio is plotted in Fig. 12.All experimental points merge into a unique curve in spite of thescatter band, whatever the number of implanted cracks. Noparticular effects of the applied stress level were evidenced. Theshape of the curve in Fig. 12 is similar to that of Et for tensile tests.By following the same approach, one can observe a slight shift of (a/t)th to the right. However, a value of (a/t)th z 0.2 can be consideredas relevant for both kinds of loading. It can then be concluded thatthe value of the threshold of crack depth ratio is 0.2. When a/t < 0.2,the crack induced by the oxidation does not propagate. The ringdeforms “homogeneously” like un-cracked ring, with significantextension of necking. For a/t > 0.2, the crack initiates and propa-gates following a classical shape of crack growth curve.
Lifetime prediction of pipes in service requires a failure assess-ment diagram. To this end, creep test results with specimens wherecrack depth ratio a/t is larger than (a/t)th were selected. At thisstage, a significant experimental measure during the creep testswas not used: the time to failure (tF). This latter was used in thenext section to establish the creep failure assessment diagram.
5. Creep failure assessment diagram: time to failure versus C*load parameter
Following the work of Ben Hadj Hamouda [5], creep crackgrowth tests were carried out first on Double Edge Notch Tensile(DENT) specimen [13]. For this (DENT) specimen, the C* loadparameter suggested by the fracture mechanics of creeping solids[14] can be expressed as follows:
C*ðDENTÞz12n2 � 1n2 þ 1
snet _d (2)
where, snet is the net stress, n2 is the creep stress exponent and _d isthe opening displacement rate. No closed form for C* calculation isavailable for pre-cracked ring specimens. Based on eq. (2) it wasassumed here that C* is expressed as :
C*ðRingÞzgn2 � 1n2 þ 1
snet _d (3)
where g is a scale factor accounting for the specimen geometry, theother quantities being the same as in eq. (2). The use of g is partlyjustified in Ref. [15]. Here, for both simple and double cracked rings,the same value of g¼ 103 was utilized. Further work based on finiteelement simulation to obtain numerical C* value is ongoing tobetter analyze this g value.
In Fig. 13, the creep failure assessment diagram is then intro-duced by plotting C* (Ring) against the corresponding time tofailure (tF). Although the scale factor differs from DENT and Ringtests, a good agreement is shown between C* and tF. It should bementioned that the correlation was obtained in two different lab-oratories, with two cracked geometries (DENT and ring) and forring specimens two configurations of crack (single or double) wereinvestigated. This creep failure assessment diagram obtained in anunprecedented manner is of prime importance. Indeed, it can thenbe utilized to predict the residual lifetime of a pipe e made of thisgrade of HDPEe containing a defect. Indeed, once the calculation ofthe C* value is performed, one can deduce from Fig. 13 the time tofailure of the pipe, which can be assumed to be its residual lifetime.

Fig. 11. Deformation of the NOL ring under creep test, in between the clearance of both half cylinders; a) for shallow crack a/t ¼ 0.18; b) for deep crack a/t ¼ 0.36.
L. Laiarinandrasana et al. / International Journal of Pressure Vessels and Piping 122 (2014) 22e30 29
6. Conclusion
135 tests on NOL ring specimens were carried out to assessthe harmfulness of crack depth ratio under both monotonic andcreep loadings. The stressestrain curves enable to distinguishthree cases of failure mechanisms: i) a brittle-like trend whereno plateau is observed; ii) a ductile-like regime where a large
Fig. 12. a/t threshold value for creep tests.
plateau is exhibited and iii) a mixed trend where a continuousdecrease of the load is observed while the applied displacementincreases. Investigations on several mechanical parameters suchas the peak net stress, the plateau strain and the energy density
Fig. 13. Creep failure assessment diagram, obtained for 0.2 � a/t � 0.6.
L. Laiarinandrasana et al. / International Journal of Pressure Vessels and Piping 122 (2014) 22e3030
indicated that the threshold value of the crack depth ratio couldbe estimated at 0.2. This threshold value was confirmed inde-pendently on either the geometrical effects (ring diameter, singleversus double crack) or the crosshead speed ranging from10 mm/min to 100 mm/min.
Moreover, the real loading on connection pipes being the creep,some additional creep tests were performed leading to the samevalue of the crack depth ratio threshold (a/t)th ¼ 0.2. Creep tests onpre-cracked ring for which the crack depth ratio is greater than 0.2,were then selected to establish a creep failure assessment diagramconsisting of C* versus time to failure correlation. The determina-tion of the residual lifetime of drinking water connection pipes canbe performed, by using this diagram.
References
[1] Choi BH, Zhou Z, Chudnovsky A, Stivala SS, Sehanobish K, Bosnyak CP. Fractureinitiation associated with chemical degradation: observation and modelling.Int J Solids Struct 2005;42:681e95.
[2] Choi BH, Chudnovsky A, Sehanobish K. Stress corrosion cracking in plasticpipes: observation. Int J Fract 2007;145:81e8.
[3] Devilliers C, Fayolle B, Laiarinandrasana L, Oberti S, Gaudichet-Maurin E.Polym Degrad Stab 2011;96:1361e8.
[4] Sumpter JDG. In: Hackett EM, Schwalbe KH, Dodds RH, editors. Constrainteffects in fracture, ASTM STP 1171; 1993. p. 492e502.
[5] Ben Hadj Hamouda H, Laiarinandrasana L, Piques R. Fracture mechanics globalapproach concepts applied to creep slow crack growth in a medium densitypolyethylene (MDPE). Eng Fract Mech 2007;14:2187e204.
[6] Ben Hadj Hamouda H, Laiarinandrasana L, Piques R. A local approach to creepfracture by slow crack growth in an MDPE: damage modelling. Int J Press VessPip 2009;86:228e38.
[7] Lu X, Brown N. The transition from ductile to slow crack growth failure in acopolymer of polyethylene. J Mater Sci 1990;25:411e6.
[8] Lu X, Brown N. Unification of ductile failure and slow crack growth in anethylene-octene copolymer. J Mater Sci 1991;26:612e20.
[9] Standard test method for apparent hoop tensile strength of plastic or rein-forced plastic pipe by split disk method ASTM D 2290-04.
[10] Rozental-Evesque M, Rabaud B, Sanchez M, Louis S, Bruzek CE. The NOL ringtest: an improved tool for characterising the mechanical degradation of non-failed polyethylene pipes house connections. In: Proceedings of Plastic PipesCongress, September 22e24, Budapest, Hungary; 2008.
[11] Laiarinandrasana L, Devilliers C, Oberti S, Gaudichet E, Fayolle B, Lucatelli JM.Ring tests on high density polyethylene: full investigation assisted by finiteelement modelling. Int J Press Vess Pip 2011;88:1e10.
[12] Laiarinandrasana L, Fu Y, Halary JL. Toughness improvement of epoxy-network by nanophase separating antiplasticizers. J Appl Polym Sci2012;123:3437e47.
[13] Devilliers C. Chemical degradation of PE and its influence on the creepresponse, damage and failure: application to lifetime assessment on pipessubjected to internal pressure. PhD thesis. Paris: Mines ParisTech; 2011 [InFrench].
[14] Landes JD, Begley JA. A fracture mechanics approach to creep cracking. Me-chanics of crack growth, vol. 590. ASTM STP; 1976. p. 128e48.
[15] Laiarinandrasana L, Gaudichet E, Oberti S, Devilliers C. Effects of aging on thecreep behaviour and residual lifetime assessment of polyvinyl chloride (PVC)pipes. Int J Press Vess Pip 2011;88:99e108.


