Epistasis and Adaptationon Fitness Landscapes
Claudia Bank1,2
1Institute of Ecology and Evolution, University of Bern, 3012 Bern, Switzerland;
email: [email protected] Institute of Bioinformatics, 1015 Lausanne, Switzerland
Claudia Bank 2022. AA:1–25
https://doi.org/10.1146/((please add
article doi))
Copyright © 2022 by Annual Reviews.
All rights reserved
Keywords
GxGxE, gene interaction, evolutionary theory, speciation, selection,
mutational effects, genotype-phenotype map, ruggedness
Abstract
Epistasis occurs when the effect of a mutation depends on its carrier’s
genetic background. Despite increasing evidence that epistasis for fit-
ness is common, its role during evolution is contentious. Fitness land-
scapes, mappings of genotype or phenotype to fitness, capture the full
extent and complexity of epistasis. Fitness landscape theory has shown
how epistasis affects the course and the outcome of evolution. More-
over, by measuring the competitive fitness of sets of tens to thousands
of connected genotypes, empirical fitness landscapes have shown that
epistasis is frequent and depends on the fitness measure, the choice
of mutations for the landscape, and the environment in which it was
measured. Here, I review fitness landscape theory and experiments
and their implications for the role of epistasis in adaptation. I dis-
cuss theoretical expectations in the light of empirical fitness landscapes
and highlight open challenges and future directions towards integrating
theory and data, and incorporating ecological factors.
1
arX
iv:2
204.
1332
1v3
[q-
bio.
PE]
10
Jun
2022

Contents
1. INTRODUCTION .. . . . . . . . . . . . . . . . . . . . . . . . . . . . . . . . . . . . . . . . . . . . . . . . . . . . . . . . . . . . . . . . . . . . . . . . . . . . . . . . . . . . . . . . . . . 22. FITNESS LANDSCAPE THEORY HIGHLIGHTS THE ROLE OF EPISTASIS IN EVOLUTION .. . . . . . . . 3
2.1. Probabilistic fitness landscape models feature tunable epistasis . . . . . . . . . . . . . . . . . . . . . . . . . . . . . . . . . . . . . . . 42.2. Epistasis arises from a non-linear phenotype-fitness map in Fisher’s Geometric model . . . . . . . . . . . . . . . 62.3. Modeling assumptions and challenges . . . . . . . . . . . . . . . . . . . . . . . . . . . . . . . . . . . . . . . . . . . . . . . . . . . . . . . . . . . . . . . . . . 7
3. EPISTASIS IS COMMON IN EXPERIMENTAL FITNESS LANDSCAPES . . . . . . . . . . . . . . . . . . . . . . . . . . . . . . . . 83.1. Engineered fitness landscapes measured in the laboratory . . . . . . . . . . . . . . . . . . . . . . . . . . . . . . . . . . . . . . . . . . . . . 83.2. Experimental design influences the shape of the fitness landscape . . . . . . . . . . . . . . . . . . . . . . . . . . . . . . . . . . . . 93.3. Pervasive diminishing-returns epistasis points to ubiquitous interactions on the genotype-
phenotype level . . . . . . . . . . . . . . . . . . . . . . . . . . . . . . . . . . . . . . . . . . . . . . . . . . . . . . . . . . . . . . . . . . . . . . . . . . . . . . . . . . . . . . . . . . 114. EPISTASIS AND FITNESS LANDSCAPES IN THE WILD . . . . . . . . . . . . . . . . . . . . . . . . . . . . . . . . . . . . . . . . . . . . . . . . 11
4.1. Experimental evidence of epistatic adaptive trajectories in the wild . . . . . . . . . . . . . . . . . . . . . . . . . . . . . . . . . . . 124.2. Epistasis is commonly observed in form of hybrid incompatibility . . . . . . . . . . . . . . . . . . . . . . . . . . . . . . . . . . . . . 134.3. The contentious role of epistasis during speciation . . . . . . . . . . . . . . . . . . . . . . . . . . . . . . . . . . . . . . . . . . . . . . . . . . . . 13
5. ENVIRONMENT-DEPENDENT EPISTASIS: MODELS AND EMPIRICAL EVIDENCE . . . . . . . . . . . . . . . . . . 145.1. Empirical evidence for environment-dependent epistasis . . . . . . . . . . . . . . . . . . . . . . . . . . . . . . . . . . . . . . . . . . . . . . . 145.2. Theoretical approaches to environment-dependent epistasis . . . . . . . . . . . . . . . . . . . . . . . . . . . . . . . . . . . . . . . . . . . 165.3. Environment-dependent epistasis could leave a footprint of “ecological history” in genomes . . . . . . . . 16
6. CONNECTIONS, DISCREPANCIES, AND FUTURE CHALLENGES . . . . . . . . . . . . . . . . . . . . . . . . . . . . . . . . . . . . . . 176.1. Ecological factors may smoothen the fitness landscape that matters for evolutionary dy-
namics in the wild . . . . . . . . . . . . . . . . . . . . . . . . . . . . . . . . . . . . . . . . . . . . . . . . . . . . . . . . . . . . . . . . . . . . . . . . . . . . . . . . . . . . . . . 176.2. At which level do ecology and the environment modify fitness landscapes, and which
traces does that leave?. . . . . . . . . . . . . . . . . . . . . . . . . . . . . . . . . . . . . . . . . . . . . . . . . . . . . . . . . . . . . . . . . . . . . . . . . . . . . . . . . . 187. FINAL REMARKS . . . . . . . . . . . . . . . . . . . . . . . . . . . . . . . . . . . . . . . . . . . . . . . . . . . . . . . . . . . . . . . . . . . . . . . . . . . . . . . . . . . . . . . . . . . 19
1. INTRODUCTION
Determining the relationship between genotype and fitness is a fundamental question in
evolutionary biology and beyond. The concept of the fitness landscape quantifies this
relationship. It provides an intuitive picture of how selection can direct evolution, iconically
visualized by Wright (1932) as a topographic map with peaks and valleys. In a fitness
landscape, populations evolve on fitness-increasing paths (via beneficial substitutions) until
they reach a fitness peak (the fittest genotype in its mutational neighborhood). A rugged
fitness landscape has multiple adaptive peaks representing different, sometimes suboptimal,
stable genetic solutions to the challenge of surviving (and thriving) in a given environment.
A necessary condition for the existence of more than one adaptive peak is epistasis for
fitness, which occurs when one or more mutations interact (Wright 1931). (Throughout
this review, I often refer to epistasis for fitness as “epistasis”.) Thus, questions about
the shape of the fitness landscape are tightly linked to questions about the prevalence of
epistasis.
The role of epistasis in evolution is controversially discussed across the subfields of evo-
lutionary research. Whereas epistasis is considered an important component of reproductive
isolation between species when it occurs as hybrid incompatibility (Seehausen et al. 2014),
it is usually not considered in studies of population and quantitative genetics. For example,
population-genetic selection screens assume that the effect of a selected mutation is indepen-
2 Bank
dent of the genetic background it occurs on, whereas in quantitative genetics, epistasis tends
to appear as a noise term (Walsh & Lynch 2018). That is because epistasis is considered a
transient, second-order effect that matters only at intermediate allele frequencies (Whitlock
et al. 1995). Moreover, incorporating epistasis into evolutionary studies is difficult because
of the complexity of multi-locus interactions, resulting in theoretical and statistical chal-
lenges (Mackay 2013). Conversely, in molecular and systems biology, epistasis is considered
a natural consequence of the structural interaction of mutations within a protein and the
interaction of proteins in biological pathways (Domingo et al. 2019). The research area
of fitness landscapes bridges evolutionary and systems biology and places epistasis at the
heart of its study (Fragata et al. 2019). Fitness landscape theory provides expectations
of how epistasis affects evolutionary trajectories, and empirical fitness landscapes provide
information on the prevalence of epistasis in nature that feeds back into theory development.
In this review, I take a fitness-landscape view of the role of epistasis in evolution. The
first part of the review highlights how epistasis constrains adaptation in two classical but
different classes of fitness landscape models, and introduces how genotype-phenotype or
phenotype-fitness maps can contribute to epistasis and its change across environments.
The subsequent sections review various empirical fitness landscape studies and evidence for
epistasis in evolutionary trajectories that have occurred in nature. I then highlight empirical
evidence for environment-dependent epistasis and how this is being integrated into fitness
landscape models. The review finishes with open questions and a call for new approaches
that incorporate ecological factors into the study of fitness landscapes.
2. FITNESS LANDSCAPE THEORY HIGHLIGHTS THE ROLE OF EPISTASISIN EVOLUTION
The ideal genotype-fitness landscape maps every possible genotype to its carrier’s fitness.
Even for small genomes, the resulting sequence space is much larger than the number of
molecules in the known universe (Szendro et al. 2013). The topological features (e.g., the
possibility of fitness ridges between two genotypes) of such a high-dimensional space are
difficult to intuit or illustrate visually (see, e.g., McCandlish 2011). Although no experiment
will be able to map the complete fitness landscape of an organism, mathematical models
can capture this space and quantify the expected evolutionary patterns for a given shape of
a fitness landscape. Fitness landscape theory quantifies both the invariant properties of the
complete fitness landscape (e.g., how many peaks & valleys? How frequent is epistasis?)
and the evolutionary dynamics on the fitness landscape (e.g., which peaks can be reached
with which probability? How many steps does it on average take to reach a fitness peak?),
and characterizes how they vary with the model parameters (e.g., the strength of epistasis).
In the following, I introduce two classes of fitness landscape models: probabilistic
genotype-fitness landscape models with few parameters, in which epistasis is tunable, rep-
resented by the Rough-Mount-Fuji (RMF) model (Aita et al. 2000); and Fisher’s Geometric
model (FGM; Fisher 1930), which creates an epistatic genotype-fitness landscape through
its phenotype-fitness mapping. The two approaches highlight different modeling perspec-
tives: whereas probabilistic fitness landscapes directly map genotypes to fitness with a given
amount of epistasis, FGM (as defined by Martin et al. 2007, and onwards) ignores the pos-
sibility that epistasis could occur in the mapping of genotype to phenotype; here, epistasis
arises as a consequence of stabilizing selection for a phenotypic optimum. This difference
between the RMF and the FGM models highlights a feature inherent to all modeling: the
www.annualreviews.org • Fitness Landscapes and Epistasis 3
model is greatly influenced by the philosophy of its developer, which affects the results
that can be obtained. For example, Fisher considered adaptation to be a process driven by
additive substitutions of small phenotypic effects towards a single optimum (Fisher 1930),
whereas Wright believed epistasis to be pervasive at the phenotype level and the fitness
landscape to be rugged (Wright 1932). Both RMF and FGM-based approaches show how
epistasis constrains the course of evolution and predict patterns that were observed in recent
empirical studies of fitness landscapes.
2.1. Probabilistic fitness landscape models feature tunable epistasis
Probabilistic fitness landscape models allow for the definition of arbitrarily epistatic fitness
landscapes with few parameters and therefore lend themselves to mathematical analysis
of the consequences of epistasis (Krug 2021). They are agnostic to any mechanistic or
molecular reasons for epistasis and are only based on probability distributions. The RMF
model (Aita et al. 2001, 2000) is highlighted here as representative of this class of models;
see Hwang et al. (2018), de Visser & Krug (2014), Ferretti et al. (2016) for descriptions of
the various other members of this class, including the prominent NK model (Kauffman &
Weinberger 1989). In the RMF model, each locus has an additive effect, either taken to
be a constant or drawn from a probability distribution, and each genotype is assigned an
epistatic deviation from its additive expectation, drawn from a normal distribution with
mean 0. The RMF model interpolates between a fully additive fitness landscape, in which
each substitution contributes a fixed amount to its carrier’s fitness independent of the rest of
the genome (i.e., there is no epistasis), and the so-called House-of-Cards fitness landscape
(Kauffman & Levin 1987), which maximizes epistasis by assigning a random fitness to
each genotype (Figure 1). The difference between the two limiting cases highlights an
essential consequence of epistasis: it makes fitness of a genotype less predictable. For
example, for a fitness landscape with L = 10 loci and two alleles per locus, resulting in
2L = 1024 genotypes, only 10 measurements are required to correctly predict the fitness of
all genotypes in an additive fitness landscape, whereas 1024 measurements are necessary to
fully determine the House-of-Cards landscape.
Probabilistic fitness landscapes such as the RMF model are an ideal testing ground to
study the evolutionary consequences of epistasis when the landscape is tuned from additive
to epistatic (Neidhart et al. 2014). In the smoothest, non-epistatic landscape, there is only
a single, global fitness peak and any population will eventually climb this peak (Figure
1A,F). At the same time, the evolutionary history of independently evolved populations will
tend to be different since any order of substitutions is possible. With maximum epistasis,
the RMF landscape is equivalent to the House-of-Cards landscape and displays a large
number of fitness peaks, which is on average 2L/(L + 1) (Kauffman & Levin 1987; Figure
1E,H). Overall, epistasis introduces the potential for parallel fitness evolution towards
different adapted genotypes (local fitness peaks). However, an increasing number of peaks
in the landscape decreases the length of adaptive trajectories and less of the full landscape
is explored by evolution. Consequently, well-adapted genotypes are most divergent for
intermediate ruggedness of the landscape (Figure S2). Moreover, epistasis tends to create
historical contingencies of adaptation. It limits the possible orders of substitutions and thus
the number of evolutionary trajectories towards a fitness peak, making evolution from the
same starting point more repeatable and seemingly more predictable. (Figure 1, Figure
S2). Notably, the regularity of the RMF landscape (and other probabilistic fitness landscape
4 Bank

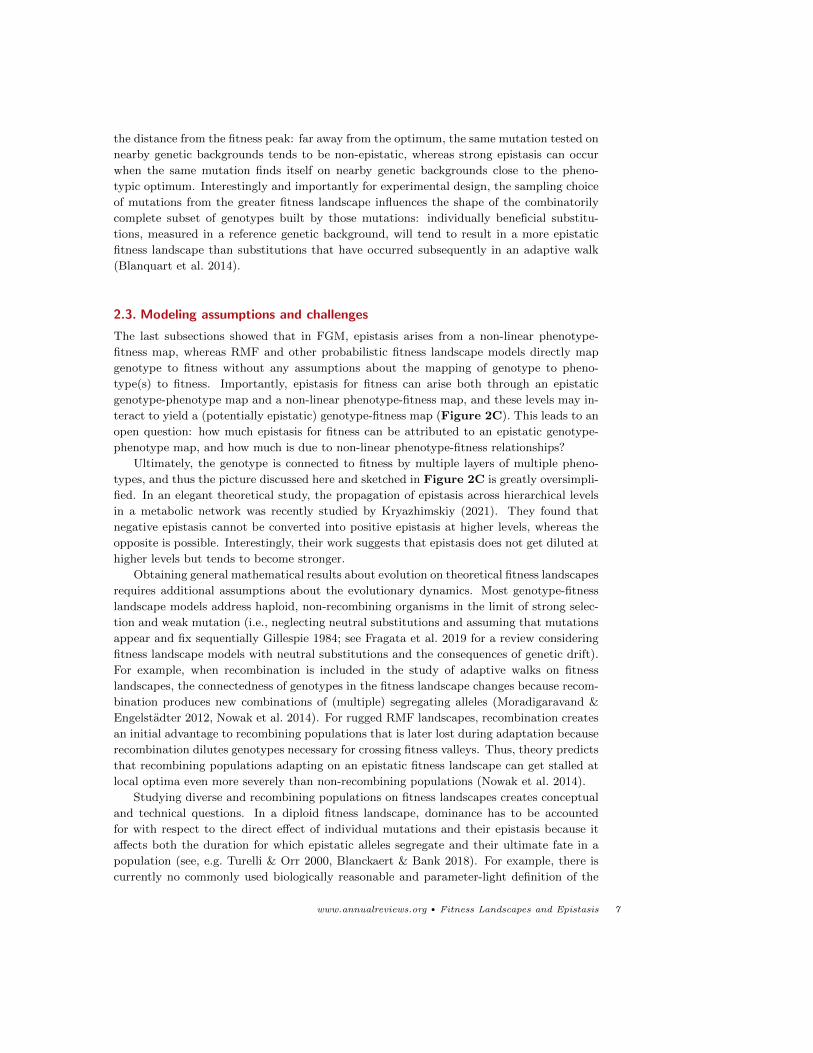
Figure 1
Illustration of the Rough-Mount-Fuji (RMF) model. (A)-(E). Examples of three-locus RMFlandscapes with increasing epistasis, ranging from additive (panel (A)) to the House-of-Cards
model with maximum epistasis (panel (E)). The genotypes are ordered on the x-axis by their
Hamming distance (i.e., the number of substitutions distinguishing two genotypes) from the leastfit reference genotype 000, whose relative fitness is arbitrarily normalized to 0. Single mutational
steps are indicated by blue lines, blue boxes indicate binary genotypes. The underlying additive
contribution to the fitness landscapes is highlighted by gray boxes and lines. More fitnesslandscapes with the same parameters are shown in Figure S1. (F)-(H) Evolutionary trajectories
are greatly affected by epistasis. For three landscapes with 10 loci (i.e., 210 = 1024 genotypes)
with varying strength of epistasis, 1000 simulations of random adaptive walks were performed,starting at the least fit genotype 000. The underlying fitness landscape showing the fitness of all
1024 genotypes and their connection by single-step substitutions is drawn in gray. The
evolutionary paths that were taken are drawn on the fitness landscape in blue, paths that wererepeatedly taken are indicated by higher color intensity. Local fitness peaks that were reached are
highlighted in red, with color intensity related to the frequency of how often this adaptive peakwas reached. See also Figure S2; the simulation code is available as Supplementary Material. In
an additive fitness landscape, the single adaptive peak is reached via many different evolutionarytrajectories (G). At intermediate epistasis, many of the existing adaptive peaks can be reachedbut evolutionary trajectories become constrained by epistasis (H). At maximum epistasis, fewevolutionary paths remain accessible and only the local fitness landscape is explored by the
adaptive walks (I).
models, Hwang et al. 2018), in which every genotype has the same statistical properties,
is an unrealistic assumption for real interaction networks between mutations or proteins.
Nevertheless, the RMF model was shown to recover features of various experimental fitness
landscapes (Szendro et al. 2013, de Visser & Krug 2014, Bank et al. 2016).
www.annualreviews.org • Fitness Landscapes and Epistasis 5
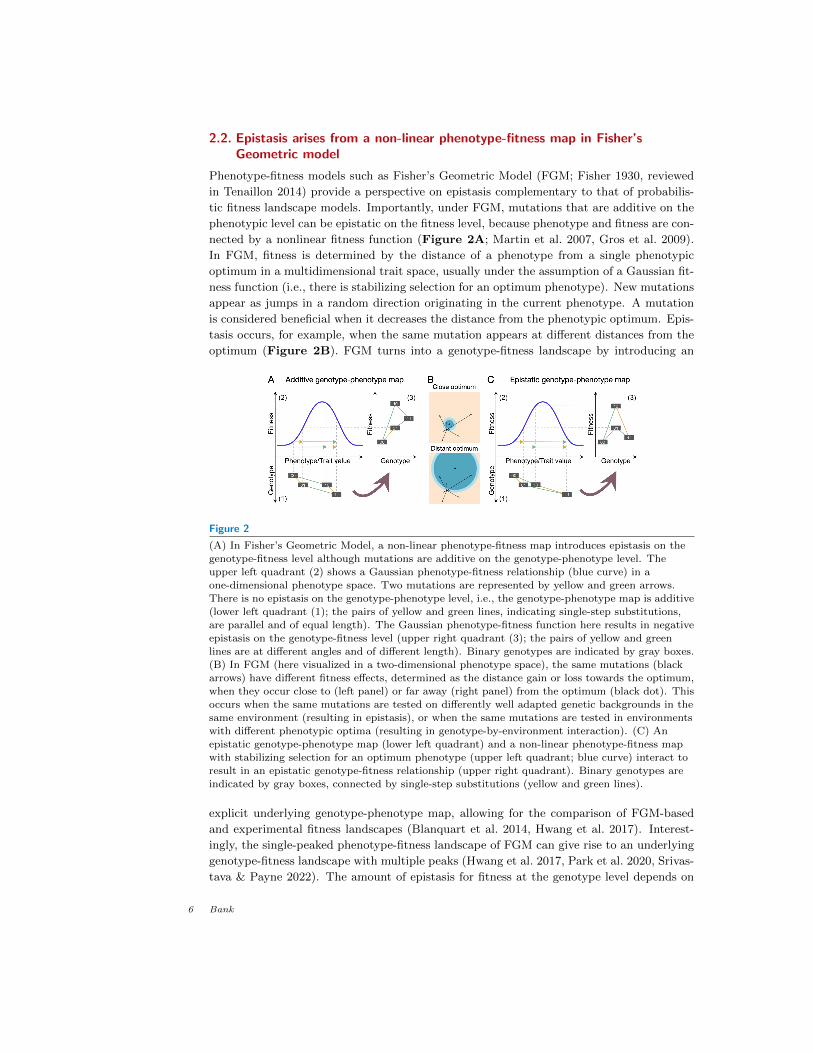
2.2. Epistasis arises from a non-linear phenotype-fitness map in Fisher’sGeometric model
Phenotype-fitness models such as Fisher’s Geometric Model (FGM; Fisher 1930, reviewed
in Tenaillon 2014) provide a perspective on epistasis complementary to that of probabilis-
tic fitness landscape models. Importantly, under FGM, mutations that are additive on the
phenotypic level can be epistatic on the fitness level, because phenotype and fitness are con-
nected by a nonlinear fitness function (Figure 2A; Martin et al. 2007, Gros et al. 2009).
In FGM, fitness is determined by the distance of a phenotype from a single phenotypic
optimum in a multidimensional trait space, usually under the assumption of a Gaussian fit-
ness function (i.e., there is stabilizing selection for an optimum phenotype). New mutations
appear as jumps in a random direction originating in the current phenotype. A mutation
is considered beneficial when it decreases the distance from the phenotypic optimum. Epis-
tasis occurs, for example, when the same mutation appears at different distances from the
optimum (Figure 2B). FGM turns into a genotype-fitness landscape by introducing an
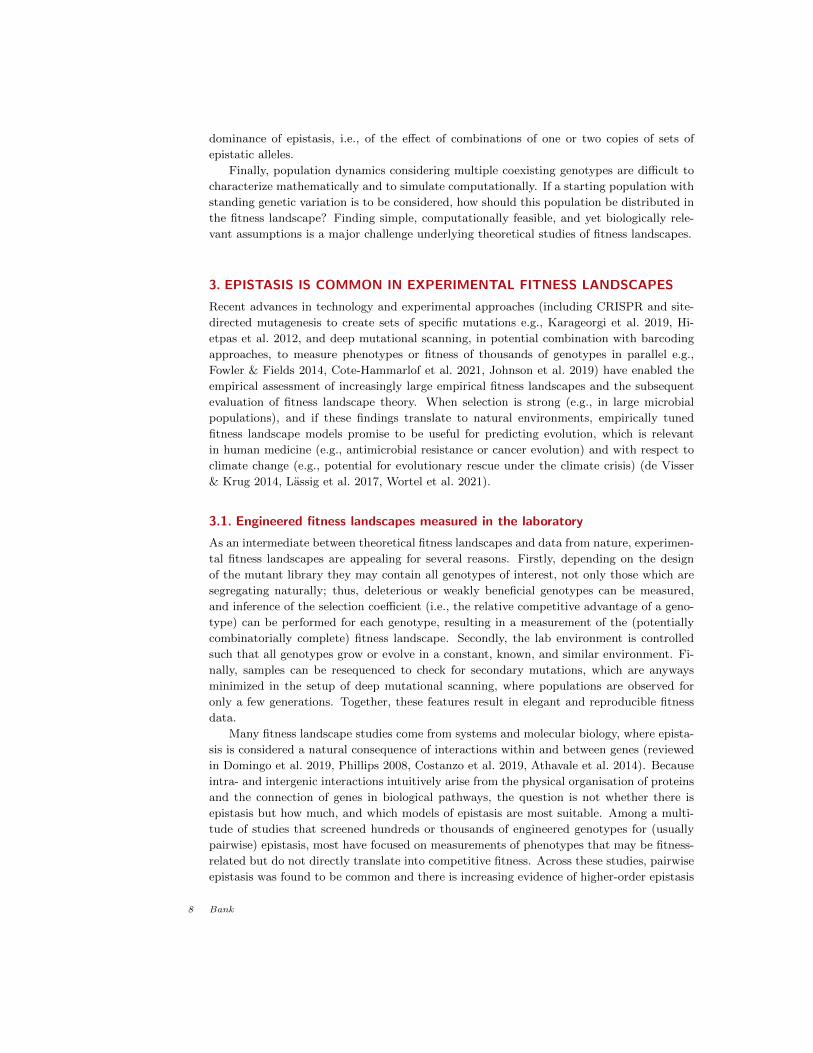
Figure 2
(A) In Fisher’s Geometric Model, a non-linear phenotype-fitness map introduces epistasis on the
genotype-fitness level although mutations are additive on the genotype-phenotype level. Theupper left quadrant (2) shows a Gaussian phenotype-fitness relationship (blue curve) in a
one-dimensional phenotype space. Two mutations are represented by yellow and green arrows.
There is no epistasis on the genotype-phenotype level, i.e., the genotype-phenotype map is additive(lower left quadrant (1); the pairs of yellow and green lines, indicating single-step substitutions,
are parallel and of equal length). The Gaussian phenotype-fitness function here results in negative
epistasis on the genotype-fitness level (upper right quadrant (3); the pairs of yellow and greenlines are at different angles and of different length). Binary genotypes are indicated by gray boxes.
(B) In FGM (here visualized in a two-dimensional phenotype space), the same mutations (blackarrows) have different fitness effects, determined as the distance gain or loss towards the optimum,
when they occur close to (left panel) or far away (right panel) from the optimum (black dot). This
occurs when the same mutations are tested on differently well adapted genetic backgrounds in thesame environment (resulting in epistasis), or when the same mutations are tested in environments
with different phenotypic optima (resulting in genotype-by-environment interaction). (C) Anepistatic genotype-phenotype map (lower left quadrant) and a non-linear phenotype-fitness mapwith stabilizing selection for an optimum phenotype (upper left quadrant; blue curve) interact to
result in an epistatic genotype-fitness relationship (upper right quadrant). Binary genotypes are
indicated by gray boxes, connected by single-step substitutions (yellow and green lines).
explicit underlying genotype-phenotype map, allowing for the comparison of FGM-based
and experimental fitness landscapes (Blanquart et al. 2014, Hwang et al. 2017). Interest-
ingly, the single-peaked phenotype-fitness landscape of FGM can give rise to an underlying
genotype-fitness landscape with multiple peaks (Hwang et al. 2017, Park et al. 2020, Srivas-
tava & Payne 2022). The amount of epistasis for fitness at the genotype level depends on
6 Bank
the distance from the fitness peak: far away from the optimum, the same mutation tested on
nearby genetic backgrounds tends to be non-epistatic, whereas strong epistasis can occur
when the same mutation finds itself on nearby genetic backgrounds close to the pheno-
typic optimum. Interestingly and importantly for experimental design, the sampling choice
of mutations from the greater fitness landscape influences the shape of the combinatorily
complete subset of genotypes built by those mutations: individually beneficial substitu-
tions, measured in a reference genetic background, will tend to result in a more epistatic
fitness landscape than substitutions that have occurred subsequently in an adaptive walk
(Blanquart et al. 2014).
2.3. Modeling assumptions and challenges
The last subsections showed that in FGM, epistasis arises from a non-linear phenotype-
fitness map, whereas RMF and other probabilistic fitness landscape models directly map
genotype to fitness without any assumptions about the mapping of genotype to pheno-
type(s) to fitness. Importantly, epistasis for fitness can arise both through an epistatic
genotype-phenotype map and a non-linear phenotype-fitness map, and these levels may in-
teract to yield a (potentially epistatic) genotype-fitness map (Figure 2C). This leads to an
open question: how much epistasis for fitness can be attributed to an epistatic genotype-
phenotype map, and how much is due to non-linear phenotype-fitness relationships?
Ultimately, the genotype is connected to fitness by multiple layers of multiple pheno-
types, and thus the picture discussed here and sketched in Figure 2C is greatly oversimpli-
fied. In an elegant theoretical study, the propagation of epistasis across hierarchical levels
in a metabolic network was recently studied by Kryazhimskiy (2021). They found that
negative epistasis cannot be converted into positive epistasis at higher levels, whereas the
opposite is possible. Interestingly, their work suggests that epistasis does not get diluted at
higher levels but tends to become stronger.
Obtaining general mathematical results about evolution on theoretical fitness landscapes
requires additional assumptions about the evolutionary dynamics. Most genotype-fitness
landscape models address haploid, non-recombining organisms in the limit of strong selec-
tion and weak mutation (i.e., neglecting neutral substitutions and assuming that mutations
appear and fix sequentially Gillespie 1984; see Fragata et al. 2019 for a review considering
fitness landscape models with neutral substitutions and the consequences of genetic drift).
For example, when recombination is included in the study of adaptive walks on fitness
landscapes, the connectedness of genotypes in the fitness landscape changes because recom-
bination produces new combinations of (multiple) segregating alleles (Moradigaravand &
Engelstadter 2012, Nowak et al. 2014). For rugged RMF landscapes, recombination creates
an initial advantage to recombining populations that is later lost during adaptation because
recombination dilutes genotypes necessary for crossing fitness valleys. Thus, theory predicts
that recombining populations adapting on an epistatic fitness landscape can get stalled at
local optima even more severely than non-recombining populations (Nowak et al. 2014).
Studying diverse and recombining populations on fitness landscapes creates conceptual
and technical questions. In a diploid fitness landscape, dominance has to be accounted
for with respect to the direct effect of individual mutations and their epistasis because it
affects both the duration for which epistatic alleles segregate and their ultimate fate in a
population (see, e.g. Turelli & Orr 2000, Blanckaert & Bank 2018). For example, there is
currently no commonly used biologically reasonable and parameter-light definition of the
www.annualreviews.org • Fitness Landscapes and Epistasis 7
dominance of epistasis, i.e., of the effect of combinations of one or two copies of sets of
epistatic alleles.
Finally, population dynamics considering multiple coexisting genotypes are difficult to
characterize mathematically and to simulate computationally. If a starting population with
standing genetic variation is to be considered, how should this population be distributed in
the fitness landscape? Finding simple, computationally feasible, and yet biologically rele-
vant assumptions is a major challenge underlying theoretical studies of fitness landscapes.
3. EPISTASIS IS COMMON IN EXPERIMENTAL FITNESS LANDSCAPES
Recent advances in technology and experimental approaches (including CRISPR and site-
directed mutagenesis to create sets of specific mutations e.g., Karageorgi et al. 2019, Hi-
etpas et al. 2012, and deep mutational scanning, in potential combination with barcoding
approaches, to measure phenotypes or fitness of thousands of genotypes in parallel e.g.,
Fowler & Fields 2014, Cote-Hammarlof et al. 2021, Johnson et al. 2019) have enabled the
empirical assessment of increasingly large empirical fitness landscapes and the subsequent
evaluation of fitness landscape theory. When selection is strong (e.g., in large microbial
populations), and if these findings translate to natural environments, empirically tuned
fitness landscape models promise to be useful for predicting evolution, which is relevant
in human medicine (e.g., antimicrobial resistance or cancer evolution) and with respect to
climate change (e.g., potential for evolutionary rescue under the climate crisis) (de Visser
& Krug 2014, Lassig et al. 2017, Wortel et al. 2021).
3.1. Engineered fitness landscapes measured in the laboratory
As an intermediate between theoretical fitness landscapes and data from nature, experimen-
tal fitness landscapes are appealing for several reasons. Firstly, depending on the design
of the mutant library they may contain all genotypes of interest, not only those which are
segregating naturally; thus, deleterious or weakly beneficial genotypes can be measured,
and inference of the selection coefficient (i.e., the relative competitive advantage of a geno-
type) can be performed for each genotype, resulting in a measurement of the (potentially
combinatorially complete) fitness landscape. Secondly, the lab environment is controlled
such that all genotypes grow or evolve in a constant, known, and similar environment. Fi-
nally, samples can be resequenced to check for secondary mutations, which are anyways
minimized in the setup of deep mutational scanning, where populations are observed for
only a few generations. Together, these features result in elegant and reproducible fitness
data.
Many fitness landscape studies come from systems and molecular biology, where epista-
sis is considered a natural consequence of interactions within and between genes (reviewed
in Domingo et al. 2019, Phillips 2008, Costanzo et al. 2019, Athavale et al. 2014). Because
intra- and intergenic interactions intuitively arise from the physical organisation of proteins
and the connection of genes in biological pathways, the question is not whether there is
epistasis but how much, and which models of epistasis are most suitable. Among a multi-
tude of studies that screened hundreds or thousands of engineered genotypes for (usually
pairwise) epistasis, most have focused on measurements of phenotypes that may be fitness-
related but do not directly translate into competitive fitness. Across these studies, pairwise
epistasis was found to be common and there is increasing evidence of higher-order epistasis
8 Bank
(Domingo et al. 2019). Moreover, an increasing number of studies have followed evolution-
ary trajectories in the laboratory and dissected epistatic effects along those trajectories (e.g.
Kryazhimskiy et al. 2014, Johnson et al. 2019). This review focuses on engineered slices of
fitness landscapes built from combinations of more than two mutational steps and with an
emphasis on studies measuring competitive fitness.
3.2. Experimental design influences the shape of the fitness landscape
3.2.1. Which level of biological organization was considered?. Three main components
distinguish experimental fitness landscapes studies that may explain some of the observed
differences between fitness landscapes and that have direct implications for the connection
of models and data. Firstly, studies differ by the considered level of biological organi-
zation. For example, a landmark study of all 32 combinations of five mutations in the
beta-lactamase gene in E. coli that together led to a 105-fold increase in resistance to the
antibiotic cefotaxime reported that only 18 out of 120 possible evolutionary trajectories
from the reference genotype to the resistant genotype in the fitness landscape were accessi-
ble, i.e., they had monotonically increasing fitness steps (Weinreich et al. 2006). In contrast,
when Khan et al. (2011) performed competition experiments of the combinations of the first
five adaptive substitutions that had been fixed during laboratory evolution of E. coli in a
glucose-limited minimal medium, the majority (86) of the 120 possible evolutionary trajec-
tories to the fittest genotype were accessible. Here, Khan et al. (2011) studied substitutions
in different genes, whereas Weinreich et al. (2006) studied a set of point mutations in the
same gene.
On average, one might expect more epistasis between random alleles within the same
gene than between random alleles between genes, because the physical structure of a protein
leads to locally interacting residues and fine balances in the composition of the protein
sequence. For example, Bank et al. (2015) reported extensive epistasis within the heat-
shock protein Hsp90 in S. cerevisiae, where almost 50% of ≈1000 interactions of pairs
of point mutations in a 9-amino-acid region of the protein showed negative epistasis for
competitive fitness, compared with ≈3% of significant fitness interactions (based on colony
size as measure of fitness) of double gene knockouts in the same species (Costanzo et al.
2010). These numbers have to be interpreted carefully: in addition to the fitness proxy,
the measurement accuracy between these studies differed greatly. Moreover, an enrichment
in epistasis is expected between genes located in the same pathway than between random
genes (Hurst et al. 2004). A systematic metaanalysis or a dedicated experimental study
could better evaluate these expectations in the future.
Theoretically, knowledge of the structure of a protein, the interactions of genes within
the protein, and the phenotypes important for fitness in a given environment could be used
to develop predictive models of epistasis. Kemble et al. (2020) studied the competitive
fitness of 1369 genotypes in E. coli carrying mutations in two adjacent metabolic genes in
the same pathway. The shape of their double-mutant fitness landscape strongly depended
on the induced amount of gene expression in the pathway (which was tuned experimentally
here and could represent different environmental pressures). This study stands out because
the authors developed a specific model of the metabolic pathway that captured the severe
changes in fitness effects and epistasis occurring across the different expression levels at
impressive accuracy. Here, the model allowed for an accurate quantitative analysis of the
specific scenario; at the same time its specificity prevents straightforward extrapolation
www.annualreviews.org • Fitness Landscapes and Epistasis 9

of the results to other pathways or higher-level questions such as the role of epistasis in
evolution. Taking this to the organismal level, systems biologists have developed complex
genome-scale metabolic models that predict phenotypes across environments (King et al.
2016, Bordbar et al. 2014). It would be interesting to see how such predictions relate to
competitive fitness of bacterial strains in the lab or observed sequence variation in nature.
In general, the arguments above indicate that epistasis is expected to be most prevalent
at short genomic distances, when substitutions within genes or in genes within the same
pathway interact. At the same time, the evolutionary relevance of epistasis at short physical
distances in the genome is unclear. Even if variation was present at physically close loci,
it would rarely be exposed to epistatic selection due to the low recombination probability
between closely linked loci and the low probability that the epistatic mutations occur in the
same genotype. Evolutionary models of complex fitness landscapes incorporating recombi-
nation could shed light on how this dichotomy affects the expected distribution and role of
epistatic variation in natural populations.
3.2.2. Which measure of fitness was used?. Secondly, many studies have measured phe-
notypes other than competitive fitness such as monoculture growth rate (e.g., Pinheiro
et al. 2021), fluorescence (e.g., Sarkisyan et al. 2016), antibody binding (e.g., Adams et al.
2019), minimal inhibitory concentration in the presence of a drug (e.g., Weinreich et al.
2006, ribozyme activity (e.g., Bendixsen et al. 2021), or transcription factor binding (e.g.,
Aguilar-Rodrıguez et al. 2017). Often, there is a clear relationship between the measured
phenotype and reproductive success (e.g., if a protein is essential, its stability is neces-
sary for survival of the individual). However, how the fitness-related phenotype maps to
competitive fitness is generally unknown, and even bacterial growth rates in monoculture,
which are often treated as equivalent to competitive fitness, are correlated with but do not
translate directly into competitive fitness (Chevin 2011, Concepcion-Acevedo et al. 2015).
As shown in Figure 2 and discussed in Section 2.3, epistasis on the genotype-phenotype
level can differ greatly from epistasis for fitness, which implies that genotype-phenotype
landscapes may often be bad predictors of the true fitness landscape.
3.2.3. How were the genotypes for the fitness landscape chosen?. Finally, the choice of the
mutations for an experimental fitness landscape affects its shape (Blanquart et al. 2014).
Khan et al. (2011) combined five substitutions that had occurred and fixed together in
adaptive walk during laboratory evolution. Due to this choice, the 5-step genotype was
by definition highly fit, and at least one evolutionary trajectory between the reference
and the endpoint had to be accessible. Using a different sampling strategy, Bank et al.
(2016) studied the complete fitness landscape of 640 genotypes in S. cerevisiae of point
mutations (all within a 9-amino-acid region in the heat-shock protein Hsp90) that had
not been previously found together and were individually beneficial to slightly deleterious.
The resulting fitness landscape of up to 6 combined mutations showed both strong positive
epistasis (at the local and global peaks) and strong negative epistasis, with many strongly
deleterious combinations of individually beneficial mutations. Interestingly, none of the
high-fitness genotypes observed in this fitness landscape were found in natural sequence
data. The observed results were compatible with theoretical predictions: mutations that
occurred together in an adaptive walk were less epistatic than random mutations (Blanquart
et al. 2014), there was an excess of positive epistasis at local peaks (Greene & Crona 2014),
and negative (diminishing-returns) epistasis was common (discussed below in Section 3.3).
10 Bank
With increasingly large experimentally measured fitness landscapes, it has become pos-
sible to consider different levels of mutation choice in the same landscape. Pokusaeva
et al. (2019) measured competitive fitness resulting in 12 fitness landscapes in S. cerevisiae
spanning a total of >4 million genotypes, including the majority of extant amino-acid sub-
stitutions of the his3 protein across 21 yeast species. Their fitness landscapes were generally
rugged with 85% of substitutions being genetic-background dependent, and the evolution-
ary trajectory was constrained by epistasis. Although commonly observed and theoretically
predicted patterns such as negative epistasis away from fitness peaks or ridges were con-
firmed in the large data set, simple models of sigmoidal phenotype-fitness relationships were
not sufficient to describe the data; only a complex multi-level model captured the observed
epistatic interactions.
3.3. Pervasive diminishing-returns epistasis points to ubiquitous interactions onthe genotype-phenotype level
Although the extent of inferred epistasis in experimental fitness landscapes differed between
study system, measure of fitness, and environment, many studies shared the observation of
negative (diminishing-returns) epistasis, where the effect of the same beneficial mutation
was smaller when it was measured in a higher-fitness genetic background (see de Visser &
Krug 2014 for an earlier review). Diminishing-returns epistasis results in a gradual slow-
down of fitness evolution and is predicted across various fitness landscape models when
the population approaches a fitness peak (Martin et al. 2007, Lyons et al. 2020, Draghi &
Plotkin 2013, Greene & Crona 2014). Diminishing-returns epistasis is predicted generally
during adaptation on a fitness landscape when there is widespread “idiosyncratic” epistasis,
corresponding to epistasis on the genotype-phenotype level in Figure 2C; Lyons et al.
(2020), Reddy & Desai (2021)). Models of idiosyncratic epistasis can, for example, explain
he fitness trajectories obtained from a long-term evolution experiment in E. coli, in which
even after 50000 generations of evolution no fitness peak was reached (Wiser et al. 2013).
Interestingly, the epistasis that occurs when an additive trait is translated into fitness
through a non-linear phenotype-fitness map (also termed “nonspecific epistasis”; Domingo
et al. 2019; see for example the genotype-phenotype-fitness map of FGM in Figure 2A) is
not sufficient to guarantee persistent diminishing-returns epistasis (Reddy & Desai 2021).
Thus, theory indicates that (potentially ubiquitous) epistasis on the genotype-phenotype
level may contribute to observed evolutionary trajectories.
4. EPISTASIS AND FITNESS LANDSCAPES IN THE WILD
In an evolving population, epistasis is a second-order effect because it only becomes visible
when recombination combines two (or more) epistatic alleles, or when mutation rates are
high enough to create epistatic double mutants. Therefore, epistasis is generally believed to
be negligible during adaptation on short time scales as compared to other evolutionary forces
such as directional selection and genetic drift. However, the widely observed pattern of
diminishing-returns epistasis, for example, can lead to a change in the selection gradient over
time and is therefore likely to lead to wrong predictions of how quantitative traits change
over time (Hansen & Pelabon 2021). Moreover, epistasis creates detectable contingencies
between substitutions in distantly related species that have been used to infer interactions
between proteins (e.g., Morcos et al. 2011, Marmier et al. 2019). The prevalence of epistasis
www.annualreviews.org • Fitness Landscapes and Epistasis 11
in experimental studies, together with its observed footprint in phylogenies, calls for a
reevaluation of how epistasis affects evolutionary inference.
4.1. Experimental evidence of epistatic adaptive trajectories in the wild
Retracing adaptive steps during evolution in the wild is becoming feasible with the advance
of experimental methods, especially in organisms that lend themselves to experimental
manipulation in the laboratory. However, few studies to date have explicitly screened
evolutionary trajectories for the presence of epistasis for fitness (see Storz 2018 for a review
of studies of genotype-phenotype epistasis). Pokusaeva et al. (2019), introduced above,
built intragenic fitness landscapes including extant variation across various yeast species.
They found ubiquitus and often higher-order epistasis. The epistasis resulted in fitness
ridges such that fit genotypes tended to be located near extant variation in the sequence
space. Thus, most likely epistasis played a role during evolution by defining the accessible
sequence space, including potentially neutrally accumulated divergence.
In a study of a protein under strong selection, Gong et al. (2013), Gong & Bloom (2014)
dissected the epistatic evolutionary trajectory of the human influenza nucleoprotein (NP)
between 1968 and 2007. They used reverse genetics approaches to create genotypes carrying
individual substitutions that had occurred during the evolutionary trajectory on the original
genetic background from 1968, and used the growth rate of these genotypes in cell cultures
as measure of their fitness. Gong et al. (2013) found that several of the substitutions
that had fixed during the evolutionary history of NP were individually deleterious in the
background of the original sequence, but enabled the virus to subsequently accumulate
beneficial immune-system evading substitutions. Interestingly, no epistatic trajectories were
observed in NP in swine influenza (Gong & Bloom 2014). Whereas humans tend to get
infected by influenza multiple times, swine are rarely infected more than once, which leads
to much stronger selection for immune invasion in human influenza than in swine influenza.
The results from Gong et al. (2013), Gong & Bloom (2014) indicate that strong selection
was a prerequisite for observing epistasis in the evolutionary trajectory. Whereas laboratory
studies in bacteria support that more strongly selected mutations have stronger interactions
(e.g. Schenk et al. 2013), it remains unknown whether epistatic trajectories in nature are
enriched for individually strongly selected substitutions. Whether this pattern is predicted
by theory depends on the considered model scenario. For example, FGM predicts strong
epistasis between strongly selected substitutions when the optimum is close, but not when
it is far away.
One example of the dissection of an evolutionary trajectory in complex organisms comes
from Karageorgi et al. (2019), who studied a convergent evolutionary trajectory of the adap-
tation of multiple insects including monarch butterflies to cardiac glycoside toxins. They
overcame the challenges of retracing evolution by using CRISPR-Cas9 based genome edit-
ing, which allowed them to create and test combinations of the target mutations introduced
into Drosophila melanogaster. They found strong positive epistasis for toxin tolerance be-
tween the three substitutions that had been repeatedly observed during evolution of toxin
resistance. In addition, the order at which substitutions could accumulate was found to be
constrained by epistasis (Karageorgi et al. 2019). Positive epistasis at fitness peaks is a gen-
eral theoretical prediction that holds independent of the fitness landscape model (Greene
& Crona 2014).
12 Bank
4.2. Epistasis is commonly observed in form of hybrid incompatibility
In the research area of speciation, epistasis plays a major role when it manifests itself as
hybrid incompatibility (reviewed in Seehausen et al. 2014, Coughlan & Matute 2020). The
classical model that explains speciation via the evolution of postzygotic hybrid incompat-
ibilities in geographically isolated populations is the (Bateson-)Dobzhansky-Muller model.
In this model, allopatrically diverging populations accumulate substitutions over time. Any
combinations of substitutions not tested by natural selection because they never segre-
gated in the same population have the potential to be incompatible, leading to so-called
Dobzhanzky-Muller incompatibilities (DMIs). As pointed out by Gavrilets (1997), the re-
sulting fitness landscape contains ridges of connected high-fitness genotypes and valleys of
incompatible genotypes reflecting negative epistasis between the outermost genotypes on
the ridge. Thus, a defining element of a classical DMI is that only one of the recombinant
offspring of hybrids suffers from low fitness, whereas the broad definition of hybrid incom-
patibility includes any combination of alleles reducing fitness in hybrids (Seehausen et al.
2014).
Hybrid incompatibilities and DMIs between species have been mapped in laboratory
crosses and more recently using large genomic screens, often revealing hundreds of pairwise
incompatibilities between species pairs. For example, a genetic map of incompatibilities
between the two fly species D. melanogaster and D. simulans resulted in an estimate of >100
hybrid-lethal incompatibility regions (Presgraves 2003). Similarly, between two hybridizing
swordtail fish in Mexico, genomic analyses of hybrid genomes indicated >100 incompatibility
loci (Schumer et al. 2014). Also within species, segregating epistatic interactions may be
common: Corbett-Detig et al. (2013) found various pairwise epistatic interactions when
screening the global genetic variation within D. melanogaster.
Measuring a complex fitness landscape in the wild that encompasses more than pairwise
interactions is difficult for various reasons. For example, diploidy creates a challenge for
defining fitness, it is often difficult to obtain a sufficiently large sample to have a good
representation of genotypes, fitness measurements are even less straightforward than in the
lab, background variation might affect measurements, or experimental manipulation and
creation of fitness variation can be impossible. Hybrid populations circumvent several of
these challenges by being natural sources of genetic and fitness variation. Few studies to
date have attempted to leverage this opportunity to map multi-locus fitness landscapes in
the wild. In a landmark study, Martin & Wainwright (2013) mapped the phenotype-fitness
landscape of hybrids of three recently diverged pupfish ecotypes in field enclosures. Based
on measures of growth and survival, they found a multi-peaked phenotype-fitness landscape
isolating molluscivores from generalists with no evidence of frequency-dependent selection
(Martin & Wainwright 2013, Martin & Gould 2020, Martin 2016). In a follow-up study,
Patton et al. (2021) recently studied the genotype-fitness landscape underlying the observed
fitness differences between specialist and generalist phenotypes.
4.3. The contentious role of epistasis during speciation
Epistasis enables multiple genetic solutions to adaptation, represented by multiple peaks
in the fitness landscape. Consequently, epistasis is thought to favor allopatric divergence.
However, it is an open question how much epistatic alleles contribute to speciation early
during divergence or in the presence of gene flow, and how (much) epistatic variation is
accumulated and maintained within populations. Barton & Bengtsson (1986) argued that
www.annualreviews.org • Fitness Landscapes and Epistasis 13
hybrid incompatibilities tend to be weak barriers to gene flow. Evolutionary theory has
predicted that, because of the specific shape of their fitness landscape, epistatic alleles in
a DMI cannot be maintained polymorphic in a population and that their accumulation
in the presence of gene flow can only be a by-product, rather than a driver, of evolution
(Gavrilets 1997, Bank et al. 2012). However, more complex epistatic interactions might
behave differently. Blanckaert et al. (2020) recently showed that adding a third locus
to the fitness landscape of a hybrid incompatibility allows for the evolution of complete
reproductive isolation in the presence of gene flow (see Paixao et al. 2015 for a network-
based approach). In a series of theoretical works, Fraısse et al. (2016), Simon et al. (2018),
Schneemann et al. (2020) have studied the evolution of hybrid incompatibility using FGM,
recovering many of the predictions of previous theoretical models and patterns observed in
empirical data. Furthermore, they developed indices characterizing the respective influence
of the environment and genetics on hybrid fitness (Schneemann et al. 2020).
Taking a fitness-landscape view of speciation models in which higher-order interactions
are possible is challenging due to the complexity of the models (and the potential genomic
inference of such interactions), but may be an opportunity to resolve the dichotomy between
the frequency at which hybrid incompatibilities are observed and the theoretically ascribed
minor role of epistatic loci early during divergence (Seehausen et al. 2014). Given the
potential overrepresentation of epistatic loci at short physical distances in the genome (e.g.,
within proteins, or regulatory interactions), it will be important to address the role of
genetic architecture and recombination distances in determining the evolutionary dynamics
of epistatic loci (see, e.g., Blanckaert & Bank 2018). Here, probabilistic fitness landscape
models can be a tool to quantify how the amount of epistasis in a fitness landscape affects
speciation. For example, with increasing ruggedness, the number of fitness peaks increases
and with it the potential for populations to climb different fitness peaks. At the same
time these fitness peaks will be located close to each other in sequence space, which should
result in a smaller barrier to gene flow when the diverged populations hybridize (see also
Figure S2). Thus, an intuitive prediction would be that intermediate epistasis maximizes
the potential for stable divergence.
5. ENVIRONMENT-DEPENDENT EPISTASIS: MODELS AND EMPIRICALEVIDENCE
5.1. Empirical evidence for environment-dependent epistasis
Despite great advances in the study of both theoretical and empirical fitness landscapes and
epistasis, little is known about how fitness landscapes and epistasis change across environ-
ments. Whereas experimental screens have reported several cases of ubiquitous genotype-
by-environment interactions for fitness (GxE; also referred to as antagonistic pleiotropy
and costs of adaptation; e.g., Bank et al. 2014, Kinsler et al. 2020, Flynn et al. 2020), the
presence and magnitude of environment-dependent epistasis (or genotype-by-genotype-by-
environment interactions; GxGxE) for fitness has received little attention to date. The
few existing examples have reported striking variation in epistasis between environments.
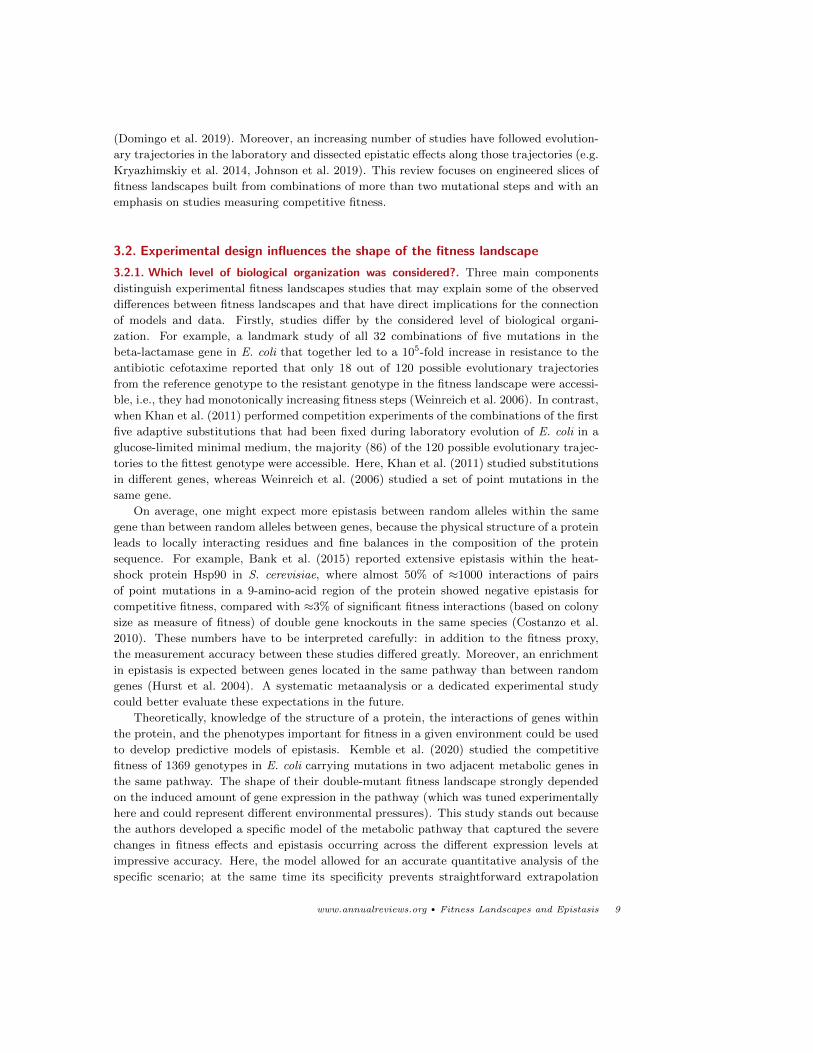
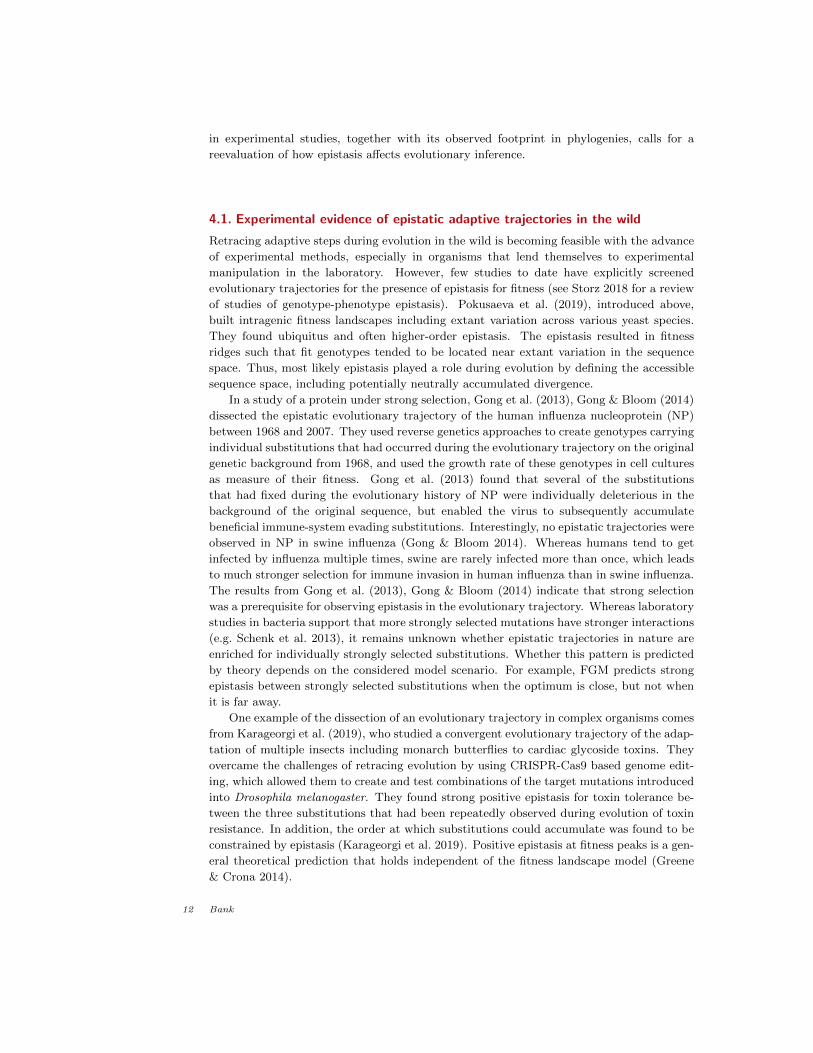
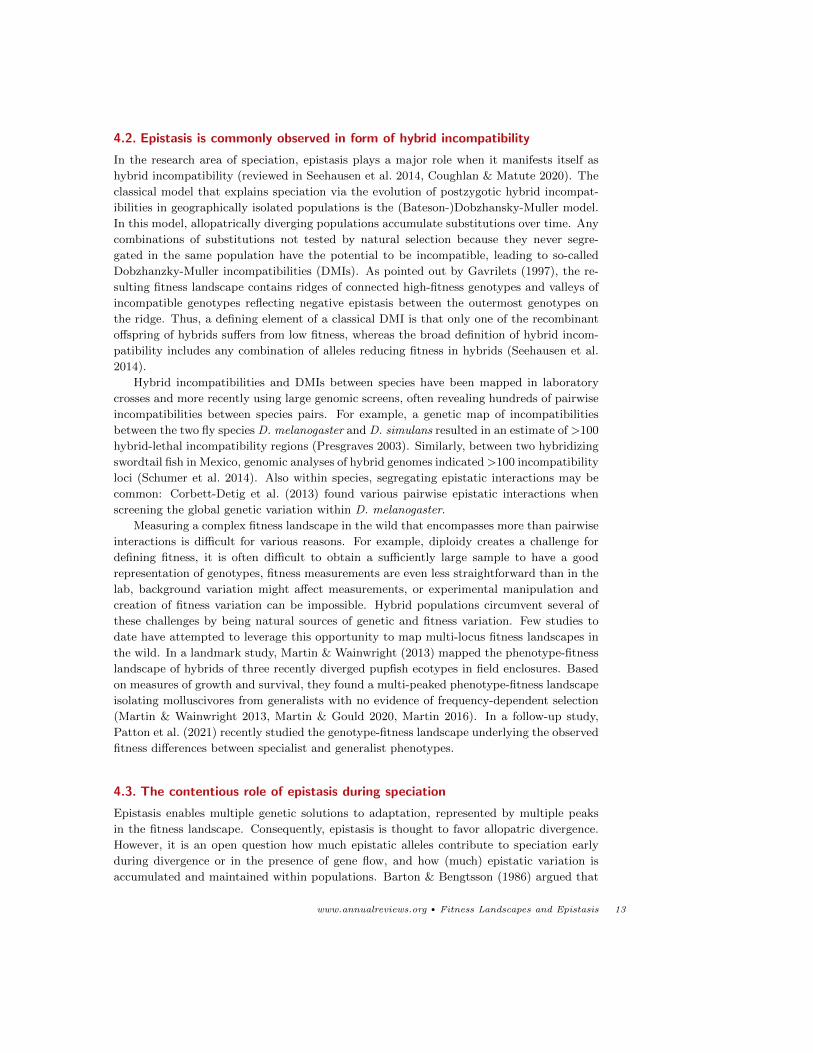
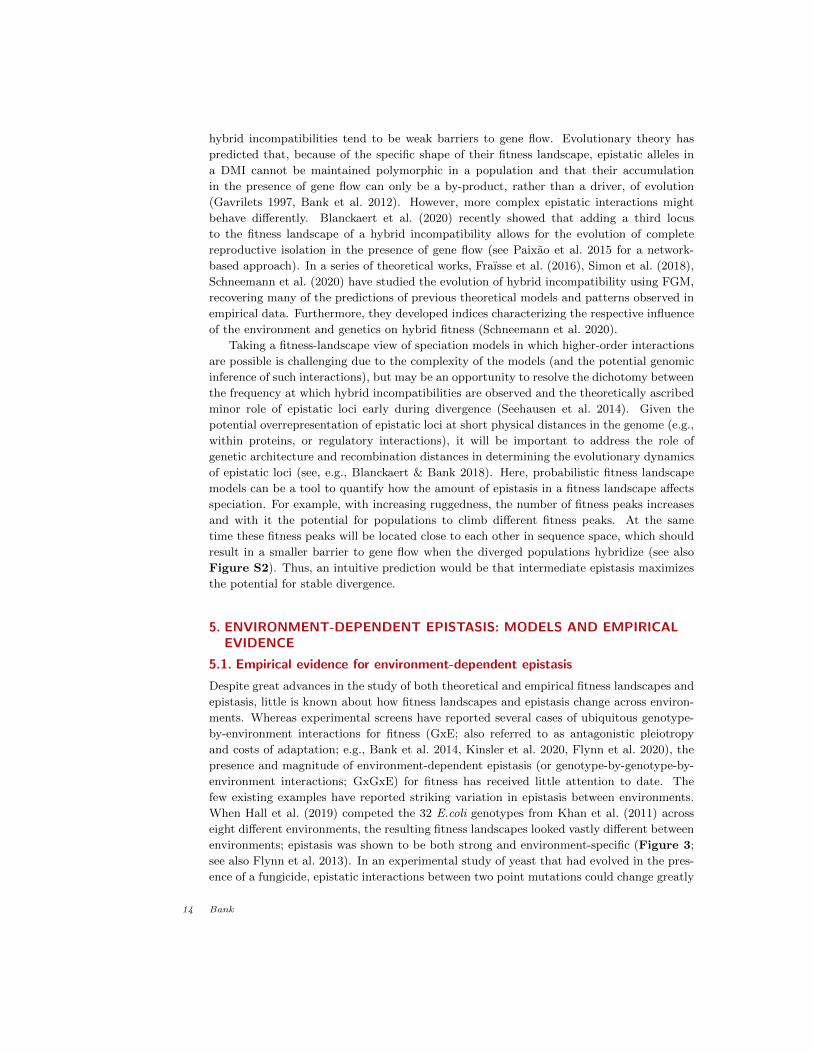
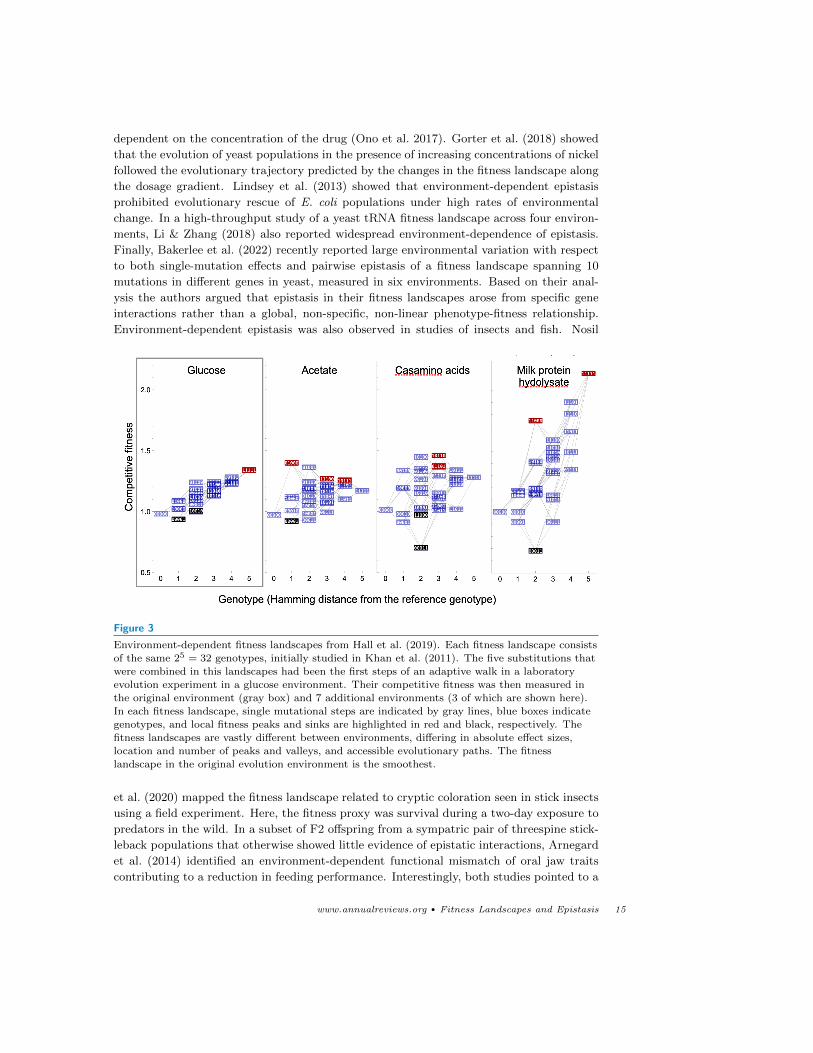
When Hall et al. (2019) competed the 32 E.coli genotypes from Khan et al. (2011) across
eight different environments, the resulting fitness landscapes looked vastly different between
environments; epistasis was shown to be both strong and environment-specific (Figure 3;
see also Flynn et al. 2013). In an experimental study of yeast that had evolved in the pres-
ence of a fungicide, epistatic interactions between two point mutations could change greatly
14 Bank
dependent on the concentration of the drug (Ono et al. 2017). Gorter et al. (2018) showed
that the evolution of yeast populations in the presence of increasing concentrations of nickel
followed the evolutionary trajectory predicted by the changes in the fitness landscape along
the dosage gradient. Lindsey et al. (2013) showed that environment-dependent epistasis
prohibited evolutionary rescue of E. coli populations under high rates of environmental
change. In a high-throughput study of a yeast tRNA fitness landscape across four environ-
ments, Li & Zhang (2018) also reported widespread environment-dependence of epistasis.
Finally, Bakerlee et al. (2022) recently reported large environmental variation with respect
to both single-mutation effects and pairwise epistasis of a fitness landscape spanning 10
mutations in different genes in yeast, measured in six environments. Based on their anal-
ysis the authors argued that epistasis in their fitness landscapes arose from specific gene
interactions rather than a global, non-specific, non-linear phenotype-fitness relationship.
Environment-dependent epistasis was also observed in studies of insects and fish. Nosil
Figure 3
Environment-dependent fitness landscapes from Hall et al. (2019). Each fitness landscape consistsof the same 25 = 32 genotypes, initially studied in Khan et al. (2011). The five substitutions that
were combined in this landscapes had been the first steps of an adaptive walk in a laboratory
evolution experiment in a glucose environment. Their competitive fitness was then measured inthe original environment (gray box) and 7 additional environments (3 of which are shown here).
In each fitness landscape, single mutational steps are indicated by gray lines, blue boxes indicategenotypes, and local fitness peaks and sinks are highlighted in red and black, respectively. The
fitness landscapes are vastly different between environments, differing in absolute effect sizes,
location and number of peaks and valleys, and accessible evolutionary paths. The fitnesslandscape in the original evolution environment is the smoothest.
et al. (2020) mapped the fitness landscape related to cryptic coloration seen in stick insects
using a field experiment. Here, the fitness proxy was survival during a two-day exposure to
predators in the wild. In a subset of F2 offspring from a sympatric pair of threespine stick-
leback populations that otherwise showed little evidence of epistatic interactions, Arnegard
et al. (2014) identified an environment-dependent functional mismatch of oral jaw traits
contributing to a reduction in feeding performance. Interestingly, both studies pointed to a
www.annualreviews.org • Fitness Landscapes and Epistasis 15
major role of environment-dependent changes in phenotype-fitness relationships in creating
and altering epistasis.
5.2. Theoretical approaches to environment-dependent epistasis
Most fitness landscape theory to date has addressed a single, static environment, and thus
a static fitness landscape. However, the study of evolution in changing environments is
important both from a basic science point of view and with respect to the response of
populations to anthropogenic change and the climate crisis. Fluctuating phenotypic optima
turn a fitness landscape into a “seascape” (Mustonen & Lassig 2009). Although the concept
of the fitness seascape is gaining increasing interest from the scientific community, little work
has addressed how to extend the existing fitness landscape theory to account for changing
environments and how this affects epistasis and its consequences.
Fisher’s Geometric Model is the most extensively studied class of fitness landscape mod-
els with respect to changing environments (Harmand et al. 2017, Martin & Lenormand 2015,
2006, Zhang 2012, Matuszewski et al. 2014, Schneemann et al. 2020). Different environ-
ments can be incorporated in FGM by assuming a change in the location of the phenotypic
optimum (Martin & Lenormand 2015, 2006, see also Figure 2B). Under this assumption, it
is possible to study environmental gradients as well as completely different environments,
and to develop expectations of the amount of genotype-by-environment interactions. Using
experimental data from E. coli, evolved at different concentrations of an antibiotic drug,
Harmand et al. (2017) could predict the costs of antibiotic resistance across environmental
gradients with a generalized FGM. From both a theoretical and experimental point of view,
an exciting next step would be to extract the how the underlying genotype-fitness landscape
changed across environments.
Several studies of dynamic genotype-fitness landscape models have addressed how pop-
ulations adapt to fluctuating environments, with a focus on the response to the time-scale
at which fluctuations occur and whether evolution results in the repeated switching be-
tween specialists or the evolution of generalists (Sachdeva et al. 2020, Wang & Dai 2019,
Trubenova et al. 2019). Moreover, Agarwala & Fisher (2019) showed that in a slowly
changing environment, epistasis promotes evolutionary dynamics that switch between short
phases of rapid adaptation and long periods of stasis in which the population waits for new
adaptive paths to open up.
5.3. Environment-dependent epistasis could leave a footprint of “ecologicalhistory” in genomes
Recent theoretical work by Das et al. (2020) has shown how simple genotype-phenotype rela-
tionships can result in environment-dependent epistasis. Their model specifically described
the genotype-fitness landscapes along an environmental gradient of antibiotic concentra-
tion, based on Hill functions that are commonly used to describe the S-shaped relationship
between bacterial growth rate and antibiotic concentration (so-called pharmacodynamics
(Goutelle et al. 2008)). Das et al. (2020) assumed that every genotype has a different S-
shaped fitness curve, and that there is a trade-off between growing well in the absence and
the presence of the antibiotic; i.e. resistant genotypes must have a cost of resistance. Their
model was in excellent agreement with a previously described experimental fitness landscape
from E. coli (Marcusson et al. 2009). Interestingly, although Das et al. (2020) observed little
epistasis for the two main phenotypic parameters of the model, the drug-free growth rate of
16 Bank
genotypes and their IC50 (the concentration of the drug reducing the growth rate by 50%),
epistasis was common in the composite fitness measure combining these two parameters and
variable along the dose gradient. Epistasis was greatest at intermediate concentrations of
the antibiotic and the fitness ranking of the genotypes changed most rapidly at intermediate
drug concentrations. The authors concluded that small changes in (intermediate) dosage
might have large consequences for evolution, because new evolutionary routes may open up
or close.
Extending their theoretical analysis of the model, Das et al. (2021) found that a geno-
type can carry information on its “ecological history”; in other words, the current genotype
is informative of the previous environments. This scenario arises in fitness landscapes in
which epistatic relationships change along an environmental gradient, such that evolution-
ary trajectories are contingent on the previously experienced environment. Firstly, some
genotypes were only accessible at low doses of an antibiotic drug, and would therefore
never be observed if the population experienced high doses of the drug in its recent history.
Secondly, there was on average limited reversibility of evolutionary paths, i.e., if the envi-
ronmental change was reversed the population did not tend to take the reverse evolutionary
path. Notably, the obtained analytical results are based on specific models and approaches
inspired by theoretical physics. It will be interesting to see if similar results can be obtained
from other models incorporating environmental gradients, such as FGM.
6. CONNECTIONS, DISCREPANCIES, AND FUTURE CHALLENGES
6.1. Ecological factors may smoothen the fitness landscape that matters forevolutionary dynamics in the wild
Under the assumption of environmental fluctuations in natural environments, evolution may
not only be constrained by epistasis, but this epistasis may also be variable across envi-
ronments, further complicating the study of selective forces that acted during evolutionary
history. So far, few models can accommodate the change of epistasis across environments,
and there is little knowledge about whether these effects could “cancel out” integrated over
evolutionary history, maybe resulting in, on average, neutral-like evolutionary dynamics.
At the same time, selection coefficients inferred from empirical fitness landscape stud-
ies tend to be much larger than those estimated via inference of the distribution of fit-
ness effects from polymorphism data (reviewed in Tataru & Bataillon 2020). This could
be due to the complexity of natural environments as compared to experimental settings.
Over evolutionarily relevant time scales (i.e., those reflecting the polymorphism used for the
above-mentioned inference methods), the experienced environment of a population has likely
fluctuated greatly (including the effect of ecological interactions of the population with its
environment), such that any specific strong fitness effect is diluted as an average over time
and number of experienced environments (and fitness-related phenotypes). This view would
reflect the ”seascape” approach to fitness landscapes (Mustonen & Lassig 2009). A labo-
ratory environment removes as many of these fluctuations and complexities as possible to
extract the fitness (or phenotypic) effect of mutations in a well-defined environment. Thus,
one main target of selection in the laboratory may be to streamline molecular processes and
to remove all unnecessary mechanisms allowing an organism to respond to environmental
fluctuations, e.g., by knocking out genes with premature stop codons (see, e.g. Kvitek &
Sherlock 2013, Kryazhimskiy et al. 2014). In addition, fluctuations could result both from
a changing environment altering the fitness of genotypes and from population size changes
www.annualreviews.org • Fitness Landscapes and Epistasis 17
altering the strength of genetic drift, thereby making fitness differences ”invisible”. Just as
Wright (1932) argued, population bottlenecks could effectively smoothen the shape of the
fitness landscape perceived by an evolving population in nature.
In the extreme case, all but the strongest epistasis could become invisible to natural
selection and the fitness landscape could effectively smoothen to an almost flat surface with
holes of strongly deleterious, incompatible genotypes, as described in Gavrilets’ holey fitness
landscape model (Gavrilets 2004). Relatedly, the study of combinatorially complete fitness
landscapes might be misleading our intuition about evolution on these landscapes. The
epistasis experienced by an evolving population based on its segregating variation is likely
different from the observed epistasis when considering the entire possible fitness landscape
(Whitlock et al. 1995). Quantifying these differences and finding measures of “realized
epistasis” is a challenge because the segregating variation strongly depends on evolutionary
parameters such as ploidy, recombination, population size and mutation rate.
6.2. At which level do ecology and the environment modify fitness landscapes,and which traces does that leave?
It is unknown which part of the genotype-phenotype-fitness relationship is most affected by
changes in the environment, and thus, what causes changes in epistasis across environments
(see Figure 4B-D). Empirical and theoretical studies could address this question by de-
veloping models allowing for environment-tunable epistasis on the genotype-phenotype and
the phenotype-fitness levels, and by designing approaches to extract those respective pieces
of the fitness landscape. As Figure 4B-C show, a change in the phenotype-fitness map-
ping straightforwardly leads to changes in the genotype-fitness landscape and thus, changes
in epistasis across environments. This can, for example, occur when a previously fitness-
relevant phenotype becomes irrelevant in a different environment (e.g., camouflage in a
dark or turbid environment, fast swimming in the absence of a predator, or antibiotic resis-
tance in an antibiotic-free environment; Figure 4C). On the other hand, the environment
can change epistasis in the genotype-phenotype map through environmentally induced (po-
tentially transgenerational) epigenetic modification without changing the phenotype-fitness
map, for example by silencing a gene involved in an epistatic interaction (Figure 4D).
Epistasis constrains evolutionary trajectories. If epistasis changes across environments, this
implies that genomes in the present may contain information on the environment(s) the
population has experienced in the past. Thus, the inference of evolutionary history from
genomic samples may be linked to (or confounded by) the ecological history of a population
(Das et al. 2021). Whether and in which conditions this concept is applicable to more
general fitness landscapes, and whether it can be translated into an inference framework for
genomic data, is currently unknown. Moreover, it is unknown how the contingency of evo-
lutionary trajectories caused by epistasis (in stable or fluctuating environments), and the
frequency-dependent selection caused by epistatic selection in admixed populations, may
confound population-genetic inference of evolutionary histories or selection. As a first step
and proof-of-concept to address this question, features of probabilistic fitness landscapes
with widespread epistasis could be incorporated into genomic simulations to quantify how
the presence of epistasis changes subsequent population-genetic inference.
Finally, epistasis can span all biological levels of organization: within or between genes,
between host and symbiont, and possibly between species (see, e.g., Sørensen et al. 2021,
Buskirk et al. 2020). Incorporating these levels into a theory of co-evolutionary fitness
18 Bank
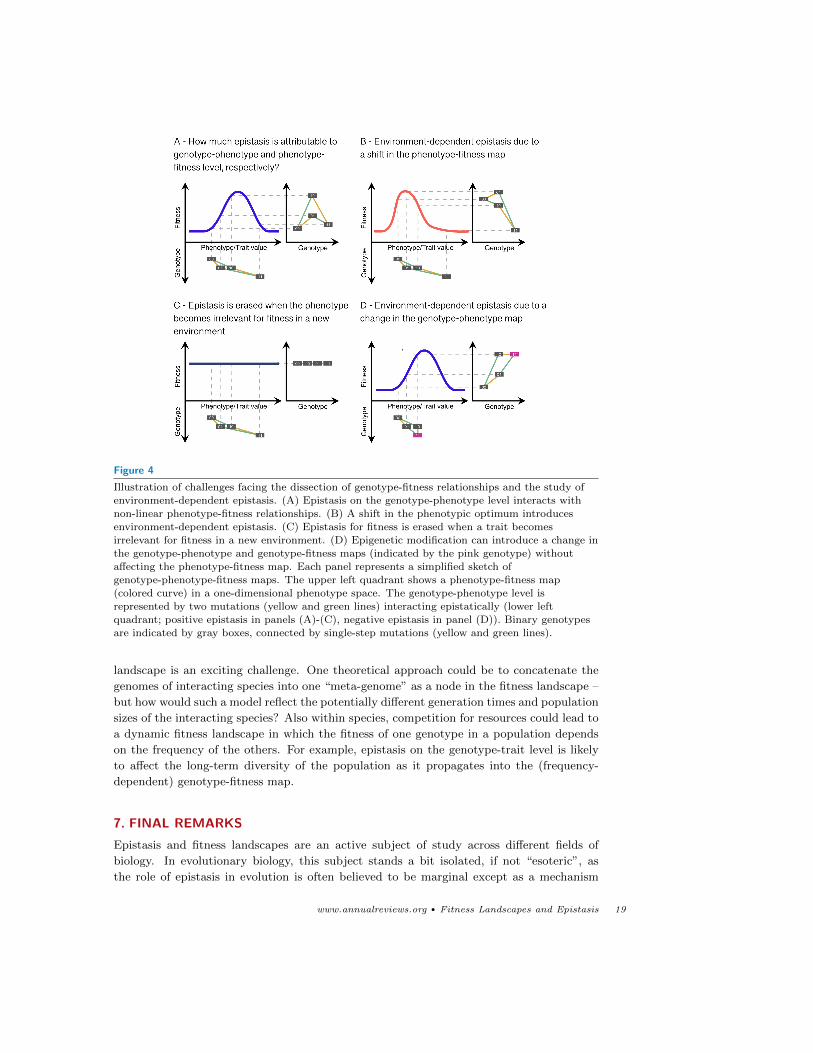
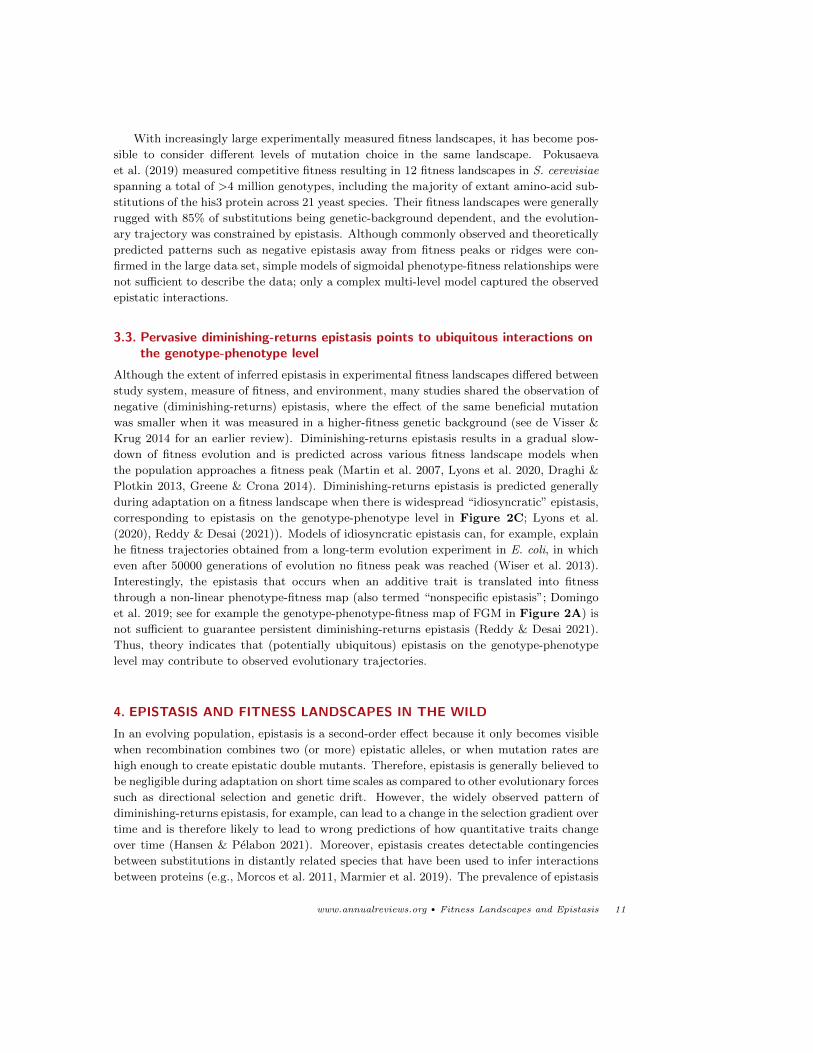
Figure 4
Illustration of challenges facing the dissection of genotype-fitness relationships and the study of
environment-dependent epistasis. (A) Epistasis on the genotype-phenotype level interacts with
non-linear phenotype-fitness relationships. (B) A shift in the phenotypic optimum introducesenvironment-dependent epistasis. (C) Epistasis for fitness is erased when a trait becomes
irrelevant for fitness in a new environment. (D) Epigenetic modification can introduce a change inthe genotype-phenotype and genotype-fitness maps (indicated by the pink genotype) without
affecting the phenotype-fitness map. Each panel represents a simplified sketch of
genotype-phenotype-fitness maps. The upper left quadrant shows a phenotype-fitness map(colored curve) in a one-dimensional phenotype space. The genotype-phenotype level is
represented by two mutations (yellow and green lines) interacting epistatically (lower left
quadrant; positive epistasis in panels (A)-(C), negative epistasis in panel (D)). Binary genotypesare indicated by gray boxes, connected by single-step mutations (yellow and green lines).
landscape is an exciting challenge. One theoretical approach could be to concatenate the
genomes of interacting species into one “meta-genome” as a node in the fitness landscape –
but how would such a model reflect the potentially different generation times and population
sizes of the interacting species? Also within species, competition for resources could lead to
a dynamic fitness landscape in which the fitness of one genotype in a population depends
on the frequency of the others. For example, epistasis on the genotype-trait level is likely
to affect the long-term diversity of the population as it propagates into the (frequency-
dependent) genotype-fitness map.
7. FINAL REMARKS
Epistasis and fitness landscapes are an active subject of study across different fields of
biology. In evolutionary biology, this subject stands a bit isolated, if not “esoteric”, as
the role of epistasis in evolution is often believed to be marginal except as a mechanism
www.annualreviews.org • Fitness Landscapes and Epistasis 19

to maintain species integrity. It is time to acknowledge the prevalence of epistasis, which
has left its marks in contingent evolutionary trajectories. New theoretical and empirical
evidence of the extent and architecture of epistasis, and new possibilities to study complex
interactions theoretically and empirically, call for a reevaluation of how epistasis affects
(and has affected) evolution and whether and how epistasis might confound inferences
from evolutionary studies. Moreover, evolutionary perspectives on genotype-phenotype-
fitness relationships and the importance of environment-dependent epistasis are essential
to further develop the biological relevance of fitness landscape studies. Bridging the gap
between theoretical and experimental fitness landscapes and the role of epistasis in the wild
requires interdisciplinary research integrating the viewpoints of molecular biology, systems
biology, and ecology and evolution.
SUMMARY POINTS
1. Fitness landscape theory shows how epistasis constrains adaptation and promotes
divergence, and indicates how experimental choices influence the expected epistasis
in an empirical fitness landscape.
2. Epistasis is prevalent in empirical fitness landscapes, with a common pattern of
diminishing-returns epistasis, where the beneficial effect of a substitution is smaller
when it appears in a fitter genetic background.
3. There is increasing evidence that epistasis can be environment-dependent. Theory
indicates that genomes evolved in a fitness landscape with environment-dependent
epistasis may carry information on their “ecological history”.
FUTURE ISSUES
1. How can the existing fitness landscape theory be applied, generalized or extended to
cases of diploid/recombining/polymorphic/small populations that evolve in chang-
ing environments and in the presence of ecological interactions?
2. How much does the prevalence of epistasis and the resulting historical contingency
affect evolutionary inference?
3. How frequently and in which way does the environment alter epistasis on the
genotype-phenotype level and the phenotype-fitness level, respectively?
DISCLOSURE STATEMENT
The author is not aware of any affiliations, memberships, funding, or financial holdings that
might be perceived as affecting the objectivity of this review.
ACKNOWLEDGMENTS
I am grateful for the thoughtful comments and suggestions from Kathleen Donohue, Sergey
Kryazhimskiy, Joachim Krug, Christopher Martin, Austin Patton, Thomas Bataillon,
Marco Louro, Adamandia Kapopoulou and David McLeod, for discussion and inspiration
provided by the THEE lab, for precious support by Vitor Sousa and Chaitanya Gokhale,
20 Bank
and funding from ERC Starting Grant 804569 (FIT2GO) and HFSP Young Investigator
Grant RGY0081/2020.
LITERATURE CITED
Adams RM, Kinney JB, Walczak AM, Mora T. 2019. Epistasis in a fitness landscape defined by
Antibody-Antigen binding free energy. Cell Syst 8(1):86–93.e3
Agarwala A, Fisher DS. 2019. Adaptive walks on high-dimensional fitness landscapes and seascapes
with distance-dependent statistics. Theor. Popul. Biol. 130:13–49
Aguilar-Rodrıguez J, Payne JL, Wagner A. 2017. A thousand empirical adaptive landscapes and
their navigability. Nat Ecol Evol 1(2):45
Aita T, Iwakura M, Husimi Y. 2001. A cross-section of the fitness landscape of dihydrofolate re-
ductase. Protein Eng. 14(9):633–638
Aita T, Uchiyama H, Inaoka T, Nakajima M, Kokubo T, Husimi Y. 2000. Analysis of a local fitness
landscape with a model of the rough mt. fuji-type landscape: application to prolyl endopeptidase
and thermolysin. Biopolymers 54(1):64–79
Arnegard ME, McGee MD, Matthews B, Marchinko KB, Conte GL, et al. 2014. Genetics of ecolog-
ical divergence during speciation. Nature 511(7509):307–311
Athavale SS, Spicer B, Chen IA. 2014. Experimental fitness landscapes to understand the molecular
evolution of RNA-based life. Curr. Opin. Chem. Biol. 22:35–39
Bakerlee CW, Nguyen Ba AN, Shulgina Y, Rojas Echenique JI, Desai MM. 2022. Idiosyncratic
epistasis leads to global fitness-correlated trends
Bank C, Burger R, Hermisson J. 2012. The limits to parapatric speciation: Dobzhansky–Muller
incompatibilities in a Continent–Island model. Genetics 191(3):845–863
Bank C, Hietpas RT, Jensen JD, Bolon DNA. 2015. A systematic survey of an intragenic epistatic
landscape. Mol. Biol. Evol. 32(1):229–238
Bank C, Hietpas RT, Wong A, Bolon DN, Jensen JD. 2014. A bayesian MCMC approach to assess
the complete distribution of fitness effects of new mutations: uncovering the potential for adaptive
walks in challenging environments. Genetics 196(3):841–852
Bank C, Matuszewski S, Hietpas RT, Jensen JD. 2016. On the (un)predictability of a large intragenic
fitness landscape. Proc. Natl. Acad. Sci. U. S. A. 113(49):14085–14090
Barton N, Bengtsson BO. 1986. The barrier to genetic exchange between hybridising populations.
Heredity 57 ( Pt 3):357–376
Bendixsen DP, Pollock TB, Peri G, Hayden EJ. 2021. Experimental resurrection of ancestral mam-
malian CPEB3 ribozymes reveals deep functional conservation. Mol. Biol. Evol. 38(7):2843–2853
Blanckaert A, Bank C. 2018. In search of the goldilocks zone for hybrid speciation. PLoS Genet.
14(9):e1007613
Blanckaert A, Bank C, Hermisson J. 2020. The limits to parapatric speciation 3: evolution of strong
reproductive isolation in presence of gene flow despite limited ecological differentiation. Philos.
Trans. R. Soc. Lond. B Biol. Sci. 375(1806):20190532
Blanquart F, Achaz G, Bataillon T, Tenaillon O. 2014. Properties of selected mutations and geno-
typic landscapes under fisher’s geometric model. Evolution 68(12):3537–3554
Bordbar A, Monk JM, King ZA, Palsson BO. 2014. Constraint-based models predict metabolic and
associated cellular functions. Nat. Rev. Genet. 15(2):107–120
Buskirk SW, Rokes AB, Lang GI. 2020. Adaptive evolution of nontransitive fitness in yeast. Elife
9:e62238
Chevin LM. 2011. On measuring selection in experimental evolution. Biol. Lett. 7(2):210–213
Concepcion-Acevedo J, Weiss HN, Chaudhry WN, Levin BR. 2015. Malthusian parameters as esti-
mators of the fitness of microbes: A cautionary tale about the low side of high throughput. PLoS
One 10(6):e0126915
Corbett-Detig RB, Zhou J, Clark AG, Hartl DL, Ayroles JF. 2013. Genetic incompatibilities are
www.annualreviews.org • Fitness Landscapes and Epistasis 21
widespread within species. Nature 504(7478):135–137
Costanzo M, Baryshnikova A, Bellay J, Kim Y, Spear ED, et al. 2010. The genetic landscape of a
cell. Science 327(5964):425–431
Costanzo M, Kuzmin E, van Leeuwen J, Mair B, Moffat J, et al. 2019. Global genetic networks and
the Genotype-to-Phenotype relationship. Cell 177(1):85–100
Cote-Hammarlof PA, Fragata I, Flynn J, Mavor D, Zeldovich KB, et al. 2021. The adaptive potential
of the middle domain of yeast hsp90. Mol. Biol. Evol. 38(2):368–379
Coughlan JM, Matute DR. 2020. The importance of intrinsic postzygotic barriers throughout the
speciation process. Philos. Trans. R. Soc. Lond. B Biol. Sci. 375(1806):20190533
Das SG, Direito SO, Waclaw B, Allen RJ, Krug J. 2020. Predictable properties of fitness landscapes
induced by adaptational tradeoffs. Elife 9:e55155
Das SG, Krug J, Mungan M. 2021. A driven disordered systems approach to biological evolution in
changing environments. bioRxiv (2108.06170):10.1101/2021.08.13.456229
de Visser JAGM, Krug J. 2014. Empirical fitness landscapes and the predictability of evolution.
Nat. Rev. Genet. 15(7):480–490
Domingo J, Baeza-Centurion P, Lehner B. 2019. The causes and consequences of genetic interactions
(epistasis). Annu. Rev. Genomics Hum. Genet. 20:433–460
Draghi JA, Plotkin JB. 2013. Selection biases the prevalence and type of epistasis along adaptive
trajectories. Evolution 67(11):3120–3131
Ferretti L, Schmiegelt B, Weinreich D, Yamauchi A, Kobayashi Y, et al. 2016. Measuring epistasis
in fitness landscapes: The correlation of fitness effects of mutations. J. Theor. Biol. 396:132–143
Fisher RA. 1930. The genetical theory of natural selection. Clarendon Press
Flynn JM, Rossouw A, Cote-Hammarlof P, Fragata I, Mavor D, et al. 2020. Comprehensive fitness
maps of hsp90 show widespread environmental dependence. Elife 9
Flynn KM, Cooper TF, Moore FBG, Cooper VS. 2013. The environment affects epistatic interac-
tions to alter the topology of an empirical fitness landscape. PLoS Genet. 9(4):e1003426
Fowler DM, Fields S. 2014. Deep mutational scanning: a new style of protein science. Nat. Methods
11(8):801–807
Fragata I, Blanckaert A, Dias Louro MA, Liberles DA, Bank C. 2019. Evolution in the light of
fitness landscape theory. Trends Ecol. Evol. 34(1):69–82
Fraısse C, Gunnarsson PA, Roze D, Bierne N, Welch JJ. 2016. The genetics of speciation: Insights
from fisher’s geometric model. Evolution 70(7):1450–1464
Gavrilets S. 1997. Hybrid zones with dobzhansky-type epistatic selection. Evolution 51(4):1027–
1035
Gavrilets S. 2004. Fitness landscapes and the origin of species. Princeton University Press
Gillespie JH. 1984. Molecular evolution over the mutational landscape. Evolution 38(5):1116–1129
Gong LI, Bloom JD. 2014. Epistatically interacting substitutions are enriched during adaptive
protein evolution. PLoS Genet. 10(5):e1004328
Gong LI, Suchard MA, Bloom JD. 2013. Stability-mediated epistasis constrains the evolution of an
influenza protein. Elife 2:e00631
Gorter FA, Aarts MGM, Zwaan BJ, de Visser JAGM. 2018. Local fitness landscapes predict yeast
evolutionary dynamics in directionally changing environments. Genetics 208(1):307–322
Goutelle S, Maurin M, Rougier F, Barbaut X, Bourguignon L, et al. 2008. The hill equation: a
review of its capabilities in pharmacological modelling. Fundam. Clin. Pharmacol. 22(6):633–648
Greene D, Crona K. 2014. The changing geometry of a fitness landscape along an adaptive walk.
PLoS Comput. Biol. 10(5):e1003520
Gros PA, Le Nagard H, Tenaillon O. 2009. The evolution of epistasis and its links with genetic
robustness, complexity and drift in a phenotypic model of adaptation. Genetics 182(1):277–293
Hall AE, Karkare K, Cooper VS, Bank C, Cooper TF, Moore FBG. 2019. Environment changes
epistasis to alter trade-offs along alternative evolutionary paths. Evolution 73(10):2094–2105
Hansen TF, Pelabon C. 2021. Evolvability: A Quantitative-Genetics perspective. Annu. Rev. Ecol.
22 Bank
Evol. Syst. 52(1):153–175
Harmand N, Gallet R, Jabbour-Zahab R, Martin G, Lenormand T. 2017. Fisher’s geometrical model
and the mutational patterns of antibiotic resistance across dose gradients. Evolution 71(1):23–37
Hietpas R, Roscoe B, Jiang L, Bolon DNA. 2012. Fitness analyses of all possible point mutations
for regions of genes in yeast. Nat. Protoc. 7(7):1382–1396
Hurst LD, Pal C, Lercher MJ. 2004. The evolutionary dynamics of eukaryotic gene order. Nat. Rev.
Genet. 5(4):299–310
Hwang S, Park SC, Krug J. 2017. Genotypic complexity of fisher’s geometric model. Genetics
206(2):1049–1079
Hwang S, Schmiegelt B, Ferretti L, Krug J. 2018. Universality classes of interaction structures for
NK fitness landscapes. J. Stat. Phys. 172(1):226–278
Johnson MS, Martsul A, Kryazhimskiy S, Desai MM. 2019. Higher-fitness yeast genotypes are less
robust to deleterious mutations. Science 366(6464):490–493
Karageorgi M, Groen SC, Sumbul F, Pelaez JN, Verster KI, et al. 2019. Genome editing retraces
the evolution of toxin resistance in the monarch butterfly. Nature 574(7778):409–412
Kauffman S, Levin S. 1987. Towards a general theory of adaptive walks on rugged landscapes. J.
Theor. Biol. 128(1):11–45
Kauffman SA, Weinberger ED. 1989. The NK model of rugged fitness landscapes and its application
to maturation of the immune response. J. Theor. Biol. 141(2):211–245
Kemble H, Eisenhauer C, Couce A, Chapron A, Magnan M, et al. 2020. Flux, toxicity, and expression
costs generate complex genetic interactions in a metabolic pathway. Sci Adv 6(23):eabb2236
Khan AI, Dinh DM, Schneider D, Lenski RE, Cooper TF. 2011. Negative epistasis between beneficial
mutations in an evolving bacterial population. Science 332(6034):1193–1196
King ZA, Lu J, Drager A, Miller P, Federowicz S, et al. 2016. BiGG models: A platform for
integrating, standardizing and sharing genome-scale models. Nucleic Acids Res. 44(D1):D515–22
Kinsler G, Geiler-Samerotte K, Petrov DA. 2020. Fitness variation across subtle environmental
perturbations reveals local modularity and global pleiotropy of adaptation. Elife 9:e61271
Krug J. 2021. Accessibility percolation in random fitness landscapes. In Probabilistic Structures in
Evolution, ed. Wa Baake E. EMS Press, Berlin, 1–22
Kryazhimskiy S. 2021. Emergence and propagation of epistasis in metabolic networks. Elife
10:e60200
Kryazhimskiy S, Rice DP, Jerison ER, Desai MM. 2014. Global epistasis makes adaptation pre-
dictable despite sequence-level stochasticity. Science 344(6191):1519–1522
Kvitek DJ, Sherlock G. 2013. Whole genome, whole population sequencing reveals that loss of
signaling networks is the major adaptive strategy in a constant environment. PLoS Genet.
9(11):e1003972
Lassig M, Mustonen V, Walczak AM. 2017. Predicting evolution. Nat Ecol Evol 1(3):77
Li C, Zhang J. 2018. Multi-environment fitness landscapes of a tRNA gene. Nat Ecol Evol 2(6):1025–
1032
Lindsey HA, Gallie J, Taylor S, Kerr B. 2013. Evolutionary rescue from extinction is contingent on
a lower rate of environmental change. Nature 494(7438):463–467
Lyons DM, Zou Z, Xu H, Zhang J. 2020. Idiosyncratic epistasis creates universals in mutational
effects and evolutionary trajectories. Nat Ecol Evol 4(12):1685–1693
Mackay TFC. 2013. Epistasis and quantitative traits: using model organisms to study gene–gene
interactions. Nat. Rev. Genet. 15(1):22–33
Marcusson LL, Frimodt-Møller N, Hughes D. 2009. Interplay in the selection of fluoroquinolone
resistance and bacterial fitness. PLoS Pathog. 5(8):e1000541
Marmier G, Weigt M, Bitbol AF. 2019. Phylogenetic correlations can suffice to infer protein partners
from sequences. PLoS Comput. Biol. 15(10):e1007179
Martin CH. 2016. Context dependence in complex adaptive landscapes: frequency and trait-
dependent selection surfaces within an adaptive radiation of caribbean pupfishes
www.annualreviews.org • Fitness Landscapes and Epistasis 23
Martin CH, Gould KJ. 2020. Surprising spatiotemporal stability of a multi-peak fitness landscape
revealed by independent field experiments measuring hybrid fitness. Evol Lett 4(6):530–544
Martin CH, Wainwright PC. 2013. Multiple fitness peaks on the adaptive landscape drive adaptive
radiation in the wild. Science 339(6116):208–211
Martin G, Elena SF, Lenormand T. 2007. Distributions of epistasis in microbes fit predictions from
a fitness landscape model. Nat. Genet. 39(4):555–560
Martin G, Lenormand T. 2006. The fitness effect of mutations across environments: a survey in
light of fitness landscape models. Evolution 60(12):2413–2427
Martin G, Lenormand T. 2015. The fitness effect of mutations across environments: Fisher’s geo-
metrical model with multiple optima. Evolution 69(6):1433–1447
Matuszewski S, Hermisson J, Kopp M. 2014. Fisher’s geometric model with a moving optimum.
Evolution 68(9):2571–2588
McCandlish DM. 2011. Visualizing fitness landscapes. Evolution 65(6):1544–1558
Moradigaravand D, Engelstadter J. 2012. The effect of bacterial recombination on adaptation on
fitness landscapes with limited peak accessibility. PLoS Comput. Biol. 8(10):e1002735
Morcos F, Pagnani A, Lunt B, Bertolino A, Marks DS, et al. 2011. Direct-coupling analysis of
residue coevolution captures native contacts across many protein families. Proc. Natl. Acad. Sci.
U. S. A. 108(49):E1293–301
Mustonen V, Lassig M. 2009. From fitness landscapes to seascapes: non-equilibrium dynamics of
selection and adaptation. Trends Genet. 25(3):111–119
Neidhart J, Szendro IG, Krug J. 2014. Adaptation in tunably rugged fitness landscapes: the rough
mount fuji model. Genetics 198(2):699–721
Nosil P, Villoutreix R, de Carvalho CF, Feder JL, Parchman TL, Gompert Z. 2020. Ecology shapes
epistasis in a genotype-phenotype-fitness map for stick insect colour. Nat Ecol Evol 4(12):1673–
1684
Nowak S, Neidhart J, Szendro IG, Krug J. 2014. Multidimensional epistasis and the transitory
advantage of sex. PLoS Comput. Biol. 10(9):e1003836
Ono J, Gerstein AC, Otto SP. 2017. Widespread genetic incompatibilities between First-Step mu-
tations during parallel adaptation of saccharomyces cerevisiae to a common environment. PLoS
Biol. 15(1):e1002591
Paixao T, Bassler KE, Azevedo RBR. 2015. Emergent speciation by multiple Dobzhansky–Muller
incompatibilities. bioRxiv (doi: 10.1101/008268):10.1101/008268
Park SC, Hwang S, Krug J. 2020. Distribution of the number of fitness maxima in fisher’s geometric
model. J. Phys. A: Math. Theor. 53(38):385601
Patton AH, Richards EJ, Gould KJ, Buie LK, Martin CH. 2021. Adaptive introgression and de
novo mutations increase access to novel fitness peaks on the fitness landscape during a vertebrate
adaptive radiation. bioRxiv :10.1101/2021.07.01.450666
Phillips PC. 2008. Epistasis–the essential role of gene interactions in the structure and evolution of
genetic systems. Nat. Rev. Genet. 9(11):855–867
Pinheiro F, Warsi O, Andersson DI, Lassig M. 2021. Metabolic fitness landscapes predict the evo-
lution of antibiotic resistance. Nat Ecol Evol 5(5):677–687
Pokusaeva VO, Usmanova DR, Putintseva EV, Espinar L, Sarkisyan KS, et al. 2019. An experi-
mental assay of the interactions of amino acids from orthologous sequences shaping a complex
fitness landscape. PLoS Genet. 15(4):e1008079
Presgraves DC. 2003. A fine-scale genetic analysis of hybrid incompatibilities in drosophila. Genetics
163(3):955–972
Reddy G, Desai MM. 2021. Global epistasis emerges from a generic model of a complex trait. Elife
10:e64740
Sachdeva V, Husain K, Sheng J, Wang S, Murugan A. 2020. Tuning environmental timescales to
evolve and maintain generalists. Proc. Natl. Acad. Sci. U. S. A. 117(23):12693–12699
Sarkisyan KS, Bolotin DA, Meer MV, Usmanova DR, Mishin AS, et al. 2016. Local fitness landscape
24 Bank
of the green fluorescent protein. Nature 533(7603):397–401
Schenk MF, Szendro IG, Salverda MLM, Krug J, de Visser JAGM. 2013. Patterns of epistasis
between beneficial mutations in an antibiotic resistance gene. Mol. Biol. Evol. 30(8):1779–1787
Schneemann H, De Sanctis B, Roze D, Bierne N, Welch JJ. 2020. The geometry and genetics of
hybridization. Evolution 74(12):2575–2590
Schumer M, Cui R, Powell DL, Dresner R, Rosenthal GG, Andolfatto P. 2014. High-resolution
mapping reveals hundreds of genetic incompatibilities in hybridizing fish species. Elife 3:e02535
Seehausen O, Butlin RK, Keller I, Wagner CE, Boughman JW, et al. 2014. Genomics and the origin
of species. Nat. Rev. Genet. 15(3):176–192
Simon A, Bierne N, Welch JJ. 2018. Coadapted genomes and selection on hybrids: Fisher’s geometric
model explains a variety of empirical patterns. Evol Lett 2(5):472–498
Sørensen MES, Wood AJ, Cameron DD, Brockhurst MA. 2021. Rapid compensatory evolution can
rescue low fitness symbioses following partner switching. Curr. Biol.
Srivastava M, Payne JL. 2022. The transformability of genotype-phenotype landscapes
Storz JF. 2018. Compensatory mutations and epistasis for protein function. Curr. Opin. Struct.
Biol. 50:18–25
Szendro IG, Schenk MF, Franke J, Krug J, de Visser JAGM. 2013. Quantitative analyses of empirical
fitness landscapes. J. Stat. Mech. 2013(01):P01005
Tataru P, Bataillon T. 2020. polyDFE: Inferring the distribution of fitness effects and properties of
beneficial mutations from polymorphism data. Methods Mol. Biol. 2090:125–146
Tenaillon O. 2014. The utility of fisher’s geometric model in evolutionary genetics. Annu. Rev. Ecol.
Evol. Syst. 45:179–201
Trubenova B, Krejca MS, Lehre PK, Kotzing T. 2019. Surfing on the seascape: Adaptation in a
changing environment. Evolution 73(7):1356–1374
Turelli M, Orr HA. 2000. Dominance, epistasis and the genetics of postzygotic isolation. Genetics
154(4):1663–1679
Walsh B, Lynch M. 2018. Evolution and selection of quantitative traits. Oxford University Press
Wang S, Dai L. 2019. Evolving generalists in switching rugged landscapes. PLoS Comput. Biol.
15(10):e1007320
Weinreich DM, Delaney NF, Depristo MA, Hartl DL. 2006. Darwinian evolution can follow only
very few mutational paths to fitter proteins. Science 312(5770):111–114
Whitlock MC, Phillips PC, Moore FBG, Tonsor SJ. 1995. Multiple fitness peaks and epistasis.
Annu. Rev. Ecol. Syst. 26(1):601–629
Wiser MJ, Ribeck N, Lenski RE. 2013. Long-term dynamics of adaptation in asexual populations.
Science 342(6164):1364–1367
Wortel MT, Agashe D, Bailey SF, Bank C, Bisschop K, et al. 2021. The why, what and how of
predicting evolution across biology: from disease to biotechnology to biodiversity. EcoEvoRxiv
:10.32942/osf.io/4u3mg
Wright S. 1931. Evolution in mendelian populations. Genetics 16(2):97–159
Wright S. 1932. The roles of mutation, inbreeding, crossbreeding, and selection in evolution. Pro-
ceedings of the Sixth International Congress of Genetics :356–366
Zhang XS. 2012. Fisher’s geometrical model of fitness landscape and variance in fitness within a
changing environment. Evolution 66(8):2350–2368
www.annualreviews.org • Fitness Landscapes and Epistasis 25


