
DOI: 10.1002/elan.201500384
Determination of the anticancer drug sorafenib in serumby adsorptive stripping differential pulse voltammetry usinga chitosan/multiwall carbon nanotube modified glassycarbon electrodeNurgul Karadas-Bakirhan,[a] St�phanie Patris,[b] Sibel A. Ozkan,[a] Alp Can,[c] and Jean-Michel Kauffmann*[b]
1. Introduction
Sorafenib (SOR), (Scheme 1), (4-[4-[[4-chloro-3-(trifluor-omethyl)phenyl]carbamoylamino] phenoxy]-N-methyl-pyridine-2-carboxamide), is a drug approved for the treat-ment of primary kidney cancer, advanced primary livercancer (hepatocellular carcinoma), and radioactive iodineresistant advanced thyroid carcinoma [1]. It inhibits alsosome intracellular serine/threonine kinases (e.g. C-Raf,wild-type B-Raf and mutant B-Raf) [2, 3]. Sorafenib isa kinase inhibitor that decreases tumor cell proliferationin vitro. Sorafenib treatment induces autophagy [4],which may suppress tumor growth [5]. After an oral ad-ministration, sorafenib is rapidly absorbed, resulting inpeak plasma levels within 3 hours and 96 % of the dose isrecovered within 14 days with 77 % of the drug excretedin the feces, 19% excreted as glucuronidated metabolitesin the urine. Due to either inefficient metabolism or lackof intestinal absorption, 50% from the feces is excretedas unchanged drug. The volume of distribution of thedrug has not been reported but sorafenib is highly proteinbound (~99.5 %) and has an average half-life of 25–48 hours, suggesting that the drug may have a largevolume of distribution.
Various analytical methods including liquid chromatog-raphy with UV and mass spectrometry detection havebeen developed for the determination of sorafenib inserum or plasma samples [6–10]. However, up to date,there are no reports by voltammetric techniques neitherin human serum sample nor in its dosage forms. A surveyof literature reveals that no electrochemical data hasbeen reported on the voltammetric behavior of SOR.
Voltammetric techniques are not affected by sampleturbidity due e.g. to insoluble excipients present in phar-maceutical dosages forms and allow sensitive and selec-tive assays in biological samples by exploiting surface pre-concentration phenomena [11–14]. In addition to the ana-lytical figures of merit voltammetric techniques are espe-cially suitable for investigating the electrochemical behav-ior of drug compounds. This knowledge can give insightinto the metabolic fate or in-vivo redox pattern of mole-cules of pharmacological interest [15,16]. The modifica-tion of solid electrodes with nanocomposite material isbeing extensively investigated for improved sensitivity ofthe measurements. In this respect, CNTs offer chemicalstability, high electrical conductivity, and mechanicalstrength with excellent electrochemical properties [17–24]. CNT can advantageously be solubilized in an aque-ous chitosan solution for electrochemical sensor and bio-sensor development (17).
The present study aimed at developing a sensor as Chi-tosan/-COOH MWCNT/GCE for the voltammetric inves-
[a] N. Karadas-Bakirhan, S. A. OzkanAnkara University, Faculty of Pharmacy, Department ofAnalytical Chemistry, 06100 Tandogan, Ankara, Turkey
[b] S. Patris, J.-M. KauffmannUniversit� libre de Bruxelles (ULB), Faculty of Pharmacy,Laboratory of Instrumental Analysis andBioelectrochemistry, Campus Plaine, CP 205/6, 1050Bruxelles, Belgium*e-mail: [email protected]
[c] A. CanAnkara University, Faculty of Medicine, Department ofHistology and Embryology, 06410, Sihhiye Ankara, Turkey
Abstract : Adsorptive stripping differential pulse voltam-metry (AdSDPV) was applied to the assay of sorafenib inhuman serum sample. Cyclic voltammetry at a carbonbased screen printed electrode (SPE) permitted to detectthe irreversible oxidation of SOR with formation ofa new compound reversibly oxidized at a lower potential.Quantitative assays were realized using a chitosan/carbox-ylic acid functionalized multiwalled carbon nanotube
modified glassy carbon electrode in 0.1 M phosphatebuffer pH 7.0 in the presence of 50% methanol. TheAdSDPV method provided two linear responses withinthe concentration ranges 1 � 10�8–8 �10�8 M and 1 �10�7–8�10�7 M in serum with LOQ and LOD of 3.2 �10�9 and9.6 �10�10 of lower linear range, respectively. The recov-ery of sorafenib in spiked serum was 97.5 %.
Keywords: Anticancer Drug · Sorafenib · Adsorptive Stripping Differential Pulse Voltammetry · Chitosan.
www.electroanalysis.wiley-vch.de � 2015 Wiley-VCH Verlag GmbH & Co. KGaA, Weinheim Electroanalysis 2015, 27, 1 – 9 &1&
These are not the final page numbers! ��
Full Paper

tigation and sensitive analysis of SOR in spiked serumsample by cyclic, differential pulse and adsorptive strip-ping differential pulse voltammetry.
2. Experimental
2.1. Chemicals and Reagents
SOR pure form (99%) was supplied by Bayer (Istanbul,Turkey). Sorafenib N-oxide was purchased from Alsa-Chim (Illkirch-Graffenstaden, France). Reagent gradechemicals (Merck or Sigma) were used for preparation ofbuffers. Multi-walled (MWCNT) carbon nanotubes,single-walled (�COOH SWCNT) and multi-walled (�COOH MWCNT) carboxylic acid functionalized carbonnanotubes (I.D x length: 10 nmx1.5 mm) were purchasedfrom DropSens. Chitosan (low molecular weight) waspurchased from Sigma-Aldrich. The stock solutions ofSOR (1.0 � 10�3 M) were prepared in methanol andstored at 48. The working solutions of SOR were pre-pared daily by dissolution in the supporting electrolytecontaining 50 % methanol. Acetonitrile was used for de-naturation of proteins in the serum sample. A buffer solu-tion prepared from sodium dihydrogen phosphate anddisodium hydrogen phosphate (Riedel-de-Haen, Germa-ny) both at 0.1 M with pH value 7.0 was used for the sup-porting electrolyte preparation. In this study, 0.1 M phos-phate buffer (PB) and 1 M acetate buffer solutions servedas supporting electrolyte for pH effect studies. CV studiesat the SPE were realized in 0.1 M PB+0.1 M KCl in thepresence of 10 % methanol. Buffer solution pH was ad-justed with NaOH solution. For electrode modification,a 0.1 % (m:v) chitosan with 1 mg/mL �COOH MWCNTsuspension was prepared in 0.1 M acetate buffer solution(pH 5.0).
2.2. Equipment and conditions
All electrochemical studies were performed using a com-puter-controlled Autolab potentiostat/galvanostatPGSTAT 302 with GPES 4.9 software and using a BASiEpsilon (BASi West Lafayette, IN, USA) potentiostat.The SPEs and an edge connector (ref. DRP-DSC) werepurchased from DropSens, S.L (Oviedo, Spain). The SPEconsisted on carbon auxiliary, silver pseudo reference andcarbon working electrodes (DS-110; Ø 4 mm), printedonto a ceramic substrate. The electrochemical cell andelectric contacts are on the insulating layer. For voltam-
metry analyses, 50 mL of sample solution was droppedonto the three-electrode electrochemical cell part.
Experiments using the glassy carbon working electrode(GCE) were performed in a three-electrode cell configu-ration with a counter electrode as platinum wire, a GCE(unmodified or modified) (Bioanalytical Systems, WestLafayette, IN, USA; Ø: 3 mm) and a NaCl saturated Ag/AgCl as reference electrode. The GCE was polished man-ually with an aqueous slurry of alumina powder (Ø:0.01 mm) on a polishing pad (Bioanalytical Systems, WestLafayette, IN, USA) just before modification and theelectrode was cleaned using an ultrasonic bath for 2 minin methanol. All measurements were performed at roomtemperature. Buffer solutions pHs were adjusted usinga pH meter Model 538 (WTW, Austria) using a combined(glass and reference) electrode with an accuracy of0.05 pH.
Surface characterizations of electrodes were performedwith SEM Leo 438 VP-QS detector in high vacuummode. Electrode surfaces were coated with AuPd as15 nm.
Electrochemical impedance spectroscopy was per-formed using the Autolab potentiostat/galvanostatPGSTAT100 with NOVA software. The impedance dia-grams were recorded at the peak potential by applyinga 10 mV sinusoidal potential through a frequency domainfrom 100 kHz down to 0.1 Hz.
DPV conditions were: pulse amplitude, 50 mV; pulsewidth 50 ms; scan rate 20 mV.s�1. AdSDPV conditionswere: deposition potential Edep =0.4 V; accumulationtime tacc =3 min; step potential 8 mV.
2.3. Preparation of the Chitosan/-COOH MWCNT/GCE
Several suspensions were prepared with 0.05, 0.1, 0.25,0.50% chitosan and 1 mg/mL �COOH MWCNT in 0.1 Macetate buffer solution (pH 5.0) under ultrasonic stirringfor 2 h prior to use. The deposited suspension volume wasvaried between 1.25–15 mL. This volume was casted ontothe electrode surface followed by heating the electrode inan oven at 50 8C for 15 min. The modified GCE was keptat room temperature for 1 h before use. The modifiedGCE was rinsed in bi-distilled water and used as Chito-san/-COOH MWCNT/GCE. It was conditioned by apply-ing 2 consecutive cyclic voltammetry cycles between�0.25 V and 1.7 V in the selected supporting electrolytebetween each measurements.
Scheme 1. Structure of SOR and SOR-N-oxide
www.electroanalysis.wiley-vch.de � 2015 Wiley-VCH Verlag GmbH & Co. KGaA, Weinheim Electroanalysis 2015, 27, 1 – 9 &2&
These are not the final page numbers! ��
Full Paper

2.4. Analysis of SOR from spiked human serum samples
Drug-free human serum samples were obtained fromhealthy volunteers and they were kept frozen until assay.After gentle thawing, an aliquot volume of sample wasspiked with SOR dissolved in methanol. The final concen-tration of SOR in this mixture was 1 �10�3 M. Then themixture was treated with acetonitrile for serum denatura-tion and precipitation of proteins. An acetonitrile/serumvolume ratio equal to 1.5/1 was used. The mixture wascentrifuged for 10 min in order to eliminate serum pro-tein residues after vortexing step for 30 s. The supernatantpart was taken carefully and then a designated volume ofthis part was transferred into a volumetric flask and dilut-ed up to the volume with the selected supporting electro-lyte. The concentration of SOR in the analyzed solutionvaried in the range between 1 � 10�8 and 8 �10�7 M.Quantification was performed by AdSDPV and SOR con-centration was obtained by means of the calibrationcurve method from the related calibration equations.
2.5. Recovery studies
Recovery studies were realized by spiking the serumsample. For this, an appropriate amount of the stock solu-tion of SOR was added to the drug free serum samples.The regression equation from the calibration curves wasused for the determination of recovery results after fiveparallel analyses of AdSDPV method (n=5).
3. Result and Discussion
3.1. Surface morphological characterization of the GCEfilm by SEM
The surface morphology of the bare GC, Chitosan/GC,-COOH MWCNT/GC and Chitosan/-COOH MWCNT/GC electrodes were investigated by SEM with 1 mm barscale. According to the SEM images (Figure 1c), theGCE surface was densly coated with �COOH MWCNTnanoparticles. Chitosan appeared as covering the -COOHMWCNT/GCE surface and formed a compact compositefilm (Figure 1d).
3.2. EIS Studies
The surface morphology of Chitosan/-COOH MWCNT/GCE and bare GCE were also characterized using EISmeasurements. The experiment was carried out in redoxmixture 5 mM potassium ferrocyanide/5 mM potassiumferricyanide in 0.1 M KCl (1 :1) in the frequency range of100 kHz to 0.1 Hz. The Randles equivalent circuit consist-ed of the ohmic resistance of the electrolyte solution (Rs),the double layer capacitance (Cdl), the electron transferresistance (Rct) and the Warburg impedance (ZW) result-ing from the diffusion of analyte molecules from the bulkof the electrolyte to the interface. Fig. 2 represents Ny-quist plots of the bare GCE and the Chitosan/-COOHMWCNT/GCE. At the bare GCE, the charge transfer re-sistance was observed as 105 kW by fitting the semi-circle(Fig. 2 curve a). When the Chitosan/-COOH MWCNT/
Fig. 1. SEM images of a) bare GCE b) Chitosan/GCE, c) -COOH MWCNT/GCE and d) Chitosan/-COOH MWCNT/GCE
www.electroanalysis.wiley-vch.de � 2015 Wiley-VCH Verlag GmbH & Co. KGaA, Weinheim Electroanalysis 2015, 27, 1 – 9 &3&
These are not the final page numbers! ��
Full Paper

GCE was studied, the charge transfer resistance signifi-cantly decreased to about 56 kW (Fig. 2 curve b). This ob-servation infers that Chitosan/-COOH MWCNT modifi-cation plays an important role to facilitate the electrontransfer at the electrode-solution interface. Higher elec-tric conductivity, improved electron transfer and largersurface area were gained thanks to the modification ofthe GCE (see below).
3.3. Voltammetry of SOR
To the best of our knowledge, the redox property andquantification of SOR have not been studied by voltam-metric methods. In the studied working solutions, metha-nol ratio was chosen as 50% due to the poor water solu-bility of SOR at all investigated pH values. The voltam-metric behavior of 5 � 10�5 M SOR was investigated byCV and DPV methods. At both the GCE and SPE, cyclicvoltammetry indicated one irreversible oxidation peakfollowed by a second one embedded in the solvent oxida-tion current. The first irreversible oxidation peak wasclearly defined by DPV and further exploited in quantita-tive experiments (Figure 3). The current of this peak de-creased at methanol ratios higher than 50% (Figure notshown). Various chitosan amounts (0.1, 0.05, 0.25, 0.50%)were studied in a solution containing 1 mg/mL �COOHMWCNT; 0.1% was chosen due to the most sensitive re-sponse obtained. The volume of this suspension castedonto the GCE was studied between 1.25 and 15 mL. Thebest response in terms of sensitivity and repeatability wasobtained with 2.5 mL casting volume for a 5� 10�5 M SORin 0.1 M PB pH 7.0 (Figure 3, curve a). Different CNTsfor GCE electrode modification were studied (see re-agents) and best results in terms of intensity of SOR5x10�5 M oxidation peak current were obtained using the�COOH MWCNT ie. a signal approximately 40% higher
was obtained comparing to the �COOH SWCNT modi-fied GCE.
The pH of the supporting electrolyte has a majorimpact on the oxidation potential of SOR at the Chito-san/-COOH MWCNT/GCE. The pH dependency wasstudied in 0.1 M PB (2.0, 3.0, 6.0, 7.0, 8.0) and 1.0 M ace-tate buffers (3.7, 4.7, 5.7) by CV and DPV. The obtainedgraphs corresponding to peak currents for both tech-niques were found to provide a similar trend at the modi-fied electrode with two linear segments and an interceptat pH 5.5 likely corresponding to the pKa of the pyridinemoiety. Lowering the pH facilitated the electrooxidationof SOR with the highest response obtained in PB atpH 7.0.
A linear regression can be expressed by the followingequations for the irreversible main oxidation peak usingCV and DPV techniques.
Ep ¼ 1124� 33:5pH; r ¼ 0:989
between pH2:0� 8:0 with CV
Ep ¼ 1081� 35:5pH; r ¼ 0:997
between pH2:0� 8:0 with CV
The slope of these regression lines were close to30 mV/pH suggesting an equal involvement of protonsand electrons in the oxidation process. Multiple CV cy-clings at the Chitosan/-COOH MWCNT/GCE of 5 �10�5 M SOR solution at PB pH 7.0+50 % methanolshowed the disappearance of the oxidation peak of SOR,due to surface fouling by oxidation products. The forma-tion of a very poorly defined reversible couple was infer-red at potentials lower than the first SOR oxidation peak(Fig. 5a).
This reversible couple was clearly detected by usinga SPE in PB pH 7 and by lowering the methanol ratio to10% in order to enhance the adsorption phenomenon,with Ep = +0.143 V as anodic part and+0.127 V as catho-dic part vs the pseudo silver reference electrode (Fig. 5b).By CV scanning between �0.25 V and 0.5 V, this reversi-ble peak was not observed confirming that it was necessa-
Fig. 2. The Nyquist-diagram for the EIS measurements ob-served at bare GCE and Chitosan/-COOH MWCNT/GCE. Theinset represents Randle�s equivalent circuit.
Fig. 3. DPV in 5� 10�5 M SOR (pH 7.0, 0.1 M PB, 50% metha-nol) as a function of amount of solution (mL) casted onto theGCE. a) 2.5, b) 1.25, c) 5.0, d) 10, e) 15 mL of 1 mg/mL �COOHMWCNT and 0.1 % chitosan suspension.
www.electroanalysis.wiley-vch.de � 2015 Wiley-VCH Verlag GmbH & Co. KGaA, Weinheim Electroanalysis 2015, 27, 1 – 9 &4&
These are not the final page numbers! ��
Full Paper
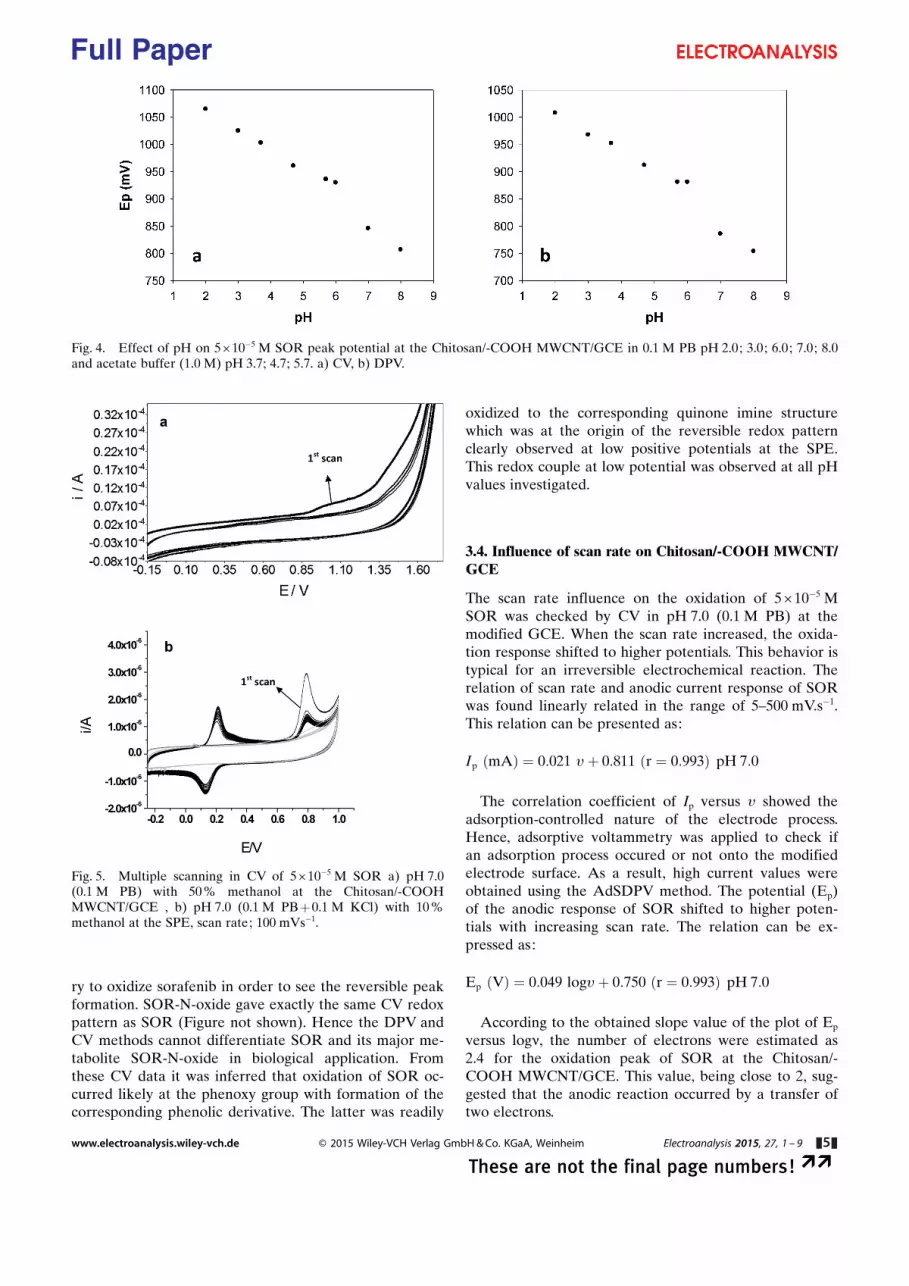
ry to oxidize sorafenib in order to see the reversible peakformation. SOR-N-oxide gave exactly the same CV redoxpattern as SOR (Figure not shown). Hence the DPV andCV methods cannot differentiate SOR and its major me-tabolite SOR-N-oxide in biological application. Fromthese CV data it was inferred that oxidation of SOR oc-curred likely at the phenoxy group with formation of thecorresponding phenolic derivative. The latter was readily
oxidized to the corresponding quinone imine structurewhich was at the origin of the reversible redox patternclearly observed at low positive potentials at the SPE.This redox couple at low potential was observed at all pHvalues investigated.
3.4. Influence of scan rate on Chitosan/-COOH MWCNT/GCE
The scan rate influence on the oxidation of 5 �10�5 MSOR was checked by CV in pH 7.0 (0.1 M PB) at themodified GCE. When the scan rate increased, the oxida-tion response shifted to higher potentials. This behavior istypical for an irreversible electrochemical reaction. Therelation of scan rate and anodic current response of SORwas found linearly related in the range of 5–500 mV.s�1.This relation can be presented as:
Ip ðmAÞ ¼ 0:021 uþ 0:811 ðr ¼ 0:993Þ pH 7:0
The correlation coefficient of Ip versus u showed theadsorption-controlled nature of the electrode process.Hence, adsorptive voltammetry was applied to check ifan adsorption process occured or not onto the modifiedelectrode surface. As a result, high current values wereobtained using the AdSDPV method. The potential (Ep)of the anodic response of SOR shifted to higher poten-tials with increasing scan rate. The relation can be ex-pressed as:
Ep ðVÞ ¼ 0:049 loguþ 0:750 ðr ¼ 0:993Þ pH 7:0
According to the obtained slope value of the plot of Ep
versus logn, the number of electrons were estimated as2.4 for the oxidation peak of SOR at the Chitosan/-COOH MWCNT/GCE. This value, being close to 2, sug-gested that the anodic reaction occurred by a transfer oftwo electrons.
Fig. 4. Effect of pH on 5�10�5 M SOR peak potential at the Chitosan/-COOH MWCNT/GCE in 0.1 M PB pH 2.0; 3.0; 6.0; 7.0; 8.0and acetate buffer (1.0 M) pH 3.7; 4.7; 5.7. a) CV, b) DPV.
Fig. 5. Multiple scanning in CV of 5�10�5 M SOR a) pH 7.0(0.1 M PB) with 50% methanol at the Chitosan/-COOHMWCNT/GCE , b) pH 7.0 (0.1 M PB+0.1 M KCl) with 10 %methanol at the SPE, scan rate; 100 mVs�1.
www.electroanalysis.wiley-vch.de � 2015 Wiley-VCH Verlag GmbH & Co. KGaA, Weinheim Electroanalysis 2015, 27, 1 – 9 &5&
These are not the final page numbers! ��
Full Paper

3.5. Influence of accumulation potential and time
The effect of Eacc and tacc on the oxidation of 5 �10�6 MSOR was studied by AdSDPV using the Chitosan/-COOH MWCNT/GCE in pH 7.0 (0.1 M PB) solution.Between 0 and 700 mV deposition potentials were testedto find best potential value for accumulation of 5 �10�6 MSOR. The highest peak current was obtained at Eacc =400 mV. The effect of tacc on the oxidation of 5 �10�6 MSOR was investigated between 0 and 240 s. The highestresponse was observed at 180 s. After 180 s, the responseof electrode decreased likely due to the blocking of elec-trode surface with adsorbed SOR. Further studies wererealized using the latter obtained Eacc and tacc conditions.The AdSDPV response of SOR was approximately 22times higher at the Chitosan/-COOH MWCNT/GCEcompared to the AdSDPV response under identical ex-perimental conditions at the bare GCE (Fig. 6).
3.6. Assay of SOR in serum samples
The voltammetric reponse for the for determination ofSOR was studied in different pH values and electrolytes.As working medium 0.1 M PB at pH 7.0 (containing 50 %methanol) was finally selected. The variation of anodiccurrent with increasing concentration of SOR was studiedby AdSDPV using the Chitosan/-COOH MWCNT/GCE(Figure 7). The electrode response indicated two linearsegments, the first between 1.0 �10�8–8.0 �10�8 and thesecond between and 1 �10�7–8� 10�7 M.
The linear regression equations were:
First segment Ip mAð Þ ¼ 517C mMð Þ � 0:006 r ¼ 0:994ð Þin 0:1M PB pH7:0ð Þ
Second segment Ip mAð Þ ¼ 227C mMð Þ þ 0:018 r ¼ 0:997ð Þin 0:1M PB pH7:0ð Þ
First segment Ip mAð Þ ¼ 126C mMð Þ � 0:002 r ¼ 0:992ð Þin serum sample
Second segment Ip mAð Þ ¼ 26C mMð Þ þ 0:007 r ¼ 0:997ð Þin serum sample
LOD and LOQ values were calculated using followingequations:
LOD ¼ 3:3 s=m and LOQ ¼ 10 s=m,
In these equations “s” is the standard deviation of re-sponse and “m” the slope of the calibration curve. Thecharacteristics of calibration equation and related valida-tion parameters are summarized in Table 1.
3.7. Within-day, between-day variability and stability
The within-day and between-day results were investigatedusing AdSDPV measurements of 4.0 �10�7 M SOR. Therelative standard deviation (RSD) of within-day measure-ments for 5 successive assays of SOR with the samemodified electrode were 1.25% and 2.55% in buffer andserum sample, respectively. The between-day criteria wasestimated using 3 different electrodes in different days;the RSDs for a 4.0 �10�7 M SOR solution were 2.1 % and2.6 % in buffer and serum sample, respectively. Thesedata indicated good repeatability and reproducibility ofthe modified GCE. Between experiments, the modifiedelectrode was stored at room temperature. The RSDvalue for a 4.0 � 10�7 M SOR concentration was foundequal to 2.2 % for a 10 days use, suggesting a good elec-trode stability. After this period the signal decreased pro-gressively.
Fig. 6. AdSDPV of SOR 5x10�6 M at the GCE and Chitosan/-COOH MWCNT/GCE in 0.1 M PB (pH:7.0) and blank.
Fig. 7. a) AdSDPV at the modified GCE for treated serumsamples in 0.1 M pH 7.0 PB, without SOR (inset) and containingdifferent concentrations of SOR from 1.0� 10�8–8.0� 10�7 M andb) Plot of the peak current as a function of SOR concentration.
www.electroanalysis.wiley-vch.de � 2015 Wiley-VCH Verlag GmbH & Co. KGaA, Weinheim Electroanalysis 2015, 27, 1 – 9 &6&
These are not the final page numbers! ��
Full Paper

3.8. Interference study
The effect of different possible interfering species in thequantification of SOR was studied in the mixed solutionsof these species with 1 �10�6 M SOR under the proposedtechnique. The tolerance limits were calculated as molarratio of SOR/interference. It was found that uric acid andsome ions such as Na+ , K+ , Ca2+, Mg2+, Cl� , SO4
2� hadno effect on SOR response at concentration of about 100fold of SOR. Dopamine interfered in the determinationof SOR for a concentration 100 fold of SOR.
3.9. Determination of SOR in spiked human serumsample
To examine the applicability of the developed techniquein human serum, a calibration equation was obtained inspiked serum sample. The measurements of SOR inserum sample were realized as described in the experi-mental part. The results for the analysis of spiked serumare summarized in Table 2. As seen, the recovery ach-ieved for spiked serum sample was close to 100%.
4. Conclusions
The voltammetric behavior and the determination ofSOR in spiked human serum sample were investigated.The electrooxidation processes for the determination ofSOR on Chitosan/-COOH MWCNT/GCE was found tobe irreversible controlled by the adsorption of SOR ontothe electrode at selected pH values and mediums. TheChitosan/-COOH MWCNT/GCE was successfully ap-plied to the quantification of SOR in spiked serum
sample with recoveries of 98 %. The Chitosan/-COOHMWCNT/GCE allowed high sensitivity to be obtainedwithin a wide linear range with good within-day and be-tween-day repeatability. The method allows rapid meas-urements of sorfaenib in serum samples with minimalsample treatment prior voltammetric analysis. The devel-oped electrode and AdDPSV methodology could behighly valuable in therapeutic drug monitoring.
Acknowledgements
The authors would like to thank Bayer Pharm. Ind. forproviding Sorafenib for developing the proposed methodand gratefully acknowledge the Ankara University Scien-tific Research Project Foundation (Project No: 12L3336002), Turkey. Also we would like to thanks to TUBI-TAK for grant support to Nurgul Karadas-Bakirhan forher scientific stay in the Universit� Libre de Bruxelles.
References
[1] L. Lang, Gastroenterology, 2008, 134, 379–380.[2] K. S. Smalley, M. Xiao, J. Villanueva, T. K. Nguyen, K. T.
Flaherty, R. Letrero, P. Van Belle, D. E. Elder, Y. Wang,K. L. Nathanson, M. Herlyn, Oncogene, 2009, 28, 85–94.
[3] S. M. Wilhelm, L. Adnane, P. Newell, A. Villanueva, J. M.Llovet, M. Lynch, Mol. Cancer Ther. , 2008, 7, 3129 –40.
[4] G. M. Keating, A. Santoro, Drugs, 2009, 69, 223 –40.[5] Y. Zhang, J Mol. Med. Rep. , 2014, 9, 83 –90.[6] B. Blanchet, B. Billemont, J. Cramard, A. S. Benichou, S.
Chhun, L. Harcouet, S. Ropert A. Dauphin, F. Goldwasser,M. Tod, J Pharm. and Biomed. Anal. , 2009, 49, 1109 –1114.
Table 1. Regression data of the calibration curves for quantitative determination of SOR by AdSDPV at the Chitosan/-COOHMWCNT/GCE
Parameters Chitosan/-COOH MWCNT/GCE
AdSDPV
Supporting electrolyte Serum
Linearity range (M) 1� 1�8–8� 10�8 1 � 10�7–1� 10�6 1 � 10�8–8� 10�8 1 � 10�7–8� 10�7
Slope (mA.M�1) 517000 276748 126187 62450Intercept (mA) 0.0062 0.0179 0.0016 0.007Correlation coefficient 0.994 0.997 0.992 0.997Standard error of slope (�103) 34.2 11.6 9.40 2.90Standard error of intercept (� 10�3) 1.68 7.06 0.462 1.43LOD (M) 4.4 � 10�10 9.6 � 10�10
LOQ (M) 1.5 � 10�9 3.2 � 10�9
Measured potential Ep (mV) 770 754 817 817Within-day Ep (RSD %)* 0.5 0.4Between-day Ep (RSD%)* 0.6 0.5Within-day peak current Ip (RSD %)* 1.25 2.55Between-day peak current Ip (RSD%)* 2.1 2.6
* Obtained from five experiments
Table 2. Determination of SOR in spiked serum sample and recovery experiments using the Chitosan/-COOH MWCNT/GCE.
Analyte Matrix Added (mM) Found (mM) Recovery% RSD (%) Bias (%)
SOR Serum 0.400 0.390 97.45 0.03 �0.03
www.electroanalysis.wiley-vch.de � 2015 Wiley-VCH Verlag GmbH & Co. KGaA, Weinheim Electroanalysis 2015, 27, 1 – 9 &7&
These are not the final page numbers! ��
Full Paper

[7] M. Zhao, M. A. Rudek, P. He, F-T. Hafner, M. Radtke, J. J.Wright, B. Douglas Smith, W. A. Messersmith, M. Hidalgo,S. D. Baker, J. Chromatogr. B, 2007, 846, 1–7.
[8] L. Gçtze, A. Hegele, S. K. Metzelder, H. Renz, W. A.Nockher, Clinica Chim. Acta, 2012, 413, 143–149.
[9] L. Jain, E. R. Gardner, J. Venitz, W. Dahut, W. D. Figg, J.Pharm. and Biomed. Anal. , 2008, 46, 362–367.
[10] S. Bouchet, E. Chauzit, D. Ducint, N. Castaing, M. Canal-Raffin, N. Moore, K. Titier, M. Molimard, Clin. Chim. Acta,2011, 412, 1060–1067.
[11] S. A. Ozkan, B. Uslu, H. Y. Aboul-Enein, Crit. Rev. Anal.Chem. , 2003, 33, 155–181.
[12] M. R. Smyth, J. G. Vos, Analytical Voltammetry, vol.XXVIII, Comprehensive Analytical Chemistry, Amsterdam,1992.
[13] N. Karadas, B. Bozal-Palabiyik, B. Uslu, S. A. Ozkan, Sen-sors & Actuators: B. Chemical, 2013, 186, 486 –494.
[14] J. Wang, Electroanalytical Techniques in Clinical Chemistryand Laboratory Medicine VCH, New York, 1988.
[15] J. M. Kauffmann, J. C. Vire, Anal.Chim. Acta, 1993, 273,329–334.
[16] S. A. Ozkan, Electroanalytical Methods in PharmaceuticalAnalysis and Their Vaildation, first ed., HNB Pub., 2011.
[17] M. Zhang, A. Smith, W. Gorski, Anal. Chem. , 2004, 76,5045–5050.
[18] L. Jiang, C. Liu, L. Jiang, Z. Peng, G. Lu, Anal. Sci. , 2004,20, 1055–9.
[19] L. Jiang, R. Wang, X. Li, L. Jiang, G. Lu, Electrochem.Comm. , 2005, 7, 597–601.
[20] X. Yao, G. H. Lu, T. Zhan, Electroanalysis, 2001, 13, 923 –926.
[21] G. H. Lu, X. Yao, X. C. Zhou, Chem. Res. Chin. U. , 2002,18, 316–320.
[22] C. E. Banks, T. J. Davis, G. G. Wildgoose, R. G. Compton,Chem. Commun. , 2005, 7, 829 –841.
[23] C. E. Banks, R. R. Moore, T. J. Davis, R. G. Compton,Chem. Commun. , 2004, 16, 1804 –1805.
[24] N. Karadas, S. A. Ozkan, Talanta, 2014, 119, 248 –254.
Received: June 2, 2015Accepted: July 10, 2015
Published online: && &&, 0000
www.electroanalysis.wiley-vch.de � 2015 Wiley-VCH Verlag GmbH & Co. KGaA, Weinheim Electroanalysis 2015, 27, 1 – 9 &8&
These are not the final page numbers! ��
Full Paper

FULL PAPERS
N. Karadas-Bakirhan, S. Patris,S. A. Ozkan, A. Can,J.-M. Kauffmann*
&& –&&
Determination of the anticancerdrug sorafenib in serum byadsorptive stripping differentialpulse voltammetry using a chitosan/multiwall carbon nanotube modifiedglassy carbon electrode
www.electroanalysis.wiley-vch.de � 2015 Wiley-VCH Verlag GmbH & Co. KGaA, Weinheim Electroanalysis 2015, 27, 1 – 9 &9&
These are not the final page numbers! ��
Full Paper


