
Debug Tool for z/OS
Debug Tool Utilities and Advanced Functions for z/OS
Customization Guide
Version 7.1
SC19-1075-02
���

Debug Tool for z/OS
Debug Tool Utilities and Advanced Functions for z/OS
Customization Guide
Version 7.1
SC19-1075-02
���
Third Edition (December 2006)
This edition applies to Debug Tool for z/OS, Version 7.1 (Program Number 5655-R44) with the PTF for APAR
PK34211 installed, which supports the following compilers:
v AD/Cycle® C/370™ Version 1 Release 2 (Program Number 5688-216)
v C/C++ for MVS/ESA Version 3 (Program Number 5655-121)
v C/C++ feature of OS/390 (Program Number 5647-A01)
v C/C++ feature of z/OS (Program Number 5694-A01)
v OS/VS COBOL, Version 1 Release 2.4 (5740-CB1) - with limitations
v VS COBOL II Version 1 Release 3 and Version 1 Release 4 (Program Numbers 5668-958, 5688-023) - with
limitations
v COBOL/370™ Version 1 Release 1 (Program Number 5688-197
v COBOL for MVS & VM Version 1 Release 2 (Program Number 5688-197)
v COBOL for OS/390 & VM Version 2 (Program Number 5648-A25)
v Enterprise COBOL for z/OS and OS/390 Version 3 (Program Number 5655-G53)
v High Level Assembler for MVS & VM & VSE Version 1 Release 4, Version 1 Release 5 (Program Number
5696-234)
v OS PL/I Version 2 Release 1, Version 2 Release 2, Version 2 Release 3 (Program Numbers 5668-909, 5668-910) -
with limitations
v PL/I for MVS & VM Version 1 Release 1 (Program Number 5688-235)
v VisualAge PL/I for OS/390 Version 2 Release 2 (Program Number 5655-B22)
v Enterprise PL/I for z/OS and OS/390 Version 3.5 or earlier (Program Number 5655-H31)
Parts of this edition apply to Debug Tool Utilities and Advanced Functions for z/OS, Version 7.1 (Program Number
5655-R45).
This edition also applies to all subsequent releases and modifications until otherwise indicated in new editions or
technical newsletters.
You can order publications online at www.ibm.com/shop/publications/order, or order by phone or fax. IBM
Software Manufacturing Solutions takes publication orders between 8:30 a.m. and 7:00 p.m. Eastern Standard Time
(EST). The phone number is (800) 879-2755. The fax number is (800) 445-9269.
You can find out more about Debug Tool by visiting the IBM Web site for Debug Tool at: http://www.ibm.com/software/awdtools/debugtool
© Copyright International Business Machines Corporation 1992, 2006. All rights reserved.
US Government Users Restricted Rights – Use, duplication or disclosure restricted by GSA ADP Schedule Contract
with IBM Corp.
Note!
Before using this information and the product it supports, be sure to read the
general information under “Notices” on page 67.
||
|
Contents
About this document . . . . . . . . . v
Who might use this document . . . . . . . . v
Accessing z/OS licensed documents on the Internet v
Using LookAt to look up message explanations . . vi
How this document is organized . . . . . . . vi
Terms used in this document . . . . . . . . vii
How to send your comments . . . . . . . . ix
Summary of changes . . . . . . . . . xi
Changes introduced with PTF for APAR PK34211 . . xi
Changes introduced with Debug Tool V7.1 . . . . xi
Changes introduced with Debug Tool Utilities and
Advanced Functions V7.1 . . . . . . . . . xiii
Chapter 1. Customization checklist . . . 1
Chapter 2. Customizing Debug Tool . . . 3
Product Registration . . . . . . . . . . . . 3
Installing the Dynamic Debug facility . . . . . . 3
Installing the SVCs without using a system IPL . . 4
Verifying the installation of the SVCs . . . . . 5
Running the installation verification programs . . 5
Using the Authorized Debug facility for protected
programs . . . . . . . . . . . . . . 5
Setting up the APF-authorized system link list data
set (SEQABMOD) . . . . . . . . . . . . . 6
Setting up the link list data set (SEQAMOD) . . . 7
Changing the default and allowable values in
EQACUIDF (optional) . . . . . . . . . . . 7
Specifying global preferences (optional) . . . . . 8
Modifying the name of the default data sets that
store settings, breakpoints, and monitor values
(optional) . . . . . . . . . . . . . . . 9
Setting the SVC screening option . . . . . . . 9
Supplying NAMES commands for the initial load
module (optional) . . . . . . . . . . . . 12
Setting the initial value for SET DEFAULT VIEW . . 13
Modifying Debug Tool behavior when requested
user interface is not available . . . . . . . . 13
Specifying SUBSYS to access source code in a
library system . . . . . . . . . . . . . 14
Chapter 3. Customizing Debug Tool
Utilities functions shipped with Debug
Tool . . . . . . . . . . . . . . . . 15
Choosing a method to start Debug Tool Utilities . . 15
Customizing the data set names in EQASTART . . 17
Adding Debug Tool Utilities to the ISPF menu . . 17
Customizing Debug Tool Setup Utility . . . . . 18
Customizing for the Problem Determination Tools 18
Parameters you can set . . . . . . . . . 18
Customizing for Problem Determination Tools for
multiple systems . . . . . . . . . . . 19
Chapter 4. Customizing Debug Tool
Utilities functions shipped with Debug
Tool Utilities and Advanced Functions . 21
Customizing the Program Preparation Utilities . . 21
Parameters you can set . . . . . . . . . 22
Customizing Preparation Utilities for multiple
systems . . . . . . . . . . . . . . . 24
Customizing Coverage Utility . . . . . . . . 24
Setting up the APF-authorized non-link list data
sets . . . . . . . . . . . . . . . . 24
Installing and enabling the monitor SVCs . . . 25
Customizing the Coverage Utility defaults . . . 26
Configuring for IMS Version 8 or later . . . . . 27
Chapter 5. Enabling debugging in
full-screen mode through a VTAM
terminal . . . . . . . . . . . . . . 29
How Debug Tool uses VTAM in full-screen mode
through a VTAM terminal . . . . . . . . . 29
The steps for enablement . . . . . . . . . . 30
Defining the VTAM EQAMVnnn minor nodes . . 30
Defining terminal LUs used by Debug Tool . . . 32
Configuring the TN3270 Telnet Server to access
the terminal LUs . . . . . . . . . . . 33
Example: Activating full-screen mode through a
VTAM terminal when using TCP/IP TN3270 Telnet
Server . . . . . . . . . . . . . . . . 35
Defining Debug Tool to VTAM . . . . . . . 35
Defining the terminals used by Debug Tool . . . 35
Configuring the TN3270 Telnet Server . . . . 36
Verifying the customization of the facility to debug
full-screen mode through a VTAM terminal . . . 38
Debug Tool Terminal Interface Manager . . . . . 38
Example: a debugging session using the Debug
Tool Terminal Interface Manager . . . . . . 39
The steps for enablement . . . . . . . . . 40
Defining the Terminal Interface Manager VTAM
minor node . . . . . . . . . . . . . 40
Starting the Debug Tool Terminal Interface
Manager . . . . . . . . . . . . . . 41
Configuring the TN3270 Telnet Server to access
the Terminal Interface Manager . . . . . . . 41
Verifying the customization of the Terminal
Interface Manager . . . . . . . . . . . 41
Chapter 6. Enabling the EQAUEDAT
user exit . . . . . . . . . . . . . . 43
Chapter 7. Adding support for
debugging under CICS . . . . . . . . 45
Activating CICS non-Language Environment exits 48
Sharing DTCN repository profile items among CICS
systems . . . . . . . . . . . . . . . . 49
Requiring users to specify resource types . . . . 50
© Copyright IBM Corp. 1992, 2006 iii
||
Overriding the default number of program elements
held in cache . . . . . . . . . . . . . . 50
Enabling communication between Debug Tool and a
remote debugger . . . . . . . . . . . . 50
Enabling the CADP transaction . . . . . . . . 51
Running multiple debuggers in a CICS region . . . 51
Running the installation verification programs . . . 51
Chapter 8. Adding support for
debugging under IMS . . . . . . . . 53
Adding support for non-Language Environment
IMS MPPs . . . . . . . . . . . . . . . 53
Chapter 9. Enabling additional
languages for some Debug Tool
components via EQACUIDF . . . . . . 55
Chapter 10. Enabling support for
display of NLS characters and
modification of COBOL NATIONAL
variables . . . . . . . . . . . . . . 57
Creating a conversion image for Debug Tool . . . 57
Example: JCL for generating conversion images . . 58
Appendix A. Support information . . . 59
Searching knowledge bases . . . . . . . . . 59
Searching the information center . . . . . . 59
Searching the Internet . . . . . . . . . . 59
Obtaining fixes . . . . . . . . . . . . . 59
Receiving weekly support updates . . . . . . 60
Contacting IBM Software Support . . . . . . . 60
Determining the business impact . . . . . . 61
Describing problems and gathering information 62
Submitting problems . . . . . . . . . . 62
Appendix B. Applying maintenance . . 63
Applying Service APAR or PTF . . . . . . . . 63
What you receive . . . . . . . . . . . 63
Checklist for applying an APAR or PTF . . . . 63
Appendix C. Accessibility . . . . . . 65
Using assistive technologies . . . . . . . . . 65
Keyboard navigation of the user interface . . . . 65
Accessibility of this document . . . . . . . . 65
Notices . . . . . . . . . . . . . . 67
Trademarks and service marks . . . . . . . . 67
Glossary . . . . . . . . . . . . . . 69
Bibliography . . . . . . . . . . . . 71
Debug Tool publications . . . . . . . . . . 71
High level language publications . . . . . . . 71
Related publications . . . . . . . . . . . 71
Softcopy publications . . . . . . . . . . . 72
Index . . . . . . . . . . . . . . . 73
iv Debug Tool V7.1 Customization Guide
|||
|||||
About this document
Debug Tool combines the richness of the z/OS® environment with the power of
Language Environment® to provide a debugger for programmers to isolate and fix
their program bugs and test their applications. Debug Tool gives you the capability
of testing programs in batch, using a nonprogrammable terminal in full-screen
mode, or using a workstation interface to remotely debug your programs.
This document describes the tasks you must do to customize Debug Tool and, if
you purchased and installed Debug Tool Utilities and Advanced Functions, the
tasks you must do to customize it.
The Debug Tool Utilities and Advanced Functions Coverage Utility is referred to
throughout this document as the Debug Tool Coverage Utility or Coverage Utility.
Who might use this document
This document is intended for system administrators who need to customize
Debug Tool and (if purchased) Debug Tool Utilities and Advanced Functions after
they have been installed.
The following operating systems and subsystems are supported:
v z/OS
– CICS®
– DB2®
– IMS™
– JES batch
– TSO
– UNIX® System Services in remote debug mode or full-screen mode through a
VTAM terminal only
– WebSphere® in remote debug mode or full-screen mode through a VTAM
terminal only
Accessing z/OS licensed documents on the Internet
z/OS licensed documentation is available on the Internet in PDF format at the
IBM® Resource Link™ Web site at:
http://www.ibm.com/servers/resourcelink
Licensed documents are available only to customers with a z/OS license. Access to
these documents requires an IBM Resource Link user ID and password, and a key
code. With your z/OS order you received a Memo to Licensees, (GI10-0671), that
includes this key code.
To obtain your IBM Resource Link user ID and password, log on to:
http://www.ibm.com/servers/resourcelink
To register for access to the z/OS licensed documents:
1. Sign in to Resource Link using your Resource Link user ID and password.
2. Select User Profiles located on the left-hand navigation bar.
© Copyright IBM Corp. 1992, 2006 v
Note: You cannot access the z/OS licensed documents unless you have registered
for access to them and received an e-mail confirmation informing you that
your request has been processed.
Printed licensed documents are not available from IBM.
You can use the PDF format on either z/OS Licensed Product Library CD-ROM or
IBM Resource Link to print licensed documents.
Using LookAt to look up message explanations
LookAt is an online facility that lets you look up explanations for most of the IBM
messages you encounter, as well as for some system abends and codes. Using
LookAt to find information is faster than a conventional search because in most
cases LookAt goes directly to the message explanation.
You can use LookAt from the following locations to find IBM message
explanations for z/OS elements and features, z/VM®, VSE/ESA™, and Clusters for
AIX® and Linux®:
v The Internet. You can access IBM message explanations directly from the LookAt
Web site at http://www.ibm.com/eserver/zseries/zos/bkserv/lookat/.
v Your z/OS TSO/E host system. You can install code on your z/OS or z/OS.e
systems to access IBM message explanations, using LookAt from a TSO/E
command line (for example, TSO/E prompt, ISPF, or z/OS UNIX System
Services running OMVS).
v Your Microsoft® Windows® workstation. You can install code to access IBM
message explanations on the z/OS Collection (SK3T-4269), using LookAt from a
Microsoft Windows command prompt (also known as the DOS command line).
v Your wireless handheld device. You can use the LookAt Mobile Edition with a
handheld device that has wireless access and an Internet browser (for example,
Internet Explorer for Pocket PCs, Blazer, or Eudora for Palm OS, or Opera for
Linux handheld devices). Link to the LookAt Mobile Edition from the LookAt
Web site.
You can obtain code to install LookAt on your host system or Microsoft Windows
workstation from a disk on your z/OS Collection (SK3T-4269), or from the LookAt
Web site (click Download, and select the platform, release, collection, and location
that suit your needs). More information is available in the LOOKAT.ME files
available during the download process.
How this document is organized
This document is divided into areas of similar information for easy retrieval of
appropriate information. The following list describes how the information is
grouped:
v Chapter 1 gives an overview of all the customization steps. It provides a
checklist of all the steps, which you can print and use as a guide as you
complete the customization.
v Chapter 2 describes customizations you are required to make and how to
modify defaults.
v Chapter 3 describes how to customize the part of Debug Tool Utilities that
comes with Debug Tool.
v Chapter 4 describes how to customize the part of Debug Tool Utilities that
comes with Debug Tool Utilities and Advanced Functions.
vi Debug Tool V7.1 Customization Guide
v Chapter 5 describes how to activate the facility to debug in full-screen mode
through a VTAM terminal. If your users want to debug any of the following
programs by using full-screen mode through a VTAM terminal, you must do the
steps described in this chapter:
– batch programs
– DB2 stored procedures
– IMS programs
– programs running under UNIX System Servicesv Chapter 6 describes how to add the EQAUEDAT user exit.
v Chapter 7 describes how to add support for CICS. If your users must debug
CICS programs, you must do the instructions described in this chapter.
v Chapter 8 describes how to add support for IMS programs. If your users must
debug IMS programs, you must do the instructions described in this chapter.
v Chapter 9 describes how to customize the Debug Tool Utilities Japanese feature.
v Chapter 10 describes how to create Unicode conversion images so that Debug
Tool can do the following tasks:
– Display NLS characters during a remote debug session.
– Use the STORAGE command to update COBOL NATIONAL variables.v Appendix A describes all the resources available to help you find technical
support information.
v Appendix B describes how to apply maintenance provided for Debug Tool.
v Appendix C describes the features and tools available to people with physical
disabilities that help them use Debug Tool and Debug Tool documents.
The last several chapters list notices, bibliography, and glossary of terms.
Terms used in this document
Because of differing terminology among the various programming languages
supported by Debug Tool, as well as differing terminology between platforms, a
group of common terms has been established. The table below lists these terms
and their equivalency in each language.
Debug Tool
term
C and C++
equivalent
COBOL
equivalent
PL/I equivalent assembler
Compile unit C and C++
source file
Program or class v Program
v PL/I source
file for
Enterprise
PL/I
v A package
statement or
the name of
the main
procedure for
Enterprise
PL/I1
CSECT
Block Function or
compound
statement
Program, nested
program, method
or PERFORM
group of
statements
Block CSECT
About this document vii
||
|
|
||
|
||||
|||||||
Debug Tool
term
C and C++
equivalent
COBOL
equivalent
PL/I equivalent assembler
Label Label Paragraph name
or section name
Label Label
Notes:
1. The PL/I program must be compiled with the Enterprise PL/I for z/OS,
Version 3.5, compiler with the PTFs for APARs PK35230 and PK35489 applied
and must be running in Language Environment Version 1.4 through 1.8 with
the PTF for APAR PK33738 applied.
Debug Tool provides facilities that apply only to programs compiled with specific
levels of compilers. Because of this, Debug Tool Customization Guide uses the
following terms:
assembler
Refers to assembler programs with debug information assembled by using
the High Level Assembler (HLASM).
COBOL
Refers to the all COBOL compilers and dialects supported by Debug Tool
except OS/VS COBOL.
disassembly or disassembled
Refers to high-level language programs compiled without debug
information or assembler programs without debug information. The
debugging support Debug Tool provides for these programs is through the
disassembly view.
Enterprise PL/I
Refers to the Enterprise PL/I for z/OS and OS/390® and the VisualAge®
PL/I for OS/390 compilers.
full-screen mode through a VTAM terminal
Refers to the debugging mode that requires a second terminal, a VTAM®
terminal, be started and used to debug an application. After the VTAM
terminal has been started, you can optionally use the Debug Tool Terminal
Interface Manager to identify that terminal to Debug Tool by using a user
ID instead of a LU name.
OS/VS COBOL
Refers to COBOL programs compiled using the IBM OS/VS COBOL
compiler.
As you read through the information in this document, remember that
OS/VS COBOL programs are non-Language Environment programs, even
though you might have used Language Environment libraries to link and
run your program. Please read the information regarding non-Language
Environment programs for instructions on how to start Debug Tool and
debug OS/VS COBOL programs, unless OS/VS COBOL-specific
information is provided.
PL/I Refers to all levels of PL/I compilers. Exceptions will be noted in the text
that describe which specific PL/I compiler is being referenced.
separate debug file
Refers to the Enterprise COBOL for z/OS and OS/390 side file and the
Enterprise PL/I for z/OS Version 3 Release 5 separate debug file.
viii Debug Tool V7.1 Customization Guide
|
||||
How to send your comments
Your feedback is important in helping us to provide accurate, high-quality
information. If you have comments about this document or any other Debug Tool
documentation, contact us in one of these ways:
v Use the Online Readers’ Comment Form at www.ibm.com/software/awdtools/rcf/. Be sure to include the name of the document, the publication number of
the document, the version of Debug Tool, and, if applicable, the specific location
(for example, page number) of the text that you are commenting on.
v Fill out the Readers’ Comment Form at the back of this document, and return it
by mail or give it to an IBM representative. If the form has been removed,
address your comments to:
IBM Corporation
H150/090
555 Bailey Avenue
San Jose, CA 95141-1003
USA
v Fax your comments to this U.S. number: (800)426-7773.
When you send information to IBM, you grant IBM a nonexclusive right to use or
distribute the information in any way it believes appropriate without incurring any
obligation to you.
About this document ix

x Debug Tool V7.1 Customization Guide
Summary of changes
This section lists the key changes made to Debug Tool for z/OS and Debug Tool
Utilities and Advanced Functions for z/OS that affect this document.
Changes introduced with PTF for APAR PK34211
The following changes were introduced with the PTF for APAR PK34211:
v Debug Tool can now debug C and C++ programs compiled with the
FORMAT(DWARF) suboption of the DEBUG compiler option.
v You can now specify a network identifier when you specify the VTAM logical
unit (LU) identifier for a terminal used in full-screen mode through a VTAM
terminal. See the section on the TEST run time option in Debug Tool Reference and
Messages for a description of the new suboption.
v If your PL/I program was compiled with the following compiler and it is
running in the following environment, you can specify the package name or the
name of the main procedure instead of a fully qualified data set name.
– Enterprise PL/I for z/OS, Version 3.5, with the PTFs for APARs PK35230 and
PK35489 applied
– Language Environment Version 1.4 through 1.8 with the PTF for APAR
PK33738 appliedv In order for users to use the STORAGE command to modify the value of a
NATIONAL variable while debugging a COBOL program, you need to create a
conversion image. See Chapter 10, “Enabling support for display of NLS
characters and modification of COBOL NATIONAL variables,” on page 57 for
more information on creating a conversion image.
v If you are experiencing CPU performance problems related to Debug Tool while
users debug CICS applications that do a LINK or XCTL to more than 10
programs, there is a modification you can make that might help improve
performance. See “Overriding the default number of program elements held in
cache” on page 50 for more information.
v Miscellaneous updates.
Changes introduced with Debug Tool V7.1
Minor changes were made to the second edition that support changes introduced
with Debug Tool Version 7.1.
v The following enhancements have been made to the monitoring functions:
– For COBOL programs, Debug Tool does not prefix the program name to the
output, allowing more data to be displayed on the same line.
– You can now display the value of variables, including members of an array or
structure, in a columnar format. Debug Tool provides a new command, SET
MONITOR COLUMN, which you can use to indicate that you want the Monitor
window to display information in columnar format.
– Debug Tool now displays a ruler, which indicates the offset from the start of
the display to current cursor position.
– You can now update large variables directly in the Monitor window.
© Copyright IBM Corp. 1992, 2006 xi
|
|
||
||||
|||
||
||
|||||
|||||
|
– You can now use the HEX prefix command on only one member of an array or
a sublevel of a structure. Previously, you could use the HEX prefix command
only on the entire array or structure.
– You can now update an array or a structure member without making the full
name of the array or structure visible. Previously, you could update an array
or structure member only if the full name of the array or structure was
visible.v You can now access source code (C, C++, Enterprise PL/I if a separate debug
file is not used) stored in library systems that require data sets to be allocated as
a DSORG DA or VSAM data set with the SUBSYS=ssss allocation parameter,
where ssss is a subsystem provided by the library system vendor.
Debug Tool provides a method (by using EQAOPTS) that instructs Debug Tool
to use the SUBSYS=ssss allocation parameter when it allocates the data set.
v You can now indicate that you want COPE facilities to continue operating while
Debug Tool is active. Standardware Corporation’s COPE product is used in an
IMS environment to deliver some additional capabilities for applications and
systems administrators. You use a new option (through EQAOPTS) to enable
this behavior.
v You can now indicate what Debug Tool should do if the terminal using the
full-screen mode through a VTAM terminal facility or the remote debugger is
not available. Use a new option (through EQAOPTS) to select the new behavior.
v Debug Tool has enhanced the LIST, CLEAR, ENABLE, and DISABLE commands to
support suspended breakpoints.
v The LIST STORAGE and STORAGE commands have been enhanced so that you can
provide a starting byte offset. Previously, Debug Tool used the start of the area
of storage allocated to the variable as the starting byte.
v You can now set COBOL level 88 condition variables to TRUE.
v The Debug Tool CICS control utility (DTCN) has been enhanced so that you can
temporarily inactivate a profile, then reactivate it at a later time.
v DTCN has been enhanced so you can select CICS tasks to debug based on the
client IP name or address.
v A new option TASK has been added to the QUIT DEBUG command to help you
terminate debugging sessions that involve pseudo-conversational applications. If
you specify the TASK option, Debug Tool terminates immediately. It does not
wait until the end of the current CICS pseudo-conversational task, which can be
indicated by, for example, an EXEC CICS RETURN TRANSID. When a new task
is started in the pseudo-conversation, Debug Tool resumes debugging.
v An option is added to the Debug Tool Utilities primary panel to invoke IBM File
Manager (FM) for z/OS functions — FM base, FM/DB2, and FM/IMS. (Note
that File Manager is a separately installed product.)
v When you specify a preference or command file in the TEST run time option, you
can specify whether Debug Tool interprets the data set name as fully or partially
qualified.
v Debug Tool now supports the DEBUG compile option with FORMAT(ISD), which is
available with the z/OS C/C++ Version 1.6 (and later) compiler. This option
helps you specify the granularity of the compiled-in hooks that the compiler
inserts and the amount of debug data to save.
v You can now view the Debug Tool Setup Utility’s File Allocation Panel as a full
screen panel by using the ShowDD command.
v Support for Korean
xii Debug Tool V7.1 Customization Guide
You can now specify Korean as your national language. See “Changing the
default and allowable values in EQACUIDF (optional)” on page 7 for more
information on how to specify Korean as your national language.
v Miscellaneous updates.
Changes introduced with Debug Tool Utilities and Advanced Functions
V7.1
v The following enhancements have been made to the monitoring functions:
– You can use a new command, SET MONITOR WRAP, to indicate how you want to
display the value of a variable, which is being monitored or automonitored,
in the Monitor window. Debug Tool can display the value of a variable in
either a wrapped format or on a scrollable line. In a wrapped format, if the
value exceeds the width of the display, Debug Tool continues the value on the
next line. On a scrollable line, if the value exceeds the width of the display,
you can scroll left or right to see the rest of the value.
– You can use a new command, SET MONITOR DATATYPE, to indicate whether you
want to display the data type of a variable that is being monitored or
automonitored.v You can display the source for a compile unit or CSECT (CU) before the load
module containing the CU has been loaded or run. You can work with
breakpoints (for example, examine existing breakpoints or set new breakpoints)
as you would for a CU that has been loaded or run. Debug Tool applies these
breakpoints when the CU becomes active. This feature is also available on
WebSphere Developer for zSeries® and WebSphere Developer Debugger for
zSeries.
v In Debug Tool Utilities, the layout of the panels and arrangement of parameters
in the Create Private Message Regions function of the Manage IMS Programs
section has been improved.
v You can specify which interface (Main Frame Interface (MFI), WebSphere
Developer for zSeries, or WebSphere Developer Debugger for zSeries) to start
when you want to debug a DB2 Stored Procedure, IMS Transaction Manager
(TM), or batch program. Through an user exit, you can specify a TEST run-time
option string that indicates which interface you want to start.
v You can use a utility, EQALANGP, to create a readable listing from a Fault
Analyzer side file (IDILANGX or EQALANGX) or a SYSDEBUG file, which is
generated by using the COBOL TEST(,,SEPARATE) compiler option. If you do not
keep compiler listings in order to conserve DASD space, EQALANGP can help
you create a compiler listing that resembles the original compiler listing.
Note: EQALANGP, which is shipped as a component of Debug Tool Utilities
and Advanced Functions, is functionally equivalent to the IDILANGP
program shipped as a component of Fault Analyzer for z/OS.
v The Debug Tool Coverage Utility (DTCU) SVC installer has been updated to
help you ensure that the SVC numbers that you choose to use for the DTCU
breakpoint SVCs do not conflict with the SVC numbers chosen for another
program.
v The Coverage Utility Annotated Listing report is updated for COBOL programs
so that you can add an HTML version of the report. The HTML version contains
colored lines that indicate statements that were not executed and recomputed
statistics based on the annotations in the listing instead of the raw coverage
Summary of changes xiii
||
data. In addition, a new HTML Targeted Coverage Report, which contains an
Annotated Listing with lines that were changed between two versions of source
files, is available for COBOL programs
v You can use a new command, SET LIST TABULAR, to indicate how you want the
output of the LIST command displayed. This helps you format the display so it
matches the display of the MONITOR LIST command.
v You can use a new command, DESCRIBE LOADMODS, to indicate that you want to
display information about all load modules or a specific load module, which are
known to Debug Tool. Debug Tool displays information about where the load
module or load modules are loaded from, and the size, the name, and the
programs and CSECTs that are contained in a load module if information on a
specific load module is requested.
v Enhancements have been added to better integrate Debug Tool Utilities and
Advanced Functions with WebSphere Developer for zSeries and WebSphere
Developer Debugger for zSeries.
xiv Debug Tool V7.1 Customization Guide
|||
Chapter 1. Customization checklist
Use the following checklist to customize Debug Tool.
After installing Debug Tool for z/OS, do the following steps:
__ 1. “Product Registration” on page 3
__ 2. “Installing the Dynamic Debug facility” on page 3.
__ 3. “Setting up the APF-authorized system link list data set (SEQABMOD)” on
page 6
__ 4. “Setting up the link list data set (SEQAMOD)” on page 7
__ 5. “Changing the default and allowable values in EQACUIDF (optional)” on
page 7
__ 6. “Specifying global preferences (optional)” on page 8. If your site does not
need to specify global preferences for Debug Tool, you can skip this step.
__ 7. “Modifying the name of the default data sets that store settings,
breakpoints, and monitor values (optional)” on page 9.
__ 8. “Setting the SVC screening option” on page 9. If you do not need to debug
non-Language Environment programs that start under Language
Environment and your site does not have any host products that might use
SVC screening when Debug Tool is started, you can skip this step.
__ 9. “Supplying NAMES commands for the initial load module (optional)” on
page 12.
__ 10. “Setting the initial value for SET DEFAULT VIEW” on page 13.
__ 11. “Modifying Debug Tool behavior when requested user interface is not
available” on page 13
__ 12. “Specifying SUBSYS to access source code in a library system” on page 14
__ 13. “Customizing the data set names in EQASTART” on page 17. If your site
does not use Debug Tool Utilities, you can skip this step.
__ 14. “Choosing a method to start Debug Tool Utilities” on page 15. If your site
does not use Debug Tool Utilities, you can skip this step.
__ 15. “Adding Debug Tool Utilities to the ISPF menu” on page 17. If your site
does not use Debug Tool Utilities or you do not want to add Debug Tool
Utilities to your ISPF panel, you can skip this step.
__ 16. “Customizing Debug Tool Setup Utility” on page 18. If your site does not
use Debug Tool Utilities, you can skip this step.
__ 17. Chapter 5, “Enabling debugging in full-screen mode through a VTAM
terminal,” on page 29. If your site does not need to debug programs in
full-screen mode through a VTAM terminal, you can skip this step.
__ 18. Chapter 6, “Enabling the EQAUEDAT user exit,” on page 43. If your site
does not need to use the EQAUEDAT user exit, you can skip this step.
__ 19. Chapter 7, “Adding support for debugging under CICS,” on page 45. If
your site does not need to debug CICS programs, you can skip this step.
__ 20. Chapter 8, “Adding support for debugging under IMS,” on page 53. If your
site does not need to debug IMS programs, you can skip this step.
__ 21. Chapter 9, “Enabling additional languages for some Debug Tool
components via EQACUIDF,” on page 55. Skip this step if your site does
not use any of the following functions in a Japanese or Korean
environment:
© Copyright IBM Corp. 1992, 2006 1
v Debug Tool Utilities ISPF panels
v EQANMDBG (non-CICS non-LE)
v Debug Tool Coverage Utility__ 22. Chapter 10, “Enabling support for display of NLS characters and
modification of COBOL NATIONAL variables,” on page 57. If your site
does not do one of the following, you can skip this step:
v Use a remote debugger to display NLS characters.
v Use the STORAGE command to update COBOL NATIONAL variables.
If you are installing Debug Tool for z/OS and Debug Tool Utilities and Advanced
Functions for z/OS, do all of the previous steps, then the following task:
__ 1. Chapter 4, “Customizing Debug Tool Utilities functions shipped with Debug
Tool Utilities and Advanced Functions,” on page 21. If your site does not
use Debug Tool Utilities, you can skip this step.
2 Debug Tool V7.1 Customization Guide
|||
|
|
Chapter 2. Customizing Debug Tool
You are required to make some of the customizations described in this chapter to
install Debug Tool. Other customizations are optional.
Use the instructions in this section to complete the following customization tasks:
v Product Registration
v Install the Dynamic Debug facility
v Set up an APF-authorized link list data set
v Set up a link list data set
v Change the default and allowable values in EQACUIDF
v Change the EQAOPTS customization module
Product Registration
You can purchase this set of tools in one of three ways. You must ensure that a
Product Registration has been done that is appropriate for the way in which you
purchased the tools. The following list describes where you will find the
information for doing this Product Registration. Select only one method for
registration. This registration must be done before you can run any component of
the tools.
Debug Tool Utilities and Advanced Functions
See the “Enable/Register Debug Tool” section of the Program Directory for
IBM Debug Tool Utilities and Advanced Functions for z/OS.
Debug Tool (stand alone)
See the “Enable/Register Debug Tool section” of the Program Directory for
IBM Debug Tool for z/OS.
Debug Tool as a feature of a full-function compiler
See the Program Directory for the appropriate compiler.
Installing the Dynamic Debug facility
The Dynamic Debug facility enables the user to debug the following types of
programs and code:
v Programs compiled with the TEST(NOHOOK,SYM) compiler option and the
Enterprise PL/I for z/OS Version 3 Release 4 compiler.
v Programs compiled with the TEST(NONE) compiler option and one of the
following compilers:
– Enterprise COBOL for z/OS and OS/390, Version 3
– COBOL for OS/390 & VM, Version 2 Release 2
– COBOL for OS/390 & VM, Version 2 Release 1 with APAR PQ40298 installedv Programs for which no debug data is available by using the disassembly view.
v Assembler code that complies with the requirements described in Debug Tool
User’s Guide. You must also install Debug Tool Utilities and Advanced Functions,
Version 7 Release 1.
v Load modules loaded by using the MVS™ LOAD and LINK macros.
© Copyright IBM Corp. 1992, 2006 3
v Programs that do not run under the Language Environment, including OS/VS
COBOL programs. You must also install Debug Tool Utilities and Advanced
Functions, Version 7 Release 1.
v Programs compiled with the suboption of the TEST compiler option that adds
compiled in hooks and with one of the following compilers:
– Any COBOL compiler supported by Debug Tool
– Any PL/I compiler supported by Debug Tool
– Any C/C++ compiler supported by Debug Tool
The Dynamic Debug facility provides performance enhancements for these
programs.
The Dynamic Debug facility requires the installation of the Dynamic Debug facility
SVC programs EQA00SVC(IGC0014E) and EQA01SVC(IGX00051):
v EQA00SVC is a type 3 SVC with a reserved number of 145 (x’91’).
v EQA01SVC is a type 3 using SVC number 109 (X’6D’) with function code 51.
The Dynamic Debug facility SVCs from this version of Debug Tool are backwards
compatible to Debug Tool for z/OS and OS/390, Version 3 Release 1 (Program
Number 5655-H32).
To install the SVCs, you can select one or both of the following alternatives:
v Install the SVCs through a system IPL. The SMP/E APPLY operation, which you
run when you install Debug Tool or apply a PTF, updates the library
hlq.SEQALPA with the SVCs. To place hlq.SEQALPA in the LPA list, add it to an
LPALSTxx member of parmlib that is used for IPL. If you have earlier releases of
Debug Tool installed at your site, remove any other SEQALPA data sets. The
next time you IPL your system, the SVCs are automatically installed.
Check SYS1.LPALIB for the following members and, if you find them, remove
them:
– EQA00SVC
– EQA01SVC
– IGC0014E (ALIAS of EQA00SVC)
– IGX00051 (ALIAS of EQA01SVC)
These members might have been placed there by previous installations of Debug
Tool. Because SYS1.LPALIB is always searched before the data sets in LPALSTxx,
these older members would be found before the newer members in LPALSTxx.
v Install the SVCs without a system IPL. The SMP/E APPLY operation, which you
run when you install Debug Tool or apply a PTF, updates the library
hlq.SEQAAUTH with the SVCs and the dynamic SVC installer. See “Installing the
SVCs without using a system IPL” for information on how to immediately
install or update the SVCs.
Installing the SVCs without using a system IPL
To install the Dynamic Debug facility SVCs without using a system IPL (referred to
as a dynamic installation), perform the following steps:
1. Mark the hlq.SEQAAUTH data set as APF-authorized2. This data set contains SVC
installation programs; therefore, access to it must be limited to system
programmers.
2. Update both places in the SVC dynamic install job EQAWISVC (shipped as a
member of the data set hlq.SEQASAMP) with the fully qualified name for the
4 Debug Tool V7.1 Customization Guide
Debug Tool hlq.SEQAAUTH data set. Eye-catchers (<<<<<) in the job highlight
the statements that require changing. You might also need to update the job
card.
3. Submit the job. The job installs both SVCs. After the job is completed, verify
that the return code is 00 (RC=00).
Verifying the installation of the SVCs
To verify the installation of the SVCs, you need to check the level of the Dynamic
Debug facility SVCs, then run the installation verification programs.
Checking the level of the Dynamic Debug facility SVCs
Display the level of the Dynamic Debug facility SVCs installed by entering the
following command:
EXEC ’hlq.SEQAEXEC(EQADTSVC)’
Information about EQA00SVC that is similar to the following is displayed. Verify that
the version and compile date that are displayed are the same or higher than what
is shown here.
x4.h.EQA00SVC2006.2325655-R44 Debug Tool Version 04 EQA00SVC-F5592a (C) Copyright .
All Rights Reserved. US Government Users Restricted Rights - Use, dupl
***> EQA00SVC is Version 04 with compile date 20 Aug 2006
Information about EQA01SVC that is similar to the following is displayed. Verify that
the version and compile date that are displayed are the same or higher than what
is shown here.
x4.g.EQA01SVC2006.2325655-R44 Debug Tool Version 06 EQA01SVC-F5398 (C) Copyright .
All Rights Reserved. US Government Users Restricted Rights - Use, dupl
***> EQA01SVC is Version 06 with compile date 20 Aug 2006
x4.h.EQA01SV22006.2325655-R44 Debug Tool Version 01 EQA01SV2-f5592a (C) Copyright .
All Rights Reserved. US Government Users Restricted Rights - Use, dup
***> EQA01SV2 is Version 01 with compile date 20 Aug 2006
Running the installation verification programs
To help you verify the installation of the Dynamic Debug facility (that the SVCs
are installed and working correctly), the hlq.SEQASAMP data set contains installation
verification programs (IVPs) in the following members. Run the IVPs that are
appropriate for the tasks that your users will be performing. Before you run any
IVP, customize it for your installation as described in the member.
IVP Task
EQAWIVP4 COBOL TEST(NONE,SYM)
EQAWIVPF PL/I TEST(ALL,SYM,NOHOOK)
EQAWIVPI Enterprise PL/I TEST(ALL,SYM,NOHOOK,SEPARATE)
EQAWIVPP COBOL TEST(NONE,SYM,SEPARATE)
EQAWIVPS disassembly
EQAZIVPA1 Language Environment assembler
EQAZIVPC1 Non-Language Environment assembler
EQAZIVPV1 OS/VS COBOL
Using the Authorized Debug facility for protected programs
If your users need to use the Dynamic Debug facility to debug programs that are
loaded into protected storage (located in subpool 251 or 252), your security
1. This IVP is available only if you installed Debug Tool Utilities and Advanced Functions.
Chapter 2. Customizing Debug Tool 5
administrator must authorize those users to use the Authorized Debug facility.
Examples of reentrant programs that are loaded into protected storage are:
v Programs loaded from an APF authorized library by MVS
v Programs loaded by CICS into RDSA or ERDSA because RENTPGM=PROTECT
Important: Before you do this task, you must have installed and verified the SVCs.
To authorize users to use the Authorized Debug facility:
1. Establish a profile for the Authorized Debug Facility in the FACILITY class by
entering the RDEFINE command:
RDEFINE FACILITY EQADTOOL.AUTHDEBUG UACC(NONE)
2. Verify that generic profile checking is in effect for the class FACILITY by
entering the following command:
SETROPTS GENERIC(FACILITY)
3. Give a user permission to use the Authorized Debug Facility by entering the
following command, where DUSER1 is the name of a RACF-defined user or
group profile:
PERMIT EQADTOOL.AUTHDEBUG CLASS(FACILITY) ID(DUSER1) ACCESS(READ)
Instead of connecting individual users, the security administrator can specify
DUSER1 to be a RACF® group profile and then connect authorized users to the
group.
4. If the FACILITY class is not active, activate the class by entering the SETROPTS
command:
SETROPTS CLASSACT(FACILITY)
Issue the SETROPTS LIST command to verify that FACILITY class is active.
5. Refresh the FACILITY class by issuing the SETROPTS RACLIST command:
SETROPTS RACLIST(FACILITY) REFRESH
Setting up the APF-authorized system link list data set (SEQABMOD)
You must make certain Debug Tool load modules available in an APF-authorized
data set that is in the system link list concatenation. You can do this in one of the
following ways, depending on your site policy:
v Mark and add the load modules by doing the following steps:
1. Mark the hlq.SEQABMOD data set as APF-authorized.2
2. Add the data set to the system link list concatenation.3
3. If you have earlier releases of Debug Tool installed, remove any other
SEQABMOD data sets.v Copy the load modules and refresh the members by doing the following steps:
1. Copy4 all the members of the hlq.SEQABMOD data set into an existing
APF-authorized system link list data set.
2. Do an LLA refresh to make these members available to Debug Tool.
6 Debug Tool V7.1 Customization Guide
Setting up the link list data set (SEQAMOD)
The hlq.SEQAMOD data set must be in the load module search path whenever you
debug a program with Debug Tool. Except for two cases, it will be convenient for
your users if you put hlq.SEQAMOD in the system link list concatenation. The
exceptions are:
v CICS, where hlq.SEQAMOD must be placed in the DFHRPL concatenation. See
Chapter 7, “Adding support for debugging under CICS,” on page 45.
v When the Debug Tool Setup Utility component of the Debug Tool Utilities ISPF
function is used to start the debugging session (where DTSU accesses
hlq.SEQAMOD for you).
In all other cases, unless you put hlq.SEQAMOD in the system link list
concatenation, the user will have to alter the execution environment of any
program being debugged so that hlq.SEQAMOD is in the load module search path
(such as placing it in JOBLIB, STEPLIB, ISPLLIB or via use of TSOLIB). Therefore,
it is recommended that you add the hlq.SEQAMOD data set to the system link list
concatenation3.
Changing the default and allowable values in EQACUIDF (optional)
The EQACUIDF member of hlq.SEQABMOD contains the default and allowable
values for the parameters NATLANG, LOCALE, and LINECOUNT. These values are used
by the following Debug Tool and the Debug Tool Utilities and Advanced Functions
components:
v Debug Tool Utilities ISPF dialogs: NATLANG
v EQANMDBG (non-CICS non-LE support): NATLANG
v Debug Tool Coverage Utility: NATLANG, LOCALE, and LINECOUNT
The default and allowable values for NATLANG, LOCALE, and LINECOUNT are as
follows:
v NATLANG. The national language, which can be one of the following:
– Mixed-case English (ENU)
– Uppercase English (UEN)
– Japanese (JPN)
– Korean (KOR)
See Chapter 9, “Enabling additional languages for some Debug Tool components
via EQACUIDF,” on page 55 for more information on changing the language for
these Debug Tool components.
v LOCALE. The format of date, time, and numeric values. You can also create date,
time, and numeric formats. The default values are as follows:
– Date format: MM/DD/YYYY
– Time format: HH:MM:SS
– Numeric format: 1,234,567.89
2. To APF-authorize a data set, add an APF ADD statement for the data set to a PROGxx member of parmlib that is used for IPL. To
immediately APF-authorize the data set, use the SETPROG APF MVS command.
3. To add a data set to the link list, add a LNKLST ADD statement for the data set to a PROGxx member of parmlib that is used for
IPL. To immediately add a data set to the link list, use the SETPROG LNKLST MVS command. Then, if the link list data set is
managed by LLA, enter a F,LLA REFRESH MVS command to refresh the Library Lookaside Directories.
4. If you do this copy, you must repeat this copy after you apply any service to Debug Tool. SMP/E does not do this copy for you.
Chapter 2. Customizing Debug Tool 7
v LINECOUNT. The number of lines (including headings) that print on a page. The
default is 66 lines.
If the default values for these parameters are the values that you want to use, you
can skip this section.
To change the default values:
1. Copy the EQACUIDF member in the hlq.SEQASAMP data set into another data
set.
2. Follow the instructions that are in the comment sections of the code to modify
the copy that you made.
3. Assemble the modified copy by using the IBM High Level Assembler and
specifying hlq.SEQASAMP as a SYSLIB.
4. Link edit the resulting object into the private.SEQABMOD data set.
5. Copy the output load module to hlq.SEQABMOD.
Sample JCL is provided in the EQACUIID member of the hlq.SEQASAMP data set to
perform steps 3 and 4.
The SEQABMOD from this version of Debug Tool is backwards compatible with
earlier versions of Debug Tool. If you have multiple versions of Debug Tool
installed on your system, you need only the SEQABMOD from this version
installed in your system link list concatenation.
Specifying global preferences (optional)
You can define settings or preferences for Debug Tool that apply to all Debug Tool
sessions in a global preferences file. For example, if your site uses the PF6 key as
the program exit key, you can assign the Debug Tool exit key to be the PF6 key. To
create a global preferences file, do the following steps:
1. Create a preferences file that is stored as a sequential file or a PDS member.
Refer to Debug Tool User’s Guide for a description of preferences files.
The rules for the preferences file are dependant on the language of the first
program Debug Tool encounters. Because you might not know what language
Debug Tool will encounter first, we recommend you use the following rules
when you create the preferences file:
v Put the commands in columns 8 - 72.
v Do not put line numbers in the file.
v Use COMMENT or /* */ to delimit comments.2. Copy the EQAOPTS member from the hlq.SEQASAMP library to a private library.
3. Edit this copy of EQAOPTS and code an EQAXOPT macro invocation to
indicate the name of the global preferences file. In the following example, the
fully qualified data set name of the global preferences file is
DEVELP.TEST.GLBLPREF:
EQAXOPT GPFDSN,’DEVELP.TEST.GLBLPREF’
See the EQAXOPT member of the hlq.SEQASAMP data set for the complete
syntax of the macro invocation.
4. Follow the directions in EQAOPTS to generate a new EQAOPTS load module.
5. Place the EQAOPTS load module in a private data set that is in the load
module search path and appears before hlq.SEQAMOD.
8 Debug Tool V7.1 Customization Guide
Whenever a user starts Debug Tool, the commands in the global preferences file
are run first. The user can also create his or her own preferences file and a
commands file. In this situation, Debug Tool processes the files in the following
order:
1. Global preferences file
2. User preferences file
3. Commands file
Modifying the name of the default data sets that store settings,
breakpoints, and monitor values (optional)
You can modify the default names of the data sets used to save and restore the
following information:
v settings (default name: userid.DBGTOOL.SAVESETS)
v breakpoints, monitor values, and LOADDEBUGDATA (LDD) specifications
(default name: userid.DBGTOOL.SAVEBPS)
In most environments, you can modify the name so that it complies with any of
the following naming conventions:
v Any other data set name that includes userid
v A DD name (Reminder: DD names are not supported under CICS)
v The string NULLFILE to indicate that saving and restoring this information is
not supported
To change the default name for either or both of these data sets, do the following
steps:
1. Copy the EQAOPTS member from the hlq.SEQASAMP library to a private library.
2. Edit this copy of EQAOPTS and code EQAXOPT macro invocations to indicate
the names of the default data sets that store settings, breakpoints, and monitor
values. For example:
EQAXOPT SAVESETDSN,’&&USERID.DBGTOOL.SETSAVE’
EQAXOPT SAVEBPDSN,’&&USERID.DBGTOOL.BPSAVE’
See the EQAXOPT member of the hlq.SEQASAMP data set for the complete
syntax of the macro invocation.
3. Follow the directions in EQAOPTS to generate a new EQAOPTS load module.
4. Place the EQAOPTS load module in a private data set that is in the load
module search path and appears before hlq.SEQAMOD.
Setting the SVC screening option
In a non-CICS environment, Debug Tool requires SVC screening for the following
situations:
v Invoking Debug Tool by using EQANMDBG to debug programs that start
outside Language Environment including OS/VS COBOL programs.
v Debugging programs that do not run in Language Environment and are started
by programs that begin in Language Environment.
v Detecting services such as MVS LINK, LOAD and DELETE.
If you need to run Debug Tool in any of the following situations, you must specify
the actions that Debug Tool must take regarding SVC screening:
Chapter 2. Customizing Debug Tool 9
v Start Debug Tool by using EQANMDBG in an environment that already uses
SVC screening.
v Run Debug Tool when debugging programs that do not run in Language
Environment and are started by programs that begin in Language Environment.
v Run Debug Tool when you need to detect services such as MVS LINK, LOAD
and DELETE.
v Run Debug Tool in a situation that requires SVC screening and SVC screening is
already in use by a program with which Debug Tool supports MERGE SVC
screening as described by the MERGE operand that follows.
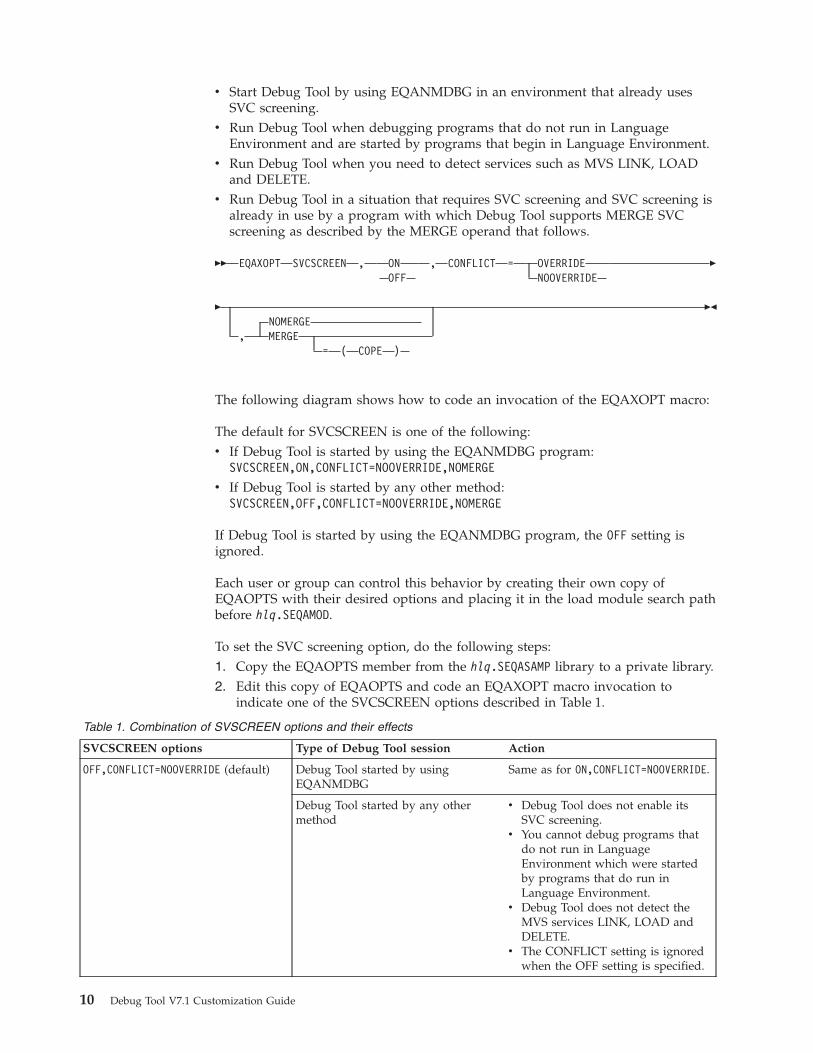
�� EQAXOPT SVCSCREEN , ON
OFF , CONFLICT = OVERRIDE
NOOVERRIDE �
� NOMERGE
,
MERGE
=
(
COPE
)
��
The following diagram shows how to code an invocation of the EQAXOPT macro:
The default for SVCSCREEN is one of the following:
v If Debug Tool is started by using the EQANMDBG program:
SVCSCREEN,ON,CONFLICT=NOOVERRIDE,NOMERGE
v If Debug Tool is started by any other method:
SVCSCREEN,OFF,CONFLICT=NOOVERRIDE,NOMERGE
If Debug Tool is started by using the EQANMDBG program, the OFF setting is
ignored.
Each user or group can control this behavior by creating their own copy of
EQAOPTS with their desired options and placing it in the load module search path
before hlq.SEQAMOD.
To set the SVC screening option, do the following steps:
1. Copy the EQAOPTS member from the hlq.SEQASAMP library to a private library.
2. Edit this copy of EQAOPTS and code an EQAXOPT macro invocation to
indicate one of the SVCSCREEN options described in Table 1.
Table 1. Combination of SVSCREEN options and their effects
SVCSCREEN options Type of Debug Tool session Action
OFF,CONFLICT=NOOVERRIDE (default) Debug Tool started by using
EQANMDBG
Same as for ON,CONFLICT=NOOVERRIDE.
Debug Tool started by any other
method
v Debug Tool does not enable its
SVC screening.
v You cannot debug programs that
do not run in Language
Environment which were started
by programs that do run in
Language Environment.
v Debug Tool does not detect the
MVS services LINK, LOAD and
DELETE.
v The CONFLICT setting is ignored
when the OFF setting is specified.
10 Debug Tool V7.1 Customization Guide
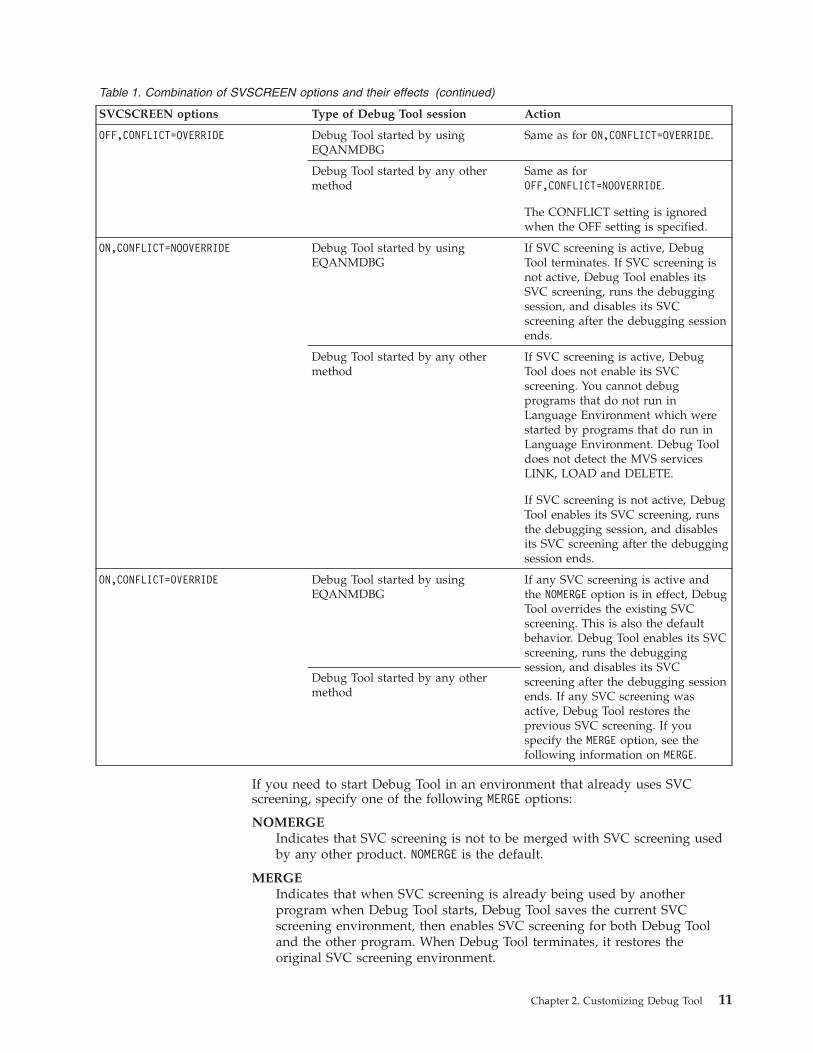
Table 1. Combination of SVSCREEN options and their effects (continued)
SVCSCREEN options Type of Debug Tool session Action
OFF,CONFLICT=OVERRIDE Debug Tool started by using
EQANMDBG
Same as for ON,CONFLICT=OVERRIDE.
Debug Tool started by any other
method
Same as for
OFF,CONFLICT=NOOVERRIDE.
The CONFLICT setting is ignored
when the OFF setting is specified.
ON,CONFLICT=NOOVERRIDE Debug Tool started by using
EQANMDBG
If SVC screening is active, Debug
Tool terminates. If SVC screening is
not active, Debug Tool enables its
SVC screening, runs the debugging
session, and disables its SVC
screening after the debugging session
ends.
Debug Tool started by any other
method
If SVC screening is active, Debug
Tool does not enable its SVC
screening. You cannot debug
programs that do not run in
Language Environment which were
started by programs that do run in
Language Environment. Debug Tool
does not detect the MVS services
LINK, LOAD and DELETE.
If SVC screening is not active, Debug
Tool enables its SVC screening, runs
the debugging session, and disables
its SVC screening after the debugging
session ends.
ON,CONFLICT=OVERRIDE Debug Tool started by using
EQANMDBG
If any SVC screening is active and
the NOMERGE option is in effect, Debug
Tool overrides the existing SVC
screening. This is also the default
behavior. Debug Tool enables its SVC
screening, runs the debugging
session, and disables its SVC
screening after the debugging session
ends. If any SVC screening was
active, Debug Tool restores the
previous SVC screening. If you
specify the MERGE option, see the
following information on MERGE.
Debug Tool started by any other
method
If you need to start Debug Tool in an environment that already uses SVC
screening, specify one of the following MERGE options:
NOMERGE
Indicates that SVC screening is not to be merged with SVC screening used
by any other product. NOMERGE is the default.
MERGE
Indicates that when SVC screening is already being used by another
program when Debug Tool starts, Debug Tool saves the current SVC
screening environment, then enables SVC screening for both Debug Tool
and the other program. When Debug Tool terminates, it restores the
original SVC screening environment.
Chapter 2. Customizing Debug Tool 11
Currently, Debug Tool supports the MERGE option with only one other
program: COPE.
If you specify the MERGE option and Debug Tool does not recognize the
program that is using the SVC screening, the MERGE option is ignored and
Debug Tool starts based on the value of the CONFLICT option.
MERGE=(COPE)
If COPE is active, Debug Tool saves the current SVC screening
environment, then enables SVC screening for both Debug Tool and COPE.
When Debug Tool terminates, it restores COPE’s SVC screening
environment.
If COPE is not active, Debug Tool starts based on the value of the CONFLICT
option.3. Follow the directions in EQAOPTS to generate a new EQAOPTS load module.
4. Place the EQAOPTS load module in a private data set that is in the load
module search path and appears before hlq.SEQAMOD.
Supplying NAMES commands for the initial load module (optional)
The Debug Tool User’s Guide describes how the NAMES command can be used to
perform several specific functions dealing with load module and compile unit
names recognized by Debug Tool. However, the NAMES command cannot be used
to alter the behavior of load module or compile unit names that have already been
seen by Debug Tool at the time the NAMES command is processed.
If it becomes necessary to perform these functions on the initial load module
processed by Debug Tool or on any of the compile unit’s contained in that load
module, you must provide the information (that would otherwise have been
specified using the NAMES command) in the EQAOPTS Debug Tool customization
module.
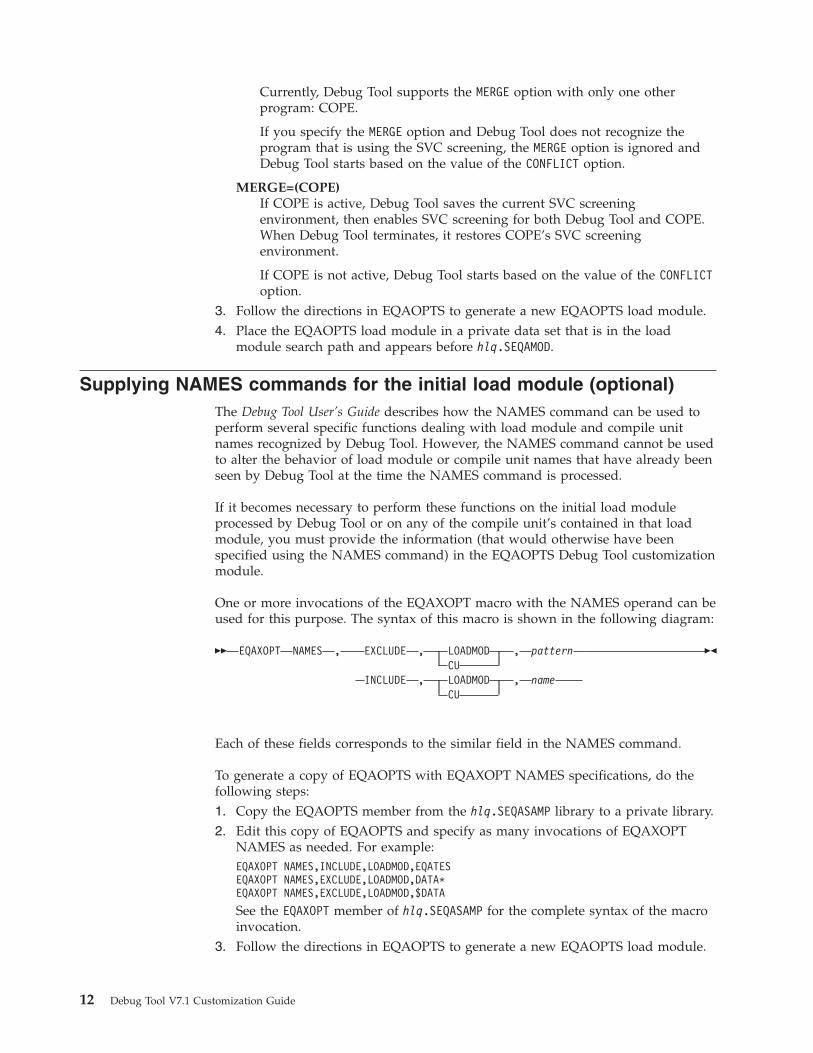
One or more invocations of the EQAXOPT macro with the NAMES operand can be
used for this purpose. The syntax of this macro is shown in the following diagram:
�� EQAXOPT NAMES , EXCLUDE , LOADMOD , pattern
CU
INCLUDE
,
LOADMOD
,
name
CU
��
Each of these fields corresponds to the similar field in the NAMES command.
To generate a copy of EQAOPTS with EQAXOPT NAMES specifications, do the
following steps:
1. Copy the EQAOPTS member from the hlq.SEQASAMP library to a private library.
2. Edit this copy of EQAOPTS and specify as many invocations of EQAXOPT
NAMES as needed. For example:
EQAXOPT NAMES,INCLUDE,LOADMOD,EQATES
EQAXOPT NAMES,EXCLUDE,LOADMOD,DATA*
EQAXOPT NAMES,EXCLUDE,LOADMOD,$DATA
See the EQAXOPT member of hlq.SEQASAMP for the complete syntax of the macro
invocation.
3. Follow the directions in EQAOPTS to generate a new EQAOPTS load module.
12 Debug Tool V7.1 Customization Guide
4. Place the EQAOPTS load module in a private data set that is in the load
module search path and appears before hlq.SEQAMOD.
Setting the initial value for SET DEFAULT VIEW
The default view used when a LOADDEBUGDATA command is issued for an
assembler CU can be set using the SET DEFAULT VIEW command. It is possible to
use the EQAXOPTS Debug Tool customization module to specify the initial value
to be used for SET DEFAULT VIEW.
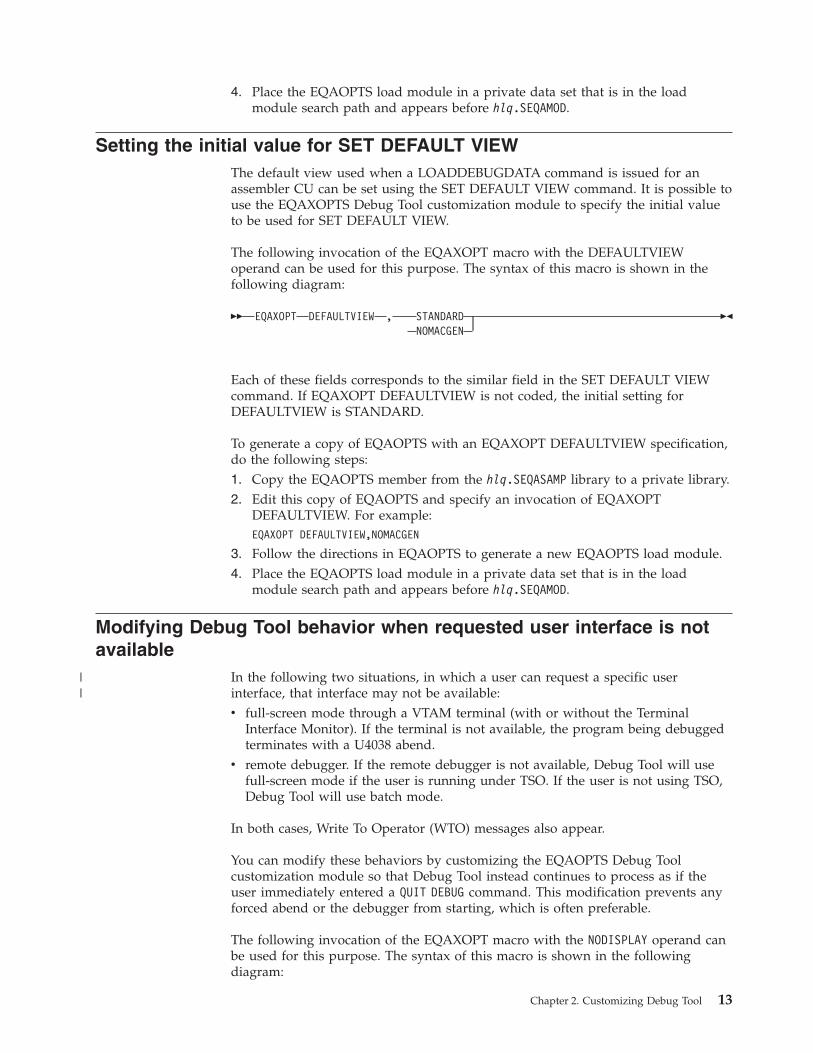
The following invocation of the EQAXOPT macro with the DEFAULTVIEW
operand can be used for this purpose. The syntax of this macro is shown in the
following diagram:
�� EQAXOPT DEFAULTVIEW , STANDARD
NOMACGEN ��
Each of these fields corresponds to the similar field in the SET DEFAULT VIEW
command. If EQAXOPT DEFAULTVIEW is not coded, the initial setting for
DEFAULTVIEW is STANDARD.
To generate a copy of EQAOPTS with an EQAXOPT DEFAULTVIEW specification,
do the following steps:
1. Copy the EQAOPTS member from the hlq.SEQASAMP library to a private library.
2. Edit this copy of EQAOPTS and specify an invocation of EQAXOPT
DEFAULTVIEW. For example:
EQAXOPT DEFAULTVIEW,NOMACGEN
3. Follow the directions in EQAOPTS to generate a new EQAOPTS load module.
4. Place the EQAOPTS load module in a private data set that is in the load
module search path and appears before hlq.SEQAMOD.
Modifying Debug Tool behavior when requested user interface is not
available
In the following two situations, in which a user can request a specific user
interface, that interface may not be available:
v full-screen mode through a VTAM terminal (with or without the Terminal
Interface Monitor). If the terminal is not available, the program being debugged
terminates with a U4038 abend.
v remote debugger. If the remote debugger is not available, Debug Tool will use
full-screen mode if the user is running under TSO. If the user is not using TSO,
Debug Tool will use batch mode.
In both cases, Write To Operator (WTO) messages also appear.
You can modify these behaviors by customizing the EQAOPTS Debug Tool
customization module so that Debug Tool instead continues to process as if the
user immediately entered a QUIT DEBUG command. This modification prevents any
forced abend or the debugger from starting, which is often preferable.
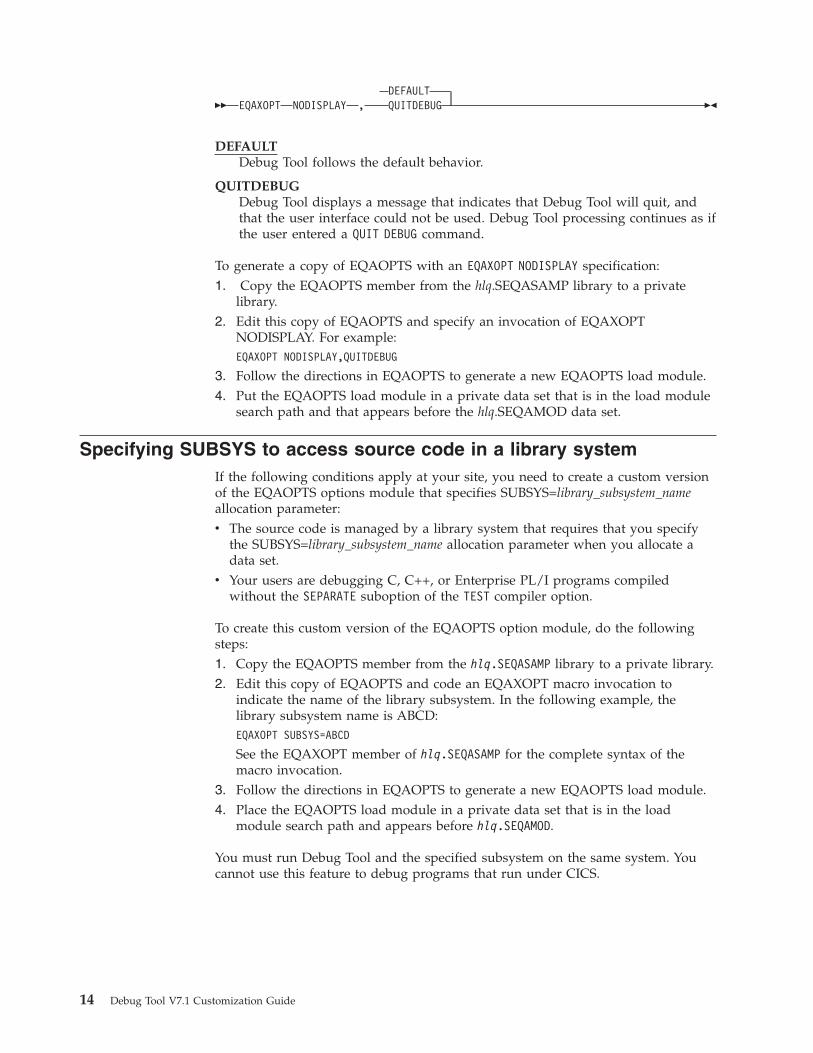
The following invocation of the EQAXOPT macro with the NODISPLAY operand can
be used for this purpose. The syntax of this macro is shown in the following
diagram:
Chapter 2. Customizing Debug Tool 13
||
�� DEFAULT
EQAXOPT
NODISPLAY
,
QUITDEBUG
��
DEFAULT
Debug Tool follows the default behavior.
QUITDEBUG
Debug Tool displays a message that indicates that Debug Tool will quit, and
that the user interface could not be used. Debug Tool processing continues as if
the user entered a QUIT DEBUG command.
To generate a copy of EQAOPTS with an EQAXOPT NODISPLAY specification:
1. Copy the EQAOPTS member from the hlq.SEQASAMP library to a private
library.
2. Edit this copy of EQAOPTS and specify an invocation of EQAXOPT
NODISPLAY. For example:
EQAXOPT NODISPLAY,QUITDEBUG
3. Follow the directions in EQAOPTS to generate a new EQAOPTS load module.
4. Put the EQAOPTS load module in a private data set that is in the load module
search path and that appears before the hlq.SEQAMOD data set.
Specifying SUBSYS to access source code in a library system
If the following conditions apply at your site, you need to create a custom version
of the EQAOPTS options module that specifies SUBSYS=library_subsystem_name
allocation parameter:
v The source code is managed by a library system that requires that you specify
the SUBSYS=library_subsystem_name allocation parameter when you allocate a
data set.
v Your users are debugging C, C++, or Enterprise PL/I programs compiled
without the SEPARATE suboption of the TEST compiler option.
To create this custom version of the EQAOPTS option module, do the following
steps:
1. Copy the EQAOPTS member from the hlq.SEQASAMP library to a private library.
2. Edit this copy of EQAOPTS and code an EQAXOPT macro invocation to
indicate the name of the library subsystem. In the following example, the
library subsystem name is ABCD:
EQAXOPT SUBSYS=ABCD
See the EQAXOPT member of hlq.SEQASAMP for the complete syntax of the
macro invocation.
3. Follow the directions in EQAOPTS to generate a new EQAOPTS load module.
4. Place the EQAOPTS load module in a private data set that is in the load
module search path and appears before hlq.SEQAMOD.
You must run Debug Tool and the specified subsystem on the same system. You
cannot use this feature to debug programs that run under CICS.
14 Debug Tool V7.1 Customization Guide
Chapter 3. Customizing Debug Tool Utilities functions shipped
with Debug Tool
Debug Tool Utilities is a utility that brings together tools provided by Debug Tool
and Debug Tool Utilities and Advanced Functions. If you order only Debug Tool,
you receive Debug Tool Setup Utility, which manages setup files. Setup files help
application programmers prepare programs to debug them interactively or in batch
mode. If you also order Debug Tool Utilities and Advanced Functions, you receive
the following tools and functions:
v Program Preparation Utilities to help application programmers precompile,
compile, and link their programs and then start Debug Tool.
v Coverage Utility to help application programmers conduct coverage tests on
their programs.
v COBOL and CICS Command Level Conversion Aid (CCCA) to help application
programmers convert OS/VS COBOL programs to Enterprise COBOL programs.
v Load Module Analyzer helps you analyze load modules to determine the
language translator that was used to compile or assemble each CSECT in the
load module.
v Manage TEST Run-time Option Data Set helps you edit a TEST runtime option
data set that the Debug Tool Language Environment user exit routines uses to
start a debug session.
v Manage IMS Programs can help you create and maintain setup files and submit
batch jobs to create a private message region or to run a BMP program. If you
are running IMS Version 8, you can also manage your Language Environment
run-time options.
If you have only Debug Tool, do the instructions in this section and you can skip
Chapter 4, “Customizing Debug Tool Utilities functions shipped with Debug Tool
Utilities and Advanced Functions,” on page 21. If you have Debug Tool Utilities
and Advanced Functions, do the instructions in Chapter 4, “Customizing Debug
Tool Utilities functions shipped with Debug Tool Utilities and Advanced
Functions,” on page 21 after you have completed the instructions in this section.
The instructions in this section describe the following customization tasks:
v Modify the TSO logon procedure so that your users can start Debug Tool
Utilities by using the EQASTART command.
v Customize the data set names in EQASTART.
v Add Debug Tool Utilities to an ISPF menu so that your users can start Debug
Tool Utilities from an ISPF menu.
v Modify Debug Tool Setup Utility so that your users can access procedure
libraries.
v Customize the Problem Determination Tools interface.
Choosing a method to start Debug Tool Utilities
Your users can start Debug Tool Utilities by doing one of the following methods:
Method 1: Enter the EXEC ’hlq.SEQAEXEC(EQASTART)’ command. This is the default
method.
© Copyright IBM Corp. 1992, 2006 15
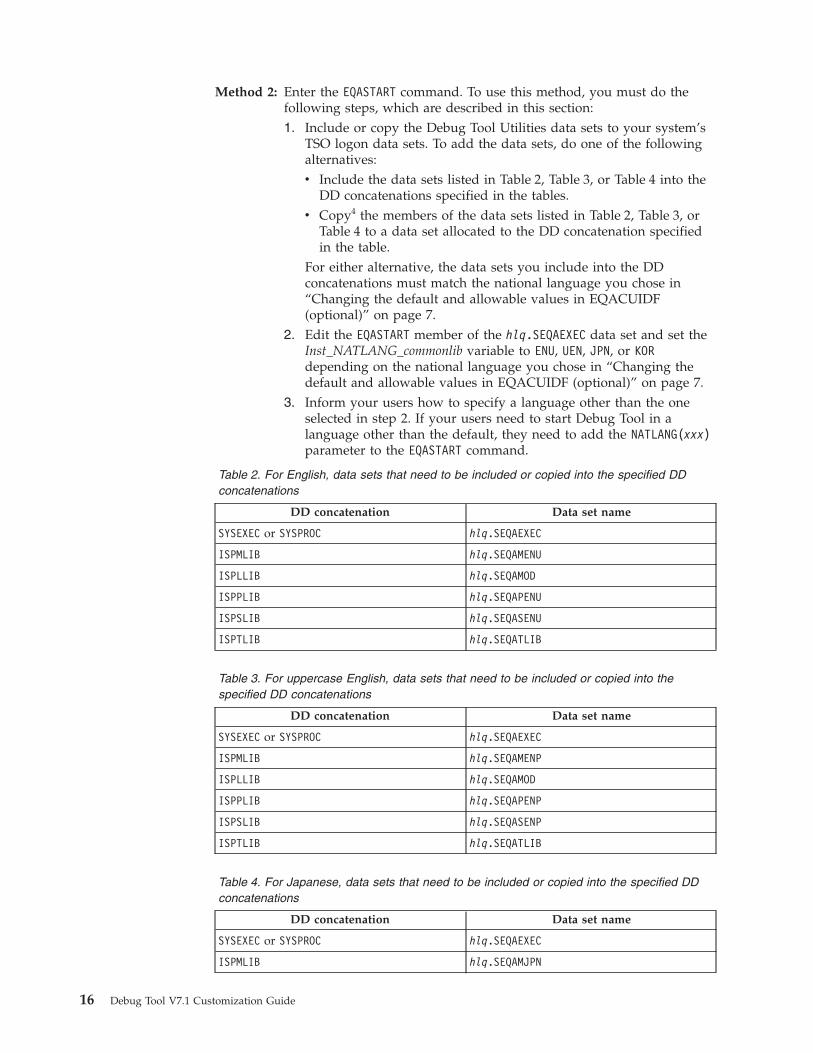
Method 2: Enter the EQASTART command. To use this method, you must do the
following steps, which are described in this section:
1. Include or copy the Debug Tool Utilities data sets to your system’s
TSO logon data sets. To add the data sets, do one of the following
alternatives:
v Include the data sets listed in Table 2, Table 3, or Table 4 into the
DD concatenations specified in the tables.
v Copy4 the members of the data sets listed in Table 2, Table 3, or
Table 4 to a data set allocated to the DD concatenation specified
in the table.
For either alternative, the data sets you include into the DD
concatenations must match the national language you chose in
“Changing the default and allowable values in EQACUIDF
(optional)” on page 7.
2. Edit the EQASTART member of the hlq.SEQAEXEC data set and set the
Inst_NATLANG_commonlib variable to ENU, UEN, JPN, or KOR
depending on the national language you chose in “Changing the
default and allowable values in EQACUIDF (optional)” on page 7.
3. Inform your users how to specify a language other than the one
selected in step 2. If your users need to start Debug Tool in a
language other than the default, they need to add the NATLANG(xxx)
parameter to the EQASTART command.
Table 2. For English, data sets that need to be included or copied into the specified DD
concatenations
DD concatenation Data set name
SYSEXEC or SYSPROC hlq.SEQAEXEC
ISPMLIB hlq.SEQAMENU
ISPLLIB hlq.SEQAMOD
ISPPLIB hlq.SEQAPENU
ISPSLIB hlq.SEQASENU
ISPTLIB hlq.SEQATLIB
Table 3. For uppercase English, data sets that need to be included or copied into the
specified DD concatenations
DD concatenation Data set name
SYSEXEC or SYSPROC hlq.SEQAEXEC
ISPMLIB hlq.SEQAMENP
ISPLLIB hlq.SEQAMOD
ISPPLIB hlq.SEQAPENP
ISPSLIB hlq.SEQASENP
ISPTLIB hlq.SEQATLIB
Table 4. For Japanese, data sets that need to be included or copied into the specified DD
concatenations
DD concatenation Data set name
SYSEXEC or SYSPROC hlq.SEQAEXEC
ISPMLIB hlq.SEQAMJPN
16 Debug Tool V7.1 Customization Guide
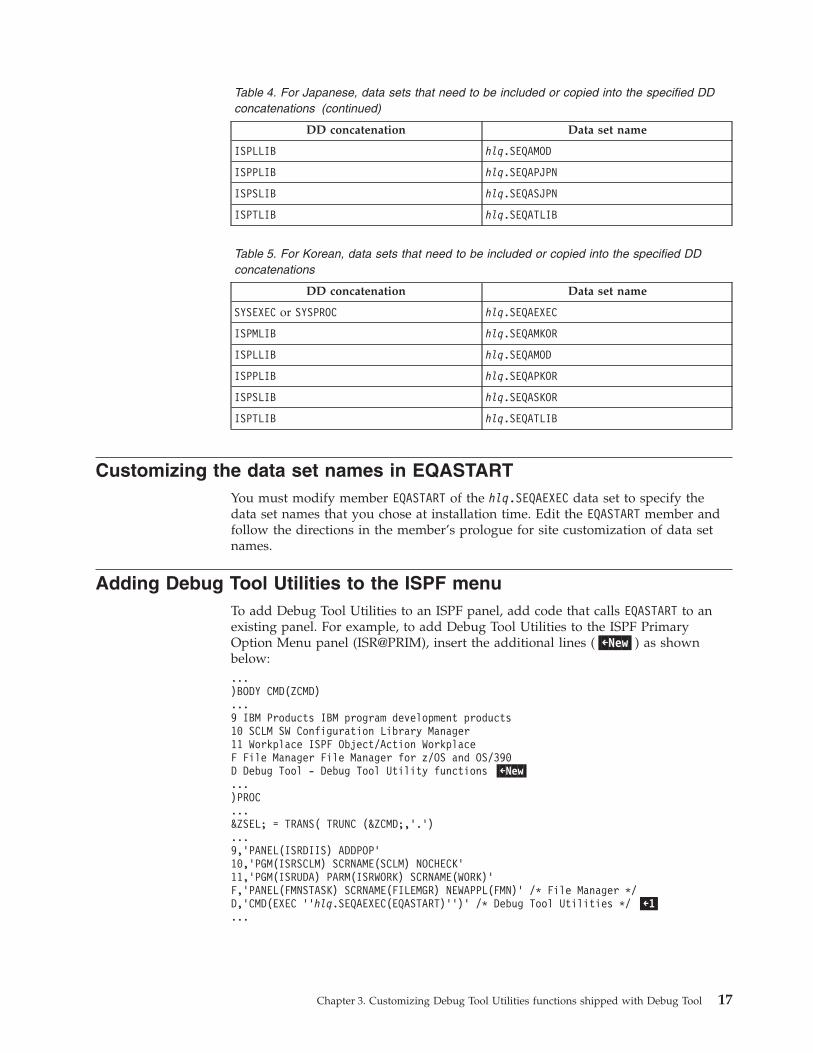
Table 4. For Japanese, data sets that need to be included or copied into the specified DD
concatenations (continued)
DD concatenation Data set name
ISPLLIB hlq.SEQAMOD
ISPPLIB hlq.SEQAPJPN
ISPSLIB hlq.SEQASJPN
ISPTLIB hlq.SEQATLIB
Table 5. For Korean, data sets that need to be included or copied into the specified DD
concatenations
DD concatenation Data set name
SYSEXEC or SYSPROC hlq.SEQAEXEC
ISPMLIB hlq.SEQAMKOR
ISPLLIB hlq.SEQAMOD
ISPPLIB hlq.SEQAPKOR
ISPSLIB hlq.SEQASKOR
ISPTLIB hlq.SEQATLIB
Customizing the data set names in EQASTART
You must modify member EQASTART of the hlq.SEQAEXEC data set to specify the
data set names that you chose at installation time. Edit the EQASTART member and
follow the directions in the member’s prologue for site customization of data set
names.
Adding Debug Tool Utilities to the ISPF menu
To add Debug Tool Utilities to an ISPF panel, add code that calls EQASTART to an
existing panel. For example, to add Debug Tool Utilities to the ISPF Primary
Option Menu panel (ISR@PRIM), insert the additional lines (�←New�) as shown
below:
...
)BODY CMD(ZCMD)
...
9 IBM Products IBM program development products
10 SCLM SW Configuration Library Manager
11 Workplace ISPF Object/Action Workplace
F File Manager File Manager for z/OS and OS/390
D Debug Tool - Debug Tool Utility functions �←New�
...
)PROC
...
&ZSEL; = TRANS( TRUNC (&ZCMD;,’.’)
...
9,’PANEL(ISRDIIS) ADDPOP’
10,’PGM(ISRSCLM) SCRNAME(SCLM) NOCHECK’
11,’PGM(ISRUDA) PARM(ISRWORK) SCRNAME(WORK)’
F,’PANEL(FMNSTASK) SCRNAME(FILEMGR) NEWAPPL(FMN)’ /* File Manager */
D,’CMD(EXEC ’’hlq.SEQAEXEC(EQASTART)’’)’ /* Debug Tool Utilities */ �←1�
...
Chapter 3. Customizing Debug Tool Utilities functions shipped with Debug Tool 17
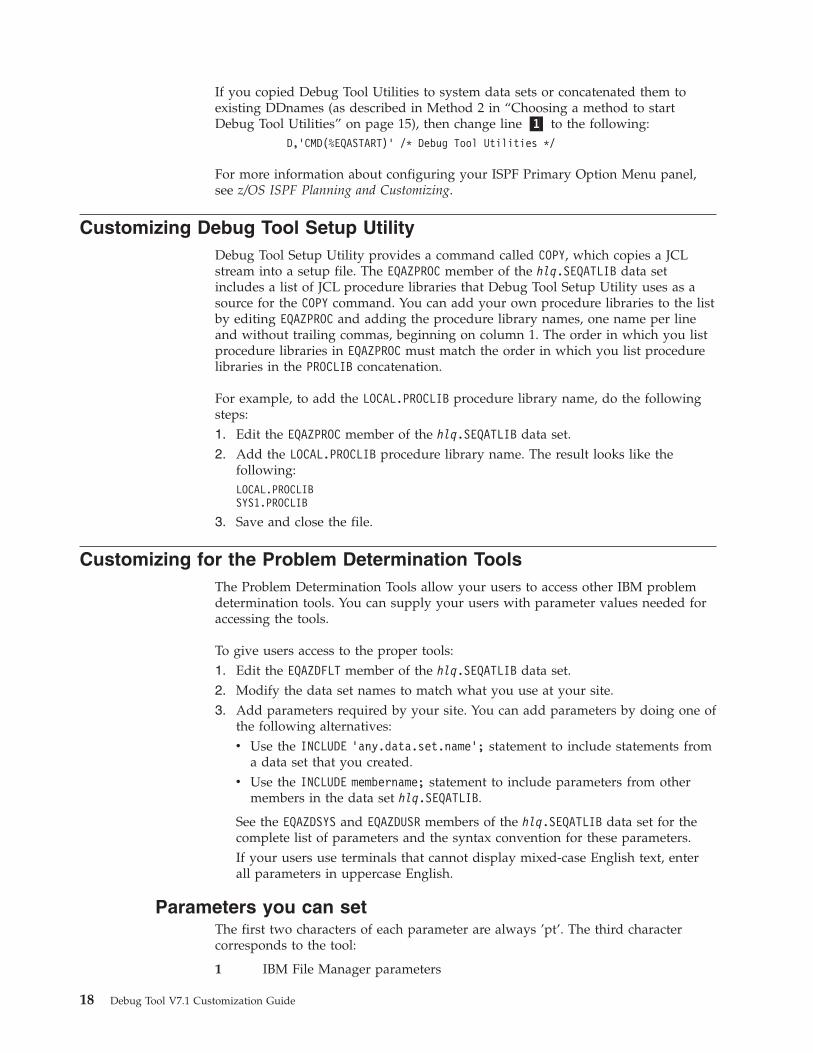
If you copied Debug Tool Utilities to system data sets or concatenated them to
existing DDnames (as described in Method 2 in “Choosing a method to start
Debug Tool Utilities” on page 15), then change line �1� to the following:
D,’CMD(%EQASTART)’ /* Debug Tool Utilities */
For more information about configuring your ISPF Primary Option Menu panel,
see z/OS ISPF Planning and Customizing.
Customizing Debug Tool Setup Utility
Debug Tool Setup Utility provides a command called COPY, which copies a JCL
stream into a setup file. The EQAZPROC member of the hlq.SEQATLIB data set
includes a list of JCL procedure libraries that Debug Tool Setup Utility uses as a
source for the COPY command. You can add your own procedure libraries to the list
by editing EQAZPROC and adding the procedure library names, one name per line
and without trailing commas, beginning on column 1. The order in which you list
procedure libraries in EQAZPROC must match the order in which you list procedure
libraries in the PROCLIB concatenation.
For example, to add the LOCAL.PROCLIB procedure library name, do the following
steps:
1. Edit the EQAZPROC member of the hlq.SEQATLIB data set.
2. Add the LOCAL.PROCLIB procedure library name. The result looks like the
following:
LOCAL.PROCLIB
SYS1.PROCLIB
3. Save and close the file.
Customizing for the Problem Determination Tools
The Problem Determination Tools allow your users to access other IBM problem
determination tools. You can supply your users with parameter values needed for
accessing the tools.
To give users access to the proper tools:
1. Edit the EQAZDFLT member of the hlq.SEQATLIB data set.
2. Modify the data set names to match what you use at your site.
3. Add parameters required by your site. You can add parameters by doing one of
the following alternatives:
v Use the INCLUDE ’any.data.set.name’; statement to include statements from
a data set that you created.
v Use the INCLUDE membername; statement to include parameters from other
members in the data set hlq.SEQATLIB.
See the EQAZDSYS and EQAZDUSR members of the hlq.SEQATLIB data set for the
complete list of parameters and the syntax convention for these parameters.
If your users use terminals that cannot display mixed-case English text, enter
all parameters in uppercase English.
Parameters you can set
The first two characters of each parameter are always ’pt’. The third character
corresponds to the tool:
1 IBM File Manager parameters
18 Debug Tool V7.1 Customization Guide
The last five characters correspond to the parameter:
flg1 Base function availability flag: Yes or No.
flg2 DB2 function availability flag: Yes or No.
flg3 IMS function availability flag: Yes or No.
ttl Title for the tool.
elib ISPF EXEC library data set.
mlib ISPF message library data set.
plib ISPF panel library data set.
slib ISPF skeleton library data set.
tlib ISPF table library data set.
pnl1 ISPF panel name for the base function.
pnl2 ISPF panel name for the DB2 function.
pnl3 ISPF panel name for the IMS function.
Customizing for Problem Determination Tools for multiple
systems
You can customize Problem Determination Tools for multiple systems by doing one
of the following alternatives:
v Modify EQASTART to use a fully qualified data set name or member name other
than EQAZDFLT to start Debug Tool Utilities.
v Instruct your users to enter one of the following commands, depending on the
customization they want to use:
– EXEC ’hlq.SEQAEXEC(EQASTART)’ ’PUMEMBER(’’data.set.name’’)’
– EXEC ’hlq.SEQAEXEC(EQASTART)’ ’PUMEMBER(membername)’
Chapter 3. Customizing Debug Tool Utilities functions shipped with Debug Tool 19

20 Debug Tool V7.1 Customization Guide
Chapter 4. Customizing Debug Tool Utilities functions shipped
with Debug Tool Utilities and Advanced Functions
Debug Tool Utilities and Advanced Functions adds the following tools and
functions to Debug Tool Utilities:
v Program Preparation Utilities to help application programmers precompile,
compile, and link their programs and then start Debug Tool.
v Coverage Utility to help application programmers conduct coverage tests on
their programs.
v COBOL and CICS Command Level Conversion Aid (CCCA) to help application
programmers convert OS/VS COBOL programs to Enterprise COBOL programs.
v Load Module Analyzer helps you analyze load modules to determine the
language translator that was used to compile or assemble each CSECT in the
load module.
v Manage TEST Run-time Option Data Set helps you edit a TEST runtime option
data set that the Debug Tool Language Environment user exit routine uses to
start a debug session.
v Manage IMS Programs can help you create and maintain setup files and submit
batch jobs to create a private message region or to run a BMP program. If you
are running IMS Version 8, you can also manage your Language Environment
run-time options.
Do the steps described in this section only if you installed Debug Tool Utilities and
Advanced Functions, and after you have completed the instructions in Chapter 3,
“Customizing Debug Tool Utilities functions shipped with Debug Tool,” on page
15.
Customizing the Program Preparation Utilities
The Program Preparation Utilities help your users access the proper compilers and
development utilities that are installed at your site. You can supply your users
with default values for data set naming patterns, data set allocation parameters,
and compiler and utility option strings.
To give users access to the proper compilers and development utilities, do the
following steps:
1. Edit the EQAZDFLT member of the hlq.SEQATLIB data set.
2. Modify the data set names to match what you use at your site.
3. Add parameters required by your site. You can add parameters by doing one of
the following alternatives:
v Use the INCLUDE ’any.data.set.name’; statement to include statements from
a data set that you created.
v Use the INCLUDE membername; statement to include parameters from other
members in the data set hlq.SEQATLIB.
See the EQAZDSYS and EQAZDUSR members of the hlq.SEQATLIB data set for the
complete list of parameters and the syntax convention for these parameters.
If your users use terminals that cannot display mixed-case English text, you
must enter all parameters in uppercase English.
© Copyright IBM Corp. 1992, 2006 21
If your site uses CCCA and requires that you use the VOLUMES parameter when
you define private data sets (for example, a cluster is not managed by SMS),
you must include the VOLUMES parameter when you define private data sets.
Modify the following variables to include the VOLUMES parameter:
v yccctla1
v ycclcpa1
v yccchga1
v yccwrka1
v ycctkna1
The following example illustrates how the variable yccctla1 is modified to
include the parameter VOLUMES(SYS166):
yccctla1 = ! CONTROL FILE KSDS
RECORDS(10000 1000)
FREESPACE(30 30)
INDEXED
SPEED
CISZ(4096)
UNIQUE
KEYS(15 0)
VOLUMES(SYS166)
RECORDSIZE(188 188);
Parameters you can set
The first two characters of each parameter are always ’yc’. The third character
corresponds to the compiler or development utility parameters:
1 COBOL compiler parameters
3 PL/I compiler parameters
4 C and C++ compiler parameters
5 Assembler parameters
L Link Edit parameters
c CCCA parameters
F Fault Analyzer parameters
G Fault Analyzer listing create parameters
DB2 and CICS parameters
The DB2 precompiler and CICS translator are listed by the compiler you
use. You can specify a different DB2 precompiler or CICS translator for
each compiler.
The last five characters correspond to the parameter:
ciclb LINKLIST or load module data set name for CICS translator.
cicmd Load module name for CICS translator.
cicps CICS translator options.
clib LINKLIST or load module data set name for the compiler.
cmod Load module name for the compiler or utility.
For the Fault Analyzer side file create and Fault Analyzer listing create
utilities, the following modules are available from the Debug Tool load
library or from the Fault Analyzer load library. They are functionally the
same.
22 Debug Tool V7.1 Customization Guide
v Fault Analyzer side file create function:
– Debug Tool load library: EQALANGX
– Fault Analyzer load library: IDILANGXv Fault Analyzer side file listing create function:
– Debug Tool load library: EQALANGP
– Fault Analyzer load library: IDILANGP
ctovr TEST compiler option override flag. Use this flag to allow or disallow the
TEST or DEBUG compiler option specified in the ctst, ctst1, ctst2, ctst3,
ctst4, or ctst5 parameters to be overridden by the settings in the user
profile. This parameter is valid for the COBOL compiler, PL/I compiler,
and C and C++ compiler.
ctst Use TEST, NOTEST, DEBUG, or NODEBUG as the main compiler debugging
option. This parameter is valid for the COBOL compiler, PL/I compiler,
and C and C++ compiler.
ctst1, ctst2, ctst3, ctst4, ctst5
TEST or DEBUG suboptions. These parameters are valid for the COBOL
compiler, PL/I compiler, and C and C++ compiler.
cttl Title for the compiler.
db2lb LINKLIST or load module data set name for the DB2 precompiler.
db2md
Load module name for DB2 precompiler.
db2ps DB2 precompiler options.
flg Enable or disable the compiler or development utility.
lsta1 Parameters of the TSO ALLOCATE command to use when data sets for
compiler listings are allocated.
lstat Data set type for the compiler listing. The type can be one of these values:
PDSE, PDS, or SEQ.
lstxx Pattern to use to create a name for the compiler listing data set. The name
is created by using the characters in the pattern. The special characters,
which start with a slash (/), are replaced by the following values:
/1, /2, ..., /n
The nth qualifier of the fully qualified data set name that was used
as input to the compiler.
/B The second to (n-1) qualifier of the fully qualified data set name
that was used as input to the compiler.
/L The right-most qualifier of the fully qualified data set name that
was used as input to the compiler.
/U Current TSO user ID.
/P Current TSO profile prefix.
sds1 Shared data set prefix for CCCA.
svs1 Shared VSAM data set prefix for CCCA.
tmpa1 Parameters of the TSO ALLOCATE command to use when temporary data
sets are allocated.
Chapter 4. Customizing Debug Tool Utilities functions shipped with Debug Tool Utilities and Advanced Functions 23
Customizing Preparation Utilities for multiple systems
You can customize Program Preparation Utilities for multiple systems by doing
one of the following alternatives:
v Modify EQASTART to use a fully qualified data set name or member name other
than EQAZDFLT to start Debug Tool Utilities.
v Instruct your users to enter one of the following commands, depending on the
customization they want to use:
– EXEC ’hlq.SEQAEXEC(EQASTART)’ ’PUMEMBER(’’any.data.set.name’’)’
– EXEC ’hlq.SEQAEXEC(EQASTART)’ ’PUMEMBER(membername)’
Customizing Coverage Utility
This section describes the steps you must do to enable Coverage Utility:
Setting up the APF-authorized non-link list data sets
This section describes where to place certain Coverage Utility load modules so that
the correct people have access to them.
Placing Coverage Utility load modules in an APF-authorized data
set accessible to all users
Certain Coverage Utility load modules must be placed in an APF-authorized data
set that is accessible to all your users. The APF-authorized data set does not need
to be in the link list.
1. Make the load modules in hlq.SEQAMOD accessible to all users by using one of
the following alternatives:
v Mark the hlq.SEQAMOD data set as APF-authorized2 and make it accessible to
all users by creating a Resource Access Control Facility (RACF) profile.
v Do not mark the hlq.SEQAMOD data set as APF-authorized. Copy4 the
following load modules to an APF-authorized data set that all users can
access.
– EQACUOCM (monitor interface)
– EQACU9M0 (monitor messages)
– EQACU9M1 (monitor messages)
– EQACU9M2 (monitor messages and only if the Japanese feature is installed)
– EQACU9M3 (monitor messages and only if the Korean feature is installed)2. Add the EQACUOCM program to the AUTHPGM entry in the member
IKJTSOxx of the SYS1.PARMLIB data set.
3. Issue the PARMLIB UPDATE(xx) command from TSO or IPL your system.
4. Edit the EQASTART member of the hlq.SEQAEXEC data set and set the
INST_Auth_SEQAMOD variable to the name of the data set from step 1 that
contains EQACUOCM.
Placing Coverage Utility load modules in an APF-authorized data
set not accessible to general users
Certain Coverage Utility load modules must be placed in an APF-authorized data
set that is accessible only to system programmers. The APF-authorized data set
must not be in the link list.
To place the load modules in an APF-authorized data set, do one of the following
alternatives:
v Mark the hlq.SEQAAUTH data set as APF-authorized2 and do one of the following:
24 Debug Tool V7.1 Customization Guide
– Limit access to only system programmers.
– Create Resource Access Control Facility (RACF) profiles to restrict access to
these load modules.v Do not mark the hlq.SEQAAUTH data set as APF-authorized. Copy4 the following
load modules into an APF-authorized data set that only system programmers
can access:
– EQACUOIN (SVC installer)
– EQACUOSV (SVCs)
Creating RACF profiles
If you place Coverage Utility load modules that must not be accessible to all users
in an APF-authorized data set that is accessible to all users, you must create RACF
profiles to prevent access to these load modules. You can add the code in the
following example to the RACF profile:
RDEFINE PROGRAM(EQACUOIN) NOTIFY(notify) UACC(NONE) +
DATA(’RACF profile for Coverage Utility monitor’) +
ADDMEM(’authlib’/’volser’/PADCHK) OWNER(owner))
RDEFINE PROGRAM(EQACUOSV) NOTIFY(notify) UACC(NONE) +
DATA(’RACF profile for Coverage Utility monitor’) +
ADDMEM(’authlib’/’volser’/PADCHK) OWNER(owner)
SETROPTS WHEN(PROGRAM) REFRESH
PERMIT EQACUOIN CLASS(PROGRAM) ID(id) ACCESS(READ)
PERMIT EQACUOSV CLASS(PROGRAM) ID(id) ACCESS(READ)
SETROPTS WHEN(PROGRAM) REFRESH
The above code restricts access to EQACUOIN and EQACUOSV by granting read access
to only id. The following list describes the operands used in this example:
notify
TSO user ID of the person who is notified of a RACF access failure.
authlib
Name of the APF-authorized data set that contains EQACUOIN and EQACUOSV.
volser
Volume serial of authlib data set or ****** to specify the current SYSRES
volume.
owner
TSO user ID or RACF group name of the person or persons that own this
profile.
id TSO user ID or RACF group name of the person or persons who have the
ability to install the SVCs.
Installing and enabling the monitor SVCs
The EQACUOIN module installs and enables the monitor SVCs. The monitor SVCs
must be installed and enabled before a user starts a monitor session. The EQACUOIN
module must be run:
v When the SVCs are initially installed
v After service is applied
v Any time you IPL your system
Chapter 4. Customizing Debug Tool Utilities functions shipped with Debug Tool Utilities and Advanced Functions 25
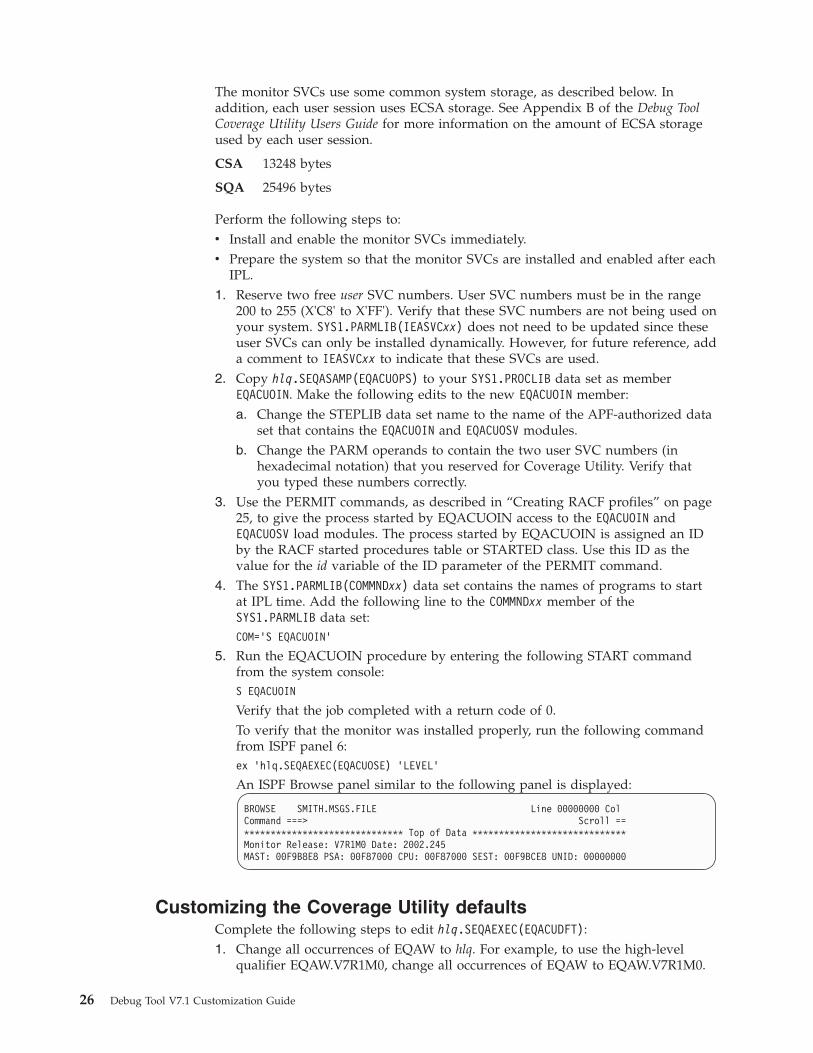
The monitor SVCs use some common system storage, as described below. In
addition, each user session uses ECSA storage. See Appendix B of the Debug Tool
Coverage Utility Users Guide for more information on the amount of ECSA storage
used by each user session.
CSA 13248 bytes
SQA 25496 bytes
Perform the following steps to:
v Install and enable the monitor SVCs immediately.
v Prepare the system so that the monitor SVCs are installed and enabled after each
IPL.1. Reserve two free user SVC numbers. User SVC numbers must be in the range
200 to 255 (X'C8' to X'FF'). Verify that these SVC numbers are not being used on
your system. SYS1.PARMLIB(IEASVCxx) does not need to be updated since these
user SVCs can only be installed dynamically. However, for future reference, add
a comment to IEASVCxx to indicate that these SVCs are used.
2. Copy hlq.SEQASAMP(EQACUOPS) to your SYS1.PROCLIB data set as member
EQACUOIN. Make the following edits to the new EQACUOIN member:
a. Change the STEPLIB data set name to the name of the APF-authorized data
set that contains the EQACUOIN and EQACUOSV modules.
b. Change the PARM operands to contain the two user SVC numbers (in
hexadecimal notation) that you reserved for Coverage Utility. Verify that
you typed these numbers correctly.3. Use the PERMIT commands, as described in “Creating RACF profiles” on page
25, to give the process started by EQACUOIN access to the EQACUOIN and
EQACUOSV load modules. The process started by EQACUOIN is assigned an ID
by the RACF started procedures table or STARTED class. Use this ID as the
value for the id variable of the ID parameter of the PERMIT command.
4. The SYS1.PARMLIB(COMMNDxx) data set contains the names of programs to start
at IPL time. Add the following line to the COMMNDxx member of the
SYS1.PARMLIB data set:
COM=’S EQACUOIN’
5. Run the EQACUOIN procedure by entering the following START command
from the system console:
S EQACUOIN
Verify that the job completed with a return code of 0.
To verify that the monitor was installed properly, run the following command
from ISPF panel 6:
ex ’hlq.SEQAEXEC(EQACUOSE) ’LEVEL’
An ISPF Browse panel similar to the following panel is displayed:
BROWSE SMITH.MSGS.FILE Line 00000000 Col
Command ===> Scroll ==
****************************** Top of Data *****************************
Monitor Release: V7R1M0 Date: 2002.245
MAST: 00F9B8E8 PSA: 00F87000 CPU: 00F87000 SEST: 00F9BCE8 UNID: 00000000
Customizing the Coverage Utility defaults
Complete the following steps to edit hlq.SEQAEXEC(EQACUDFT):
1. Change all occurrences of EQAW to hlq. For example, to use the high-level
qualifier EQAW.V7R1M0, change all occurrences of EQAW to EQAW.V7R1M0.
26 Debug Tool V7.1 Customization Guide
2. In the execute step data entry for EXEJOBLB, change the name hlq.SEQAMOD to
the name of the APF-authorized data set you used for the EQACUOCM
program identified in “Placing Coverage Utility load modules in an
APF-authorized data set accessible to all users” on page 24.
3. Enter the Coverage Utility Monitor SVC numbers (in hexadecimal notation) in
the CUSVC2B and CUSVC4B entries.
4. When you create JCL, the *JOBLn lines become the first three lines of the JOB
card for each respective job. Customize these lines and customize all of the
*JOBJ* lines to specify any JES control information as appropriate for your site.
5. If your site requires a specification for allocation parameters such as
STORCLAS or UNIT on new or temporary data set allocations, look for the
word SPACE in this EXEC and the ’hlq.SEQAS*’ data sets and update the
allocation specifications.
6. If you want Coverage Utility to generate or build each data set as sequential or
partitioned, set the USEPRGNM variable to Y. To generate a data set as
sequential, set the DSORG variable to SEQ. To generate a data set as
partitioned, set the DSORG variable to PDS.
Coverage Utility uses the following forms to generate data set names:
v For sequential data sets:
’proj_qual.program_name.file_type’
For example: ’PROGA.SAMPLE.COB01.BRKTAB’
v For partitioned data sets:
’proj_qual.file_type(program_name)’
For example: ’PROGA.SAMPLE.BRKTAB(COB01)’7. If you do not want Coverage Utility to generate or build any data set names
automatically, set the USEPRGNM variable to N.
Configuring for IMS Version 8 or later
If your users use the Manage IMS Programs - Manage LE Runtime Options
function in Debug Tool Utilities, you must do the following tasks:
1. Install and configure IMS Version 8 or later as an IMSplex. See IMS Version 8:
Administration Guide: System for information about configuring an IMSplex.
2. Include the IMS load library, which is located in the hlq.SDFSRESL data set, in
the standard search path for load modules used by your users. hlq is the high
level qualifier of IMS installed on your system.
If you do not include the IMS load library in the search path, your users will see
one or both of the following messages and they will not be able to use the Manage
LE Runtime Options function in Debug Tool Utilities:
v EQAZ60E REXX IMS SPOC environment is not available. Return Code = nnn
v IKJ56500I COMMAND CSLULXSB NOT FOUND
If you want the debug session to use the options you specify in the Manage LE
Runtime Options function, you must use the DFSBXITA user exit supplied by IMS.
This exit contains a copy of the Language Environment CEEBXITA user exit that is
customized for IMS. The DFSBXITA user exit either replaces the exit supplied by
Language Environment in CEEBINIT, or is placed in your load module.
v To make the user exit available installation-wide, do a replace link edit of the
IMS CEEBXITA into the CEEBINIT load module in your system hlq.SCEERUN
Language Environment runtime library.
Chapter 4. Customizing Debug Tool Utilities functions shipped with Debug Tool Utilities and Advanced Functions 27
v To make the user exit available region-wide, copy the CEEBINIT in your
hlq.SCEERUN library into a private library, and then do a replace link edit of the
IMS CEEBXITA into the CEEBINIT load module in your private library. Then
place your private library in the STEPLIB DD concatenation sequence before the
system hlq.SCEERUN data set in the MPR region startup job.
v To make the user exit available to a specific application, link the IMS CEEBXITA
into your load module. The user exit runs only when the application is run.
The following sample JCL describes how to do a replace link edit of the IMS
CEEBXITA into a CEEBINIT load module:
INCLUDE MYOBJ(CEEBXITA) �1�
REPLACE CEEBXITA
INCLUDE SYSLIB(CEEBINIT)
ORDER CEEBINIT MODE AMODE(24),RMODE(24)
ENTRY CEEBINIT
ALIAS CEEBLIBM
NAME CEEBINIT(R)
When you assembled the IMS user exit DFSBXITA, if you named the resulting
object member DFSBXITA, replace CEEBXITA on line �1� with DFSBXITA.
28 Debug Tool V7.1 Customization Guide
Chapter 5. Enabling debugging in full-screen mode through a
VTAM terminal
To enable users to debug the following types of programs while using a 3270-type
terminal, you need to enable full-screen mode through a VTAM terminal:
v Batch programs
v TSO programs (using a separate terminal for debugging)
v Programs running under UNIX System Services
v DB2 stored procedures
v IMS programs
How Debug Tool uses VTAM in full-screen mode through a VTAM
terminal
The following steps describe how a user would start a debugging session for a
batch job using full-screen mode through a VTAM terminal. Study these steps to
understand how Debug Tool uses VTAM in full-screen mode through a VTAM
terminal and to understand why you need to do the configuration steps described
in “The steps for enablement” on page 30.
1. Start two terminal emulator sessions. Connect the second session to a terminal
LU that can handle a full-screen mode debugging session through a VTAM
terminal.
2. On the first terminal emulator session, log on to TSO.
3. Note the LU name to which the second terminal emulator session is connected.
If the second session displays a session manager screen, exit from the session
manager.
4. Edit the PARM string of your batch job so that you specify the TEST run time
parameter in the following format:
TEST(,,,MFI%VTAM_LU_id:*)
VTAM_LU_id is the VTAM LU name to which the second terminal emulator
session is connected.
If your site requires that you specify the VTAM network identifier, specify the
TEST run time parameter in the following format:
TEST(,,,MFI%network_identifier.VTAM_LU_id:*)
network_identifer is optional and identifies the network in which the second
terminal emulator resides.
Place a slash (/) before or after the parameter, depending on your
programming language.
5. Submit the batch job. The following tasks are completed:
a. Debug Tool allocates a VTAM minor node ACB (EQAMVnnn) for its end of a
VTAM conversation.
b. Debug Tool uses VTAM to initiate a conversation with the terminal LU to
which the second terminal emulator session is connected. In particular it
will acquire the terminal LU and do a SIMLOGON from it.
c. A VTAM conversation is then conducted between the Debug Tool minor
node and the terminal LU.
© Copyright IBM Corp. 1992, 2006 29
||
|
||
||
|
||
||
The user does not logon to any host application through the second
terminal emulator session. Debug Tool initiates the connection between itself
and the terminal LU to which the second session is connected.6. On the second terminal emulator session, a full-screen mode debugging session
is displayed. Interact with it in the same way you would with any other
full-screen mode debugging session.
This technique requires you to define and configure a number of items in VTAM
for Debug Tool, in VTAM for the terminal definitions, and in TCP/IP (if the
TN3270 server is used to manage the terminal). Section “The steps for enablement”
describes these definitions and configuration.
The steps for enablement
To enable full-screen mode through a VTAM terminal, do the following steps:
1. Define the VTAM minor nodes that Debug Tool uses for its end of the
conversation with the terminal LU.
2. Define the terminals used by Debug Tool.
3. Configure the TN3270 Telnet Server.
4. Verify the installation of the facility to debug programs in full-screen mode
through a VTAM terminal.
Defining the VTAM EQAMVnnn minor nodes
You must define the minor nodes that Debug Tool uses for its end of the VTAM
conversation with the terminal LU. You can define up to 999 minor nodes for
Debug Tool. You can define a minor node by using one of the following naming
conventions:
v Define each minor node with the following naming convention: the first five
characters of the minor node name must be EQAMV and the last three characters
must be consecutive three digit numbers, starting with 001.
v Define each minor node name with the naming convention you use at your site.
Code an ACBNAME operand on the APPL definition statement that uses EQAMV as
the first five characters, and three numeric digits (starting with 001) as the last
three characters.
Tip: The EQAMVnnn minor node names are used internally by Debug Tool. Do not
confuse these node names with the terminal minor node (LU) names that
define the display terminal. The user needs to know only the terminal LU
name of the display terminal, which he specifies with the MFI% sub-option of
the TEST run time option.
The number of minor node names you define must be sufficient to allow for the
maximum number of concurrent Debug Tool full-screen mode through a VTAM
terminal sessions. (Debug Tool uses one of these minor node names for its end of
each VTAM session that is initiated with a terminal LU.)
The descriptions and examples used in this book assume you defined minor node
names by using the EQAMVnnn naming convention. Debug Tool uses the EQAMVnnn
minor node names for internal processing.
The EQAWAPPL member in the hlq.SEQASAMP data set predefines 20 minor node
names, EQAMV001 to EQAMV020. You can copy EQAWAPPL into a new member or into
an existing member in the VTAM definitions library (VTAMLST).
30 Debug Tool V7.1 Customization Guide
|||
v To copy EQAWAPPL into a new member:
1. Create a new member in the VTAM definitions library (VTAMLST). The VTAM
definitions library is often stored in the data set SYS1.VTAMLST.
2. Copy the contents of the EQAWAPPL member into the new member.
3. Add the new member’s name to the VTAM start options configuration file,
ATCCONxx.v To copy EQAWAPPL into an existing member:
1. Select a member in the VTAM definitions library (VTAMLST) that contains the
major node definitions.
2. Copy the minor node name definitions (APPL statements) for Debug Tool
from the EQAWAPPL member into the selected member.
If you are running VTAM in a sysplex or a VTAM multi-domain environment and
you require the ability to debug full-screen mode through a VTAM terminal on
more than one host in the sysplex, edit the copy of EQAWAPPL on each system to
make the names for Debug Tool major and minor nodes unique for each system.
For example, if you have hosts SYSA, SYSB, and SYSC, and need to provide
definitions for up to 20 concurrent users debugging programs in full-screen mode
through a VTAM terminal on each system, you can code the following entries:
v SYSA VTAMLST EQAWAPPL entry:
EQAAPPLA VBUILD TYPE=APPL
EQAMV001 APPL AUTH=(PASS,ACQ),PARSESS=NO
EQAMV002 APPL AUTH=(PASS,ACQ),PARSESS=NO
...
EQAMV020 APPL AUTH=(PASS,ACQ),PARSESS=NO
v SYSB VTAMLST EQAWAPPL entry:
EQAAPPLB VBUILD TYPE=APPL
EQAMV021 APPL AUTH=(PASS,ACQ),PARSESS=NO
EQAMV022 APPL AUTH=(PASS,ACQ),PARSESS=NO
...
EQAMV040 APPL AUTH=(PASS,ACQ),PARSESS=NO
v SYSC VTAMLST EQAWAPPL entry:
EQAAPPLC VBUILD TYPE=APPL
EQAMV041 APPL AUTH=(PASS,ACQ),PARSESS=NO
EQAMV042 APPL AUTH=(PASS,ACQ),PARSESS=NO
...
EQAMV060 APPL AUTH=(PASS,ACQ),PARSESS=NO
You can have up to 999 unique minor node names for full-screen mode through a
VTAM terminal spread across the sysplex.
As an alternative to coding each minor node name, you can use the Model
Application Names function. With this function, VTAM dynamically creates the
minor nodes. Use one of the following ways (alter these examples, if needed, to
maintain unique names per system as discussed in “Defining the VTAM
EQAMVnnn minor nodes” on page 30):
v EQAMV??? APPL AUTH=(PASS,ACQ),PARSESS=NO
v ABCDE??? APPL AUTH=(PASS,ACQ),PARSESS=NO,ACBNAME=EQAMV???
Activating the VTAM EQAMVnnn minor nodes
Activate the VTAM minor nodes by entering the following command from the
console, where member-name is the member name in the VTAM library:
VARY NET,ACT,ID=member-name
Chapter 5. Enabling debugging in full-screen mode through a VTAM terminal 31
If you used the Model Application Names function, enter the one of the following
commands from the console:
v DISPLAY NET,E,ID=EQAMV001
v DISPLAY NET,E,ID=ABCDE001, where ABCDE001 is the first application node name.
Use this command if you used something other than EQAMVnnn for the
application node name.
Defining terminal LUs used by Debug Tool
The terminal LUs used by Debug Tool in full-screen mode through a VTAM
terminal must meet the requirements specified in the following sections:
“Terminal LU specifications”
“Terminal LU state requirements”
Terminal LU specifications
All terminal LUs that are used to debug programs in full-screen mode through a
VTAM terminal must have a default LOGMODE specified in the corresponding VTAM
definitions. This LOGMODE must match the characteristics of the terminal emulator
session that is attached to this terminal LU. Use the DLOGMOD= operand on the APPL
definition for the terminal logical unit (LU) to specify the default LOGMODE.
To support the widest range of terminal characteristics, we recommend you use a
DLOGMOD specification of D4C32XX3, in the IBM supplied MODETAB of ISTINCLM. If
you use a DLOGMOD specification of D4C32XX3, you must use a TN3270E emulator
that responds to a VTAM query with terminal characteristics, such as size, color,
and extended graphics.
If your terminal emulator session cannot provide this information, select a
logmode that matches your terminal emulator session characteristics. For example,
if you have a TN3270E emulator that does not respond to a query, select one of the
following logmodes that matches the terminal size that the user will be using:
v D4C32782 24x80
v D4C32783 32x80
v D4C32784 43x80
v D4C32785 27x132
When you specify these types of log modes, the user must select a terminal size
that matches your DLOGMOD specification.
An example of a set of terminal LU definitions for the terminal side of the VTAM
conversation is hlq.SEQASAMP(EQAWTRML). See the logon mode definitions in the IBM
Communications Server SNA Resource Definition Reference (SC31-8778) for further
information about log modes. The MODETAB logon mode table load module that
contains the DLOGMOD default log on mode specification must be available to VTAM
via the VTAMLIB DD statement.
You need to VARY on these new terminal LU definitions, similar to the way it was
done in “Activating the VTAM EQAMVnnn minor nodes” on page 31.
Terminal LU state requirements
When Debug Tool accesses the terminal LU, the terminal LU must be in the
following state:
v It must be known to the z/OS system on which the application runs.
v It must be marked secondary logical unit (SLU) enabled.
32 Debug Tool V7.1 Customization Guide
v It must not be in session with any application.
You can determine whether a particular terminal LU meets these criteria by using
the DISPLAY VTAM operator command:
1. Access the desired LU using your terminal emulator session, and exit any
session manager.
2. On your system console, enter the following command, where name is the LU
name:
DISPLAY NET,ID=name,SCOPE=ALL
3. Inspect the output of the command for the following information:
v The IST486I message indicates STATUS=ACTIV and DESIRED STATE=ACTIV, and
an IST172I NO SESSIONS EXIST message is displayed.
v The IST597I message indicates SLU ENABLED.
v The IST934I message indicates that a DLOGMOD was specified.
Configuring the TN3270 Telnet Server to access the terminal
LUs
This section applies if you use the IBM Communications Server for z/OS TN3270
Telnet Server.
If you use this TN3270 Telnet Servers to manage your terminals, you can set up a
new TN3270 telnet port that will allow the TN3270 Telnet Server to support the
requirements stated previously. The particular requirements are as follows:
v Terminal LUs that have a proper DLOGMOD specified must be accessed.
v The LUMAP KEEPOPEN statement needs to be specified, so that VTAM
allocates the ACB for the terminal LU when a terminal emulator session is
connected to it, rather than only when an application is started.
v The terminal LU name must be available to the user of the terminal emulator
session.
The following changes guide you though configuring such a port. For reference
you might also want to refer ahead to working examples of this new port shown
in the next section.
1. Select an unused port, such as 2023. If you have a firewall installed, ensure that
this port is allowed through the firewall.
2. Do one of the following steps:
v If you are running the TN3270 Telnet Server in the TCP/IP address space,
specify a PORT num TCP INTCLIEN statement to reserve the new port for the
TN3270 Telnet Server.
v If you are running the TN3270 Telnet Server in a separate address space,
specify a PORT num TCP jobname NOAUTOLOG statement to reserve the new port
for the TN3270 Telnet Server.3. Create a new set of TELNETPARMS and BEGINVTAM blocks for the new port
by copying the existing TELNETPARMS and BEGINVTAM blocks for port 23.
4. Customize the new TELNETPARMS and BEGINVTAM blocks to use this new
port number. Ensure that the previous TELNETPARMS and BEGINVTAM
blocks also specify a port number (typically 23).
5. Make the following changes to your new BEGINVTAM block:
Chapter 5. Enabling debugging in full-screen mode through a VTAM terminal 33
|
|||
|||
a. If you intend to use this new port for only Debug Tool in full screen-mode
through a VTAM terminal, you can remove all the statements from the
BEGINVTAM block that you created in step 3 on page 33, except the PORT
statement. Go to step 5c.
b. Remove any copied DEFAULTLUS, DEFAULTLUSSPEC, DEFAULTAPPL
and LUMAP statements.
c. Specify a new LUGROUP specification that indicates which terminal LUs
that will be used as VTAM terminals for debugging in full-screen mode
through a VTAM terminal. These terminal LUs must have a DLOGMOD
specification in their APPL definition statement.
d. Specify some client_identification statements (such as HNGROUP and
IPGROUP).
e. Specify a new LUMAP statement with KEEPOPEN (along with the proper
LU group operand and client_identification operand).
The KEEPOPEN operand forces the TN3270 Telnet Server to keep the access
control block (ACB) for the LU open at all times (for those LUs affected by
this LUMAP statement). With the ACB open, Debug Tool can acquire the
LU if the LU is connected to a client terminal emulator session but is not in
session.
f. Specify a new ALLOWAPPL EQAMV* statement (or ALLOWAPPL * if site
policies allow it) in the BEGINVTAM block to let Debug Tool do a
SIMLOGON of an application that is named EQAMVnnn from the terminal LU.
If you defined the minor node name that Debug Tool uses for its side of the
VTAM conversation with a node name other than EQAMVnnn, then you should
specify that node name on the ALLOWAPPL statement, rather than
EQAMVnnn. (Or just use * if your site policies allow it.)
g. Specify whether the terminal is to display a session manager panel, a
USSMSG10 panel, or a Telnet Solicitor Logon panel.
The user must know what terminal LU they have acquired when they
connect their terminal emulator session to this new port. If you normally
use a session manager that displays the terminal LU, then you can continue
to use that method. Otherwise, use one of the following panels:
v A modified USSMSG10 panel that displays the terminal LU name
v The Telnet Solicitor Logon panel, if the terminal emulator itself shows the
terminal LU name
To specify which panel is to be displayed, do the following steps:
1) To display a session manager panel, specify the FIRSTONLY operand on
a DEFAULTAPPL statement that defines the session manager to run. To
use the LU to debug a program in full-screen mode through a VTAM
terminal, the user must first exit the session manager panel and return
to the Telnet Solicitor Logon panel.
2) To display a USSMSG10 panel, specify a USSTCP statement. If your
terminal emulator session supports the TN3270E protocol, the
USSMSG10 panel can be customized to display the terminal LU name.
See the IBM Communication Server IP Configuration Reference manual for
information on how to create a new USS table load module that contains
a USSMSG10 panel which includes the @@LUNAME parameter.
3) To display a Telnet Solicitor Logon panel, code no additional statements.
If you want to restrict access for a terminal connected to this new port so that no
one can use it to start any application and that no application other than Debug
Tool can acquire it, then do the following steps:
34 Debug Tool V7.1 Customization Guide
1. Remove any statements from the port’s BEGINVTAM block other than those
recommended above.
2. Write only one ALLOWAPPL statement, specifying EQAMVnnn or, if you didn’t
use EQAMVnnn, the minor node name that Debug Tool uses for its side of the
VTAM conversation.
3. Use the USSMSG10 panel or Telnet Solicitor Logon Panel display method.
After you make these changes to the TCP/IP configuration data set, you must
instruct TCP/IP to use this updated definition and start the new port. The Telnet
server uses the VARY command to change Telnet functions. One of the following
commands can help you change Telnet functions:
VARY TCPIP,,OBEYFILE
To start, restart or change a port by updating the Telnet profile.
VARY TCPIP,,TELNET,STOP and VARY TCPIP,,OBEYFILE
To stop a Telnet port, and then restart that port or a new port without
stopping the TCP/IP stack.
See IBM Communication Server IP Configuration Reference (SC31-8775) for more
information on the VARY TCPIP command.
After making these changes, your users can set up a unique terminal emulator
session that connects to this new port, and debug programs that require the use of
full-screen mode through a VTAM terminal.
Example: Activating full-screen mode through a VTAM terminal when
using TCP/IP TN3270 Telnet Server
The examples below describe how to define the Debug Tool minor node names,
define the terminal LUs for use by Debug Tool, and three ways to define Telnet
ports that the TN3270 Telnet server can use.
After you code these definitions, you need activate these changes by using the
VARY NET and VARY TCPIP commands as described previously.
Defining Debug Tool to VTAM
These are the Debug Tool minor node names defined to VTAM through VTAMLST:
EQAAPPL VBUILD TYPE=APPL
EQAMV001 APPL AUTH=(PASS,ACQ),PARSESS=NO
EQAMV002 APPL AUTH=(PASS,ACQ),PARSESS=NO
EQAMV003 APPL AUTH=(PASS,ACQ),PARSESS=NO
EQAMV004 APPL AUTH=(PASS,ACQ),PARSESS=NO
EQAMV005 APPL AUTH=(PASS,ACQ),PARSESS=NO
...
EQAMV020 APPL AUTH=(PASS,ACQ),PARSESS=NO
See hlq.SEQASAMP(EQAWAPPL) for a sample of these definitions.
Defining the terminals used by Debug Tool
These are the terminal LUs defined to VTAM through VTAMLST:
TRMLU001 APPL AUTH=NVPACE,EAS=1,PARSESS=NO,MODETAB=ISTINCLM, *
SESSLIM=YES,DLOGMOD=D4C32XX3
TRMLU002 APPL AUTH=NVPACE,EAS=1,PARSESS=NO,MODETAB=ISTINCLM, *
SESSLIM=YES,DLOGMOD=D4C32XX3
TRMLU003 APPL AUTH=NVPACE,EAS=1,PARSESS=NO,MODETAB=ISTINCLM, *
SESSLIM=YES,DLOGMOD=D4C32XX3
Chapter 5. Enabling debugging in full-screen mode through a VTAM terminal 35
TRMLU004 APPL AUTH=NVPACE,EAS=1,PARSESS=NO,MODETAB=ISTINCLM, *
SESSLIM=YES,DLOGMOD=D4C32XX3
TRMLU005 APPL AUTH=NVPACE,EAS=1,PARSESS=NO,MODETAB=ISTINCLM, *
SESSLIM=YES,DLOGMOD=D4C32XX3
...
TRMLU020 APPL AUTH=NVPACE,EAS=1,PARSESS=NO,MODETAB=ISTINCLM, *
SESSLIM=YES,DLOGMOD=D4C32XX3
See hlq.SEQASAMP(EQAWTRML) for a sample of these definitions.
Note that the DLOGMOD operand is specified. Change the TRMLUnnn names on the
terminal LU APPL definition statements to names that meet your site convention
for terminal LU names. These names must match the entries in the LUGROUP
statements in the BEGINVTAM blocks shown in “Example 1,” “Example 2” on
page 37, and “Example 3” on page 37.
Configuring the TN3270 Telnet Server
The examples below highlight the changes made to the TCP/IP TN3270 server’s
configuration file.
Example 1
The example defines a new port (2023). When a user connects a terminal emulator
session to this port, the Netview Access Services (NVAS) menu appears when the
LU is created. The user copies the LU name that appears on the NVAS screen and
specifies it as the value for the MFI%VTAM_LU_id sub-option of the TEST run-time
option. After the user copies the LU name, the user exits NVAS and returns to the
Telnet Solicitor Logon panel to make the terminal LU available to Debug Tool.
Each change is highlighted with a number in �reverse highlighting�. This
number corresponds to the step number in the list of instructions in “Configuring
the TN3270 Telnet Server to access the terminal LUs” on page 33.
PORT
...
�2� 2023 TCP INTCLIEN ; Telnet Server - Debug Tool
...
;
; Define Telnet pool for Debug Tool
;
TELNETPARMS
�4� PORT 2023
... the rest of this should be a copy of port 23
ENDTELNETPARMS
BEGINVTAM
�4� PORT 2023
LUGROUP DBGTOOL
�5b� TRMLU001..TRMLU020
ENDLUGROUP
IPGROUP EVERYONE
�5c� 0.0.0.0:0.0.0.0
ENDIPGROUP
�5f1�DEFAULTAPPL NVAS FIRSTONLY
�5d�LUMAP DBGTOOL EVERYONE KEEPOPEN
�5e�ALLOWAPPL EQAMV*
ENDVTAM
36 Debug Tool V7.1 Customization Guide
|
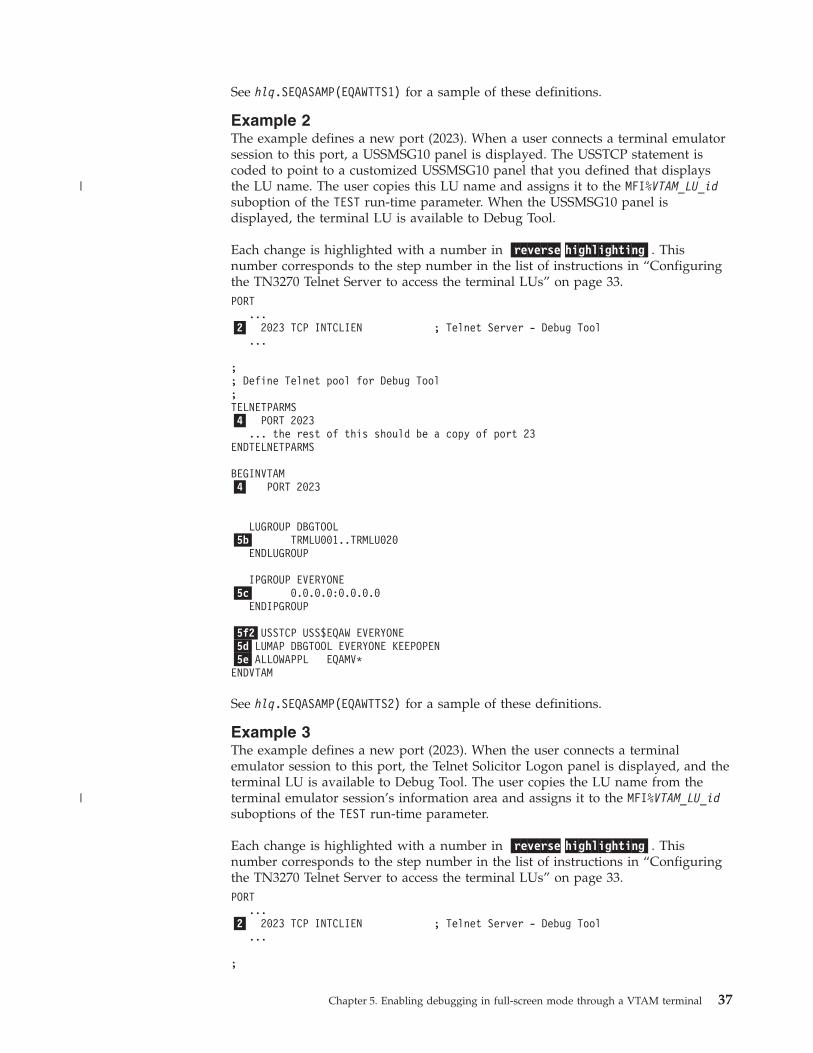
See hlq.SEQASAMP(EQAWTTS1) for a sample of these definitions.
Example 2
The example defines a new port (2023). When a user connects a terminal emulator
session to this port, a USSMSG10 panel is displayed. The USSTCP statement is
coded to point to a customized USSMSG10 panel that you defined that displays
the LU name. The user copies this LU name and assigns it to the MFI%VTAM_LU_id
suboption of the TEST run-time parameter. When the USSMSG10 panel is
displayed, the terminal LU is available to Debug Tool.
Each change is highlighted with a number in �reverse highlighting�. This
number corresponds to the step number in the list of instructions in “Configuring
the TN3270 Telnet Server to access the terminal LUs” on page 33.
PORT
...
�2� 2023 TCP INTCLIEN ; Telnet Server - Debug Tool
...
;
; Define Telnet pool for Debug Tool
;
TELNETPARMS
�4� PORT 2023
... the rest of this should be a copy of port 23
ENDTELNETPARMS
BEGINVTAM
�4� PORT 2023
LUGROUP DBGTOOL
�5b� TRMLU001..TRMLU020
ENDLUGROUP
IPGROUP EVERYONE
�5c� 0.0.0.0:0.0.0.0
ENDIPGROUP
�5f2�USSTCP USS$EQAW EVERYONE
�5d�LUMAP DBGTOOL EVERYONE KEEPOPEN
�5e�ALLOWAPPL EQAMV*
ENDVTAM
See hlq.SEQASAMP(EQAWTTS2) for a sample of these definitions.
Example 3
The example defines a new port (2023). When the user connects a terminal
emulator session to this port, the Telnet Solicitor Logon panel is displayed, and the
terminal LU is available to Debug Tool. The user copies the LU name from the
terminal emulator session’s information area and assigns it to the MFI%VTAM_LU_id
suboptions of the TEST run-time parameter.
Each change is highlighted with a number in �reverse highlighting�. This
number corresponds to the step number in the list of instructions in “Configuring
the TN3270 Telnet Server to access the terminal LUs” on page 33.
PORT
...
�2� 2023 TCP INTCLIEN ; Telnet Server - Debug Tool
...
;
Chapter 5. Enabling debugging in full-screen mode through a VTAM terminal 37
|
|
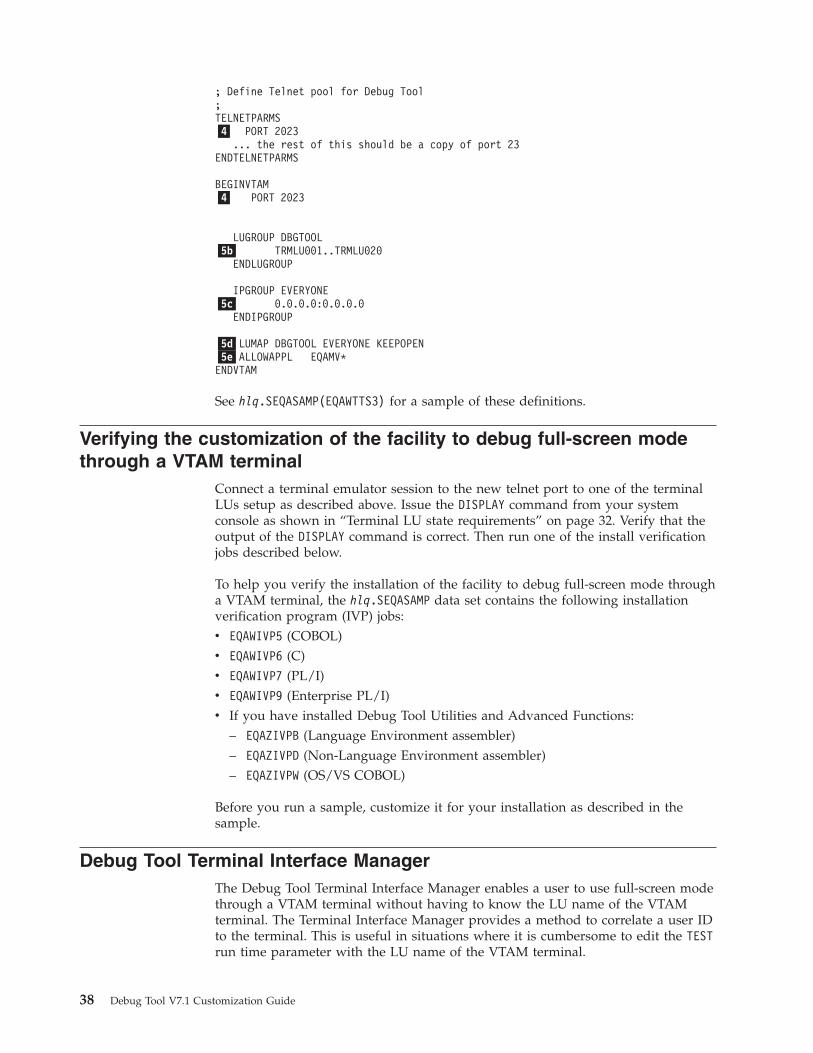
; Define Telnet pool for Debug Tool
;
TELNETPARMS
�4� PORT 2023
... the rest of this should be a copy of port 23
ENDTELNETPARMS
BEGINVTAM
�4� PORT 2023
LUGROUP DBGTOOL
�5b� TRMLU001..TRMLU020
ENDLUGROUP
IPGROUP EVERYONE
�5c� 0.0.0.0:0.0.0.0
ENDIPGROUP
�5d�LUMAP DBGTOOL EVERYONE KEEPOPEN
�5e�ALLOWAPPL EQAMV*
ENDVTAM
See hlq.SEQASAMP(EQAWTTS3) for a sample of these definitions.
Verifying the customization of the facility to debug full-screen mode
through a VTAM terminal
Connect a terminal emulator session to the new telnet port to one of the terminal
LUs setup as described above. Issue the DISPLAY command from your system
console as shown in “Terminal LU state requirements” on page 32. Verify that the
output of the DISPLAY command is correct. Then run one of the install verification
jobs described below.
To help you verify the installation of the facility to debug full-screen mode through
a VTAM terminal, the hlq.SEQASAMP data set contains the following installation
verification program (IVP) jobs:
v EQAWIVP5 (COBOL)
v EQAWIVP6 (C)
v EQAWIVP7 (PL/I)
v EQAWIVP9 (Enterprise PL/I)
v If you have installed Debug Tool Utilities and Advanced Functions:
– EQAZIVPB (Language Environment assembler)
– EQAZIVPD (Non-Language Environment assembler)
– EQAZIVPW (OS/VS COBOL)
Before you run a sample, customize it for your installation as described in the
sample.
Debug Tool Terminal Interface Manager
The Debug Tool Terminal Interface Manager enables a user to use full-screen mode
through a VTAM terminal without having to know the LU name of the VTAM
terminal. The Terminal Interface Manager provides a method to correlate a user ID
to the terminal. This is useful in situations where it is cumbersome to edit the TEST
run time parameter with the LU name of the VTAM terminal.
38 Debug Tool V7.1 Customization Guide
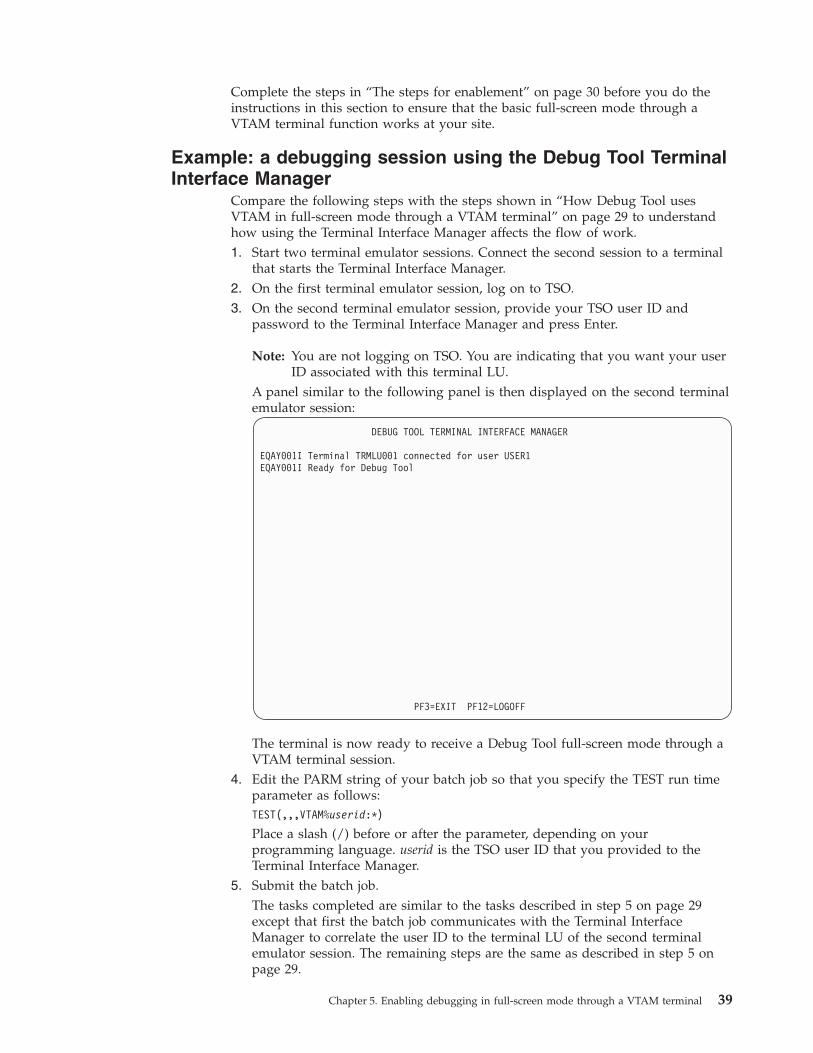
Complete the steps in “The steps for enablement” on page 30 before you do the
instructions in this section to ensure that the basic full-screen mode through a
VTAM terminal function works at your site.
Example: a debugging session using the Debug Tool Terminal
Interface Manager
Compare the following steps with the steps shown in “How Debug Tool uses
VTAM in full-screen mode through a VTAM terminal” on page 29 to understand
how using the Terminal Interface Manager affects the flow of work.
1. Start two terminal emulator sessions. Connect the second session to a terminal
that starts the Terminal Interface Manager.
2. On the first terminal emulator session, log on to TSO.
3. On the second terminal emulator session, provide your TSO user ID and
password to the Terminal Interface Manager and press Enter.
Note: You are not logging on TSO. You are indicating that you want your user
ID associated with this terminal LU.
A panel similar to the following panel is then displayed on the second terminal
emulator session:
DEBUG TOOL TERMINAL INTERFACE MANAGER
EQAY001I Terminal TRMLU001 connected for user USER1
EQAY001I Ready for Debug Tool
PF3=EXIT PF12=LOGOFF
The terminal is now ready to receive a Debug Tool full-screen mode through a
VTAM terminal session.
4. Edit the PARM string of your batch job so that you specify the TEST run time
parameter as follows:
TEST(,,,VTAM%userid:*)
Place a slash (/) before or after the parameter, depending on your
programming language. userid is the TSO user ID that you provided to the
Terminal Interface Manager.
5. Submit the batch job.
The tasks completed are similar to the tasks described in step 5 on page 29
except that first the batch job communicates with the Terminal Interface
Manager to correlate the user ID to the terminal LU of the second terminal
emulator session. The remaining steps are the same as described in step 5 on
page 29.
Chapter 5. Enabling debugging in full-screen mode through a VTAM terminal 39
6. On the second terminal emulator session, a full-screen mode debugging session
is displayed. Interact with it the same way you would with any other
full-screen mode debugging session.
7. After you exit Debug Tool, the second terminal emulator session displays the
panel and messages you saw in step 3 on page 39. This indicates that Debug
Tool can use this session again. (this will happen each time you exit from
Debug Tool).
8. If you want to start another debugging session, return to step 5 on page 39. If
you are finished debugging, you can do one of the following tasks:
v Close the second terminal emulator session.
v Exit the Terminal Interface Manager by choosing one of the following
options:
– Press PF12 to display the Terminal Interface Manager logon panel. You
can log in with the same ID or a different user ID.
– Press PF3 to exit the Terminal Interface Manager.
The steps for enablement
To enable full-screen mode through a VTAM terminal with Debug Tool Terminal
Interface Manager, do the following steps:
1. Define the VTAM minor node as described in “Defining the Terminal Interface
Manager VTAM minor node.”
2. Start the Debug Tool Terminal Interface Manager as described in “Starting the
Debug Tool Terminal Interface Manager” on page 41.
3. Configure the Telnet Server as described in “Configuring the TN3270 Telnet
Server to access the Terminal Interface Manager” on page 41.
4. Verify that the customizations are completed correctly by following the steps in
“Verifying the customization of the Terminal Interface Manager” on page 41.
Defining the Terminal Interface Manager VTAM minor node
You must define the VTAM minor node that the Terminal Interface Manager will
use for its conversations. To define the VTAM minor node, do the following steps:
1. Define the minor node as shown in the EQAWSESS member in the
hlq.SEQASAMP data set by doing one of the following:
v Copy EQAWSESS into a new member:
a. Create a new member in the VTAM definitions library (VTAMLST). The
VTAM definitions library is often stored in the data set SYS1.VTAMLST.
b. Copy the contents of the EQAWSESS member into the new member.
c. Add the new member’s name to the VTAM start options configuration
file, ATCCONxx.v Copy EQAWSESS into an existing member:
a. Select a member in the VTAM definitions library (VTAMLST) that contains
the major node definitions.
b. Copy the minor node name definition (APPL statement) for Debug Tool
from the EQAWSESS member into the selected member.
To activate the new definitions, enter the following command from the console:
VARY NET,ACT,ID=member-name
member-name is the member name in the VTAM definitions library.
40 Debug Tool V7.1 Customization Guide
Starting the Debug Tool Terminal Interface Manager
The Debug Tool Terminal Interface Manager is a VTAM application that must be
started (following the start of VTAM itself) before users can access it. Follow these
steps to start it:
1. Copy the EQAYSESM member of the data set hlq.SEQASAMP to the SYS1.PROCLIB
data set, making any changes required by your installation.
2. Make sure that the Debug Tool Terminal Inteface manager load module,
EQAYSESM, resides in an APF authorized library (this module can be found in
the hlq.SEQAAUTH data set). This is required to allow access to functions to
validate users by TSO user ID and password.
3. Start the Debug Tool Terminal Interface Manager using the START command
from the console. The START command can be added to the COMMNDxx
member of SYS1.PARMLIB to start the Debug Tool Terminal Interface Manager
when the system is IPLed.
Configuring the TN3270 Telnet Server to access the Terminal
Interface Manager
Select an additional unused port (for example, 2024) and then implement “Example
1” on page 36 with the following changes:
v Specify port 2024 instead of 2023 (3 times)
v Specify the following value for the DEFAULTAPPL statement:
DEFAULTAPPL EQASESSM FIRSTONLY
v Make the following change on the ALLOWAPPL statement:
ALLOWAPPL EQA*
Instruct TCP/IP to use this additional definition, as described on page 35.
After you make these changes, your users can set up a unique terminal emulator
session that connects to this new port, and debug programs that require the use of
full-screen mode through a VTAM terminal with the Debug Tool Terminal Interface
Manager. The user does the following steps:
1. Starts a terminal emulator session that connects to this new port. The Debug
Tool Terminal Interface Manager is displayed.
2. The user enters his user ID and password and then presses Enter. A Telnet
Solicitor Logon panel is displayed. The terminal is now ready to receive a
Debug Tool full-screen mode through a VTAM terminal session.
3. On another terminal emulator session, the user starts his program with the TEST
run-time option and specifies the VTAM%userid suboption. The terminal
emulator session connected to this new port displays a full-screen mode
through a VTAM terminal session.
Verifying the customization of the Terminal Interface Manager
Do the following steps to verify the installation and customization:
1. Start a terminal emulator session that starts the Terminal Interface Manager.
Enter your user ID and password and then press Enter.
2. On your other terminal emulator session, select the same IVP as you used
above, change the run time parameter string fromMFI%VTAM_LU_id:* to
VTAM%userid:*, submit the job and then follow the rest of the instructions in the
IVP.
Chapter 5. Enabling debugging in full-screen mode through a VTAM terminal 41
|

42 Debug Tool V7.1 Customization Guide
Chapter 6. Enabling the EQAUEDAT user exit
The EQAUEDAT user exit enables the library administrator or system programmer
to direct Debug Tool to the location where source, listing, or separate debug files
are stored. If your site policy is to control the location of these files, this user exit
supports this policy by allowing your application programmers to debug their
programs without knowing where these files are located.
This sample is designed to operate only under the Language Environment. If you
require an exit to run at any time in a non-Language Environment environment,
you must replace the CEEENTRY and CEEEXIT macro invocations with the proper
prologue and epilogue code for your environments. If Debug Tool detects a
Language Environment-enabled EQAUEDAT when the Language Environment is not
active, the exit will not be started.
To enable this user exit, do the following steps:
1. Copy the EQAUEDAT member from the hlq.SEQASAMP library to a private library.
2. Edit the copy, as instructed in the member. Write the logic required to
implement your site policy.
3. Submit the JCL.
4. Add the private library where the generated EQAUEDAT load module is located to
the load module search path for the application that you are debugging and for
which you want this site policy enabled, in front of hlq.SEQAMOD.
© Copyright IBM Corp. 1992, 2006 43

44 Debug Tool V7.1 Customization Guide
Chapter 7. Adding support for debugging under CICS
To debug applications that run in CICS, Debug Tool requires the following:
v Language Environment. Refer to the Language Environment installation and
customization information for more information.
v Do the steps described in this chapter.
Note: You can use DTCN or CADP to add support for debugging, depending on
the version of CICS:
v CICS version 2.2 or earlier: you must use DTCN.
v CICS version 2.3 or later: either DTCN or CADP.
To add Debug Tool support for CICS applications:
1. Verify that the current Debug Tool resources are defined in the CICS CSD and
installed in the CICS region. The CICS definitions are in the EQACCSD and
EQACDCT members of the hlq.SEQASAMP data set.
a. If your site policy is to define the Transient Data queues by using DCT
macro definitions, add the definitions in the EQACDCT member to your
DCT and reassemble it.
If your site uses COBOL or PL/I separate debug files, follow the
instructions in EQACDCT to define the appropriate queues to CICS.
b. Add the Debug Tool definitions to the CICS CSD. These definitions are
specified in the group EQA, which is in the EQACCSD member. Follow
the directions at the beginning of EQACCSD. After making all of the
required changes, run the job to add the definitions to CICS. 2. Update the JCL that starts CICS:
a. Include Debug Tool’s hlq.SEQAMOD data set and the Language Environment
run-time libraries (SCEECICS, SCEERUN, and, if required by your applications,
SCEERUN2) in the DFHRPL concatenation. The DFHRPL concatenation is in the
CICS region start-up JCL.
b. Remove any data sets from the concatenation that refer to old releases of
Debug Tool.
c. Include EQA00DYN and EQA00HFS from Debug Tool’s hlq.SEQAMOD data set in
the STEPLIB concatenation by either of the following ways:
v Use the Authorized Program Facility (APF) to authorize2 the
hlq.SEQAMOD data set and add the data set to the STEPLIB concatenation.
v Copy4 the EQA00DYN and EQA00HFS modules from the hlq.SEQAMOD data
set to a library that is already in the STEPLIB concatenation.d. Ensure that no DD statements exist for CINSPIN, CINSPLS, CINSPOT,
IBMDBGIN, or IGZDBGIN. 3. For any terminal that Debug Tool uses to display a debugging session, verify
that the CICS TYPETERM definition for that terminal specifies a minimum
value of 4096 for the RECEIVESIZE parameter or sets the BUILDCHAIN parameter
to YES.
4. Verify that users can run the CDT# transaction without receiving any errors.
If the CDT# transaction runs successfully, no messages are displayed. You
might see X-SYSTEM after you press Enter. This disappears when the
transaction finishes and the keyboard unlocks.
© Copyright IBM Corp. 1992, 2006 45
|
5. If you are running your CICS programs in a multi-region CICS environment:
a. Define the DTCN transaction name the same across all local and remote
systems. If the DTCN transaction name is changed, or if a DTCN
transaction is duplicated and given a different name, change the name on
all systems.
b. If a debugging session might run in a region that is different from the one
where DTCN or CADP was used to save the debugging profile, use the
PLTPI program EQA0CPLT in conjunction with the CICS start up
parameter INITPARM=(EQA0CPLT=’NWP’).
c. If you are using DTCN, ensure that the region shares the EQADTCN2
temporary storage queue (TSQ). See “Sharing DTCN repository profile
items among CICS systems” on page 49 for more information on defining
the region that owns EQADTCN2. The most common multi-region
debugging scenario is where the EQADTCN2 temporary storage queue is
shared and DTCN runs in the TOR while the application to be debugged is
transaction routed to an AOR.
One of two methods must be used in this case to start Debug Tool’s new
program support in the AOR. Either use EQA0CPLT to enable this support
when the region starts (see step 9 on page 47 for information about
EQA0CPLT), or use the Debug Tool DTCP transaction to start or stop this
support as needed. In the AOR, enter DTCPO on a clear CICS screen to
activate this support and enter DTCPF to deactivate it. You can activate
and deactivate this support multiple times.
d. If you are using CADP for debugging profiles, set the startup parameter
DEBUGTOOL=YES for any region where a Debug Tool session could start.
This parameter activates the Debug Tool new program support. 6. If users need to debug Enterprise PL/I for z/OS, Version 3 Release 4 (or later),
applications under CICS:
a. Install the following co-requisites:
v The PTF for the Language Environment run time APAR PK03093, which
is available for z/OS Version 1 Release 3 through Version 1 Release 6.
v The PTF for the Enterprise PL/I for z/OS, Version 3 Release 4, compiler
APAR PK03264.
Users can begin a debug session by using DTCN or CADP at either of the
following points:
v The entry to programs invoked by EXEC CICS LINK or XCTL.
v The entry to any program, even if it is a nested program within a
composite load module, invoked as a static or dynamic CALL.b. To enable users to start debug sessions with CADP, use PLTPI program
EQA0CPLT in conjunction with the CICS start up parameter
INITPARM=(EQA0CPLT=’NWP’). See step 9 on page 47 for information about
EQA0CPLT. 7. If you are planning to debug command-level assembler application programs
that do not run under or use Language Environment services, activate the
CICS non-Language Environment exits as described in “Activating CICS
non-Language Environment exits” on page 48.
8. If your CICS region is started with the SEC parameter set to YES and the
XCMD parameter is set to YES to activate command security, review the
access settings for the following resources:
EXITPROGRAM
Do one of the following options:
46 Debug Tool V7.1 Customization Guide
v Verify that Debug Tool users have UPDATE authority to the
EXITPROGRAM resource so that they can run EXEC CICS ENABLE
PROGRAM EXIT, DISABLE PROGRAM EXIT, and EXTRACT EXIT.
v Activate Debug Tool’s single-terminal mode screen stacking user exits
during CICS start up by doing the following:
a. Verify that the user ID that runs the CICS region has UPDATE
access to the EXITPROGRAM resource.
b. Add the program EQA0CPLT to your Program List Table (PLTPI).
c. Add INITPARM=(EQA0CPLT=’STK’) to your CICS startup parameters.
See step 9 for instructions on using EQA0CPLT.
TDQUEUE
Verify that all users have UPDATE authority to the TDQUEUE resource,
so that they can run EXEC CICS INQUIRE and EXEC CICS SET
TDQUEUE.
PROGRAM
Verify that all users have READ authority to the PROGRAM resource, so
that they can run EXEC CICS INQUIRE PROGRAM.For more information about the CICS security features, see CICS RACF
Security Guide.
9. (Optional) Set up the CICS PLTPI program called EQA0CPLT:
a. Add the program EQA0CPLT to your Program List Table (PLTPI).
EQA0CPLT initializes parts of Debug Tool during CICS startup as
indicated by a CICS INITPARM system initialization parameter. Run
EQA0CPLT as a Stage 2 or Stage 3 PLTPI program. The following sample
PLT includes EQA0CPLT:
TITLE ’DFHPLTXX - IBM Debug Tool CICS Sample PLT’
DFHPLT TYPE=INITIAL,SUFFIX=XX
*
DFHPLT TYPE=ENTRY,PROGRAM=DFHDELIM
DFHPLT TYPE=ENTRY,PROGRAM=EQA0CPLT
*
DFHPLT TYPE=FINAL END DFHPLTBA
b. Add the INITPARM keyword to the CICS startup parameters. Multiple
parameters can be passed to EQA0CPLT in the same INITPARM. The
following common parameters can be used:
NLE
Non-Language Environment support. See “Activating CICS
non-Language Environment exits” on page 48.
STK
Screen stack exits. This parameter is required if you are using
command security.
NWP
New program support. This parameter is required if you are using
multi-regions or Enterprise PL/I Version 3 Release 4 (or later) with
CADP.For example, to activate the non-Language Environment support, screen
stack exits, and new program support (multi-region and Enterprise PL/I
Version 3 Release 4 with CADP) in a single INITPARM, add the following
to your CICS startup parameters:
INITPARM=(EQA0CPLT=’NLE,STK,NWP’)
Any combination of these three can be coded on the same INITPARM.
Chapter 7. Adding support for debugging under CICS 47
10. If the users use COBOL or PL/I separate debug files, verify that the users
specify the following attributes for the PDS or PDSE that contains the separate
debug files:
v RECFM=FB
v LRECL=1024
v BLKSIZE set so that the system determines the optimal size
Important: Users must allocate files with the correct attributes to optimize the
performance of Debug Tool.
11. (Optional) Increase the DSALIM and EDSALIM sizes in your CICS region so
that Debug Tool functions properly with multiple concurrent users. The
amount of increase is based on the current workload in the CICS region.
Recommendation: Increase the sizes of SALIM and EDSALIM in increments
of 5% or 10%. Monitor the storage in the region as Debug
Tool users are debugging for the highest amount of storage
that is used at any one point.
See the Debug Tool User’s Guide for information about how to debug CICS
programs.
Activating CICS non-Language Environment exits
To debug non-Language Environment assembler programs or OS/VS COBOL
programs that run under CICS, you must start the required Debug Tool global user
exits before you start the programs. Debug Tool provides the following global user
exits to help you debug non-Language Environment applications: XPCFTCH,
XEIIN, XEIOUT, XPCTA, and XPCHAIR. The exits can be started by using either
the DTCX transaction (provided by Debug Tool), or using a PLTPI program that
runs during CICS region startup
DTCX: You can turn the exits on and off by using the transaction DTCX. To
activate all of the exits, from a clear CICS terminal screen enter DTCXXO. To
deactivate all of the exits, enter DTCXXF. You need to activate the exits only once.
If you deactivate the exits and then want to debug a non-Language Environment
assembler program, you need to enter DTCXXO from a clear CICS terminal screen
to activate the exits.
After you enter DTCXXO, a series of messages are displayed on your screen. If all
exits are activated successfully, the following messages are displayed:
EQA9972I - DT XPCFTCH CICS exit now ON.
EQA9972I - DT XEIIN exit now ON.
EQA9972I - DT XEIOUT exit now ON.
EQA9972I - DT XPCTA exit now ON.
EQA9972I - DT XPCHAIR exit now ON.
EQA9970I - CICS exit activation successful.
When you enter DTCXXF, the following messages are displayed:
EQA9973I - DT XPCFTCH CICS exit now OFF.
EQA9973I - DT XEIIN exit now OFF.
EQA9973I - DT XEIOUT exit now OFF.
EQA9973I - DT XPCTA exit now OFF.
EQA9973I - DT XPCHAIR exit now OFF.
EQA9971I - CICS exit deactivation successful.
48 Debug Tool V7.1 Customization Guide
If there is a problem starting or activating one of the exits, an error message like
the following is displayed:
EQA9974I Error enabling XPCFTCH - EQANCFTC
If you see this error message, verify that the CICS CSD is properly updated to
include the latest Debug Tool resource definitions, and that the Debug Tool
SEQAMOD data is in the DFHRPL DD concatenation for the CICS region.
You can start the exits during region initialization by using a sequential terminal or
any other mechanism that runs transactions during CICS startup. You are not
required to shut down the exits prior to or during a region shutdown.
PLT: The non-Language Environment exits can also be activated during CICS
region initialization by using the CICS Program List Table (PLTPI) program
EQA0CPLT (supplied by Debug Tool). In addition to adding EQA0CPLT to your
CICS region PLT, you must specify the CICS startup parameter
INITPARM=(EQA0CPLT=’NLE’). EQA0CPLT supercedes the function provided earlier
by PLTPI program EQANCPLT. See step 9 on page 47 for instructions on using
EQA0CPLT. For more information on PLT processing, see the CICS Resource
Definition Guide.
Sharing DTCN repository profile items among CICS systems
The DTCN debug profile repository is a CICS temporary storage queue called
EQADTCN2. If you want to share the repository among CICS systems (for
example, MRO), designate a single CICS region as the queue-owning region and
define the queue as REMOTE in a TSMODEL resource definition (or temporary
storage table) on regions that need to access it remotely. This makes the queue
profile items owned by one CICS system accessible to other CICS systems.
The following sample resource definition shows how to define the Debug Tool
EQADTCN2 temporary storage queue in a region that will use it remotely. To
optimize the performance of Debug Tool, it is important that you define this queue
as Location MAIN.
CEDA View TSmodel( DTCN1 )
TSmodel ==> DTCN1
Group ==> DTCNREM
Description ==> TEST DTCN TSQ REMOTE
PRefix ==> EQADTCN2
XPrefix ==>
Location ==> Main Auxiliary | Main
RECOVERY ATTRIBUTES
RECovery ==> No No | Yes
SECURITY ATTRIBUTES
Security ==> No No | Yes
SHARED ATTRIBUTES
POolname ==>
REMOTE ATTRIBUTES
REMOTESystem ==> P6
REMOTEPrefix ==> EQADTCN2
XRemotepfx ==>
Group ==>
For details on defining a TSMODEL resource, see CICS Resource Definition Guide.
Chapter 7. Adding support for debugging under CICS 49
Requiring users to specify resource types
If your users use DTCN to specify debugging profiles, you can customize Debug
Tool to require that your users specify some or all resource types. For example, if
your users are debugging a heavily used CICS program, you can require that they
specify a Terminal ID and a Transaction ID to avoid having Debug Tool started
every time that CICS program is run.
To make this customization, do the following steps:
1. Copy the EQAOPTS member from the hlq.SEQASAMP library to a private library.
2. Edit this copy of EQAOPTS and code an EQAXOPT macro invocation to
indicate which resource types you want to require. In the following example,
DTCN users are forced to specify a User ID and a Program ID:
EQAXOPT DTCNFORCEUSERID,YES
EQAXOPT DTCNFORCEPROGID,YES
See the EQAXOPT member of the hlq.SEQASAMP data set for the complete
syntax of the macro invocation.
3. Follow the directions in EQAOPTS to generate a new EQAOPTS load module.
4. Place the EQAOPTS load module in a private data set that is in the load
module search path and appears before hlq.SEQAMOD.
Overriding the default number of program elements held in cache
To reduce CPU consumption when running under CICS, Debug Tool uses a cache
to store information about the application programs being debugged by a task. By
default, for each debug session, Debug Tool stores the information for a maximum
of 10 programs. Application programs that do a LINK or XCTL to more than 10
programs can degrade Debug Tool's CPU performance. You can enhance Debug
Tool's CPU performance for these application programs by specifying an increased
CACHENUM value in EQAOPTS. An increased value causes Debug Tool to use
more storage for each debugged task.
To make this customization, do the following steps:
1. Copy the EQAOPTS member from the hlq.SEQASAMP library to a private library.
2. Edit this copy of EQAOPTS and code an EQAXOPT macro invocation to set a
new cache number value. In the following example, 15 is the new cache
number:
EQAXOPT CACHENUM,15
See the EQAXOPT member of the hlq.SEQASAMP data set for the complete
syntax of the macro invocation.
3. Follow the directions in EQAOPTS to generate a new EQAOPTS load module.
4. Place the EQAOPTS load module in a private data set that is in the load
module search path and appears before hlq.SEQAMOD.
Enabling communication between Debug Tool and a remote debugger
If you use a remote debugger, Debug Tool communicates with the remote
debugger by using TCP/IP sockets.
If you have CICS Transaction Server for z/OS Version 2 Release 3 or later, you
must start the CICS Sockets Domain and install the DFHSO group:
50 Debug Tool V7.1 Customization Guide
|
||||||||
|
|
|||
|
||
|
||
v To start the Sockets Domain, ensure that the CICS system initialization
parameter TCPIP is set to YES. For more information about the CICS system
initialization parameters, see the CICS System Definition Guide.
v Install the IBM-supplied group DFHSO, which contains the resource definitions
for External sockets support. For information on installing this group, see the
CICS Migration Guide
If you have an earlier version of CICS, Debug Tool uses the TCP/IP Socket
Interface for CICS feature of TCP/IP for MVS. For instructions on activating this
feature, see z/OS Communications Server IP CICS Sockets Guide Version 1 Release 4
Document Number, SC31-8807-01.
You can use EZAC, a TCP/IP-supplied CICS transaction, to inquire about the
status of TCP/IP connections in the CICS region. EZAC,DISPLAY,LISTENER provides
information about the TCP/IP listener task that needs to be running.
EZAC,DISPLAY,CICS displays information about the CICS-TCP/IP configuration.
Enabling the CADP transaction
Beginning with CICS Transaction Server for z/OS Version 2 Release 3, you can use
the debugging profiles created by the application debugging profile manager
(CADP transaction) with Debug Tool. Set the DEBUGTOOL system initialization
parameter to YES to indicate that Debug Tool must use debugging profiles created
by the CADP transaction. With the DEBUGTOOL system initialization parameter
set to YES, you cannot use DTCN to define debugging profiles.
The default setting of DEBUGTOOL=NO indicates that Debug Tool will not use
CADP profiles and will use DTCN-defined profiles. With DEBUGTOOL=NO, you
can use CADP to update or add debugging profiles, but these profiles will not be
used by Debug Tool.
You can dynamically switch between the CADP and DTCN debug profiles that are
used by Debug Tool. After the CICS region is started, enter CEMT SET DEBUG to have
CADP profiles used and CEMT SET NODEBUG to have DTCN profiles used.
Running multiple debuggers in a CICS region
Coexistence with other debuggers cannot be guaranteed since situations can occur
where multiple debuggers might contend for use of storage, facilities and interfaces
which are intended for only one requester.
It is suggested that if you must have multiple debuggers installed in a CICS
region, then only one should be active at any given time. When another debugger
is used, ensure that the Debug Tool CICS non-Language Environment user exits
are deactivated and that there are no active CADP or DTCN profiles in the region.
The user exits can be deactivated by issuing the DTCXXF transaction. To deactivate
other debuggers, please consult the documentation provided by the vendor of the
other debuggers.
Running the installation verification programs
To help you verify that your CICS region has been customized properly for Debug
Tool, the hlq.SEQASAMP data set contains installation verification programs (IVPs) in
the following members. Run the IVPs that are appropriate for the tasks that your
users will be performing.
Chapter 7. Adding support for debugging under CICS 51
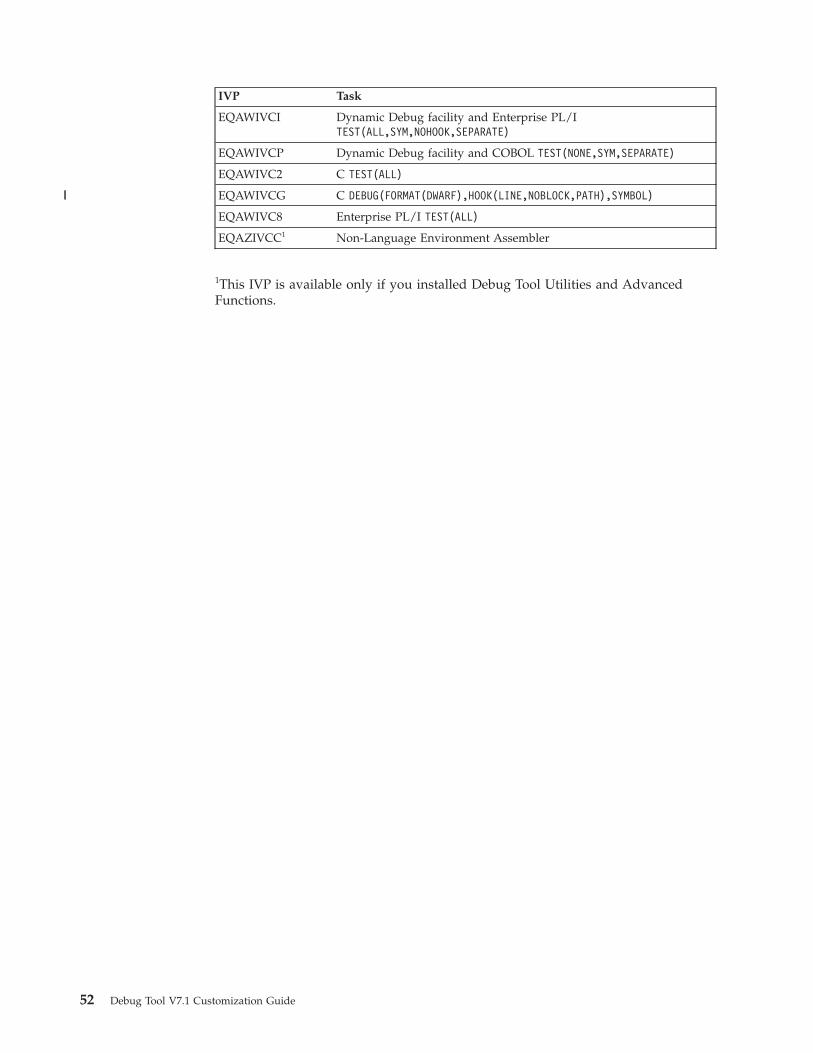
IVP Task
EQAWIVCI Dynamic Debug facility and Enterprise PL/I
TEST(ALL,SYM,NOHOOK,SEPARATE)
EQAWIVCP Dynamic Debug facility and COBOL TEST(NONE,SYM,SEPARATE)
EQAWIVC2 C TEST(ALL)
EQAWIVCG C DEBUG(FORMAT(DWARF),HOOK(LINE,NOBLOCK,PATH),SYMBOL)
EQAWIVC8 Enterprise PL/I TEST(ALL)
EQAZIVCC1 Non-Language Environment Assembler
1This IVP is available only if you installed Debug Tool Utilities and Advanced
Functions.
52 Debug Tool V7.1 Customization Guide
||
Chapter 8. Adding support for debugging under IMS
To debug applications that run in IMS, Debug Tool requires the following:
v Language Environment. Refer to the Language Environment installation and
customization information for more information.
v Do the steps described in this chapter.
To add Debug Tool support for IMS applications, include the Debug Tool
hlq.SEQAMOD data set and the Language Environment run-time library in the
STEPLIB concatenation of your IMS region.
To give IMS users enough time to run and debug their applications, increase the
time-out limit in the message-processing region (MPR) region to 1440.
If you are running your IMS Transaction Manager program in IMS Version 8 and
you want to use Debug Tool Utilities to update TEST run-time options, ensure that
you do the instructions in “Configuring for IMS Version 8 or later” on page 27.
Adding support for non-Language Environment IMS MPPs
To add support that enables users to debug IMS MPPs that do not run in
Language Environment, do the following steps:
1. Copy the load modules EQANIAFE and EQANISET from the hlq.SEQAMOD data
set into the IMS.PGMLIB data set.
2. Define the following IMS transaction:
APPLCTN GPSB=EQANISET,PGMTYPE=TP,LANG=ASSEM HIDAM/OSAM
TRANSACT CODE=EQASET,MODE=SNGL, X
DCLWA=NO,EDIT=UC,INQ=(YES,NORECOV), X
MSGTYPE=(SNGLSEG,NONRESPONSE,1)
3. Add the application front end parameter APPLFE=EQANIAFE to the MPR start
up job.
4. Assign the EQASET transaction to a class served by the MPR that is started
with the APPLFE=EQANIAFE parameter.
© Copyright IBM Corp. 1992, 2006 53

54 Debug Tool V7.1 Customization Guide
Chapter 9. Enabling additional languages for some Debug
Tool components via EQACUIDF
The EQACUIDF member of hlq.SEQABMOD contains the default and allowable
values for the parameters NATLANG, LOCALE and LINECOUNT. These
parameters are used by the following Debug Tool and Debug Tool Utilities and
Advanced Functions components:
v Debug Tool Utilities ISPF dialog: NATLANG
v EQANMDBG (non-CICS non-LE support: NATLANG
v Debug Tool Coverage Utility: NATLANG, LOCALE, LINECOUNT
If you use these components, and have installed either of the additional language
features (Japanese or Korean), you must do the following steps to enable the user
to specify the additional language feature with the NATLANG parameter.
To change the language to Japanese or Korean:
1. Create a private SEQASAMP data set like hlq.SEQASAMP.
2. Create a private SEQABMOD data set like hlq.SEQABMOD.
3. Copy members EQACUIDF, EQACUIDM and EQACUIID from hlq.SEQASAMP
to your private SEQASAMP. Any edits that are described in this section are to
be done in the private SEQASAMP copies of these members.
4. Edit the EQACUIDM member and add each additional installed language
feature to the line starting with &ValLang(1), using JPN for Japanese, and KOR
for Korean. For example, adding Japanese would be done as follows:
&ValLang(1) SetC ’ENU’,’UEN’,’JPN’ Set valid languages
5. Edit the EQACUIDF member and add each additional installed language
feature after the following line:
UEN Language UEN
For example:
UEN Language UEN
JPN Language JPN
6. If you want to change the default value for NATLANG, edit the EQACUIDF
member and change the DfltLang value. For example, making JPN the default
for NATLANG would be as follows:
EQACUIDF InstDflt DfltLang=JPN, +
7. Assemble and link a new copy of EQACUIDF into the private SEQABMOD by
editing and submitting the JCL that is supplied in member EQACUIID.
8. Copy the EQACUIDF member from the private SEQABMOD into
hlq.SEQABMOD.
For more information, see “Changing the default and allowable values in
EQACUIDF (optional)” on page 7.
© Copyright IBM Corp. 1992, 2006 55

56 Debug Tool V7.1 Customization Guide
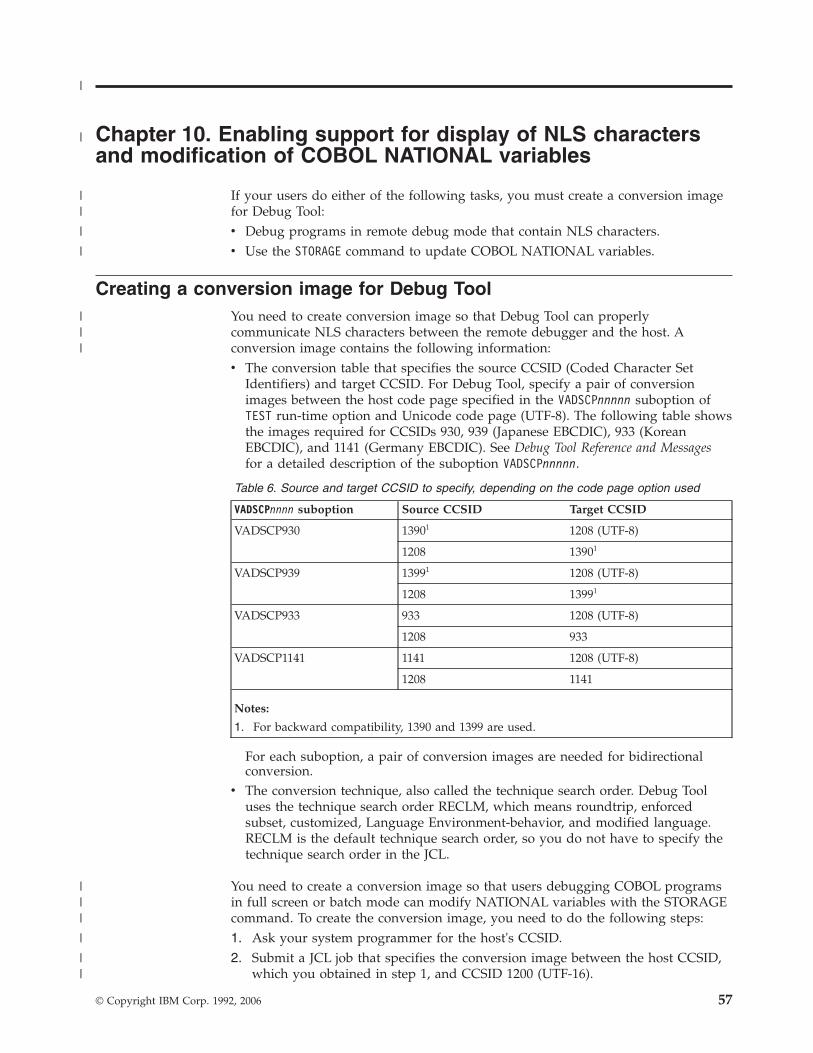
Chapter 10. Enabling support for display of NLS characters
and modification of COBOL NATIONAL variables
If your users do either of the following tasks, you must create a conversion image
for Debug Tool:
v Debug programs in remote debug mode that contain NLS characters.
v Use the STORAGE command to update COBOL NATIONAL variables.
Creating a conversion image for Debug Tool
You need to create conversion image so that Debug Tool can properly
communicate NLS characters between the remote debugger and the host. A
conversion image contains the following information:
v The conversion table that specifies the source CCSID (Coded Character Set
Identifiers) and target CCSID. For Debug Tool, specify a pair of conversion
images between the host code page specified in the VADSCPnnnnn suboption of
TEST run-time option and Unicode code page (UTF-8). The following table shows
the images required for CCSIDs 930, 939 (Japanese EBCDIC), 933 (Korean
EBCDIC), and 1141 (Germany EBCDIC). See Debug Tool Reference and Messages
for a detailed description of the suboption VADSCPnnnnn.
Table 6. Source and target CCSID to specify, depending on the code page option used
VADSCPnnnn suboption Source CCSID Target CCSID
VADSCP930 13901 1208 (UTF-8)
1208 13901
VADSCP939 13991 1208 (UTF-8)
1208 13991
VADSCP933 933 1208 (UTF-8)
1208 933
VADSCP1141 1141 1208 (UTF-8)
1208 1141
Notes:
1. For backward compatibility, 1390 and 1399 are used.
For each suboption, a pair of conversion images are needed for bidirectional
conversion.
v The conversion technique, also called the technique search order. Debug Tool
uses the technique search order RECLM, which means roundtrip, enforced
subset, customized, Language Environment-behavior, and modified language.
RECLM is the default technique search order, so you do not have to specify the
technique search order in the JCL.
You need to create a conversion image so that users debugging COBOL programs
in full screen or batch mode can modify NATIONAL variables with the STORAGE
command. To create the conversion image, you need to do the following steps:
1. Ask your system programmer for the host's CCSID.
2. Submit a JCL job that specifies the conversion image between the host CCSID,
which you obtained in step 1, and CCSID 1200 (UTF-16).
© Copyright IBM Corp. 1992, 2006 57
|
|
||
|
|
|||
|||
|
||
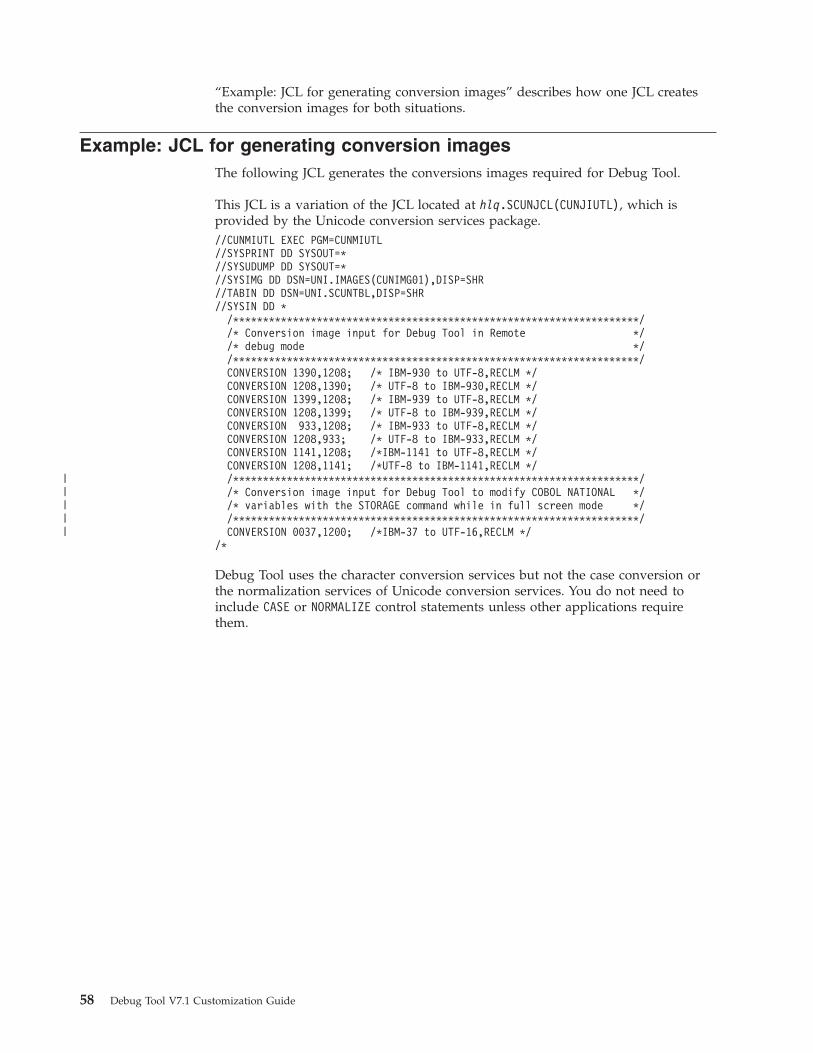
“Example: JCL for generating conversion images” describes how one JCL creates
the conversion images for both situations.
Example: JCL for generating conversion images
The following JCL generates the conversions images required for Debug Tool.
This JCL is a variation of the JCL located at hlq.SCUNJCL(CUNJIUTL), which is
provided by the Unicode conversion services package.
//CUNMIUTL EXEC PGM=CUNMIUTL
//SYSPRINT DD SYSOUT=*
//SYSUDUMP DD SYSOUT=*
//SYSIMG DD DSN=UNI.IMAGES(CUNIMG01),DISP=SHR
//TABIN DD DSN=UNI.SCUNTBL,DISP=SHR
//SYSIN DD *
/********************************************************************/
/* Conversion image input for Debug Tool in Remote */
/* debug mode */
/********************************************************************/
CONVERSION 1390,1208; /* IBM-930 to UTF-8,RECLM */
CONVERSION 1208,1390; /* UTF-8 to IBM-930,RECLM */
CONVERSION 1399,1208; /* IBM-939 to UTF-8,RECLM */
CONVERSION 1208,1399; /* UTF-8 to IBM-939,RECLM */
CONVERSION 933,1208; /* IBM-933 to UTF-8,RECLM */
CONVERSION 1208,933; /* UTF-8 to IBM-933,RECLM */
CONVERSION 1141,1208; /*IBM-1141 to UTF-8,RECLM */
CONVERSION 1208,1141; /*UTF-8 to IBM-1141,RECLM */
/********************************************************************/
/* Conversion image input for Debug Tool to modify COBOL NATIONAL */
/* variables with the STORAGE command while in full screen mode */
/********************************************************************/
CONVERSION 0037,1200; /*IBM-37 to UTF-16,RECLM */
/*
Debug Tool uses the character conversion services but not the case conversion or
the normalization services of Unicode conversion services. You do not need to
include CASE or NORMALIZE control statements unless other applications require
them.
58 Debug Tool V7.1 Customization Guide
|||||
Appendix A. Support information
If you have a problem with your IBM software, you want to resolve it quickly. This
section describes the following options for obtaining support for IBM software
products:
v “Searching knowledge bases”
v “Obtaining fixes”
v “Receiving weekly support updates” on page 60
v “Contacting IBM Software Support” on page 60
Searching knowledge bases
You can search the available knowledge bases to determine whether your problem
was already encountered and is already documented.
Searching the information center
IBM provides this documentation in an information center. You can use the search
function of the information center to query conceptual information, instructions for
completing tasks, and reference information.
Searching the Internet
If you cannot find an answer to your question in the information center, search the
Internet for the latest, most complete information that might help you resolve your
problem.
To search multiple Internet resources for your product, use the Web search topic in
your information center. In the navigation frame, click Troubleshooting and
support � Searching knowledge bases and select Web search. From this topic, you
can search a variety of resources, including the following:
v IBM technotes
v IBM downloads
v IBM Redbooks™
v IBM developerWorks®
v Forums and newsgroups
v Google
Obtaining fixes
A product fix might be available to resolve your problem. To determine what fixes
are available for your IBM software product, follow these steps:
1. Go to the IBM Software Support Web site at http://www.ibm.com/software/support.
2. Click Downloads and drivers in the Support topics section.
3. Select the Software category.
4. Select a product in the Sub-category list.
5. In the Find downloads and drivers by product section, select one software
category from the Category list.
6. Select one product from the Sub-category list.
© Copyright IBM Corp. 1992, 2006 59
7. Type more search terms in the Search within results if you want to refine your
search.
8. Click Search.
9. From the list of downloads returned by your search, click the name of a fix to
read the description of the fix and to optionally download the fix.
For more information about the types of fixes that are available, see the IBM
Software Support Handbook at http://techsupport.services.ibm.com/guides/handbook.html.
Receiving weekly support updates
To receive weekly e-mail notifications about fixes and other software support news,
follow these steps:
1. Go to the IBM Software Support Web site at http://www.ibm.com/software/support.
2. Click My support in the upper right corner of the page.
3. If you have already registered for My support, sign in and skip to the next
step. If you have not registered, click register now. Complete the registration
form using your e-mail address as your IBM ID and click Submit.
4. Click Edit profile.
5. In the Products list, select Software. A second list is displayed.
6. In the second list, select a product segment, for example, Application servers.
A third list is displayed.
7. In the third list, select a product sub-segment, for example, Distributed
Application & Web Servers. A list of applicable products is displayed.
8. Select the products for which you want to receive updates, for example, IBM
HTTP Server and WebSphere Application Server.
9. Click Add products.
10. After selecting all products that are of interest to you, click Subscribe to email
on the Edit profile tab.
11. Select Please send these documents by weekly email.
12. Update your e-mail address as needed.
13. In the Documents list, select Software.
14. Select the types of documents that you want to receive information about.
15. Click Update.
If you experience problems with the My support feature, you can obtain help in
one of the following ways:
Online
Send an e-mail message to [email protected], describing your problem.
By phone
Call 1-800-IBM-4You (1-800-426-4968).
Contacting IBM Software Support
IBM Software Support provides assistance with product defects.
60 Debug Tool V7.1 Customization Guide
Before contacting IBM Software Support, your company must have an active IBM
software maintenance contract, and you must be authorized to submit problems to
IBM. The type of software maintenance contract that you need depends on the
type of product you have:
v For IBM distributed software products (including, but not limited to, Tivoli®,
Lotus®, and Rational® products, as well as DB2 and WebSphere products that
run on Windows, or UNIX operating systems), enroll in Passport Advantage® in
one of the following ways:
Online
Go to the Passport Advantage Web site at http://www.lotus.com/services/passport.nsf/ WebDocs/Passport_Advantage_Home and click
How to Enroll.
By phone
For the phone number to call in your country, go to the IBM Software
Support Web site at http://techsupport.services.ibm.com/guides/contacts.html and click the name of your geographic region.
v For customers with Subscription and Support (S & S) contracts, go to the
Software Service Request Web site at https://techsupport.services.ibm.com/ssr/login.
v For customers with IBMLink™, CATIA, Linux, S/390®, iSeries™, pSeries®, zSeries,
and other support agreements, go to the IBM Support Line Web site at
http://www.ibm.com/services/us/index.wss/so/its/a1000030/dt006.
v For IBM eServer™ software products (including, but not limited to, DB2 and
WebSphere products that run in zSeries, pSeries, and iSeries environments), you
can purchase a software maintenance agreement by working directly with an
IBM sales representative or an IBM Business Partner. For more information
about support for eServer software products, go to the IBM Technical Support
Advantage Web site at http://www.ibm.com/servers/eserver/techsupport.html.
If you are not sure what type of software maintenance contract you need, call
1-800-IBMSERV (1-800-426-7378) in the United States. From other countries, go to
the contacts page of the IBM Software Support Handbook on the Web at
http://techsupport.services.ibm.com/guides/contacts.html and click the name of
your geographic region for phone numbers of people who provide support for
your location.
To contact IBM Software support, follow these steps:
1. “Determining the business impact”
2. “Describing problems and gathering information” on page 62
3. “Submitting problems” on page 62
Determining the business impact
When you report a problem to IBM, you are asked to supply a severity level.
Therefore, you need to understand and assess the business impact of the problem
that you are reporting. Use the following criteria:
Severity 1
The problem has a critical business impact. You are unable to use the
program, resulting in a critical impact on operations. This condition
requires an immediate solution.
Severity 2
The problem has a significant business impact. The program is usable, but
it is severely limited.
Appendix A. Support information 61
Severity 3
The problem has some business impact. The program is usable, but less
significant features (not critical to operations) are unavailable.
Severity 4
The problem has minimal business impact. The problem causes little impact
on operations, or a reasonable circumvention to the problem was
implemented.
Describing problems and gathering information
When describing a problem to IBM, be as specific as possible. Include all relevant
background information so that IBM Software Support specialists can help you
solve the problem efficiently. To save time, know the answers to these questions:
v What software versions were you running when the problem occurred?
v Do you have logs, traces, and messages that are related to the problem
symptoms? IBM Software Support is likely to ask for this information.
v Can you re-create the problem? If so, what steps were performed to re-create the
problem?
v Did you make any changes to the system? For example, did you make changes
to the hardware, operating system, networking software, and so on.
v Are you currently using a workaround for the problem? If so, be prepared to
explain the workaround when you report the problem.
Submitting problems
You can submit your problem to IBM Software Support in one of two ways:
Online
Click Submit and track problems on the IBM Software Support site
athttp://www.ibm.com/software/support/probsub.html. Type your
information into the appropriate problem submission form.
By phone
For the phone number to call in your country, go to the contacts page of
the IBM Software Support Handbook at http://techsupport.services.ibm.com/guides/contacts.html and click the name of your geographic region.
If the problem you submit is for a software defect or for missing or inaccurate
documentation, IBM Software Support creates an Authorized Program Analysis
Report (APAR). The APAR describes the problem in detail. Whenever possible,
IBM Software Support provides a workaround that you can implement until the
APAR is resolved and a fix is delivered. IBM publishes resolved APARs on the
Software Support Web site daily, so that other users who experience the same
problem can benefit from the same resolution.
62 Debug Tool V7.1 Customization Guide
Appendix B. Applying maintenance
Appendix A, “Support information,” on page 59 describes all the resources
available to obtain technical support information. Follow the steps in this section to
apply a service APAR or PTF.
Applying Service APAR or PTF
This chapter describes how to apply service updates to Debug Tool and (if
purchased) Debug Tool Utilities and Advanced Functions. To use the maintenance
procedures effectively, you must install the product or products by using SMP/E
before doing the maintenance procedures below.
What you receive
If you report a problem with Debug Tool to your IBM Support Center, you may
receive a tape containing one or more Authorized Program Analysis Reports
(APARs) or Program Temporary Fixes (PTFs) that were created to solve your
problem.
You may also receive a list of prerequisite APARs or PTFs, which you must apply
to your system before applying the current APAR. These prerequisite APARs or
PTFs might relate to Debug Tool or any other licensed product you have installed,
including z/OS or OS/390.
Checklist for applying an APAR or PTF
The following checklist describes the steps and associated SMP/E commands to
install the APAR or PTF:
__ Step 1. Prepare to install the APAR or PTF.
__ Step 2. Receive the APAR or PTF. (SMP/E RECEIVE)
__ Step 3. Review the HOLDDATA.
__ Step 4. Accept previously applied APARs or PTFs (optional). (SMP/E
ACCEPT)
__ Step 5. Apply APAR or PTF. (SMP/E APPLY)
__ Step 6. Run REPORT CROSSZONE and apply any missing requisites.
__ Step 7. Test APAR or PTF.
__ Step 8. Accept APAR or PTF. (SMP/E ACCEPT)
Step 1. Prepare to install APAR or PTF
Before you start to install an APAR or PTF, do the following:
1. Create a backup copy of the current Debug Tool libraries. Save this copy of
Debug Tool until you have completed installing the APAR or PTF, and you are
confident that the service runs correctly.
2. Research each service tape through the IBM Support Center for any errors or
additional information. Note all errors on the tape that were reported by
APARs or PTFs and apply the relevant fixes. You should also review the
current Preventive Service Planning (PSP) information.
© Copyright IBM Corp. 1992, 2006 63
Step 2. Receive the APAR or PTF
Receive the service using the SMP/E RECEIVE command from either the SMP/E
dialogs in ISPF, or using a batch job similar to EQAWRECV or EQAZRECV in
hlq.SEQASAMP.
Step 3. Review the HOLDDATA
Review the HOLDDATA summary reports for the APAR or PTF. Follow any
instructions described in the summary reports.
Step 4. Accept previously applied APAR or PTF (optional)
If there is any APAR or PTF which you applied earlier but did not accept, and the
earlier APAR or PTF is not causing problems in your installation, accept the
applied service from either the SMP/E dialogs in ISPF, or using a batch job similar
to EQAWACPT or EQAZACPT in hlq.SEQASAMP.
Accepting the earlier service allows you to use the SMP/E RESTORE command to
return to your current level if you encounter a problem with the service you are
currently applying. You can do this either from the SMP/E dialogs in ISPF, or
using a batch job.
Step 5. Apply the APAR or PTF
We recommend you first use the SMP/E APPLY command with the CHECK
operand. Check the output; if it shows no conflict, rerun the APPLY command
without the CHECK operand. This can be done from the SMP/E dialogs in ISPF or
using a batch job similar to EQAWAPLY or EQAZAPLY in hlq.SEQASAMP.
Step 6. Run REPORT CROSSZONE and apply any missing
requisites
Run an SMP/E REPORT CROSSZONE by using the SMP/E dialogs or by using a
batch job similar to EQAWRPXZ or EQAZRPXZ in hlq.SEQASAMP. Apply any
missing requisites found by SMP/E.
Step 7. Test the APAR or PTF
Thoroughly test your updated Debug Tool. Do not accept an APAR or PTF until
you are confident that it runs correctly.
Step 8. Accept the APAR or PTF
We recommend you first use the SMP/E ACCEPT command with the CHECK
operand. Check the output; if it shows no conflict, rerun the ACCEPT command
without the CHECK operand. You can do this either from the SMP/E dialogs in
ISPF, or using a batch job similar to EQAWACPT or EQAZACPT in hlq.SEQASAMP.
64 Debug Tool V7.1 Customization Guide
Appendix C. Accessibility
Accessibility features help a user who has a physical disability, such as restricted
mobility or limited vision, to use software products successfully. The accessibility
features in z/OS provide accessibility for Debug Tool.
The major accessibility features in z/OS enable users to:
v Use assistive technology products such as screen readers and screen magnifier
software
v Operate specific or equivalent features by using only the keyboard
v Customize display attributes such as color, contrast, and font size
Using assistive technologies
Assistive technology products work with the user interfaces that are found in
z/OS. For specific guidance information, consult the documentation for the
assistive technology product that you use to access z/OS interfaces.
Keyboard navigation of the user interface
Users can access z/OS user interfaces by using TSO/E or ISPF. Refer to z/OS
TSO/E Primer, z/OS TSO/E User’s Guide, and z/OS ISPF User’s Guide Volume 1 for
information about accessing TSO/E and ISPF interfaces. These guides describe
how to use TSO/E and ISPF, including the use of keyboard shortcuts or function
keys (PF keys). Each guide includes the default settings for the PF keys and
explains how to modify their functions.
Accessibility of this document
Information in the following formats of this document is accessible to visually
impaired individuals who use a screen reader:
v PDF format when viewed with Adobe Acrobat Reader 5.0 or later
v BookManager® format when viewed with IBM BookManager BookServer (except
for syntax diagrams)
Syntax diagrams start with the word Format or the word Fragments. Each diagram
is preceded by two images. For the first image, the screen reader will say ″Read
syntax diagram″. The associated link leads to an accessible text diagram. When you
return to the document at the second image, the screen reader will say ″Skip visual
syntax diagram″ and has a link to skip around the visible diagram.
For BookManager users only: A screen reader might say the lines, symbols, and
words in a diagram, but not in a meaningful way.
For example, you might hear ″question question
dash dash MOVE dash dash plus dash dash
literal-1 dash dash plus″ for part of the MOVE
statement. You can enter Say Next Paragraph to
move quickly through syntax diagrams if your
screen reader has that capability.
© Copyright IBM Corp. 1992, 2006 65

66 Debug Tool V7.1 Customization Guide
Notices
This information was developed for products and services offered in the U.S.A.
IBM might not offer the products, services, or features discussed in this document
in other countries. Consult your local IBM representative for information on the
products and services currently available in your area. Any reference to an IBM
product, program, or service is not intended to state or imply that only that IBM
product, program, or service may be used. Any functionally equivalent product,
program, or service that does not infringe any IBM intellectual property right may
be used instead. However, it is the user’s responsibility to evaluate and verify the
operation of any non-IBM product, program, or service.
IBM may have patents or pending patent applications covering subject matter in
this document. The furnishing of this document does not give you any license to
these patents. You can send license inquiries, in writing, to:
IBM Corporation
J46A/G4
555 Bailey Avenue
San Jose, CA 95141-1003
U.S.A.
For license inquiries regarding double-byte (DBCS) information, contact the IBM
Intellectual Property Department in your country or send inquiries, in writing, to:
IBM World Trade Asia Corporation
Licensing
2-31 Roppongi 3-chome, Minato-ku
Tokyo 106, Japan
The following paragraph does not apply to the United Kingdom or any other
country where such provisions are inconsistent with the local law:
INTERNATIONAL BUSINESS MACHINES CORPORATION PROVIDES THIS
PUBLICATION “AS IS” WITHOUT WARRANTY OF ANY KIND, EITHER
EXPRESS OR IMPLIED, INCLUDING, BUT NOT LIMITED TO, THE IMPLIED
WARRANTIES OF NON-INFRINGEMENT, MERCHANTABILITY OR FITNESS
FOR A PARTICULAR PURPOSE.
Some states do not allow disclaimer of express or implied warranties in certain
transactions; therefore, this statement might not apply to you.
This information could include technical inaccuracies or typographical errors.
Changes are periodically made to the information herein; these changes will be
incorporated in new editions of the publication. IBM may make improvements
and/or changes in the product(s) and/or the program(s) described in this
publication at any time without notice.
Trademarks and service marks
The following terms, denoted by an asterisk (*) on the first occurrence in this
publication, are trademarks or service marks of International Business Machines
Corporation in the United States or other countries:
© Copyright IBM Corp. 1992, 2006 67
Other company, product, and service names, which may be denoted by a double
asterisk (**), may be trademarks or service marks of others.
Java™ and all Java-based trademarks are trademarks of Sun Microsystems, Inc. in
the United States, other countries, or both.
LINUX is a registered trademark of Linus Torvalds in the United States, other
countries, or both.
Microsoft, Windows, and Windows NT® are registered trademarks of Microsoft
Corporation in the United States, other countries, or both.
UNIX is a trademark of UNIX System Laboratories, licensed exclusively by
X/Open Company, Ltd.
68 Debug Tool V7.1 Customization Guide
Glossary
This glossary defines technical terms and
abbreviations used in Debug Tool Customization
Guide documentation. If you do not find the term
you are looking for, refer to the IBM Glossary of
Computing Terms, located at the IBM Terminology
web site:
http://www.ibm.com/ibm/terminology
B
batch. Pertaining to a predefined series of actions
performed with little or no interaction between the user
and the system. Contrast with interactive.
batch job. A job submitted for batch processing. See
batch. Contrast with interactive.
C
CADP. A CICS-supplied transaction used for
managing debugging profiles from a 3270 terminal.
compile. To translate a program written in a high
level language into a machine-language program.
compile unit. A sequence of HLL statements that
make a portion of a program complete enough to
compile correctly. Each HLL product has different rules
for what comprises a compile unit.
compiler. A program that translates instructions
written in a high level programming language into
machine language.
D
data set. The major unit of data storage and retrieval,
consisting of a collection of data in one of several
prescribed arrangements and described by control
information to which the system has access.
debug. To detect, diagnose, and eliminate errors in
programs.
DTCN. Debug Tool Control utility, a CICS transaction
that enables the user to identify which CICS programs
to debug.
debugging profile. Data that specifies a set of
application programs which are to be debugged
together.
F
full-screen mode. An interface mode for use with a
nonprogrammable terminal that displays a variety of
information about the program you are debugging.
H
hook. An instruction inserted into a program by a
compiler when you specify the TEST compile option.
Using a hook, you can set breakpoints to instruct
Debug Tool to gain control of the program at selected
points during its execution.
L
link-edit. To create a loadable computer program
using a linkage editor.
load module. A program in a form suitable for
loading into main storage for execution. In this
document this term is also used to refer to a Dynamic
Load Library (DLL).
LU. See “logical unit.”
logical unit. (1) A type of network accessible unit that
enables users to gain access to network resources and
communicate with each other. (2) A name used by
VTAM to identify a terminal or other resource.
N
network identifier. In TCP/IP, that part of the IP
address that defines a network. The length of the
network ID depends on the type of network class (A, B,
or C).
node name. The name assigned to a node during
network definition. The format for the node name is
netid.cpname.
P
parameter. Data passed between programs or
procedures.
partitioned data set (PDS). A data set in direct access
storage that is divided into partitions, called members,
each of which can contain a program, part of a
program, or data.
PDS. See partitioned data set.
© Copyright IBM Corp. 1992, 2006 69
| | | |
PLU. See primary logical unit.
primary logical unit. (1) In SNA, the logical unit that
contains the primary half-session for a particular logical
unit-to-logical unit (LU-to-LU) session. (2) In SNA, the
logical unit (LU) that sends the BIND to activate a
session with its partner LU.
profile. A group of customizable settings that govern
how the user’s session appears and operates.
program. A sequence of instructions suitable for
processing by a computer. Processing can include the
use of an assembler, a compiler, an interpreter, or a
translator to prepare the program for execution, as well
as to execute it.
S
secondary logical unit. (1) In SNA, the logical unit
(LU) that contains the secondary half-session for a
particular LU-LU session. An LU may contain
secondary and primary half-sessions for different active
LU-LU sessions. (2) A VTAM Secondary Logical Unit
(i.e., terminal).
session. The events that take place between the time
the user starts an application and the time the user
exits the application.
SIMLOGON. A VTAM macro instruction that initiates
a session in which the application program acts as the
PLU.
Single Point of Control. The control interface that
sends commands to one or more members of an
IMSplex and receives command responses.
SLU. See “secondary logical unit.”
SPOC. See “Single Point of Control.”
U
utility. A computer program in general support of
computer processes; for example, a diagnostic program,
a trace program, or a sort program.
V
VTAM. See “Virtual Telecommunications Access
Method.”
Virtual Telecommunications Access Method (VTAM).
(1) IBM software that controls communication and the
flow of data in an SNA network by providing the SNA
application programming interfaces and SNA
networking functions. An SNA network includes
subarea networking, Advanced Peer-to-Peer
Networking® (APPN), and High-Performance Routing
(HPR). Beginning with Release 5 of the OS/390
operating system, the VTAM for MVS/ESA™ function
was included in Communications Server for OS/390;
this function is called Communications Server for
OS/390 - SNA Services. (2) An access method
commonly used by MVS to communicate with
terminals and other communications devices.
70 Debug Tool V7.1 Customization Guide
Bibliography
Debug Tool publications
Using CODE/370 with VS COBOL II and OS PL/I,
SC09-1862
Debug Tool for z/OS
Debug Tool Summary of Commands and Built-in
Functions, SC19-1074
Debug Tool Customization Guide, SC19-1075
Program Directory for Debug Tool for z/OS,
GI10-8726
Debug Tool Reference and Messages, GC19-1073
Debug Tool User’s Guide, SC19-1071
Debug Tool Utilities and Advanced Functions
for z/OS
Debug Tool Coverage Utility Users Guide,
SC19-1072
Program Directory for Debug Tool Utilities and
Advanced Functions for z/OS, GI10-8727
High level language publications
z/OS C and C++
Compiler and Run-Time Migration Guide,
GC09-4913
Curses, SA22-7820,
Language Reference, SC09-4815
Programming Guide, SC09-4765
Run-Time Library Reference, SA22-7821
User’s Guide, SC09-4767
Enterprise COBOL for z/OS and OS/390
Migration Guide, GC27-1409
Customization, GC27-1410
Licensed Program Specifications, GC27-1411
Language Reference, SC27-1408
Programming Guide, SC27-1412
COBOL for OS/390 & VM
Compiler and Run-Time Migration Guide,
GC26-4764
Customization under OS/390, GC26-9045
Language Reference, SC26-9046
Programming Guide, SC26-9049
Enterprise PL/I for z/OS and OS/390
Diagnosis Guide, SC27-1459
Language Reference, SC27-1460
Licensed Program Specifications, GC27-1456
Messages and Codes, SC27-1461
Migration Guide, GC27-1458
Programming Guide, SC27-1457
VisualAge PL/I for OS/390
Compiler and Run-Time Migration Guide,
SC26-9474
Diagnosis Guide, SC26-9475
Language Reference, SC26-9476
Licensed Program Specifications, GC26-9471
Messages and Codes, SC26-9478
Programming Guide, SC26-9473
PL/I for MVS & VM
Compile-Time Messages and Codes, SC26-3229
Compiler and Run-Time Migration Guide,
SC26-3118
Diagnosis Guide, SC26-3149
Installation and Customization under MVS,
SC26-3119
Language Reference, SC26-3114
Licensed Program Specifications, GC26-3116
Programming Guide, SC26-3113
Reference Summary, SX26-3821
Related publications
CICS
Application Programming Guide, SC34-6231
Application Programming Primer, SC34-0674
Application Programming Reference, SC34-6232
DB2 Universal Database™ for z/OS
Administration Guide, SC18-7413
Application Programming and SQL Guide,
SC18-7415
Command Reference, SC18-7416
Data Sharing: Planning and Administration,
SC18-7417
Installation Guide, GC18-7418
© Copyright IBM Corp. 1992, 2006 71
Messages and Codes, GC18-7422
Reference for Remote DRDA* Requesters and
Servers, SC18-7424
Release Planning Guide, SC18-7425
SQL Reference, SC18-7426
Utility Guide and Reference, SC18-7427
IMS
IMS Application Programming: Database
Manager, SC27-1286
IMS Application Programming: EXEC DLI
Commands for CICS & IMS, SC27-1288
IMS Application Programming: Transaction
Manager, SC27-1289
TSO/E
Command Reference, SA22-7782
Programming Guide, SA22-7788
System Programming Command Reference,
SA22-7793
User’s Guide, SA22-7794
z/OS
MVS JCL Reference, SA22-7597
MVS JCL User’s Guide, SA22-7598
MVS System Commands, SA22-7627
z/OS Language Environment
Concepts Guide, SA22-7567
Customization, SA22-7564
Debugging Guide, GA22-7560
Programming Guide, SA22-7561
Programming Reference, SA22-7562
Run-Time Migration Guide, GA22-7565
Vendor Interfaces, SA22-7568
Writing Interlanguage Communication
Applications, SA22-7563
Softcopy publications
Online publications are distributed on CD-ROMs
and can be ordered through your IBM
representative. Debug Tool User’s Guide, Debug Tool
Customization Guide, and Debug Tool Reference and
Messages are distributed on the following
collection kit:
SK3T-4269
Online publications can also be downloaded from
the IBM Web site. Visit the IBM Web site for each
product to find online publications for that
product.
72 Debug Tool V7.1 Customization Guide
Index
Aaccessing
another language by using
NATLANG 16
activatingDebug Tool definitions to VTAM 31
SVCs without using a system IPL 4
ALLOWAPPL EQAMV*specifying, statement 34
assembler, definition of viii
assigningvalues to NATLANG, LOCALE, and
LINECOUNT 7
authorizing 6
Dynamic Debug facility to access
programs in protected storage 5
authorizing all users to access Coverage
Utility 24
authorizing system administrators to
access Coverage Utility 24
CCCSID 57
CEEBXITA, DFSBXITA as copy of 27
checklist 1
CICSadding support for 45
CSD 45
DFHRPL 45
EQA0CPLT 47
EQACCSD 45
EQACDCT 45
INITPARM 47
JCL, updating 45
SEQAMOD 45
CICS translatorspecifying a different 22
code pagescreating conversion images for 57
copyingdata sets to specified DD
concatenation 16
creatingup RACF profiles 25
CSD 45
customer supportSee Software Support
customizingCoverage Utility 24
Debug Tool Utilities 17
Problem Determination Tools 18
Program Preparation Utilities 21
Ddata set, site defaults 26
data setscopying into DD concatenation 16
DB2 precompilerspecifying a different 22
Debug Toolparameters
assigning values to 7
terminology vii
Debug Tool Terminal Interface ManagerConfiguing telnet server for 41
description of 38
example of use 39
how to start 41
Verifying customization of 41
Debug Tool Utilities and Advanced
Functions, description of 15
Debug Tool Utilities and Advanced
Functions, functions added by 21
default data set namesLDD specifications file 9
saved breakpoints file 9
saved monitor values file 9
saved settings file 9
defaults, site 26
definingDTCN transaction name 46
minor node names 30
TCP/IP terminals 33
defining Transient Data queues 45
DELETE, detecting 9
DFSBXITA 27
DLOGMOD operand, specifying 32
documents, licensed v
DSALIM 48
DTCX transaction 48
DTSUSee Debug Tool Setup Utility
Dynamic Debugaccessing programs in unprotected
storage 5
Dynamic Debug, installing 3
Eediting
EQAZPROC to add other procedure
libraries 18
EDSALIM 48
Enterprise PL/I, definition of viii
EQA00SVCchecking level of 5
description of 4
EQA01SVCchecking level of 5
description of 4
EQA0CPLTINITPARM 47
example 47
parameters 47
PLT, adding 47
set up 47
EQA9974I 49
EQACCSD 45
EQACDCT 45
EQACUOIN 25
EQACUOSV 25
EQADTCN2, how to define 49
EQANCPLT 49
EQAOPTS, using to set global
preferences 8
EQAOPTS, using to set SVC screening
option 10
EQASTARTmodifying, to customize data set
names 17
EQAUEDAT 43
EQAWAPPLmodifying 30
EQAXOPTmodifying
for default data set names 9
for NAMES command 12
for SET DEFAULT VIEW
command 13
EQAZDFLT 18, 21
example of, showing parameters to
set 18, 21
EQAZPROC 18
exampleactivating Debug Tool definitions to
VTAM 35
full-screen mode through a VTAM
terminal 29
JCL that generates conversion
images 58
RACF profiles 25
VTAM in a sysplex environment 31
executingSee running
EZAC transaction 51
FFIRSTONLY operand
specifying, to display a session
manager panel 34
fixes, obtaining 59
full-screen mode through a VTAM
terminal with Debug Tool Terminal
Interface Manager,overview of steps to enable 40
full-screen mode through a VTAM
terminal,overview of steps to enable 30
full-screen mode through a VTAM
terminal, how users start 29
Gglobal preferences file 8
© Copyright IBM Corp. 1992, 2006 73
IIMS
adding support for 53
configuring for V8 of 27
program that do not run in Language
Environment 53
information centers, searching for
problem resolution 59
INITPARMexample 47
NLE 47
NWP 47
STK 47
Internetsearching for problem resolution 59
invokingSee starting
IPLto install Dynamic Debug facility
SVC 4
IVP 5
running for Dynamic Debug
facility 5
JJapanese
adding data sets to DD
concatenation 16
Coverage Utility monitor
messages 24
Customizing Debug Tool 55
data sets 16
JCL, sampleCEEBXITA into CEEBINIT 28
Kknowledge bases, searching for problem
resolution 59
KoreanCoverage Utility monitor
messages 24
data sets 17
Llicensed documents v
LINK, detecting 9
LOAD, detecting 9
LookAt message retrieval tool vi
Mmaking a user exit available
application-specific 28
installation-wide 27
region-wide 28
managing debugging profiles 51
message retrieval tool, LookAt vi
Model Application Names 31, 32
modifyingEQASTART 17
EQAWAPPL 30
multi-domain environmentmodifying EQAWAPPL 31
multiple systems, customizing
Preparation Utilities for 19, 24
NNAMES command
description of 12
NATLANG 16
NLE 47
NWP 47
Ooptimizing Debug Tool’s
performance 48
order of execution of files 9
Pparameters
setting, using EQAZDFLT
example 18, 21
specifying, for DB2 and CICS 22
performanceoptimizing for CICS 48
PL/I, definition of viii
preferences file, setting global 8
preparingto customize Debug Tool 1
to customize Debug Tool Utilities and
Advanced Functions 2
problem determinationdescribing problems 62
determining business impact 61
submitting problems 62
RRACF profiles 25
required customizations 3
installing Dynamic Debug facility 3
Sscreening, setting SVC 9
separate debug file, attributes to use
for 48
SEQAAUTH 24
SEQABMOD 6
SEQAEXECmodifying 17
SEQAMOD 24
SEQATLIB 16, 17, 18, 21
session manager paneldisplaying 34
SET DEFAULT VIEW commanddescription of 13
syntax of EQAXOPT macro for 13
setting global preferences file 8
SITSee system initialization parameter
site defaults data setediting 26
site defaults data set (continued)example 27
Software Supportcontacting 60
describing problems 62
determining business impact 61
receiving weekly updates 60
submitting problems 62
startingDebug Tool Utilities from an ISPF
panel 17
STK 47
supervisor call (SVC)installing and enabling 25
SVCinstalling and enabling 25
installing, without using a system
IPL 4
setting screening option 9
SVC screening 9
sysplexmodifying EQAWAPPL 31
system initialization parameterDEBUGTOOL 51
TTCP/IP
defining terminals to TN3270 33
VARY NET command 31
VARY TCPIP command 35
TCP/IP, using with CICS 50
terminology, Debug Tool vii
Uuser exit 43
EQAUEDAT 43
XEIIN 48
XEIOUT 48
XPCFTCH 48
XPCHAIR 48
XPCTA 48
USSMSG10 paneldisplaying 34
Vverifying 5
installation of Dynamic Debug facility
SVCs 5
VTAMactivating Debug Tool definitions to,
example 35
allowing users to debug using 29
DLOGMOD operand 32
in a multi-domain environment 31
in a sysplex environment 31
LU characteristics 32
verifying installation of the Debug
Tool definitions to 38
VTAM definitions library 30
VTAM minor nodedefining for Terminal Interface
Manager 40
how to define 30
74 Debug Tool V7.1 Customization Guide

VTAMLST 30
Wworkstation debugging
See remote debug mode
Index 75

76 Debug Tool V7.1 Customization Guide
Readers’ Comments — We’d Like to Hear from You
Debug Tool for z/OS
Debug Tool Utilities and Advanced Functions for z/OS
Customization Guide
Version 7.1
Publication No. SC19-1075-02
We appreciate your comments about this publication. Please comment on specific errors or omissions, accuracy,
organization, subject matter, or completeness of this book. The comments you send should pertain to only the
information in this manual or product and the way in which the information is presented.
For technical questions and information about products and prices, please contact your IBM branch office, your
IBM business partner, or your authorized remarketer.
When you send comments to IBM, you grant IBM a nonexclusive right to use or distribute your comments in any
way it believes appropriate without incurring any obligation to you. IBM or any other organizations will only use
the personal information that you supply to contact you about the issues that you state on this form.
Comments:
Thank you for your support.
Submit your comments using one of these channels:
v Send your comments to the address on the reverse side of this form.
v Send your comments via e-mail to: [email protected]
If you would like a response from IBM, please fill in the following information:
Name
Address
Company or Organization
Phone No. E-mail address
Readers’ Comments — We’d Like to Hear from You SC19-1075-02
SC19-1075-02
����
Cut or FoldAlong Line
Cut or FoldAlong Line
Fold and Tape Please do not staple Fold and Tape
Fold and Tape Please do not staple Fold and Tape
NO POSTAGENECESSARYIF MAILED IN THEUNITED STATES
BUSINESS REPLY MAIL FIRST-CLASS MAIL PERMIT NO. 40 ARMONK, NEW YORK
POSTAGE WILL BE PAID BY ADDRESSEE
IBM Corporation
Silicon Valley Laboratory
Department J87/D325
555 Bailey Ave.
San Jose, CA
95141-9989
_ _ _ _ _ _ _ _ _ _ _ _ _ _ _ _ _ _ _ _ _ _ _ _ _ _ _ _ _ _ _ _ _ _ _ _ _ _ _ _ _ _ _ _ _ _ _ _ _ _ _ _ _ _ _ _ _ _ _ _ _ _ _ _ _ _ _ _ _ _ _ _ _ _ _ _ _ _ _ _ _ _ _ _ _ _ _ _ _
_ _ _ _ _ _ _ _ _ _ _ _ _ _ _ _ _ _ _ _ _ _ _ _ _ _ _ _ _ _ _ _ _ _ _ _ _ _ _ _ _ _ _ _ _ _ _ _ _ _ _ _ _ _ _ _ _ _ _ _ _ _ _ _ _ _ _ _ _ _ _ _ _ _ _ _ _ _ _ _ _ _ _ _ _ _ _ _ _
__
__
__
__
__
__
__
__
__
__
__
__
__
__
__
__
__
__
__
__
__
__
__
__
__
__
__
__
__
__
__
__
__
__
__
__
__
__
__
__
__
__
__
__
__
__
__
__
__
_

����
Program Number: 5655-R44
Printed in USA
SC19-1075-02


