Convective boiling of halocarbon refrigerants ¯owing in a horizontalcopper tube ± an experimental study
Jos�e Maria Saiz Jabardo *, Enio Pedone Bandarra Filho
Refrigeration Laboratory, Department of Mechanical Engineering, Escola de Engenharia de S~ao Carlos, University of S~ao Paulo, Av. Trabalhador
S~aoCarlense, 400-centro, 13566-590 S~ao Carlos, SP, Brazil
Abstract
An experimental study of convective boiling of refrigerants R-22, R-134a and R-404A in a 12.7 mm internal diameter, 2 m long,
horizontal copper tube has been performed. Experiments involved a relatively wide range of operational conditions. Experiments
were performed at the evaporating temperatures of 8°C and 15°C. Quality, mass velocity and heat ¯ux varied in the following
ranges: 5% to saturated vapor, 50±500 kg=�s m2); and 5±20 kW=m2. E�ects of these physical parameters over the heat transfer
coe�cient have been investigated. High quality experiments were also performed up to the point of the tube surface dryout, a
mechanism which was investigated from the qualitative point of view. Two heat transfer coe�cient correlations from the literature
have been evaluated through comparisons with experimental data. Deviations varied in the range from ÿ25% to 42%. Ó 2000
Elsevier Science Inc. All rights reserved.
Keywords: Halocarbon refrigerants; Convective boiling; Heat transfer; Dryout
1. Introduction
Convective boiling of refrigerants ¯owing in tubeshas been under intense scrutiny during the last ®ve de-cades, specially in studies having in sight refrigerationapplications. This is justi®ed by the wide range of ap-plications of direct expansion evaporators in this in-dustry. The refrigerant enters as a saturated liquid±vapor mixture in a direct expansion evaporator andleaves it as superheated vapor, changing of phase while¯owing inside the tubes, undergoing a heat transfermechanism that is generally designated as ``ConvectiveBoiling'', Collier and Thome [1].
The enforced substitution of the family of halocar-bon refrigerants known as CFCs by actions prescribedby the Montreal Protocol has allowed the developmentof renewed research opportunities of convective boilingassociated to the CFCs substitutes. Manufacturers haveintroduced a whole new family of halocarbon refriger-ants during the past few years to satisfy speci®c industryneeds and regulations in a scenario which is both vola-tile and competitive. The newly arrived refrigerants must
be evaluated under convective boiling conditions due toboth the lack of generality of the correlations developedin the past and the discrepancies among them. This inturn opens the way for renewed e�orts to understand themechanism behind convective boiling of refrigerants andits adequate correlation, which are the main objectivesof the study reported herein.
This paper reports results obtained in a set-up spe-cially developed to investigate thermal performance ofhalocarbon refrigerants undergoing convective boilingin a horizontal tube. Results involving three halocarbonrefrigerants (R-22, R-134a and R-404A) are discussed interms of the e�ects of the important intervening physicalparameters. In addition, comparison of these resultswith heat transfer correlations from the literature ismade to check their quantitative signi®cance.
2. Fundamentals of convective boiling
In a broad sense, convective boiling designates theliquid to vapor change of phase that takes place underforced ¯ow of a heated ¯uid. In this study major at-tention has been focused on conditions prevailing indirect expansion evaporators, especially covering a re-gion from the evaporator inlet to the section wheredryout occurs. This is by large the most important
Experimental Thermal and Fluid Science 23 (2000) 93±104
www.elsevier.nl/locate/etfs
* Corresponding author. Tel.: +55-16-2739415; fax: +55-16-
2739402.
E-mail addresses: [email protected] (J.M.S. Jabardo), band-
[email protected] (E. Pedone Bandarra Filho).
0894-1777/00/$ - see front matter Ó 2000 Elsevier Science Inc. All rights reserved.
PII: S 0 8 9 4 - 1 7 7 7 ( 0 0 ) 0 0 0 4 0 - 6
region in the evaporator, and that where thermal equi-librium conditions prevail. Vapor quality at the entranceof the evaporator is in general larger than 10%, varyingfrom case to case. On the other hand, post dryoutconditions encompass the misty two-phase ¯ow and thesuperheated vapor regions. Misty ¯ow heat transfer hasnot been adequately addressed in the literature. Re-garding heat transfer, this has been generally consideredas a single phase saturated vapor region.
The region covered by this study is that where thefollowing two-phase ¯ow regimes might occur: bubbly,intermittent (slug), strati®ed (wavy), and annular. Theseregimes have been previously observed by Zahn [2] andGouse and Coumou [3] in transparent tube evaporators.Heat transfer mechanisms under these ¯ow regimes areassociated to either nucleate boiling or evaporation atthe liquid±vapor interface. The latter is designated asconvective boiling by some authors, as Collier andThome [1], a designation more restrictive than the oneused in this study. Throughout this paper this conditionwill be designated as ``strictly convective boiling'', SaizJabardo et al. [4]. It must be noted that both mecha-nisms, nucleate and strictly convective boiling, mightoccur simultaneously. In fact, some of the current heattransfer correlations for convective boiling actually as-sume a superposition of those e�ects after Chen [5], see,for example, [6±10], and others.
The heat transfer mechanism is a�ected by the ¯owregime, as one should expect, due to changes in the to-pology of the liquid±vapor interface, as suggested by
Collier and Thome [1]. Three major physical parametersa�ect the ¯ow regime transition in convective boiling:mass velocity, heat ¯ux, and quality. For a given heat¯ux and reduced mass velocity, typically lower than100 kg/(s m2), strati®ed (wavy) regime occurs over therange of qualities encompassing those prevailing in atypical evaporator (say x > 10%), Kattan et al. [11],Wattelet et al. [12]. Nucleate boiling might occur on thewall in contact with the liquid ®lling the bottom of thehorizontal tube, specially at lower qualities. As the liq-uid layer gradually turns thinner, bubble nucleationmight be suppressed. The heat transfer coe�cient is notsigni®cantly a�ected by quality and remains essentiallyconstant up to the complete dryout of the wall, though,at very low mass velocities, it has been observed that itgradually diminishes as the liquid layer at the bottom ofthe tube evaporates.
Higher mass velocities prompt the transition fromintermittent, mostly slug, to the annular regime. Theheat transfer coe�cient presents a typical behavior, be-ing strongly dependent upon the heat ¯ux in the nucleateboiling region. As the annular regime sets in, the heattransfer coe�cient no longer depends upon the heat ¯uxbut increases gradually as the ®lm thickness at the wallbecomes thinner as a result of intense evaporation at theliquid±vapor interface, Jung et al. [6].
The typical behavior of the heat transfer coe�cientdescribed in previous paragraphs will be carefully cross-examined in subsequent sections on the basis of theexperimental results reported herein.
Nomenclaturecp speci®c heat (J/(kg K))D diameter (m)Db bubble departure diameter (m)F two-phase multiplier for strictly convective
heat transferFfl ¯uid parameter de®ned by Kandlikarg acceleration of gravity (m=s2)G mass velocity (kg/(s m2))h heat transfer coe�cient (W/(m2 K))i enthalpy (kJ/kg)k thermal conductivity (W/(m K))L length (m)m mass ¯ow rate (kg/s)p pressure (Pa)Q heat transfer rate (W)S suppression factorT temperature (°C)x quality
Dimensionless groupsBo Boiling number; Bo � �/=GD�Co convective number as de®ned by
Shah; Co � �1ÿ x=x�0:8�qg=qf�0:5Fr Froude number; Fr � �G2=q2
f gD�Re Reynolds number; Re � �GD=l�
Xtt Martinelli parameter;Xtt � �1ÿ x=x�0:9�qg=qf�0:5�lf=lg�0:1
Greeksb contact angle (degrees)/ heat ¯ux (W=m2)l viscosity (Pa s)q density (kg=m3)r surface tension (N/m)
Subscriptsb bubblecorrel correlationexp experimentalf liquid or relative to single phase ¯ow of the
mixture liquidg gasi insidein inletNB nucleate boilingo outletPH preheaterr refrigerantsat saturatedTS test sectionw wall
94 J.M. Saiz Jabardo, E.P. Bandarra Filho / Experimental Thermal and Fluid Science 23 (2000) 93±104
3. Description of the experimental set-up and procedures
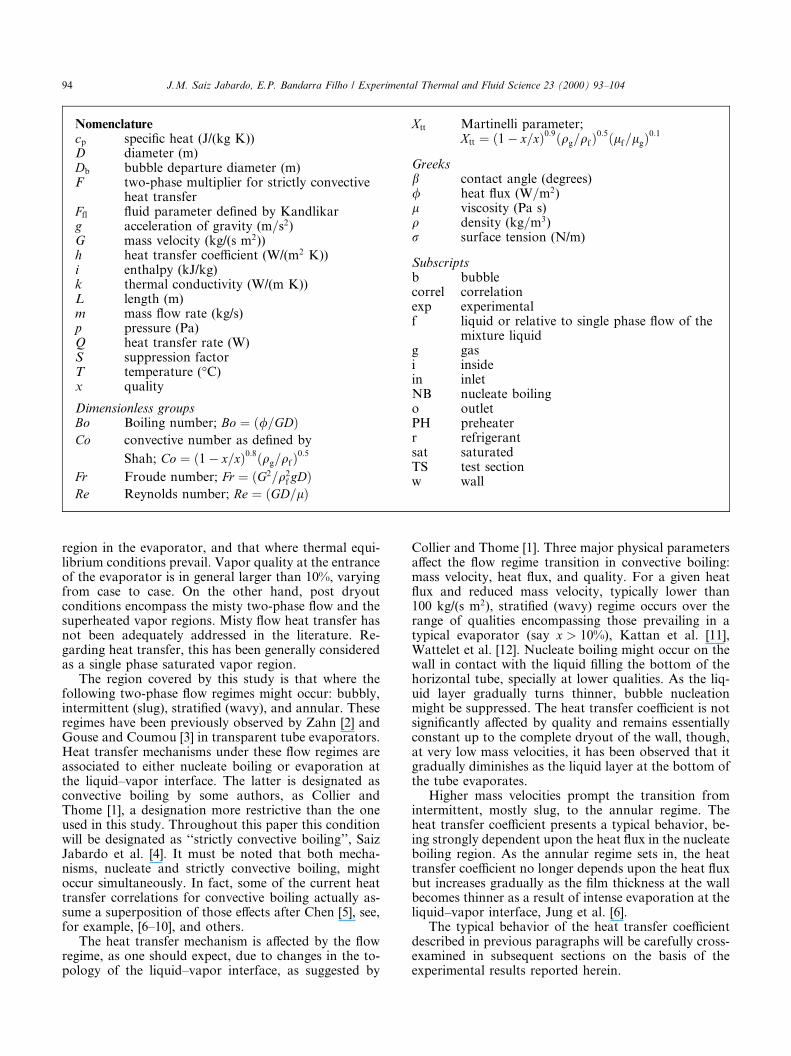
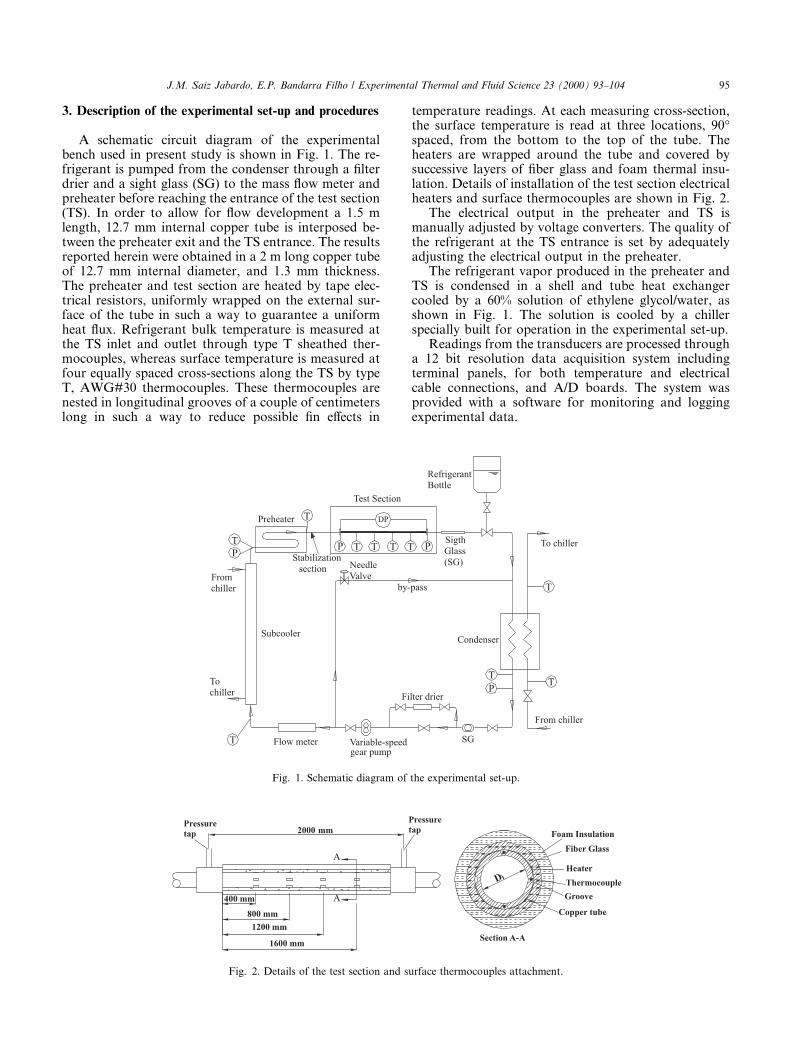
A schematic circuit diagram of the experimentalbench used in present study is shown in Fig. 1. The re-frigerant is pumped from the condenser through a ®lterdrier and a sight glass (SG) to the mass ¯ow meter andpreheater before reaching the entrance of the test section(TS). In order to allow for ¯ow development a 1.5 mlength, 12.7 mm internal copper tube is interposed be-tween the preheater exit and the TS entrance. The resultsreported herein were obtained in a 2 m long copper tubeof 12.7 mm internal diameter, and 1.3 mm thickness.The preheater and test section are heated by tape elec-trical resistors, uniformly wrapped on the external sur-face of the tube in such a way to guarantee a uniformheat ¯ux. Refrigerant bulk temperature is measured atthe TS inlet and outlet through type T sheathed ther-mocouples, whereas surface temperature is measured atfour equally spaced cross-sections along the TS by typeT, AWG#30 thermocouples. These thermocouples arenested in longitudinal grooves of a couple of centimeterslong in such a way to reduce possible ®n e�ects in
temperature readings. At each measuring cross-section,the surface temperature is read at three locations, 90°spaced, from the bottom to the top of the tube. Theheaters are wrapped around the tube and covered bysuccessive layers of ®ber glass and foam thermal insu-lation. Details of installation of the test section electricalheaters and surface thermocouples are shown in Fig. 2.
The electrical output in the preheater and TS ismanually adjusted by voltage converters. The quality ofthe refrigerant at the TS entrance is set by adequatelyadjusting the electrical output in the preheater.
The refrigerant vapor produced in the preheater andTS is condensed in a shell and tube heat exchangercooled by a 60% solution of ethylene glycol/water, asshown in Fig. 1. The solution is cooled by a chillerspecially built for operation in the experimental set-up.
Readings from the transducers are processed througha 12 bit resolution data acquisition system includingterminal panels, for both temperature and electricalcable connections, and A/D boards. The system wasprovided with a software for monitoring and loggingexperimental data.
Fig. 1. Schematic diagram of the experimental set-up.
Fig. 2. Details of the test section and surface thermocouples attachment.
J.M. Saiz Jabardo, E.P. Bandarra Filho / Experimental Thermal and Fluid Science 23 (2000) 93±104 95
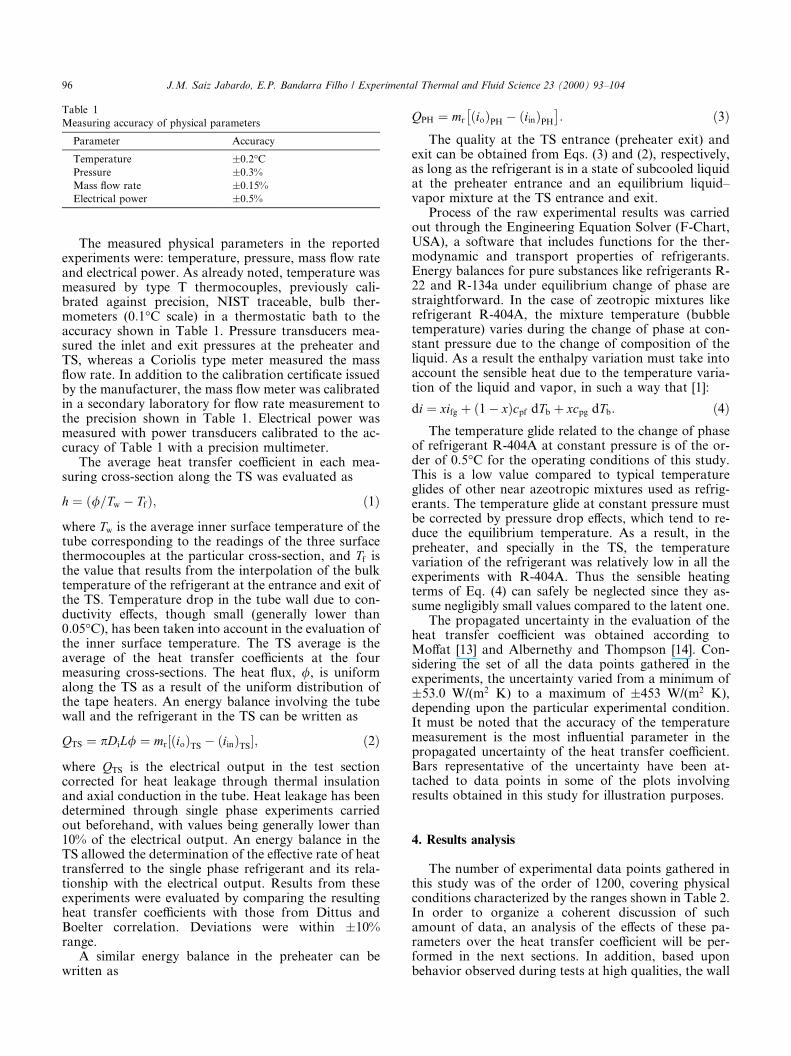
The measured physical parameters in the reportedexperiments were: temperature, pressure, mass ¯ow rateand electrical power. As already noted, temperature wasmeasured by type T thermocouples, previously cali-brated against precision, NIST traceable, bulb ther-mometers (0:1°C scale) in a thermostatic bath to theaccuracy shown in Table 1. Pressure transducers mea-sured the inlet and exit pressures at the preheater andTS, whereas a Coriolis type meter measured the mass¯ow rate. In addition to the calibration certi®cate issuedby the manufacturer, the mass ¯ow meter was calibratedin a secondary laboratory for ¯ow rate measurement tothe precision shown in Table 1. Electrical power wasmeasured with power transducers calibrated to the ac-curacy of Table 1 with a precision multimeter.
The average heat transfer coe�cient in each mea-suring cross-section along the TS was evaluated as
h � �/=Tw ÿ Tf�; �1�where Tw is the average inner surface temperature of thetube corresponding to the readings of the three surfacethermocouples at the particular cross-section, and Tf isthe value that results from the interpolation of the bulktemperature of the refrigerant at the entrance and exit ofthe TS. Temperature drop in the tube wall due to con-ductivity e�ects, though small (generally lower than0:05°C), has been taken into account in the evaluation ofthe inner surface temperature. The TS average is theaverage of the heat transfer coe�cients at the fourmeasuring cross-sections. The heat ¯ux, /, is uniformalong the TS as a result of the uniform distribution ofthe tape heaters. An energy balance involving the tubewall and the refrigerant in the TS can be written as
QTS � pDiL/ � mr��io�TS ÿ �iin�TS�; �2�where QTS is the electrical output in the test sectioncorrected for heat leakage through thermal insulationand axial conduction in the tube. Heat leakage has beendetermined through single phase experiments carriedout beforehand, with values being generally lower than10% of the electrical output. An energy balance in theTS allowed the determination of the e�ective rate of heattransferred to the single phase refrigerant and its rela-tionship with the electrical output. Results from theseexperiments were evaluated by comparing the resultingheat transfer coe�cients with those from Dittus andBoelter correlation. Deviations were within �10%range.
A similar energy balance in the preheater can bewritten as
QPH � mr �io�PH
� ÿ �iin�PH
�: �3�
The quality at the TS entrance (preheater exit) andexit can be obtained from Eqs. (3) and (2), respectively,as long as the refrigerant is in a state of subcooled liquidat the preheater entrance and an equilibrium liquid±vapor mixture at the TS entrance and exit.
Process of the raw experimental results was carriedout through the Engineering Equation Solver (F-Chart,USA), a software that includes functions for the ther-modynamic and transport properties of refrigerants.Energy balances for pure substances like refrigerants R-22 and R-134a under equilibrium change of phase arestraightforward. In the case of zeotropic mixtures likerefrigerant R-404A, the mixture temperature (bubbletemperature) varies during the change of phase at con-stant pressure due to the change of composition of theliquid. As a result the enthalpy variation must take intoaccount the sensible heat due to the temperature varia-tion of the liquid and vapor, in such a way that [1]:
di � xifg � �1ÿ x�cpf dTb � xcpg dTb: �4�The temperature glide related to the change of phase
of refrigerant R-404A at constant pressure is of the or-der of 0:5°C for the operating conditions of this study.This is a low value compared to typical temperatureglides of other near azeotropic mixtures used as refrig-erants. The temperature glide at constant pressure mustbe corrected by pressure drop e�ects, which tend to re-duce the equilibrium temperature. As a result, in thepreheater, and specially in the TS, the temperaturevariation of the refrigerant was relatively low in all theexperiments with R-404A. Thus the sensible heatingterms of Eq. (4) can safely be neglected since they as-sume negligibly small values compared to the latent one.
The propagated uncertainty in the evaluation of theheat transfer coe�cient was obtained according toMo�at [13] and Albernethy and Thompson [14]. Con-sidering the set of all the data points gathered in theexperiments, the uncertainty varied from a minimum of�53.0 W/(m2 K) to a maximum of �453 W/(m2 K),depending upon the particular experimental condition.It must be noted that the accuracy of the temperaturemeasurement is the most in¯uential parameter in thepropagated uncertainty of the heat transfer coe�cient.Bars representative of the uncertainty have been at-tached to data points in some of the plots involvingresults obtained in this study for illustration purposes.
4. Results analysis
The number of experimental data points gathered inthis study was of the order of 1200, covering physicalconditions characterized by the ranges shown in Table 2.In order to organize a coherent discussion of suchamount of data, an analysis of the e�ects of these pa-rameters over the heat transfer coe�cient will be per-formed in the next sections. In addition, based uponbehavior observed during tests at high qualities, the wall
Table 1
Measuring accuracy of physical parameters
Parameter Accuracy
Temperature �0.2°C
Pressure �0.3%
Mass ¯ow rate �0.15%
Electrical power �0.5%
96 J.M. Saiz Jabardo, E.P. Bandarra Filho / Experimental Thermal and Fluid Science 23 (2000) 93±104
dryout mechanism will be outlined. Finally, a quanti-tative comparison will be made of the heat transfer co-e�cient experimentally obtained with that from twocorrelations from the literature.
4.1. Mass velocity
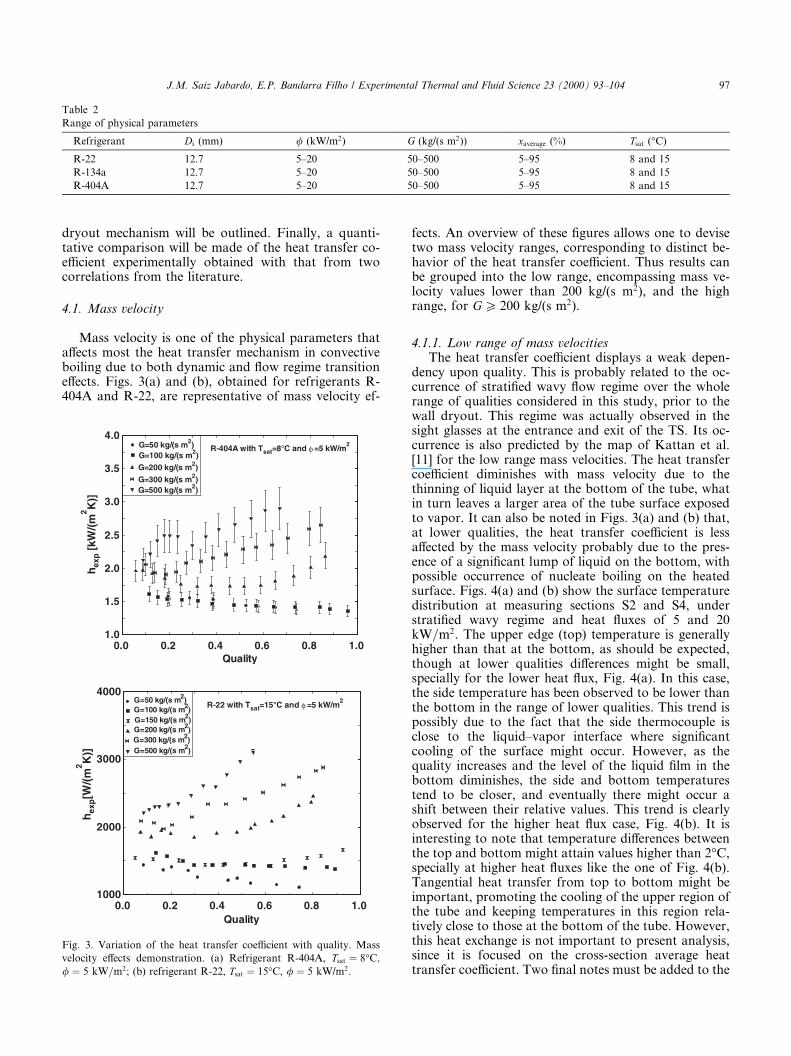
Mass velocity is one of the physical parameters thata�ects most the heat transfer mechanism in convectiveboiling due to both dynamic and ¯ow regime transitione�ects. Figs. 3(a) and (b), obtained for refrigerants R-404A and R-22, are representative of mass velocity ef-
fects. An overview of these ®gures allows one to devisetwo mass velocity ranges, corresponding to distinct be-havior of the heat transfer coe�cient. Thus results canbe grouped into the low range, encompassing mass ve-locity values lower than 200 kg/(s m2), and the highrange, for G P 200 kg/(s m2).
4.1.1. Low range of mass velocitiesThe heat transfer coe�cient displays a weak depen-
dency upon quality. This is probably related to the oc-currence of strati®ed wavy ¯ow regime over the wholerange of qualities considered in this study, prior to thewall dryout. This regime was actually observed in thesight glasses at the entrance and exit of the TS. Its oc-currence is also predicted by the map of Kattan et al.[11] for the low range mass velocities. The heat transfercoe�cient diminishes with mass velocity due to thethinning of liquid layer at the bottom of the tube, whatin turn leaves a larger area of the tube surface exposedto vapor. It can also be noted in Figs. 3(a) and (b) that,at lower qualities, the heat transfer coe�cient is lessa�ected by the mass velocity probably due to the pres-ence of a signi®cant lump of liquid on the bottom, withpossible occurrence of nucleate boiling on the heatedsurface. Figs. 4(a) and (b) show the surface temperaturedistribution at measuring sections S2 and S4, understrati®ed wavy regime and heat ¯uxes of 5 and 20kW=m2. The upper edge (top) temperature is generallyhigher than that at the bottom, as should be expected,though at lower qualities di�erences might be small,specially for the lower heat ¯ux, Fig. 4(a). In this case,the side temperature has been observed to be lower thanthe bottom in the range of lower qualities. This trend ispossibly due to the fact that the side thermocouple isclose to the liquid±vapor interface where signi®cantcooling of the surface might occur. However, as thequality increases and the level of the liquid ®lm in thebottom diminishes, the side and bottom temperaturestend to be closer, and eventually there might occur ashift between their relative values. This trend is clearlyobserved for the higher heat ¯ux case, Fig. 4(b). It isinteresting to note that temperature di�erences betweenthe top and bottom might attain values higher than 2°C,specially at higher heat ¯uxes like the one of Fig. 4(b).Tangential heat transfer from top to bottom might beimportant, promoting the cooling of the upper region ofthe tube and keeping temperatures in this region rela-tively close to those at the bottom of the tube. However,this heat exchange is not important to present analysis,since it is focused on the cross-section average heattransfer coe�cient. Two ®nal notes must be added to the
Fig. 3. Variation of the heat transfer coe�cient with quality. Mass
velocity e�ects demonstration. (a) Refrigerant R-404A, Tsat � 8°C;
/ � 5 kW=m2; (b) refrigerant R-22, Tsat � 15°C, / � 5 kW/m2.
Table 2
Range of physical parameters
Refrigerant Di (mm) / (kW/m2) G (kg/(s m2)) xaverage (%) Tsat (°C)
R-22 12.7 5±20 50±500 5±95 8 and 15
R-134a 12.7 5±20 50±500 5±95 8 and 15
R-404A 12.7 5±20 50±500 5±95 8 and 15
J.M. Saiz Jabardo, E.P. Bandarra Filho / Experimental Thermal and Fluid Science 23 (2000) 93±104 97
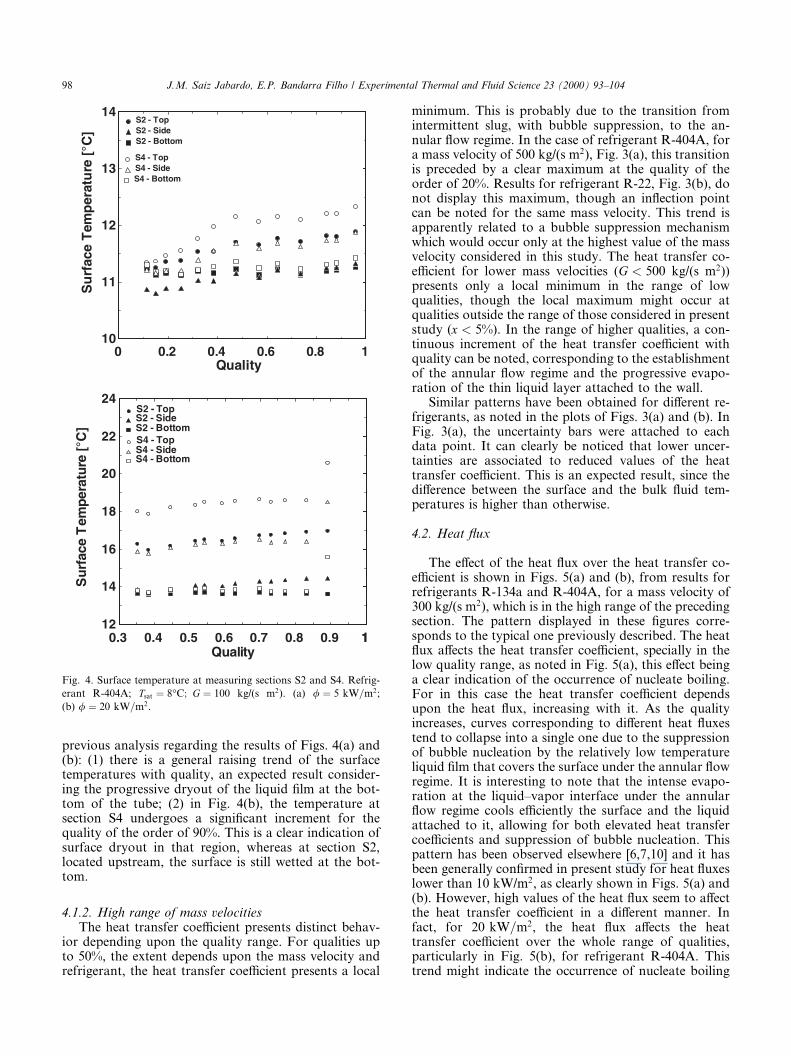
previous analysis regarding the results of Figs. 4(a) and(b): (1) there is a general raising trend of the surfacetemperatures with quality, an expected result consider-ing the progressive dryout of the liquid ®lm at the bot-tom of the tube; (2) in Fig. 4(b), the temperature atsection S4 undergoes a signi®cant increment for thequality of the order of 90%. This is a clear indication ofsurface dryout in that region, whereas at section S2,located upstream, the surface is still wetted at the bot-tom.
4.1.2. High range of mass velocitiesThe heat transfer coe�cient presents distinct behav-
ior depending upon the quality range. For qualities upto 50%, the extent depends upon the mass velocity andrefrigerant, the heat transfer coe�cient presents a local
minimum. This is probably due to the transition fromintermittent slug, with bubble suppression, to the an-nular ¯ow regime. In the case of refrigerant R-404A, fora mass velocity of 500 kg/(s m2), Fig. 3(a), this transitionis preceded by a clear maximum at the quality of theorder of 20%. Results for refrigerant R-22, Fig. 3(b), donot display this maximum, though an in¯ection pointcan be noted for the same mass velocity. This trend isapparently related to a bubble suppression mechanismwhich would occur only at the highest value of the massvelocity considered in this study. The heat transfer co-e�cient for lower mass velocities (G < 500 kg/(s m2))presents only a local minimum in the range of lowqualities, though the local maximum might occur atqualities outside the range of those considered in presentstudy (x < 5%). In the range of higher qualities, a con-tinuous increment of the heat transfer coe�cient withquality can be noted, corresponding to the establishmentof the annular ¯ow regime and the progressive evapo-ration of the thin liquid layer attached to the wall.
Similar patterns have been obtained for di�erent re-frigerants, as noted in the plots of Figs. 3(a) and (b). InFig. 3(a), the uncertainty bars were attached to eachdata point. It can clearly be noticed that lower uncer-tainties are associated to reduced values of the heattransfer coe�cient. This is an expected result, since thedi�erence between the surface and the bulk ¯uid tem-peratures is higher than otherwise.
4.2. Heat ¯ux
The e�ect of the heat ¯ux over the heat transfer co-e�cient is shown in Figs. 5(a) and (b), from results forrefrigerants R-134a and R-404A, for a mass velocity of300 kg/(s m2), which is in the high range of the precedingsection. The pattern displayed in these ®gures corre-sponds to the typical one previously described. The heat¯ux a�ects the heat transfer coe�cient, specially in thelow quality range, as noted in Fig. 5(a), this e�ect beinga clear indication of the occurrence of nucleate boiling.For in this case the heat transfer coe�cient dependsupon the heat ¯ux, increasing with it. As the qualityincreases, curves corresponding to di�erent heat ¯uxestend to collapse into a single one due to the suppressionof bubble nucleation by the relatively low temperatureliquid ®lm that covers the surface under the annular ¯owregime. It is interesting to note that the intense evapo-ration at the liquid±vapor interface under the annular¯ow regime cools e�ciently the surface and the liquidattached to it, allowing for both elevated heat transfercoe�cients and suppression of bubble nucleation. Thispattern has been observed elsewhere [6,7,10] and it hasbeen generally con®rmed in present study for heat ¯uxeslower than 10 kW/m2, as clearly shown in Figs. 5(a) and(b). However, high values of the heat ¯ux seem to a�ectthe heat transfer coe�cient in a di�erent manner. Infact, for 20 kW=m2, the heat ¯ux a�ects the heattransfer coe�cient over the whole range of qualities,particularly in Fig. 5(b), for refrigerant R-404A. Thistrend might indicate the occurrence of nucleate boiling
Fig. 4. Surface temperature at measuring sections S2 and S4. Refrig-
erant R-404A; Tsat � 8°C; G � 100 kg/(s m2). (a) / � 5 kW=m2;
(b) / � 20 kW=m2.
98 J.M. Saiz Jabardo, E.P. Bandarra Filho / Experimental Thermal and Fluid Science 23 (2000) 93±104
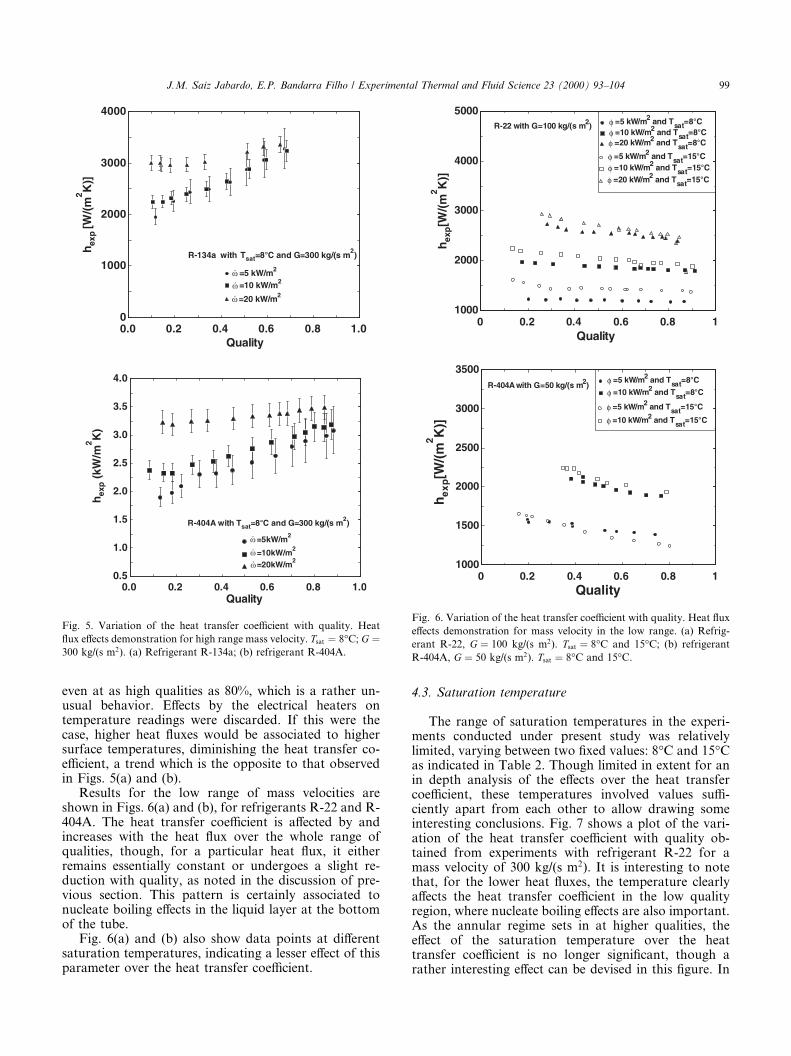
even at as high qualities as 80%, which is a rather un-usual behavior. E�ects by the electrical heaters ontemperature readings were discarded. If this were thecase, higher heat ¯uxes would be associated to highersurface temperatures, diminishing the heat transfer co-e�cient, a trend which is the opposite to that observedin Figs. 5(a) and (b).
Results for the low range of mass velocities areshown in Figs. 6(a) and (b), for refrigerants R-22 and R-404A. The heat transfer coe�cient is a�ected by andincreases with the heat ¯ux over the whole range ofqualities, though, for a particular heat ¯ux, it eitherremains essentially constant or undergoes a slight re-duction with quality, as noted in the discussion of pre-vious section. This pattern is certainly associated tonucleate boiling e�ects in the liquid layer at the bottomof the tube.
Fig. 6(a) and (b) also show data points at di�erentsaturation temperatures, indicating a lesser e�ect of thisparameter over the heat transfer coe�cient.
4.3. Saturation temperature
The range of saturation temperatures in the experi-ments conducted under present study was relativelylimited, varying between two ®xed values: 8°C and 15°Cas indicated in Table 2. Though limited in extent for anin depth analysis of the e�ects over the heat transfercoe�cient, these temperatures involved values su�-ciently apart from each other to allow drawing someinteresting conclusions. Fig. 7 shows a plot of the vari-ation of the heat transfer coe�cient with quality ob-tained from experiments with refrigerant R-22 for amass velocity of 300 kg/(s m2). It is interesting to notethat, for the lower heat ¯uxes, the temperature clearlya�ects the heat transfer coe�cient in the low qualityregion, where nucleate boiling e�ects are also important.As the annular regime sets in at higher qualities, thee�ect of the saturation temperature over the heattransfer coe�cient is no longer signi®cant, though arather interesting e�ect can be devised in this ®gure. In
Fig. 6. Variation of the heat transfer coe�cient with quality. Heat ¯ux
e�ects demonstration for mass velocity in the low range. (a) Refrig-
erant R-22, G � 100 kg/(s m2). Tsat � 8°C and 15°C; (b) refrigerant
R-404A, G � 50 kg/(s m2). Tsat � 8°C and 15°C.
Fig. 5. Variation of the heat transfer coe�cient with quality. Heat
¯ux e�ects demonstration for high range mass velocity. Tsat � 8°C; G �300 kg/(s m2). (a) Refrigerant R-134a; (b) refrigerant R-404A.
J.M. Saiz Jabardo, E.P. Bandarra Filho / Experimental Thermal and Fluid Science 23 (2000) 93±104 99
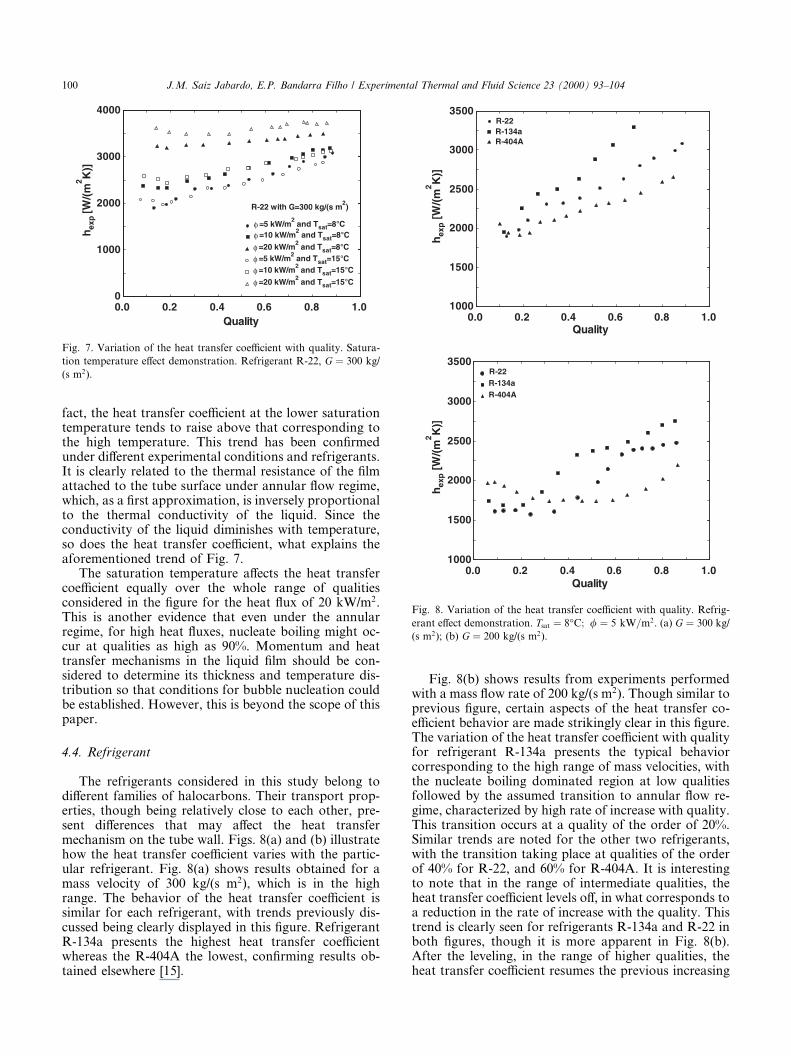
fact, the heat transfer coe�cient at the lower saturationtemperature tends to raise above that corresponding tothe high temperature. This trend has been con®rmedunder di�erent experimental conditions and refrigerants.It is clearly related to the thermal resistance of the ®lmattached to the tube surface under annular ¯ow regime,which, as a ®rst approximation, is inversely proportionalto the thermal conductivity of the liquid. Since theconductivity of the liquid diminishes with temperature,so does the heat transfer coe�cient, what explains theaforementioned trend of Fig. 7.
The saturation temperature a�ects the heat transfercoe�cient equally over the whole range of qualitiesconsidered in the ®gure for the heat ¯ux of 20 kW/m2.This is another evidence that even under the annularregime, for high heat ¯uxes, nucleate boiling might oc-cur at qualities as high as 90%. Momentum and heattransfer mechanisms in the liquid ®lm should be con-sidered to determine its thickness and temperature dis-tribution so that conditions for bubble nucleation couldbe established. However, this is beyond the scope of thispaper.
4.4. Refrigerant
The refrigerants considered in this study belong todi�erent families of halocarbons. Their transport prop-erties, though being relatively close to each other, pre-sent di�erences that may a�ect the heat transfermechanism on the tube wall. Figs. 8(a) and (b) illustratehow the heat transfer coe�cient varies with the partic-ular refrigerant. Fig. 8(a) shows results obtained for amass velocity of 300 kg/(s m2), which is in the highrange. The behavior of the heat transfer coe�cient issimilar for each refrigerant, with trends previously dis-cussed being clearly displayed in this ®gure. RefrigerantR-134a presents the highest heat transfer coe�cientwhereas the R-404A the lowest, con®rming results ob-tained elsewhere [15].
Fig. 8(b) shows results from experiments performedwith a mass ¯ow rate of 200 kg/(s m2). Though similar toprevious ®gure, certain aspects of the heat transfer co-e�cient behavior are made strikingly clear in this ®gure.The variation of the heat transfer coe�cient with qualityfor refrigerant R-134a presents the typical behaviorcorresponding to the high range of mass velocities, withthe nucleate boiling dominated region at low qualitiesfollowed by the assumed transition to annular ¯ow re-gime, characterized by high rate of increase with quality.This transition occurs at a quality of the order of 20%.Similar trends are noted for the other two refrigerants,with the transition taking place at qualities of the orderof 40% for R-22, and 60% for R-404A. It is interestingto note that in the range of intermediate qualities, theheat transfer coe�cient levels o�, in what corresponds toa reduction in the rate of increase with the quality. Thistrend is clearly seen for refrigerants R-134a and R-22 inboth ®gures, though it is more apparent in Fig. 8(b).After the leveling, in the range of higher qualities, theheat transfer coe�cient resumes the previous increasing
Fig. 8. Variation of the heat transfer coe�cient with quality. Refrig-
erant e�ect demonstration. Tsat � 8°C; / � 5 kW=m2. (a) G � 300 kg/
(s m2); (b) G � 200 kg/(s m2).
Fig. 7. Variation of the heat transfer coe�cient with quality. Satura-
tion temperature e�ect demonstration. Refrigerant R-22, G � 300 kg/
(s m2).
100 J.M. Saiz Jabardo, E.P. Bandarra Filho / Experimental Thermal and Fluid Science 23 (2000) 93±104
rate with quality. It must be stressed that this behaviorhas been observed in di�erent degrees depending uponboth the refrigerant and the mass velocity.
Some conclusions from the results shown in Figs.8(a) and (b) can be drawn and summarized as follows:1. The heat transfer coe�cient associated to refrigerant
R-404A attains the highest values whereas the lowestcorrespond to refrigerant R-22 in the low quality re-gion, where nucleate boiling is dominant. In thestrictly convective region (annular ¯ow regime) thistrends are inverted, with the highest heat transfer co-e�cient corresponding to refrigerant R-134a, and thelowest to R-404A.
2. As noted before leveling o� of the heat transfer coef-®cient has been observed in all the results obtainedfrom experiments performed in the range of highmass velocities. The onset quality and the range ofqualities at which this behavior is observed dependsupon the mass velocity and refrigerant, though it ismore apparent for the lower mass velocities. It couldbe related to an e�ective transition to the annular¯ow regime, in which case the assumed transition atlower qualities could be related to an intermittent slug¯ow regime. Naked eye observations through sightglasses installed at the TS entrance and exit did notallow to draw any consistent conclusion in that re-spect.
3. Results of Fig. 8(b), though qualitatively similar tothose of Fig. 8(a), show a clear trend toward transi-tion to the strati®ed ¯ow regime. This trend can clear-ly be noted for refrigerants R-404A and R-22, beingcharacterized by the heat transfer coe�cient levelingat higher quality and wider range of qualities. Thus,according to the results obtained in this study, themass velocity of 200 kg/(s m2) seems to constitute atransition value to the lower range of mass velocities.
4.5. An overview of the wall dryout
Post dryout heat transfer has received little attentionin the refrigeration ®eld, since, for all practical purposes,the heat transfer coe�cient does not di�er much of theone corresponding to the saturated vapor. Possible liq-uid entrainment in the center of the tube a�ects onlymarginally the heat transfer coe�cient, Barnhardt [16].Dryout studies have been carried out in the past inconnection with nuclear applications. In refrigeration ithas been the subject of some speculation in connectionwith the study of the feedback control system consti-tuted by the direct expansion evaporator and the ther-mostatic expansion valve, Wedkind and Stoecker [17],Huelle [18]. The post dryout region has been associatedto a peculiar behavior of tube surface and refrigeranttemperatures, which are typically non-steady. It must benoted that the major thrust of present investigation wasnot related to the dryout region. However, some resultsrelated to that region have been obtained that might beworth mentioning.
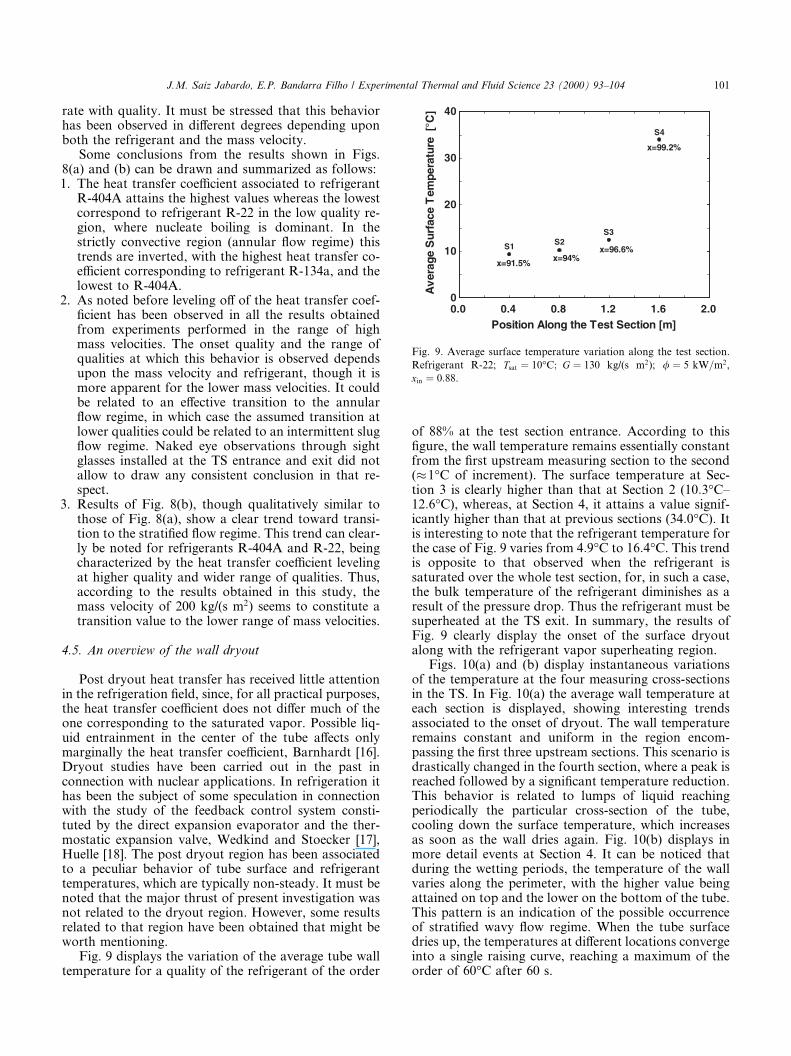
Fig. 9 displays the variation of the average tube walltemperature for a quality of the refrigerant of the order
of 88% at the test section entrance. According to this®gure, the wall temperature remains essentially constantfrom the ®rst upstream measuring section to the second(�1°C of increment). The surface temperature at Sec-tion 3 is clearly higher than that at Section 2 (10:3°C±12:6°C), whereas, at Section 4, it attains a value signif-icantly higher than that at previous sections (34:0°C). Itis interesting to note that the refrigerant temperature forthe case of Fig. 9 varies from 4:9°C to 16:4°C. This trendis opposite to that observed when the refrigerant issaturated over the whole test section, for, in such a case,the bulk temperature of the refrigerant diminishes as aresult of the pressure drop. Thus the refrigerant must besuperheated at the TS exit. In summary, the results ofFig. 9 clearly display the onset of the surface dryoutalong with the refrigerant vapor superheating region.
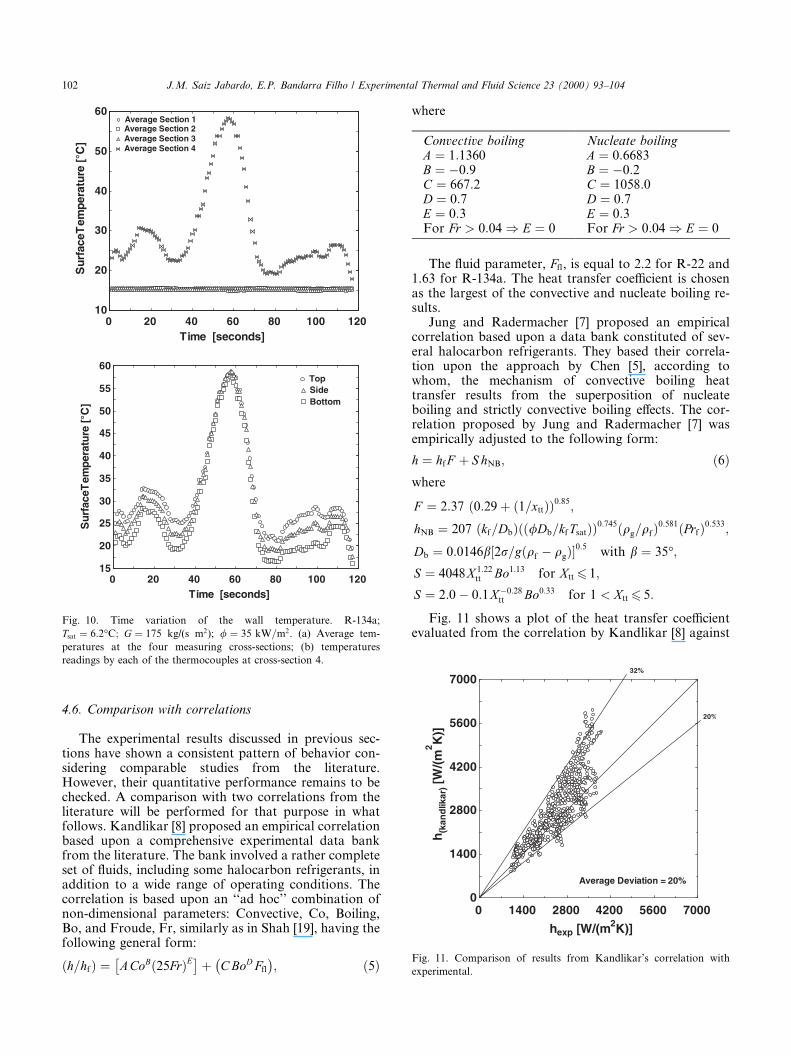
Figs. 10(a) and (b) display instantaneous variationsof the temperature at the four measuring cross-sectionsin the TS. In Fig. 10(a) the average wall temperature ateach section is displayed, showing interesting trendsassociated to the onset of dryout. The wall temperatureremains constant and uniform in the region encom-passing the ®rst three upstream sections. This scenario isdrastically changed in the fourth section, where a peak isreached followed by a signi®cant temperature reduction.This behavior is related to lumps of liquid reachingperiodically the particular cross-section of the tube,cooling down the surface temperature, which increasesas soon as the wall dries again. Fig. 10(b) displays inmore detail events at Section 4. It can be noticed thatduring the wetting periods, the temperature of the wallvaries along the perimeter, with the higher value beingattained on top and the lower on the bottom of the tube.This pattern is an indication of the possible occurrenceof strati®ed wavy ¯ow regime. When the tube surfacedries up, the temperatures at di�erent locations convergeinto a single raising curve, reaching a maximum of theorder of 60°C after 60 s.
Fig. 9. Average surface temperature variation along the test section.
Refrigerant R-22; Tsat � 10°C; G � 130 kg/(s m2); / � 5 kW=m2,
xin � 0:88.
J.M. Saiz Jabardo, E.P. Bandarra Filho / Experimental Thermal and Fluid Science 23 (2000) 93±104 101
4.6. Comparison with correlations
The experimental results discussed in previous sec-tions have shown a consistent pattern of behavior con-sidering comparable studies from the literature.However, their quantitative performance remains to bechecked. A comparison with two correlations from theliterature will be performed for that purpose in whatfollows. Kandlikar [8] proposed an empirical correlationbased upon a comprehensive experimental data bankfrom the literature. The bank involved a rather completeset of ¯uids, including some halocarbon refrigerants, inaddition to a wide range of operating conditions. Thecorrelation is based upon an ``ad hoc'' combination ofnon-dimensional parameters: Convective, Co, Boiling,Bo, and Froude, Fr, similarly as in Shah [19], having thefollowing general form:
�h=hf� � ACoB�25Fr�E� �� C BoD Ffl
ÿ �; �5�
where
The ¯uid parameter, Ffl, is equal to 2.2 for R-22 and1.63 for R-134a. The heat transfer coe�cient is chosenas the largest of the convective and nucleate boiling re-sults.
Jung and Radermacher [7] proposed an empiricalcorrelation based upon a data bank constituted of sev-eral halocarbon refrigerants. They based their correla-tion upon the approach by Chen [5], according towhom, the mechanism of convective boiling heattransfer results from the superposition of nucleateboiling and strictly convective boiling e�ects. The cor-relation proposed by Jung and Radermacher [7] wasempirically adjusted to the following form:
h � hf F � S hNB; �6�where
F � 2:37 �0:29� �1=xtt��0:85;
hNB � 207 �kf=Db���/Db=kf Tsat��0:745�qg=qf�0:581�Prf�0:533;
Db � 0:0146b�2r=g�qf ÿ qg��0:5 with b � 35°;
S � 4048X 1:22tt Bo1:13 for Xtt6 1;
S � 2:0ÿ 0:1Xÿ0:28tt Bo0:33 for 1 < Xtt6 5:
Fig. 11 shows a plot of the heat transfer coe�cientevaluated from the correlation by Kandlikar [8] against
Convective boiling Nucleate boilingA � 1:1360 A � 0:6683B � ÿ0:9 B � ÿ0:2C � 667:2 C � 1058:0D � 0:7 D � 0:7E � 0:3 E � 0:3For Fr > 0:04) E � 0 For Fr > 0:04) E � 0
Fig. 11. Comparison of results from Kandlikar's correlation with
experimental.
Fig. 10. Time variation of the wall temperature. R-134a;
Tsat � 6:2°C; G � 175 kg/(s m2); / � 35 kW=m2. (a) Average tem-
peratures at the four measuring cross-sections; (b) temperatures
readings by each of the thermocouples at cross-section 4.
102 J.M. Saiz Jabardo, E.P. Bandarra Filho / Experimental Thermal and Fluid Science 23 (2000) 93±104
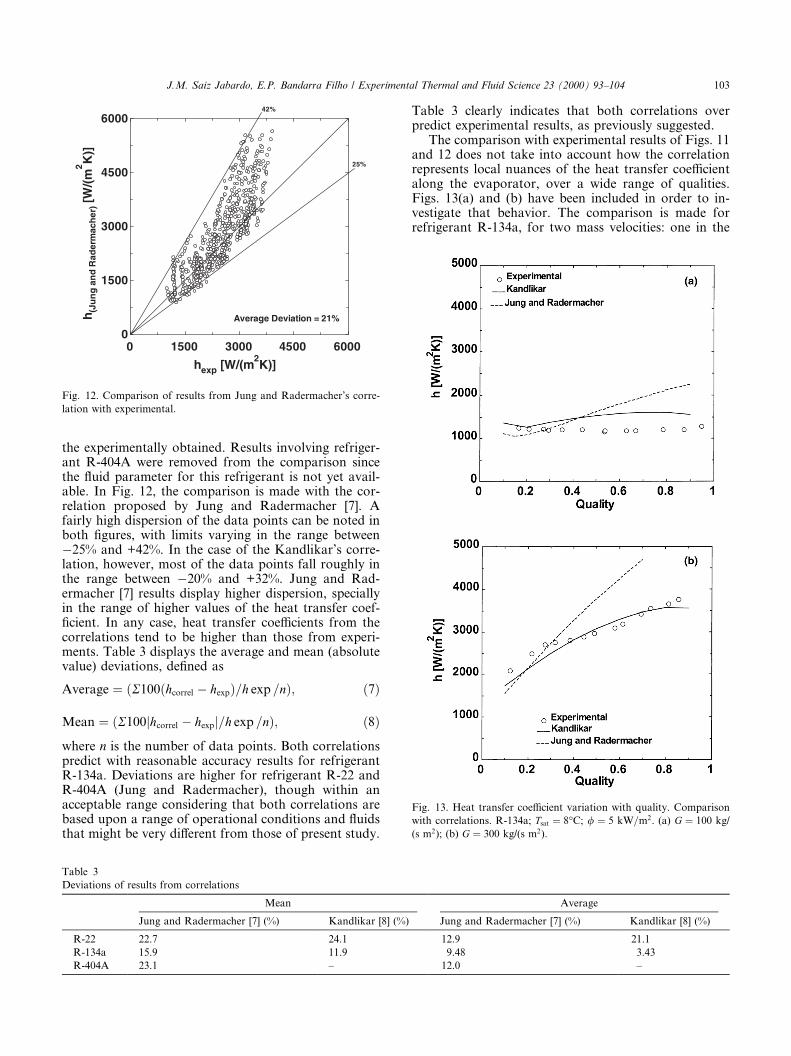
the experimentally obtained. Results involving refriger-ant R-404A were removed from the comparison sincethe ¯uid parameter for this refrigerant is not yet avail-able. In Fig. 12, the comparison is made with the cor-relation proposed by Jung and Radermacher [7]. Afairly high dispersion of the data points can be noted inboth ®gures, with limits varying in the range betweenÿ25% and +42%. In the case of the Kandlikar's corre-lation, however, most of the data points fall roughly inthe range between ÿ20% and +32%. Jung and Rad-ermacher [7] results display higher dispersion, speciallyin the range of higher values of the heat transfer coef-®cient. In any case, heat transfer coe�cients from thecorrelations tend to be higher than those from experi-ments. Table 3 displays the average and mean (absolutevalue) deviations, de®ned as
Average � �R100�hcorrel ÿ hexp�=h exp =n�; �7�
Mean � �R100jhcorrel ÿ hexpj=h exp =n�; �8�where n is the number of data points. Both correlationspredict with reasonable accuracy results for refrigerantR-134a. Deviations are higher for refrigerant R-22 andR-404A (Jung and Radermacher), though within anacceptable range considering that both correlations arebased upon a range of operational conditions and ¯uidsthat might be very di�erent from those of present study.
Table 3 clearly indicates that both correlations overpredict experimental results, as previously suggested.
The comparison with experimental results of Figs. 11and 12 does not take into account how the correlationrepresents local nuances of the heat transfer coe�cientalong the evaporator, over a wide range of qualities.Figs. 13(a) and (b) have been included in order to in-vestigate that behavior. The comparison is made forrefrigerant R-134a, for two mass velocities: one in the
Fig. 12. Comparison of results from Jung and Radermacher's corre-
lation with experimental.
Table 3
Deviations of results from correlations
Mean Average
Jung and Radermacher [7] (%) Kandlikar [8] (%) Jung and Radermacher [7] (%) Kandlikar [8] (%)
R-22 22.7 24.1 12.9 21.1
R-134a 15.9 11.9 9.48 3.43
R-404A 23.1 ± 12.0 ±
Fig. 13. Heat transfer coe�cient variation with quality. Comparison
with correlations. R-134a; Tsat � 8°C; / � 5 kW=m2. (a) G � 100 kg/
(s m2); (b) G � 300 kg/(s m2).
J.M. Saiz Jabardo, E.P. Bandarra Filho / Experimental Thermal and Fluid Science 23 (2000) 93±104 103
low range, 100 kg/(s m2), Fig. 13(a), and the other in thehigh range, 300 kg/(s m2), Fig. 13(b). It can be notedthat Kandlikar's [8] correlation represents fairly well thedata for the higher mass velocity, Fig. 13(b), showingrelatively low deviations with respect to the experimen-tal results. Deviations are higher for the lower massvelocity, Fig. 13(a), though qualitatively this correlationtends to represent the general behavior of the heattransfer coe�cient, showing a weak dependency uponthe quality. The correlation by Jung and Radermacher[7] over predicts the experimental heat transfer coe�-cient, specially in the high quality range. Both correla-tions tend to represent with certain degree of accuracythe aforementioned local minimum in the range of lowqualities, as clearly noted in Fig. 13(a). This trend istaken care by the correlations by shifting from nucleateboiling dominant regime to convective boiling [7,8].
5. Conclusions
The study reported herein has involved experimentswith three halocarbon refrigerants under a fairly widerange of operating conditions. E�ects of physical pa-rameters over the heat transfer performance of theworking refrigerants have been investigated. Whereasconsistent results have been obtained regarding previousestablished standards for refrigerant behavior, someinteresting new trends have been raised in connection tothe e�ects of the heat ¯ux and the mass velocity. Re-garding the ®rst, it has been found out that nucleateboiling e�ects may persist even at high qualities, spe-cially for higher heat ¯uxes. As for the latter, it seems tobe a transition pattern at mass velocities of the order of200 kg/(s m2) from the higher to the lower range of massvelocities, according to which, the two phase ¯ow regimeshifts from predominantly annular to the strati®edwavy. In addition to these, some e�ects over the heattransfer coe�cient have been disclosed related to boththe two-phase ¯ow regime in the low quality range andthe particular working refrigerant. An overview of thesurface dryout mechanism has been performed on thebasis of high quality experimental results obtained inthis investigation. A quantitative analysis of results hasrevealed that the heat transfer coe�cient from correla-tions by Kandlikar [8] and Jung and Radermacher [7]tends to be in the higher side as compared with thoseexperimentally obtained in present study.
Acknowledgements
The authors gratefully acknowledge the supportgiven to this investigation by Fundacß~ao de Amparo �aPesquisa do Estado de S~ao Paulo, FAPESP, Brazil.They would also like to extend their recognition toDuPont do Brasil for providing the much needed re-frigerants used in this research.
References
[1] J.G. Collier, J.R. Thome, Convective Boiling and Condensation,
third ed., Oxford Science, New York, 1996.
[2] W.R. Zahn, A visual study of two-phase ¯ow while evaporating
in horizontal tubes, Journal of Heat Transfer ± Transactions of
ASME, August 1964, pp. 417±429.
[3] W.S. Gouse, K.G. Coumou, Heat transfer and ¯uid ¯ow inside a
horizontal tube evaporator: Phase I, ASHRAE Transactions,
1966, pp. 152±161.
[4] J.M. Saiz Jabardo, E.P. Bandarra Filho, C.U.S. Lima, A new
correlation for convective boiling of pure halocarbon refrigerants
¯owing in horizontal tubes, RBCM, The Brazilian Journal of
Mechanical Sciences 21 (2) (1999) 245±258.
[5] J.C. Chen, Correlation for boiling heat transfer of saturated ¯uids
in convective ¯ow, I & EC Process Design and Development 5 (3)
(1966) 322±329.
[6] D.S. Jung, M. McLinden, R. Radermacher, D. Didion, A study
of ¯ow boiling heat transfer with refrigerant mixtures, Int. J. Heat
Mass Transfer 32 (9) (1989) 1751±1764.
[7] D.S. Jung, R. Radermacher, Prediction of heat transfer coe�cient
of various refrigerants during evaporation, Paper No. 3492,
ASHRAE Annual Meeting, Indianapolis, June 1991.
[8] S.G. Kandlikar, A general correlation for saturated two-phase
¯ow boiling heat transfer inside horizontal and vertical tubes,
Journal of Heat Transfer ± Transactions of the ASME 112 (1)
(1990) 219±228.
[9] K.E. Gungor, R.H.S. Winterton, A general correlation for ¯ow
boiling in tubes and annuli, Int. J. Heat Mass Transfer 29 (1)
(1986) 351±358.
[10] J.P. Wattelet, Heat transfer ¯ow regimes of refrigerants in a
horizontal-tube evaporator, Ph.D. Thesis, University of Illinois at
Urbana-Champaign, USA, 1994.
[11] N. Kattan, J.R. Thome, D. Favrat, Flow boiling in horizontal
tubes: Part 1 ± Development of a diabatic two-phase ¯ow pattern
map, Journal of Heat Transfer ± Transactions of ASME 120
(1998) 140±147.
[12] J. Wattelet, J.M. Saiz Jabardo, J. Chato, A.L. Souza, Experi-
mental evaluation of convective boiling of refrigerants HFC-134a
and CFC-12, in: Proceedings of the 28th National Heat Transfer
Conference, San Diego, CA, USA, August 1992.
[13] R.J. Mo�at, Describing the uncertainties in experimental results,
Experimental Fluid and Thermal Science 1 (1) (1988) 3±17.
[14] R.B. Albernethy, J.W. Thompson, Uncertainties in gas turbine
measurements, ISA I-483-3, 1980.
[15] N. Kattan, J.R. Thome, D. Favrat, Flow boiling in horizontal
tubes: Part 2 ± New heat transfer data for ®ve refrigerants,
Journal of Heat Transfer ± Transactions of ASME 120 (1998)
148±155.
[16] J. Barnhardt, An Experimental investigation of ¯ow patterns and
liquid entrainment in a horizontal-tube evaporator, Ph.D. Thesis,
University of Illinois, 1992.
[17] G.L. Wedkind, W.F. Stoecker, Transient response of the mixture-
vapor transition point in horizontal evaporating ¯ow, ASHRAE
Transactions, vol. 72, Part II, 1966, p. IV.2.1.
[18] Z.R. Huelle, New points of view on evaporator liquid supply
control by thermostatic expansion valves, The Danfoss Journal 1
(1968).
[19] M.M. Shah, Chart correlation for saturated boiling heat transfer:
equations and further study, ASHRAE Transactions, vol. 88,
Part I, 1982, pp. 185±196.
104 J.M. Saiz Jabardo, E.P. Bandarra Filho / Experimental Thermal and Fluid Science 23 (2000) 93±104


