
CITY OF ST. JOSEPH MISSOURI
THE ADOPTED BUDGET
FOR FISCAL YEAR 2019 – 2020


CITY OF ST. JOSEPH, MISSOURI
FY2019-2020ANNUAL OPERATING BUDGET
ANDPROGRAM OF SERVICES
ST. JOSEPH CITY COUNCILFront Row/LR: Brenda Blessing, Madison Davis, Bill McMurray, Russell Moore, Gary Roach
Back Row/LR: Kent O’Dell, Marty Novak, PJ Kovac, Brian Myers
J. Bruce Woody, P.E. City Manager
Cover Photo: Fire Station No. Eleven Photo courtesy of Ed Schilling, Multimedia Planner

TABLE OF CONTENTSPage
INTRODUCTIONPREFACE
Table of Contents iIntroduction to the City of St. Joseph iiiManagement Team and Advisory Bodies ivOrganization Chart vHow to Use This Document viBudget Adoption Ordinance [upon adoption]
BUDGET TRANSMITTALCity Manager's Budget Transmittal 1 - 1Revenue Discussion 1 - 12
CITY MISSION AND POLICIESCity Council Vision & Mission Statements 1 - 19How Our Policy Documents Relate 1 - 21Key Fiscal Policies 1 - 22
BUDGET SUMMARYBudget Process 2 - 1Budget Calendar 2 - 2Budget Overview, Fund Balance, Staff Summary 2 - 3
OPERATING DEPARTMENTSGENERAL GOVERNMENT 3 - 1
Mayor & City Council 3 - 4City Clerk 3 - 8City Manager's Office 3 - 11Human Resources 3 - 18Legal Services 3 - 21
ADMINISTRATIVE SERVICES 4 - 1Administration, Budget & Finance, Municipal Court Divisions 4 - 4Technology Services Divisions 4 - 17
PLANNING & COMMUNITY DEVELOPMENT 5 - 1Administration & Planning Divisions 5 - 4Community Development Divisions 5 - 10Inspections & Code Enforcement Divisions 5 - 19
PUBLIC SAFETY 6 - 1Police Department 6 - 4Fire Department 6 - 22Health Department 6 - 36
PARKS & RECREATION 7 - 1Parks Administration Division 7 - 4Park Maintenance Division 7 - 8Parks and Recrecation Divisions 7 - 11Parks Civic Facilities Divisions 7 - 22Municipal Golf & CIP 7 - 32
PUBLIC WORKS 9 - 1Administration, MPO, Street Enhancement Use Tax, Engineering & Street Divisions 9 - 4Airport Operations & CIP 9 - 25Public Parking 9 - 29Water Protection & CIP 9 - 33Mass Transit Operations & CIP 9 - 40Landfill Operations & CIP 9 - 42 i
OTHER DEPARTMENTS/PROGRAMS 10 - 1Non-Departmental & Cell Phone 10 - 3Gaming Initiatives and Museum Tax Initiatives 10 - 6TIF & EDC Programs 10 - 10
FUND SUMMARIESFund Budgeting Overview 11 - 1
General Fund 11 - 3Special Revenue Funds
Streets Maintenance Fund 11 - 12Parks Maintenance Fund 11 - 15CDBG Fund 11 - 18Gaming Initiatives Fund 11 - 21Special Allocation Fund 11 - 24Museum Fund 11 - 27Public Safety Sales Tax Fund 11 - 30
Enterprise FundsAviation Fund 11 - 33Parking Operations Fund 11 - 36Water Protection Fund 11 - 39Golf Fund 11 - 43Transit Fund 11 - 47Landfill Fund 11 - 50
Capital Projects Fund 11 - 53
SUPPLEMENTAL INFORMATIONDebt Discussion & Schedules 12 - 1
12 - 6
FIVE YEAR CIP PLANCIP Plan Adoption Resolution (after adoption)Capital Projrects & Planning Process Discussion CIP - 3Capital Expenditures Five -Year History CIP - 6FY2020 Total Capital Budget - Sources & Uses CIP - 7Capital Project Summary by Major Funding Source CIP - 9CIP Five-Year Purpose & Plan CIP - 17
ii
Fund Summary, Fund Balance, Line Item Revenue & Expenditure Summaries in the folllowing order:
Glossary

iii
St. Joseph, Missouri In 1843, the people of Black Snake Hills sought to designate their community as the seat of Buchanan County. As a result, Joseph Robidoux decided to have the land platted, ultimately choosing a design by Frederick Smith who in turn named the city St. Joseph. The official plat, signed by Joseph Robidoux was then sent to the Court of Common Pleas in St. Louis and on July 26, 1843, it was officially recorded as the town of St. Joseph.
The City of St. Joseph was incorporated as a village in 1851, a second class city in 1885, a first class city in 1909, and as a constitutional city charter government in 1961. The current Charter became effective on April 19, 1982, and provides that the municipal government shall be known as a Council-Manager government. A City Manager is appointed by the City Council and serves for an indefinite period as the City’s chief administrative officer. The City Charter also provides for the appointment of a City Clerk by the City Council and the election of a Municipal Court Judge by the citizens. The City Charter was amended August 9, 1989, to provide for a District Council system consisting of nine members including a Mayor and three Council members nominated and elected at-large, and five Council members elected by district. Council members serve concurrent four-year terms and are elected on a non-partisan basis.
The City Charter provides for a Council-Manager form of government and the following municipal services:
General Government Planning & Zoning
Public Safety Culture & Recreation
Public Works & Transportation Sanitation, Health & Social Services
Highways & Streets Public Improvements
These municipal services are provided by the following departmental organizations as defined in the City Administrative Code as follows:
City Council & Mayor Health
City Clerk Law
City Manager’s Office Parks, Recreation & Civic Facilities
Administrative Services Planning & Community Development
Fire Police
Human Resources Public Works & Transportation

(this page intentionally left blank)

MANAGEMENT TEAMAND ADVISORY BODIES
J. Bruce WoodyCity Manager
Administrative Services Tom MahoneyCity Attorney Bryan CarterCity Clerk Paula HeydeFire Chief Michael DalsingHuman Resources Alicia NolanParks, Recreation & Civic Facilities Chuck KempfPlanning & Community Development Clint ThompsonPolice Chief Chris ConnallyPublic Health Debra BradleyPublic Works & Transportation Andrew Clements
ADVISORY BODIES
ABCD Regional Planning Commission Law Enforcement Center CommissionAdministrative Violation Review Board Library BoardAdvisory Commission on Aging Mechanical Standards Board of AppealsAviation Board Museum Oversight BoardBuilding & Fire Prevention Code - Board of Appeals Operating Engineers BoardCommunity Police Advisory Parks & Recreation BoardDisability Services Board Personnel BoardDowntown Economic Stimulus Authority Planning CommissionDowntown Review Board Plumbers Examining & Appeals BoardElectrical Standards & Appeals Board Port AuthorityEnhanced Enterprise Zone Board Senior Citizens Foundation, Inc. BoardFire & Emergency Services Advisory Board Social Welfare Board of Buchanan Co.Housing Authority Tax Increment Financing CommissionHuman Rights Commission Tourism CommissionIndustrial Development Authority Traffic Commission BoardLand Clearance for Redevelopment Authority Tree BoardLandmark Commission Zoning Adjustment BoardLandmark Review Boardi
iv

v
ORGANIZATION CHART
Citizens of St. Joseph
Mayor and
City Council
Municipal Court Judge
City Clerk
Boards and
Commissions
City Manager
Police Fire
Public Works and Transportation
Planning and Community Development
Parks, Recreation & Civic Facilities
Administrative Services Health
City Attorney
Municipal Court
Services
Human Resources

HOW TO USE THIS DOCUMENT
The Annual Budget and Five Year Capital Plan communicate how the City intends to deliver governmental services to its residents. In order to present this information in a meaningful way, the budget document is organized into five main sections.
i. INTRODUCTIONBehind this tab are several sections designed to give the reader an introduction to the Cityof St. Joseph, instructions on how to use the budget document and the table of contents.
CITY MANAGER’S TRANSMITTAL LETTER & REVENUE DISCUSSIONThis Budget introduction communicates information relevant to the budgeting processincluding an assessment of the fiscal environment under which the City operates. Sincethese factors impact the budget as adopted, you may wish to review it prior to examiningthe remaining sections.
CITY MISSION AND POLICIESThe City’s Mission Statement and Council Action Plan are reproduced in their entirety.
OVERVIEWUse the Overview Section to obtain an overview of the budget process as well assummarized revenue and expenditure information for the City as a whole. Revenue,expenditure, fund balance and employment information is presented in a graphic formatadding visual significance to related budget information.
ii. OPERATING DEPARTMENTS BUDGET DETAILSUse the Operating Departments section to obtain revenue, expenditure and staffinginformation for each department. The divisions and/or programs within each departmentare detailed with both financial information and with statements on program missions, coreservices and public service work loads.
iii. FUND SUMMARIESUse the Fund Summary section to obtain an explanation of Fund Budgeting as used bythe City.
The section is designed to give the reader an overall view of each type of City fund and,within each fund, summary information on revenues, expenditures, and fund balance on athree year reporting basis.
Three major fund types are discussed in this section. They encompass the operatingcomponents of budget – General, Special Revenue, and Enterprise. The Capital Fund iscovered in more detail in the following section.
iv. SUPPLEMENTAL INFORMATIONUse this section to find information on Debt Service and a Glossary is provided.
v. CAPITAL FUND and FIVE YEAR CIP PLANThe current year CIP program and the Five Year CIP Plan is found following the CapitalFund Tab
vi

CITY MANAGER’S BUDGET TRANSMITTAL
1 - 1
April 26, 2019
Mayor Bill McMurray and Members of the City Council City of St. Joseph 1100 Frederick Avenue St. Joseph, Missouri 64501
Dear Mayor McMurray and City Council:
I am pleased to present to you the fiscal year 2020 (FY2020) Proposed Annual Budget.
The budget reflects City Council’s goals and priorities and is their single most important policy statement. This year’s $178 million budget includes all the city government’s proposed expenditures, but it is still a living document. While each year the annual budget provides a starting point for the upcoming fiscal year, the budget is amended throughout the year as Council approves various ordinances based on changing conditions such as one-time expenses, receipt of grants, unanticipated expenses, etc.
Performance among the various funds in FY2019 was mixed. The General fund took on many project-related expenses and revenues remain flat or declining while expenses for employee salaries and benefits continue to rise. The Mass Transit fund has a very healthy fund balance with a recent federal grant and despite the expenditure of funds for replacing part of the bus fleet.
The three enterprise funds of Aviation, Parking and Golf all need ongoing close attention this year due to the need for operating subsidies and/or declining fund balance. In contrast, the Landfill fund has performed quite well during FY2019 with increased tonnage received as a result of a decrease in tipping fees.
The Cell Phone fund revenue remains flat or slightly declining. The special allocation funds are performing consistently, but with no appreciable growth in the rate of revenue over last year. The Gaming fund revenues are down significantly due to flood damage that closed the casino floor for one month and the ongoing closure of the land-based portion of the casino that contains the restaurant and gift shop.
At the City Council’s direction, this year’s budget is smaller overall, as needed to produce balanced operating budgets. This was accomplished in the General fund largely through lower operating expenses and a reduction in capital projects. This was done in an environment of operating expenses otherwise being on the rise mostly due to personnel related costs, and operating revenues being flat or on the decline. The challenge is to pursue the many needs, and occasional wants, of our citizens while also addressing the responsibility to provide efficient and fiscally responsible public services. An annual budget must achieve a fine balance between the vast numbers of tasks to be accomplished and the limited amount of resources necessary to accomplish those tasks. Then once adopted, a budget also provides accountability for the use of those limited public resources.
This proposed budget and accompanying budget message is presented to you in accordance with Article VI, Section 6.3, of the City Charter. It is complete, except for any changes made by the City Council during

CITY MANAGER’S BUDGET TRANSMITTAL
1 - 2
the April/May budget work sessions and corrections, if any, to proposed revenues and expenditures that may be necessary through the date of budget adoption on June 17, 2019.
OPERATING BUDGET OVERVIEW – FY2020
The FY2020 operating budget shows a decrease in expenditures of 5.13% over that of FY2019.
The capital portion of the budget also displays a decrease from last year. The capital budget is down 16.09% from FY2019.
In FY2019, the 2014-2018 half-cent Capital Improvement Program (CIP) Sales Tax was winding down and fewer capital project from that fund source were being bid that year. This year contains CIP projects for the first year of the new 5-year cycle. But, I am also pleased that there are no new environmental compliance projects in the wastewater utility for FY2020, so the upward pressure on rates is significantly reduced. For the first time in over a decade, rates in the next two years will be in the low, single digits. Rates for FY2020 are recommended to only increase by 2% (overall average increase).
The combined effect for the overall budget is an 8.46% decrease over last year.
The proposed budget for FY2020 totals $178,323,916 and compares to the adopted annual budget for FY2019 as follows:
Expenditure Component Proposed Expenditure
FY2020
Adopted Expenditure
FY2019
Dollar Increase (Decrease)
Percent Increase
(Decrease)
Operating Expenditures $ 128,693,576 $ 135,656,318 ($6,962,742) -5.13%
Capital Improvements $ 49,630,340 $ 59,148,534 ($9,518,194) -16.09%Total: $ 178,323,916 $194,804,852 ($16,480,936) -8.46%
Operating Revenues The operating revenue component of the City’s FY2020 Proposed Annual Budget, net of Capital Project receipts, transfers, bonds, Special Allocation fund revenues and capital grants, are projected to decrease. Property tax revenue is approximately 10% of total revenue, up only slightly from last year. Annual growth in property tax valuations for the past five years have fluctuated between 1.34% to 1.9%. Hancock limitations restricts property tax growth to the lower of 5% or the consumer price index, which was 2.1%. Property tax is projected to be virtually the same in FY2020, with only a 0.4% gain in additional revenue.
Sales tax revenues represent 27% of the City’s total revenue. FY2019 is expected to finish the year flat, having just barely met projections. We are currently projecting no change in FY2020. I am increasingly concerned that operational expenses are increasing at a much faster pace than sales tax. Sales tax is a volatile revenue source and the retail market is experiencing intense changes as internet sales increase each year. The major percentage change in revenues continues to come from the use tax which voters approved in April 2015. Unlike sales tax which usually only varies 0.5-1% in any given year lately, use tax is heavily influenced by both sales and construction activity. We have seen double digit growth each of the first two

CITY MANAGER’S BUDGET TRANSMITTAL
1 - 3
years, with the growth in FY2019 projected to be 12.9% over last year. For our FY2019 program, budgeted revenue projections were $4,394,040, however we are anticipating receipts approaching $4.6 million in FY2020. This funding is committed to contracted street maintenance work so the city will continue to benefit from the increase in revenue with additional streets maintenance projects as a result.
Each year, we conduct a Cost of Service Rate Study whose purpose is to set wastewater utility user fees (sewer rates) for the following year. In FY2017, we completed the last of the pending environmental improvement projects when we added ammonia treatment to the treatment plant. Last year, we encumbered the cost of a major project associated with remediating our combined sewer overflow, the Blacksnake Creek Stormwater Separation Project. We are now entering an extended period of several years without multi-million dollar capital improvement projects. Therefore, I am very pleased to be recommending only a 2% rate change for next year. Further, rate projections into the following four years indicate that we should remain in the single digits, specifically 3%, 3%, 4% and 6%.
Meanwhile, other revenue sources remain basically flat compared to the current year’s receipts, including franchise taxes and most other major sources of revenue. Most license and permit fees remained stable, however, fine revenue had a dramatic drop of 30% in FY2018 when the state legislature instituted caps that lower fines schedules across the state. In the couple years since, fine revenue has stabilized and is projected to have a slight increase of about 7% next year. Fines only represent about 1% of total General fund revenues.
Operating Expenditures The net operating expenditure component of the City’s FY2020 Proposed Annual Budget (excluding Special Allocation Funds, CIP programs, cell phone expenditures) decreased by 2.44% or $2,977,624 below that adopted by the City Council for FY2019. Most of that reduction has come about in the General fund, and made possible by the following actions: 1) reduction in actual operating expenses through targeted reductions made by department directors, followed by an additional 2% reduction across all program line items made by the city manager, 2) reduction of six vacant positions and one filled position, 3) less conservative budgeting of salary and benefits by budgeting for 97.5% employment instead of 100% full employment (end-of-year actual expenses for salary and benefits typically come in around 4-6% lower than budgeted due to turn-over in staff associated with retirement and natural attrition.)
FY2020 will be the first time in several years that I am not recommending a Cost of Living Adjustment (COLA) for city employees. Health insurance rates have risen 9.8% this year ($522,000) and dental insurance rates have risen 13.3% ($26,000). Despite this significant cost, we have kept the service levels the same and absorbed all the additional cost for employee coverage. The city has been generous with COLAs in recent years and have invested in pension enhancements as well. Both actions have pushed up salary and benefits expenses, however to bring the General fund back in balance, we need to pause this year while we adjust expenses and deal with lower revenues.
While there are many capital and supplemental changes to the FY2020 operations budgets in the various funds, I have listed just a few of the larger ones that would be of more general interest to the Council below.

CITY MANAGER’S BUDGET TRANSMITTAL
1 - 4
In FY2020, there will be an overall reduction of 7.5 Full Time Equivalent positions and the addition of three new positions. Six of these positions were vacant at some point in the last quarter of FY2019, and were chosen to not be filled in FY2020 as a measure to reduce expenditures in the General fund. The positions
Selected Changes in Operating Expenditures – By DepartmentIncrease
(Decrease)
General Fund2.5% decrease in Salaries & Benefits (based on historical trends) (1,095,764)$ 2% decrease in all other expenses (based on historical trends) (205,480)$
Public WorksElectronic Scanning of Engineering Documents 35,000$ Replace Mower (SIMR) 35,000$ Brine/Sugar Beet Mixing & Management System, Applicator (SIMR) 39,000$ 1/2 Ton Crew Cab Truck (Airport) 30,000$ Three Mechanic Trucks (Water Protection) 170,000$ 15 Transit Buses (80% Grant Funded) 6,750,000$ Land Acquisition for Transit Station 600,000$ Haul Truck for Landfill 583,000$ Replacement of Bulldozer for Landfill 456,000$
PoliceMobile & Portable Radio Upgrades 216,000$ 5 Marked Police Vehicles 205,000$ Replace Consoles in the Communications Center 101,756$
HealthMid-Sized SUV 30,000$
Parks & Recreation Department1/2 Ton Pickup (Parks Maintenance) 32,000$ Two Mowers (Parks Maintenance) 70,000$ 24-Hour Access to Fitness Room (REC Center) 15,000$
Administrative Services DepartmentNew Storage Area Network & Host Servers 150,000$
General GovernmentCommunity Issues Initiative 5,000$
Planning & Community DevelopmentPurchase of Used Front-Wheel Drive Car 15,000$ Purchase of Used Truck 15,000$

CITY MANAGER’S BUDGET TRANSMITTAL
1 - 5
include two laborers in the Street Maintenance division; an equipment operator position and horticulturist position in the Parks department; a clerical position in the Legal department; and an accountant position in the Administrative Services department.
One and one-half additional occupied positions are being removed from the FY2020 budget. The full-time position is the capital projects coordinator. Investment in new software to track and present our Capital Improvements Program (CIP) projects effectively replaces most of the tasks of the position, and the remaining accounting tasks will be reassigned to the Administrative Services department. The part-time position is an administrative aide and will remain in the FY2020 Sewer fund budget through the end of December. It is not funded for the last half of FY2020 since it was a support position for the Blacksnake Creek project which will be completed this fall.
Two of the new positions are school resource officers. A St. Joseph School District levy issue was approved by voters on April 2, 2019, and included plans to fund 50% of the salary and benefits costs for two new school resource officers. These officers would be primarily assigned to the middle schools, but would also provide support to elementary schools, as needed. The city is budgeting revenue from the School District for 50% of their salary and benefits and is covering the remaining 50% from the General fund.
Enterprise Fund Balance All funds are monitored for changes in revenue and expenditures and resulting maintenance of minimum levels of fund balances. The past few years, we have closely monitored the low or declining fund balance of four of the enterprise funds. I am pleased to tell you that the Landfill division has significantly increased its revenue following the City Council’s decision to reduce tipping fees by $2.00 per ton to attract additional volume. This strategy has worked very well, however the remaining three divisions continue to be of a concern. The table below shows the ending operating fund balances for the Aviation, Parking, Landfill and Golf funds.
Change in Positions
Positions - Reduced FTEHorticulturist - Parks 1.00 Laborer - Streets (2) 2.00 Operator 3 (Senior Work Leader) 1.00 Secretary - Legal 1.00 Accountant - Admin Services 1.00 Capital Projects Coordinator 1.00 Part-Time Administrative Aide (WPC) 0.50 Total Reduced 7.50
Positions - Added TotalSchool Resource Officer (2) 2.00 Master Mechanic - Landfill 1.00 Total Added 3.00
Net Change (4.50)
Net Change in Expense ($240,775)

CITY MANAGER’S BUDGET TRANSMITTAL
1 - 6
Fund FY2015 FY2016 FY2017 FY2018 FY2019 Projected
FY2020 Projected
Aviation $180,400 $6,327 $0 332,818 $179,922 $75,073 Parking $46,400 ($26,049) $0 130,901 $153,229 $104,675 Landfill $1,251,600 $2,858,896 $3,633,902 $4,640,509 $4,884,387 $5,326,109 Golf $45,200 ($88,839) $0 $21,943 $21,940 $0
Aviation: The Aviation fund has struggled since FY2012 when the National Guard Bureau significantly reduced its Airport Joint Use Agreement (AJUA) payments to a reduced rate resulting in an annual loss of revenue of $107,000. Since then, an annual $20,000 operating subsidy from the General fund and $70,000 operating subsidy from the Gaming fund have been budgeted to help supplant the loss in revenue for the important services provided by this public works division. Starting in FY2021, revenue from land rents to the Water Protection division for their land application program on airport property will transition to a slightly lower rent structure for farming uses as the wastewater utility fully converts their bio-solids processing process to their new dryer system. While beneficial to the wastewater utility, this action will further hurt revenues for the Aviation Fund. While it is a goal to operate the Aviation division as an enterprise fund, Rosecrans Memorial Airport doesn’t have commercial air service so without that income stream it operates like most of its peer general aviation airports, needing financial subsidies to cover operating expenses.
In contrast, St. Joseph’s aviation program continues to greatly benefit from the presence of our largest tenant, the Missouri Air National Guard. Many large capital projects have, and continue to be, constructed at Rosecrans due to financial support from the military when working on infrastructure that supports their operations. In conjunction with Federal Aviation Administration (FAA) funding, the city’s costs are generally only 5-10% of any given project, with that money coming from the voter’s support of the half-cent Capital Improvement Program sales tax. The city is also working with its federal legislative delegation to seek federal donation of property and buildings from the Missouri Air National Guard south base as they continue their development of new facility on the north end of the airfield.
Parking: The Parking fund continues to struggle with the need for significant capital maintenance funding but has little program revenue. On the positive side, the structurally deficient and functionally obsolete parking garage at 9th and Felix was razed and replaced with a new structure in FY2018/FY2019. The capital expense for the city’s share of that project is being provided by the General fund, as is the operating expense for the new facility. The City and Mosaic share the cost of operation and maintenance of the parking floors of the garage. Mosaic is solely responsible for operation and maintenance of the first-floor retail space. This year saw the addition of a tenant in the first-floor retail space. Two additional spaces are still being marketed.
Meanwhile, Parking division revenues still do not cover the cost of operating the remaining two garages and several surface lots. Several years ago, City Council chose not to enact the recommendations of the Citizens’ Downtown Parking Committee to re-install parking meters in order to raise revenues to meet the costs of maintaining and operating the downtown parking lots and garages. The goal of that recommendation was to financially incentivize the longer-term parkers to use the garages and surface lots, leaving on-street parking for short-term parking. This also promotes turnover of parking in front of downtown businesses. Meanwhile, very few minor capital repairs have been made in the past few years

CITY MANAGER’S BUDGET TRANSMITTAL
1 - 7
and those few have been paid for from other funds. I recommend revisiting that topic with representatives of downtown property owners since downtown has grown significantly since that time.
Landfill: Revenue growth had been slowing in this fund as incoming tonnage had been on the decline. The decline was in part because the city landfill competes with a nearby transfer station in Doniphan County owned by Waste Management (WM). They, in turn, transfer the waste in long-haul trucks to deliver to its own Johnson County Landfill in Kansas. In FY2019 the City was approached by WM to discuss how additional tonnage could affect tipping fees. Those discussions led to a $2.00 per ton reduction of landfill tipping fees for all users, which prompted WM to redirect their significant volume to our local landfill and the eventual closing of their transfer station.
With the increasing revenue, the FY2020 proposed budget includes the replacement of several important pieces of capital equipment. Due to the nature of the work, these pieces of earth moving equipment are large and expensive. They are, however, vital to the operation, and their replacement has previously been delayed a year or more due to the slow revenue growth.
The increasing balance shown above also reflects the ongoing accumulation of designated monies set aside for closure/post-closure activities. Those funds are to pay for environmental monitoring and controls long after the landfill has closed and there are no longer any revenues being generated.
Municipal Golf Course: Nationally, the number of rounds of golf played continues to decline, putting continued downward pressure on revenues. The City made significant investments two years ago in the facility by constructing asphalt overlays of the cart paths and adding zoysia grass to the several additional fairways. That work came at the expense of some deficit spending in FY2017, which was offset by a subsidy from the General fund balance at year-end closing. We did not fund a request for additional golf carts in FY2018 due to insufficient revenue but did enter into a lease for a significant piece of course maintenance equipment (truckster/sprayer), which continues into FY2020. On the bright side, the FY2017 purchase of a golf simulator keeps customers coming back throughout the winter months and quickly paid for itself. Income from rental of the meeting/banquet room has also provided much needed revenue and encouraged additional events.
In FY2020 the Golf fund includes funding for additional golf cart rental for large events and also the replacement of the driving range netting. Overall, the Golf fund continues to just barely meets its revenue needs. I appreciate staff’s continued work to generate activities that bring new and existing users back to Fairview.
Capital Budget Overview – FY2020
The capital budget provides a multiyear plan that includes funding of projects for the current and next five fiscal years. Items in the capital budget are those that are greater than $5,000 in cost. The time span of the capital budget is the next fiscal year, plus five additional years, for a total of six years. Projects in the first year of the plan come from every department and nearly every fund. Projects in the outer five years are predominately those in the Sewer fund and the half-cent CIP sales tax fund, two funds that have project planning out beyond the current year.
FY2019 was the last year of the 2013-2019, half-cent Capital Improvement Program sales tax program. Last August, voters overwhelmingly approved the continuation of the CIP, with this cycle running from

CITY MANAGER’S BUDGET TRANSMITTAL
1 - 8
July 1, 2019 through June 30, 2024. This year’s capital program contains the first year of the new CIP program, so is up a little from last year, at $64,461,158.
The largest categories of capital improvements in FY2020 continue to be in the wastewater utility, aviation, half-cent CIP sales tax and mass transit areas. Many of those projects are funded from grants, especially those in aviation and mass transit. In aviation, we are again partnering with the Missouri Air National Guard for military construction funding this year for a rehabilitation project on the aviation apron. A major portion of next year’s overall capital program is again from the Mass Transit division where we are purchasing fifteen (15) more 30’ low-floor coaches, thanks to a federal grant. These new coaches will not only complete the replacement of our fleet, but will also help with expansion of the system by adding additional busses during peak times on our three main routes, which will reduce headways to ½ hour.
In the first year of the new CIP cycle, the largest single project is the design and construction of the new fire station number 8, to replace the existing station near 33rd and Mitchell. The new station will be located along Mitchell Avenue, east of I-29. In its new location, response times will decrease for residential, commercial and industrial areas in the southeast part of St. Joseph. The design of the new Hyde Park water feature (splash pad/spray park) will begin next year, in preparation for construction in FY2021.
The use tax program continues to perform well, and we anticipate having $4.6 million for contracted asphalt and concrete street maintenance.
The Landfill division will be purchasing several large pieces of equipment in support of regular operations and the construction of the next cell at the landfill. This expansion is within an area already permitted. Most of the work is being done by Landfill division staff. The FY2020 budget also includes funds for the purchase of some additional acreage adjacent to the landfill for additional buffer, as well as a source of soil for liner material.
Detail of the City’s projected capital projects’ spending for FY2020 can be found in the City Capital Projects section of the budget document.
Discretionary Expenditures
Being a service organization, a significant percentage of overall costs are salary and benefits. Additionally, much of our revenue is restricted or allocated to specific uses, leaving little discretionary funding. Most of the City’s discretionary revenue comes from the Gaming fund and the Cell Phone receipts (cell phone franchise revenue) which totals approximately 1.5% of the overall operating expenditure in the FY2020 budget. The remaining source of discretionary funding is the General fund. The ability to appropriate those funds depends on the health of the fund and a favorable fund balance.
Overall, total revenues in the General Fund are nearly flat, having only risen 9.7% in the last five years, while expenditures have risen 18.2% in the same period. This prompts the City to rely more and more on the Cell Phone and Gaming funds for capital expenses that can’t be fully supported through a department’s regular fund sources. Again this year, reductions in capital expenses have been the means by which budgets are balanced as the cost of utilities, fuel, payroll and other expenses rise. This is especially true in the enterprise funds. Also, the City has continued to look to the discretionary funds of Gaming or Cell Phone for many of those capital purchases.

CITY MANAGER’S BUDGET TRANSMITTAL
1 - 9
Unique to FY2020, there is the additional challenge of the 2019 flood which caused significant damage to the casino. The casino was completely closed from the middle of March until the middle of April, when it reopened with just the floating casino floor. The land-based portion of the facility which contains the restaurant, meeting rooms and gift shop remains closed while undergoing renovation from the flood. As a result, the FY2019 Gaming fund budget will end the year with an estimated $100,000 less in revenue. The FY2020 Gaming Fund budget is estimated to be $150,000 less in revenue due to ongoing renovations for the first 3-4 months of the fiscal year. Hopefully, the casino will open more quickly and these projected revenue losses are overly conservative.
This year, I am recommending $1,116,108 in Cell Phone funds for major purchases of replacement equipment, purchase of rolling stock and the purchase of other minor capital. $144,500 would go to the parks and recreation department, while $400,852 would be allocated to divisions in the public works department.
Over the past few years, Gaming revenues have slightly declined, with projections of $900,000 in annual revenue. The City Council has conservatively limited its use of Gaming revenues to one-time capital needs, recognizing that the fund source could easily shrink or be lost altogether, as we experienced in 2011, and now again in 2019. I will note that the City has increasingly relied on this source for several recurring contractual agreements with outside agencies. In a time when the General fund expenses are increasing faster than revenue, together with reduced revenue in the Gaming fund itself due to the flood, the FY2020 proposed budget recommends a significant reduction in these types of outside agency expenditures due to the needs for funding city priorities for capital expenses.
CELL PHONE INITIATIVES
15,000 10,000
205,000
30,000
15,000
Other Services 3,000 Human Rights Commission
Transfer to Streets Maintenance 50,000 Stormwater Grant (75% City/25% Resident)
70,000 32,000 6,000 Snow Plow for 1 Ton Truck5,000 Turbine Blower
216,000 101,756 Communication Center Consoles - Police
30,000
253,852 67,000 Mosaic Maintenance/Repair Costs
6,500
1,116,108$
Parks and Recreation 24-Hour Access Fitness RoomDrain Covers - Aquatic
Police Marked Police Cars (5)
Transfer to Golf Course Driving Range Netting
Health Health Department SUV
Building Development Building Inspector Vehicle
Transfer to Aviation 1/2 Ton Crew Cab Truck
Transfer to Public Parking Mosaic Obligation
Transfer to Parks Maintenance Mowers (2)1/2 Ton Pickup Truck
Transfer to Public Safety Mobile/Portable Radio Upgrades - Police

CITY MANAGER’S BUDGET TRANSMITTAL
1 - 10
GAMING INITIATIVES
Proposed Gaming Funded Initiatives
Contributions/Contracts - Recurring 21,310$ Festival Funding15,000 City 4th of July fireworks display30,000 Allied Arts Council
1,600 MoDOT Lease40,000 Public Education Spots & Cablevision Contract (Pub Info)
Chamber/Econ Dev 189,000 Chamber Economic Development Contract20,000 MO-KAN Contribution10,000 State Legislative Lobbyist (Mark Rhoads)10,000 Downtown Partnership Contract20,000 Community Alliance Membership
750 Great Northwest Day at the Capital, City's sponsorship10,000 Chamber Workforce Development
259,750
125,000 Legal Services - Outside Specialized Counsel (Legal)
20,000 Save Our Heritage Neighborhood GrantsHistoric/Landmark 150,000 Historic preservation grants outside of HUD-eligible areas
25,000 Landmark Commission Emergency building stabilization8,000 Landmark Commission Public & education outreach
203,000
80,000 Property Mnt clean-up, abatement, dangerous bldg issues
17,500 Innovation Stockyard7,000 Foundation Recovery
Contributions/Contracts - Once or Limited
TRANSFER TO GENERAL FUND
Nature Center: 40,000 Special ProgrammingNonDepartmental: 10,000 Contribution toward in-kind services supplied to spcl events
TRANSFER TO STREETS FUND
Stormwater Grant 50,000 Stormwater Match Grant 75% City/25% Resident
TRANSFER TO SPECIAL ALLOCATION FUND
City Sponsored TIFs: 5,000 As Needed - To cover City expenses until TIF revenues begin
TRANSFER TO AVIATION FUNDAirport Operations: 70,000 Operating Subsidy in support of Air Guard presence
TRANSFER TO PARKING FUNDParking Operations: 6,500 Reimbursement for lost revenue/waived fees at Civic Center
TOTAL PROPOSED 981,660$

CITY MANAGER’S BUDGET TRANSMITTAL
1 - 11
Fiscal Year 2020 Opportunities and Challenges
FY2020 will bring the start of the third in a series of new fire stations. With stations 9 and 11 having been completed in FY2019, it will be exciting to embark on the first major project of the new CIP cycle by construction this new facility.
FY2020 should also be remembered as a year of very low increases in wastewater utility rates at only 2%. Thanks to a multi-year lull in large capital projects scheduled for the next four years, future rate increases should remain in the low single digits for the three years following FY2020.
In FY2020, the first phase of the Riverfront Development Plan will be underway with the extension of utilities along Waterworks Road. This first phase will promote private investment in the corridor, which will be an important part of the overall plan.
MoDOT will also be completing their alternatives study on the I-229 bridge to determine which one of nearly 19 alternatives is appropriate for the future of this facility and important traffic corridor. The results will have important impacts to downtown, as well as riverfront development.
An important challenge for FY2020 will remain keeping General fund expenses stable or declining, in light of the struggle we have with very minor revenue increases. The General Assembly is debating three different bills related to internet sales tax, two of which could help restore a large portion of the sales tax revenue the cities in Missouri have lost to internet sales. I am cautiously optimistic that by sometime in FY2021, we may have a solution to that problem approved by the state.
The Public Safety Tax is now fully staffed with 20 new officers and salaries and benefits have improved with its help. The challenge going forward is that after FY2020, the Public Safety Tax fund will be fully dedicated to only salaries and benefits, with no additional room for capital equipment purchases. In fact, some of the expenses for salaries and benefits will roll over into the General fund as revenue reduction, putting further pressure on that fund to reduce expenses or find new or expanded revenue sources.
The sections immediately following this budget transmittal give you a detailed discussion on revenue trends, expenditure summaries, ending fund balance estimates and an overall budget summary. I look forward to our review of the proposed budget during the last week in April and the first week in May.
Respectfully Submitted,
J. Bruce WoodyCity Manager

(this page intentionally left blank)

REVENUE DISCUSSION
1 - 12
The City of St. Joseph, Missouri derives revenue from various sources including taxes, user fees, government grants and subventions, licenses and permits, fines and forfeitures, bond proceeds, investment earnings, and other less significant types of revenue including sales of fixed assets, insurance recoveries, special assessments, and donations. Due to the varying types of revenue, many different methods must be employed to project revenues. The projection methods selected depend on the nature and materiality of the revenue item and the period of time over which the revenue is projected. The specific revenue projection technique employed for any given revenue item is identified in the city’s quarterly reports and Revenue Manual.
Revenue Projection Techniques • Historical Data - This method predicts future revenue based on historical movements over time
and assumes that historical trends will continue in the future. Budget staff compiles a revenuehistory for the previous five years, determines average rate of change, and applies this rate ofchange to the previous year’s annual revenue amount.
• Current Data - This method predicts future revenue based on actual or annualized current yearrevenues and is often used when historical data and trends are not available or, if used, wouldresult in an inaccurate revenue projection.
• Facts & Circumstances - This method predicts future revenue on facts and circumstancesuniquely affecting the revenue item including actions promulgated by or undertaken with thirdparties. This method is often supported by certain documentation in the form of lease/rentalagreements, grant agreements, service contracts, legislative records, judicial findings, propertyappraisals, consultant’s reports, rate making authority rulings, government statistical reports etc.…And, finally, Administrative Services staff may adjust its projections to reflect the probable impacton revenues of anticipated changes in the economy, legislation, inflation, and demographics.
• Judgmental Estimates - this method relies on a person knowledgeable in the field, often adepartment director, who prepares a revenue projection based on awareness of past and presentconditions including fee changes, development plans, marketing campaigns, usage activity,frequency, volume, weight, and similar determinations. Examples include landfill and sewerrevenue where anticipated usage, weight, and volume are major revenue determining factors.
Who Prepares Revenue Projections? Revenue projections are prepared by department directors and budget staff and are approved by the City Manager as part of the annual budgeting process. Prior to submitting revenue projections to the City Manager, budget staff compares and reconciles revenue projections with those prepared by department directors.
Large bond issues anticipated in the Water Protection Fund, tend to distort the percentages other revenue sources provide to the operations of the City. Therefore, the following discussions exclude that amount for purposes of establishing major revenue sources and providing the percentage of support provided whenever such issues are anticipated.
Revenue Sources • Property Tax – Property taxes represent approximately 10% of the City’s budgeted resources.
Property taxes include real, personal, public safety, railroad & utility, merchants & manufacturers’,financial institutions’, and payments in lieu of tax. Such taxes are assessed at the prescribed taxrate per $100 of assessed value determined at 12%, 19%, and 32% of fair market value foragricultural, residential, and commercial property, respectively.

REVENUE DISCUSSION
1 - 13
Revenue Assumptions - Annual growth in property tax valuations for the past five years had fluctuated between 1.3% up to 1.9%. However, the FY2019 property tax revenue (tax year 2018) increased by 9.5%. A majority of this jump was due to TIF projects receiving significant assessments, including the Mosaic parking garage TIF.
Budgeting for FY2020 reassessment year has limitations due to the Hancock Amendment. It restricts property tax growth to the lower of 5% or the Consumer Price Index ceiling. The CPI for FY19 was 2.1%, but the City is at the maximum authorized rate ceiling on all tax levies except for the Health portion, so minimal growth is expected. New construction valuations and prior year tax collections are not restricted by the Hancock Amendment.
• Sales Tax – Sales taxes represent 27% of the City’s total revenue. Sales taxes include thelocal 1.5% sales tax (General Fund), 1/2% CIP sales tax (Capital Projects Fund),1/2% Public SafetyTax (Public Safety Fund), 3/8% Mass Transit sales tax (Transit Fund), 5% cigarette tax (GeneralFund), 3% hotel/motel tax (General Fund), 3% hotel/motel economic development tax (GeneralFund) and state fuel tax distributions (Streets Maintenance Fund). Effective July 1, 2015, the Cityadded the ability to collect the Use Tax (equal to the City’s current sales tax rate at any given time)on goods and materials bought outside of the state (General Fund with a little more than 90%designated towards Street Maintenance & Enhancement).
Revenue Assumptions – Historically existing sales tax revenues have ranged from slightly lower in FY2017 to growth of 1.5% in FY2016 and 1.4% in FY2018. The overall growth in sales tax revenues have come from passage of the special purpose sales taxes - Public Safety (1/2%) tax effective January 2014 and the Use Tax in July 2015. Staff continue to be optimistic that the local economy will sustain slight growth. Retail growth has slowed down, but there are several major industrial projects going forward to keep jobs in St. Joseph, which allows a relatively stable sales tax base.
However, at three-quarters of the way through this fiscal year, retail sales tax revenues are approximately 1.5% lower than over the same period in FY2018. We are cautiously optimistic that sales will meet budget projections. Use tax revenues have increased 12.9%
$16,643
$17,022
$16,989
$18,605
$18,680
$15,000
$16,000
$17,000
$18,000
$19,000
$20,000
FY2016 FY2017 FY2018 FY2019 FY2020
Property Tax Five Year Trend (In Thousands)

REVENUE DISCUSSION
1 - 14
over this same period. The FY2020 budget was set at an overall increase of one-half percent (0.5%) over FY2019 projected.
The five-year trend for sale tax revenues are shown in the chart above. The fluctuation in revenue beginning in FY 2016 was due to the passage of Use Tax. However, use tax revenues are designated for Street improvement purposes only and not general purposes. With more historical data behind us, current year Use Taxes are projected to remain strong at 5% above projected FY2019.
FY2016 FY2017 FY2018 FY2019 FY2020 Existing Sales Taxes (STx) 34,570 33,479 33,075 32,999 33,080 Riverfront Dvlpmnt Tax (RDTx) 614 591 614 682 682 Public Safety Tax (PSTx) 6,090 6,148 6,191 6,051 6,051 Use Tax-Enhanced Streets (UTx) 3,433 3,905 3,889 4,305 4,509 Total Sales Taxes 44,093 44,123 43,769 44,037 44,322
$44,093 $44,123 $43,769 $44,037 $44,322
20,000
25,000
30,000
35,000
40,000
45,000
50,000
FY2016 FY2017 FY2018 FY2019 FY2020
In T
hous
ands
of D
olla
rs
Five Year Sales Tax Trend
0
10,000
20,000
30,000
40,000
50,000
FY2016 FY2017 FY2018 FY2019 FY2020
Contribution of Recent Sales Tax (In Thousands)
(STx) (RDTx) (PSTx) (UTx)

REVENUE DISCUSSION
1 -15
Hotel/Motel tax revenue has been very unstable over the past ten years. Revenue tends to follow the attractions within the St. Joseph and the Kansas City areas. Solar Eclipse traffic resulted in a slight increase in fiscal year 2018. Trails West and the Chief’s camp also generate additional tax revenue. Another positive note was the addition of the Fairfield Inn on I-29. This is the first new hotel in many years. FY2020 Hotel/Motel tax projections are expected to remain at FY2019 level.
Flooding along the Missouri River is expected to cause some disruption in FY2019.
Current year motor fuel tax revenues are projected slightly lower than FY2018 actual levels. This may change with the recent rise in motor vehicle fuel prices. Projections for FY2020 were reduced as well.
• Utility Taxes – Utility taxes (franchise fees) represent 4.5% of total City revenue and areassessed to private utility companies on gross receipts collected from customers and thenforwarded to the City on a monthly or quarterly basis. The electric franchise fee is determinedbased on a declining block scale ranging from 6.5% to .5% depending on usage. Other franchisefees are fixed as percentage of gross receipts as follows: steam - 1/2%, telephone - 7%, cable -5%, water - 6.5%, and gas - 6.5%. An additional franchise license fee of 1% is assessed on water,gas, and electric receipts and is dedicated to mass transit operations.
Revenue Assumptions - Annual growth in Franchise Fees are very difficult to project using historical revenue patterns. Therefore, a three-year average is used. Fluctuations in franchise fee revenues correspond to changes in annual weather conditions and rate increases (or decreases) by individual utilities, as well as restrictions imposed by State Statutes and Federal legislation.
The revenue that would normally have been recognized due to extended winter weather in FY2019 is being offset by an adjustment of KCP&L gross receipts for the prior calendar year and going forward. The reduction is due to the 2018 federal corporate tax decrease being passed on to customers.
$7,337 $7,572 $7,437 $7,251 $7,251
$6,259 $6,295 $6,497 $6,351 $6,351
$5,000
$6,000
$7,000
$8,000
FY2016 FY2017 FY2018 FY2019 FY2020
In T
hous
ands
of D
olla
rs
Franchise Revenue Five Year Trend
Franchise FeesMinus Cell Phone Revenue

REVENUE DISCUSSION
1 - 16
The chart above shows the impact of cell phone revenues and the bottom line reflects the history of utility taxes without the cell phone. As you can see, revenue been unstable the last three fiscal years. Revenues will remain unclear as the tolling agreements with many providers ends on May 31, 2019 and negotiations begin for extension.
The FY2019 budgeted franchise revenues are estimated as follows: Electric and gas franchise taxes are averaging slightly higher at a 1.5% increase. Although the last year has been relatively dry, water revenues continue to decline. Telephone estimates, excluding cell phone revenues, were based on the current year projections with a slight increase from the prior year. In FY2017, cell phone revenue fell below $1 million. Historical cell phone revenue has been on the decline since FY2008 with the last of the settlements. City staff are working with outside counsel to audit several telecom revenues to ensure exemptions are appropriate. Federal legislation has also caused a reduction as some gross revenues are now exempt from the gross sales calculation. Legislation also may potentially affect cable revenue. Cable revenues have been falling steadily since FY2012.
• User Fees - User fees represent 26% of total FY2020 City budgeted revenues and arecharged for civic facility rents, downtown and on-street public parking, building inspections,recreational activities (swimming, ice skating, golf, athletic leagues, etc.), casino gaming taxes,bus fares, sewer user fees, landfill tipping fees, and various other fees for service.
Revenue Assumptions – Ownership changes, floods and the economy have had a major effect on gaming revenues over the past ten years. The casino revenue remains flat. Although admissions revenue has declined over the past few fiscal years, gaming has increased slightly. FY2019 and FY2020 revenue remains unsure with the spring flooding in St. Joseph and upstream.
Sewer fees are determined by an annual cost of service study prepared by outside consultants. FY2019 rates were kept at the FY2018 levels, a sigh of relief for users. The FY2020 study is currently under review. The June 2018 Study recommended a 3.0% increase in July 2019.
Historically, the City was required to take sewer billing back from the local water company in fall, 2012 as the company made a nationwide decision to stop billing for sewer customers. An annual review of the Collection Policy is performed to keep pace with any ongoing concerns regarding delinquent accounts. Staff send delinquent accounts to the City’s
$35,864 $38,423 $42,677
$42,436 $42,774
$20,000
$30,000
$40,000
$50,000
$60,000
FY2016 FY2017 FY2018 FY2019 FY2020
In T
hous
ands
of D
olla
rs
Rents & User Fees Five Year Trend

REVENUE DISCUSSION
1 - 17
contracted collection agency monthly. Utility billing staff also continue to bill Country Club Village’s wastewater customers per Billing and Collection Agreement.
In March 2018, a landfill tipping fee study was performed by Blackstone Environmental, Inc. Staff recommended lowering the rate by $2.00 per ton from $34.00 to $32.00, with projected revenues to increase as haulers would bring in increased tonnage. The scenario has proven correct as landfill revenues continue to climb.
The prior increase in October 2013 was $4.00 per ton from $30.00 per ton. Revenues have been on the rebound since FY2016 with increased tonnage from National Beef and WasteManagement. WasteManagement continues to be the largest hauler to the landfill. The tipping fees in St. Joseph remain the second lowest in Missouri.
Based upon current trends, the FY2019 projected revenue reflects a 7.0% increase over FY2018 actual revenue. FY2020 is projected at 2.5% increase over projected FY2019. This is despite the lowering of the tipping fees in July 2018. (Landfill revenue has historically been significant enough issue to display trends separately.)
• Grants - Grant revenues consist primarily of: federal Community Development Block Grant(CDBG) funds for programs designed to assist low and moderate income individuals; FederalTransit Administration (FTA) operating and capital outlay assistance for the city’s public transitsystem; Federal Aviation Administration support for Rosecrans Airport improvements; and ofFederal Economic Development Administration (EDA) for qualified infrastructure improvementsrelated to economic development initiatives.
Revenue Assumptions - Historical revenue patterns and trends are only marginally useful when projecting future grant revenues. Annual federal funding of CDBG programs remain questionable with possible complete budget cuts coming. Some grant funding is based on funding applications pending and/or approved for specific projects and program activities. Increases and decreases in total grant revenue often correspond with increases and decreases in capital projects funded by grants. Grant amounts are based on known or anticipated amounts at this time. Unbudgeted grants received during the year result in an amended budget to recognize the revenue and intended expenditures tied to them.
3,1652,748 2,730
2,962
3,5173,931
4,6154,972 5,100
$2,000
$3,000
$4,000
$5,000
$6,000
FY2012 FY2013 FY2014 FY2015 FY2016 FY2017 FY2018 FY2019 FY2020
In T
hous
ands
of D
olla
rs
Landfill Tipping Fees

REVENUE DISCUSSION
1 - 18
• Licenses/Permits/Fines - Licenses and permits are charged to specific individuals based onthe value of service provided. Licenses are issued for occupational licenses, liquor licenses, doglicenses, trade licenses/examination fees, and garage sale licenses. Permits are issued for trashhauling, septic tanks, food establishments, street cuts, and alarm monitoring. Fine revenue isgenerated as a byproduct of the city’s effort to reduce violations of its code of ordinances. Overall,these sources generate 1% of the City’s revenues.
Revenue Assumptions – Most license and permit revenues remain fairly stable. Revenue estimates are based largely on the experience and projections of the responsible departments. Given the slight rally in the economy, revenues for inspection fees and plan review have been held steady.
Fine revenue may have finally stabilized. With a slight increase in number of citations issued, revenues are projected at a slight increase over FY2018 actual revenue. The plummet over the past two years was due to State legislation restricting maximum fines. Most of this is a result of the legislation enacted after the Ferguson, MO case. It appears that they may be reversing some of the maximum fines in the future, but projections remain skeptical.
• Interest/Other - Interest revenues consist primarily of interest earned on operating and capitalproject cash reserves. Lesser amounts of interest are derived from special assessments andaccounts receivable. Other revenues are generated from special assessment principal collections,sale of fixed assets, insurance recoveries, and reimbursements of prior year expenditures.
Revenue Assumptions - Interest earnings relate most specifically to the amount of expected cash reserves, fund balances, and interest rates rather than to historical interest income totals. Much of what is ultimately contingent in nature. Due to the contingent nature of insurance recoveries, refunds of prior year expenditures, and sale of fixed assets, such revenues are usually not included in the Annual Budget.
• Sale of Bonds - Bond sales occur intermittently in response to the funding requirements of capitalprojects and capital outlay initiatives.
Revenue Assumptions - Bonds sales most often occur in response to individual capital project and capital outlay funding initiatives with little or no relationship to prior year bond sales.
$828
$1,077
$1,788
$2,121
$1,668
0
500
1,000
1,500
2,000
2,500
FY2016 FY2017 FY2018 FY2019 FY2020
Thou
sand
s
Five Year Interest Trend

(this page intentionally left blank)

Vision Statement: St. Joseph, a thriving and progressive community with nationally recognized history, providing opportunities for its citizens.
Mission Statement: The City of St. Joseph is dedicated to investing in people, creating a better place and growing the prosperity of its citizens.
Invest in PeopleReduce crime Support police department crime reduction plans Educate public regarding crime rates, trends and progressReduce homelessness Support and actively participate in United Way efforts to address homelessness Revise permitting process to alleviate geographic clustering of homeless servicesDemonstrate support for workforce development Support the St. Joseph School District and community partners in education Promote workforce development opportunities through City communications
Create a Better Place Promote and advance Riverfront Development Leverage established funding to advance riverfront development Invest in riverfront infrastructure development to increase access Promote business development and economic opportunities near riverfrontPromote Community Enhancements and Property Maintenance Institute an abandoned property fee Update City policy and regulation of blighted properties and trash disposal Partner with civic leaders to launch citywide education and clean-up campaignDesign and implement beautification of Parkway and Parks
Identify and implement beautification plans for parkway and select parks Implement parks and recreation programming for youth and all ages Promote and advance future development of the urban trail systemPromote neighborhood associations, watches and clean-ups Support establishment and growth of neighborhood associations Sponsor neighborhood clean-ups as part of citywide clean-up campaignPromote development of downtown and the Frederick Avenue entertainment district Support the goals of those interested in developing and enhancing downtown and the Frederick Avenue entertainment districtDevelop a five-year environmental plan Coordinate with Sustainable Environment Advisory Committee as it creates and helps implement a five-year plan
Grow Prosperity Attract better paying jobs through use of economic development tools Support economic development work of the Chamber of Commerce Leverage economic development tools to promote business developmentEndorse Imagine St. Joseph 2040 community planning process Adopt Council resolution endorsing Imagine St. Joseph 2040 Collaborate with Community Alliance to advance Imagine St. Joseph 2040 plans
Strategic Plan 2018 – 2022
Focus areas identified through Imagine St. Joseph 2040 community planning process
1-19

HOW OUR POLICY DOCUMENTS RELATE
Zoning Ordinance Downtown Master Plan Precise Plan
+
City Council Action Plan Code of Ordinances
Annual Operating
Budget Administrative Code
Departmental Policies
Personnel Code Budget Transfer Ordinance Investment Policy Procurement Policy
Employee Performance Appraisal System Affirmative Action Plan Loss Prevention Policy Labor Contracts
- FOP Local 77, IAFF, SEIU, Local1290 Capital Asset Policy Procurement Card Policy Travel and Other Business Expense Policy Fund Balance Policy Debt Management Policy Write-Off & Collections Policy
General Administrative
Emergency Operations Plan Stormwater Management Policy
Enterprise Community Strategic Plan Land Use Plan Community Partnership Strategy & Consolidated
Plan (CDBG)
Citizens/Voters
Mayor & City Council
CITY CHARTER
City Manager &
City Staff
Department Service Plans
5 Year Capital
Improvement Plan
Administrative Services
Planning & Community Development
Public Health & Safety (Police/Fire/Health/Property Maintenance)
Recreation Park Maintenance Policy
Public Works/ Transportation
Airport Operations Manual Solid Waste Management Plan Long Range Transportation Plan Transit System Service Plan Street Maintenance Rating System & Policy
Financial Disclosure Requirements for Municipal Officials
Media Policy Resident Request System
Community Alliance Plan
Code Ordinances Health Ordinances
1 - 21

KEY FISCAL POLICIES
FUND BALANCE This fund balance policy applies to all city’s fund balance and reserves. The objective of establishing and maintaining a fund balance policy is for the city to be in a strong fiscal position that will (1) provide sufficient cash flow for daily financial needs, (2) secure and maintain investment grade bond ratings, (3) offset significant economic downturns or revenue shortfalls, and (4) provide funds for unforeseen expenditures related to emergencies.
In February, 2009, Governmental Accounting Standards Board (GASB) issued GASB Statement No. 54, Fund Balance Reporting and Governmental Fund Type Definitions effective for fiscal periods beginning after June 15, 2010. This standard created new classifications for fund balance based upon constraints placed on the use of current fund balance and redefines governmental fund type definitions effective for the City of St. Joseph for fiscal year ending June 30, 2011.
Minimum Fund Balance General Fund – The General Fund is used to account for resources traditionally associated with government which are not required legally or by sound financial management to be accounted for and reported in another fund.
The City shall strive to maintain a fund balance level in the General Fund equal to 10% of annual expenditures. The purpose for maintaining this balance will be for meeting emergencies arising from (1) the loss or substantial reduction in actual revenue collections over anticipated amounts (2) unexpected expenditures due to natural disasters or casualty losses (3) non-budgeted expenditures for the satisfaction of court judgments and litigation costs and (4) conditions that threaten the loss of life, health or property within the community.
The availability of resources in other funds and the potential drain on the General fund resources from other funds could affect the necessary level of minimum unrestricted fund balance. The availability of resources in other funds may reduce the amount of unrestricted fund balance needed in the General fund, just as deficits in other funds may require that a higher level of unrestricted fund balance be maintained in the General fund.
All other funds, including Special Revenue Funds, Debt Service Funds, and Capital Project Funds do not have a fund balance requirement. Fund balances in these funds are dictated by revenue sources and are equal to a schedule of expenditures and capital projects.
Special Revenue Funds – Special revenue funds are created to account for the proceeds of specific revenue sources that are legally restricted to expenditure for specific purposes. The amount of any reservation of fund balance shall be governed by the legal authority underlying the creation of the individual funds.
Debt Service Fund – Debt service fund is created for very specific reserve amounts
1 - 22

KEY FISCAL POLICIES
as part of the ordinance or resolution which authorizes the issuance of the bonds. Reserve requirement for any outstanding bond issue will be consistent with the ordinance or resolution authorizing the issuance of the bonds.
Capital Projects Fund – Capital projects fund is created to account for resources designated to construct or acquire capital assets and major improvements. These projects may extend beyond a single fiscal year. However, at a minimum, the fiscal year end reserved fund balance, and estimated revenues for the ensuing fiscal year must be sufficient to meet all outstanding fund encumbrances.
The City will periodically review of the sufficiency of the minimum fund balance levels in all funds.
Order Of Resource Use The City will classify its fund balances based on the nature of the particular net resources reported in a governmental fund and on the constraints placed on their use. It is the policy of the City to utilize the restricted fund balance for a specific purpose prior to unrestricted fund balance when more than one fund balance resource is required. Unrestricted fund balance will be maintained for necessary and unexpected expenditures. With this policy, the City will consent to committed amounts first followed by assigned funds before allocating unassigned net resources when more than one unrestricted resource is required.
This policy shall recognize the financial importance of a stable and sufficient level of fund balance. In the event that the fund balance is so calculated to be less than the policy anticipates for minimum required balances, the City will strive to adjust budget resources in the subsequent fiscal years to restore the balance. Whenever an operating fund balance falls below the level established above, the City will restore through revenue allocations or expenditure reductions back to the allowable level.
The City will strive to develop and maintain a diversified and reliable revenue stream so as to avoid becoming overly dependent on any single source of revenue. Efforts will be directed to optimize existing revenue sources while periodically reviewing potential new revenue sources. Any amounts in an operating fund balance that exceed the appropriate level of that fund may be utilized in the following year’s operating budget for one-time or limited purposes.
The City Manager is directed to make recommendations to the City Council with the proposed budget a plan to restore the minimum requirements. (See specifics under the Revenue and Expenditure policy sections below.)
Stabilization Arrangements Appropriation from fund balance shall require the approval of the City Council. If fund balance is nearing its minimum threshold, such appropriations shall be only for one time expenditures and not for ongoing and routine operating expenditures. It should
1 - 23

KEY FISCAL POLICIES
be used to insure adequate reserves, respond to unforeseen emergencies, protect from revenue shortages, other contingencies, and overall financial stability.
Authority To Commit Fund Balance The City Council is the highest level of authority and any committed amounts will be imposed by Ordinance.
Authority To Assign Fund Balance The authority to assign fund balance for specific uses will be delegated to the City Manager and/or the Director of Administrative Services.
Unlike committed fund balance, the action taken to assign fund balance may be made after year end.
The City will classify fund balance at year end for financial reporting purposes. Thus only current, and not future, net resources are classified. Typically the subsequent year’s budgeted expenditures are expected to be paid from the subsequent year’s revenues and not the current reporting year’s ending fund balance. On occasion, the City will “deficit” budget, or in other words, budget more expenditures than anticipated revenues and drawdown beginning fund balance for the subsequent year. An appropriation of existing fund balance to eliminate a projected budgetary deficit in the subsequent year’s budget in an amount no greater than the projected excess of expected expenditures over expected revenues satisfies the criteria to be classified as an assignment of fund balance. (6/4/2007, rev. 6/13/2011)
BUDGET POLICIES
Operating Budget Policies 1. Balanced Budget – Current revenues will be sufficient to support current
operating expenditures.
2. Operating Deficits - Annual fund net operating deficits, a condition in whichannual operating deficits exceed annual operating revenues, shall not be allowed for any purpose other than one that is temporary, minor and would not cause operating fund balance to be reduced below 5% of annual budgeted operating expenditures.
3. The City will avoid budgetary and accounting procedures that balance thecurrent budget at the expense of future budgets. (6/4/2007)
Expenditure Policies 1. In order to meet the operating budget policies above, the following
protocols shall be followed when developing annual operating budgets: a. Annual increases to employee health insurance at the fund level shall not
exceed 15%.
1 - 24

KEY FISCAL POLICIES
b. Annual increases to other employee benefit categories at the fund levelshall not exceed 2%
c. Annual increases to other operating expenditures at the fund level shall notexceed 2%.
d. Annual service expansions shall not be allowed if those expansions relyupon revenue sources that are temporary in nature or provide for less than 100% of the full amount needed to operate that program or activity.
e. The addition of new employee positions will only be requested after serviceneeds have been thoroughly examined and it is substantiated that the additional staffing will result in increased revenue, enhanced operating efficiencies, or the achievement of specific objectives approved by the Council. In no event shall an increase in staffing levels be allowed to bring fund balance below the established target for any operating fund.
2. In the event that item 1 protocols are not sufficient to achieve theaforementioned fund balance and operating budget objectives, the City Council shall consider the following actions:
a. Additional fees and revenues (see Revenue Policies),b. Adjust municipal programs and activities; explore alternate means of service
delivery, procurement options, etc. These may or may not require a reduction in budgeted positions, active or vacant. To the extent feasible, personnel cost reductions will be achieved through attrition and reassignment.
3. Employee Compensation - The City will strive to provide for an annualincrease to employee compensation in accordance with the City of St. Joseph Employee Compensation Plan. In the event the protocols and actions described above are not effective, only then shall the City Council forego employee compensation adjustments in accordance with the Employee Compensation Plan. (6/4/2007)
Revenue Policies 1. One-Time Revenues – One time revenues shall be used only for one-time
expenditures (including capital expenditures). The City will avoid using temporary revenues to fund on-going programs and activities.
2. Grants – The City shall actively pursue federal, state and other grantopportunities when deemed appropriate. Before accepting any grant the City shall thoroughly consider all implications related to costs associated with complying with the terms of the grant agreement and the ongoing obligations that will be required in connection with the acceptance of the grant. Programs financed with grant monies will be monitored and the service program will be adjusted to reflect the level of available funding. In the event of reduced grant funding, City resources may be substituted only after all program priorities and alternatives are considered during the budget process.
1 -25

KEY FISCAL POLICIES
3. Revenue Diversification – The City will strive to develop and maintain adiversified and reliable revenue stream (in all funds as far as possible) so as to avoid becoming overly dependent on any single source of revenue. Efforts will be directed to optimize existing revenue sources while periodically reviewing potential new revenue sources.
4. Estimation of Annual Budgeted Revenues – The Administrative ServicesDepartment will provide an annual estimate of anticipated revenues using an objective and analytical process. When faced with assumption uncertainties, conservative projections will be utilized.
5. User Fees and Charges –A. General and Special Revenue Funds - Fees and charges shall be
periodically evaluated and, if necessary, adjusted annually to assure that they cover all direct and indirect costs unless it is determined by City Council that full cost recovery would not be in the best interest of the public.
B. Enterprise Funds – Fees and user charges for each enterprise fundshall be set at a level that fully supports the total direct and indirect cost of the activity. Indirect costs include the cost of annual depreciation of capital assets and overhead charges.
6. Administrative and Program Support Services – The City shall set fundtransfers for each fund at a rate that fully covers direct and/or indirect costs of providing support services to other funds. The Indirect Cost Plan will be developed in accordance with prevailing federal indirect cost guidelines. (6/4/2007)
INVESTMENT POLICY It is the policy of the City of St. Joseph, Missouri, to invest public funds in a manner which will provide the highest investment return with the maximum security while meeting the daily cash flow demands of the City and while conforming to all Missouri state statutes, the City Charter, the City Administrative Code, and the City's Code of Ordinances governing the investment of public funds. The City Investment Policy, a separate document, is available on request. (7/19/1994; rev. 10/18/2010; rev. 01/17/2017)
CAPITAL ASSET POLICY The Capital Asset Policy provides comprehensive guidelines for the classification, recording and control of capital assets. The policy applies to the recording of capital assets in the General Capital Asset Account Group and in the Proprietary Funds as necessary in order to 1) provide for physical and financial control, 2) avoid duplication and inefficient use of assets and 3) account for general government capital expenditures in compliance with Federal guidelines and State statutes and regulations concerning municipal accounting, auditing and reporting requirements.
1 - 26

KEY FISCAL POLICIES
The Capital Asset Policy, a separate document, is available on request. (4/7/1997, rev. 12/13/1999; rev. 2/24/10)
PROCUREMENT POLICY The City’s Procurement Policy provides a process for the fair and equitable treatment of all persons involved in public procurement with the city, to maximize the procurement value of public funds in procurement and to provide safeguards for maintaining a procurement system of quality and integrity.
The policy applies to all contracts or commitments for the expenditure of any public funds under the city’s control. It shall apply to every expenditure of public funds by the city irrespective of their source. When the procurement involves the expenditure of federal assistance or contract funds, the procurement shall be conducted in accordance with any applicable federal laws and/or regulations, which have not been set out in the policy.
The City Procurement Policy, made part of the city’s code of ordinances, is available on request. (4/19/1982; rev. 3/22/1999; rev. 5/23/2005; rev. 12/18/2006; rev 2/25/2008; rev.11/30/17)
TRAVEL & OTHER BUSINESS EXPENSE POLICY The Travel and Other Business Expense Policy (Policy) has been established for use by City employees and officials who travel and incur business expenses on behalf of the City both outside and inside the City. The Policy establishes General Conditions which are those requirements that must be satisfied in order to qualify for advance travel authorization from the City Manager and/or department directors. The Policy identifies Specific Conditions which are those individual requirements necessary for proper approval, payment, documentation, and reconciliation of actual travel and related business expenses. The Policy lists Allowable Expenses that are generally considered by the City and the Internal Revenue Service to be ordinary and necessary in the exercise of business when traveling for the City. The Policy identifies Unallowable Expenses considered by the City to be unordinary and unnecessary in the exercise of business when traveling for the City. The Policy includes Travel Position Statements that address, expand, and/or clarify the City’s treatment of complex and/or specific travel and related business expense issues. Definitions explain terms commonly used when discussing travel and travel related issues. The Travel and Other Business Expense Policy, a separate document, is available on request. (4/30/1990; rev. 12/27/1999; rev. 6/13/2011)
TAX AND SECURITIES LAWS COMPLIANCE POLICY The Internal Revenue Service and the Securities and Exchange Commission have increased requirements for compliance with federal tax and securities laws and expanded enforcement of such laws, shifting the burden of proof for compliance with such laws to the issuers of governmental obligations. The Tax and Securities Law Compliance Policy is intended to ensure compliance with Federal tax and securities
1 - 27

KEY FISCAL POLICIES
laws following issuance of such bonds and obligations. The policy is available upon request. (10/29/2012) WRITE OFF AND COLLECTIONS POLICY The City adopted a Write-Off and Collections Policy to establish a consistent and effective method of handling various types of accounts receivables and improving collection efforts. The focus of collection efforts will be concentrated on billed amounts that remain uncollected past their due dates for more than 90 days (“Current Receivables”). The policy was drafted in order to pull together and formalize various departmental collection practices that had developed over the years. The policy is available upon request. (03/17/ 2014, rev. 11/21/16)
DEBT MANAGEMENT POLICY The Debt Management Policy was established to accomplish several objectives: • Minimize the cost of borrowing• Provide timely funding of capital projects and other financial needs• Optimize the City’s credit ratings• Establish a framework for appropriate security to investors of City obligations• Ensure compliance with all statutory and regulatory obligations• Communicate to the City and the municipal bond market the manner in which
the City will participate in financing its debt obligations
The policy lays out the guidelines for the use of debt. It explains the types of debt the City is authorized to issue. Method of bonds sale are explained. Debt capacity guidelines are established for each type of debt obligation. Guidance is provided on debt structuring and terms of sale.
The actual components of debt management are discussed including the need for feasibility analyses and studies, debt service cash flow monitoring, covenant compliance, prepayment and defeasance of debt, and refunding of existing debt. Selection of related professional services – financial advisor, bond counsel, investment bankers/underwriters – is covered. Finally, investment of bond proceeds, debt reporting and the City’s regulatory compliance and disclosure obligations are detailed. The policy is available on request. (4/14/2014)
1 - 28


BUDGET PROCESS
Annual Budget & Program of Services
The Proposed Annual Budget is submitted by the City Manager to the City Council no later than sixty days prior toJune 30, the end of the City’s fiscal year. The proposed budget must be balanced within each fund based on estimated revenue for the upcoming fiscal year, plus or minus any carry-over fund balance from prior fiscal years. The City Manager’s Proposed Budget is based on operating and capital budget requests prepared by each department, Council priorities, citizen input, federal or state mandated actions, estimated revenues, and available fund balances. The Council may amend the proposed budget within estimated revenue and available fund balances.
DOCUMENTS BUDGET PROCESS INPUTS
……….. Citizens provide input at public budget meetings.
……….. Finance staff provide overview of City’s financial condition.
……… Finance staff assist departments in developing their budget requests.
+
…………City Manager meets with directors to
discuss budget requests in light of available fund balance.
……..… Staff responds to Council inquiries and provides additional information requested. `
………… City Council conducts Public budgethearings two weeks prior to adoption.
………….Public comment is sought prior to budget adoption.
MEMO
BUDGET PREPARATION GUIDELINES
OPERATING BUDGET
REQUESTS
CAPITAL BUDGET
REQUESTS
CITY MANAGER’S PROPOSED BUDGETS
CITY MANAGER’S PROPOSED BUDGETS
(AMENDED)
ANNUAL OPERATING &
CAPITAL BUDGETS
City Manager reviews City’s financial condition, council priorities, citizen input, and federal/state mandates to formulate Budget Preparation Guidelines.
Departments prepare their Operating and Capital Budget Requests in accordance with the City Manager’s Budget Preparation Guidelines.
The City Manager reviews department budget requests, determining if budgeted dollars are being used effectively. The Manager makes needed revisions, and produces the City Manager’s Proposed Budgets, distributed to Council, staff and the public no later than 60 days prior to June 30.
City Council reviews City Manager’s Proposed Budgets and conducts several public budget work sessions with each department director. The Proposed Budgets are amended to reflect changes approved by Council in the public work sessions.
Council adopts Annual Operating Budget and the Multi-Year Capital Budget with or without amendment on or before the third Monday in June.
2 - 1

Fiscal Year 2019/2020
January 15 Personnel listings to departments to check
1531 Personnel Listing Returned to Administrative Services Department (ASD)
February 4 Base Budgets to Departments for review4 Department Core Services Sheets due to Administrative Services
March 4 Base budget and any Supplemental Req (Operating, Capital, Personnel) due to ASD4 Final FY19 Fund Balance Reconciliations due from Accounting4 CIP Budget reviewed with Department directors, Capital Projects coordinator, Administrative Services6-15 Department Directors review supplementals, CIP, Personnel requests with City Manager11-15 Third quarter sales tax revenues (minus TIF disbursements) should be available22 "Preliminary" proposed budget to Manager & Directors w/ supplemental requests 29 Final changes to budget due to Administrative Services
April 2-3 Washington Fly-In (Tentative)5 "Final" operating budget submitted to City Manager8-26 Final Budget document preparation19 CIP Budget submitted to City Manager24 City Manager Budget Transmittal due to Administrative Services Department
Revenue and Expenditure projections continue to be reviewed26 City Manager's Proposed Budget to Council (min. 60 days prior to fiscal year start)30 Council - Budget Work Sessions (4 P.M., 4th Floor conference room)
May 1-2 Council - Budget Work Sessions (4 P.M., 4th Floor conference room)7-8 Council - Budget Work Sessions (4 P.M., 4th Floor conference room)24 Publication of budget summary and of public hearing notice (10 days prior to
Public Budget Hearing)
June 3 Public Hearing for Budget/CIP Plan/Sewer Rate - regular City Council meeting 7:00 p.m. 17 Budget Adoption - regular City Council meeting 7:00 p.m.
July 1 FY 2019/2020 Budget goes into effect.
BUDGET CALENDAR
Prior year Core Services/CY activities/Challenges & Initiatives/Performance measures distributed for update
2 - 2

BUDGETED FUND BALANCE OVERVIEW(in thousands of dollars)
Estimated EstimatedNet Beginning Ending
Revenue/ Fund FundRevenue Expenditure (Expenditure) Balance Balance
Fund Unassigned General Governmental 53,983 $ 53,412 $ 571 $ 5,952 $ 6,044 $
Cell Phone Revenue 904 1,116 (212) 965 753General Governmental Restricted or Assigned
Computer Escrow Xp 90 608 (518) 221 28Riverfront Econ Dvlp Tx 755 0 755 3,916 4,671Street Enhancement 4,600 5,400 (800) 987 187Total Emergency Reserve 0 0 0 1,125 1,12527th Payroll Reserve 0 0 0 633 787
Total General Fund 60,332 $ 60,536 $ (204) 13,799 $ 13,595Special Revenue *
Public Safety 6,397 6,906 (509) 509 0Street Maintenance 4,337 4,267 70 327 397 Parks Maintenance 1,281 1,279 2 189 191 Special Allocation (TIF) 10,480 7,938 2,542 5,368
Accumulated TIFs Reimursed to Water Protection Fund (1,515) 6,395Gaming Initiatives 830 982 (152) 161 9 Museum 577 601 (24) 90 65 Community Development 2,133 2,300 (167) 167 (0)
Enterprise (inc. CIP Programs) *Municipal Golf 766 788 (22) 22 (0)Aviation 10,421 10,525 (105) 180 75 Public Parking 617 666 (49) 153 105 Water Protection 48,928 52,332 (3,403) 26,281
Special Allocation Fund Reimbursement 1,515 24,392 Mass Transit 14,753 15,836 (1,082) 21,585 20,502 Landfill 5,536 5,094 442 4,884 5,326
Capital Projects Fund 6,511 8,249 (1,738) 3,018 1,280 Total 173,899 $ 178,299 $ (4,400)$ 76,733 $ 72,333 $
$(5,000) $0 $5,000 $10,000 $15,000 $20,000 $25,000 $30,000
General Streets Maintenance
Parks MaintenancePublic Safety TaxSpecial Allocation
Street EnhancementTotal Emergency Reserve
Gaming InitiativesMuseum Tax
CDBGCapital Projects
Municipal Golf Aviation
Public ParkingWater Protection/Swr Mnt
Mass Transit Landfill
Fund Balance Comparison(in thousands of dollars)
Ending
Beginning
2 - 3

Staffingby Service/Program
Includes Regular, Part Time EmployeesChange from
FY2019 FY2020 Prior YrAdopted Budget Adopted
General Government & Administrative Services Mayor's Office/City Clerk* 12.5 12.0 (0.5) City Manager/Pulbic Info/HR/Building Maint 13.0 8.0 (5.0) Human Resources 0.0 5.0 5.0 Legal/Risk Management 9.0 8.0 (1.0) Administrative Services (including Muni Court)** 32.0 31.0 (1.0)
66.5 64.0 (2.5)
Planning & Community Development Planning & CD Admin 3.0 3.0 0.0 Planning 2.0 2.0 0.0 CDBG Admin & Housing/Revitalization 4.5 4.5 0.0 Property Maintenance/Demolition 10.5 10.5 0.0 Building Development 8.0 8.0 0.0
28.0 28.0 0.0Parks & Recreation Parks & Rec Administration 5.0 5.0 0.0 Parks Maintenance 25.0 23.0 (2.0) Rec Activities & Cultural Facilities 31.4 31.4 0.0 Golf Operations 7.3 7.3 0.0
68.7 66.7 (2.0)Public Safety Police 185.0 187.0 2.0 Fire 131.0 131.0 0.0 Health 44.5 44.5 0.0
360.5 362.5 2.0Public Works Public Works Admin/MPO 6.0 5.0 (1.0) Engineering 10.0 10.0 0.0 Street & Sewer Support Srvcs 16.0 16.0 0.0 Streets Maintenance 60.0 58.0 (2.0) Aviation 6.0 6.0 0.0 Landfill/Recycling Ops 21.0 22.0 1.0 Water Protection/Sewer Mnt 86.5 86.0 (0.5) Parking Operations 5.5 5.5 0.0
211.0 208.5 (2.5) Total Full Time Equivalents 734.7 729.7 (5.0)
2 - 4

WHERE THE MONEY COMES FROM(in thousands of dollars)
% ofchange
FY2019 FY2020 fromFY2018 Adopted Estimated % of FY2019Actual Budget Actual Budget total Adopted
Revenue Property Tax 16,989$ 16,793$ 17,798$ 17,827$ 10% 6.16% Sales Tax 49,165 49,548 49,510 49,906 29% 0.72% Utility Tax 7,467 7,247 7,172 7,409 4% 2.24% User Fees & Gaming 42,713 41,405 42,360 43,131 25% 4.17% Grants 7,922 18,894 18,860 21,694 12% 14.82%
124,255 133,887 135,700 139,966 80% 4.54 %
Other Revenue Licenses & Permits 1,530 1,652 1,591 1,595 1% (3.46)% Fines 973 860 598 744 0% (13.59)% Interest 1,743 262 2,121 2,103 1% 701.56 % Bond Proceeds 32,986 21,450 11,361 15,926 9% (25.75)% Other 7,886 1,986 5,109 1,950 1% (1.84)%
45,118 26,211 20,780 22,317 13% (14.86)%Operating Revenue 169,374 160,098 156,480 162,284 93% 1.37 %
Interfund Transfers-In 12,872 12,587 14,946 11,616 7% (7.72)%
From (to) Fund Balance - 17,909 23,017 - 0% (100.00)%
Total Revenue 182,245 $ 190,593 $ 194,443 $ 173,899 $ 100% (8.76)%
Property Tax10%
Sales Tax29%
Utility Franchise Fees4%
User Fees25%
Grants12%
All Other Revenue4%
Transfers-In7%
2 - 5

WHERE THE MONEY GOESby Expenditure Type(in thousands of dollars)
% ofchange
FY2019 FY2020 fromFY2018 Adopted Estimated % of FY2019Actual Budget Actual Budget Total Adopted
Expenditure Salaries & Wages 33,194$ 36,936$ 34,868$ 34,913$ 20% (5%)ro Employee Benefits* 16,563 18,501 18,391 18,561 10% 0% Materials & Supplies 5,176 6,062 5,601 5,769 3% (5%)s, Services & Utilities 31,397 29,867 31,289 29,386 16% (2%) Debt Service 20,326 22,357 21,563 23,125 13% 3% Capital Outlay 7,601 8,734 9,610 9,650 5% 10% Public Improvements 27,622 49,576 34,449 45,280 25% (9%)
141,878 172,033 155,771 166,683 93% (3%)
Interfund Transfers-Out 12,769 12,587 13,231 11,616 7% (8%)
Total Expenditures $154,647 $184,620 $169,002 $178,299 100% (3%)
*Payroll Taxes, Pension Costs, Health Insurance
Salaries & Wages, Payroll Taxes &
Insurances20%
Services, Utilities, Mnt & Repair
17%Debt Service13%
Capital Outlay5%
Public Improvements
25%
Transfers-Out7%
2 - 6

WHERE THE MONEY GOESOperational Summary
% of % ofFY2020 Operating Total
Department Budget Total BudgetPublic Works 59,746$ 50.9%Police 19,728 16.8%Fire 14,866 12.7%Parks & Recreation 7,723 6.6%Planning & Community Dvlpmnt 4,297 3.7%Administrative Services 3,965 3.4%Health 4,440 3.8%City Manager 894 0.8%Human Resources 472 0.4%Legal 758 0.6%City Clerk 186 0.2%City Council & Mayor 232 0.2%
Total Major Operating Departments $117,307 65.8%
% ofCIP Summary CIP
TotalWater Protection CIP 20,601$ 41.5%CIP Sales Tax 8,249 16.6%Transit CIP 8,755 17.6%Airport CIP 9,842 19.8%Museum Tax CIP 254 0.5%Museum Tax CIP 75 0.2%Landfill CIP 1,839 3.7%Golf CIP 16 0.0%
Total Capital Projects $49,630 27.8%
% ofOther Programs
Other Budgeted Programs Total
Special Allocation (TIF & EDC) 7,938 69.9%Non Department & Cell Phone 1,916 16.9%Gaming Financed Initiatives 982 8.6%Municipal Museums Tax 526 4.6%
Total Other Programs $11,362 6.4%
Total Budget 178,299$
2 - 7


GENERAL GOVERNMENT DEPARTMENTS
TOTAL BUDGETED RESOURCES: 2,541,933$
The General Governmental Departments provide the legislative and managerial services for citygovernment.
These operations are funded through the local general sales tax, property taxes and other general fundrevenue sources.
MAYOR & CITY COUNCIL
CITY CLERK CITY MANAGER'S OFFICE
PUBLIC INFORMATION & COMMUNICATION
BUILDING MAINTENANCE
LEGAL
RISK MANAGEMENT
HUMAN RESOURCES
3 - 1

GENERAL GOVERNMENTUSES
Mayor & Council9%
City Manager10%
Public Information14%
Building Maintenance
11%
Human Resources19%
City Clerk7%Legal Services
23%
Risk Management7%
PROGRAM USES
3 - 2

GENERAL GOVERNMENT DEPARTMENTSSUMMARY
2017-18 2019-20Adopted Estimated
Actual Budget Actual Budget
Salaries & Wages 1,243,746 1,428,139 1,398,126 1,367,011Payroll Expenses & Benefits 580,234 694,105 631,556 694,975Materials & Supplies 31,304 51,365 46,150 18,591Utilities & Other Contracted Services 257,203 557,017 466,563 461,357Other 68,787 30,000 36,832 0
2,181,274 2,760,626 2,579,227 2,541,933
Mayor & City Council 199,397 252,894 210,137 232,187City Clerk 251,006 219,895 227,342 185,892City Manager's Office 297,128 315,130 299,206 258,828Public Inform & Comm 281,629 332,295 340,223 363,882Building Maintenance 0 347,443 275,571 270,848Human Resources 427,895 464,232 435,812 472,047Legal Services 573,561 667,337 623,916 588,892Risk Management Legal 150,658 161,401 167,021 169,357
2,181,274 2,760,626 2,579,227 2,541,933
Mayor & City Council 10.0 10.0 9.5 9.5City Clerk 2.5 2.5 2.5 2.5City Manager's Office 2.0 2.0 2.0 2.0Public Inform & Comm 3.0 3.0 3.0 3.0Building Maintenance 0.0 2.5 2.5 2.0Human Resources 4.0 5.0 5.0 5.0Legal Services 7.0 7.0 7.0 6.0Risk Management 2.0 2.0 2.0 2.0
30.5 34.0 33.5 32.0
STAFFING SUMMARY
2018-19
ACCOUNT TYPE
USES BY PROGRAM
City Manager
Legal
DEPARTMENTMayor & CouncilCity ClerkCity Manager
City ManagerH Resources
3 - 3

MAYOR AND CITY COUNCIL
MAYOR & CITY COUNCIL
MAYOR'S ASSISTANT (PT)
3 - 4

•
•••
•
•
••
••
•
•
•••
•••
•
•
•
Participated in at least three city parades. Participated in numerous ribbon cuttings.A continuing partnership with the 139th Airlift Wing and Rosecrans Memorial Airport, including maintaining theperimeter of the wildlife fence.
Mayor & City Council
INVEST in PEOPLE CREATE A BETTER PLACE and GROW PROSPERITY. (Imagine St. Joseph 2040)Mission
Core Services
Current Year Activity/Achievements
Adopt ordinances, resolutions, policies and regulations for the health, safety and welfare of the current andfuture inhabitants of the City of St. Joseph.Establish policies for the effective and efficient delivery of municipal services to the City.Establish goals, objectives and performance measures for the City Government and the City Manager.Create departments, divisions, bureaus, offices and citizen advisory committees necessary for the efficientand effective operation of the City.Exercise legislative oversight over the City Manager, professional staff, consultants, citizen advisorycommittees and all other employees, volunteers and officers appointed or retained by the City.Work with citizen advisory committees established by the City Council to formulate recommendations to theCity Council on policies, projects and spending allocations.
Adopt master plans for water, wastewater, storm drainage, parks, municipal facilities to guide the City's futuredevelopment of critical infrastructure.Adopt the annual City budget and approve expenditures of City funds.
Continue economic development and improvement in partnership with Imagine St. Joseph 2040. Maintainadequate staffing levels to continue delivering and enhancing high quality efficient services and infrastructure.
Participate in community strategic and long-range planning.
Promote good relations with federal, state, county, and other municipal government agencies. The Mayor andCity Council will take an active role in working with appropriate officials on Inter-jurisdictional issues andregional problems affecting the residents of St. Joseph. The Mayor's office is the focal point for citizenassistance.
Budget Challenges/Planned Initiatives
A continuing partnership with community homeless shelters, addiction facilities, and food banks.
The City Council has held approximately 18 council work sessions, 13 public council meetings and fourspecial meetings since July 1, 2018. Conducted two City Talk meetings with the community.Mayor's Children's Christmas Party at Bode Ice Arena in December 2018. Mayor's Christmas tree lighting atKrug Park and Hyde Park in November 2018. Supported the downtown Christmas Lighting.Mayor's Thanksgiving Dinner in coordination with Second Harvest fundraiser in November 2018.
Numerous ordinances and resolutions presented and passed at the council meetings.There are over 30 boards and commissions including the Downtown Review Board, Landmark Commissionand Social Welfare Board.Approximately 30 proclamations prepared and personally presented since July 1, 2018.10. Approximately 9special recognitions prepared and presented since July 1, 2018.Continuing partnership with the community developing a comprehensive plan to be known as Imagine St.Joseph 2040.
3 - 5

•
••
•
•
•
•
•
•
Continue implementing high priority drainage projects. Analyze police and fire department staffing andtraining levels to keep pace with the city's growth, to proactively address community issues and to maintain asafe community.
Continue enhancing community engagement and transparency. Continue ensuring boards and commissionsare addressing important community issues and council goals and objectives.Maintain a healthy and balanced city budget. Attract, retain, and grow a diverse community workforce.
Continue working with community partners to understand regional labor needs and identify and promoteworkforce development and matchmaking programs to fill regional workforce gaps. Expand programs for jobcreation and employment growth opportunities.
Continue identifying strategies to encourage investment in downtown and promote local businessdevelopment. Continue working with community partners to promote diverse entertainment, shopping, andgathering spaces that are attractive to our diverse community.Continue promoting an inclusive, open-minded, and progressive community. Continue implementation ofresponses to property crime through dedicated investigative resources, improved technology, and proactivepublic communications.Continue to initiate and support programs to reduce gun violence and property crimes. Continue to developenforcement strategies to reduce illegal narcotics, and work with social service organizations to addresssubstance abuse/addiction.Continue to partner with residents, neighborhood groups and community organizations to improve police-community relations. Continue supporting community-wide efforts to establish a reentry program foroffenders exiting the criminal justice system.Continue to collaborate with community and governmental partners to address issues related to poverty,mental health, and homelessness. Continue analyzing current planning and building code approvalprocesses to help decision making be more predictable, more strategic, and timely. Continue researchingprograms to improve the quality of rental housing.
3 - 6

MAYOR & CITY COUNCILProgram 8110
Program Description
2017-18 2019-20Staffing Detail Adopted Estimated
Actual Budget Actual Budget
Mayor (Elected, Part Time) 1 1 1 1
Council Members (Elected, Part Time) 8 8 8 8
Mayor's Assistant (Part Time) 1 1 0.5 0.5
10 10 9.5 9.5
Operating Budget Summary
2017-18 2019-20
Adopted Estimated
Actual Budget Actual Budget
56,437 93,586 76,615 86,394
114,204 123,618 101,401 113,672
2,486 2,300 2,300 2,000
26,270 33,390 29,821 30,121
Total 199,397 252,894 210,137 232,187
199,397 252,894 210,137 232,187
Total 199,397 252,894 210,137 232,187
Other General Fund
Expenditures:
Revenue Sources:
2018-19
2018-19
Salaries & Wages
Employee Benefits
Materials & Supplies
Services
Salaries & Wages
37%
Employee Benefits
49%
Materials & Supplies
1%
Services13%
Expenditures by Type
Other General
Fund100%
Revenue Sources by Type
The Mayor and eight City Council members are the elected representatives of the citizens of St. Joseph and arecharged with the formation of public policy to meet the community's needs. They are responsible for appointing the CityManager and the City Clerk.
3 - 7

CITY CLERK
MAYOR & CITY COUNCIL
CITY CLERK
DEPUTY CITY CLERK CLERK (PT)
3 - 8

•••••
•
•
•••
•••••••
Core Services
Current Year Activity/Achievements
To provide City Council, other city departments and citizens with accurate and timely information.
City Clerk
Administer the City Council paperless agenda process and process requests for copies of public documentsin a timely manner.Prepare appointment letters and certificates of appointments for individuals nominated to serve on boardsand commissions; maintain list of boards and commissions.Prepare Council meeting and work session minutes in a timely manner and post meeting notices/agendaspursuant to Missouri law.Conduct city elections as required by the City Charter.Send correspondence to the City Council on a daily basis using the Council's electronic tablets.Oversee City Council agenda process which includes creation of bimonthly agendas, coordination ofordinances and resolutions, duplication and distribution of agenda materials to interested parties.
Provide for records disposal to the fullest extent permissible by Missouri law.Preserve the integrity of the City's official records.
Provide for the cost effective, legal maintenance of permanent records for all City departments.Inform citizenry of public hearings pursuant to Missouri law.
Mission
Responses to customer and staff requests for information - 850Number of ordinances and resolutions processed - 393Number of Council meetings and work sessions minutes prepared - 56Supplements to the code processed and distributed - 5
Number of board and commission members appointments/resignations processed - 86Sunshine Law requests processed - 85
Bills of Sale processed - 73
3 - 9

City Clerk Department
CITY CLERKProgram 8210
Program Description
2017-18 2019-20
Staffing Detail Adopted Estimated
Actual Budget Actual Budget
City Clerk 1 1 1 1
Deputy City Clerk 1 1 1 1
Clerk (PT) 0.5 0.5 0.5 0.5
2.5 2.5 2.5 2.5
Operating Budget Summary
2017-18 2019-20
Adopted Estimated
Actual Budget Actual Budget
122,764 128,553 129,050 124,110
43,841 47,352 47,470 49,052
1,263 1,700 1,000 1,190
14,351 12,290 12,990 11,540
68,787 30,000 36,832 0
Total 251,006 219,895 227,342 185,892
251,006 219,895 227,342 185,892
Total 251,006 219,895 227,342 185,892
Election Costs
Expenditures:
Revenue Sources:
Other General Fund
2018-19
2018-19
Salaries & Wages
Employee Benefits
Materials/Supplies
Services/Charges
Salaries & Wages
67%Employee Benefits
26%
Materials &
Supplies1%
Services/Charges
6%
Election Costs
0%
Expenditures by Type
Other General
Fund100%
Revenue Sources by Type
Secretary to the City Council and legal custodian of the City's official records. The Clerk provides City Council, other citydepartments and citizens with accurate and timely information regarding those records as well as posting all officialmeeting notices.
3 - 10

CITY MANAGER'S OFFICE
CITY MANAGER
ASSISTANT TO THE CITY MANAGER/COMMUNICATION & PUBLIC
RELATIONS MANAGER
EXECUTIVE SECRETARY
MULTIMEDIA PLANNER
COMMUNICATION SPECIALIST
MAINTENANCE TECHNICIAN
CUSTODIAN (PT) (2)
3 - 11

••••
•
•••
•••••
•••
•
••
•
Core Services
Current Year Activity/Achievements
Budget Challenges/Planned Initiatives
To implement the policies established by City Council through the overall management and administration of day-to-day City operations and to deliver efficient and affordable city services.
Act as a communication link between the City Council and staff, as well as creating and maintaining effectiverelationships between the city and other taxing jurisdictions as well as private organizations.Utilize the directors, communications manager and other city staff to provide timely follow-up to City Councilinquiries.
Strategic Planning for City Council.Oversaw completion of the 2013-2019 CIP projects.
Oversaw the scheduling and implementation of the 2019 CIP 5-year timeline.
Continue efforts for Civic Arena/Event Center and related development downtown.Continue efforts to incorporate Imagine 2040 and the Community Survey with the goals and mission of CityCouncil.Explore opportunities to streamline operations and tighten expenditures while maintaining an expected level ofservice to our residents.Enhance existing programs to further efforts in addressing crime and community appearance.Establish a program to better communicate with employees and foster an open dialogue of communications.
Develop and implement Servant Leadership Initiative.
Implements City Council policies and goals.Provides professional leadership and support on organizational issues to all city departments.Provide for department needs to accomplish their mission in a safe, efficient and effective manner.
Provide timely responses to citizen inquiries.Monitor and respond to proposed bills in the Missouri General Assembly.
Continued development of the riverfront.
Oversee the financial health of the organization through annual and long-range financial planning.
Research the potential implementation of a merit-based performance appraisal system.
Mission
City Manager's Office
Continue efforts for development of the riverfront.
3 - 12

City Manager Department
CITY MANAGER'S OFFICEProgram 8300
Program Description
2017-18 2019-20
Staffing Detail Adopted Estimated
Actual Budget Actual Budget
City Manager 1 1 1 1
Executive Administrative Assistant 1 1 1 1
2 2 2 2
Operating Budget Summary
2017-18 2019-20
Adopted Estimated
Actual Budget Actual Budget
186,841 188,550 189,541 172,740
83,582 87,780 85,015 86,671
908 1,450 1,450 -20,933
25,796 37,350 23,200 20,350
Total 297,128 315,130 299,206 258,828
43,186 37,882 37,882 41,687
253,942 277,248 261,324 217,141
Total 297,128 315,130 299,206 258,828
Services & Other
Revenue Sources:Othr Fnds-Cost Alloc.
Other General Fund
2018-19
2018-19
Expenditures:
Salaries & Wages
Employee Benefits
Materials & SuppliesSalaries &
Wages57%
Employee Benefits
29%
Materials & Supplies
1% Services & Other7%
Expenditures by Type
Othr Fnds-Cost Alloc.
16%
Other General Fund…
Revenue Sources by Type
The City Manager is appointed by and serves at the discretion of the City Council and is the City's chiefadministrative officer. The City Manager implements the policies established by City Council and administers theday-to-day operations of the City through his actions and those of his directors.
3 - 13

•••
•
•
•••
••
••••••
••
Current Year Activity/Achievements
Budget Challenges/Planned Initiatives
Public Information and Communications
Represents the City on a variety of committees including Council appointed citizens committees andcommunity-wide projects and events.Produces and disseminates a variety of newsletters, publications, press releases, and public information forthe City.Provides writing, design, photography and other graphic services for print, digital, and video communicationformats.
Serves as the Public Information Officer during declared emergencies and for other general city contacts withthe media.
Communicates public information in an effective, creative manner.Markets, advertises, and promotes City services locally and regionally.
Televises City Council and Planning Commission meetings.Manages the City's website.
Launched a community brand in conjunction with the Community Alliance partners.Redesigned the city's website to make more interactive and in a functional format for mobile devices.Redesigned the city's bi-weekly newsletter into a weekly digital e-newsletter.Completed the upgrade to the multimedia technology in the Council Chamber.
Provided staff support to the 2019 CIP campaign which was voter-approved in August by 73%.
Further expanded the utilization of social media as a method of communications.
Maintaining effective communications and developing original programming with limited staffing.Create public information campaigns to raise awareness for city services and community priorities.
Produces programming and manages the City’s Government Access Channel 19.Provides special event coordination and promotion.
To provide effective communications and positive public relations between city government and the community.To provide effective communications to city employees to ensure quality, responsive customer service.
Mission
Core Services
3 - 14

City Manager Department
PUBLIC INFORMATION & COMMUNICATIONSProgram 8320
Program Description
2017-18 2019-20Staffing Detail Adopted Estimated
Actual Budget Actual Budget
Assistant to City Manager/Communications Manager 1 1 1 1
MultiMedia Planner 1 1 1 1
Communications Specialist 1 1 1 1
3 3 3 3
Operating Budget Summary
2017-18 2019-20
Adopted Estimated
Actual Budget Actual Budget
156,175 166,468 180,512 184,296
62,087 70,801 73,134 77,786
8,107 5,100 4,800 6,800
55,259 89,926 81,776 95,000
Total 281,629 332,295 340,223 363,882
1,459 8,082 8,082 0
8,134 8,928 8,928 13,297
272,036 323,367 323,213 350,585
Total 281,629 340,377 340,223 363,882
Other Revenue
Othr Fnds-Cost Alloc.
Other General Fund
2018-19
2018-19
Expenditures:
Revenue Sources:
Salaries & Wages
Employee Benefits
Materials/Supplies
Services/OtherSalaries & Wages
51%
Employee Benefits
21%
Materials/Supplies
2% Services/Other27%
Expenditures by Type
Othr Fnds-Cost Alloc.4%
Other General …
Revenue Sources by Type
This division oversees communications with customers, both internal and external, manages the City's website, theCity's government access channel and social media, and assists departments with the effective use of technology tocommunicate.
3 - 15

••••
•••
• Create a five-year plan to address long-term maintenance needs at City Hall.Budget Challenges/Planned Initiatives
Review existing custodial activities and recommend improvements if appropriate.Monitor the building's heating and cooling systems for maximum efficiency.Perform custodial and building maintenance responsibilities.
Cleaned out basement area for more efficient storage.
Complete annual maintenance walk through and perform associated maintenance.
Building Maintenance
Mission
Core Services
Current Year Activity/Achievements
Maintain a clean, safe, comfortable and aesthetically pleasing work environment at City Hall, as well as toprovide a maintenance schedule to protect and ensure long-term preservation of the building.
Assisted purchasing division with the city's auction.
Annual inspections for boiler, air conditioning system, and elevator system.
3 - 16

City Manager Department
BUILDING MAINTENANCEProgram 8711
Program Description
2017-18 2019-20Staffing Detail Adopted Estimated
Actual Budget Actual BudgetMaintenance Technician 1 1 1 1Custodian 1 1 1 0Custodian (Part Time) 0.5 0.5 0.5 1.0
2.5 2.5 2.5 2.0
Operating Budget Summary
2017-18 2019-20Adopted Estimated
Actual Budget Actual Budget
56,479 72,682 68,085 72,39721,372 33,099 26,794 22,63934,650 26,915 22,565 21,01590,159 83,000 82,205 83,00077,887 131,747 75,922 71,797
Total 280,547 347,443 275,571 270,848
16,142 15,634 15,634 15,634264,405 331,809 259,937 255,214
Total 280,547 347,443 275,571 270,848
2018-19
2018-19
Expenditures:
Revenue Sources:Other Funds-Cost Alloc.Other General Fund
Salaries & WagesEmployee BenefitsMaterials & SuppliesUtilitiesServices
Salaries & Wages
27%Employee Benefits
8%
Materials & Supplies
8%
Utilities31%
Services26%
Expenditures by Type
Other Funds-Cost
Alloc.6%
Other General
Fund94%
Revenue Sources by Type
Maintenance staff provide a clean, safe, comfortable and aesthetically pleasing work environment at City Hall.
3 - 17
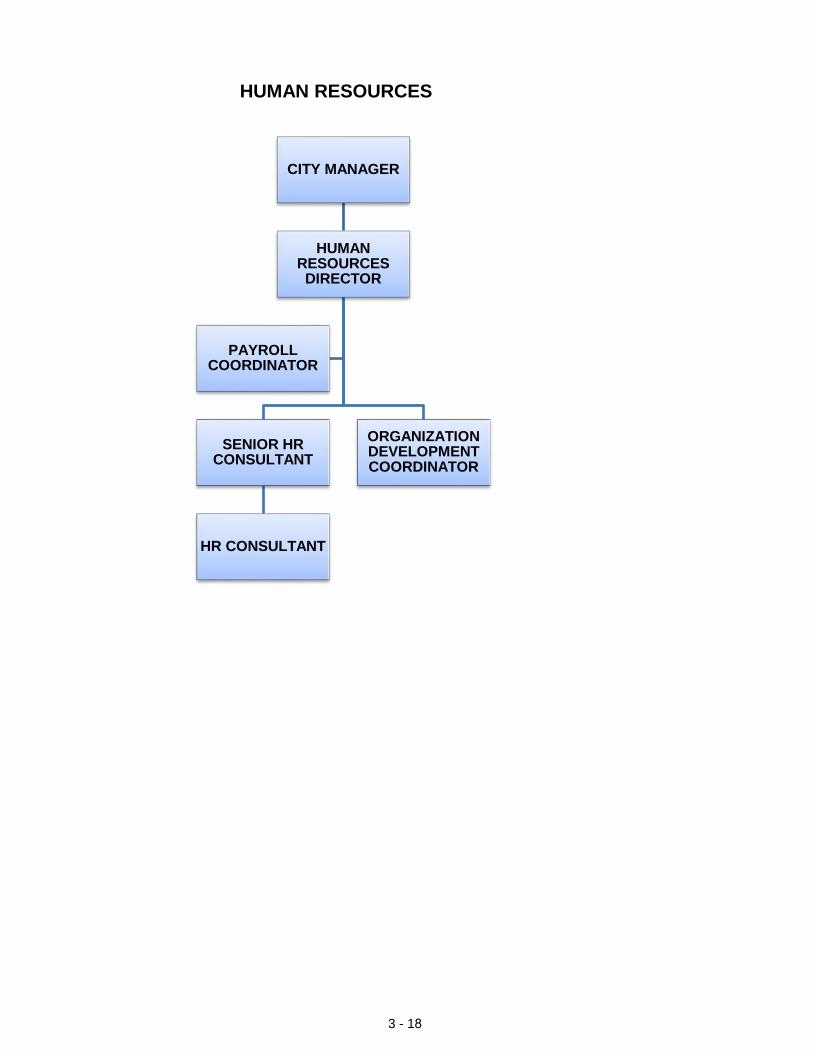
HUMAN RESOURCES
CITY MANAGER
HUMAN RESOURCES DIRECTOR
SENIOR HR CONSULTANT
HR CONSULTANT
ORGANIZATION DEVELOPMENT COORDINATOR
PAYROLL COORDINATOR
3 - 18

••••••••••
••
•
•••••••
•••
•
•••
•••••
Coordinated health/benefit fair, flu shots and benefit carrier presentations throughout the year.
Implement benefit renewals for health, dental, vision, LTD, life and dependent/supplemental life.
Completed JCPER, GASB 45, IRS Fed 941, Unemployment/Modes and MO Dept of Labor statistical reports.
Budget Challenges/Planned Initiatives
10 Entry level and promotional tests for police and fire.
Strive to meet increased regulatory requirements and the ACA.
Performance Statistics
Worked with CBIZ to renew health insurance with Blue Cross Blue Shield for coverage effective 7/1/16.Coordinated discrimination and harassment training.
Explore technology options for electronic benefits enrollment.
Advised employees and supervisors on policies, procedures, practices, benefits and other employment relatedmatters.Administered employee benefits plans: health, dental, life, vision, LTD, supplemental life Cancer, UniversalLife, dependent life, three pension plans, FLEX DECAF, EAP, MOST, two 457 deferred comp plans, ROTH
Performed annual Personnel Manual review and revisions, adopted by Council in September 2016.Conducted police entry level written and physical agility tests and fire entry level written tests.Conducted police and fire promotional level testing.
19 Retirement Applications facilitated.26 payrolls and 4 Fire Retiree Consultant payments processed.
Invest in training and development to maintain a productive workforce.
Payroll issued approximately 1,115 W2s this year.88 New full-time hires in-processed and set up64 Other than full-time hires set up.
Human Resources
MissionThe Human Resources Department is committed to providing services that foster a safe, healthy and productivework environment that is characterized by fair treatment of staff, open communications, personal accountability,trust and mutual respect in order to recruit, retain and develop the diverse talent needed to support theorganization.
Core ServicesConduct all position recruitments including advertising, screening and testing.
127 FMLA applications processed.
Current Year Activity/Achievements
Maintain an organization wide training program.
Oversee policy administration, employment & labor laws, HR records and other HR functions.Collaborate with Accounting on payroll services.Participate on the City's Labor Relations Negotiating Teams.Provide direction and assistance to departments on policies, procedures, disciplinary matters, hiring
Maintain Human Resources Information System.Administer an employee benefit package and coordinate employee benefit events.Provide New Employee Orientation.Maintain city-wide classification system.
Advised and assisted supervisors with disciplinary and other employment & benefit related questions,
752 Personnel Action Forms handled.
3 - 19

Human Resources Department
HUMAN RESOURCESProgram 8620
Program Description
2017-18 2019-20Staffing Detail Adopted Estimated
Actual Budget Actual BudgetHuman Resources Director 0 0 1 1Human Resources Manager 1 1 0 0Organization Development Coordinator 1 1 1 1Senior Human Resources Consultant 0 0 1 1Human Resources Consultant 1 2 1 1Payroll Coordinator 1 1 1 1
4 5 5 5
Operating Budget Summary
2017-18 2019-20Adopted Estimated
Actual Budget Actual Budget
247,480 246,392 243,847 255,52197,323 119,175 103,305 129,87513,185 6,900 5,650 3,73269,906 91,765 83,010 82,919
Total 427,895 464,232 435,812 472,047
53,436 59,790 59,790 90,093374,459 404,442 376,022 381,954
Total 427,895 464,232 435,812 472,047
2018-19
2018-19
Expenditures:
Revenue Sources:
General Fund
Salaries & WagesEmployee BenefitsMaterials/SuppliesServices
Other Funds-Cost Alloc.
Salaries & Wages
54%
Employee Benefits
27%Materials/Supplies
1% Services18%
Expenditures by Type
Other Funds-Cost Alloc.19%
General Fund81%
Revenue Sources by Type
This division assists other City departments in hiring and maintaining qualified individuals through the basic staffservices of employee recruitment, in-processing, evaluation, benefits administration, labor relations, examinations,position and pay administration, employee records maintenance, training and development, employee and retireeassistance.
3 - 20

LEGAL SERVICES
CITY ATTORNEY
ASSISTANT CITY
ATTORNEY (2)LEGAL
ASSISTANT
DEPUTY CITY ATTORNEY/CITY PROSECUTOR
LEGAL ASSISTANT
RISK MANAGER
CLAIMS TECHNICIAN
3 - 21

•
•••
•
•
•
•
••
•
•
•
•••
••••
••
•
••
••••
Provided legal guidance to decrease the risk of valid claims and litigation, resulting in minimal active litigationcases. Provided quarterly litigation reports to the City Council and Administration.
Prosecuted municipal ordinance violations in municipal court.Coordinated with the City's insurer to settle lawsuits in which the City was involved.
Successfully represented the City in litigation and administrative hearings.
MissionTo provide effective and timely legal representation and advice to the City Council and City Administration. Theoffice represents the City in legal controversies and is committed to minimizing negative legal exposure andpotential liability.
Legal Services
Manage risk to minimize the number of valid claims brought against the City.
Average 40-50 requests for legal assistance weekly; responding, typically within a week of the request, withthe goal of responding to all requests within two weeks.
Represent the City Council, City Administration, operating departments, and specified Boards andCommissions in all matters of law pertaining to their official duties.Assist departments in preparation of ordinances, resolutions, contracts, leases, and other documents.Assist departments in ensuring compliance with terms and conditions set forth in legal documents.Represent the City in litigation and monitor the activities of outside counsel retained to assist with litigationand other complex matters.Prosecute Municipal Court violations through the City Prosecutor's Office, which files charges and makesrecommendations, as necessary and appropriate under the applicable facts and circumstances.
Current Year Activity/Achievements
Budget Challenges / Planned Initiatives
Performance Statistics
Assisted with various Code of Ordinances' revisions and drafting of new provisions, including various newProperty Maintenance initiatives.
Attend regular City Council and various Boards and Commissions meetings, special meetings, and worksessions.Maintain up-to-date information on legal issues facing municipalities and ensure that the City is in compliancewith newly-enacted State and Federal legislation.Assist with developing an official position on proposed legislation and monitor proposed legislation for thepurpose of advising City directors on legislation that might affect the City.Assist in the evaluation and investigation of employee-related concerns and matters.Assist with the annual review and update of the City's Personnel Manual and act as a member of the City'sLabor Negotiation Team.
Attended most board and commission meetings and assisted with follow-up tasks.Evaluated the legal ramifications of alternatives for enhancing property maintenance programs.
Core Services
Monitor evolving state and federal legislation to ensure local compliance.
Reviewed and updated numerous contracts for services, purchases, and real property transactions.Assisted in negotiations with representatives of labor unions.Continued negotiations related to the City's sewer system operations with users and state and federalregulatory agencies.Reduced use of outside counsel for common activities.
Increasing need to significantly rewrite zoning and related codes.Rapidly evolving staffing needs related to attorney staff's involvement with other departments and evolvingneed for administrative staff.Inconsistency in level of staffing needed.
Monitored new legislation and other changes in the law and reported such changes to other City officials.
Monitor over 50 contracts, leases, and other legal documents.
3 - 22

Legal Services Department
LEGAL SERVICESProgram 8390
Program Description
2017-18 2019-20Staffing Detail Adopted Estimated
Actual Budget Actual Budget
City Attorney 1 1 1 1
Deputy City Attorney/City Prosecutor 1 1 1 1
Assistant City Attorney 1 2 2 2
City Prosecutor 1 0 0 0
Legal Assistant 2 2 2 2
Legal Secretary 1 1 1 0
7 7 7 6
Operating Budget Summary
2017-18 2019-20Adopted Estimated
Actual Budget Actual Budget
379,671 435,279 409,543 371,076
137,321 168,024 149,159 165,489
3,462 4,500 5,680 3,312
53,108 59,534 59,534 49,015
Total 573,561 667,337 623,916 588,892
181 0 150 049,738 35,809 35,809 0
67,410 68,197 68,197 75,665
456,233 563,331 519,760 513,227
Total 573,561 667,337 623,916 588,892
Other General Fund
2018-19
2018-19
Expenditures:
Salaries & Wages
Employee Benefits
Materials/Supplies
Services
Revenue Sources:
Other RevenueTransfers
Othr Fnds-Cost Alloc.
Salaries & Wages
63%
Employee Benefits
28%Materials/Supplies
1%
Services8%
Expenditures by Type
Other Revenue
0%Transfers0%
Othr Fnds-Cost Alloc.13%
Other General
Fund87%
Revenue Sources by Type
Legal staff conduct litigation involving the City, prepare and enforce City ordinances and resolutions, render legalopinions and advice, and draft City contracts, leases and other legal documents. The City Prosecutor representsthe City when individuals are seen in Municipal Court for citations issued by a city department for violations of stateor municipal laws and codes.
3 - 23

•
•
•••
•
•••
••••
••
•
•••
•
••••
••
•••
Risk ManagementMission
Core Services
Current Year Activity/Achievements
Budget Challenges/Planned Initiatives
Worked with agents and insurance companies to process property/casualty renewals.Conducted site visits and interviews for investigation of claims.
Provide assistance to departments related to safety/loss control policies and initiatives through employeemeetings, training programs and resources.
Manage and administer claims under the City's Sewer Backup Reimbursement Policy/Program.Assist the Legal Department with litigation strategies in response to liability causes of action.
Manage the City's risk transfer methods related to contract services and special events.Administer the City's Drug/Alcohol Testing Program.
Manage the City's risk financing methods such as the procurement of insurance policies and self-insuranceprograms.Investigate liability claims asserted by members of the public and initiate appropriate response procedures.
Promoting the S.E.R.V.E. model to put servant leadership into practice every day.
Increase Safety Awareness through development of Safety Meetings in all departments.
Responded to 220 liability (including sewer) incidents. (CY18)Processed 80 subrogation incidents. (CY18)Processed 248 employee injuries. (CY18)
Develop and implement innovative safety communication strategies that include training elements specific todepartmental operations and equipment through the use of available technologies.Coordinate department applicable RM training opportunities.Establishing an effective Safety/Loss Control Program with limited staffing.
Develop more robust Drug & Alcohol program including more safety sensitive positions and testing withinbudget constraints.Bid out Workers' Compensation TPA services.
Effective incident investigation with limited staffing.
Performance Statistics
Investigate occurrences and submit State-required reports for all work-related injuries and manageassociated workers' compensation claims with assistance from contract third party administrator and legalcounsel.
Provided annual claim and operational statistics, including financial information to the State and otheragencies; as required to maintain self-insurance authority for the Workers' Compensation Program.
Submitted property and liability claims and coordinated with claims administrators and all liability insurancecarriers on matters related to claims, lawsuits and other actions filed with them.Maintained Certificates of Insurance.Coordinated drug & alcohol testing and EAP referrals.
Attended meetings and work sessions to present and discuss matters of insurance and claims.
Reviewed contracts and event permits.Coordinated activities associated with workers' compensation claims (e.g. processing claim, authorizingmedical treatment, referrals, payroll & settlements).
Process insurance or reimbursement claims for damage to City property, whether damage results from aninsured cause of loss through City operations or damage caused by members of the public.
To continually monitor and evaluate City operations in order to manage the associated risks through aggressivemanagement and administration of the City's Property/Casualty Insurance Program, Sewer BackupReimbursement Program, the Self-Insured Workers' Compensation Program, Drug/Alcohol Testing Programand Safety/Loss Control Programs. Promote the S.E.R.V.E. model.
3 - 24

Legal Services Department
RISK MANAGEMENTProgram 8651
Program Description
2017-18 2019-20Staffing Detail Adopted Estimated
Actual Budget Actual Budget
Risk Manager 1 1 1 1Claims Technician 1 1 1 1
2 2 2 2
Operating Budget Summary
2017-18 2019-20
Adopted Estimated
Actual Budget Actual Budget
94,377 96,630 100,934 100,476
41,876 44,256 45,277 49,791
Materials/Supplies 12,513 18,015 18,105 17,615
1,892 2,500 2,705 1,475
Total 150,658 161,401 167,021 169,357
20,071 20,617 20,617 0
53,436 60,403 60,403 73,568
77,151 80,381 86,001 95,789
Total 150,658 161,401 167,021 169,357
Other General Fund
Salaries & Wages
Employee Benefits
Services
Transfers
2018-19
2018-19
Expenditures:
Revenue Sources:
Other Funds-Cost Alloc.
Salaries & Wages
59%
Employee Benefits
29%
Materials/Supplies
11%
Services1%
Expenditures by Type
Transfers0%
Other Funds-Cost Alloc.
43%
Other General
Fund57%
Revenue Sources by Type
Staff works to reduce the City's exposure to insurance risk (loss) through aggressive management of the City'sProperty/Casualty Insurance Program, the Self-Insured Workers' Compensation Program, the City's Loss ControlProgram, and the Drug/Alcohol Testing Program.
3 - 25

(this page intentionally left blank)

ADMINISTRATIVE SERVICES DEPARTMENT
TOTAL BUDGETED RESOURCES: 3,965,146$
The Administrative Services Department provides staff support to other City services relating to personnel matters,financial services and analysis, technology support. The department also provides customer service in its CustomerAssistance, Municipal Court and Utility Billing divisions.
These operations are funded through the local general sales tax, property taxes and other general fund revenuesources. Over 60% of these services are funded through reimbursements from the Enterprise Funds indicating thelevel of support provided to each and/or from revenues generated by the programs.
CITY MANAGER
DIRECTOR OF ADMINSTRATIVE
SERVICES
ASSISTANT DIRECTOR ADMINISTRATIVE SERVICES
REVENUE
MUNICIPAL COURT
UTILITY BILLING
CUSTOMER SERVICES
ACCOUNTING
BUDGET
PURCHASING
TECHNOLOGY
NETWORK SERVICESCOMPUTER NETWORK
OPERATIONSGIS DEVELOPMENT
4 - 1
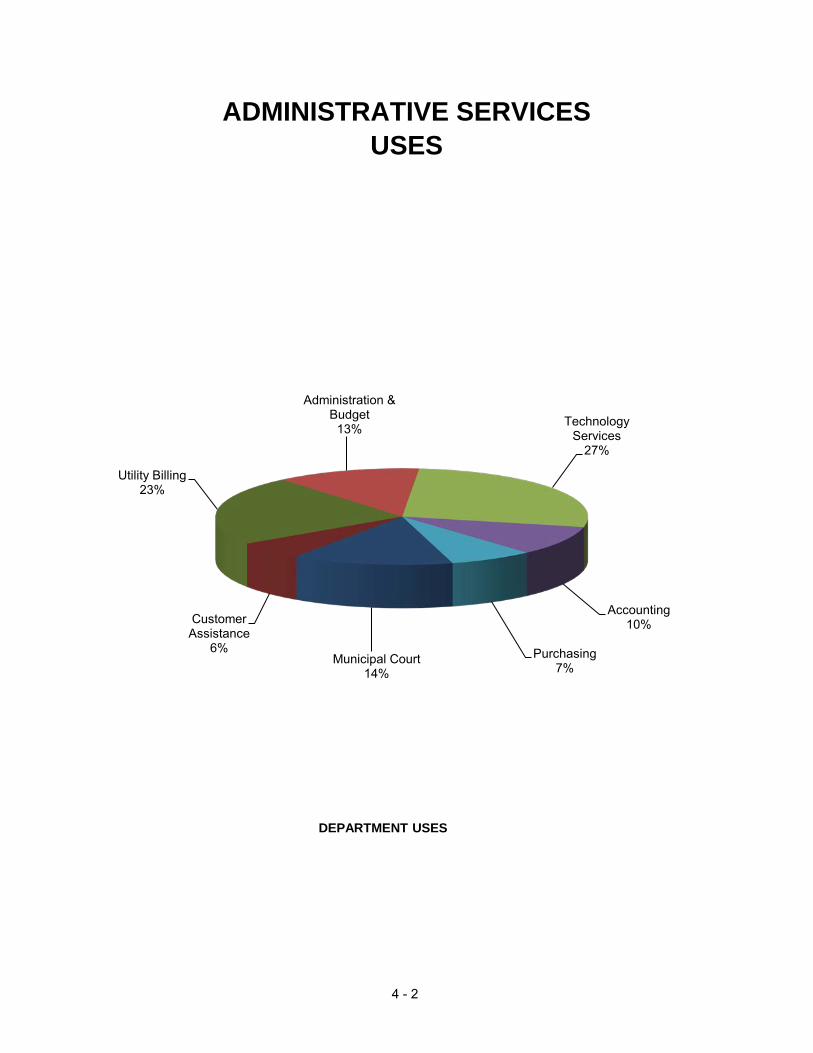
ADMINISTRATIVE SERVICESUSES
Administration & Budget
13% Technology Services
27%
Accounting10%
Purchasing7%
Municipal Court14%
Customer Assistance
6%
Utility Billing23%
DEPARTMENT USES
4 - 2

ADMINISTRATIVE SERVICES DEPARTMENTS
2017-18 2019-20Adopted Estimated
Actual Budget Actual Budget
1,515,368 1,600,508 1,573,857 1,510,994608,628 674,633 648,684 708,497189,509 159,750 137,453 147,546
1,558,482 1,404,827 1,345,692 1,448,109782,864 106,000 164,554 150,000
4,654,852 3,945,718 3,870,239 3,965,146
436,679 413,677 478,007 498,498470,657 571,613 432,125 392,733272,289 292,559 283,425 287,741196,135 224,294 229,158 236,931969,994 922,298 847,928 924,957280,547 0 0 0
Municipal Court Services 527,360 541,174 552,396 540,288Designated Court Training 9,668 9,025 9,410 12,400
1,116,472 418,361 426,717 431,69924,230 30,890 24,690 31,800
350,823 521,828 586,382 608,1004,654,852 3,945,718 3,870,239 3,965,146
4.0 4.0 5.0 5.05.0 5.0 4.0 3.04.0 4.0 4.0 4.03.0 3.0 3.0 3.03.0 3.5 3.5 3.53.0 0.0 0.0 0.07.5 7.5 7.5 7.55.0 5.0 5.0 5.00.0 0.0 0.0 0.00.0 0.0 0.0 0.0
34.5 32.0 32.0 31.0
2018-19
Computer Network Operations
Building MaintenanceMunicipal Court ServicesNetwork ServicesGIS
Administration & BudgetAccountingPurchasingCustomer AssistanceUtility Billing
Computer Network Operations
STAFFING SUMMARY
ACCOUNT TYPESalaries & WagesPayroll Expenses & BenefitsMaterials & SuppliesUtilities & Other Contracted ServicesCapital Outlay
USES BY PROGRAMAdministration & BudgetAccountingPurchasingCustomer AssistanceUtility Billing Building Maintenance
Network ServicesGIS
4 - 3

•••
•
••
•
••
•
•••••
•
•
•
Continue development of reporting and reconciliation between Springbrook cash receipts/utility billing processes withfinancial software system - ONEsolution.Continue auditing utility billing system by adding accounts to City's GIS to track those areas that appear unserved byCity sewer system.
Careful monitoring of city revenues & expenditures; preparing for the challenges facing the City from legislativesources and other economic conditions that may arise.
Monitor City's financial condition and provide financial strategies to ensure fiscal solvency.Prepare monthly, quarterly and annual financial reports that provide City Council, City staff and the public with thefinancial information necessary to make informed choices and decisions.Provide consistent, cohesive budget planning, implementation, and administration. Oversee preparation of theannual Operating and CIP budgets as well as the Five Year CIP plan.Act as part of the City's Labor Relations Negotiating Team.Management and control of City revenues and accounts receivable, including the financial requirements related tothe City's Special Allocation Fund (TIF, TDD, CID, and EDC programs). Track, review and monitor TIF reimbursableexpenses to Developers per Redevelopment Agreements and prepare and file TIF Reports with the MissouriDepartment of Economic Development.
Updated City's Investment Policy and Purchasing Policy.
Prepared annual indirect cost plan.
Track and review Buchanan County annual tax billing and monthly collection reports and disbursements. Work withthe Buchanan County Assessor's office to ensure compliance with Enterprise Zone, Chapter 100, Chapter 353 taxabatements.Reporting and monitoring past due accounts and Collection Agency reporting.Maintain the data base for the parking ticket program and manage the collection process, including issuance ofsummons to Municipal Court.Monitor daily revenue deposits of departments outside of City Hall. Enter revenues into the general ledger.
Administration & Budget
Mission
Core Services
Current Year Activity/Achievements
Budget Challenges/Planned Initiatives
To preserve the City's strong financial condition by creating a responsible financial strategy, effectively managing theCity's resources. To assist city management in the allocation of public resources to meet the service, program andfacilities' needs and expectations of the community, as determined by the Mayor and Council, in accordance withfederal/state/local statutes and generally accepted accounting principles. Provide oversight and direction to theAdministrative Services Department personnel.
Updated City's Collection Policy.Reporting of collections activity for Special Assessments, Administrative Penalties and Sewer Receivables includingmonthly listings provided to City's Collection Agency.
Provide financial policy, cash management, debt management for the City.
Continue improving Annual Budget processes to streamline department submissions.
4 - 4

Administrative Services Department
ADMINISTRATION & BUDGETProgram 8310
Program Description
2017-18 2019-20Staffing Detail Adopted Estimated
Actual Budget Actual Budget
Director of Administrative Services 1 1 1 1Assistant Director of Administrative Services 0 0 1 1Associate Director - Finance & Revenue 1 1 1 1
Revenue Analyst 1 1 1 1Revenue Specialist 1 1 1 1
4 4 5 5
Operating Budget Summary 2017-18 2019-20
Adopted Estimated
Actual Budget Actual Budget
288,154 266,612 331,525 317,702
97,797 103,725 118,668 149,8447,104 6,200 5,700 7,653
43,623 37,140 22,115 23,300Total 436,679 413,677 478,007 498,498
0 0 34,506 0259,758 219,579 219,579 224,828176,921 194,098 223,922 273,670
Total 436,679 413,677 478,007 498,498General Fund
Salaries & Wages
Employee BenefitsMaterials/SuppliesServices
Revenue Sources:
2018-19
Recovery/Reimb
2018-19
Expenditures:
Other Funds-Cost Alloc.
Salaries & Wages
64%
Employee Benefits
30%
Materials/Supplies
1% Services5%
Expenditures by Type
Other Funds-Cost
Alloc.45%
General Fund55%
Revenue Sources by Type
Staff assist city management in the allocation o public resources to meet the service, program and facilities needs andexpectations of the community, as determined by the Mayor and Council, in accordance with federal/state/local statutes.Develop information that demonstrates the impact of decisions on the City's financial policies and the City's goal ofmaintaining a high level of quality services. Prepare the Annual Operating and Capital Budgets as well as the Five YearCIP Plan. Administer all financial aspects of the City's TIF and TDD projects. Provide oversight and direction to theAdministrative Services Department personnel.
4 - 5

•••••
•
•
••
•
•
Customer Assistance
MissionProvide excellent customer service for business license renewals and payments for sewer users, parking tickets, buspasses, and all other services provided by customer assistance clerks for other city departments. Provide a positiveattitude to both external and internal customers.
Core ServicesProvide prompt, accurate and courteous customer service.
Accela licensing and permit software training for better reporting.Increase collection for liens, sewer utility bills and administrative penalties by notices, and finally forwarding to City'scontracted collection agency.UTILITY BILLING: With the City's re-acquisition of the sewer billing function, the division has seen increased walk-intraffic from individuals paying in person and customers paying bills by phone. Regular part-time person utilized 25-28 hours per week.
Accela software upgraded for license and permit activities.
WORK MANAGEMENT SOFTWARE - investigate transition to a paperless, on-line customer service center,allowing customers to apply for permits, garage sale permits, etc. online.
Help customers in understanding, completing and processing of sewer user fee, parking tickets and other billings.Maintain proper cash handling protocols in order to comply with auditing practices.Maintain real estate ownership records provided by the County.
Current Year Activities/Achievements
Budget Challenges/Planned Initiatives
Support other city departments by collecting sewer utility payments; processing business license renewals andvarious annual permit renewals; and providing proper information regarding their programs and policies.
Continue working with Utility Billing staff to reduce the delinquency rate on sewer utility bills, including termination ofwater services.
4 - 6

Administrative Services Department
CUSTOMER ASSISTANCEProgram 5420
Program Details
2017-18 2019-20Staffing Detail Adopted Estimated
Actual Budget Actual Budget
Customer Services Manager 1 1 1 1Customer Services Representative 2 2 2 2
3 3 3 3
Operating Budget Summary
2017-18 2019-20
Adopted Estimated
Actual Budget Actual Budget
106,835 118,383 122,112 122,54540,527 54,150 55,035 61,531
1,523 2,670 2,670 3,07047,250 49,091 49,341 49,785
Total 196,135 224,294 229,158 236,931
108,627 120,117 120,117 114,31987,508 104,177 109,041 122,612
Total 196,135 224,294 229,158 236,931
Services
Other General FundOther Funds-Cost Allo
Expenditures:
Revenue Sources:
2018-19
2018-19
Salaries & WagesEmployee BenefitsMaterials/Supplies
Salaries & Wages
52%
Employee Benefits
26%
Materials/Supplies
1% Services21%
Expenditures by Type
Other Funds-Cost Alloc.54%
Other General
Fund52%
Revenue Sources by Type
The Customer Assistance staff issues business licenses, liquor license, health permits. They provide cash receiptingservices and perform collections for special tax billings and sewer utility billings. Staff also issues garage sale permits,bus and parking passes while managing the city’s sidewalk grant program.
4 - 7

••••
•
•
•
•
•
•
•
•
•
••
•
•
•
Performance Statistics
Enhance procedure manual regarding billings, adjustments, collections etc. regarding sewer billing/collection process.
Further communicate the enhanced Customer Service options for sewer payments via citizen interactive voiceresponse (IVR) system, online payments and contracted outside locations, as well as City staff's availability to answerany questions citizens may have.Continue training customer service representatives on acceptance of utility payments and responding to basic utilitybilling questions.
Citizens' contact for issues with sewer billings. Research possible account adjustments.Audit daily receipt batch postings for accuracy.Reconciles the Sewer billing system with General Ledger and prepares journal entries to account for monthlyadjustments to billings.Prepare Aging reports on utility accounts receivable and follow collection procedures per City ordinance and StateStatutes.
Upgraded Sewer Automated Response System (IVR), Customer Service for direct payments, and to Utility Billing staffto respond to any questions they have.Audit of Missouri American weekly data files to GIS and current billed records to ensure all accounts are being billed.
Average Number of bills generated monthly - FY18 - 26,260; FY17 - 26,284; FY16 - 26,157;
Average Number of monthly payments from Lockbox - FY18 - 7,650; FY17 - 7,908; FY16 - 9,466Average Number of monthly payments from Web - FY18 - 2,346; FY17 - 2,086; FY16 - 1,768
Average Number of monthly payments from IVR (interactive voice response by phone) - FY18 - 447 FY17 - 382; FY16 - 336
Average Number of monthly payments from FirsTech (contracted vendor in grocery stores) - FY17- 763; FY16 - 739; FY16 - 924Other Payments - FY18 - 13,823; FY17 - 14,218; FY16 - 11,609Paperless Bills /Web Billing processed per month - 450.Delinquent Notices Per Month - FY18 - 1,231: FY17 - 951; FY16 - 2,054
Utility Billing
Mission
Core Services
Current Year Activities/Achievements
Budget Challenges/Planned Initiatives
Provide accurate and timely utility billing statements. Research requests to correct billing errors. Verification of sewer
billing accuracy. Offer prompt and courteous customer service when contacted for information whether by phone, e-mail
or in person. Provide timely listing to collection agency for those accounts closed, but with balances due.
Provide back-up and assistance to the other divisions as necessary.
Collection policy amended and approved by Council in February, 2018. Bid out and awarded collections to
Professional Recovery Systems.
This division generates the monthly utility billing statements for the users of the City's sewer system.
4 - 8
•

Administrative Services Department
UTILITY BILLINGProgram 8560
Program Details
2017-18 2019-20Staffing Detail Adopted Estimated
Actual Budget Actual Budget
Utility Billing Supervisor 1 1 1 0
Billing & Collections Technician 1 1 1 1
Utility Billing Technician 1 1 1 2
Utility Billing Account Technician (Part Time) 0 0.5 0.5 0.5
3 3.5 3.5 3.5
Operating Budget Summary
2017-18 2019-20Adopted Estimated
Actual Budget Actual Budget
113,759 137,016 125,872 127,21050,261 65,940 55,214 68,0793,532 3,400 1,000 2,500
802,441 715,942 665,842 727,168Total 969,994 922,298 847,928 924,957
10,195 37,000 10,000 39,000959,798 885,298 837,928 885,957
Total 969,994 922,298 847,928 924,957
2018-19
2018-19
Billing/DNR FeesWater Protection FD
Salaries & WagesEmployee BenefitsMaterials & SuppliesServices
Expenditures:
Revenue Sources:
Salaries & Wages
14%Employee Benefits
7%
Services79%
MaterialsSupplies
1%
Expenditures by Type
Water Protection
FD96%
Billing/DNR Fees…
Revenue Sources by Type
As of October 2012, the City took over billing its sewer customers from the water company. Utility Billing staff strive toprovide accurate and timely utility billing statements. Research requests to correct billing errors. Verify sewer billingaccuracy. Offer prompt and courteous customer service when contacted for information whether by phone, e-mail or inperson.
4 - 9

•
••
••
•••
•
•
••
•
••
•••
••••
Court upgrade to INCODE software scheduled May 8, 2019.
Management, collection and control of Municipal Court revenues and accounts receivables - general financialoversight of Municipal Court.
Continue migration to "paperlight court" process with the hardware & software provided for in the FY16 budget.State Legislation continues to limit Court fees and fines.
Coordinate case filings, updates, and dispositions with the City Prosecutor and warrant issuance and update warrantstatus with the SJPD.Provide Court docket for arraignments and trials; schedule specific weekly arraignments and trials for specializedhearings, i.e. Code Compliance, Animal Control, and Spanish-speaking (or other individuals needing a translator).
Paperless initiated for entry of appearances, discoveries, work orders, community service, defendant identificationsand class completions.Warrant and docket information available on City's website July 1, 2017.Cross-training of staff to allow for staff absences.
Comply with judicial orders and/or judicial directives given by the Municipal Court Judge.Oversee all internal financial controls and audit functions associated with Municipal Court.
State mandate to mail out letters to those who fail to appear for initial arraignment. This is unplanned hit to postagebudget.Research and implement solution for storage of citation data as required by State Statute.
Budget Challenges/Planned Initiatives
Citations Filed : FY2018 - 12,903; FY2017 - 16,246; FY2016 - 18,623; FY2015 - 17,938Completed Cases: FY2018 - 14,522; FY2017 - 18,045; FY2016 - 19,039; FY2015 - 17,969Warrants Issued : FY2018 - 4,549; FY2017- 3,496; FY2016 - 4,915; FY2015 - 5,360Warrants Served/Cleared : FY2018 - 4,880; FY2017 - 3,487; FY2016 - 5,132; FY2015 - 5,459
Performance Statistics
Municipal Court Services
MissionProvide Municipal Court services in a manner that complies with City codes and the Office of State Courts Administrator (OSCA).
Core Services
Current Year Activity/Achievements
Court interface between St. Joseph Police Department and Municipal Court for citation download under review.Software vendor change has delayed project slightly.
Prepare warrants, failure-to-appear notices and subpoenas.Provide Municipal Court Judge and substitute judges with training necessary for Certification and Provide stafftraining necessary for obtaining and continuing education required for certification from Missouri Association forCourt Administration (MACA).Transmit monthly reports to the City Clerk, Buchanan County Circuit Court and Missouri Department of Revenue.Enforce administrative policies and procedures as directed by Municipal Court Judge with regard to the judiciaryfunctions of the Municipal Court.
4 - 10

Administrative Services Department
MUNICIPAL COURTProgram 2710
Program Descriptions
2017-18 2019-20Staffing Detail Adopted Estimated
Actual Budget Actual Budget
Municipal Court Judge (elected) 1 1 1 1Municipal Court Administrator 1 1 1 1Senior Court Srvcs Representative 1 1 1 1Court Services Representative 2 2 2 2PT Court Services Representative 0.5 0.5 0.5 0.5Substitute Judges (PT) less than 100 hours per year 2 2 2 2
7.5 7.5 7.5 7.5
Operating Budget Summary
2017-18 2019-20
Adopted Estimated Actual Budget Actual Budget
294,423 305,154 308,677 293,343120,277 116,695 125,606 130,467
2,524 6,005 4,023 423110,135 113,320 114,090 116,055
Total 527,360 541,174 552,396 540,288
489,120 580,300 498,300 540,300385 225 417 225580 1,000 1,000 1,000
37,274 (40,351) 52,680 (1,237)Total 527,360 541,174 552,396 540,288
2018-19
2018-19
Interest
Other General FundOther Revenue
Salaries & WagesEmployee BenefitsMaterials/SuppliesServices
Court Revenue (Fines
Expenditures:
Revenue Sources:
Salaries & Wages
54%
Employee Benefits
24%
Materials/Supplies
0%Services
22%
Expenditures by Type
Court Revenue (Fines)100%
Other Revenue
0%
Other General
Fund0%
Revenue Sources by Type
Municipal Court upholds municipal codes and ordinances by processing and rendering decisions on the cases filed by theCity's Prosecuting Attorney. Court support staff, under the direction of the Administrative Services Department, also collectthe fines levied by the court, prepare warrants and failure-to-appear notices, schedule bond forfeiture hearings, and transmitmonthly reports to the City Clerk, County Circuit Court and State Department of Revenue.
4 - 11

Administrative Services Department
RESTRICTED FINANCIAL SERVICESProgram 8580
Program Description
2017-18 2019-20Staffing Detail Adopted Estimated
Actual Budget Actual Budget
N/A 0 0 0 0
0 0 0 0
Operating Budget Summary
2017-18 2019-20
Adopted Estimated Actual Budget Actual Budget
8,390 7,600 6,920 8,4001,278 1,425 2,490 4,000
Total 9,668 9,025 9,410 12,400
7,738 9,025 9,025 9,0250 0 0 0
1,930 0 385 3,375Total 9,668 9,025 9,410 12,400
2018-19
2018-19
Other General Fund
Travel & TrainingDues & Prof Services
Judicial Education FeeOther Revenue
Expenditures:
Revenue Sources:
Travel & Training
95%
Dues & …
Expenditures by Type
Judicial Education
Fee73%
Other Revenue
0%
Other General
Fund27%
Revenue Sources by Type
This program accounts for the revenues and expenditures in the Administrative Services Department from the JudicialEducation revenues. This is training funded over and above what might be paid from General Fund revenues. Since thereis a per person cap annually on the amount of money that can be reserved for staff training and appointed Counsel, therevenues and expenditures are being tracked in this program.
4 - 12

• • •
• •
•
•
• •
• •
•
• • •
•
• • • • • •
GASB issued Statement No. 90 (Majority Equity Interests-Competent Units).
Monitor internal controls, debt compliance, and grant reconciliation.Conform, comply and implement the City's financial reporting to GAAP standards and statements.
Provide departments with accurate and timely monthly financial reports/updates.Review policies and procedures and update (or develop) as necessary.
Received an unqualified (clean) audit opinion on the City's CAFR and received the GFOA distinguished CAFRReporting award for the 28th consecutive year.
Continuing updating and adding OneSolution Accounting Software modules.
GASB issued Statement No. 83 (Certain Asset Retirement Obligations).GASB issued Statement No. 84 (Fiduciary Activities).GASB issued Statement No. 87 (Leases).GASB issued Statement No. 88 (Certain Disclosures Related to Debt).
Stay current with OneSolution Accounting Software upgrade and fixes.Continue to streamline processes and procedures to improve efficiency.
Budget Challenges/Planned Initiatives
Working with COGNOS to launch City's cloud-based platform for a more open, effective & accountable governmentto access transparent & timely spending information.
Provide investment and cash management, accounting services.
Reconciled 31 funds including the General fund, nine (9) special revenue funds, 1 capital project fund, six (6)enterprise funds, two (2) internal service funds, ten (10) agency funds, and two (2) account group funds.
Police pension investment portfolio monitored: $41,428,886# of Federal grants reconciled: 56$ of Federal grants reconciled: $38,807,647City's investment portfolio diversified: $86,585,626Number of capital assets inventoried: 2,104Maintained debt compliance for total debt service of: $278,639,004
Performance Statistics
Accounting
MissionPromote confidence in the City's financial operations by providing management with timely, accurate and meaningfulfinancial information and by continuing to achieve an unqualified (clean) audit opinion on the City's Annual FinancialReport (CAFR).
Core Services
Current Year Activity/Achievements
4 - 13

Administrative Services Department
ACCOUNTINGProgram 8540
Program Description
2017-18 2019-20Staffing Detail Adopted Estimated
Actual Budget Actual Budget1 1 0 0
Accountant 3 3 3 2Budget & Financial Analyst 1 1 1 1
5 5 4 3
Operating Budget Summary
2017-18 2019-20Adopted Estimated
Actual Budget Actual Budget
247,005 312,498 216,191 183,355
94,781 120,110 86,479 73,6721,466 5,500 3,500 1,000
127,405 133,505 125,955 134,705Total 470,657 571,613 432,125 392,733
134,699 151,584 151,584 157,565335,958 420,029 280,541 235,168
Total 470,657 571,613 432,125 392,733
2018-19
2018-19
Other Funds-Cost AllocOther General Fund
Assistant Director Admininstrative Services
Salaries & Wages
Employee BenefitsMaterials/SuppliesServices
Expenditures:
Revenue Sources:
Salaries & Wages
47%
Employee Benefits
19%
Materials/Supplies
1%
Services34%
Expenditures by Type
Other Funds-Cost
Alloc.…
Other General
Fund60%
Revenue Sources by Type
The Accounting staff provides management with timely, accurate and meaningful financial information.They continue to achieve an unqualified (clean) audit opinion on the City's Annual Financial Report (CAFR).
4 - 14

••
•
••
•
•
•
•••
••••••
Purchasing
MissionPromote public confidence in municipal government procurement through compliance with established federal, state andlocal procurement statutes; by communicating effectively with City staff and outside vendors; and by providing staff withthe training and tools necessary to execute the procurement function at the highest professional level.
Number of "front end" documents developed for capital projects19
Number of federal & state prevailing wage payroll audits/on-site visits at on-going projects 10
Budget Challenges/Planned Initiatives
Performance Statistics
Bids and contracts processed within three (3) working days Yes
Number of accounts payable transactions processed63,407Amount of revenue generated by use of City procurement card for large vendor invoice payments$104,810.72
Maximize efficiencies and cost savings in the procurement of materials & supplies.
Number of bids and contract awards processed 117
Core ServicesProvide accounts payable, purchasing and receiving services.Communicate effectively with City staff and outside vendors to ensure compliance with established federal, state andlocal procurement statutes.Provide multiple channel through which bid openings and requests for proposals can be accessed by vendors, including on-line bid opportunities and vendor listings.
Reduce the City's exposure to financial risk (loss of grant funding) by ensuring construction contractors comply withstate and federal prevailing wage laws.Increase public confidence in municipal government procurement on the part of the general citizenry through adherence to the adopted Purchasing Policy.
Current bid opportunities and bid results are now being posted on the City website making it easier for vendors todownload specifications which aren't construction related.Streamline the database to eliminate inactive vendors as well as accommodate types of commodities or servicesprovided.
Current Year Activity/Achievements
Continue to identify vendors who accept the AP card for payment of invoices.Obtain ability to track companies or individuals who are picking up bids from the City website.Continue to research on-line bidding process in order to transition the City's bidding process in the future.
4 - 15

Administrative Services Department
PURCHASINGProgram 8600
Program Description
2017-18 2019-20Staffing Detail Adopted Estimated
Actual Budget Actual Budget
Purchasing Agent 1 1 1 1Compliance Technician 1 1 1 1Account Technician 2 2 2 2
4 4 4 4
Operating Budget Summary
2017-18 2019-20
Adopted Estimated
Actual Budget Actual Budget
168,744 173,350 174,131 173,341
73,264 77,853 76,538 82,0554,037 4,900 2,500 900
26,244 30,456 30,256 31,446Capital Outlay 0 6,000 0 0
Total 272,289 292,559 283,425 287,741
5,685 4,000 4,000 4,000110,896 151,584 151,584 157,565155,708 136,975 127,841 126,176
Total 272,289 292,559 283,425 287,741
2018-19
2018-19
Other Funds-Cost AlloOther General Fund
Salaries & Wages
Employee BenefitsMaterials/SuppliesServices
Nonrefundable Dep
Expenditures:
Revenue Sources:
Salaries & Wages
60%
Employee Benefits
29%
Materials/Supplies
2%Services
11%Capital Outlay
0%
Expenditures by Type
Other Revenues
1%
Other Funds-
Cost Alloc.55%
Other General
Fund44%
Revenue Sources by Type
This division helps ensure public confidence in municipal government procurement through compliance with establishedfederal, state and local procurement statutes; by communicating effectively with City staff and outside vendors; and byproviding staff with the training and tools necessary to execute the procurement function at the highest professional level.
4 - 16

•••
•
•
••
•
•••••••••
•••••
•
••••
Upgraded Accela Automation for all modules. Continue to customize and create reports.Server consolidation and virtualization.Implemented Executime payroll software.
Provide data/voice/video services to over 600 staff at 30 locations.Maintain minimum standards for desktop hardware and a standardized software environment.Maintain the City's website (hosted by CivicPlus), as well as maintain sites for CIP, Parks, Transit, andGIS.Plan, manage, and maintain the production environment to maintain and enhance security, reliability,availability and performance.Provide "on demand" service and support for system and security administration; problem resolutionor coordination; research into possible software/hardware acquisitions; and information requestsregarding the same.
Maintain a data network consisting of more than 450 desktop and laptop computers accessing a fullsuite of general purpose software tools, as well as over 15 business applications and services.More than 600 users are spread out over 30 locations.Over 150 mobile smartphone and tablet users plus personal devices.
Maintain over 400 Avaya phones on the network.More than 10TB of data to manage.
Budget Challenges/Planned Initiatives
Implemented Projectmates software for tracking projects.Implemented a desktop backup solution.Implemented Office 365.Continue upgrade of network switches to be completed in early 2019.In process of implementing Cartegraph asset management software.
Continue to utilize automated management tools to stretch limited resources.
In process of implementing Tolemi Building Blocks software. Map-based application that connectsdata from several different sources.
Upgrade our SAN, which hosts most all of our data and virtual machines.Upgrading Accela Civic Platform in 2019 to latest version and implement scripting and ACA.Explore ways to reduce costs and do more with less.Find some parking software to replace the parking database in Accela.
Performance Statistics
Technology Services
MissionPromote ready access to municipal government information through appropriate day-to-day maintenanceof the City's PC-based computer network, by assisting other city departments with the development,implementation and use of various computer software systems at a minimum cost.
Core Services
Current Year Activity/Achievements
Provide timely assistance and/or information in response to requests.Meet the requirements of replacing/upgrading PCs, printers, services and other equipment as neededthrough a funding mechanism based on a per PC charge.Maintain GIS data for access by City employees.
4 - 17

Administrative Services Department
NETWORK SERVICESProgram 8570
Program Description
2017-18 2019-20Staffing Detail Adopted Estimated
Actual Budget Actual Budget
Assoc Director - Technology Services 1 1 1 1
Network Administrator 1 1 1 1System Support Specialist 1 1 1 1Computer Support Specialist 1 1 1 1Software Support Specialist 1 1 1 1
5 5 5 5
Operating Budget Summary
2017-18 2019-20
Adopted Estimated
Actual Budget Actual Budget
239,969 287,496 295,349 293,499
101,958 122,360 124,224 128,250
398 1,075 1,075 2,000
8,498 7,430 6,070 7,950
Total 350,823 418,361 426,717 431,699
350,823 418,361 426,717 431,699
Total 350,823 418,361 426,717 431,699
2018-19
2018-19
General Fund
Salaries & Wages
Employee Benefits
Materials & Supplies
Services
Expenditures:
Revenue Sources:
Salaries & Wages
68%
Employee Benefits
30%Materials
& Supplies1% Services
2%
Expenditures by Type
General Fund100%
Revenue Sources by Type
The division promotes ready access to municipal government information through appropriate day-to-day maintenance ofthe City’s computer network, by assisting other city departments with the development, implementation and use of variouscomputer software systems and other technologies.
4 - 18

Administrative Services Department
NETWORK OPERATIONSProgram 8590
Program Description
2017-18 2019-20Staffing Detail Adopted Estimated
Actual Budget Actual Budget
N/A 0 0 0 0
0 0 0 0
Operating Budget Summary
2017-18 2019-20
Adopted Estimated
Actual Budget Actual Budget
134,275 130,000 116,985 130,000199,333 291,828 304,843 328,100782,864 100,000 164,554 150,000
Total 1,116,472 521,828 586,382 608,100
1,001,136 411,828 507,563 518,10032,000 32,000 32,000 42,0006,000 6,000 6,000 6,0002,000 2,000 2,000 1,0004,000 4,000 4,000 4,000
34,000 36,000 0 06,000 6,000 6,000 7,0001,000 1,000 1,000 3,0003,000 3,000 3,000 4,000
12,000 12,000 12,000 10,00015,335 8,000 12,819 13,000
Total 1,116,472 521,828 586,382 608,100
Landfill FundParking Fund
Expenditures:
Revenue Sources:
2018-19
2018-19
Interest
Materials & SuppliesServicesCapital Outlay
General Fund
CDBG FundStreets Mnt Fund
Golf Course FundTransit Fund
Parks Mnt FundAviation FundWater Prtctn Fund
Materials & Supplies
21%
Services54%
Capital Outlay25%
Expenditures by Type
General Fund85%
Streets Mnt Fund
7% CDBG Fund1%
Parks Mnt Fund1%
Aviation Fund…
Water Prtctn Fund0%
Landfill Fund1%
Parking Fund1%
Golf Course Fund1%
Transit Fund2%
Interest2%
Revenue Sources by Type
This program provides for the City’s future technology needs through timely replacement or upgrades of computer networkhardware and software and through implementation of new advances in technologies when appropriate.
4 - 19

Administrative Services Department
GIS DEVELOPMENTProgram 8595
Program Description
2017-18 2019-20Staffing Detail Adopted Estimated
Actual Budget Actual Budget
N/A 0 0 0 0
0 0 0 0
Operating Budget Summary
2017-18 2019-20
Adopted Estimated
Actual Budget Actual Budget
0 6,200 0 6,20024,230 24,690 24,690 25,600
Total 24,230 30,890 24,690 31,800
6,450 6,450 6,450 6,45017,780 24,440 18,240 25,350
Total 24,230 30,890 24,690 31,800
TrainingServices
Transfer from SewerGeneral Fund
2018-19
2018-19
Expenditures:
Revenue Sources:
Training19%
Services81%
Expenditures by Type
Transfer from
Sewer20%
General Fund80%
Revenue Sources by Type
The GIS program is responsible for funding and managing the City's multi-department GIS function, including serveradministration, software updates, development of additional data layers and applications to update and access the data.
4 - 20

TOTAL BUDGETED RESOURCES: 4,296,587$
PLANNING & COMMUNITY DEVELOPMENT DEPARTMENTThe City of St. Joseph's planning and community development department provides economic planning andpublic/private sector cooperation in order to diversify the economic base of the community. Planning ensures thatdevelopment within the city follows adopted city plans and policies through review and consultation with privatedevelopers. And, the Community Development divisions address housing and non-housing-related communitydevelopment needs.
The Inspections and Code Compliance programs provide review and approval of code compliant construction anddevelopment.
These operations are funded through the local general sales tax, property taxes, special use permit fees, buildinginspections and permit fees and federal community development block grant sources.
PLANNING & COMMUNITY
DEVELOPMENT DEPARTMENT
COMMUNITY DEVELOPMENT
COMMUNITY DEVELOPMENT ADMINISTRATIO
N
HOUSING & REVITALIZATIO
N
HOME PROGRAM
VARIOUS PASS-THROUGH
GRANT PROGRAMS
PLANNINGINSPECTIONS &
CODE ENFORCEMENT
PROPERTY MAINTENANCE
BUILDING DEVELOPMENT
SERVICES
VACANT STRUCTURE
STABILIZATION
DEMOLITIONS
RIVERFRONT ECONOMIC
DEVELOPMENT TAX
5 - 1

PLANNING & COMMUNITY DEVELOPMENTSOURCES & USES
Transfers frm Other Funds
10%
Other General Revenue Sources
12%
Federal Grants55%
Inspection & Permit Fees
7%
Rvrfrnt Dvlpmnt Tax16%
P&CD Administration
5%
CDBG Programs49%
Building Development
15%
Property Mnt & Demolition
27%Planning
4%
PROGRAM USES
FUNDING SOURCES
5 - 2

2017-18 2018-19 2019-20Adopted Estimated
Actual Budget Actual BudgetACCOUNT TYPE
Salaries & Wages 1,312,773 1,424,950 1,323,818 1,308,539Payroll Expenses & Benefits 549,283 673,657 611,453 650,989Materials & Supplies 41,720 56,322 42,599 41,413Utilities & Other Contracted Services 1,524,276 1,831,381 2,816,992 2,069,872Claims/Insurance/Fund Transfers 202,094 208,629 208,629 210,775Capital 0 30,000 200,000 15,000
3,630,145 4,224,939 5,203,492 4,296,587USES BY PROGRAM* Planning & Community Dvlpmnt Admin 283,353 314,998 662,392 222,030
Planning 162,742 179,309 184,798 184,897CDBG Management 555,243 433,637 373,603 371,381Housing & Revitalization 591,979 822,923 1,436,391 843,946Restricted ARRA Program 0 0 0 0Home Program 91,804 341,189 341,189 439,741Federal Emergency Srv Grnt 54,428 0 0 0Slum/Blight Activity & Low/Mod Activity 68,494 0 101,870 0Public Service Agencies 340,000 340,000 377,200 377,200Building Development 470,626 591,118 491,193 615,203Property Maintenance 690,543 805,595 778,806 874,622Vacant Structure Stabilization 0 0 100,000 100,000Demolition 320,934 396,169 356,050 267,568
3,630,145 4,224,939 5,203,492 4,296,587FUNDING SOURCES
General Fund 1,184,264 1,468,020 1,794,189 1,558,751Landfill Fund 423,000 423,000 423,000 438,000CDBG Fund 2,022,882 2,333,918 2,986,303 2,299,836
3,630,145 4,224,939 5,203,492 4,296,587STAFFING SUMMARY
P&CD Administration 3.0 3.0 3.0 3.0Planning (Split from Admin program) 2.0 2.0 2.0 2.0CDBG Management 2.0 2.0 2.0 2.0Housing & Revitalization 2.5 2.5 2.5 2.5Home Program 0.0 0.0 0.0 0.0Building Development Services 8.0 8.0 8.0 8.0Property Maintenance 10.0 10.0 10.0 10.0Demolitions 0.5 0.5 0.5 0.5
28.0 28.0 28.0 28.0
* Includes the Riverfront Economic Development Tax Program
PLANNING & COMMUNITY DEVELOPMENT DEPARTMENTSUMMARY
5 - 3

PLANNING & COMMUNITY DEVELOPMENTADMINISTRATION, PLANNING DIVISIONS
Director of Planning & Community Development
Executive Administrative Assistant
City Planner
Assistant City Planner
License & Permit Supervisor
5 -4

• Managerial oversight of planning and zoning, building development, property maintenance, community development,and economic development function of the City.
• Support and implementation of Downtown Master Plan initiatives.• Work with private development to promote job creation.• Comprehensive review of site and building plans.• Provide economic development assistance to public to promote job creation and retention.• Provide assistance to low/moderate income homeowners for rehab of homes.• Provide emergency assistance to address life/health threatening issues in their homes.• Help public service agencies provide services to clients.• Provide funding for facade improvements to eligible properties located in the downtown precise plan area.
• Support of Council's Priority to work on riverfront redevelopment efforts.• Administered 8 economic development programs.• Updated City Codes to reduce neighborhood blight.• Implementation of Building Blocks software program.• Completed 1 facade improvement project.• Completed 19 emergency grants, 14 housing rehabilitation and 20 demolition projects.• Provided funding to 11 Public Service Agencies to provide necessary services to low/moderate income individuals.
• Continue to update and alter Accela software program to meet needs of Staff.• Change over of staff, hiring and training of staff.• Educating public on importance of City Codes and need to review how project may impact surrounding neighborhood.
• Provide funds to improve city owned parks and public housing.• Continue to promote facade improvement program.
Planning & Community Development Administration
MissionSupport and enhance our community's economic development efforts while ensuring public health and safety, andcompliance with city ordinances and adopted codes.
Core Services
Current Year Activities/Achievements
Budget Challenges/Planned Initiatives
5 - 5

Planning & CD Department
Program Description
2017-18 2018-19 2019-20Adopted Estimated
Staffing Detail Actual Budget Actual Budget
Director of Planning & Community Development 1 1 1 1Executive Administrative Assistant 1 1 1 1License & Permit Supervisor 1 1 1 1
3 3 3 3
Operating Budget Summary
2017-18 2018-19 2019-20Adopted Estimated
Actual Budget Actual Budget
183,525 189,495 190,525 148,29972,895 82,703 78,447 79,491
616 1,500 600 (7,059)1,014 1,300 1,555 1,300
Total 258,050 274,998 271,127 222,030
0 0 0 64,9150 0 0 0
258,050 274,998 271,127 222,030Total 258,050 274,998 271,127 222,030
Indirect Cost-CDBGGeneral Fund-Other
PLANNING & COMMUNITY DEVELOPMENT ADMINISTRATIONProgram 8380
Expenditures:
Revenue Sources:
Salaries & WagesEmployee BenefitsMaterials & SuppliesServices
The administrative office provides managerial oversight of planning and zoning, building inspections, property maintenance issues,economic development coordination and federally funded project administration including the historic preservation functions of theCity. Staff oversees permitting, licensing, building inspection, code compliance and development review and coordination. TheSpecial Events Coordinator, makes sure that parades, festivals, and other special events sponsored by a variety of individuals orgroups in the community are properly permitted and have met all street and safety concerns. The position also serves City’s primarypoint of contact for all liquor licensing issues.
Other
Salaries & Wages
63%
Employee Benefits
30%
Materials & Supplies
1% Services0%
Expenditures by Type
Indirect Cost-CDBG
0%
General Fund-Other
100%
Revenue Sources by Type
5 - 6

Planning & CD Department
Program Description
2017-18 2018-19 2019-20Adopted Estimated
Staffing Detail Actual Budget Actual Budget
None
0 0 0 0
Operating Budget Summary
2017-18 2018-19 2019-20Adopted Estimated
Actual Budget Actual BudgetExpenditures:Services 25,303 40,000 191,265 0
0 0 200,000 0Total 25,303 40,000 391,265 0
Revenue Sources:613,537 681,660 681,660 681,660
Interest 39,936 0 73,332 73,332(628,170) (641,660) (363,727) (754,992)
Total 25,303 40,000 391,265 0
Riverfront Economic Development TaxProgram 0022
Program used to track the revenue and expenditures of the Downtown/Riverfront Economic Development Tax. This is the additional3% transient guest tax on hotel/motel rooms as approved by voters. The revenue generated by downtown hotels is to be used fordowntown development. Until the end of the 3rd Street Hotel TIF, the only hotel downtown, all the additional revenue generatedthere goes to pay off that TIF. Revenues generated by hotels/motels outside the downtown area are dedicated to riverfrontdevelopment projects.
General Fund-Other
Hotel/Motel Tax
Capital Improvements
Expenditures by Type
Hotel/Motel Tax
52%
General Fund-Other-48%
General Fund-Other-50%
Revenue Sources by Type
5 - 7

• Review all residential and commercial development plans, all zoning and subdivision platting.• Ensure compliance with the City's Comprehensive Land Use Plan in order to manage growth and development.• Ensure compliance with the City's zoning code for proper spacing, location and design to protect quality of life
standards.• Provide staff reports for the Downtown Review Board, Planning Commission, Zoning Board of Adjustment, and
Landmark Commission.
• Continued updates to the Comprehensive Plan.• Continued updates to the Zoning Code.• Update of Accela to better track progress of applications.• Continued improved customer service.• Update of the Downtown Precise Plan.• Updated sign regulations.
• Work to meet customers needs in planning services.• Promote continued reinvestment in the community by working with developers to find options for their project to
succeed.• Continued support of downtown redevelopment.• Create a Comprehensive Plan for St Joseph.• Develop a Frederick Avenue Corridor Plan.• Establishing standardized process for planning applications and development.• Develop a Historic Preservation Plan.
• Processed 98 applications for plans and permits issued through the Planning Commission, Downtown Review Board,and Zoning Board of Adjustment.
Performance Statistics
Budget Challenges/Planned Initiatives
Planning
MissionThe planning division ensures that development within the City follows adopted city plans and policies through the reviewand consultation with private developers. Staff works with the public to identify ways to assist with their project andprovide options to encourage better development.
Core Services
Current Year Activity/Achievements
5 - 8

Planning & CD Department
Program Description
2017-18 2018-19 2019-20Adopted Estimated
Staffing Detail Actual Budget Actual Budget
City Planner 1 1 1 1Assistant City Planner 1 1 1 1
2 2 2 2
Operating Budget Summary
2017-18 2018-19 2019-20Adopted Estimated
Actual Budget Actual Budget
102,842 107,042 107,724 107,24347,011 49,467 49,629 51,103
811 1,500 2,100 1,20012,078 21,300 25,345 25,350
Total 162,742 179,309 184,798 184,897
27,063 20,000 20,000 24,112135,679 159,309 164,798 160,785
Total 162,742 179,309 184,798 184,897
Outside Services
Revenue Sources:PermitsGeneral Fund-Other
PLANNINGProgram 5110
Expenditures:Salaries & WagesEmployee BenefitsMaterials & Supplies
The City's planning division is responsible for citywide planning and zoning administration, regulating subdivisions, andadministering a comprehensive land use plan for the city. The comprehensive land use plan is a blueprint for dealing with physicaland economic development and housing initiatives.
Permits13%
Other General Fund87%
Revenue Sources by Type
Salaries
& Wages
60%
Employee
Benefits
27%
Materials
& Supplies
1%
Outside
Services
12%
Expenditures by Type
5 - 1

COMMUNITY DEVELOPMENT(CDBG)
Director of Planning & Community Development
Community Development Manager
Grants Specialist Historic Preservation Planner
Housing Program Coordinator Loan & Fair Housing Coordinator
5 - 10

• Housing Rehabilitation and Revitalization• Demolition• Funding for Public Service Programs• Fair Housing• Community Development Administration• Housing Programs-HOME Investment Partnerships Program funds
• 12 grants provided to income eligible homeowners to alleviate dangerous situations in their homes• 11 housing rehab projects were completed to assist homeowners with substantial repairs to their homes• Assisted Community Action Partnership with construction of 4 more senior rental homes at Applewood Estates• Assisted Habitat for Humanity with the construction of 2 new homes for homeownership in the Mid Town area• Assisted Habitat to help develop a 7 family home development north of Carden Park School• Bartlett Center-provided affordable childcare to 77 low/moderate income children• Bartlett Center- 24,127 home delivery meals to home bound senior citizens• Bartlett Center-provided a latchkey program to 123 youth• Sold 2 rehabilitated homes to income qualified families to help improve neighborhoods
• Providing more services with the same amount of entitlement funding, which has been stagnant for several years.
• YWCA-440 women and children sheltered - 16,880 total nights• Social Welfare Board-263 people received dental services• United Cerebral Palsy-provided therapy services to 12 low/moderate income children• 2nd Harvest-provided 25,200 lbs. of food to senior citizens• Samaritan Center-provided funding for mental health services to 404 low/moderate income citizens• Children's Advocacy Center-provided counseling to 26 children who were victims of sexual/physical abuse• Hillcrest Transitional Housing-provided services to 90 individuals/families• Interserv- provided afterschool programs to 105 kids• Community Missions Corp.-provided apartments and supportive services to 17 homeless men• N.W. Children's Advocacy Center provided counseling to 30 abused children
Budget Challenges/Planned Initiatives
Performance Statistics
Core Services
Current Year Activity/Achievements
Community Development Block Grant Program
MissionThe City of St. Joseph utilizes the Community Development Block Grant funds and the HOME Investment PartnershipsProgram funds to the greatest extent possible to assist low/moderate income citizens with both housing and non housingneeds in order to improve the quality of life. A variety of services are provided through 12 public service agencies to helpwith a wide range of assistance programs. At least 70% of the CDBG funding received each year is allocated tolow/moderate income citizens. In addition, 100% of the HOME Program funds are allocated to agencies providingaffordable housing to citizens eligible for homeownership and rental properties developed by Habitat for Humanity andCommunity Action Partnership.
5 - 11

Planning & CD Department
Program Description
2017-18 2018-19 2019-20Adopted Estimated
Staffing Detail Actual Budget Actual Budget
Community Development Manager 1 1 1 1Grants Specialist 1 1 1 1
2 2 2 2
Operating Budget Summary
2017-18 2018-19 2019-20Adopted Estimated
Actual Budget Actual Budget
113,210 153,424 111,436 110,93143,519 71,638 53,592 53,238
0 2,800 2,800 2,800208,870 15,826 15,826 15,081181,994 185,949 185,949 185,332
7,650 4,000 4,000 4,000Total 555,243 433,637 373,603 371,381
195,622 0 0 01,097,750 1,894,181 1,931,381 1,663,158(738,129) (1,460,544) (1,557,778) (1,291,777)
Total 555,243 433,637 373,603 371,381CDBG Fund - OtherFed Entitlement Grnt
COMMUNITY DEVELOPMENT ADMINISTRATIONProgram 5260
Expenditures:Salaries & WagesEmployee BenefitsMaterials & SuppliesServicesTransfers OutTransfers-Netwrk
Revenue Sources:Interest & Other
The program oversees the administration of funding received from the U.S. Department of Housing & Urban Development.
Salaries & Wages
36%
Employee Benefits
14%
Materials &
Supplies1%
Services6%
Transfers Out42%
Transfers-Netwrk
1%
Expenditures by Type
Fed Entitlement
Grant100%
Revenue Sources by Type
5 - 12

Planning & CD Department
Program Description
2017-18 2018-19 2019-20Adopted Estimated
Staffing Detail Actual Budget Actual Budget
Historic Preservation Planner 0.5 0.5 0.5 0.5Housing Program Coordinator 1 1 1 1Loan & Fair Housing Coordinator 1 1 1 1
2.5 2.5 2.5 2.5
Operating Budget Summary
2017-18 2018-19 2019-20Adopted Estimated
Actual Budget Actual Budget
142,695 117,169 119,423 107,90762,652 60,793 61,328 64,569
2,345 3,917 3,917 3,917376,130 630,345 1,245,345 656,854
8,157 10,700 6,379 10,700Total 591,979 822,923 1,436,391 843,946
0 0 0 0Total 591,979 822,923 1,436,391 843,946
Materials & Supplies
HOUSING & REVITALIZATIONProgram 5210
Expenditures:Salaries & WagesEmployee Benefits
Provides decent, safe, and sanitary housing for low to moderate income families through coordination, implementation, andmonitoring of Community Development Block Grant Emergency Assistance and Home Improvement programs. Staff also coordinateand oversee activities designed to promote the revitalization of St. Joseph's core inner-city neighborhoods. Projects within the NRSAwill receive priority funding.
ServicesOther Charges
Revenue Sources:Other Revenue
Salaries & Wages
13%
Employee Benefits
7%Materials &
Supplies0%
Services78%
Other Charges
1%
Expenditures by Type
CDBG Fund -Other 100%
Revenue Sources by Type
5 - 13

Planning & CD Department
Program Description
2017-18 2018-19 2019-20Adopted Estimated
Staffing Detail Actual Budget Actual Budget
0 0 0 00 0 0 0
Operating Budget Summary
2017-18 2018-19 2019-20Adopted Estimated
Actual Budget Actual Budget
0 5,984 5,984 079,354 316,525 316,525 418,29812,450 18,680 18,680 21,443(1,650) 2,000 2,000 2,000
Total 91,804 341,189 341,189 439,741
242,708 342,189 342,189 469,763102,726 0 0 0
(253,630) (1,000) (1,000) (30,022)Total 91,804 341,189 341,189 439,741
CDBG Fund - Other
Revenue Sources:Fed Entitlement GrantInterfund Transfer
HOME PROGRAMProgram 8880
Expenditures:TrainingServicesInterfund Transfers
This program administers HUD funding in a broad array of eligible housing activities including both home ownership and theexpansion of affordable rental housing. The majority of HOME funds are focused on infill construction within the NRSA.
Tranfer-Computer
Training0%
Services95%
Transfers Out…
Expenditures by Type
Fed Entitlement
Grant100%
Revenue Sources by Type
None
5 - 14

Planning & CD Department
Program Description
2017-18 2018-19 2019-20Adopted Estimated
Staffing Detail Actual Budget Actual Budget
0 0 0 00 0 0 0
Operating Budget Summary
2017-18 2018-19 2019-20Adopted Estimated
Actual Budget Actual Budget
0 0 100,000 100,000Total 0 0 100,000 100,000
0 0 0 00 0 100,000 100,000
Total 0 0 100,000 100,000
Revenue Sources:Other RevenueTransfer from Landfill
VACANT STRUCTURE STABILIZATIONProgram 5435
This program provides non-federal source of funds to eliminate vacant dangerous structures through city demolition or working withproperty owner to stabilize vacant structures.
Expenditures:Services
Services100%
Expenditures by Type
Transfer from
Landfill100%
Revenue Sources by Type
None
5 - 15

Planning & CD Department
Program Description
2017-18 2018-19 2019-20Adopted Estimated
Staffing Detail Actual Budget Actual Budget
None
0 0 0 0
Operating Budget Summary
2017-18 2018-19 2019-20Adopted Estimated
Actual Budget Actual BudgetExpenditures:Services 54,428 0 0 0
Total 54,428 0 0 0Revenue Sources:Federal HMIS Grant 5,082 0 0 0Reprogrammend Fnds 0 0 0 0
49,347 0 0 0Total 54,428 0 0 0
FEDERAL EMERGENCY SHELTER GRANTProgram 6800
Federal funds are allocated to alleviate homelessness by providing rent, utility assistance and legal service for individuals andfamilies who are homeless, threatened with homelessness or lack the funds to secure housing by providing funds to various non-profit organizations in St. Joseph that address these needs. Allocations are determined by a Citizens Advisory Committee afterpublic hearings on funding applications.
CDBG Fund - Other
5 - 16

Planning & CD Department
Program Description
2017-18 2018-19 2019-20Adopted Estimated
Staffing Detail Actual Budget Actual Budget
None0 0 0 0
Operating Budget Summary
2017-18 2018-19 2019-20Adopted Estimated
Actual Budget Actual BudgetExpenditures:Services 68,494 0 101,870 0Interfund Transfers 0 0 0 0
Total 68,494 0 101,870 0Revenue Sources:Fed Entitlement Grant 0 0 0 0
68,494 0 101,870 0Total 68,494 0 101,870 0
SLUM/BLIGHT/REDEVELOPMENT ACTIVITIESLOW/MODERATE ACTIVITY
Program 8840 & 8860
To meet one of the national objectives of the CDBG program, the City Council allocates a limited amount of funds to organizationsand individuals to undertake eligible slum and blight activities. The dollar amount that the City can award is restricted by federalregulations. Activities include preservation of historic structures, infrastructure improvements, and streetscape and landscapeimprovements.
CDBG Fund - Other
5 -17

Planning & CD Department
2017-18 2018-19 2019-20Adopted Estimated
Actual Budget Actual Budget
0 0 0 0
Hillcrest Transitional Housing of Buch Co $33,000 Amer 2nd Harvest Emergency Food Assist $31,200 Interfaith Com. Srv-Youth Latchkey $30,000 Bartlett Center - Family Resource Program $20,000 AFL-CIO Community Services $20,000 Samaritan Counseling-Client Assistance $25,000 Social Welfare Brd-Dental Care Program $85,000 United Cerebral Palsy-Integration & Advocacy $10,000 YWCA-Women & Children's Shelter $68,000 Community Missions-Housing for Hmless $30,000 NWMO Children's Advocacy-Abuse Cnslng $25,000
$377,200
2017-18 2018-19 2019-20Adopted Estimated
Actual Budget Actual Budget
340,000 340,000 377,200 377,200Total 340,000 340,000 377,200 377,200
0 0 0 0340,000 340,000 377,200 377,200
Total 340,000 340,000 377,200 377,200CDBG Fund - Other
PUBLIC SERVICE AGENCIESProgram 8850
Expenditures:Services
Funding is allocated to non-profit organizations in St. Joseph concerned with public issues such as child care, public health, drug and alcohol abuse,recreational activities, domestic violence, and treatment of children with physical and developmental disabilities. Disbursement is determined by acitizen committee charged with evaluating applications for the grant.
Revenue Sources:Fed Entitlement Grant
Operating Budget Summary
Staffing Detail
Program Description
None
Services100%
Expenditures by Type
CDBG Fund -Other 100%
Revenue Sources by Type
5 - 18

BUILDING REGULATIONS & PROPERTY MAINTENANCE
Director of Planning & Community Development
Property Maintenance Inspectors (2) Chief Building Official
Construction Inspector
Mechanical & Plumbing Inspector
Electrical Inspector
Permit Clerks (2)
Property Maintenance Manager
Property Maintenance Inspector (5)
Work Crew Supervisor
Commercial Development Review Coordinator
Code & Neighborhood Support Technician
Code Enforcement Clerk
Laborer (2)
5 - 19

• Consultations with customers relating to their particular building project.• Inform customers of specific information that they need to provide to the City.• Schedule a Development Review Meeting for the project if necessary.• Review plans to insure adherence to local building codes.• Inspect projects to verify the installation is acceptable and code compliant.• Building Department clerks assist customers through the documentation process.• Upon project completion occupancy is approved and project files are archived.• Assist customers with numerous miscellaneous requests.
• Improve Development Review Process.• Increase inspector training to improve code understanding.• Building Inspections: 139 commercial and 225 residential• Mechanical /I Plumbing inspections: 231 commercial and 387 residential• Electrical Inspections: 158 commercial and 247 residential• Number of Plan Reviews: 489 commercial and 746 residential• Percent of Plans reviewed in 10 working days: 95%
• Continue to encourage staff to meet all certification requirements.• Implementation of new software for managing project files.• Work to update Accela software program to allow access from the field.
• Building Inspections: 139 commercial and 225 residential.• Mechanical /I Plumbing inspections: 231 commercial and 387 residential.• Electrical Inspections: 158 commercial and 247 residential.• Number of Plan Reviews: 489 commercial and 746 residential• Percent of Plans reviewed in 10 working days: 95%
Core Services
Building Development Services
MissionProvide the public with minimum requirements to safeguard health, safety and general welfare as it relates to the building
industry. These minimum requirements will be administered through consultations, plan reviews and inspections.
Current Year Activities/Achievements
Budget Challenges/Planned Initiatives
Performance Statistics
5 -20

Planning & CD Department
Program Description
2017-18 2019-20Adopted Estimated
Staffing Detail Actual Budget Actual Budget
Dangerous Building Inspector 1 1 1 11 1 1 11 1 1 11 1 1 11 1 1 11 1 1 12 2 2 28 8 8 8
Operating Budget Summary
2017-18 2018-19 2019-20Adopted Estimated
Actual Budget Actual Budget
307,226 362,764 301,001 377,638127,184 170,451 137,303 180,569
6,106 7,800 5,612 7,80030,094 50,103 47,278 49,195
Total 470,608 591,118 491,193 615,203
91,674 96,000 96,000 100,0208,475 5,000 5,000 5,000
324,314 413,500 413,500 456,7900 10,000 10,000 10,000
46,145 66,618 (33,307) 43,393Total 470,608 591,118 491,193 615,203
General Fund-Other
2018-19
BUILDING DEVELOPMENT SERVICESProgram 5410
Expenditures:Salaries & Wages
Building Development Services staff oversee review of development plans, perform building plan review, inspection buildingconstruction activities and interacts with building and industry organizations in order to promote a vibrant and safe buildingenvironment. Through property and construction information, inspections and enforcement the staff verifies construction projectsmeet appropriate building code standards thereby ensuring public safety.
FinesFees/PermitsOther Revenue
Revenue Sources:
Chief Building Official
Licenses/Permits
Construction InspectorMechanical & Plumbing InspectorElectrical Inspector
Commerical Development Review Coordinator
Permit Clerk
Employee BenefitsMaterials & SuppliesServicesSalaries &
Wages62%
Employee Benefits
29%Materials &
Supplies1%
Services8%
Expenditures by Type
Licenses/Permits17%
Fees/ Permits
79%
Other Revenue
2%
Revenue Sources by Type
5 - 21

• Enforce minimum property maintenance codes related to exterior yard conditions related to vegetation, trash, debris,trash collection practices, firewood storage, standing water, excessive lighting, vehicles on private property, somezoning issues and trees.
• Enforce minimum property maintenance codes for interior housing conditions related to electrical, mechanical,plumbing, sanitation and egress issues.
• Coordinate the City's Neighborhood Cleanup Dumpster program.• Enforce minimum dangerous building codes related to exterior / interior conditions.• Coordinate the Tree City USA program.• Provide professional code enforcement with the goal of eliminating blight and ensuring the health, safety, and welfare
of the City.
• Complete implementation of Accela Automation software system and staff training.• Continued improvement of Abatement Program through work crew staff changes.• Continued improvement of utilizing CDBG funds for demolitions and stabilization.• Continued improvements of utilizing work crew staff to secure vacant abandoned properties.• Implementation of Tolemi software to track and identify core areas of code violations.• Impletation of Ordinance 7-328 Vacant Residential Building Registration.• Neighborhood Services Initiative.
• Use software to become more efficient, in order for existing staff to be able to respond to the number of complaints wereceive.
• Use current inspection staff to respond to complaints and proactively survey for violations that add to unhealthy andblighted conditions in the community.
• Work with public to address the cleanliness of neighborhoods and help to establish neighborhood pride.• Improve on the results of the Community Alliance Survey to help reduce the negative appearance of blighted
properties.• Utilize a vacant property registration ordinance to help with keep track of the inventory and enforce codes by applying a
registration fee for residential structures to help the appearance of the neighborhoods.• Implement a rental property inspection program to promote health and safety for our tenants within the City.• Utilize a new non federal funding for demolitions and stabilizations of dangerous and deteriorated properties among the
City.• Rental Inspection Program.
• During calendar year 2018, the Property Maintenance Division initiated cases and performed 1,285 abatements, withtotal billing of $227,336.25
• Initiated 10,704 cases related to property maintenance and dangerous building violations.• Issued 1,151 administrative penalties.• Performed 586 securing abatements.• Issued 537 Municipal citations.• Utilized $125,050.00 of CDBG funds in demolishing structures.
Property MaintenanceProperty Maintenance, Demolitions
MissionThe Property Maintenance division enforces minimum property maintenance standards adopted by the City Council.
Core Services
Performance Statistics
Current Year Activity/Achievements
Budget Challenges/Planned Initiatives
5 - 22

Planning & CD Department
Program Description
2017-18 2018-19 2019-20Adopted Estimated
Staffing Detail Actual Budget Actual Budget
Property Maintenance Manager 1 1 1 1Dangerous Building Insprector 1 1 1 1Property Maintenance Inspector 4 4 4 4Work Crew Supervisor 1 1 1 1NBHD Service Cooridinator 1 1 1 1Code Enforcement Clerk 1 1 1 1Laborer 1 1 1 1
10 10 10 10
Operating Budget Summary
2017-18 2018-19 2019-20Adopted Estimated
Actual Budget Actual Budget
352,537 379,714 405,689 427,948150,126 174,999 179,213 205,09429,429 35,250 25,148 30,300
156,478 183,133 166,733 193,7801,972 2,500 2,023 2,500
0 30,000 0 15,000Total 690,543 805,595 778,806 874,622
42,865 40,000 40,000 45,00084,446 90,000 90,000 100,000
50 0 0 0423,000 423,000 423,000 438,000140,181 252,595 225,806 291,622
Total 690,543 805,595 778,806 874,622General Fund-Other
Materials & Supplies
PROPERTY MAINTENANCEProgram 5430
Expenditures:Salaries & WagesEmployee Benefits
Property maintenance staff work with citizens in an effort to eliminate trash, debris, overgrown weeds and dangerous buildingsthroughout the city, The staff also provides rodent and mosquito control and rental dwelling inspections.
Other RevenueFund Transfers
Services UtitliesCapital
Revenue Sources:Admin Code PenalitiesWeed/Trash Abatements
Salaries & Wages
49%
Employee Benefits
14%
Materials & Supplies
5%
Services 22%Capital
2%
Expenditures by Type
Admin Code
Penalities8%
Weed/Trash Abatements
15%
Fund Transfers
75%
Revenue Sources by Type
5 - 23

• Enforce minimum property maintenance codes related to exterior yard conditions related to vegetation, trash, debris,trash collection practices, firewood storage, standing water, excessive lighting, vehicles on private property, somezoning issues and trees.
• Enforce minimum property maintenance codes for interior housing conditions related to electrical, mechanical,plumbing, sanitation and egress issues.
• Coordinate the City's Neighborhood Cleanup Dumpster program.• Enforce minimum dangerous building codes related to exterior / interior conditions.• Coordinate the Tree City USA program.• Provide professional code enforcement with the goal of eliminating blight and ensuring the health, safety, and welfare
of the City.
• Complete implementation of Accela Automation software system and staff training.• Continued improvement of Abatement Program through work crew staff changes.• Continued improvement of utilizing CDBG funds for demolitions and stabilization.• Continued improvements of utilizing work crew staff to secure vacant abandoned properties.• Implementation of Tolemi software to track and identify core areas of code violations.• Impletation of Ordinance 7-328 Vacant Residential Building Registration.• Neighborhood Services Initiative.
• Use software to become more efficient, in order for existing staff to be able to respond to the number of complaints wereceive.
• Use current inspection staff to respond to complaints and proactively survey for violations that add to unhealthy andblighted conditions in the community.
• Work with public to address the cleanliness of neighborhoods and help to establish neighborhood pride.• Improve on the results of the Community Alliance Survey to help reduce the negative appearance of blighted
properties.• Utilize a vacant property registration ordinance to help with keep track of the inventory and enforce codes by applying a
registration fee for residential structures to help the appearance of the neighborhoods.• Implement a rental property inspection program to promote health and safety for our tenants within the City.• Utilize a new non federal funding for demolitions and stabilizations of dangerous and deteriorated properties among the
City.• Rental Inspection Program.
• During calendar year 2018, the Property Maintenance Division initiated cases and performed 1,285 abatements, withtotal billing of $227,336.25
• Initiated 10,704 cases related to property maintenance and dangerous building violations.• Issued 1,151 administrative penalties.• Performed 586 securing abatements.• Issued 537 Municipal citations.• Utilized $125,050.00 of CDBG funds in demolishing structures.
Performance Statistics
Current Year Activity/Achievements
Budget Challenges/Planned Initiatives
Core Services
Property MaintenanceProperty Maintenance, Demolitions
MissionThe Property Maintenance division enforces minimum property maintenance standards adopted by the City Council.
5 - 24

Planning & CD Department
Program Description
2017-18 2018-19 2019-20Adopted Estimated
Staffing Detail Actual Budget Actual Budget
Historic Preservation Planner 0.5 0.5 0.5 0.50.5 0.5 0.5 0.5
Operating Budget Summary
2017-18 2018-19 2019-20Adopted Estimated
Actual Budget Actual Budget
110,739 115,342 88,020 28,57345,896 57,622 45,958 16,925
2,413 3,555 2,422 2,455161,886 219,650 219,650 219,615
0 0 0 0Total 320,934 396,169 356,050 267,568
10,628 0 0 01,843 0 0 0
0 0 0 0308,463 396,169 356,050 267,568
Total 320,934 396,169 356,050 267,568CDBG Fund - OtherFed Entitlmnt Grnt
DEMOLITIONSProgram 5360
Expenditures:Salaries & WagesEmployee BenefitsMaterials & SuppliesServicesCapital
Revenue Sources:Principal EarningsInterest Earnings
Through this program, federal funding is used to eliminate slum and blight conditions by securing or demolishing dilapidated,abandoned, or dangerous structures thereby assuring public health and safety. The Historic Preservation Planner also provideshistoric preservation review compliance for rehab and demolition projects using State and Federal funding.
Salaries & Wages
11%
Employee Benefits
12%Materials
& Supplies
1%
Services82%
Expenditures by Type
CDBG Fund -Other100%
Revenue Sources by Type
5 - 25

(this page intentionally left blank)

PUBLIC SAFETY DEPARTMENTS
TOTAL BUDGETED RESOURCES: 39,033,743$
CITY MANAGER
POLICE DEPARTMENT
FIRE DEPARTMENT
POLICE ADMINISTRATION
POLICE PATROL
DETECTIVE DIVISION
TRAINING
SUPPORT SERVICES
FIRE ADMINISTRATION
FIRE SUPPRESSION
FIRE PREVENTION
FIRE TRAINING
FIRE EQUIPMENT SUPPORT
EMERGENCY MANAGEMENTCOMMUNICATIONS
INFORMATION SERVICES
VEHICLE MAINTENANCE
HEALTH DEPARTMENT
HEALTH ADMINISTRATION
CLINIC SERVICES
COMMUNITY HEALTH SERVICES
W.I.C.
ENVIRONMENTAL HEALTH & FOOD
SAFETY
ANIMAL CONTROL & RESCUE
The Public Safety Departments - the St. Joseph Police Department, St. Joseph Fire Department and St. JosephHealth Department - provide a wide range of public safety services, detailed in the following pages.
Services are funded through the public safety property tax, general property taxes, general sales taxes, the 2013 voterapproved half-cent public safety sales tax, charges for services, and a variety of state and federal grants.
6 - 1

PUBLIC SAFETYSOURCES & USES
General Fund82%
Public Safety Fund18%
Police Department51%
Fire Department38%
Health Department11%
PROGRAM USES
FUNDING SOURCES
6 - 2

PUBLIC SAFETY DEPARTMENTSSUMMARY
2017-18 2019-20Adopted Estimated
Actual Budget Actual Budget
Salaries & Wages 17,799,852 19,633,412 18,337,836 18,303,268117,815 115,825 115,825 135,000
10,361,232 11,114,475 11,461,487 11,031,564836,891 910,144 1,166,668 739,755
3,522,399 3,619,153 3,695,754 3,615,4024,920,140 5,518,270 5,518,270 4,694,499
908,056 758,075 777,483 317,7560 0 0 196,500
38,466,383 41,669,354 41,073,324 39,033,743USES BY PROGRAM DEPARTMENT
957,493 1,318,535 1,208,745 871,7926,732,874 7,196,351 7,034,820 7,043,2122,378,996 2,504,870 2,525,850 2,471,609
Police 4,659,193 4,955,570 4,878,682 4,300,588146,896 161,579 163,333 154,896
Police 812,197 856,010 851,679 833,427Police 2,543,613 2,765,747 2,745,622 2,752,787
632,427 680,208 681,643 684,916460,786 733,980 737,961 456,72499,798 147,965 232,134 157,838
469,552 751,277 551,138 192,10210,726,658 11,306,981 11,026,708 11,293,969
405,366 468,007 434,612 470,976246,682 263,884 271,854 264,534538,149 440,916 401,707 386,397107,044 120,758 147,435 122,488
2,327,830 2,448,657 2,449,857 2,135,400876,004 931,462 1,041,086 803,821
1,030,744 1,092,645 1,075,601 967,105334,954 314,155 357,167 438,757438,093 494,980 490,435 516,270236,650 283,027 268,399 235,519859,690 946,018 1,011,084 1,008,581444,693 485,771 485,771 470,036
38,466,383 41,669,354 41,073,324 39,033,743FUNDING SOURCES
31,034,667 33,779,356 33,259,014 32,127,7207,431,716 7,889,998 7,814,310 6,906,024
38,466,383 41,669,354 41,073,324 39,033,743
Police 180.0 185.0 185.0 187.0Fire 131.0 131.0 131.0 131.0Health 44.5 44.5 44.5 44.5
355.5 360.5 360.5 362.5
STAFFING SUMMARY
2018-19
Police
Police
PolicePolicePolice
PolicePolice
ACCOUNT TYPE
Retired Fire "Consultant" PayPayroll Expenses & BenefitsMaterials & SuppliesUtilities & Other Contracted ServicesTransfersCapital OutlayDebt Service
Police AdministrationPatrol OperationsDetective DivisionPublic Safety Tax - PoliceTrainingSupport ServicesPolice CommunicationsInformation ServicesPolice MaintenanceGrant Funded ProgramsFire AdministrationFire SuppressionFire PreventionFire TrainingFire Equipment Support
FireFireFireFireFireFireFireHealthHealthHealth
Emergency ManagementPublic Safety Tax - FireHealth AdministrationClinic ServicesCommunity Health Services
General FundPublic Safety Fund
HealthHealthHealthHealth
WIC ServicesHealth/Food SafetyAnimal Control/RescuePublic Safety Tax - Health
6 - 3

(this page intentionally left blank)

CHIEF OF POLICE
ADMINISTRATIVE ASSISTANT
SECRETARY
PROFESSIONAL STANDARDS POLICY COMPLIANCE
POLICE ADMINISTRATION
6 - 4

•••
•••
•
••
•
•
••
•
••
••
••
••••••••
•
••••••
Monitor monthly activity reports and progress on long term and short term goals and objectives.Enhance relationships with citizens and partner agencies.
Identify areas we can improve services.
Administer the financial, operational and capital budgets of the department.Manage the overall working of the department to provide a safe and secure community environment.Create a more involved, responsible community by building stronger community partnerships and improvingcustomer service.Provide organizational leadership and support.
Attended weekly public meetings and provided presentations to citizen groups including Neighborhood Watch,Community Police Advisory Committee, etc.Completed the Annual Report for calendar year 2018.Completed transition to Missouri Incident Based Reporting System (MIBRS) and reported out 2018 crime statistics.
Coordinate the achievement of goals and objectives established in the multiyear strategic plan.
Number of documented complaints investigated: 66Total Part I crimes reported: 5,131
Number of pursuits reviewed: 69
Ensure consistent compliance with department policies, procedures, as well as state and federal laws.Continue to investigate allegations of misconduct.
Respond to every complaint filed by a citizen.Maintain certification in Missouri Incident Based Reporting System (MIBRS).Maintain standards for Missouri State Certification.
Number of "Use of Force" incidents reviewed: 315Performance Statistics
Total crimes reported: 11,715Total traffic crashes: 2,269Number of new hire background investigations: 17
Ensure effective communications between Administration and line officers.Educate the public as to general police procedures and give them information they can use to effectively work withthe Police Department through the Citizen's Police Academy.Coordinate strategies to reduce crime, the fear of crime, and improve quality of life for the citizens of St. Joseph.Coordinate the achievement of goals and objectives in the multiyear strategic plan.Work with Division Commanders in setting annual goals, and monitor achievement.
Continued implementation of crime reduction strategy Informed Response through Intelligence and Statistics, andbegan using predictive analysis.Maintain State Certification standards for performance and administration of the police department, auditscompletedAdded 2 commissioned personnel.Overcame staff reductions related to Military deployments, retirements, FMLA, and officer injuries while hiring andtraining new personnel and continuing to meet or exceed the level of services provided in the past.Conducted background investigations for new hires.Continued implementation of the 2021 Strategic Plan.
Police Administration
Mission
Core Services
Manage overtime to ensure adequate services are provided for the most serious crimes, while continuing to addressother crime and quality of life issues in the community.
Current Year Activity/Achievements
Budget Challenges/Planned Initiatives
The mission of the Police Administration Division is to ensure professional police service through the establishment ofdepartment goals and objectives and the assurance that they are being accomplished; the creation and adherence todepartment written directives; and the insistence on excellent communications with those outside the department.
6 - 5

Police Department
POLICE ADMINISTRATIONProgram 8340
Program Description
2017-18 2019-20Staffing Details Adopted Estimated
Actual Budget Actual BudgetPolice Chief 1 1 1 1Police Sergeant 2 2 2 2Administrative Asst to the Chief 1 1 1 1Secretary 1 1 1 1
5 5 5 5
Operating Budget Summary
2017-18 2019-20Adopted Estimated
Actual Budget Actual Budget
326,103 616,904 21,532 18,282150,717 153,996 642,237 168,51411,488 7,600 6,600 (48,608)
469,185 540,035 538,376 537,1050 0 0 196,500
Total 957,493 1,318,535 1,208,745 871,792
345 50 125,296 50140 100 313 2,120
0 0 0 0957,008 1,318,385 1,083,136 869,622
Total 957,493 1,318,535 1,208,745 871,792
2018-19
2018-19
Expenditures:
Revenue Sources:
Debt Service
Public Safety TaxOther General Fund
Salaries & WagesEmployee BenefitsMaterials/SuppliesServices/LEC Contrb
InterestOther Revenue
Salaries & Wages
2%Employee Benefits
17%
Materials/Supplies
1%Services/LEC
Contrb53%
Debt Service
20%
Expenditures by Type
Other Revenue
0%Interest
1%
Public Safety Tax
0%
Other General
Fund100%
Revenue Sources by Type
The Police Chief and staff ensure professional police service through the establishment of department goals andobjectives and the assurance that they are being accomplished; the creation and adherence to department writtendirectives; and the insistence on excellent communications with those outside the department. The Buchanan CountyLaw Enforcement Center serves as the operational headquarters of the St. Joseph Police Department. The City pays40% of the total L.E.C. operating budget and 50% of capital purchases. That expenditure is also budgeted in thisprogram.
6 - 6

Police Department
PUBLIC SAFETY - POLICEProgram 2295
Program Description
Staffing Details 2017-18 2019-20Adopted Estimated
Staffing Detail Actual Budget Actual BudgetSergeant 1 1 1 1Patrol Officer 17 19 19 19
18 20 20 20Wages & other related staff costs for the new positions are budgeted here.
Operating Budget Summary
2017-18 2019-20Adopted Estimated
Actual Budget Actual Budget
822,230 994,214 945,815 1,006,817488,230 573,854 559,534 550,437129,806 125,510 123,821 104,81877,377 104,240 104,240 103,515
2,369,727 2,845,467 2,845,467 2,217,245771,823 312,285 299,805 317,756
Total 4,659,193 4,955,570 4,878,682 4,300,588
4,659,193 4,955,570 4,878,682 4,300,588Total 4,659,193 4,955,570 4,878,682 4,300,588
2018-19
2018-19
Expenditures:
Revenue Sources:Public Safety Fund
TransfersCapital Outlay
Salaries & WagesEmployee BenefitsMaterials/SuppliesServices
Salaries & Wages
23%Employee Benefits
11%Materials/Supplies
3%
Services2%
Transfers52%
Capital Outlay
7%
Expenditures by Type
Public Safety Fund100%
Revenue Sources by Type
This program is funded totally through the 1/2 cent Public Safety Tax. Expenditures for the additional personnel hired,per the plan approved by the voters, are accounted for in this program. Staff are assigned to various other divisionswithin the department. Eventually the department hopes to create a variety of positions in Patrol, Detectives, and thesupport areas. Transfers are also made to the Police Department in the General Fund to cover salary enhancementsfor the department employees.
6 - 7

CHIEF OF POLICE
PATROL DIVISION
DAY SHIFT
SCHOOL RESOURCE OFFICERS
WARRANT UNIT
EVENING SHIFT
MIDNIGHT SHIFT TRAFFIC UNIT
PATROL OPERATIONS
6 - 8

•••
••
•
•
••
••
•••
•
••
••••••
Number of calls for service in 2017: 55,582 in 2018: 52,809Number of self-initiated activities in 2017: 36,852 in 2018: 44,708Number of Traffic Summons issued in 2017: 15,297 in 2018: 16,168Number of Adult arrests in 2017: 6322 in 2018: 6811
Average response time (priority calls): in 2017: 11m 55s in 2018: 11m 29s
The Department hired 9 new Officers during the year to fill vacancies and positions created retirements andcompletely fill all budgeted positions.
Keep staffing at optimum levels in patrol.Continue positive community interaction by participating in meetings with various citizen and business groups.
Number of School Resource Officer Cases in 2017: 553 in 2018: 460
Performance Statistics
Continue working towards the goals and objectives set out in the multi-year strategic plan.Continue with a replacement plan for equipment for various units to keep technology updated.
Maintain items needed to efficiently run the division.Keep Officers trained as required by State Certification requirements.
Day shift Officers make regular visits to the elementary schools.
Budget Challenges/Planned Initiatives
With partnership with the school district we added one new SRO position.
During 2018 the division worked to continue the development of partnerships with business and neighborhoodgroups.Officers from all shifts participate in regular group meetings and attend neighborhood meetings in their assignedareas.This provides citizens with more contact with officers assigned to specific areas and neighborhoods.
Current Year Activity/Achievements
Patrol Operations
MissionThe Patrol Division is a 24 hour operation responsible for responding to calls for service and initiating enforcementactivities within the 46.5 square miles of the City of St. Joseph. In addition, the division participates in planning andprovides manpower for the security needs of the many special events held within the city. The division is compromisedof 93 commissioned officers and one civilian clerk, divided into three shifts. Each shift is responsible for an 8 hour tourof duty.
Core Services
Serve felony and misdemeanor arrest warrants.Work with other agencies and city departments to provide a unified response in emergency situations.
Respond to calls for service and enforce Federal, State and Municipal laws or ordinances.Enforce traffic safety laws and investigate traffic crashes.Maintain specialized units to provide specific services to include: Special Response Team, Warrants Unit, K-9 Unit,and School Resource Officers.
6 - 9

Police Department
PATROL OPERATIONSProgram 2210
Program Description
2017-18 2019-20Staffing Details Adopted Estimated Actual Budget Actual BudgetPolice Commander 1 1 1 1Police Captain 3 3 3 3Police Sergeant 11 11 11 11Police Officer 61 60 60 60School Resource Officers 4 5 5 7Patrol Clerk 1 1 1 1
81 81 81 83
Operating Budget Summary
2017-18 2019-20Adopted Estimated
Actual Budget Actual Budget
4,141,754 4,471,360 4,269,460 4,500,7112,476,413 2,575,311 2,515,308 2,400,371
109,586 119,160 221,532 121,17023,122 30,520 28,520 20,960
(18,000) 0 0 0Total 6,732,874 7,196,351 7,034,820 7,043,212
42,900 39,000 39,000 39,000107,364 0 0 0
833 100 2,086 2,090166,203 207,570 207,570 270,378
6,415,574 6,949,681 6,786,164 6,731,744 Total 6,732,874 7,196,351 7,034,820 7,043,212Other General Fund
FinesOther Revenue
COPS IN SCHOOLS
Capital Outlay
Interest
2018-19
2018-19
Expenditures:
Revenue Sources:
Salaries & WagesEmployee BenefitsMaterials & SuppliesServices
Salaries & Wages
64%
Employee Benefits
34%
Materials & Supplies
2%Services
1%
Expenditures by Type
Fines0%
COPS IN SCHOOLS
4%
Interest1%
Other General
Fund95%
Revenue Sources by Type
To enforce Federal, State and local laws by providing 24 hour responses to public safety emergency , non-emergencysituations and other incidents that require police intervention or participation in order to protect life and property and topromote a sense of safety and well being in the community.
6 - 10

Police Department
GRANT FUNDED PROGRAMS2280
Program Description
2017-18 2019-20Staffing Details Adopted Estimated
Actual Budget Actual BudgetNA 0 0 0 0
0 0 0 0
Operating Budget Summary
2017-18 2019-20Adopted Estimated
Actual Budget Actual Budget
43,849 79,143 88,421 74,51421,892 8,000 10,512 28,8674,175 16,664 47,872 12,500
29,882 44,158 61,028 41,9570 0 24,301 0
Total 99,798 147,965 232,134 157,838
15,613 15,000 15,000 20,280100,840 107,860 192,705 103,240
301 200 470 475100 0 1,500 1,500
(17,056) 24,905 22,459 32,343Total 99,798 147,965 232,134 157,838
Other General Fund
Charges for ServicesGrantsInterest
Capital Outlay
2018-19
2018-19
Expenditures:
Revenue Sources:
Other Revenue
Salaries & WagesEmployee BenefitsMaterials/Supplies
Services
Salaries & Wages
47%
Employee Benefits
18%
Materials/Supplies
11%
Services27%
Expenditures by Type
Charges for
Services, 14%
Grants, 77%
Interest1%
Other General
Fund 8%
Revenue Sources by Type
This program was developed to account for the revenues and expenditures by the Police Department from grant orother special revenue sources.
6 - 11

CHIEF OF POLICE
DETECTIVE DIVISION
CRIME INTELLIGENCE
STREET CRIMES UNIT
FAMILY CRIMES UNIT
FINANCIALELECTRONIC
CRIMES
GENERAL ASSIGNMENTS
CSI
DETECTIVE DIVISION
6 - 12

••
•
•
••
•
•
•
•
•
•
•••••
Detective Division
Mission
Core Services
Current Year Activity/Achievements
Budget Challenges / Planned Initiatives
The Detective Division is the investigative branch of the Police Department and as such is responsible for all secondaryinvestigation of crimes that occur within the boundaries of the City of St. Joseph. Members of the Detective Division areresponsible for case preparation and assisting in prosecution through court room testimony.
Record progress of investigations and maintain informational files on crimes and suspects.
Investigate all crimes assigned; Interview victims, witnesses, and suspects to determine the facts of an incident.Direct activities at crime scenes to assist victims, gather and protect physical evidence, and develop leads for furtherinvestigation.Ensure that all subjects charged in an offense are processed to include photographs and fingerprints to be included inthe official record of the case.Review department reports and other data pertaining to criminal cases to evaluate solvability factors and establishassignment options.
Assist patrol officers in the apprehension of offenders and serve as a liaison between the department and otheragencies.Assist in planning and participate in training citizens, students, and businesses in crime prevention tactics.
The division was able to obtain valuable equipment through grant funding and budgeted purchases that enhanced theabilities of the investigators to meet the demands of our mission. The Crime Scene Unit and Street Crimes Unit bothof which are influenced by changing technology were particularly impacted by the new equipment acquisitions.
Performance Statistics
Personnel responsible for conducting criminal investigations require specialized training to compile a professional,thorough, and precise case suitable to submit for prosecution. The division has been fortunate to receive fundingthrough the budget process to assist with this expense.
Total Cases Reviewed - 17,160 Cleared by Exception - 168Total Cases Assigned - 3,398 Closed by Arrest - 674Referred to State Prosecutor - 1055 Referred to City Prosecutor - 232Referred to Juvenile - 83 Referred to Other - 122Open - 653 Unfounded - 204
Personnel movement with the Detective Division continues to be a challenge in terms of equipment, supplies, trainingand overtime needs.Advancements in technology and statutory changes resulting from legislative action are a constant in our field. Theseoccurrences often require unanticipated actions that must be taken with little time for preparation.Members of the Detective Division will continue to work toward accomplishing the objectives established in therecently updated Department Strategic Plan that relate to our function.
6 - 13

Police Department
DETECTIVE DIVISIONProgram 2240
Program Description
2017-18 2019-20Staffing Details Adopted Estimated
Actual Budget Actual BudgetPolice Commander 1 1 1 1Police Captain 1 1 1 1Police Sergeant 4 4 4 4Police Officer 18 20 20 20Secretary 1 1 1 1
25 27 27 27
Operating Budget Summary
2017-18 2019-20Adopted Estimated
Actual Budget Actual Budget
1,473,533 1,584,307 1,598,485 1,575,334849,247 853,851 865,873 818,69521,995 13,132 12,712 8,20034,221 53,580 48,780 69,380
Total 2,378,996 2,504,870 2,525,850 2,471,609
2,378,996 2,504,870 2,525,850 2,471,609Total 2,378,996 2,504,870 2,525,850 2,471,609
Expenditures:
2018-19
2018-19
Revenue Sources:Other General Fund
Salaries & WagesEmployee BenefitsMaterials/SuppliesServices
Salaries & Wages
64%
Employee Benefits
33%
Materials/Supplies
1%Services
3%
Expenditures by Type
Other General
Fund100%
Revenue Sources by Type
The Detective Division was formed to apprehend suspected offenders, assist in the prosecution of those individuals, andrecover stolen property through the investigation of criminal acts that occur within the boundaries of the City. Detectivesalso provide assistance to the public, other law enforcement agencies and fellow officers.
6 - 14

CHIEF OF POLICE
SUPPORT SERVICES DIVISION
COMMUNICATIONS TRAINING
CRIME ANALYSIS CRIME PREVENTION
GRANTS
DAY SHIFT
EVENING SHIFT
MIDNIGHT SHIFT
BOOKING
ARMORER
RECORDS UNIT TELESERVE
EVIDENCE
VEHICLE MAINTENANCE
MAIN CONTROL
SUPPORT SERVICES
6 - 15

••
•••
•••
••••••
•••
•
••
••••
••••••••••
Support ServicesSupport Services/Training/CommunicationsInformation Services/Vehicle Maintenance
Mission
Core Services
To enhance the crime fighting capabilities of the department by providing long-range planning and crime analysisintelligence to the department. To educate the public in crime prevention and public education in areas such as policeprocedures and operational functions. To provide skilled, professional public safety officer training. To maintain thepolice fleet in a state of good repair. To ensure 24-hour, accurate, clear and timely communication between the public,the Police Department, the Fire Department, and the County Sheriff's Department. To serve as custodial gatekeeperof police records and maintain those records as required by state statute and federal law.
Provide crime analysis and statistical reports to the department.Identify specific training needs of department personnel and provide customized public safety training programs forsworn and civilian employees.Provide timely, comprehensive preventive vehicle maintenance checks.
Number of citizen completing beverage server class 932.
Number of calls on the non-emergency line 147,049.Number of prisoners booked 3,776.Neighborhood Watch Meetings in 85.
Number of vehicle maintenance orders 1251.Number of miles driven by SJPD fleet 1,122,300.
Citizen volunteer hours 1670.
Total number of new case reports by Records Unit 17,168.Number of incoming 911 calls 55,685.
Develop a system to track CA requests. (internally and externally).
Number of grants received in 2017 were 18, value of grants received $126,623.Performance Statistics
Developing a solution for radio system encryption (AES 256-bit) and acquisition of mobile/portable radios.Expansion of Bug-Out-Box with two addional operator positions for Communications.Develop a replacement plan for aging consoles in Communications Center.
Completed and in use of Virtual Academy training to assist in meeting new POST requirements.9-1-1 For Kids Education Program reached out to over 1,500 children in area schools, and hundreds of childrenvisited the booth at numerous community events. Also expanded the Summer Youth Camp.Progression of replacing current ticketing software with Brazzos initiated.
Computer Aided Dispatch program upgrade Enterprise Edition.Improve CAD mapping services by continuing with monthly meetings with Fire Dept. to identify and address areasfor improvement and any other issue of concern.
Budget Challenges/Planned Initiatives
Mobile 10 field reporting completed.
Active 911 application completed for notification Police/Fire incidents.Completed training all officers with he use of Narcan.Crime Analysis Unit continued to expand in providing crime analysis support to include the use of predictive analysisto enhance patrol strategies.
Maintain tracking systems for gas usage, mileage, maintenance and repairs.Provide clear, accurate and timely communications between the SJPD, SJFD, Rural Fire Departments, CountySheriff's Department, the public, and Police Dispatch operators.Enter data to the MULES system.Process all external and internal requests for reports and information.Crime Prevention Unit engages in speaking engagements with civic groups, service clubs, neighborhoodassociations, business groups, etc.
February, the department was recognized and certified by MIBRS.Completed server/database environment through virtualization.Integration web service text to 911 into phone hardware system 1st phase was completed.
Current Year Activity/Achievements
6 - 16

Police Department
SUPPORT SERVICESProgram 2250
Program Description
2017-18 2019-20Staffing Details Adopted Estimated
Actual Budget Actual BudgetPolice Commander 1 1 1 1Police Sergeant 3 3 3 3Police Officer 1 1 1 1Booking Officer 4 4 4 4Booking Officer PT 2 / 1 PT as needed 1.5 1.5 1.5 1.5
10.5 10.5 10.5 10.5
Operating Budget Summary
2017-18 2019-20Adopted Estimated
Actual Budget Actual Budget
501,916 520,081 520,659 521,110258,343 269,205 267,639 245,38733,096 34,230 34,642 36,23018,841 32,494 28,739 30,700
Total 812,197 856,010 851,679 833,427
26,845 28,000 28,000 26,6406,000 5,000 5,000 3,0001,372 1,000 2,653 2,125
635 0 0 0777,345 822,010 816,026 801,662
Total 812,197 856,010 851,679 833,427Other General Fund
Alcohol Server LicFinesInterestOther Revenue
2018-19
2018-19
Expenditures:
Revenue Sources:
Salaries & WagesEmployee BenefitsMaterials/SuppliesServicesSalaries &
Wages63%
Employee Benefits
29%
Materials/Supplies
4%Services
4%
Expenditures by Type
Alcohol Server Lic
3%Fines1%
Interest1%
Other General
Fund95%
Revenue Sources by Type
Staff enhance the crime fighting capabilities of the department by providing long-range planning and crime analysisintelligence to the department. It also educates the public in crime prevention and public education in areas such aspolice procedures and operational functions. The Police Commander in this division also oversees the operations of theTraining, Information Services, Maintenance, and Communications divisions.
6 - 17

Police Department
TRAININGProgram 2260
Program Description
2017-18 2019-20Staffing Details Adopted Estimated
Actual Budget Actual BudgetPolice Sergeant 1 1 1 1
Operating Budget Summary
2017-18 2019-20Adopted Estimated
Actual Budget Actual Budget
56,816 70,076 69,913 70,07574,306 75,083 77,086 71,90110,298 8,830 9,797 8,8305,180 7,290 6,290 3,790
296 300 247 300Total 146,896 161,579 163,333 154,896
Other Revenue 973 0 0 0145,923 161,579 163,333 154,896
Total 146,896 161,579 163,333 154,896
2018-19
2018-19
Expenditures:
Revenue Sources:
Other General Fund
Utilities
Salaries & WagesEmployee BenefitsMaterials/SuppliesServices
Salaries & Wages
45%
Employee Benefits
46%
Materials/Supplies
6%
Services3%
Utilities1%
Expenditures by Type
Other General
Fund 100%
Revenue Sources by Type
This Unit is responsible for in-service training, specialized seminars, and the mandated, Missouri Police OfficersStandards of Training Commission (P.O.S.T.) training in order to provide skilled, professional public safety officers.
6 -18

Police Department
VEHICLE MAINTENANCEProgram 2290
Program Description
2017-18 2019-20Staffing Details Adopted Estimated
Actual Budget Actual BudgetMaster Mechanic 1 1 1 1Auto Mechanic 1 1 1 1
2 2 2 2
Operating Budget Summary
2017-18 2019-20Adopted Estimated
Actual Budget Actual Budget
79,614 85,724 86,925 85,89736,753 38,146 38,604 40,192
184,297 211,120 206,253 214,855141,082 112,200 119,389 115,78019,040 286,790 286,790 0
Total 460,786 733,980 737,961 456,724
24,363 0 4,927 7,500436,423 733,980 733,034 449,224
Total 460,786 733,980 737,961 456,724
2018-19
2018-19
Expenditures:
Revenue Sources:
Other General Fund
Salaries & WagesEmployee BenefitsMaterials/SuppliesServices
Insurance Proceeds
Capital
Salaries & Wages
19%
Employee Benefits
9%
Materials/Supplies
26%
Services25%
Capital0%
Expenditures by Type
Insurance Proceeds
2%
Other General
Fund98%
Revenue Sources by Type
Staff maintain the police fleet in a state of good repair by conducting timely, comprehensive preventive maintenancechecks. With the increase in the number of officers starting in FY2015, the number of vehicles in the fleet will increase.FY2018 fleet will consists of 49 marked and 41 unmarked vehicles, 5 trucks and vans, 5 SUVs, 3 motorcycles, 4 trailers, 1armored vehilce and 1 command post.
6 - 19

Police Department
COMMUNICATIONSProgram 2910
Program Description
2017-18 2019-20Staffing Details Adopted Estimated
Actual Budget Actual Budget
Police Captain 1 1 1 1Senior Communications Operator 4 4 4 4Communications Operator 17 18 18 18Public Safety Network Administrator 1 1 1 1Communication Operators (PT) (2) as needed in lieu of overtime 1 1 1 1
24 25 25 25
Operating Budget Summary
2017-18 2019-20Adopted Estimated
Actual Budget Actual Budget
937,918 1,068,830 1,064,071 1,074,843397,663 464,546 456,584 485,29414,221 14,870 12,601 12,870
1,175,738 1,196,501 1,195,501 1,158,78018,073 21,000 16,865 21,000
Total 2,543,613 2,765,747 2,745,622 2,752,787
47,121 47,000 47,000 48,00016,692 17,000 17,000 16,10010,132 6,200 6,200 5,400
402,989 412,985 412,985 412,900280,741 282,000 282,000 281,50070,185 70,432 70,432 78,000
1,715,752 1,930,130 1,910,005 1,910,887Total 2,543,613 2,765,747 2,745,622 2,752,787
Other General Fund
Other Revenue
Alarm PermitsTower Rents
County-OprtnsCounty-MotorolaMosaic-Motorola
2018-19
2018-19
Expenditures:
Revenue Sources:
Utilities
Salaries & WagesEmployee BenefitsMaterials/SuppliesServices
Salaries & Wages
39%Employee Benefits
13%
Materials/Supplies
1%
Services42%
Utilities1%
Expenditures by Type
Alarm Permits
2%
Tower Rents
1%
Other Revenue
1%
County-Oprtns15%
County-Motorola
10% Mosaic-Motorola
3%
Other General
Fund69%
Revenue Sources by Type
The police communications center ensures that accurate, clear and timely communication occurs between the public, thePolice Department, the Fire Department, the ambulance service, the County Sheriff's Department and outlying firedistricts by providing routine and emergency public safety communications service twenty-four hours a day, seven days aweek.
6 - 20

Police Department
INFORMATION SERVICESProgram 2920
Program Description
2017-18 2019-20Staffing Details Adopted Estimated
Actual Budget Actual BudgetPolice Records Supervisor 1 1 1 1Evidence Control Technician 1 1 1 1Police Report Specialist 2 2 2 2Police Records Clerk 4 4 4 4Main Control Technician 4 4 4 4Police Records Clerk (PT) 0.5 0.5 0.5 0.5Main Control Technician (PT) (Paid directly in PS Tax - Police) 0.5 0.5 0.5 0.5Evidence Control Technician (PT) (Paid directly in PS Tax - Police) 0.5 0.5 0.5 0.5
13.5 13.5 13.5 13.5
Operating Budget Summary
2017-18 2019-20Adopted Estimated
Actual Budget Actual Budget
435,624 454,636 462,727 459,054187,945 211,082 206,226 214,772
5,827 6,500 5,700 5,6003,032 7,990 6,990 5,490
Total 632,427 680,208 681,643 684,916
632,427 680,208 681,643 684,916Total 632,427 680,208 681,643 684,916
2018-19
2018-19
Expenditures:
Revenue Sources:Other General Fund
Salaries & WagesEmployee BenefitsMaterials/SuppliesServices
Salaries & Wages
67%
Employee Benefits
31%
Materials/Supplies
1% Services1%
Expenditures by Type
Staff provide direct and indirect support services to the various units of the Police Department as well as direct service tothe public by maintenance of police records, teleserve and main control activities.
Other General
Fund100%
Revenue Sources By Type
6 - 21

FIRE CHIEF
ADMINISTRATIVE ASSISTANT TO
THE CHIEF
BATTALION CHIEF (3)
CAPTAIN (33)
CHIEF OF FIRE PREVENTION
FIRE INSPECTOR (3)
CHIEF TRAINING OFFICER
DRIVER/ENGINEER (33)
FIRE TRAINING OFFICER
FIREFIGHTER(51)
MASTER MECHANIC
MAINTENANCE TECHNICIAN
EMERGENCY MANAGER
FIRE DEPARTMENT
6 - 22

••
••••
••
•
•
•
•••
••
•••
•••• Need to purchase land for Station 8 and a possible addition to Headquarters.
For the second year, we were able to offer NFPA physicals to our firefighters. Physicals were done on site andincluded a visit with the doctor.We had 11 firefighters meet the "Fit as a Rookie" requirements of at least 100 hours of physical fitness.
Acts as a member of the Labor Negotiating Committee for the contract with the IAFF.Provide the best customer service possible to both the public and our fellow City employees.
Completed and opened two new fire stations at 3200 Faraon and 2316 So 22nd.We were able to complete a phase two environmental study on the Hansen Mead building located southeast of theHeadquarters station.
Negotiated and signed a new contract with Local 77 that was approved and in place in early 2018.
RFP's were done for the possible sale and reuse of old stations 9 and 11. After a lukewarm response to the RFP's itwas decided to deed Station 11 to Habitat for Humanity and lease the organization Station 9 for storage.
Fire Administration
Mission
Core Services
Current Year Activity/Achievements
The Fire Department with the help of the visitor and convention bureau hosted the Firefighters Association ofMissouri's annual Conference. Approximately 250 firefighter and their families attended the 3 day event.
To provide creative and innovative leadership in the emergency and non-emergency fire and ems services that weprovide for the citizens of St. Joseph.
Provide budgeting and oversight services to ensure fiscal control.
Work to maintain and improve our ISO rating by improving our training processes and station relocations.
Continue with NFPA physicals and implement additional methods and procedures to reduce cancer among ourfirefighters.Current radios are no longer able to be repaired and will need to be replaced in very near future.Continue to review General Orders and Standard Operation procedures with staff and Local 77.
Worked with Legal, EPA and MoDNR on HPI buildings and chemical storage. This included a public meeting.Fire Department paramedics assisted the Health Department with their annual flu clinic and we provided EMScoverage at two major softball tournaments hosted by the Parks Department.
Continue to upgrade fleet through public safety funding.Pursue grants through various local, state, and national grants.
Oversee the daily operations pertaining to Fire Suppression, Fire Training, Fire Prevention and Fire Maintenance.Interact with and ensure that the emergent and non-emergent needs of the business community and the generalpublic are met.Ensure the completion of all Capital Improvement Program projects relevant to the Fire Department.
Budget Challenges/Planned Initiatives
We completed our ISO inspection and expect results in 2019.
6 - 23

Fire Department
FIRE ADMINISTRATIONProgram 8350
Program Description
2017-18 2019-20Staffing Details Adopted Estimated
Actual Budget Actual BudgetFire Chief 1 1 1 1Administrative Asst to Fire Chief 1 1 1 1
2 2 2 2
Operating Budget Summary
2017-18 2019-20Adopted Estimated
Actual Budget Actual Budget
157,003 432,119 232,200 (145,646)117,815 115,825 115,825 135,00092,147 96,488 96,488 99,11622,412 23,095 21,545 26,40775,260 79,000 80,330 82,0004,915 4,750 4,750 (4,775)
Total 469,552 751,277 551,138 192,102
30,400 32,000 32,000 30,4004,468 3,500 3,500 3,000
10,097 0 57,516 02,105,720 2,187,032 2,187,032 2,007,218
(1,681,133) (1,471,255) (1,728,910) (1,848,516)Total 469,552 751,277 551,138 192,102
2018-19
2018-19
Expenditures:
Revenue Sources:Alarm Permits
Salaries & WagesFire Consultant PayEmployee BenefitsServices
Charges for ServicesOther RevenuePublic Sfty Sales TxOther General Fund
UtilitiesMaterials
Salaries & Wages
-30%
Employee Benefits
20%Services
5%
Utilities17%
Materials-1%
Fire Consultant Pay27%
Expenditures by Type
Alarm Permits
1%
Charges for
Services1%
Public Sfty
Sales Tx52%
Other General
Fund-49%
Revenue Sources by Type
Fire Administration provides the leadership and vision for the Fire Department's fire protection and rescue services.Fire Administration manages programs in Fire Suppression, Fire Training, Fire Prevention and Fire Maintenance.Staff interacts with and ensures that the non-emergent needs of the business community and the general public aremet. Fire Administration ensures the completion of all Capital Improvement Program projects relevant to the FireDepartment. Staff provides budgeting and oversight services to ensure fiscal control.
6 - 24

Fire Department
PUBLIC SAFETY - FIREProgram 2595
Program Description
2017-18 2019-20Staffing Details Adopted Estimated
Actual Budget Actual BudgetNA 0 0 0 0
0 0 0 0
Operating Budget Summary
2017-18 2019-20Adopted Estimated
Actual Budget Actual Budget
65,302 89,300 90,500 77,85764,743 66,825 66,825 50,325
2,105,720 2,187,032 2,187,032 2,007,21861,345 105,500 105,500 030,720 0 0 0
Total 2,327,830 2,448,657 2,449,857 2,135,400
0 0 1,200 1,2000 0 0 0
2,327,830 2,448,657 2,448,657 2,134,200Total 2,327,830 2,448,657 2,449,857 2,135,400
2018-19
2018-19
Expenditures:
Revenue Sources:Other RevenueTransfersPublic Safety Tx Fund
Materials/Supplies
TransfersCapital OutlayCapital Improvements
Services
MaterialsSupplies
4%Services,
4%
Transfers88%
Expenditures by Type
Other Revenue
0%
Public Safety Tx
Fund100%
Revenue Sources by Type
This program is funded totally through the 1/2 cent Public Safety Tax. Expenditures are concentrated in three areas -transfer to the Fire Department in the General Fund to cover the wage enhancements negotiated by the fire union,equipment purchases, and an escrow established as a sinking fund to enable purchases of major pieces of fireequipment in the future. There are no plans to create new positions in the fire department through this tax.
6 - 25

••
••
•
•••
••••
••
•
•
•
••
••
Budget Challenges/Planned Initiatives
Improve documented monthly training hours through Target Solutions.
Continue to work with Local 77 to establish a fitness program and complete a yearly physical for eachfirefighter.Continue to work with Local 77 to review General Orders and Standard Operating Procedures on ayearly basis.Participate in local and regional exercises.Continue to support employees willing to enhance their medical skills through refresher and outsidetraining classes, such as Trauma Trends, state fire schools, Hillyard Technical Center, and EMSconferences.Maintain our current ISO rating of 3, while looking at cost effective opportunities to improve.
Continue to work toward having all firefighters trained to level of Firefighter II, and all having an EMTlicense.
Respond to all types of fire-related emergencies within the City.
Increased total number of EMTs to 103.Fire crews are participating in assigned training through Target Solutions to meeting ISOrequirements.Maintained a 6-minute response time in over 80% of emergency medical calls.
Responded to 137 working structure fires,
Implement specialized emergency rescue operations in: Confined Space Rescue, Light Rescue,Water/Ice Rescue, Swift Water & River Rescue, and Hazardous Materials Response.Provide assistance and First Responder medical care to victims of sudden illness or injury.Conduct fire inspections of residential apartments (multi-family), commercial, and industrialoccupancies.Maintain mutual aid agreements with surrounding communities.
Responded to 11670. calls, with almost 65% being medical.
All EMTs completed King Airway insertion refresher class.
Fire Suppression
MissionTo protect the life, health, and property of the public through provision of fire protection, emergencyrescue and emergency medical First Responder services.
Fire crews completed 333 inspections last year.11 firefighters completed voluntary fitness program �Fit as a Rookie�. Completing over 1000 hours ofphysical fitness and getting a physical.5 firefighters trained with the state Incident Support Team.
Core Services
Current Year Activity/Achievements
6 -26

Fire Department
FIRE SUPPRESSIONProgram 2510
Program Description
2017-18 2019-20Staffing Details Adopted Estimated
Actual Budget Actual BudgetBattalion Chief 3 3 3 3Captain 33 33 33 33Driver/Engineer 33 33 33 33Firefighter 51 51 51 51
120 120 120 120
Operating Budget Summary
2017-18 2019-20Adopted Estimated
Actual Budget Actual Budget
6,423,400 6,700,370 6,494,587 6,606,4624,218,708 4,560,931 4,488,441 4,642,536
50,685 25,340 25,340 24,84033,864 20,340 18,340 20,130
Total 10,726,658 11,306,981 11,026,708 11,293,969
425,834 425,825 440,639 453,85871 0 0 0
10,300,752 10,881,156 10,586,069 10,840,111Total 10,726,658 11,306,981 11,026,708 11,293,969
2018-19
2018-19
Expenditures:
Revenue Sources:
Other RevenueOther General Fund
Salaries & WagesEmployee BenefitsMaterials & SuppliesServices
Fire District Contracts
Salaries & Wages,
61%
Employee Benefits
36%
Materials/Supplies
1%Services
1%
Expenditures by Type
Fire District Contracts
4%
Other General
Fund96%
Revenue Sources by Type
Fire Suppression personnel provide fire suppression, rescue, and emergency medical service to the City of St. Joseph andthree Fire Protection Districts. Fire Suppression personnel provide non-emergent support to the public with fire prevention,festival medical care, and citizen assistance services. Personnel also assist other City departments with manpower andequipment, as needed.
6 -27

•
•
••
••••
••
•••
•
•••
•
•••••••
Performance Statistics
To reduce the loss to property and life through fire code enforcement and public fire safety education. The Divisionmaintains statistics and appropriate records for public safety education, code compliance inspections and records onfire investigations.
39 Sprinkler and alarm system inspections63 Certificates of occupancy119 Building plans review35 Alarms and sprinkler system plans reviews0 Juvenile Fire Setter intervention
84 Annual inspections by Fire Inspectors (typically large industrial complexes)125 Walk-through inspections
All inspectors maintained certification.
Fire Prevention
Mission
Core Services
Current Year Activity/Achievements
Provide fire safety inspections in all public schools.Ensure every public and private elementary school, grades K through 4, receives fire prevention information andtraining as a part of Fire Prevention Week activities.Conduct fire prevention activities for all levels school-age to senior citizen.Provide fire code compliance review of all commercial/industrial building plans.Provide fire code compliance inspections prior to issuance of occupancy permits.
Conduct required fire code safety inspections in residential apartment (multi-family) and commercial/industrialoccupancies.Conduct required fire code violation re-inspections in residential apartment (multi-family) and commercial/industrialoccupancies.
Conduct investigations as to the source of all major fire incidents.
All Inspectors will remain certified as State of Missouri Fire Investigators.Obtain additional certifications: Certified Fire Investigator IAAI or PFFIA, ICC Plans Examiner, ICC Fire Marshal, andAEGIS System Administrator course from New World Systems.Continue to monitor progress at HPI with other agencies like Water protection, EPA and MoDNR.
Annual fire inspections/activities 424 (includes inspections, walkthrough, Cof O's).New Fire Prevention demonstration house was used at schools, residential care facilities, open houses for new firestations and other venues and reached 1790 children and 338 adults. There were 45 additional fire preventionprograms excluding the safety trailer.Donated old fire safety trailer to the Chillicothe Fire Department (this allowed the CFD to provide some of the
Budget Challenges/Planned InitiativesContinue to work with other departments to inventory, track and improve our knowledge of vacant and abandonedstructures.All Inspectors will be at least Inspector I certified through ICC.
Two members attended advanced arson investigation training in Florida (along with PD detective).
6 - 28

Fire Department
FIRE PREVENTIONProgram 2530
Program Description
2017-18 2019-20Staffing Details Adopted Estimated
Actual Budget Actual BudgetChief of Fire Prevention 1 1 1 1Fire Inspector 3 3 3 3
4 4 4 4
Operating Budget Summary
2017-18 2019-20Adopted Estimated
Actual Budget Actual Budget
240,179 280,242 258,702 279,772158,905 182,215 170,360 186,354
2,531 2,550 2,550 1,8503,751 3,000 3,000 3,000
0 0 0 0Total 405,366 468,007 434,612 470,976
215 250 250 250405,151 467,757 434,362 470,726
Total 405,366 468,007 434,612 470,976
2018-19
2018-19
Expenditures:
Revenue Sources:Other RevenueOther General Fund
Capital Outlay
Salaries & WagesEmployee BenefitsMaterials/SuppliesServices
Salaries & Wages,
62%
Employee Benefits
36%
Materials/Supplies
1%Services
1%
Expenditures by Type
Other General
Fund99%
Other Revenue
1%
Revenue Sources by Type
Fire Prevention staff provide fire investigation services to businesses and the public to ensure accurate fire causedetermination. Fire Prevention personnel are the lead inspectors to ensure a fire-safe community. Other activities includeplans review, fire code permitting and enforcement, and public education programs. Fire Prevention is the keeper of theDepartment's emergency response and fire inspection records.
6 - 29

•
•
•
••••
•••
•••
••
•
•
•
•
•••
Current Year Activity/Achievements
Prepare various forms, official documents, and reports for local, state, and federal officials.
Plan, organize and direct the operations of the City of St Joseph's Emergency Management Program with localgovernment, civic, business officials, and other interested groups.Coordinate the emergency management program within the City by working with local government, business, andindustry.Recruit and train volunteer personnel to assist at major events and in times of disaster.Meet with local, state, and federal emergency management officials to coordinate the City's emergency program.
Emergency Management main objectives are: Life Safety, Incident Stabilization and Protecting the Environment. This isachieved through Mitigation, Planning, Response and Recovery.
Budget Challenges/Planned Initiatives
Emergency Management
Mission
Core Services
Prepare the budget for the emergency management programs, including applying for local, state, and federal grants.Actively participate in all phases of the major program areas Mitigation, Preparedness, Response, and Recovery.
Renewed EMP grant which reimburses the City for part of Emergency Manager's salary and benefits.Completed Homeland Security grant risk assessment forms.Worked with Blue Valley Siren to update Siren computer program and add additional contacts after the resignation ofthe Emergency Manager in mid-November.Working to improve use and number of users of NIXEL and IPAWS.Identified a site for a siren to take the place of the vacated one at Omnium.Put in for a grant to purchase a new weather alert siren.Participated in Great shake out drill as well as assisting in EOC at Air Show.Signed up and was accepted to Leadership St Joseph.Assisted with Fire Department new hire interviews.
The EM has been moved back under the supervision of the Fire Chief with assistance and guidance from the directors of Public Works, Police, Health, and the City Manager.The City still needs a permanent Emergency Operations Center for major disasters. The current location at Station 12 is too small for a permanent location, but would serve as a good back up location, if needed.EMP funds and grants continue to shrink. A combined City/County EMD may need to be looked at as an option in the future.Continue to work on emergency notifications groups for exercises and actual events.Training sessions for department directors in EOC operations.Provide templates for all city building custodians to provide safe areas, evacuation routes and out of building meeting areas in the event of emergencies.
6 - 30

Fire Department
EMERGENCY MANAGEMENTProgram 2540
Program Description
2017-18 2019-20Staffing Details Adopted Estimated
Actual Budget Actual BudgetEmergency Manager 1 1 1 1
1 1 1 1
Operating Budget Summary
2017-18 2019-20Adopted Estimated
Actual Budget Actual Budget
61,400 62,935 64,141 63,85924,346 26,421 26,703 27,7271,979 5,000 4,330 4,500
18,399 25,402 25,402 25,402920 1,000 772 1,000
0 0 26,087 0
Total 107,044 120,758 147,435 122,488
48,864 48,183 74,270 48,00058,180 72,575 73,165 74,488
Total 107,044 120,758 147,435 122,488
2018-19
2018-19
Expenditures:
Revenue Sources:
Other General FundEmerg Mgt Grant
Salaries & WagesEmployee BenefitsMaterials/SuppliesServices
Capital OutlayUtilities
This division was established to track the revenue and expense relating to the Emergency Management grant the Cityreceives from the State. The rest of the grant covers other E.M. expenses such as emergency communications'services at the Emergency Operations Center. Maintenance costs for the City's warning siren system is also budgetedin this program.
Salaries & Wages
52%
Employee Benefits
18%
Materials/Supplies
4%
Services21% Utilities
1%
Expenditures by Type
Emerg Mgt Grant
39%
Other General
Fund61%
Revenue Sources by Type
6 - 31

•
••••
•
•
••••••
••
•
•
•••••
Fire Equipment Support
MissionTo provide timely maintenance for the vehicles in the Fire Department fleet, including mechanized and auxiliary equipment. Plan and care of all Department facilities and equipment. Staff is also responsible for procuring and distribution of supplies and building maintenance materials for all stations.
Core ServicesReduce downtime for all first-line equipment by: immediate repair of first-line fire apparatus failures, monthly preventive maintenance checks, and Manufacturer's recommended oil changes.Provide a maintenance tracking a prioritization system.Complete building maintenance repairs as needed.Schedule and complete third-party testing of aerial units, ground ladders, and pumps.Assist planning and specifications for new equipment and facilities.
Current Year Activity/AchievementsMaintained a fleet of 11 front line fire trucks, including 2 ladders trucks, 2 Telesqurts, 2 heavy-duty rescue trucks, and 5 pumpers. Reserve fleet consists of 2 reserve pumpers and 1 Telesqurt.Maintained fleet of 14 light-duty trucks and cars including: 4 Prevention, 2 Training, 2 Administration, 4 first responder vehicles, 3 rescue boats and 7 trailers.Maintained 9 fire stations, including outbuildings and all permanent equipment.Maintained, organized, and inventoried maintenance areas at Station 5 and Headquarters.Provided frequent updates on truck repairs to appropriate department personnel.Outfitted and put two new pumpers into service at stations 9 and 11.Implemented a maintenance tracking system to increase productivity and cost tracking capabilities.Made call number changes to trucks and stations to help with new maintenance system and Communications Center system.Removed the plymovent systems at old stations 9 and 11 in anticipation of reinstalling at station 12.Both members attended and received certification for Pierce pump and multiplexing electrical training.
Budget Challenges/Planned InitiativesAge and condition of fleet is still not what it should be, but with the purchase of two new engines and the repair of reserve engines we are heading in the right direction.Continue to find annual courses or training for maintenance personnel to keep up with current apparatus trends and facility maintenance within the fire industry.Since we could not afford to build a new maintenance facility with one of the new stations, we need to continue to Still need to replace Ladder 5 (this is scheduled in the current CIP).New mechanic is hired and we are looking at new ways to track hours of truck operation vs mileage.Need to continue upgrades to fire stations.Recent agreement with Schneider electric will allow for centralized monitoring of HVAC systems in all fire buildings.
6 - 32

Fire Department
FIRE EQUIPMENT SUPPORTProgram 2550
Program Description
2017-18 2019-20Staffing Details Adopted Estimated
Actual Budget Actual BudgetMaster Mechanic 1 1 1 1Maintenance Technician 1 1 1 1
2 2 2 2
Operating Budget Summary
2017-18 2019-20Adopted Estimated
Actual Budget Actual Budget
87,810 92,800 90,133 92,79938,007 39,866 38,566 41,89851,540 98,000 68,758 53,000
360,792 210,250 204,250 198,700Total 538,149 440,916 401,707 386,397
150 0 0 0537,999 440,916 401,707 386,397
Total 538,149 440,916 401,707 386,397
2018-19
2018-19
Expenditures:
Revenue Sources:Other RevenueOther General Fund
Salaries & WagesEmployee BenefitsMaterials/SuppliesServices
Salaries & Wages
24%
Employee Benefits
11%
Materials/Supplies
22%
Services51%
Expenditures by Type
Other General
Fund100%
Revenue Sources by Type
Fire Maintenance provides and/or ensures the proper maintenance of the Department's fire apparatus and staff car fleet.Fire Maintenance also procures and distributes fire station supplies as well as schedules, performs and/or ensures testingof Department ladders, aerial fire apparatus and fire pumps.
6 - 33

•
•••
••
••
•••
•••
•••
•••
Purchased new fit test machine (air pack mask) that greatly reduces testing time.
Improve participation in �Fit as a Rookie� voluntary physical fitness program.Attempt to increase certification of staff officers and Captains for ISO requirements and personal development.Use new software to maintain firefighter licensure and certification, as well as meeting ISO training requirements.
Served on Hillyard EMT/Fire Advisory Committee, and two state-level committees related to state firefighters.
Attempt to increase hands-on training by the use of props and more realistic training evolutions.Make better use of emerging technology.Educate all personnel on current best practices for personal safety on medical calls.
Budget Challenges/Planned Initiatives
Provided cleaning of turnout gear and equipment as necessary, and purchased various supplies and equipment,such as hose, fittings, gloves, helmets, turnout gear, etc.Assisted Fire Chief with new fire stations construction and open houses.
Fire Training
Mission
Conducted monthly meetings with a communications group to address training and issues with alarms and dispatch.
Provided training topics, NIOSH reports, and building preplan for Captains on a monthly basis.Implemented a new web-based training platform for all personnel to stay current with fire and ems topics. Thissystem also helps track licenses and station activities.Implemented and trained on a new nomex hood policy to keep contaminated gear clean and available.Implemented and trained on new evacuation tones to make fire scenes safer for personnel and worked on a newstation alerting system for better notification of personnel.Assisted with new hire processing and training of 9 new firefighters in 2018.
Increase the efficiency and effectiveness of the Fire Department through the integration of new strategies and oldpractices, better equipment, and an increased awareness of new dangers as they evolve.Improve firefighter safety.Provide training and orientation for new firefighters.Maintain current certifications for both fire and EMS.
Core Services
Current Year Activity/Achievements
To preserve and protect life and property of the citizens of St. Joseph and of the firefighting personnel themselves bydeveloping skilled, professional fire personnel through fire protection education and training.
6 - 34

Fire Department
FIRE TRAININGProgram 2570
Program Description
2017-18 2019-20Staffing Details Adopted Estimated
Actual Budget Actual BudgetChief Training Officer 1 1 1 1Fire Training Officer 1 1 1 1
2 2 2 2
Operating Budget Summary
2017-18 2019-20Adopted Estimated
Actual Budget Actual Budget
142,940 135,674 143,306 135,67390,235 91,555 92,893 94,205
2,943 2,700 2,700 2,70010,565 33,955 32,955 31,955
Total 246,682 263,884 271,854 264,534
500 0 0 01,200 0 0 0
244,982 263,884 271,854 264,534Total 246,682 263,884 271,854 264,534
2018-19
2018-19
Expenditures:
Revenue Sources:Other Revenue
Other General Fund
Salaries & WagesEmployee BenefitsMaterials/SuppliesServices
Grants
Salaries & Wages
51%
Employee Benefits…
Materials/Supplies
1% Services12%
Expenditures by Type
Other G Fund100%
Revenue Sources by Type
Training staff preserve and protect life and property of the citizens of St. Joseph and of the firefighting personnelthemselves by developing skilled, professional fire personnel through fire protection, rescue, emergency medical,hazardous materials and terrorism training.
6 - 35

HEALTH DEPARTMENT
DIRECTOR OF HEALTH
EXECUTIVE ADMINISTRATIVE
ASSISTANT
ASSISTANT DIRECTOR OF HEALTH
ENVIRONMENTAL PUBLIC HEALTH SPECIALIST (3)
ADMINISTRATRIVE TECHNICIAN(4)
BUILDING MAINTENANCE
TECHNICIAN
CUSTODIAN
ANIMAL CONTROLMANAGER
OFFRICE SUPPORT
COORDINATOR
HUMANE EDUCATOR(2)
SR ANIMAL CONTROL OFFICER
ANIMAL CONTROL
OPERATIONS OFFICER
ANIMAL CONTROL
OFFICER (5)
SR ANIMAL CARE SPECIALIST
ANIMAL CARE SPECIALIST (3)
CLINIC SERVICES SUPERVISOR
WIC COORDINATOR
WIC CERTIFIER(2)
NUTRITIONIST(4)
BFPC (3)
CLINIC COORDINATOR
COMMUNITY HEALTH NURSE (3)
COMMUNITY HEALTH NURSE
LEAD EDUCATOR
COMMUNITY HEALTH COORDINATOR
COMMUNITY HEALTH NUIRSE
HEALTH EDUCATOR
HIV CARE COORDINATOR
6 - 36

• Provide planning, evaluation, budgeting, coordination and administrative support for all divisions within the healthdepartment.
• Monitor compliance with State grants and contracts to ensure all contract requirements and deliverables are met.• Secure revenue from various resources such as contracts, grants and Medicaid through monthly billing.• Identify gaps in public health services and create needed programs with community partners. Identify existing and
new funding opportunities to implement new programs, and identify opportunities for strengthening existing services.• Continue social media campaigns.• Provide public information to the media regarding public health.• Serve as a referral center for citizens needing to be connected to local resources/agencies for assistance.• Serve as Vital Statistics Registrar for Buchanan County, which entails issuing certified copies of Missouri birth and
death certificates, to the public.• Maintain the structural operations of Patee Market Health Center, a 100+ year old building, which houses two
agencies with ever growing and changing needs.• Provide public health emergency response planning to address all hazards within Buchanan County.
• The health department continues to seek out and be awarded grants that allow for the development of outreach andpreparedness programs to further our available services, and community protection efforts.
• The health department's Facebook page continued to provide currently trending health information and localinformation of importance and interest to our community. New viewers are continuously added and communityresponse and viewing numbers are consistently increasing.
• Seven (7) Mental Health First Aid classes were held, training 168 new first aiders. The courses were offered forMWSU's Public Safety Police Academy, Central High School teachers, Mid-City Excellence and Northwest MissouriArea Health Education Center students.
• Celebrated Public Health Week with several different community involved events and outings.• Hosted the annual all-staff retreat at the Law Enforcement Center with a focus on HIPAA, Mandated Reporting and
what to do if you have a violent intruder.• The Emergency Response Plan was updated for Patee Market Health Center.• Staff serve on various boards such as, but not limited to the United Way, including Success by Six, Unmet Needs,
Allocations, Housing Stability Taskforce and Leadership St. Joseph. Other groups include Buchanan CountyCommunity Organizations Active in Disaster, Crisis Intervention Team Council of Northwest Missouri, Drug FreeCommunity Coalition, Local Emergency Planning Committee, KCMO Branch of International Association ofAdministrative Professionals (IAAP), IAAP Influencer 2018-19, Region H Healthcare Coalition, PEACE,Children/Youth Disaster: Pediatric Behavioral Health Work Group, MO Animal Control Association, Community DrugCouncil, NWMO Coalition for Roadway Safety, Opioid Task Force as well as others.
• HEALTH was transitioned to Community Action Partnership in September 2018 for funding sustainability and growth.
Core Services
Current Year Activities/Achievements
Health Administration
MissionTo provide administrative services and management support to all health programs. To provide program, policy, andlegislative development necessitated by emerging needs in our community. Once needs are identified, to initiate andpromote programs that will have direct, positive local health outcomes. Ensure public health and safety during times oflocal, state or national crisis.
6 - 37

• Contracts and grants, while amounts are consistently reduced, the application process has become more competitive.Also, Public Health funding at the Federal and state level waxes and wanes depending upon the current politicalclimate, or presence of emerging health concerns at any given time.
• Patee Market Health Center continues to need ongoing maintenance and repairs. As several systems begin to reachthe top end of their typical functional life, many maintenance technicians have informed staff of the need to beginplanning for the replacement of some major building systems or their components. Staff worked with Engineering tocomplete an Energy Efficiency Audit which outlined a plan to replace the aging HVAC system through a multi-yearfinancing plan.
• Regular all-staff meetings will continue to be held, including an annual all-staff retreat, complimented by more concisequarterly meetings.
• The health department "Employee Internal Response Team" will continue meeting to identify areas for improvementof internal and external staff, patron and general facility safety, and staff training opportunities pertaining to safetypractices. The team participants will take the lead during a crisis within the building to assist others to safety.
• Maintaining Facebook page with useful, relevant health information.• Will continue to attend HEALTH meeting.• Will continue participant with community boards and committees.
• The number of certified birth certificates issued was 5,198.• The number of certified death certificates issued was 6,760• Funding from grants, contracts and donations provided 24% of the budget revenues. Fees, Fines, Licenses and
Permits accounted for 13% of total revenue.• Successfully updated the health department's Facebook page to share public health information via 219 posts and
66,769 page-follower reaches.• Issued 55 press releases; completed 104 media contacts.
Budget Challenges/Planned Initiatives
Performance Statistics
6 - 38

Health Department
Program Description
2017-18 2018-19 2019-20Adopted Estimated
Staffing Detail Actual Budget Actual Budget
Director of Public Health 1 1 1 1Assistant Director of Public Health 1 1 1 1Administrative Specialist 1 1 1 0Executive Secretary 1 1 1 1Administrative Technician 4 4 4 4Building Maintenance Technician 1 1 1 1Custodian 1 1 1 1
10 10 10 9
Operating Budget Summary
2017-18 2018-19 2019-20Adopted Estimated
Actual Budget Actual Budget
435,200 456,810 406,868 339,316194,557 207,626 214,889 192,02115,888 19,800 102,880 (4,529)
191,379 196,726 278,522 237,08438,979 50,500 37,927 39,930
Total 876,004 931,462 1,041,086 803,821
156,268 130,050 130,050 130,050215,088 209,122 311,163 209,217444,693 485,771 485,771 470,03672,375 72,000 72,000 73,404
140 20 130 1302,458,821 2,441,046 2,498,397 2,498,387
768 0 23,006 0(2,472,149) (2,406,547) (2,479,431) (2,577,403)
Total 876,004 931,462 1,041,086 803,821
HEALTH ADMINISTRATIONProgram 8370
Other
Salaries & WagesEmployee BenefitsMaterials/SuppliesServicesUtilities
Health FeesCharges for ServicesPublic Sfty Sales TxHealth ContractsInterestHlth Prop Tx & GF
General Fund - Other
Provides administrative services and management support to all health programs through planning, evaluation, budgeting, coordination,vital records management, facility maintenance and issue monitoring and response. Ensures enforcement of State and City lawsrelating to public health and sanitation for the welfare of the citizens of the City.
Expenditures:
Revenue Sources:
Salaries & Wages
42%
Employee Benefits
22%
Materials/Supplies
-2%
Services29% Utilities
5%
Expenditures by Type
Health Fees4%
Charges for
Services6%
Public Sfty
Sales Tx14%
Health Contracts
2%
Interest0%
Property Tax74%
Revenue Sources by Type
6 - 39

Health Department
Program Description
2017-18 2019-20Staffing Detail Adopted Estimated
Actual Budget Actual Budget0 0 0 00 0 0 0
Operating Budget Summary
2017-18 2019-20Adopted Estimated
Actual Budget Actual Budget
Transfers 444,693 485,771 485,771 470,036Total 444,693 485,771 485,771 470,036
444,693 485,771 485,771 470,036Total 444,693 485,771 485,771 470,036
Public Safety Tx Fund
Expenditures:
Revenue Sources:
This program is funded totally through the 1/2 cent Public Safety Tax. Expenditures are concentrated in one area - transfer tothe Health Department in the General Fund to cover the wage enhancements implemented as a result of the 2013Compensation Study.
PUBLIC SAFETY - HEALTHProgram 6795
2018-19
2018-19Transfers
100%
Expenditures by Type
Public Safety Tx
Fund100%
Revenue Sources by Type
6 - 40

• Community-wide immunizations for infants, children and adults through clinic services.• Annual public influenza clinics.• Tuberculin skin testing, referral and assessment of LTBI clients, and follow-up monitoring of treatment. Intense
monitoring of clients with tuberculosis disease; providing Directly Observed Therapy for medication with up to dailyvisits either in the Clinic or the community.
• Pregnancy testing for minimal fee. Free prenatal case management offered to qualified females to provide supportiveservices as well as information regarding the pregnancy and post delivery period. Provide resource and referralguidance for benefit of the individual.
• Child Care Health Consultation program provides nursing on-site visits to child care providers to assess health andsafety practices as well as educational programs, per contract guidelines, for the children and care-givers that isinteractive and entertaining.
• Lead screenings are done free by request for children up to 6 years of age as well as clinic based nurse casemanagement assessments. Provide the community education about lead dangers and teach prevention activities toreduce the risk of elevated blood lead levels.
• Communicable disease follow-up on all communicable and contagious diseases that are reportable in the state ofMissouri. Prevention activities promoted through individual and community education programs. Health departmentstaff serve as resource and referral sources for the prevention, containment and control of communicable diseases forhealth care professionals and the community at large. Active and passive surveillance is conducted at designatedsites.
• Blood pressure monitoring is provided on a walk-in basis with results reported to respective physicians as requested orrequired.
• Free head lice checks performed on a walk-in basis for children and adults with education consultation provided.• Participation in health fairs and other outreach activities that are scheduled to provide health and safety promotional
activities throughout the year at various locations by health department staff.
• The health department supplied the Social Welfare Board (SWB) with $489,742.00 along with space, utilities and somesupplies. An additional $51,000.00 was provided to the SWB for mental health referrals and administration of such.
• Staff managed several LTBI and TB clients with Daily Observation Therapy.• American Heart Association CPR/AED and First Aid classes are offered on a regular basis.• Basic Life Saving CPR/AED classes for health care professionals are offered on an as requested basis. 30 classes
were offered in 2018 with 113 participants.• Prenatal Services saw 341 women for pregnancy testing or with proof of pregnancy. Of those, 316 received temporary
pregnancy Medicaid.• Immunizations for Back to School: 1,036 vaccines were administer to 476 children.• Immunization for Flu Vaccine: 950 doses of flu vaccine were administered.
• There continues to be a gap of need in the community to allow for CPR/AED and First Aid classes and training with areasonable cost for the client. There was an increase in the cost for CPR classes by American Heart Association for allproviders.
• The CPR/AED classes continue to be successful. The health department has maintained a reasonable cost option forthe general public.
• Due to the number of elevated lead cases identified within the City of St. Joseph, DHSS continues to work incollaboration with the City of St. Joseph to staff a lead education nurse.
Health Clinics
MissionThe City of St. Joseph Health Department is committed in providing its citizens with health care programs that promotehealthy lifestyles, education, disease prevention and assessment and are committed to the development andmaintenance of a healthy environment.
Budget Challenges/Planned Initiatives
Current Year Activities/Achievements
Core Services
6 - 41

• A part-time, grant funded nurse was added to the City of St. Joseph Clinic staff, solely to focus on lead education forthe City of St. Joseph population. She has collaborated with community partners, physicians, parents and daycares.She will branch out to realtor offices and other non-medical partners.
• The nurse providing lead education will continue to partner with the EPA on education and training outreach.
• Children and adults immunized: 2,121• Immunizations given: 3,749• Tuberculin skin test screenings: 469• LTBI and active TB medications given: 650• Communicable disease investigation and follow-up: 308• Pregnancy tests and proof of pregnancy: 341• Prenatal case management contacts (office/mail/phone calls): 1,003• Temporary Medicaid assistance forms issued: 316• Childhood lead case management (new and discharged): averaged 90 participants per month.
Performance Statistics
6 - 42

Health Department
Program Description
2017-18 2019-20Adopted Estimated
Staffing Detail Actual Budget Actual Budget
Clinic Supervisor 1 1 1 1Clinic Coordinator 0 1 1 1Community Health Nurse 5 3 3 3
6 5 5 5
Operating Budget Summary
2017-18 2019-20Adopted Estimated
Actual Budget Actual Budget
304,005 325,635 324,455 272,972124,473 136,220 135,935 118,150
38,731 39,908 35,521 17,900563,535 590,883 579,691 558,083
Total 1,030,744 1,092,645 1,075,601 967,105
50,855 53,500 53,500 47,400100,780 109,327 148,957 9,758
1,140 190 1,747 1,7557,375 0 0 0
870,594 929,628 871,397 908,192Total 1,030,744 1,092,645 1,075,601 967,105
2018-19
2018-19
General Fund - OtherOther Revenue
CLINIC SERVICESProgram 6710
Expenditures:
Revenue Sources:
Interest
To provide the citizens of the City of St. Joseph and Buchanan County with health care programs promoting prevention activitiessuch as immunizations, health education, maternal and child care, pregnancy testing, etc. Staff work collaboratively with otheragencies to establish a local area health care network.
Salaries & WagesEmployee BenefitsMaterials & SuppliesServices
Health FeesCharges for Services
Salaries & Wages
28%Employee Benefits
9%
Materials &
Supplies2%
Services58%
Expenditures by Type
Health Fees80%
Charges for Services
17%
Interest3%
Revenue Sources by Type
6 - 43
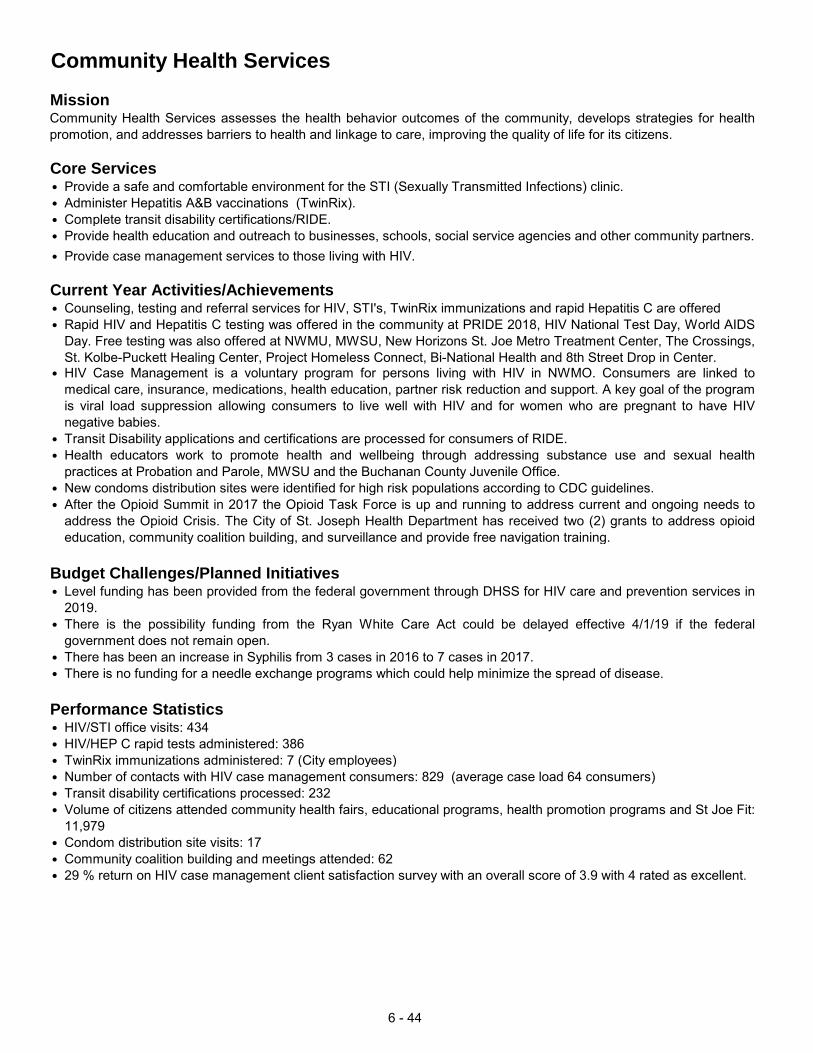
• Provide a safe and comfortable environment for the STI (Sexually Transmitted Infections) clinic.• Administer Hepatitis A&B vaccinations (TwinRix).• Complete transit disability certifications/RIDE.• Provide health education and outreach to businesses, schools, social service agencies and other community partners.• Provide case management services to those living with HIV.
• Counseling, testing and referral services for HIV, STI's, TwinRix immunizations and rapid Hepatitis C are offered• Rapid HIV and Hepatitis C testing was offered in the community at PRIDE 2018, HIV National Test Day, World AIDS
Day. Free testing was also offered at NWMU, MWSU, New Horizons St. Joe Metro Treatment Center, The Crossings,St. Kolbe-Puckett Healing Center, Project Homeless Connect, Bi-National Health and 8th Street Drop in Center.
• HIV Case Management is a voluntary program for persons living with HIV in NWMO. Consumers are linked tomedical care, insurance, medications, health education, partner risk reduction and support. A key goal of the programis viral load suppression allowing consumers to live well with HIV and for women who are pregnant to have HIVnegative babies.
• Transit Disability applications and certifications are processed for consumers of RIDE.• Health educators work to promote health and wellbeing through addressing substance use and sexual health
practices at Probation and Parole, MWSU and the Buchanan County Juvenile Office.• New condoms distribution sites were identified for high risk populations according to CDC guidelines.• After the Opioid Summit in 2017 the Opioid Task Force is up and running to address current and ongoing needs to
address the Opioid Crisis. The City of St. Joseph Health Department has received two (2) grants to address opioideducation, community coalition building, and surveillance and provide free navigation training.
• Level funding has been provided from the federal government through DHSS for HIV care and prevention services in2019.
• There is the possibility funding from the Ryan White Care Act could be delayed effective 4/1/19 if the federalgovernment does not remain open.
• There has been an increase in Syphilis from 3 cases in 2016 to 7 cases in 2017.• There is no funding for a needle exchange programs which could help minimize the spread of disease.
• HIV/STI office visits: 434• HIV/HEP C rapid tests administered: 386• TwinRix immunizations administered: 7 (City employees)• Number of contacts with HIV case management consumers: 829 (average case load 64 consumers)• Transit disability certifications processed: 232• Volume of citizens attended community health fairs, educational programs, health promotion programs and St Joe Fit:
11,979• Condom distribution site visits: 17• Community coalition building and meetings attended: 62• 29 % return on HIV case management client satisfaction survey with an overall score of 3.9 with 4 rated as excellent.
Core Services
Community Health Services
MissionCommunity Health Services assesses the health behavior outcomes of the community, develops strategies for healthpromotion, and addresses barriers to health and linkage to care, improving the quality of life for its citizens.
Current Year Activities/Achievements
Budget Challenges/Planned Initiatives
Performance Statistics
6 - 44

Health Department
Program Description
2017-18 2019-20Adopted Estimated
Staffing Detail Actual Budget Actual Budget
HIV Care Coordinator 1 1 1 1Health Educator 1 1 1 2Community Health Nurse 1 1 1 1Community Hlth Srvcs Supervisor 2 1 1 1
5 4 4 5
Operating Budget Summary
2017-18 2019-20Adopted Estimated
Actual Budget Actual Budget
215,671 203,991 206,858 254,92990,216 91,814 101,826 118,89726,185 6,900 9,994 26,9902,883 0 38,489 37,940
Total 334,954 302,705 357,167 438,757
2,894 2,800 2,800 2,650195,728 149,482 149,482 195,707
176 3,000 3,100 0136,156 147,423 201,785 240,400
Total 334,954 302,705 357,167 438,757
Materials & Supplies
COMMUNITY HEALTH SERVICESProgram 6720
Expenditures:Salaries & WagesEmployee Benefits
Staff works to prevent and control the spread of HIV/STD infections and to provide services and outreach to support those infectedwithin northwest Missouri. They work with the network of community groups, agencies and providers to coordinate services forclients infected with HIV as well as to educate the general public. They also provide discharge planning and case managementservices for HIV incarcerated persons.
2018-19
2018-19
General Fund - Other
Services
Revenue Sources:Health Fees GrantsOther Revenue
Salaries & Wages
58%
Employee Benefits
27%
Materials & Supplies
6%
Services9%
Expenditures by Type
Health Fees1%
Grants99%
Revenue Sources by Type
6 - 45

• WIC conducts nutrition assessment to help provide targeted nutrition education via one on one counseling. WIC nutritioneducation emphasizes the relationship between proper nutrition and good health. WIC assists participants in establishinghealthy eating behaviors and achieving positive lifestyle changes by setting nutrition and health goals. Nutrition educationis also available on line at https://www.wichealth.org/
• WIC promotes breastfeeding as the optimal infant feeding choice. Participants receive breastfeeding education andsupport prenatal group classes, one on one counseling, and follow up. For those participants in need, manual and electricbreast pumps are available.
• WIC refers participants for substance abuse counseling and treatment, immunizations, lead screening, and MissouriHealth Net. WIC also maintains an up to date list of community resources including health services and public assistance.This list is provided to participants for additional resources that may be available to them.
• WIC foods are intended as a supplement to help participants meet the special nutritional needs of their specific population.The nutrients critical to growth and development found in WIC foods are typically lacking in the diet of the WIC eligiblepopulation. Participants who have specific dietary needs may receive special food packages, including special formulas, ifordered by a physician and approved by appropriate staff. A nutritionist also determines the quantities of the supplementalfoods appropriate for participants and may authorize a tailored food package. In Missouri, WIC foods are issued toparticipants using a paper check system. Missouri WIC checks may be redeemed at over 650 participating retailersacross the State.
• The City of St. Joseph continues to operate a satellite clinic in the obstetrics unit at MOSAIC Life Care Hospital onMonday, Wednesday, and Friday from 8 am � noon. This site provides bedside promotion, certification, and breastfeedingsupport services for mothers who have recently delivered and their newborn infants.
• Breastfeeding support line available for assistance 7 days per week,7am � 9 pm.• Collaborate with MOSAIC Life Care Hospital for breastfeeding support group twice weekly.• Breast pump loan program for WIC and non-WIC participants.• The breastfeeding peer counselors and peer counselor coordinator are active members of the Missouri Breastfeeding
Coalition and local Breastfeeding Task Force.• Assist businesses in the obtaining Breastfeeding Friendly Worksite and Breastfeeding Friendly Child Care Facility
recognition.• Maintain designation as a Breastfeeding Friendly WIC Clinic.• Maintain designation as a Gold Level for the Loving Support Award of Excellence.• Celebrate World Breastfeeding Week and Black Breastfeeding Week in collaboration with many other agencies, providing• Participate in the local perinatal and postpartum depression task force and support group to help raise awareness and
provide support for mothers and their families.
• As caseload continues to decline across the State, City of St. Joseph WIC will strive to meet contracted average monthlycaseload of 1,859 participants.
• The Healthy, Hunger-Free Kids Act of 2010 mandates the implementation of an electronic benefits issuance (EBT) forWIC benefits by October 1, 2020. In 2019, the City of St. Joseph WIC will begin preparation to convert from the papercheck system of benefit issuance to EBT. https://health.mo.gov/living/families/wic/ewic/index.php
• Increase the rate of women on WIC with the City St. Joseph who have ever breastfed their infant(s) from 63.7% to 65%.
• Maintain �Breastfeeding Friendly WIC Clinic� status and �Loving Support Award of Excellence� gold award.https://www.fns.usda.gov/wic/loving-support-award-excellence-program
• In conjunction with the Missouri Department of Health and Senior Services and the Missouri Breastfeeding Coalition, Cityof St. Joseph WIC will assist at least three additional business in achieving �Breastfeeding Friendly Worksite�designation. https://health.mo.gov/living/families/wic/breastfeeding/support.php
• Average participant count was 1,766 per month; 21,187 for the year. 5,803 women, 6,600 infants and 8,784 children• 90,271 WIC checks were printed for $2,225,344 in WIC supplemental foods.• Percentage of women on WIC with the City of St. Joseph who ever breastfed their infant was 63.7%.
WICMissionThe City of St. Joseph Health Department provides a link to the Missouri WIC program. WIC serves women who arepregnant, breastfeeding and non-breastfeeding, infants and children up to the month of their 5th birthday. WIC is an adjunctto good health care during critical times of growth and development, in order to prevent the occurrence of health problemsand to improve the health status. �
Core Services
Current Year Activities/Achievements
Budget Challenges/Planned Initiatives
Performance Statistics
6 - 46

Health Department
Program Description
2017-18 2018-19 2019-20Adopted Estimated
Staffing Detail Actual Budget Actual Budget
Senior Nutritionist 1 0 0 0WIC Coordinator 0 1 1 1Nutritionist 3 3 3 4WIC Clerk 3 3 3 2BFPC Funded (Part Time) 1.5 1.5 1.5 1.5
8.5 8.5 8.5 8.5
2017-18 2018-19 2019-20Adopted Estimated
Actual Budget Actual Budget
292,079 314,153 309,378 326,464113,780 137,244 136,111 146,166
5,952 7,230 9,180 7,13726,282 36,353 35,766 36,503
Total 438,093 494,980 490,435 516,270
88,830 80,000 80,000 80,000386,236 359,592 359,592 353,079
0 0 1,950 100(36,973) 55,388 48,893 83,091
Total 438,093 494,980 490,435 516,270
Materials & Supplies
WICProgram 6780
Salaries & WagesExpenditures:
Employee Benefits
The program promotes the health of low-income women, infants and children (WIC) through a federally funded nutrition educationand food provision program with integration and coordination from other programs. All clients must meet income guidelines andhave a qualifying medical condition for program admittance.
Operating Budget Summary
General Fund - Other
Services
Revenue Sources:Health FeesCharges for ServicesOther Revenue
Salaries & Wages
63%
Employee Benefits
20%
Materials &
Supplies2% Services
7%
Expenditures by Type
Health Fees18%
Charges for
Services82%
Revenue Sources by Type
6 - 47

• Provide routine, follow-up, complaint, pre-opening walk-thru, seasonal, temporary event, and/or final inspections of allfood, lodging, childcare and tattooing establishments, and swimming pools and spas, to ensure environmental codestandards are met.
• Provide public education on many topics such as, but not limited to food safety, mold control, precautions againstvector-borne diseases, bedbug and other pest control, and more.
• Collect and verify documentation necessary to obtain a tattooing artist card.• Coordinate and investigate environmental health issues such as, but not limited to, suspected food contamination,
surfacing sewage, air quality concerns, odor complaints and the Smoke free Air Workplaces and Public Placesordinance.
• Review applications submitted, permit new system construction and existing system repairs or replacements, evaluatelocations for the availability of sanitary sewers, conduct site, construction, and final inspections for Onsite WastewaterTreatment System (OWTS).
• Provide Environmental contract services for the Holt County Health Department, including food, lodging and childcareestablishment inspections, as well as onsite wastewater treatment system permitting and approval.
• Offer and conduct food safety education courses in basic and advanced food handling.• 24/7 response to truck wrecks, fires, floods and other catastrophic events affecting environmental health and/or food
safety.
• Food establishment inspections are made on the basis of risk to the consumer. The greater the risk the morefrequently inspections are performed to safeguard the general public to maintain minimum sanitation standards andproper enforcement of all applicable rules, regulations and standards.
• Environmental Services staff continue to enforce the Smoke-Free Indoor Air ordinance during food safety inspectionsand during investigations of complaints received.
• The public, and specifically food establishment owners, managers and general staff, continue to express interest inthe food handlers� trainings available each month in a basic and advanced course version.
• EPHS staff have successfully integrated childcare sanitation inspection into their task load (beginning in October2016), without increasing staffing levels.
• Environmental Health & Food Safety staff have developed a food handler's training for the food establishmentworkforce. A basic food handler and managerial course is offered to the public for a fee.
• Staff have become certified to proctor exams for a nationally accredited food safety program (ServSafe), enablingparticipants enrolled in the online course to be able to take the final certification exam locally.
• Total number of inspections for food/drink establishments (routine, follow-up, complaint, temporary event units, truckwrecks and fires): 1,683 (21 temporary events resulted in 534 temporary event unit inspections)
• Total number of other inspections & contacts (pre-opening walk-thru, plan review final inspections, educational visits,etc.): 361
• Total number of lodging inspections (routine, follow-up and complaint): 41 (18 of these were responses to complaints.• Total number of public & semi-private pools & spas inspected (routine, follow-up and complaint): 42. There were no
fatal accident investigations completed.• Total number of OWTS (septic system) permitted: 7. Total number of site visits completed during
construction/installations: 30• Total number of complaint investigations (surfacing sewage/illegal installation): 2• Total number of tattoo artists licensed: 16. Total number of tattoo establishments inspected and licensed: 7. St.• Total number of investigations for air quality complaints: 5• Total number of food handler courses taught: 8 (7 basic courses; 1 advanced). Total number of food handler
participants educated: 88 (86 basic level; 2 advanced level)• Total number of childcare sanitation inspections completed (routine, follow-up): 46
Performance Statistics
To safeguard the public's health and safety by ensuring that the appropriate services and establishments meetenvironmental and food safety standards, codes, laws and regulations, and to educate the public on these criteria at anygiven opportunity.
Environmental Health & Food SafetyMission
Core Services
Budget Challenges/Planned Initiatives
Current Year Activities/Achievements
6 - 48

Health Department
Program Description
2017-18 2019-20Adopted Estimated
Staffing Detail Actual Budget Actual Budget
Environmental Public Hlth Specialist 3 3 3 33 3 3 3
2017-18 2019-20Adopted Estimated
Actual Budget Actual Budget
144,683 148,364 149,032 148,35659,784 63,753 63,912 66,3334,049 5,100 7,496 6,370
10,781 12,310 12,960 14,46017,353 53,500 35,000 0
Total 236,650 283,027 268,399 235,519
92,061 95,060 95,060 94,34921,424 4,800 4,800 4,8004,505 1,300 8,395 8,395
993 0 0 0117,667 181,867 160,144 127,975
Total 236,650 283,027 268,399 235,519
Capital Outlay
Revenue Sources:
General Fund - Other
PermitsOther RevenueGrantsCharges for Services
Salaries & WagesEmployee BenefitsMaterials/SuppliesServices
ENVIRONMENTAL HEALTH & FOOD SAFETYProgram 6920
2018-19
2018-19
Expenditures:
Environmental specialists ensure that all food, drink,lodging and childcare establishments and swimming pools meetenvironmental and safety codes through aggressive inspection programs, in order to safeguard public health and safety.Environmental health issues such as noxious odor complaints, Missouri Clean Indoor Air, water quality, and septic tank systempermitting are also investigated and coordinated.
Operating Budget Summary
Salaries & Wages
63%
Employee Benefits
23%Materials/Supplies
3%Services
6%
Expenditures by Type
Permits88%
Other Revenue
4%
Grants8%
Revenue Sources by Type
6 - 49

• Animal Control Officers area available 24-hours a day, 7-days a week in order to ensure public safety and a quick response todire situations.
• Operate the City's Animal Control Shelter pursuant to the Missouri Department of Agriculture standards.• Offer public education programs on animal husbandry and safety issues.• Promote animals for adoption through local media outlets and the shelter's webpage.• Investigate all complaints regarding animal abuse and neglect. Protect the public from feral animals by investigating
complaints of vicious or dangerous animals.• Protect the public from zoonotic diseases through surveillance and impoundment of diseased wildlife and suspected rabid
animals.• Conduct annual city-wide rabies vaccination and pet registration clinics in partnership with local veterinarians.• Offer pet micro-chipping, low-cost spay/neuter financial assistance program to pet owners, and cremation services for pets.• Work in partnership with the Missouri Department of Corrections on the Puppies for Parole program which utilizes offenders
to train shelter dogs and improve their adoption outcome.• Collaborate with PetSmart and Petco to maintain a satellite adoption program for cats.
• The shelter is open various hours throughout the week including one late evening and on Saturday to accommodate thepublic and to increase adoptions.
• Held five (5) city-wide rabies vaccination and pet registration clinics.• Continue the canine enrichment program for shelter dogs to reduce stress and behavioral issues. Continue planning a feline
enrichment program for the shelter cats.• Hosted Howlapalooza event at the Corby Dog Park, offering onsite adoptions and costume contests.• Continued the partnership with the Missouri Department of Corrections for the Puppies for Parolees program.• Continue current programs such as IMPACT, Girl Scouts educational outreach, and more. Also continue to teach the No More
Bullying curriculum from Wayside Waifs at the St. Joseph public and private schools to present to 3rd, 4th, and 5th graders.• Added a new position of Senior Animal Care Specialist (SACS) who will oversee shelter operations. The SACS will also
oversee the $63,500 grant from PetSmart to fund spay and neuters of shelter animals.• Implemented puppy and dog obedience courses offered at a discount for dogs adopted from the shelter.• Support the Friends of the Animal Shelter with their capital campaign for a new shelter.• Implemented the Digs for Dogs program through an ASPCA Anti Cruelty grant provided new and used doghouses and other
supplies to dog owners in need.
• To maintain existing services with shrinking revenues.• To implement additional youth activities to engage the youth in shelter operations.• To continue decreasing the number of healthy adoptable animals euthanized by developing stronger relationships with
rescues and challenging staff to think "outside the box".• To find creative ways to minimize vehicle repair and upkeep costs, in a safe and reasonable manner.• To initiate implementation of online licensing to increase staff efficiency and accessibility.• To meet staff training needs with minimal effect on the budget.• To launch a new and improved volunteer program to engage an utilize volunteers to their potential.• To offer dog sheltering education and resources to the public.• To launch a new and improved animal foster program to increase live outcomes.
• Total number of dogs received: 1,374; 858 of which were strays. 1,254 impounded dogs were adopted, redeemed or placedat a rescue.
• Total number of cats received: 1,400; 1,192 of which were strays. 799 impounded cats were adopted, redeemed or placed ata rescue.
• Total number of complaints investigated: 7,438 Total number of citations issued: 1,077 or 14%• Total number of public education programs: 145• Total number participants at the annual rabies clinics: 833• Total number of rabies specimens submitted to the lab:. 83; 0 confirmed positive for rabies virus• Total number of animal licenses sold: 5,135• Total number of dog park memberships sold: 722• Total microchips sold: 1,674
Budget Challenges/Planned Initiatives
Performance Statistics
Current Year Activities/Achievements
Animal Control and Rescue
Mission
Core Services
The mission of the Animal Control and Rescue program is to ensure the humane treatment of all animals and to protect thepublic from diseased and vicious animals through education, surveillance and enforcement of City codes.
6 - 50

Health Department
Program Description
2017-18 2019-20Adopted Estimated
Staffing Detail Actual Budget Actual BudgetAnimal Control Manager 1 1 1 1Senior Animal Control Officer 1 1 1 1Senior Animal Care Specialist 0 0 0 1Humane Educator 1 1 1 1Office Support Coordinator 1 1 1 1Animal Control Operations Officer 1 1 1 1Animal Control Officer 5 4 4 5Animal Care Specialist 3 3 3 3
13 12 12 14
Operating Budget Summary
2017-18 2019-20Adopted Estimated
Actual Budget Actual Budget
476,124 535,044 530,167 541,675214,564 257,268 255,762 273,73041,403 45,950 121,139 49,45073,284 74,906 73,981 113,70628,542 32,850 30,035 30,02025,774 0 0 0
Total 859,690 946,018 1,011,084 1,008,581
54,748 50,600 50,600 50,50030,473 32,000 32,000 32,00071,117 68,240 68,240 111,040
0 0 628 6300 0 3,955 0
23,459 13,900 88,600 14,400679,892 781,278 763,106 800,011
Total 859,690 946,018 1,011,084 1,008,581
2018-19
2018-19
Expenditures:
ANIMAL CONTROL & RESCUEProgram 6930
Animal Control officers provide protection for all animals against inhumane treatment and protect the public from diseased andvicious animals through education and complaint investigation. Staff operate the City's animal shelter
General Fund - Other
Salary & WagesEmployee BenefitsMaterials/SuppliesServicesInsurance & OtherCapital Outlay
Licenses/PermitsFinesFees
Other Revenue
Revenue Sources:
InterestGrants
Salary & Wages54%
Employee Benefits
25%
Materials/Supplies
5%Services11%
Insurance & Other
4%
Expenditures by Type
Licenses/Permits
5%
Fines3%
Fees11%
General Fund -Other81%
Revenue Sources by Type
6 - 1

PARKS, RECREATION & CIVIC FACILITIES DEPARTMENT
TOTAL BUDGETED RESOURCES: 7,738,728$
PLANNED USE BY PROGRAM:
Parks & Rec Admin
Civic Arena Recreation
Remington Nature Center
Parks & Rec
Designated
Civic Arena
Conces-sions
Missouri Theater
Softball Baseball
Parks ImprovemntP
rojects
Fairview Golf
Course
Senior Center
REC Center
Bode Sports
Complex
Parks Conces-
sions
Parks Mntce
Swimming
The Parks, Recreation & Civic Facilities Department accounts for most parks and recreation activities includingswimming, softball, baseball, recreation, REC Center, Senior Center, Bode Sports Complex, the Remington NatureCenter and the municipal golf course. The department maintains the city's parks, grounds, facilities and equipment.
Besides general fund revenues, the department is supported by revenues derived from a twenty cent ($.20)property tax levy, a special parks maintenance property tax levy of fifty cents ($.50) per $100 assessed valuation onland only, donations, user fees, concession sales, grants and a 3% hotel/motel tax. One-half of the City Sticker &Penalty revenue was routed from the General Fund to Parks Maintenance in FY2004 to assist that function.
7 - 1

PARKS & RECREATION DEPARTMENTSOURCES & USES
Missouri T
General Fund54%
Parks Maintenance Fund35%
Museum Tax1%
FUNDING SOURCES
Parks & Rec Admin, & Designated
5%
Softball Swimming9%
Remington Nature Center
4%
Fairview Golf Course11%
Bode Sports Complex6%
Parks Concessions3%
Missouri Theater, Civic Arena & Concessions
10%Senior Citizen Center5%
REC Center10%
Parks Maintenance37%
PROGRAM USES
7-2

PARKS, RECREATION & CIVIC FACILITIES DEPARTMENTSUMMARY
2017-18 2018-19 2019-20Adopted Estimated
Actual Budget Actual BudgetACCOUNT TYPE
Salaries & Wages 3,310,740 3,532,749 3,286,966 3,172,589Payroll Expenses & Benefits 1,118,791 1,232,787 1,242,236 1,236,542Materials & Supplies 846,810 868,595 806,377 717,356Utilities & Other Contracted Services 2,022,713 1,954,329 1,929,451 1,961,022Insurance/Claims/Other/Transfers 750,612 471,710 538,316 531,719Capital Outlay/Lease Payment Debt 711,346 231,000 159,385 119,500
8,761,013 8,291,170 7,962,731 7,738,728USES BY PROGRAM
Parks, Recreation & Civic Facilities Admin 1,163,514 826,887 777,110 682,932Softball/Baseball 236,017 232,244 217,162 231,870Swimming 477,784 471,487 487,918 468,733Remington Nature Center 365,284 308,749 316,011 304,577Senior Citizen Center 292,390 339,521 338,715 339,899REC Center 760,650 875,438 744,112 752,844Fairview Golf Course 870,761 764,221 810,300 772,220Golf Course CIP 0 9,052 9,052 15,552Bode Sports Complex 498,199 436,529 448,077 454,730Parks Concessions 308,273 340,858 271,266 224,606Parks Designated Expenses 70,538 10,360 128,595 9,324Parks Maintenance 2,879,654 2,875,248 2,650,202 2,732,390Civic Arena & Civic Concessions 682,261 637,072 607,620 628,869Missouri Theater 155,688 163,503 156,591 120,183
8,761,013 8,291,170 7,962,731 7,738,728FUNDING SOURCES
General Fund 6,957,405 6,640,154 6,126,840 4,158,866Parks Maintenance Fund 924,758 808,782 919,752 2,732,390Gaming Fund 14,600 9,700 9,700 9,700Museum Fund 50,000 50,000 50,000 50,000Golf Fund 814,250 782,534 856,439 787,772
8,761,013 8,291,170 7,962,731 7,738,728STAFFING SUMMARY (Full & PT Regular)
Parks, Recreation & Civic Facilities Admin 4 5 5 5Softball/Baseball 1 1 1 1Swimming 1 1 1 1Remington Nature Center 4.0 4.5 4.5 4.5Senior Citizen Center 4 4 4 4REC Center (4 FT, remainder are PT positions) 11.5 11.5 11.5 11.5Fairview Golf Course 7.5 7.5 7.5 7.5Bode Sports Complex 4.0 4.0 4.0 4.0Parks Maintenance 25 25 25 23Civic Arena & Civic Concessions 4 4 4 4Missouri Theater 1 1 1 1
67.0 68.5 68.5 66.5
*Excluding Transfers to Prks Mnt Fund
7-4

PARKS, RECREATION & CIVIC FACILITIES ADMINISTRATION
Director, Parks Recreation & Civic Facilities
Assistant Director of PR&CF
Administrative Specialist
Senior Account Clerk
Special Events Coordinator
7-4

•••••••
••••••
••••
•••
•
•
•
•
•••
• 522 Shelter reservations, with approximately 14,000 people utilizing in 2018
Evaluation of department wide facility-use agreements and re-evaluating processes and programs to increaseefficiency and provide better customer serviceVandalism and other incidents in parks, parkway, and facilities increases the need for security cameras at allfacilities and parks
Improvements and completion of work: Hyde Park Baseball Complex project, LED lighting upgrades at Holiday Park Raised fees at Remington Nature Center for the first time in ten yearsIncreased interest in Adopt-a-Park program memorials/donations. Resulting in placement of 5 benches, pads, andbrick throughout parks, parkway, and trails
Aging infrastructure, equipment, and the ability to obtain parts for obsolete equipment has caused an increase of Implemented new payroll software, which adds additional staff time to record employee payroll informationNew Missouri minimum wage requirements impacting Parks budget, which could significantly increase part timetemporary wages in all programs over the next five years
Performance Statistics
Implementation of asset management software to track assets and project work flowNearly annual flooding along the riverfront resulting in negative impacts on parks budget for clean-up and repairIncreasing costs for security during public swimming hours, during youth & adult recreation leagues, and specialevents. The added security negatively impacts program budgets. Example Aquatic Park spent over $12,000 forsecurity during the 2018 summer session.
Continued relationships with community partnerships with community organizations, companies, and groups. These Successful Community Assistance Program agreement with Missouri Department of Conservation, stocking of fish in Increased communication to the public by utilizing social media sites: Facebook, Twitter, Instagram, Pinterest, andTumblr
Continued evaluation of fee structure throughout the department and evaluation for lower users toprograms/activities/events, and evaluating funding for special programming that relies on donations andsponsorshipsPassage of CIP provides for needed funding for playground and infrastructure improvement projects. Assistancefrom CDBG funding to replace playground equipment at one park
Parks & Recreation Administration
Mission
Work to augment revenue and reduce expenditures
Administer the financial, operational, and capital budgets of the departmentProvide professional leadership and guidance to all divisions of the departmentEncourage professional growth of staffExplore alternative funding opportunities through grants
To provide quality of life experiences for the residents of St. Joseph and to add to the aesthetic appeal of the city. Toprovide for the recreational and special needs of all ages and abilities of the citizenry by administering a well-rounded,interesting and complete experience. To enhance our City's attractions and assets for enjoyment by all citizens and forthe encouragement of tourism.
Core Services
Current Year Activity/Achievements
Budget Challenges/Planned Initiatives
Second year of high participation in the St. Joe Fit Program
Collaborate with other city departments and outside agencies to provide quality programs and experiencesEnhance options for recreation, health and wellness, and tourism
Constructed the city's first all inclusive playground at Bartlett Park with funding from the Land & Water Conservation Continue to apply for grants for various park improvement projectsApplied for and received $1,700 Tree Resource Improvement and Park Maintenance (TRIM) grant from the Missouri
7-5

Parks Recreation Department
PARKS & RECREATION ADMINISTRATIONProgram 8330
Program Description
2017-18 2018-19 2019-20Adopted Estimated
Staffing Detail Actual Budget Actual Budget
Director, Parks, Rec & Civic Facilities 1 1 1 1Ast Director Parks, Rec & Civic Facilites 0 1 1 1Special Events Coordinator 1 1 1 1Administrative Specialist 1 1 1 1Senior Account Clerk 1 1 1 1
4 5 5 5
Operating Budget Summary
2017-18 2018-19 2019-20Adopted Estimated
Actual Budget Actual BudgetExpenditures:Salaries & Wages 297,428 298,900 225,243 190,062Employee Benefits 124,886 136,427 128,662 128,487Materials & Supplies 5,502 10,300 9,300 (25,450)Capitla Outlay 116,772 0 0 0Services 91,375 98,060 95,785 93,660Transfers 527,551 283,200 318,120 296,172
Total 1,163,514 826,887 777,110 682,932
Revenue Sources:Real/ Pers Prop Tax 2,237,370 2,237,003 2,281,382 2,274,431Rec Fees 0 8,500 245 8,500Interest 39 100 61 60Other Revenue 62 115 23,121 23,121Interfund Transfer 0 0 0 0General Fund-Other (1,073,957) (1,418,831) (1,527,699) (1,623,180)
Total 1,163,514 826,887 777,110 682,932
Salaries & Wages
26%
Employee Benefits
18%Materials &
Supplies-3%
Transfers40%
Expenditures by Type
Real/ Pers Prop
Tax58%
Rec Fees0%
Interest0%
Other Revenue
1%
Revenue Sources by Type
Administrative services and management support for Parks & Recreation programs are provided with the aim of offering a variety of quality of life experiences for the residents of St. Joseph and adding to the aesthetic appeal of the City. Staff also provide information to the public regarding department services and coordinate activities and events using parks and park facilities.
7-6

Parks Recreation Department
PARKS DESIGNATED FUNDSProgram 3180
Program Description
2017-18 2018-19 2019-20Adopted Estimated
Staffing Detail Actual Budget Actual Budget
N/A
Operating Budget Summary
2017-18 2018-19 2019-20Adopted Estimated
Actual Budget Actual BudgetExpenditures:Materials & Supplies 3,994 5,760 11,610 4,724Capital Improvement 59,575 0 112,385 0Services 6,969 4,600 4,600 4,600
Total 70,538 10,360 128,595 9,324
Revenue Sources:Other Revenue 20,285 8,600 120,985 7,600Interest 125 10 250 250Transfer Fund bal 50,128 1,750 7,360 1,474
Total 70,538 10,360 128,595 9,324
Services100%
Expenditures by Type
Other Revenue
81%
Transfer Fund bal
16%
Revenue Sources by Type
This program was established to help track expenditures and revenues related to grants and donations
7-7

PARKS, RECREATION & CIVIC FACILITIES - PARKS
Director of Parks, Recreation & Civic Facilities
Assistant Director of PR&CF
Superintendant of Parks
Senior Account Clerk
Field Supervisor
Work Crew Supervisor Senior Auto Mechanic
Auto Service TechnicianSenior Work Leader (3)
Equipment Operator 3 (2)
Equipment Operator 2 (3)
Equipment Operator 1 (3)
Maintenance Technician (7)
7-8

•••
•
•••••
•
•••
•
•
•
•
•
••
••••••••••
Budget Challenges/Planned Initiatives
Increase staff to accommodate increased work load
Maintain a 9 day mowing cycle of the parkway and park systemContinue upgrades to department vehicles and equipment used in the care and upkeep of the boulevard and parksInstall new foul poles at Heritage Park Softball ComplexRepair of aging pools and operating systemRepair or replace aging roofs on park facilitiesContinue to maintain many trees under our care
Construction of water feature and other areas at Hyde ParkMaintenance and upkeep of aging rolling stock
Parks Maintenance
Mission
Maintained a nine day mowing cycle of the parkways, trails and parks.
Work to improve the overall experience, accessibility and enjoyment of our parks, facilities and boulevard system.Maintain the scheduled maintenance program including mowing the 1500 acre, 26 mile parkway and parks system.Work with garden clubs and volunteers to adopt certain landscape areas and organizations to sponsor communityimprovement projects.Daily cleaning and maintenance of 23 park system restrooms, Provide trash pickup including emptying 320 barrels dailyduring the summer months. Weekly inspection of 16 playgrounds.Raise tree limbs and eliminate hazardous limbs and trees along well traveled areas of the parkway, trails and parks.Pre-emerge, seed, aerate and fertilize high use areas of parks.Enhance floral plantings throughout the parkway and parks system.Work to increase security and reduce vandalism in our parks and facilities.Continue Capital Improvements such as playground improvements, pool renovations, Krug Park Restoration, Hyde ParkRenovation, etc.Partner with the Downtown Partnership in the Downtown Cleanup Program.
Enhance both the beauty of the park system and user enjoyment of the City's park facilities by maintaining City parks, park buildings and equipment.
Implementation of new asset management software
Current Year Activity/Achievements
Replacement of Bartlett Park playground with an inclusive playground, new restrooms, and walkways.Laser graded Eagles baseball fields, replaced dugouts and batting cages and installed new walkways and handicapparking area - funds provided by donation from Buller TrustReplaced aging roof on carpenter shop and added parking area and walkway
Collaborated with various community groups on a variety of community projects including a community garden
Seasonal placement and removal of French Bottoms river dockPurchased and implemented a new radio communication systemCurrently constructing an 18 hold disc golf course from Bartlett Park to Walnut Street and backAdded several memorial benches throughout the park systemPrepared and maintained 21 ball fields from March to October
Core Services
7-9

Parks Recreation Department
PARKS MAINTENANCEProgram 3090
Program Description
2017-18 2018-19 2019-20Adopted Estimated
Staffing Detail Actual Budget Actual Budget
Superintendent of Parks 1 1 1 1Senior Work Leader 3 3 3 3Work Crew Supervisor 1 1 1 1Senior Auto Mechanic 1 1 1 1Maintenance Technician 7 7 7 7Equipment Operator III 2 2 2 2Equipment Operator II 3 3 3 3Senior Account Clerk 1 1 1 1Equipment Operator I 4 4 4 3Auto Service Technician 1 1 1 1Horticulturist 1 1 1 0
25 25 25 23
2017-18 2018-19 2019-20Operating Budget Summary Adopted Estimated
Actual Budget Actual BudgetExpenditures:Salaries & Wages 1,004,959 1,034,485 1,045,624 984,162Employee Benefits 443,165 455,433 466,139 469,129Outside Services 670,874 681,620 681,620 695,652Utilities 195,175 220,000 177,205 220,000Capital Outlay 87,462 192,500 35,000 113,000Capital Improve 307,616 38,500 12,000 0Materials & Supplies 170,403 211,150 191,055 194,850Transfers 0 39,560 39,560 54,597Transfer Network 0 2,000 2,000 1,000
Total 2,879,654 2,875,248 2,650,202 2,732,390Revenue Sources:Parks Mnt Spcl Tax 730,643 717,040 728,501 728,501City Sticker Tax 96,988 95,000 95,000 95,000Misc Rev 0 0 0 0Rents & Other 34,443 34,450 34,450 34,450Grants Donations 76,710 70,000 70,000 70,000Interest 7,750 0 2,377 2,400Other Revenue 5,347 2,000 2,000 2,000Interfund Transfers 393,825 431,840 225,090 348,840General Fund Other 1,533,949 1,559,368 1,492,783 1,453,599
Total 2,879,654 2,909,698 2,650,202 2,734,790
Salaries & Wages
36%
Materials & Supplies
17%
Outside Services
26%
Utilities8%
Capital Outlay
4%
Capital Improve
0%
Materials & Supplies
7%
Expenditures by Type
Parks Mnt Spcl Tax
27%City Sticker Tax3%
Rents & Other1%
Grants Donations
3%
Interfund Transfers
13%
Revenue Sources by Type
To enhance both the beauty of the park system and user enjoyment of the City's park facilities, staff maintains City parks, park buildings and equipment.
7-10

PARKS, RECREATION & CIVIC FACILITIES - RECREATION
Director, Parks Recreation & Civic
Facilities
Recreation Programs &
Facilities Supervisor & Coordinator
Senior Work Leader(Softball/Baseball
fields)
REC Center Supervisor
Bode Complex Manager
PT Employees (for grounds mnt & gatekeepers)
Assistant Center Supervisor
Senior REC Leader
Assistant Complex Manager
Building Mnt Technician
Concession Facilities
Coordinator
PT Complex Attendants &
Concessions Staff
Aquatics Supervisor
PT Lifeguards
Temp & PT staff, 12 hrs/day, 7
days/wk
7-11

• Administer the financial, operational budgets of the recreation and softball/baseball programs• Provide assistance to user groups to facilitate youth sports activities• Organize and facilitate adult programming for all ages in fitness, softball, baseball, and other recreational activities
• Market and promote city facilities for use in local, state, regional and national tournaments and competitions• Provide quality facilities for various user groups in the community• Coordinate with park maintenance staff to prepare and maintain athletic and recreation facilities for public usage
• Partnered with St Joseph Health Department to facilitate St. Joe Fit wellness program• Assisted St Joseph School District to facilitate an annual elementary track meet• Offered youth tennis program during the month of July to introduce the game to young children• Held the initial adult cornhole league at Heritage Park in the fall of 2018• Held the first Outlaw Adventure challenge run in March 2018• Held the first Senior Games sponsored by the Parks, Recreation & Civic Facilities department for adults 50 years of age
and older offering various events and activities
• USA Softball Men's Major fastpitch softball tournament to be held July 2019• Hold the Outlaw Adventure Run and look into ways of increasing participation• Increase participation in the Senior Games event• Create equity between user groups and the fees that are collected for use of city facilities• Renovation of tennis courts at Noyes, Northside, and Hyde Park - working around High School tennis schedules• Increase participation for the tennis programs at Noyes Tennis center after renovations• Decline in participation in traditional adult team activities such as softball and basketball• Increased interest in new adult and youth activities such as cornhole, adventure/challenge runs, and disc golf that have
shortened time commitments needed for participation
Budget Challenges/Planned Initiatives
Current Year Activity/Achievements
Provide a variety of safe and enjoyable recreational activities to motivate youth to make positive, healthy life choices anddiscourage at-risk behavior. Promote tourism through sports tournaments and competition and provide a variety ofrecreation activities for adults in the community.
Recreation ProgramsRecreation, Softball/Baseball
Mission
Core Services
7-12

Parks Recreation Department
SOFTBALL/BASEBALLProgram 3020
Program Description
2017-18 2018-19 2019-20Adopted Estimated
Staffing Detail Actual Budget Actual Budget
Senior Work Leader 1 1 1 1
PT Temporary Employees (Groundskeepers & Gatekeepers) 1 1 1 1
Operating Budget Summary
2017-18 2018-19 2019-20Adopted Estimated
Actual Budget Actual BudgetExpenditures:Salaries & Wages 104,839 108,284 100,768 98,479Employee Benefits 21,000 28,920 28,408 28,474Materials & Supplies 21,567 17,720 17,720 17,812Services 42,941 54,820 52,250 64,605Capital Improvements 23,191 0 0 0Utility Expense 22,480 22,500 18,016 22,500Capital Outlay 0 0 0 0
Total 236,017 232,244 217,162 231,870Revenue Sources:Rec Fees/Complex Rev 47,926 74,150 38,307 74,150Rents 21,440 11,000 26,840 16,550Other Revenue 29,000 25,005 25,005 26,005General Fund-Other 137,651 122,089 127,010 115,165
236,017 232,244 217,162 231,870
Salaries & Wages
42%
Employee Benefits
12%
Materials &
Supplies8%
Services28%
Capital Improvements
0%
Utility Expense
10%
Expenditures by Type
Rec Fees/Complex
Rev32%
Rents7% Other
Revenue11%
Revenue Sources by Type
Provides a safe and enjoyable experience through the management and administration of the City's Spring and Fall Adult Softball programs and the City's 21 baseball and softball fields.
7-13

•••••••
•••
••••••
•
••
•
••••
•••
Continue challenges with meeting needs of the variety of users with limited spaceIncrease in fitness classes participants along with limited space for fitness classes, has a resulted in crowded classes and a need for more spaceWith the inability to control the increasing aggressive and inappropriate behaviors there was not second session of Little Ballers league
Continued summer youth sports and recreation campYouth volleyball leagues increased and became one of the larger youth programs offeredVolleyball and pickle ball continue to be the most popular sports programs for adultsFacility rentals for youth basketball and volleyball practices increased due to more open court time availabilityExpanded pickle ball weekday open gym times
Possible 24-hour access to fitness room to attract new memberships. Without 24-hour fitness memberships have continued to decline
Budget Challenges/Planned Initiatives
Attended job and health fairs to promote the centerOne of the host facilities for the Missouri Special Olympics 2018 Indoor gamesFacility rentals for tournament increased due to more available weekend gym times
To provide safe, supervised recreation and fitness opportunities through both adult and youth programs for the entire community.
Core Services
St. Joseph REC Center
Mission
Looking to partner with outside organizations to offer youth basketball programs again in the futureWill be host facility for National Youth Basketball tournament and Special Olympics Indoor Games in 2019Increased cost for security during youth recreation leaguesAttempts to correct a sewer smell and still unable to find the cause
Added new fitness classes and saw an increase in class participants
Fitness Center, Indoor walking track, and fitness classes
Youth sports include basketball, volleyball, and karateSummer youth recreation and sports campSpecial event and tournament rentalsHealth and wellness initiatives including St. Joe FitHost community events
Adult sports include volleyball, basketball, and pickle ball
Current Year Activity/Achievements
55 gym rentals for basketball practice31 gym rentals for volleyball197 Members in FY19 as of December - 232 Memberships in FY18
Performance Statistics
7-14

Parks Recreation Department
REC CENTER(St. Joseph Recreation, Exercise & Community Center)
Program 3060
Program Description
2017-18 2018-19 2019-20Adopted Estimated
Staffing Detail Actual Budget Actual Budget
Recreation Center Manager 1 1 1 1Recreation Programs & Facilities Supervisor 1 1 1 1Assistant REC Center Manager 1 1 1 1Recreation Programs & Facilities Coordinator 1 1 1 1REC Activities Cordinator 0 1 1 1Custodian (3) @ 15 hrs/wk 2.5 2.5 2.5 2.5Receptionists (7) @ 29 hrs/wk 3.5 2.5 2.5 2.5Fitness Attendants (3) @ 25 hrs/wk 1.5 1.5 1.5 1.5Center has other Temp Fitness Instructors, Activity Room Attendants 11.5 11.5 11.5 11.5
Operating Budget Summary
2017-18 2018-19 2019-20Adopted Estimated
Actual Budget Actual BudgetExpenditures:Salaries & Wages 451,800 538,454 432,521 441,668Employee Benefits 111,651 126,644 128,302 120,385Materials & Supplies 72,125 77,920 72,975 73,720Utilities 45,077 44,000 38,994 44,700Services/ Claims 79,997 88,420 71,320 72,370Capital 0 0 0 0Capital Improvements 0 0 0 0
Total 760,650 875,438 744,112 752,844Revenue Sources:Rec Fees 371,256 354,620 323,240 354,620Other Revenue 2,669 1,150 1,150 1,150General Fund - Other 386,725 519,668 419,722 397,074
Total 760,650 875,438 744,112 752,844
Salaries & Wages
59%
Employee Benefits
16%
Materials & Supplies
10%Utilities
6%
Expenditures by Type
Rec Fees47%
Other Revenue
0%
General Fund -Other53%
Revenue Sources by Type
The staff at the Center provide safe, supervised recreation opportunities through both adult and children's activityprograms for the whole community. The REC Center hosts a fitness room, three basketball/volleyball courts, acommunity room, an indoor running track and rooms for various recreation & fitness programs. The Center alsoinitiates summer playground and Life Skills programs.
7-21

Bode Sports Complex
Mission
Core Services
••••••••••
Current Year Activity/Achievements
••••••••••
Budget Challenges/Planned Initiatives
•••• Pickle Ball courts will be available for rent and leagues at newly re-purposed area in front of the ice arena
Bode started power and edge classes for figure skaters and hockey playersHosted Special Olympics Winter Games for the 28th yearThe FSC show will be held in May 'Mary Poppins Over Frozen Pond'
Continue house hockey program in AugustOffer an additional Learn to Skate Class through the weekOffer a Learn to Synchro program to continue growing the Synchro teams
National Skating Month in January had 273 people attend
Host St. Joseph Curling Club activitiesSix lighted outdoor basketball courts which host the Summer Jam programThree outdoor pickleball courts and a multi-purpose areaHost of a variety of figure skating competitionsHost of a variety of youth hockey tournaments
Bode hosted the Pony Express Figure Skating Championships in SeptemberHosted the Storm Girls' Hockey Invitational TournamentBode was the site of the 5th Annual Best of MidWest Synchro Championships in NovemberThe Greater St. Joseph Youth Hockey Association added one additional teamCollaborated with the RNC on the Recreation Education packages with great successThe Synchro Christmas show 'The Spirit of Christmas' was again attended well
Beyond basic skating program
Provide a variety of enjoyable, supervised, recreational activities for the community in a family friendly environment.
Recreational ice skating for everyoneIce time for figure skating organizationsIce time for hockey teamsProvide classes for basic skills for figure skating and hockey
7-16

Parks Recreation Department
BODE SPORTS COMPLEXProgram 3080
Program Description
2017-18 2018-19 2019-20Adopted Estimated
Staffing Detail Actual Budget Actual Budget
Ice Arena Manager 1 1 1 1Assistant Complex Manager 1 1 1 1Concessions Facilities Coordinator 1 1 1 1Building Maintenance Technician 1 1 1 1
Various Positions (PT) 4 4 4 4
Operating Budget Summary
2017-18 2018-19 2019-20Adopted Estimated
Actual Budget Actual BudgetExpenditures:Salaries & Wages 198,514 202,224 211,830 215,268Employee Benefits 72,475 81,385 81,666 86,722Materials & Supplies 23,411 19,300 21,608 16,700Services 72,836 60,420 64,720 52,840Insurance & Other 97,716 73,200 68,253 83,200Capital Improvments 33,247 0 0 0
Total 498,199 436,529 448,077 454,730Revenue Sources:Complex Revenue 252,030 227,000 220,780 227,500Misc Revenue 1,873 2,000 2,000 2,000Other Grants 8,988 0 0 0General Fund-other 235,308 207,529 225,297 225,230
Total 498,199 436,529 448,077 454,730
Salaries & Wages
47%
Employee Benefits
19%
Materials & Supplies
4%
Services12%
Insurance & Other18%Capital
Improvmnts8%
Expenditures by Type
Complex Revenue
50%
0%
Other Grants50%
Revenue Sources by Type
This program offers a quality facility that operates on a flexible schedule. The Complex is open 10 months a year for recreational skating, private parties, school groups, hockey and figure skating. Outdoor, in-line rink and basketball courts are open year round, weather permitting.
7-17

•••••
••••
••••
Safety of employees continues to be an issue in remote facilitiesProvide credit card services at Drake/Southpark fieldsImpact of Minimum wage increase - increase wages will also increase product costs
Continue to build relationships with vendors to offer the best product and pricing
To offer outstanding customer service. Provide a variety of menu options to users of the Parks Concessions throughoutthe City.
Parks Concessions
Mission
Offer fair and responsible menu pricing
Provide a clean, user friendly, environmentKeep facilities and grounds clean and well maintained within health codeOffer outstanding customer service at all timesEmploy over seventy seasonal part - time positions to the community
Core Services
Current Year Activity/Achievements
Budget Challenges/Planned Initiatives
Maintained 8 concession areas within the Parks ConcessionsRevamped Bode Ice Arena concession operation and updated the menuTwo employees received their ServSafe Management certificationContinue to recycle in all areas of operation
7-18

Parks Recreation Department
PARKS CONCESSIONSProgram 3085
Program Description
2017-18 2018-19 2019-20Adopted Estimated
Staffing Detail Actual Budget Actual Budget
Part time concession staff only N/A N/A N/A N/A
Major Budgetary Changes & Program Highlights
Operating Budget Summary
2017-18 2018-19 2019-20Adopted Estimated
Actual Budget Actual BudgetExpenditures:PT & Seasonal Emps 142,787 155,788 114,971 114,713Payroll Taxes 10,939 18,356 18,356 14,290Materials & Supplies 146,418 161,995 132,045 90,883Services 8,129 4,720 5,895 4,720Capital 0 0 0 0
Total 308,273 340,858 271,266 224,606Revenue Sources:Concessions 241,762 272,175 272,175 186,446Other Revenue 6,976 5,000 5,000 4,090General Fund - Other 59,536 63,683 -5,909 34,070
Total 308,273 340,858 271,266 224,606
PT & Seasonal
Emps51%
Payroll Taxes
6% Materials &
Supplies41%
Services2%
Expenditures by Type
Concessions83%
Other Revenue
2%
General Fund -Other15%
Revenue Sources by Type
This program accounts for the concession services provided by the Parks & Recreation Department to the swimming pools, ballfields, Remington Nature Center and Bode Sports Complex.
~The entire wage category is for part time concessions and recreation attendant personnel who work at the variousvenues - pools, ballfields, Bode Complex, and the Nature Center.~No major change to the program's budget.
7-19

•••••••
••••••••
•
••••••
Swimming
Mission
Working on organizing a Master's swim program
Supervise recreational swimming at the Aquatic Park, Krug Pool, and MWSU indoor poolProvide a year round family friendly swimming venueProvide swim lessons for children, ages 3 and upProvide a venue for swim team practicesProvide lifeguard training and certification classesProvide a venue for aqua fitness classesA location for group events, such as daycares, summer camps, and other organizations
Able to increase the number of lifeguard staff after several years of declineAssisting with MWSU for operation and staffing of their year round indoor facilityAdded swim team practice opportunities at Aquatic Park and MWSU
Core Services
Current Year Activity/Achievements
Budget Challenges/Planned Initiatives
Aging facilities and infrastructure continue to be a concern
Offered swim lessons only at MWSU throughout the year to better serve the public
Staffing expense continues to be a problem. Unless we increase to stay competitive, we will lose employees to othercompanies paying more. Minimum wage will be increased by increments of 85 cents until it reaches $12.00 in 2023with each year thereafter increased according to Consumer Price Index.The year round involvement in the operation of the MWSU indoor poolYear round swim lessons and lifeguard training is now possible with indoor optionSpecial rentals at the indoor facility should help with revenuesExpanded flexibility in lifeguard training with indoor pool option
Implemented using RaceTrac software for daily transactions at the Aquatic ParkInstalled internet access to connect to the city's networkAssisted with St. Joe Fit's Aqua Zumba
Attracting lifeguards - offered free certification this year to hopefully attract more people. They would have to be willingto work for the City if they take the free certification.
To enable children and adults the enjoyment of recreational water activities, to provide a safe recreational environmentand to learn water safety skills that will last a lifetime.
7-20

Parks Recreation Department
SWIMMINGProgram 3030
Program Description
2017-18 2018-19 2019-20Adopted Estimated
Staffing Detail Actual Budget Actual Budget
Aquatics/Recreation Supervisor 1 1 1 1
PT Temporary Employees 1 1 1 1
Major Budgetary Changes & Program Highlights
Operating Budget Summary
2017-18 2018-19 2019-20Adopted Estimated
Actual Budget Actual BudgetExpenditures:Salaries & Wages 225,644 240,925 226,461 214,537Employee Benefits 38,734 49,842 52,671 48,914Materials & Supplies 55,488 39,950 40,350 36,413Services 81,197 91,020 67,020 78,620Ins & other 0 6,250 6,250 6,250Improv Other Buildings 0 0 0 0Utility Services 64,336 43,500 95,166 84,000Capital Outlay 12,385 0 0 0
Total 477,784 471,487 487,918 468,733Revenue Sources:Charges for Services 120,896 122,000 109,439 122,000Rental 5,867 8,000 7,040 8,000Other Rev 2,194 0 0 0General Fund - Other 348,828 341,487 371,439 338,733
Total 477,784 471,487 487,918 468,733
Salaries & Wages
46%Employee Benefits
10%
Materials &
Supplies8%
Services17%
Ins & other1%
Utility Services
18%
Capital Outlay
0%
Expenditures by Type
Charges for
Services26%
Rental2%
Other Rev0%
Revenue Sources by Type
The swimming program provides daily water recreation opportunities for all area residents through administration of theCity's swimming pools at Krug and Hyde Parks along with the St. Joseph Aquatic Center at the Noyes Park. Theprogram also provides Red Cross swimming lessons, rental for pool parties, and events such as water fitness.
~~Replacing aged and damaged equipment at the Aquatic Park (lounge chairs,& benches ) $7000~~Request for purchas of backboards and mannequins $2000
7-21
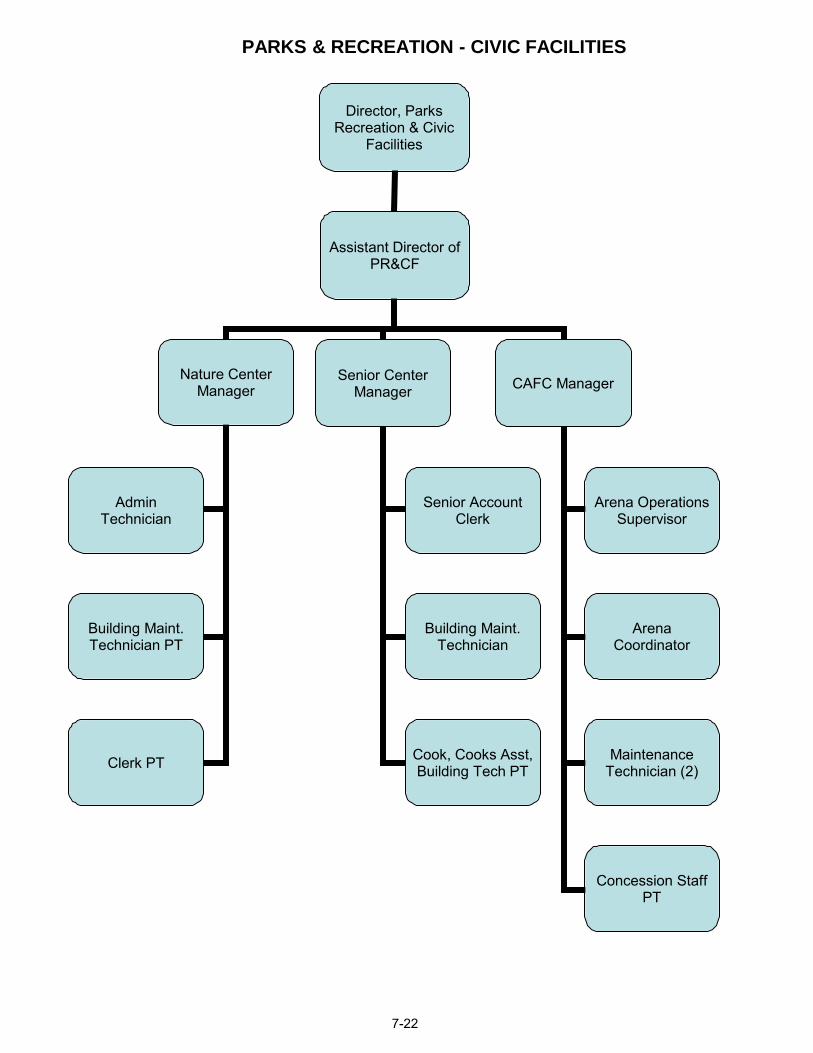
PARKS & RECREATION - CIVIC FACILITIES
Director, Parks Recreation & Civic
Facilities
Assistant Director of PR&CF
Senior Center Manager CAFC ManagerNature Center
Manager
AdminTechnician
Building Maint.Technician PT
Clerk PT
Senior Account Clerk
Building Maint.Technician
Cook, Cooks Asst, Building Tech PT
Arena Operations Supervisor
Arena Coordinator
Maintenance Technician (2)
Concession Staff PT
7-22

•••••••
••••••
••••
••••••
••
Hosted a large number of school field tripsContinued popularity for business meetings, community evens, private parties, field trips, and outreach programs;hosted 366 separate eventsIncreased admission fees for the first time in 10 years.Celebrated ten year anniversary - celebration was attended by approximately 370 people
Continue to try unique ideas and increase programming options to increase revenues
Won "Best Museum" through the St. Joseph News PressWelcomed more than 25,000 visitors, all 50 states represented as well as visitors from Mexico, Canada, Japan,
Enhance outdoor landscaping around the buildingContinuing the partnerships with area and regional school districtsLagoon retaining wall is failing and lagoon needs dredging due to siltThe filtration units for the 7,000 gallon Aquarium has developed a leak. These filters are located in the basement, butneed to be addressed.
Issues with the HVAC system being inadequate for the building. Currently will not heat or cool properly.
Hosted several well attended educational programming events throughout the year.
Showcase a variety of natural displays and exhibitsShowcase a variety of historic displays and exhibitsProvide educational programming for all ages on nature, animals, history, and cultural issuesProgramming includes 7,000 gallon aquarium with native fish on displayProvide space for special events, parties, and meeting rentalsOperation of gift shop with a variety of educational and recreational items
Continued partnership with Bode Ice Arena for "Recreation Education" programStrengthened presence in local museum community with heavy involvement with Museum AssociationParticipated in numerous off-site outreach programs throughout the region and state.
Provide off-site outreach programs in the surrounding areas
The roof is an ongoing issue and needs to be repaired.Conference room needs upgrades to flooring/carpeting and divider door needs to be replaced
Remington Nature Center
Mission
Core Services
Current Year Activity/Achievements
Budget Challenges/Planned Initiatives
To inspire visitors to learn more about human impacts on the Earth, and instill a desire to be a positive steward for ourworld through programming and hands-on experiences concerning nature and the cultural heritage of the St. Joseph areafor our citizens and for tourists.
7 - 23
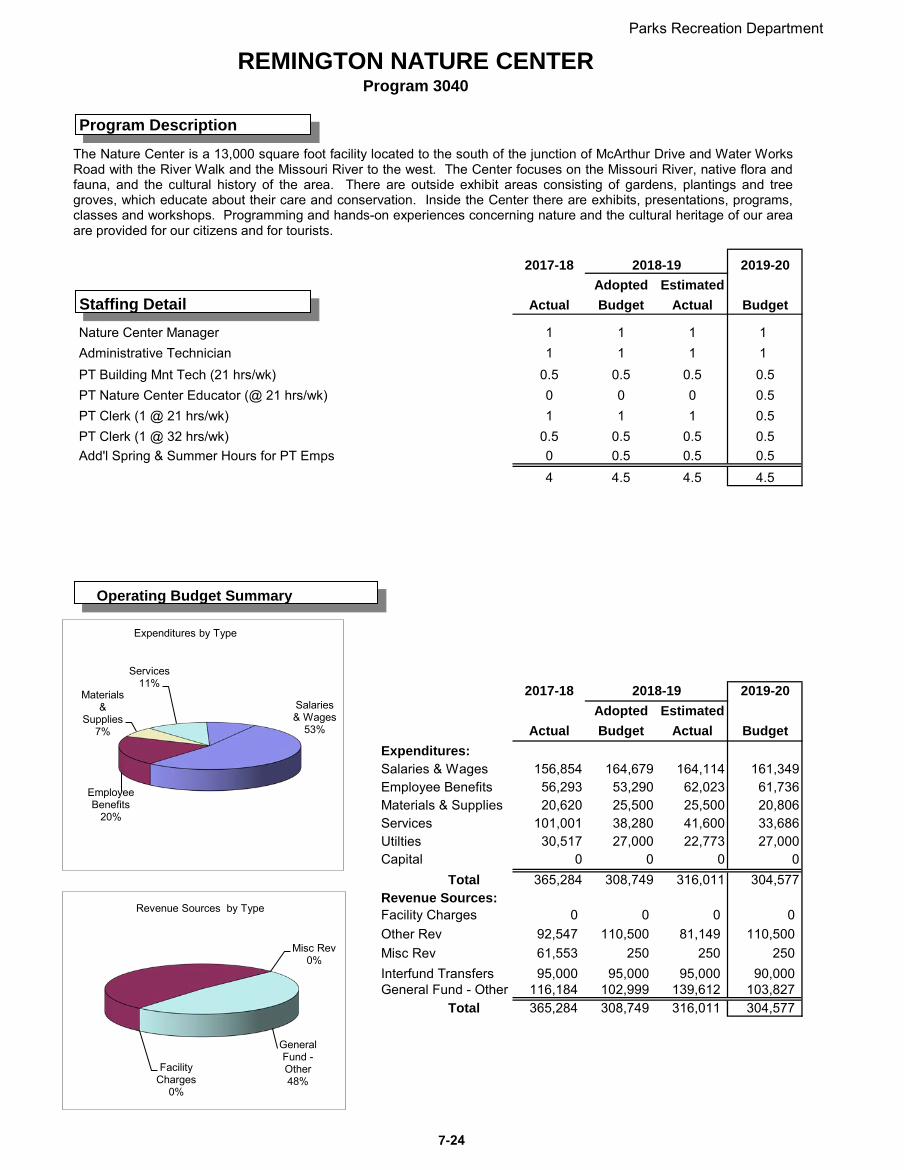
Parks Recreation Department
REMINGTON NATURE CENTERProgram 3040
Program Description
2017-18 2018-19 2019-20Adopted Estimated
Staffing Detail Actual Budget Actual Budget
Nature Center Manager 1 1 1 1Administrative Technician 1 1 1 1PT Building Mnt Tech (21 hrs/wk) 0.5 0.5 0.5 0.5PT Nature Center Educator (@ 21 hrs/wk) 0 0 0 0.5PT Clerk (1 @ 21 hrs/wk) 1 1 1 0.5PT Clerk (1 @ 32 hrs/wk) 0.5 0.5 0.5 0.5Add'l Spring & Summer Hours for PT Emps 0 0.5 0.5 0.5
4 4.5 4.5 4.5
Operating Budget Summary
2017-18 2018-19 2019-20Adopted Estimated
Actual Budget Actual BudgetExpenditures:Salaries & Wages 156,854 164,679 164,114 161,349Employee Benefits 56,293 53,290 62,023 61,736Materials & Supplies 20,620 25,500 25,500 20,806Services 101,001 38,280 41,600 33,686Utilties 30,517 27,000 22,773 27,000Capital 0 0 0 0
Total 365,284 308,749 316,011 304,577Revenue Sources:Facility Charges 0 0 0 0Other Rev 92,547 110,500 81,149 110,500Misc Rev 61,553 250 250 250Interfund Transfers 95,000 95,000 95,000 90,000General Fund - Other 116,184 102,999 139,612 103,827
Total 365,284 308,749 316,011 304,577
Salaries & Wages
53%
Employee Benefits
20%
Materials &
Supplies7%
Services11%
Expenditures by Type
Facility Charges
0%
Misc Rev0%
General Fund -Other48%
Revenue Sources by Type
The Nature Center is a 13,000 square foot facility located to the south of the junction of McArthur Drive and Water WorksRoad with the River Walk and the Missouri River to the west. The Center focuses on the Missouri River, native flora andfauna, and the cultural history of the area. There are outside exhibit areas consisting of gardens, plantings and treegroves, which educate about their care and conservation. Inside the Center there are exhibits, presentations, programs,classes and workshops. Programming and hands-on experiences concerning nature and the cultural heritage of our areaare provided for our citizens and for tourists.
7-24

•••••
•••••••••
•
•
•
•••
•
Aging building needs significant renovations in almost all areas, issues needing attention are a new roof, HVAC units,
elevator, painting interior/exterior, replace aging/weathered signs, finish LED lighting, finish exposed pipe project.Kitchen renovations/repairs needed, replace walk in freezer, steam table, refrigerators, hood system, and dishwasher
Continue offering education sessions and opportunities and look at new ways to attract and increase participationWorking with the Silver Sneakers program on the centers eligibility to participatePit in sidewalk on 10th street is leaking and needs replacement - backflow preventer cannot be tested due to failingequipmentFees and charges - what would be reasonable for our customers and not deter participation in center
Offered educational programs to seniors "Glimpses of the Past", and ScramboreeIncreased social media presence on FacebookReplaced damaged fitness center flooring with Bounce 2Senior Center Council/Strategic Planning - SWAT analysis to improve the center40th Anniversary celebration observed and received a proclamation by the MayorAdded rooftop alarm beams after suspected tampering with HVAC unitsCafeteria has made adjustments to lunches, proving to be very popularVolunteer committee held a "clean up of the area" at the lower level parking lot to spruce up our appearance as guestsare entering the buildingSenior Center hosts the Senior Foundations annual Thanksgiving dinner
Core Services
Current Year Activity/Achievements
Budget Challenges/Planned Initiatives
Provide a variety of services to persons age 50 and over and people with disabilities. Maintain a clean, positive, andhealthy environment in order to increase the overall quality of life for persons 50 and over.
Joyce Raye Patterson Senior Center
Mission
Provide a cafeteria serving lunch Tuesday - Friday
Continue to provide a safe, clean environment for senior user groups
Administer the operational budgets of the centerFacilitate relationships with a wide variety of user groupsProvide a facility for groups to use for fitness, recreation, education, and socializationProvide an active fitness center with a variety of strength and cardio equipment
7-25

Parks Recreation Department
JOYCE RAYE PATTERSON SENIOR CITIZEN CENTERProgram 3050
Program Description
2017-18 2018-19 2019-20Adopted Estimated
Staffing Detail Actual Budget Actual Budget
Senior Center Manager 1 1 1 1Fitness Coordinator (split with REC) 1 1 1 1Senior Account Clerk 1 1 1 1Building Maintenance Technician 1 1 1 1
4 4 4 4
Operating Budget Summary
2017-18 2018-19 2019-20Adopted Estimated
Actual Budget Actual BudgetExpenditures:Salaries & Wages 157,442 195,934 192,922 194,382Employee Benefits 55,065 78,207 78,179 82,124Materials & Supplies 17,536 19,100 16,175 22,528Services 22,074 15,865 25,182 15,865Utilities 28,842 30,415 26,257 25,000Capital 0 0 0 0Capital Improve 11,431 0 0 0
Total 292,390 339,521 338,715 339,899Revenue Sources:Rec Fees/Memberships 58,807 61,000 64,200 61,000Other Revenue 50,932 35,938 35,938 50,938General Fund-Other 182,651 242,583 238,577 227,961
Total 292,390 339,521 338,715 339,899
Salaries & Wages
57%
Employee Benefits
24%
Materials &
Supplies7% Services
5%
Utilities7%
Capital Improve
0%
Expenditures by Type
Rec Fees/Memberships
18%
General Fund-Other67%
Revenue Sources by Type
The Center provides a variety of services to persons age 50 and over, and to the disabled in a well-maintained, clean, cheerful and healthful environment. Services include card groups, craft activities, dances, special events, meeting space, retirement association meetings, a computer lab and a fitness room. It also has a cafeteria open to the public.
7-26

•••
•••
••
•••
•••
•
•
•
•
••
•
••
Civic Center Arena and Concessions
Core ServicesThe Civic Arena offers 40,000 square feet of unobstructed exhibition space for trade shows.Venue provides an arena for sporting events that include wrestling, basketball, bull riding, cheer and dance Perfect venue for receptions, banquets, conventions, meetings, training, parties, and a various other parties andactivities.The Civic Arena provides concession stands, catering and bars for all events.Family entertainment facility for events such as dog shows, chili challenge, Harlem Globetrotters, circus events,
MissionThe Civic Arena is a downtown facility that hosts concerts, trade shows, sporting events, conventions, and other specialevents in order to enhance the local economy and contribute to the overall appeal of St. Joseph as a destination forboth local and outside business and tourist trade and entertainment.
Perfect event space for specialized events such as Vet2Vet, Special Olympics, and a Statewide Dental Clinic.
Budget Challenges/Planned Initiatives
Current Year Activity/Achievements
Because of Finance Assistance Program we were able to host the Children's Area Fair, Tiny Tot Town, and two Career
Successful year with numerous corporate bookings for meetings and banquets.Numerous banquets including the Chamber of Commerce, Women of Excellence, Pivotal Fall Ball, Noyes Home "TakeA Seat", Mayor's Thanksgiving Dinner, and Mayor's Prayer Breakfast.Liberty Nationals Youth Wrestling Tournament completed it's six consecutive year at the arena.Hosting another year of trade shows that included the Midland Empire Farm and Ag, Gun Shows, Antique Show, Adding a new trade show the year . . . Shop Small St. Joseph.
Concert featuring Justin Moore and Dylan Scott.
We work closely with the Convention and Visitors Bureau to seek local and out of town events.
We continue our relationship with Boehringer Ingelheim hosting their annual employee meeting.
Major issue with a storm drain causing periodic flooding of lobbies.
Work hard to maintain our current client base by providing them the best possible customer service in a safe and clean Struggle with deficiencies in our heating and cooling system. The boilers continue costing us high amounts to keep themoperating.Currently have a non-functioning emergency generator.
All seating and bleachers are in dire need of replacement for mechanical and safety reason.
The arena staff continues to search out more diverse events that will fit well with our facility and community.
We continue to struggle with the aging facility that is in dire need of attention including for safety purposes in terms ofl bi l t i l d i tContinue to develop deeper relationships with promoters showing them their event can be successful in St. Joseph and
specifically at the Civic Arena.
7-27

Parks Recreation Department
CIVIC ARENAProgram 5510
Program Description
2017-18 2018-19 2019-20Adopted Estimated
Staffing Detail Actual Budget Actual Budget
CFAC Manager 1 1 1 1Arena Operations Supervisor 1 1 1 1Maintenance Technician 1 1 1 1Arena Coordinator 1 1 1 1
4 4 4 4
Operating Budget Summary
2017-18 2018-19 2019-20Adopted Estimated
Actual Budget Actual BudgetExpenditures:Salaries & Wages 181,158 191,637 185,829 186,684Employee Benefits 74,853 81,708 78,308 84,230Materials & Supplies 39,440 9,800 10,750 8,800Services 122,190 114,627 99,202 104,740Capital Improvements 4,500 0 0 0Utilities 148,699 121,800 142,656 142,800Capital 41,440 0 0 0
Total 612,280 519,572 516,744 527,254Revenue Sources:Hotel/ Motel Tax 613,214 714,000 714,000 714,000Charges for Services 229,307 214,000 199,865 219,000Other Revunue 754 0 0 0Interest 1,028 0 667 675General Fund - Other (230,994) (408,428) (397,121) (406,421)
Total 613,309 519,572 517,411 527,254
Salaries & Wages
35%
Employee Benefits
16%
Materials &
Supplies2%
Services20%
Utilities27%
Expenditures by Type
Charges for
Services17%
General Fund -
Other…
Hotel/Motel77%
Revenue Sources by Type
The Civic Arena is a downtown facility that hosts concerts, trade shows, sporting events, conventions and other special events in order to enhance the local economy and contribute to the overall appeal of St. Joseph as a destination for both local and outside business and tourist trade and entertainment.
7-40

Parks Recreation Department
CIVIC ARENA CONCESSIONSProgram 5520
Program Description
2017-18 2018-19 2019-20Adopted Estimated
Staffing Detail Actual Budget Actual Budget
Part time concession staff only N/A N/A N/A N/A
Operating Budget Summary
2017-18 2018-19 2019-20Adopted Estimated
Actual Budget Actual BudgetExpenditures:PT Concessions Staff 10,133 20,600 14,726 14,726Employee Benefits 778 2,400 2,400 1,839Materials & Supplies 54,924 90,000 69,250 80,550Services 4,146 4,500 4,500 4,500
Total 69,980 117,500 90,876 101,615Revenue Sources:Resale Concession 142,784 115,000 115,000 115,000Other Rev 0 0 0 0From (to) FB (72,804) 2,500 (24,124) (13,385)
Total 69,980 117,500 90,876 101,615
PT Concessions Staff
15%
Employee
Benefits2%
Materials & Supplies
79%
Services4%
Expenditures by Type
Resale Concessi
on90%
From (to) FB
-10%
Revenue Sources by Type
This program accounts for the concession products supplied to the patrons of the Civic arena through stand and bar operations. Staff also do minor catering of events.
7-29

•
•
•
•
•
•
•
••
•
••
•
••••
Budget Challenges/Planned Initiatives
Missouri Theater
The Missouri Theater is a 1,200 seat, 1920's vaudeville style entertainment facility in the heart of downtown St. Joseph.The Theater provides a home to many of the city's arts associations and serves as a venue for a wide variety of culturalevents.
Core Services
Missouri Theater is excellent for concerts.
Missouri Theater is on the National Registry of Historic Buildings.
Missouri Theater is a venue for local arts organizations to perform including Robidoux Resident Theatre, St. JosephSymphony, Creative Arts Productions, and various dance schools.The Missouri Theater provides a venue for the Performing Arts Association to host their season of national andinternational acts.Missouri Theater is perfect for movie showings, meetings, award ceremonies, graduations, pageants, and conferences.
Mission
Various Pageants, conference and meetings used the venue.
Began working with a new promoter where we were able to bring in the Beach Boys, Josh Turner, Dwight Yoakam andThree Dog Night.
The Missouri Theater welcomed a new sound system and upgrades to the dressing rooms and green room thanks tosome very generous local donations.
Seats a the Missouri Theater are in need of replacement and/or being cushioned and covered.Water leakage from roof drainage is causing severe damage to the walls and ceiling areas.Work is needed on the studio windows which have been broken and/or damaged over the years.
All office spaces at the complex are currently occupied.
The Missouri Theater was the perfect venue for showcasing the new film "Christmas at the Chateau."Branson artists the Haygoods performed at the Missouri Theater.
Current Year Activity/AchievementsLocal company productions, i.e. Foot Loose, The Dark Fairy, Momma Mia, Annie, 9 to 5, Madagascar, Peter Pan, St.Joseph Symphony, Shrek, Legally Blond, and othersPerforming Arts Association brought in Roy Orbison and the Everly Brothers, Temptation Revue, Steve Lippia,Inspiration of Broadway, Steep Canyon Rangers, Stunt Dog Experience, Tony Danza, Brass Transit, Lee Rocker andForever Plaid.The return of four local dance companies using the Missouri Theater for the annual recitals.
7-30

Parks Recreation Department
MISSOURI THEATERProgram 3710
Program Description
2017-18 2018-19 2019-20Adopted Estimated
Staffing Detail Actual Budget Actual Budget
Maintenance Technician 1 1 1 1
1 1 1 1
Operating Budget Summary
2017-18 2018-19 2019-20Adopted Estimated
Actual Budget Actual BudgetExpenditures:Salaries & Wages 44,659 45,796 45,903 32,263Employee Benefits 19,191 19,907 18,585 17,501Materials & Supplies 5,198 9,000 9,000 6,120Utilities 35,103 49,800 54,104 50,300Capital Improve 11,465 0 0 0Outside Services 40,071 39,000 29,000 14,000
Total 155,688 163,503 156,591 120,183Revenue Sources:Charges for Services 52,425 52,875 51,775 51,175Other Gen Fund 103,263 110,628 104,816 69,008
Total 155,688 163,503 156,591 120,183
Salaries & Wages
27%
Employee Benefits
14%
Materials &
Supplies5%
Utilities42%
Outside Services
12%
Expenditures by Type
Charges for
Services43%
Other Gen
Fund…
Revenue Sources by Type
The Missouri Theater is a 1,200 seat, 1920's vaudeville style entertainment facility in the heart of downtown St. Joseph. Therenovated Theater provides a home to many of the City's arts associations. It serves as a venue for a wide variety of cultura events.
7-31

(this page intentionally left blank)

PARKS, RECREATION & CIVIC FACILITIES GOLF COURSE
Director, Parks Recreation & Civic Facilities
Assistant Director of PR&CF
Golf Course Superintendent
Maintenance Technician
Golf Course Manager
Assistant Course Manager
PT Kitchen Sprvsr, Front Counter Sprvsr, Cashiers,
etcPT Seasonal Laborers
7-32
•••
••
••
•
••
•
••
•
•
•
•
•
•
•
•
••
•
•
Co-op hosting (2) winter adult Corn hole leagues in banquet room, providing new revenues in concessions averaging$250-300 each week.
Loss of memberships due to private competing club becoming more public. Loss of memberships meant loss ofrevenue through greens/cart fees, concessions, range, and Pro Shop revenue.Golf rounds were less this season mainly due to loss of memberships.Increased wages begin in January 2019 for all part time workers. This will impact services provided eventually as it isset to contue to raise annually. Catering/concessions will be raised to offset some costs associated with staff and lessstaff utilized for events will be the unfortunate reality looking into the future. It will be tricky to keep fees at currentlevels through this as well as stay competitive with (3) other area golf courses. The golf course with most competitivepricing while still maintaining a well-kept course will be the one who attracts the most rounds.Simulator upgrade is necessary to continue interest in off season golf activity. Ours is in its fourth year and beginningto have some problems. Options are being addressed now for the future. These problems have seen a decline insimulator rounds due to down/repair time.
Budget Challenges/Planned Initiatives
PGA Teaching Pro, Greg Dillon and MWSU continue their co-op operations with Fairview offering junior camps insummer, private lessons, and fall college curriculum class for beginner golfers.Banquet room opportunities continue to grow each year since the 2010 renovation. Rentals include class and familyreunions, birthday and retirement parties, weddings, and receptions, memorial services, Christmas and sororityparties, baby and bridal showers, company meetings and parties, and the list grows each year. 181 events werehosted this year with 40% of those utilizing our catering/bar services.Several trees were cut down over the year - some due to disease and others to open up fairways to promote moregrowth in our Zoysia turf.Maintenance has overhauled the 5 reels associated with the older fairway mowing unit to provide a backup/addedmower for the new season coming up.New sprayer was purchased this year replacing the one which was over 25 years old. This provides better coveragewhen applying chemicals.
The City of St. Joseph's only 18 hole public golf courseOffering league opportunities for men, women, seniors, and corporateCorporate outings, fundraisers, couples golf, memorial events, and social eat/play/meeting options are all highlightedin our Tournament schedule each seasonBanquet room available for up to 150 guests as well as on site catering to compliment your event
To provide a competitive, yet enjoyable 18-hole golf course complete with practice facilities, fully stocked MerchandiseShop, snack bar, and full service banquet/meeting room with on site catering available.
Core Services
Not only is beautiful scenery an added attraction when utilizing our three outdoor patio areas but these areas nowboast speakers to listen to music or favorite sports broadcasts through our new outdoor sound system.Manicured golf course made consistent through daily, weekly, and other scheduled routine maintenance.Turf performance maintained through proper fertilization to greens, tees, fairways; pest and weed control; and aerationand seeding practices.Provide a clean and attractive clubhouse and parking lot area with knowledgeable, courteous staff to meet all your golfand banquet needs.Provide quality food service with clean and up-to-date facility and kitchen with properly trained staff.Indoor winter golf now available through simulator play providing entertainment through leagues, open play and range,and party options
Simulator golf continues to be popular during the winter months providing off season revenues through leagues, openplay, and indoor range options.Corporate members grew from 79 members in 2017 to 123 members in 2018.Popular leagues continue such as Wednesday night Men's league May-September of each season with 112 weeklyplayers. Tuesday morning ladies host between 14-22 players each week, while the Thursday FLAG ladies 9-holeleague increased members by 15 this year. Legends senior golf is played every other Thursday hosting between 48-60players each outing.Corporate leagues are also held weeknights with 4 different companies bringing in an average of 16-28 people foreach league per week.
Current Year Activity/Achievements
Fairview Municipal Golf Course
Mission
Merchandise shop will discontinue selling clothing in the season ahead and focus more on clubs, tees, balls, hats,novelty items to sell.
7-33

Parks Recreation Department
FAIRVIEW MUNICIPAL GOLF COURSEProgram 3070
Program Description
2017-18 2018-19 2019-20Adopted Estimated
Staffing Detail Actual Budget Actual Budget
Golf Course Superintendent 1 1 1 1Golf Course Manager 1 1 1 1Golf Course Assistant Manager 1 1 1 1Maintenance Technician 1 1 1 1Part-time 3.5 3.5 3.5 3.5
7.5 7.5 7.5 7.5
Operating Budget Summary
2017-18 2018-19 2019-20Adopted Estimated
Actual Budget Actual BudgetExpenditures:Salaries & Wages 334,523 335,043 326,055 324,296Employee Benefits 89,761 100,268 98,538 92,712Materials & Supplies 210,184 171,100 179,040 168,900Services 108,685 90,310 102,535 95,812Other Charges 100,936 64,500 101,133 86,500Capital 2,263 0 0 0Debt Service- Princ 0 0 0 0Debt Service - Interest 0 0 0 0Transfers 21,409 0 0 0Transfers Computer 3,000 3,000 3,000 4,000
Total 870,761 764,221 810,300 772,220Revenue Sources:Chrg for Golf Services 650,385 715,200 685,103 671,800Interest (257) 0 (355) 0Other Revenue 6,006 6,000 6,000 6,000Interfund Transfer 196,824 47,360 107,500 60,332(To)/From Golf FB 17,546 (4,339) 11,697 34,088
Total 870,504 764,221 809,945 772,220
Salaries & Wages
42%
Employee Benefits
12%
Materials &
Supplies22%
Services12%
Other Charges
11%
Debt Service-
Princ0%
Expenditures by Type
Fairview Golf Course, the City's only public course, offers a competitive and enjoyable golf environment and practice facility for St. Joseph citizens as well as visitors through leagues, clubs and other programs for men, women, seniors and
Chrg for Golf
Services87%
Other Revenue
8%
(To)/From Golf
FB4%
Revenues By Type
7-34

Parks Recreation Department
GOLF FACILITY IMPROVEMENTSProgram 1300
PROGRAM DESCRIPTION
CAPITAL OUTLAY & PUBLIC IMPROVEMENTS
Capital Budget Summary
2017-18 2018-19 2019-20Adopted Estimated
Actual Budget Actual BudgetExpenditures:Services 0 9,052 9,052 9,052Debt Principal 0 0 0 0Debt Interest 0 0 0 0Machinery & Equip 0 0 0 0Capital Imprvmts 0 0 0 6,500
Total 0 9,052 9,052 15,552Revenue Sources:Chrgs for Services 18,596 21,100 21,100 21,100Other Revenue 0 100 0 100Interfund Transfer 0 0 0 6,500FB from/(to) (18,596) (12,048) (12,048) (12,148)
Total 0 9,152 9,052 15,552
$0 $50,000 $100,000 $150,000 $200,000 $250,000 $300,000 $350,000 $400,000 $450,000 $500,000
24,42235,414
17,52514,98814,714
144,7140
9,05215,552
Golf Facility Improvement Project Expenditures
The Municipal Golf Improvements Program was established to track, monitor, and facilitate capitalexpenditures funded by the voluntary $1.00/round golf surcharge.
7-35

TOTAL BUDGETED RESOURCES: 101,036,914$
PUBLIC WORKS DEPARTMENTThe Public Works Department provides for street maintenance, street overlay, storm sewers, bridges, street signs,snow removal, street lighting, operations at the city’s parking structures and lots as well as downtown parkingenforcement, solid waste disposal and recycling, engineering and capital project management, wastewater treatmentand sewer collection system maintenance, mass transit services, and a municipal airport.
These operations are funded through the City’s share of the Missouri motor fuel tax, road and bridge tax, localgeneral sales tax, use tax, parking fees & fines, landfill fees, sewer treatment fees, airport rents, transit fares andfederal transportation operation grants.
Infrastructure improvements are financed by a combination of tax revenues, fees, State Revolving Loan bonds,revenue bonds, and county, state, and federal grants.
Public Works Administration
Street/Sewer Mtce Admin
WP Administration
Engineering
Landfill Operations
MPO
Rosecrans Airport
Street Maintenance
Parking Operations
Traffic
Snow/Ice Control
Sewer Line
PW Communications
Equipment
WP Plant Operations Laboratory Recycling
Capital Projects
Transit
Street Enhancement Use
9 - 1

PUBLIC WORKS DEPARTMENTSOURCES & USES
General Fund59%
Aviation Fund-12%Landfill Fund
2%
Water Protection Fund12%
Transit Fund8%
Parking Fund0%
Streets Maintenance Fund
9%Gaming Fund
0.2%
FUNDING SOURCES - OPERATING
Public Works Administration
2%
Engineering2%
MPO1%
Streets & Sewer Administration and
Support3%
Strts Mnt & Enhanced St Use
Tax22%
Parking Ops1%
Sewer Collection Syst Mtce
10%
WP Plant Administration and
Operations47%
Mass Transit12%
St. Joseph Rosecrans Airport
1%
Landfill & Recycling5%
PROGRAM USES - OPERATING
9-2

PUBLIC WORKS DEPARTMENTSUMMARY
2017-18 2018-19 2019-20Adopted Estimated
Actual Budget Actual BudgetACCOUNT TYPE
Salaries & Wages 7,893,215 9,200,446 8,832,287 9,115,552Payroll Expenses & Benefits 3,344,454 4,111,341 3,795,439 4,238,376Materials & Supplies 3,216,562 3,988,962 3,503,676 4,104,130Utilities & Other Contracted Services 14,494,586 14,673,890 15,238,747 16,132,307Claims/Insurance/Fund Transfers 5,092,396 4,153,919 4,568,357 4,073,011Debt Service 13,340,727 16,696,044 15,902,089 16,190,655Operating Capital Outlay 7,811,719 4,834,000 4,825,747 5,892,000Public Improvements 18,118,551 45,403,828 28,938,759 41,290,883
73,312,210 103,062,430 85,605,101 101,036,914USES BY OPERATING PROGRAM
Public Works Administration 2,626,021 1,540,216 1,494,337 1,299,076Engineering 758,847 992,115 876,333 1,007,086MPO 304,134 286,830 298,488 297,200Street Enhancement Use Tax 4,593,760 3,700,000 3,700,000 5,400,000Streets & Sewer Administration and Support 1,912,991 2,070,571 1,801,618 1,967,767Streets Maintenance 8,405,407 7,707,781 7,683,604 7,537,653Parking Operations 357,451 492,022 389,952 412,034Sewer & Stormwater Collection System Mtce 2,269,597 2,509,197 2,423,163 2,600,618WP Plant Administration and Operations 24,657,408 28,742,687 27,952,833 28,205,245Mass Transit 5,845,073 6,003,189 6,290,212 7,080,767St. Joseph Rosecrans Airport 763,912 755,944 758,050 683,405Landfill & Recycling 2,699,058 2,858,052 2,997,753 3,255,180
55,193,659 57,658,602 56,666,342 59,746,031ENTERPRISE FUNDS CIP PROGRAM
Water Protection 10,116,067 28,796,373 11,361,149 20,601,031Transit 4,337,729 7,910,000 7,910,000 8,755,000Parking 373,495 272,455 272,455 253,852Airport 3,003,321 7,200,000 7,230,750 9,842,000Landfill 287,940 1,225,000 2,164,405 1,839,000
18,118,551 45,403,828 28,938,759 41,290,883TOTAL PUBLIC WORKS BUDGET: 73,312,210 103,062,430 85,605,101 101,036,914
FUNDING SOURCESGeneral Fund 28,314,303 53,993,559 37,109,534 51,262,012Gaming Fund 0 0 0 0Capital Projects Fund 0 0 0 0Streets Maintenance Fund 8,405,407 7,707,781 7,683,604 7,537,653Water Protection Fund 26,927,005 31,251,884 30,375,996 30,805,864Mass Transit Fund 5,845,073 6,003,189 6,290,212 7,080,767Airport Fund 763,912 755,944 758,050 683,405Landfill Fund 2,699,058 2,858,052 2,997,753 3,255,180Parking Fund 357,451 492,022 389,952 412,034
73,312,210 103,062,430 85,605,101 101,036,914STAFFING SUMMARY (Full Time)
Public Works Administration 4.0 4.0 4.0 3.0MPO (1 position grant funded) 2.0 2.0 2.0 2.0Engineering 10.0 10.0 10.0 10.0Street & Sewer Administration & Support 16.0 16.0 16.0 16.0Streets & Traffic Maintenance 60.0 60.0 60.0 58.0Parking Operations 5.5 5.5 5.5 5.5Sewer Collection System Maintenance 25.0 25.0 25.0 25.0WP Administration 3.0 3.0 3.0 3.0WP Plant 48.5 48.5 48.5 48.0Laboratory 10.0 10.0 10.0 10.0Airport 6.0 6.0 6.0 6.0Landfill 19.0 19.0 19.0 20.0Recycling 2.0 2.0 2.0 2.0
211.0 211.0 211.0 208.5
9-3

PUBLIC WORKS ADMINISTRATION,ENGINEERING, MPO
Director, Public Works & Transportation
Assistant Director of Public Works
Transportation Planner City Engineer
Civil Engineer (3)
Estimator/Spec Writer
Engineering Technician (3)
Associate Engineering Technician
Engineering Clerk (PT)
[MASS TRANSIT MANAGED THROUGH
CONTRACT BY OUTSIDE COMPANY]
Executive Secretary
9-4

• Oversee department activities related to meeting City Council goals and City Manager priorities.• Promote best practices and effective technology to improve safe travel and encourage convenient and accessible
modes of transportation.• Provide administrative services and management oversite for Public Works and Transportation divisions and programs.
• Work with external regulatory bodies in developing thorough plans in order to meet local, state and national mandatesconcerning public health and safety in all areas under the responsibility of the department.
• Pursue and monitor grants for both operations and capital projects.• Coordinate capital projects monitoring and reporting.
• Comply with the City's long term CSO plan by completing mandated projects at the Wastewater Treatment Facility.
• Manage debt financing for wastewater projects, including state revolving fund and revenue bonds.• Apply budgeting constraints to prioritize core services.• Enhance operations with a focus on customer service, procurement, training, and communications.
• While the Use Tax revenue has allowed the expansion of the street maintenance program, staff is still only 60% towardsthe goal of a fully funded street overlay program.
• Continued modernization and environmental enhancements of the wastewater system while recognizing the financialchallenges faced by sewer customers.
• Continued communication of progress being made in street maintenance activities and on construction projects,including more use of social media.
• Develop policies and funding strategies to address concrete streets, curb and sidewalk maintenance, as well as toassist with challenges in the private storm drainage network.
• Asset management system implementation.• Support sewer revenue bond activities to obtain additional bond authority from the voters as necessary to comply with
the Combined Sewer Long Term Control Plan's requirements under the Clean Water Act.
• Dollar amount of operating grants received: $16,523,034.51• Dollar amount of capital project grants procured: $18,059,966.84• Number of on-going capital projects monitored: 47• Number of new capital projects that will start in FY-20
Public Works Administration
Mission
Core Services
Current Year Activity/Achievements
Budget Challenges/Planned Initiatives
To improve the City's basic infrastructure and services (streets, traffic control, bridges, curbs and gutters, sidewalks,wastewater utilities, mass transit, aviation, landfill and other public facilities) in order to support economic vitality and toprovide a safe environment within which our citizens live, work, and play.
Performance Statistics
9-5

Public Works Department
PUBLIC WORKS ADMINISTRATIONProgram 8360
Program Description
2017-18 2018-19 2019-20Adopted Estimated
Staffing Detail Actual Budget Actual BudgetDirector Public Works & Transportation 1 1 1 1Asst Director Pub Works & Transp 1 1 1 1Capital Projects Coordinator 1 1 1 0Executive Secretary 1 1 1 1
4 4 4 3
Operating Budget Summary
2017-18 2018-19 2019-20Adopted Estimated
Actual Budget Actual BudgetExpenditures:Salaries & Wages 295,707 284,573 288,162 97,244Employee Benefits 94,776 102,818 103,670 85,266Materials & Supplies 3,785 3,400 3,400 (44,470)Utilities & Contracts 116,482 16,425 8,105 28,035Debt-Princ 0 0 0 0Debt - Interest 0 0 0 0Interfund Transfers 2,115,270 1,133,000 1,091,000 1,133,000
Total 2,626,021 1,540,216 1,494,337 1,299,076Revenue Sources:Sales Tax 5,751,340 5,711,000 5,711,000 5,711,000Motor Vehicle Tax 1,055,291 980,000 980,000 1,020,000Permits 29,105 18,000 18,000 18,000Parking Fees 1,225 1,000 1,000 1,000Other Revenues 6,092 9,000 43,506 43,506Interfund Transfers 105,956 1,115 1,115 34,998General Fund (4,322,988) (5,179,899) (5,260,284) (5,529,428)
Total 2,626,021 1,540,216 1,494,337 1,299,076
Salaries & Wages
7%Employee Benefits
6%
Utilities & Contracts
2%
Interfund Transfers
82%
Expenditures by Type
Sales Tax84%
Motor Vehicle
Tax15%
Interfund Transfers
0%
Revenue Sources by Type
The Public Works Director and staff provide administrative services and management oversight for Public Works andTransportation divisions and programs with an emphasis on thorough planning consistent with the health, safety andeconomic needs of the public and goals of the City Council.
9-6

• Coordinate the development of the Unified Planning Work Program to define the major administrative, planning and technical work elements for the upcoming year.
• Address multi modal transportation developments related to funding and program requirements.• Monitor the Metropolitan Transportation Plan and the Transportation Improvement Program.• Update the MTP every five years, currently year 3.• Maintain a four-year TIP plan and update amendments as needed.• Address work elements such as revising/updating the transportation micro-model: performing demographic analysis,
performing special transportation-related studies.
• Conduct bicycle & pedestrian counts for the National Bicycle and Pedestrian Documentation Projectp g y, • Produce a new 2020-2023 Transportation Improvement Program.• Produce an updated Non-Motorized plan.
• Integrating new initiative including Active and Healthy Living into the planning process will be an area of focus.g p , p g • Considerable effort will be made obtaining public input on short, medium and long term transportation issues.• Implement a Safety and Innovation Lab and keep up to date• Coordinate Transit Working Group, Freight Committee, Bike and Ped Committee, and the Safety Committee
• Number of Technical & Policy Board Meetings conducted - 12• Amount of FHWA & FTA funding received - approximately $230,978 for this year
Metropolitan Planning Organization (MPO)
MissionTo conduct multi-modal transportation planning throughout the urbanized area of St. Joseph, Missouri and Elwood, Kansas (Counties of Buchanan, Andrew & Doniphan, Cities of Elwood, Wathena, St Joseph, Village of Country Club & Savannah)
Performance Statistics
Core Services
Current Year Activity/Achievements
Budget Challenges/Planned Initiatives
9-7
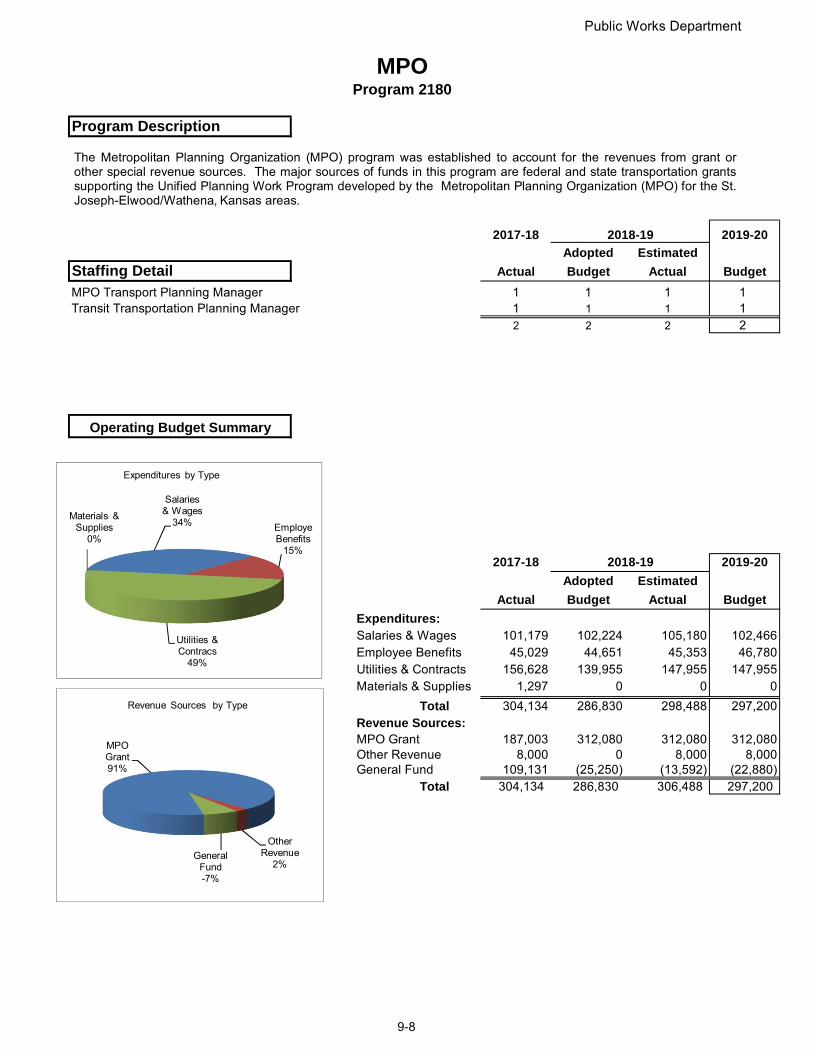
Public Works Department
MPOProgram 2180
Program Description
2017-18 2018-19 2019-20Adopted Estimated
Staffing Detail Actual Budget Actual BudgetMPO Transport Planning Manager 1 1 1 1Transit Transportation Planning Manager 1 1 1 1
2 2 2 2
Operating Budget Summary
2017-18 2018-19 2019-20Adopted Estimated
Actual Budget Actual BudgetExpenditures:Salaries & Wages 101,179 102,224 105,180 102,466Employee Benefits 45,029 44,651 45,353 46,780Utilities & Contracts 156,628 139,955 147,955 147,955Materials & Supplies 1,297 0 0 0
Total 304,134 286,830 298,488 297,200Revenue Sources:MPO Grant 187,003 312,080 312,080 312,080Other Revenue 8,000 0 8,000 8,000General Fund 109,131 (25,250) (13,592) (22,880)
Total 304,134 286,830 306,488 297,200
Salaries & Wages
34% Employe Benefits
15%
Utilities & Contracs
49%
Materials & Supplies
0%
Expenditures by Type
MPO Grant91%
Other Revenue
2%General
Fund-7%
Revenue Sources by Type
The Metropolitan Planning Organization (MPO) program was established to account for the revenues from grant orother special revenue sources. The major sources of funds in this program are federal and state transportation grantssupporting the Unified Planning Work Program developed by the Metropolitan Planning Organization (MPO) for the St.Joseph-Elwood/Wathena, Kansas areas.
9-8

STREET ENHANCEMENT USE TAXProgram 2185
Program Description
2017-18 2018-19 2019-20Adopted Estimated
Staffing Detail Actual Budget Actual Budget
N/A
Operating Budget Summary
2017-18 2018-19 2019-20Adopted Estimated
Actual Budget Actual BudgetExpenditures:Capital Improvements 4,593,760 3,700,000 3,700,000 5,400,000
Total 4,593,760 3,700,000 3,700,000 5,400,000Revenue Sources:City Use Tax 3,888,914 4,305,100 4,305,100 4,510,000Interest 47,787 0 88,940 90,000Approp fund 0 0 800,000 0General Fund 657,058 (605,100) (694,040) 800,000
Total 4,593,760 3,700,000 4,500,000 5,400,000
Capital Improveme
nts100%
Expenditures by Type
City Use Tax
100%
Revenue Sources by Type
In April 2015 voters approved a local use tax on out-of-state purchases for a period of 10 years. The rate of the tax isequal to the local sales tax at any given time, currently 2.875%. Proceeds are being used to preserve the existinggeneral fund revenues and, in this program, to provide revenues for streets maintenance activities and projects.
9-9
• Manage all aspects of construction projects from inception through warranty period.• Provide design services for most small and medium sized projects.• Provide construction observation services for in-house design projects.• Provide plan reviews for all development projects to ensure compliance with City codes.• Assist Citizens and contractors with information and guidance related to city infrastructure, rights-of-way and other
public works facilities and codes.• Involve public project owner throughout entire project process.• Review and issue floodplain development permits.
Review and approve utility extension and replacement permits.
• 2015 Urban Trail - Riverside, Phase 2 construction• Patee Trail Phase 2 Design (Construction Summer 2019)• Completed 2018 Resurfacing program• Completed 2018 Concrete Street Repairs• Missouri Theater facade improvements• Fire Stations #9 & #11 facility construction oversight• City standby power - City Hall generator• Oversight of numerous transit projects (Admin, roof, solar light bus stops, bus wash, bus lube system, etc...)• Alan Dewey obtained his Certified Floodplain Manager Credentials
• Control CIP project designs to remain within funding limits.• Managing several multi-million dollar wastewater projects with existing staff levels.• Expanding Support Services & Project Oversight to other departments
• Number of formal construction contracts developed - 17• Number of Developer Plans reviewed - 105+
Engineering
MissionProvide services to all departments to help ensure quality project delivery for capital improvements and major maintenanceprojects.
Performance Statistics
Core Services
Current Year Activity/Achievements
Budget Challenges/Planned Initiatives
9-10

Public Works Department
ENGINEERINGProgram 8500
Program Description
2017-18 2018-19 2019-20Adopted Estimated
Staffing Detail Actual Budget Actual BudgetCity Engineer 1 1 1 1Assist. City Engineer 1 1 1 1Senior Project Manager 2 2 2 2Project Manager 5 5 5 5Administrative Aide 1 1 1 1
10 10 10 10
Major Budgetary Changes & Program Highlights
Operating Budget Summary
2017-18 2018-19 2019-20Adopted Estimated
Actual Budget Actual BudgetExpenditures:Salaries & Wages 501,109 615,819 558,439 625,901Employee Benefits 175,119 249,676 219,140 253,455Materials & Supplies 12,375 32,190 23,524 12,400Utilities & Contracts 64,444 69,430 75,230 115,330Outside Service 5,800 25,000 0 0Transfer 0 0 0 0
Total 758,847 992,115 876,333 1,007,086Revenue Sources:Charges for Services 0 10,000 10,000 10,000General Fund 758,847 982,115 866,333 997,086
Total 758,847 992,115 876,333 1,007,086
Salaries & Wages
62%
Employee Benefits
25%
Materials & Supplies
1%
Utilities & Contracts
12%
Expenditures by Type
Charges for
Services1%
General Fund99%
Revenue Sources by Type
Provides planning, design, inspection, survey, testing, construction management and related services for work oncapital improvement and maintenance projects for all City divisions and departments so that the projects are cost-effective and adhere to national/local design, construction, maintenance and safety standards.
.
9-11

S/S MAINTENANCE ADMIN, PW COMMUNICATIONS, EQUIPMENT SUPPORT
Director, Public Works
Assistant Director of Public Works
Superintendent Streets & Sewer
AssistSuperintendent Streets/Sewer
SIMR Administrative Technician
Maintenance Technician
Custodian
Dispatcher/Clerk (4) Chief Master Mechanic
Master Mechanic
Senior Auto Mechanic (2)
Auto Mechanic
Auto Service Technician
Automotive Storeroom Clerk
9-12

• 24 hour, 7 day per week answering and dispatching service for street and sewer maintenance, emergencies,complaints, and inquiries.
• Clerical, data entry, security monitoring and fuel dispensing services to Public Works' divisions.• Routine maintenance and emergency repairs for all street, sewer, engineering, traffic, public parking vehicles and
equipment following a prioritized preventive maintenance and repair program for the delivery of services• Dispenses fuel to several City Departments• Maintain the Street Rating Management System• Supervise and coordinate activities of the above divisions• Thorough inspection of all equipment brought in for repair• Multi-point preventative maintenance program• MO ONE CALL Locates
• Completed upgrades to Traffic building• Implemented salt brine program for snow removal• Implementing Cartegraph asset management system• Begin upgrade to storage building where Jetrod and flusher can be kept without winterization for emergency needs
during cold months; will also act as storage area for cold sensitive materials used for street repair• Fully implemented new digital radio system upgrade
• Reducing redundancies in parts inventory• Complete upgrade of storage building• Begin administration of sidewalk repair program at Street Division
• Dispensed 84,579 gallons of unleaded fuel and 60,073 gallons of diesel fuel; to date, $378,163.76 since July 1, 2018
• Processed over 4.000 locate requests• Performed 264 PM inspections/Oil Changes• Replaced 33 batteries• Replaced or repaired 126 tires• Performed 28 Motor Vehicle inspections
Streets/Sewer Maintenance SupportSTREETS/SEWER ADMINISTRATION, COMMUNICATIONS, EQUIPMENT SUPPORT
Mission
Performance Statistics
To provide administrative and management support for the efficient operation of all street maintenance, public parking,traffic, and sewer maintenance programs.
Core Services
Current Year Activity/Achievements
Budget Challenges/Planned Initiatives
9-13

Public Works Department
STREET/SEWER MAINTENANCE ADMINISTRATIONProgram 8510
Program Description
2017-18 2018-19 2019-20Adopted Estimated
Staffing Detail Actual Budget Actual BudgetSuperintendent Streets/Sewer Maintenance 1 1 1 1Asst Supt Streets/Sewer Maintenance 1 1 1 1SIMR Administrative Technician 1 1 1 1Maintenance Technician 1 1 1 1Custodian 1 1 1 1
5 5 5 5
Operating Budget Summary
2017-18 2018-19 2019-20Adopted Estimated
Actual Budget Actual BudgetExpenditures:Salaries & Wages 248,624 292,977 253,072 241,783Employee Benefits 102,498 124,758 104,510 109,170Materials & Supplies 44,686 44,100 44,100 45,100Contracts 93,181 80,425 80,425 80,225Utilities 138,119 59,000 44,868 45,700
Total 627,107 601,260 526,975 521,978
Revenue Sources:Charges for Service 500 0 0 0General Fund 626,607 601,260 526,975 521,978
Total 627,107 601,260 526,975 521,978
Salaries & Wages
46%Employee Benefits
21%
Materials & Supplies
9%
Contracts15% Utilities
9%
Expenditures by Type
General Fund100%
Revenue Sources by Type
Staff provides administrative and management support for the efficient operation of all street maintenance, public parking, traffic and sewer maintenance programs.
9-14

Public Works Department
PUBLIC WORKS COMMUNICATIONSProgram 8520
Program Description
2017-18 2018-19 2019-20Adopted Estimated
Staffing Detail Actual Budget Actual BudgetDispatch/Clerks 4 4 4 4
Operating Budget Summary
2017-18 2018-19 2019-20Adopted Estimated
Actual Budget Actual BudgetExpenditures:Salaries & Wages 128,600 156,327 133,272 164,680Employee Benefits 58,027 63,124 57,652 77,821Capital 203,500 0 0 0Utilities & Contracts 38,450 63,880 63,880 38,880
Total 428,576 283,331 254,805 281,381
Revenue Sources:General Fund 428,576 283,331 254,805 281,381
Total 428,576 283,331 254,805 281,381
Salaries & Wages
58%
Employee Benefits
28%
Capital 0%
Utilities & Contracts
14%
Expenditures by Type
General Fund100%
Revenue Sources by Type
This division provides 24 hour, 7 day per week answering and dispatching service for street and sewer maintenance,emergencies, complaints and inquiries. Staff also provide communications support for the Health department on holidays,evenings, and weekends; dispense fuel to City vehicles; provide visual surveillance throughout the City Yards using asecurity monitoring system; and provide clerical and data entry services for the Street Maintenance Administration.
9-15

Public Works Department
EQUIPMENT SUPPORTProgram 8530
Program Description
2017-18 2018-19 2019-20Adopted Estimated
Staffing Detail Actual Budget Actual BudgetChief Master Mechanic 1 1 1 1Master Mechanic 1 1 1 1Senior Auto Mechanic 2 2 2 2Auto Mechanic 2 2 2 2Inventory Supply Technician 1 1 1 1
7 7 7 7
Operating Budget Summary
2017-18 2018-19 2019-20Adopted Estimated
Actual Budget Actual BudgetExpenditures:Salaries & Wages 236,446 264,084 231,950 294,437Employee Benefits 107,740 118,416 102,365 141,490Materials & Supplies 171,648 316,380 198,423 278,880Utilities & Contracts 341,473 487,100 487,100 449,600
Total 857,307 1,185,980 1,019,838 1,164,408
Revenue Sources:Operating Grant 0 0 0 0Other Revenue 574 2,300 2,300 2,300General Fund 856,733 1,183,680 1,017,538 1,162,108
Total 857,307 1,185,980 1,019,838 1,164,408
Salaries & Wages
25%
Employee Benefits
12%Materials &
Supplies24%
Utilities & Contracts
39%
Expenditures by Type
General Fund100%
Revenue Sources by Type
Staff provide a well-maintained fleet for all street, sewer, engineering, traffic and public parking vehicles and equipment through annual safety inspections, preventative maintenance work, and on-site repairs when necessary.
9-16

STREETS MAINTENANCE, SEWER MAINTENANCE, TRAFFIC
Superintendent Strts/Swr Mnt
Assistant Superintendent S/S
Mnt
Senior Field Supervisor Traffic Supervisor
Project Facilitator Utility Cut Inspector Field Supervisor
Senior Work Leader (2)
Work Leader
Equipment Operator 4 (3)
Equipment Operator 3 (3)
Equipment Operator 2 (13)
Equipment Operator 1 (18)
Laborer (3)
Signal Repair Technician (2)
Senior Work Leader (2)
Equipment Operator 2
Equipment Operator 1 (2)
Sewer Maintenance Supervisor
Senior Work Leader
Work Leader TV Sewer Technician Auto Mechanic
Equipment Operator 3 (5)
Equipment Operator 2 (2)
Equipment Operator 1 (3)
Laborer (7)
Senior Account Clerk
Utility Locator
Utility Locator Technician
9-17

• Maintenance & repair of city streets through asphalt overlay, slurry seal program, concrete repair and replacement• Curb & gutter work• Maintenance of public alleys by citizen request• Patching of paved alleys as time allows if owner purchases material and less than 20% of alley needs patched• Oversee utility cut repairs in public right of way• Regularly scheduled street sweeping• Regularly scheduled mowing program along certain city street right-of-ways• Provide navigable streets as soon as possible following a snow storm, ice event or clean-up after a wind storm• During floods we fill & place sandbags, fill gaps in levees, close streets and other necessary work as needed
• Continued development of an improved secondary snow route system• Changes to existing streets due to the Blacksnake project• Completed two major drainage projects; one at Hampton and Newport and one on South 42nd Street• Through combined City forces/contractor arrangement, repaired several areas in CBD in preparation for overlay
program
• Keeping up to date on newer and better methods for street repairs• Keeping close eye on expenditures (due to rising costs for materials) to ensure maintenance goals are met• Staffing shortages due to compensation• Adequate funding for capital equipment purchases
• Composite rating for City streets: 85• Miles of streets slurry sealed: 17.45• Miles of 3"� asphalt streets resurfaced: 32 centerline miles, 88 lane miles• Tons of asphalt used patching potholes: 295• Number of potholes patched: 8,000 +• Miles of street swept: 1,140• Number of locations mowed in ROW: 62• Number of inches snow/freezing precipitation received: 18.13• Total cost: $ 381,300.43• Cost per inch of snow/freezing precipitation: $ 21,037.26
Streets MaintenanceSTREETS MAINTENANCE/SNOW & ICE CONTROL
MissionEnsure public safety and enhance economic development through timely, cost effective preventive maintenance andrepair to all public streets & bridges and to storm drainage systems within the City's right-of-way.
Core Services
Current Year Activity/Achievements
Budget Challenges/Planned Initiatives
Performance Statistics
9-18

Public Works Department
STREET MAINTENANCEPrograms 1210 &
1211Program Description
2017-18 2018-19 2019-20Adopted Estimated
Staffing Detail Actual Budget Actual BudgetSenior Field Supervisor 1 1 1 1Field Supervisor 1 1 1 1Senior Work Leader 6 6 6 6Utility Cut Inspector 0 0 0 0Project Facilitator 1 1 1 1Equipment Operator 4 1 1 1 1Equipment Operator 3 5 5 5 5Equipment Operator 2 10 10 10 10Equipment Operator 1 20 20 20 18Dispatch/Clerk 1 1 1 1
Administrative Aide 2 2 2 2
Laborer 4 4 4 4
52 52 52 50
Operating Budget Summary
2017-18 2018-19 2019-20Adopted Estimated
Actual Budget Actual BudgetExpenditures:Salaries & Wages 1,613,330 1,936,341 1,874,433 1,896,747Employee Benefits 697,856 925,963 846,256 866,659Materials & Supplies 783,261 883,100 883,100 1,049,100Contracts 574,988 627,390 626,890 650,995Outside Services 1,522,992 1,325,000 1,493,498 1,493,500Transfers 31,000 32,000 32,000 42,000Capital Outlay 534,333 183,000 130,000 92,000Public Improvements 1,548,529 564,000 564,000 200,000
Total 7,306,289 6,476,794 6,450,177 6,291,001Revenue Sources:State Fuel Taxes 2,768,885 2,765,740 2,765,740 2,765,740Misc Grants 0 0 0 0Street Cuts 259,493 250,000 250,000 250,000Interest 16,195 450 24,569 24,570Principal 6,700 6,750 6,750 6,750Other Rev 55,483 42,000 42,000 57,000Interfund Trfer 2,498,398 1,286,000 1,209,000 1,233,000Fund Balance 1,701,134 2,125,854 2,152,118 1,953,941
Total 7,306,289 6,476,794 6,450,177 6,291,001
Salaries & Wages
30%
Employee Benefits
14%
Materials & Supplies
17%
Contracts10%
Utilities24%
Capital Outlay
1%
Public Improve
9%
Expenditures by Type
State Fuel Taxes89%
Misc Grants
0%Street Cuts8%
Revenue Sources by Type
The division ensures the public's health and safety and promotes economic development by providing timely, costeffective preventative maintenance and repair to all public streets, bridges, and storm drainage systems within Cityowned right-of-way. Staff also assist with maintenance of public alleys; perform street sweeping; and oversee utilityexcavation repair.
9-19

• Maintain, repair and install the traffic control devices throughout the City, including traffic, fire, pedestrian and schoolsignals, weather stations, traffic signs and on and off-street pavement markings
• Provide annual traffic signal preventive maintenance programs• Serve as an emergency response crew for snow/thunder/wind storms, floods, fires and other emergencies• Serve as an on-call service repairman• Perform traffic counts and data collection as required• Do visual checks and measurements for handicaps & dumpsters• Research traffic needs• Provide field safety inspections• Coordinate road closures
• Continuing major sign replacement program in order to comply with new sign reflectivity standards• As part of a long-term replacement program, over 1,428 high-intensity stop signs have been installed to date• Traffic data collection in several different areas• Began replacing intersection paint markings with thermoplastic markings (stop bars, arrows, crosswalks)
• Keep replacing signs that do not comply with the MUTCD as the budget will allow• Paint over 400 lane miles of pavement markings plus all pedestrian and stop bars• Help the airport and park departments with their pavement markings• Inventory of all signs throughout the city• Special events severely strain our budget resources• More Traffic signs are being made in-house, although cheaper than purchasing ready-made signs, the cost of
materials is rising
• Two (2) Cabinet & Controller sets were upgraded• Preventive Maintenance on traffic signal devices at 25 locations• 6 new signal heads installed due to �knock downs• Tested Conflict Monitors in 64 intersections• Number of pavement markings lane miles 413 lane miles. (2935 Gallons of Paint)• 215 pedestrian crossings and 202 stop bars painted• Painted 6 City owned parking lots
Traffic
MissionThe mission of the Traffic Division is to protect the safety of vehicular and pedestrian traffic in accordance with theMUTCD.
Budget Challenges/Planned Initiatives
Current Year Activity/Achievements
Core Services
Performance Statistics
9-20

Public Works Department
TRAFFIC Program 2110 &
2111
Program Description
2017-18 2018-19 2019-20Adopted Estimated
Staffing Detail Actual Budget Actual BudgetTraffic Supervisor 1 1 1 1Senior Work Leader 3 2 2 2Signal Repair Technician 1 2 2 2Equipment Operator II 1 1 1 1Equipment Operator I 2 2 2 2
8 8 8 8
Operating Budget Summary
2017-18 2018-19 2019-20Adopted Estimated
Actual Budget Actual BudgetExpenditures:Salaries & Wages 327,477 336,980 341,138 340,659Employee Benefits 142,610 157,555 158,542 166,442Materials & Supplies 88,392 105,000 103,317 106,000Outside Services 120,795 126,150 117,650 126,150Utilites 47,838 46,000 48,080 48,100Capital Outlay 0 0 0 0
Total 727,111 771,685 768,727 787,351
Revenue Sources:Other Rev 4,332 0 0 0Street Mnt Fund 722,779 771,685 768,727 787,351
Total 727,111 771,685 768,727 787,351
Salaries & Wages
43%Employee Benefits
21%
Materials & Supplies
14%
Outside Services
16%
Utilities6%
Expenditures by Type
Other Rev0%
Street Mnt Fund100%
Revenue Sources by Type
Division staff maintain, repair and install the traffic control devices throughout the City, including traffic, fire, pedestrianand school signals, weather stations, traffic signs and on and off-street pavement markings in order to protect thesafety of vehicular and pedestrian traffic. Staff also research traffic needs, provide field safety inspections andcoordinate road closures.
9-21

Public Works Department
SNOW & ICE CONTROLProgram 2150
Program Description
2017-18 2018-19 2019-20Adopted Estimated
Staffing Detail Actual Budget Actual Budget
N/A
Operating Budget Summary
2017-18 2018-19 2019-20Adopted Estimated
Actual Budget Actual BudgetExpenditures:Materials & Supplies 252,288 448,300 452,600 448,300Utilities & Contracts 8,869 11,000 11,000 11,000Capital Outlay 110,849 0 1,100 0
Total 372,006 459,300 464,700 459,300Revenue Sources:Other Rev 0 0 0 0Streets Mnt Fund 372,006 459,300 464,700 459,300
Total 372,006 459,300 464,700 459,300
Materials & Supplies
98%
Utilities & Contracts
2%
Expenditures by Type
Streets Mnt Fund100%
Revenue Sources by Type
This program tracks and manages the materials and purchases associated with the yearly expenses of snow and ice control.
9-22

• Routine preventive maintenance of the sewer collection system including, but not limited to, inspection and cleaning• Closed circuit television inspections (CCTV) of the sewer system• Implement the response strategy for the Capacity, Management, Operation and Maintenance (CMOM) requirements of
the Clean Water Act• Document and report on all sewer maintenance management, operations and maintenance activities to the MDNR on
behalf of the EPA• Respond to reports of blocked sewer lines and/or backups• Clean and repair manholes and storm sewer inlets• Update the sewer facilities shown on the City GIS system
• Working on the multi-year sewer district cleaning program; have started another run through• Have completed a number of pre-acceptance CCTV inspections of new sewers• Currently implementing Cartagraph as the new asset management system• Continued working with Utility Support Services by dye testing indicated properties in order to verify sewer connections
• Implementing new GIS-centric CCTV Inspection software
• Keep up with ever changing state and federal rules and regulations• Keep up with needed sewer and inlet repairs• Working towards facility relocation• Staffing shortages due to compensation• Initiate a voluntary collections system licensing program for employees
• Total miles of sanitary sewer line: 409.06• Length of lines cleaned: 144,011 ft. or 27 miles• Length of sewer line inspected w/closed circuit TV: 36,098 ft. or 7 miles• Number of inlets repaired/replaced: 85• Number of inlets cleaned: 560• Number of dye tests performed: 44• Number of cave-ins repaired: 12 by City crews, 24 by contractors
Sewer Collection System Maintenance
MissionThe mission of the Sewer Collection System Maintenance Division is to protect public health and the system's physicalassets by maintaining the physical integrity of the wastewater and combined sewer collection system.
Current Year Activity/Achievements
Budget Challenges/Planned Initiatives
Core Services
Performance Statistics
9-23

Public Works Department
SEWER MAINTENANCEProgram 6430
Program Description
2017-18 2018-19 2019-20Adopted Estimated
Staffing Detail Actual Budget Actual BudgetSewer Maintenance Supervisor 1 1 1 1Senor Work Leader 2 2 2 2Utility Locator 1 1 1 1Work Leader 1 1 1 1Utility Locator Technician 1 1 1 1Equipment Operator IV 1 1 1 1Equipment Operator III 4 4 4 4Equipment Operator II 3 3 3 3Senior Account Clerk 1 1 1 1Equipment Operator I 5 5 5 5Senior Auto Machanic 1 1 1 1Sewer Maintenance Laborer 4 4 4 4
25 25 25 25
Operating Budget Summary 2017-18 2018-19 2019-20
Adopted EstimatedActual Budget Actual Budget
Expenditures:Salaries & Wages 889,534 987,921 957,387 1,022,634Employee Benefits 395,438 465,515 417,668 488,993Materials & Supplies 96,901 113,100 105,447 129,600Utilities & Contracts 583,030 942,661 942,661 959,391Insurance & Other 0 0 0 0Capital Equipment 304,694 0 0 0Public Improvements 0 0 0 0
Total 2,269,597 2,509,197 2,423,163 2,600,618Revenue Sources:Other Grants 0 0 0 0Other Rev 62,517 0 0 0Transfers 3,250 3,250 3,250 3,250Sewer Charges 2,203,830 2,505,947 2,419,913 2,597,368
Total 2,269,597 2,509,197 2,423,163 2,600,618
Salaries & Wages
39%Employee Benefits
19%
Materials & Supplies
5%
Utilities & Contracts
37%
Expenditures by Type
Staff maintain the physical integrity of the system. To avoid system breaks, spills, etc., crews inspect, clean, maintain, andrepair the wastewater and storm sewer collection system. This includes all City sewers, manholes, and storm sewer inletslocated outside the water protection plant.
9-24

ROSECRANS MUNICIPAL AIRPORT
Director of Public Works
Assistant PW Director
Airport General Manager
Airport Operations Manager
Airport Maintenance Specialist (3)
Secretary
9-25

• Maintain all airport pavement and safety area surfaces, lighting and markings• Provide required FAA airport maintenance and operations such as grass mowing, snow removal and wildlife conditions
• Meet/exceed compliance requirements evaluated during annual FAA Part 139 Airfield Safety Inspection• Manage land/property leases with tenants to resolve any deficiencies and monitor compliance• Maintain current airfield preventative maintenance program/forecast for future airfield pvmt prog• Implement airport security measures necessary to ensure airport safety and to satisfy FAA• Provide affordable aircraft hangar rental space for private/commercial aircraft at fair mkt value• Inspect supplies fueling equipment/vehicles for FAA compliance• Maintain operational joint use areas as contracted in Airport Joint Use Agmt with MoANG
• During annual FAA Part 139 Airfield Inspection, Rosecrans Airport received zero discrepancies, thereby receiving aMedal of Excellence
• Completed Wildlife Perimeter Fence Project• Complete hangar taxilane and apron pavement reconstruction projects• Record setting 2018 Air Show held August 25-26• Purchased Bobcat Skid Steer Loader to replace an existing 23 year old loader• Purchased new Crew Cab Truck to effectively/efficiently perform daily airfield tasks• EAA Young Eagles annual rallies to give STJ youth opportunity to explore aviation
• Ever increasing FAA requirements to maintain certification• Airshows great for community but added expense for several city departments• Aging buildings and equipment continue to increase frequency of repair time and costs• Replacement of several aging equipment and appliances• Partner with 139AW to accommodate Open Sky's Treaty• No further incoming revenue from FAA for facilities lease agreement
• Total Based Aircraft (2018): 61 (10-military; 51-general aviation, corporate, medical, agricultural• Total Aircraft Operations (2018 takeoff/landings): 14,157 compared to 2017 total of 17,891• Total Volume Aircraft Fuel Sales (2018): 217,307 gallons compared to 2017 total of 241,712• Hangar Occupancy: 34 existing T-hangars with 5 vacant
Current Year Activity/Achievements
Rosecrans Municipal Airport
MissionDedicated to providing safe aeronautical facilities and quality services to all general, corporate, commercial and militaryaviation operations of a progressive community.
Core Services
Budget Challenges/Planned Initiatives
Performance Statistics
9-26

Public Works Department
AIRPORT OPERATIONSProgram 1310
Program Description
2017-18 2018-19 2019-20Adopted Estimated
Staffing Detail Actual Budget Actual BudgetAirport Manager 1 1 1 1Airport Operations Manager 1 1 1 1Secretary 3 3 3 1Airport Maintenance Specialist 1 1 1 3
6 6 6 6
Operating Budget Summary
2017-18 2018-19 2019-20Adopted Estimated
Actual Budget Actual BudgetExpenditures:Salaries & Wages 295,678 304,846 306,708 304,830Employee Benefits 128,667 133,779 134,221 139,975Materials & Supplie 32,984 44,040 38,993 44,040Other Services 145,972 127,179 119,922 124,560Utilities 35,759 42,100 38,123 36,000Capital Outlay 120,852 100,000 116,083 30,000Capital Improvemen 0 0 0 0Transfers 0 0 0 0Transfers Network 4,000 4,000 4,000 4,000
Total 763,912 755,944 758,050 683,405Revenue Sources:Rents 548,849 403,772 403,772 403,385Other Revenues 85,241 26,780 26,780 26,780Interest Earnings 2,382 100 6,312 100General Fund 128,290 238,290 207,116 148,290Aviation Fund Balnc (850) 87,002 114,070 104,850
Total 763,912 755,944 758,050 683,405
To improve the economic climate of the airport and attract additional general aviation and commercial operations thisprogram oversees airport maintenance and operations. The program derives revenue through facility, hangar and landrents. Deficits are financed through transfers from the SIM&R Fund. Over the last five years, the airport has received over$5 million in capital improvement grants. Aviation is under the direction of Public Works & Transportation Department.
Salaries & Wages
45%
Employee Benefits
21%
Materials & Supplies
6%
Other Services
18%
Capital Outlay
4%
Transfers Network
1%
Expenditures by Type
Rents59%
Other Revenues
4%
General Fund22%
Aviation Fund Balnc
15%
Revenue Sources by Type
9-27

Public Works Department
AVIATION FUND IMPROVEMENT PROJECTSProgram 1290
PROGRAM DESCRIPTION
CAPITAL OUTLAY & PUBLIC IMPROVEMENTS
Capital Budget Summary
2017-18 2018-19 2019-20Adopted Estimated
Actual Budget Actual BudgetExpendituresOutside Services 366,468 250,000 259,400 250,000Capital Equipment 0 0 0 0Improvement Proj's 2,636,853 6,950,000 6,971,350 9,592,000
Total 3,003,321 7,200,000 7,230,750 9,842,000Revenue SourcesGrants 2,346,843 6,260,000 6,290,750 8,637,800Transfrs & Other 218,512 940,000 940,000 1,204,200Aviation CIP FB 437,967 0 0 0
Total 3,003,321 7,200,000 7,230,750 9,842,000
$0 $2,000,000 $4,000,000 $6,000,000 $8,000,000
FY2010
FY2012
FY2014
FY2016
FY2018
FY2020
1,241,2518,268,676
648,598116,372
514,798356,900
8,589,1781,944,324
3,003,321
7,230,750 10,092,000
Aviation Improvement Project Expenditures
The Airport Improvement Projects Program was established to track, monitor, and facilitate expenditure of theremaining funds for Aviation projects authorized by voters in the 1989 1/4 cent CIP Sales Tax Initiative. Manyprojects are now being completed for the future move of the Air National Guard unit to the north end of the Airportproperty. These projects are funded by the Guard. Federal Aviation grants and matching funds from BuchananCounty help fund other projects.
9-28

PARKING OPERATIONS
Director of Public Works
Superintendent Streets/Sewers
Mnt
Building Maintenance Technician
Parking Control Technician (2)
Parking Lot Attendant (2)
Parking Lot Attendant PT
(.56)
9-29

• Maintenance and repair of parking garages, surface lots, and on-street parking spaces• Maintain ticket dispensers and electronic gates• Enforce parking regulations• Ensure quality customer service to the downtown community• Staff collection booths at two parking garages
• Replaced wiring and conduit due to theft 6th Jules• Repaired west gate at 5th and Felix Parking Garage
• Lack of funding has resulted in the inability to make needed repairs to the facilities• Upgrade security features• Upgrade ticket spitters at 5th & Felix and 6th & Jules
Current Year Activity/Achievements
Public Parking Operations
MissionThe mission of the Public Parking Division is to provide safe, well maintained parking facilities for the public who work andshop in the Central Business District and South Side.
Core Services
Budget Challenges/Planned Initiatives
9-30

Public Works Department
PARKING MAINTENANCEProgram 1550
Program Description
2017-18 2018-19 2019-20Adopted Estimated
Staffing Detail Actual Budget Actual Budget
Work Leader 1 1 1 1Building Maintenance Technician 1 1 1 1Parking Control Technician 1 1 1 1Parking Lot Attendant 2 2 2 2Prkg Lot Attendant (PT) 4.5 hrs/day 0.5 0.5 0.5 0.5
5.5 5.5 5.5 5.5
Major Budgetary Changes & Program Highlights
Operating Budget Summary
2017-18 2018-19 2019-20Adopted Estimated
Actual Budget Actual BudgetExpenditures:Salaries & Wages 149,838 177,417 165,738 175,698Employee Benefits 66,804 82,715 79,943 88,447Materials & Supplies 6,079 9,200 7,389 8,200Utilities & Contracts 31,300 110,090 110,090 110,190Utilities 27,083 31,600 25,792 26,500Transfers 75,347 0 0 0Transfers Network 1,000 1,000 1,000 3,000Capital 0 0 0 0Capital Outlay 0 80,000 0 0
Total 357,451 492,022 389,952 412,034
Revenue Sources:City Sticker 100,753 97,500 97,500 98,900Fines 73,897 150,100 150,100 70,200Parking Fees 108,012 88,500 88,500 118,200Interest & Other 1,239 100 2,680 2,680Transfers 230 0 0 0Gaming/General Trsfr 6,500 153,500 73,500 73,500(To)/Frm Parking FB 66,821 2,322 (22,328) 48,554
Total 357,451 492,022 389,952 412,034
Salaries & Wages
43%Employee Benefits
21%Materials & Supplies
2%
Utilities & Contracts
27%
Utilities6%
Transfers0%
Expenditures by Type
City Sticker24%
Fines17%
Parking Fees29%
Transfers0% Gaming/Ge
neral Trsfr18%
(To)/Frm Parking FB
12%
Revenue Sources by Type
Parking staff provide safe, well maintained parking opportunities for the public who work and shop in the CentralBusiness District through the maintenance and repair of parking garages, surface lots, and on-street parking spaces.Staff maintain ticket dispensers and electronic gates; enforce traffic and parking regulations, and staff garagecollection booths.
9-31

Public Works Department
PARKING FUND IMPROVEMENT PROJECTSProgram 1230
PROGRAM DESCRIPTION
CAPITAL OUTLAY & PUBLIC IMPROVEMENTS
Capital Budget Summary
2017-18 2019-20Adopted Estimated
Actual Budget Actual BudgetExpendituresMaterials & Services 373,494.5 272,455 272,455 253,852Capital Outlay 0 0 0 0Improvement Projs 0 0 0 0
Total 373,495 272,455 272,455 253,852
Revenue SourcesGrants 0 0 0 0Transfers 373,274 272,455 272,455 253,852
Total 373,274 272,455 272,455 253,852
2018-19
$0 $500 $1,000 $1,500 $2,000 $2,500 $3,000 $3,500 $4,000 $4,500 $5,000 $5,500 $6,000
FY2011
FY2012
FY2013
FY2014
FY2015
FY2016
FY2017
FY2018
FY2019
FY2020
$744,000
$78,000
$33,000$5,000
$0
$21,000
$254
$373,495
$272,455
$253,852
Parking Improvement Project Expenditures
The Transit Improvement Program was established for project management and project cost reporting for major vehicle, facility,and other capital improvements and capital outlay primarily funded by the Federal Transit Administration (FTA).
9-32

WATER PROTECTION
Director of Public Works
Assistant PW Director
Superintendent of Water Prtctn
Operations Manager
Secretary
Plant Mntnce Supervisor
Senior Account Clerk
Laboratory Manager
Asst Plant Mntnce Supervisor
Environmental Services Supervisor
Senior Auto Mechanic (1)
Plant Maintenance Mechanic (12)
Master Maintenance Electrician (2)
Maintenance Technician (2)
Industrial Painter (1) Laboror (4)
Master Plant Operator (1) Lead Plant Operator (5)
Equipment Operator 3 (4)
Inventory Control Technician (1)
Electronics Technician (1)
Plant Operator (6)
Process Manager
Assistant Lab Manager
Lab Analysts (4)
Pump Station Collection Tech (2)
Assist. Envrn Srvcs Supervisor
Envrnmntl Srvcs Technician
Pretreatment Lab Technician
9-33

Public Works Department
• Provide comprehensive wastewater treatment services.• Comply with all guidelines set forth by the Environmental Protection Agency (EPA) and the Missouri Department of
Natural Resources (MDNR).• Comply with all discharge regulations set forth by the EPA, the MDNR and the National Pollutant Discharge.• Monitor compliance by Significant Industrial Users (SIU's) with regulatory agency effluent guidelines as well as with the
City's Pre-Treatment Ordinance.• Monitor discharge from the City's Wastewater Treatment Facility daily to ensure regulatory compliance.• Perform proactive major maintenance of significant process systems.• Monitor F.O.G. (Fats, Oils, & Grease) compliance from restaurants and other permitted contributors.• Administer the MS4 Storm Water Program.• Compile and report all required Reports to regulatory agencies.
• Continue to implement Phase 1 of the Long Term Control Plan for reducing Combined Sewer Overflows (CSO's).• Phase 1 is estimated to cost $150,000,000.00 over the 20 year period.• Continue Seasonal operation of the U.V. Wastewater Effluent Disinfection System.• Annual Cost of Service Study is progressing.
• Complete the construction of a new stormwater separation conduit for Blacksnake Creek.• Finish commissioning and begin day-to-day operation of the Biosolids Dryer.• Construct the Wastewater Package Treatment system at Rosecrans to comply with the Ammonia requirements.
• Average daily wastewater flow treated by the primary system will be down to 13.0 million gallons per day. This is a
further reduction of 1.5 million gallons per day due the separation of Blacksnake Creek out of the collection system.• Total primary plant capacity is 27 million gallons per day.• Total secondary plant capacity is 54 million gallons per day.• Number of pumping stations is 19.• Number of Notice of Violations issued against the City is Zero.
WATER PROTECTION ADMINISTRATION, WATER PROTECTION SERVICES, LABORATORY
MissionTo ensure that the public health is protected, the environment is not harmed, and this essential utility service is availableto encourage growth and economic vitality in our community.
Core Services
Current Year Activity/Achievements
Budget Challenges/Planned Initiatives
Performance Statistics
9-34

Public Works Department
WPC ADMINISTRATIONProgram 6310
Program Description
2017-18 2018-19 2019-20Adopted Estimated
Staffing Detail Actual Budget Actual BudgetWastewater Treatment Superintendent 1 1 1 1Assist. Super of WWT 1 1 1 1Secretary 1 1 1 1
3 3 3 3
Major Budgetary Changes & Program Highlights
Operating Budget Summary
2017-18 2018-19 2019-20Adopted Estimated
Actual Budget Actual BudgetExpenditures:Salaries & Wages 114,526 169,654 185,351 189,881Employee Benefits 52,964 79,391 81,094 88,072Materials & Supplies 14,518 8,400 8,400 14,000Outside Services 213,862 188,416 188,416 222,050Utilities 0 0 0 0Capital Outlay 0 0 0 0Capital Improvements 0 0 0 0Bad Debt 438,912 500,000 550,000 500,000Debt Serv-Princ 7,385,900 9,892,660 9,601,500 9,957,900Debt Serv-Interest 5,515,915 6,303,384 5,750,589 5,732,755Transfers 1,956,600 2,196,642 2,360,361 2,092,701Transfers Computer N 34,000 36,000 0 0
Total 15,727,197 19,374,547 18,725,712 18,797,359
Revenue Sources:Sewer Charges 31,822,752 30,530,500 31,490,745 31,926,496User Charges 271,200 0 (180,000) 0Other Revenue 678,665 523,727 431,339 388,727Prin Earnings 17,339 15,000 15,000 15,000Interest Earnings 414,005 100,000 715,261 470,750Sewer FB (17,476,765) (11,794,680) (13,746,633) (14,003,614)
Total 15,727,197 19,374,547 18,725,712 18,797,359
Salaries & Wages
37%
Employe Benefits
18%
Materials &
Supplies3%
Expenditures by Type
Sewer Charges
73%
Other Revenue
1%
Sewer FB-30%
Revenue Sources by Type
Provides administrative and management support for the sewer treatment plant, pumping stations, airport lagoonsystem and laboratory. Staff provide internal management duties, oversees regulatory compliance, monitorswastewater classes and licenses, and responds to regulatory inquiries to ensure environmental protection and toprotect public health.
9-35

Public Works Department
LABORATORYProgram 6350
Program Description
2017-18 2018-19 2019-20Adopted Estimated
Staffing Detail Actual Budget Actual BudgetLaboratory Super visor 1 1 1 1Technical Services Manager 1 1 1 1Assist. Envir. Service Suprvisor 2 2 2 2Stormwater quality Coord. 1 1 1 1Laboratory Analyst 4 4 4 4Environmental Compliance Technician 1 1 1 1
10 10 10 10Major Budgetary Changes & Program Highlights
Operating Budget Summary
2017-18 2018-19 2019-20Adopted Estimated
Actual Budget Actual BudgetExpenditures:Salaries & Wages 438,536 459,660 463,391 468,716Employee Benefits 192,327 193,234 198,152 213,839Materials & Supplies 121,243 61,372 61,372 110,000Outside Services 59,313 59,680 59,680 59,680Capital Outlay 24,003 0 0 0
Total 835,423 773,946 782,595 852,235
Revenue Sources:Sewer Charges 835,423 773,946 782,595 852,235
Total 835,423 773,946 782,595 852,235
Salaries & Wages
55%
Employee Benefits
25%
Materials & Supplies
13%Outside Services
7% Capital Outlay
0%
Expenditures by Type
Sewer Charges
100%
Revenue Sources by Type
The Laboratory monitors compliance with regulatory agencies such as MDMR, the EPA as well as the City's Pre-Treatment Ordinance. Staff gather field samples and conduct testing. This also allows for industrial cost recovery basedon the use of the treatment plant and collection system by industrial users.
9-36

Public Works DepartmentWater Protection Plant
Program 6330Program Description
2017-18 2018-19 2019-20Adopted Estimated
Staffing Detail Actual Budget Actual BudgetPlant Maintenance Supervisor 1 1 1 1Operations Manager 1 1 1 1Master Plant Operator 1 1 1 1Asst Plant Maintenance Supervisor 1 1 1 1Lead Plant Operator 2 2 2 2Electronics Technician 3 3 3 3Senior Work Leader 1 1 1 1Master Maintenance Electrician 1 1 1 1Plant Operator III 1 1 1 1Indust Maint Tech 11 11 11 11Plant Operator II 5 5 5 5Pump Station Collection Technician 1 1 1 1Senior Auto Mechanic 1 1 1 1Plant Operator 9 9 9 9Maintenance Technician 1 1 1 1Inventory Control Technician 1 1 1 1Equipment Operator III 2 2 2 2Operations Tech 2 2 2 2Administrative Aide 1 1 1 1Laborer 2 2 2 2Engineering Clerk PT (25 hrs/wk) 0.5 0.5 0.5 0
48.5 48.5 48.5 48
Operating Budget Summary
2017-18 2018-19 2019-20Adopted Estimated
Actual Budget Actual BudgetExpenditures:Salaries & Wages 1,752,140 2,229,352 2,073,375 2,256,809Employee Benefits 738,670 961,507 847,818 1,018,108Materials & Supplies 845,176 738,135 738,135 755,635Outside Services 2,697,153 2,698,473 2,790,572 2,840,099Capital Outlay 272,036 195,000 302,564 170,000Capital Improve 0 0 0 0Utilities 1,789,612 1,771,725 1,692,063 1,515,000Transfers 0 0 0 0
Total 8,094,787 8,594,192 8,444,526 8,555,651Revenue Sources:Grants & Other 0 0 0 0Other Rev 104,321 62,070 68,570 62,070Transfers 0 0 0 0WPC Fund Balance 7,990,467 8,532,122 8,375,956 8,493,581
Total 8,094,787 8,594,192 8,444,526 8,555,651
Salaries & Wages
26%
Employee Benefits
12%Materials &
Supplies9%
Outside Services
33%
Capital Outlay
2%
Capital Improve
0%
Expenditures by Type
Staff operate and maintain all treatment plant facilities and equipment and monitor compliance with effluent guidelinesestablished by the Environmental Protection Agency (EPA) and Missouri Department of Natural Resources (MDNR) inorder to protect public health and the environment.
Sewer Charges
100%
Revenue Sources by Type
9-44

Public Works Department
Program 1240
PROGRAM DESCRIPTION
CAPITAL OUTLAY & PUBLIC IMPROVEMENTS
0 0
Capital Budget Summary
2017-18 2019-20Adopted Estimated
Actual Budget Actual BudgetExpendituresServices 4,597,406 0 0 0Capital 11,400 343,163 343,163 445,166Capital Improvement 5,507,261 28,453,210 11,000,000 20,155,865Transfer 0 0 17,986 0
Total 10,116,067 28,796,373 11,361,149 20,601,031
Revenue SourcesSewer Charges 0 0 0 0Interest & Other Rv 30,893 700 226,566 96,708Grants 0 0 0 0Appropriation Fund 0 0 0 0Bond Revenues/Int 32,986,127 21,449,986 11,361,149 15,926,446Sewer FB (22,900,953) 7,345,687 (226,566) 4,577,877
Total 10,116,067 28,796,373 11,361,149 20,601,031
WATER PROTECTION FUND IMPROVEMENT PROJECTS
2018-19
0 10,000 20,000 30,000 40,000 50,000 60,000 70,000 80,000
FY2011
FY2012
FY2013
FY2014
FY2015
FY2016
FY2017
FY2018
FY2019
FY2020
$7,729$29,256
$15,886
$63,865
$33,796
$6,772
$47,201
$10,116
$11,361
$29,750
Sewer Improvement Project Expenditures(In Thousands)
The Sewer Improvement Program was established to provide project management and reporting for major treatmentplant and collection system improvements. Projects currently in progress are financed by a revenue bonds andSRF leveraged loans..
9-45

• Accessible bus service on 8 fixed routes, 5 days a week• Reduced service on 10 fixed routes on Saturdays• Curb-to-curb pickups with scheduled deviations at least 30 minutes prior to departure• Bus service to Elwood with deviation on any scheduled #18 King Hill trip• Intelligent Transportation System and scheduling software that allows faster reaction in the event of an emergency;
provides better routing information to passengers; increases passenger confidentiality; improves communicationsbetween drivers and dispatchers; automates visual and voice announcements of major intersections and stops for sightand hearing challenged passengers; enables accurate passenger counting
• Half fare passes and fares available to persons with disabilities and over the age of 60• Youth passes and fares available to those age 18 and younger
• Continued Open Access arrangement with Missouri Western State University. MWSU pays a fee to cover the fare forstudents to ride all year with their ID.
• Continued Travel Ambassador program which assists new customers in using transit (grant funded)• Expanded Saturday service with introduction of grant funded #21 SOUTH route• Introduced smart phone fare payment app• Procured 9 new replacement buses using local funds• Installed improvements (landing pad, bench, solar light) at 20 bus stops (grant funded)• Replaced administration building roof and bus wash (grant funded)• Repaired concrete driveway and replaced several doors at Angelique station (grant funded)
• While fuel costs remained low this year, the market is still difficult to anticipate. The budgeted amount for fuel is aconservative estimate.
• The aging bus fleet continues to drive high costs in M&R of Motor Vehicles. f f • Several facility repairs and customer amenity improvements planned (grant funded)
• Performance Statistics: FY2017 FY2018 FY2019 (Projected)• On-Time Performance 98.5% 98.2% 98.5%• Number of fare paying passengers (w/o transfers) 357,219 367,765 371,000• Number of trips (including transfers) 417,497 428,748 433,000• Percent of operating budget funded by paying riders 5.6% 5.9% 5.6%• Percent of "half fare" passengers 19% 20% 20%• Cost per trip per passenger $11.86 $11.95 $12.00• Number of deviations 57,347 56,788 57,300
*trip = passenger ride from one bus or one point to another
Mass Transit
MissionTo provide safe, convenient and affordable public transportation for both the ambulatory and mobility challengedpopulations with a fixed route system that allows route deviation for curb-to-curb service.
Core Services
Current Year Activity/Achievements
Performance Statistics
Budget Challenges
9-39

Public Works Department
MASS TRANSIT OPERATIONSProgram 1710
Program Description
2017-18 2018-19 2019-20Adopted Estimated
Staffing Detail Actual Budget Actual Budget
Mass Transit staff (53) are employed by the City's transit contractor.
Operating Budget Summary
2017-18 2018-19 2019-20Adopted Estimated
Actual Budget Actual BudgetExpenditures:Travel/Training 6,007 13,200 13,200 6,700Materials & Supplies 430,894 724,995 473,234 728,695Outside Services 5,013,130 5,092,459 5,399,068 6,160,727Utilities 44,374 41,400 44,855 46,425Capital Outlay 99,163 0 0 0Capital Improve 0 0 0 0Transfers 239,506 119,135 347,854 128,220Transfers Computer 12,000 12,000 12,000 10,000
Total 5,845,073 6,003,189 6,290,212 7,080,767
Revenue Sources:Transp Sales Tx 4,644,256 4,687,100 4,687,100 4,767,950Utility Franchise Tax 1,232,496 1,176,100 1,129,250 1,214,100Farebox Charges 321,873 291,300 291,300 296,300Other Revenues 30,853 3,500 3,500 3,500Interest & Other 254,216 8,500 483,459 454,000Operating Grants 1,525,719 1,688,500 1,688,500 1,688,500Capital Grant 0 0 0 0Transit FB (2,164,341) (1,851,811) (1,992,897) (1,343,583)
Total 5,845,073 6,003,189 6,290,212 7,080,767
Materials & Supplies
10%
Outside Services
87%
Capital Outlay
0%
Transfers2%Transfers
Computer0%
Expenditures by Type
Transp Sales Tx
57%
Utility Franchise
Tax14% Farebox
Charges4%
Operating Grants20%
Revenue Sources by Type
The transit system provides a safe, convenient, and affordable means of transportation. It strives to equally serve the needs of the disabled community through both fixed route and curb to curb services.
9-40

Public Works Department
TRANSIT FUND IMPROVEMENT PROJECTSProgram 1280
PROGRAM DESCRIPTION
CAPITAL OUTLAY & PUBLIC IMPROVEMENTS
Capital Budget Summary
2017-18 2019-20Adopted Estimated
Actual Budget Actual BudgetExpendituresMaterials & Services 0 0 0 0Capital Outlay 3,909,418 6,780,000 6,780,000 6,998,000Improvement Projs 428,311 1,130,000 1,130,000 1,757,000
Total 4,337,729 7,910,000 7,910,000 8,755,000
Revenue SourcesGrants 122,770 5,415,400 5,415,400 6,329,000Transit Sales Tax 0 0 0 0Transit FB 4,214,959 2,494,600 2,494,600 2,426,000
Total 4,337,729 7,910,000 7,910,000 8,755,000
2018-19
$0 $500 $1,000 $1,500 $2,000 $2,500 $3,000 $3,500 $4,000 $4,500 $5,000 $5,500 $6,000
FY2011
FY2012
FY2013
FY2014
FY2015
FY2016
FY2017
FY2018
FY2019
FY2020
$744
$78
$3
$5
$0
$0
$96
$4,337
$7,910
$8,790
Transit Improvement Project Expendituresin Thousands of Dollars
The Transit Improvement Program was established for project management and project cost reporting for major vehicle, facility,and other capital improvements and capital outlay primarily funded by the Federal Transit Administration (FTA).
9-41

(this page intentionally left blank)

Public Works Department
LANDFILL OPERATIONS
Director of Public Works
Assistant PW Director
Superintendent of Solid
Secretary
Landfill Clerk
Solid Waste & Recycling
Chief Master Mechanic
Equipment Operator 2 (2)
Equipment Operator 4 (8)
Recycling Laborer (2)
Laborer (2)
Environmental Technician
9-42

Public Works Department
• Properly landfill and cover all solid waste for all 304 days• Grind and compost all yard waste received• Comply with all state regulations• Comply with all EPA regulations• Cut and properly dispose of all waste tires received• Perform freon recovery and recycling of all appliances• Properly recycle all materials received at the Recycling Center• Provide safe disposal options for Household Hazardous Waste for the community• Provide operation "Clean Sweep" for St. Joseph residents
• 60,056 transactions processed at Landfill in 2018• 145,059.99 tons of solid waste received in 2018• 2,296.93 tons of yard waste received in 2018• 4 MDNR inspections passed• 7,570 tires received and processed in 2018• 735 appliances received in 2018• 1,146,305 pounds of material received at the Recycling Center• 1,342 vehicles and 140,929 pounds received in 2018 during the household hazard waste collection• 394.06 tons of debris received in 2018 during clean sweep operation• Completed second siltation basin under the new erosion control plan
• Proper compaction and cover active fill• Relocate stormwater retention basin to allow for construction of next cell• Execution of erosion control plan to minimize impact on stormwater run-off• Prepare facility to move into Stage 7 of the newly permitted area• Perform all necessary steps to prepare facility for many years of future operations in the new permit
• Number of tons of solid waste received at the landfill 145,059.99 tons up 12% from 2017• Number of pounds of material dropped at the Recycling Center 1,146,305 up 1% from 2017• Percent of pounds of recycling material compared to tons of landfill material .0039%• Number of transactions processed at the landfill 60,056• Number of pounds of materials collected at Household Hazardous Waste events 140,929 up 24% from 2017• Number of vehicles through Recycling Center 45,077• Tons of debris received in 2018 during clean sweep operation 394.06
Landfill & Recycling Operations
MissionThe mission of this program is to operate the St. Joseph Sanitary Landfill in the most cost-effective manner possible thatprovides for optimum protection of public health and environment.
Core Services
Current Year Activity/Achievements
Budget Challenges/Planned Initiatives
Performance Statistics
9-43

Public Works Department
LANDFILL OPERATIONS
Program 6110Program Description
2017-18 2018-19 2019-20Adopted Estimated
Staffing Detail Actual Budget Actual BudgetSuperintendent of Solid Waste 1 1 1 1Solid Waste & Recycling Supervisor 1 1 1 1Chief Master Mechanic 1 1 1 1Master Mechanic 0 0 0 1Equipment Operator IV 8 8 8 8Administrative Assistant 1 1 1 1Enviromental Technician 1 1 1 1Equipment Operator II 3 3 3 3Landfill Clerk 1 1 1 1Laborer 2 2 2 2
19 19 19 20Major Budgetary Changes & Program Highlights
Operating Budget Summary
2017-18 2018-19 2019-20Adopted Estimated
Actual Budget Actual BudgetExpenditures:Salaries & Wages 733,499 813,958 825,940 864,612Employee Benefits 307,278 361,348 352,061 411,110Materials & Supplies 311,816 455,900 360,893 417,300Other Services 601,206 468,722 598,820 771,685Utilities 15,959 15,600 16,974 17,500Capital Outlay 0 12,000 12,000 0Transfers 615,422 610,892 710,892 649,840Transfers Network 5,000 6,000 6,000 7,000
Total 2,590,180 2,744,420 2,883,579 3,139,047Revenue Sources:Permits & Rents 4,755,239 4,760,000 5,130,885 5,260,000Misc. Charges 27,536 10,300 15,300 15,300Interest Earnings 134,112 60,100 238,350 238,600Gas to Energy Sales 3,895 2,500 2,000 2,500Rents 4,464 4,500 4,500 4,500Interfund Trfer (2,335,066) (2,092,980) (2,507,455) (2,381,853)
Total 2,590,180 2,744,420 2,883,579 3,139,047
Salaries & Wages
27%
Employee Benefits
13%
Materials & Supplies
13%
Other Services
25%
Utilities1%
Transfers21%
Expenditures by Type
Misc. Charges
2%
Permits & Rents98%
Revenue Sources by Type
The Landfill staff provide the cititzens of St. Joseph and surrounding areas with a comprehensive, cost effective,environmentally safe solid waste management program through efficient daily operations at the existing landfill, throughproper maintenance of the three closed landfills, and through development of new disposal areas for the future.
9-37

Public Works Department
RECYCLING OPERATIONSProgram 6150
Program Description
2017-18 2018-19 2019-20Adopted Estimated
Staffing Detail Actual Budget Actual BudgetLaborer 2 2 2 2
Operating Budget Summary
2017-18 2018-19 2019-20Adopted Estimated
Actual Budget Actual BudgetExpenditures:Salaries & Wages 66,989 68,312 68,750 68,454Employee Benefits 32,643 33,689 33,793 36,047Materials & Supplies 517 1,350 1,350 1,350Other Services 5,479 7,030 7,030 7,030Utilities 0 0 0 0Capital Outlay 0 0 0 0Transfers 3,250 3,250 3,250 3,250
Total 108,878 113,631 114,172 116,131
Revenue Sources:User Charges 1,000 1,000 1,000 1,000Recyling Revenues 20,238 20,000 14,000 14,000Recycling FB 87,639 92,631 99,172 101,131
Total 108,878 113,631 114,172 116,131
Salaries & Wages
61%
Employee Benefits
32%
Materials & Supplies
1%
Other Services
6%
Expenditures by Type
User Charges
7%
Recyling Revenues
93%
Revenue Sources by Type
The recycling center was opened in 1995 to reduce the volume of waste that otherwise would be sent to a landfill byproviding a drop-off site which collects eight types of products.
9-45

Public Works Department
LANDFILL FUND IMPROVEMENT PROJECTSProgram 1260
PROGRAM MISSION
CAPITAL OUTLAY & PUBLIC IMPROVEMENTS
Capital Budget Summary
2017-18 2018-19 2019-20Adopted Estimated
Actual Budget Actual Budget
ExpendituresProfessional Services 0 135,000 135,000 0Capital Outlay 83,982 0 939,405 1,069,000Improvement Proj's 203,958 1,090,000 1,090,000 770,000
Total 287,940 1,225,000 2,164,405 1,839,000Revenue SourcesLandfill Fees 287,940 1,225,000 2,164,405 1,839,000
Total 287,940 1,225,000 2,164,405 1,839,000
$100,000 $350,000 $600,000 $850,000 $1,100,000 $1,350,000 $1,600,000
FY2013
FY2014
FY2015
FY2016
FY2017
FY2018
FY2019
FY2020
752,633
675,308
939,220
128,458
752,633
0
135,000
135,000
Landfill Improvement Project Expenditures
The Landfill Improvement Program provides project management and cost reporting for major capital improvements atthe Landfill. Projects include grading and construction, liner installation, and improvements related to the close oflandfills as required by the Missouri Department of Natural Resources.
$100,000 $350,000 $600,000 $850,000 $1,100,000 $1,350,000 $1,600,000
FY2011
FY2012
FY2013
FY2014
FY2015
FY2016
FY2017
FY2018
FY2019
FY2020
0348,496
752,633
675,308
939,220
128,458
752,633
0135,000
135,000
Landfill Improvement Project Expenditures
The Landfill Improvement Program provides project management and cost reporting for major capital improvements atthe Landfill. Projects include grading and construction, liner installation, and improvements related to the close oflandfills as required by the Missouri Department of Natural Resources.
9-46

(this page intentionally left blank)

OTHER PROGRAMS
TOTAL BUDGETED RESOURCES: 11,437,024$
CITY MANAGER
GAMING INITIATIVES FUND
GENERAL FUND NON-
DEPARTMENTAL EXPENDITURES
GENERAL FUND -CELL PHONE
FUNDED INITIATIVES
The City of St. Joseph's has several departments with no staff. All but one of these programs have their own fundingsources.
Revenues in the Special Allocation fund are primarily generated through the Payments in Lieu of Property Taxes (PILOTs)and Economic Activity Taxes (EATs). They are used to reimburse developers within economic development districtsand/or to pay debt service on TIF bonds.
The monies from the revenues received from the local casino and from cell phone franchise taxes have the possibility ofbeing eliminated. These monies are used for one-time or less essential expenditures.
The Museum property tax monies are allocated to city-owned museums both directly to city-run facilities and via amanagement contract for others. A portion of the annual tax distribution is ear-marked for capital improvements at theWyeth-Tootle Mansion.
ADMINISTRATIVE SERVICES DEPARTMENT
MUSEUM TAX FUND SPECIAL ALLOCATION FUND
TIF DISTRICTS
CID DISTRICTS
TDD DISTRICTS
ECONOMIC DVLPMNT DISTRICTS
10 - 1

OTHER PROGRAMSSUMMARY
2017-18 2019-20Adopted Estimated
Actual Budget Actual Budget
2,610,376 3,124,352 2,892,327 2,909,798Debt Service, Reimbursed Expenditures 6,985,467 7,855,697 7,855,697 7,099,738
1,783,673 1,438,715 2,554,715 1,077,48847,650 527,161 494,161 350,000
11,427,166 12,945,925 13,796,900 11,437,024
866,394 1,255,160 1,096,500 981,660CMO 1,812,715 1,501,491 874,536 800,171CMO 680,489 767,451 889,041 1,116,108
494,352 957,410 957,410 600,6502,045 52,395 52,395 42,761
679 300 300 9,71458 2,000 2,000 510,450
171 7,000 7,000 8,235297 500 500 10,065137 130 130 123
150,390 149,480 149,480 117,6180 5,000 5,000 5,000
381,476 381,600 381,600 385,005637,390 599,750 599,750 628,754
17,582 8,900 1,523,900 14,185637,508 1,385,200 1,385,200 623,422
3,465,365 3,489,038 3,489,038 2,976,7351,610 0 0 20,000
321,830 377,625 377,625 322,4161,939,950 1,945,395 1,945,395 1,950,860
95 100 100 950 0 0 0
16,633 60,000 60,000 312,99711,427,166 12,945,925 13,796,900 11,437,024
2,493,205 2,268,942 1,763,577 1,916,279866,394 1,255,160 1,096,500 981,660494,352 957,410 957,410 600,650
7,573,216 8,464,413 9,979,413 7,938,43511,427,166 12,945,925 13,796,900 11,437,024
Admin ServicesAdmin Services
Museum Tax ProgramCenter Building TIFGilmore Building TIF
Admin Services
Downtown Mosaic TIF
Admin Services
Admin ServicesAdmin ServicesAdmin ServicesAdmin ServicesAdmin Services
Admin ServicesAdmin ServicesAdmin ServicesAdmin ServicesAdmin Services
CVS/Pharmacy STRA TIFUptown Redevelopment TIFRyan Block TIFCooks Crossing Redvlpmt
SUPERVISINGUSES BY PROGRAM
Non-DepartmentalGaming Initiatives
Cell Phone Initiatives
DEPARTMENTCMO
2018-19
ACCOUNT TYPEMaterials, Professional & Contracted Srvcs
TransfersCapital Outlay
East Hills TIF (&CID)NE Cook Road TIFThe Commons Dvlpmnt (EDCMitchell Avenue TIFDowntown Revitalization TIF
N County Dvlpmnt TIFAmerican Electric TIFEBR Dvlpmnt TIFTriumph Foods TIFFountain Creek TIF
Museum Tax FundSpecial Allocation Fund
Admin Services
3rd Street Hotel TIFTuscany Towers TIF
FUNDING SOURCESGeneral FundGaming Fund
Admin Services
Admin ServicesAdmin ServicesAdmin ServicesAdmin Services
10 - 2
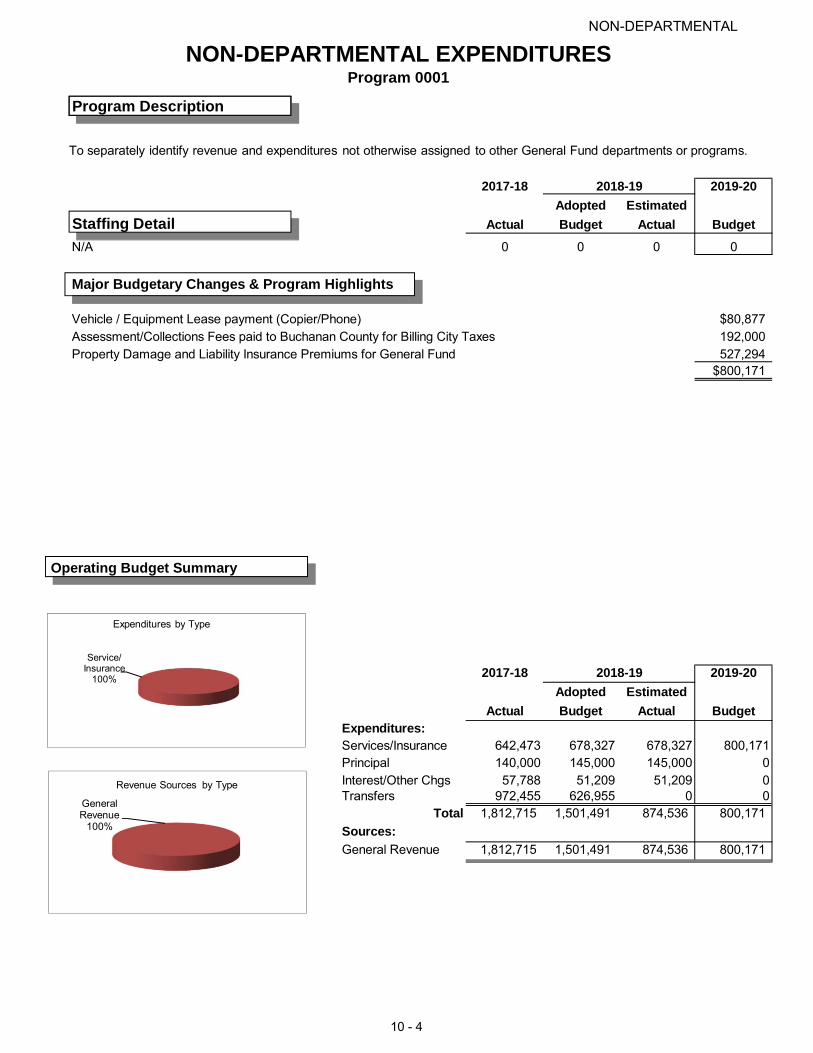
NON-DEPARTMENTAL
NON-DEPARTMENTAL EXPENDITURESProgram 0001
Program Description
2017-18 2019-20Adopted Estimated
Staffing Detail Actual Budget Actual Budget
N/A 0 0 0 0
Major Budgetary Changes & Program Highlights
$80,877192,000527,294
$800,171
Operating Budget Summary
2017-18 2019-20Adopted Estimated
Actual Budget Actual Budget
642,473 678,327 678,327 800,171140,000 145,000 145,000 057,788 51,209 51,209 0
972,455 626,955 0 0Total 1,812,715 1,501,491 874,536 800,171
1,812,715 1,501,491 874,536 800,171
2018-19
2018-19
Expenditures:
Sources:General Revenue
Services/InsurancePrincipal Interest/Other ChgsTransfers
Vehicle / Equipment Lease payment (Copier/Phone)Assessment/Collections Fees paid to Buchanan County for Billing City TaxesProperty Damage and Liability Insurance Premiums for General Fund
Service/Insurance
100%
Expenditures by Type
General Revenue
100%
Revenue Sources by Type
To separately identify revenue and expenditures not otherwise assigned to other General Fund departments or programs.
10 - 4

NON-DEPARTMENTAL
Program 0011
Program Description
2017-18 2019-20Adopted Estimated
Staffing Detail Actual Budget Actual Budget
N/A 0 0 0 0
Major Budgetary Changes & Program Highlights
Proposed Cell Phone Funded Initiatives
15,000$ 10,000
205,000 30,000 15,000 3,000
Transfer to Streets Maintenance - Stormwater Grant (75% City/25% Resident) 50,000 70,000 32,000 6,000 5,000
216,000 101,756 30,000
253,852 67,000 6,500
1,116,108$
Operating Budget Summary
2017-18 2018-19 2019-20Adopted Estimated
Actual Budget Actual BudgetExpenditures:
21,648 101,290 40,000 3,0005,000 27,000 14,925 0
629,031 546,000 773,955 838,1080 9,000 9,000 250,000
24,810 84,161 51,161 25,000Total 680,489 767,451 889,041 1,116,108
Sources:997,373 900,000 900,000 900,000
7,576 4,000 20,337 4,000(324,460) (136,549) (31,296) 212,108
Total 680,489 767,451 889,041 1,116,108Other General Fund
Materials
Interest
Services
TransfersCapital OutlayCapital Improvemnts
Wireless Franch Tx
Transfer to Parks Maintenance - Mowers (2)Transfer to Parks Maintenance - 1/2 Ton Pickup TruckTransfer to Parks Maintenance - Snow Plow for 1 Ton TruckTransfer to Parks Maintenance - Turbine Blower
CELL PHONE EXPENDITURES
2018-19
24 Hour Access Fitness Room - Parks Department (REC Center)Drain Covers - Parks Department (Aquatic)Marked Cars (5) - Police DepartmentDepartment SUV - Health DepartmentInspector Vehicle - Building DevelopmentHuman Rights Commission - Legal Department
Transfer to Golf Course - Driving Range Netting
Transfer to Public Safety - Mobile/Portable Radio Upgrades (Police)Transfer to Public Safety - Communication Center Consoles ( Police)Transfer to Aviation - 1/2 Ton Crew Cab TruckTransfer to Public Parking - Mosaic ObligationTransfer to Public Parking - Mosaic Maintenance Repair Costs
Transfers75%
Capital Outlay…
Capital Improvemnts
2%
Expenditures by Type
Wireless Franch Tx, …
Interest1%
Revenue Sources by Type
To separately identify revenue and expenditures related to one-time and on-going wireless franchise taxes.
10 -4

CELL PHONE INITIATIVES
15,000 10,000
205,000
30,000
15,000
Other Services 3,000
50,000
70,000 32,000 6,000 5,000
216,000 101,756
30,000
253,852 67,000
6,500
1,116,108$
Transfer to Public Safety Tax Fund Mobile/Portable Radio Upgrades - Police
Parks and Recreation 24-Hour Access Fitness RoomDrain Covers - Aquatic
Police Marked Police Cars (5)
Health Health Department SUV
Building Development Building Inspector Vehicle
Transfer to Parks Maintenance Fund Mowers (2)1/2 Ton Pickup Truck
Transfer to Streets Maintenance Fund
Human Rights Commission
Transfer to Aviation Fund 1/2 Ton Crew Cab Truck
Transfer to Public Parking Fund Mosaic Obligation
Transfer to Municipal Golf Fund Driving Range Netting
Stormwater Grant (75% City/25% Resident)
Snow Plow for 1 Ton TruckTurbine Blower
Communication Center Consoles - Police
Mosaic Maintenance/Repair Costs
10 - 5

(this page intentionally left blank)

Gaming Funded Initiatives
GAMING FUNDED INITIATIVESProgram 8900
Program Description
2017-18 2018-19 2019-20Adopted Estimated
Staffing Detail Actual Budget Actual Budget
N/A 0 0 0 0
Operating Budget Summary
2017-18 2018-19 2019-20Adopted Estimated
Actual Budget Actual BudgetExpenditures:Outside Services 744,894 1,048,660 890,000 800,160Materials/Supplies 0 0 0 0Capital Outlay 0 0 0 0Capital Imprvmnt 0 0 0 0Transfers Out 121,500 206,500 206,500 181,500
Total 866,394 1,255,160 1,096,500 981,660 Sources:Grants 0 0 0 0Gaming Revenue 954,245 1,030,000 817,200 822,000Interest 5,416 200 7,991 8,000Other Revenue 1,600 0 0 0Fund Balance (to)/frm (94,867) 224,960 271,309 151,660
Total 866,394 1,255,160 1,096,500 981,660
Outside Services
82%
Transfers Out18%
Expenditures by Type
Gaming Revenue
99%
Interest1%
Revenue Sources by Type
To separately identify revenue from riverboat gaming operations and expenditures paid as authorized by Council.To concentrate funding on efforts that promote economic and community development and community aesthetics.
10 - 6

GAMING INITIATIVES
Proposed Gaming Funded Initiatives
Contributions/Contracts - Recurring 21,310$ Festival Funding15,000 City 4th of July fireworks display30,000 Allied Arts Council
1,600 MoDOT Lease40,000 Public Education Spots & Cablevision Contract (Pub Info)
Chamber/Econ Dev 189,000 Chamber Economic Development Contract20,000 MO-KAN Contribution10,000 State Legislative Lobbyist (Mark Rhoads)10,000 Downtown Partnership Contract20,000 Community Alliance Membership
750 Great Northwest Day at the Capital, City's sponsorship10,000 Chamber Workforce Development
259,750
125,000 Legal Services - Outside Specialized Counsel (Legal)
20,000 Save Our Heritage Neighborhood GrantsHistoric/Landmark 150,000 Historic preservation grants outside of HUD-eligible areas
25,000 Landmark Commission Emergency building stabilization8,000 Landmark Commission Public & education outreach
203,000
80,000 Property Mnt clean-up, abatement, dangerous bldg issues
17,500 Innovation Stockyard7,000 Foundation Recovery
Contributions/Contracts - Once or Limited
TRANSFER TO GENERAL FUND
Nature Center: 40,000 Special ProgrammingNonDepartmental: 10,000 Contribution toward in-kind services supplied to spcl events
TRANSFER TO STREETS FUND
Stormwater Grant 50,000 Stormwater Match Grant 75/25
TRANSFER TO SPECIAL ALLOCATION FUND
City Sponsored TIFs: 5,000 As Needed - To cover City expenses until TIF revenues begin
TRANSFER TO AVIATION FUNDAirport Operations: 70,000 Operating Subsidy in support of Air Guard presence
TRANSFER TO PARKING FUNDParking Operations: 6,500 Reimbursement for lost revenue/waived fees at Civic Center
TOTAL PROPOSED 981,660$
10 - 7

Museum Contributions Program
MUSEUM FUND CONTRIBUTIONSProgram 3750
Program Description
2017-18 2019-20Adopted Estimated
Staffing Detail Actual Budget Actual Budget
N/A 0 0 0 0
Operating Budget Summary
2017-18 2019-20Adopted Estimated
Actual Budget Actual Budget
14,204 14,200 14,200 14,20011,621 14,950 14,950 18,570
385,000 435,000 435,000 435,00060,687 59,260 59,260 57,880
Total 471,512 523,410 523,410 525,650
484,340 487,550 494,203 494,2035,292 700 7,301 7,300
(18,121) 35,160 21,906 24,147Total 471,512 523,410 523,410 525,650
2018-19
2018-19
Expenditures:
Revenue Sources:
(To) Frm FB
ServicesInsuranceMuseum ContractTransfers
Museum Property TaxInterest & Other
Services3%
Transfers11%Insurance
3%
Museum Contract
83%
Expenditures by Type
Museum Property
Tax94%
Interest & …(To) Frm
FB5%
Revenue Sources by Type
To separately identify revenue from the Museum Property Tax and expenditures paid as authorized by Council. To concentrate funding on municipal museums.
10 - 8

Museum Contributions Program
MUSEUM FUND IMPROVEMENT PROJECTSProgram 1238
PROGRAM DESCRIPTION
CAPITAL OUTLAY & PUBLIC IMPROVEMENTS
Major Budgetary Changes & Program Highlights
Capital Budget Summary
2017-18 2018-19 2019-20Adopted Estimated
Actual Budget Actual BudgetExpenditures
22,840 434,000 434,000 75,000Total 22,840 434,000 434,000 75,000
Revenue Sources75,000 75,000 75,000 75,000
(52,160) 359,000 359,000 0Total 22,840 434,000 434,000 75,000
Capital Improv
Property TaxCIP FB
$0 $50,000 $100,000 $150,000 $200,000 $250,000 $300,000 $350,000 $400,000
Expenditures
Museum Improvement Project Expenditures
The Museum Improvement Projects Program was established to track, monitor, and facilitate expenditure of the $75,000 per year appropriation from the Museum Tax for use in repairing and renovating the Wyeth-Tootle Mansion, considered on of the City's museums.
A separate CIP program for the Museum projects was created in order to better demonstrate that the Museum tax funds were being spent on the appropriate projects.
Major CIP Projects:-Future Exterior improvements
10-9

Special Allocation Fund
CENTER BUILDING TIFProgram 5140
Program Description
2017-18 2018-19 2019-20Adopted Estimated
Staffing Detail Actual Budget Actual Budget
N/A 0 0 0 0
Major Budgetary Changes & Program Highlights
Operating Budget Summary
2017-18 2018-19 2019-20Adopted Estimated
Actual Budget Actual BudgetExpenditures:Prof Srvcs 2,045 2,800 2,800 2,023Reimbrsd Exp 0 49,595 49,595 40,738
Total 2,045 52,395 52,395 42,761Sources:PILOTS 10,895 12,044 12,044 10,920EATS 31,432 30,740 30,740 31,826From(To) Fund Bal. (40,281) 9,611 9,611 15
Total 2,045 52,395 52,395 42,761
Prof Srvcs5%
Reimbrsd Exp95%
Expenditures by Type
PILOTS26%
EATS74%
From(To) Fund Bal.0%
Revenue Sources by Type
This program tracks the revenues and expenditures for the Center Building TIF. This is the first redevelopment project within the Dowtown Revitalization TIF district. The project is a building rehab program located at 6th and Edmond. In addition to updates of the building, the project also includes: streetscapes, sidewalks, and improvents to the city-owned public parkiing lot located west of the building. Reimbursable costs include public infrastructure, construction, architecture, and engineering.
~This is a pay-as-you-go TIF. A few small businesses are open within the building. The center piece - the GroundRound Restaurant - replaced the Brazilian Restaurant in 2012.
10 - 10

Special Allocation Fund
GILMORE BUILDING TIFProgram 5145
Program Description
2017-18 2018-19 2019-20Adopted Estimated
Staffing Detail Actual Budget Actual Budget
N/A 0 0 0 0
Major Budgetary Changes & Program Highlights
Operating Budget Summary
2017-18 2018-19 2019-20Adopted Estimated
Actual Budget Actual BudgetExpenditures:Prof Srvcs 679 300 300 714Reimbrsd Exp 0 0 0 9,000
Total 679 300 300 9,714Sources:PILOTS 13,063 4,500 8,033 7,051EATS 552 2,940 2,940 2,587From(To) Fund Bal. (12,936) (7,140) (10,673) 76
Total 679 300 300 9,714
This program tracks the revenues and expenditures for the Gilmore Building TIF. This is a redevelopment project located in the "Phase One" area of the Downtown Revitalization TIF district. The project is a building rehab program located at 107 S 6th Street. The project involves restoration of an existing building for development of retail space and market rate apartments. Reimbursable costs include elevator, stairs, stairwell, and electrical service.
~This is an active pay-as-you-go TIF where the Paradox Theatre and Coffee House reside.
Prof Srvcs100%
Expendiure by Type
PILOTS72%
EATS27%
From(To) Fund Bal.…
Revenue Sources by Type
10 - 11

Special Allocation Fund
DOWNTOWN MOSAIC TIFProgram 5146
Program Description
2017-18 2018-19 2019-20Adopted Estimated
Staffing Detail Actual Budget Actual Budget
N/A 0 0 0 0
Major Budgetary Changes & Program Highlights
Operating Budget Summary
2017-18 2018-19 2019-20Adopted Estimated
Actual Budget Actual BudgetExpenditures:Prof Srvcs 58 2,000 2,000 26,819TIF Reimb/Debt Serv 0 0 0 483,631
Total 58 2,000 2,000 510,450Sources:PILOTS 0 0 496,372 508,450EATS 0 0 0 0Other Revenue 0 0 0 0From(To) Fund Bal. 58 2,000 (494,372) 2,000
Total 58 2,000 2,000 510,450
This program tracks the revenues and expenditures for the Downtown Mosaic TIF. The Mosaic Downtown Revitalizaton Project is for renovation fo the German American building, the demolition and reconstruciton of the City owned public parking structure at Felix and 8th Street and repaving and striping of two surface parking lots, all within Redevelopment Project Area 1 of the Downtown St. Joseph Tax Increment Financing Redevelopment Plan approved by Special Ordinance No. 7704 passed June 29, 2009.
~This is a recently established, pay-as-you-go TIF. The renovations for the German American building werecompleted in May of 2017. The parking garage opened for use early in 2018.
Prof Srvcs100%
Expenditures by Type
PILOTS100%
Other Revenue
0%
Revenue Sources by Type
10 - 12

Special Allocation Fund
CVS ASHLAND TIFProgram 5147
Program Description
2017-18 2018-19 2019-20Adopted Estimated
Staffing Detail Actual Budget Actual Budget
N/A 0 0 0 0
Major Budgetary Changes & Program Highlights
Operating Budget Summary
2017-18 2018-19 2019-20Adopted Estimated
Actual Budget Actual BudgetExpenditures:Prof Srvcs 171 0 0 111Reimbrsd Exp 0 7,000 7,000 8,124
Total 171 7,000 7,000 8,235Sources:PILOTS 0 0 0 0EATS 8,566 7,000 7,000 5,526From(To) Fund Bal. (8,395) 0 0 2,709
Total 171 7,000 7,000 8,235
This program tracks the revenues and expenditures for the improvements made to Karnes Road and North Belt Highway intersection. The developer redeveloped approximately 1.458 acres to construct a new CVS/Pharmacy. The Developer agrees as part of the development to pay for costs related to construction of a right hand turn lane to service the project area at the intersection of Karnes Road and North Belt Highway. The Developer intends to use future sales tax revenue generated from CVS/Pharmacy reimbursed by the City over a period not to exceed six (6) years with no interest to cover most of the right hand turn lane from Karnes Road to The Belt Highway.
~This is an active pay-as-you-go TIF. CVS opened for business in March of 2016.
Reimbrsd Exp…
Expenditures by Type
EATS100%
Resources by Type
10 - 13

Special Allocation Fund
UPTOWN REDEVELOPMENT TIFProgram 5155
Program Description
2017-18 2018-19 2019-20Adopted Estimated
Staffing Detail Actual Budget Actual Budget
N/A 0 0 0 0
Major Budgetary Changes & Program Highlights
Operating Budget Summary
2017-18 2018-19 2019-20Adopted Estimated
Actual Budget Actual BudgetExpenditures:Services 297 500 500 650Reimbrsd Exp 0 0 0 9,415
Total 297 500 500 10,065Sources:PILOTS 5,317 1,000 1,466 1,466EATS 0 0 0 0Other Revenue 0 0 0 0From/(To) Fund Bal (5,020) (500) (966) 8,599
Total 297 500 500 10,065
This program tracks the revenues and expenditures for the project(s) at the Uptown Redevelopment site. This project targets the redevelopment of large sections of uptown St. Joseph including the site of the west campus of Heartland Hospital. This TIF project was approved March 2005. A majority of the TIF revenues will go to pay back the hospital for the extraordinary demolition costs of the old buildings. Most of this project area will be developed under a 353 program.
~To date, two residential properties have been developed.
Services100%
Expenditures by Type
PILOTS100%
Resources by Type
10 - 14

Special Allocation Fund
RYAN BLOCK TIFProgram 5156
Program Description
2017-18 2018-19 2019-20Adopted Estimated
Staffing Detail Actual Budget Actual Budget
N/A 0 0 0 0
Major Budgetary Changes & Program Highlights
Operating Budget Summary
Retail business, Friederich's Market, opened in October of 2017
2017-18 2018-19 2019-20Adopted Estimated
Actual Budget Actual BudgetExpenditures:Services 137 130 130 123TIF Reimb/Debt Serv 0 0 0 0
Total 137 130 130 123Sources:PILOTS (221) 1,558 2,327 2,328EATS 385 0 0 450Other Revenue 0 0 0 0From/(To) Fund Bal (27) (1,428) (2,197) (2,655)
Total 137 130 130 123
This program tracks the revenues and expenditures for the project(s) at the Ryan Block redevelopment site. This is a mixed use commercial space/residential lofts project on Frederick Avenue. The TIF project was approved December 2006.
~This TIF is based on a pay-as-you-go basis. Development began in 2006 with the demolition of one building inorder to provide a parking lot for the refurbished buildings. There will be 3,300 square feet of commercial space onthe first floor and 6,600 square feet of residential space on the second and third floors.~ Only a small amount of PILOTs have been generated. Nothing has been reimbursed as yet.
Services100%
Expenditures by Type
PILOTS100%
Resources by Type
10 - 15

Special Allocation Fund
COOKS CROSSING REDEVELOPMENTProgram 5157
Program Description
2017-18 2018-19 2019-20Adopted Estimated
Staffing Detail Actual Budget Actual Budget
N/A 0 0 0 0
Major Budgetary Changes & Program Highlights
Operating Budget Summary
2017-18 2018-19 2019-20Adopted Estimated
Actual Budget Actual BudgetExpenditures:Services 1,268 1,500 1,500 1,162 TIF Reimbursable - 147,980 147,980 - Debt Service 149,122 - - 116,456
Total 150,390 149,480 149,480 117,618 Sources:PILOTS - - - - EATS 126,820 120,000 120,000 122,244 Other Revenue - - - - From/(To) Fund Bal 23,570 29,480 29,480 (4,626)
Total 150,390 149,480 149,480 117,618
This program tracks the revenues and expenditures for the project(s) at the Creeks Crossing redevelopment site. This is a commercial space project which redeveloped the site of an abandoned Payless Cashways building on the Belt Highway. Pay-as-you-go reimbursements are made through a Tax Redevelopment Agreement with the City.
~This Economic Development project is based on a pay-as-you-go basis. A property vacated by the former businessyears ago has been completely redeveloped. Tenants include Dicks' Sporting Goods, a re-located Aldi's grocery, aStarbucks, a Pet Smart and several other small businesses. The project was approved by City Council in the springof 2011.~Incentives include tax abatements through a 353 Redevelopment Agreement and sales tax reimbursementsthrough an Economic Development Agreement with the City. By FY15 revenue from City PILOTs will be available.The amount is currently unknown although an estimate has been projected.
Services100%
TIF Reimburs
able0%
Expenditures by Type
EATS100%
Revenues by Type
10 - 16

Special Allocation Fund
DOWNTOWN REVITALIZATION TIFProgram 5164
Program Description
2017-18 2018-19 2019-20Adopted Estimated
Staffing Detail Actual Budget Actual Budget
N/A 0 0 0 0
Major Budgetary Changes & Program Highlights
Operating Budget Summary
2017-18 2018-19 2019-20Adopted Estimated
Actual Budget Actual BudgetExpenditures:Services/Supplies 0 5,000 5,000 5,000Interfund Trf (Gaming) 0 0 0 0
Total 0 5,000 5,000 5,000Sources:PILOTS 0 0 0 0EATS 0 0 0 0Interfund Trf (Gaming) 0 5,000 5,000 5,000From(To) Fund Bal. 0 0 0 0
Total 0 5,000 5,000 5,000
This program tracks the revenues and expenditures for the Downtown Revitalization TIF. This is a TIF project initiated by the City in order to meet the Council goal of downtown revitalization. The Plan itself was funded through the Governor's DREAM initiative.
~The TIF District was approved at the end of FY2009. The first redevelopment project - the Center Building TIF wasapproved in FY2010. The district itself does not generate revenues, but is the framework within which specificprojects such as the Center Building TIF, Gilmore Building TIF, and the Downtown Mosaic TIF are activated.Revenues are transferred from the Gaming fund to cover any expenses, such as legal fees connected with thedistrict.~Recently Council appproved the redevlopment of the American Electric Builiding which will consist of loftapartments and retail in on the first floor. Construction is scheduled to begin soon.
Services/Supplies
100%
Expenditures by Type
Interfund Trf
(Gaming)100%
Resources by Type
10 - 17

Special Allocation Fund
MITCHELL AVENUE CORRIDOR TIFProgram 5165
Program Description
2017-18 2018-19 2019-20Adopted Estimated
Staffing Detail Actual Budget Actual Budget
N/A 0 0 0 0
Major Budgetary Changes & Program Highlights
Operating Budget Summary
2017-18 2018-19 2019-20Adopted Estimated
Actual Budget Actual BudgetExpenditures:Services 19,326 20,000 20,000 18,405Principal 190,000 200,000 200,000 215,000Interest/Other Charges 172,150 161,600 161,600 151,600
Total 381,476 381,600 381,600 385,005Sources:PILOTS 392,845 378,000 416,505 416,505EATS 22,383 17,510 17,510 19,805Interest/Due from TIF 1,293 100 100 2,507From/(To) Fund Bal (35,046) (14,010) (52,515) (53,812)
Total 381,476 381,600 381,600 385,005
Services5%
Principal56%
Interest/Other
Charges39%
Expenditures by Type
PILOTS95%
EATS4%
Revenue Sources by Type
This program tracks the revenues and expenditures for the project(s) at the Mitchell Avenue Cooridor Redevelopment site for the American Family Insurance Company. This project targets the redevelopment of property surrounding and including portions of the American Family campus as well as parts of Missouri Western University. This TIF project was approved June 2006. TIF revenues will go to sanitary sewer and street improvements on Mitchell Avenue.
~PILOTS & EATS will be used to meet debt service payments.~In order to generate sufficient PILOTS, the company had themselves removed from an Enterprise Zoneclassification. Their resulting PILOT payments will go toward the TIF bonds debt service.
10 - 18

Special Allocation Fund
NORTH AMERICAN R E DEVELOPMENTProgram 5166
Program Description
2017-18 2018-19 2019-20Adopted Estimated
Staffing Detail Actual Budget Actual Budget
N/A 0 0 0 0
Major Budgetary Changes & Program Highlights
Operating Budget Summary
2017-18 2018-19 2019-20Adopted Estimated
Actual Budget Actual BudgetExpenditures:Services 13,092 16,350 16,350 13,411Developer Reimb. 0 583,400 583,400 0Principal 485,953 0 0 451,425Interest/Other Charges 138,344 0 0 163,918
Total 637,390 599,750 599,750 628,754Sources:PILOTs 11,828 4,775 12,779 12,779EATs 626,670 640,000 640,000 624,846From/(To) Fund Bal (1,109) (45,025) (53,029) (8,871)
Total 637,390 599,750 599,750 628,754
Services2%Developer
Reimb.0%
Principal72%
Interest/Other Charges
26%
Expenditures by Type
EATs98%
PILOTs2%
Revenue Sources by Type
This program tracks the revenues and expenditures for the North American R E Development (formerly the Commons Economic Development Agreement approved November 2007). This is a mixed use commercial/retail space project. The project also includes traffic improvements to parts of Highway 169 and Highway A, street lighting, and sewer installation. A CID was approved and activated July 2007 in order to help cover reimbursable costs and to generate funds for future upkeep of the development area, however a one-cent CID sales tax was not approved by the CID until spring of 2014 and did not go into effect until October 2014.
~This is an Economic Agreement whereby only the incremental general property tax and general sales tax realizedby the City is eligible to be used for reimbursements to the developer.~Expenditures represent reimbursements by the developer for land development, street construciton, and sewerinstallation.~Recent additions to the development include El Maguey and The Human Bean.
10 - 19

Special Allocation Fund
NORTH EAST COOK ROAD TIFProgram 5167
Program Description
2017-18 2018-19 2019-20Adopted Estimated
Staffing Detail Actual Budget Actual Budget
N/A 0 0 0 0
Major Budgetary Changes & Program Highlights
Operating Budget Summary
2017-18 2018-19 2019-20Adopted Estimated
Actual Budget Actual BudgetExpenditures:
17,582 8,900 8,900 14,1850 0 0 00 0 1,515,000 0
Total 17,582 8,900 1,523,900 14,185Sources:PILOTS 350,684 380,000 405,831 405,622Sewer Capacity Fee 0 0 0 0EATS 957 0 0 953From(To) Fund Bal. (334,060) (371,100) 1,118,069 (392,390)
Total 17,582 8,900 1,523,900 14,185
Services/SuppliesDvlpr ReimburseTransfers
Services/Supplies
100%
Expenditures by Type
PILOTS99.8%
Revenue Sources by Type
This program tracks the revenues and expenditures for the North East Cook Road TIF. This is a residential subdivisionproject with a mix of estate homes, single family homes and multi-unit residences. The plan includes sewer installation,water line installation, and street improvements to Cook Road in front of the development. The TIF project wasapproved and activated March 2008.
~Expenditures represent the City's legal costs and other professional costs.~Revenues are generated by property taxes as houses are sold and occupied.
10 - 20

Special Allocation Fund
EAST HILLS TIFProgram 5168
Program Description
2017-18 2018-19 2019-20Adopted Estimated
Staffing Detail Actual Budget Actual Budget
N/A 0 0 0 0
Major Budgetary Changes & Program Highlights
Operating Budget Summary
2017-18 2018-19 2019-20Adopted Estimated
Actual Budget Actual BudgetExpenditures:Services 22,460 33,200 33,200 23,422TIF Reimbrsmnt 0 1,352,000 1,352,000 0Principal 615,049 0 0 600,000
Total 637,508 1,385,200 1,385,200 623,422Sources:PILOTs 549,626 548,616 548,616 544,651EATs 180,998 386,550 386,550 304,380Interest/Other 2 100 0 100From (To) Fund Bal (93,119) 449,934 450,034 (225,709)
Total 637,508 1,385,200 1,385,200 623,422
Services4%
TIF Reimbrs
mnt0%
Principal96%
Expenditures by Type
PILOTs51%
EATs28%
From Fund Bal
1%
Revenue Sources by Type
This program tracks the revenues and expenditures for the East Hills TIF. This is a redevelopment of use retail/entertainment center project at the East Hills Mall site. The plan includes blight removal, construction and renovationof the existing site, and construcution of new pad sites. The TIF project was approved and activated in January 2008.
~Reimbursements are pay-as-you-go as PILOTS and EATS are generated.~Revenues will be generated by a combination of EATS and CID sales tax.~CID sales tax of 1% was apporved.~The higher than usual expenditures in professional fees is the result of the development's exploration of issuingCID bonds.~Bonds were issued during FY16.
10 - 21

Special Allocation Fund
SHOPPES AT NORTH VILLAGE TIFProgram 5170
Program Description
2017-18 2018-19 2019-20Adopted Estimated
Staffing Detail Actual Budget Actual Budget
N/A 0 0 0 0
Major Budgetary Changes & Program Highlights
Operating Budget Summary
2017-18 2018-19 2019-20Adopted Estimated
Actual Budget Actual BudgetExpenditures:Services 228,615 186,000 186,000 235,000Principal 1,610,000 1,775,000 1,775,000 1,840,000Interest & Other 1,626,750 1,528,038 1,528,038 901,735
Total 3,465,365 3,489,038 3,489,038 2,976,735Revenue Sources:PILOTS 1,045,642 1,048,000 1,066,275 1,066,274EATS 3,579,624 3,374,000 3,374,000 3,446,070Interest & Other 124,476 400 400 140,223From/(To) Fund Bal (1,284,377) (933,362) (951,637) (1,675,832)
Total 3,465,365 3,489,038 3,489,038 2,976,735
Services5%Principal
22%
Interest & Other72%
Expenditures by Type
EATS100%
Revenue Sources by Type
This program tracks the revenues and expenditures for the project(s) at the North County redevelopment site. The firstproject is the Shoppes at North Village, a retail/entertainment center. This TIF project (officially Phase 1A) was approvedAugust 2003 and revised March 2004. Most of the retail shops were open by late spring, 2005. A few outer pad sitescontinue to be developed.
~All TIF reimbursements have been made to the City and developer.~The final payment was made to the County following approval of a Third Amendment to the TIF Plan. Theremaining expenses in this project will be annual debt service.~The 2005 bonds were refinanced in 2018 and will have the same maturity date.
10 - 22

Page 1 Special Allocation Fund
American Electric TIFProgram 5173
Program Description
2017-18 2018-19 2019-20Adopted Estimated
Actual Budget Actual Budget0 0 0 0
Major Budgetary Changes & Program Highlights
Operating Budget Summary
2017-18 2018-19 2019-20Adopted Estimated
Actual Budget Actual BudgetExpenditures:Services 1,610 0 0 20,000TIF Reimbursements 0 0 0 0
Total 1,610 0 0 20,000Sources:PILOTS 0 0 0 0EATS 0 0 0 0Interest/Other 0 0 0 0From/(To) Fund Bal 1,610 0 0 20,000
Total 1,610 0 0 20,000
Services100%
Expenditures by Type
From/(To) Fund Bal
100%
Revenue Sources by Type
This program involves the rehabilitation and restoration of an existing 200,000 square foot historic building located at 302 North 3rd Street for the development of market rate apartments and commercial retail and office space.
~This is included in the Downtown TIF and is based on a pay-as-you-go basis.~The project uses other economic development incentives including a Sales Tax Reimbursement Agreement (STRA), Chapter 100 Bond and Community Improvement District (CID).~The project was approved in March of 2018.

Special Allocation Fund
EBR TIFProgram 5175
Program Description
2017-18 2018-19 2019-20Adopted Estimated
Staffing Detail Actual Budget Actual Budget
N/A 0 0 0 0
Major Budgetary Changes & Program Highlights
Operating Budget Summary
2017-18 2018-19 2019-20Adopted Estimated
Actual Budget Actual BudgetExpenditures:Services 75,996 133,145 133,145 72,416TIF Reimbursements 245,834 244,480 244,480 250,000
Total 321,830 377,625 377,625 322,416Sources:PILOTS 246,633 228,360 230,054 244,485EATS 164,543 161,130 161,130 156,750Interest/Other 11,376 345 18,482 12,142From/(To) Fund Bal (100,723) (12,210) (32,041) (90,961)
Total 321,830 377,625 377,625 322,416
Services5%
TIF Reimbursements
78%
Expenditures by Type
PILOTS59%
EATS38%
Interest/Other3%
Revenue Sources by Type
This program tracks the revenues and expenditures for the project(s) at the EBR/HHS redevelopment site. Sinceinception, the project has become the sole responsibility of EBR. This is a mixed use commercial space/office spaceproject. The TIF project was approved August 2005.
~This TIF is based on a pay-as-you-go basis. Development began in 2007 with the opening of one restaurant. Twoadditional restaurants opened in 2008.~Construction is complete on the business office portion of the project.
10 - 24
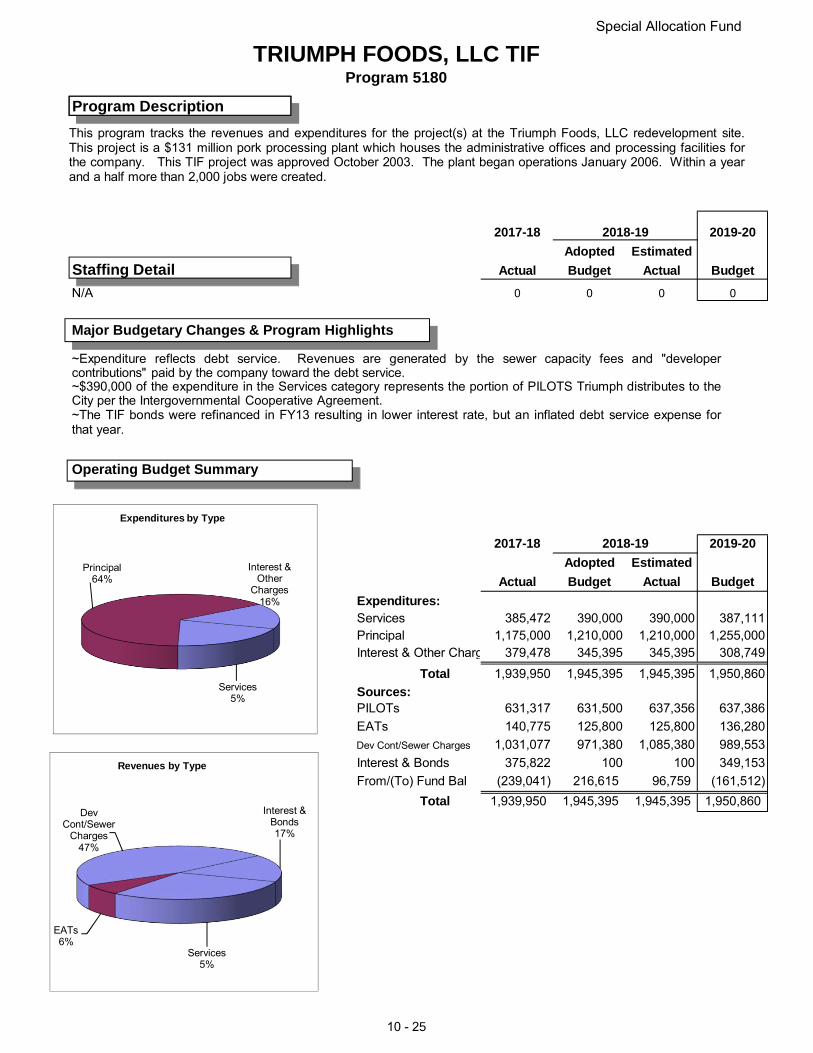
Special Allocation Fund
TRIUMPH FOODS, LLC TIFProgram 5180
Program Description
2017-18 2018-19 2019-20Adopted Estimated
Staffing Detail Actual Budget Actual Budget
N/A 0 0 0 0
Major Budgetary Changes & Program Highlights
Operating Budget Summary
2017-18 2018-19 2019-20Adopted Estimated
Actual Budget Actual BudgetExpenditures:Services 385,472 390,000 390,000 387,111Principal 1,175,000 1,210,000 1,210,000 1,255,000Interest & Other Charg 379,478 345,395 345,395 308,749
Total 1,939,950 1,945,395 1,945,395 1,950,860Sources:PILOTs 631,317 631,500 637,356 637,386EATs 140,775 125,800 125,800 136,280Dev Cont/Sewer Charges 1,031,077 971,380 1,085,380 989,553Interest & Bonds 375,822 100 100 349,153From/(To) Fund Bal (239,041) 216,615 96,759 (161,512)
Total 1,939,950 1,945,395 1,945,395 1,950,860
Services5%
Principal64%
Interest & Other
Charges16%
Expenditures by Type
Services5%
EATs6%
Dev Cont/Sewer
Charges47%
Interest & Bonds17%
Revenues by Type
This program tracks the revenues and expenditures for the project(s) at the Triumph Foods, LLC redevelopment site.This project is a $131 million pork processing plant which houses the administrative offices and processing facilities forthe company. This TIF project was approved October 2003. The plant began operations January 2006. Within a yearand a half more than 2,000 jobs were created.
~Expenditure reflects debt service. Revenues are generated by the sewer capacity fees and "developercontributions" paid by the company toward the debt service.~$390,000 of the expenditure in the Services category represents the portion of PILOTS Triumph distributes to theCity per the Intergovernmental Cooperative Agreement.~The TIF bonds were refinanced in FY13 resulting in lower interest rate, but an inflated debt service expense forthat year.
10 - 25

Special Allocation Fund
FOUNTAIN CREEK TIFProgram 5185
Program Description
2017-18 2018-19 2019-20Adopted Estimated
Staffing Detail Actual Budget Actual Budget
N/A 0 0 0 0
Major Budgetary Changes & Program Highlights
Operating Budget Summary
2017-18 2018-19 2019-20Adopted Estimated
Actual Budget Actual BudgetExpenditures:Services 95 100 100 95
Total 95 100 100 95Sources:PILOTS 2,019 2,021 4,071 4,071From/(To) Fund Bal (1,924) (1,921) (3,971) (3,976)
Total 95 100 100 95
This program tracks the revenues and expenditures for the Fountain Creek TIF. This is a proposed TIF comprised ofretail, commercial space, and multi-family units. The project is located in the southwest corner of South 22nd Streetand Highway 752.
~Although a TIF was approved, no activity has occurred with the project. Expenditures represent the City's legaland other professional costs.
Services100%
Expenditures by Type
Services100%
Resources by Type
10 - 26

Special Allocation Fund
TUSCANY TOWERS TIFProgram 5195
Program Description
2017-18 2018-19 2019-20Adopted Estimated
Staffing Detail Actual Budget Actual Budget
N/A 0 0 0 0
Major Budgetary Changes & Program Highlights
Operating Budget Summary
2017-18 2018-19 2019-20Adopted Estimated
Actual Budget Actual BudgetExpenditures:Services 16,633 5,000 5,000 18,050TIF Reimbursements 0 55,000 55,000 294,947
Total 16,633 60,000 60,000 312,997Sources:PILOTS 244,870 124,000 255,664 201,262EATS 90,309 30,000 30,000 75,839From/(To) Fund Bal (318,546) (94,000) (225,664) 35,896
Total 16,633 60,000 60,000 312,997
This program tracks the revenues and expenditures for the project(s) at the Tuscany Towers Redevelopment site. Thisproject targets the redevelopment of property just to the south of the North Shoppes project. Plans call for retail andoffice space, as well as a destination hotel. This TIF project was approved August 2005. A majority of the TIF revenueswill go to sanitary sewer and street improvements.
~TIF reactivated during FY15.~Currently in construction phase.~To date development added a gas station with restaurant, hotel, and urgent care clinic.
Services5%
TIF Reimbursements94.2%
Expenditures by Type
PILOTS64%
EATS24%
From/(To) Fund Bal
12%
Revenues by Type
10 - 27

Fund Budgeting The City uses a style of accounting (called “fund accounting”) required for all governmentaljurisdictions in order to segregate and account for restricted resources. Such accounting arose in response to the special limitations placed on significant amounts of the resources provided to jurisdictions by legal ordinances, grantors, and other revenue providers. Government resources are allocated to, and accounted from, individual funds based on the purposes for which they are to be spent and means by which spending activities are controlled
The operations of each City fund are budgeted and accounted for with a separate set of self-balancing accounts that comprise its assets, liabilities, fund equity, revenues, and expenditures as appropriate.
Below are brief descriptions of each City fund and the major programs included in each. Following this brief explanation are fund summaries showing a three-year history of revenues and expenditures by type.
Types of Funds
General Fund The General Fund is used to account for City financial resources not otherwise required or designated to be accounted for in another fund. Departments in the General Fund are:
• Administrative Services• City Clerk
• Municipal Court (Court Services Is apart of Administrative Services)
• City Manager’s Office • Parks, Recreation & Civic Facilities• Fire • Planning & Community Development• Health • Police• Legal • Public Works• Mayor and Council
Special Revenue Funds Special Revenue Funds are used to account for the proceeds of specific revenue sources that are constitutionally or by statute limited to expenditures for specific purposes. Special Revenue Funds consist of:
• Streets Maintenance Fund • Community Development Block Grant• Parks Maintenance Fund (CDBG) Fund• Gaming Initiatives Fund • Museum Tax Initiatives Fund• Special Allocation Fund (TIFS) • Public Safety Tax Fund
Enterprise Funds Enterprise Funds are used to account for operations; (a) that are financed and operated in a manner similar to private business enterprises – where the intent of the governing body is that the cost of providing goods or services to the general public on a continuing basis be financed or recovered primarily through use charges; or (b) where the governing body has decided that periodic determination of revenue earned, expenses incurred, and net income or loss is appropriate for capital maintenance, public policy, management control,
11 -1

Types of Funds (continued)
accountability or other purposes. The City has six Enterprise Funds which are:
• Aviation Fund • Public Parking Fund• Water Protection Fund • Municipal Golf Fund• Mass Transit Fund • Landfill Fund
Capital Project Fund Capital Project Fund is used to account for financial resources and expenditures associated with the acquisition and/or construction of major capital facilities for governmental funds. Capital project resources and expenditures associated with non-governmental funds, i.e., Enterprise Funds, are recorded in those funds. The City’s capitalized project program tracks the active projects from the 1993, 1998, 2003 and 2008 CIP Sales Tax Initiatives. Projects authorized in each voter approved initiative are tracked with identifying project numbers.
Debt Service Fund The Debt Service Fund is used to account for the accumulation of resources for the payment of General Obligation (G.O.) debt. The City has one Debt Service Fund. The City currently has no outstanding G.O. debt.
Basis of Budgeting
Basis of budgeting refers to when revenues and expenditures are recognized in the accounts andreported in the financial records of the City, regardless of the measurement focus applied.
Modified Accrual All governmental funds are budgeted using the modified accrual basis of accounting. Revenues are recognized when they become measurable. A revenue is “Measurable” when the amount of the transaction can be reasonably determined. Sales taxes, property taxes, motor fuel taxes, utility franchise fees, and reimbursement type grants are major revenue sources that meet these criteria. Expenditures are generally recognized when the related fund liability is incurred.
Accrual Enterprise funds are budgeted using the accrual basis of accounting. Revenues are recognized when they are earned, and expenses are recognized when they are incurred.
Encumbrances
Encumbrance accounts, under which purchase orders, contracts, and other commitments for theexpenditure of monies are recorded, are extensions of formal budgetary control. Unencumbered appropriations lapse at year-end.
Interfund Transactions
Transactions between funds are reflected as operating transfers in the accompanying budgetdocument. Transfers to and from the various funds sometimes don’t agree in the Annual Budget document because offsetting transfers are in funds for which no budgets are prepared including the CDBG re-programmable funds and General Fund Emergency Reserves.
11-2

2017-18 2019-20Adopted Estimated
Actual Budget Actual Budget
199,397 252,894 210,137 232,187 251,006 219,895 227,342 185,892 578,757 1,459,099 1,350,811 893,558
Human Resources 427,895 - - 472,047 724,220 828,737 790,937 758,249
1,607,264 1,891,020 2,217,189 1,996,751 3,157,498 2,482,246 2,469,915 2,499,901
527,360 541,174 552,396 540,288 14,765,080 16,365,245 16,374,113 15,427,202 12,493,452 13,351,823 12,833,454 12,730,465 12,977,026 11,946,571 11,391,145 13,241,636 6,458,722 6,132,567 6,004,939 5,671,857 3,776,135 4,062,287 4,243,772 3,970,053 2,493,205 2,268,942 1,570,552 1,916,279
TOTAL USES 60,437,015 61,802,502 60,236,702 60,536,365Non Departmental & Cell Phone
PoliceFirePublic Works (Admin, Streets, Eng)Parks, Recreation & Civic FacilitiesHealth Department
City Manager
LegalPlanning & Community DevelopmentAdministrative ServicesMunicipal Court
GENERAL FUND 2018-19
USES BY DEPARTMENT (rounded to nearest $)City CouncilCity Clerk
City Council0%City Clerk
0%City Manager
2%
Human Resources1%
Legal1%
Planning & Community
Development3%
Administrative Services
4%
Municipal Court1%
Police26%
Fire21%
Public Works (Admin, Streets,
Eng)22%
Parks, Recreation & Civic Facilities
9%Health
Department7%
Non Departmental & Cell Phone
3%
Uses of General Fund Revenues By DepartmentExcluding Non-Department & Cell Phone
11 - 3

2017-18 2019-20Adopted Estimated
Actual Budget Actual Budget
12,942,788 13,799,16921,980,528 22,392,400 22,392,400 22,597,300 12,194,137 12,148,587 12,402,976 12,465,689
6,234,607 6,071,000 6,043,000 6,195,000 3,136,682 3,179,585 3,058,754 3,220,309 1,328,224 1,457,060 1,396,060 1,398,421 1,226,751 1,395,660 1,395,660 1,395,660 1,055,291 980,000 980,000 1,020,000
343,259 370,000 331,483 370,000 1,396,840 1,496,516 1,761,097 1,501,854
844,885 845,417 844,489 853,804 50,838 36,000 50,880 40,650
627,572 710,325 628,325 673,325 198,121 70,345 254,213 246,267 713,006 315,305 816,103 392,625
(96) - - - 8,187,916 8,855,098 8,737,643 7,961,222
- - - -
59,518,562 60,323,298 61,093,083 60,332,126
27,115,610 27,115,610 28,105,454 27,855,583 13,861,504 15,240,519 15,352,756 15,223,691
1,601,038 1,858,514 1,888,364 1,398,474 7,448,234 7,750,954 7,901,565 7,754,837
197,788 196,209 196,209 196,500 4,244,308 2,589,155 2,183,075 2,267,280 5,968,533 4,294,451 4,609,278 5,840,000
60,437,015 59,045,411 60,236,702 60,536,365856,381 (204,240)
13,799,169 13,594,930
1,757,904 1,911,5346,088,966 5,688,7505,952,299 5,994,646
AssignedUNASSIGNED FUND BALANCE:
TOTAL USESNet Surplus (Deficit)
TOTAL SOURCES
USESSalaries & WagesEmployee Benefits & Payroll Taxes
Reserved
ENDING BALANCE:Components of Fund Balance:
Materials & SuppliesUtilities & Other Outside ServicesDebt Service, Property Ins, ElectionsTransfers OutCapital Outlay
FinesInvestment EarningsOther
Transfers InFund Balance Appropriation
Special Assessment
Mototr Fuel TaxCigarette TaxOperating GrantsOther GrantsRents
Property TaxUtility TaxCharges for ServiceLicenses & PermitsHotel Tax
GENERAL FUND 2018-19
SOURCES Beginning FB:Sales Tax
Sales Tax37%
Property Tax21%
Utility Tax10%
Charges for Service
5%
Licenses & Permits
2%Hotel Tax
2%
Mototr Fuel Tax2%
Cigarette Tax1%
Operating Grants
2% Fines1%
Fund Revenue Sources
Salaries & Wages
47%
Employee Benefits &
Payroll Taxes25%
Materials & Supplies
2%
Utilities & Other
Outside Services
13%
Debt Service, Property Ins,
Elections1%
Transfers Out4%
Capital Outlay9.65%
Fund Uses
11 - 4

2017-18 2018-19 2019-20Adopted Estimated
Actual Budget Actual Budget
Property Tax7,233,795 7,171,698 7,285,369 7,357,053
497,484 489,311 501,231 501,231 198,491 244,440 244,440 244,440
13,626 18,100 18,100 18,100 62,752 70,390 70,390 70,390
2,507,216 2,465,122 2,510,898 2,510,897 172,097 168,500 172,350 172,350
47,893 42,140 42,140 42,140 148,010 131,680 139,451 139,271
10,161 9,550 9,550 9,550 689,966 720,100 772,036 765,075
- - - - 96,328 96,004 98,873 97,042 60,937 63,890 63,890 63,890
455,380 457,662 474,259 474,260 12,194,137 12,148,587 12,402,976 12,465,689
Utility Franchise TaxesGas 492,454 456,000 490,000 490,000 Electric 2,665,667 2,640,000 2,540,000 2,640,000 Water 679,839 600,000 638,000 690,000 Telephone 1,492,278 1,450,000 1,450,000 1,450,000 Cable 735,750 760,000 760,000 760,000 Utility EATS (TIF generated utility taxes 168,620 165,000 165,000 165,000
6,234,607 6,071,000 6,043,000 6,195,000Sales Tax
Sales Tax 13,325,295 13,359,000 13,359,000 13,359,000 Vehicle Sales Tax 704,184 660,000 660,000 700,000 Use Tax 3,888,914 4,305,100 4,305,100 4,510,000 Sales Tax Contra Account (4,531,727) (4,632,300) (4,632,300) (4,632,300) 1/2 Percent Sales Tax 6,660,014 6,675,600 6,675,600 6,675,600 Cigarette Tax 343,259 370,000 331,483 370,000 Hotel/Motel Tax 1,190,406 1,272,960 1,272,960 1,272,960 Riverfront Dev Hotel.Motel Tax 36,345 122,700 122,700 122,700 EATS (TIF generated sales tax) 2,638,032 2,685,000 2,685,000 2,685,000 Vehicle Fees 351,107 320,000 320,000 320,000
24,605,830 25,138,060 25,099,543 25,382,960Licenses
Business Licenses 824,439 961,000 900,000 900,000 Liquor Licenses 96,457 100,000 100,000 97,000 Server (Alcohol) License 26,845 28,000 28,000 26,640 Dog/Cat License 53,078 49,000 49,000 49,000 Trade License/Exam Fees 76,804 75,000 75,000 77,380 Garage Sale Licenses 7,287 8,000 8,000 8,000 Contractor License - 4,500 4,500 6,140
1,084,910 1,225,500 1,164,500 1,164,160Permits
Septic Tank Permits 480 240 240 240 Pool/Spa Permit 1,847 2,100 2,100 2,100 Food Establishment Permits 86,088 90,000 90,000 88,537 Food Handler Permits 1,386 720 720 720 Special Use Permits 29,272 22,000 22,000 26,864 Sidewalk/Street Permits 4,830 7,500 7,500 7,500
Financial Institituion TaxRailroad Tax
Prior P/P TaxPrior Public Safety P/P TaxMerchants & Manufacturers TaxPayments in Lieu of Tax - CityPayments in Lieu of Tax - Other
Prior Public Safety R/E TaxReal Estate Penalty & InterestCurrent Personal PropertyCurrent Personal Public SafetyP/P Penalty & Interest
GENERAL FUND REVENUES
Current Real Estate TaxCurrent Real Estate Public Saftey TaxPrior Real Estate Tax
11 - 5

2017-18 2018-19 2019-20Adopted Estimated
Actual Budget Actual Budget
GENERAL FUND REVENUES
Land Disturbance Permits 10,040 9,000 9,000 9,000 Street/Utility Permits 29,105 18,000 18,000 18,000 Special Event Permits 1,024 1,400 1,400 1,400 Alarm Ordinance Permits 47,121 47,000 47,000 48,000 Fire Inspection Permits 30,400 32,000 32,000 30,400 Petting Zoo Permits 350 400 400 400 Breeder Permits 220 200 200 100 Litter Permits 1,150 1,000 1,000 1,000
243,313 231,560 231,560 234,261Fines
Municipal Court Fines/Costs 480,972 582,000 500,000 532,000 Crime Victims' Compensation 2,862 3,000 3,000 3,000 DWI Enforcement Revenue 9,487 9,000 9,000 9,000 Police Training Revenue 15,475 15,000 15,000 15,000 State DWI Enforcement Revenue 14,517 15,000 15,000 15,000 Judicial Education Revenue 7,738 9,025 9,025 9,025 Liquor Establishment Penalty 6,000 5,000 5,000 3,000 Warrant Processing Fees 4,704 1,300 1,300 1,300 Cash Bond Forfeitures 32,228 25,000 25,000 35,000 Surety Bond Forfeitures 2,250 1,000 1,000 1,000 Administrative Code Penalties 51,340 45,000 45,000 50,000
627,572 710,325 628,325 673,325Rents
Communication Tower Lease 16,692 17,000 17,000 16,100 Parks/Pools Rental 34,147 19,000 33,880 24,550
50,838 36,000 50,880 40,650Parking Permits/Fees
Parking Permits 1,225 1,000 1,000 1,000
Inspection FeesBoiler Inspections - - - 62,000 Mechanical Perms 45,204 62,000 62,000 45,500 Building Permits 126,300 180,000 180,000 167,700 Electrical Permits 56,644 55,000 55,000 58,400 Plumbing Permits 33,214 40,000 40,000 40,490 Certificate of Occupancy Fee 10,946 12,000 12,000 12,400 Other Inspections - Signs 7,358 1,000 1,000 6,800
279,666 350,000 350,000 393,290Health Fees
Medicaid Fees 124,522 120,300 120,300 115,150 Breast Pump Kits 220 - - - Pregnancy Test Fees 850 1,100 1,100 500 HIV/STD Test Fees 2,850 2,500 2,500 2,500 Shelter Fees 40,608 43,000 43,000 43,000 Rabies Clinic Fees 4,600 3,200 3,200 4,000 Animal Microchip Fees 11,735 10,500 10,500 10,500 Vicious Animal Impound Bond 120 240 240 240 Dog Park Fee 3,860 2,000 2,000 2,500 Vet Fees - - - 41,500 Birth/Death Certificates 156,268 130,000 130,000 130,000 Vaccinations/Immunizatons 60 - - - VaxCare Immunizations 5,461 7,000 7,000 6,000 Individual TB Testing 3,330 1,400 1,400 1,400 Health Testing - DOC 2,906 3,000 3,000 3,000
11 - 6

2017-18 2018-19 2019-20Adopted Estimated
Actual Budget Actual Budget
GENERAL FUND REVENUES
357,389 324,240 324,240 360,290Recreation Fees
Swimming Pools - Daily Fees 6,808 6,000 6,691 6,000 Aquatic Park - Daily Fees 101,013 100,000 90,696 100,000 Swimming Pools - Punch Cards - - - - Aquatic Park - Punch Cards 4,880 6,000 4,545 6,000 Swimming Lessons 626 - - - Youth Sports -Basketball/Volleyball 111,156 130,120 84,422 130,120 Fall Softball 11,875 15,750 6,050 15,750 Summer Softball 21,665 38,400 22,000 38,400 Parkway Run Fees 3,110 2,000 2,000 2,000 REC Center Fees - - - - REC Center Rental 10,894 6,000 12,889 6,000 Individual Day Pass 30,810 30,000 30,149 30,000 Adventure/Sport Camp 37,463 30,000 30,000 30,000 Other Recreation Fees 46,699 50,500 43,747 50,500 REC Center Fitness Memberships 80,964 65,500 65,500 65,500 REC Center Fitness Classes 25,638 21,000 26,248 21,000 Concessions - REC Center 36,111 40,000 40,000 40,000 Concessions - Pools 45,344 41,375 41,375 40,960 Concessions - Ball Fields/Vending 115,958 158,400 158,400 74,400 MWSU Aquatic Fees 7,570 10,000 7,507 10,000 Concessions - Senior Citizen Cafeteria 24,553 25,000 28,275 25,000
723,136 776,045 700,494 691,630Nature Center Fees
Nature Center Admissions 32,646 58,000 33,769 58,000 Nature Center Memberships 23,290 25,000 25,083 25,000 Nature Center Gift Shop 33,276 30,000 22,370 30,000 Concessions - Nature Center - - - - Nature Center Program Income 10,568 6,500 9,938 6,500
99,780 119,500 91,160 119,500Civic Facilities Charges
Civic Arena Rental 80,004 100,000 83,000 101,000 Civic Arena Equipment Rental 50,071 60,000 50,000 50,000 Meeting Room Rental 15,732 16,000 14,744 15,000 Missouri Theater Office Rent 12,900 12,875 14,575 12,900 Special Civic Arena Promotions 68,617 25,000 42,000 40,000 Concessions - Civic Center 223,244 187,400 187,400 186,086 Move in/out Fees 21,500 20,000 23,500 20,000 Missouri Theater Rental 39,525 40,000 37,200 38,275 Reimbursed Events Payroll - - - -
511,592 461,275 452,419 463,261Bode Complex Charges
Bode Complex Revenue 15,827 23,000 14,210 22,500 Skating Lessons 44,001 40,000 35,898 30,000 Ice Rental - Hocky 32,500 28,000 34,186 32,000 Ice Rink Admissions 80,213 78,000 69,712 78,000 Ice Rental - Figure Skating 23,733 18,000 17,800 18,000 Ice Rental - General 70,142 60,000 59,231 67,000 Advertising 8,815 8,000 1,065 8,000
275,231 255,000 232,102 255,500Charges for Services
Copies of Public Documents 12,005 9,400 9,400 9,400 Plan Review/Archiving Fees 45,842 63,500 63,500 63,000 Archiving Fees 2,317 3,000 3,000 3,000 Finance Administration Fees 288,193 275,000 275,000 275,000
11 - 7

2017-18 2018-19 2019-20Adopted Estimated
Actual Budget Actual Budget
GENERAL FUND REVENUES
Trash/Weed Abatement 84,446 90,000 90,000 100,000 Identification Cards 981 500 500 500 Animal Cremation Services 10,055 9,300 9,300 9,300 County Health Contract 72,375 72,000 72,000 73,404 Fire District Contracts 425,834 425,825 440,639 453,858 Non Criminal Fingerprint Fee 3,375 1,000 1,000 1,500 Non Criminal Fingerprint Fee 15,613 15,000 15,000 20,280 State Health Contract 148,214 147,602 147,602 147,602 State MCH Health Contract 47,901 46,611 81,646 46,229 Childrens Lead Prevention 44,301 55,000 58,021 - Outreach Service Contract 2,740 3,716 5,290 1,758 State WIC Contract 386,236 359,592 359,592 353,079
1,590,429 1,577,046 1,631,490 1,557,910Other Revenue
Sale of Fixed Assets 16,425 - - - Insurance Proceeds 12,360 - 4,000 7,000 Girft Certificate Revenue 826 - - - Concessions - Vending Machines 5,538 6,150 6,150 5,240 Donations 259,397 55,588 252,123 75,588 Taser Reimbursement - 50 50 50 Recycling Revenue 1,485 2,300 3,227 2,800 Nonrefundable Bid Deposits 5,685 4,000 4,000 4,000 Recovery/Reimbursements 175,714 55,182 352,968 105,612 Refunds of Prior Year Expenses 1,431 - 150 - Other Revenues Over/Short 169,082 127,120 129,220 127,420 MO Tax Credits 65,063 64,915 64,915 64,915 Bond Proceeds - - - -
713,006 315,305 816,803 392,625Other Revenue
Princpal on Special Assessments (96) - - - (96) - - -
Investment EarningsInvestment Interest Income 188,067 63,945 247,813 239,067 MDFB Bonds Interest Income 1,723 1,000 1,000 1,800 Interest on Special Assessments 8,332 5,400 5,400 5,400
11 - 8

2017-18 2018-19 2019-20Adopted Estimated
Actual Budget Actual Budget
GENERAL FUND REVENUES
198,121 70,345 254,213 246,267Intergovernmental
Buchanan County LEC Operations 402,989 412,985 412,985 412,900 Emergency Preparedness 66,874 61,520 66,533 61,615 Immunizaton - Medicare - - - - Bode Trust 8,988 - - - HIV Prevention 59,835 57,482 57,482 57,478 HIV Service Coordination 93,539 92,000 92,000 92,000 POST 9,607 8,000 7,072 8,000 COPS in SCHOOLS 166,203 207,570 207,570 270,378 FEMA - - - - Bullet Proof Vest Grant 5,693 - 8,616 - MO Hwy Safety Project Grant 55,858 69,860 72,166 75,240 MO Emergency Management Grant 48,864 48,183 74,270 48,000 Edward Byrne Grant 3,355 - 59,384 - Child Care Inspections Agreement 3,650 - 4,770 4,770 Buchanan County 911 Maintenace 280,741 282,000 282,000 281,500 Heartland Health 911 Maintenance 70,185 70,432 70,432 78,000 SEMA - - - - FTA/CPG Grant 187,003 312,080 312,080 312,080 Miscellaneous Grants 76,576 35,300 153,375 31,625
1,539,959 1,657,412 1,880,735 1,733,586Interfund Transfers - Computer Network
Transit from SIMR 31,000 32,000 32,000 42,000 Transfer from P&R - 2,000 2,000 1,000 Transfer from CDBG Fund 6,000 6,000 6,000 6,000 Transfer from Aviation 4,000 4,000 4,000 4,000 Transfer from Water Protection Fund 34,000 36,000 - - Transfer from Landfill Fund 5,000 6,000 6,000 7,000 Transfer from Parking Fund 1,000 1,000 1,000 3,000 Transfer from Golf Course 3,000 3,000 3,000 4,000 Transfer from Transit Fund 12,000 12,000 12,000 10,000
Interfund Transfers In 96,000 102,000 66,000 77,000
Transfer from Parks & Rec - 39,560 39,560 54,597 Transfer from Pub Safety Tax 4,920,140 5,518,270 5,518,270 4,694,499 Transfer from CDBG Fund 196,094 202,629 202,629 204,775 Transfer from Gaming Initiatve Fund 55,000 55,000 55,000 50,000 Transfer from Parking Fund 75,347 - - - Transfer from Water Protection Fund 1,908,310 2,148,352 1,966,897 2,044,411 Transfer from Municipal Golf Fund 21,409 - - - Transfer from Mass Transit Fund 239,506 119,135 119,135 128,220 Transfer from Landfill Fund 615,422 610,892 710,892 649,840 Transfer from Museum 60,687 59,260 59,260 57,880
8,091,916 8,753,098 8,671,643 7,884,222Transfer from/(to) Fund Balance
Fund Balance Appropriations - - - -
Total 59,518,562 60,323,298 61,093,083 60,332,126
11 - 9

2017-18 2018-19 2019-20Adopted Estimated
Actual Budget Actual Budget
Salaries & WagesBase Salaries/Wages 24,496,954 26,535,311 25,877,784 26,444,334 Salary Increases - 545,621 (379,379) (1,093,923) Overtime 1,279,710 1,246,345 1,255,301 1,240,582 FLSA Overtime (Fire Dept) 219,625 198,430 198,430 198,430 Temp-Part Time Wages 894,085 1,083,487 889,490 913,665 Out-of-Title Pay 95,536 130,687 130,687 6,525 Sick Leave Buy Back 11,884 16,993 16,993 10,970 Retired Consultant's Pay 117,815 115,825 115,825 135,000
27,115,610 29,872,700 28,105,132 27,855,583Employee Benefits
Police Pension Contribution 2,175,524 2,193,877 2,623,693 1,917,922 Lagers Pension Contribution 4,248,371 4,826,498 4,773,240 4,891,414 FICA Contribution 868,056 946,673 932,632 928,980 FIM Medicare 382,837 423,954 414,700 418,874 457 Plan Employer Match 202,923 213,232 213,232 174,530 Health Insurance 4,011,074 4,411,464 4,203,145 4,673,584 Dental Insurance 145,080 169,403 169,315 187,752 Life Insurance 80,508 89,483 89,464 91,202 Unemployment Insurance 11,330 206 206 - Long Term Disability 58,740 71,646 69,832 72,752 Workers Compensation 1,041,057 1,164,769 1,150,124 1,143,815 Uniform Allowance 344,712 364,500 364,500 366,000 EMT Allowance 23,333 25,500 25,500 25,750 Car/Mileage Allowance 48,121 41,164 42,275 35,746 Confer/Train/Travel 219,837 298,150 280,898 295,370
13,861,504 15,240,519 15,352,756 15,223,691Materials & Supplies
Office Supplies 73,156 89,910 82,650 83,414 Police Evidence Supplies 5,406 7,000 6,047 6,500 Photo Supplies 798 1,200 1,600 1,600 Janitorial Supplies 63,636 70,650 61,900 63,970 Recreation Supplies 112,784 102,690 105,490 84,497 Safety Equip/Clothing 92,927 85,780 186,485 83,380 Chemical/Drugs/Medical Supplies 28,760 36,800 102,397 37,950 Motor Fuel and Lubricants 428,235 656,035 491,048 572,590 Minor Equipment 297,752 276,777 277,257 240,855 Traffic & Lighting Supplies - - 525 - Materials & Supplies for Resale 210,707 228,100 199,150 151,079 Other Materials/Supplies 286,877 303,572 374,515 72,639
1,601,038 1,858,514 1,889,064 1,398,474Services
Employment Services 188,453 196,705 190,105 182,705 Professional Services 778,115 676,495 868,059 690,816 Recruitment Costs 68 3,000 1,500 - Memberships 66,128 61,109 62,219 58,529 Periodicals & Books 22,169 29,640 23,495 20,095
GENERAL FUND EXPENDITURES
11 - 10

2017-18 2018-19 2019-20Adopted Estimated
Actual Budget Actual Budget
GENERAL FUND EXPENDITURES
Communication Services 373,201 430,027 431,737 442,037 Postage 44,659 58,400 45,383 42,890 Freight 1,333 1,300 1,435 1,400 Advertising 101,275 123,690 118,863 111,359 Permits & Recording Fees 4,974 6,020 6,095 6,020 Printing & Binding 27,442 45,600 38,134 37,650 Gas Service 116,224 136,000 132,661 134,895 Electric Service 661,636 548,650 507,908 541,220 Water Service 87,247 56,715 119,921 108,835 Vehicle/Equipment Rent 148,941 167,974 152,779 132,378 Facility Rent Lease 61,400 61,400 44,000 44,000 M&R - Office Equipment 234,872 464,635 452,759 562,344 M&R - Building & Facilities 459,084 554,907 415,159 427,671 M&R - Machinery & Equipment 79,761 105,212 101,462 97,502 M&R - Motor Vehicles 801,085 738,380 752,843 696,660 M&R - Communications Equipment 1,132,995 1,141,321 1,138,371 1,107,230 Major Maintenance & Repairs 23,669 40,000 40,300 5,000 Custodial Services - - - - Towing Services 7,514 10,350 12,408 12,350 Laundry Services 28,033 33,811 32,271 31,211 Solid Waste Disposal Services 31,418 36,530 35,530 43,020 MO DNR Fees 724 670 545 670 Special Contributions 1,047,796 1,049,108 1,080,900 1,037,108 Other Services 482,590 509,566 623,774 600,673
7,012,805 7,287,214 7,430,615 7,176,268Other Charges
Principal 140,000 145,000 145,000 155,000 Interest 50,625 44,325 44,325 37,800 Other Debt Charges 7,163 6,884 6,884 3,700 Insurance 347,860 382,990 382,990 527,819 Judgments & Claims 18,782 44,500 44,500 44,500 Election Expenses 68,787 30,000 36,832 - Refund Expenses - 6,250 6,250 6,250
633,217 659,949 666,781 775,069Capital Outlay
Office Equipment & Furniture 194,917 9,000 9,000 - Motor Vehicles 62,168 370,290 321,790 265,000 Machinery & Equipment 237,302 25,000 50,388 - Radio & Communications Equipmen 506,855 - - 150,000 Software Purchases 205,687 106,000 164,554 -
1,206,929 510,290 545,732 415,000 Capital Improvements
Building - - - - Street, Curbs, Sidewalks 4,599,095 3,708,000 3,700,000 5,400,000 Improv Other Than Buildings 162,509 76,161 363,546 25,000
4,761,604 3,784,161 4,063,546 5,425,000 Interfund Transfers
Transfer to Streets Maintenance 2,498,398 1,236,000 1,159,000 1,183,000 Transfer to Parks Maintenance 393,825 431,840 225,690 348,840 Transfer to Public Safety Tax - - - 317,756 Transfer to Aviation 20,000 100,000 - 30,000 Transfer to Public Parking 373,274 419,455 339,455 320,852 Transfer to Water Proteection - - - - Transfer to Golf 196,824 47,360 104,430 66,832 Transfer to Capital Projects 761,987 354,500 354,500 -
4,244,308 2,589,155 2,183,075 2,267,280
Total 60,437,015 61,802,502 60,236,702 60,536,365
11 - 11

2017-18 2018-19 2019-20Adopted Estimated
Actual Budget Actual Budget
SOURCES Beginning FB: 492,199 327,023Streets & Highway Taxes 2,768,885 2,765,740 2,765,740 2,765,740 Charges for Service 259,493 250,000 250,000 250,000 Other Revenue 59,815 42,000 42,000 57,000 FEMA Reimbursements - - - - Investment Earnings 16,195 450 24,569 24,570 Special Assessments 6,700 6,750 6,750 6,750 Transfers In 2,498,398 1,286,000 1,209,000 1,233,000 Fund Balance Appropriation - - - -
TOTAL SOURCES 5,609,487 4,350,940 4,298,059 4,337,060
USES Materials & Supplies 1,123,941 1,436,400 1,439,017 1,603,400 Other Outside Services 704,652 764,540 755,540 788,145 Utilities 1,570,830 1,371,000 1,541,578 1,541,600 Operating Capital Equipment 645,182 183,000 131,100 92,000 Capital Improvements 1,548,529 564,000 564,000 200,000 Transfers Out 31,000 32,000 32,000 42,000
TOTAL USES 5,624,133 4,350,940 4,463,235 4,267,145
Net Surplus (Deficit) (14,646) (165,176) 69,915
ENDING RESERVED FUND BALANCE: 492,199 327,023 396,938
STREETS MAINTENANCE FUND SUMMARY
Streets & Highway Taxes64%
Other Revenue
1%FEMA
Reimbursements
0%
Investment Earnings
1%
Transfers In
28%
Fund Revenue Sources
Materials & Supplies
38%
Other Outside Services
18%
Capital Equipmnt
2%
Capital Imprvmnts
5% Capital Imprvmnts
1%
Fund Uses
11 - 12

2017-18 2018-19 2019-20Adopted Estimated
Actual Budget Actual BudgetStreets & Highway Taxes
Fuel Tax 2,055,246 2,050,740 2,026,740 2,050,740 Road & Bridge Tax 713,639 715,000 739,000 715,000
2,768,885 2,765,740 2,765,740 2,765,740Charges for Services
Street Cut Repair 259,493 250,000 250,000 250,000 259,493 250,000 250,000 250,000
Other RevenueSale of Fixed Assets 40,500 32,000 32,000 32,000 Insurance Proceeds 2,572 - - - Sale of Gas & Oil - - - - Recycling Revenue 2,404 - - - Recovery/Reimbursements/PY Refunds 14,126 10,000 10,000 25,000 Refund Prior Year Expense 213 - - - Other Revenue - - - -
59,815 42,000 42,000 57,000Grants & Entitlements
FEMA - - - - SEMA - - - -
0 0 0 0Principal Earnings
Principal on Special Assessment 6,700 6,750 6,750 6,750 6,700 6,750 6,750 6,750
Investment EarningsInterest on Special Assessments 11 - - - Investment Interest Income 16,184 450 24,569 24,570
16,195 450 24,569 24,570Interfund Transfers In
Transfer from General Fund 2,498,398 1,236,000 1,159,000 1,183,000 Transfer from Gaming Fund - 50,000 50,000 50,000 Transfer from Landfill Fund - - - - 2,498,398 1,286,000 1,209,000 1,233,000
Transfer from/(to) Fund BalanceFund Balance Appropriations - - - -
Total 5,609,487 4,350,940 4,298,059 4,337,060
STREETS MAINTENANCE FUNDREVENUES
11 - 13

2017-18 2019-20Adopted Estimated
Actual Budget Actual Budget
Materials & SuppliesOffice Supplies 914 800 300 800 Safety Equip/Clothing 17,986 21,200 19,200 21,200 Motor Fuel and Lubricants 18,757 22,150 23,155 23,150 Minor Equipment 44,757 38,500 39,600 38,500 Street Maintenance Supplies 983,417 1,277,100 1,277,100 1,443,100 Traffic/Lighting Supplies 57,624 74,000 74,000 74,000 Other Materials/Supplies 486 2,650 5,662 2,650
1,123,941 1,436,400 1,439,017 1,603,400 Services
Employment Services - - - - Employment Services 110,072 195,000 195,000 195,000 Professional Services 9,000 11,000 11,000 11,000 Memberships 435 200 200 200 Periodicals & Books - 200 - 200 Communication Svcs 200 1,800 300 1,800 Postage 71 200 - 200 Freight 48 1,500 - 1,500 Advertising 1,414 - - - Printing & Binding - - - - Electric Service - Street Lighting 1,570,830 1,371,000 1,541,578 1,541,600 Vehicle/Equipment Rent 1,251 3,900 3,900 3,900 M&R - Building & Facilities 344,920 254,150 254,150 254,150 M&R - Machinery & Equipment 75 1,000 - 1,000 M&R - Motor Vehicles 94,485 96,000 93,000 96,000 M&R - Communications Equipment 3,800 3,800 3,800 3,800 Towing Services - 100 - 100 Laundry Services 2,200 2,200 2,200 2,200 MO DNR Fees - - - - Other Services 109,212 132,500 132,500 147,500
2,248,010 2,074,550 2,237,628 2,260,150 Other Charges
Computer Network Transfer 31,000 32,000 32,000 42,000 Insurance 27,471 59,490 59,490 68,095 Judgement & Claims - 1,500 - 1,500
58,471 92,990 91,490 111,595 Capital Outlay
Motor Vehicles - 35,000 - - Office Equipment & Furniture - - - - Machinery & Equipment 517,822 148,000 131,100 92,000 Radios 127,360 - - -
645,182 183,000 131,100 92,000 Public Improvements
Buildings 49,967 50,000 50,000 50,000 Improvements Other Than Buildings 168,990 166,000 166,000 - Streets, Curbs & Sidewalks 1,329,572 348,000 348,000 150,000
1,548,529 564,000 564,000 200,000
Total 5,624,133 4,350,940 4,463,235 4,267,145
STREETS MAINTENANCE FUNDEXPENDITURES
11 - 14

2017-18 2018-19 2019-20Adopted Estimated
Actual Budget Actual Budget
Projected Beginning Fund Balance: $255,898 $170,073 $189,052SOURCES
Parks Property Tax (Land Only) 730,643 717,040 728,501 728,501 City Sticker Tax 96,988 95,000 95,000 95,000 Rents 34,443 34,450 34,450 34,450 Operating Grants - - - - Other Grants 76,710 70,000 70,000 70,000 Interest 7,750 - 2,377 2,400 Other Revenue 5,347 2,000 2,000 2,000 Transfers In 393,825 431,840 225,090 348,840 Fund Balance Appropriation - - - -
TOTAL SOURCES 1,345,705 1,350,330 1,157,419 1,281,191
USES BY PROGRAMMaterials & Supplies 170,403 211,150 191,055 194,850 Outside Services 670,874 681,620 681,620 695,652 Utilities 195,175 220,000 177,205 220,000 Capital Equipment 87,462 192,500 35,000 113,000 Capital Improvemnets 307,616 38,500 12,000 - Transfers Out - 41,560 41,560 55,597
TOTAL USES 1,431,530 1,385,330 1,138,440 1,279,099
Net Surplus (Deficit) (85,825) (35,000) 18,979 2,092
Projected Ending Fund Balance: $170,073 $189,052 $191,144
Insurance 0Judgement & Claims
0 0 0
PARKS MAINTENANCE FUND SUMMARY
Parks Property Tax (Land Only)
57%
City Sticker Tax7%
Rents3%
Other Grants 6%
Interest0%Other Revenue
0%
Transfers In 27%
Fund Revenue Sources
Materials & Supplies
15%
Outside Services
55%
Utilities17%
Operating Capital
Equipment17%
Transfers Out4%
Fund Uses
11 - 15

2017-18 2018-19 2019-20Adopted Estimated
Actual Budget Actual BudgetProperty Tax
Current Park District Tax 690,062 681,000 692,461 692,461 Prior Park District R/E Tax 31,855 30,000 30,000 30,000 R/E Penalty & Interest 8,725 6,040 6,040 6,040
730,643 717,040 728,501 728,501Licenses
City Sticker & Penalty 96,988 95,000 95,000 95,000 96,988 95,000 95,000 95,000
RentsHorace Mann Rent 34,443 34,450 34,450 34,450
34,443 34,450 34,450 34,450Other Revenue
Sale of Fixed Assets - - - - Insurance Proceeds 533 - - - Concessions-Vending Machines - - - - Donations - - - - Recycling Revenue 1,564 - - - Other Revenue - - - - Refund Prior Yr Expense - - - - Recovery/Reimbursements 3,250 2,000 2,000 2,000
5,347 2,000 2,000 2,000Interst Earnings
Interest on Investments 7,750 - 2,377 2,400 7,750 - 2,377 2,400
Intergovernmental FEMA Reimbursement Funds - - - - SEMA Reimbursement Funds - - - - Bode Trust - - - - Parks Maintenance Trust 76,710 70,000 70,000 70,000
76,710 70,000 70,000 70,000Interfund Transfers In
Transfer from General Fund 393,825 431,840 225,090 348,840 393,825 431,840 225,090 348,840
Transfer from/(to) Fund BalanceFund Balance Appropriations - - - -
Total 1,345,705 1,350,330 1,157,419 1,281,191
REVENUESPARKS MAINTENANCE FUND
11 -16

2017-18 2018-19 2019-20Adopted Estimated
Actual Budget Actual BudgetMaterials & Supplies
Janitorial Supplies 6,251 5,000 5,000 5,000 Office Supplies - - - - Recreation Supplies 24,667 21,000 21,000 21,500 Safety Equip/Clothing 3,161 3,500 3,500 3,500 Chemical/Drugs/Medical Supplies - 150 150 150 Motor Fuel and Lubricants 86,139 125,000 104,905 105,000 Minor Equipment 25,219 31,500 31,500 34,700 Traffic & Lighting Supplies 24,966 25,000 25,000 25,000 Materials & Supplies for Resale - - - -
170,403 211,150 191,055 194,850Services
Professional Services 4,790 - - - Employment Services 220,000 220,000 220,000 240,000 Memberships - 20 20 20 Avertising - - - - Telephone Service 4,124 5,090 5,090 5,090 Gas Service 27,289 45,000 29,888 45,000 Electric Service 139,559 125,000 118,931 125,000 Water Service 28,328 50,000 28,386 50,000 Vehicle/Equipment Rent 328 2,700 2,700 2,700 M&R - Building & Facilities 145,611 130,000 130,000 130,000 M&R - Machinery & Equipment 16,791 20,000 20,000 20,000 M&R - Motor Vehicles 102,971 104,500 104,500 104,500 M&R - Communications Equipment 41 5,000 5,000 5,000 Major Repairs & Replacement - - - - Laundry Services 870 1,000 1,000 1,000 Solid Waste Disposal Svc - - - - MO DNR Fees 2,415 2,000 2,000 2,000 Other Services 52,116 58,500 58,500 58,500
745,231 768,810 726,015 788,810Interfund Transfers
Transfer to Computer Network - 2,000 2,000 1,000 Transfer to General Fund - 39,560 39,560 54,597
- 41,560 41,560 55,597 Other Charges
Insurance 120,080 130,810 130,810 124,842 Judgement & Claims 739 2,000 2,000 2,000
120,819 132,810 132,810 126,842Capital Outlay
Motor Vehicles - 35,000 35,000 32,000 Machinery & Equipment 87,462 157,500 - 81,000 Computer Software - - - -
87,462 192,500 35,000 113,000Capital Improvements
Buildings 80,703 12,000 12,000 - Improvements Other Than Buildings 226,913 26,500 - - Streets, Curbs & sidewalks - - - -
307,616 38,500 12,000 0
Total 1,431,530 1,385,330 1,138,440 1,279,099
EXPENDITURESPARKS MAINTENANCE FUND
11 - 17

2017-18 2018-19 2019-20Adopted Estimated
Actual Budget Actual BudgetSOURCES
Special Assessments/Interest Earnings 12,471 - - - Intergovernmental/Other Grants 1,345,539 2,236,370 2,273,570 2,132,921 Other Revenue 195,622 - - - Transfers (To)/From - Reprogrammable Funds 102,726 - 715,870 -
TOTAL SOURCES 1,656,359 2,236,370 2,989,440 2,132,921
USESSalaries & Wages 366,644 385,935 318,880 247,411 Employee Benefits & Payroll Taxes 152,067 196,037 166,862 134,731 Materials & Supplies 4,758 10,272 9,139 9,172 Utilities & Other Outside Services 1,292,043 1,528,925 2,278,674 1,695,122 Property Ins & Other 5,276 4,120 4,120 2,625 Transfers Out 202,094 208,629 208,629 210,775 Operating Capital Equip - - - -
TOTAL USES 2,022,882 2,333,918 2,986,303 2,299,836
Net Surplus (Deficit) to/from Reprogrammed Fnd (366,523) (97,548) 3,137 (166,915)
COMMUNITY DEVELOPMENT BLOCK GRANT FUNDSUMMARY
CDBG Entitlement
Funds100%
Fund Revenue Sources
Salaries & Wages
11%
Employee Benefits &
Payroll Taxes
6% Materials & Supplies
0%
Utilities & Other
Outside Services
74%
Transfers Out9%
Fund Uses
11 - 18

2017-18 2018-19 2019-20Adopted Estimated
Actual Budget Actual Budget
Other RevenuesLoss on Sale of Fixed Assets 43,157 - - - Refunds PY Expenditures 276 - - - Other Revenue 152,189 - - -
195,622 - - - Special Assessments
Principal 10,628 - - - Interest on Special Assessments 1,843 - - -
12,471 - - - Intergovernmental
Home Program Grant 242,708 342,189 342,189 469,763 Community Development Block Grant 1,097,750 1,894,181 1,931,381 1,663,158 American Rec Reinvst Grant - - - - Federal HMIS Grant 5,082 - - -
1,345,539 2,236,370 2,273,570 2,132,921 Interfund Transfers In
Transfer from Rehab Loan Fund - - 715,870 - Transfer from HOME Revolv Fund 102,726 - - -
102,726 - 715,870 - Transfer from/(to) Reprogrammable Funds
Appropriated from Fund Balance - - - -
Total 1,656,359 2,236,370 2,989,440 2,132,921
COMMUNITY DEVELOPMENT BLOCK GRANT FUNDREVENUES
11 - 19

2017-18 2019-20Adopted Estimated
Actual Budget Actual BudgetSalaries & Wages
Base Salaries/Wages 366,644 385,935 318,880 247,411 366,644 385,935 318,880 247,411
Employee BenefitsLagers Pension Contribution 39,887 45,540 37,627 30,184 FICA Contribution 22,899 23,927 19,770 15,339 FICA Medicare 5,356 5,596 4,624 3,587 457 Employer Match Plan 2,130 2,340 2,340 1,950 Health Insurance 60,255 64,637 51,376 44,340 Dental Insurance 2,171 2,492 2,492 1,765 Life Insurance 1,212 1,298 1,289 831 Long Term Disability 918 1,038 858 666 Workers Compensation 14,437 15,438 12,756 9,896 Car/Mileage Allowance 1,259 6,750 6,750 2,324 Confer/Train/Travel 1,542 26,981 26,981 23,849
152,067 196,037 166,862 134,731 Materials & Supplies
Office Supplies 1,931 5,800 5,800 5,800 Motor Fuel 1,274 1,600 467 500 Minor Equipment 1,553 1,855 1,855 1,855 Other Materials/Supplies - 1,017 1,017 1,017
4,758 10,272 9,139 9,172 Services
Employment Services - - - - Professional Services 84,076 110,000 110,000 110,000 Memberships 4,281 1,595 1,595 1,560 Periodicals & Books 436 1,000 1,000 1,000 Telephone Service 2,059 5,320 5,320 5,320 Postage 2,813 7,800 7,800 7,800 Freight - - - - Advertising 15,184 26,080 26,080 26,080 Permits & Recording Fees 5,130 2,245 2,245 2,245 Printing & Binding 284 2,160 2,160 2,160 Gas Service 2,696 4,700 2,163 4,700 Electric Service 4,360 5,000 3,386 5,000 Water Service 1,102 1,000 830 1,000 Vehicle/Equipment Rent 1,577 3,350 3,350 3,350 M&R Mach & Equipment 296 - - - M&R - Motor Vehicles 78 700 700 700 M&R - Communications Equipment - 100 100 100 Solid Waste Disposal 918 1,000 1,000 1,000 Special Contributions 363,265 387,500 424,700 424,700 Other Services 803,488 969,375 1,686,245 1,098,407
1,292,043 1,528,925 2,278,674 1,695,122 Other Charges
Refund Expense - - - - Insurance 5,276 4,120 4,120 2,625 Transfer to General Fund 196,094 202,629 202,629 204,775 Transfer to Capital Projects
207,370 212,749 212,749 213,400
Total 2,022,882 2,333,918 2,986,303 2,299,836
COMMUNITY DEVELOPMENT BLOCK GRANT FUNDEXPENDITURES
11 - 19

2017-18 2018-19 2019-20Adopted Estimated
Actual Budget Actual Budget
Projected Beginning Fund Balance: $337,385 $432,252 $160,942SOURCES
Gaming Revenue 954,245 1,030,000 817,200 822,000 Other Revenue 1,600 - - - Interest Earnings 5,416 200 7,991 8,000 Transfers from Other Funds - - - - Grants & Entitlements - - - - Appropriated from/(to) Fund Balance - - - - TOTAL SOURCES 961,260 1,030,200 825,191 830,000
USES BY PROGRAMGaming Funded Initiatives 866,394 1,255,160 1,096,500 981,660
TOTAL USES 866,394 1,255,160 1,096,500 981,660
Net Surplus (Deficit) 94,867 (224,960) (271,309) (151,660)
Projected Ending Fund Balance: $432,252 $160,942 $9,282
SUMMARYGAMING INITIATIVES FUND
11 - 21

2017-18 2018-19 2019-20Adopted Estimated
Actual Budget Actual Budget
RentsState Admissions 505,179 618,000 490,320 435,400 State Gaming 449,066 412,000 326,880 386,600
954,245 1,030,000 817,200 822,000Investment Interest
Interest Income 5,416 200 7,991 8,000 5,416 200 7,991 8,000
Other RevenueDonations - - - - Refunds Prior Year - - - - Other Revenue 1,600 - - - Recovery/Reimbursement - - - -
1,600 - - - Transfers
Transfer From General Fund - - - - - - - -
Grants & EntitlementsMO Trim Grant - - - -
- - - - Transfer from/(to) Fund Balance
Fund Balance Appropriation - - - - - - - -
Total 961,260 1,030,200 825,191 830,000
GAMING INITIATIVES FUNDREVENUES
11 - 21

2017-18 2018-19 2019-20Adopted Estimated
Actual Budget Actual Budget
Services & SuppliesMinor Equipment - - - - Employmemt Services - - - - Professional Services 111,667 300,000 225,000 125,000 Communication Services - - - - Postage - - - - Advertising 48,941 50,000 50,000 40,000 MR Communications Equipment 21,294 - - - Major Repairs & Replacement - - - - Special Contributions 546,143 617,060 590,000 553,560 Other Services 16,849 81,600 25,000 81,600
744,894 1,048,660 890,000 800,160Interfund Transfers Out
Transfer to General Fund 55,000 55,000 55,000 50,000 Transfer to SIMR Fund - 50,000 50,000 50,000 Transfer to Special Allocation Fund - 5,000 5,000 5,000 Transfer to Aviation Fund 60,000 90,000 90,000 70,000 Transfer to Parking Fund 6,500 6,500 6,500 6,500 Transfer to Capital Projects Fund - - - -
121,500 206,500 206,500 181,500Capital Outlay
Buildings - - - - Improvements Other Than Buildings - - - - Motor Vehicles - - - - Software Purchases - - - - Radio & Communication Equipment - - - - Machinery & Equipment - - - -
- - - -
Total 866,394 1,255,160 1,096,500 981,660
GAMING INITIATIVES FUNDEXPENDITURES
11 - 22

2017-18 2018-19 2019-20Adopted Estimated
Actual Budget Actual Budget
Projected Beginning Fund Balance: 1,274,237$ 3,726,602$ 3,852,713$ SOURCES
PILOTS 3,504,520 3,364,374 4,097,392 4,063,250 EATS/TDD/NonIncremental Sales Tax 4,974,015 4,895,670 4,895,670 4,927,556 Bond Proceeds/Reimbursements - - - - Recovery/Reimbursement/Other Revenue 3,000 3,000 3,000 24,956 Sewer System Development Fees - - - - Developer Contributions 411,180 425,380 425,380 407,086 Interest Earnings 159,871 1,045 19,082 149,936 Int on Special Assessments 353,098 - - 320,000 Sewer Reserve Charges 619,898 546,000 660,000 582,467 Transfers from Other Funds - 5,000 5,000 5,000 TOTAL SOURCES 10,025,582 9,240,469 10,105,524 10,480,251
USES BY PROGRAMCenter Building TIF 2,045 52,395 52,395 42,761 Gilmore Building TIF 679 300 300 9,714 Downtown Mosaic TIF 58 2,000 2,000 510,450 CVS Ashland TIF 171 7,000 7,000 8,235 Uptown Redevelopment TIF 297 500 500 10,065 Ryan Block TIF 137 130 130 123 Cooks Crossing EDC 150,390 149,480 149,480 117,618 Downtown Redevelopment TIF - 5,000 5,000 5,000 Mitchell Avenue Corridor TIF 381,476 381,600 381,600 385,005 The Commons Development (EDC) 637,390 599,750 599,750 628,754 North East Cook Road TIF 17,582 8,900 1,523,900 14,185 East Hills TIF 637,508 1,385,200 1,385,200 623,422 Shoppes at North Village TIF 3,465,365 3,489,038 3,489,038 2,976,735 EBR Development TIF 321,830 377,625 377,625 322,416 Triumph Foods, LLC TIF 1,939,950 1,945,395 1,945,395 1,950,860 Fountain Creek TIF 95 100 100 95 3rd Street Hotel TIF - - - - Tuscany Towers TIF 16,633 60,000 60,000 312,997 American Electric TIF 1,610 - - 20,000
TOTAL USES 7,573,216 8,464,413 9,979,413 7,938,435
Net Surplus (Deficit) 2,452,365 776,056 126,111 2,541,816
Projected Ending Fund Balance: 3,726,602$ 3,852,713$ 6,394,529$
SPECIAL ALLOCATION FUND SUMMARY
All Others9.07%
East Hills TIF7.87%
Shoppes TIF37.59%
EBR TIF4.07%
The Commons7.94%Triumph Foods,
LLC TIF24.64%Tuscany Towers
TIFMitchell Cooridor
TIF4.86%
11 - 24
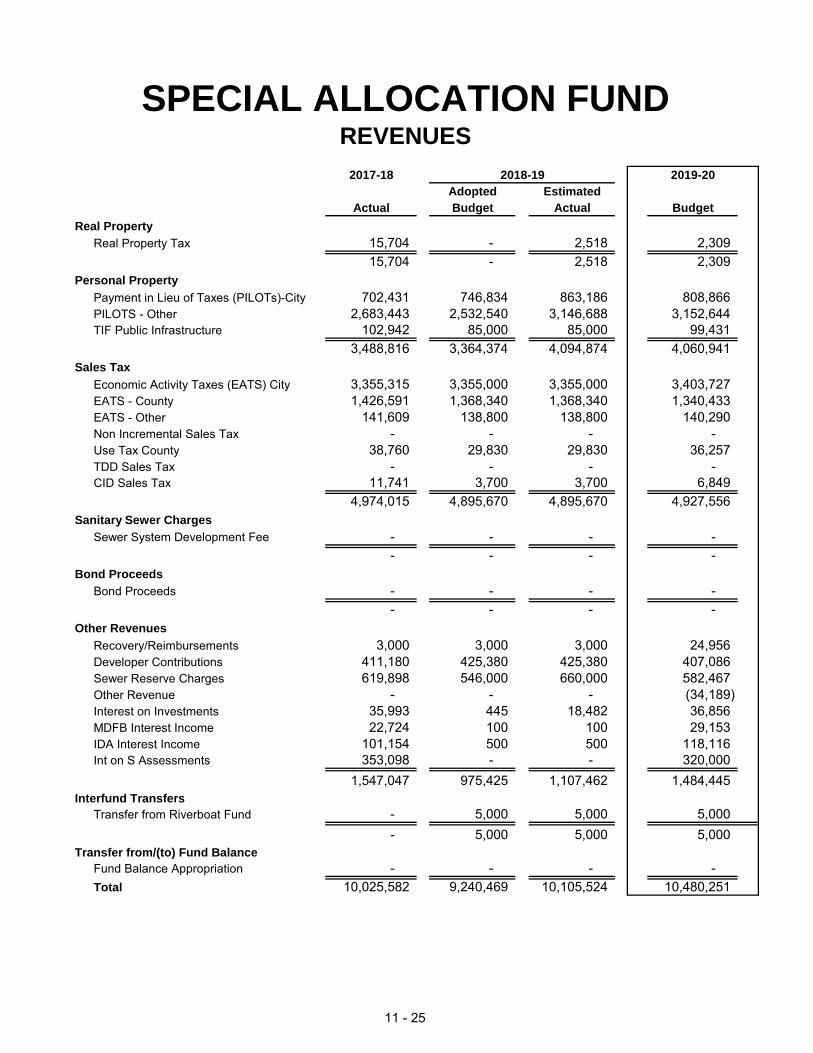
2017-18 2019-20Adopted Estimated
Actual Budget Actual BudgetReal Property
Real Property Tax 15,704 - 2,518 2,309 15,704 - 2,518 2,309
Personal PropertyPayment in Lieu of Taxes (PILOTs)-City 702,431 746,834 863,186 808,866 PILOTS - Other 2,683,443 2,532,540 3,146,688 3,152,644 TIF Public Infrastructure 102,942 85,000 85,000 99,431
3,488,816 3,364,374 4,094,874 4,060,941 Sales Tax
Economic Activity Taxes (EATS) City 3,355,315 3,355,000 3,355,000 3,403,727 EATS - County 1,426,591 1,368,340 1,368,340 1,340,433 EATS - Other 141,609 138,800 138,800 140,290 Non Incremental Sales Tax - - - - Use Tax County 38,760 29,830 29,830 36,257 TDD Sales Tax - - - - CID Sales Tax 11,741 3,700 3,700 6,849
4,974,015 4,895,670 4,895,670 4,927,556 Sanitary Sewer Charges
Sewer System Development Fee - - - - - - - -
Bond ProceedsBond Proceeds - - - -
- - - - Other Revenues
Recovery/Reimbursements 3,000 3,000 3,000 24,956 Developer Contributions 411,180 425,380 425,380 407,086 Sewer Reserve Charges 619,898 546,000 660,000 582,467 Other Revenue - - - (34,189) Interest on Investments 35,993 445 18,482 36,856 MDFB Interest Income 22,724 100 100 29,153 IDA Interest Income 101,154 500 500 118,116
353,098 - - 320,000 1,547,047 975,425 1,107,462 1,484,445
Interfund TransfersTransfer from Riverboat Fund - 5,000 5,000 5,000
- 5,000 5,000 5,000 Transfer from/(to) Fund Balance
Fund Balance Appropriation - - - - Total 10,025,582 9,240,469 10,105,524 10,480,251
SPECIAL ALLOCATION FUNDREVENUES
2018-19
Int on S Assessments
11 - 25
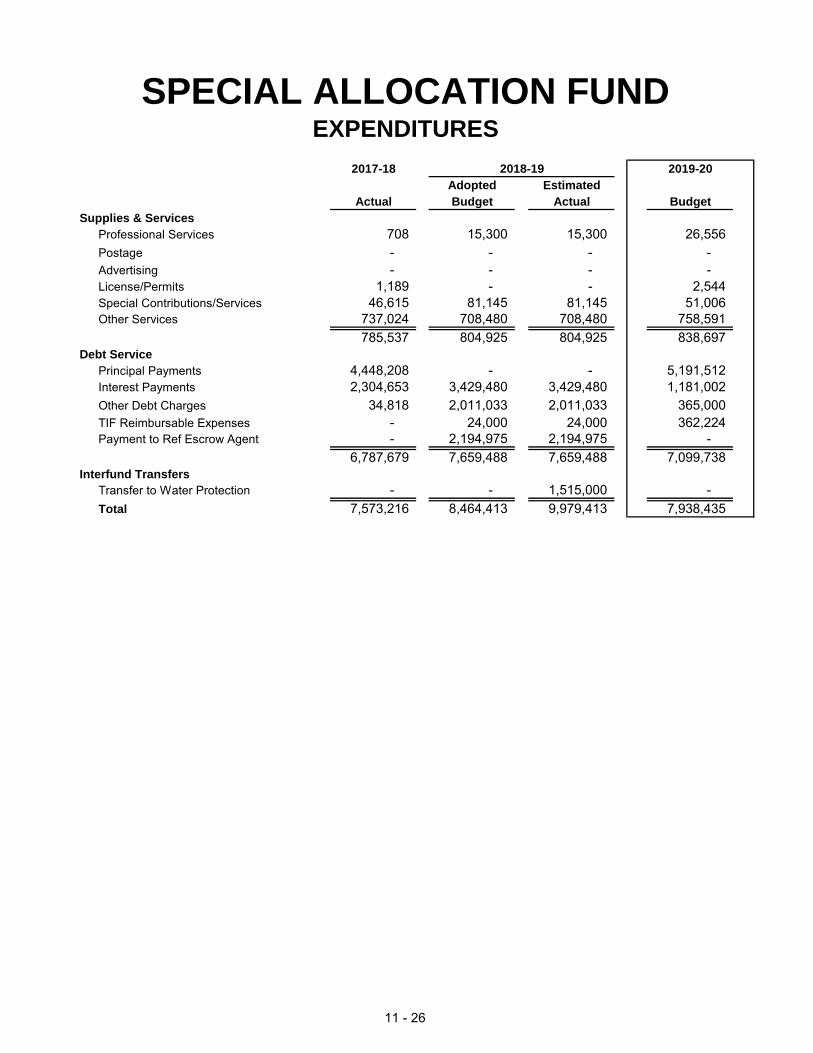
2017-18 2018-19 2019-20Adopted Estimated
Actual Budget Actual BudgetSupplies & Services
Professional Services 708 15,300 15,300 26,556 Postage - - - - Advertising - - - - License/Permits 1,189 - - 2,544 Special Contributions/Services 46,615 81,145 81,145 51,006 Other Services 737,024 708,480 708,480 758,591
785,537 804,925 804,925 838,697Debt Service
Principal Payments 4,448,208 - - 5,191,512 Interest Payments 2,304,653 3,429,480 3,429,480 1,181,002 Other Debt Charges 34,818 2,011,033 2,011,033 365,000 TIF Reimbursable Expenses - 24,000 24,000 362,224 Payment to Ref Escrow Agent - 2,194,975 2,194,975 -
6,787,679 7,659,488 7,659,488 7,099,738Interfund Transfers
Transfer to Water Protection - - 1,515,000 - Total 7,573,216 8,464,413 9,979,413 7,938,435
SPECIAL ALLOCATION FUNDEXPENDITURES
11 - 26

2017-18 2019-20Adopted Estimated
Actual Budget Actual Budget
Beginning FB: 93,353 111,474 89,568
459,340 462,550 469,203 469,203 25,000 25,000 25,000 25,000
- - - - 5,292 700 7,301 7,300
489,632 488,250 501,504 501,503
360,000 410,000 410,000 410,000 86,512 88,410 88,410 90,650 25,000 25,000 25,000 25,000
471,512 523,410 523,410 525,650
18,121 (35,160) (21,906) (24,147)
ENDING OPERATING FUND BALANCE: 111,474 89,568 65,421
Beginning Capital FB: 284,000 359,000 - SOURCES
Property Tax 75,000 75,000 75,000 75,000 Appropriated from (to) Fund Balance - 359,000 - -
75,000 434,000 75,000 75,000 USES
Capital Improvements - Wyeth-Tootle - 434,000 434,000 75,000 - 434,000 434,000 75,000
Net Capital Surplus (Deficit) 75,000 - (359,000) -
ENDING CIP FUND BALANCE: 359,000 - -
TOTAL USES 471,512 957,410 957,410 600,650
A building, place, or institution devoted to the acquisition, conservation, study, exhibition, and educational interpretation ofobjects having scientific, historical, or artistic value.
An institution dedicated to preserving and interpreting the primary tangible evidence of humankind and theenvironment…Museums have been founded for a variety of purposes: to serve as recreational facilities, scholarly venues,or educational resources; to contribute to the quality of life of the areas where they are situated; to attract tourism to aregion; to promote civic pride or nationalistic endeavor; or even to transmit overtly ideological concepts. Given such avariety of purposes, museums reveal remarkable diversity in form, content, and even function. Yet, despite such diversity,they are bound by a common goal: the preservation and interpretation of some material aspect of society's culturalconsciousness.
- From the Encyclopedia Britannica
- From the American Heritage Dictionary
Definitions of a Museum:
Other Museum Related ExpendituresCapital $ Used for Minor W-T RepairsTOTAL USES
Net Surplus (Deficit)
MUSEUM TAX FUND SUMMARY
2018-19
Property TaxProp Tx Rev Dedicated to Minor RepairsOther RevenueInterest EarningsTOTAL SOURCES
SOURCES
USES BY PROGRAMMuseum Tax Contract Contributions
11 - 27

2017-18 2019-20Amended Estimated
Actual Budget Actual Budget
355,346 354,345 358,022 358,0229,733 13,000 13,000 13,0002,879 2,000 2,367 2,367
367,958 369,345 373,389 373,389
122,926 122,260 123,107 123,1072,197 2,100 2,100 2,1007,258 7,040 7,040 7,040
31,656 34,000 35,103 35,103164,037 165,400 167,350 167,350
3,656 3,565 3,565 3,565 2,796 3,140 3,140 3,140
20,893 21,100 21,759 21,759 27,345 27,805 28,464 28,464
5,292 700 7,301 7,300- - - -
5,292 700 7,301 7,300
- - - -
564,632 563,250 576,504 576,503
MUSEUM TAX FUND REVENUES
2018-19
Real Property TaxCurrent Real Estate TaxPrior Real Estate TaxReal Estate Penalty and Interest
Personal Property TaxCurrent Personal Property TaxPersonal Property Penalty and IntPrior Personal Property TaxM & M Surtax
Other Personal Property TaxPayment in Lieu of Taxes - OtherFinancial Institution Tax
Fund Balance Appropriation
Total
Railroad Tax
Investment InterestInterest EarningsOther Revenue
Transfer from/(to) Fund Balance
11 - 28

2017-18 2019-20Adopted Estimated
Actual Budget Actual Budget
Services & SuppliesSpecial Contributions 385,000 435,000 435,000 435,000 Other Services 14,204 14,200 14,200 14,200
399,204 449,200 449,200 449,200 Interfund Transfers Out
Transfer to General Fund 60,687 59,260 59,260 57,880 Transfer to Capital Projects - - - -
60,687 59,260 59,260 57,880 Insurance
Insurance 11,621 14,950 14,950 18,570 11,621 14,950 14,950 18,570
Capital ImprovementsBuilding Improvements 22,840 434,000 434,000 75,000
22,840 434,000 434,000 75,000
Total 494,352 957,410 957,410 600,650
MUSEUM TAX FUND EXPENDITURES
2018-19
11 - 29

2017-18 2019-20Adopted Estimated
Actual Budget Actual Budget
2,243,503$ 509,246$
5,107,429 5,034,600 5,034,600 5,034,600 1,083,608 1,016,000 1,016,000 1,016,000
276 - 1,032 - 38,431 - 27,221 27,221
- - 1,200 1,200 - - - 317,756
6,229,744 6,050,600 6,080,053 6,396,777
4,659,193 4,955,570 4,878,682 4,300,588 2,327,830 2,448,657 2,449,857 2,135,400
444,693 485,771 485,771 470,036 7,431,716 7,889,998 7,814,310 6,906,024
(1,201,972) (1,839,398) (1,734,257) (509,247)
509,246$ (0)$
Sales TaxEATSRecovery/Reimbursement/RefundsInterest Earnings
PUBLIC SAFETY TAX FUNDSUMMARY
2018-19
Projected Beginning Fund Balance:SOURCES
Other RevenueTransfersTOTAL SOURCES
USES BY PROGRAMPublic Safety - PolicePublic Safety - FirePublic Safety - HealthTOTAL USES
Net Surplus (Deficit)
ENDING RESERVED FUND BALANCE:
Police62%
Fire31%
Health7%
Public Safety Tax Uses
11 - 30

2017-18 2019-20Amended Estimated
Actual Budget Actual Budget
6,658,677 6,506,000 6,506,000 6,506,000 (1,551,248) (1,471,400) (1,471,400) (1,471,400)
- - - - 1,083,608 1,016,000 1,016,000 1,016,000
276 - 1,032 - 38,431 - 27,221 27,221
- - 1,200 1,200 Transfers - - - 317,756
6,229,744 6,050,600 6,080,053 6,396,777
Transfer from/(to) Fund Balance- - - -
6,229,744 6,050,600 6,080,053 6,396,777
PUBLIC SAFETY TAX FUNDREVENUES
2018-19
Sales TaxPublic Safety Sales Tax
Interest EarningsOther Revenue
Fund Balance Appropriation
Total
Sales Tax Contra Account1/2 Percent Sales TaxEATSRecovery/Reimbursement/Refunds
11 - 31

2017-18 2019-20Adopted Estimated
Actual Budget Actual Budget
698,622 842,817 794,418 874,723 - 19,303 19,303 -
77,607 85,092 85,092 85,092 46,001 47,002 47,002 47,002
822,230 994,214 945,815 1,006,817
258,064 299,072 285,520 268,748 - - - -
2,876 2,914 2,914 2,914 12,315 16,581 15,879 9,553 9,813 9,861 9,861 4,680
120,847 145,428 145,428 159,624 4,888 6,228 6,228 6,353 2,365 2,881 2,881 2,939 1,868 2,307 2,177 2,353
30,414 39,582 37,646 40,273 24,688 25,500 25,500 30,000 20,091 23,500 25,500 23,000
488,230 573,854 559,534 550,437
62,333 89,480 89,480 77,580 25 - - -
79,238 73,950 75,150 67,815 Other Materials/Supplies 53,513 51,380 49,691 37,280
195,109 214,810 214,321 182,675
72,369 66,905 66,905 56,905 - 850 850 850
35,274 35,280 35,280 37,905 - 6,500 6,500 - - 6,860 6,860 8,510
24,630 25,000 25,000 25,000 9,848 29,670 29,670 24,670
142,120 171,065 171,065 153,840
503,823 192,910 192,910 - 53,214 47,980 35,500 -
276,131 168,895 168,895 216,000 30,720 - - -
- 8,000 8,000 - 863,888 417,785 405,305 317,756
4,920,140 5,518,270 5,518,270 4,694,499 4,920,140 5,518,270 5,518,270 4,694,499
7,431,716 7,889,998 7,814,310 6,906,024
PUBLIC SAFETY TAX FUND EXPENDITURES
2018-19
Salaries & WagesBase Salaries/WagesSalary IncreasesOvertimePT Wages
Employee BenefitsPolice Pension ContributionLagers Pension ContributionFICA ContributionFIM Medicare457 Employer MatchHealth InsuranceDental InsuranceLife InsuranceLong Term DisabilityWorkers CompensationUniform Allowance
ServicesProfessional ServicesInsuranceM&R Office Equipment
Confer/Train/Travel
Materials & SuppliesSafety Equip/ClothingMotor Fuel and LubricantsMinor Equipment
M&R - Buildings & FacilitiesM&R - Machinery & EquipmentM&R - Motor VehiclesM&R - Communications Equipment
Capital Outlay
Interfund TransfersTransfer to General Fund
Total
Motor VehiclesMachinery & EquipmentRadio & Communications EquipBuildingsSoftware Purchases/Improvemnts
11 - 32

2017-18 2018-19 2019-20Adopted Estimated
Actual Budget Actual Budget
Projected Beginning Fund Balance: 332,818$ 179,922$ SOURCES
Rents 411,948 403,772 403,772 403,385 Other Revenue 85,241 26,780 26,780 26,780 Investment Earnings 2,382 100 6,312 100 Grants - - - - Transfers In 128,290 238,290 168,290 148,290 Fund Balance Appropriation - - - - TOTAL SOURCES 627,862 668,942 605,154 578,555
USESSalaries & Wages 295,678 304,846 306,708 304,830 Employee Benefits & Payroll Taxes 128,667 133,779 134,221 139,975 Materials & Supplies 32,984 44,040 38,993 44,040 Utilities & Other Outside Services 526,417 256,972 255,138 167,832 Debt Service, Property Ins & Transfers Out 25,781 22,990 22,990 26,728 Capital Outlay - - - -
TOTAL USES 1,009,527 762,627 758,050 683,405
Net Surplus (Deficit) (381,666) - (152,896) (104,850)
SOURCESGrants/Entitlements 2,346,843 6,260,000 6,290,750 8,637,800 Transfers In/Other Revenue 218,512 940,000 940,000 1,204,200 Appropriated from Fund Balance - - - - TOTAL SOURCES 2,565,354 7,200,000 7,230,750 9,842,000
USESAviation Projects in Capital Project Fund 2,757,706 7,050,000 7,230,750 9,842,000
Net Capital Surplus (Deficit) (192,351) 150,000 - -
Projected Ending Fund Balance: 332,818$ 179,922$ 75,072$
AVIATION FUND SUMMARY
Salaries & Wages
45%
Employee Benefits &
Payroll Taxes20%
Materials & Supplies
6%
Utilities & Other
Outside Services
25%
Debt Service, Property Ins & Transfers
Out4%
Operating Uses
Rents70%
Interest Earnings &
Other5%
Transfers In
25%
Operating Revenue Sources
11 - 33

2017-18 2018-19 2019-20Adopted Estimated
Actual Budget Actual BudgetRents
Airport Hangar Rent 95,846 90,000 90,000 91,980 Airport Restaurant Rent 4,800 4,800 4,800 4,800 Life Net Lease 6,194 6,200 6,200 6,200 Farm Land Rent 64,841 68,675 68,675 64,536 Air National Guard Rent 81,256 81,240 81,240 81,240 BMS Warehouse Rent 12,667 6,333 6,333 6,333 F.B.O. Lease 80,427 80,608 80,608 82,380 Federal Aviation Administration Rent 65,916 65,916 65,916 65,916
411,948 403,772 403,772 403,385Other Revenue
Sale of Fixed Assets 45,100 - - - Sale of Gas & Oil 27,811 24,500 24,500 24,500 Recycling Revenue 4,306 - - - Recovery/Reimbursements 7,249 1,500 1,500 1,500 Other Revenue 775 780 780 780
85,241 26,780 26,780 26,780Investment Earnings
Interest Income 2,382 100 6,312 100 2,382 100 6,312 100
Intergovernmental Federal Aviation Administration 1,715,939 6,260,000 6,290,750 8,637,800 Buchanan County Aviation - - - - State Airport Aid Grant 54,687 - - - FEMA/SEMA Reimbursements - - - - MO Air National Guard Grant 576,217 - - -
2,346,843 6,260,000 6,290,750 8,637,800Interfund Transfers In
Transfer from General Fund 20,000 100,000 30,000 30,000 Transfer from Gaming Fund 60,000 90,000 90,000 70,000 Transfer from Water Protection Fund 48,290 48,290 48,290 48,290 Transfer from CIP Sales Tax Fund 218,512 940,000 940,000 1,204,200
346,802 1,178,290 1,108,290 1,352,490Transfer from/(to) Fund Balance
Fund Balance Appropriation - - 38,826 -
Total 3,193,216 7,868,942 7,874,730 10,420,555
2017-18 2018-19 2019-20Adopted Estimated
Actual Budget Actual BudgetSalaries & Wages
Base Salaries/Wages 289,726 297,121 298,983 297,105 Salary Adjustments - - - - Overtime 5,952 7,725 7,725 7,725 Temporary/Part-Time Wages - - - -
295,678 304,846 306,708 304,830Employee Benefits
Lagers Pension Contribution 33,083 35,972 36,192 37,189 FICA Contribution 18,550 18,900 19,015 18,899 FICA Medicare 4,338 4,420 4,447 4,420 457 Employer Plan Match 1,950 1,950 1,950 1,950 Health Insurance 48,473 48,478 48,478 53,208 Dental Insurance 1,747 1,868 1,868 2,118 Life Insurance 972 998 998 998
AVIATION FUNDREVENUES
EXPENDITURES
11 - 34

2017-18 2018-19 2019-20Adopted Estimated
Actual Budget Actual BudgetEmployee Benefits Con't
Long Term Disability 702 799 804 799 Workers Compensation 11,553 12,194 12,269 12,193 Unemployment Claims - - - - Car/Mileage Allowance - 200 200 200 Confer/Train/Travel 7,299 8,000 8,000 8,000
128,667 133,779 134,221 139,975Materials & Supplies
Office Supplies 1,082 1,400 1,400 1,400 Janitorial Supplies 1,811 3,100 3,100 3,100 Safety Equip/Clothing 1,619 2,600 2,600 2,600 Chemicals/Drugs/Med Supply - - - - Motor Fuel and Lubricants 12,911 19,550 14,503 19,550 Minor Equipment 5,005 5,000 5,000 5,000 Street Maintenance Supplies 8,456 9,000 9,000 9,000 Other Materials/Supplies 2,100 3,390 3,390 3,390
32,984 44,040 38,993 44,040Services
Professional Services 366,468 250,000 259,400 250,000 Memberships 712 1,220 1,220 1,220 Periodicals & Books 126 460 460 460 Communication Services 5,187 5,500 5,500 5,500 Postage 259 500 500 500 Advertising 515 400 400 400 Permits & Recording Fees 3,465 3,400 3,400 3,400 Printing & Binding 25 100 100 100 Gas Service 845 2,000 802 900 Electric Service 33,446 38,000 35,833 33,500 Water Service 1,468 2,100 1,488 1,600 Vehicle/Equipment Rent 6,337 7,454 7,454 7,597 M&R - Building & Facilities 36,514 48,350 48,350 41,850 M&R - Machinery & Equipment 12,576 9,000 9,000 9,000 M&R - Motor Vehicles 1,679 4,600 4,600 4,600 M&R - Communications Equipment - - - - Major Repairs & Replacements 17,609 15,135 7,878 15,135 Laundry Services 3,412 2,400 2,400 2,400 Solid Waste Disposal Services 1,321 1,320 1,320 1,320 MO DNR Fees 519 150 150 150 Special Contributions - 2,000 2,000 2,000 Other Services 33,935 6,200 6,200 6,200
526,417 400,289 398,455 387,832Other Charges
Insurance 21,781 18,990 18,990 22,728 Transfer to General Fund - - - - Transfer to General Fund - Computer 4,000 4,000 4,000 4,000
25,781 22,990 22,990 26,728Capital Outlay & Public Improvements
Vehicle 36,830 30,000 38,826 30,000 Machinery & Equipment 84,022 70,000 77,257 - Building - - - - Improvements other than Buildings 2,636,853 6,950,000 6,971,350 9,592,000
2,757,706 7,050,000 7,087,433 9,622,000
Total 3,767,233 7,955,944 7,988,800 10,525,405
AVIATION FUNDEXPENDITURES
11 - 35

2017-18 2018-19 2019-20Adopted Estimated
Actual Budget Actual Budget
Beginning Operating FB: 130,901$ 153,229$ SOURCES
City Sticker 100,753 97,500 97,500 98,900 Parking Fines 73,897 150,100 150,100 70,200 Parking Fees 108,012 88,500 88,500 118,200 Other Revenue/Interest Earnings 1,469 100 2,680 2,680 Transfers In 379,774 425,955 345,955 327,352 Fund Balance Appropriation - - - -
TOTAL SOURCES 663,904 762,155 684,735 617,332
USESSalaries & Wages 149,838 177,417 165,738 175,698 Employee Benefits & Payroll Taxes 66,804 82,715 79,943 88,447 Materials & Supplies 6,079 9,200 7,389 8,200 Utilities & Other Outside Services 48,268 131,400 125,592 126,300 Property Ins & Transfers Out 86,872 11,290 11,290 13,390 Capital Outlay 373,084 352,455 272,455 253,852
TOTAL USES 730,945 764,477 662,407 665,886
Net Surplus (Deficit) (67,041) 22,328 (48,554)
ENDING OPERATING FUND BALANCE: 130,901 153,229 104,674
PUBLIC PARKING FUNDSUMMARY
Salaries & Wages
27%
Employee Ins &
Payroll Taxes13%
Materials & Supplies
1%
Utilities & Other
Outside Services
19%
Property Ins &
Transfers Out2%
Capital Outlay38%
Operating Uses
City Sticker34%
Parking Fines24%
Parking Fees41%
Interest, Transfers In
0.92%
Operating Sources
11 - 36

2017-18 2019-20Adopted Estimated
Actual Budget Actual BudgetLicenses
City Sticker & Penalty 100,753 97,500 97,500 98,900 100,753 97,500 97,500 98,900
FinesParking Violation Fines 73,747 150,000 150,000 70,000 Boot Fee 150 100 100 200
73,897 150,100 150,100 70,200Charges for Services
Parking - 6th & Jules 63,342 55,000 55,000 61,400 Parking - 7th & Sylvanie 1,170 1,300 1,300 1,500 Parking - 9th & Felix 2,680 4,500 4,500 4,800 Parking - 5th & Edmond 120 200 200 500 Parking - 5th & Felix 29,693 17,000 17,000 22,000 Parking - 8th & Felix 2,110 5,000 5,000 20,000 Other Parking Permit Fees 8,378 5,000 5,000 7,500 Customer Service Zone Permits 519 500 500 500
108,012 88,500 88,500 118,200Investment Earnings/Other Rev
Intrest Income 1,239 100 2,680 2,680 Other Revenue 230 - - - STP/FHWA Grant - - - -
1,469 100 2,680 2,680Transfers In
Transfer from General Fund 373,274 419,455 339,455 320,852 Transfer from Gaming Fund 6,500 6,500 6,500 6,500
379,774 425,955 345,955 327,352Transfer from/(to) Fund Balance
Fund Balance Appropriation - - - -
Total 663,904 762,155 684,735 617,332
PUBLIC PARKING FUNDREVENUES
11 - 37

2017-18 # 2019-20Adopted Estimated
Actual Budget Actual Budget
Salaries & WagesBase Salaries/Wages 137,254 161,338 149,659 159,619 Salary Increases - - - - Overtime 1,181 1,450 1,450 1,450 Temp-Part Time Wages 11,403 14,629 14,629 14,629 Out of Title Pay - - - -
149,838 177,417 165,738 175,698Employee Benefits
Lagers Pension Contribution 13,614 19,038 17,660 19,650 FICA Contribution 9,329 10,003 9,279 10,893 FICA Medicare 2,182 2,339 2,170 2,548 457 Emloyer Plan Match 947 1,950 1,950 1,170 Health Insurance 32,426 40,398 40,398 44,340 Dental Insurance 1,169 1,557 1,557 1,765 Federal Health Reinsurer Tax - - - - Life Insurance 438 542 540 585 Long Term Disability 350 434 403 467 Workers Compensation 6,320 6,454 5,987 7,028 Conference/Training/Travel 30 - - -
66,804 82,715 79,943 88,447Materials & Supplies
Office Supplies 772 800 800 800 Janitorial Supplies 520 500 500 500 Safety Equip/Clothing 1,413 2,000 2,000 2,000 Motor Fuel and Lubricants 1,695 4,000 2,189 3,000 Minor Equipment 1,375 1,600 1,600 1,600 Other Materials & Supplies 304 300 300 300
6,079 9,200 7,389 8,200Services
Professional Services - - - - Periodicals & Books - 200 200 200 Telephone Service 2,730 2,000 2,000 2,000 Postage 1,580 3,300 3,300 3,300 Adverising 411 - - - Freight - - - - Printing & Binding 2,264 2,500 2,500 2,500 Electric Service 26,325 30,000 25,147 25,500 Water Service 758 1,600 645 1,000 M&R - Office Equipment 1,740 2,400 2,400 2,400 M&R - Building & Facilities 6,453 81,300 81,300 81,300 M&R Machinery & Equipment - - - - M&R - Motor Vehicles 3,374 4,500 4,500 4,500 M&R - Communications Equipment 1,500 1,500 1,500 1,500 Towing Services - 100 100 100 Laundry Services 1,064 2,000 2,000 2,000 MO DNR Fees 69 - - - Other Services - - - -
Other Charges 48,268 131,400 125,592 126,300
Principal - - - - Interest - - - - Other Debt Charges - - - - Insurance 10,525 9,290 9,290 9,390 Judgement & Claims - 1,000 1,000 1,000 Motor Vehicles - - - - Transfer to General Fund 75,347 - - - Motor Vehicles - - - - Improvement Other Than Buildings 373,084 352,455 272,455 253,852 Transfer to General Fund - Computer 1,000 1,000 1,000 3,000
459,956 363,745 283,745 267,242
Total 730,945 764,477 662,407 665,886
PUBLIC PARKING FUNDEXPENDITURES
11 - 38

WATER PROTECTION FUND SUMMARY
2017-18 2018-19 2019-20Adopted Estimated
OPERATING: Actual Budget Actual Budget
Projected Beginning Fund Balance: $24,724,020 $27,795,827SOURCES
Sanitary Sewer Charges 32,093,452 30,556,000 31,310,245 31,953,996Missouri BUILD Tax Credits 374,514 387,727 387,727 387,727Other Revenues 33,467,812 21,659,556 11,483,831 16,001,016Interest Earnings/Special Assessments 462,238 115,700 956,827 582,458Transfers In 3,250 3,250 1,518,250 3,250Grants 0 0 0 0Fund Balance 0 0 0 0TOTAL SOURCES 66,401,265 52,722,233 45,656,880 48,928,447
USESSalaries & Wages 3,308,496 3,983,604 3,805,376 4,065,250Employee Benefits & Payroll Taxes 1,429,661 1,765,587 1,599,947 1,877,091Materials & Supplies 1,081,408 924,407 914,353 1,011,735Utilities & Other Outside Services 10,515,727 6,160,666 6,123,003 6,085,138Debt Service, Property Ins & Transfers Out 15,558,416 19,144,917 18,496,667 18,521,606Operating Capital Equipment 612,133 538,163 645,727 615,166Capital Improvements 6,119,394 28,453,210 11,000,000 20,155,865
TOTAL FUND 38,625,235 60,970,554 42,585,073 52,331,850
Net Operating Surplus (Deficit) 27,776,030 (8,248,321) 3,071,807 (3,403,404)
Projected Ending Fund Balance: $24,724,020 $27,795,827 $24,392,424
CAPITAL:SOURCES
Bond Proceeds 32,986,127 11,361,149 11,361,149 15,926,446Other Revenues/Transfers In 0 0 0 700Interest Earnings/Special Assessments 0 0 0 566,758Appropriated from Operating Fund Balance 0 0 0 0
TOTAL CIP SOURCES 32,986,127 11,361,149 11,361,149 16,493,904
USESWP CIP Improvements 5,507,261 11,361,149 11,587,715 16,493,904
Net Capital Surplus (Deficit) 0
TOTAL USES 38,625,235 60,970,554 42,585,073 52,331,850
Personnel Costs11%
Materials & Supplies
2%
Utilities & Other Outside
Services12%
Debt Service, Property Ins & Transfers Out
35%
Capital Equipment
1%
Capital Imprvmnt
39%
Operating Uses
Sanitary Sewer
Charges65%
Missouri BUILD Tax
Credits1%
Interest Earnings &
Other34%
Operating Revenue Sources
11 - 39

WATER PROTECTIONREVENUES
2017-18 2018-19 2019-20Adopted Estimated
Actual Budget Actual BudgetFines & Charges for Services
Residential/Commercial Sewer Serv. 29,359,276 28,000,000 24,167,666 24,651,019 Sewer System Development Fee 28,500 30,000 30,000 30,000 South St. Joseph Industrial Sewer Dist. 1,756,953 2,000,000 1,917,100 1,836,700 Triumph Wholesale Sewer Serv - - 1,254,800 1,254,800 Nat'l Beef Wholesle Sewer - - 381,700 381,700 Septage Revenue - - 135,000 135,000 Sewer Service Charges - Retail - - 3,033,365 3,094,032 Sewer Service Penalties 649,046 500,000 542,745 542,745 MO DNR Fees 28,477 26,000 27,869 28,000 Admin Code Penalties 271,200 - (180,000) -
32,093,452 30,556,000 31,310,245 31,953,996Other Revenue
Other Revenue 183,019 135,000 42,612 - Sale of Fixed Assets 108,725 11,929 11,929 11,929 Advertising 500 500 500 500 Finance Admin Fees 10,195 11,000 10,000 11,000 Insurance Proceeds 36,160 - 5,000 - Recycling Revenue 6,439 - 1,500 - Refunds PY Expenditures 7 - - - Recovery/Reimbursement 136,640 51,141 51,141 51,141 Missouri BUILD Tax Credits 374,514 387,727 387,727 387,727 Gain/Loss Sale of Investments - - - - Bond Proceeds 32,986,127 21,449,986 11,361,149 15,926,446
Investment Earnings 33,842,325 22,047,283 11,871,558 16,388,743
EIERA Interest 9,966 - 20,022 - MDFB Interest 3,351 700 4,700 700 IDA Bonds Interest Income 88,761 - 82,173 - Sewer Bond Interest Income 22,148 - 264,747 - Accrued Interest - - 30,384 - Interest Income 317,917 100,000 537,901 566,758
Special Assessments 442,143 100,700 939,927 567,458
Principle 17,339 15,000 15,000 15,000 Interest Income 2,756 - 1,900 -
Grants & Entitlements 20,095 15,000 16,900 15,000
FEMA Reimbursement - - - - SEMA Reimbursement - - - - EPA Wastewater Grant - - - -
Interfund Transfers In 0 0 0 0
Transfer from Spec Alloc - - 1,515,000 - Transfer from Gen Fund - - - - Transfer from Landfill Fund 3,250 3,250 3,250 3,250
Transfer from/(to) Fund Balance 3,250 3,250 1,518,250 3,250
Fund Balance Appropriation - - - - Total 66,401,265 52,722,233 45,656,880 48,928,447
Salaries & Wages EXPENDITURESBase Salaries/Wages 2,971,284 3,628,618 3,353,562 3,649,071 Salary Increases - - - - Overtime 293,715 292,893 382,611 317,493 Temporary & PT Wages 23,400 43,886 43,886 43,886 Out of Title Pay 19,359 16,906 24,017 53,500 Sick Leave Buy Back 738 1,300 1,300 1,300
Employee Benefits 3,308,496 3,983,604 3,805,376 4,065,250
Lagers Pension Contribution 344,036 465,731 433,274 493,224 FICA Contribution 205,461 246,036 228,982 253,376 FICA Medicare 48,052 57,541 53,553 60,278 457 Employer Match Plan 17,662 19,110 19,110 23,400 Health Insurance 573,002 702,925 602,564 762,648 Dental Insurance 20,617 27,092 27,092 27,881 Federal Health Reinsurer Tax - - - -
11 -40

WATER PROTECTIONEXPENDITURES
2017-18 2018-19 2019-20Adopted Estimated
Actual Budget Actual BudgetLife Insurance 9,819 12,192 12,154 12,577 Unemployment 1,231 515 515 - Long Term Disability 7,626 9,761 9,021 10,059 Workers Compensation 135,940 158,734 147,732 167,698 Confer/Train/Travel 66,216 65,950 65,950 65,950
1,429,661 1,765,587 1,599,947 1,877,091Materials & Supplies
Office Supplies 15,563 10,600 9,600 16,600 Janitorial Supplies 11,717 13,000 13,000 15,000 Safety Equip/Clothing 99,309 42,000 42,000 74,500 Wastewater Treatment Chemicals 410,784 456,635 393,047 468,635 Motor Fuel and Lubricants 126,121 175,000 161,934 158,000 Minor Equipment 342,604 162,772 230,372 198,500 Street Maintenance Supplies 62,631 60,000 60,000 75,000 Other Materials/Supplies 12,680 4,400 4,400 5,500
1,081,408 924,407 914,353 1,011,735Services
Employment Services 96,402 70,600 82,548 80,500 Professional Services 5,335,665 779,300 779,300 788,300 Other Professional Services - - - - Memberships 15,456 11,485 11,485 20,600 Periodicals & Books 360 1,500 1,500 1,500 Telephone Service 29,041 30,185 30,085 31,505 Postage 121,002 141,300 121,300 142,025 Freight 2,528 5,000 5,000 6,000 Advertising 4,033 1,000 1,000 2,000 Permits & Recording Fees 6,420 2,300 2,300 2,300 Printing & Binding 19,585 22,600 22,600 22,600 Gas Service 141,129 165,000 150,149 125,000 Electric Service 1,564,531 1,556,725 1,454,820 1,300,000 Water Service 83,952 50,000 87,094 90,000 Vehicle/Equipment Rental 158,435 45,909 165,909 45,910 M&R - Office Equipment 196,841 118,463 118,463 118,463 M&R - Building & Facilities 1,329,149 1,440,356 1,468,071 1,522,641 M&R - Machinery & Equipment 5,935 12,500 12,500 50,000 M&R - Motor Vehicles 144,088 200,000 200,000 200,000 M&R - Communications Equipment 50,128 68,200 68,200 68,200 Major Repairs & Replacements 734,961 960,443 852,879 987,794 Towing Service 150 2,500 2,500 2,500 Laundry Services 26,000 27,000 27,000 27,000 Sewer Conn Disconnect Fees - - 100,000 140,000 Solid Waste Disposal Services 3,497 3,650 3,650 3,650 MO DNR Fees 283,410 275,000 315,000 275,000 Special Contributions/Services - - - - Other Services 163,031 169,650 39,650 31,650
10,515,727 6,160,666 6,123,003 6,085,138
11 - 41

WATER PROTECTIONEXPENDITURES
2017-18 2018-19 2019-20Adopted Estimated
Actual Budget Actual BudgetOther Charges
Bad Debt Expense 438,912 500,000 550,000 500,000 Principal 7,385,900 9,892,660 9,601,500 9,957,900 Interest 4,069,358 5,390,014 4,837,219 4,903,310 Other Debt Charges 1,446,557 886,870 886,870 802,945 Bond Issuance Cost Amortization - 26,500 26,500 26,500 Insurance 181,368 165,231 165,231 187,250 Claims 45,721 51,000 51,000 51,000 Transfer to General Fund 1,908,310 2,148,352 1,939,830 2,044,411 Transfer to Aviation Fund 48,290 48,290 48,290 48,290 Transfer to Capital Projects Fund - - 390,227 - Transfer to General Fund - Computer 34,000 36,000 - -
15,558,416 19,144,917 18,496,667 18,521,606Capital Outlay & Public Improvements
Office Equipment - - - - Motor Vehicles 24,003 - 107,564 170,000 Machinery & Equipment 470,237 538,163 538,163 445,166 Radio & Communications Equipment 117,893 - - - Software Purchases - - - - Buildings 52,927 - - - Improvements other than Buildings 5,363,583 28,453,210 11,000,000 20,155,865 Streets, Curbs & Sidewalks 7,913 - - - Land 82,838 - - -
6,119,394 28,991,373 11,645,727 20,771,031
Total 38,013,102 60,970,554 42,585,073 52,331,850
11 - 42

201-18 2018-19 2019-20Adopted Estimated
Actual Budget Actual Budget
Projected Beginning Fund Balance: 21,149$ 21,943$ 21,939$ SOURCES
Golf Charges 668,981 736,300 706,203 692,900 Other Revenue 6,006 6,000 6,000 6,000 Investment Earnings (257) 100 (355) 100 Transfer In 196,824 47,360 107,500 66,832 Fund Balance Appropriaton - - - -
TOTAL SOURCES 871,555 789,760 819,348 765,832
USESSalaries & Wages 334,523 335,043 326,055 324,296 Employee Benefits & Payroll Taxes 89,761 100,268 98,538 92,712 Materials & Supplies 210,184 171,100 179,040 168,900 Utilities & Other Outside Services 204,892 158,222 207,580 185,472 Property Ins & Claims 4,729 5,640 5,140 5,892 Transfers Out 24,409 3,000 3,000 4,000 Operating Capital Equipment 2,263 - - 6,500
TOTAL USES 870,761 773,273 819,352 787,772
Net Surplus (Deficit) 794 (3) (21,940)
Projected Ending Fund Balance: 21,943 21,939 0
MUNICIPAL GOLF COURSE FUND SUMMARY
Personnel Costs53%
Materials & Supplies
22%
Utilities & Other
Outside Services
24%Property
Ins & Claims
1%
Transfers Out0%
Operating Uses
Golf Charges99.1%
Other Revenue
0.9%
Operating Revenue Sources
11 - 43
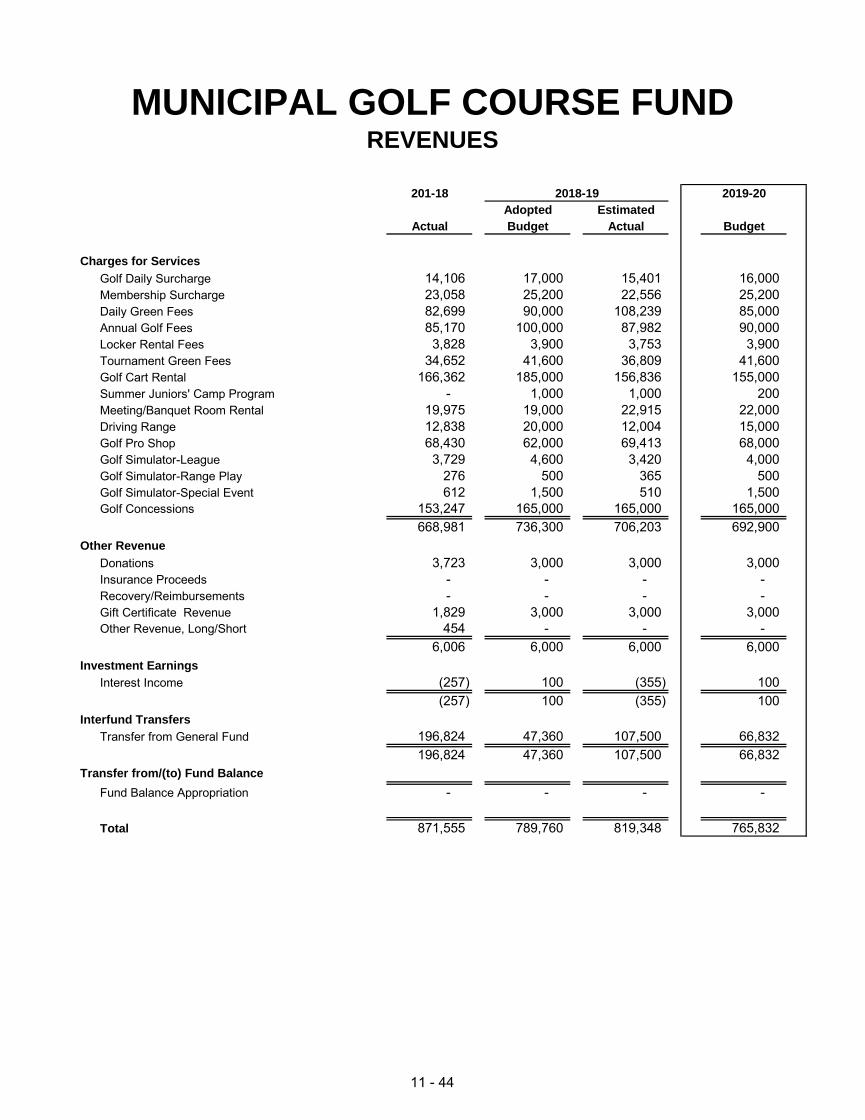
201-18 2018-19 2019-20Adopted Estimated
Actual Budget Actual Budget
Charges for ServicesGolf Daily Surcharge 14,106 17,000 15,401 16,000 Membership Surcharge 23,058 25,200 22,556 25,200 Daily Green Fees 82,699 90,000 108,239 85,000 Annual Golf Fees 85,170 100,000 87,982 90,000 Locker Rental Fees 3,828 3,900 3,753 3,900 Tournament Green Fees 34,652 41,600 36,809 41,600 Golf Cart Rental 166,362 185,000 156,836 155,000 Summer Juniors' Camp Program - 1,000 1,000 200 Meeting/Banquet Room Rental 19,975 19,000 22,915 22,000 Driving Range 12,838 20,000 12,004 15,000 Golf Pro Shop 68,430 62,000 69,413 68,000 Golf Simulator-League 3,729 4,600 3,420 4,000 Golf Simulator-Range Play 276 500 365 500 Golf Simulator-Special Event 612 1,500 510 1,500 Golf Concessions 153,247 165,000 165,000 165,000
668,981 736,300 706,203 692,900Other Revenue
Donations 3,723 3,000 3,000 3,000 Insurance Proceeds - - - - Recovery/Reimbursements - - - - Gift Certificate Revenue 1,829 3,000 3,000 3,000 Other Revenue, Long/Short 454 - - -
6,006 6,000 6,000 6,000Investment Earnings
Interest Income (257) 100 (355) 100 (257) 100 (355) 100
Interfund TransfersTransfer from General Fund 196,824 47,360 107,500 66,832
196,824 47,360 107,500 66,832Transfer from/(to) Fund Balance
Fund Balance Appropriation - - - -
Total 871,555 789,760 819,348 765,832
MUNICIPAL GOLF COURSE FUNDREVENUES
11 - 44

201-18 2018-19 2019-20Adopted Estimated
Actual Budget Actual BudgetSalaries & Wages
Base Salaries/Wages 195,834 204,383 194,825 193,631 Salary Increases - - - - Overtime 1,011 - 1,120 - Sick Leave Buy Back 932 365 935 365 Temporary Part-Time Wages 136,746 130,295 129,175 130,300
334,523 335,043 326,055 324,296Employee Benefits
Lagers Pension Contribution 20,792 24,117 22,989 23,623 FICA Contribution 20,359 20,750 20,157 20,084 FICA Medicare 4,761 4,853 4,714 4,697 457 Employer Match Plan 1,500 1,560 1,560 1,170 Health Insurance 30,632 32,318 32,318 26,604 Dental Insurance 1,104 1,246 1,246 1,059 Federal Health Reinsurer Tax - - - - Life Insurance 638 687 686 960 Unemployement Claims 1,371 - - - Long Term Disability 462 550 524 758 Workers Compensation 7,975 13,387 13,390 12,957 Car Mileage - 300 300 300 Confer/Train/Travel 166 500 653 500
89,761 100,268 98,538 92,712Materials & Supplies
Office Supplies 1,824 1,000 1,000 500 Janitorial Supplies 1,650 1,500 1,500 2,100 Recreation Supplies 29,651 22,000 22,000 16,600 Safety Eqipment/Clothing 260 100 100 100 Motor Fuel and Lubricants 22,595 17,500 25,440 22,100 Minor Equipment 4,828 4,000 4,000 3,000 Materials for Resale 86,243 85,000 81,400 82,500 Other Supplies 63,132 40,000 43,600 42,000
210,184 171,100 179,040 168,900Services
Professional Services 11,780 10,000 10,000 8,500 Memberships/Books 859 800 860 800 Periodicals/Books - - 520 - Communication Services 5,350 3,500 4,700 5,100 Postage 30 50 50 50 Freight - - - - Advertising 3,709 3,800 3,800 3,800 Licenses/Permits 1,483 1,300 1,300 1,300 Printing & Binding 754 600 600 200 Gas Service 2,787 1,500 2,905 3,000 Electric Service 15,310 10,000 12,228 12,500 Water Service 82,839 53,000 86,000 71,000 Vehicle/Equipment Rent 48,433 51,272 56,447 57,722 M&R Office Equipment - - - - M&R - Building & Facilities 18,070 10,000 15,600 9,400
MUNICIPAL GOLF COURSE FUNDEXPENDITURES
11 - 45

201-18 2018-19 2019-20Adopted Estimated
Actual Budget Actual Budget
MUNICIPAL GOLF COURSE FUNDEXPENDITURES
M&R - Machinery & Equipment/Commun 13,043 12,000 12,000 12,000 M&R - Motor Vehicles 130 100 100 100 Laundry Services 315 300 470 - Other Services - - - -
204,892 158,222 207,580 185,472Other Charges
Debt Service (Equipment Lease) - - - - Debt Service Interest - - - - Insurance 4,729 5,140 5,140 5,392 Judgement & Claims - 500 - 500 Transfer to General Fund 21,409 - - - Transfer to General Fund - Computer 3,000 3,000 3,000 4,000
29,138 8,640 8,140 9,892Capital Outlay
Machinery & Equipment 2,263 - - - Improv Other Than Buildings - - - 6,500 Streets, Curbs, Sidewalks - - - -
2,263 0 0 6,500 Total 870,761 773,273 819,352 787,772
11 -46

MASS TRANSIT FUND SUMMARY
2017-18 2018-19 2019-20Adopted Estimated
Actual Budget Actual Budget
Projected Beginning Fund Balance: $19,704,608 $22,086,454 $24,079,351SOURCES
Utility Taxes 1,232,496 1,176,100 1,129,250 1,214,100Sales Taxes 4,644,256 4,687,100 4,687,100 4,767,950Charges for Services 321,873 291,300 291,300 296,300Other Revenue 30,853 3,500 3,500 3,500Investment Earnings 254,216 8,500 483,459 454,000Intergovernmental Operating Grants 1,648,490 1,688,500 1,688,500 1,688,500Fund Balance Appropriation 0 0 0 0TOTAL SOURCES 8,132,185 7,855,000 8,283,109 8,424,350
USESEmployee Travel & Training 6,007 13,200 13,200 6,700Materials & Supplies 430,894 724,995 473,234 728,695Utilities & Other Outside Services 4,905,789 4,984,849 5,353,372 6,023,462Debt Service, Property Ins & Transfers Out 407,649 280,145 450,405 321,910
TOTAL FUND 5,750,339 6,003,189 6,290,212 7,080,767
Net Surplus (Deficit) 2,381,846 1,851,811 1,992,897 1,343,583
ENDING TRANSIT FUND BALANCE: $22,086,454 $24,079,351 $25,422,934
SOURCESGrants & Entitlements 0 5,415,400 5,415,400 6,329,000Appropriated from Fund Balance 4,436,892 0 0 0TOTAL SOURCES 4,436,892 5,415,400 5,415,400 6,329,000
USESTransit CIP Projects 4,436,892 7,910,000 7,910,000 8,755,000
Net Capital Surplus (Deficit) 0 (2,494,600) (2,494,600) (2,426,000)ENDING CIP FUND BALANCE: 0 (2,494,600) (4,920,600)
Utility Taxes, 14%
Sales Taxes, 57%
Interest & Other
Revenue, 9%
Intergovernmental Operating Grants,
20%
Operating Revenue SourcesMaterials &
Supplies10%
Utilities & Other
Outside Services…
Debt Service,
Property Ins & Transfers
Out5%
Operating Uses
11 - 47

MASS TRANSIT FUNDREVENUES
2017-18 2018-19 2019-20Adopted Estimated
Actual Budget Actual BudgetUtility Franchise Fees
Gas 236,978 220,000 231,750 230,000 Electric 804,014 780,000 713,400 780,000 Water 168,457 153,000 161,000 181,000 Utility Taxes - TIF portion 23,048 23,100 23,100 23,100
1,232,496 1,176,100 1,129,250 1,214,100Sales Tax
Sales Tax 4,995,008 5,008,000 5,008,000 5,113,000 Sales Tax Contra Account (1,163,545) (1,150,000) (1,150,000) (1,174,150) EATS (TIF generated sales tax) 812,793 829,100 829,100 829,100
4,644,256 4,687,100 4,687,100 4,767,950Charges for Services
Fare Box Revenue 172,674 175,000 175,000 175,000 Ticket Sales - Adult 89,330 50,000 50,000 50,000 Ticket Sales - Youth 2,228 2,000 2,000 2,000 Ticket Sales - Senior/Handicapped 38,815 38,000 38,000 38,000 Ticket Sales - Commissions 5,943 7,500 7,500 7,500 Token Transit Program - - - 5,000 ID Cards 884 800 800 800 Advertising 12,000 18,000 18,000 18,000
321,873 291,300 291,300 296,300Other Revenue
Recovery/Reimbursments 693 - - - Concessions 2,587 3,500 3,500 3,500 Insurance Proceeds - - - - Refund Prior Yr Expense - - - - Other Revenue 27,071 - - - Sale of Fixed Assets - - - - Recycling Revenue 503 - - -
30,853 3,500 3,500 3,500Investment Earnings
Interest Income 254,216 8,500 483,459 454,000 254,216 8,500 483,459 454,000
Intergovernmental Federal Transit Authority - Capital 122,770 5,415,400 5,415,400 6,329,000 Federal Transit Authority - Operations 1,505,130 1,688,500 1,688,500 1,688,500 American Rec Reinvest Capital - - - - State Operating Grant 20,589 - - -
1,648,490 7,103,900 7,103,900 8,017,500Transfer from/(to) Fund Balance
Fund Balance Appropriation - - - -
Total 8,132,185 13,270,400 13,698,509 14,753,350
11 - 48

MASS TRANSIT FUNDEXPENDITURES
2017-18 2018-19 2019-20Adopted Estimated
Actual Budget Actual BudgetEmployee Benefits
Car/Mileage Allow - 1,500 1,500 - Confer/Train/Travel 6,007 11,700 11,700 6,700
6,007 13,200 13,200 6,700Materials & Supplies
Office Supplies 6,454 9,500 3,300 9,500 Janitorial Supplies 6,039 8,000 2,300 10,000 Safety Equip/Clothing 19,487 18,300 16,700 20,000 Other Material & Supplies - - - - Motor Fuel and Lubricants 397,033 686,695 448,434 686,695 Minor Equipment 1,881 2,500 2,500 2,500
430,894 724,995 473,234 728,695Services
Professional Services 269,237 289,642 277,642 308,146 Memberships 2,950 3,000 2,500 3,000 Periodicals & Books - 250 250 250 Communications Services 13,798 30,730 13,000 30,730 Postage 515 1,000 300 1,000 Advertising 35,486 25,000 17,610 45,000 Permits & Recording Fees 547 950 387 950 Printing & Binding 6,972 12,000 3,177 12,000 Gas Service 13,337 17,400 16,416 16,425 Electric Service 20,922 16,000 18,977 19,000 Water Service 10,115 8,000 9,463 11,000 Vehicle/Equipment Rental 610 9,535 1,133 9,535 M&R - Office Equipment 750 2,420 2,420 2,420 M&R - Building & Facilities 84,416 122,000 43,104 97,000 M&R - Machinery & Equipment 3,632 7,000 1,576 7,000 M&R - Motor Vehicles 420,015 345,000 345,000 345,000 M&R - Communications Equipment 11,326 17,000 612 17,000 Major Repairs & Replacements - 35,000 - 35,000 Towing Service 7,060 2,500 2,500 2,500 Laundry Services 10,263 10,000 4,582 10,000 Solid Waste Disposal Services 559 600 600 600 Other Services 3,993,281 4,029,822 4,592,124 5,049,906
4,905,789 4,984,849 5,353,372 6,023,462Other Charges
Insurance 156,143 149,010 90,551 183,690 Judgetment & Claims - - - - Transfer to Capital Programs - - 228,719 - Transfer to Computer Network 12,000 12,000 12,000 10,000 Transfer to General Fund 239,506 119,135 119,135 128,220
407,649 280,145 450,405 321,910Capital Outlay & Public Improvements
Office Equipment & Furniture - - - - Motor Vehicles 3,890,528 6,750,000 6,750,000 6,785,000 Machinery & Equipment 18,890 30,000 30,000 213,000 Radio & Comm Equipment 99,163 - - -
Land - - - 600,000 Buildings 112,940 349,000 349,000 210,000
Improv. Other Than Buildings 315,371 781,000 781,000 947,000 4,436,892 7,910,000 7,910,000 8,755,000
Total 10,187,230 13,913,189 14,200,212 15,835,767
11 - 49

LANDFILL FUND SUMMARY
2017-18 2018-19 2019-20Adopted Estimated
Actual Budget Actual Budget
Projected Beginning Fund Balance: $2,682,045 $4,640,509 $4,884,387SOURCES
Permits 3,895 2,500 2,000 2,500Rents 4,464 4,500 4,500 4,500Landfill Tipping Fee 4,614,989 4,600,000 4,971,592 5,100,000Gas to Energy Charges 140,250 160,000 159,293 160,000Other Revenue 1,417 1,300 1,300 1,300Recycling Revenue 46,334 30,000 29,000 29,000Investment Earnings 134,112 60,100 238,350 238,600Fund Balance Appropriation 0 0 0 0TOTAL SOURCES 4,945,461 4,858,400 5,406,035 5,535,900
USES - OperatingSalaries & Wages 800,488 882,270 894,689 933,066Employee Benefits & Payroll Taxes 339,921 395,037 385,854 447,157Materials & Supplies 312,333 457,250 362,243 418,650Utilities & Other Outside Services 600,909 605,732 737,204 770,630Debt Service, Property Ins 21,735 20,620 20,620 25,585Transfers Out 623,672 620,142 720,142 660,090Capital Outlay 0 0 0 0TOTAL OPERATING USES 2,699,057 2,981,051 3,120,752 3,255,178
USES - Capital ImprovementsLandfill CIP Improvements in Capital Project Program 287,940 1,102,000 2,041,405 1,839,000
TOTAL USES 2,986,997 4,083,051 5,162,157 5,094,178
Net Surplus/(Deficit): 1,958,464 775,349 243,878 441,722
LANDFILL FUND BALANCE: 4,640,509 $4,884,387 $5,326,109
Salaries & Wages
18%
Emp Ins & Payroll Taxes
9%Materials &
Supplies8%
Utilities & Other
Outside Services
15%
Debt Service,
Property Ins1%
Transfers Out13%
Landfill CIP Imprvmnts
23%
Uses
Landfill Tipping
Fee92%
Gas to Energy
Charges3%
Permits, Rents,
Recycling1%
Interest Earnings
4%
Revenue Sources
11 - 50

LANDFILL FUNDREVENUES
2017-18 2018-19 2019-20Adopted Estimated
Actual Budget Actual BudgetPermits
Trash Hauler Permits 3,895 2,500 2,000 # 2,500 3,895 2,500 2,000 2,500
RentFarm Land Rent 4,464 4,500 4,500 # 4,500
4,464 4,500 4,500 4,500Charges for Services
Landfill Tipping Fees 4,614,989 4,600,000 4,971,592 # 5,100,000 Gas to Energy Sales 140,250 160,000 159,293 # 160,000
4,755,239 4,760,000 5,130,885 5,260,000Other Revenue
Recycling Revenue 46,334 30,000 29,000 # 29,000 Sale of Fixed Asset - - - # - Advertising 1,000 1,000 1,000 # 1,000 Recovery/Reimbursement 629 300 300 # 300 Other (212) - - # -
47,752 31,300 30,300 30,300Investment Earnings
Interest Income 116,681 60,000 238,250 # 238,500 Interest on Accounts Receivable 17,431 100 100 # 100
134,112 60,100 238,350 238,600Transfer from/(to) Fund Balance
Fund Balance Appropriation - - - # -
Total 4,945,461 4,858,400 5,406,035 5,535,900
EXPENDITURES
Salaries & WagesBase Salaries/Wages 754,509 832,195 844,614 # 859,342 Salary Adjustment - - - # - Overtime 45,082 48,925 48,925 # 72,575 Out of Title Pay - - - # - Sick Leave Buy Back 897 1,150 1,150 # 1,150
800,488 882,270 894,689 933,067Employee Benefits
Lagers Pension Contribution 83,569 103,972 105,438 # 113,834 FICA Contribution 49,702 54,629 55,399 # 57,850 FICA Medicare 11,624 12,777 12,957 # 13,529 457 Employer Plan Match 5,075 5,460 5,460 # 7,020 Health Insurance 143,352 161,592 149,461 # 195,096 Dental Insurance 5,166 6,228 6,228 # 7,058 Federal Health Reinsurer Tax - - - # - Life Insurance 2,478 2,796 2,798 # 2,970 Unemployment Claims - - - # - Long Term Disability 1,859 2,239 2,272 # 2,376 Workers Compensation 33,219 35,244 35,741 # 37,323 Confer/Train/Travel 3,876 10,100 10,100 # 10,100
11 - 51

LANDFILL FUNDEXPENDITURES
2017-18 2018-19 2019-20Adopted Estimated
Actual Budget Actual BudgetMaterials & Supplies
Office Supplies 5,367 5,100 5,100 5,100 Janitorial Supplies 3,741 2,600 2,600 2,600 Safety Equip/Clothing 4,753 5,350 5,750 5,350 Motor Fuel and Lubricants 248,723 350,000 283,193 350,000 Minor Equipment 21,101 15,500 25,500 15,500 Street Maintenance Supplies 22,177 60,000 30,000 30,000 Other Materials/Supplies 6,471 18,700 10,100 10,100
312,333 457,250 362,243 418,650Services
Professional Services 261,644 282,314 300,000 175,000 Memberships 976 800 800 800 Periodicals & Books - 500 500 500 Telephone Service 5,966 6,380 6,380 6,380 Postage 158 500 500 500 Freight 3,014 2,000 2,000 2,000 Advertising 18,855 12,000 12,000 12,000 Permits & Recording Fees 2,275 4,400 4,400 4,400 Printing & Binding 2,411 2,700 2,700 2,700 Gas Service 4,940 5,000 5,914 6,000 Electric Service 9,554 10,000 9,560 10,000 Water Service 1,466 600 1,499 1,500 Vehicle/Equipment Rental 411 700 700 700 M&R - Office Equipment - 1,600 1,600 1,600 M&R - Building & Facilities 6,760 7,500 7,500 7,500 M&R - Machinery & Equipment 152,214 78,600 120,500 120,500 M&R - Motor Vehicles 16,143 20,000 15,000 20,000 M&R - Communications Equipment 5,106 4,000 3,500 4,000 Major Repairs & Replacements 31,463 23,988 30,000 50,000 Towing Services 35 200 200 200 Laundry Services 4,333 5,250 5,250 5,250 MO DNR Fees (17,022) 50,000 150,000 250,000 Other Services 90,208 86,700 56,700 89,100
600,909 605,732 737,204 770,630Other Charges
Other Debt Charges - - - - Insurance 20,624 18,620 18,620 23,585 Judgments & Claims 1,111 2,000 2,000 2,000 Transfer to General Fund 615,422 610,892 710,892 649,840 Transfer to SIMR Fund - - - - Transfer to Water Protection 3,250 3,250 3,250 3,250 Transfer to General Fund - Computer 5,000 6,000 6,000 7,000
645,407 640,762 740,762 685,675Capital Outlay & Public Improvements
Motor Vehicles - - - - Machinery & Equipment 83,982 12,000 951,405 1,069,000 Land - 400,000 400,000 400,000 Improvements Other than Buildings 203,958 690,000 690,000 370,000
287,940 1,102,000 2,041,405 1,839,000 Total 2,986,997 4,083,051 5,162,157 5,094,179
11 -52

2017-18 2018-19 2019-20Adopted Estimated
Actual Budget Actual Budget
Projected Beginning Fund Balance: $1,963,279 $1,730,273 3,018,047 SOURCES
CIP Sales Tax 5,980,599 6,011,000 6,011,000 6,011,000 Other Misc Revenues 4,862,300 - 2,382,350 - Interest Earnings 108,677 20,000 105,691 20,000 Intergovernmental/Grants 262,460 882,000 672,000 480,000 Transfer from General Fund 761,987 354,500 354,500 - Transfer from Gaming Fund - - 390,227 - Transfer from CDBG Fund - - 228,719 - Transfer from Museum Fund - - - - Appropriation from Fund Balance - 6,483,592 - - TOTAL SOURCES 11,976,023 13,751,092 10,144,487 6,511,000
USESProfessional Services/Materials & Supplies 188,971 - - - Interfund Trfs 218,512 940,000 - 1,204,200 Capital Equip - - - - Improvmnt Projects 11,801,547 6,780,092 8,856,713 7,044,705
TOTAL USES 12,209,029 7,720,092 8,856,713 8,248,905
Net Surplus (Deficit) (233,006) 6,031,000 1,287,774 (1,737,905)
Projected Ending Fund Balance: $1,730,273 $3,018,047 1,280,142
CAPITAL PROJECTS FUNDSUMMARY
Interfund Trfs
14.6%
Improvmnt Projects85.4%
Capital Uses by Category
CIP Sales Tax 92.3%
Interest Earnings
0.3%
Grants7.4%
Capital Revenue Sources
11 - 53

2017-18 2018-19 2019-20Adopted Estimated
Actual Budget Actual BudgetSales Tax
Sales Tax 6,660,014 6,678,000 6,678,000 6,678,000 Sales Tax Contra Account (1,551,394) (1,541,400) (1,541,400) (1,541,400) EATS 871,979 874,400 874,400 874,400
5,980,599 6,011,000 6,011,000 6,011,000 Other Revenue
Insurance Proceeds 10,000 - - - Donations 406,800 - 10,000 - Recovery/Reimbursement - - 119,350 - MO Levee Project 4,445,500 - - - Developer Contributions - - 13,000 - Capital Lease Proceeds - - 2,240,000 -
4,862,300 - 2,382,350 - Investment Earnings
Interest Income 108,677 20,000 105,691 20,000 108,677 20,000 105,691 20,000
Intergovernmental Buchanan County Streets - - 210,000 - Bode Trust - - 330,000 - MO DNR Parks - - - - Trans Enhancement Grant - - - - STP/FHWA Grant 262,460 882,000 132,000 480,000 FTA/CPG Grant - - - - Buchanan County 911 - - - - FEMA Reimbursement Fund - - - - SEMA Homeland Security Grant - - - - Miscellaneous Grants - - - - American Rec Reinvest Capital - - - -
Interfund Transfers In 262,460 882,000 672,000 480,000
Transfer from General Fund 761,987 354,500 354,500 - Transfer from Water Protection - - 390,227 - Transfer from Transit - - 228,719 - Transfer from Museum Fund - - - -
Transfer from/(to) Fund Balance 761,987 354,500 973,446 -
Fund Balance Appropriation - 6,483,592 7,865,717 -
Total 11,976,023 13,751,092 18,010,204 6,511,000
CAPITAL PROJECTS FUNDREVENUES
11 - 54

2017-18 2018-19 2019-20Adopted Estimated
Actual Budget Actual BudgetSupplies/Services/Other
Minor Equipment 6,608 - - - Professional Services 158,222 - - - License/Permits/Recording Fees 699 - - - Refund Expense - - - - Other Services 19,249 - - - Advertising 4,193 - - -
188,971 - - - Capital Outlay
Motor Vehicles - - - - Machinery & Equipment - - - - Software Purchases - - - -
- - - - Public Improvements
Land 19,265 180,800 55,800 - Buildings 773,351 460,210 97,725 - Improvements other than Buildings 7,674,220 3,683,082 7,186,840 7,044,705 Streets, Curbs & Sidewalks 3,334,711 2,456,000 1,516,348 -
11,801,547 6,780,092 8,856,713 7,044,705 Interfund Transfers
Transfer to General Fund - - - - Transfer to Aviation 218,512 940,000 - 1,204,200
218,512 940,000 - 1,204,200
Total 12,209,029 7,720,092 8,856,713 8,248,905
CAPITAL PROJECTS FUNDEXPENDITURES
11 - 55

(this page intentionally left blank)

GENERAL OBLIGATION BOND INDEBTEDNESSLEGAL DEBT MARGIN DETERMINATION
$1,049,424,110
Debt Limitation at 5% of assessed valuation................................................................ $52,471,206
Debt Limitation at 5% of assessed valuation................................................................ $52,471,206
Debt Limitation at 10% of assessed valuation.............................................................. $104,942,411
$00
0
$209,884,822
Total General Obligation Bonded debt .................................... Less amount available in Debt Service Fund……..
Legal Debt Margin
Assessed Valuation at January 4, 2019
Legal Debt Margin: Any Legal "City Purpose" - Art. VI, Sec 26b
Additional Debt Margin: Any Legal "City Purpose" - Art. VI. Sec 26c
Legal Debt Margin: Streets, Storm or Sanitary Sewers - Art VI. Sec 26d
Debt Applicable to Limitation:
The City, by agreement, has irrevocably appropriated and pledged property tax receipts in an amountsufficient to pay principal and interest on the outstanding general obligation bonds. In the event that receiptspledged are not sufficient to pay these obligations, the City is obligated to levy additional property taxessufficient to pay these debts.
The Missouri State Constitution permits a City, by vote of two-thirds of the voting electorate, to incur generalobligation indebtedness for "City Purposes" not to exceed 10% of the assessed value of taxable tangibleproperty; and to incur additional general obligation indebtedness not to exceed, in the aggregate, anadditional 10% of the assessed value of taxable tangible property, for the purpose of acquiring right-of-way,construction, extending and improving streets and avenues and/or sanitary or storm sewer systems; and anadditional 10% for purchasing or constructing waterworks, electric or other light plants, provided that the totalgeneral obligation indebtedness of the City does not exceed 20% of the assessed valuation of taxableproperty.
12 - 1

GENERAL OBLIGATION BOND INDEBTEDNESSLEGAL DEBT MARGIN
(in thousands of dollars)
2014-2015 2015-2016 2016-2017 2017-2018 2018-2019
942,350 980,423 1,012,996 1,030,563 1,049,424
188,470.00 196,084.60 202,599.20 206,112.62 209,884.82
0.00 0.00 0.00 0.00 0.00
188,470.00 196,084.60 202,599.20 206,112.62 209,884.82 Legal Debt Margin
Assessed Valuation at July 1
Legal Debt Limit @ 20%
Total General Obligation Debt Amount Available from Debt Service FundActual Debt (net)
Actual G.O. DebtLegal Debt Limit
$0
$200,000
$400,000
$600,000
$800,000
$1,000,000
$1,200,000
2014-2015 2015-2016 2016-2017 2017-2018 2018-2019
Actual Debt vs. Legal Debt Limit
(in th
ousa
nds)
12 - 2

SUMMARY OF EXISTING MUNICIPAL DEBT
At Issue Current MaturityDate Balance Fund Date
777,000 215,000 Sewer 4/1/202314,217,922 11,443,900 Sewer 1/1/203456,000,000 49,121,000 Sewer 7/1/203528,585,000 25,059,000 Sewer 7/1/203566,850,000 64,115,000 Sewer 7/1/20495,755,000 4,825,000 Sewer 7/1/2034
15,905,000 15,440,000 Sewer 6/1/2038188,089,922 170,218,900
233,522 34,689 General 1/1/202021,896 7,931 General 10/10/202013,553 4,909 Sewer 10/10/2020
120,465 85,386 Golf 2/15/202232,531 23,101 Golf 3/15/2022
2,240,000 2,240,000 CIP 12/1/20332,661,967 2,396,015
2,425,000 840,000 General 3/1/20245,110,000 2,720,000 Spec Alloc 3/1/20296,685,000 2,920,000 Spec Alloc 5/1/2024
22,275,000 17,645,000 Sewer 5/1/20368,685,000 4,365,000 Spec Alloc 11/1/20248,825,000 4,520,000 Sewer 11/1/2024
10,255,000 8,805,000 Sewer 4/1/203419,215,000 16,175,000 Sewer 4/1/202719,360,000 18,225,000 Spec Alloc 6/30/2028
102,835,000 76,215,000
293,586,889 248,829,915
2015 - IDA B (2007 Refncd)2018 - IDA (Shoppes TIF)
Total All Debt
Amount of Financing
2008 - IDA (Mitchell Ave Project)2011 - MDFB A (Triumph 2004 Refncd)2011 - MDFB E (Sewer System)2012 - MDFB B ( 2004 Refncd)2012 - MDFB C (2004C Sewer Refncd)2015 - IDA A (Sewer System)
2018 - Golf Carts2018 - Golf Sprayer2019 - Energy Improvements
Other Debt2004 - MDFB D (LEC Expansion)
2018 - Sewer Revenue Bonds
Revenue Bonds
Capital Lease Obligations2015 - Avaya IP Phone2017 - Mail Machine2017 - Folder/Inserter
2003 - Sewer Revenue Bonds2013 - SRF Bonds2014 - SRF Bonds2014A - SRF Bonds2017 - SRF Bonds2014B Sewer Revenue Bonds
12 - 3

Remaining Total Total
Original Prior Current ThroughIssue Payments Balance 2019-2020 2020-2021 2021-2022 2022-2023 2023-2024 2024-2050 Maturity
233,522 198,833 34,689 34,689 0 0 0 0 0 34,68974,541 1,417 0 0 0 0 0 1,417
233,522 273,374 34,689 36,106 0 0 0 0 0 36,106
21,896 13,965 7,931 5,601 2,330 0 0 0 0 7,931785 99 46 0 0 0 0 145
21,896 14,750 7,931 5,700 2,376 0 0 0 0 8,076
2,425,000 1,585,000 840,000 155,000 160,000 165,000 175,000 185,000 0 840,0001,086,405 37,800 30,825 23,625 16,200 8,325 0 116,775
2,425,000 2,671,405 840,000 192,800 190,825 188,625 191,200 193,325 0 956,775
2,680,418 1,797,798 882,620 195,290 162,330 165,000 175,000 185,000 0 882,6201,161,731 39,316 30,871 23,625 16,200 8,325 0 118,337
2,680,418 2,959,529 882,620 234,606 193,201 188,625 191,200 193,325 0 1,000,957
2,240,000 0 2,240,000 110,000 120,000 125,000 130,000 135,000 1,620,000 2,240,0000 106,398 70,070 65,923 61,607 57,122 288,402 649,521
2,240,000 0 2,240,000 216,398 190,070 190,923 191,607 192,122 1,908,402 2,889,521
120,465 35,079 85,386 31,012 32,211 22,163 0 0 0 85,3869,882 2,708 1,509 317 0 0 0 4,534
120,465 44,961 85,386 33,720 33,720 22,480 0 0 0 89,920
32,531 9,430 23,101 8,011 8,450 6,640 0 0 0 23,1011,885 1,041 602 149 0 0 0 1,792
32,531 11,315 23,101 9,052 9,052 6,789 0 0 0 24,893
152,996 44,509 108,487 39,022 40,661 28,804 0 0 108,48711,767 3,750 2,111 466 0 0 6,327
152,996 56,276 108,487 42,772 42,772 29,270 0 0 114,814
5,110,000 2,390,000 2,720,000 215,000 220,000 235,000 250,000 260,000 1,540,000 2,720,0002,388,640 149,600 137,775 125,675 112,750 99,000 263,450 888,250
5,110,000 4,778,640 2,720,000 364,600 357,775 360,675 362,750 359,000 1,803,450 3,608,250
6,685,000 3,765,000 2,920,000 535,000 560,000 580,000 605,000 640,000 0 2,920,0001,410,846 126,869 106,806 84,406 57,581 29,600 0 405,263
6,685,000 5,175,846 2,920,000 661,869 666,806 664,406 662,581 669,600 0 3,325,263
8,685,000 4,320,000 4,365,000 720,000 745,000 770,000 800,000 835,000 495,000 4,365,0001,492,241 168,880 144,918 118,262 86,861 54,237 10,093 583,252
8,685,000 5,812,241 4,365,000 888,880 889,918 888,262 886,861 889,237 505,093 4,948,252
19,360,000 1,135,000 18,225,000 1,840,000 1,915,000 2,010,000 2,100,000 2,190,000 8,170,000 18,225,000479,698 551,735 529,135 505,535 481,135 449,385 1,312,523 3,829,448
19,360,000 1,614,698 18,225,000 2,391,735 2,444,135 2,515,535 2,581,135 2,639,385 9,482,523 22,054,448
39,840,000 11,610,000 28,230,000 3,310,000 3,440,000 3,595,000 3,755,000 3,925,000 10,205,000 28,230,0005,771,424 997,083 918,634 833,878 738,328 632,222 1,586,066 5,706,212
39,840,000 17,381,424 28,230,000 4,307,083 4,358,634 4,428,878 4,493,328 4,557,222 11,791,066 33,936,212Interest
Total Spec Allocation
Total Golf Debt
Total GF Debt
FUTURE DEBT SERVICE REQUIREMENTS - EACH TYPE BY FUND
PrincipalInterest
PrincipalInterest
Principal
Interest
PrincipalInterest
PrincipalInterest
PrincipalInterest
PrincipalInterest
PrincipalInterest
Principal
Special Allocation (TIF)
2013 Golf Carts Lease
2011 MDFB Series A (Triumph Foods TIF)
Municipal Golf
PrincipalInterest
2008 IDA Mitchell Avenue
2018 MDFB Series (North Shoppes TIF)
2012 MDFB Series B (Triumph Foods TIF)
Principal
General Fund
2015 Avaya IP Phone System
2017 Mailing Machine
2004 MDFB D (LEC Expansion)
Interest
Capital Projects2019 Energy Improvements
PrincipalInterest
Total Capital Project Debt
Interest
Principal
2018 Golf Sprayer Lease
12 - 4

RemainingTotal Total
Original Prior Current ThroughIssue Payments Balance 2019-2020 2020-2021 2021-2022 2022-2023 2023-2024 2024-2050 Maturity
13,553 8,644 4,909 3,467 1,442 0 0 0 0 4,909487 61 28 0 0 0 0 90
13,553 9,131 4,909 3,528 1,470 0 0 0 0 4,999
777,000 562,000 215,000 50,000 50,000 55,000 60,000 0 0 215,000388,043 10,905 8,405 5,880 3,075 0 0 28,265
777,000 950,043 215,000 60,905 58,405 60,880 63,075 0 0 243,265
22,275,000 4,630,000 17,645,000 695,000 725,000 750,000 790,000 825,000 13,860,000 17,645,0007,354,036 896,463 868,663 839,663 804,038 766,513 5,242,706 9,418,044
22,275,000 11,984,036 17,645,000 1,591,463 1,593,663 1,589,663 1,594,038 1,591,513 19,102,706 27,063,044
1,946,230 1,668,312 277,918 277,918 0 0 0 0 0 277,9181,344,684 10,619 0 0 0 0 0 10,619
1,946,230 3,012,996 277,918 288,537 0 0 0 0 0 288,537
6,878,770 2,636,688 4,242,082 417,082 715,000 740,000 760,000 785,000 825,000 4,242,0821,271,617 132,756 122,525 101,075 77,025 52,325 13,406 499,112
6,878,770 3,908,305 4,242,082 549,838 837,525 841,075 837,025 837,325 838,406 4,741,194
14,217,922 2,774,022 11,443,900 646,900 661,500 677,000 692,500 708,900 8,057,100 11,443,900882,304 148,934 140,350 131,567 122,580 113,388 578,627 1,235,446
14,217,922 3,656,326 11,443,900 795,834 801,850 808,567 815,080 822,288 8,635,727 12,679,346
56,000,000 6,879,000 49,121,000 2,414,000 2,478,000 2,544,000 2,611,000 2,680,000 36,394,000 49,121,0002,895,859 761,788 723,637 684,473 644,273 603,013 3,591,760 7,008,943
56,000,000 9,774,859 49,121,000 3,175,788 3,201,637 3,228,473 3,255,273 3,283,013 39,985,760 56,129,943
28,585,000 3,526,000 25,059,000 1,236,000 1,268,000 1,302,000 1,335,000 1,370,000 18,548,000 25,059,0001,218,793 336,627 319,709 302,348 284,532 266,254 1,584,740 3,094,211
28,585,000 4,744,793 25,059,000 1,572,627 1,587,709 1,604,348 1,619,532 1,636,254 20,132,740 28,153,211
5,755,000 930,000 4,825,000 220,000 225,000 230,000 240,000 255,000 3,655,000 4,825,000806,053 166,438 162,038 157,538 152,363 146,363 921,900 1,706,638
5,755,000 1,736,053 4,825,000 386,438 387,038 387,538 392,363 401,363 4,576,900 6,531,638
10,255,000 1,450,000 8,805,000 380,000 400,000 420,000 440,000 460,000 6,705,000 8,805,0001,429,155 341,294 322,294 302,294 281,294 259,294 1,458,575 2,965,044
10,255,000 2,879,155 8,805,000 721,294 722,294 722,294 721,294 719,294 8,163,575 11,770,044
19,215,000 3,040,000 16,175,000 1,290,000 1,355,000 1,420,000 1,490,000 1,625,000 8,995,000 16,175,0003,507,538 808,750 744,250 676,500 605,500 531,000 1,044,500 4,410,500
19,215,000 6,547,538 16,175,000 2,098,750 2,099,250 2,096,500 2,095,500 2,156,000 10,039,500 20,585,500
66,850,000 1,735,000 65,115,000 1,766,000 1,798,000 1,831,000 1,864,000 1,898,000 54,958,000 64,115,0001,028,130 737,301 717,077 696,489 675,518 654,172 8,179,700 11,660,257
66,850,000 2,763,130 65,115,000 2,503,301 2,515,077 2,527,489 2,539,518 2,552,172 63,137,700 75,775,257
15,905,000 465,000 15,440,000 565,000 590,000 610,000 635,000 670,000 12,370,000 15,440,000651,133 551,735 529,135 505,535 481,135 449,385 3,276,723 5,793,648
15,905,000 1,116,133 15,440,000 1,116,735 1,119,135 1,115,535 1,116,135 1,119,385 15,646,723 21,233,648
248,673,475 30,304,666 218,368,809 9,961,367 10,266,942 10,579,000 10,917,500 11,276,900 164,367,100 217,368,80922,777,832 4,903,670 4,658,110 4,403,361 4,131,332 3,841,706 25,892,636 47,830,815
248,673,475 53,082,498 218,368,809 14,865,037 14,925,052 14,982,361 15,048,832 15,118,606 190,259,736 265,199,624
293,586,889 43,756,973 249,829,916 13,615,680 14,029,933 14,492,804 14,977,500 15,521,900 176,192,100 248,829,91529,722,754 6,050,217 5,679,796 5,327,253 4,947,467 4,539,375 27,767,104 54,311,212
293,586,889 73,479,728 249,829,916 19,665,897 19,709,728 19,820,057 19,924,967 20,061,275 203,959,204 303,141,127
PrincipalInterest
PrincipalInterest
2017 Folder/Inserter
PrincipalInterest
PrincipalInterest
PrincipalInterest
Interest
2017 State Revolving Loan Funds
2013 State Revolving Loan Funds
PrincipalInterest
FUTURE DEBT SERVICE REQUIREMENTS - EACH TYPE BY FUND
Principal
Total All Debt
Total Debt Service
Total Sewer Debt
2014 State Revolving Loan Funds
2014A State Revolving Loan Funds
2014B Sewerage System Revenue Bonds
2015A IDA Sewerage System Revenue Bonds
2015B IDA Sewerage System Revenue Bonds
Principal
PrincipalInterest
Principal
Interest
PrincipalInterest
Interest
Sewer
2003 Sewerage System Revenue Bonds
2011 Sewerage System MDFB Series E
2012 MDFB C - WWT Plant Expansion - BUILD Bond Portion
2012 MDFB C - WWT Plant Expansion - City Portion
PrincipalInterest
PrincipalInterest
PrincipalInterest
2018 Sewerage System Revenue BondsPrincipalInterest
12 - 5


GLOSSARY Accrual Accounting – A method of accounting in which revenues are recorded when measurable and earned, and expenses are recognized when a good or service is used. see also modified accrual accounting
Acronym – An abbreviation used to stand for a phrase, compound word, name, etc. It is used to save space, to avoid repetition of long words and phrases, or simply to conform to conventional usage. The list of the most commonly used acronyms in the Budget Document includes:
CAP Community Appearance Plan CDBG Community Development Block Grant (Fund) CIP Capital Improvement Plan (or Capital Improvement Project) depending on context EATS Economic Activity Taxes FB Fund Balance FY Fiscal Year GASB General Accounting Standards Board GFOA Government Finance Officer Association G.O. General Obligation (Bond) HUD (Department of) Housing and Urban Development IDA Industrial Development Authority LINC Linking Individuals, Neighborhoods & Community MDFB Missouri Development Finance Board MDNR Missouri Department of Natural Resources MoDOT Missouri Department of Transportation PILOTS Payment In Lieu of Taxes SIMR Street Improvement Maintenance & Repair (Fund) SRF State Revolving Funds TIF Tax Increment Financing TDD Transportation Development District WIC Women, Infants and Children (federal grant program) WP Water Protection WWT Wastewater Treatment
Ad Valorem Taxes - General Property Taxes levied on the assessed valuation of real and personal property.
Annual Budget and Program of Services - The budget is a policy document, a financial plan, an operations guide, and a communications device covering a specified period of time. The City of St. Joseph prepares an annual operating budget matching planned revenues and expenditures to municipal services. The City's annual fiscal year budgeting period is from July 1 through June 30.
Annual Period - Unless otherwise stated refers to the twelve-month fiscal year commencing July 1 and concluding June 30. see also fiscal year
Appropriation - A legal authorization granted by the City Council permitting the City to incur obligations and to make expenditures of resources.
Appropriation Ordinance - The official document adopted by the City Council establishing the legal authority to incur obligations and to make expenditures of resources.
Assessed Valuation - The basis for determining property taxes. Assessed valuation determines the value of real and personal property. Personal property located in Missouri is assessed at 33% of its fair market
12 - 6

GLOSSARY value. Real estate property is assessed at 19%, 32%, and 12% of fair market value for residential, commercial, and agricultural property, respectively.
Bonded Debt - A form of borrowing (debt financing) which reflects a written promise from the City to repay a sum of money on a specific date at a specified interest rate. Bonds are used to finance large capital projects such as construction or repair of buildings, streets, and sewer infrastructure and purchase of high cost machinery and equipment.
Budget Message - The letter of transmittal from the City Manager which provides the City Council and the public with the general summary of the most important aspects of the budget, changes from previous fiscal years, and his views and recommendations.
Budgetary Control - The control or management of a governmental unit or enterprise in accordance with an approved budget for the purpose of keeping expenditures within the limitations of authorized appropriations and available revenues.
Budgetary Units - Formal cost centers including programs, departments, and funds used for fiscal oversight, compliance, and control.
Capital Asset Capitalization Policy - A set of self-imposed conditions required to capitalize and /or depreciate fixed assets purchased or constructed by the City. The purpose of the policy is to provide a reasonable basis for identifying and qualifying assets based on asset cost, estimated economic useful life, and related factors. Generally, infrastructure, assets costing less than $5,000, and assets having an estimated economic useful life of less than 1 year may not be capitalized because they do not warrant the effort of tracking and depreciating the asset.
Capital Improvement Program - The Capital Improvement Program is a five-year plan providing a summary of proposed capital projects including project costs and related financing plan. A Capital Improvement Program document is prepared and updated annually. The document serves as a planning tool identifying projects based on assigned priorities and providing for the coordinated implementation of selected projects. Capital Improvement Programs are adopted by Council Resolution with or without amendment after a public hearing, on or before the last day of the month six months prior to the beginning of the fiscal year.
Capital Lease Obligations - Capital Lease Obligations allow the City to acquire capital assets under fixed monthly payment arrangements over a specified lease term. Such lease Assets are considered City assets. Title to the assets transfers to the City at the end of the lease term and after payment of a one dollar ($1.00) bargain purchase option. Leases between the Vendor and the City do not require voter approval and are subject to annual appropriation by the City Council.
Capital Outlay - Purchases of fixed assets having a value equal to or greater than five thousand dollars ($5,000) and having an estimated economic useful life of more than one (1) year. Examples of capital outlay include, but are not necessarily limited to office furniture and equipment, computer hardware and software, vehicles, machinery and equipment, and communications equipment.
Capital Projects - Projects which are identified in the Capital Improvement Program document or the Annual Budget document and which are accounted for in either a Governmental or Proprietary Type Fund. The financial resources and expenditures of capital projects are generally kept separate from other municipal operations by coding such amounts to a CIP Project Program account in the appropriate fund.
12 - 7
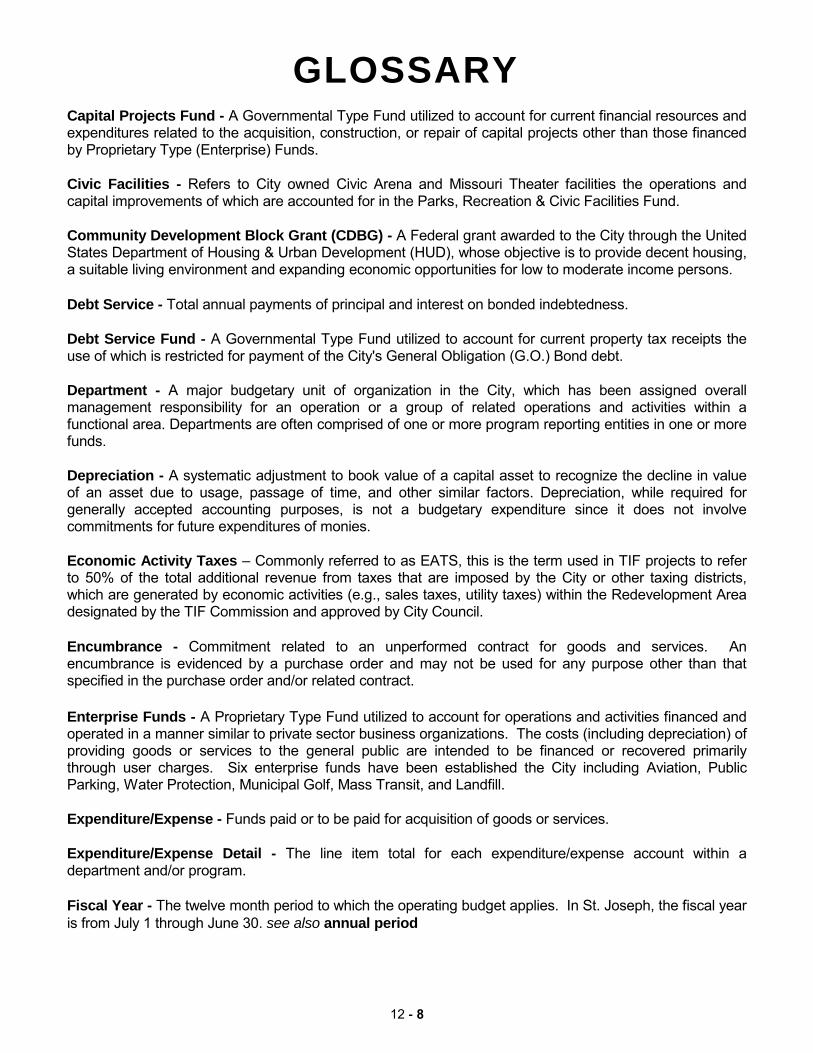
GLOSSARY Capital Projects Fund - A Governmental Type Fund utilized to account for current financial resources and expenditures related to the acquisition, construction, or repair of capital projects other than those financed by Proprietary Type (Enterprise) Funds.
Civic Facilities - Refers to City owned Civic Arena and Missouri Theater facilities the operations and capital improvements of which are accounted for in the Parks, Recreation & Civic Facilities Fund.
Community Development Block Grant (CDBG) - A Federal grant awarded to the City through the United States Department of Housing & Urban Development (HUD), whose objective is to provide decent housing, a suitable living environment and expanding economic opportunities for low to moderate income persons.
Debt Service - Total annual payments of principal and interest on bonded indebtedness.
Debt Service Fund - A Governmental Type Fund utilized to account for current property tax receipts the use of which is restricted for payment of the City's General Obligation (G.O.) Bond debt.
Department - A major budgetary unit of organization in the City, which has been assigned overall management responsibility for an operation or a group of related operations and activities within a functional area. Departments are often comprised of one or more program reporting entities in one or more funds.
Depreciation - A systematic adjustment to book value of a capital asset to recognize the decline in value of an asset due to usage, passage of time, and other similar factors. Depreciation, while required for generally accepted accounting purposes, is not a budgetary expenditure since it does not involve commitments for future expenditures of monies.
Economic Activity Taxes – Commonly referred to as EATS, this is the term used in TIF projects to refer to 50% of the total additional revenue from taxes that are imposed by the City or other taxing districts, which are generated by economic activities (e.g., sales taxes, utility taxes) within the Redevelopment Area designated by the TIF Commission and approved by City Council.
Encumbrance - Commitment related to an unperformed contract for goods and services. An encumbrance is evidenced by a purchase order and may not be used for any purpose other than that specified in the purchase order and/or related contract.
Enterprise Funds - A Proprietary Type Fund utilized to account for operations and activities financed and operated in a manner similar to private sector business organizations. The costs (including depreciation) of providing goods or services to the general public are intended to be financed or recovered primarily through user charges. Six enterprise funds have been established the City including Aviation, Public Parking, Water Protection, Municipal Golf, Mass Transit, and Landfill.
Expenditure/Expense - Funds paid or to be paid for acquisition of goods or services.
Expenditure/Expense Detail - The line item total for each expenditure/expense account within a department and/or program.
Fiscal Year - The twelve month period to which the operating budget applies. In St. Joseph, the fiscal year is from July 1 through June 30. see also annual period
12 - 8

GLOSSARY Franchise Fees - A franchise fee assessed major utility companies for the privilege of using public rights-of-way and property within the City limits. The City currently assesses franchise fees to KCPL, Spire Gas, AT & T, Missouri-American Water Company, and Suddenlink.
Function/Functional Classification - A high level of summarization used in the City's Annual Budget and Program of Services. Functional classification represents a grouping of related operations and activities which may cross organizational and formal budgetary unit boundaries. Functional classification, while not a formal budgetary unit, is aimed at providing information on a broad range of financial and performance data for related City services.
Fund - A major budgetary unit with revenues and expenditures segregated to carrying-out specific activities. The City maintains fifteen funds for budgeting purposes which are broadly classified as either a government type fund or a proprietary type fund. The City's sixteen funds include General; Streets Maintenance; Parks Maintenance; Community Development Block Grant; Public Safety Tax; Gaming Initiatives; Special Allocation; Museum Tax Initiatives; Debt Service; Aviation; Public Parking; Water Protection; Municipal Golf; Mass Transit; Landfill; and Capital Project Funds.
Fund Accounting - The accounts of the City are organized on the basis of funds, departments, and programs (budgetary units) and are used to demonstrate legal compliance and to aid in financial management by segregating financial transactions of various City functions and activities.
Fund Balance - The amount by which the reported value of City assets exceeds the reported value of its liabilities in a particular Fund. Fund balance is reduced for appropriated expenditures and increased for recorded revenues. GASB 54 dictates the components of fund balance. The four components involving actual cash are:
• Restricted fund balance – Monies which have an externally enforceable limitation on use imposedby grantors, contributors, laws or regulations of other governments, constitutional provisions orenabling legislation.
• Committed fund balance – Monies which have self imposed limitations on use set in place by theCity Council. Formal action by the Council is required to remove the limitation.
• Assigned fund balance – Monies with an intended use established by either the City Council or bythe City Manager.
• Unassigned fund balance – formally referred to as “unrestricted”, this is the surplus of resourcesavailable in the general fund after any restricted, committed and/or assigned monies are deducted.
GASB 34 – A General Accounting Standards Board (GASB) standard issued in June 1999, requiring a new CAFR reporting model for all state and local entities. The model is designed to provide an analysis of government’s functions more closely resembling the financial statements of private commerce and industry.
GASB 54 – See information under Fund Balance definition above.
General Fund - A Governmental Type Fund in which all revenues and expenditures are accounted for, if not specifically allocated by law or contractual agreement, to another specific fund. With the exception of subvention or grant revenues restricted for specific uses, the General Fund resources can be utilized for any legitimate governmental purpose. Departments accounted for within the General Fund are Mayor & City Council, City Clerk, Municipal Court, City Manager, Public Information and Communication, Human Resources, Legal and Risk Management, Community Development Services, Administrative Services, Technology Services, Police, Fire, Public Works, Parks Recreation & Civic Facilities, and Public Health.
12 - 9

GLOSSARY General Obligation (G.O.) Bonds - General Obligation bonds can be issued for any qualified "city purpose" in an amount not to exceed 20% of assessed value of taxable tangible property and are backed by the full faith and credit of the City. G.O. Bonds require voter approval of 2/3rds or 4/7ths majorities.
Goal – A long-term, continuing target of the organization. A broad statement of intended accomplishments and/or description of general conditions deemed desirable. Goal statements are specified at the fund, department and/or program level and communicated in the Annual Budget document.
Governmental Type Fund - A fund having a measurement focus on current financial resources thereby eliminating the need for revenue and expenditure accruals. The City has four categories of Governmental Type Funds including the General Fund, Special Revenue Funds, Proprietary (Enterprise) Funds, and Capital Project Fund.
Industrial Development Authority (IDA) – A board appointed by the City Council, it develops, advances, encourages and promotes, subject to the limitations imposed by the Industrial Development Authority Act, commercial, industrial, agricultural and manufacturing facilities in the City. The IDA provides the financial vehicle(s) through which businesses can obtain funding for expanding and/or establishing themselves in the community.
Infrastructure – Physical systems or structures that when installed become indistinguishable, inseparable, or otherwise part of surrounding appurtenant structures. Completed infrastructure and related depreciation are not recorded as assets in the financial records of the City. Examples of infrastructure include sewer lines; streetlights; streets, curbs, and gutters; retaining walls, etc.
Interest on Investments - Revenues derived from the investment earnings of unrestricted and restricted cash. The City invests primarily in full faith and credit obligations of the U.S. Government, and fully collateralized Certificates of Deposit. Interest on unrestricted cash investments is credited to respective fund accounts based on an average monthly pooled cash balance. Interest earned on restricted cash investments such as cash proceeds from bond issuances and cash reserves established by bond covenants, are tracked separately and credited to the appropriate fund.
Interfund Transfers - Amounts transferred from one fund to another.
Line-item Budget - A budget that reports budgeted amounts for individual detailed expenditure categories (salary, telephone, office supplies, etc...). The City of St. Joseph provides a line-item budget at the department and fund level. Program level revenues and expenditures are summarized and not reported in the budget on a line-item budget basis.
Long-term Debt - Debt with an original maturity in excess of one year from date of issuance.
Minor Equipment - Category of assets expensed for accounting and budgetary control purposes because they do not satisfy the City's capital asset capitalization policy.
Modified Accrual Accounting – A form of accrual accounting in which (1) expenditures are recognized when the goods or services are received and (2) revenues, such as taxes, are recognized when measurable and available to pay expenditures in the current accounting period. see also accrual accounting.
Operating Budget - The portion of the budget that pertains to basic operations of the various municipal funds, departments, and programs.
12 - 10

GLOSSARY Payment in Lieu of Taxes - Commonly referred to as PILOTs, this is the term used in TIF projects or in Chapter 100 Agreements to refer to those revenues from real property in the Redevelopment Area as designated by the TIF Commission (when linked to a TIF) and approved by City Council. These revenues are used to retire TIF Obligations and pay other reimbursable project costs which taxing districts would have received had the City not adopted the TIF or granted the Chapter 100 tax abatements.
Personnel Costs - Cost of wages, salaries, payroll taxes, retirement, and costs of other employee benefits for all City employees.
Program - The lowest budgetary unit reporting as practiced by the City of St. Joseph. Related programs are rolled forward and included in the appropriate department and fund. Programs are groupings of related activities organized to accomplish basic goals and objectives.
Program Summary - The Program Summary provides descriptions of program services and activities, program outcomes and indicators, program revenues, program expenditures, program capital outlay, and staffing levels. The Program Summary is designed to assist the user to better understand the nature, extent, costs, and benefits of program services and functions.
Proprietary Type Fund - A fund having a measurement focus on the flow of economic resources and determination of net income including current and non-current financial resources. Since non-current economic resources must be considered, revenue and expenditure accruals are considered. The City budgets one category of Proprietary Type Fund. (See Enterprise Funds).
Public Building Authority (PBA) Bonds/Leases - The PBA issues bonds to investors using the bond proceeds to purchase equipment or construct public improvements which are leased to the City under an arrangement where the lease payments to the PBA equal the bond payments to the investors. Leases between the PBA and the City do not require voter approval and are subject to annual appropriation.
Public Safety Tax – Voters approved the 2013 half-cent public safety sales tax for a period of twenty (20) years for improving the public safety of the city, including additional police officers, public safety employee salaries and benefits, expenditures on equipment and facilities.
Reimbursable Project Costs – Refers to those costs incurred by the Developer and/or the City that, as approved in a Redevelopment Agreement, are to be funded or reimbursed from PILOTS, EATS, or other TIF-related revenue sources.
Revenue - Amounts the City of St. Joseph receives and/or earns as income including, but not limited to, such items as taxes, user fees, franchise fees, licenses, bond proceeds, rents, grants, fines, forfeitures, and interest earnings.
Revenue Bonds - Revenue bonds are sold to fund capital improvements when sufficient earnings can be generated from the improvements to repay the bond debt. Revenue bonds require voter approval of 2/3rds or 4/7ths majorities.
Risk Management - An organized attempt to protect an organization's assets against accidental loss in the most cost-effective manner. The City employs a full-time Risk Manager to coordinate this effort. The Risk Management Program is described in the Budget Document under the Legal Department in the General Fund.
Sales Tax - A tax remitted to the City by the State applied to the sales of goods and services within City limits.
12 - 11

GLOSSARY Special Allocation Fund – The fund established by the City into which, as required by State Statute, all PILOTS, EATS, and other TIF revenues are deposited for the purpose of paying redevelopment project costs and TIF obligations.
Special Revenue Fund - A Governmental Type Fund utilized to account for the proceeds from specific revenue sources (other than from trusts or capital improvement projects) the expenditures of which are legally restricted for specific purposes. The City maintains six budgeted Special Revenue Funds including the Streets Maintenance; Parks Maintenance Fund; Public Safety Tax Fund, Special Allocation Fund; Gaming Initiatives Fund, Museum Tax Initiatives Fund; and the Community Development Block Grant Fund.
State Revolving Fund – The Missouri State Revolving Fund (SRF) leveraged loan program is a subsidized low interest low program available through the Department of Natural Resources Water Protection Program for improvements to the City’s sewer infrastructure. The City currently has the 2013, 2014, 2014A, and 2017 SRF loans outstanding as of June, 2018.
Subventions - Revenues collected by the State or other government entity which are allocated to the City on a formula basis. The major subventions received by the City from the State include motor vehicle sales tax, road and bridge tax, motor vehicle fee increases, and gasoline tax.
Tax Increment Financing – Commonly known as a TIF project or TIF redevelopment project, a TIF is an economic development tool established by state statutes which provides a means for local governments to help finance the redevelopment of area that are blighted, substandard, or economically underutilized and that would not otherwise be developed without public assistance. TIF provides a mechanism to capture future increases in real property taxes and economic activity taxes (e.g., local sales taxes, utility taxes) associated with the redevelopment of the property in an established TIF district.
Transportation Development District – Commonly known as a TDD, is a special purpose district authorized to finance, undertake and maintain transportation related public improvements benefiting the district. A TDD project includes any bridge, street, intersection, signing or signalization, parking lot, garage, etc., related to transportation needs of the district. The district can use one or more funding mechanisms to fund a project---special assessments, property tax, sales tax, tolls.
User Fees - Receipt of a fee for providing a direct and specifically identifiable service to a particular customer.
12 - 12


