University of North Dakota University of North Dakota
UND Scholarly Commons UND Scholarly Commons
Theses and Dissertations Theses, Dissertations, and Senior Projects
January 2020
Auditory Consonant Trigrams: Construct And Criterion Validity Auditory Consonant Trigrams: Construct And Criterion Validity
Update Update
Katharine Elizabeth Lindberg
Follow this and additional works at: https://commons.und.edu/theses
Recommended Citation Recommended Citation Lindberg, Katharine Elizabeth, "Auditory Consonant Trigrams: Construct And Criterion Validity Update" (2020). Theses and Dissertations. 3283. https://commons.und.edu/theses/3283
This Dissertation is brought to you for free and open access by the Theses, Dissertations, and Senior Projects at UND Scholarly Commons. It has been accepted for inclusion in Theses and Dissertations by an authorized administrator of UND Scholarly Commons. For more information, please contact [email protected].

AUDITORY CONSONANT TRIGRAMS: CONSTRUCT AND CRITERION VALIDITY UPDATE
By
Katharine Elizabeth Lindberg
Bachelor of Arts, Winthrop University, 2013 Master of Arts, University of North Dakota, 2017
A Dissertation
Submitted to the Graduate Faculty
of the
University of North Dakota
in partial fulfillment of the requirements
for the degree of
Doctor of Philosophy
Grand Forks, North Dakota
August 2020

ii
Copyright 2020 Katharine E. Lindberg

iii
This dissertation, submitted by Katharine E. Lindberg in partial fulfillment of the requirements for the Degree of Doctor of Philosophy from the University of North Dakota, has been read by the Faculty Advisory Committee under whom the work has been done and is hereby approved. Dr. Joseph Miller, Chairperson
Dr. Thomas Petros, Committee Member
Dr. F. Richard Ferraro, Committee Member
Dr. Alan King, Committee Member
Dr. Lindsay Hines, Committee Member
Dr. Virginia Clinton, Member-At-Large
This dissertation is being submitted by the appointed advisory committee as having met all of the requirements of the School of Graduate Studies at the University of North Dakota and is hereby approved.
Dr. Chris Nelson Dean of the School of Graduate Studies
Date

iv
PERMISSION
Title Auditory Consonant Trigrams: Construct and Criterion Validity Update
Department Psychology
Degree Doctor of Philosophy
In presenting this dissertation in partial fulfillment of the requirements for a graduate degree from the University of North Dakota, I agree that the library of this University shall make it freely available for inspection. I further agree that permission for extensive copying for scholarly purposes may be granted by the professor who supervised my dissertation work or, in his absence, by the Chairperson of the department or the dean of the School of Graduate Studies. It is understood that any copying or publication or other use of this dissertation or part thereof for financial gain shall not be allowed without my written permission. It is also understood that due recognition shall be given to me and to the University of North Dakota in any scholarly use which may be made of any material in my dissertation.
Katharine E. Lindberg July 29, 2020

v
TABLE OF CONTENTS
LIST OF FIGURES .......................................................................................................... ix
LIST OF TABLES .............................................................................................................. x
ACKNOWLEDGMENTS ................................................................................................ xi
ABSTRACT ..................................................................................................................... xii
CHAPTER
I. INTRODUCTION ....................................................................................... 1
Intelligence....................................................................................... 13
Executive Functioning .....................................................................15
Working memory/Updating ................................................. 16 Perseveration ........................................................................ 18
Attention .......................................................................................... 19
Processing Speed ............................................................................. 20
Present Study ................................................................................... 21
II. METHOD ................................................................................................. 23
Participants ....................................................................................... 23
Materials .......................................................................................... 27
Demographics ...................................................................... 27
vi
Neuropsychological Assessment Measures ......................... 27
Measures of Executive Functioning ........................ 29
Auditory Consonant Trigrams Test ............. 29
WAIS-IV Digit Span Forwards and
Backwards .................................................... 30
Integrated Visual and Auditory Continuous
Performance Test Auditory Prudence .......... 31
WAIS-IV Letter Number Sequencing ......... 31
WAIS-IV Arithmetic ................................... 32
California Verbal Learning Test-II Trial 1
and Trials 1-5 scores .................................... 32
Rey Complex Figure Test (RCFT) Percent
Retention ...................................................... 33
Stroop Test Interference Score..................... 34
Wisconsin Card Sorting Test Perseverative
Errors score .................................................. 34
Controlled Oral Word Association Test ...... 35

vii
Measures of Processing Speed ................................. 35
WAIS-IV Coding ......................................... 35
WAIS-IV Symbol Search ............................ 36
Stroop Test Word-reading score and Color-
naming score ................................................ 36
Measures of Attention .............................................. 36
Trail Making Test Part A and Part B ........... 36
IVA + Auditory Vigilance ........................... 37
Verbal Series Attention Test ........................ 37
Measures of IQ and Premorbid IQ ........................... 38
WAIS-IV Full Scale Score........................... 38
Wide Range Achievement Test: Fourth
Edition Word Reading ................................ 38
Procedure ......................................................................................... 39
III. RESULTS ................................................................................................. 39
Exploratory Factor Analyses............................................................ 41
Receiver Operating Characteristic Analyses ................................... 46

viii
IV. DISCUSSION ........................................................................................... 55
Construct Validity ............................................................................ 56
Implications of Principle Factors Extraction Method and
Promax Rotation on the EFA ............................................... 60
Additional Limitations and Future Directions of the EFA .. 62
Criterion Validity ............................................................................. 64
Limitations and Future Directions of ROC Analyses .......... 68
Limitations and Future Directions ................................................... 69
REFERENCES ..................................................................................................... 71
ix
LIST OF FIGURES
Figure Page
1. ACT Total and ACT Perseveration score Means with Standard Deviations within Clinical Groups of 30 or More Patients ...................................................................... 48
x
LIST OF TABLES
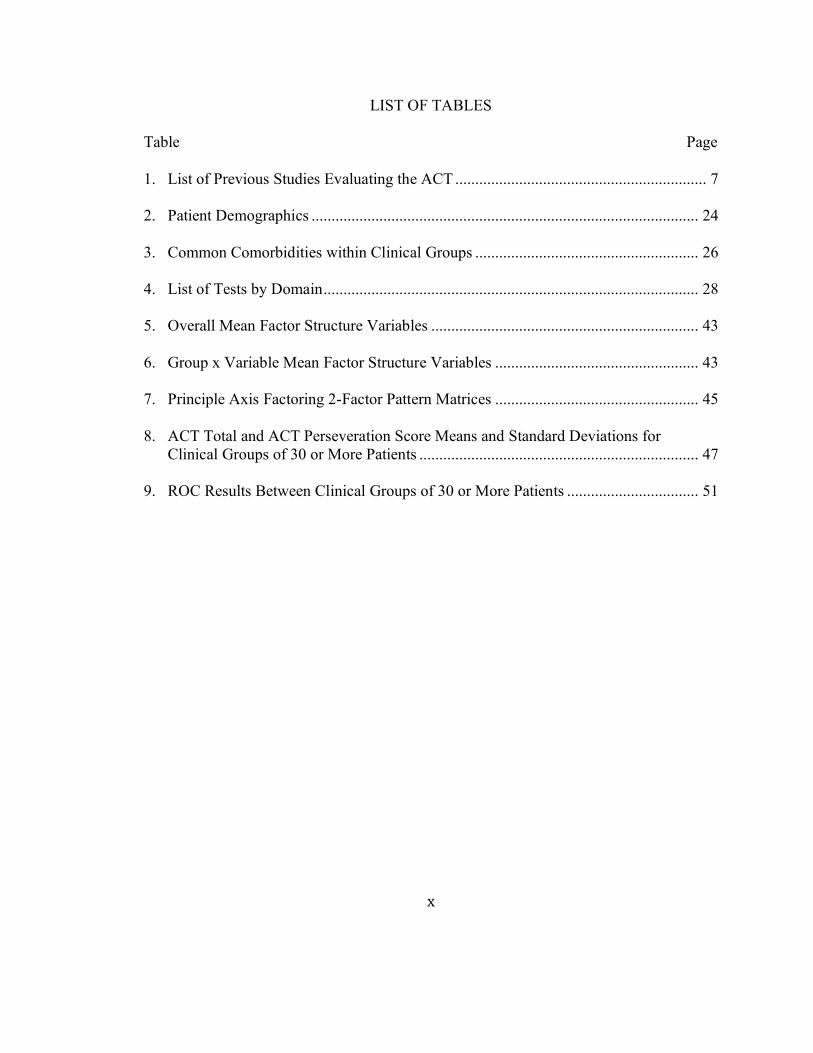
Table Page 1. List of Previous Studies Evaluating the ACT ............................................................... 7
2. Patient Demographics ................................................................................................. 24
3. Common Comorbidities within Clinical Groups ........................................................ 26
4. List of Tests by Domain .............................................................................................. 28
5. Overall Mean Factor Structure Variables ................................................................... 43
6. Group x Variable Mean Factor Structure Variables ................................................... 43
7. Principle Axis Factoring 2-Factor Pattern Matrices ................................................... 45
8. ACT Total and ACT Perseveration Score Means and Standard Deviations for Clinical Groups of 30 or More Patients ...................................................................... 47 9. ROC Results Between Clinical Groups of 30 or More Patients ................................. 51

xi
ACKNOWLEDGMENTS
I wish to express my profound gratitude to my advisor and committee
chairperson, Dr. Joseph Miller. The support and guidance you offered throughout not
only this project, but also during my time in this graduate program has been generous and
truly invaluable. I am thankful that I have had the opportunity to work with you on this
and other projects. To Dr. Lindsay Hines, your support and guidance was essential to the
completion of this project, moreover your mentorship has enabled me to succeed far
beyond the scope of this project in my career pursuits. Your bright and enthusiastic
nature kept me going, for this I will forever be grateful. I would like to offer my
appreciation to all the other members of my advisory committee, Dr. Thomas Petros, Dr.
F. Richard Ferraro, Dr. Alan King, and Dr. Virginia Clinton whose support and
suggestions have aided me in this endeavor.
I would like to thank my cohort, with whom I have shared many memories over
the past years. Special thanks to Stephanie Henley. Your support and knowledge aided
me tremendously in this and other projects, as well as, the mental support you have
always given me. I am lucky to call you my colleague, but more importantly my friend.
Last but most definitely not least, thank you to my family and other friends who helped to
keep me motivated through your endless encouragement over the years.

To my mom Mary. You have always been my source of strength.
Moving forward without you will continue to be immensely difficult, but I am so thankful you raised me to be the resilient woman I am today.
We are two of a kind and as such I will never be without you. This accomplishment will always remind me of your sacrifices and unconditional love for me.
I love you.
To my dad, Richard, and my sister, Kristin. I could not have been successful through the ups and downs that have come our way without
both of you by my side. I am so glad these trials have brought us closer together as your encouragement kept me going even when I doubted myself.
To my nephews, Jack and Jude. You are both my joy and I cannot wait to see what you will accomplish in the future.
I am looking forward to laughing with you all and sharing in each other’s accomplishments for many years to come.
I love you all tremendously.
xii
ABSTRACT
The Auditory Consonant Trigrams (ACT) has historically been used in research and
clinical settings as a measure of working memory ability, though previous research has
failed to identify the precise cognitive processes and abilities measured by the task. The
ACT total score (ACT T) has been shown to be sensitive to numerous clinical
neurological and psychological populations (i.e., TBI, ADHD, MS, MDD). Alternatively,
little is known about the ACT perseveration score (ACT P), the current study aimed to
identity the ACT T and ACT P’s relationships to other neuropsychological measures and
their clinical utility within diverse clinical/neurological presentations. In a sample of
patients referred for neuropsychological evaluation (N = 448), an exploratory factor
analysis revealed a 2-factor model accounting for 49.54% of the variance within the
sample. The ACT T and ACT P loaded on a factor with measures of higher-order
executive functioning accounting for 9.99% of the variance within the sample. Further,
the clinical utility of the ACT T and ACT P was found to be limited within the current
sample with a trend of the ACT T discriminating the severity of brain damage within
TBI, while the ACT P tended to discriminate diagnostic groups. These findings suggest
that the ACT scoring methods may be too simplistic to identify subtle cognitive changes
in clinical populations.

1
CHAPTER I
INTRODUCTION
The Brown-Peterson task is an assessment measure used in clinical and
experimental settings that require test-takers to maintain information throughout a
distractor task (e.g., counting backwards; Brown, 1958; Lezak et al., 2012; Strauss et al.,
2006). Brown (1958) created the task to assess memory decay after a brief delay (i.e.,
immediate memory) while limiting test-takers' ability to rehearse information to be
remembered. Distractor tasks, such as the Brown-Peterson task, were shown to decrease
recall performance over a delay of up to 20 seconds. This finding suggested that
information encoded into short-term memory, though initially accurate, rapidly decays
especially in situations where rehearsal is not possible (Peterson & Peterson, 1959).
Numerous versions of the Brown-Peterson task have been created and studied, with
variations in types of information to be remembered (e.g., letters vs. words), types of
delays (e.g., no delay, time only delay, distractor task delay), length of delay, and
administration method (e.g., auditory and computer). Despite the longevity of the Brown-
Peterson paradigm, numerous researchers have failed to converge on a consensus
regarding the precise cognitive processes and abilities measured by the task (Boone et al.,
1998; Mertens et al., 2006; Shura et al., 2016), though the task is generally administered
in clinical settings as a measure of working memory ability (Lezak et al., 2012; Strauss et
al., 2006).
2
One of the most common variations of the Brown-Peterson task used in clinical
practice is the Auditory Consonant Trigrams (ACT; Boone et al., 1998; Stuss et al., 1987;
Stuss et al., 1988), which requires test-takers to listen to a sequence of three letters (i.e.,
consonant trigrams; e.g., B-T-G), then immediately begin counting backwards by threes.
After some period of counting, the test-takers are asked to recall the previously presented
consonant trigram. Although conceptualized and commonly used as a measure of
working memory ability, empirical evidence suggests performance on the ACT is highly
related to other measures of basic and complex attention, processing speed, working
memory, impulsivity, and intelligence (Boone et al., 1998; Mertens et al., 2006; Shura et
al., 2016). Though the ACT has been ranked one of the top 40 tests used by
neuropsychologists to measure attention (Rabin et al., 2005), a consistent relationship
between the ACT and other neuropsychological assessment measures, nor a clear
understanding of the construct the ACT is thought to measure, has emerged.
Throughout the ACT literature and norming samples, many different versions of
the ACT have been used, resulting in difficulty interpreting results across studies. One of
the most prevalent differences between these versions of the ACT is in the length of the
distractor task (e.g., counting backwards by threes) delay, with some versions using a
consistent distractor delay (i.e., 20-seconds for all trials; Mertens et al., 2006) and others
having a variable distractor delay (i.e., 3-, 9-, 18-seconds or 9-, 18-, 36-seconds; Boone et
al., 1998; Stuss et al., 1987; Stuss et al., 1988). In clinical practice, the 3-, 9-, 18-second
and the 9-, 18-, 36-second distractor delay versions are used; however, these distractor
delays are not specifically used in any particular age groups (e.g., youth, middle age,
3
older adult) or clinical populations; rather, use is dependent on the normative comparison
sample. In addition to the distractor delay time, some versions require participants to
write down the recalled trigrams (Mertens et al., 2006), while most others require the
participant to report trigrams verbally (Boone et al., 1998; Stuss et al., 1987; Stuss et al.,
1988). Finally, one study (Geurten et al., 2016) used a computerized version of the ACT
(see description below) and its comparability to either the verbal or written method is
unclear.
The most commonly used ACT in clinical practice is the Stuss and colleagues
(1987, 1988) version. Stuss and colleagues (1987) used three consonants (i.e., consonant
trigram) for the stimulus followed by the presentation of a 2- or 3-digit number.
Participants then immediately began counting backwards out loud by threes from the
number presented. After the distractor task (i.e., counting backwards by 3s from the
number presented) delay of either 9-, 18-, or 36-seconds, participants were asked to
verbally report the stimulus consonants remembered. Five trials of each distractor task
delay were administered in random order (i.e., 15 total trials). The score was derived
from the number of correct consonants reported by the participant. Stuss and colleagues
(1987) normed this ACT version on 60 Canadian individuals, ages 16 to 69, and provided
normative data based on either gender and education or age for each of the three
distractor delay times. In 1988, Stuss and colleagues extended their normative sample to
include 90 Canadian individuals. While, the clinical version of the Stuss and colleagues
(1987, 1988) ACT includes five 0-second trials (i.e., with no distractor task) administered
consecutively before the 9-, 18-, and 36-second distractor delay trials, these trials were

4
not added (i.e. to administration but not to scoring) until Stuss and colleagues (1989)
examined the ACT's utility in a sample of patients with traumatic brain injury (TBI).
Regarding the clinical utility of the ACT, previous studies have shown the ACT is
sensitive to numerous clinical neurological and psychological populations (Anile et al.,
2003; Oral et al., 2012; Stuss et al., 1989; Merkley et al., 2013; Shura et al., 2016; Dige &
Wik, 2005; Ozakbas et al., 2004), thus the ACT may aid in the detection or identification
of these groups in clinical neuropsychological evaluations. More specifically, Stuss and
colleagues (1989) found the ACT to be sensitive to cognitive dysfunction in recent mild
TBI and more severe TBI. Merkley and colleagues (2013) found, when comparing
patients with severe TBI to controls, that the ACT (i.e., Boone et al., 1998 version)
showed a moderate effect of the total score discriminating between the two groups'
performance. Alternatively, Shura and colleagues (2016) found no difference in ACT
total performance between remote (>11 months since injury) mild TBI and no history of
mTBI in a sample of veterans, in the context of adequate performance validity. With
regard to attention deficit hyperactivity disorder (ADHD), the ACT was found to
distinguish between individuals with adult ADHD and control subjects with moderate to
large effects (Dige & Wik, 2005). With regards to multiple sclerosis (MS), a study of
Turkish patients found significant differences between patients with relapsing-remitting
MS and secondary progressive MS, as well as between clinically isolated syndrome and
secondary progressive MS on ACT performance, but not between relapsing-remitting MS
and clinically isolated syndrome (Ozakbas et al., 2004). With regard to post-traumatic
stress disorder (PTSD), Shura and colleagues (2016) found no relationship between the

5
presence of PTSD in a sample of veterans and ACT total score performance. With
regards to major depressive disorder (MDD), both Oral et al. (2012) and Shura et al.
(2016) found significantly lower scores for participants with MDD than individuals
without MDD. In sum, the ACT total score may aid in differentiating numerous clinical
neurological and psychological populations; however, limited research has elucidated the
effectiveness of the ACT total score in differentiating clinical presentations from their
relevant differential diagnoses. Additionally, no previous studies have evaluated the
utility of the ACT perseveration score in clinical neurological and psychological
presentations.
Given that the ACT does not require a timed response and is sensitive to disorders
with white matter disturbance, some have suggested it may be a desirable measure of
executive functioning not confounded by declines in mental speed (Mitrushina et al.,
2005). For example, lower scores on other measures of executive function (e.g., Trail
Making Test Trial B and Stroop Color Interference) may easily be confounded by slowed
information processing speed making interpretation of executive functioning on these
tasks difficult (Mitrushina et al., 2005). In order to determine the utility of the ACT in the
context of clinical disorders with slowed processing speed, an understanding of the task’s
relationship to measures of executive functioning, general intellectual ability, and
psychomotor speed must first be established (Boone et al., 1998; Shura et al., 2006;
Mertens et al., 2006).
In the context of the reported popularity of the ACT in clinical practice (Rabin et
al., 2005), relatively few studies have assessed the psychometric properties and construct

6
validity of the ACT, with the result being an unclear consensus as to what cognitive
abilities the ACT measures. In the following paragraphs, studies completed in which the
construct validity of the ACT is assessed will be reviewed.
Two previous factor analytic studies have assessed the relationship of ACT
performance to test-takers' performance on other neuropsychological assessment
measures/cognitive domains; however, these factor structure results are only partially
congruent (see Table 1 for a review of previous studies including the ACT). First, Boone
and colleagues (1998) aimed to assess validated measures (i.e., Wisconsin Card Sorting
Test, WCST [Heaton, 1981]; Stroop Test [Comalli et al., 1962]; Verbal Fluency, FAS
version [Boone et al., 1998]; and ACT [Boone et al., 1998]) of frontal lobe function to
understand the specific functions assessed, the relationship between tests, and if the
measures were redundant in neuropsychological assessment batteries. The sample was
comprised of older adults from inpatient, outpatient, and control patients/non-patients
groups (Boone et al., 1998). The inpatient and outpatient groups were largely psychiatric
in presentation, with the top three diagnoses consisting of obsessive-compulsive disorder,
late-life psychosis, and major depression (Boone et al., 1998). The 3-, 9-, and 18-second
interference delay version of the ACT was used. Ultimately, a three-factor model was
proposed, including factors labeled “cognitive flexibility,” “speeded processing,” and
“basic/divided attention and short-term memory” (Boone et al., 1998, pg. 590). ACT
performance (i.e., total score, perseveration score, sequence score) loaded on the
"basic/divided attention and short-term memory" (Boone et al., 1998, pg. 590) factor,
which included verbal and performance intelligence quotients (IQ; i.e., Wechsler Adult
7
Intelligence Scale-Revised, WAIS-R, Verbal Intelligence Quotient, VIQ; WAIS-R
Performance Intelligence Quotient, PIQ; Adams et al., 1984), auditory and visual
working memory (i.e., WAIS-R Digit Span, Adams et al., 1984; Rey-Osterrieth Complex
Figure, Rey-O, percent retention), and processing speed (WAIS-R Digit Symbol; Adams
et al., 1984). Thus, providing convergent validity of the ACT as a measure of IQ,
working memory, and processing speed, though Boone and colleagues (1998) seemed to
deemphasize the ACT’s relationship to measures of IQ. This finding was not entirely
novel, as the ACT had been previously used clinically as a measure of short-term
memory and/or divided attention (Lezak, 1995). Of note, this assessment of the ACT was
the only one found which assessed additional scores on the ACT, namely the ACT
perseveration score; however, little emphasis was placed on interpreting these scores.
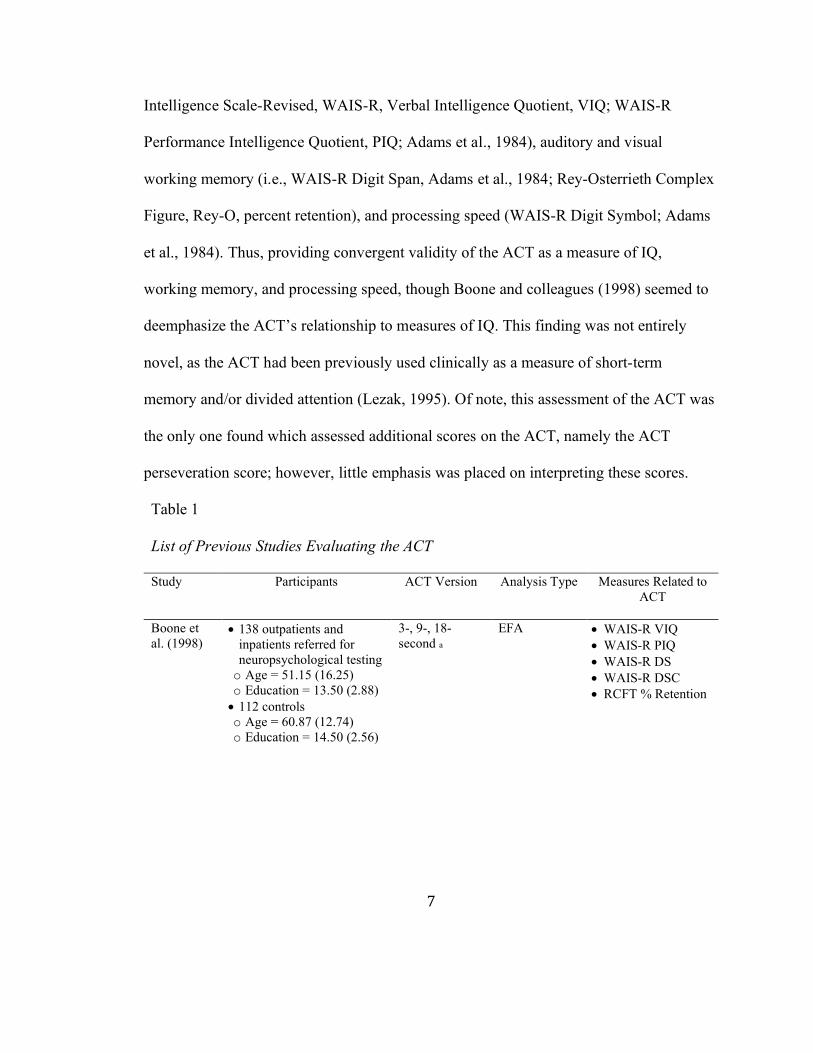
Table 1 List of Previous Studies Evaluating the ACT Study Participants ACT Version Analysis Type Measures Related to
ACT
Boone et al. (1998)
x 138 outpatients and inpatients referred for neuropsychological testing o Age = 51.15 (16.25) o Education = 13.50 (2.88) x 112 controls o Age = 60.87 (12.74) o Education = 14.50 (2.56)
3-, 9-, 18-second a
EFA x WAIS-R VIQ x WAIS-R PIQ x WAIS-R DS x WAIS-R DSC x RCFT % Retention

8
Mertens et al. (2006)
x Younger participants o Age = 20.83 (.27) o Education = 14.64 (0.16) x Older participants o Age = 70.14 (0.83) o Education = 15.55 (0.34) o MMSE = 28.66 (0.13) o All part of a study
evaluating the impact of glucose regulation on cognitive functions
"modified Brown-Peterson task" b
EFA x WAIS-III DS x WAIS-III LN x WAIS-III AR
Shura et al. (2016)
x Veterans o Age=35.54 (9.42) o Education=13.74 (1.97) o 85.3% male x Controls o Age=36.41 (10.33) o Education=13.81 (2.18) o 84.5% male
9-, 18-, 36-second c
hierarchical linear regression
x Education x WTAR x TMT A x WAIS-III LN x CPT-II COM
Geurten et al. (2016)
x French speaking x TBI o Age = 37.7 (12.89) o Education = 13.00 (2.26) x Controls o Age = 37.77 (12.86) o Education = 13.11 (2.98)
x Whole health o Age = 49.78 (19.94) o Education = 12.64 (3.51)
computerized Brown-Peterson test d
correlations x PASAT x Stroop In x WAIS-III DS x Stroop C x fNART
Aita et al. (2019)
x Healthy college students x Age=19.82 (1.45) x Education=12.98 (0.97)
3-, 9-, 18-second a
EFA x RSpan x OSpan
Notes. ACT = Auditory Consonant Trigrams test; MMSE = Mini–Mental State Examination; TBI = Traumatic Brain Injury; WAIS-R = Wechsler Adult Intelligence Scales - Revised; WAIS-III = Wechsler Adult Intelligence Scales - III; VIQ = Verbal Intelligence Quotient; PIQ = Performance Intelligence Quotient; DS = Digit Span; DSC = Digit-Symbol Coding; RCFT = Rey Complex Figure Test; % Retention = Percent Retention; LN = Letter-Number Sequencing; AR = Arithmetic; WTAR = Wechsler Test of Adult Reading; TMT A = Trail Making Test Part A; CPT-II = Conners' Continuous Performance Test-II; COM = Commission Errors; PASAT = Paced Auditory Serial Addition Task; In = Inhibition; C = Color-Naming; fNART = National Adult Reading Test; RSpan = Reading Span; OSpan = Operation Span aBoone et al. (1990), bMertens et al. (2006), cStuss et al. (1987) & Stuss et al. (1988), dGeurten et al. (2016)

9
With regards to divergent validity for the ACT, the other two factors contained 1)
a measure of abstract concept formation and set-shifting (i.e., Wisconsin Card Sorting
Test, WCST; Heaton, 1981) and 2) measures of executive functioning and processing
speed (i.e., Verbal Fluency, FAS; Stroop A, Stroop B, Stroop C, Comalli et al., 1962; and
WAIS-R Digit Symbol; Adams et al., 1984). Thus, the distinction between the “speeded
processing” and “basic/divided attention and short-term memory” (Boone et al., 1998, pg.
590) was somewhat unclear and seemed to represent some overlap in cognitive processes
(i.e., processing speed).
Given the persisting ambiguity of the ACT, a second factor analytic study was
completed by Mertens and colleagues (2006). An exploratory factor analysis (EFA) was
conducted to determine the neuropsychological measures related to the "modified Brown-
Peterson task" (MBPT, Mertens et al., 2006). Two samples were collected, 1) healthy
young adults and 2) older adults, and were both screened for health issues (i.e., diabetes,
hypoglycemia, chronic hepatitis, neurological problems, depression, and alcohol or drug
abuse). Four versions of the MBPT were used, each using different letters; however, all
consisted of three conditions (i.e., baseline, waiting without counting, interference),
though the order of conditions was varied between versions (Mertens et al., 2006). Unlike
other versions of the MBPT or ACT, (a) participants were asked to write down the
consonants remembered, instead of verbally reporting them, and (b) every trial of the
interference condition had a distractor task delay of 20-seconds (i.e., instead of
alternating delay time). All other aspects of the MBPT were consistent with Stuss and
colleagues’ (1987, 1988) previously described version. After completing a factor analysis
10
including neuropsychological assessment variables and the MBPT interference trial total
number of consonants recalled, the researchers found the MBPT loaded on a factor with
the working memory subtests from the Wechsler Adult Intelligence Scale - III (WAIS-III;
i.e., Digit Span Forwards and Backwards, Letter-Number Sequencing, and Arithmetic,
Wechsler, 1997) described as an "auditory/visual working memory and complex attention
factor" (Mertens et al., 2006, pg.736). These findings agreed in part with Boone and
colleagues’ findings (1998), in that both found measures of working memory to load on
the same factor as ACT performance; however, Mertens and colleagues (2006) did not
find a relationship between ACT performance, IQ, and processing speed. Of note,
Mertens and colleagues (2006) did not include IQ or Rey-O performance in their factor
analysis; however, Wechsler Memory Scale-III (WMS-III, Wechsler, 1997) Spatial Span
was included as a measure of visual working memory but was not shown to be related to
ACT performance. Additionally, a measure of processing speed (i.e., WAIS-III Digit
Symbol Coding, Wechsler, 1997) was included; however, loaded on a separate factor
from ACT performance in direct contrast to Boone and colleagues’ (1998) findings
(Mertens et al., 2006). In sum, Mertens and colleagues’ (2006) results suggested the ACT
was similar to other measures of working memory; however, they did not replicate Boone
and colleagues’ (1998) relationship between ACT, IQ, and processing speed.
As Boone and colleagues’ (1998) and Mertens and colleagues’ (2006) results
failed to provide a clear consensus regarding the cognitive processes measured by the
ACT, Shura and colleagues (2016) and Geurten and colleagues (2016) concurrently
aimed to provide a psychometric update for the ACT.
11
In Shura and colleagues’ (2016) study, a hierarchical regression analysis was
conducted, including measures of cognitive domains identified by Boone and colleagues
(1998) and Mertens and colleagues (2006) as related to ACT performance (i.e.,
processing speed, IQ, and executive functioning) and measures relating to attention and
verbal learning. Stuss and colleagues’ (1987, 1988) version of the ACT was used. Here,
ACT performance was predicted by education, premorbid intelligence (i.e., Wechsler
Test of Adult Reading, WTAR, a measure of reading ability for phonemically irregular
words; The Psychological Corporation, 2001), processing speed (Trail Making Test Part
A; Reitan & Wolfson, 1985), verbal working memory (WAIS-III Letter-Number
Sequencing, LNS; Wechsler, 1997a), and impulsivity (Conners' Continuous Performance
Test-II, CPT-II, Commission Errors; Conners & MHS Staff, 2004). Shura and colleagues
(2016) suggested these results did not provide convergent validity for the ACT as a
measure of executive functioning or working memory, as previously described (Boone et
al., 1998; Mertens et al., 2006), rather suggested the ACT may be more adequately
described as a measure of general intellectual ability and psychomotor speed.
In Geurten and colleagues’ (2016) study, a computerized version of the Brown-
Peterson test, unique to the study, was used. Participants were presented with three
letters, one at a time on the screen, and asked to read each letter aloud. Then, participants
were shown pairs of numbers, one pair per screen, which they were to repeat backwards
for delays of either 0-, 5-, 10-, or 20-seconds. After this interference delay, participants
were asked to enter the three letters in the correct order. While there are potentially
numerous benefits to a computerized version of the ACT (e.g., more accurate delay

12
intervals, more consistent administration), Geurten and colleagues (2016) did not
establish the relationship of this new computerized version to any of the non-
computerized versions. More specifically, it remains unclear the extent to which the
visual presentation of the consonant trigrams, the difference in distractor tasks, and the
impact of requesting participants to enter responses in the correct order have on the
equivalency of the computerized to non-computerized version. Convergent validity
measures indicated relationships (i.e., significant correlations) between the Brown-
Peterson test and measures of attention (i.e., a computer version of the Paced Auditory
Serial Addition Task, PASAT; Gronwall, 1977) and executive functioning/working
memory (i.e., Stroop Interference score; Regard, 1981; WAIS-III forward and backward
Digit Span; Wechsler, 1997) while controlling for age and education (Geurten et al.,
2016). Measures used for divergent validity indicated relationships between the Brown-
Peterson test and measures of processing speed (i.e., Stroop Color-Naming; Regard,
1981) and vocabulary (i.e., National Adult Reading Test, fNART; Geurten et al., 2016).
In sum, numerous domains of cognitive function have been related, rationally or
empirically, to ACT performance with no consistent relationship established. These
domains have included intelligence/word reading ability, executive functioning, working
memory, attention, and processing speed (Boone et al., 1998; Mertens et al., 2006; Shura
et al., 2016; Geurten et al., 2016). The following section offers a brief review of the
aforementioned domains of cognitive function, with the goal of providing the reader with
a general understanding of the concepts/abilities conceptualized within these domains.
The discussion here is minimally descriptive, rather than exhaustive.
13
Intelligence
Intelligence is a complex construct used to describe mental processes underlying
adaptive behavior (Goleman, 1995; Greenspan & Driscoll, 1997), complex problem-
solving (Sternberg, 1997), and/or stable traits or trait-like competencies predictive of
performance on specified tasks (Sternberg, 1997; Gardner, 1983; Horn & Noll, 1998).
Wechsler (1944) specifically defined intelligence as the “capacity of the individual to act
purposefully, to think rationally, and to deal effectively with his environment” (pg. 3).
Wechsler (1944) did not limit his definition to solely cognitive descriptors, as intelligence
is also comprised and impacted by characteristics such as goal awareness, enthusiasm,
persistence, etc., which are not routinely assessed in cognitive tasks (Wechsler, 1975).
Three general theoretical perspectives of intelligence are identified by McGrew
and Flanagon (1998): the psychometric or structural theories, information processing
theories, and the cognitive modifiability theories. The information processing and
cognitive modifiability theories are often used to explain performance on a cognitive task
by identifying ability areas represented by test performance (McGrew & Flanagon,
1998).
Alternatively, the psychometric or structural approach identifies stable
population-level traits or competencies based on individual differences in cognitive test
performance (McGrew & Flanagan, 1998). Correlational methods (i.e., factor analysis)
identify latent ability domains within and across psychological tests. Individual
differences can be detected and test-takers placed at different points along one or more
dimensions based on their test performance relative to the population. The psychometric

14
approach emphasizes the structure of latent abilities and classification of individual test-
takers over explanation of cognitive performance. Intelligence models based on this
approach have the longest history of empirical support and have become popular
measures of intelligence in clinical practice settings (McGrew & Flanagan, 1998).
While numerous psychometric theories of intelligence have been assessed
historically, one of the most widely accepted is Carroll’s (1993) hierarchical model of
intelligence, which expanded the Horn-Cattell Gf-Gc model through factor analytic
research. Carroll’s (1993) model included three levels: stratum III (g), stratum II (broad
abilities), and stratum I (narrow abilities). In this model, g is the all-encompassing
cognitive ability, broad abilities represent different intellectual domains within g, and
narrow abilities represent specialized intellectual abilities within each broad domain
(Carroll, 1993). Stratum II contained intelligences familiar to most psychologists, e.g.,
“Gv”, representing visual-spatial ability, “Gs” representing speed and efficiency of
simple information processing, etc. Stratum I contained specific cognitive processes
deemed relevant to the superordinate Stratum II broad abilities; e.g., inductive and
deductive reasoning skills for the domain of Fluid Reasoning (Gf).
As conceptualized by Carroll (1993) within this framework, the rest of the
cognitive domains to be discussed would fall within stratum II or stratum I abilities and
theoretically should load on the overarching cognitive ability, g, or in the context of
neuropsychological assessment measures of IQ.

15
Executive Functioning
The concept of executive function (EF) is highly diverse and is defined more
broadly depending on the context. In the clinical literature, EF is defined more broadly as
a system of supervisory capacities of overall brain processing and is comprised of
abilities needed for purposeful or goal-directed behavior (Lezak, 2004; Strauss et al.,
2006). As such, EF abilities are more frequently used in novel or unfamiliar contexts,
rather than during routine or well-learned problem-solving, as the individual needs to
develop new effective strategies (Shallice, 1990). EF deficits may appear in assessment
performance as poor initiation, poor planning/organization, poor inhibition, inability to
shift, poor working memory, inflexibility, perseveration, difficulty generating or using
strategies, difficulty correcting mistakes, difficulty using feedback, and overall
carelessness (Strauss et al., 2006). Given the broad nature of EF in this context, many
confounds have presented themselves, specifically, that by definition EF tasks or
functions must use other lower-level cognitive processes (Miyake et al., 2000; Strauss et
al., 2006). In addition, numerous studies assessing tasks of frontal lobe function (Boone
et al., 1998) and planning/problem solving (Kafer & Hunter, 1997) have resulted in factor
structures or models in which multiple, and sometimes seemingly divergent, constructs
appear as related to EF. Thus, the construct validity of executive tests is often not well
established (Strauss et al., 2006).
As a result of the ambiguity of EF in the clinical literature, experimental models
of EF have frequently aimed to identify simpler, more discrete, functional components of
EF. While there are numerous models of EF in the literature, a commonly accepted model
16
proposes three underlying abilities: shifting, updating, and inhibition (Miyake et al.,
2000). The shifting function relates to one's ability to shift between multiple tasks or
mental sets (Miyake et al., 2000). Tests of shifting require participants to switch back and
forth between tasks, such as the Trail Making Part B test and the Wisconsin Card Sorting
Test. The updating function relates to one's ability to update and monitor working
memory representations and is almost synonymous with the term working memory
(Miyake et al., 2000; Miyake & Shah, 1999). This function requires one to monitor and
code new information while revising the information contained in one's working memory
by replacing information no longer relevant with more relevant information (Miyake et
al., 2000). Tests of updating require participants to actively manipulate information held
in working memory, such as WAIS-IV Digit Span Backwards and Letter-Number
Sequencing. The inhibition function relates to one's ability to intentionally inhibit more
automatic or dominant responses when necessary (Miyake et al., 2000). Tests of
inhibition require participants to deliberately stop a more automatic response, in order to
provide the requested response, such as the Color Word trial of the Stroop task. While
these three components are most commonly accepted as central tenants of EF, it should
be noted they are not comprehensive and other more complex aspects of EF are still
largely unresolved in both the clinical and experimental literature.
Working Memory/Updating
Of specific interest to the current study is working memory (WM) or updating
(Miyake et al., 2000; Miyake & Shah, 1999), as the ACT was originally developed to
assess memory encoding (Brown, 1958) and given the historical categorization of the

17
ACT as a measure of WM by most neuropsychological texts (Strauss et al., 2006; Lezak,
et al., 2012). WM may be classified both in the context of EF (Lezak et al., 2012) and in
memory (Strauss et al., 2006).
WM is the most current in a series of terms, replacing older terms like short-term
and immediate memory, and is generally accepted as a limited-capacity store for
information over a short period of time (i.e., seconds to minutes) in which one can also
perform complex cognitive operations on said information (Strauss et al., 2006; Lezak et
al., 2012). The information assessed in WM may come from new sensory inputs or
retrieved from long-term memory (Strauss et al., 2006). While numerous models of WM
exist, one of the most prominent is from Baddeley and Hitch (1974). In this model of
WM, the central executive, a supervisory controlling system, is assisted by the
phonological loop and the visuospatial sketchpad (Baddeley & Hitch, 1974). The
phonological loop is used to temporarily store and process verbal material, while the
visuospatial sketchpad is used to temporarily store and process visual material (Baddeley
& Hitch, 1974). In addition, Baddeley (2003) added an additional component to this
model, the episodic buffer, which is described as a limited-capacity store of information
that binds/integrates information. The central executive is in control of these subordinate
systems (i.e., phonological loop, visuospatial sketchpad, and episodic buffer) and
determines how the information they contain and process will be used (Straus et al.,
2006). In this model, working memory is conceptualized as an attentional control system
that is responsible for strategy selection and coordination of cognitive processes to enable

18
completion of cognitively complex activities, such as learning, comprehending, and
reasoning (Strauss et al., 2006).
As such, WM refers to the use of both executive control and memory to complete
an activity or task (Vandierendonck, 2016). More specifically, WM is the ability to
sustain memory representations, while at the same time processing alternative
information, distractions, and/or shifts in attention (Conway et al., 2002; Engle et al.,
1999; Vandierendonck, 2016). WM is a heterogeneous construct, which includes, but is
not limited to, tasks involving language, mental arithmetic, reasoning, attentional control,
etc. (Vandierendonck, 2016).
Perseveration
Perseveration is another central concept to the current study, given the proposed
evaluation of the perseveration score on the ACT (see below in methods section).
Perseveration is the impaired ability to shift responses, typically presented as repetition of
the same activity and/or response (Lezak, 2012). Perseveration errors can present in a
variety of ways, including verbal, motor, visual, etc. The construct is often
conceptualized as a central disruption within the shifting function; however, Miyake and
colleagues (2000) conceptualized shifting through only Wisconsin Card Sorting Test
(WCST) scores (Lezak, 2012). However, perseverative responses present in many
additional ways throughout a neuropsychological testing battery (i.e., word repetitions in
word fluency, inability to discontinue motor responses or patterns, providing similar or
the same responses to subsequent items on a variety of tests), thus it is unclear if these
different presentations of preservation form a unitary empirical construct. While

19
numerous neuropsychological assessments are used to identify different types (i.e.,
verbal, motor, visual, etc.) of perseveration, many do not provide normative data for
which to compare these responses, rather are qualitatively evaluated as positive or
negative for perseveration (Lezak, 2012; Strauss et al., 2006). The lack of assessment
measures in different response types (i.e., verbal, motor, visual, etc.) with quantitative or
normative scoring of perseveration presents difficulty in the evaluation of perseveration
across the neuropsychological assessment battery, thus the development of scoring
methods of perseveration across the battery will aid in both the empirical and clinical
understanding of perseveration.
Attention
Attention is a multifaceted term comprising multiple basic processes, including
sensory selection, response selection, attentional capacity, and sustained performance
(Cohen, 1993; Strauss et al., 2006). Overall, attention is conceptualized as a system of
interacting processes that allow individuals to identify relevant and irrelevant
information, hold and modify mental representations, and monitor responses to
information (Straus et al., 2006). The construct of attention is most commonly divided
into component processes (i.e., alertness/arousal, focused attention, selective attention,
divided attention, and sustained attention/vigilance; Strauss et al., 2006); however, there
is variability in the exact definition of each of these processes and some tend to represent
overlapping processes (i.e., focused attention and selective attention). It is important to
note that tests of attention often measure more than one type of attention and other motor
and cognitive aspects as well (i.e., motor speed, information processing speed, verbal
20
responding, etc.; Strauss et al., 2006). The construct of attention shares overlap with other
domains of cognitive functioning, namely EF and WM. More specifically, many tests of
attention, especially divided attention tests, require individuals to use inhibition,
switching, and WM (i.e., aspects contained in models of executive functioning; Strauss et
al., 2006). Thus, the distinction between tests of attention (i.e., EF and WM) is somewhat
arbitrary and often defined based on the extent to which these processes are required to
complete a task and/or the relative difficulty of the task. Although arguably loosely
defined, tests of attention are often very sensitive measures and crucial to the diagnosis of
many neurological disorders, as many of these patients initially present with attentional
disorders (Strauss et al., 2006).
Processing Speed
Processing speed (PS) is a term, one of many, used to describe the speed at which
individuals can execute cognitive processes (Kail, 1986; Kail, 2000). PS has been shown
to be related to mental capacity (Kail & Salthouse, 1994), reading performance (Kail &
Hall, 1994), reasoning, and WM (Fry & Hale, 1996; Kail, 2000). Concepts relating to
speed factors more broadly have been included in numerous theories of intelligence, such
as Carroll's (1993) three-stratum theory and Horn and Noll's (1998) theory of fluid (Gf)
and crystallized (Gc) intelligence. PS has also been identified as an important domain of
cognitive functioning through factor analytic analyses (Carroll, 1993; Horn & Noll,
1998). Though, a clear structure of PS has largely been unresolved, as much of the
research on PS has focused on its relationship with age-related changes (Danthiir et al.,
2005). Danthiir and colleagues (2005) completed a study to assess if PS is a unitary or

21
multidimensional concept. Results revealed a general mental speed factor that loaded four
subfactors (i.e., Switching, Odd-Mann-Out, Substitution, and Hick task); however,
Danthiir and colleagues (2005) acknowledged the variance associated with each subfactor
is limited in interpretability. Thus, while PS seems to be related to a wide array of
cognitive processes and potentially overall cognitive functioning, the lack of consistency
in the measurement of PS throughout the experimental and clinical psychology literature
may be impeding a more comprehensive understanding of this domain of cognitive
functioning.
Present Study
With regards to the current study, there are three main goals: 1) explore the
construct validity of the ACT by consolidating previous findings, 2) identify the
relationship of the ACT perseveration score to other measures of cognitive functioning,
and 3) add to the literature on the discriminant ability of the ACT total and perseveration
scores within a clinical/neurological population referred for neuropsychological
assessment.
With regards to construct validity, previous research has suggested the ACT
shares relationships with a variety of cognitive domains and premorbid abilities,
including: education, IQ, premorbid IQ, EF, WM, Attention, and PS (Boone et al., 1998;
Mertens et al., 2006; Shura et al., 2016; Geurten et al., 2016). In sum, these previous
findings have not resulted in a consistent relationship between the ACT and other
neuropsychological assessment measures/constructs, resulting in ambiguity regarding the
ACT's utility in clinical practice. Although the ACT is seemingly most consistent (i.e.,
22
face validity) with tasks of EF function, specifically WM/updating, previous research has
not consistently identified and has even challenged the ACT’s relationship to WM
(Boone et al., 1998; Mertens et al., 2006; Shura et al., 2016; Geurten et al., 2016). The
current study aims to add to the construct validity of the ACT by conducting an EFA in a
diverse clinical/neurological sample and including neuropsychological measures of IQ,
EF, PS, and attention, as well as, education. Based upon previous factor analytic research,
it is hypothesized the ACT will load on the same factor with measures of intelligence,
processing speed, and executive functioning (i.e., specifically measures of working
memory) within the current study (Boone et al., 1998; Mertens et al., 2006).
The evaluation of the relationship between the ACT perseveration score to the
ACT total score and other neuropsychological measures has been especially limited in
scope (Boone et al., 1998). As such, the current study will include the ACT perseveration
score and total score in an EFA, to identify the ACT perseveration score’s relationship to
other neuropsychological measures and relevant latent variables. Based on Boone et al.'s
(1998) finding, it is hypothesized that the ACT perseveration score will load on the same
factor as the ACT total score.
Finally, the assessment of the ACT total score, and, certainly, the ACT
perseveration score, in a largely neurological sample, has been limited, with previous
studies having limited numbers and/or clinical presentations. Though the ACT’s
construct validity is suboptimal, the ACT has been shown to have promising discriminant
ability between clinical populations of interest (Anile et al., 2003; Oral et al., 2012; Stuss
et al., 1989; Merkley et al., 2013; Shura et al., 2016; Dige & Wik, 2005; Ozakbas et al.,
23
2004). No previous study has assessed the clinical utility of the ACT perseveration score
in discriminating clinical presentations. Through criterion-related validity analyses, the
current study aims to assess the clinical utility of the ACT perseveration score and further
assess the clinical utility of the ACT total score in discriminating clinical groups within a
diverse clinical/neurological sample of patients referred for neuropsychological
evaluation.
CHAPTER II
METHOD
Participants
A total of 448 patients’ neuropsychological assessment data, clinical diagnoses,
and demographic information were collected from Sanford Health Neuropsychology
department, Fargo, ND, for the current study. These patients were a clinically referred
group with comprehensive neuropsychological evaluations. Patients' data were obtained
by chart review of patient files and electronic medical record systems. To meet inclusion
criteria for the current study, (1) patients must have previously undergone a
neuropsychological evaluation at Sanford Health Neuropsychology department between
January 1, 2012, and April 13, 2018, (2) have completed the ACT during their
neuropsychological assessment, and (3) were 18 to 90 years of age at the time of
assessment. After a review of patient records at Sanford Health Neuropsychology, 448
patients were identified who met the current study inclusion criteria.
The majority of patients were white (92.2%), right hand dominant (90.4%), and
female (56.7%). The mean patient age was 45.5 (range = 18 – 78, SD = 14.6) and the

24
mean highest achieved education was 13.5 years (range = 6 – 20, SD = 2.3) with 10%
achieving below a high school education, 36.6% earning a high school diploma, 27.6%
attending college without a degree or earning an associate’s degree, 19.4% earning a
bachelor’s (4-year) degree, and 6.2% attending post-graduate education and/or earning a
master’s or doctoral degree. A total of 20 primary diagnostic groups were identified
within the sample. Of those, the 5 largest clinical presentations (in order from highest to
lowest) were a primary psychiatric diagnosis, multiple sclerosis (MS), moderate to severe
TBI, cognitive disorder not otherwise specified (NOS) and mild TBI (i.e., concussion).
See Table 2 for more detailed demographic information. The groups represented a highly
diverse clinical population with numerous comorbidities, see Table 3 for the most
common comorbidities within each clinical group.
Table 2 Patient Demographics Variable
Sex Female Male
56.7 a
43.3 b
Race (%) White Native American or Alaskan Native Black or African American Hispanic or Latino Asian Native Hawaiian or other Pacific Islander
92.2 3.8
2.2 c
1.4 0.2 d
0.2
Age (Mean; SD) 45.5 (14.6)
Education (Mean; SD) 13.5 (2.3)
Handedness (%) Right hand dominant
90.4

25
Left hand dominant Unknown
9.4 0.2
Primary Clinical Diagnosis (%; number of cases)e
MS f Seizure Disorder Autism Spectrum Disorder Attention Disorder Psychiatric diagnosis moderate to severe TBI g TIA and Cerebrovascular Disease No diagnosis Cognitive Disorder NOS mild TBI g Renal Failure Mild Cognitive Impairment Anoxic Brain Injury and Encephalopathy Cerebrovascular Accident and Aneurysm Major Neurocognitive Impairment h Parkinson’s Disease Central Nervous System Tumor Neurodevelopmental Disorder, Intellectual Disability, Fetal Alcohol Syndrome Substance Induced Cognitive Disorder Specific Learning Disorder
19.4 (87) 2.2 (10) 1.8 (8) 4.7 (21) 20.1 (90) 13.6 (61) 3.1 (14) 0.7 (3) 8.5 (38) 6.9 (31) 3.1 (14) 1.1 (5) 1.8 (8) 6.5 (29) 2.0 (9) 0.7 (3) 0.4 (2) 1.6 (7) 0.9 (4) 0.9 (4)
Notes. a The female group contained one female-to-male transgender individual. b The male group contained two male-to-female transgender individuals. c The African American group contained one biracial African American and White individual. d The Asian group contained one biracial Asian and White individual. e Primary clinical diagnoses were identified from the neuropsychologists’ primary diagnostic classification. f multiple sclerosis. g TBI = traumatic brain injury, h dementia

26
Table 3 Common Comorbidities within Clinical Groups
Clinical Group 1st Comorbidity (%)
2nd Comorbidity (%)
3rd Comorbidity (%)
MS
Mood Disorder (54.0)
Anxiety Disorder (26.4)
Sleep Diagnosis (10.3)
Seizure Disorder Mood Disorder
(90.0)
Anxiety Disorder (60.0)
Sleep Diagnosis (30.0)
Autism Spectrum Disorder
Mood Disorder (50.0)
Anxiety Disorder (37.5)
Learning difficulty (25.0)
Attention Disorder
Anxiety Disorder (71.4)
Mood Disorder (47.6)
Learning difficulty (14.3)
Psychiatric Diagnosis a
Chronic pain (16.7) Headaches/Migraines (11.1)
Self-reported history of head trauma (11.1)
moderate to severe TBI
Mood Disorder (44.3)
Anxiety Disorder (14.8)
Sleep Diagnosis (11.5)
TIA and Cerebrovascular Disease
Mood Disorder (71.4)
Anxiety Disorder (64.3)
Sleep Diagnosis (57.1)
No Diagnosis
Self-reported history of head trauma (33.3)
Cognitive Disorder NOS
Mood Disorder (50.0)
Sleep Diagnosis (36.84)
Chronic Pain (26.3)
mild TBI b
Mood Disorder (71.0)
Headaches/Migraines (58.1)
Anxiety Disorder (48.39)
Renal Failure
Learning difficulty (35.7)
Mood Disorder (28.6)
Anxiety Disorder (21.4)
Mild Cognitive Impairment
Mood Disorder (60.0)
Kidney Disease (20.0)
Structural Changes on Imaging (20.0)
Anoxic Brain Injury and Encephalopathy
Mood Disorder (37.5)
Seizure Disorder (12.5)
Trauma Disorder (12.5)
Cerebrovascular Accident and Aneurysm
Mood Disorder (48.3)
Sleep Diagnosis (24.1)
Headaches/Migraines (20.7)

27
Major Neurocognitive Impairment c
Mood Disorder (55.56)
Sleep Diagnosis (22.2)
Diabetes Mellitus (11.1)
Parkinson’s Disease
Anxiety Disorder (33.3)
Central Nervous System Tumor
Visual Deficit (50.0)
Neurodevelopmental Disorder, Intellectual Disability, Fetal Alcohol Syndrome
Attention Disorder (57.1)
Mood Disorder (57.1)
Anxiety Disorder (14.3)
Substance Induced Cognitive Disorder
Mood Disorder (50.0)
Anxiety Disorder (25.0)
Sleep Diagnosis (25.0)
Specific Learning Disorder
Anxiety Disorder (100.0)
Mood Disorder (75.0)
Attention Disorder (75.0)
Notes. a Comorbidities are the 3rd, 4th, and 5th most common disorders after mood disorder and anxiety disorder., b i.e., concussion, c i.e., dementia
Materials
Demographics
Information from patients' records were collected regarding their age, sex,
ethnicity, and education level at the time of their neuropsychological evaluation. The
patients' cognitive and/or physical diagnosis(es) associated with their neuropsychological
assessment were collected.
Neuropsychological Assessment Measures
Neuropsychological assessment measures were collected from a standard battery
that was completed as part of referral-based clinical care. Neuropsychological evaluations
in this clinical setting include various measures administered by trained technicians using
standard procedures for each test. Neuropsychological testing is generally completed in
one or two sessions. Neuropsychological test measures included in these batteries are

28
largely similar, with only minimal deviation. Additional measures may have been
included at the discretion of the neuropsychologist and relate to the patient's need and
medical necessity. See Table 4 for a list of the selected tests by domain.
Table 4 List of Tests by Domain
Domain 1 Measure
Executive Functioning ACT T ACT P IVA + Auditory Prudence WAIS-IV LN WAIS-IV AR WAIS-IV DS CVLT-II 1 CVLT-II 1-5 RCFT % Retention STROOP In WCST PE COWAT
Processing Speed WAIS-IV CD WAIS-IV SS STROOP C STROOP W
Attention IVA + Auditory Vigilance TMT A TMT B VSAT Time
IQ WAIS-IV FSIQ WRAT4 WR
Notes. Bold items were included in final analyses, alternatively non bolded items were planned but ultimately not included due to missing data or influence on factor structure. ACT T = Auditory Consonant Trigrams Total score; ACT P = Auditory Consonant Trigrams Perseveration score; IVA + = Integrated Visual and Auditory Continuous Performance Test; WAIS-IV = Wechsler Adult Intelligence Scales - IV; LNS = Letter-Number Sequencing; AR = Arithmetic; DS = Digit Span; CVLT-II = California Verbal Learning Test -II; 1 = Trial 1; 1-5 = Trials 1-5; RCFT = Rey Complex Figure Test; % Retention = Percent Retention; WCST = Wisconsin Card Sorting Test; PE = Perseverative Errors; COWAT = Controlled Oral Word Association test; CD = Coding; SS = Symbol

29
Search; In = Interference; C = Color-naming; W = Word-reading; TMT A = Trail Making Test Part A; TMT B = Trail Making Test Part B; VSAT = Verbal Series Attention Test; FSIQ = Full Scale Intelligence Quotient; WRAT4 = Wide Range Achievement Test: Fourth Edition; WR = Word Reading 1 Based on domains as described in Strauss et al. (2006), with the exception of measures of working memory which were conceptualized as measures of Executive Functioning (see discussion in-text), and test sources.
Measures of Executive Functioning (EF).
Auditory Consonant Trigrams Test (ACT). The ACT used in the current study is
a variation of the Brown-Peterson test (Brown, 1958; Peterson & Peterson, 1959)
developed by Stuss and colleagues (1987, 1988). During the first five trials, test-takers
are verbally presented with a consonant trigram (e.g., L-B-D), one letter per second, and
asked to immediately recall the consonant trigram, with no delay. These initial trials act
as a practice for the delay trials. Then, test takers are presented with a consonant trigram,
one letter per second, immediately followed by a two- or three-digit number. The test-
taker must immediately begin counting backwards out loud by threes from the number
presented (e.g., 98-95-92...). After a delay of 9, 18, or 36 seconds, the test-taker is asked
to recall the consonant trigram they were presented with prior to the delay. The delays are
varied in order throughout the test until five trials for each delay time are administered.
The total number of correct letters recalled are scored for each delay interval (i.e., 0, 9,
18, and 36 seconds) and a total sum of all correct letters recalled were used as the ACT
total score (ACT T). Additionally, as outlined by Boone and colleagues (1990), a total
perseveration score (ACT P) will be calculated by summing the number of perseverations
on all 20 trials of the ACT task (i.e., including the 0-second delay trials). Perseveration
will be defined as "the reporting of an incorrect letter which was used as an answer on the

30
preceding trial, (Boone et al., 1990)" with a total of 57 perseverations possible on the
Stuss et al. (1987, 1988, 1989) version of the ACT.
Weschler Adult Intelligence Scale, Fourth Edition (WAIS-IV) Digit Span
Forwards and Backwards (WAIS-IV DSF & WAIS-IV DSB). In the WAIS-IV DSF,
participants are verbally administered sequences of 2 to 9 numbers, in ascending trials
(two trials of each number sequence, i.e., two trials of a sequence of 2 numbers, two trials
of a sequence of 3 numbers...two trials of a sequence of 9 numbers), at a rate of one
number per second (Wechsler, 2008). Participants are subsequently asked to repeat the
stimulus numbers aloud as they heard them, in the same order (Wechsler, 2008). Thus, if
a patient was administered a trial consisting of the stimulus 3-5-2, the correct response of
the patient would be 3-5-2. Each trial is scored as correct (if all the numbers are reported
in the same order as the stimulus) or incorrect (if all the numbers are not reported in the
same order as the stimulus) and the task ending when both trials of an item are incorrect
or all trials are administered (Wechsler, 2008). The total score is the sum of the number
of correct trials throughout the test.
In the WAIS-IV DSB test, participants are verbally administered sequences of 2
to 8 numbers, in ascending trials (two trials of each number sequence, i.e., two trials of a
sequence of 2 numbers, two trials of a sequence of 3 numbers...two trials of a sequence of
8 numbers), at a rate of one number per second (Wechsler, 2008). Participants are
subsequently asked to repeat the stimulus numbers aloud backwards (Wechsler, 2008).
Thus, if a patient was administered a trial consisting of the stimulus 3-5-2, the correct
response of the patient would be 2-5-3. Each trial is scored as correct (if all the numbers

31
are reported in the backwards order) or incorrect (if all the numbers are not reported in
the backwards order) and the task is ended when both trials of an item are incorrect or
when all trials are administered (Wechsler, 2008). The total score is the sum of the
number of correct trials throughout the test.
Integrated Visual and Auditory Continuous Performance Test (IVA + )
Auditory Prudence. The IVA + is an auditory and visual continuous performance test,
measuring sustained attention and response inhibition (Sandford & Turner, 2004a, 2004b;
Strauss et al., 2006). The test includes four sections: “warm-up” (i.e., two one-minute
tests consisting of simple visual and auditory reaction time tests for baseline reaction
time), a 1.5-minute practice session, the main test which consists of five sections of 100
visual and 100 auditory trials, and a “cool-down” (the same as the practice session;
Strauss et al., 2006). While numerous scores can be derived from the IVA +
administration, of specific interest is the Auditory Prudence IVA + scaled score, which is
reported to measure impulsivity/response inhibition by scoring commission errors
throughout the test administration (Sandford & Turner, 2004a, 2004b; Strauss et al.,
2006).
WAIS-IV Letter Number Sequencing (WAIS-IV LN). In the WAIS-IV LN,
patients are read a sequence of numbers and letters, then asked to recall the numbers in
ascending order and the letters in alphabetical order (Wechsler, 2008). Each trial is
scored as correct (all the stimulus numbers reported in correct ascending order and all the
stimulus letters reported in correct alphabetical order) or incorrect (any other response;
Wechsler, 2008). The test consists of 10 items with 3 trials each (i.e., a total of up to 30

32
trials) and patients are administered trials until they incorrectly answer all 3 trials of a test
item (Wechsler, 2008). The sum of correct trials is used to calculate a scaled score.
WAIS-IV Arithmetic (WAIS-IV AR). In the WAIS-IV AR, patients are verbally
administered up to 22 arithmetic problems and are asked to mentally solve each problem
(Wechsler, 2008). Each response is scored as correct (correct answer provided within <31
seconds) or incorrect (any incorrect answer and correct answers provided after 30
seconds), then the sum of correct responses is used to calculate the scaled score
(Wechsler, 2008).
California Verbal Learning Test-II Trial 1 and Trials 1-5 scores (CVLT-II 1 &
1-5). In the CVLT-II, patients are verbally presented with a 16-word list and asked to
report all the words remembered from the presented list (Delis et al., 2000; Strauss et al.,
2006). The patient is presented with the same word list, in the same order, for 5 trials.
Next, the patient is presented with a second 16-word list, an interference list, and asked to
report all the words remembered from this second list of words. Next, the participant is
asked to report all the words remembered from the first list, the list presented 5-times, not
the second list. Then, the patient is presented with four categories (i.e., the four categories
of words presented in the first list: furniture, vegetables, ways of traveling, and animals)
and asked to report all the words from the first list remembered from each category. After
a 20-minute delay, the patient is asked to recall all the words remembered from the first
list and then subsequently is asked to report all the words remembered from the first list
from the presented categories again. Then, words are presented one at a time (i.e., words
from the first list, words from the second list, and words not in either list) and the patient
33
is asked to respond “yes” if the word was from the first list or “no” if the word was not
from the first list. After a 10-minute delay, the patient is presented with two words at a
time (i.e., one word from the first list and a second word they have not heard before) and
asked to report which word was from the first list. Numerous scores are derived from this
verbal list-learning task; however, for the purpose of the current study, the Trial 1 and
Trials 1-5 scores are of interest. The Trial 1 score is the total of correctly reported words
from the first list after its first presentation to the patient (Delis et al., 2000). The Trial 1-
5 score is the sum of the correctly reported words from the first list from each of the five
learning trials (Delis et al., 2000).
Rey Complex Figure Test (RCFT) Percent Retention (% Retention). In the
RCFT, patients are asked to copy a complex geometric figure (copy trial; Meyers &
Meyers, 1995). After a 3-minute delay, the patient is asked to draw the same complex
figure from memory (immediate recall trial). After a 30-minute delay (from the end time
of the copy trial), the patient is asked to draw the complex figure again from memory
(delayed recall trial). Then, the patient is presented with 24-designs and asked to select
each of the designs they believe were part of the complex geometric figure they copied
before (recognition trial). Each RCFT figure drawn was scored in accordance with the
Meyers and Meyers (1995) scoring criteria. While numerous scores can be generated
from the RCFT, the percent retention score is of interest in the present study. Given the
percent retention score was not calculated for clinical use, the score will be calculated by
dividing the immediate recall trial total score (ranging from 0-36) by the copy trial total
score (ranging from 0-36), then multiplying by 100.

34
Stroop Test Interference Score (Stroop In). In the Stroop Test (i.e., Golden
Version; Golden & Freshwater, 2002), patients are first asked to read words (i.e., red,
blue, and green) that are printed on the page (Word-Reading trial). In the next trial
(Color-Naming trial), patients are asked to name the color (i.e., red, blue, and green) of
the ink the XXXX are printed in on a second page. In the last trial (Color-Word
Interference trial), patients are asked to name the color ink (i.e., red, blue, and green) the
words (i.e., red, blue, and green) are printed in on a third page. On all trials, the patient is
told if they make an error and are directed back to the incorrectly answered item and
asked to correct the mistake, then continue the trial. Each trial is administered for 45-
seconds and the score for each trial is the number of the last correctly answered item.
While there are numerous scores calculated on this test, the interference score is a
calculated score (i.e., color-word interference trial score minus a predicted color-word
score based on age and education level of the participant) of interest in the current study
(Golden & Freshwater, 2002).
Wisconsin Card Sorting Test Perseverative Errors score (WCST PE). During the
WCST (Heaton et al., 1993; Kongs et al., 2000), participants are tasked with matching
response cards, one at a time, to one of 4 stimulus cards. Participants are told if a
response card match is correct or incorrect based on rules known to the administrator but
not the participant (i.e., matching based upon color, form, or number of figures). Patients
are administered consecutive trials until all the cards are used (either 64- or 128-cards
depending on the version) or all rules are solved by the patient. While there are a number
of different scores within this test, of concern to the present study is the perseveration

35
errors (WCST PE) score. The perseveration errors score is a multifaceted faceted score,
summing numerous types of perseveration errors patients can make while matching cards
(Heaton et al., 1993). In general, a perseveration error on the WCST is when a patient
continues to respond to a stimulus characteristic (i.e., color, form, or number) which is
incorrect for the current rule (Strauss et al., 2006). All perseverations on the WCST were
scored according to the Heaton and colleagues (1993) scoring guidelines.
Controlled Oral Word Association Test (COWAT). In the COWAT, patients are
verbally presented with a letter and asked to verbally produce as many words as possible
that begin with the administered letter, until they are told to stop (i.e., after 60-seconds;
Heaton et al., 2004). The patients are told that they cannot use proper nouns (i.e., names
of people or places) or use the same word again with a different ending (i.e., eat, eats,
eating). The patients complete three trials (i.e., letters administered are F, A, and S). The
COWAT score is the total number of words (minus repetitions, proper nouns, and items
with only a different ending than another item) the patient generates over the three trials
(Heaton et al., 2004).
Measures of Processing Speed (PS).
WAIS-IV Coding (WAIS-IV CD). In the WAIS-IV CD subtest, patients are
required to transcribe, using a key, the symbol associated with each number, one number
at a time, within a 2-minute time limit (Wechsler, 2008). The patient is provided with a
record form with the key at the top and rows of boxes beneath. For each row of boxes, the
top of the top box has a number in it and the bottom box is empty, so the participant can

36
draw in the associated symbol. The total number of correctly drawn symbols is used to
calculate the scaled score (Wechsler, 2008).
WAIS-IV Symbol Search (WAIS-IV SS). In the WAIS-IV SS subtest, patients are
required to scan rows of symbols (target group) one row at a time for two target symbols
(for each row) and indicate whether either of the target symbols is in the target group
(Wechsler, 2008). The patient is told to either mark the target symbol within the target
group or mark the “NO” box if neither of the target symbols are in the target group
(Wechsler, 2008). The total number of correctly marked target symbols and correctly
marked “NO” boxes are summed. The total number of incorrectly marked non-target
symbols and incorrectly marked “NO” boxes summed. The incorrect total is subtracted
from the correct total, then this calculated number is used to calculate the scaled score
(Wechsler, 2008).
Stroop Test Word-reading score (W) and Color-naming score (C). See Stroop
Test Interference Score (above) for a full explanation of the Stroop Test. Additional
scores for the current study on the Stroop Test are the word-reading score (i.e., number of
items completed correctly on the word-reading trial) and the color-naming score (i.e.,
number of items completed correctly on the color-naming trail; Golden & Freshwater,
2002).
Measures of Attention.
Trail Making Test Part A and Part B (TMT A & TMT B). The TMT A test is a
paper and pencil test, where the participant is to connect circles containing the numbers 1
through 25 in sequential order as quickly as they are able without making mistakes. If a

37
mistake is made (e.g., connecting the circle containing 23 to 25), the administrator
informs the participant of the error and directs them back to the last correct connection
(e.g., 23) and instructs the participant to continue. The total time (in seconds) is recorded
for the score on the TMT A (Heaton et al., 2004).
The TMT B test is a paper and pencil test, where the participant is to connect
circles containing the numbers 1 through 13 and letters A through L alternately (e.g.,
connecting the circle containing 1 to A to 2 to B... L to 13) as quickly as they are able
without making mistakes. If a mistake is made (e.g., connecting the circle containing 2 to
3 or 2 to D), the administrator informs the participant of the error and directs them back
to the last correct connection (e.g., B) and instructs the participant to continue. The total
time (in seconds) is recorded for the score on the TMT B (Heaton et al., 2004).
IVA + Auditory Vigilance. See above for a full description of the IVA +
assessment. The IVA + Vigilance scaled score is reported to measure attention by scoring
omission errors throughout the test administration (Sandford & Turner, 2004a, 2004b;
Strauss et al., 2006).
Verbal Series Attention Test (VSAT). The VSAT is a verbal test of attention,
developed as a screening measure (Mahurin & Cooke, 1996). The VSAT consists of nine
items: 1) reciting the alphabet, 2) counting backwards from 20 to 1, 3) counting
backwards by 3’s from 100 to 70, 4) reciting the days of the week forwards, 5) reciting
the days of the week backwards, 6) reciting the months of the year forwards, 7) reciting
the months of the year backwards, 8) alternately sequencing numbers and letters from 1
to 10 (i.e., 1-A, 2-B,…,10-K), and 9) an auditory vigilance task where the patient is asked

38
to signal each time a specific letter is reported in a sequence of 60 letters (Mahurin &
Cooke, 1996). The total time (in seconds) is recorded, with a maximum time of 60
seconds per item, then the time (in seconds) for the first eight items (item number nine is
untimed) is recorded and scored (Mahurin & Cooke, 1996).
Measures of IQ and Premorbid IQ.
WAIS-IV Full Scale Score (WAIS-IV FSIQ). The WAIS-IV FSIQ is not a
specific test administered to patients, rather the FSIQ is a composite score derived from
all the index scaled scores on the WAIS-IV (i.e., Verbal Comprehension Index Scale,
Perceptual Reasoning Index Scale, Working Memory Index Scale, Processing Speed
Index Scale; Wechsler, 2008). Each index scaled score is derived from the core subtest
scores (or supplemental subtest scores if all core subtests are not administered) within
each index score. The WAIS-IV FSIQ provides a measure of general intellectual
functioning (FSIQ), which is based on current cognitive performance on the WAIS-IV
subtests (Wechsler, 2008).
Wide Range Achievement Test: Fourth Edition Word Reading (WRAT4 WR).
In the WRAT4 WR, participants are asked to read up to 55-words printed on a card
(Wilkinson & Robertson, 2006). The administrator immediately scores each word read
aloud as correct (i.e., responses read correctly) or incorrect (i.e., any incorrect reading of
a word) and, at the end of the test, sums the total number of correctly read words
(Wilkinson & Robertson, 2006). If the participant cannot read at least 5-words correctly,
then they are administered the Letter Reading trial, where they are to read aloud 15 letters
(Wilkinson & Robertson, 2006). If the patient can correctly read at least 5 words, the 15-

39
points from the Letter Reading trial is automatically added to the total points from the
Word Reading trail. The sum of the Letter and Word Reading trails are used to calculate
a scaled score (Wilkinson & Robertson, 2006). While the Word Reading test was created
to measure letter and word recognition (Wilkinson & Robertson, 2006), word reading
tests are frequently used as estimates of premorbid intelligence (Stevens & Price, 1999),
as reading tests are relatively more immune to the effects of many types of brain damage
than other neuropsychological tests (Strauss et al., 2006). Thus, the WRAT4 WR score
will be used as a premorbid intelligence estimate in the current study.
Procedure
A waiver of informed consent was approved from Sanford Health Institutional
Review Board. Patients meeting inclusion criteria (see Participants section) were
identified through a review of patient files and electronic medical record systems at
Sanford Health Neuropsychology department. Once identified, code-linked identifiers
were assigned to each patient, thus patients' protected health information (PHI; i.e., name
and medical record number) were kept separate from the study database in a secure
electronic file. All aforementioned materials (i.e., demographics and neuropsychological
assessment measures) were collected for each patient and entered into a second secure
electronic file, which was used for statistical analyses.
CHAPTER III
RESULTS
Prior to planned statistical analyses, missing data points were addressed in two
ways, i.e., first, variables with greater than 10 percent missing data were eliminated (i.e.,

40
WAIS-IV LN, IVA + Auditory Vigilance, IVA + Auditory Prudence, VSAT Time,
CVLT-II 1, and WRAT4 WR) and second, two data substitution methods were used (i.e.,
overall mean substitution and group x variable mean substitution). Two data sets were
created to accommodate both mean substitution methods. In the first version of the data
set, overall variable means were substituted for missing data points, alternatively in the
second version of the data set group x variable mean substitutions were substituted for
missing data points. These methods of data substitutions were chosen as even after
eliminating variables with greater than or equal to 10 percent missing data, there
continued to be missing data points throughout the variables, ranging from 8.7% to 0.7%,
with the exception of the ACT total and perseveration scores which evidenced no missing
data points due to study inclusion criteria. Case deletion for missing variables was not
used, as this method would have reduced the sample below 200 unique individuals. Per
Tabachnick and Fidell’s (2013) recommendation regression or prediction based
estimation procedures were not used to reduce the likelihood of inflating variable
correlations and thus potentially creating factors. As the overall variable mean
substitution was likely to underrepresent the variability within the sample and group x
variable mean substitution was likely to overrepresent the variability within the sample,
both methods were employed to gain a diverse picture of variable relationships within
this clinical database.
Reliable correlations were verified using Bartlett’s test of sphericity. Normality
was assessed with some variables evidencing a skewed distribution. Data transformation
was not conducted, which may knowingly degrade the factor solution (Tabachnick &

41
Fidell, 2013). To assess linearity of variable combinations, correlation matrices were
produced, within both groups. For variable relationships that did not have a significant
correlation, the scatter plots of these variable relationships were assessed for linearity. In
these cases, variable relationships were scattered without an identifiable relationship, but
did not evidence other forms of nonlinear relationships. Univariate and Multivariate
outliers were assessed, though outliers were present given the aim of the current study to
understand variable relationships within a broad clinical sample, deletions were not
conducted.
Exploratory Factor Analyses (EFA)
Regarding sample size, adequate sampling estimates for factor analytic
analyses vary depending on the number of variables, strength of factor loadings, and
commonality, thus require specific analysis of these variables while conducting a
factor analysis on one's data post hoc (Field, 2013). A priori predictions are limited
in utility; however, numerous sources suggested a sample size of 300 should
provide a stable factor solution unless the aforementioned variables suggest
otherwise in a sample (Tabachnick & Fidell, 2007; Field, 2013). Alternatively, a
review article of PsychINFO articles using either principal components or EFA
recommended a 10:1 ratio of cases per variable, sighted a majority (63%) of studies
resulted in adequate factor structures with this ratio (Costello & Osborne, 2005).
Thus, a priori, the current study aimed for overall data collection of approximately
240 cases based upon the 10:1 ratio of cases to variables. Final data collection

42
resulted in 448 unique patients being collected, exceeding the recommended sample
size estimates.
The factors were extracted using principal factors (also called principal axis
factoring), such that the shared variability between variables could be assessed through
estimated communalities (Tabachnick & Fidell, 2007). This particular data extraction
procedure attempts to eliminate or reduce both unique and error variance from variables
entered. A priori, an oblique promax rotation was planned, allowing for the correlation
between factors, which was expected given the results of previous factor analytic studies
(Boone et al., 1998; Mertens et al., 2006). Based on the recommendations of Tabachnick
and Fidell (2007), .32 was used as the minimum loading of a variable on a factor
acceptable for inclusion. Factors with fewer than three variable loadings were eliminated.
The factor structures for the overall mean and group x variable mean substitution data did
not differ in factor structure outcomes, loadings, or variance
accounted for, thus are described simultaneously.
Prior to performing the EFA, data were screened for normality, univariate
outliers, and homogeneity of variance among entered variables. Results revealed all
statistical assumptions of EFA were met. The Kaiser-Meyer-Olkin (KMO) measure of
sampling adequacy was .893, indicating a sufficient proportion of common variance
among variables for EFA. Bartlett’s test of sphericity was significant, indicating
sufficient covariances among variables for factor analysis (p < .001). Concerning sample
size, the cases to variables ratio (N/k) was approximately 30:1, which is adequate
(Costello & Osborne, 2005). See Table 5 and Table 6 for EFA data screening summaries.
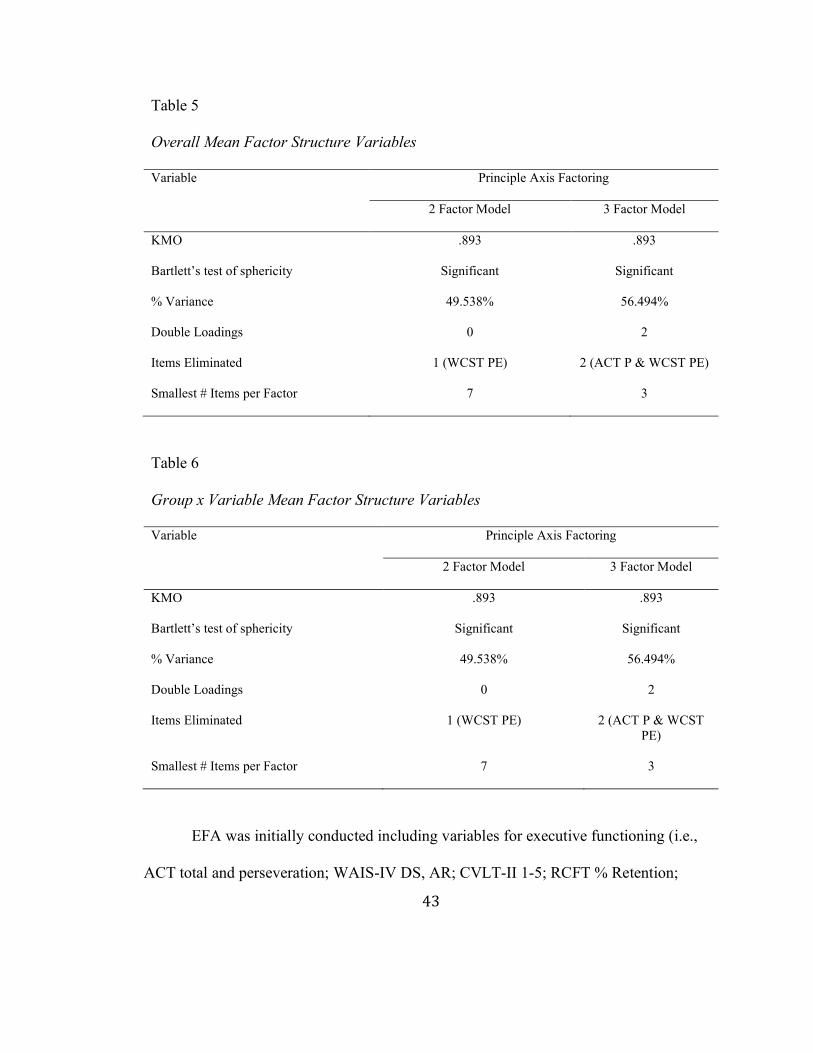
43
Table 5 Overall Mean Factor Structure Variables Variable Principle Axis Factoring
2 Factor Model 3 Factor Model
KMO .893
.893
Bartlett’s test of sphericity Significant
Significant
% Variance 49.538%
56.494%
Double Loadings 0
2
Items Eliminated 1 (WCST PE)
2 (ACT P & WCST PE)
Smallest # Items per Factor 7
3
Table 6 Group x Variable Mean Factor Structure Variables Variable Principle Axis Factoring
2 Factor Model 3 Factor Model
KMO .893
.893
Bartlett’s test of sphericity Significant
Significant
% Variance 49.538%
56.494%
Double Loadings 0
2
Items Eliminated 1 (WCST PE)
2 (ACT P & WCST PE)
Smallest # Items per Factor 7 3
EFA was initially conducted including variables for executive functioning (i.e.,
ACT total and perseveration; WAIS-IV DS, AR; CVLT-II 1-5; RCFT % Retention;

44
Stroop In; WCST PE; COWAT), processing speed (i.e., WAIS-IV CD and SS; Stroop W
and C), attention (i.e., TMT A and B), and IQ/premorbid IQ (i.e., WAIS-IV FSIQ; see
Table 4 for a complete list of tests by domain). WAIS-IV FSIQ was ultimately removed
from the final factor analyses due to its strong correlation with WAIS-IV subtests,
negatively impacting the factor structure.
A 2-factor structure was retained using the principle factors extraction method
with an oblique promax rotation, while a 3-factor structure was rejected due to multiple
double loadings, a 2 variable third factor, and the elimination of the ACT perseveration
and WCST PE variables from the factor loadings. See Table 5 and Table 6 for factor
structure variables. The 2-factor model accounted for 49.54% of the overall variance
while eliminating the WCST PE. The smallest number of variables per factor was 7 with
no double loadings. The first factor, accounting for 39.55% of the variance, included
Stroop W, TMT A, Stroop C, WAIS-IV CD, TMT B, WAIS-IV SS, and COWAT, while
the second factor, accounting for 9.99% of the variance, included ACT total, WAIS-IV
AR, CVLT-2 1-5 Total, WAIS-IV DS, Stroop In, Rey-O % Retention, and ACT
perseveration. See Table 7 for the factor structure and loadings, as well as the factor
correlation matrix.

45
Table 7 Principle Axis Factoring 2-Factor Pattern Matrices
Overall Mean substitution Group x Variable Mean substitution
Factor Factor
1 2 1 2
Stroop W .918 -.208 .918 -.208
TMT A .860 -.189 .860 -.189
Stroop C .842 -.079 .842 -.079
WAIS-IV CD .715 .104 .715 .104
TMT B .626 .122 .626 .122
WAIS-IV SS .617 .192 .617 .192
COWAT .406 .215 .406 .215
ACT T -.041 .745 -.041 .745
WAIS-IV AR .115 .630 .115 .630
CVLT2 1-5 .162 .528 .162 .528
WAIS-IV DS .255 .528 .255 .528
Stroop In -.152 .487 -.152 .487
Rey-O % Retention
-.119 .429 -.119 .429
ACT P .024 -.327 .024 -.327
WCST PE .140 .308 .140 .308
% Variance 39.55 9.99 39.55 9.99
Eigenvalue 5.93 1.50 5.93 1.50
Cronbach's Alpha .83 .48 .83 .48
Factor Correlation Matrix Factor Correlation Matrix
Factor 1 2 1 2

46
1 1.000 .667 1.000 .667
2 .667 1.000 .667 1.000
Receiver Operating Characteristic Analyses (ROC)
The ACT’s criterion-related validity in actual clinical application was
evaluated via receiver operating characteristic (ROC; McFall & Treat, 1999)
analyses. ROC analyses produce a quantitative index of prediction accuracy between
two groups on test by plotting the hit rate (i.e., sensitivity) on the y-axis and the
false alarm rate (i.e., 1-specificity) on the x-axis for all possible cutoff values of the
test/score (McFall & Treat, 1999). The area under the curve (AUC; McFall & Treat,
1999) statistic was used to assess the accuracy of group prediction in all ROC
analyses. AUC ranges from 0-1, with 0.50 representing prediction no better than
chance, and higher scores reflecting better overall prediction of criterion groups.
Hosmer and colleagues (2013) indicated that 0.5 < AUC < 0.7 represents poor
discrimination, 0.7 d AUC < 0.8 represents acceptable discrimination, 0.8 d AUC <
0.9 represents excellent discrimination, and AUC t 0.9 represents outstanding
discrimination between groups. Specific goals were to identify clinical groups, which
previous research on the ACT total score has indicated discriminant ability (i.e., TBI,
ADHD, MS, PTSD, MDD; see above for a review of studies) when possible in the
archival data set, and new clinical groups yet to be assessed using the ACT. Given,
the relatively little information regarding adequate sample size for ROC analyses it
was determined that a priori clinical groups with 30 or more patients would be

47
compared using the ROC analyses. As such, ROC analyses were conducted between
all possible combinations of clinical groups of 30 or more patients for both the ACT
total and perseveration scores instead of predetermined comparisons, which
included the MS, psychiatric diagnosis, moderate to severe TBI, cognitive disorder
NOS, and mild TBI (i.e., concussion) clinical groups. See Table 8 and Figure 1 for the
ACT total and ACT perseveration means and standard deviations within these
aforementioned clinical groups for reference.
Table 8 ACT Total and ACT Perseveration Score Means and Standard Deviations for Clinical Groups of 30 or More Patients Primary Clinical Group Comparison
ACT T ACT P
M SD M SD
MS 41.62
7.92 6.64
4.90
Psychiatric Diagnosis 42.24
7.48 4.96
3.82
moderate to severe TBI 40.20
8.46 7.92
6.64
Cognitive Disorder NOS 39.53
8.68 4.71
3.32
mild TBI 43.71 7.83 5.68
4.35
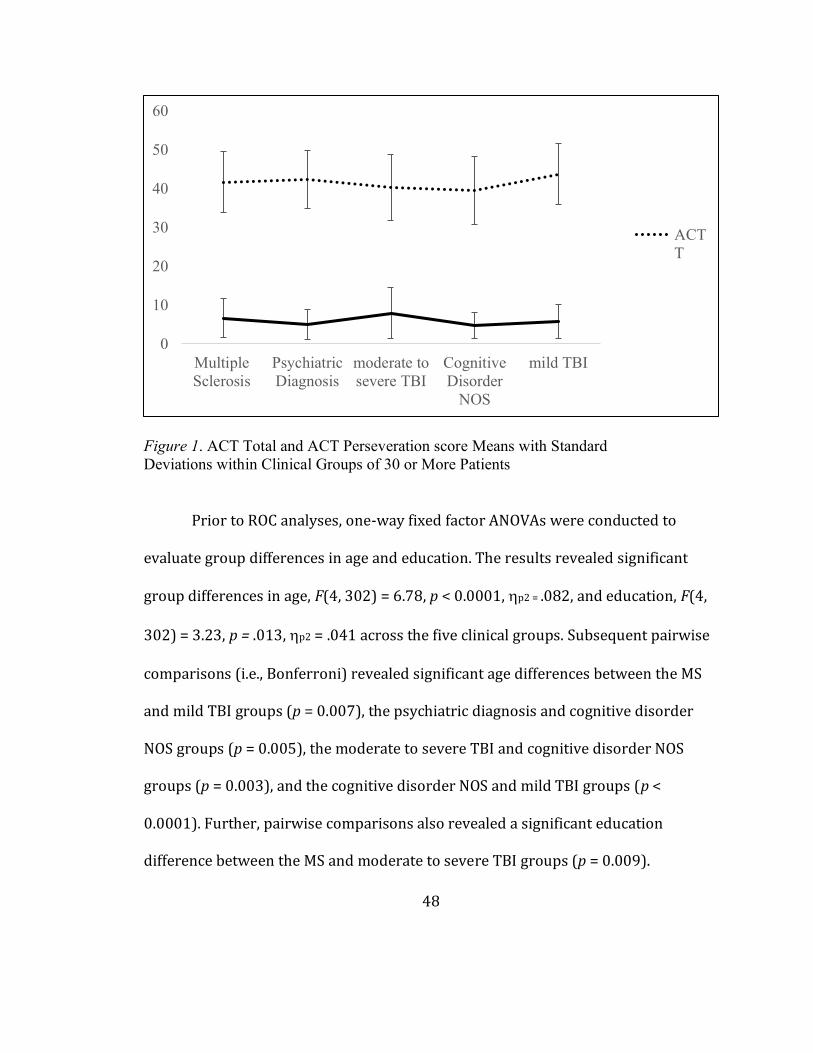
48
Figure 1. ACT Total and ACT Perseveration score Means with Standard Deviations within Clinical Groups of 30 or More Patients
Prior to ROC analyses, one-way fixed factor ANOVAs were conducted to
evaluate group differences in age and education. The results revealed significant
group differences in age, F(4, 302) = 6.78, p < 0.0001, Kp2 = .082, and education, F(4,
302) = 3.23, p = .013, Kp2 = .041 across the five clinical groups. Subsequent pairwise
comparisons (i.e., Bonferroni) revealed significant age differences between the MS
and mild TBI groups (p = 0.007), the psychiatric diagnosis and cognitive disorder
NOS groups (p = 0.005), the moderate to severe TBI and cognitive disorder NOS
groups (p = 0.003), and the cognitive disorder NOS and mild TBI groups (p <
0.0001). Further, pairwise comparisons also revealed a significant education
difference between the MS and moderate to severe TBI groups (p = 0.009).
0
10
20
30
40
50
60
MultipleSclerosis
PsychiatricDiagnosis
moderate tosevere TBI
CognitiveDisorder
NOS
mild TBI
ACTT
49
Significant ROCs between these group comparisons were further assessed to
understand the impact of age and education on ACT total and ACT perseveration
prediction.
A total of ten comparisons were made with results as follows. See Table 9 for
a tabular view of these results. 1) In the comparison between patients in the MS
group and those in the psychiatric diagnosis group, ACT perseveration was found to
be a significant predictor of diagnostic group (AUC = .60, p = .019); however, ACT
total was not (AUC = .521, p = .637). 2) In the comparison between patients in the
MS group and those in the moderate to severe TBI group, neither the ACT
perseveration (AUC = .54, p = .463) or ACT total (AUC = .558, p = .232) were
significant predictors of diagnostic group. 3) In the comparison between patients in
the MS group and those in the cognitive disorder NOS group, neither the ACT
perseveration (AUC = .61, p = .053) or ACT total (AUC = .58, p = .153) were
significant predictors of diagnostic group. 4) In the comparison between patients in
the MS group and those in the mild TBI (i.e., concussion) group, neither the ACT
perseveration (AUC = .55, p = .375) or ACT total (AUC = .58, p = .190) were
significant predictors of diagnostic group. 5) In the comparison between patients in
the psychiatric diagnosis group and those in the moderate to severe TBI group, ACT
perseveration was found to be a significant predictor of diagnostic group (AUC = .63,
p = .006); however, ACT total was not (AUC = .58, p = .086). 6) In the comparison
between patients in the psychiatric diagnosis group and those in the cognitive

50
disorder NOS group, neither the ACT perseveration (AUC = .50, p = .960) or ACT
total (AUC = .61, p = .062) were significant predictors of diagnostic group. 7) In the
comparison between participants in the psychiatric diagnosis group and those in the
mild TBI (i.e., concussion) group, neither the ACT perseveration (AUC = .55, p =
.394) or ACT total (AUC = .56, p = .321) were significant predictors of diagnostic
group. 8) In the comparison between patients in the moderate to severe TBI group
and those in the cognitive disorder NOS group, ACT perseveration was found to be a
significant predictor of diagnostic group (AUC = .63, p = .030); however, ACT total
was not (AUC = .53, p = .630). 9) In the comparison between patients in the
moderate to severe TBI group and those in the mild TBI (i.e., concussion) group,
ACT total (AUC = .64, p = .036) was found to be a significant predictor of diagnostic
group; however, ACT perseveration (AUC = .58, p = .198) was not. 10) In the
comparison between patients in the cognitive disorder NOS group and those in the
mild TBI (i.e., concussion) group, ACT total (AUC = .65, p = .035) was found to be a
significant predictor of diagnostic group; however, ACT perseveration (AUC = .55, p
= .070) was not.

51
Table 9
ROC Results Between Clinical Groups of 30 or More Patients
Primary Clinical Group Comparison
ACT T (AUC; p) ACT P (AUC; p)
MS x Psychiatric Diagnosis
.521 (.627)
.602 (.019*)
MS x moderate to severe TBI
.558 (.232)
.536 (.463)
MS x Cognitive Disorder NOS
.580 (.153)
.609 (.053)
MS x mild TBI .580 (.190)
.554 (.375)
Psychiatric Diagnosis x moderate to severe TBI
.583 (.086)
.632 (.006**)

52
Psychiatric Diagnosis x Cognitive Disorder NOS
.605 (.062)
.503 (.960)
Psychiatric Diagnosis x mild TBI
.560 (.321)
.551 (.394)
moderate to severe TBI x Cognitive Disorder NOS
.529 (.630)
.630 (.030*)
moderate to severe TBI x mild TBI
.635 (.036*)
.582 (.198)
Cognitive Disorder NOS x mild TBI
.649 (.035*)
.546 (.070)
Notes. *significant (<.05) difference between scores, **significant (<.01) difference between scores
Given the significant group difference in age and significant ROC between the
moderate to severe TBI and the cognitive disorder NOS groups (see ANOVA and ROC
results above), the relationship between ACT perseveration and age was evaluated
53
more thoroughly to understand if the ACT perseveration improved discrimination
between these groups above and beyond age alone. A hierarchical binary logistic
regression was conducted where age was entered into the model followed by ACT
perseveration. The addition of ACT perseveration significantly added to the model
(Block Chi-Square = 9.173, df = 1, p = .002), as the age only model explained 14.4%
of the variability in clinical group placement (Nagelkerke RSquare = .144). The final
model revealed that age and ACT perseveration were significant predictors of
clinical group ( moderate to severe TBI vs. cognitive disorder NOS), which improved
upon the intercept only model (Model Chi-Square = 20.270, df = 2, p < .001). This
final model explained 25.2% of the variability of clinical group placement
(Nagelkerke RSquare = .252). Age and ACT perseveration were significant at or
below the 1% level (age Wald = 10.019, p = .002; ACT perseveration Wald = 6.723, p
= .010). The model predicted 73.8% of the moderate to severe TBI cases and 50.0%
of the cognitive disorder NOS cases, giving an overall percentage correct prediction
rate of 64.6% though this is less than the desired standard of 25% greater accuracy
rate than having no model (greater than 65.875% accuracy rate). However, the age
only model correctly predicted 80.3% of the moderate to severe TBI cases and
44.7% of the cognitive disorder NOS cases with an overall percentage correct
prediction rate of 66.7%, thus the final model resulted in a slight decrease in
prediction accuracy. In sum, the ACT perseveration was found to be a significant
predictor of clinical group beyond age alone; however, its addition into the model

54
slightly reduced (by 2.1%) the overall discriminative accuracy of the age alone
model.
Given the significant difference in age and significant ROC between the
cognitive disorder NOS and mild TBI groups (see ANOVA and ROC results above),
the relationship between ACT total and age was evaluated more thoroughly to
understand if the ACT total improved discrimination between these groups above
and beyond age alone. A hierarchical binary logistic regression was conducted
where age was entered into the model followed by ACT total. The final model was
significant with age as the significant predictor of clinical group identification
between cognitive disorder NOS and mild TBI groups than the intercept only model
(Model Chi-Square = 17.939, df = 1, p < .001), explaining 30.6% of the variability of
clinical group placement (Nagelkerke RSquare = .306). Age was significant below
the 1% level (age Wald = 14.037, p < .001). The model predicted 76.3% of the
cognitive disorder NOS cases and 64.5% of the mild TBI cases, giving an overall
percentage correct prediction rate of 71.0% which is above the than the desired
standard of 25% greater accuracy rate than having no model (greater than 63.15%
accuracy rate). The addition of ACT total did not significantly add to the model
(Block Chi-Square = 2.332, df = 1, p = .127), thus was not retained. In sum, the ACT
total was not found to be a significant predictor of clinical group beyond age alone,
thus did not add to the overall discriminative accuracy of the age alone model.

55
CHAPTER IV
DISCUSSION
Previous research aimed to understand the relationship between the ACT and
other neuropsychological assessment measures to gain a better understanding of the
domains of cognitive function involved in ACT performance; however, this research did
not reveal a consistent relationship, with some finding relationships with measures of
intelligence/word reading ability, executive functioning, working memory, attention,
and/or processing speed (Boone et al., 1998; Mertens et al., 2006; Shura et al., 2016;
Geurten et al., 2016). The present study aimed to improve upon the construct validity of
the ACT by consolidating previous findings with specific emphasis on identifying the
relationship of the ACT perseveration score with other measures of cognitive functioning,
which had only been previously assessed in one prior study (i.e., Boone et al., 1998). To
accomplish this, the present study aimed to conduct an EFA including
neuropsychological assessment measures within all domains of cognitive functioning
previously identified to be related to ACT performance (i.e., IQ, EF, WM, Attention, and
PS). Further, to add to the literature on the discriminant ability of the ACT total and
perseveration scores within a largely neurological sample, the present study aimed to
validate and expand upon previous research regarding the clinical utility of the ACT total
score within a clinical/neurological population referred for neuropsychological
assessment (Anile et al., 2003; Oral et al., 2012; Stuss et al., 1989; Merkley et al., 2013;
Shura et al., 2016; Dige & Wik, 2005; Ozakbas et al., 2004), while generating a novel
understanding of the clinical utility of the ACT perseveration score within the same

56
sample. To accomplish this, the present study planned to conduct ROC analyses between
all sufficiently large (i.e., greater than 30 cases) clinical groups within the collected
sample for both the ACT total and perseveration scores.
Construct Validity
Regarding the planned EFA analysis, the a priori hypothesis predicted that the
ACT total and perseveration scores would load on the same factor with measures of
intelligence, processing speed, and executive functioning, specifically measures of
working memory, as indicated by previous research (Boone et al., 1998; Mertens et al.,
2006; Shura et al., 2016; Geurten et al., 2016). Results from the present study revealed a
2-factor model. The first factor included measures of verbal and visual processing speed
(i.e., Stroop W, Stroop C, WAIS-IV CD, and WAIS-IV SS), attention (i.e., TMT A, TMT
B), and verbal executive functioning (i.e., COWAT), while the second factor included
measures of executive functioning (i.e., ACT total, WAIS-IV AR, CVLT-II 1-5, WAIS-
IV DS, Stroop In, Rey-O Percent Retention, and ACT perseveration). Given these
findings, the first factor, accounting for the most variance within the sample (i.e.,
39.55%), appeared to be most indicative of the domains of latent attention and processing
speed, whereas the second factor, which the ACT total and perseveration scores loaded
on, appeared to relate latent higher-order EF functions, accounting for less variance
within the current sample (i.e., 9.99%).
The EFA within the present study accounted for a similar amount of variance
within the sample as in the Boone and colleagues’ (1998) and Mertens and colleagues’
(2006) EFAs at 49.54% variance accounted for compared to 55% and 46.7%,

57
respectively. In addition, in all cases (i.e., the present study; Boone et al., 1998; Mertens
et al., 2006) the factor loading the ACT accounted for the least amount of variance within
the factor structure at 9.99% in the present study, 13% (Boone et al., 1998), and 10.61%
(Mertens et al., 2006). These results are not surprising given the inclusion by all three
studies of similar overlapping neuropsychological measures within the EFAs, suggesting
some consistency across studies even in the context of different samples.
Congruent with previous findings, the present study found a consistent
relationship between the ACT total and perseveration scores with WAIS-IV DS, WAIS-
IV AR, RCFT % Retention, and Stroop In (Boone et al., 1998; Mertens et al., 2006;
Geurten et al., 2016). In contrast, the present study did not reveal significant relationships
between the ACT total and perseveration scores with WAIS-IV CD, TMT A, and Stroop
C as found in previous studies, in that the ACT total and perseveration scores did not load
on the same factor as these measures (Boone et al., 1998; Shura et al., 2016; Geurten et
al., 2016). These findings provide convergent validity for the ACT as a measure of
executive functioning as opposed to a measure of processing speed or attention, as
previously suggested (Boone et al., 1998; Shura et al., 2016).
With regard to measures of IQ and premorbid IQ, though previous research found
significant relationships in EFA analysis, regression, and correlational research, these
measures were ultimately not included in the present study’s EFA. The planned measure
of premorbid IQ (i.e., WRAT4 WR) evidenced greater than 10% missing data points,
thus was eliminated during data screening. Additionally, the planned measure of IQ (i.e.,
WAIS-IV FSIQ) was initially included in the EFA; however, it was ultimately removed
58
due to overlapping variance with other WAIS-IV measures, as the score is derived from
other WAIS-IV subtests used in the EFA. This variable relationship pooled WAIS-IV
measures onto the same factor, thus limiting the expression of WAIS-IV subtests
relationships with the ACT total and perseveration scores in the EFA. Though a
limitation of the current study, an independent measure of IQ was not identified within
the current sample, thus general intelligence was eliminated as a domain assessed.
A novel finding of the current study was that the ACT total and perseveration
scores loaded on the same factor with verbal learning (i.e., CVLT-II 1-5 Total), an EF
measure, which had not been previously identified by other researchers. While previous
research had included multiple measures of verbal learning and memory, these measures
were found to load on a “memory and tracking of information” factor separate from the
ACT total score performance (Mertens et al., 2006). Mertens and colleagues’ (2006)
previous finding was not surprising given the inclusion of numerous measures of verbal
memory with multiple sub-scores from each measure, resulting in strong relationships
leading to high amounts of shared variance. Given that the present study only included
one measure of verbal learning, the relationship between verbal learning and aspects of
executive functioning was elicited.
The ACT total and perseveration scores’ evidenced relationship with
measures of EF in the present study is not a novel finding as previous studies have
suggested relationships with measures of short-term memory, working memory,
and executive functioning (Boone et al., 1998; Mertens et al., 2006; Geurten et al.,
2016). Further, a recent article by Aita and colleagues (2019) included the ACT total

59
score in an EFA of measures of EF to assess the construct validity of verbal fluency
measures (i.e., semantic and phonemic) as measures of executive functioning within
healthy college students. The EFA revealed the ACT total score loaded with
measures of working memory (i.e., Reading Span, requires the participant to
mentally hold series of letters of increasing length with a distraction task of reading
and identifying the truthfulness of sentence; and Operation Span, requires the
participant to remember series of letters of increasing length with a distraction task
of simple mathematical problems) on a factor that accounted for 34.25% of variance
out of 61% total variance within their sample (Aita et al., 2019). Alternatively, the
ACT total score did not load with measures of “fluid reasoning” (i.e., WAIS-IV Block
Design, WAIS-IV Matrix Reasoning, Raven’s Progressive Matrices) or measures of
“shifting/updating” (i.e., TMT B, Paced Auditory Serial Addition Test, Shifting
Attention Test; Aita et al., 2019). This study further validated the ACT total score as
a measure of EF, more specifically a measure of working memory.
Previous research on the ACT proposed that the ACT total score and in some
cases the Perseveration score likely represent a variety of cognitive domains and
premorbid abilities, including: education, IQ, premorbid IQ, EF, WM, Attention, and PS
(Boone et al., 1998; Mertens et al., 2006; Shura et al., 2016; Geurten et al., 2016). The
present study suggested that ACT total and perseveration score performances are more
closely related to other measures of executive functioning within the current clinical
population, which was also validated by Aita and colleagues (2019), who, within a

60
healthy sample, reported the ACT total score’s relationship with measures of working
memory. Though direct comparison between the two studies is limited, given the use of
measures of processing speed and attention in the present study, as well as sample
differences (i.e., healthy versus clinical), future research is indicated to replicate a similar
EFA of EF measures with the inclusion of both the ACT total and perseveration scores
within healthy and clinical samples. The purpose of this prospective study would be to
aid in further differentiating the ACT total and perseveration scores within only measures
of EF, which may aid in identifying differential executive processes between the two
scores. Though Boone and colleagues (1998) reportedly assessed “measures of prefrontal
lobe functioning,” their inclusion of EF factors was limited and did not represent an
extensive sampling of EF measures or subdomains. Future research should strategically
include EF measures covering the broad EF subdomains of shifting, updating, and
inhibition established by Miyake and colleagues (2000), as well as other higher-order
mental processes, that is, planning, problem-solving, and abstract reasoning routinely
considered within the EF domain of cognitive functioning (Collins & Koechlin, 2012).
Implications of Principle Factors Extraction Method and Promax Rotation on the EFA
An EFA using principle factors (also called principal axis factoring) with a
promax rotation was selected for the current study based upon the congruence of the
extraction method with study goals and variable characteristics, as well as
correspondence with previous research. Alternatively, other extraction and rotation
methods may have yielded different results and interpretations. Principal factor was
selected in order to assess the shared variance between variables as this extraction

61
method attempts to eliminate both unique and error variance from each of the variables
entered (Tabachnick & Fidell, 2013). Alternatively, Principle Component Analysis
(PCA) would have also been a reasonable extraction method for the current data and
research questions, as both are methods aimed at maximizing the variance extracted by
orthogonal components or factors. In contrast, in PCA, the final solution includes
common, unique, and error variance within the components, which may contaminate the
final factor solution resulting in a factor structure that is more difficult to interpret
(Tabachnick & Fidell, 2013). Given the nature of the present study’s sample with diverse
clinical presentations and overlapping comorbidities, the more conservative principle
factors method was selected to reduce the impacts of unique and error variance, in order
to simplify interpretation of the factor structure. The reader should be aware that the
communalities used in the principle factors extraction method are an estimation of the
common variance between variables with potential for error in underestimating this
variance, whereas the PCA extraction more closely aligns with the direct correlations
seen in the original correlation matrices within the sample (Tabachnick & Fidell, 2013).
This discussion serves to highlight the strengths and weaknesses of both extraction
methods for the reader and to serve as an explanation for why the principle factors
extraction method was selected.
Further, regarding the rotation method, the oblique promax rotation method was
planned and performed as it allowed for the correlation between factors, which was
expected within the current sample, given the results from previous similar EFAs (Boone
et al., 1998; Mertens et al., 2006). This method was selected as its specific goal is to
62
rotate orthogonal factors into oblique rotations, allowing for correlations among factors
and maximizing clarity by identifying which variables do and do not correlate with the
factors (Tabachnick & Fidell, 2013). Thus, this method was identified as best suited
given previous EFA findings and the goals of the current analysis; however, other
alternative oblique rotation methods may have revealed differing results and
interpretations as they simplify or rotate the factor structure using differing methods (e.g.,
minimizing cross-products of loadings, rescale factor loadings; Tabachnick & Fidell,
2013).
Additional Limitations and Future Directions of the EFA
The impact of variable deletions (i.e., IVA + Auditory Prudence, IVA + Auditory
Vigilance, WAIS-IV LN, CVLT-II 1, VSAT Time, WRAT4 WR) and elimination of
WAIS-IV FSIQ is somewhat unknown. If retained in the EFA as planned, these variables
may have had a significant impact on the overall factor structure. It is known that the
reduction in planned variables reduced the number of EF, attention, and IQ measures
included in the present study analyses, which may have underrepresented relationships
that exist within the clinical sample. Similarly, the use of mean substitution methods for
other retained variables (i.e., WAIS-IV AR, DS, CD, and SS; CVLT-II 1-5; RCFT %
Retention; STROOP C, W, In; WCST PE; COWAT; and TMT A and B) reduced the
overall variability within these variables, which may have limited additional factor
identification or clarity. As EFA methods are highly influenced by the variables included,
variability within the sample, and relationships between variables, it is likely the deletion
of planned variables and the use of mean substitution methods impacted the underlying

63
factor structure in unforeseen ways (Tabachnick & Fidell, 2013). Given the archival
nature of the current study with a priori test selection and extensive missing data not at
random, the reduction in variables was unplanned, thus future research is indicated to
understand the ACT total and perseveration score relationships within a more extensive
sampling of EF measures.
Regarding the sample within the present study and its impact on the EFA, the
heterogeneous nature of the overall sample and heterogeneity within each of the clinical
groups may have negatively impacted the EFA. In the EFA, though the present study
aimed to understand the relationship of the ACT scores with other measures in a clinical
data set, it is possible that the factor structure of these variables may be different within
each clinical group included, thus rendering the resulting overall factor structure less
meaningful. Further, within each clinical group, there was extensive heterogeneity due to
differences in clinical presentation and severity, as well as differing comorbidities. Thus,
the current factor structure may represent variable loadings that are not necessarily
consistent between all groups included. As such, future research may aim to understand
the unique factor structures within diagnostic categories or clinical presentations, i.e.,
more homogeneous groups, rather than an overall clinical group. A more homogeneous
clinical sample may have yielded a substantially different factor structure and variable
relationships with the ACT total and perseveration scores. While assessing
neuropsychological measures within a clinical sample can be useful, as there may be
more pervasive deficits and differing relationship patterns, this same variability may also

64
confound cumulative analyses or non-group specific analyses such as EFA. This
limitation should be considered when assessing the results of the current EFA.
Criterion Validity
Previous research on the ACT had assessed the discriminant ability of the ACT
total score in predicting clinical group membership with numerous significant results,
though mixed. Within TBI samples, previous research on the predictive ability of the
ACT total score reported discriminant ability between mild and severe TBI (Stuss et al.,
1989; Merkley et al., 2013) but no difference in performance between mild TBI and no
TBI samples. With regard to MS samples, previous findings revealed the ACT total score
differentiated relapsing-remitting MS and clinically isolated syndrome from secondary
progressive MS (Ozakbas et al., 2004). Within psychiatric presentations, the ACT total
score had been shown to not predict PTSD symptoms (Shura et al., 2016); however,
alternatively, it did predict symptoms of MDD (Shura et al., 2016; Oral et al., 2012) and
ADHD (Dige & Wik, 2005). In sum, previous research assessing the clinical utility of the
ACT total score was limited with mixed findings, while the clinical utility of the ACT
perseveration score had not been previously assessed.
Regarding the present study, given the exploratory nature of the planned ROC
analyses within unknown clinical/neurological populations, no a priori hypotheses were
made for the comparisons between clinical groups with regard to the predictive utility of
the ACT total and perseveration scores. After conducting all ROC analyses with the ACT
total and perseveration scores between all possible combinations of the MS, psychiatric
diagnosis, moderate to severe TBI, cognitive disorder NOS, and mild TBI clinical groups,
65
the results revealed that the ACT total score significantly differentiated between the
moderate to severe TBI and mild TBI groups, and between the cognitive disorder NOS
and mild TBI groups, though it was a poor predictor. Follow-up analysis between the
cognitive disorder NOS and mild TBI groups was necessary due to the significant group
difference in age. The results revealed that age alone accounted for the previous finding
without significant discriminant utility added by the ACT total score. This finding
suggests that the significant AUC for the ACT total score between the cognitive disorder
NOS and mild TBI groups is rather subsumed by variation in age between the two groups
resulting in limited discriminate ability of the ACT total score in this clinical group
comparison.
Further, the results revealed the ACT perseveration score significantly predicted
between the MS and psychiatric diagnoses groups, the psychiatric diagnosis and
moderate to severe TBI groups, and the moderate to severe TBI and cognitive disorder
NOS groups, though was a poor predictor. Follow-up analysis between the moderate to
severe TBI and cognitive disorder NOS groups was necessary due to the significant
group difference in age. The results revealed that age and unique variance from the ACT
perseveration score accounted for the previous finding, with age being the strongest
predictor of group membership. This finding suggests that the ACT perseveration score is
useful as a predictor between the moderate to severe TBI and cognitive disorder NOS
groups, though there is a significant group difference in age within the current sample.
No other group comparisons revealed the ACT total or ACT perseveration scores to be
significant predictors of clinical group membership.
66
An overall interpretation of these findings within the current sample suggests that
while the ACT total score may have limited utility in discriminating the severity of brain
damage within TBI, the ACT perseveration score evidenced a trend of more consistent
utility in discriminating diagnostic groups. More specifically, The ACT perseveration
score discriminated between those groups with acquired executive functioning deficits
(i.e., MS and moderate to severe TBI) from those without (i.e., psychiatric diagnosis and
cognitive disorder NOS) in most cases (i.e., except in the comparison between MS versus
cognitive disorder NOS). While there are potentially numerous explanations for these
findings, two recent publications from the same longitudinal study may provide insight
into the current results. These studies revealed that the ACT total score alone was not
sensitive to subjective cognitive changes in mild TBI (Karr et al., 2019). Alternatively,
fMRI data revealed differential resting state functional connectivity in the frontal-
temporal brain regions between the mild TBI group and controls, with increased
activation in the mild TBI group being significantly related to improved ACT total score
performance, representing a compensatory change (Pagulayan et al., 2018). These results
indicate that while the ACT total score was not effective in discriminating between the
clinical and control groups, ACT total score performance was associated with significant
changes in brain activation. Of note, the ACT perseveration score was not assessed
within the two aforementioned studies. Thus, condensing the findings of the present study
with these two studies may indicate that, though there are likely declines in EF or
working memory, the ACT total score is not effective in identifying these changes;
whereas the ACT perseveration score may be more clinically useful, especially in

67
discriminating clinical groups with more significant EF dysfunction (i.e., in MS and
moderate to severe TBI) from those without. Though, even the ACT perseveration score
may not be effective in identifying mild EF dysfunctions, suggesting that the ACT
scoring methods may be too simplistic to identify subtle cognitive changes in clinical
populations. This is reiterated by the current study as evidenced by the inability of the
ACT total and perseveration scores to discriminate between mild TBI and psychiatric
groups, as well as between mild TBI and cognitive disorder NOS groups.
No previous studies had evaluated the clinical utility of the ACT perseveration
score, thus the present study revealed novel discriminative ability between clinically
relevant presentations (i.e., MS and psychiatric diagnoses, psychiatric diagnoses and
moderate to severe TBI, and moderate to severe TBI and cognitive disorder NOS) using
this sub-score of the ACT. Though previous factor analytic research (Boone et al., 1998)
and the present study found the ACT total and perseveration scores to load on the same
factor with each other, the ACT total and perseveration scores shared 27.04% (r = -0.52;
Boone et al., 1998) and 11.49% (r = -0.339, p < .001; present study) variability,
respectively, suggesting medium to large effects but with limited overlapping variability
(Field, 2013). These findings suggest that though there is a strong relationship between
the two scores, there remains variance unaccounted for (i.e., 72.96% and 88.51%) by this
relationship, comprised of unique and error variance. Research to date has been unable to
differentiate the specific differences in latent construct relationships which may account
for the unique variance between the ACT perseveration and ACT total scores. These
combined results may suggest that the two scores, though significantly related, are

68
measuring different aspects of underlying cognitive performance on the ACT task
resulting in the differential discriminant ability seen between clinical presentations in the
current study.
Limitations and Future Directions of ROC Analyses
In the ROC analyses, the clinical groups were highly heterogeneous with many
stages/types of the overarching medical conditions, as well as many comorbidities.
Notably, as examples, the brain injury groups included individuals at different stages of
recovery and the MS group contained all types of MS at all stages of the disease process.
Including such variability within each clinical group likely reduced the discriminative
utility of the ACT scores, whereas ideally, the study would have had enough
patients/information within each group to understand differences between acute vs. post-
acute, in severity, and different subtypes of clinical presentation, etc. Future research
within subsets of these clinical groups may aid in understanding the ACT’s clinical utility
further beyond the results of the current study.
Due to the archival nature of the present study, criterion contamination may be
present, that is, the ACT total and perseveration scores may have significantly influenced
the subject’s inclusion in their clinical group. If this were the case, the ROC results may
have been inflated. Though possible, given the multifaceted nature of neuropsychological
evaluations with use of many data points, e.g., history, physical presentation,
neuropsychological assessment results, imaging, lab results, etc., it is unlikely that the
ACT total score, the only score used clinically within this sample, would have been used
69
as a sole or even significant determinant of diagnostic group within the clinical
determination.
Limitations and Future Directions
Regarding the scoring of the ACT perseveration variable, though the utilized
scoring method has been used by other authors (i.e., Boone et al. 1998), theoretically
there are alternative or additional ways to score perseveration within this measure.
Notably, one could choose to score perseverations based upon the length the
perseverative response is maintained rather than all instances of perseverations, as was
the case in the present study. Though this scoring method was not selected, future
research may be indicated to identify the costs and benefits of both scoring methods, as
well as differences in discriminant usefulness.
In conclusion, the present study aimed to clarify the construct and criterion
validity of the ACT total and perseveration scores, within a clinically referred
sample. Results suggested that the ACT total and perseveration scores load on the
same factor with other measures of executive functioning. These findings indicate
that though previous research has suggested the ACT loads with other domains of
cognitive functioning, the current study and a recent study by Aita and colleagues
(2019) suggest the ACT total and perseveration scores are more closely related to
other measures of executive functioning in healthy and clinical samples. Further,
relating to criterion validity, the present study revealed that the ACT total and
perseveration scores evidence differential discriminative utility between clinical

70
groups, a novel finding. Such that the ACT perseveration score may be more useful
in discriminating diagnostic groups. Considering the limitations within the present
study (i.e., deletion of variables due to missing data, heterogeneity within the
sample and diagnostic groups), future studies are warranted to address the
construct and criterion validity more thoroughly with a more comprehensive
measure of EF and within more clinical presentations (e.g., ADHD, subsets of clinical
presentations, dementias).
71
References
Adams, R. L., Smigielski, J., & Jenkins, R. L. (1984). Development of a Satz-Mogel
short form of the WAIS-R. Journal of Consulting and Clinical Psychology, 52(5),
908. https://doi.org/10.1037/0022-006X.52.5.908
Aita, S. L., Beach, J. D., Taylor, S. E., Borgogna, N. C., Harrell, M. N., & Hill, B. D.
(2019). Executive, language, or both? An examination of the construct validity of
verbal fluency measures. Applied Neuropsychology: Adult, 26(5), 441-451.
https://doi.org/10.1080/23279095.2018.1439830
Anil, A. E., Kivircik, B. B., Batur, S., Kabakçi, E., Kitis ̧, A., Güven, E., . . .
Arkar, H. (2003). The Turkish version of the Auditory Consonant Trigram
Test as a measure of working memory: A normative study. Clinical
Neuropsychologist, 17, 159–169. https://doi.org/10.1076/clin
.17.2.159.16510
Baddeley, A. D. (2003). Working memory: Looking back and looking forward.
Nature Reviews Neuroscience, 4, 829-839.
https://doi.org/10.1038/nrn1201
Baddeley, A. D., & Hitch, G. (1974). Working memory. Psychology of Learning
and Motivation, 8, 47-89. https://doi.org/10.1016/S0079-7421(08)60452-1
Boone, K. B., Pontón, M. O., Gorsuch, R. L., González, J. J., & Miller, B. L.
(1998). Factor analysis of four measures of prefrontal lobe functioning.
Archives of Clinical Neuropsychology, 13(7), 585-595.
https://doi.org/10.1093/arclin/13.7.585

72
Boone, K.B., Miller, B.L., Lesser, I.M., Hill, E., & D’Elia, L. (1990).
Performance on frontal lobe tests in healthy, older individuals.
Developmental Neuropsychology, 6(3), 215-223.
https://doi.org/10.1080/87565649009540462
Brown, J. (1958). Some tests of the decay theory of immediate memory.
Quarterly Journal of Experimental Psychology, 10, 12–21.
https://doi.org/10.1080/17470215808416249
Carroll, J. B. (1993). Human cognitive abilities: A survey of factor-analytic studies.
Cambridge University Press.
Cohen, R. A. (1993). The neuropsychology of attention. New York: Plenum Press.
Collins, A., & Koechlin, E. (2012). Reasoning, learning, and creativity: Frontal
lobe function and human decision making. PLoS Biology, 10, e1001293.
https://doi.org/10.1371/journal. pbio.1001293
Comalli, P. E., Wapner, S., & Werner, H. (1962). Interference effects of Stroop
color-word test in childhood, adulthood, and aging. Journal of Genetic
Psychology: Research and theory on human development, 100, 47–53.
https://doi.org/10.1080/00221325.1962.10533572
Conners, C. K., & MHS Staff. (2004). Conners’ continuous performance test II
(CPT II) for windows: Technical and software manual. North Tonawanda,
NY: MHS.
Conway, A. R., Cowan, N., Bunting, M. F., Therriault, D. J., & Minkoff, S. R.
(2002). A latent variable analysis of working memory capacity, short-term
73
memory capacity, processing speed, and general fluid intelligence.
Intelligence, 30(2), 163-193. https://doi.org/10.1016/S0160-
2896(01)00096-4
Costello, A. B., & Osborne, J. W. (2005). Best practices in exploratory factor
analysis: Four recommendations for getting the most from your analysis.
Practical Assessment, Research, & Evaluation, 10 (7), 1-9.
https://doi.org/10.7275/jyj1-4868
Danthiir, V., Wilhelm, O., Schulze, R., & Roberts, R. D. (2005). Factor structure
and validity of paper-and-pencil measures of mental speed: Evidence for a
higher-order model? Intelligence 33, 491-514.
https://doi.org/10.1016/j.intell.2005.03.003
Delis, D. C., Kramer, J. H., Kaplan, E., & Ober, B. A. (2000). California Verbal
Learning Test-Second Edition, Adult Version. San Antonio, TX: The
Psychological Corporation.
Dige, N., & Wik, G. (2005). Adult attention deficit hyperactivity disorder
identified by neuropsychological testing. International Journal of
Neuroscience, 115, 169-183. https://doi.org/10.1080/00207450590519058
Engle, R. W., Tuholski, S. W., Laughlin, J. E., & Conway, A. R. A. (1999). Working
memory, short-term memory and general fluid intelligence: A latent variable
approach. Journal of Experimental Psychology: General, 128, 309 – 331.
https://doi.org/10.1037//0096-3445.128.3.309

74
Field, A. (2013). Discovering statistics using IBM SPSS Statistics (4th ed.). Washington,
D.C.: SAGE Publications Inc.
Fry, A. F., & Hale, S. (1996). Processing speed, working memory, and fluid intelligence:
Evidence for a developmental cascade. Psychological Science, 7(4), 237-241.
https://doi.org/10.1111/j.1467-9280.1996.tb00366.x
Gardner, H. (1983). Frames of Mind. New York: Basic Book Inc.
Golden, C. J., & Freshwater, S. M. (2002). The Stroop Color and Word Test: A
manual for clinical and experimental uses. Wood Dale, IL: Stoelting Co.
Goleman, D. (1995). Emotional Intelligence: Why it can matter more than IQ. New
York: Bantam Books.
Greenspan, S. & Driscoll, J. (1997). The role of intelligence in a broad model of personal
competence. In D. Flanagan, J. Genschaft, & P. Harrison (Eds.), Contemporary
intellectual assessment. NY: The Guilford Press.
Geurten, M., Vincent, E., Van der Linden, M., Coyette, F., & Meulemans, T.
(2016). Working memory assessment: Construct validity of the Brown-
Peterson Test. Canadian Journal of Behavioral Science / Revue
canadienne des sciences du comportement, 48(4), 328-
336. https://doi.org/10.1037/cbs0000057
Gronwall, D. M. A. (1977). Paced auditory serial-addition task: A measure of
recovery from concussion. Perceptual and Motor Skills, 44, 367–373.
https://doi.org/10.2466/pms.1977.44.2.367
75
Heaton, R. K. (1981). Wisconsin Card Sorting Test manual. Odessa, FL:
Psychological Assessment Resources.
Heaton, R. K., Chelune, G.J., Talley, J.L., Kay, G.G., & Curtiss, G. (1993).
Wisconsin Card Sorting Test (WCST) manual, revised and expanded.
Odessa, FL: Psychological Assessment Resources.
Heaton, R. K., Miller, S. W., Taylor, M. J., & Grant, I. (2004). Revised
comprehensive norms for an expanded Halstead-Reitan battery:
Demographically adjusted neuropsychological norms for African
American and Caucasian adults. Lutz, Fla.: Psychological Assessment
Resources.
Horn, J. & Noll, J. (1998). Human cognitive capabilities: Gf-Gc Theory. In D. Flanagan,
J. Genschaft, & P. Harrison (Eds.), Contemporary intellectual assessment. NY:
The Guilford Press.
Hosmer, D. W., Lemeshow, S., & Sturdivant, R. X. (2013). Applied Logistic Regression.
Hoboken, NJ: John Wiley & Sons, Inc.
Kafer, K. L., & Hunter, M. (1997). On testing the face validity of
planning/problem-solving tasks in a normal population. Journal of the
International Neuropsychological Society, 3, 108-119.
Kail, R. (1986). Sources of age differences in speed of processing. Child
Development, 57(4), 969-987. https://doi.org/10.2307/1130372

76
Kail, R. (2000). Speed of information processing: Developmental change and links to
intelligence. Journal of School Psychology, 38(1), 51-61.
https://doi.org/10.1016/S0022-4405(99)00036-9
Kail, R., & Hall, L. K. (1994). Processing speed, naming speed, and reading.
Developmental Psychology, 30(6), 949-954. https://doi.org/10.1037/0012-
1649.30.6.949
Kail, R., & Salthouse, T. A. (1994). Processing speed as a mental capacity. Acta
Psychologica, 86(2-3), 199-225. https://doi.org/10.1016/0001-
6918(94)90003-5
Karr, J. E., Rau, H. K., Shofer, J. B., Hendrickson, R. C., Peskind, E. R., &
Pagulayan, K. F. (2019). Variables associated with subjective cognitive
change among Iraq and Afghanistan war Veterans with blast-related mild
traumatic brain injury. Journal of Clinical and Experimental
Neuropsychology, 41(7), 680-693.
https://doi.org/10.1080/13803395.2019.1611740
Kongs, S. K., Thompson, L. L., Iverson, G. L., & Heaton, R. K. (2000).
Wisconsin Card Sorting Test-64 Card Version. Lutz, FL: Psychological
Assessment Resources.
Lezak, M. D. (1995). Neuropsychological assessment (3rd ed.). New York:
Oxford University Press.
Lezak, M. D. (2004). Neuropsychological assessment. Oxford University Press, USA.

77
Lezak, M. D., Howieson, D. B., Bigler, E. D., & Tranel, D. (2012). Neuropsychological
assessment (5th ed.). New York: Oxford University Press.
Mahurin, R. K. & Cooke, N. (1996). Verbal series attention test: Clinical utility in
the assessment of dementia. The Clinical Neuropsychologist, 10(1), 43-53.
https://doi.org/10.1080/13854049608406662
McFall, R. M., & Treat, T. A. (1999). Quantifying the information value of
clinical assessments with signal detection theory. Annual Review
Psychology, 50, 215-41. http://doi.org/10.1146/annurev.psych.50.1.215
McGrew, K., & Flanagan, D. (1998). The intelligence test desk reference (ITDR): Gf-Gc
cross-battery assessment. Boston: Allyn & Bacon.
Merkley, T. L., Larson, M. J., Bigler, E. D., Good, D. A., & Perlstein, W. M.
(2013). Structural and functional changes of the cingulate gyrus following
traumatic brain injury: Relation to attention and executive skills. Journal
of the International Neuropsychological Society, 19, 899 – 910.
https://doi.org/10.1017/S135561771300074X
Mertens, V. B., Gagnon, M., Coulombe, D., & Messier, C. (2006). Exploratory
factor analysis of neuropsychological tests and their relationship to the
Brown-Peterson task. Archives of Clinical Neuropsychology, 21, 733-739.
https://doi.org/10.1016/j.acn.2006.08.005

78
Meyers, J. E., & Meyers, K. R. (1995). Rey Complex Figure Test and Recognition
Trial: Professional manual. Odessa, Fla.: Psychological Assessment
Resources, Inc.
Mitrushina, M., Boone, K.B., Razani, J., & D’Elia, L.F. (2005). Handbook of
normative data for neuropsychological assessment: Second edition. New
York, New York: Oxford University Press, Inc.
Miyake, A., Friedman, N. P., Emerson, M. J., Witzki, A. H., & Howerter, A.
(2000). The unity and diversity of executive functions and their
contributions to complex "frontal lobe" tasks: A latent variable analysis.
Cognitive Psychology, 41, 49-100. https://doi.org/10.1006/cogp.1999.0734
Miyake, A., & Shah, P. (1999). Models of working memory: mechanisms of
active maintenance and executive control. New York: Cambridge
University Press.
Oral, E., Canpolat, S., Yildirim, S., Gulec, M., Aliyev, E., & Aydin, N. (2012).
Cognitive functions and serum levels of brain-derived neurotrophic factor
in patients with major depressive disorder. Brain Research Bulletin, 88,
454–459. https://doi.org/10.1016/j.brainresbull.2012.03.005
Ozakbas, S., Ormeci, B., Akdede, B. K., Alptekin, K., & Idiman, E. (2004).
Utilization of the auditory consonant trigram test to screen for cognitive
impairment in patients with multiple sclerosis: Comparison with the paced
auditory serial addition test. Multiple Sclerosis, 10, 686-689.
https://doi.org/10.1191/1352458504ms1111oa

79
Pagulayan, K. F., Petrie, E. C., Cook, D. G., Hendrickson, R. C., Rau, H., Reilly,
M., Mayer, C., Meabon, J. S., Raskind, M. A., Peskind, E. R., &
Kleinhans, N. (2018). Effect of blast-related mTBI on the working
memory system: A resting state fMRI study. Brain Imaging and Behavior.
https://doi.org/10.1007/s11682-018-9987-9
Peterson, L. R., & Peterson, M. J. (1959). Short-term retention of individual
verbal items. Journal of Experimental Psychology, 58, 193–198.
https://doi.org/10.1037/h0049234
Rabin, L. A., Barr, W. B., & Burton, L. A. (2005). Assessment practices of
clinical neuropsychologists in the United States and Canada: A survey of
INS, NAN, and APA Division 40 members. Archives of Clinical
Neuropsychology, 20(1), 33-65. https://doi.org/10.1016/j.acn.2004.02.005
Regard, M. (1981). Stroop Test—Victoria version. Victoria, BC, Canada:
University of Victoria, Neuropsychological Laboratory.
Reitan, R. M., & Wolfson, D. (1985). The Halstead-Reitan neuropsychological
test battery: Theory and clinical interpretation. Tuscon, AZ:
Neuropsychology Press.
Sandford, J. A., & Turner, A. (2004a). IVA+PlusTM: Integrated Visual and
Auditory Continuous Performance Test administration manual.
Richmond, VA: Brain Train, Inc.

80
Sandford, J. A., & Turner, A. (2004b). IVA+PlusTM: Integrated Visual and
Auditory Continuous Performance Test interpretation manual. Richmond,
VA: Brain Train, Inc.
Shallice, T. (1990). From neuropsychology to mental structure. New York:
Cambridge University Press.
Shura, R. D., Rowland, J., & Miskey, H. M. (2016). Auditory Consonant
Trigrams: A psychometric update. Archives of Clinical Neuropsychology,
31, 47-57. https://doi.org/10.1093/arclin/acv083
Sternberg, R. (1997). The concept of intelligence and its role in lifelong learning and
success. American Psychologist, 52 (10), 1030-1037.
https://doi.org/10.1037/0003-066X.52.10.1030
Stevens, K. B., & Price, J. R. (1999). Adult reading assessment: Are we doing the
best with what we have? Applied Neuropsychology, 6(2), 68-78.
Strauss, E., Sherman, E. M., & Spreen, O. (2006). A compendium of
neuropsychological tests: Administration, norms, and commentary. New
York, NY: Oxford University Press.
Stuss, D. T., Stethem, L. L., Hugenholtz, H., & Richard, M. T. (1989). Traumatic
brain injury: A comparison of three clinical tests, and analysis of recovery.
Clinical Neuropsychologist, 3(2), 145-156.
https://doi.org/10.1080/13854048908403287

81
Stuss, D. T., Stethem, L. L., & Pelchat, G. (1988). Three tests of attention and
rapid information processing: An extension. Clinical Neuropsychologist,
2(3), 246-250. https://doi.org/10.1080/13854048808520107
Stuss, D. T., Stethem, L. L., & Poirier, C. A. (1987). Comparison of three tests of
attention and rapid information processing across six age groups. Clinical
Neuropsychologist, 1, 139–152. https://doi.org/10.1080/
13854048708520046
Tabachnick, B. G., & Fidell, L. S. (2013). Using multivariate statistics (5th ed.).
New York: Allyn and Bacon.
Tabachnick, B. G., & Fidell, L. S. (2007). Using multivariate statistics (6th ed.).
New York: Pearson Education, Inc.
The Psychological Corporation. (2001). Wechsler Test of Adult Reading: Manual.
San Antonio, TX: Author.
Vandierendonck, A. (2016). A working memory system with distributed
executive control. Perspectives on Psychological Science, 11(1), 74-100.
https://doi.org/10.1177/1745691615596790
Wechsler, D. (1975). Intelligence defined and undefined: A relativistic appraisal.
American Psychologist, 30(2), 135-139. https://doi.org/10.1037/h0076868
Wechsler, D. (1944). The measurement of adult intelligence (3rd ed.). Baltimore:
Williams and Wilkins.
Wechsler, D. (1997a). Wechsler adult intelligence scale-III. New York:
Psychological Corporation.
82
Wechsler, D. (2008). Wechsler Adult Intelligence Scale-Fourth Edition:
Technical and Interpretive Manual. San Antonio, TX: NCS Pearson, Inc.
Wechsler, D. (1997b). Wechsler memory scale-III. New York: Psychological
Corporation.
Wilkinson, G. S., & Robertson, G. J. (2006). Wide Range Achievement Test 4:
Professional Manual.


