Download - Asian Dividend Strategy
See important disclosures, including any required research certifications, beginning on page 46
Pan Asia Strategy
5 July 2019
Asian Dividend Strategy
Seeking sustainable yield in REITs, utilities, staples and telecoms (RUST) during economic uncertainty
Sustainable yield is our preferred strategy in an economic downturn, focusing highly selectively on REITs, utilities, staples and telecoms
Select “bond-proxy” equities that are high-yield, with appropriate financials and managements willing to deliver dividends in downturns
Daiwa and alliance partners’ sector research identifies 16 sustainable yield ideas; Animal Spirits includes the top-6 in our Top Picks
Paul M. Kitney, PhD(852) 2848 4947

See important disclosures, including any required research certifications, beginning on page 46
Pan Asia Strategy
“Risk off” and cyclical risks call for a sustainable yield approach. As presented in Animal Spirits – Risk off with an emerging-ASEAN & India geographical bias and an emphasis on sustainable dividend yield, 2 July 2019, we are taking a defensive stance in APAC equities, based on expectations of a sharp slowdown in 2020 economic growth that we believe will start to be priced in during 2H19. We argue that disinflation witnessed in the past year will accelerate with this slowdown, and as explained in Animal Spirits – Sustainable yield preferred strategy during disinflation, 2 April 2019, both theory and historical evidence support a sustainable yield approach to stock picking during such times. In this report, we apply the sustainable yield dividend strategy to the so-called RUST group – REITs, utilities, (consumer) staples and telecoms – in Asia ex-Japan. Sustainable yield strategy in the RUST group. We define a sustainable dividend yield strategy as one that focuses on a high current dividend yield that is likely to be maintained or increased during an economic downturn. We focus on the RUST group, but believe a blanket approach to yield among defensives is unwise due to risks related to overvaluation, refinancing risk during credit shocks, heavy capex burdens (eg, 5G), and regulation. Selectivity is therefore critical. Thus, in addition to yield, we apply certain financial metrics such as minimum free cash flow yield, maximum financial leverage, short-term debt mix, and changing capex requirements. While the ability to sustain dividends during an economic downturn is one thing, managements’ willingness to do so is another. Here, we look at managements’ capital management policies and historical track records. Animal Spirits sets a minimum requirement for sector analyst input, leaving plenty of room for sector experts to apply their own methodology, which is shown explicitly. Selecting Animal Spirits Top Picks working with our sector research. From the 16 names presented by Daiwa and our ASEAN alliance partners’ sector research, we have identified 6 names that Animal Spirits particularly likes, which are included in the Animal Spirits Top Picks list. These are: Sunlight REIT (435 HK, HKD6.01, Outperform [2]), CapitaLand Mall Trust (CT SP, SGD2.63, Outperform [2]), Digital Telecom Infrastructure Fund (DIF TB, THB17, BUY), Power Assets (6 HK, HKD57.4, Hold [3]), Guangdong Investment (270 HK, HKD15.82, Outperform [2]), and China Telecom (728 HK, HKD3.94, Buy [1]).
5 July 2019
Asian Dividend Strategy
Seeking sustainable yield in REITs, utilities, staples and telecoms (RUST) during economic uncertainty
Sustainable yield is our preferred strategy in an economic downturn, focusing highly selectively on REITs, utilities, staples and telecoms
Select “bond-proxy” equities that are high-yield, with appropriate financials and managements willing to deliver dividends in downturns
Daiwa and alliance partners’ sector research identifies 16 sustainable yield ideas; Animal Spirits includes the top-6 in our Top Picks
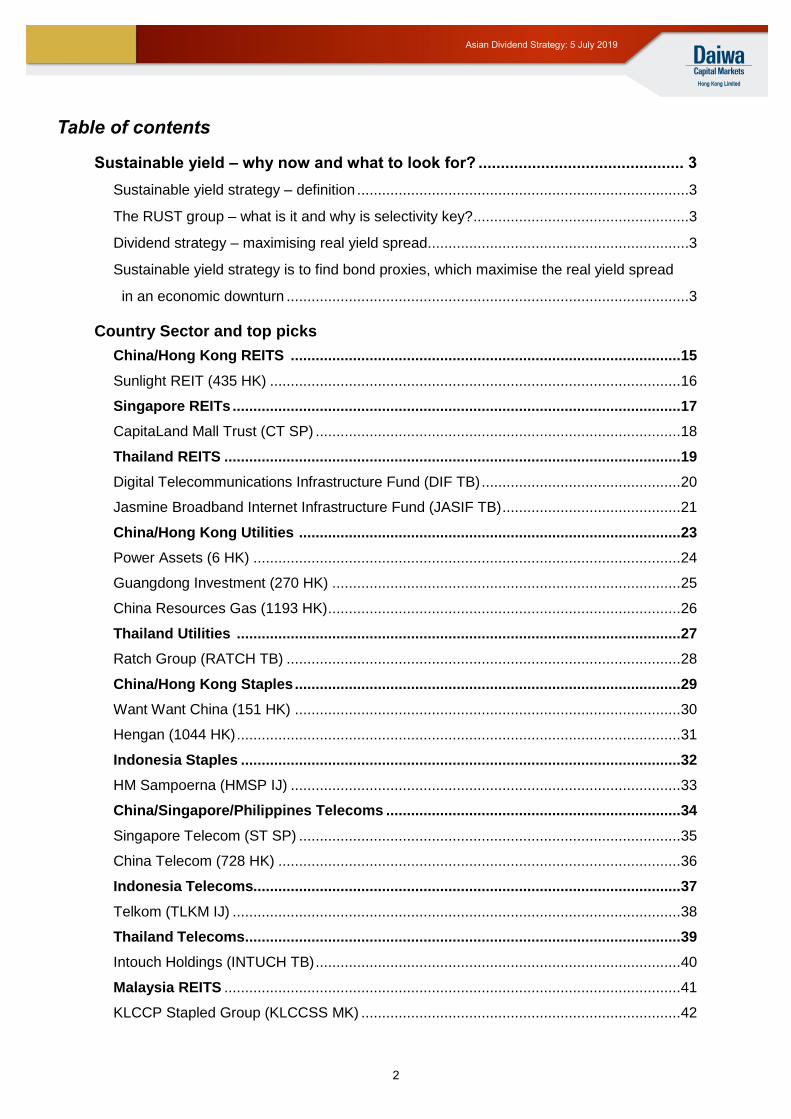
Animal Spirits Top PicksCompany Ticker AIA Group 1299 HK Shenzhou International 2313 HK China Telecom 728 HK Guangdong Investment 270 HK China Mengniu Dairy 2319 HK Wharf REIC 1997 HK Sunlight REIT 435 HK Power Assets 6 HK KT&G Corp 033780 KS Havells India HAVL IN Axis Bank AXSB IN Larsen & Toubro LT IN CapitaLand Mall Trust CT SP Amata Corporation AMATA TB Digital Telecom Infrastructure Fund DIF TB Sino-Thai E&C STEC TB Bank Rakyat Indonesia BBRI IJ Ayala Land ALI PM Airports Corp of Vietnam ACV VN NTT Docomo 9437 JP
Source: Daiwa
Paul M. Kitney, PhD(852) 2848 4947
2
Asian Dividend Strategy: 5 July 2019
Table of contents
Sustainable yield – why now and what to look for? .............................................. 3
Sustainable yield strategy – definition ................................................................................3
The RUST group – what is it and why is selectivity key? ....................................................3
Dividend strategy – maximising real yield spread ...............................................................3
Sustainable yield strategy is to find bond proxies, which maximise the real yield spread
in an economic downturn .................................................................................................3
Country Sector and top picks
China/Hong Kong REITS .............................................................................................. 15
Sunlight REIT (435 HK) ................................................................................................... 16
Singapore REITs ............................................................................................................ 17
CapitaLand Mall Trust (CT SP) ........................................................................................ 18
Thailand REITS .............................................................................................................. 19
Digital Telecommunications Infrastructure Fund (DIF TB) ................................................ 20
Jasmine Broadband Internet Infrastructure Fund (JASIF TB) ........................................... 21
China/Hong Kong Utilities ............................................................................................ 23
Power Assets (6 HK) ....................................................................................................... 24
Guangdong Investment (270 HK) .................................................................................... 25
China Resources Gas (1193 HK) ..................................................................................... 26
Thailand Utilities ........................................................................................................... 27
Ratch Group (RATCH TB) ............................................................................................... 28
China/Hong Kong Staples ............................................................................................. 29
Want Want China (151 HK) ............................................................................................. 30
Hengan (1044 HK) ........................................................................................................... 31
Indonesia Staples .......................................................................................................... 32
HM Sampoerna (HMSP IJ) .............................................................................................. 33
China/Singapore/Philippines Telecoms ....................................................................... 34
Singapore Telecom (ST SP) ............................................................................................ 35
China Telecom (728 HK) ................................................................................................. 36
Indonesia Telecoms....................................................................................................... 37
Telkom (TLKM IJ) ............................................................................................................ 38
Thailand Telecoms ......................................................................................................... 39
Intouch Holdings (INTUCH TB) ........................................................................................ 40
Malaysia REITS .............................................................................................................. 41
KLCCP Stapled Group (KLCCSS MK) ............................................................................. 42
3
Asian Dividend Strategy: 5 July 2019
Sustainable yield – why now and what to look for?
Sustainable yield strategy – definition
We define a sustainable dividend yield strategy as one that focuses on high current
dividend yield, which is likely to be maintained or increased during an economic downturn.
What factors do we consider important in evaluating the sustainability of dividend yield?
Broadly, these reflect considerations of both a firm’s ability and managements’ willingness
to pay out dividends in a sustained fashion, under various operating conditions.
The RUST group – what is it and why is selectivity key?
RUST is an acronym for REITs, utilities, (consumer) staples and telecom sector equities.
These are considered traditionally “defensive” industries, as demand is inelastic or not as
cyclically sensitive as many other sectors. However, we caution against a blanket
approach to the so-called RUST group, without consideration of various issues that may
preclude some RUST stocks from behaving defensively, when required – namely, during
an economic downturn or a bear market. One consideration is valuation. For example, in
Asia, Animal Spirits would argue that many consumer staples equities listed in China and
India are overvalued. In a downturn, quality factors such as balance sheet strength are
important to determine dividend sustainability as credit shocks expose levered companies.
Other risks such as regulation of utility tariffs in Korea, for example, may preclude some
equities as sustainable yield plays. 5G-related capex in the telecom sector may put free
cash flow at risk in some cases. These factors may constrain certain RUST names being
able to sustain dividends through the cycle or may prevent them behaving defensively.
Dividend strategy – maximising real yield spread
We outlined in Animal Spirits – Sustainable yield preferred strategy during disinflation, 2
April 2019, our preferred valuation metric – the real yield spread. Equity income is
preferred to fixed income when the real yield spread = nominal dividend yield – nominal
bond yield – inflation rate, is sufficiently positive. In our opinion, a sound equity income
strategy is one that chooses equities that maximises the real yield spread during any
macro conditions. During reflationary periods such as 1H18, when inflation and bond yields
were rising, the real yield spread was positive primarily for companies that were growing
their dividends sufficiently fast. That is why, during 1H18, Animal Spirits advocated a
dividend growth approach to stock picking, utilising the real yield spread approach under a
reflationary regime. Indeed, dividend growth stocks considerably outperformed high
dividend yield stocks during that period. We demonstrated this in Animal Spirits –
Sustainable yield preferred strategy during disinflation, 2 April 2019.
Sustainable yield strategy is to find bond proxies, which maximise the real yield spread in an economic downturn
In contrast, during a disinflationary paradigm – when inflation rates are falling, such as the
present day – high dividend growth stocks do not maximise real excess yield. During
disinflation, not only are inflation rates falling but so are bond yields. We are witnessing this
now. The US 10-year bond yield peaked at c.3.2% in 2018, but is now around 2%. To
maximise the real yield spread (throughout the disinflationary paradigm, which could last
years, in our view) under disinflation, we need to select high current yield stocks, where
yields are likely to be maintained during the economic down cycle that is often concomitant
with disinflation. In other words, we are seeking “bond proxies” during disinflation. We
won’t rehash our macro outlook here (see Risk off, 2 July; China-A downgrade, 1 July,
Korea Strategy – Strong headwinds, 10 June; ASEAN strategy – Cyclical Hideouts, 3
May), but our long-held roadmap calls for a sharp economic downturn, particularly
pronounced from 2H20. In our view, this will likely go hand in hand with a prolonged period
of disinflation, which motivates our sustainable yield dividend strategy.
A blanket approach to
yield among defensives
is unwise due to risks
related to overvaluation,
refinancing risk during
credit shocks, heavy
capex burdens (eg, 5G),
and regulation
In disinflation, which is
likely to persist for a
year or longer, “bond
proxies” are preferred,
which are high yield
equities able to at least
sustain their dividends
during a down cycle
4
Asian Dividend Strategy: 5 July 2019
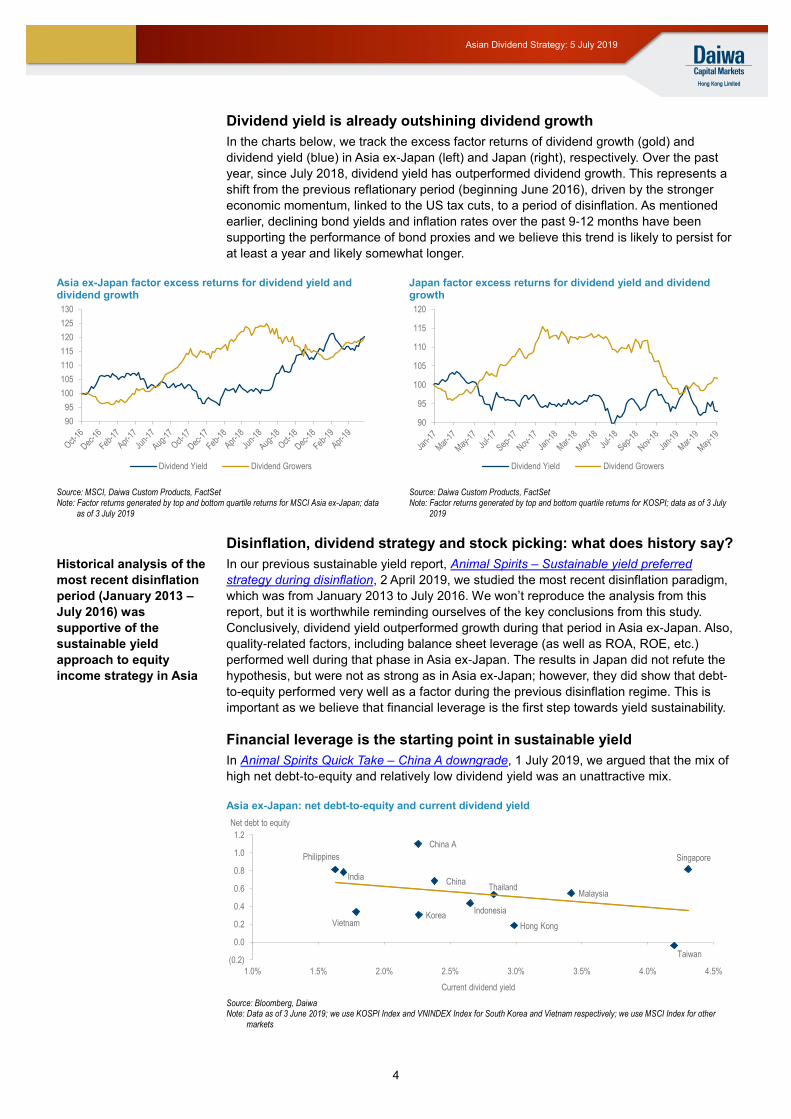
Dividend yield is already outshining dividend growth
In the charts below, we track the excess factor returns of dividend growth (gold) and
dividend yield (blue) in Asia ex-Japan (left) and Japan (right), respectively. Over the past
year, since July 2018, dividend yield has outperformed dividend growth. This represents a
shift from the previous reflationary period (beginning June 2016), driven by the stronger
economic momentum, linked to the US tax cuts, to a period of disinflation. As mentioned
earlier, declining bond yields and inflation rates over the past 9-12 months have been
supporting the performance of bond proxies and we believe this trend is likely to persist for
at least a year and likely somewhat longer.
Asia ex-Japan factor excess returns for dividend yield and dividend growth
Japan factor excess returns for dividend yield and dividend growth
Source: MSCI, Daiwa Custom Products, FactSet Note: Factor returns generated by top and bottom quartile returns for MSCI Asia ex-Japan; data
as of 3 July 2019
Source: Daiwa Custom Products, FactSet Note: Factor returns generated by top and bottom quartile returns for KOSPI; data as of 3 July
2019
Disinflation, dividend strategy and stock picking: what does history say?
In our previous sustainable yield report, Animal Spirits – Sustainable yield preferred
strategy during disinflation, 2 April 2019, we studied the most recent disinflation paradigm,
which was from January 2013 to July 2016. We won’t reproduce the analysis from this
report, but it is worthwhile reminding ourselves of the key conclusions from this study.
Conclusively, dividend yield outperformed growth during that period in Asia ex-Japan. Also,
quality-related factors, including balance sheet leverage (as well as ROA, ROE, etc.)
performed well during that phase in Asia ex-Japan. The results in Japan did not refute the
hypothesis, but were not as strong as in Asia ex-Japan; however, they did show that debt-
to-equity performed very well as a factor during the previous disinflation regime. This is
important as we believe that financial leverage is the first step towards yield sustainability.
Financial leverage is the starting point in sustainable yield
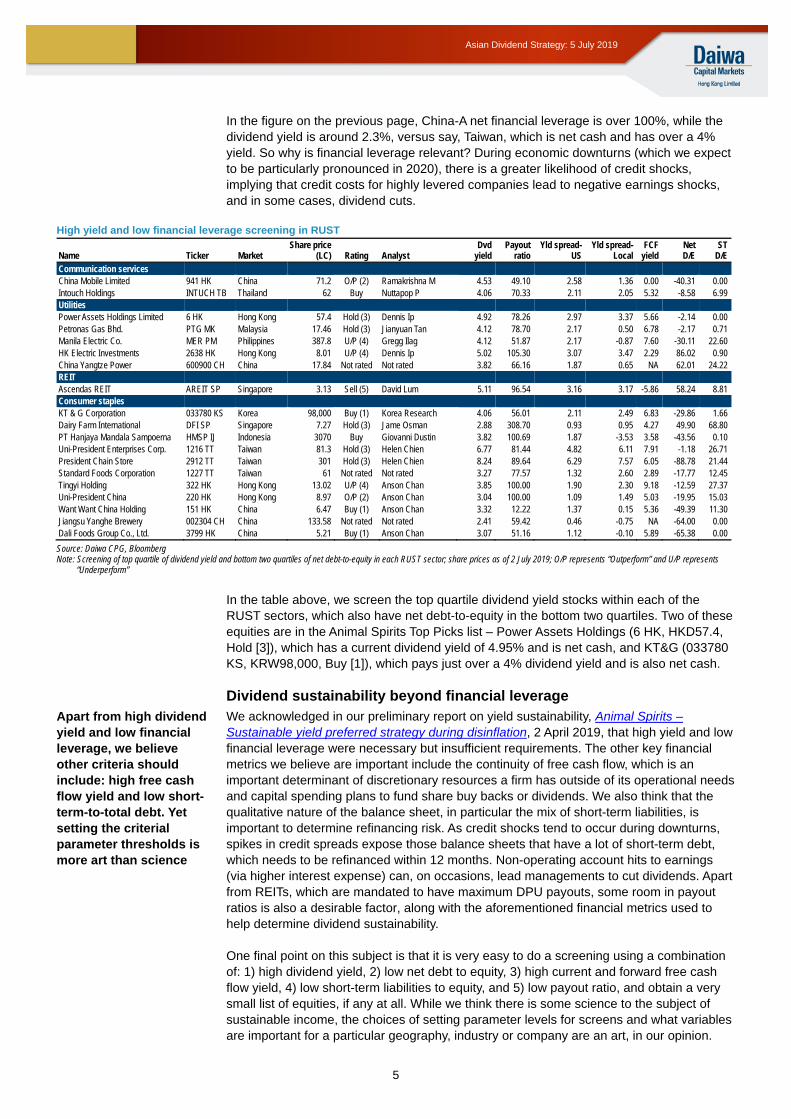
In Animal Spirits Quick Take – China A downgrade, 1 July 2019, we argued that the mix of
high net debt-to-equity and relatively low dividend yield was an unattractive mix.
Asia ex-Japan: net debt-to-equity and current dividend yield
Source: Bloomberg, Daiwa Note: Data as of 3 June 2019; we use KOSPI Index and VNINDEX Index for South Korea and Vietnam respectively; we use MSCI Index for other
markets
90
95
100
105
110
115
120
125
130
Dividend Yield Dividend Growers
90
95
100
105
110
115
120
Dividend Yield Dividend Growers
China
China A
Hong Kong
Taiwan
Korea
Philippines Singapore
MalaysiaThailand
India
Indonesia
Vietnam
(0.2)
0.0
0.2
0.4
0.6
0.8
1.0
1.2
1.0% 1.5% 2.0% 2.5% 3.0% 3.5% 4.0% 4.5%
Net debt to equity
Current dividend yield
Historical analysis of the
most recent disinflation
period (January 2013 –
July 2016) was
supportive of the
sustainable yield
approach to equity
income strategy in Asia
5
Asian Dividend Strategy: 5 July 2019
In the figure on the previous page, China-A net financial leverage is over 100%, while the dividend yield is around 2.3%, versus say, Taiwan, which is net cash and has over a 4% yield. So why is financial leverage relevant? During economic downturns (which we expect to be particularly pronounced in 2020), there is a greater likelihood of credit shocks, implying that credit costs for highly levered companies lead to negative earnings shocks, and in some cases, dividend cuts.
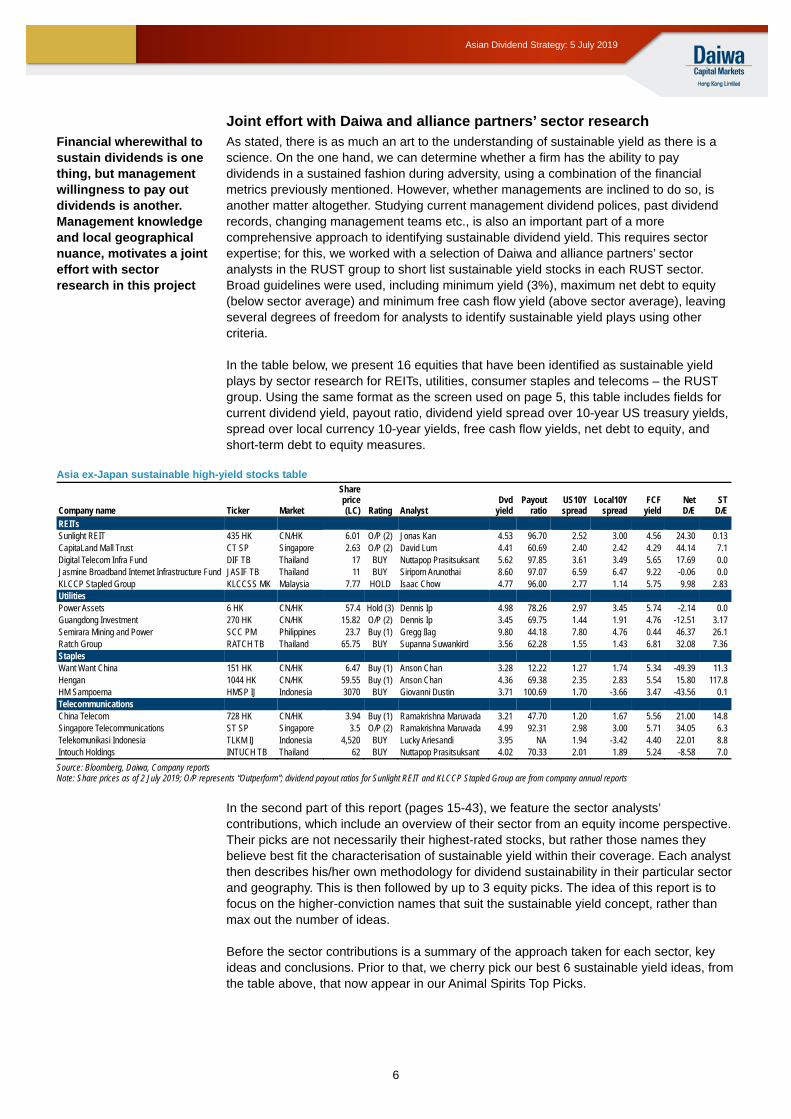
High yield and low financial leverage screening in RUST
Name Ticker Market Share price
(LC) Rating Analyst Dvd
yield Payout
ratio Yld spread-
US Yld spread-
Local FCF
yield Net D/E
ST D/E
Communication services China Mobile Limited 941 HK China 71.2 O/P (2) Ramakrishna M 4.53 49.10 2.58 1.36 0.00 -40.31 0.00 Intouch Holdings INTUCH TB Thailand 62 Buy Nuttapop P 4.06 70.33 2.11 2.05 5.32 -8.58 6.99 Utilities Power Assets Holdings Limited 6 HK Hong Kong 57.4 Hold (3) Dennis Ip 4.92 78.26 2.97 3.37 5.66 -2.14 0.00 Petronas Gas Bhd. PTG MK Malaysia 17.46 Hold (3) Jianyuan Tan 4.12 78.70 2.17 0.50 6.78 -2.17 0.71 Manila Electric Co. MER PM Philippines 387.8 U/P (4) Gregg Ilag 4.12 51.87 2.17 -0.87 7.60 -30.11 22.60 HK Electric Investments 2638 HK Hong Kong 8.01 U/P (4) Dennis Ip 5.02 105.30 3.07 3.47 2.29 86.02 0.90 China Yangtze Power 600900 CH China 17.84 Not rated Not rated 3.82 66.16 1.87 0.65 NA 62.01 24.22 REIT Ascendas REIT AREIT SP Singapore 3.13 Sell (5) David Lum 5.11 96.54 3.16 3.17 -5.86 58.24 8.81 Consumer staples KT & G Corporation 033780 KS Korea 98,000 Buy (1) Korea Research 4.06 56.01 2.11 2.49 6.83 -29.86 1.66 Dairy Farm International DFI SP Singapore 7.27 Hold (3) Jame Osman 2.88 308.70 0.93 0.95 4.27 49.90 68.80 PT Hanjaya Mandala Sampoerna HMSP IJ Indonesia 3070 Buy Giovanni Dustin 3.82 100.69 1.87 -3.53 3.58 -43.56 0.10 Uni-President Enterprises Corp. 1216 TT Taiwan 81.3 Hold (3) Helen Chien 6.77 81.44 4.82 6.11 7.91 -1.18 26.71 President Chain Store 2912 TT Taiwan 301 Hold (3) Helen Chien 8.24 89.64 6.29 7.57 6.05 -88.78 21.44 Standard Foods Corporation 1227 TT Taiwan 61 Not rated Not rated 3.27 77.57 1.32 2.60 2.89 -17.77 12.45 Tingyi Holding 322 HK Hong Kong 13.02 U/P (4) Anson Chan 3.85 100.00 1.90 2.30 9.18 -12.59 27.37 Uni-President China 220 HK Hong Kong 8.97 O/P (2) Anson Chan 3.04 100.00 1.09 1.49 5.03 -19.95 15.03 Want Want China Holding 151 HK China 6.47 Buy (1) Anson Chan 3.32 12.22 1.37 0.15 5.36 -49.39 11.30 Jiangsu Yanghe Brewery 002304 CH China 133.58 Not rated Not rated 2.41 59.42 0.46 -0.75 NA -64.00 0.00 Dali Foods Group Co., Ltd. 3799 HK China 5.21 Buy (1) Anson Chan 3.07 51.16 1.12 -0.10 5.89 -65.38 0.00
Source: Daiwa CPG, Bloomberg Note: Screening of top quartile of dividend yield and bottom two quartiles of net debt-to-equity in each RUST sector; share prices as of 2 July 2019; O/P represents “Outperform” and U/P represents
“Underperform”
In the table above, we screen the top quartile dividend yield stocks within each of the RUST sectors, which also have net debt-to-equity in the bottom two quartiles. Two of these equities are in the Animal Spirits Top Picks list – Power Assets Holdings (6 HK, HKD57.4, Hold [3]), which has a current dividend yield of 4.95% and is net cash, and KT&G (033780 KS, KRW98,000, Buy [1]), which pays just over a 4% dividend yield and is also net cash. Dividend sustainability beyond financial leverage We acknowledged in our preliminary report on yield sustainability, Animal Spirits – Sustainable yield preferred strategy during disinflation, 2 April 2019, that high yield and low financial leverage were necessary but insufficient requirements. The other key financial metrics we believe are important include the continuity of free cash flow, which is an important determinant of discretionary resources a firm has outside of its operational needs and capital spending plans to fund share buy backs or dividends. We also think that the qualitative nature of the balance sheet, in particular the mix of short-term liabilities, is important to determine refinancing risk. As credit shocks tend to occur during downturns, spikes in credit spreads expose those balance sheets that have a lot of short-term debt, which needs to be refinanced within 12 months. Non-operating account hits to earnings (via higher interest expense) can, on occasions, lead managements to cut dividends. Apart from REITs, which are mandated to have maximum DPU payouts, some room in payout ratios is also a desirable factor, along with the aforementioned financial metrics used to help determine dividend sustainability. One final point on this subject is that it is very easy to do a screening using a combination of: 1) high dividend yield, 2) low net debt to equity, 3) high current and forward free cash flow yield, 4) low short-term liabilities to equity, and 5) low payout ratio, and obtain a very small list of equities, if any at all. While we think there is some science to the subject of sustainable income, the choices of setting parameter levels for screens and what variables are important for a particular geography, industry or company are an art, in our opinion.
Apart from high dividend yield and low financial leverage, we believe other criteria should include: high free cash flow yield and low short-term-to-total debt. Yet setting the criterial parameter thresholds is more art than science
6
Asian Dividend Strategy: 5 July 2019
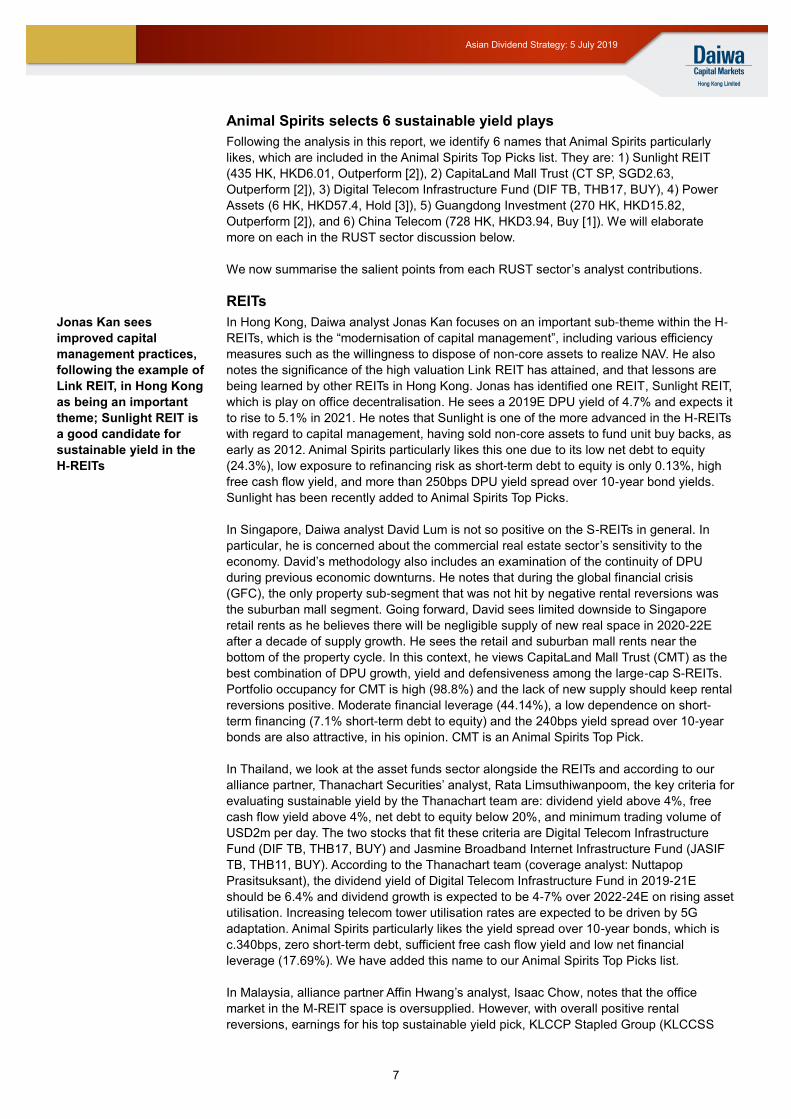
Joint effort with Daiwa and alliance partners’ sector research As stated, there is as much an art to the understanding of sustainable yield as there is a science. On the one hand, we can determine whether a firm has the ability to pay dividends in a sustained fashion during adversity, using a combination of the financial metrics previously mentioned. However, whether managements are inclined to do so, is another matter altogether. Studying current management dividend polices, past dividend records, changing management teams etc., is also an important part of a more comprehensive approach to identifying sustainable dividend yield. This requires sector expertise; for this, we worked with a selection of Daiwa and alliance partners’ sector analysts in the RUST group to short list sustainable yield stocks in each RUST sector. Broad guidelines were used, including minimum yield (3%), maximum net debt to equity (below sector average) and minimum free cash flow yield (above sector average), leaving several degrees of freedom for analysts to identify sustainable yield plays using other criteria. In the table below, we present 16 equities that have been identified as sustainable yield plays by sector research for REITs, utilities, consumer staples and telecoms – the RUST group. Using the same format as the screen used on page 5, this table includes fields for current dividend yield, payout ratio, dividend yield spread over 10-year US treasury yields, spread over local currency 10-year yields, free cash flow yields, net debt to equity, and short-term debt to equity measures.
Asia ex-Japan sustainable high-yield stocks table
Company name Ticker Market
Share price (LC) Rating Analyst
Dvd yield
Payout ratio
US10Y spread
Local10Y spread
FCF yield
Net D/E
ST D/E
REITs
Sunlight REIT 435 HK CN/HK 6.01 O/P (2) Jonas Kan 4.53 96.70 2.52 3.00 4.56 24.30 0.13 CapitaLand Mall Trust CT SP Singapore 2.63 O/P (2) David Lum 4.41 60.69 2.40 2.42 4.29 44.14 7.1 Digital Telecom Infra Fund DIF TB Thailand 17 BUY Nuttapop Prasitsuksant 5.62 97.85 3.61 3.49 5.65 17.69 0.0 Jasmine Broadband Internet Infrastructure Fund JASIF TB Thailand 11 BUY Siriporn Arunothai 8.60 97.07 6.59 6.47 9.22 -0.06 0.0 KLCCP Stapled Group KLCCSS MK Malaysia 7.77 HOLD Isaac Chow 4.77 96.00 2.77 1.14 5.75 9.98 2.83 Utilities
Power Assets 6 HK CN/HK 57.4 Hold (3) Dennis Ip 4.98 78.26 2.97 3.45 5.74 -2.14 0.0 Guangdong Investment 270 HK CN/HK 15.82 O/P (2) Dennis Ip 3.45 69.75 1.44 1.91 4.76 -12.51 3.17 Semirara Mining and Power SCC PM Philippines 23.7 Buy (1) Gregg Ilag 9.80 44.18 7.80 4.76 0.44 46.37 26.1 Ratch Group RATCH TB Thailand 65.75 BUY Supanna Suwankird 3.56 62.28 1.55 1.43 6.81 32.08 7.36 Staples
Want Want China 151 HK CN/HK 6.47 Buy (1) Anson Chan 3.28 12.22 1.27 1.74 5.34 -49.39 11.3 Hengan 1044 HK CN/HK 59.55 Buy (1) Anson Chan 4.36 69.38 2.35 2.83 5.54 15.80 117.8 HM Sampoerna HMSP IJ Indonesia 3070 BUY Giovanni Dustin 3.71 100.69 1.70 -3.66 3.47 -43.56 0.1 Telecommunications
China Telecom 728 HK CN/HK 3.94 Buy (1) Ramakrishna Maruvada 3.21 47.70 1.20 1.67 5.56 21.00 14.8 Singapore Telecommunications ST SP Singapore 3.5 O/P (2) Ramakrishna Maruvada 4.99 92.31 2.98 3.00 5.71 34.05 6.3 Telekomunikasi Indonesia TLKM IJ Indonesia 4,520 BUY Lucky Ariesandi 3.95 NA 1.94 -3.42 4.40 22.01 8.8 Intouch Holdings INTUCH TB Thailand 62 BUY Nuttapop Prasitsuksant 4.02 70.33 2.01 1.89 5.24 -8.58 7.0
Source: Bloomberg, Daiwa, Company reports Note: Share prices as of 2 July 2019; O/P represents “Outperform”; dividend payout ratios for Sunlight REIT and KLCCP Stapled Group are from company annual reports
In the second part of this report (pages 15-43), we feature the sector analysts’ contributions, which include an overview of their sector from an equity income perspective. Their picks are not necessarily their highest-rated stocks, but rather those names they believe best fit the characterisation of sustainable yield within their coverage. Each analyst then describes his/her own methodology for dividend sustainability in their particular sector and geography. This is then followed by up to 3 equity picks. The idea of this report is to focus on the higher-conviction names that suit the sustainable yield concept, rather than max out the number of ideas. Before the sector contributions is a summary of the approach taken for each sector, key ideas and conclusions. Prior to that, we cherry pick our best 6 sustainable yield ideas, from the table above, that now appear in our Animal Spirits Top Picks.
Financial wherewithal to sustain dividends is one thing, but management willingness to pay out dividends is another. Management knowledge and local geographical nuance, motivates a joint effort with sector research in this project
7
Asian Dividend Strategy: 5 July 2019
Animal Spirits selects 6 sustainable yield plays
Following the analysis in this report, we identify 6 names that Animal Spirits particularly
likes, which are included in the Animal Spirits Top Picks list. They are: 1) Sunlight REIT
(435 HK, HKD6.01, Outperform [2]), 2) CapitaLand Mall Trust (CT SP, SGD2.63,
Outperform [2]), 3) Digital Telecom Infrastructure Fund (DIF TB, THB17, BUY), 4) Power
Assets (6 HK, HKD57.4, Hold [3]), 5) Guangdong Investment (270 HK, HKD15.82,
Outperform [2]), and 6) China Telecom (728 HK, HKD3.94, Buy [1]). We will elaborate
more on each in the RUST sector discussion below.
We now summarise the salient points from each RUST sector’s analyst contributions.
REITs
In Hong Kong, Daiwa analyst Jonas Kan focuses on an important sub-theme within the H-
REITs, which is the “modernisation of capital management”, including various efficiency
measures such as the willingness to dispose of non-core assets to realize NAV. He also
notes the significance of the high valuation Link REIT has attained, and that lessons are
being learned by other REITs in Hong Kong. Jonas has identified one REIT, Sunlight REIT,
which is play on office decentralisation. He sees a 2019E DPU yield of 4.7% and expects it
to rise to 5.1% in 2021. He notes that Sunlight is one of the more advanced in the H-REITs
with regard to capital management, having sold non-core assets to fund unit buy backs, as
early as 2012. Animal Spirits particularly likes this one due to its low net debt to equity
(24.3%), low exposure to refinancing risk as short-term debt to equity is only 0.13%, high
free cash flow yield, and more than 250bps DPU yield spread over 10-year bond yields.
Sunlight has been recently added to Animal Spirits Top Picks.
In Singapore, Daiwa analyst David Lum is not so positive on the S-REITs in general. In
particular, he is concerned about the commercial real estate sector’s sensitivity to the
economy. David’s methodology also includes an examination of the continuity of DPU
during previous economic downturns. He notes that during the global financial crisis
(GFC), the only property sub-segment that was not hit by negative rental reversions was
the suburban mall segment. Going forward, David sees limited downside to Singapore
retail rents as he believes there will be negligible supply of new real space in 2020-22E
after a decade of supply growth. He sees the retail and suburban mall rents near the
bottom of the property cycle. In this context, he views CapitaLand Mall Trust (CMT) as the
best combination of DPU growth, yield and defensiveness among the large-cap S-REITs.
Portfolio occupancy for CMT is high (98.8%) and the lack of new supply should keep rental
reversions positive. Moderate financial leverage (44.14%), a low dependence on short-
term financing (7.1% short-term debt to equity) and the 240bps yield spread over 10-year
bonds are also attractive, in his opinion. CMT is an Animal Spirits Top Pick.
In Thailand, we look at the asset funds sector alongside the REITs and according to our
alliance partner, Thanachart Securities’ analyst, Rata Limsuthiwanpoom, the key criteria for
evaluating sustainable yield by the Thanachart team are: dividend yield above 4%, free
cash flow yield above 4%, net debt to equity below 20%, and minimum trading volume of
USD2m per day. The two stocks that fit these criteria are Digital Telecom Infrastructure
Fund (DIF TB, THB17, BUY) and Jasmine Broadband Internet Infrastructure Fund (JASIF
TB, THB11, BUY). According to the Thanachart team (coverage analyst: Nuttapop
Prasitsuksant), the dividend yield of Digital Telecom Infrastructure Fund in 2019-21E
should be 6.4% and dividend growth is expected to be 4-7% over 2022-24E on rising asset
utilisation. Increasing telecom tower utilisation rates are expected to be driven by 5G
adaptation. Animal Spirits particularly likes the yield spread over 10-year bonds, which is
c.340bps, zero short-term debt, sufficient free cash flow yield and low net financial
leverage (17.69%). We have added this name to our Animal Spirits Top Picks list.
In Malaysia, alliance partner Affin Hwang’s analyst, Isaac Chow, notes that the office
market in the M-REIT space is oversupplied. However, with overall positive rental
reversions, earnings for his top sustainable yield pick, KLCCP Stapled Group (KLCCSS
Jonas Kan sees
improved capital
management practices,
following the example of
Link REIT, in Hong Kong
as being an important
theme; Sunlight REIT is
a good candidate for
sustainable yield in the
H-REITs
8
Asian Dividend Strategy: 5 July 2019
MK), are defensive due to high occupancy for its flagship Suria KLCC Shopping Mall asset
(among other things) and low gearing, with net debt to equity at 9.98%.
We now switch to the topic of sustainable yield in the Utilities sector.
Utilities
In Hong Kong/China, Daiwa analyst Dennis Ip has a clear methodology for evaluating
sustainable yield including low beta (less than 0.35), a minimum threshold of a 3%
dividend yield, at least a 3.5% free cash flow yield, net short-term cash to equity, and a
track record of not having lowered its dividend per share since 2008. Based on Dennis’s
analysis, Power Assets (6 HK, HKD57.4, Hold [3]) meets these criteria. It has a 0.28 three-
year trailing beta; 5% dividend yield (2020); 5% free cash flow yield; 6% net short-term
cash to equity (based on Dennis’ model); and saw 3% average dividend per share growth
over 2008-18 without a yearly decline. Animal Spirits also likes this particular name, adding
that overall it is net cash and has a c.300bps yield spread over 10-year bonds, and is
included in the Animal Spirits Top Picks list. Similarly, we agree with Dennis’s assessment
of Guangdong Investment (270 HK, HKD15.82, Outperform [2]), as it meets his criteria and
is also included in our Top Picks.
In the Philippines, Daiwa analyst Gregg Ilag’s approach follows the broad Animal Spirits
guideline of a 3% minimum dividend yield and below-average financial leverage and
above-average free cash flow yield. In addition to these criteria, Greg also focuses on the
track record of maintaining dividends. In this context, he likes Semirara Mining and Power
Corp (SCC PM, PHP 23.7, Buy [1]). He notes the integration of coal mining and power
generation puts it in a strong competitive position to sustain cash flows in a downturn.
Based on his work, it has a 5.8% dividend yield, the free cash flow yield should be over 9%
for 2019-20E, and has steadily increased its dividend over the past 13 years, which
includes the GFC period.
In Thailand, alliance partner Thanachart analyst Supanna Suwankird has set specific
criteria: minimum dividend yield of 4%, at least a 2.3% free cash flow yield, maximum net
debt-to-equity of 80%; and no drop in dividend over the past 15 years. Supanna presents
one name that fits these criteria, Ratch group (RATCH TB, 65.75, BUY).
We now change the topic from dividend sustainability in the utilities sector to consumer
staples.
Staples
In Hong Kong/China, Daiwa analyst Anson Chan offers his insight on dividend
sustainability methodology. He believes that reduced capex needs, lower net gearing and
steady operating cash flow are the most important factors, but also considers a long-term
track record of maintaining dividends, in his evaluation. Anson likes Want Want China (151
HK, HKD6.47, Buy [1]) as a dividend sustainability candidate. It pays a dividend of just
over 4%, which is well within free cash flow yield of c.6%, which is supported by low capex
requirements. Anson also likes Hengan (1044 HK, HKD59.55, Buy [1]) as a sustainable
dividend yield play. He believes that capex needs will remain low, paving the way for
consistent free cash flow and dividend yields.
In Indonesia, Bahana Securities analyst Giovanni Dustin follows Animal Spirits broad
sustainable yield methodology and has selected HM Sampoerna (HMSP IJ, IDR 3070,
BUY) as a sustainable yield play. With the stock’s c.3% dividend yield, net cash and 4.5%
free cash flow yield, as well as low capital spending burden, Giovanni believes that
together with its price leadership and solid growth outlook, this is a good sustainable yield
candidate.
We shift now to the Telecoms sector.
Dennis Ip has a
methodical approach to
sustainable yield
including maximum
beta, minimum dividend
and free cash flow yield,
net short-term cash to
equity and a track record
of maintaining dividends
over 10 years
9
Asian Dividend Strategy: 5 July 2019
Telecoms
Daiwa’s China/Singapore/Philippines telecoms analyst, Rama Maruvada’s methodology for
evaluating sustainable yield has several components. First, he looks at the forward-looking
dividend yield over 2019-21E and screens for a minimum of 3%. Then over the same
period he requires a flat to positive DPU trend YoY. Then he reduces his universe to those
which have a net debt-EBITDA below 2.0x and dividend payout less than free cash flow.
Finally, he uses subjective measures of management track record and commitment to
sustain dividends, together with potential capex risks. Based on his approach, Rama likes
China Telecom (728 HK, HKD3.94, Buy [1]). Based on his model, the dividend yield in
2019E is 3.4%, growing to 4% in 2021E, net debt-to-EBITDA is 0.45x and dividends as a
percentage of free cash flow is 28%. Rama sees the prospects of 5G network-sharing as a
distinct possibility, which should help significantly in managing capex, but this is also the
risk, if 5G related capex surprises on the upside. Animal Spirits also likes the low financial
leverage, including low short-term debt mix, and includes China Telecom in the Animal
Spirits Top Picks. Rama also explains that Singapore Telecom (ST SP, SGD3.5,
Outperform [2]) fits his criteria and sees upside to the company’s dividend payout guidance
of 60-75%.
In Indonesia, Bahana Securities’ telecom analyst, Lucky Ariesandi, broadly follows the
Animal Spirits dividend sustainability criteria. He selects Telekomunikasi Indonesia (TLKM
IJ, IDR4,520, BUY). Based on his model, the 4% dividend yield and strong free cash flow
generation, with a free cash flow yield of 4.7%, are supportive of his positive sustainable
yield viewpoint. He notes that there are limited capex risks as network capacity is at c.50%
utilization. Animal Spirits does note that the yield spread with local government bonds is
negative (see table on page 6).
Finally, Nuttapop Prasitsuksant, Thanachart’s telecom analyst, sets out his sustainable
yield criteria as: minimum dividend yield of 3%; net debt-to-EBITDA less than 2x; greater
than 3% free cash flow yield; and 3 years’ positive earnings-growth outlook. Based on his
criteria, he picks Intouch Holdings (INTUCH TB, THB62, BUY).
This completes our summary of the sustainable yield ideas presented in this report. To
follow is a summary of Daiwa’s APAC market and sector views, together with a compilation
of our Animal Spirits Top Picks. Thereafter is a section including the detailed contributions
from Daiwa and alliance partner sector analysts.
Rama Maruvada likes
China Telecom. Based
on his model, the
dividend yield for 2019E
is 3.4%, growing to 4% in
2021E, net debt-to-
EBITDA is 0.45x and
dividends as a
percentage of free cash
flow is 28%. The risk is
an overshoot on 5G
capex but network
sharing is a good
chance. This is an
Animal Spirits Top Pick!
10
Asian Dividend Strategy: 5 July 2019
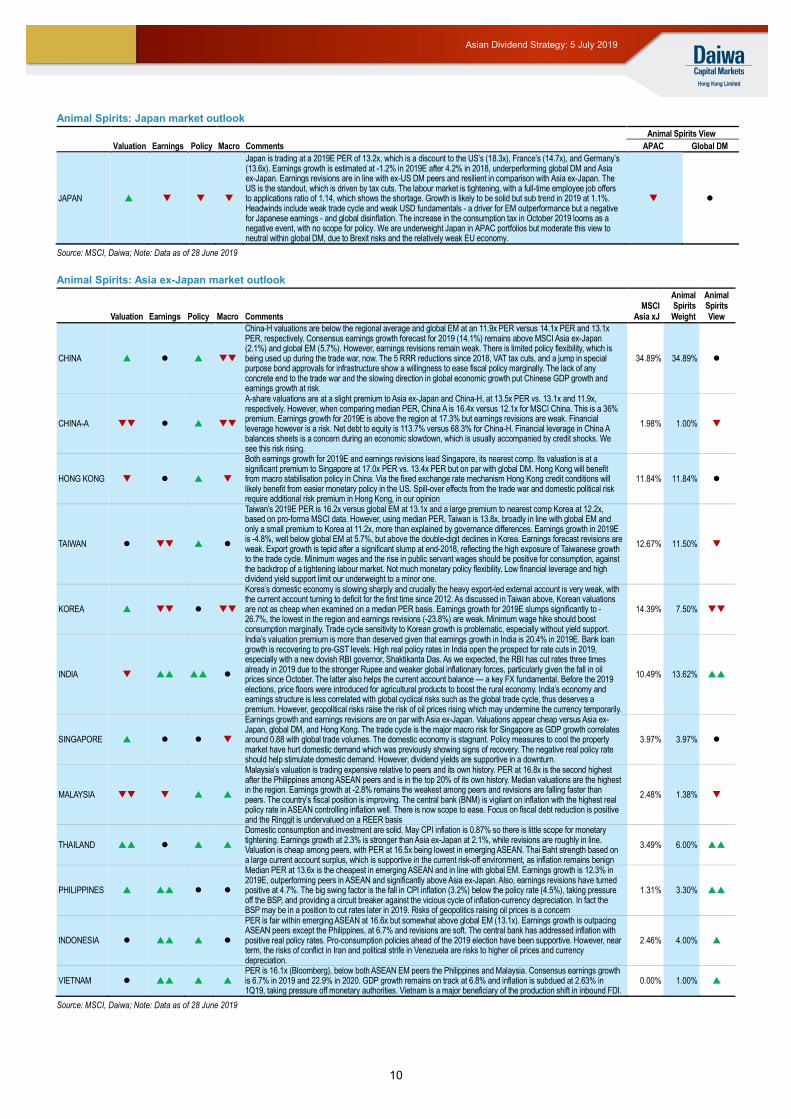
Animal Spirits: Japan market outlook
Valuation Earnings Policy Macro Comments
Animal Spirits View
APAC Global DM
JAPAN
Japan is trading at a 2019E PER of 13.2x, which is a discount to the US’s (18.3x), France’s (14.7x), and Germany’s (13.6x). Earnings growth is estimated at -1.2% in 2019E after 4.2% in 2018, underperforming global DM and Asia ex-Japan. Earnings revisions are in line with ex-US DM peers and resilient in comparison with Asia ex-Japan. The US is the standout, which is driven by tax cuts. The labour market is tightening, with a full-time employee job offers to applications ratio of 1.14, which shows the shortage. Growth is likely to be solid but sub trend in 2019 at 1.1%. Headwinds include weak trade cycle and weak USD fundamentals - a driver for EM outperformance but a negative for Japanese earnings - and global disinflation. The increase in the consumption tax in October 2019 looms as a negative event, with no scope for policy. We are underweight Japan in APAC portfolios but moderate this view to neutral within global DM, due to Brexit risks and the relatively weak EU economy.
Source: MSCI, Daiwa; Note: Data as of 28 June 2019
Animal Spirits: Asia ex-Japan market outlook
Valuation Earnings Policy Macro Comments MSCI
Asia xJ
Animal Spirits Weight
Animal Spirits View
CHINA
China-H valuations are below the regional average and global EM at an 11.9x PER versus 14.1x PER and 13.1x PER, respectively. Consensus earnings growth forecast for 2019 (14.1%) remains above MSCI Asia ex-Japan (2.1%) and global EM (5.7%). However, earnings revisions remain weak. There is limited policy flexibility, which is being used up during the trade war, now. The 5 RRR reductions since 2018, VAT tax cuts, and a jump in special purpose bond approvals for infrastructure show a willingness to ease fiscal policy marginally. The lack of any concrete end to the trade war and the slowing direction in global economic growth put Chinese GDP growth and earnings growth at risk.
34.89% 34.89%
CHINA-A
A-share valuations are at a slight premium to Asia ex-Japan and China-H, at 13.5x PER vs. 13.1x and 11.9x, respectively. However, when comparing median PER, China A is 16.4x versus 12.1x for MSCI China. This is a 36% premium. Earnings growth for 2019E is above the region at 17.3% but earnings revisions are weak. Financial leverage however is a risk. Net debt to equity is 113.7% versus 68.3% for China-H. Financial leverage in China A balances sheets is a concern during an economic slowdown, which is usually accompanied by credit shocks. We see this risk rising.
1.98% 1.00%
HONG KONG
Both earnings growth for 2019E and earnings revisions lead Singapore, its nearest comp. Its valuation is at a significant premium to Singapore at 17.0x PER vs. 13.4x PER but on par with global DM. Hong Kong will benefit from macro stabilisation policy in China. Via the fixed exchange rate mechanism Hong Kong credit conditions will likely benefit from easier monetary policy in the US. Spill-over effects from the trade war and domestic political risk require additional risk premium in Hong Kong, in our opinion
11.84% 11.84%
TAIWAN
Taiwan’s 2019E PER is 16.2x versus global EM at 13.1x and a large premium to nearest comp Korea at 12.2x, based on pro-forma MSCI data. However, using median PER, Taiwan is 13.8x, broadly in line with global EM and only a small premium to Korea at 11.2x, more than explained by governance differences. Earnings growth in 2019E is -4.8%, well below global EM at 5.7%, but above the double-digit declines in Korea. Earnings forecast revisions are weak. Export growth is tepid after a significant slump at end-2018, reflecting the high exposure of Taiwanese growth to the trade cycle. Minimum wages and the rise in public servant wages should be positive for consumption, against the backdrop of a tightening labour market. Not much monetary policy flexibility. Low financial leverage and high dividend yield support limit our underweight to a minor one.
12.67% 11.50%
KOREA
Korea’s domestic economy is slowing sharply and crucially the heavy export-led external account is very weak, with the current account turning to deficit for the first time since 2012. As discussed in Taiwan above, Korean valuations are not as cheap when examined on a median PER basis. Earnings growth for 2019E slumps significantly to -26.7%, the lowest in the region and earnings revisions (-23.8%) are weak. Minimum wage hike should boost consumption marginally. Trade cycle sensitivity to Korean growth is problematic, especially without yield support.
14.39% 7.50%
INDIA
India’s valuation premium is more than deserved given that earnings growth in India is 20.4% in 2019E. Bank loan growth is recovering to pre-GST levels. High real policy rates in India open the prospect for rate cuts in 2019, especially with a new dovish RBI governor, Shaktikanta Das. As we expected, the RBI has cut rates three times already in 2019 due to the stronger Rupee and weaker global inflationary forces, particularly given the fall in oil prices since October. The latter also helps the current account balance — a key FX fundamental. Before the 2019 elections, price floors were introduced for agricultural products to boost the rural economy. India’s economy and earnings structure is less correlated with global cyclical risks such as the global trade cycle, thus deserves a premium. However, geopolitical risks raise the risk of oil prices rising which may undermine the currency temporarily.
10.49% 13.62%
SINGAPORE
Earnings growth and earnings revisions are on par with Asia ex-Japan. Valuations appear cheap versus Asia ex-Japan, global DM, and Hong Kong. The trade cycle is the major macro risk for Singapore as GDP growth correlates around 0.88 with global trade volumes. The domestic economy is stagnant. Policy measures to cool the property market have hurt domestic demand which was previously showing signs of recovery. The negative real policy rate should help stimulate domestic demand. However, dividend yields are supportive in a downturn.
3.97% 3.97%
MALAYSIA
Malaysia’s valuation is trading expensive relative to peers and its own history. PER at 16.8x is the second highest after the Philippines among ASEAN peers and is in the top 20% of its own history. Median valuations are the highest in the region. Earnings growth at -2.8% remains the weakest among peers and revisions are falling faster than peers. The country’s fiscal position is improving. The central bank (BNM) is vigilant on inflation with the highest real policy rate in ASEAN controlling inflation well. There is now scope to ease. Focus on fiscal debt reduction is positive and the Ringgit is undervalued on a REER basis
2.48% 1.38%
THAILAND
Domestic consumption and investment are solid. May CPI inflation is 0.87% so there is little scope for monetary tightening. Earnings growth at 2.3% is stronger than Asia ex-Japan at 2.1%, while revisions are roughly in line. Valuation is cheap among peers, with PER at 16.5x being lowest in emerging ASEAN. Thai Baht strength based on a large current account surplus, which is supportive in the current risk-off environment, as inflation remains benign
3.49% 6.00%
PHILIPPINES
Median PER at 13.6x is the cheapest in emerging ASEAN and in line with global EM. Earnings growth is 12.3% in 2019E, outperforming peers in ASEAN and significantly above Asia ex-Japan. Also, earnings revisions have turned positive at 4.7%. The big swing factor is the fall in CPI inflation (3.2%) below the policy rate (4.5%), taking pressure off the BSP, and providing a circuit breaker against the vicious cycle of inflation-currency depreciation. In fact the BSP may be in a position to cut rates later in 2019. Risks of geopolitics raising oil prices is a concern
1.31% 3.30%
INDONESIA
PER is fair within emerging ASEAN at 16.6x but somewhat above global EM (13.1x). Earnings growth is outpacing ASEAN peers except the Philippines, at 6.7% and revisions are soft. The central bank has addressed inflation with positive real policy rates. Pro-consumption policies ahead of the 2019 election have been supportive. However, near term, the risks of conflict in Iran and political strife in Venezuela are risks to higher oil prices and currency depreciation.
2.46% 4.00%
VIETNAM
PER is 16.1x (Bloomberg), below both ASEAN EM peers the Philippines and Malaysia. Consensus earnings growth is 6.7% in 2019 and 22.9% in 2020. GDP growth remains on track at 6.8% and inflation is subdued at 2.63% in 1Q19, taking pressure off monetary authorities. Vietnam is a major beneficiary of the production shift in inbound FDI.
0.00% 1.00%
Source: MSCI, Daiwa; Note: Data as of 28 June 2019
11
Asian Dividend Strategy: 5 July 2019
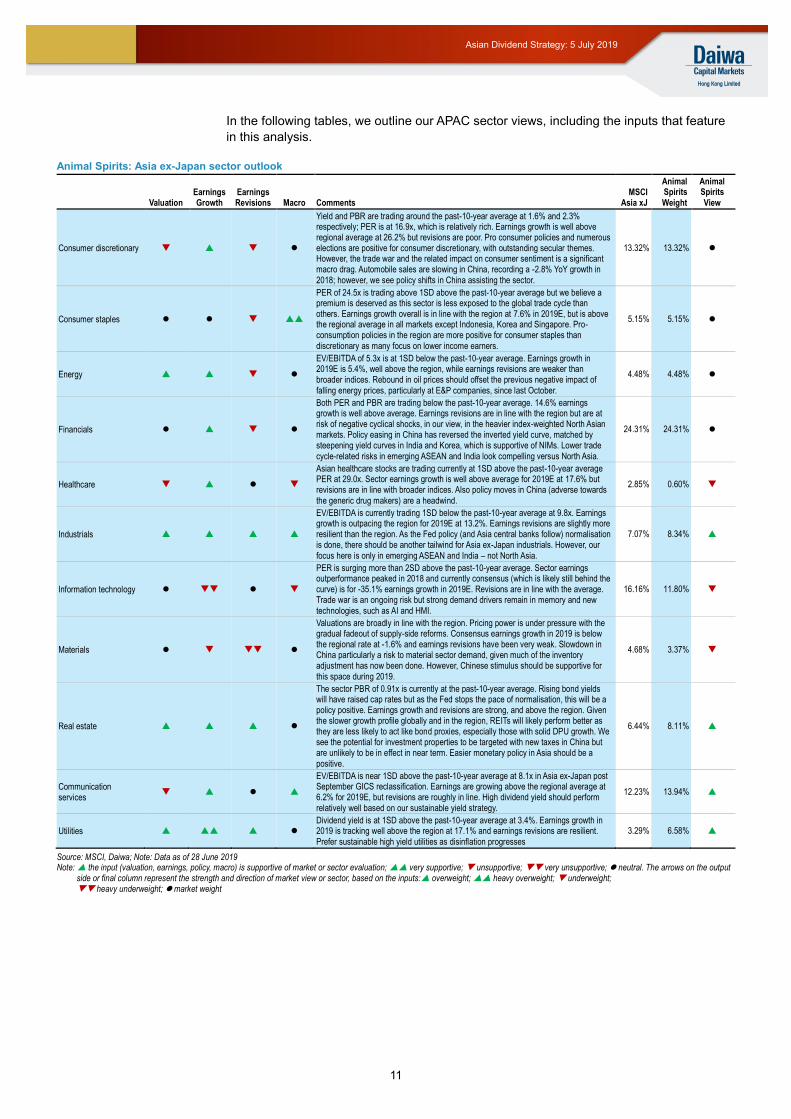
In the following tables, we outline our APAC sector views, including the inputs that feature
in this analysis.
Animal Spirits: Asia ex-Japan sector outlook
Valuation Earnings Growth
Earnings Revisions Macro Comments
MSCI Asia xJ
Animal Spirits Weight
Animal Spirits View
Consumer discretionary
Yield and PBR are trading around the past-10-year average at 1.6% and 2.3% respectively; PER is at 16.9x, which is relatively rich. Earnings growth is well above regional average at 26.2% but revisions are poor. Pro consumer policies and numerous elections are positive for consumer discretionary, with outstanding secular themes. However, the trade war and the related impact on consumer sentiment is a significant macro drag. Automobile sales are slowing in China, recording a -2.8% YoY growth in 2018; however, we see policy shifts in China assisting the sector.
13.32% 13.32%
Consumer staples
PER of 24.5x is trading above 1SD above the past-10-year average but we believe a premium is deserved as this sector is less exposed to the global trade cycle than others. Earnings growth overall is in line with the region at 7.6% in 2019E, but is above the regional average in all markets except Indonesia, Korea and Singapore. Pro-consumption policies in the region are more positive for consumer staples than discretionary as many focus on lower income earners.
5.15% 5.15%
Energy
EV/EBITDA of 5.3x is at 1SD below the past-10-year average. Earnings growth in 2019E is 5.4%, well above the region, while earnings revisions are weaker than broader indices. Rebound in oil prices should offset the previous negative impact of falling energy prices, particularly at E&P companies, since last October.
4.48% 4.48%
Financials
Both PER and PBR are trading below the past-10-year average. 14.6% earnings growth is well above average. Earnings revisions are in line with the region but are at risk of negative cyclical shocks, in our view, in the heavier index-weighted North Asian markets. Policy easing in China has reversed the inverted yield curve, matched by steepening yield curves in India and Korea, which is supportive of NIMs. Lower trade cycle-related risks in emerging ASEAN and India look compelling versus North Asia.
24.31% 24.31%
Healthcare
Asian healthcare stocks are trading currently at 1SD above the past-10-year average PER at 29.0x. Sector earnings growth is well above average for 2019E at 17.6% but revisions are in line with broader indices. Also policy moves in China (adverse towards the generic drug makers) are a headwind.
2.85% 0.60%
Industrials
EV/EBITDA is currently trading 1SD below the past-10-year average at 9.8x. Earnings growth is outpacing the region for 2019E at 13.2%. Earnings revisions are slightly more resilient than the region. As the Fed policy (and Asia central banks follow) normalisation is done, there should be another tailwind for Asia ex-Japan industrials. However, our focus here is only in emerging ASEAN and India – not North Asia.
7.07% 8.34%
Information technology
PER is surging more than 2SD above the past-10-year average. Sector earnings outperformance peaked in 2018 and currently consensus (which is likely still behind the curve) is for -35.1% earnings growth in 2019E. Revisions are in line with the average. Trade war is an ongoing risk but strong demand drivers remain in memory and new technologies, such as AI and HMI.
16.16% 11.80%
Materials
Valuations are broadly in line with the region. Pricing power is under pressure with the gradual fadeout of supply-side reforms. Consensus earnings growth in 2019 is below the regional rate at -1.6% and earnings revisions have been very weak. Slowdown in China particularly a risk to material sector demand, given much of the inventory adjustment has now been done. However, Chinese stimulus should be supportive for this space during 2019.
4.68% 3.37%
Real estate
The sector PBR of 0.91x is currently at the past-10-year average. Rising bond yields will have raised cap rates but as the Fed stops the pace of normalisation, this will be a policy positive. Earnings growth and revisions are strong, and above the region. Given the slower growth profile globally and in the region, REITs will likely perform better as they are less likely to act like bond proxies, especially those with solid DPU growth. We see the potential for investment properties to be targeted with new taxes in China but are unlikely to be in effect in near term. Easier monetary policy in Asia should be a positive.
6.44% 8.11%
Communication services
EV/EBITDA is near 1SD above the past-10-year average at 8.1x in Asia ex-Japan post September GICS reclassification. Earnings are growing above the regional average at 6.2% for 2019E, but revisions are roughly in line. High dividend yield should perform relatively well based on our sustainable yield strategy.
12.23% 13.94%
Utilities
Dividend yield is at 1SD above the past-10-year average at 3.4%. Earnings growth in 2019 is tracking well above the region at 17.1% and earnings revisions are resilient. Prefer sustainable high yield utilities as disinflation progresses
3.29% 6.58%
Source: MSCI, Daiwa; Note: Data as of 28 June 2019 Note: the input (valuation, earnings, policy, macro) is supportive of market or sector evaluation; very supportive; unsupportive; very unsupportive; neutral. The arrows on the output
side or final column represent the strength and direction of market view or sector, based on the inputs: overweight; heavy overweight; underweight; heavy underweight; market weight
12
Asian Dividend Strategy: 5 July 2019
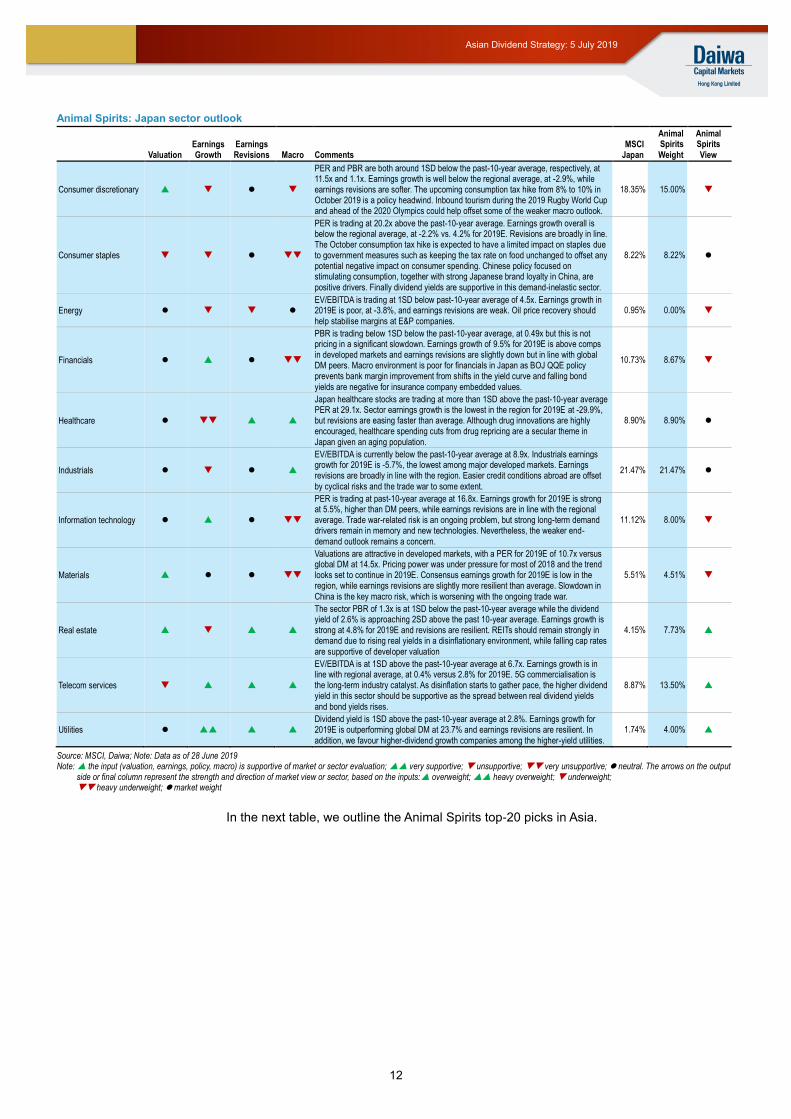
Animal Spirits: Japan sector outlook
Valuation Earnings Growth
Earnings Revisions Macro Comments
MSCI Japan
Animal Spirits Weight
Animal Spirits View
Consumer discretionary
PER and PBR are both around 1SD below the past-10-year average, respectively, at 11.5x and 1.1x. Earnings growth is well below the regional average, at -2.9%, while earnings revisions are softer. The upcoming consumption tax hike from 8% to 10% in October 2019 is a policy headwind. Inbound tourism during the 2019 Rugby World Cup and ahead of the 2020 Olympics could help offset some of the weaker macro outlook.
18.35% 15.00%
Consumer staples
PER is trading at 20.2x above the past-10-year average. Earnings growth overall is below the regional average, at -2.2% vs. 4.2% for 2019E. Revisions are broadly in line. The October consumption tax hike is expected to have a limited impact on staples due to government measures such as keeping the tax rate on food unchanged to offset any potential negative impact on consumer spending. Chinese policy focused on stimulating consumption, together with strong Japanese brand loyalty in China, are positive drivers. Finally dividend yields are supportive in this demand-inelastic sector.
8.22% 8.22%
Energy
EV/EBITDA is trading at 1SD below past-10-year average of 4.5x. Earnings growth in 2019E is poor, at -3.8%, and earnings revisions are weak. Oil price recovery should help stabilise margins at E&P companies.
0.95% 0.00%
Financials
PBR is trading below 1SD below the past-10-year average, at 0.49x but this is not pricing in a significant slowdown. Earnings growth of 9.5% for 2019E is above comps in developed markets and earnings revisions are slightly down but in line with global DM peers. Macro environment is poor for financials in Japan as BOJ QQE policy prevents bank margin improvement from shifts in the yield curve and falling bond yields are negative for insurance company embedded values.
10.73% 8.67%
Healthcare
Japan healthcare stocks are trading at more than 1SD above the past-10-year average PER at 29.1x. Sector earnings growth is the lowest in the region for 2019E at -29.9%, but revisions are easing faster than average. Although drug innovations are highly encouraged, healthcare spending cuts from drug repricing are a secular theme in Japan given an aging population.
8.90% 8.90%
Industrials
EV/EBITDA is currently below the past-10-year average at 8.9x. Industrials earnings growth for 2019E is -5.7%, the lowest among major developed markets. Earnings revisions are broadly in line with the region. Easier credit conditions abroad are offset by cyclical risks and the trade war to some extent.
21.47% 21.47%
Information technology
PER is trading at past-10-year average at 16.8x. Earnings growth for 2019E is strong at 5.5%, higher than DM peers, while earnings revisions are in line with the regional average. Trade war-related risk is an ongoing problem, but strong long-term demand drivers remain in memory and new technologies. Nevertheless, the weaker end-demand outlook remains a concern.
11.12% 8.00%
Materials
Valuations are attractive in developed markets, with a PER for 2019E of 10.7x versus global DM at 14.5x. Pricing power was under pressure for most of 2018 and the trend looks set to continue in 2019E. Consensus earnings growth for 2019E is low in the region, while earnings revisions are slightly more resilient than average. Slowdown in China is the key macro risk, which is worsening with the ongoing trade war.
5.51% 4.51%
Real estate
The sector PBR of 1.3x is at 1SD below the past-10-year average while the dividend yield of 2.6% is approaching 2SD above the past 10-year average. Earnings growth is strong at 4.8% for 2019E and revisions are resilient. REITs should remain strongly in demand due to rising real yields in a disinflationary environment, while falling cap rates are supportive of developer valuation
4.15% 7.73%
Telecom services
EV/EBITDA is at 1SD above the past-10-year average at 6.7x. Earnings growth is in line with regional average, at 0.4% versus 2.8% for 2019E. 5G commercialisation is the long-term industry catalyst. As disinflation starts to gather pace, the higher dividend yield in this sector should be supportive as the spread between real dividend yields and bond yields rises.
8.87% 13.50%
Utilities
Dividend yield is 1SD above the past-10-year average at 2.8%. Earnings growth for 2019E is outperforming global DM at 23.7% and earnings revisions are resilient. In addition, we favour higher-dividend growth companies among the higher-yield utilities.
1.74% 4.00%
Source: MSCI, Daiwa; Note: Data as of 28 June 2019 Note: the input (valuation, earnings, policy, macro) is supportive of market or sector evaluation; very supportive; unsupportive; very unsupportive; neutral. The arrows on the output
side or final column represent the strength and direction of market view or sector, based on the inputs: overweight; heavy overweight; underweight; heavy underweight; market weight
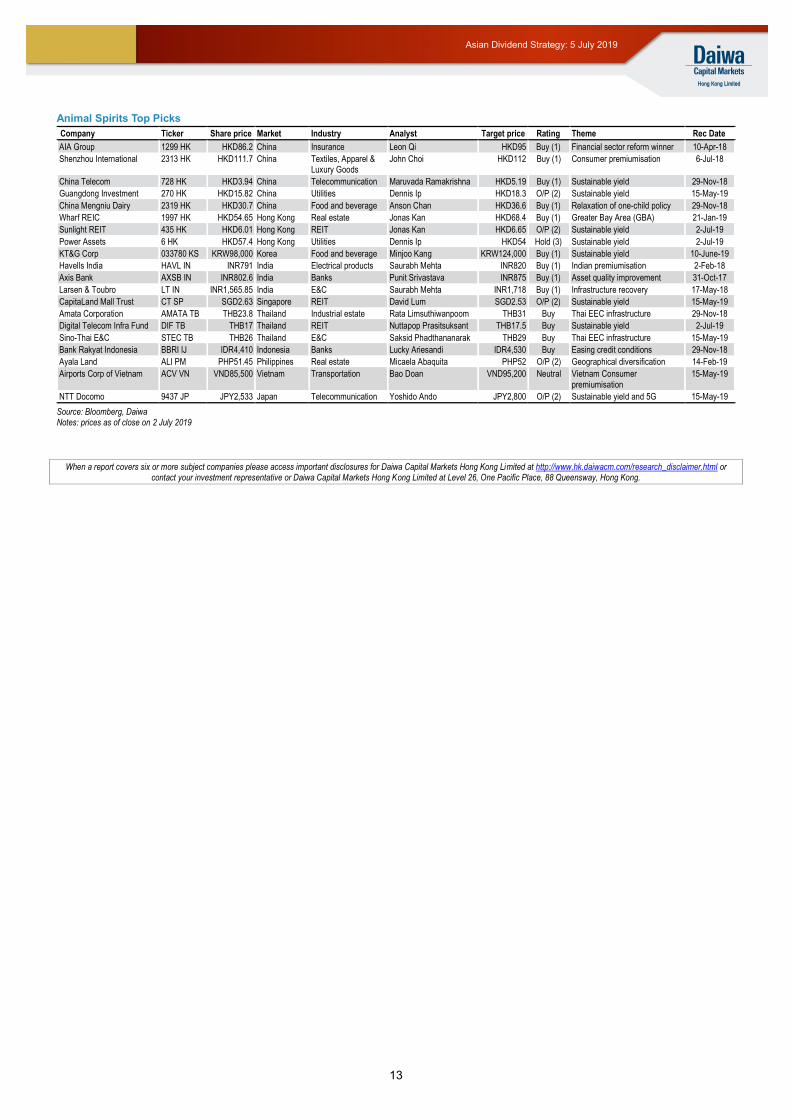
In the next table, we outline the Animal Spirits top-20 picks in Asia.
13
Asian Dividend Strategy: 5 July 2019
Animal Spirits Top Picks
Company Ticker Share price Market Industry Analyst Target price Rating Theme Rec Date
AIA Group 1299 HK HKD86.2 China Insurance Leon Qi HKD95 Buy (1) Financial sector reform winner 10-Apr-18
Shenzhou International 2313 HK HKD111.7 China Textiles, Apparel & Luxury Goods
John Choi HKD112 Buy (1) Consumer premiumisation 6-Jul-18
China Telecom 728 HK HKD3.94 China Telecommunication Maruvada Ramakrishna HKD5.19 Buy (1) Sustainable yield 29-Nov-18
Guangdong Investment 270 HK HKD15.82 China Utilities Dennis Ip HKD18.3 O/P (2) Sustainable yield 15-May-19
China Mengniu Dairy 2319 HK HKD30.7 China Food and beverage Anson Chan HKD36.6 Buy (1) Relaxation of one-child policy 29-Nov-18
Wharf REIC 1997 HK HKD54.65 Hong Kong Real estate Jonas Kan HKD68.4 Buy (1) Greater Bay Area (GBA) 21-Jan-19
Sunlight REIT 435 HK HKD6.01 Hong Kong REIT Jonas Kan HKD6.65 O/P (2) Sustainable yield 2-Jul-19
Power Assets 6 HK HKD57.4 Hong Kong Utilities Dennis Ip HKD54 Hold (3) Sustainable yield 2-Jul-19
KT&G Corp 033780 KS KRW98,000 Korea Food and beverage Minjoo Kang KRW124,000 Buy (1) Sustainable yield 10-June-19
Havells India HAVL IN INR791 India Electrical products Saurabh Mehta INR820 Buy (1) Indian premiumisation 2-Feb-18
Axis Bank AXSB IN INR802.6 India Banks Punit Srivastava INR875 Buy (1) Asset quality improvement 31-Oct-17
Larsen & Toubro LT IN INR1,565.85 India E&C Saurabh Mehta INR1,718 Buy (1) Infrastructure recovery 17-May-18
CapitaLand Mall Trust CT SP SGD2.63 Singapore REIT David Lum SGD2.53 O/P (2) Sustainable yield 15-May-19
Amata Corporation AMATA TB THB23.8 Thailand Industrial estate Rata Limsuthiwanpoom THB31 Buy Thai EEC infrastructure 29-Nov-18
Digital Telecom Infra Fund DIF TB THB17 Thailand REIT Nuttapop Prasitsuksant THB17.5 Buy Sustainable yield 2-Jul-19
Sino-Thai E&C STEC TB THB26 Thailand E&C Saksid Phadthananarak THB29 Buy Thai EEC infrastructure 15-May-19
Bank Rakyat Indonesia BBRI IJ IDR4,410 Indonesia Banks Lucky Ariesandi IDR4,530 Buy Easing credit conditions 29-Nov-18
Ayala Land ALI PM PHP51.45 Philippines Real estate Micaela Abaquita PHP52 O/P (2) Geographical diversification 14-Feb-19
Airports Corp of Vietnam ACV VN VND85,500 Vietnam Transportation Bao Doan VND95,200 Neutral Vietnam Consumer premiumisation
15-May-19
NTT Docomo 9437 JP JPY2,533 Japan Telecommunication Yoshido Ando JPY2,800 O/P (2) Sustainable yield and 5G 15-May-19
Source: Bloomberg, Daiwa Notes: prices as of close on 2 July 2019
When a report covers six or more subject companies please access important disclosures for Daiwa Capital Markets Hong Kong Limited at http://www.hk.daiwacm.com/research_disclaimer.html or
contact your investment representative or Daiwa Capital Markets Hong Kong Limited at Level 26, One Pacific Place, 88 Queensway, Hong Kong.
14
Asian Dividend Strategy: 5 July 2019
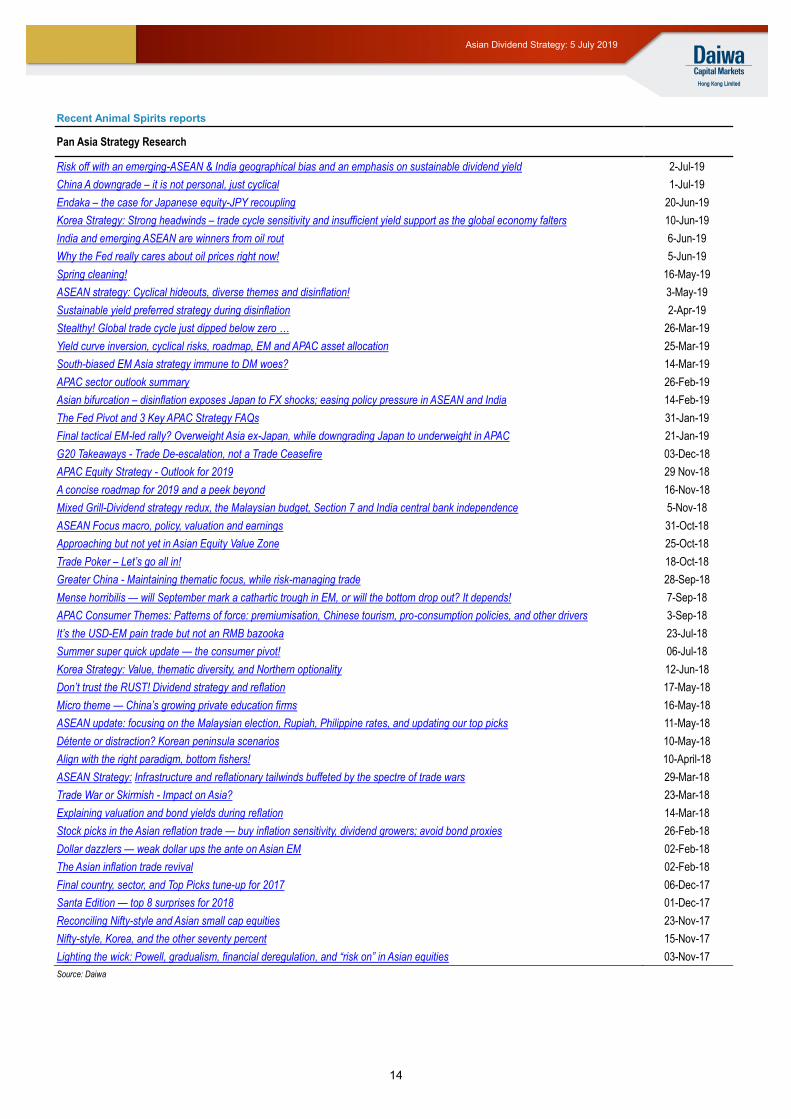
Recent Animal Spirits reports
Pan Asia Strategy Research
Risk off with an emerging-ASEAN & India geographical bias and an emphasis on sustainable dividend yield 2-Jul-19
China A downgrade – it is not personal, just cyclical 1-Jul-19
Endaka – the case for Japanese equity-JPY recoupling 20-Jun-19
Korea Strategy: Strong headwinds – trade cycle sensitivity and insufficient yield support as the global economy falters 10-Jun-19
India and emerging ASEAN are winners from oil rout 6-Jun-19
Why the Fed really cares about oil prices right now! 5-Jun-19
Spring cleaning! 16-May-19
ASEAN strategy: Cyclical hideouts, diverse themes and disinflation! 3-May-19
Sustainable yield preferred strategy during disinflation 2-Apr-19
Stealthy! Global trade cycle just dipped below zero … 26-Mar-19
Yield curve inversion, cyclical risks, roadmap, EM and APAC asset allocation 25-Mar-19
South-biased EM Asia strategy immune to DM woes? 14-Mar-19
APAC sector outlook summary 26-Feb-19
Asian bifurcation – disinflation exposes Japan to FX shocks; easing policy pressure in ASEAN and India 14-Feb-19
The Fed Pivot and 3 Key APAC Strategy FAQs 31-Jan-19
Final tactical EM-led rally? Overweight Asia ex-Japan, while downgrading Japan to underweight in APAC 21-Jan-19
G20 Takeaways - Trade De-escalation, not a Trade Ceasefire 03-Dec-18
APAC Equity Strategy - Outlook for 2019 29 Nov-18
A concise roadmap for 2019 and a peek beyond 16-Nov-18
Mixed Grill-Dividend strategy redux, the Malaysian budget, Section 7 and India central bank independence 5-Nov-18
ASEAN Focus macro, policy, valuation and earnings 31-Oct-18
Approaching but not yet in Asian Equity Value Zone 25-Oct-18
Trade Poker – Let’s go all in! 18-Oct-18
Greater China - Maintaining thematic focus, while risk-managing trade 28-Sep-18
Mense horribilis — will September mark a cathartic trough in EM, or will the bottom drop out? It depends! 7-Sep-18
APAC Consumer Themes: Patterns of force: premiumisation, Chinese tourism, pro-consumption policies, and other drivers 3-Sep-18
It’s the USD-EM pain trade but not an RMB bazooka 23-Jul-18
Summer super quick update — the consumer pivot! 06-Jul-18
Korea Strategy: Value, thematic diversity, and Northern optionality 12-Jun-18
Don’t trust the RUST! Dividend strategy and reflation 17-May-18
Micro theme — China’s growing private education firms 16-May-18
ASEAN update: focusing on the Malaysian election, Rupiah, Philippine rates, and updating our top picks 11-May-18
Détente or distraction? Korean peninsula scenarios 10-May-18
Align with the right paradigm, bottom fishers! 10-April-18
ASEAN Strategy: Infrastructure and reflationary tailwinds buffeted by the spectre of trade wars 29-Mar-18
Trade War or Skirmish - Impact on Asia? 23-Mar-18
Explaining valuation and bond yields during reflation 14-Mar-18
Stock picks in the Asian reflation trade — buy inflation sensitivity, dividend growers; avoid bond proxies 26-Feb-18
Dollar dazzlers — weak dollar ups the ante on Asian EM 02-Feb-18
The Asian inflation trade revival 02-Feb-18
Final country, sector, and Top Picks tune-up for 2017 06-Dec-17
Santa Edition — top 8 surprises for 2018 01-Dec-17
Reconciling Nifty-style and Asian small cap equities 23-Nov-17
Nifty-style, Korea, and the other seventy percent 15-Nov-17
Lighting the wick: Powell, gradualism, financial deregulation, and “risk on” in Asian equities 03-Nov-17
Source: Daiwa
15
Asian Dividend Strategy: 5 July 2019
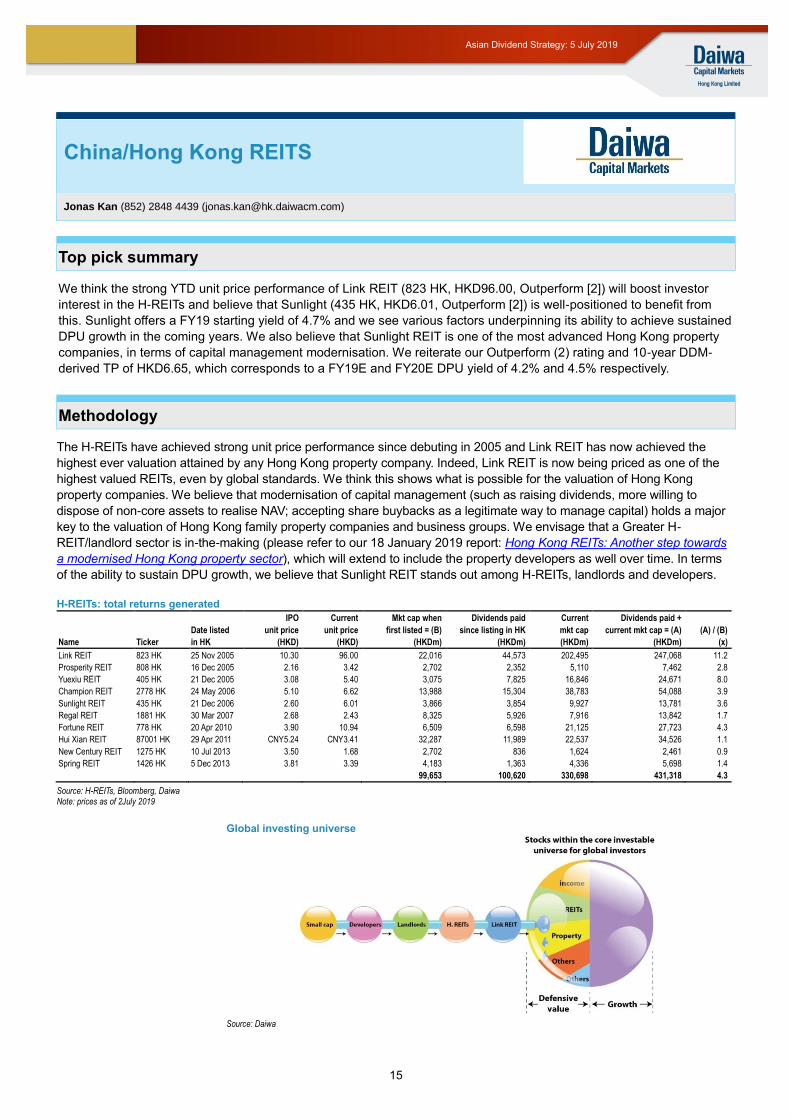
Top pick summary
We think the strong YTD unit price performance of Link REIT (823 HK, HKD96.00, Outperform [2]) will boost investor
interest in the H-REITs and believe that Sunlight (435 HK, HKD6.01, Outperform [2]) is well-positioned to benefit from
this. Sunlight offers a FY19 starting yield of 4.7% and we see various factors underpinning its ability to achieve sustained
DPU growth in the coming years. We also believe that Sunlight REIT is one of the most advanced Hong Kong property
companies, in terms of capital management modernisation. We reiterate our Outperform (2) rating and 10-year DDM-
derived TP of HKD6.65, which corresponds to a FY19E and FY20E DPU yield of 4.2% and 4.5% respectively.
Methodology
The H-REITs have achieved strong unit price performance since debuting in 2005 and Link REIT has now achieved the
highest ever valuation attained by any Hong Kong property company. Indeed, Link REIT is now being priced as one of the
highest valued REITs, even by global standards. We think this shows what is possible for the valuation of Hong Kong
property companies. We believe that modernisation of capital management (such as raising dividends, more willing to
dispose of non-core assets to realise NAV; accepting share buybacks as a legitimate way to manage capital) holds a major
key to the valuation of Hong Kong family property companies and business groups. We envisage that a Greater H-
REIT/landlord sector is in-the-making (please refer to our 18 January 2019 report: Hong Kong REITs: Another step towards
a modernised Hong Kong property sector), which will extend to include the property developers as well over time. In terms
of the ability to sustain DPU growth, we believe that Sunlight REIT stands out among H-REITs, landlords and developers.
H-REITs: total returns generated
IPO Current Mkt cap when Dividends paid Current Dividends paid +
Date listed unit price unit price first listed = (B) since listing in HK mkt cap current mkt cap = (A) (A) / (B)
Name Ticker in HK (HKD) (HKD) (HKDm) (HKDm) (HKDm) (HKDm) (x)
Link REIT 823 HK 25 Nov 2005 10.30 96.00 22,016 44,573 202,495 247,068 11.2
Prosperity REIT 808 HK 16 Dec 2005 2.16 3.42 2,702 2,352 5,110 7,462 2.8
Yuexiu REIT 405 HK 21 Dec 2005 3.08 5.40 3,075 7,825 16,846 24,671 8.0
Champion REIT 2778 HK 24 May 2006 5.10 6.62 13,988 15,304 38,783 54,088 3.9
Sunlight REIT 435 HK 21 Dec 2006 2.60 6.01 3,866 3,854 9,927 13,781 3.6
Regal REIT 1881 HK 30 Mar 2007 2.68 2.43 8,325 5,926 7,916 13,842 1.7
Fortune REIT 778 HK 20 Apr 2010 3.90 10.94 6,509 6,598 21,125 27,723 4.3
Hui Xian REIT 87001 HK 29 Apr 2011 CNY5.24 CNY3.41 32,287 11,989 22,537 34,526 1.1
New Century REIT 1275 HK 10 Jul 2013 3.50 1.68 2,702 836 1,624 2,461 0.9
Spring REIT 1426 HK 5 Dec 2013 3.81 3.39 4,183 1,363 4,336 5,698 1.4
99,653 100,620 330,698 431,318 4.3
Source: H-REITs, Bloomberg, Daiwa Note: prices as of 2July 2019
Global investing universe
Source: Daiwa
China/Hong Kong REITS
Jonas Kan (852) 2848 4439 ([email protected])
16
Asian Dividend Strategy: 5 July 2019
Stock Pick
Sunlight REIT (435 HK)
Investment thesis
Riding on quality niche assets
Sunlight REIT owns a portfolio of quality niche assets which positions it well to take advantage of what we see as various structural trends driving the Hong Kong commercial property market, including office decentralisation, the Central District expanding westward into Sheung Wan, sustained growth in cross-border spending as well as Tseung Kwan O’s rise as a middle-class area. This should underpin sustained growth in its DPU, in our view.
Valuation
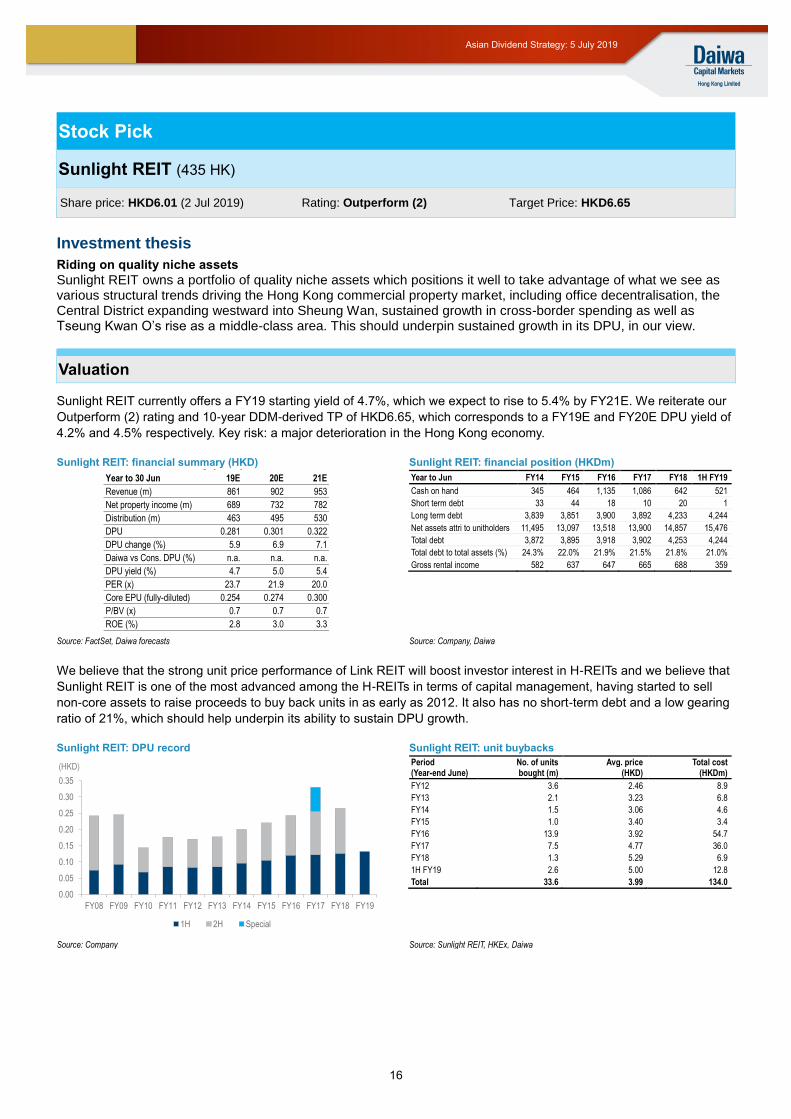
Sunlight REIT currently offers a FY19 starting yield of 4.7%, which we expect to rise to 5.4% by FY21E. We reiterate our
Outperform (2) rating and 10-year DDM-derived TP of HKD6.65, which corresponds to a FY19E and FY20E DPU yield of
4.2% and 4.5% respectively. Key risk: a major deterioration in the Hong Kong economy.
Sunlight REIT: financial summary (HKD) Sunlight REIT: financial position (HKDm)
Year to Jun FY14 FY15 FY16 FY17 FY18 1H FY19
Cash on hand 345 464 1,135 1,086 642 521
Short term debt 33 44 18 10 20 1
Long term debt 3,839 3,851 3,900 3,892 4,233 4,244
Net assets attri to unitholders 11,495 13,097 13,518 13,900 14,857 15,476
Total debt 3,872 3,895 3,918 3,902 4,253 4,244
Total debt to total assets (%) 24.3% 22.0% 21.9% 21.5% 21.8% 21.0%
Gross rental income 582 637 647 665 688 359
Source: FactSet, Daiwa forecasts Source: Company, Daiwa
We believe that the strong unit price performance of Link REIT will boost investor interest in H-REITs and we believe that
Sunlight REIT is one of the most advanced among the H-REITs in terms of capital management, having started to sell
non-core assets to raise proceeds to buy back units in as early as 2012. It also has no short-term debt and a low gearing
ratio of 21%, which should help underpin its ability to sustain DPU growth.
Sunlight REIT: DPU record Sunlight REIT: unit buybacks
Period No. of units Avg. price Total cost (Year-end June) bought (m) (HKD) (HKDm)
FY12 3.6 2.46 8.9
FY13 2.1 3.23 6.8
FY14 1.5 3.06 4.6
FY15 1.0 3.40 3.4
FY16 13.9 3.92 54.7
FY17 7.5 4.77 36.0
FY18 1.3 5.29 6.9
1H FY19 2.6 5.00 12.8
Total 33.6 3.99 134.0
Source: Company Source: Sunlight REIT, HKEx, Daiwa
Financial summary (HKD)
Year to 30 Jun 19E 20E 21E
Revenue (m) 861 902 953
Net property income (m) 689 732 782
Distribution (m) 463 495 530
DPU 0.281 0.301 0.322
DPU change (%) 5.9 6.9 7.1
Daiwa vs Cons. DPU (%) n.a. n.a. n.a.
DPU yield (%) 4.7 5.0 5.4
PER (x) 23.7 21.9 20.0
Core EPU (fully-diluted) 0.254 0.274 0.300
P/BV (x) 0.7 0.7 0.7
ROE (%) 2.8 3.0 3.3
0.00
0.05
0.10
0.15
0.20
0.25
0.30
0.35
FY08 FY09 FY10 FY11 FY12 FY13 FY14 FY15 FY16 FY17 FY18 FY19
1H 2H Special
(HKD)
Share price: HKD6.01 (2 Jul 2019) Rating: Outperform (2) Target Price: HKD6.65
17
Asian Dividend Strategy: 5 July 2019
Top pick summary
We have a Negative rating on the S-REIT sector with a ratings distribution of two Sell (5), four Underperform (4), five
Hold (3) and three Outperform (2) calls.
The sector yield spread (DPU yield minus 10-year government bond yield) is now near 3.1%, 50bps below its 15-year
average of 3.6%.
We see increasing downside risk for GDP growth, and emerging recession tail risk. As we believe the real estate market
cannot decouple from the economy, we expect any near-recession outcome to eventually hit commercial rents.
We are still positive on retail-property S-REITs for their proven income defensiveness in recessions. Among the listed S-
REITs, we prefer industry heavyweight CapitaLand Mall Trust (CMT; CT SP, SGD2.63, Outperform [2]).
Methodology
Of all the S-REIT property subsegments under our coverage, the only one that was not hit by negative rental reversions
during the global financial crisis (GFC) was the suburban-mall segment. This is the sole basis for our resilient dividend
yield selection.
For investors looking for a sustainable yield trade now in the S-REIT sector, we see suburban-retail exposure as the safe
haven in a yield-starved market environment. We are wary of tail risk (Singapore slipping into a recession soon) and only
the suburban-mall properties in the listed S-REITs have demonstrated income resilience during periods of economic
recession as these assets cater to day-to-day non-discretionary shopping and are embedded into the daily lifestyles of
the local population catchments. We expect the suburban-mall properties’ defensiveness to come through again if
Singapore slips into a recession in the coming quarters.
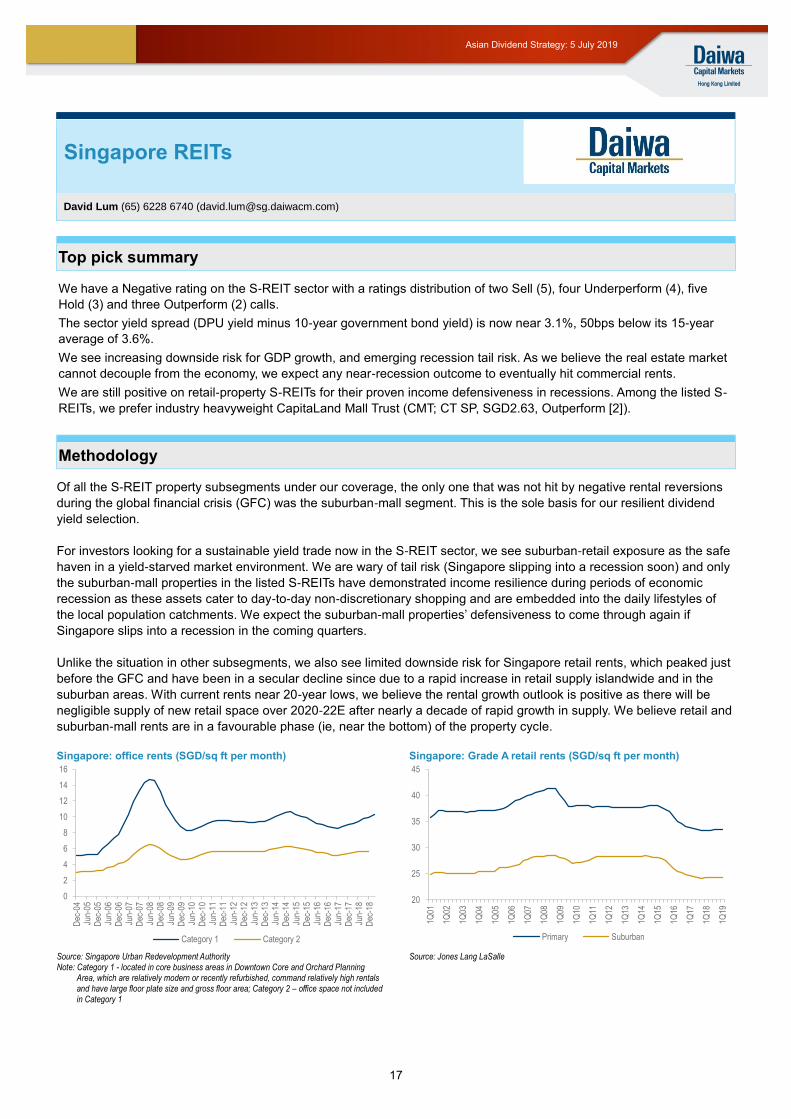
Unlike the situation in other subsegments, we also see limited downside risk for Singapore retail rents, which peaked just
before the GFC and have been in a secular decline since due to a rapid increase in retail supply islandwide and in the
suburban areas. With current rents near 20-year lows, we believe the rental growth outlook is positive as there will be
negligible supply of new retail space over 2020-22E after nearly a decade of rapid growth in supply. We believe retail and
suburban-mall rents are in a favourable phase (ie, near the bottom) of the property cycle.
Singapore: office rents (SGD/sq ft per month) Singapore: Grade A retail rents (SGD/sq ft per month)
Source: Singapore Urban Redevelopment Authority Note: Category 1 - located in core business areas in Downtown Core and Orchard Planning
Area, which are relatively modern or recently refurbished, command relatively high rentals and have large floor plate size and gross floor area; Category 2 – office space not included in Category 1
Source: Jones Lang LaSalle
0
2
4
6
8
10
12
14
16
Dec
-04
Jun-
05D
ec-0
5Ju
n-06
Dec
-06
Jun-
07D
ec-0
7Ju
n-08
Dec
-08
Jun-
09D
ec-0
9Ju
n-10
Dec
-10
Jun-
11D
ec-1
1Ju
n-12
Dec
-12
Jun-
13D
ec-1
3Ju
n-14
Dec
-14
Jun-
15D
ec-1
5Ju
n-16
Dec
-16
Jun-
17D
ec-1
7Ju
n-18
Dec
-18
Category 1 Category 2
20
25
30
35
40
45
1Q01
1Q02
1Q03
1Q04
1Q05
1Q06
1Q07
1Q08
1Q09
1Q10
1Q11
1Q12
1Q13
1Q14
1Q15
1Q16
1Q17
1Q18
1Q19
Primary Suburban
Singapore REITs
David Lum (65) 6228 6740 ([email protected])
18
Asian Dividend Strategy: 5 July 2019
Stock Pick
CapitaLand Mall Trust (CT SP)
Investment thesis
Defensiveness plus growth
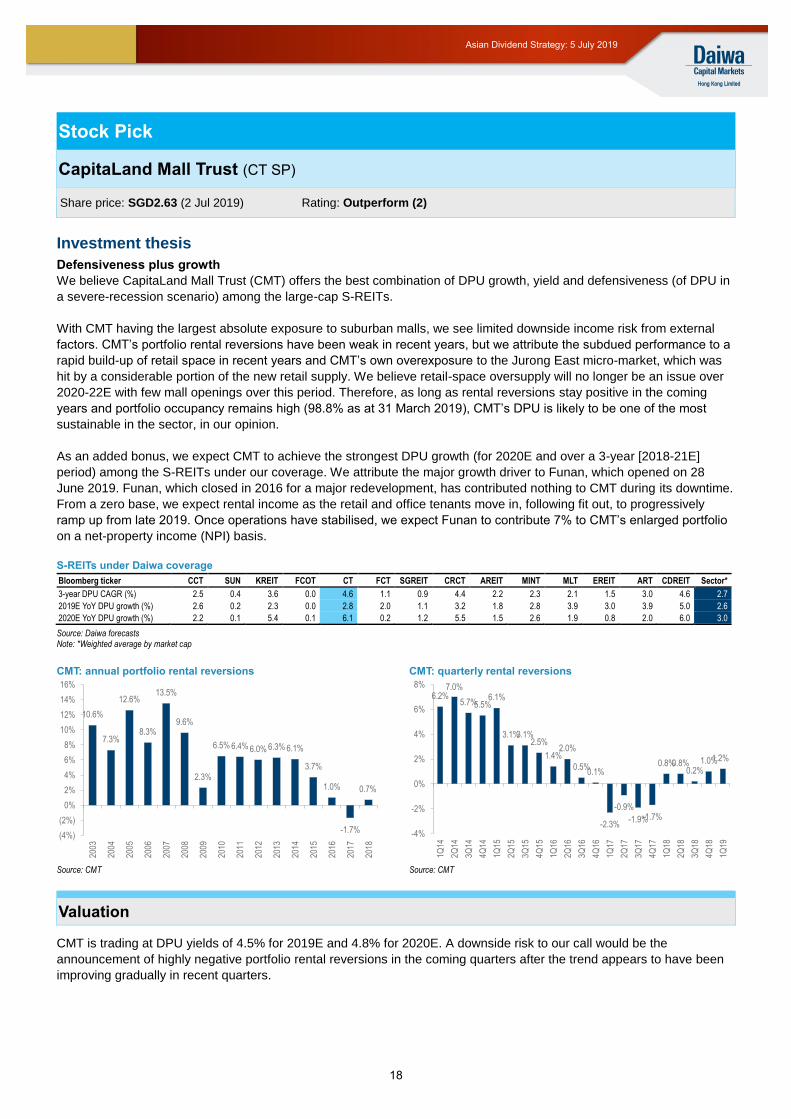
We believe CapitaLand Mall Trust (CMT) offers the best combination of DPU growth, yield and defensiveness (of DPU in
a severe-recession scenario) among the large-cap S-REITs.
With CMT having the largest absolute exposure to suburban malls, we see limited downside income risk from external
factors. CMT’s portfolio rental reversions have been weak in recent years, but we attribute the subdued performance to a
rapid build-up of retail space in recent years and CMT’s own overexposure to the Jurong East micro-market, which was
hit by a considerable portion of the new retail supply. We believe retail-space oversupply will no longer be an issue over
2020-22E with few mall openings over this period. Therefore, as long as rental reversions stay positive in the coming
years and portfolio occupancy remains high (98.8% as at 31 March 2019), CMT’s DPU is likely to be one of the most
sustainable in the sector, in our opinion.
As an added bonus, we expect CMT to achieve the strongest DPU growth (for 2020E and over a 3-year [2018-21E]
period) among the S-REITs under our coverage. We attribute the major growth driver to Funan, which opened on 28
June 2019. Funan, which closed in 2016 for a major redevelopment, has contributed nothing to CMT during its downtime.
From a zero base, we expect rental income as the retail and office tenants move in, following fit out, to progressively
ramp up from late 2019. Once operations have stabilised, we expect Funan to contribute 7% to CMT’s enlarged portfolio
on a net-property income (NPI) basis.
S-REITs under Daiwa coverage
Bloomberg ticker CCT SUN KREIT FCOT CT FCT SGREIT CRCT AREIT MINT MLT EREIT ART CDREIT Sector*
3-year DPU CAGR (%) 2.5 0.4 3.6 0.0 4.6 1.1 0.9 4.4 2.2 2.3 2.1 1.5 3.0 4.6 2.7
2019E YoY DPU growth (%) 2.6 0.2 2.3 0.0 2.8 2.0 1.1 3.2 1.8 2.8 3.9 3.0 3.9 5.0 2.6
2020E YoY DPU growth (%) 2.2 0.1 5.4 0.1 6.1 0.2 1.2 5.5 1.5 2.6 1.9 0.8 2.0 6.0 3.0
Source: Daiwa forecasts Note: *Weighted average by market cap
CMT: annual portfolio rental reversions CMT: quarterly rental reversions
Source: CMT Source: CMT
Valuation
CMT is trading at DPU yields of 4.5% for 2019E and 4.8% for 2020E. A downside risk to our call would be the
announcement of highly negative portfolio rental reversions in the coming quarters after the trend appears to have been
improving gradually in recent quarters.
10.6%
7.3%
12.6%
8.3%
13.5%
9.6%
2.3%
6.5% 6.4% 6.0% 6.3% 6.1%
3.7%
1.0%
-1.7%
0.7%
(4%)
(2%)
0%
2%
4%
6%
8%
10%
12%
14%
16%
2003
2004
2005
2006
2007
2008
2009
2010
2011
2012
2013
2014
2015
2016
2017
2018
6.2%7.0%
5.7%5.5%6.1%
3.1%3.1%2.5%
1.4%2.0%
0.5%0.1%
-2.3%
-0.9%
-1.9%-1.7%
0.8%0.8%0.2%
1.0%1.2%
-4%
-2%
0%
2%
4%
6%
8%
1Q14
2Q14
3Q14
4Q14
1Q15
2Q15
3Q15
4Q15
1Q16
2Q16
3Q16
4Q16
1Q17
2Q17
3Q17
4Q17
1Q18
2Q18
3Q18
4Q18
1Q19
Share price: SGD2.63 (2 Jul 2019) Rating: Outperform (2)
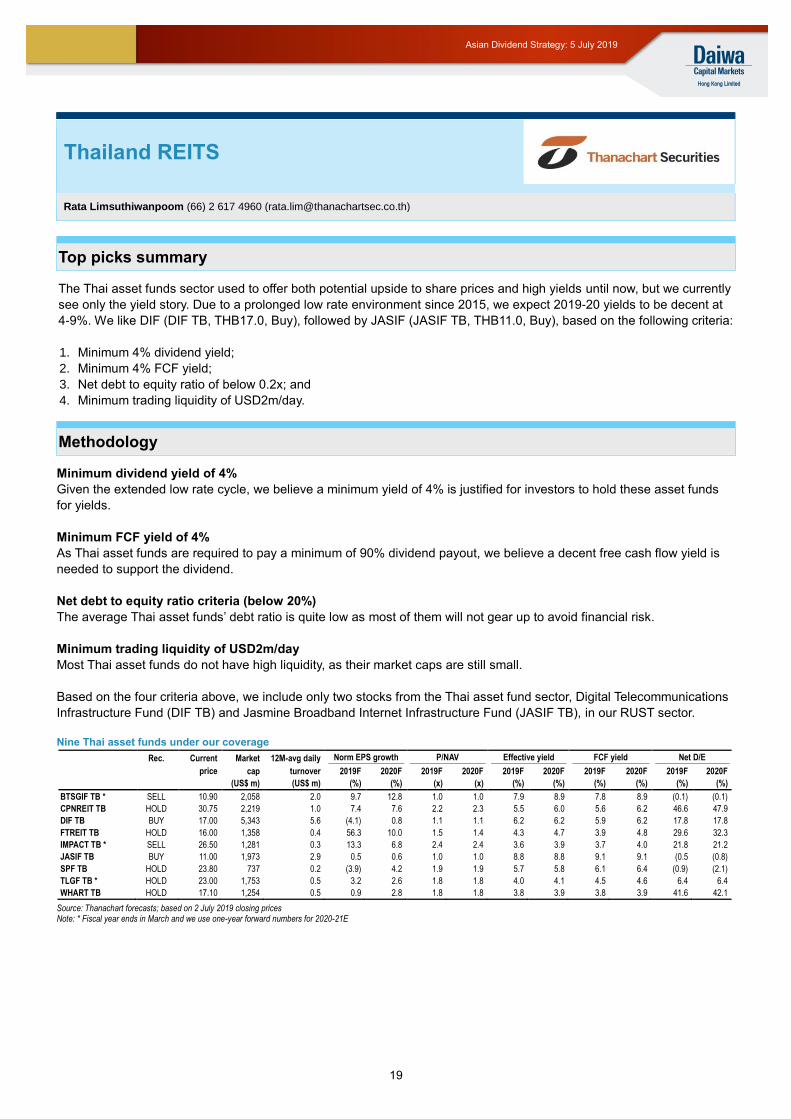
19
Asian Dividend Strategy: 5 July 2019
Top picks summary
The Thai asset funds sector used to offer both potential upside to share prices and high yields until now, but we currently
see only the yield story. Due to a prolonged low rate environment since 2015, we expect 2019-20 yields to be decent at
4-9%. We like DIF (DIF TB, THB17.0, Buy), followed by JASIF (JASIF TB, THB11.0, Buy), based on the following criteria:
1. Minimum 4% dividend yield;
2. Minimum 4% FCF yield;
3. Net debt to equity ratio of below 0.2x; and
4. Minimum trading liquidity of USD2m/day.
Methodology
Minimum dividend yield of 4%
Given the extended low rate cycle, we believe a minimum yield of 4% is justified for investors to hold these asset funds
for yields.
Minimum FCF yield of 4%
As Thai asset funds are required to pay a minimum of 90% dividend payout, we believe a decent free cash flow yield is
needed to support the dividend.
Net debt to equity ratio criteria (below 20%)
The average Thai asset funds’ debt ratio is quite low as most of them will not gear up to avoid financial risk.
Minimum trading liquidity of USD2m/day
Most Thai asset funds do not have high liquidity, as their market caps are still small.
Based on the four criteria above, we include only two stocks from the Thai asset fund sector, Digital Telecommunications
Infrastructure Fund (DIF TB) and Jasmine Broadband Internet Infrastructure Fund (JASIF TB), in our RUST sector.
Nine Thai asset funds under our coverage
Rec. Current Market 12M-avg daily Norm EPS growth P/NAV Effective yield FCF yield Net D/E
price cap turnover 2019F 2020F 2019F 2020F 2019F 2020F 2019F 2020F 2019F 2020F
(US$ m) (US$ m) (%) (%) (x) (x) (%) (%) (%) (%) (%) (%)
BTSGIF TB * SELL 10.90 2,058 2.0 9.7 12.8 1.0 1.0 7.9 8.9 7.8 8.9 (0.1) (0.1)
CPNREIT TB HOLD 30.75 2,219 1.0 7.4 7.6 2.2 2.3 5.5 6.0 5.6 6.2 46.6 47.9
DIF TB BUY 17.00 5,343 5.6 (4.1) 0.8 1.1 1.1 6.2 6.2 5.9 6.2 17.8 17.8
FTREIT TB HOLD 16.00 1,358 0.4 56.3 10.0 1.5 1.4 4.3 4.7 3.9 4.8 29.6 32.3
IMPACT TB * SELL 26.50 1,281 0.3 13.3 6.8 2.4 2.4 3.6 3.9 3.7 4.0 21.8 21.2
JASIF TB BUY 11.00 1,973 2.9 0.5 0.6 1.0 1.0 8.8 8.8 9.1 9.1 (0.5 (0.8)
SPF TB HOLD 23.80 737 0.2 (3.9) 4.2 1.9 1.9 5.7 5.8 6.1 6.4 (0.9) (2.1)
TLGF TB * HOLD 23.00 1,753 0.5 3.2 2.6 1.8 1.8 4.0 4.1 4.5 4.6 6.4 6.4
WHART TB HOLD 17.10 1,254 0.5 0.9 2.8 1.8 1.8 3.8 3.9 3.8 3.9 41.6 42.1
Source: Thanachart forecasts; based on 2 July 2019 closing prices Note: * Fiscal year ends in March and we use one-year forward numbers for 2020-21E
Thailand REITS
Rata Limsuthiwanpoom (66) 2 617 4960 ([email protected])
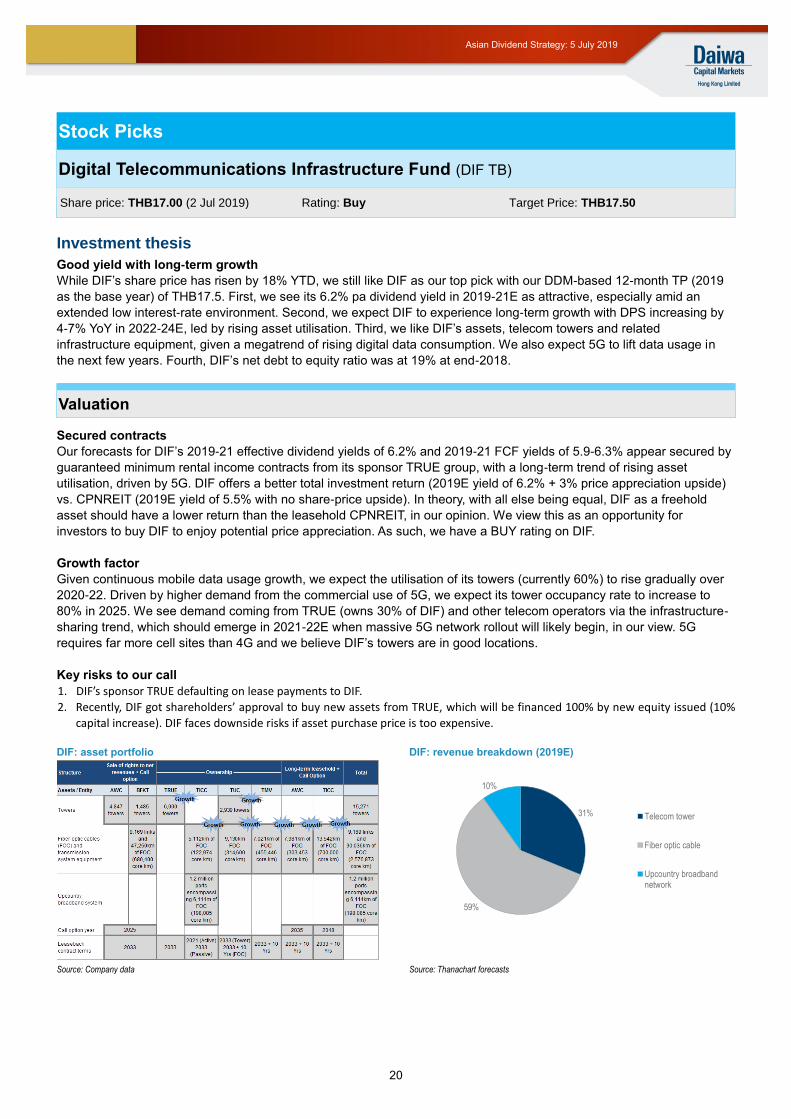
20
Asian Dividend Strategy: 5 July 2019
Stock Picks
Digital Telecommunications Infrastructure Fund (DIF TB)
Investment thesis
Good yield with long-term growth
While DIF’s share price has risen by 18% YTD, we still like DIF as our top pick with our DDM-based 12-month TP (2019
as the base year) of THB17.5. First, we see its 6.2% pa dividend yield in 2019-21E as attractive, especially amid an
extended low interest-rate environment. Second, we expect DIF to experience long-term growth with DPS increasing by
4-7% YoY in 2022-24E, led by rising asset utilisation. Third, we like DIF’s assets, telecom towers and related
infrastructure equipment, given a megatrend of rising digital data consumption. We also expect 5G to lift data usage in
the next few years. Fourth, DIF’s net debt to equity ratio was at 19% at end-2018.
Valuation
Secured contracts
Our forecasts for DIF’s 2019-21 effective dividend yields of 6.2% and 2019-21 FCF yields of 5.9-6.3% appear secured by
guaranteed minimum rental income contracts from its sponsor TRUE group, with a long-term trend of rising asset
utilisation, driven by 5G. DIF offers a better total investment return (2019E yield of 6.2% + 3% price appreciation upside)
vs. CPNREIT (2019E yield of 5.5% with no share-price upside). In theory, with all else being equal, DIF as a freehold
asset should have a lower return than the leasehold CPNREIT, in our opinion. We view this as an opportunity for
investors to buy DIF to enjoy potential price appreciation. As such, we have a BUY rating on DIF.
Growth factor
Given continuous mobile data usage growth, we expect the utilisation of its towers (currently 60%) to rise gradually over
2020-22. Driven by higher demand from the commercial use of 5G, we expect its tower occupancy rate to increase to
80% in 2025. We see demand coming from TRUE (owns 30% of DIF) and other telecom operators via the infrastructure-
sharing trend, which should emerge in 2021-22E when massive 5G network rollout will likely begin, in our view. 5G
requires far more cell sites than 4G and we believe DIF’s towers are in good locations.
Key risks to our call
1. DIF’s sponsor TRUE defaulting on lease payments to DIF.
2. Recently, DIF got shareholders’ approval to buy new assets from TRUE, which will be financed 100% by new equity issued (10%
capital increase). DIF faces downside risks if asset purchase price is too expensive.
DIF: asset portfolio DIF: revenue breakdown (2019E)
Source: Company data Source: Thanachart forecasts
31%
59%
10%
Telecom tower
Fiber optic cable
Upcountry broadbandnetwork
Share price: THB17.00 (2 Jul 2019) Rating: Buy Target Price: THB17.50
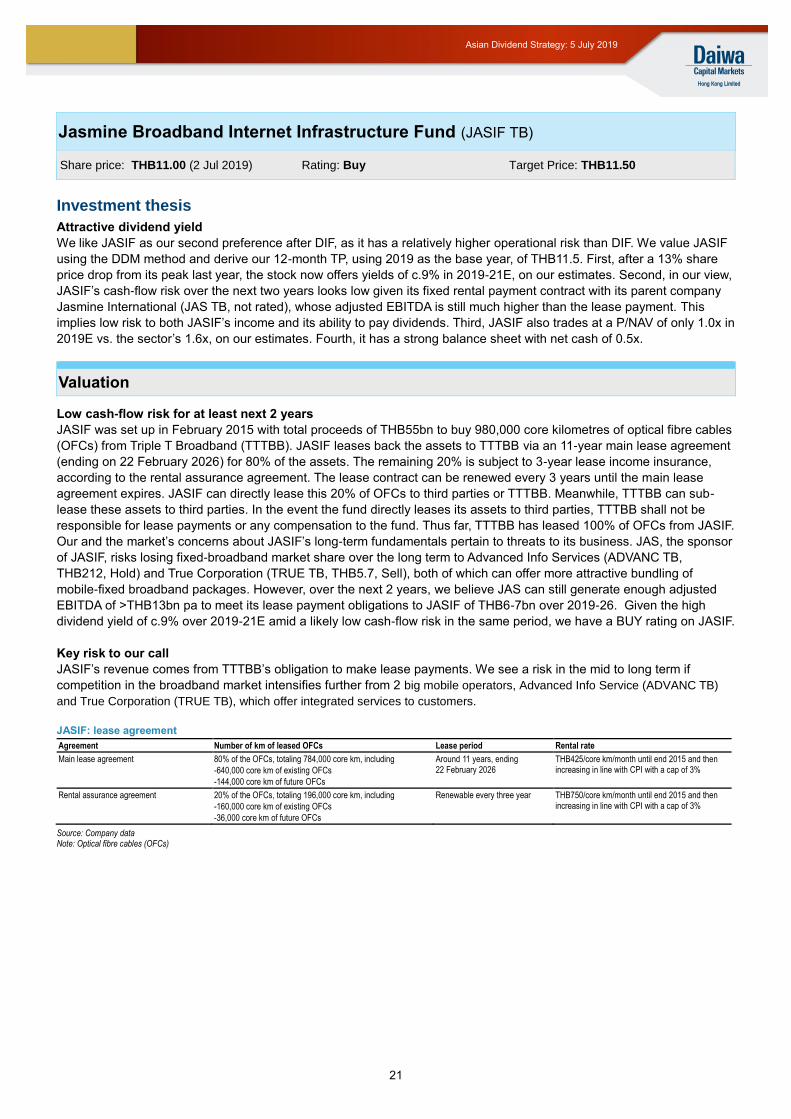
21
Asian Dividend Strategy: 5 July 2019
Jasmine Broadband Internet Infrastructure Fund (JASIF TB)
Investment thesis
Attractive dividend yield
We like JASIF as our second preference after DIF, as it has a relatively higher operational risk than DIF. We value JASIF
using the DDM method and derive our 12-month TP, using 2019 as the base year, of THB11.5. First, after a 13% share
price drop from its peak last year, the stock now offers yields of c.9% in 2019-21E, on our estimates. Second, in our view,
JASIF’s cash-flow risk over the next two years looks low given its fixed rental payment contract with its parent company
Jasmine International (JAS TB, not rated), whose adjusted EBITDA is still much higher than the lease payment. This
implies low risk to both JASIF’s income and its ability to pay dividends. Third, JASIF also trades at a P/NAV of only 1.0x in
2019E vs. the sector’s 1.6x, on our estimates. Fourth, it has a strong balance sheet with net cash of 0.5x.
Valuation
Low cash-flow risk for at least next 2 years
JASIF was set up in February 2015 with total proceeds of THB55bn to buy 980,000 core kilometres of optical fibre cables
(OFCs) from Triple T Broadband (TTTBB). JASIF leases back the assets to TTTBB via an 11-year main lease agreement
(ending on 22 February 2026) for 80% of the assets. The remaining 20% is subject to 3-year lease income insurance,
according to the rental assurance agreement. The lease contract can be renewed every 3 years until the main lease
agreement expires. JASIF can directly lease this 20% of OFCs to third parties or TTTBB. Meanwhile, TTTBB can sub-
lease these assets to third parties. In the event the fund directly leases its assets to third parties, TTTBB shall not be
responsible for lease payments or any compensation to the fund. Thus far, TTTBB has leased 100% of OFCs from JASIF.
Our and the market’s concerns about JASIF’s long-term fundamentals pertain to threats to its business. JAS, the sponsor
of JASIF, risks losing fixed-broadband market share over the long term to Advanced Info Services (ADVANC TB,
THB212, Hold) and True Corporation (TRUE TB, THB5.7, Sell), both of which can offer more attractive bundling of
mobile-fixed broadband packages. However, over the next 2 years, we believe JAS can still generate enough adjusted
EBITDA of >THB13bn pa to meet its lease payment obligations to JASIF of THB6-7bn over 2019-26. Given the high
dividend yield of c.9% over 2019-21E amid a likely low cash-flow risk in the same period, we have a BUY rating on JASIF.
Key risk to our call
JASIF’s revenue comes from TTTBB’s obligation to make lease payments. We see a risk in the mid to long term if
competition in the broadband market intensifies further from 2 big mobile operators, Advanced Info Service (ADVANC TB)
and True Corporation (TRUE TB), which offer integrated services to customers.
JASIF: lease agreement
Agreement Number of km of leased OFCs Lease period Rental rate
Main lease agreement 80% of the OFCs, totaling 784,000 core km, including
-640,000 core km of existing OFCs
-144,000 core km of future OFCs
Around 11 years, ending 22 February 2026
THB425/core km/month until end 2015 and then increasing in line with CPI with a cap of 3%
Rental assurance agreement 20% of the OFCs, totaling 196,000 core km, including
-160,000 core km of existing OFCs
-36,000 core km of future OFCs
Renewable every three year THB750/core km/month until end 2015 and then increasing in line with CPI with a cap of 3%
Source: Company data Note: Optical fibre cables (OFCs)
Share price: THB11.00 (2 Jul 2019) Rating: Buy Target Price: THB11.50
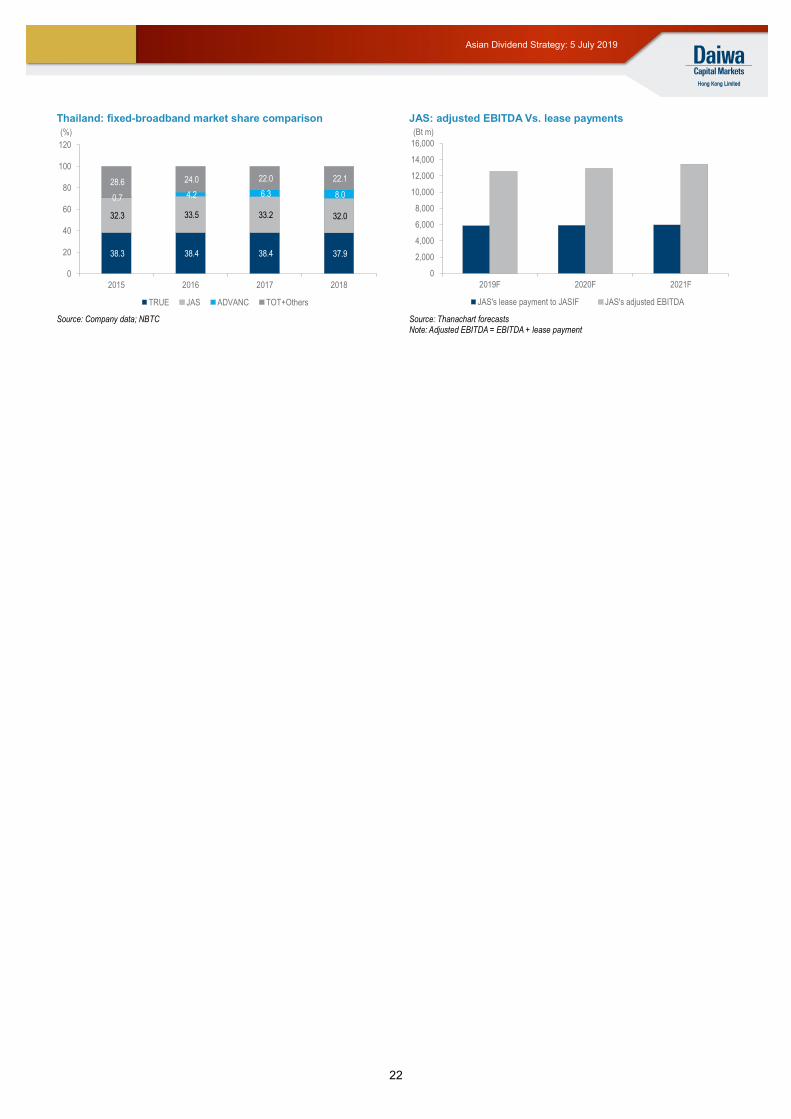
22
Asian Dividend Strategy: 5 July 2019
Thailand: fixed-broadband market share comparison JAS: adjusted EBITDA Vs. lease payments
Source: Company data; NBTC
Source: Thanachart forecasts Note: Adjusted EBITDA = EBITDA + lease payment
38.3 38.4 38.4 37.9
32.3 33.5 33.2 32.0
0.7 4.2 6.3 8.0
28.6 24.0 22.0 22.1
0
20
40
60
80
100
120
2015 2016 2017 2018
TRUE JAS ADVANC TOT+Others
(%)
0
2,000
4,000
6,000
8,000
10,000
12,000
14,000
16,000
2019F 2020F 2021F
JAS's lease payment to JASIF JAS's adjusted EBITDA
(Bt m)
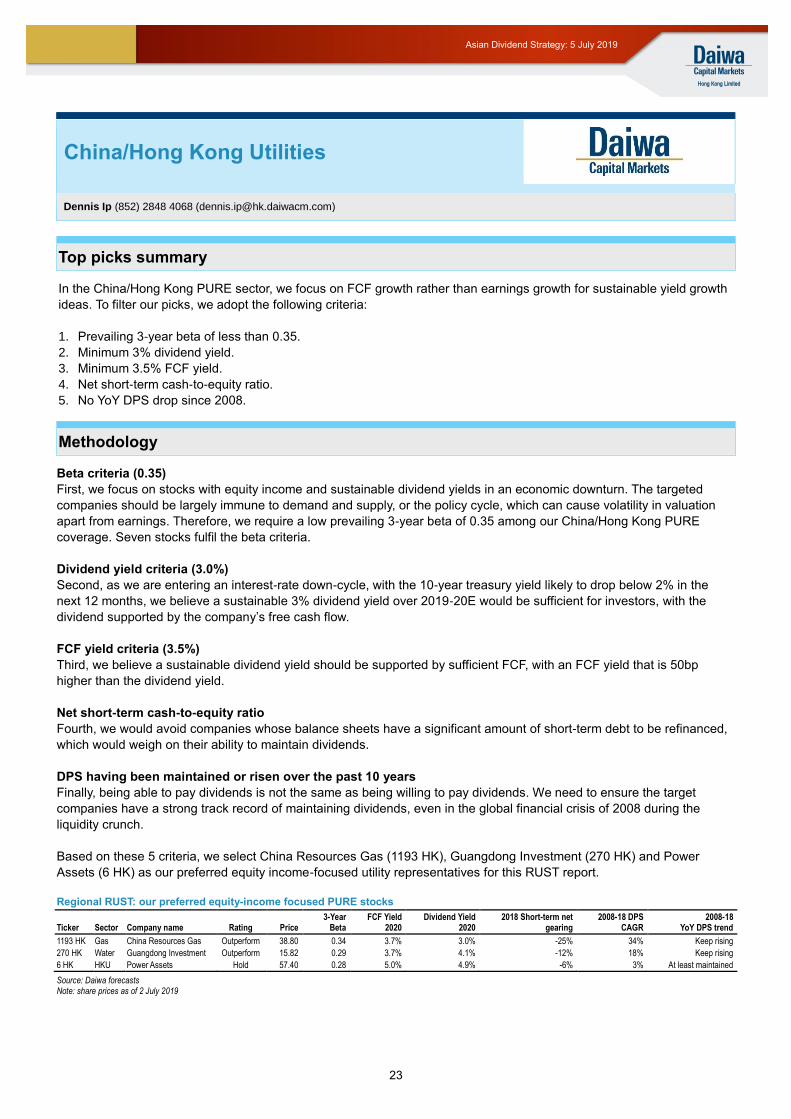
23
Asian Dividend Strategy: 5 July 2019
Top picks summary
In the China/Hong Kong PURE sector, we focus on FCF growth rather than earnings growth for sustainable yield growth
ideas. To filter our picks, we adopt the following criteria:
1. Prevailing 3-year beta of less than 0.35.
2. Minimum 3% dividend yield.
3. Minimum 3.5% FCF yield.
4. Net short-term cash-to-equity ratio.
5. No YoY DPS drop since 2008.
Methodology
Beta criteria (0.35)
First, we focus on stocks with equity income and sustainable dividend yields in an economic downturn. The targeted
companies should be largely immune to demand and supply, or the policy cycle, which can cause volatility in valuation
apart from earnings. Therefore, we require a low prevailing 3-year beta of 0.35 among our China/Hong Kong PURE
coverage. Seven stocks fulfil the beta criteria.
Dividend yield criteria (3.0%)
Second, as we are entering an interest-rate down-cycle, with the 10-year treasury yield likely to drop below 2% in the
next 12 months, we believe a sustainable 3% dividend yield over 2019-20E would be sufficient for investors, with the
dividend supported by the company’s free cash flow.
FCF yield criteria (3.5%)
Third, we believe a sustainable dividend yield should be supported by sufficient FCF, with an FCF yield that is 50bp
higher than the dividend yield.
Net short-term cash-to-equity ratio
Fourth, we would avoid companies whose balance sheets have a significant amount of short-term debt to be refinanced,
which would weigh on their ability to maintain dividends.
DPS having been maintained or risen over the past 10 years
Finally, being able to pay dividends is not the same as being willing to pay dividends. We need to ensure the target
companies have a strong track record of maintaining dividends, even in the global financial crisis of 2008 during the
liquidity crunch.
Based on these 5 criteria, we select China Resources Gas (1193 HK), Guangdong Investment (270 HK) and Power
Assets (6 HK) as our preferred equity income-focused utility representatives for this RUST report.
Regional RUST: our preferred equity-income focused PURE stocks
Ticker Sector Company name Rating Price 3-Year
Beta FCF Yield
2020 Dividend Yield
2020 2018 Short-term net
gearing 2008-18 DPS
CAGR 2008-18
YoY DPS trend
1193 HK Gas China Resources Gas Outperform 38.80 0.34 3.7% 3.0% -25% 34% Keep rising
270 HK Water Guangdong Investment Outperform 15.82 0.29 3.7% 4.1% -12% 18% Keep rising
6 HK HKU Power Assets Hold 57.40 0.28 5.0% 4.9% -6% 3% At least maintained
Source: Daiwa forecasts Note: share prices as of 2 July 2019
China/Hong Kong Utilities
Dennis Ip (852) 2848 4068 ([email protected])
24
Asian Dividend Strategy: 5 July 2019
Stock Picks
Power Assets (6 HK)
Investment thesis
Sustainable 5% yield under potential disinflation
PAH’s share price has risen by 4% since 3 May 2019 vs. a 4% drop in the HSI, likely due mainly to investors’ risk-averse
behaviour post the escalation of the US-China trade dispute. We select PAH as one of our 3 preferred equity income-
focused utilities for the RUST theme, given its:
1. 0.28 3-year trailing beta.
2. 5.0% 2020E dividend yield.
3. 5.0% 2020E FCF yield.
4. 6% net short-term cash-to-equity ratio.
5. 3% 2008-18 DPS CAGR, with DPS YoY never having dropped since 2008.
Valuation
Lack of DPS growth less of an issue, with strong 5% yield likely during the upcoming disinflation period
Despite PAH generating only c.HKD5bn in OCF (over 2017-18) (including dividend payouts from JVs and associates), on
our forecasts — lower than its HKD5.9bn ordinary dividend payout — we expect it to maintain a DPS of HKD2.8 through
gearing its net-cash balance sheet. In 2021, we expect PAH to receive an additional HKD200-300m dividend from
Husky’s midstream assets to close the gap between its OCF and dividend outflow, which should be sufficient to maintain
at least a 5.0% yield at the current share price over 2019-21E and make it the strongest yield play among Hong Kong
utility stocks (peers: c.2-4%), except GDI at 5% for 2021E, on 10% DPS growth over 2018-21E, on our estimates.
Daiwa’s Chief Strategist Paul Kitney has a bearish 2H19-2020 outlook, with a potential global economic downturn likely to
trigger disinflation, which would favour a dividend strategy as investors seek sustainable yields amid a declining bond
yield and inflation environment.
Further selling by CKI still an overhang, but less likely under an easing credit market
According to management, parent CKI (1038 HK, HKD64.75, Buy [1]) has room to issue a further USD500-800m in
perpetual securities, at c.5.0%, should it require funds for sizeable M&A earning a 10% cash yield. However, we do not
rule out the possibility that CKI may further dispose of PAH’s shares if PAH’s yield narrows to 4.8% or its share price rises
to HKD58.5 (+1.9% from the current level), given the cost of issuing perpetual securities would be higher than PAH’s yield
by then.
While we continue to prefer CKI over PAH, we have a Hold (3) rating on PAH with our SOTP-based 12-month TP
remaining unchanged at HKD54. Key upside/downside risks: better-/worse-than-expected outcome in the UK regulatory
return reset, and slower-/faster-than-expected US interest-rate hikes.
Share price: HKD57.4 (2 Jul 2019) Rating: Hold (3) Target Price: HKD54.0
25
Asian Dividend Strategy: 5 July 2019
Guangdong Investment (270 HK)
Investment thesis
Attractive absolute yield and yield growth
GDI’s share price has risen by 6% since 3 May 2019 vs. a 4% drop in the HSI, likely due mainly to investors’ risk-averse
behaviour post the escalation of the China-US trade dispute. We select GDI as one of our 3 preferred equity income-
focused utilities for the RUST sector, given its:
1. 0.29 3-year trailing beta.
2. 4.0% 2020E dividend yield.
3. 3.6% 2020E FCF yield.
4. 12% net short-term cash-to-equity ratio.
5. 18% 2008-18 DPS CAGR, with DPS rising YoY.
Valuation
Three major earnings growth drivers in 2019E
In our view, the 3 earnings growth drivers for GDI in 2019E will be: 1) non-Dongjiang water projects, 2) the Zhuguanglu
property project, and 3) the Dongguan Yinping Road PPP project. In 2018, the company acquired new water projects
worth CNY5.9bn (vs. CNY4.8bn in 2017), which will be built in the next few years.
Further yield gap expansion for GDI
Management expects GDI’s payout ratio to be capped at 90%; we forecast GDI to achieve 10% YoY DPS growth over
2019-21, as we expect it to record only a 70-73% payout, on an 8% net profit CAGR over 2019-21E, where operating
cash flow of HKD8-10bn pa should be sufficient for a HKD3.9-4.7bn dividend payment pa plus c.HKD4.3-6.4bn capex pa.
Hence, we expect GDI to see a 0.8pp expansion of its 2019-21E yield (Hong Kong utility peers: from a 1.0pp drop to
0.4pp expansion). Compared with CRG, another preferred equity income-focused utility, GDI has a 1pp higher yield
despite a 0.3pp lower expansion, on our forecasts.
Attractive valuation vs. other Hong Kong utilities peers
We view GDI’s 3.7% 2019E dividend yield as attractive and its 19x 2019E PER as undemanding vs. Hong Kong and
China Gas (3 HK, HKD29.8, Outperform [2]), which maintains a 1-for-10 bonus share policy at a 38x 2019E PER and
2.0% dividend yield. GDI is also the only Hong Kong utility without a share-price overhang or return cut in 2019E vs. CLP
(2 HK, HKD87.35, Underperform [4]), which is trading at a 20x 2019E PER and 3.6% dividend yield, and CK
Infrastructure (1038 HK, HKD64.75, Buy [1]), whose UK overhang will only be removed on the return reset result of
Northumbrian Water in 4Q19.
We recently downgraded GDI from Buy (1) to Outperform (2) as its share price has risen by 12% since mid-April, but
raised our SOTP-based 12-month TP from HKD17.2 to HKD18.3. Key risk: slow-than-expected acquisition of new water
projects.
Share price: HKD15.82 (2 Jul 2019) Rating: Outperform (2) Target Price: HKD18.30
26
Asian Dividend Strategy: 5 July 2019
China Resources Gas (1193 HK)
Investment thesis
Yield grower favoured amid policy noise
Despite a 6-9% city-gate tariff hike for non-residential gas in June and concerns of full cost pass-through amid tough
economic conditions with the US-China trade tensions, we estimate that CRG’s strong net-cash balance sheet and FCF
will enable a 21% 2018-21E DPS CAGR (peers: 8-16%), resulting in a 1.1pp expansion in its 2019-21E yield vs. peers’
0.3-0.7pp. Hence, we select CRG as one of our 3 preferred equity income-focused utilities for the RUST group, given its:
1. 0.34 3-year trailing beta.
2. 3.0% 2020E dividend yield.
3. 3.8% 2020E FCF yield.
4. 25% net short-term cash-to-equity ratio.
5. 34% 2008-18 DPS CAGR, with DPS rising YoY.
Valuation
City-gate tariff hike expected; dollar margin squeeze in case of insufficient pass-through possible, but
manageable
According to Reuters, CNPC has agreed to raise the non-residential city-gate tariff by 6.4% in the near term, which is well
below the requested 20% in April. We expect the city-gate tariff to rise by CNY0.08-0.13/m3; CRG should be able to pass
through the majority of the hike to non-coal-to-gas customers, in our view.
Strong balance sheet; the only gas company to raise its payout ratio
With HKD8.3bn in operating cash flow, CRG generated c.CNY2.3bn in free cash flow in 2018. Hence, the company
returned to a net cash position of HKD1.7bn as at end-December 2018 and was able to raise its payout from 33% in 2017
to 38% in 2018 for 40% YoY DPS growth. Despite our forecast of a 13% 2018-21 EPS CAGR for CRG, we expect the
company to record a 21% DPS CAGR over the same period, with the payout further improving from 38% to 47% in
2021E.
CRG’s 1H18 HKD-reported earnings expanded by 28% YoY on strong industrial gas sales, as the CNY appreciated
versus the HKD by 9% YoY. Although we look for CRG’s 1H19 HKD-reported earnings growth to slow to a low-teen
percentage YoY due to the 7% YoY depreciation of the CNY versus the HKD, we expect the company to raise its interim
dividend payout to offset the impact (last raise: 2016).
We have an Outperform (2) rating on CRG, and recently raised our DCF-based 12-month TP to HKD42.0 from HKD39.5,
which would be in line with the stock’s past-11-year average PER of 15.5x. Key downside risk: lower-than-expected dollar
margin on gas sales.
Share price: HKD38.8 (2 Jul 2019) Rating: Outperform (2) Target Price: HKD42.0
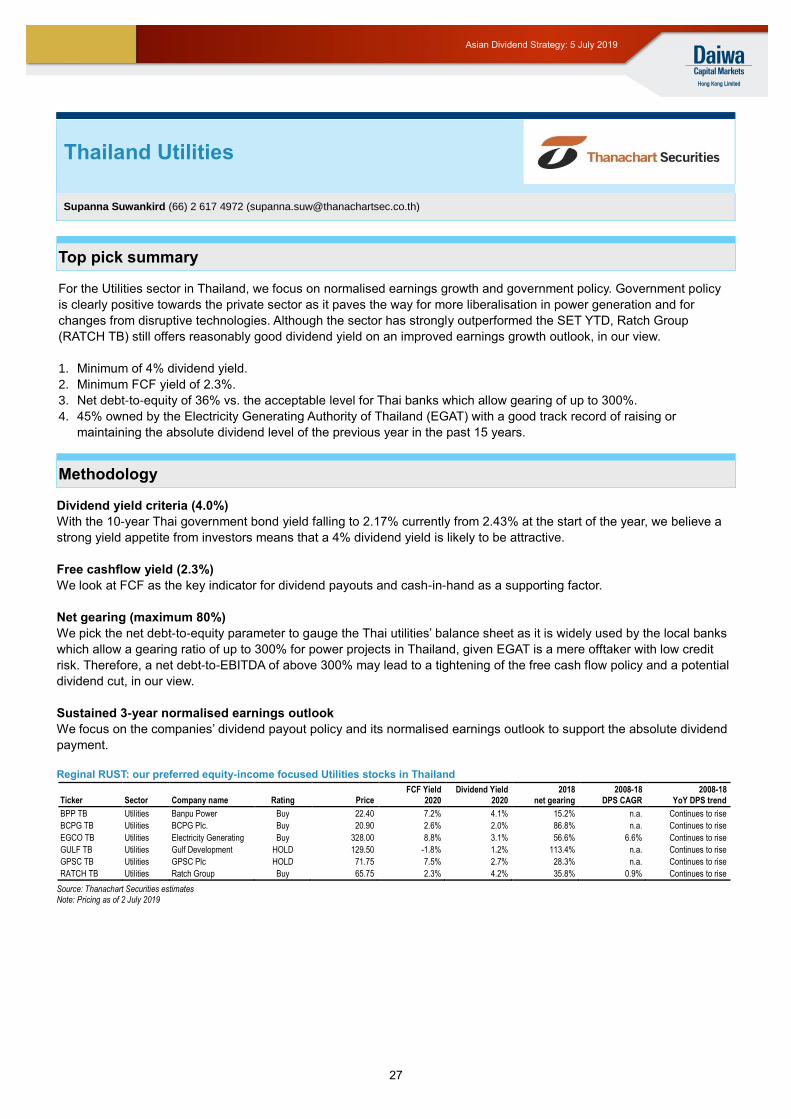
27
Asian Dividend Strategy: 5 July 2019
Top pick summary
For the Utilities sector in Thailand, we focus on normalised earnings growth and government policy. Government policy
is clearly positive towards the private sector as it paves the way for more liberalisation in power generation and for
changes from disruptive technologies. Although the sector has strongly outperformed the SET YTD, Ratch Group
(RATCH TB) still offers reasonably good dividend yield on an improved earnings growth outlook, in our view.
1. Minimum of 4% dividend yield.
2. Minimum FCF yield of 2.3%.
3. Net debt-to-equity of 36% vs. the acceptable level for Thai banks which allow gearing of up to 300%.
4. 45% owned by the Electricity Generating Authority of Thailand (EGAT) with a good track record of raising or
maintaining the absolute dividend level of the previous year in the past 15 years.
Methodology
Dividend yield criteria (4.0%)
With the 10-year Thai government bond yield falling to 2.17% currently from 2.43% at the start of the year, we believe a
strong yield appetite from investors means that a 4% dividend yield is likely to be attractive.
Free cashflow yield (2.3%)
We look at FCF as the key indicator for dividend payouts and cash-in-hand as a supporting factor.
Net gearing (maximum 80%)
We pick the net debt-to-equity parameter to gauge the Thai utilities’ balance sheet as it is widely used by the local banks
which allow a gearing ratio of up to 300% for power projects in Thailand, given EGAT is a mere offtaker with low credit
risk. Therefore, a net debt-to-EBITDA of above 300% may lead to a tightening of the free cash flow policy and a potential
dividend cut, in our view.
Sustained 3-year normalised earnings outlook
We focus on the companies’ dividend payout policy and its normalised earnings outlook to support the absolute dividend
payment.
Reginal RUST: our preferred equity-income focused Utilities stocks in Thailand
Ticker Sector Company name Rating Price FCF Yield
2020 Dividend Yield
2020 2018
net gearing 2008-18
DPS CAGR 2008-18
YoY DPS trend
BPP TB Utilities Banpu Power Buy 22.40 7.2% 4.1% 15.2% n.a. Continues to rise
BCPG TB Utilities BCPG Plc. Buy 20.90 2.6% 2.0% 86.8% n.a. Continues to rise
EGCO TB Utilities Electricity Generating Buy 328.00 8.8% 3.1% 56.6% 6.6% Continues to rise
GULF TB Utilities Gulf Development HOLD 129.50 -1.8% 1.2% 113.4% n.a. Continues to rise
GPSC TB Utilities GPSC Plc HOLD 71.75 7.5% 2.7% 28.3% n.a. Continues to rise
RATCH TB Utilities Ratch Group Buy 65.75 2.3% 4.2% 35.8% 0.9% Continues to rise
Source: Thanachart Securities estimates Note: Pricing as of 2 July 2019
Thailand Utilities
Supanna Suwankird (66) 2 617 4972 ([email protected])
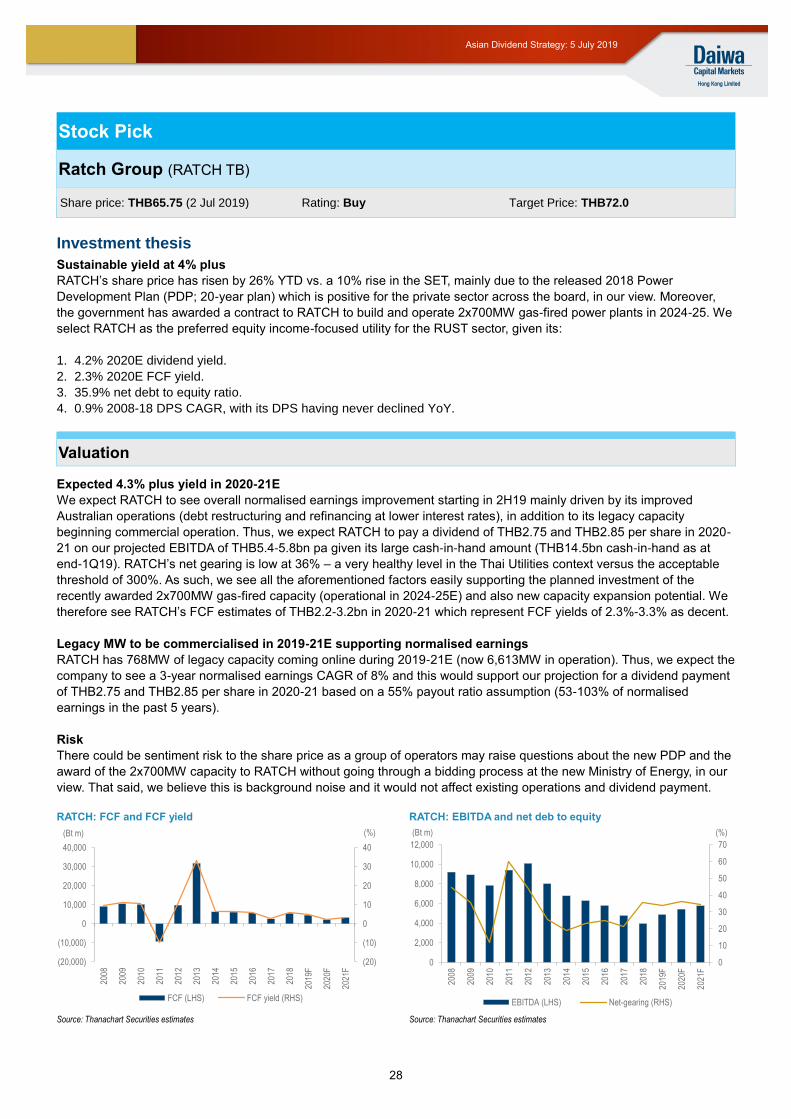
28
Asian Dividend Strategy: 5 July 2019
Stock Pick
Ratch Group (RATCH TB)
Investment thesis
Sustainable yield at 4% plus
RATCH’s share price has risen by 26% YTD vs. a 10% rise in the SET, mainly due to the released 2018 Power
Development Plan (PDP; 20-year plan) which is positive for the private sector across the board, in our view. Moreover,
the government has awarded a contract to RATCH to build and operate 2x700MW gas-fired power plants in 2024-25. We
select RATCH as the preferred equity income-focused utility for the RUST sector, given its:
1. 4.2% 2020E dividend yield.
2. 2.3% 2020E FCF yield.
3. 35.9% net debt to equity ratio.
4. 0.9% 2008-18 DPS CAGR, with its DPS having never declined YoY.
Valuation
Expected 4.3% plus yield in 2020-21E
We expect RATCH to see overall normalised earnings improvement starting in 2H19 mainly driven by its improved
Australian operations (debt restructuring and refinancing at lower interest rates), in addition to its legacy capacity
beginning commercial operation. Thus, we expect RATCH to pay a dividend of THB2.75 and THB2.85 per share in 2020-
21 on our projected EBITDA of THB5.4-5.8bn pa given its large cash-in-hand amount (THB14.5bn cash-in-hand as at
end-1Q19). RATCH’s net gearing is low at 36% – a very healthy level in the Thai Utilities context versus the acceptable
threshold of 300%. As such, we see all the aforementioned factors easily supporting the planned investment of the
recently awarded 2x700MW gas-fired capacity (operational in 2024-25E) and also new capacity expansion potential. We
therefore see RATCH’s FCF estimates of THB2.2-3.2bn in 2020-21 which represent FCF yields of 2.3%-3.3% as decent.
Legacy MW to be commercialised in 2019-21E supporting normalised earnings
RATCH has 768MW of legacy capacity coming online during 2019-21E (now 6,613MW in operation). Thus, we expect the
company to see a 3-year normalised earnings CAGR of 8% and this would support our projection for a dividend payment
of THB2.75 and THB2.85 per share in 2020-21 based on a 55% payout ratio assumption (53-103% of normalised
earnings in the past 5 years).
Risk
There could be sentiment risk to the share price as a group of operators may raise questions about the new PDP and the
award of the 2x700MW capacity to RATCH without going through a bidding process at the new Ministry of Energy, in our
view. That said, we believe this is background noise and it would not affect existing operations and dividend payment.
RATCH: FCF and FCF yield RATCH: EBITDA and net deb to equity
Source: Thanachart Securities estimates Source: Thanachart Securities estimates
(20)
(10)
0
10
20
30
40
(20,000)
(10,000)
0
10,000
20,000
30,000
40,000
2008
2009
2010
2011
2012
2013
2014
2015
2016
2017
2018
2019
F
2020
F
2021
F
(%)(Bt m)
FCF (LHS) FCF yield (RHS)
0
10
20
30
40
50
60
70
0
2,000
4,000
6,000
8,000
10,000
12,000
2008
2009
2010
2011
2012
2013
2014
2015
2016
2017
2018
2019
F
2020
F
2021
F
(%)(Bt m)
EBITDA (LHS) Net-gearing (RHS)
Share price: THB65.75 (2 Jul 2019) Rating: Buy Target Price: THB72.0
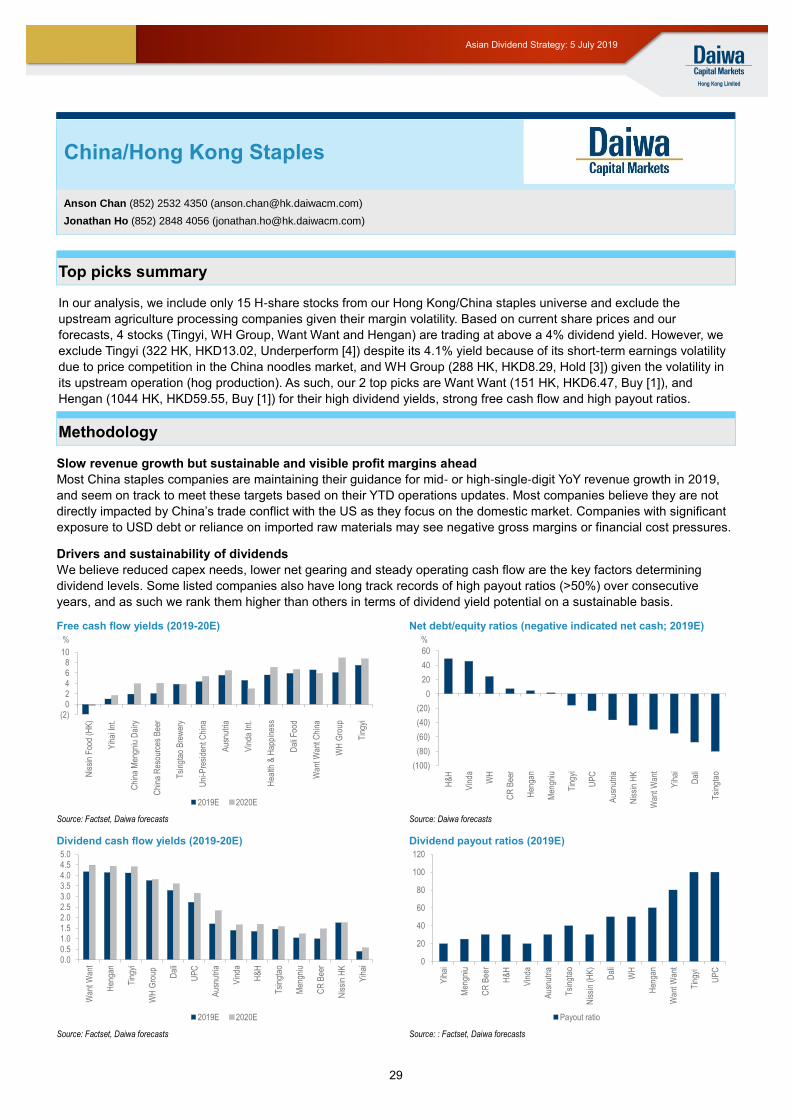
29
Asian Dividend Strategy: 5 July 2019
Top picks summary
In our analysis, we include only 15 H-share stocks from our Hong Kong/China staples universe and exclude the
upstream agriculture processing companies given their margin volatility. Based on current share prices and our
forecasts, 4 stocks (Tingyi, WH Group, Want Want and Hengan) are trading at above a 4% dividend yield. However, we
exclude Tingyi (322 HK, HKD13.02, Underperform [4]) despite its 4.1% yield because of its short-term earnings volatility
due to price competition in the China noodles market, and WH Group (288 HK, HKD8.29, Hold [3]) given the volatility in
its upstream operation (hog production). As such, our 2 top picks are Want Want (151 HK, HKD6.47, Buy [1]), and
Hengan (1044 HK, HKD59.55, Buy [1]) for their high dividend yields, strong free cash flow and high payout ratios.
Methodology
Slow revenue growth but sustainable and visible profit margins ahead
Most China staples companies are maintaining their guidance for mid- or high-single-digit YoY revenue growth in 2019,
and seem on track to meet these targets based on their YTD operations updates. Most companies believe they are not
directly impacted by China’s trade conflict with the US as they focus on the domestic market. Companies with significant
exposure to USD debt or reliance on imported raw materials may see negative gross margins or financial cost pressures.
Drivers and sustainability of dividends
We believe reduced capex needs, lower net gearing and steady operating cash flow are the key factors determining
dividend levels. Some listed companies also have long track records of high payout ratios (>50%) over consecutive
years, and as such we rank them higher than others in terms of dividend yield potential on a sustainable basis.
Free cash flow yields (2019-20E) Net debt/equity ratios (negative indicated net cash; 2019E)
Source: Factset, Daiwa forecasts Source: Daiwa forecasts
Dividend cash flow yields (2019-20E) Dividend payout ratios (2019E)
Source: Factset, Daiwa forecasts Source: : Factset, Daiwa forecasts
(2)02468
10
Nis
sin
Foo
d (H
K)
Yih
ai In
t.
Chi
na M
engn
iu D
airy
Chi
na R
esou
rces
Bee
r
Tsi
ngta
o B
rew
ery
Uni
-Pre
side
nt C
hina
Aus
nutr
ia
Vin
da I
nt.
Hea
lth &
Hap
pine
ss
Dal
i Foo
d
Wan
t Wan
t Chi
na
WH
Gro
up
Tin
gyi
2019E 2020E
%
(100)
(80)
(60)
(40)
(20)
0
20
40
60
H&
H
Vin
da WH
CR
Bee
r
Hen
gan
Men
gniu
Tin
gyi
UP
C
Aus
nutr
ia
Nis
sin
HK
Wan
t Wan
t
Yih
ai
Dal
i
Tsi
ngta
o
%
0.00.51.01.52.02.53.03.54.04.55.0
Wan
t Wan
t
Hen
gan
Tin
gyi
WH
Gro
up Dal
i
UP
C
Aus
nutr
ia
Vin
da
H&
H
Tsi
ngta
o
Men
gniu
CR
Bee
r
Nis
sin
HK
Yih
ai
2019E 2020E
0
20
40
60
80
100
120
Yih
ai
Men
gniu
CR
Bee
r
H&
H
Vin
da
Aus
nutr
ia
Tsi
ngta
o
Nis
sin
(HK
)
Dal
i
WH
Hen
gan
Wan
t Wan
t
Tin
gyi
UP
C
Payout ratio
China/Hong Kong Staples
Anson Chan (852) 2532 4350 ([email protected])
Jonathan Ho (852) 2848 4056 ([email protected])
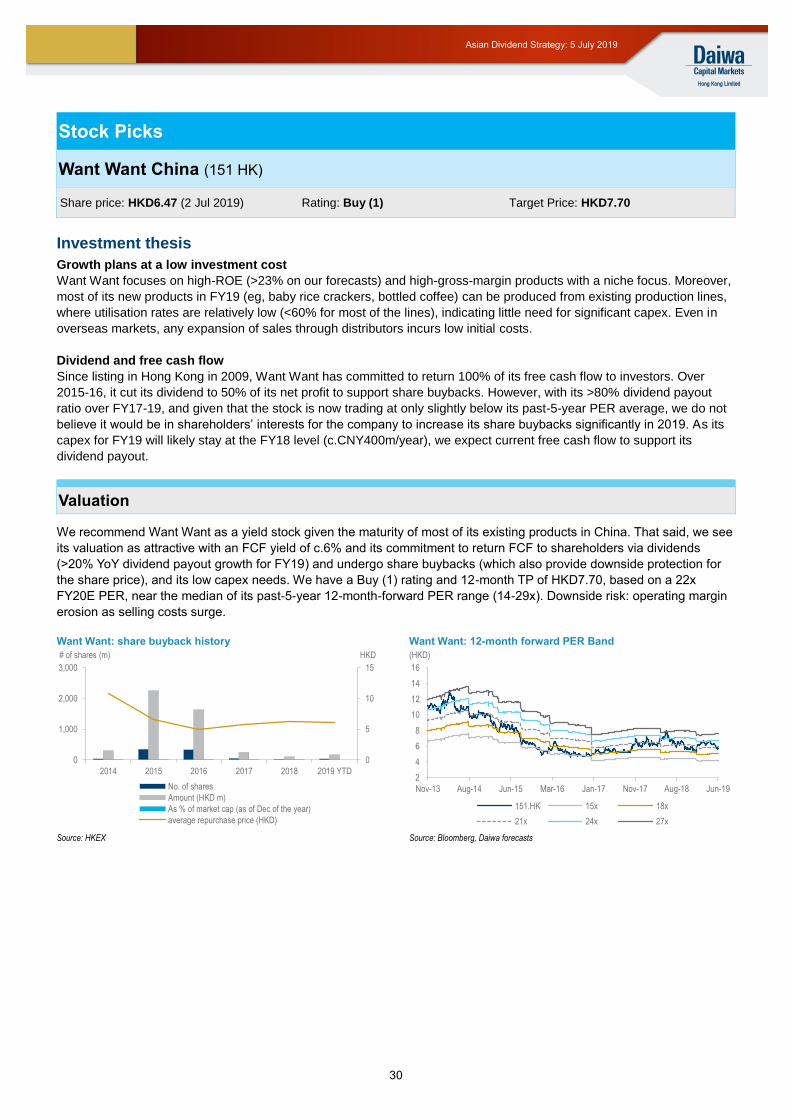
30
Asian Dividend Strategy: 5 July 2019
Stock Picks
Want Want China (151 HK)
Investment thesis
Growth plans at a low investment cost
Want Want focuses on high-ROE (>23% on our forecasts) and high-gross-margin products with a niche focus. Moreover,
most of its new products in FY19 (eg, baby rice crackers, bottled coffee) can be produced from existing production lines,
where utilisation rates are relatively low (<60% for most of the lines), indicating little need for significant capex. Even in
overseas markets, any expansion of sales through distributors incurs low initial costs.
Dividend and free cash flow
Since listing in Hong Kong in 2009, Want Want has committed to return 100% of its free cash flow to investors. Over
2015-16, it cut its dividend to 50% of its net profit to support share buybacks. However, with its >80% dividend payout
ratio over FY17-19, and given that the stock is now trading at only slightly below its past-5-year PER average, we do not
believe it would be in shareholders’ interests for the company to increase its share buybacks significantly in 2019. As its
capex for FY19 will likely stay at the FY18 level (c.CNY400m/year), we expect current free cash flow to support its
dividend payout.
Valuation
We recommend Want Want as a yield stock given the maturity of most of its existing products in China. That said, we see
its valuation as attractive with an FCF yield of c.6% and its commitment to return FCF to shareholders via dividends
(>20% YoY dividend payout growth for FY19) and undergo share buybacks (which also provide downside protection for
the share price), and its low capex needs. We have a Buy (1) rating and 12-month TP of HKD7.70, based on a 22x
FY20E PER, near the median of its past-5-year 12-month-forward PER range (14-29x). Downside risk: operating margin
erosion as selling costs surge.
Want Want: share buyback history Want Want: 12-month forward PER Band
Source: HKEX Source: Bloomberg, Daiwa forecasts
0
5
10
15
0
1,000
2,000
3,000
2014 2015 2016 2017 2018 2019 YTD
No. of shares
Amount (HKD m)
As % of market cap (as of Dec of the year)
average repurchase price (HKD)
# of shares (m) HKD
2
4
6
8
10
12
14
16
Nov-13 Aug-14 Jun-15 Mar-16 Jan-17 Nov-17 Aug-18 Jun-19
151.HK 15x 18x
21x 24x 27x
(HKD)
Share price: HKD6.47 (2 Jul 2019) Rating: Buy (1) Target Price: HKD7.70
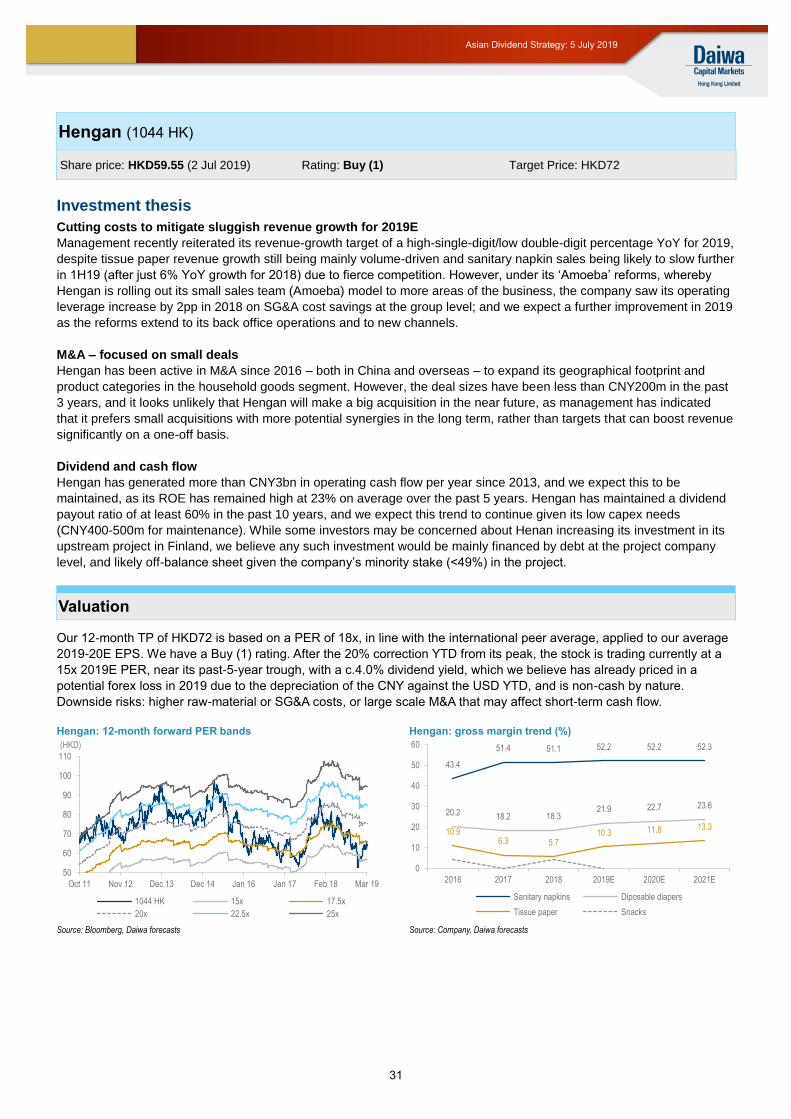
31
Asian Dividend Strategy: 5 July 2019
Hengan (1044 HK)
Investment thesis
Cutting costs to mitigate sluggish revenue growth for 2019E
Management recently reiterated its revenue-growth target of a high-single-digit/low double-digit percentage YoY for 2019,
despite tissue paper revenue growth still being mainly volume-driven and sanitary napkin sales being likely to slow further
in 1H19 (after just 6% YoY growth for 2018) due to fierce competition. However, under its ‘Amoeba’ reforms, whereby
Hengan is rolling out its small sales team (Amoeba) model to more areas of the business, the company saw its operating
leverage increase by 2pp in 2018 on SG&A cost savings at the group level; and we expect a further improvement in 2019
as the reforms extend to its back office operations and to new channels.
M&A – focused on small deals
Hengan has been active in M&A since 2016 – both in China and overseas – to expand its geographical footprint and
product categories in the household goods segment. However, the deal sizes have been less than CNY200m in the past
3 years, and it looks unlikely that Hengan will make a big acquisition in the near future, as management has indicated
that it prefers small acquisitions with more potential synergies in the long term, rather than targets that can boost revenue
significantly on a one-off basis.
Dividend and cash flow
Hengan has generated more than CNY3bn in operating cash flow per year since 2013, and we expect this to be
maintained, as its ROE has remained high at 23% on average over the past 5 years. Hengan has maintained a dividend
payout ratio of at least 60% in the past 10 years, and we expect this trend to continue given its low capex needs
(CNY400-500m for maintenance). While some investors may be concerned about Henan increasing its investment in its
upstream project in Finland, we believe any such investment would be mainly financed by debt at the project company
level, and likely off-balance sheet given the company’s minority stake (<49%) in the project.
Valuation
Our 12-month TP of HKD72 is based on a PER of 18x, in line with the international peer average, applied to our average
2019-20E EPS. We have a Buy (1) rating. After the 20% correction YTD from its peak, the stock is trading currently at a
15x 2019E PER, near its past-5-year trough, with a c.4.0% dividend yield, which we believe has already priced in a
potential forex loss in 2019 due to the depreciation of the CNY against the USD YTD, and is non-cash by nature.
Downside risks: higher raw-material or SG&A costs, or large scale M&A that may affect short-term cash flow.
Hengan: 12-month forward PER bands Hengan: gross margin trend (%)
Source: Bloomberg, Daiwa forecasts Source: Company, Daiwa forecasts
50
60
70
80
90
100
110
Oct 11 Nov 12 Dec 13 Dec 14 Jan 16 Jan 17 Feb 18 Mar 19
1044 HK 15x 17.5x
20x 22.5x 25x
(HKD)
43.4
51.4 51.1 52.2 52.2 52.3
20.2 18.2 18.321.9 22.7 23.6
10.96.3 5.7
10.3 11.8 13.3
0
10
20
30
40
50
60
2016 2017 2018 2019E 2020E 2021E
Sanitary napkins Diposable diapers
Tissue paper Snacks
Share price: HKD59.55 (2 Jul 2019) Rating: Buy (1) Target Price: HKD72
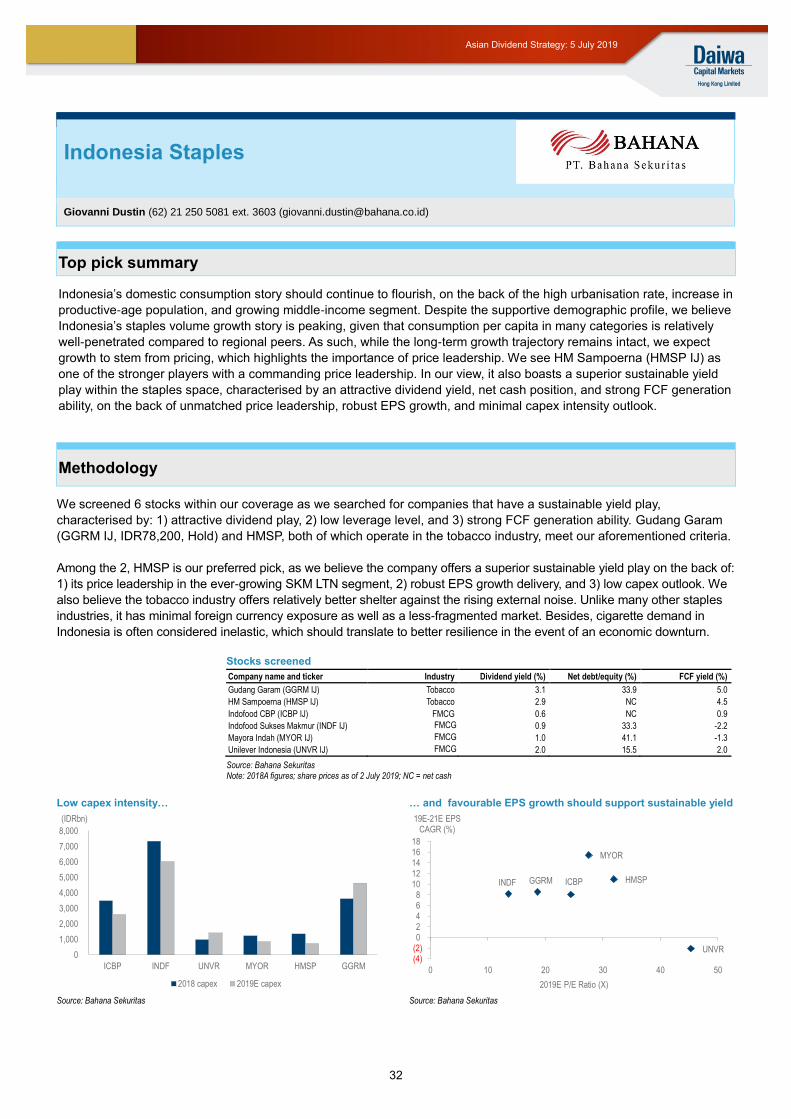
32
Asian Dividend Strategy: 5 July 2019
Indonesia Staples
Giovanni Dustin (62) 21 250 5081 ext. 3603 ([email protected])
Top pick summary
Indonesia’s domestic consumption story should continue to flourish, on the back of the high urbanisation rate, increase in
productive-age population, and growing middle-income segment. Despite the supportive demographic profile, we believe
Indonesia’s staples volume growth story is peaking, given that consumption per capita in many categories is relatively
well-penetrated compared to regional peers. As such, while the long-term growth trajectory remains intact, we expect
growth to stem from pricing, which highlights the importance of price leadership. We see HM Sampoerna (HMSP IJ) as
one of the stronger players with a commanding price leadership. In our view, it also boasts a superior sustainable yield
play within the staples space, characterised by an attractive dividend yield, net cash position, and strong FCF generation
ability, on the back of unmatched price leadership, robust EPS growth, and minimal capex intensity outlook.
Methodology
We screened 6 stocks within our coverage as we searched for companies that have a sustainable yield play,
characterised by: 1) attractive dividend play, 2) low leverage level, and 3) strong FCF generation ability. Gudang Garam
(GGRM IJ, IDR78,200, Hold) and HMSP, both of which operate in the tobacco industry, meet our aforementioned criteria.
Among the 2, HMSP is our preferred pick, as we believe the company offers a superior sustainable yield play on the back of:
1) its price leadership in the ever-growing SKM LTN segment, 2) robust EPS growth delivery, and 3) low capex outlook. We
also believe the tobacco industry offers relatively better shelter against the rising external noise. Unlike many other staples
industries, it has minimal foreign currency exposure as well as a less-fragmented market. Besides, cigarette demand in
Indonesia is often considered inelastic, which should translate to better resilience in the event of an economic downturn.
Stocks screened
Company name and ticker Industry Dividend yield (%) Net debt/equity (%) FCF yield (%)
Gudang Garam (GGRM IJ) Tobacco 3.1 33.9 5.0
HM Sampoerna (HMSP IJ) Tobacco 2.9 NC 4.5
Indofood CBP (ICBP IJ) FMCG 0.6 NC 0.9
Indofood Sukses Makmur (INDF IJ) FMCG 0.9 33.3 -2.2
Mayora Indah (MYOR IJ) FMCG 1.0 41.1 -1.3
Unilever Indonesia (UNVR IJ) FMCG 2.0 15.5 2.0
Source: Bahana Sekuritas Note: 2018A figures; share prices as of 2 July 2019; NC = net cash
Low capex intensity… … and favourable EPS growth should support sustainable yield
Source: Bahana Sekuritas Source: Bahana Sekuritas
0
1,000
2,000
3,000
4,000
5,000
6,000
7,000
8,000
ICBP INDF UNVR MYOR HMSP GGRM
(IDRbn)
2018 capex 2019E capex
ICBPINDF
UNVR
MYOR
HMSPGGRM
(4)(2)02468
1012141618
0 10 20 30 40 50
19E-21E EPS CAGR (%)
2019E P/E Ratio (X)
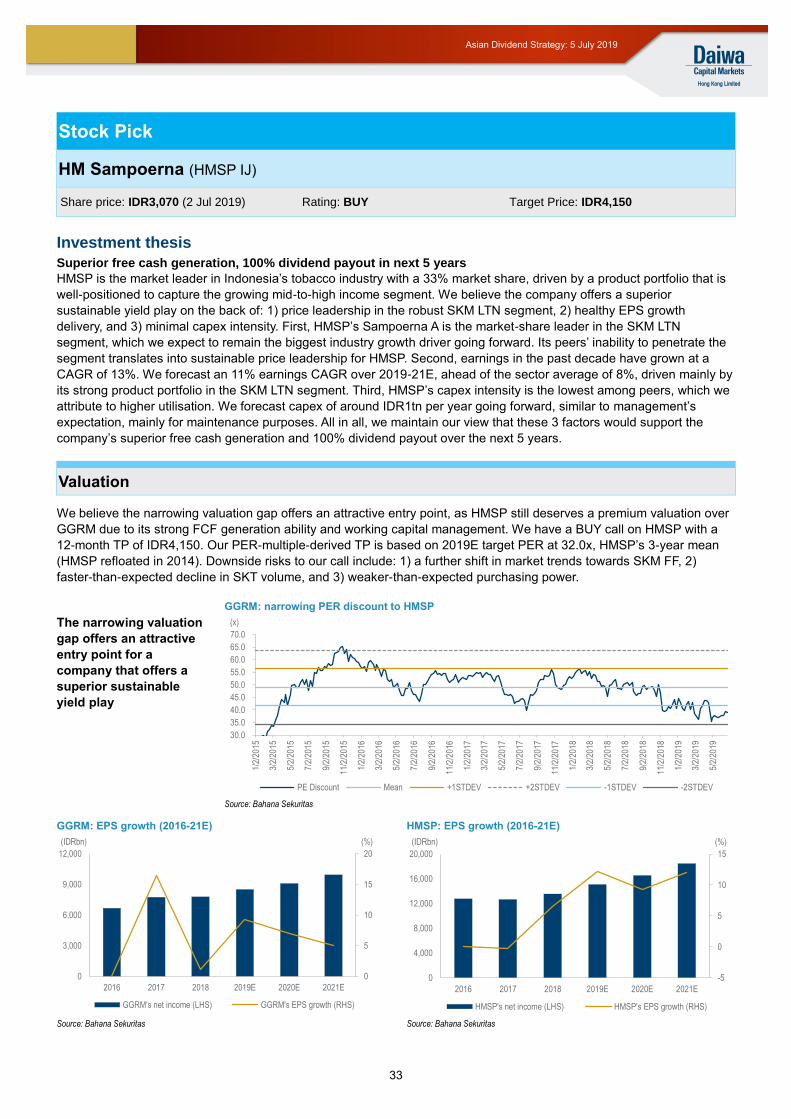
33
Asian Dividend Strategy: 5 July 2019
Stock Pick
HM Sampoerna (HMSP IJ)
Share price: IDR3,070 (2 Jul 2019) Rating: BUY Target Price: IDR4,150
Investment thesis
Superior free cash generation, 100% dividend payout in next 5 years
HMSP is the market leader in Indonesia’s tobacco industry with a 33% market share, driven by a product portfolio that is
well-positioned to capture the growing mid-to-high income segment. We believe the company offers a superior
sustainable yield play on the back of: 1) price leadership in the robust SKM LTN segment, 2) healthy EPS growth
delivery, and 3) minimal capex intensity. First, HMSP’s Sampoerna A is the market-share leader in the SKM LTN
segment, which we expect to remain the biggest industry growth driver going forward. Its peers’ inability to penetrate the
segment translates into sustainable price leadership for HMSP. Second, earnings in the past decade have grown at a
CAGR of 13%. We forecast an 11% earnings CAGR over 2019-21E, ahead of the sector average of 8%, driven mainly by
its strong product portfolio in the SKM LTN segment. Third, HMSP’s capex intensity is the lowest among peers, which we
attribute to higher utilisation. We forecast capex of around IDR1tn per year going forward, similar to management’s
expectation, mainly for maintenance purposes. All in all, we maintain our view that these 3 factors would support the
company’s superior free cash generation and 100% dividend payout over the next 5 years.
Valuation
We believe the narrowing valuation gap offers an attractive entry point, as HMSP still deserves a premium valuation over
GGRM due to its strong FCF generation ability and working capital management. We have a BUY call on HMSP with a
12-month TP of IDR4,150. Our PER-multiple-derived TP is based on 2019E target PER at 32.0x, HMSP’s 3-year mean
(HMSP refloated in 2014). Downside risks to our call include: 1) a further shift in market trends towards SKM FF, 2)
faster-than-expected decline in SKT volume, and 3) weaker-than-expected purchasing power.
GGRM: narrowing PER discount to HMSP
The narrowing valuation
gap offers an attractive
entry point for a
company that offers a
superior sustainable
yield play
Source: Bahana Sekuritas
GGRM: EPS growth (2016-21E) HMSP: EPS growth (2016-21E)
Source: Bahana Sekuritas Source: Bahana Sekuritas
30.0
35.0
40.0
45.0
50.0
55.0
60.0
65.0
70.0
1/2/
2015
3/2/
2015
5/2/
2015
7/2/
2015
9/2/
2015
11/2
/201
5
1/2/
2016
3/2/
2016
5/2/
2016
7/2/
2016
9/2/
2016
11/2
/201
6
1/2/
2017
3/2/
2017
5/2/
2017
7/2/
2017
9/2/
2017
11/2
/201
7
1/2/
2018
3/2/
2018
5/2/
2018
7/2/
2018
9/2/
2018
11/2
/201
8
1/2/
2019
3/2/
2019
5/2/
2019
(x)
PE Discount Mean +1STDEV +2STDEV -1STDEV -2STDEV
0
5
10
15
20
0
3,000
6,000
9,000
12,000
2016 2017 2018 2019E 2020E 2021E
(%)(IDRbn)
GGRM's net income (LHS) GGRM's EPS growth (RHS)
-5
0
5
10
15
0
4,000
8,000
12,000
16,000
20,000
2016 2017 2018 2019E 2020E 2021E
(%)(IDRbn)
HMSP's net income (LHS) HMSP's EPS growth (RHS)
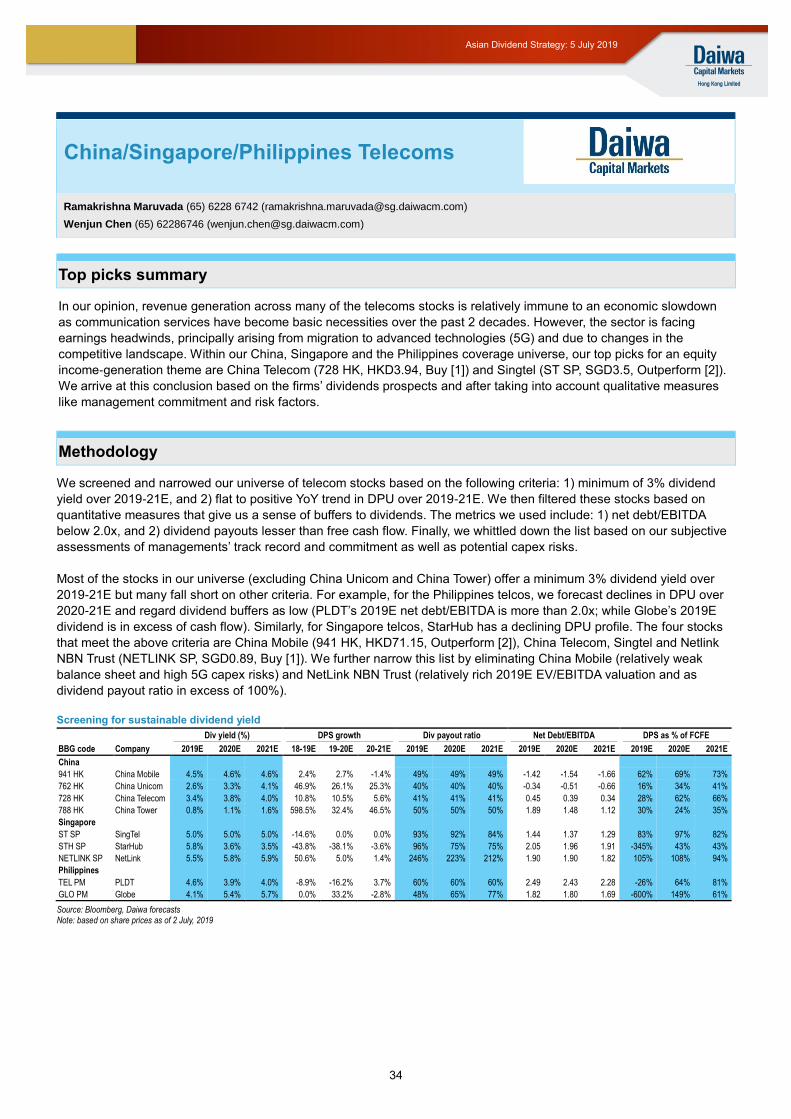
34
Asian Dividend Strategy: 5 July 2019
Top picks summary
In our opinion, revenue generation across many of the telecoms stocks is relatively immune to an economic slowdown
as communication services have become basic necessities over the past 2 decades. However, the sector is facing
earnings headwinds, principally arising from migration to advanced technologies (5G) and due to changes in the
competitive landscape. Within our China, Singapore and the Philippines coverage universe, our top picks for an equity
income-generation theme are China Telecom (728 HK, HKD3.94, Buy [1]) and Singtel (ST SP, SGD3.5, Outperform [2]).
We arrive at this conclusion based on the firms’ dividends prospects and after taking into account qualitative measures
like management commitment and risk factors.
Methodology
We screened and narrowed our universe of telecom stocks based on the following criteria: 1) minimum of 3% dividend
yield over 2019-21E, and 2) flat to positive YoY trend in DPU over 2019-21E. We then filtered these stocks based on
quantitative measures that give us a sense of buffers to dividends. The metrics we used include: 1) net debt/EBITDA
below 2.0x, and 2) dividend payouts lesser than free cash flow. Finally, we whittled down the list based on our subjective
assessments of managements’ track record and commitment as well as potential capex risks.
Most of the stocks in our universe (excluding China Unicom and China Tower) offer a minimum 3% dividend yield over
2019-21E but many fall short on other criteria. For example, for the Philippines telcos, we forecast declines in DPU over
2020-21E and regard dividend buffers as low (PLDT’s 2019E net debt/EBITDA is more than 2.0x; while Globe’s 2019E
dividend is in excess of cash flow). Similarly, for Singapore telcos, StarHub has a declining DPU profile. The four stocks
that meet the above criteria are China Mobile (941 HK, HKD71.15, Outperform [2]), China Telecom, Singtel and Netlink
NBN Trust (NETLINK SP, SGD0.89, Buy [1]). We further narrow this list by eliminating China Mobile (relatively weak
balance sheet and high 5G capex risks) and NetLink NBN Trust (relatively rich 2019E EV/EBITDA valuation and as
dividend payout ratio in excess of 100%).
Screening for sustainable dividend yield
Div yield (%) DPS growth Div payout ratio Net Debt/EBITDA DPS as % of FCFE
BBG code Company 2019E 2020E 2021E 18-19E 19-20E 20-21E 2019E 2020E 2021E 2019E 2020E 2021E 2019E 2020E 2021E
China
941 HK China Mobile 4.5% 4.6% 4.6% 2.4% 2.7% -1.4% 49% 49% 49% -1.42 -1.54 -1.66 62% 69% 73%
762 HK China Unicom 2.6% 3.3% 4.1% 46.9% 26.1% 25.3% 40% 40% 40% -0.34 -0.51 -0.66 16% 34% 41%
728 HK China Telecom 3.4% 3.8% 4.0% 10.8% 10.5% 5.6% 41% 41% 41% 0.45 0.39 0.34 28% 62% 66%
788 HK China Tower 0.8% 1.1% 1.6% 598.5% 32.4% 46.5% 50% 50% 50% 1.89 1.48 1.12 30% 24% 35%
Singapore
ST SP SingTel 5.0% 5.0% 5.0% -14.6% 0.0% 0.0% 93% 92% 84% 1.44 1.37 1.29 83% 97% 82%
STH SP StarHub 5.8% 3.6% 3.5% -43.8% -38.1% -3.6% 96% 75% 75% 2.05 1.96 1.91 -345% 43% 43%
NETLINK SP NetLink 5.5% 5.8% 5.9% 50.6% 5.0% 1.4% 246% 223% 212% 1.90 1.90 1.82 105% 108% 94%
Philippines
TEL PM PLDT 4.6% 3.9% 4.0% -8.9% -16.2% 3.7% 60% 60% 60% 2.49 2.43 2.28 -26% 64% 81%
GLO PM Globe 4.1% 5.4% 5.7% 0.0% 33.2% -2.8% 48% 65% 77% 1.82 1.80 1.69 -600% 149% 61%
Source: Bloomberg, Daiwa forecasts Note: based on share prices as of 2 July, 2019
– XXXX summary text here XXXX
China/Singapore/Philippines Telecoms
Ramakrishna Maruvada (65) 6228 6742 ([email protected])
Wenjun Chen (65) 62286746 ([email protected])
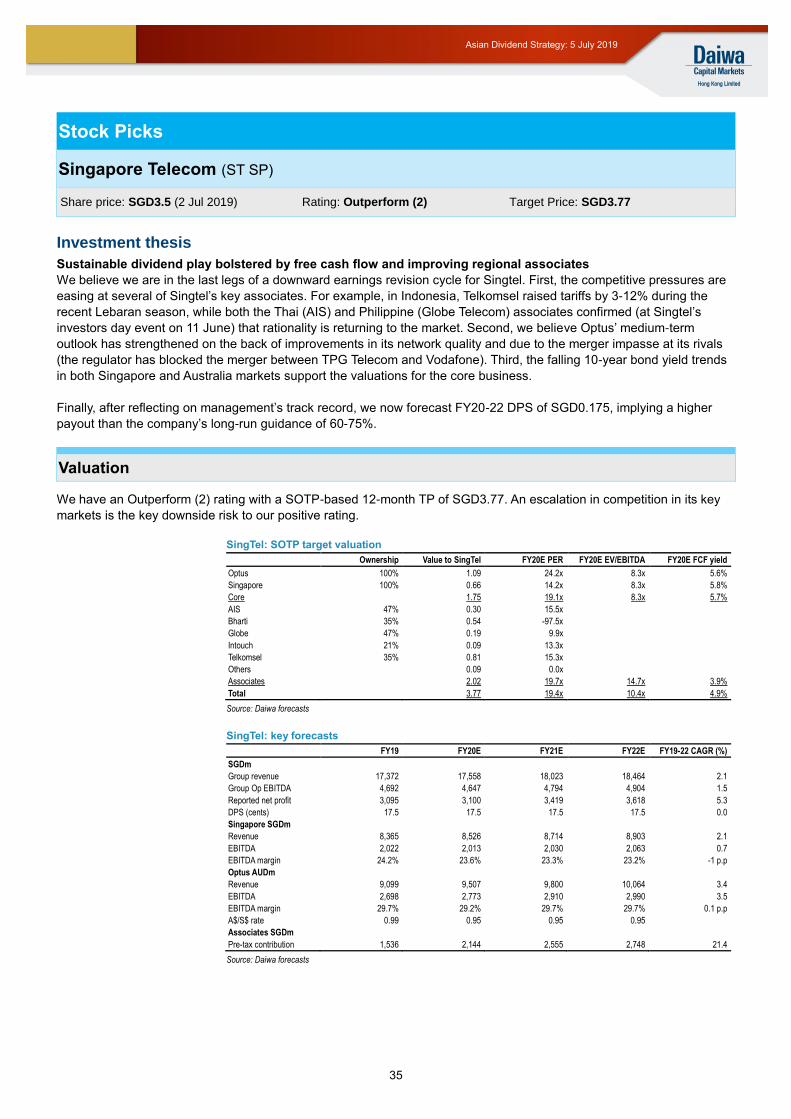
35
Asian Dividend Strategy: 5 July 2019
Stock Picks
Singapore Telecom (ST SP)
Share price: SGD3.5 (2 Jul 2019) Rating: Outperform (2) Target Price: SGD3.77
Investment thesis
Sustainable dividend play bolstered by free cash flow and improving regional associates
We believe we are in the last legs of a downward earnings revision cycle for Singtel. First, the competitive pressures are
easing at several of Singtel’s key associates. For example, in Indonesia, Telkomsel raised tariffs by 3-12% during the
recent Lebaran season, while both the Thai (AIS) and Philippine (Globe Telecom) associates confirmed (at Singtel’s
investors day event on 11 June) that rationality is returning to the market. Second, we believe Optus’ medium-term
outlook has strengthened on the back of improvements in its network quality and due to the merger impasse at its rivals
(the regulator has blocked the merger between TPG Telecom and Vodafone). Third, the falling 10-year bond yield trends
in both Singapore and Australia markets support the valuations for the core business.
Finally, after reflecting on management’s track record, we now forecast FY20-22 DPS of SGD0.175, implying a higher
payout than the company’s long-run guidance of 60-75%.
Valuation
We have an Outperform (2) rating with a SOTP-based 12-month TP of SGD3.77. An escalation in competition in its key
markets is the key downside risk to our positive rating.
SingTel: SOTP target valuation
Ownership Value to SingTel FY20E PER FY20E EV/EBITDA FY20E FCF yield
Optus 100% 1.09 24.2x 8.3x 5.6%
Singapore 100% 0.66 14.2x 8.3x 5.8%
Core
1.75 19.1x 8.3x 5.7%
AIS 47% 0.30 15.5x
Bharti 35% 0.54 -97.5x
Globe 47% 0.19 9.9x
Intouch 21% 0.09 13.3x
Telkomsel 35% 0.81 15.3x
Others
0.09 0.0x
Associates
2.02 19.7x 14.7x 3.9%
Total
3.77 19.4x 10.4x 4.9%
Source: Daiwa forecasts
SingTel: key forecasts
FY19 FY20E FY21E FY22E FY19-22 CAGR (%)
SGDm
Group revenue 17,372 17,558 18,023 18,464 2.1
Group Op EBITDA 4,692 4,647 4,794 4,904 1.5
Reported net profit 3,095 3,100 3,419 3,618 5.3
DPS (cents) 17.5 17.5 17.5 17.5 0.0
Singapore SGDm
Revenue 8,365 8,526 8,714 8,903 2.1
EBITDA 2,022 2,013 2,030 2,063 0.7
EBITDA margin 24.2% 23.6% 23.3% 23.2% -1 p.p
Optus AUDm
Revenue 9,099 9,507 9,800 10,064 3.4
EBITDA 2,698 2,773 2,910 2,990 3.5
EBITDA margin 29.7% 29.2% 29.7% 29.7% 0.1 p.p
A$/S$ rate 0.99 0.95 0.95 0.95
Associates SGDm
Pre-tax contribution 1,536 2,144 2,555 2,748 21.4
Source: Daiwa forecasts
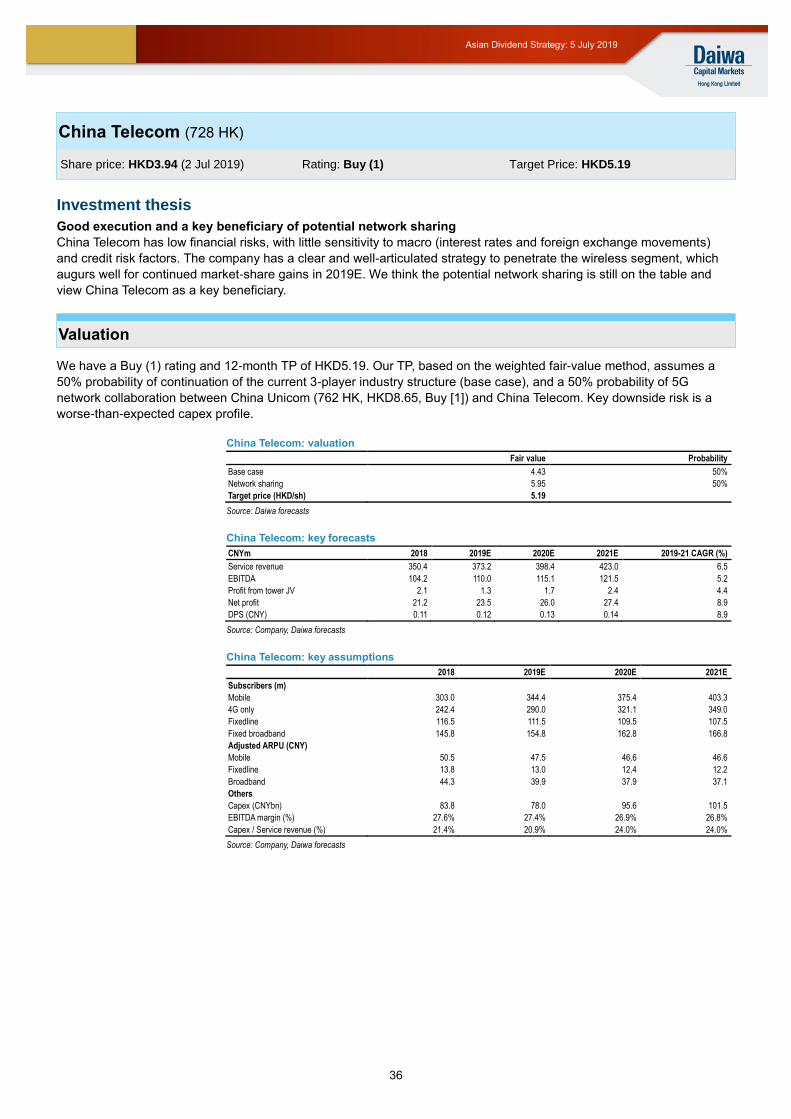
36
Asian Dividend Strategy: 5 July 2019
China Telecom (728 HK)
Share price: HKD3.94 (2 Jul 2019) Rating: Buy (1) Target Price: HKD5.19
Investment thesis
Good execution and a key beneficiary of potential network sharing
China Telecom has low financial risks, with little sensitivity to macro (interest rates and foreign exchange movements)
and credit risk factors. The company has a clear and well-articulated strategy to penetrate the wireless segment, which
augurs well for continued market-share gains in 2019E. We think the potential network sharing is still on the table and
view China Telecom as a key beneficiary.
Valuation
We have a Buy (1) rating and 12-month TP of HKD5.19. Our TP, based on the weighted fair-value method, assumes a
50% probability of continuation of the current 3-player industry structure (base case), and a 50% probability of 5G
network collaboration between China Unicom (762 HK, HKD8.65, Buy [1]) and China Telecom. Key downside risk is a
worse-than-expected capex profile.
China Telecom: valuation
Fair value Probability
Base case 4.43 50%
Network sharing 5.95 50%
Target price (HKD/sh) 5.19
Source: Daiwa forecasts
China Telecom: key forecasts
CNYm 2018 2019E 2020E 2021E 2019-21 CAGR (%)
Service revenue 350.4 373.2 398.4 423.0 6.5
EBITDA 104.2 110.0 115.1 121.5 5.2
Profit from tower JV 2.1 1.3 1.7 2.4 4.4
Net profit 21.2 23.5 26.0 27.4 8.9
DPS (CNY) 0.11 0.12 0.13 0.14 8.9
Source: Company, Daiwa forecasts
China Telecom: key assumptions
2018 2019E 2020E 2021E
Subscribers (m)
Mobile 303.0 344.4 375.4 403.3
4G only 242.4 290.0 321.1 349.0
Fixedline 116.5 111.5 109.5 107.5
Fixed broadband 145.8 154.8 162.8 166.8
Adjusted ARPU (CNY)
Mobile 50.5 47.5 46.6 46.6
Fixedline 13.8 13.0 12.4 12.2
Broadband 44.3 39.9 37.9 37.1
Others
Capex (CNYbn) 83.8 78.0 95.6 101.5
EBITDA margin (%) 27.6% 27.4% 26.9% 26.8%
Capex / Service revenue (%) 21.4% 20.9% 24.0% 24.0%
Source: Company, Daiwa forecasts
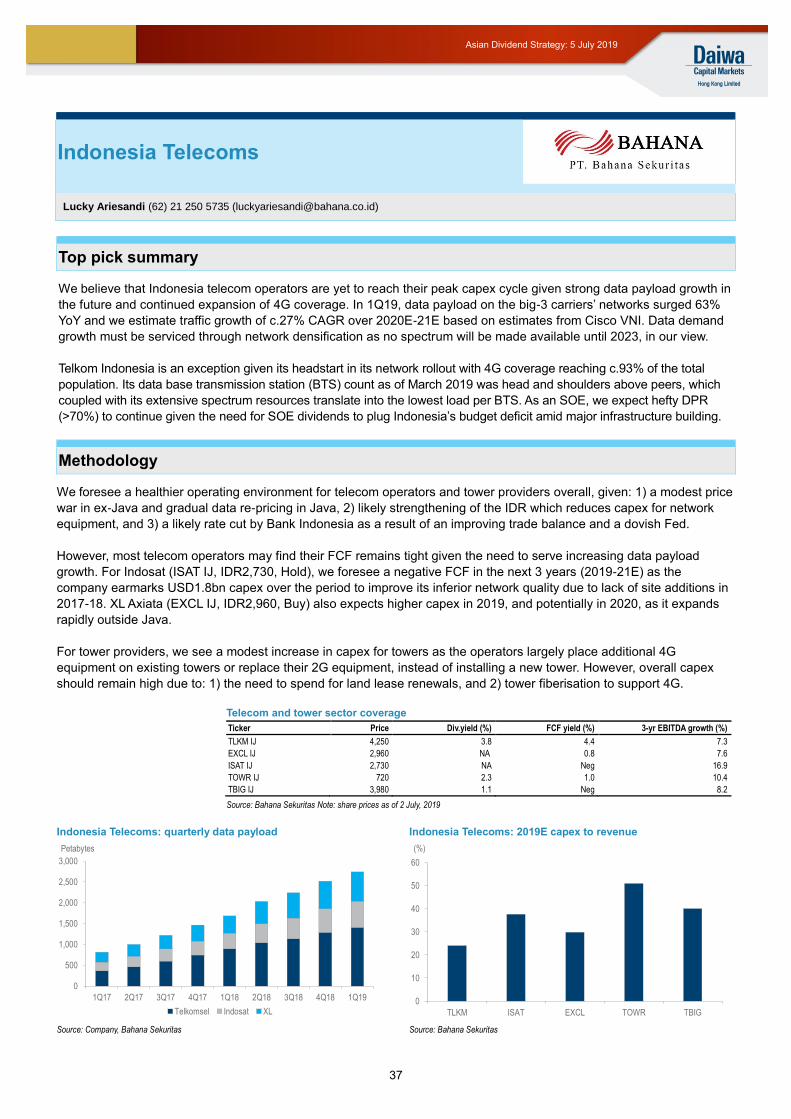
37
Asian Dividend Strategy: 5 July 2019
Indonesia Telecoms
Lucky Ariesandi (62) 21 250 5735 ([email protected])
Top pick summary
We believe that Indonesia telecom operators are yet to reach their peak capex cycle given strong data payload growth in
the future and continued expansion of 4G coverage. In 1Q19, data payload on the big-3 carriers’ networks surged 63%
YoY and we estimate traffic growth of c.27% CAGR over 2020E-21E based on estimates from Cisco VNI. Data demand
growth must be serviced through network densification as no spectrum will be made available until 2023, in our view.
Telkom Indonesia is an exception given its headstart in its network rollout with 4G coverage reaching c.93% of the total
population. Its data base transmission station (BTS) count as of March 2019 was head and shoulders above peers, which
coupled with its extensive spectrum resources translate into the lowest load per BTS. As an SOE, we expect hefty DPR
(>70%) to continue given the need for SOE dividends to plug Indonesia’s budget deficit amid major infrastructure building.
Methodology
We foresee a healthier operating environment for telecom operators and tower providers overall, given: 1) a modest price
war in ex-Java and gradual data re-pricing in Java, 2) likely strengthening of the IDR which reduces capex for network
equipment, and 3) a likely rate cut by Bank Indonesia as a result of an improving trade balance and a dovish Fed.
However, most telecom operators may find their FCF remains tight given the need to serve increasing data payload
growth. For Indosat (ISAT IJ, IDR2,730, Hold), we foresee a negative FCF in the next 3 years (2019-21E) as the
company earmarks USD1.8bn capex over the period to improve its inferior network quality due to lack of site additions in
2017-18. XL Axiata (EXCL IJ, IDR2,960, Buy) also expects higher capex in 2019, and potentially in 2020, as it expands
rapidly outside Java.
For tower providers, we see a modest increase in capex for towers as the operators largely place additional 4G
equipment on existing towers or replace their 2G equipment, instead of installing a new tower. However, overall capex
should remain high due to: 1) the need to spend for land lease renewals, and 2) tower fiberisation to support 4G.
Telecom and tower sector coverage
Ticker Price Div.yield (%) FCF yield (%) 3-yr EBITDA growth (%)
TLKM IJ 4,250 3.8 4.4 7.3
EXCL IJ 2,960 NA 0.8 7.6
ISAT IJ 2,730 NA Neg 16.9
TOWR IJ 720 2.3 1.0 10.4
TBIG IJ 3,980 1.1 Neg 8.2
Source: Bahana Sekuritas Note: share prices as of 2 July, 2019
Indonesia Telecoms: quarterly data payload Indonesia Telecoms: 2019E capex to revenue
Source: Company, Bahana Sekuritas Source: Bahana Sekuritas
0
500
1,000
1,500
2,000
2,500
3,000
1Q17 2Q17 3Q17 4Q17 1Q18 2Q18 3Q18 4Q18 1Q19
Petabytes
Telkomsel Indosat XL0
10
20
30
40
50
60
TLKM ISAT EXCL TOWR TBIG
(%)
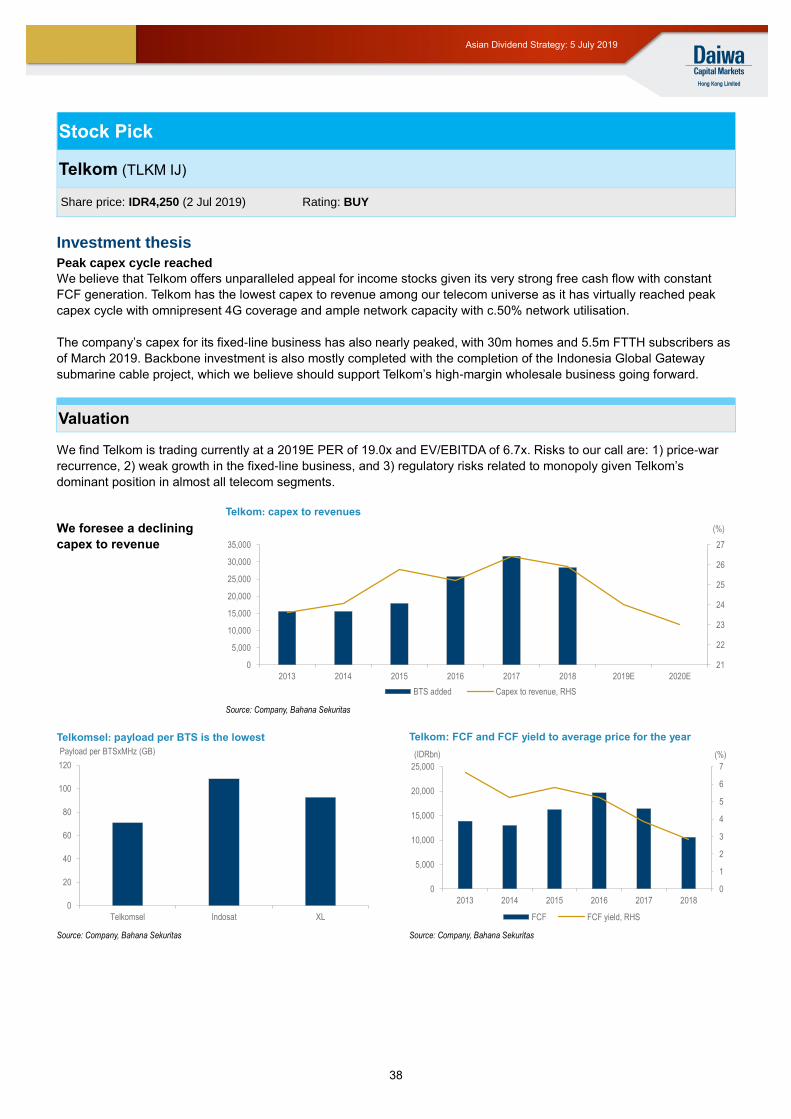
38
Asian Dividend Strategy: 5 July 2019
Stock Pick
Telkom (TLKM IJ)
Share price: IDR4,250 (2 Jul 2019) Rating: BUY
Investment thesis
Peak capex cycle reached
We believe that Telkom offers unparalleled appeal for income stocks given its very strong free cash flow with constant
FCF generation. Telkom has the lowest capex to revenue among our telecom universe as it has virtually reached peak
capex cycle with omnipresent 4G coverage and ample network capacity with c.50% network utilisation.
The company’s capex for its fixed-line business has also nearly peaked, with 30m homes and 5.5m FTTH subscribers as
of March 2019. Backbone investment is also mostly completed with the completion of the Indonesia Global Gateway
submarine cable project, which we believe should support Telkom’s high-margin wholesale business going forward.
Valuation
We find Telkom is trading currently at a 2019E PER of 19.0x and EV/EBITDA of 6.7x. Risks to our call are: 1) price-war
recurrence, 2) weak growth in the fixed-line business, and 3) regulatory risks related to monopoly given Telkom’s
dominant position in almost all telecom segments.
Telkom: capex to revenues
We foresee a declining
capex to revenue
Source: Company, Bahana Sekuritas
Telkomsel: payload per BTS is the lowest Telkom: FCF and FCF yield to average price for the year
Source: Company, Bahana Sekuritas Source: Company, Bahana Sekuritas
21
22
23
24
25
26
27
0
5,000
10,000
15,000
20,000
25,000
30,000
35,000
2013 2014 2015 2016 2017 2018 2019E 2020E
(%)
BTS added Capex to revenue, RHS
0
20
40
60
80
100
120
Telkomsel Indosat XL
Payload per BTSxMHz (GB)
0
1
2
3
4
5
6
7
0
5,000
10,000
15,000
20,000
25,000
2013 2014 2015 2016 2017 2018
(%)(IDRbn)
FCF FCF yield, RHS
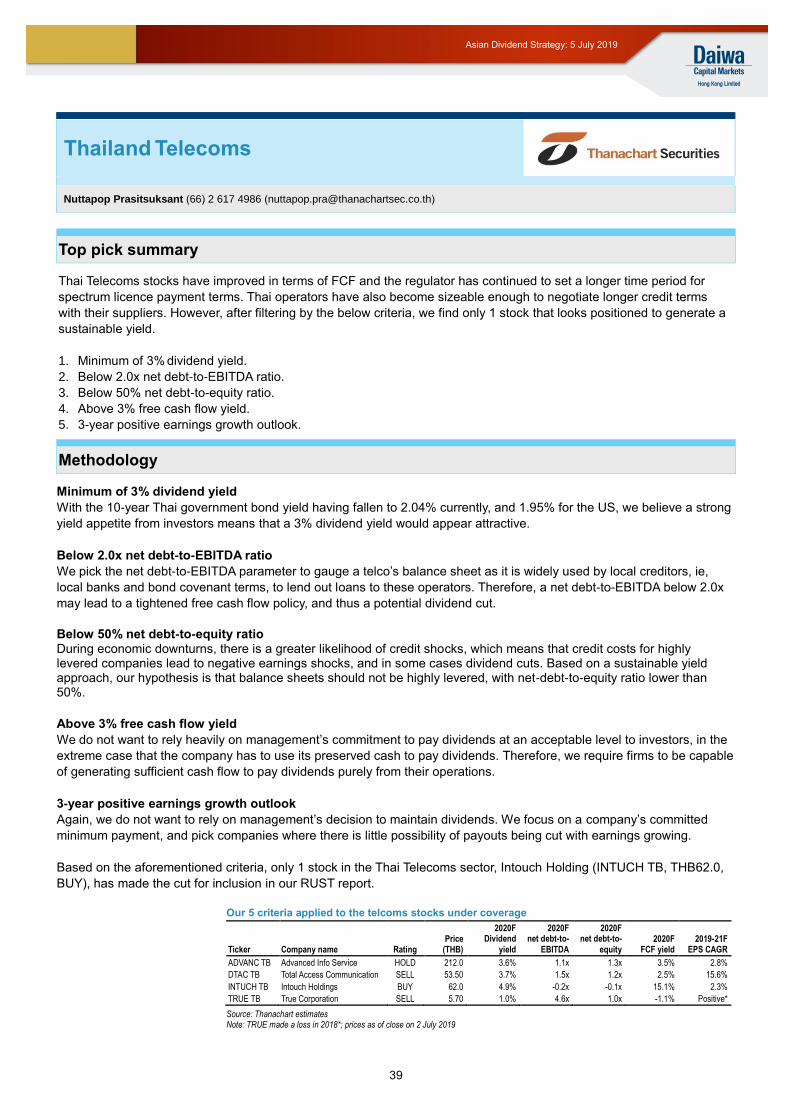
39
Asian Dividend Strategy: 5 July 2019
Top pick summary
Thai Telecoms stocks have improved in terms of FCF and the regulator has continued to set a longer time period for
spectrum licence payment terms. Thai operators have also become sizeable enough to negotiate longer credit terms
with their suppliers. However, after filtering by the below criteria, we find only 1 stock that looks positioned to generate a
sustainable yield.
1. Minimum of 3% dividend yield.
2. Below 2.0x net debt-to-EBITDA ratio.
3. Below 50% net debt-to-equity ratio.
4. Above 3% free cash flow yield.
5. 3-year positive earnings growth outlook.
Methodology
Minimum of 3% dividend yield
With the 10-year Thai government bond yield having fallen to 2.04% currently, and 1.95% for the US, we believe a strong
yield appetite from investors means that a 3% dividend yield would appear attractive.
Below 2.0x net debt-to-EBITDA ratio
We pick the net debt-to-EBITDA parameter to gauge a telco’s balance sheet as it is widely used by local creditors, ie,
local banks and bond covenant terms, to lend out loans to these operators. Therefore, a net debt-to-EBITDA below 2.0x
may lead to a tightened free cash flow policy, and thus a potential dividend cut.
Below 50% net debt-to-equity ratio During economic downturns, there is a greater likelihood of credit shocks, which means that credit costs for highly levered companies lead to negative earnings shocks, and in some cases dividend cuts. Based on a sustainable yield approach, our hypothesis is that balance sheets should not be highly levered, with net-debt-to-equity ratio lower than 50%.
Above 3% free cash flow yield
We do not want to rely heavily on management’s commitment to pay dividends at an acceptable level to investors, in the
extreme case that the company has to use its preserved cash to pay dividends. Therefore, we require firms to be capable
of generating sufficient cash flow to pay dividends purely from their operations.
3-year positive earnings growth outlook
Again, we do not want to rely on management’s decision to maintain dividends. We focus on a company’s committed
minimum payment, and pick companies where there is little possibility of payouts being cut with earnings growing.
Based on the aforementioned criteria, only 1 stock in the Thai Telecoms sector, Intouch Holding (INTUCH TB, THB62.0,
BUY), has made the cut for inclusion in our RUST report.
Our 5 criteria applied to the telcoms stocks under coverage
Ticker Company name Rating Price
(THB)
2020F Dividend
yield
2020F net debt-to-
EBITDA
2020F net debt-to-
equity 2020F
FCF yield 2019-21F
EPS CAGR
ADVANC TB Advanced Info Service HOLD 212.0 3.6% 1.1x 1.3x 3.5% 2.8%
DTAC TB Total Access Communication SELL 53.50 3.7% 1.5x 1.2x 2.5% 15.6%
INTUCH TB Intouch Holdings BUY 62.0 4.9% -0.2x -0.1x 15.1% 2.3%
TRUE TB True Corporation SELL 5.70 1.0% 4.6x 1.0x -1.1% Positive*
Source: Thanachart estimates Note: TRUE made a loss in 2018*; prices as of close on 2 July 2019
Thailand Telecoms
Nuttapop Prasitsuksant (66) 2 617 4986 ([email protected])
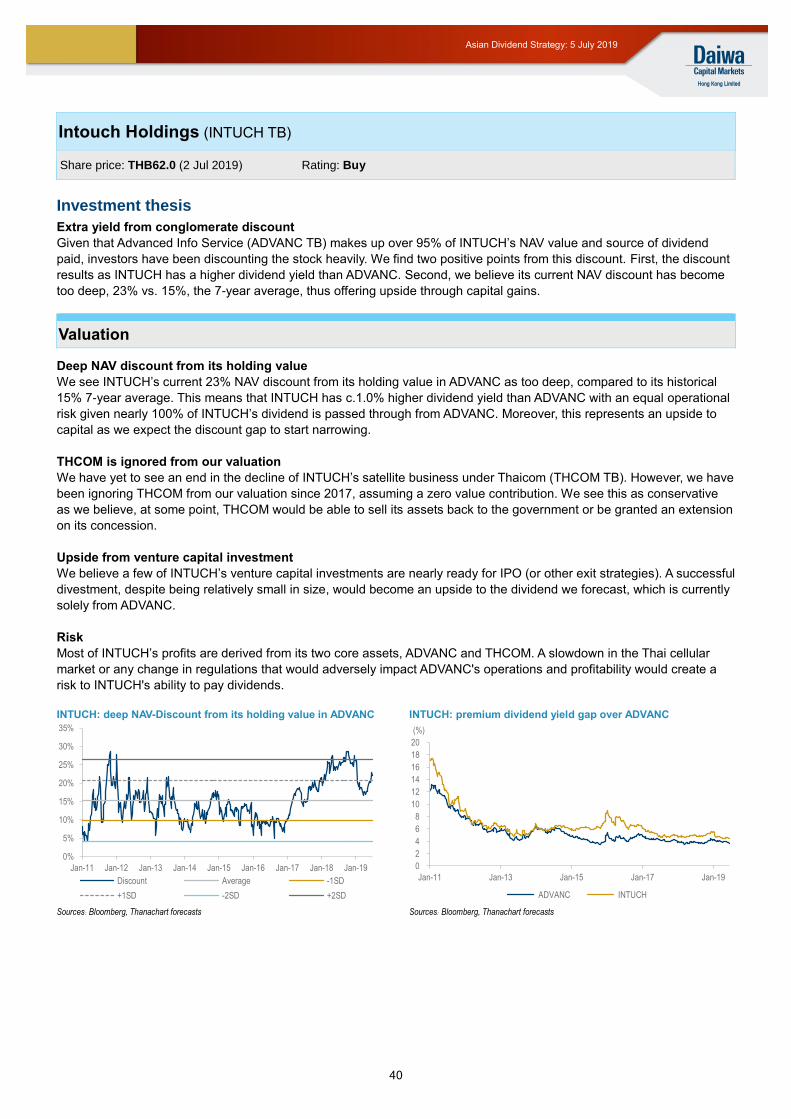
40
Asian Dividend Strategy: 5 July 2019
Intouch Holdings (INTUCH TB)
Investment thesis
Extra yield from conglomerate discount
Given that Advanced Info Service (ADVANC TB) makes up over 95% of INTUCH’s NAV value and source of dividend
paid, investors have been discounting the stock heavily. We find two positive points from this discount. First, the discount
results as INTUCH has a higher dividend yield than ADVANC. Second, we believe its current NAV discount has become
too deep, 23% vs. 15%, the 7-year average, thus offering upside through capital gains.
Valuation
Deep NAV discount from its holding value
We see INTUCH’s current 23% NAV discount from its holding value in ADVANC as too deep, compared to its historical
15% 7-year average. This means that INTUCH has c.1.0% higher dividend yield than ADVANC with an equal operational
risk given nearly 100% of INTUCH’s dividend is passed through from ADVANC. Moreover, this represents an upside to
capital as we expect the discount gap to start narrowing.
THCOM is ignored from our valuation
We have yet to see an end in the decline of INTUCH’s satellite business under Thaicom (THCOM TB). However, we have
been ignoring THCOM from our valuation since 2017, assuming a zero value contribution. We see this as conservative
as we believe, at some point, THCOM would be able to sell its assets back to the government or be granted an extension
on its concession.
Upside from venture capital investment
We believe a few of INTUCH’s venture capital investments are nearly ready for IPO (or other exit strategies). A successful
divestment, despite being relatively small in size, would become an upside to the dividend we forecast, which is currently
solely from ADVANC.
Risk
Most of INTUCH’s profits are derived from its two core assets, ADVANC and THCOM. A slowdown in the Thai cellular
market or any change in regulations that would adversely impact ADVANC's operations and profitability would create a
risk to INTUCH's ability to pay dividends.
INTUCH: deep NAV-Discount from its holding value in ADVANC INTUCH: premium dividend yield gap over ADVANC
Sources: Bloomberg, Thanachart forecasts Sources: Bloomberg, Thanachart forecasts
0%
5%
10%
15%
20%
25%
30%
35%
Jan-11 Jan-12 Jan-13 Jan-14 Jan-15 Jan-16 Jan-17 Jan-18 Jan-19
Discount Average -1SD
+1SD -2SD +2SD
0
2
4
6
8
10
12
14
16
18
20
Jan-11 Jan-13 Jan-15 Jan-17 Jan-19
(%)
ADVANC INTUCH
Share price: THB62.0 (2 Jul 2019) Rating: Buy
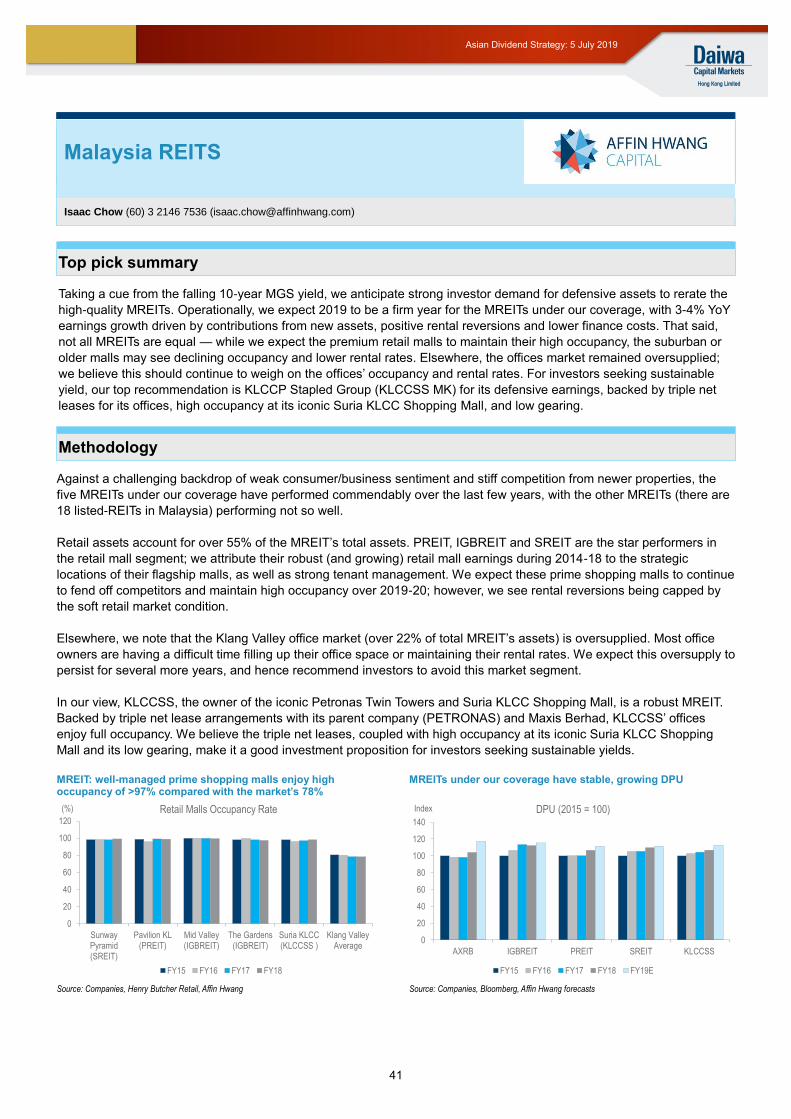
41
Asian Dividend Strategy: 5 July 2019
Top pick summary
Taking a cue from the falling 10-year MGS yield, we anticipate strong investor demand for defensive assets to rerate the
high-quality MREITs. Operationally, we expect 2019 to be a firm year for the MREITs under our coverage, with 3-4% YoY
earnings growth driven by contributions from new assets, positive rental reversions and lower finance costs. That said,
not all MREITs are equal — while we expect the premium retail malls to maintain their high occupancy, the suburban or
older malls may see declining occupancy and lower rental rates. Elsewhere, the offices market remained oversupplied;
we believe this should continue to weigh on the offices’ occupancy and rental rates. For investors seeking sustainable
yield, our top recommendation is KLCCP Stapled Group (KLCCSS MK) for its defensive earnings, backed by triple net
leases for its offices, high occupancy at its iconic Suria KLCC Shopping Mall, and low gearing.
Methodology
Against a challenging backdrop of weak consumer/business sentiment and stiff competition from newer properties, the
five MREITs under our coverage have performed commendably over the last few years, with the other MREITs (there are
18 listed-REITs in Malaysia) performing not so well.
Retail assets account for over 55% of the MREIT’s total assets. PREIT, IGBREIT and SREIT are the star performers in
the retail mall segment; we attribute their robust (and growing) retail mall earnings during 2014-18 to the strategic
locations of their flagship malls, as well as strong tenant management. We expect these prime shopping malls to continue
to fend off competitors and maintain high occupancy over 2019-20; however, we see rental reversions being capped by
the soft retail market condition.
Elsewhere, we note that the Klang Valley office market (over 22% of total MREIT’s assets) is oversupplied. Most office
owners are having a difficult time filling up their office space or maintaining their rental rates. We expect this oversupply to
persist for several more years, and hence recommend investors to avoid this market segment.
In our view, KLCCSS, the owner of the iconic Petronas Twin Towers and Suria KLCC Shopping Mall, is a robust MREIT.
Backed by triple net lease arrangements with its parent company (PETRONAS) and Maxis Berhad, KLCCSS’ offices
enjoy full occupancy. We believe the triple net leases, coupled with high occupancy at its iconic Suria KLCC Shopping
Mall and its low gearing, make it a good investment proposition for investors seeking sustainable yields.
MREIT: well-managed prime shopping malls enjoy high occupancy of >97% compared with the market’s 78%
MREITs under our coverage have stable, growing DPU
Source: Companies, Henry Butcher Retail, Affin Hwang Source: Companies, Bloomberg, Affin Hwang forecasts
0
20
40
60
80
100
120
SunwayPyramid(SREIT)
Pavilion KL(PREIT)
Mid Valley(IGBREIT)
The Gardens(IGBREIT)
Suria KLCC(KLCCSS )
Klang ValleyAverage
(%) Retail Malls Occupancy Rate
FY15 FY16 FY17 FY18
0
20
40
60
80
100
120
140
AXRB IGBREIT PREIT SREIT KLCCSS
Index DPU (2015 = 100)
FY15 FY16 FY17 FY18 FY19E
Malaysia REITS
Isaac Chow (60) 3 2146 7536 ([email protected])
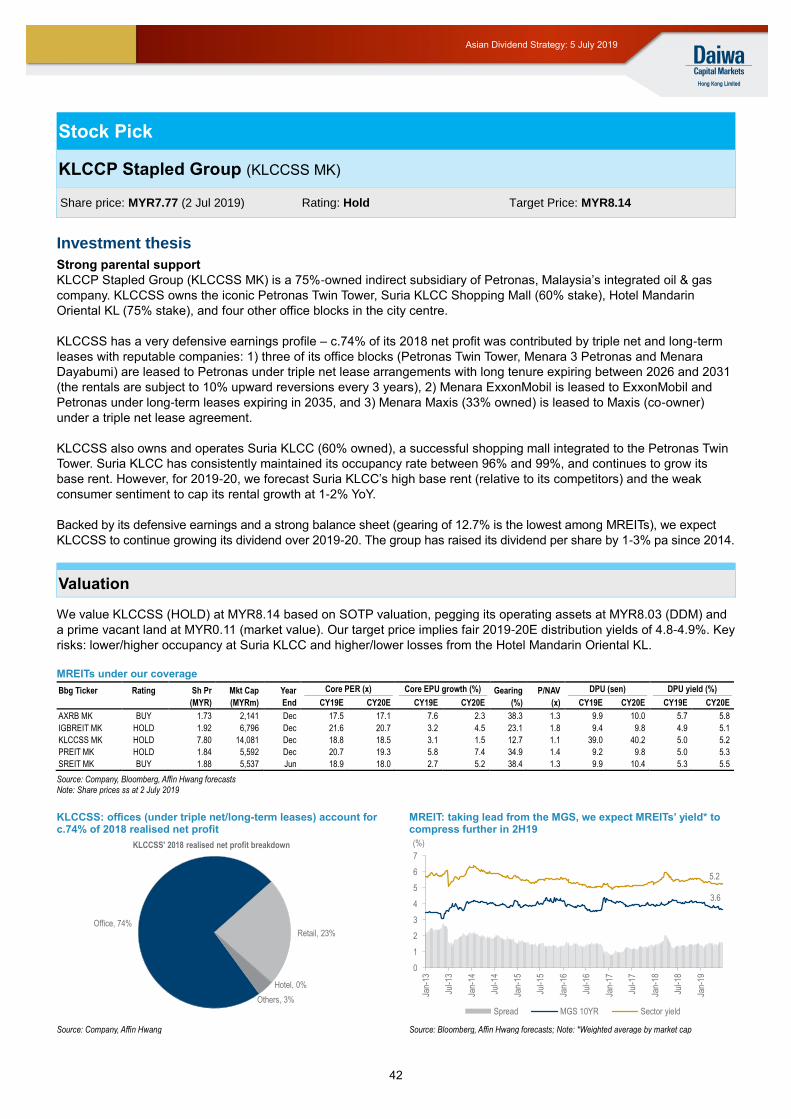
42
Asian Dividend Strategy: 5 July 2019
Stock Pick
KLCCP Stapled Group (KLCCSS MK)
Investment thesis
Strong parental support
KLCCP Stapled Group (KLCCSS MK) is a 75%-owned indirect subsidiary of Petronas, Malaysia’s integrated oil & gas
company. KLCCSS owns the iconic Petronas Twin Tower, Suria KLCC Shopping Mall (60% stake), Hotel Mandarin
Oriental KL (75% stake), and four other office blocks in the city centre.
KLCCSS has a very defensive earnings profile – c.74% of its 2018 net profit was contributed by triple net and long-term
leases with reputable companies: 1) three of its office blocks (Petronas Twin Tower, Menara 3 Petronas and Menara
Dayabumi) are leased to Petronas under triple net lease arrangements with long tenure expiring between 2026 and 2031
(the rentals are subject to 10% upward reversions every 3 years), 2) Menara ExxonMobil is leased to ExxonMobil and
Petronas under long-term leases expiring in 2035, and 3) Menara Maxis (33% owned) is leased to Maxis (co-owner)
under a triple net lease agreement.
KLCCSS also owns and operates Suria KLCC (60% owned), a successful shopping mall integrated to the Petronas Twin
Tower. Suria KLCC has consistently maintained its occupancy rate between 96% and 99%, and continues to grow its
base rent. However, for 2019-20, we forecast Suria KLCC’s high base rent (relative to its competitors) and the weak
consumer sentiment to cap its rental growth at 1-2% YoY.
Backed by its defensive earnings and a strong balance sheet (gearing of 12.7% is the lowest among MREITs), we expect
KLCCSS to continue growing its dividend over 2019-20. The group has raised its dividend per share by 1-3% pa since 2014.
Valuation
We value KLCCSS (HOLD) at MYR8.14 based on SOTP valuation, pegging its operating assets at MYR8.03 (DDM) and
a prime vacant land at MYR0.11 (market value). Our target price implies fair 2019-20E distribution yields of 4.8-4.9%. Key
risks: lower/higher occupancy at Suria KLCC and higher/lower losses from the Hotel Mandarin Oriental KL.
MREITs under our coverage
Bbg Ticker Rating Sh Pr Mkt Cap Year Core PER (x) Core EPU growth (%) Gearing P/NAV DPU (sen) DPU yield (%)
(MYR) (MYRm) End CY19E CY20E CY19E CY20E (%) (x) CY19E CY20E CY19E CY20E
AXRB MK BUY 1.73 2,141 Dec 17.5 17.1 7.6 2.3 38.3 1.3 9.9 10.0 5.7 5.8
IGBREIT MK HOLD 1.92 6,796 Dec 21.6 20.7 3.2 4.5 23.1 1.8 9.4 9.8 4.9 5.1
KLCCSS MK HOLD 7.80 14,081 Dec 18.8 18.5 3.1 1.5 12.7 1.1 39.0 40.2 5.0 5.2
PREIT MK HOLD 1.84 5,592 Dec 20.7 19.3 5.8 7.4 34.9 1.4 9.2 9.8 5.0 5.3
SREIT MK BUY 1.88 5,537 Jun 18.9 18.0 2.7 5.2 38.4 1.3 9.9 10.4 5.3 5.5
Source: Company, Bloomberg, Affin Hwang forecasts Note: Share prices ss at 2 July 2019
KLCCSS: offices (under triple net/long-term leases) account for c.74% of 2018 realised net profit
MREIT: taking lead from the MGS, we expect MREITs’ yield* to compress further in 2H19
Source: Company, Affin Hwang Source: Bloomberg, Affin Hwang forecasts; Note: *Weighted average by market cap
Office, 74%Retail, 23%
Hotel, 0%
Others, 3%
KLCCSS' 2018 realised net profit breakdown
3.6
5.2
0
1
2
3
4
5
6
7
Jan-
13
Jul-1
3
Jan-
14
Jul-1
4
Jan-
15
Jul-1
5
Jan-
16
Jul-1
6
Jan-
17
Jul-1
7
Jan-
18
Jul-1
8
Jan-
19
Spread MGS 10YR Sector yield
(%)
Share price: MYR7.77 (2 Jul 2019) Rating: Hold Target Price: MYR8.14
43
Asian Dividend Strategy: 5 July 2019
Daiwa’s Asia Pacific Research Directory
HONG KONG
Takashi FUJIKURA (852) 2848 4051 [email protected]
Regional Research Head
Jiro IOKIBE (852) 2773 8702 [email protected]
Co-head of Asia Pacific Research
John HETHERINGTON (852) 2773 8787 [email protected]
Co-head of Asia Pacific Research
Craig CORK (852) 2848 4463 [email protected]
Regional Head of Asia Pacific Product Management
Paul M. KITNEY (852) 2848 4947 [email protected]
Chief Strategist for Asia Pacific; Strategy (Regional)
Kevin LAI (852) 2848 4926 [email protected]
Chief Economist for Asia ex-Japan; Macro Economics (Regional)
Kelvin LAU (852) 2848 4467 [email protected]
Head of Automobiles; Transportation and Industrials (Hong Kong/China)
Fiona LIANG (852) 2532 4341 [email protected]
Industrials (Hong Kong/China)
Jay LU (852) 2848 4970 [email protected]
Automobiles and Components (Hong Kong/China)
Leon QI (852) 2532 4381 [email protected]
Regional Head of Financials; Banking; Diversified financials; Insurance (Hong Kong/China)
Kevin JIANG (852) 2532 4383 [email protected]
Banking (China)
Anson CHAN (852) 2532 4350 [email protected]
Consumer (Hong Kong/China)
Adrian CHAN (852) 2848 4427 [email protected]
Consumer (Hong Kong/China)
Andrew CHUNG (852) 2773 8529 [email protected]
Head of Gaming (Hong Kong/China)
John CHOI (852) 2773 8730 [email protected]
Head of Hong Kong and China Internet; Regional Head of Small/Mid Cap
Carlton LAI (852) 2532 4349 [email protected]
Small/Mid Cap (Hong Kong/China)
Dennis IP (852) 2848 4068 [email protected]
Regional Head of Power, Utilities, Renewable and Environment (PURE); PURE (Hong Kong/China)
Anna LU (852) 2848 4465 [email protected]
Power, Utilities, Renewable and Environment (PURE) – IPP, Wind & Nuclear (China)
Jonas KAN (852) 2848 4439 [email protected]
Head of Hong Kong and China Property
Cynthia CHAN (852) 2773 8243 [email protected]
Property (China)
Bryan CHIK (852) 2773 8741 [email protected]
Custom Products Group
Selwyn CHENG (852) 2773 8716 [email protected]
Custom Products Group
Jack CHAN (852) 2773 8731 [email protected]
Custom Products Group
PHILIPPINES
Renzo CANDANO (63) 2 737 3022 [email protected]
Consumer
Micaela ABAQUITA (63) 2 737 3021 [email protected]
Property
Gregg ILAG (63) 2 737 3023 [email protected]
Utilities; Energy
SOUTH KOREA
Sung Yop CHUNG (82) 2 787 9157 [email protected]
Pan-Asia Co-head/Regional Head of Automobiles and Components; Automobiles; Shipbuilding; Machinery
Mike OH (82) 2 787 9179 [email protected]
Banking; Capital Goods (Construction and Defence); Utilities; Steel
Josh RHEE (82) 2 787 9124 [email protected]
Chemicals
SK KIM (82) 2 787 9173 [email protected]
IT/Electronics – Semiconductor/Display and Tech Hardware
Henny JUNG (82) 2 787 9182 [email protected]
IT/Electronics – Semiconductor/Display and Tech Hardware (Small/Mid Cap)
Thomas Y KWON (82) 2 787 9181 [email protected]
Pan-Asia Head of Internet & Telecommunications; Software – Internet/On-line Games
TAIWAN
Rick HSU (886) 2 8758 6261 [email protected]
Head of Regional Technology; Head of Taiwan Research; Semiconductor/IC Design (Regional)
Nora HOU (886) 2 8758 6249 [email protected]
Banking; Diversified financials; Insurance; Strategy
Steven TSENG (886) 2 8758 6252 [email protected]
IT/Technology Hardware (Automation & PC Hardware)
Kylie HUANG (886) 2 8758 6248 [email protected]
IT/Technology Hardware (Handsets and Components)
Helen CHIEN (886) 2 8758 6254 [email protected]
Small/Mid Cap
INDIA
Punit SRIVASTAVA (91) 22 6622 1013 [email protected]
Head of India Research; Strategy; Banking/Finance
Saurabh MEHTA (91) 22 6622 1009 [email protected]
Capital Goods; Utilities
SINGAPORE
Ramakrishna MARUVADA (65) 6228 6742 [email protected]
Head of Singapore Research; Telecommunications (China/ASEAN/India)
David LUM (65) 6228 6740 [email protected]
Banking; Property and REITs
Royston TAN (65) 6228 6745 [email protected]
Oil and Gas; Capital Goods
Jame OSMAN (65) 6228 6744 [email protected]
Transportation – Road and Rail; Pharmaceuticals and Healthcare; Consumer
JAPAN
Yukino YAMADA (81) 3 5555 7295 [email protected]
Strategy (Regional)
44
Asian Dividend Strategy: 5 July 2019
Daiwa’s Offices
Office / Branch / Affiliate Address Tel Fax
DAIWA SECURITIES GROUP INC
HEAD OFFICE Gran Tokyo North Tower, 1-9-1, Marunouchi, Chiyoda-ku, Tokyo, 100-6753 (81) 3 5555 3111 (81) 3 5555 0661
Daiwa Securities Trust Company One Evertrust Plaza, Jersey City, NJ 07302, U.S.A. (1) 201 333 7300 (1) 201 333 7726
Daiwa Securities Trust and Banking (Europe) PLC (Head Office) 5 King William Street, London EC4N 7JB, United Kingdom (44) 207 320 8000 (44) 207 410 0129
Daiwa Europe Trustees (Ireland) Ltd Level 3, Block 5, Harcourt Centre, Harcourt Road, Dublin 2, Ireland (353) 1 603 9900 (353) 1 478 3469
Daiwa Capital Markets America Inc. New York Head Office Financial Square, 32 Old Slip, New York, NY10005, U.S.A. (1) 212 612 7000 (1) 212 612 7100
Daiwa Capital Markets America Inc. San Francisco Branch 555 California Street, Suite 3360, San Francisco, CA 94104, U.S.A. (1) 415 955 8100 (1) 415 956 1935
Daiwa Capital Markets Europe Limited, London Head Office 5 King William Street, London EC4N 7AX, United Kingdom (44) 20 7597 8000 (44) 20 7597 8600
Daiwa Capital Markets Europe Limited, Frankfurt Branch Neue Mainzer Str. 1, 60311 Frankfurt/Main, Germany (49) 69 717 080 (49) 69 723 340
Daiwa Capital Markets Europe Limited, Paris Representative Office 17, rue de Surène 75008 Paris, France (33) 1 56 262 200 (33) 1 47 550 808
Daiwa Capital Markets Europe Limited, Geneva Branch 50 rue du Rhône, P.O.Box 3198, 1211 Geneva 3, Switzerland (41) 22 818 7400 (41) 22 818 7441
Daiwa Capital Markets Europe Limited, Moscow Representative Office
Midland Plaza 7th Floor, 10 Arbat Street, Moscow 119002, Russian Federation
(7) 495 641 3416 (7) 495 775 6238
Daiwa Capital Markets Europe Limited, Bahrain Branch 7th Floor, The Tower, Bahrain Commercial Complex, P.O. Box 30069, Manama, Bahrain
(973) 17 534 452 (973) 17 535 113
Daiwa Capital Markets Hong Kong Limited Level 28, One Pacific Place, 88 Queensway, Hong Kong (852) 2525 0121 (852) 2845 1621
Daiwa Capital Markets SG Limited 6 Shenton Way #26-08, OUE Downtown 2, SG 068809, Republic of SG
(65) 6220 3666 (65) 6223 6198
Daiwa Capital Markets Australia Limited Level 34, Rialto North Tower, 525 Collins Street, Melbourne, Victoria 3000, Australia
(61) 3 9916 1300 (61) 3 9916 1330
DBP-Daiwa Capital Markets Philippines, Inc 18th Floor, Citibank Tower, 8741 Paseo de Roxas, Salcedo Village, Makati City, Republic of the Philippines
(632) 813 7344 (632) 848 0105
Daiwa-Cathay Capital Markets Co Ltd 14/F, 200, Keelung Road, Sec 1, Taipei, Taiwan, R.O.C. (886) 2 2723 9698 (886) 2 2345 3638
Daiwa Securities Capital Markets Korea Co., Ltd. 20 Fl.& 21Fl. One IFC, 10 Gukjegeumyung-Ro, Yeongdeungpo-gu, Seoul, Korea
(82) 2 787 9100 (82) 2 787 9191
Daiwa Securities Co. Ltd., Beijing Representative Office Room 301/302,Kerry Center,1 Guanghua Road,Chaoyang District,
Beijing 100020, People’s Republic of China
(86) 10 6500 6688 (86) 10 6500 3594
Daiwa (Shanghai) Corporate Strategic Advisory Co. Ltd. 44/F, Hang Seng Bank Tower, 1000 Lujiazui Ring Road, Pudong, Shanghai China 200120 , People’s Republic of China
(86) 21 3858 2000 (86) 21 3858 2111
Daiwa Securities Co. Ltd., Bangkok Representative Office 18th Floor, M Thai Tower, All Seasons Place, 87 Wireless Road,
Lumpini, Pathumwan, Bangkok 10330, Thailand (66) 2 252 5650 (66) 2 252 5665
Daiwa Capital Markets India Private Ltd 10th Floor, 3 North Avenue, Maker Maxity, Bandra Kurla Complex, Bandra East, Mumbai – 400051, India
(91) 22 6622 1000 (91) 22 6622 1019
Daiwa Securities Co. Ltd., Hanoi Representative Office Suite 405, Pacific Palace Building, 83B, Ly Thuong Kiet Street, Hoan Kiem Dist. Hanoi, Vietnam
(84) 4 3946 0460 (84) 4 3946 0461
DAIWA INSTITUTE OF RESEARCH LTD
HEAD OFFICE 15-6, Fuyuki, Koto-ku, Tokyo, 135-8460, Japan (81) 3 5620 5100 (81) 3 5620 5603
MARUNOUCHI OFFICE Gran Tokyo North Tower, 1-9-1, Marunouchi, Chiyoda-ku, Tokyo, 100-6756 (81) 3 5555 7011 (81) 3 5202 2021
New York Research Center 11th Floor, Financial Square, 32 Old Slip, NY, NY 10005-3504, U.S.A. (1) 212 612 6100 (1) 212 612 8417
London Research Centre 3/F, 5 King William Street, London, EC4N 7AX, United Kingdom (44) 207 597 8000 (44) 207 597 8550
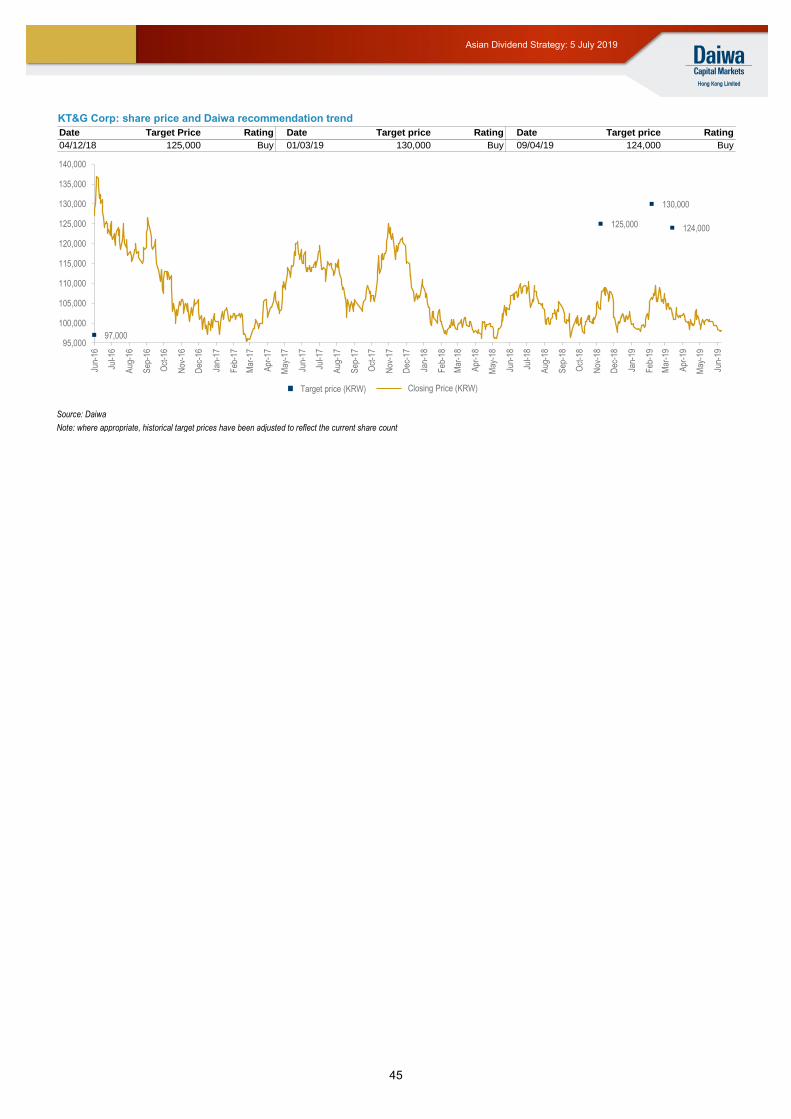
45
Asian Dividend Strategy: 5 July 2019
KT&G Corp: share price and Daiwa recommendation trend
Source: Daiwa
Note: where appropriate, historical target prices have been adjusted to reflect the current share count
Date Target Price Rating Date Target price Rating Date Target price Rating
04/12/18 125,000 Buy 01/03/19 130,000 Buy 09/04/19 124,000 Buy
97,000
125,000
130,000
124,000
95,000
100,000
105,000
110,000
115,000
120,000
125,000
130,000
135,000
140,000
Jun-
16
Jul-1
6
Aug
-16
Sep
-16
Oct
-16
Nov
-16
Dec
-16
Jan-
17
Feb
-17
Mar
-17
Apr
-17
May
-17
Jun-
17
Jul-1
7
Aug
-17
Sep
-17
Oct
-17
Nov
-17
Dec
-17
Jan-
18
Feb
-18
Mar
-18
Apr
-18
May
-18
Jun-
18
Jul-1
8
Aug
-18
Sep
-18
Oct
-18
Nov
-18
Dec
-18
Jan-
19
Feb
-19
Mar
-19
Apr
-19
May
-19
Jun-
19
Target price (KRW) Closing Price (KRW)
46
Asian Dividend Strategy: 5 July 2019
Important Disclosures and Disclaimer This publication is produced by Daiwa Securities Group Inc. and/or its non-U.S. affiliates, and distributed by Daiwa Securities Group Inc. and/or its non-U.S. affiliates, except to the extent expressly provided herein. This publication and the contents hereof are intended for information purposes only, and may be subject to change without further notice. Any use, disclosure, distribution, dissemination, copying, printing or reliance on this publication for any other purpose without our prior consent or approval is strictly prohibited. Neither Daiwa Securities Group Inc. nor any of its respective parent, holding, subsidiaries or affiliates, nor any of its respective directors, officers, servants and employees, represent nor warrant the accuracy or completeness of the information contained herein or as to the existence of other facts which might be significant, and will not accept any responsibility or liability whatsoever for any use of or reliance upon this publication or any of the contents hereof. Neither this publication, nor any content hereof, constitute, or are to be construed as, an offer or solicitation of an offer to buy or sell any of the securities or investments mentioned herein in any country or jurisdiction nor, unless expressly provided, any recommendation or investment opinion or advice. Any view, recommendation, opinion or advice expressed in this publication may not necessarily reflect those of Daiwa Securities Group Inc., and/or its affiliates nor any of its respective directors, officers, servants and employees except where the publication states otherwise. This research report is not to be relied upon by any person in making any investment decision or otherwise advising with respect to, or dealing in, the securities mentioned, as it does not take into account the specific investment objectives, financial situation and particular needs of any person. Daiwa Securities Group Inc., Thanachart Securities, Affin Hwang Investment Bank Berhad, PT.Bahana Sekuritas, Saigon Securities, their respective subsidiaries or affiliates, or their respective directors, officers and employees from time to time have trades as principals, or have positions in, or have other interests in the securities of the company under research including market making activities, derivatives in respect of such securities or may have also performed investment banking and other services for the issuer of such securities. Daiwa Securities Group Inc.,Thanachart Securities, Affin Hwang Investment Bank Berhad, PT.Bahana Sekuritas, Saigon Securities, their respective subsidiaries or affiliates do and seek to do business with the company(s) covered in this publication. Therefore, investors should be aware that a conflict of interest may exist. The following are additional disclosures. Ownership of Securities For “Ownership of Securities” information, please visit BlueMatrix disclosure link at https://daiwa3.bluematrix.com/sellside/Disclosures.action. Investment Banking Relationship For “Investment Banking Relationship”, please visit BlueMatrix disclosure link at https://daiwa3.bluematrix.com/sellside/Disclosures.action. Portions of this publication are prepared by Affin Hwang Investment Bank Berhad (“Affin Hwang”) and reviewed by Daiwa Securities Group Inc. and/or its non-U.S. affiliates (collectively, “Daiwa”), and is distributed and/or originated from outside Malaysia by Daiwa Securities Group Inc. and/or its non-U.S. affiliates, except to the extent expressly provided herein. The role of
Daiwa Securities Group Inc. and/or its non-U.S. affiliates in connection with this publication is solely limited to the review and distribution of this publication ; and Daiwa Securities Group Inc. and/or its non-U.S. affiliates are not involved in the preparation of this publication in any other way. This research is for Daiwa clients only and the publication and the contents hereof are intended for information purposes only, and may be subject to change without further notice. Other than disclosures relating to Daiwa, this research is based on current public information that Affin Hwang and Daiwa consider reliable, but we do not represent it is accurate or complete, and it should not be relied on as such. The analysts named in this report may have from time to time discussed with clients, including Daiwa’s salespersons and traders, or may discuss in this report, trading strategies that reference catalysts or events that may have a near-term impact on the market price of the equity securities discussed in this report, which impact may be directionally counter to the analysts' published price target expectations for such stocks. Any such trading strategies are distinct from and do not affect the analysts' fundamental equity rating for such stocks, which rating reflects a stock's return potential relative to its coverage group as described herein. Any use, disclosure, distribution, dissemination, copying, printing or reliance on this publication for any other purpose without our prior consent or approval is strictly prohibited. Neither Daiwa Securities Group Inc. nor any of its respective parent, holding, subsidiaries or affiliates, nor any of its respective directors, officers, servants and employees, represent nor warrant the accuracy or completeness of the information contained herein or as to the existence of other facts which might be significant, and will not accept any responsibility or liability whatsoever for any use of or reliance upon this publication or any of the contents hereof. Neither this publication, nor any content hereof, constitute, or are to be construed as, an offer or solicitation of an offer to buy or sell any of the securities or investments mentioned herein in any country or jurisdiction where such an offer or solicitation would be illegal nor, unless expressly provided, any recommendation or investment opinion or advice. Any view, recommendation, opinion or advice expressed in this publication constitutes the views of the analyst(s) named herein and does not necessarily reflect those of Daiwa Securities Group Inc. and/or its affiliates nor any of its respective directors, officers, servants and employees except where the publication states otherwise. This research report is not to be relied upon by any person in making any investment decision or otherwise advising with respect to, or dealing in, the securities mentioned, as it does not take into account the specific investment objectives, financial situation and particular needs of any person. Clients should consider whether any advice or recommendation in this research is suitable for their particular circumstances and, if appropriate, seek professional advice, including tax advice. The price and value of investments referred to in this research and the income from them may fluctuate. Past performance is not a guide to future performance future returns are not guaranteed, and a loss of original capital may occur. Fluctuations in exchange rates could have adverse effects on the value or price of, or income derived from, certain investments. Certain transactions, including those involving futures, options, and other derivatives, give rise to substantial risk and are not suitable for all investors. Investors should review current options disclosure documents in relation to such investments. Portions of this publication are prepared by PT. Bahana Sekuritas and reviewed by Daiwa Securities Group Inc. and/or its affiliates, and distributed outside Indonesia by Daiwa Securities Group Inc. and/or its affiliates, except to the extent expressly provided herein. Certain copies of this publication may be distributed inside and outside of Indonesia by PT. Bahana Sekuritas in accordance with relevant laws and regulations. This publication and the contents hereof are intended for information purposes only, and may be subject to change without further notice. Any use, disclosure, distribution, dissemination, copying, printing or reliance on this publication for any other purpose without our prior consent or approval is strictly prohibited. Any review does not constitute a full verification of the publication and merely provides a minimum check. Neither Daiwa Securities Group Inc. nor any of its respective parent, holding, subsidiaries or affiliates, nor any of its respective directors, officers, servants and employees, represent nor warrant the accuracy or completeness of the information contained herein or as to the existence of other facts which might be significant, and will not accept any responsibility or liability whatsoever for any use of or reliance upon this publication or any of the contents hereof. Neither this publication, nor any content hereof, constitute, or are to be construed as, an offer or solicitation of an offer to buy or sell any of the securities or investments mentioned herein in any country or jurisdiction nor, unless expressly provided, any recommendation or investment opinion or advice. Any view, recommendation, opinion or advice expressed in this publication constitutes the views of the analyst(s) named herein and does not necessarily reflect those of Daiwa Securities Group Inc. and/or its affiliates nor any of its respective directors, officers, servants and employees except where the publication states otherwise. This research report is not to be relied upon by any person in making any investment decision or otherwise advising with respect to, or dealing in, the securities mentioned, as it does not take into account the specific investment objectives, financial situation and particular needs of any person. Neither Daiwa Securities Group Inc. nor any of its affiliates is licensed to undertake any business within the Republic of Indonesia. Any display of any trade name or logo of the Daiwa Securities Group Inc. on this publication shall not be deemed to be an undertaking of any business within the Republic of Indonesia. Daiwa Securities Group Inc., its subsidiaries or affiliates, or its or their respective directors, officers and employees from time to time may have trades as principals, or have positions in, or have other interests in the securities of the company under research including derivatives in respect of such securities or may have also performed investment banking and other services for the issuer of such securities. The following are additional disclosures. Portions of this publication are prepared by Thanachart Securities Public Company Limited and distributed outside Thailand by Daiwa Securities Group Inc. and/or its non-U.S. affiliates except to the extent expressly provided herein. This publication and the contents hereof are intended for information purposes only, and may be subject to change without further notice. Any use, disclosure, distribution, dissemination, copying, printing or reliance on this publication for any other purpose without our prior consent or approval is strictly prohibited. Neither Thanachart Securities Public Company Limited (“Thanachart Securities”), Daiwa Securities Group Inc. nor any of their respective parent, holding, subsidiaries or affiliates, nor any of their respective directors, officers, servants and employees, represent nor warrant the accuracy or completeness of the information contained herein or as to the existence of other facts which might be significant, and will not accept any responsibility or liability whatsoever for any use of or reliance upon this publication or any of the contents hereof. Neither this publication, nor any content hereof, constitute, or are to be construed as, an offer or solicitation of an offer to buy or sell any of the securities or investments mentioned herein in any country or jurisdiction nor, unless expressly provided, any recommendation or investment opinion or advice. Any view, recommendation, opinion or advice expressed in this publication constitutes the views of the analyst(s) named herein and does not necessarily reflect those of Thanachart Securities, Daiwa Securities Group Inc. and/or their respective affiliates nor any of their respective directors, officers, servants and employees except where the publication states otherwise. This research report is not to be relied upon by any person in making any investment decision or otherwise advising with respect to, or dealing in, the securities mentioned, as it does not take into account the specific investment objectives, financial situation and particular needs of any person. All research reports are disseminated and available to our clients simultaneously through electronic publication to our internal client websites. Not all research content is redistributed to our clients or available to third-party aggregators, nor is Daiwa responsible for the redistribution of our research by third party aggregators. Portions of this publication are prepared by Saigon Securities Inc. and distributed outside Vietnam by Daiwa Securities Group Inc. and/or its non-U.S. affiliates except to the extent
expressly provided herein. This publication and the contents hereof are intended for information purposes only, and may be subject to change without further notice. Any use, disclosure, distribution, dissemination, copying, printing or reliance on this publication for any other purpose without our prior consent or approval is strictly prohibited. Neither Saigon Securities Inc. (“Saigon Securities”), Daiwa Securities Group Inc. nor any of their respective parent, holding, subsidiaries or affiliates, nor any of their respective directors, officers, servants and employees, represent nor warrant the accuracy or completeness of the information contained herein or as to the existence of other facts which might be significant, and will not accept any responsibility or liability whatsoever for any use of or reliance upon this publication or any of the contents hereof. Neither this publication, nor any content hereof, constitute, or are to be construed as, an offer or solicitation of an offer to buy or sell any of the securities or investments mentioned herein in any country or jurisdiction nor, unless expressly provided, any recommendation or investment opinion or advice. Any view, recommendation, opinion or advice expressed in this publication constitutes the views of the analyst(s) named herein and does not necessarily reflect those of Saigon Securities, Daiwa Securities Group Inc. and/or their respective affiliates nor any of their respective directors, officers, servants and employees except where the publication states otherwise. This research report is not to be relied upon by any person in making any investment decision or otherwise advising with respect to, or dealing in, the securities mentioned, as it does not take into account the specific investment objectives, financial situation and particular needs of any person.
47
Asian Dividend Strategy: 5 July 2019
Saigon Securities, Daiwa Securities Group Inc., their respective subsidiaries or affiliates, or their respective directors, officers and employees from time to time have trades as principals, or have positions in, or have other interests in the securities of the company under research including derivatives in respect of such securities or may have also performed investment banking and other services for the issuer of such securities. Saigon Securities, Daiwa Securities Group Inc., their respective subsidiaries or affiliates do and seek to do business with the company(s) covered in this research report. Therefore, investors should be aware that a conflict of interest may exist. IMPORTANT
This report is provided as a reference for making investment decisions and is not intended to be a solicitation for investment. Investment decisions should be made at your own discretion and risk. Content herein is based on information available at the time the report was prepared and may be amended or otherwise changed in the future without notice. We make no representations as to the accuracy or completeness. Daiwa Securities Co. Ltd. retains all rights related to the content of this report, which may not be redistributed or otherwise transmitted without prior consent.
Ratings
Issues are rated 1, 2, 3, 4, or 5 as follows: 1: Outperform TOPIX/benchmark index by more than 15% over the next 12 months. 2: Outperform TOPIX/benchmark index by 5-15% over the next 12 months. 3: Out/underperform TOPIX/benchmark index by less than 5% over the next 12 months. 4: Underperform TOPIX/benchmark index by 5-15% over the next 12 months. 5: Underperform TOPIX/benchmark index by more than 15% over the next 12 months. Benchmark index: TOPIX for Japan, S&P 500 for US, STOXX Europe 600 for Europe, HSI for Hong Kong, STI for SG, KOSPI for Korea, TWII for Taiwan, and S&P/ASX 200 for Australia. Japan
Daiwa Securities Co. Ltd. and Daiwa Securities Group Inc. Daiwa Securities Co. Ltd. is a subsidiary of Daiwa Securities Group Inc. Investment Banking Relationship Within the preceding 12 months, the subsidiaries and/or affiliates of Daiwa Securities Group Inc. * has lead-managed public offerings and/or secondary offerings (excluding straight bonds) of the securities of the following companies: Cromwell European REIT (CERT SP).
*Subsidiaries of Daiwa Securities Group Inc. for the purposes of this section shall mean any one or more of: Daiwa Capital Markets Hong Kong Limited (大和資本市場香港有限公司), Daiwa
Capital Markets Singapore Limited, Daiwa Capital Markets Australia Limited, Daiwa Capital Markets India Private Limited, Daiwa-Cathay Capital Markets Co., Ltd., Daiwa Securities Capital Markets Korea Co., Ltd. Disclosure of Interest of Thanachart Securities Investment Banking Relationship Within the preceding 12 months, Thanachart Securities has lead-managed public offerings and/or secondary offerings (excluding straight bonds) of the securities of the following companies: Gulf Energy Development PCL (GULF TB), TQM Corporation Pcl. (TQM TB). Disclosure of Interest of Affin Hwang Investment Bank Investment Banking Relationship Within the preceding 12 months, Affin Hwang Investment Bank has lead-managed public offerings and/or secondary offerings (excluding straight bonds) of the securities of the following companies: MI Technovation Berhad (fka Mi Equipment Holdings Bhd) (MI_MK), Malakoff Corporation Berhad (MLK MK). Disclosure of Interest of Bahana Sekuritas Investment Banking Relationship Within the preceding 12 months, Bahana Securities has lead-managed public offerings and/or secondary offerings (excluding straight bonds) of the securities of the following companies: PT Indonesia Kendaraan Terminal Tbk (IPCC IJ). Disclosure of Interest of Saigon Securities Inc. Investment Banking Relationship Within the preceding 12 months, Saigon Securities Inc. has lead-managed public offerings and/or secondary offerings (excluding straight bonds) of the securities of the following companies: Vietnam National Petroleum Group (Petrolimex) (PLX_VN), Dong Hai Ben Tre JSC (DHC_VN), Vinhomes JSC (VHM_VN); DHG Pharmaceutical JSC (DHG_VN); Tien Phong Bank JSC (TPB_VN), Dat Xanh Group (DXG_VN). Hong Kong
This research is distributed in Hong Kong by Daiwa Capital Markets Hong Kong Limited (大和資本市場香港有限公司) (“DHK”) which is regulated by the Hong Kong Securities and Futures
Commission. Recipients of this research in Hong Kong may contact DHK in respect of any matter arising from or in connection with this research. Korea
The developing analyst of this research and analysis material hereby states and confirms that the contents of this material correctly reflect the analyst’s views and opinions and that the analyst has not been placed under inappropriate pressure or interruption by an external party. Name of Analyst : Daiwa Asia Research Team Disclosure of Analysts’ Interests If an analyst engaging in or a person who exercises influences on the preparation or publication of a Research Report containing recommendations for general investors to trade financial investment instruments with regard to which the analyst or the influential person has personal interests and if the recommendations contained in the Report may have impacts on the personal interests, Daiwa Securities Capital Markets Korea Co., Ltd.(“Daiwa Securities Korea”)shall ensure that the Analyst or the influential person notifies that he/she has personal interests with regard to: 1. The equity, the equity-linked bonds and the instruments with the subscription right to the equity issued by the legal entity covered in the Research Report (or the legal entity subject to the investment recommendations); 2. The stock option granted by the legal entity covered in the Research Report (or the legal entity subject to the investment recommendations); or 3. The equity futures, the equity options and the equity-linked warrants backed by the equity prescribed in the preceding Paragraph 1 as the underlying assets. Legal Entities subject to Research Report Coverage Restrictions Daiwa Securities Korea hereby states and confirms that Daiwa Securities Korea has no conflicts of interests with the legal entity covered in this Research Report: 1. In that Daiwa Securities Korea does NOT offer direct or indirect payment guarantee for the legal entity by means of, for instance, guarantee, endorsement, provision of collaterals or the acquisition of debts; 2. In that Daiwa Securities Korea does NOT own one-hundredth (or 1/100) or more of the total number of outstanding equities issued by the legal entity; 3. In that The legal entity is NOT an affiliated company of Daiwa Securities Korea pursuant to Sub-paragraph 3, Article 2 of the Monopoly Regulation and Fair Trade Act of Korea; 4. In that, although Daiwa Securities Korea offers advisory services for the legal entity with regard to an M&A deal, the size of the M&A deal does NOT exceed five-hundredths (or 5/100) of the total asset size or the total number of equities issued and outstanding of the legal entity; 5. In that, although Daiwa Securities Korea acted in the capacity of a Lead Underwriter for the initial public offering of the legal entity, more than one-year has passed since the IPO date; 6. In that Daiwa Securities Korea is NOT designated by the legal entity as the ‘tender offer agent’ pursuant to the Paragraph 2, Article 133 of the Financial Services and Capital Market Act or the legal entity is NOT the issuer of the equity subject to the proposed tender offer; this requirement, however applies until the maturity of the tender offer period; or 7. In that Daiwa Securities Korea does NOT have significant or material interests with regard to the legal entity. Disclosure of Prior Distribution to Third Party This report has not been distributed to the third party in advance prior to public release. The following explains the rating system in the report as compared to KOSPI, based on the beliefs of the author(s) of this report. "1": the security could outperform the KOSPI by more than 15% over the next 12 months, unless otherwise stated. "2": the security is expected to outperform the KOSPI by 5-15% over the next 12 months, unless otherwise stated. "3": the security is expected to perform within 5% of the KOSPI (better or worse) over the next 12 months, unless otherwise stated. "4": the security is expected to underperform the KOSPI by 5-15% over the next 12 months, unless otherwise stated. "5": the security could underperform the KOSPI by more than 15% over the next 12 months, unless otherwise stated. “Positive” means that the analyst expects the sector to outperform the KOSPI over the next 12 months, unless otherwise stated. “Neutral” means that the analyst expects the sector to be in-line with the KOSPI over the next 12 months, unless otherwise stated. “Negative” means that the analyst expects the sector to underperform the KOSPI over the next 12 months, unless otherwise stated.
48
Asian Dividend Strategy: 5 July 2019
Additional information may be available upon request. Relevant Relationship (DHK) DHK may from time to time have an individual employed by or associated with it serves as an officer of any of the companies under its research coverage. Singapore This research is distributed in SG by Daiwa Capital Markets SG Limited and it may only be distributed in SG to accredited investors, expert investors and institutional investors as defined in the Financial Advisers Regulations and the Securities and Futures Act (Chapter 289), as amended from time to time. By virtue of distribution to these category of investors, Daiwa Capital Markets SG Limited and its representatives are not required to comply with Section 36 of the Financial Advisers Act (Chapter 110) (Section 36 relates to disclosure of Daiwa Capital Markets SG Limited’s interest and/or its representative’s interest in securities). Recipients of this research in SG may contact Daiwa Capital Markets SG Limited in respect of any matter arising from or in connection with the research. Australia
This research is distributed in Australia by Daiwa Capital Markets Australia Limited and it may only be distributed in Australia to wholesale investors within the meaning of the Corporations Act. Recipients of this research in Australia may contact Daiwa Capital Markets Stockbroking Limited in respect of any matter arising from or in connection with the research. India
This research is distributed in India to Institutional Clients only by Daiwa Capital Markets India Private Limited (Daiwa India) which is an intermediary registered with Securities & Exchange Board of India as a Stock Broker, Merchant Bank and Research Analyst. Daiwa India, its Research Analyst and their family members and its associates do not have any financial interest save as disclosed or other undisclosed material conflict of interest in the securities or derivatives of any companies under coverage. Daiwa India and its associates may have received compensation for any products other than Investment Banking (as disclosed) or brokerage services from the subject company in this report during the past 12 months. Unless otherwise stated in BlueMatrix disclosure link at https://daiwa3.bluematrix.com/sellside/Disclosures.action, Daiwa India and its associates do not hold more than 1% of any companies covered in this research report. There is no material disciplinary action against Daiwa India by any regulatory authority impacting equity research analysis activities as of the date of this report. Associates of Daiwa India, registered with Indian regulators, include Daiwa Capital Markets Singapore Limited and Daiwa Portfolio Advisory (India) Private Limited and Associates of Daiwa India having office in India but not registered with any Indian regulators include Daiwa Corporate Advisory India Private Limited. Taiwan This research is solely for reference and not intended to provide tailored investment recommendations. This research is distributed in Taiwan by Daiwa-Cathay Capital Markets Co., Ltd. and it may only be distributed in Taiwan to specific customers who have signed recommendation contracts with Daiwa-Cathay Capital Markets Co., Ltd. and non-customers including (i) professional institutional investors, (ii) TWSE or TPEx listed companies, upstream and downstream vendors, and specialists that offer or seek advice, and (iii) potential customers with an actual need for business development in accordance with the Operational Regulations Governing Securities Firms Recommending Trades in Securities to Customers. Recipients of this research including non-customer recipients of this research shall not provide it to others or engage in any activities in connection with this research which may involve conflicts of interests. Neither Daiwa-Cathay Capital Markets Co., Ltd. nor its personnel who writes or reviews the research report has any conflict of interest in this research. Since Daiwa-Cathay Capital Markets Co., Ltd. does not operate brokerage trading business in foreign markets, this research is prepared on a “without recommendation” to any foreign securities basis and Daiwa-Cathay Capital Markets Co.,
Ltd. does not accept orders from customers to trade in such foreign securities. Recipients of this research shall carefully judge their own investment risk and take full responsibility for the results of any resulting investments in the companies and/or sectors featured in this research. Without the prior written permission of Daiwa-Cathay Capital Markets Co., Ltd., recipients of this research are prohibited from disclosing the research to the media, reprinting the research, or quoting from the research to other parties. Recipients of this research in Taiwan may contact Daiwa-Cathay Capital Markets Co., Ltd. in respect of any matter arising from or in connection with the research. Philippines
This research is distributed in the Philippines by DBP-Daiwa Capital Markets Philippines, Inc. which is regulated by the Philippines Securities and Exchange Commission and the Philippines Stock Exchange, Inc. Recipients of this research in the Philippines may contact DBP-Daiwa Capital Markets Philippines, Inc. in respect of any matter arising from or in connection with the research. DBP-Daiwa Capital Markets Philippines, Inc. recommends that investors independently assess, with a professional advisor, the specific financial risks as well as the legal, regulatory, tax, accounting, and other consequences of a proposed transaction. DBP-Daiwa Capital Markets Philippines, Inc. may have positions or may be materially interested in the securities in any of the markets mentioned in the publication or may have performed other services for the issuers of such securities. For relevant securities and trading rules please visit SEC and PSE link at http://www.sec.gov.ph/irr/AmendedIRRfinalversion.pdf and http://www.pse.com.ph/ respectively. United Kingdom
This research report is produced by Daiwa Securities Co. Ltd. and/or its affiliates and is distributed in the European Union, Iceland, Liechtenstein, Norway and Switzerland. Daiwa Capital Markets Europe Limited is authorised and regulated by The Financial Conduct Authority (“FCA”) and is a member of the London Stock Exchange and Eurex . This publication is intended for investors who are not Retail Clients in the United Kingdom within the meaning of the Rules of the FCA and should not therefore be distributed to such Retail Clients in the United Kingdom. Should you enter into investment business with Daiwa Capital Markets Europe’s affiliates outside the United Kingdom, we are obliged to advise that the protection afforded by the United Kingdom regulatory system may not apply; in particular, the benefits of the Financial Services Compensation Scheme may not be available. Daiwa Capital Markets Europe Limited has in place organisational arrangements for the prevention and avoidance of conflicts of interest. Our conflict management policy is available at http://www.uk.daiwacm.com/about-us/corporate-governance-regulatory. Germany
This document is distributed in Germany by Daiwa Capital Markets Europe Limited, Niederlassung Frankfurt which is regulated by BaFin (Bundesanstalt fuer Finanzdienstleistungsaufsicht) for the conduct of business in Germany. Bahrain
This research material is distributed in Bahrain by Daiwa Capital Markets Europe Limited, Bahrain Branch, regulated by The Central Bank of Bahrain and holds Investment Business Firm – Category 2 license and having its official place of business at the Bahrain World Trade Centre, South Tower, 7th floor, P.O. Box 30069, Manama, Kingdom of Bahrain. Tel No. +973 17534452 Fax No. +973 535113 United States This research is distributed into the United States directly by Daiwa Capital Markets Hong Kong Limited and indirectly by Daiwa Capital Markets America Inc. (DCMA), a U.S. Securities and Exchange Commission registered broker-dealer and FINRA member firm, exclusively to “major U.S. institutional investors”, as defined under Rule 15a-6 promulgated under the U.S. Securities Exchange Act of 1934, as amended, and as interpreted by the staff of the U.S. Securities and Exchange Commission (SEC). This report is not an offer to sell or the solicitation of any offer to buy securities. U.S. customers wishing to effect transactions in any designated investment discussed in this report should do so through a qualified salesperson of DCMA. Non-U.S. customers wishing to effect transactions in any designated investment discussed in this report should contact a Daiwa entity in their local jurisdiction. The securities or other investment products discussed in this report may not be eligible for sale in some jurisdictions. Analysts employed outside the U.S., as specifically indicated elsewhere in this report, are not registered as research analysts with FINRA. These analysts may not be associated persons of DCMA, and therefore may not be subject to FINRA Rule 2241 restrictions on communications with a subject company, public appearances and trading securities held by a research analyst account.
ADDITIONAL IMPORTANT DISCLOSURES CAN BE FOUND AT: https://daiwa3.bluematrix.com/sellside/Disclosures.action
Ownership of Securities: For “Ownership of Securities” information please visit BlueMatrix disclosure link at https://daiwa3.bluematrix.com/sellside/Disclosures.action. Investment Banking Relationships: For “Investment Banking Relationships” please visit BlueMatrix disclosure link at https://daiwa3.bluematrix.com/sellside/Disclosures.action. DCMA Market Making: For “DCMA Market Making” please visit BlueMatrix disclosure link at https://daiwa3.bluematrix.com/sellside/Disclosures.action. Research Analyst Conflicts: For updates on “Research Analyst Conflicts” please visit BlueMatrix disclosure link at https://daiwa3.bluematrix.com/sellside/Disclosures.action. The principal research analysts who prepared this report have no financial interest in securities of the issuers covered in the report, are not (nor are any members of their household) an officer, director or advisory board member of the issuer(s) covered in the report, and are not aware of any material relevant conflict of interest involving the analyst or DCMA, and did not receive any compensation from the issuer during the past 12 months except as noted: no exceptions.
49
Asian Dividend Strategy: 5 July 2019
Research Analyst Certification: For updates on “Research Analyst Certification” and “Rating System” please visit BlueMatrix disclosure link at https://daiwa3.bluematrix.com/sellside/Disclosures.action. The views about any and all of the subject securities and issuers expressed in this Research Report accurately reflect the personal views of the research analyst(s) primarily responsible for this report (or the views of the firm producing the report if no individual analysts[s] is named on the report); and no part of the compensation of such analyst(s) (or no part of the compensation of the firm if no individual analyst[s)] is named on the report) was, is, or will be directly or indirectly related to the specific recommendations or views contained in this Research Report. The following explains the rating system in the report as compared to relevant local indices, unless otherwise stated, based on the beliefs of the author of the report. "1": the security could outperform the local index by more than 15% over the next 12 months. "2": the security is expected to outperform the local index by 5-15% over the next 12 months. "3": the security is expected to perform within 5% of the local index (better or worse) over the next 12 months. "4": the security is expected to underperform the local index by 5-15% over the next 12 months. "5": the security could underperform the local index by more than 15% over the next 12 months. Disclosure of investment ratings
Rating Percentage of total
Buy* 67.99%
Hold** 22.52%
Sell*** 9.49%
Source: Daiwa
Notes: data is for single-branded Daiwa research in Asia (ex Japan) and correct as of 30 June 2019. * comprised of Daiwa’s Buy and Outperform ratings. ** comprised of Daiwa’s Hold ratings. *** comprised of Daiwa’s Underperform and Sell ratings. For stocks and sectors in Malaysia covered by Affin Hwang, the following rating system is in effect:
Stocks:
BUY: Total return is expected to exceed +10% over a 12-month period
HOLD: Total return is expected to be between -5% and +10% over a 12-month period
SELL: Total return is expected to be below -5% over a 12-month period
NOT RATED: Affin Hwang Investment Bank Berhad does not provide research coverage or rating for this company. Report is intended as information only and not as a recommendation
Sectors: OVERWEIGHT: Industry, as defined by the analyst’s coverage universe, is expected to outperform the KLCI benchmark over the next 12 months NEUTRAL: Industry, as defined by the analyst’s coverage universe, is expected to perform inline with the KLCI benchmark over the next 12 months UNDERWEIGHT: Industry, as defined by the analyst’s coverage universe is expected to under-perform the KLCI benchmark over the next 12 months Conflict of Interest Disclosure: Affin Hwang Ownership of Securities For “Ownership of Securities” information, please visit BlueMatrix disclosure Link at https://daiwa3.bluematrix.com/sellside/Disclosures.action. Investment Banking Relationships For “Investment Banking Relationship”, please visit BlueMatrix disclosure Link at https://daiwa3.bluematrix.com/sellside/Disclosures.action. Relevant Relationships Affin Hwang may from time to time have an individual employed by or associated with it serves as an officer of any of the companies under its research coverage. Affin Hwang market making Affin Hwang may from time to time make a market in securities covered by this research. For stocks and sectors in Indonesia covered by Bahana Sekuritas, the following rating system is in effect: Stock ratings are based on absolute upside or downside, which is the difference between the target price and the current market price. Unless otherwise specified, these ratings are set with a 12-month horizon. It is possible that future price volatility may cause a temporary mismatch between upside/downside for a stock based on the market price and the formal rating.
"Buy": the price of the security is expected to increase by 10% or more.
"Hold": the price of the security is expected to range from an increase of less than 10% to a decline of less than 5%.
"Reduce": the price of the security is expected to decline by 5% or more.
Sector ratings are based on fundamentals for the sector as a whole. Hence, a sector may be rated “Overweight” even though its constituent stocks are all rated “Reduce”; and a sector may be rated “Underweight” even though its constituent stocks are all rated “Buy”.
“Overweight”: positive fundamentals for the sector.
“Neutral”: neither positive nor negative fundamentals for the sector.
“Underweight”: negative fundamentals for the sector.
Ownership of Securities For “Ownership of Securities” information, please visit BlueMatrix disclosure Link at https://daiwa3.bluematrix.com/sellside/Disclosures.action. Investment Banking Relationships For “Investment Banking Relationship”, please visit BlueMatrix disclosure Link at https://daiwa3.bluematrix.com/sellside/Disclosures.action. Relevant Relationships (Bahana Sekuritas) Bahana Sekuritas may from time to time have an individual employed by or associated with it serves as an officer of any of the companies under its research coverage. Bahana Sekuritas market making Bahana Sekuritas may from time to time make a market in securities covered by this research. For stocks in Thailand covered by Thanachart Securities, the following rating system is in effect:
Ratings are based on absolute upside or downside, which is the difference between the target price and the current market price.
If the upside is 10% or more, the rating is BUY.
If the downside is 10% or more, the rating is SELL.
For stocks where the upside or downside is less than 10%, the rating is HOLD.
Unless otherwise specified, these ratings are set with a 12-month horizon. Thus, it is possible that future price volatility may cause a temporary mismatch between upside/downside for a stock based on the market price and the formal rating.
For the sector, Thanachart looks at two areas, ie, the sector outlook and the sector weighting.
For the sector outlook, an arrow pointing up, or the word “Positive”, is used when Thanachart sees the industry trend improving.
An arrow pointing down, or the word “Negative”, is used when Thanachart sees the industry trend deteriorating.
A double-tipped horizontal arrow, or the word “Unchanged”, is used when the industry trend does not look as if it will alter. The industry trend view is Thanachart’s top-down perspective on the industry rather than a bottom-up interpretation from the stocks that Thanachart covers.
An “Overweight” sector weighting is used when Thanachart has BUYs on majority of the stocks under its coverage by market cap.
“Underweight” is used when Thanachart has SELLs on majority of the stocks it covers by market cap.
“Neutral” is used when there are relatively equal weightings of BUYs and SELLs.
Ownership of Securities For “Ownership of Securities” information, please visit BlueMatrix disclosure Link at https://daiwa3.bluematrix.com/sellside/Disclosures.action . Investment Banking Relationships
50
Asian Dividend Strategy: 5 July 2019
For “Investment Banking Relationship”, please visit BlueMatrix disclosure Link at https://daiwa3.bluematrix.com/sellside/Disclosures.action . Relevant Relationships (Thanachart Securities) Thanachart Securities may from time to time have an individual employed by or associated with it serves as an officer of any of the companies under its research coverage. Thanachart Securities market making Thanachart Securities may from time to time make a market in securities covered by this research. For stocks in Vietnam covered by Saigon Securities, the following rating system is in effect:
For stocks in Vietnam covered by Saigon Securities, the following rating system is in effect:
Buy: Expected to provide a price gain at least 10 percentage points greater than the market over the next 12 months.
Outperform: Expected to provide a price gain up to 10 percentage points greater than the market over the next 12 months.
Neutral: Expected to provide a price gain similar to the market over the next 12 months.
Underperform: Expected to provide a price gain up to 10 percentage points less than the market over the next 12 months.
Sell: Expected to provide a price gain at least 10 percentage points less than the market over the next 12 months.
Ownership of Securities For “Ownership of Securities” information, please visit BlueMatrix disclosure Link at https://daiwa3.bluematrix.com/sellside/Disclosures.action . Investment Banking Relationships For “Investment Banking Relationship”, please visit BlueMatrix disclosure Link at https://daiwa3.bluematrix.com/sellside/Disclosures.action . Relevant Relationships (Saigon Securities) Saigon Securities may from time to time have an individual employed by or associated with it serves as an officer of any of the companies under its research coverage. Saigon Securities market making Saigon Securities may from time to time make a market in securities covered by this research. Additional information may be available upon request. Japan - additional notification items pursuant to Article 37 of the Financial Instruments and Exchange Law
(This Notification is only applicable where report is distributed by Daiwa Securities Co. Ltd.) If you decide to enter into a business arrangement with us based on the information described in materials presented along with this document, we ask you to pay close attention to the following items.
In addition to the purchase price of a financial instrument, we will collect a trading commission* for each transaction as agreed beforehand with you. Since commissions may be included in the purchase price or may not be charged for certain transactions, we recommend that you confirm the commission for each transaction.
In some cases, we may also charge a maximum of ¥ 2 million (including tax) per year as a standing proxy fee for our deposit of your securities, if you are a non-resident of Japan.
For derivative and margin transactions etc., we may require collateral or margin requirements in accordance with an agreement made beforehand with you. Ordinarily in such cases, the amount of the transaction will be in excess of the required collateral or margin requirements.
There is a risk that you will incur losses on your transactions due to changes in the market price of financial instruments based on fluctuations in interest rates, exchange rates, stock prices, real estate prices, commodity prices, and others. In addition, depending on the content of the transaction, the loss could exceed the amount of the collateral or margin requirements.
There may be a difference between bid price etc. and ask price etc. of OTC derivatives handled by us.
Before engaging in any trading, please thoroughly confirm accounting and tax treatments regarding your trading in financial instruments with such experts as certified public accountants.
*The amount of the trading commission cannot be stated here in advance because it will be determined between our company and you based on current market conditions and the content of each transaction etc.
When making an actual transaction, please be sure to carefully read the materials presented to you prior to the execution of agreement, and to take responsibility for your own decisions regarding the signing of the agreement with us.
Corporate Name: Daiwa Securities Co. Ltd. Financial instruments firm: chief of Kanto Local Finance Bureau (Kin-sho) No.108 Memberships: Japan Securities Dealers Association, Financial Futures Association of Japan Japan Securities Investment Advisers Association Type II Financial Instruments Firms Association


