xIlkogretim Online - Elementary Education Online,2021; Vol 20 (Issue 1): pp.2600-2617 http://ilkogretim-online.org doi: 10.17051/ilkonline.2021.01.292
2600| Kalpana Agrawal A Trend Analysis on Rice Exports from India
A Trend Analysis on Rice Exports from India DR. KALPANA AGRAWAL
ABSTRACT- In Aisa India is the main rice exporter.India is popular for its rice cultivation all over the world, rice export by India is in three categories which are Basmati, non-Basmati and other. India is the second large exporter in the world, it has generated the export value of 4905.67 million USD in 2017-18 . Export value of basmati rice is 2,612.09 million USD from basmati rice under 10063020 in 2017-18. While exported value of non-basmati rice is 1,267.44 million USD from non-basmati rice under 10063010 in 2017-18.India's contribution in export of rice has always been significant. in the world . India exports rice to various countries like Saudi Arab, Iran, Kuwait, United Arab Emirates, U.K. etc.The study was based on secondary data. The time series data on export of rice from India for the period 2008-09 to 2017-18 was taken for the study.It also focuses on future prospects of rice export and this paper also analyzes Trend, RCA,Direction and growth of rice exports from India.
Keywords: Rice, Export, trends, India, RCA
I. INTRODUCTION
Indian economy is dependent on agriculture. India is the leading important role of exporter of the Rice to the global markets. It is the base of the Indian economy and is the oldest and largest occupation of India. In agriculture rice is one of the most important food harvest of India and second across the world. Agriculture is still one of the priority sectors of the rural economy.
Rice export by India is in three category which is Basmati, non-Basmati and other. Any rice other than Basmati Rice is named as Non- Basmati rice. Rice is an important commodity which is being exported to different countries. Basmati and non-basmati and other rice are exported from India to different countries. India is the leading exporter of the Basmati Rice to the global markets. During 2015-16 the country had exported globally about 40.45 Lakh MT of Basmati Rice and 63.66 Lakh MT Non-Basmati rice for the worth of Rs. 2,2718.44 crores and Rs. 15,129.09 crores respectively. India had exported around 5.04 million tonne in the 2019-20 season. In 2017-18,India had exported 8 million tonne the highest export of non-basmati rice. B Krishna Rao, president, AIREA had said. “Indian prices are very econmic which makes massive export of rice possible.". He said. “Indian non-basmati rice varieties are around ten percent economic than Thailand and Vietnam, Inida's price are at $370-380 per tonne as against $460-470 a tonne in Thailand and Vietnam. Both Thailand and Vietnam put a halt to export during lockdown but India continued to export and it gave a boost to India's rice export. During lockdown the demand for rice rose as it cooks easily and was simplest and quick food to put on table and Biryani even tops the menu and gave huge opportunity for exports to India. Even during months of lockdown Swiggy claimed to have delivered 5.5 lakh biryanis thus rice became glutinous grain and it became superstar food consumption. In Europe, consumers are drawn towards aromatic basmati rice for traditional dishes such as sushi, risotto or paella. Becuase of the fear in Europe that the spread of the new strain of the coronavirus will further result in impose of another lockdown, so customers in many countries including Europe hoarded basmati rice and thus demand of Indian Rice rose.
The common variety of basmati rice, 1121 Pusa, which is mostly exported, fetching a 15% higher price from November 2020.Basmati is long grain aromatic rice grown for many centuries in the specific geographical area, at the Himalayan foot hills of Indian sub-continent, blessed with characteristics extra- long slender grains that elongate at least twice of their original size with a characteristics soft and fluffy texture upon cooking, delicious taste, superior aroma and distinct flavor, Basmati rice is unique among other aromatic long grain rice varieties.Twenty nine varieties of Basmati rice were notified under the seeds Act, 1966. These are Basmati 217, Basmati 370, Type 3 (Dehraduni Basmati) Punjab Basmati 1 (Bauni Basmati), Pusa Basmati 1, Kasturi, Haryana Basmati 1, Mahi Sugandha, Taraori Basmati (HBC 19 / Karnal Local), Ranbir Basmati, Basmati 386, Improved Pusa Basmati 1 (Pusa 1460), Pusa Basmati 1121 (After amendment), Vallabh Basmati 22, Pusa Basmati 6 (Pusa 1401), Punjab Basmati 2, Basmati CSR 30
2601| Kalpana Agrawal A Trend Analysis on Rice Exports from India
(After amendment), Malviya Basmati Dhan 10-9 (IET 21669), Vallabh Basmati 21 (IET 19493), Pusa Basmati 1509 (IET 21960), Basmati 564, Vallabh Basmati 23, Vallabh Basmati 24, Pusa Basmati 1609, Pant Basmati 1 (IET 21665), Pant Basmati 2 (IET 21953), Punjab Basmati 3, Pusa Basmati 1637, Pusa Basmati 1728.
In the world it has been reported that there are 10000 varieties of rice and out of which the maximum number are in India.The country had exported 68,20,773.06 MT of Non-Basmati Rice to the world for the worth of Rs. 17,145.36 cores / 2,563.72 USD Millions during the year 2017-18. India produced 7.5 million tonnes of basmati in 2019-20, of which 61% was exported, by which the country earned Rs 31,025 crore, according to the commerce and industry ministry.Non-basmati rice exports from India increased by 123% in the April-November 2020 period to 7.03 million tonne, which was 6.12 million tonne in the year-ago period. In November 2020 Exports rose by 159% at 0.90 million tonne, against 0.35 million tonne during the same period last year, Kaul Executive Director of AIREA said.
It has generated the export value of 4905.67 million USD in 2017-18. Export value of basmati rice was 2,612.09 USD million from basmati rice in 2017-18. While exported value of non-basmati rice was 1,267.44 million USD from non-basmati rice in 2017-18.India exports rice to various countries like Saudi Arab, Iran, Kuwait, United Arab Emirates, U.K. etc.Value of Rice export from India to Saudi Arab was 416.54 $US million in 2017-18, Iran generated the export value of 698-49 million $US in 2017-18, Kuwait had generated the export value of 106.19 million $US in 2017-18, United Arab Emirates had generated the export value of 389.6353 million $US in 2017-18 and U.K had generated the export value of 160.56 million $US in 2017-18.
Government’s recent move to allow rice shipments through the deep-water port in Kakinada, which is the major export hub for non-basmati rice, would speed up the shipments in the coming time. The Rice Exporters Association (TREA), the trade body of non-basmati rice exporters, is very bouyant on the potential of export of rice. As more importers from South America, Eastern Africa and South East Asia began lining up for the Indian rice, the exports of both basmati and non-basmati rice will be seen scaling great highs.
Vinod Kaul, the Executive Director of AIREA( All India Rice Exporters Association ) said despite the fact that there has been a twenty nine per cent dip in export volumes of rice to Iran,“We expect the basmati volumes to touch 5 million tonnes this year.” Other countries in the Middle East have imported higher quantities this year. India is the most sought-after market for the non-basmati rice as other major producers face supply issues,”
Rice exports including both basmati and non-basmati types are expected to range between 16 and 17 million tonnes (mt) against previous fiscal’s 9.48 mt.For the April-December period of current financial year, total rice exports have shown 80 per cent increase at 11.59 mt (6.42 mt). Of this, shipments of basmati rice has grown by 19 per cent at 3.38 mt while that of non-basmati have seen a astonishing rise of 129 per cent at 8.21 mt (3.58 mt).
Objectives of the study:-
To study the export of rice from India. To analyze the India’s rice export performance. To study the trends and variability of rice export from India. To study India's rice export competitiveness with the major competitors using RCA Index.
II. LITERATURE REVIEW
According to Department of Food and Public Distribution in (2014) reported During 2006-07 a total quantity of 54.54 lakh tonnes was imported at a weighted average price of US $ 204.65( Rs. 9,240.72) per tonne and in 2007-08 a total quantity of 17.69 lakh MT of wheat was imported at a weighted average price of US $ 372.82 /Rs. 14,755.32 per tonne and no import of rice for the Central Pool took place during since 2003-04. In order to meet the shortfall in the Central Pool, the Government decided to import wheat during 2006-07 & 2007-08.
2602| Kalpana Agrawal A Trend Analysis on Rice Exports from India
According to Allan and Santosh in (2013) the government continued focus on developed Green Revolution technology in the rice growing regions of eastern India through promotion of hybrid rice cultivation, intensification techniques and other modern production techniques support a MY 2013-14 near-record production forecast of 102.0 million tonnes.
According to Raghu ram and Asopain (2008) reported that rice is exported in two varieties, basmati (aromatic) and non-basmati. The basmati rice exports are of three categories: white, brown and parboiled. India earned Rs 18.4 billion in 2001-02 from exports of basmati rice and non-basmati rice contributed Rs. 13.3 billion for the same period. Mandating open mandi procurement rather than FCI canalized procurement by exporters seems to improve storage facilities proactively making provisions for wagon availability during peak movement. Improving the efficiency of supply chain through special purpose agri jetties in ports like Kandla and Mundra on the west coast, and Paradip and Vishakhapatnam on the east coast to reduce ship turnaround time.
According to Amita Batra & Zeba Khan (2005), “Revealed Comparative Advantage: An analysis for India and China” analyzed the pattern of comparative advantage for India and China in the world market. The researchers provided the detailed information regarding the India and China’s top performing sectors and commodities. Study revealed that both India and China enjoy comparative advantage for labor and resource intensive sectors in the world market.
III. RESEARCH METHOLODGY:-
The study: The study undertaken was exploratory in nature and secondary data was used for Trend Analysis of export of rice and And Revealed Comparative Advantage.
Identification of variable: To study export growth potential of Indian rice industry for major export destination of rice product were chosen for study viz. India, Saudi Arab, Bangladesh, Iran, Kuwait, United Arab Emirates etc.
Export data with respect to the above countries were collected for a period of ten years from 2008-09 to 2017-18. Data were sourced from official website of department of commerce of India and from annual report of Indian foreign trade. Computations were primarily based on data at the ITC-HS six-digit level as the ITC-HS codes are uniform across countries.
Tool for data analysis: To find export growth potential of Indian rice sector for ten major export destination under the study, trend analysis was applied on the data and Revealed Comparative Advantage was also used for identifying the comparative advantage of India with other export competitors of rice.
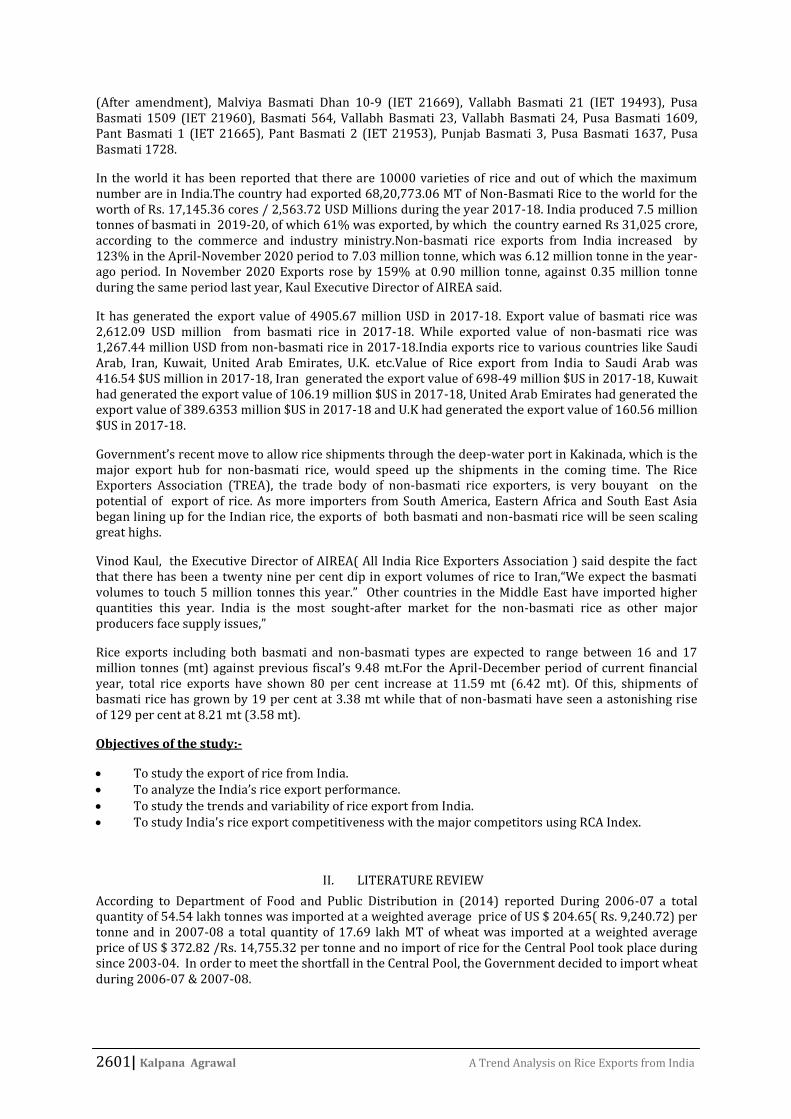
(India’s rice exports - Volume in million tonnes and Value in billion dollars)
Basmati Non Basmati
Volume Value Volume Value
2020-21 (April-Dec) 3.38 2.94 8.21 3.07
2019-20 4.45 4.37 5.03 2.02
2018-19 4.41 4.71 7.53 3.00
2017-18 4.05 4.16 8.63 3.56
2603| Kalpana Agrawal A Trend Analysis on Rice Exports from India
Basmati Non Basmati
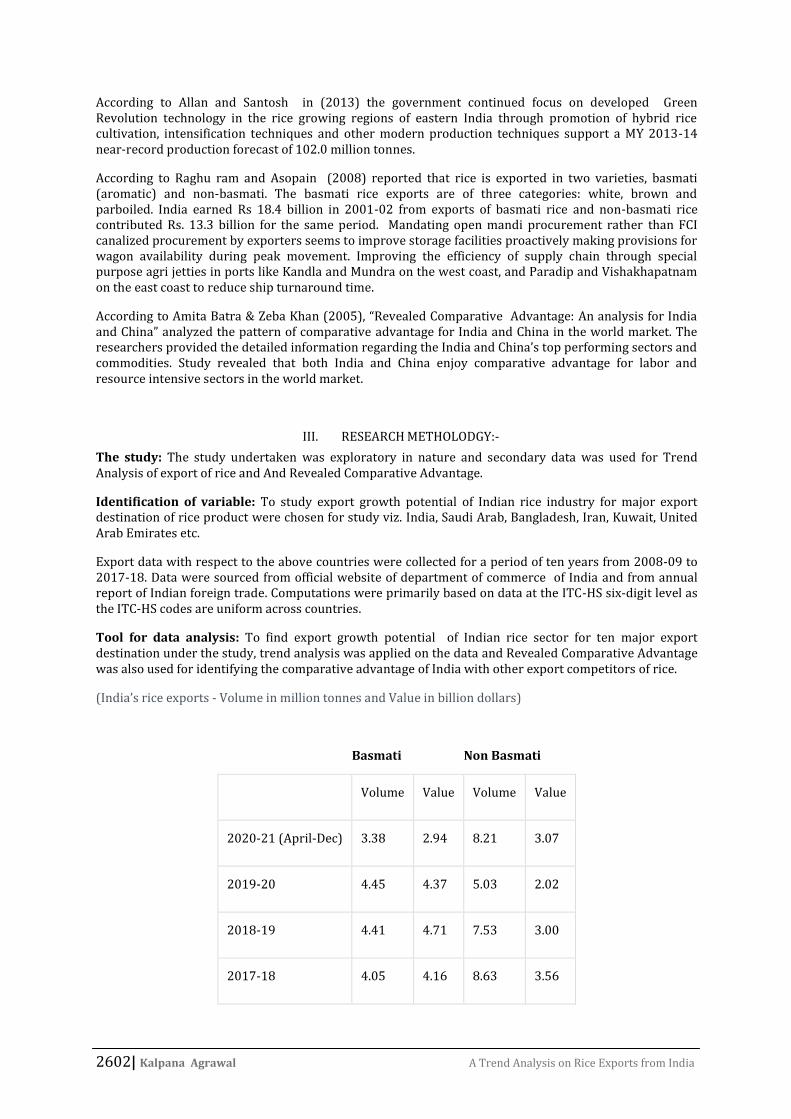
2016-17 3.99 3.22 6.81 2.55
2015-16 4.04 3.48 6.37 2.31
2014-15 3.70 4.52 8.22 3.32
2013-14 3.75 4.86 7.14 2.93
2012-13 3.45 3.56 6.68 2.65
2011-12 3.16 3.22 3.99 1.72
2010-11 2.33 2.49 0.10 0.05
Source:APEDA DGCIS
Table No.1
TOTAL EXPORT FROM INDIA DURING 2008-09 TO 2017-18
DATE – 18/02/18
Values in US $ MILLION
TOTAL RICE EXPORT FROM INDIA
S.NO YEARS
Share % Total export value( US $
MILLION)
1 2008-09
1.3244
4069.85
2 2009-10
1.3235
4189.45
3 2010-11
1.0186
4349.69
4 2011-12
1.6147
4904.36
5 2012-13
2.0692
6216.01
6 2013-14
2.4776
7789.75
2604| Kalpana Agrawal A Trend Analysis on Rice Exports from India
Table No.2
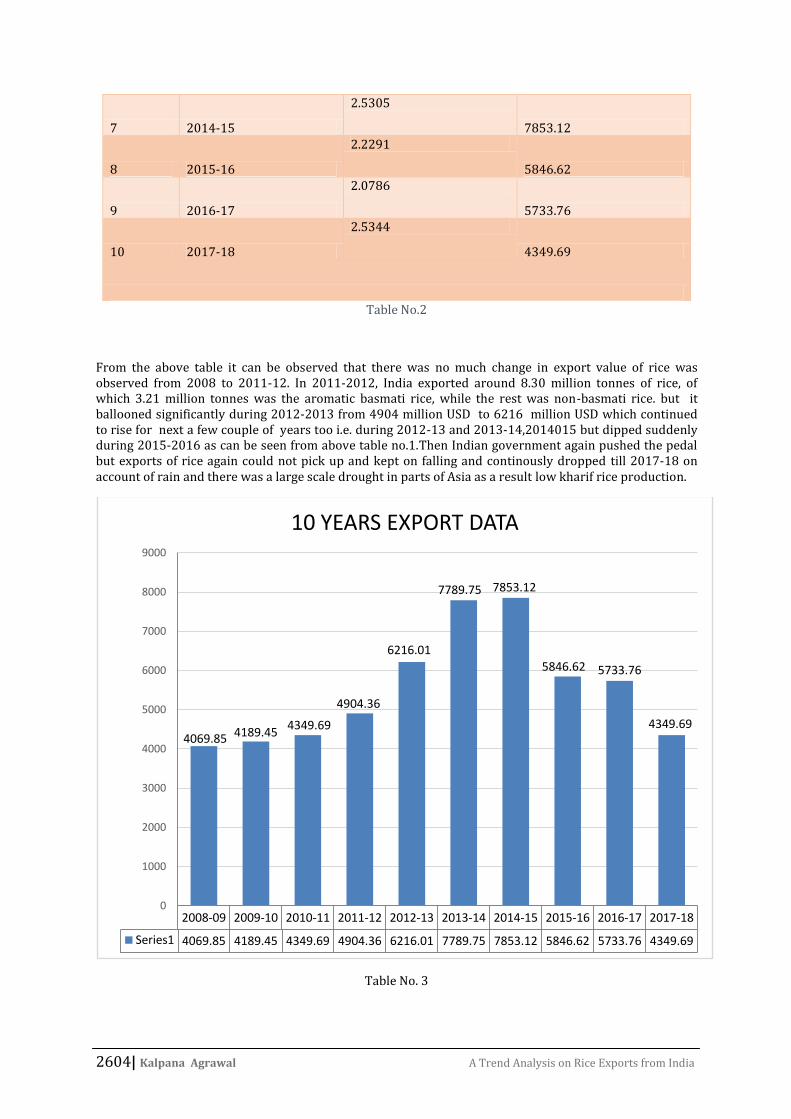
From the above table it can be observed that there was no much change in export value of rice was observed from 2008 to 2011-12. In 2011-2012, India exported around 8.30 million tonnes of rice, of which 3.21 million tonnes was the aromatic basmati rice, while the rest was non-basmati rice. but it ballooned significantly during 2012-2013 from 4904 million USD to 6216 million USD which continued to rise for next a few couple of years too i.e. during 2012-13 and 2013-14,2014015 but dipped suddenly during 2015-2016 as can be seen from above table no.1.Then Indian government again pushed the pedal but exports of rice again could not pick up and kept on falling and continously dropped till 2017-18 on account of rain and there was a large scale drought in parts of Asia as a result low kharif rice production.
Table No. 3
2008-09 2009-10 2010-11 2011-12 2012-13 2013-14 2014-15 2015-16 2016-17 2017-18
Series1 4069.85 4189.45 4349.69 4904.36 6216.01 7789.75 7853.12 5846.62 5733.76 4349.69
4069.85 4189.454349.69
4904.36
6216.01
7789.75 7853.12
5846.62 5733.76
4349.69
0
1000
2000
3000
4000
5000
6000
7000
8000
9000
10 YEARS EXPORT DATA
7 2014-15
2.5305
7853.12
8 2015-16
2.2291
5846.62
9 2016-17
2.0786
5733.76
10 2017-18
2.5344
4349.69
2605| Kalpana Agrawal A Trend Analysis on Rice Exports from India
As described above table no.1 in the same manner it can be depicted through the above graph that down fall in export value could be observed from the period 2015-16 to 2017-18.During 2008-2015 rice exports increased due to good quality and production. And rice export of India dropped during 2015-17 due to uneven rainfall and as a result domestic production of rice suffered.
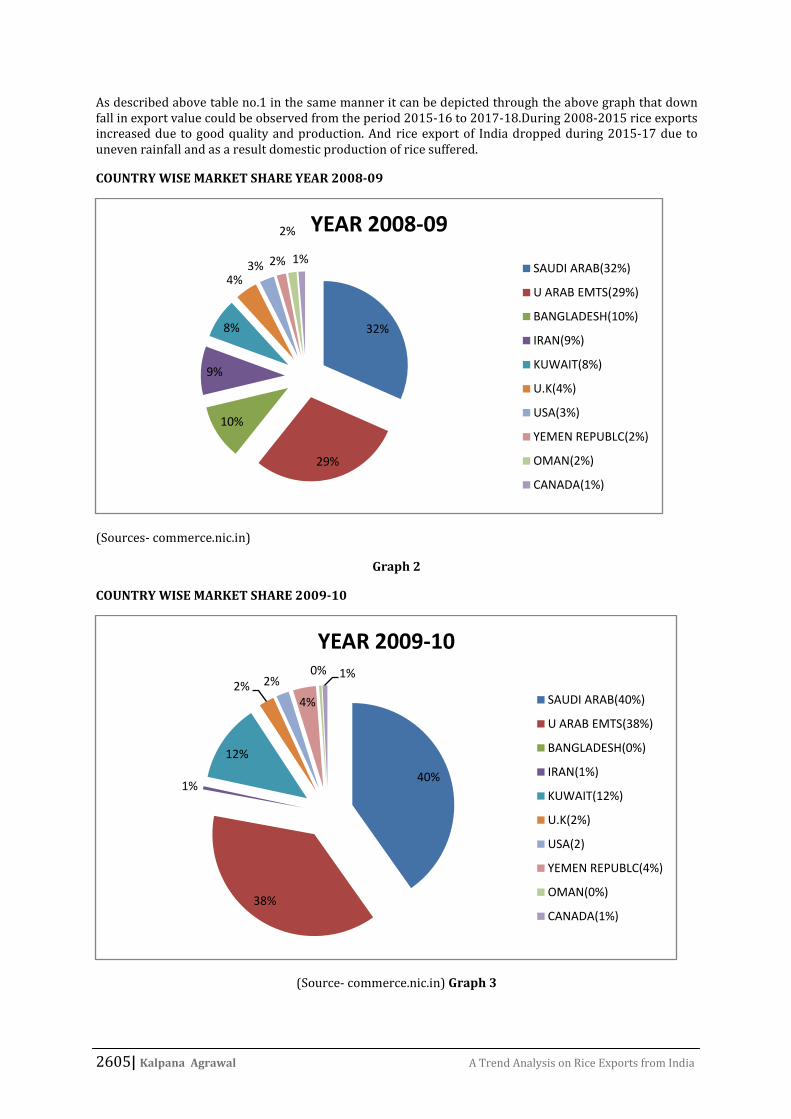
COUNTRY WISE MARKET SHARE YEAR 2008-09
(Sources- commerce.nic.in)
Graph 2
COUNTRY WISE MARKET SHARE 2009-10
(Source- commerce.nic.in) Graph 3
32%
29%
10%
9%
8%
4%3% 2%
2%
1%
YEAR 2008-09
SAUDI ARAB(32%)
U ARAB EMTS(29%)
BANGLADESH(10%)
IRAN(9%)
KUWAIT(8%)
U.K(4%)
USA(3%)
YEMEN REPUBLC(2%)
OMAN(2%)
CANADA(1%)
40%
38%
1%
12%
2% 2%
4%
0% 1%
YEAR 2009-10
SAUDI ARAB(40%)
U ARAB EMTS(38%)
BANGLADESH(0%)
IRAN(1%)
KUWAIT(12%)
U.K(2%)
USA(2)
YEMEN REPUBLC(4%)
OMAN(0%)
CANADA(1%)
2606| Kalpana Agrawal A Trend Analysis on Rice Exports from India
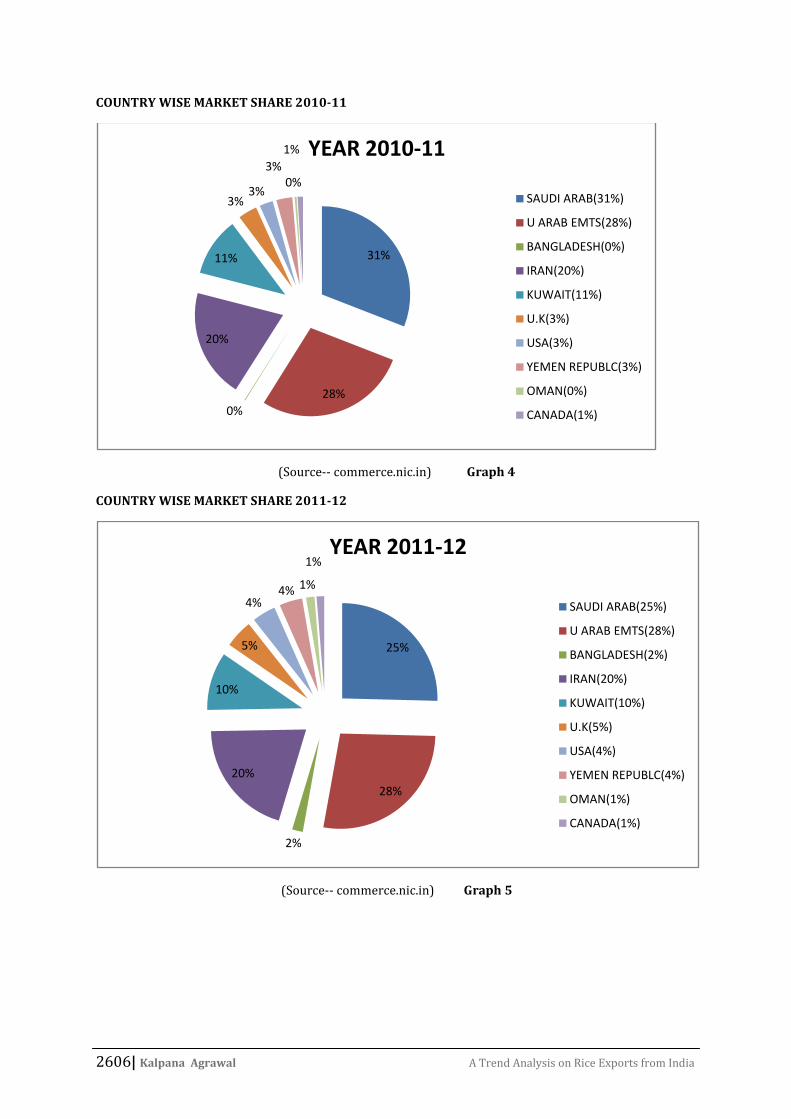
COUNTRY WISE MARKET SHARE 2010-11
(Source-- commerce.nic.in) Graph 4
COUNTRY WISE MARKET SHARE 2011-12
(Source-- commerce.nic.in) Graph 5
31%
28%
0%
20%
11%
3%3%
3%0%
1% YEAR 2010-11
SAUDI ARAB(31%)
U ARAB EMTS(28%)
BANGLADESH(0%)
IRAN(20%)
KUWAIT(11%)
U.K(3%)
USA(3%)
YEMEN REPUBLC(3%)
OMAN(0%)
CANADA(1%)
25%
28%
2%
20%
10%
5%
4%4% 1%
1%YEAR 2011-12
SAUDI ARAB(25%)
U ARAB EMTS(28%)
BANGLADESH(2%)
IRAN(20%)
KUWAIT(10%)
U.K(5%)
USA(4%)
YEMEN REPUBLC(4%)
OMAN(1%)
CANADA(1%)
2607| Kalpana Agrawal A Trend Analysis on Rice Exports from India
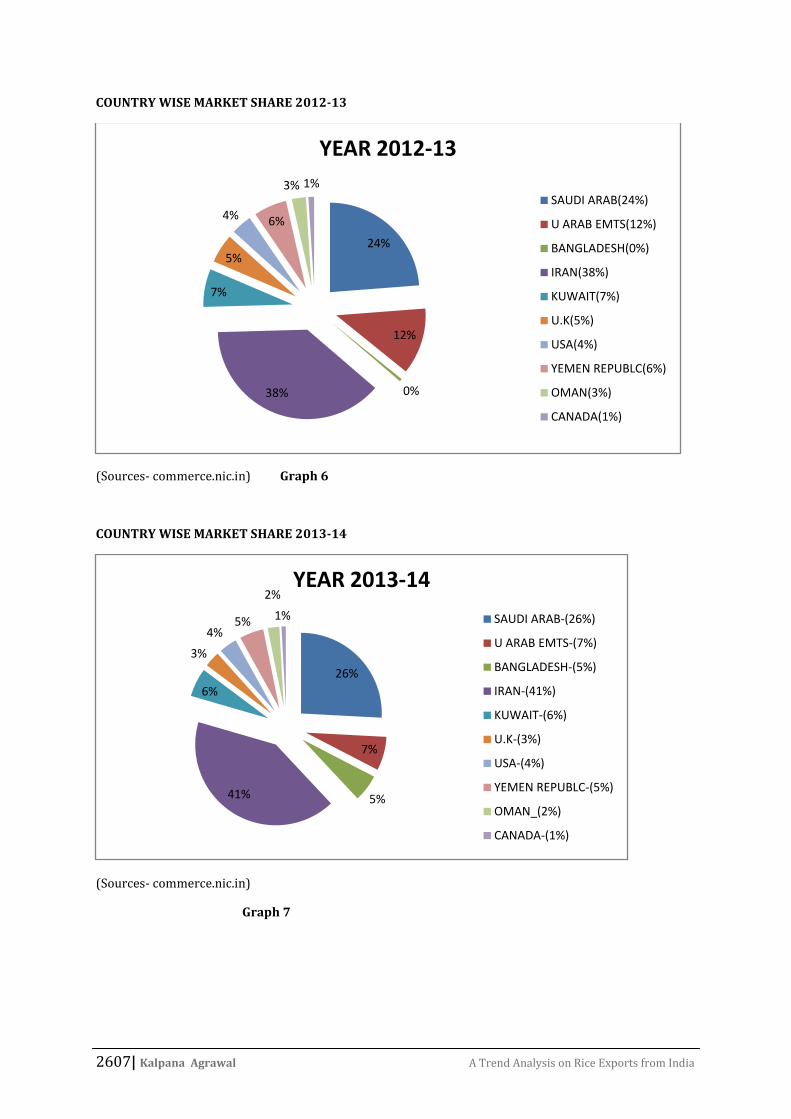
COUNTRY WISE MARKET SHARE 2012-13
(Sources- commerce.nic.in) Graph 6
COUNTRY WISE MARKET SHARE 2013-14
(Sources- commerce.nic.in)
Graph 7
24%
12%
0%38%
7%
5%
4% 6%
3% 1%
YEAR 2012-13
SAUDI ARAB(24%)
U ARAB EMTS(12%)
BANGLADESH(0%)
IRAN(38%)
KUWAIT(7%)
U.K(5%)
USA(4%)
YEMEN REPUBLC(6%)
OMAN(3%)
CANADA(1%)
26%
7%
5%41%
6%
3%
4%5%
2%
1%
YEAR 2013-14
SAUDI ARAB-(26%)
U ARAB EMTS-(7%)
BANGLADESH-(5%)
IRAN-(41%)
KUWAIT-(6%)
U.K-(3%)
USA-(4%)
YEMEN REPUBLC-(5%)
OMAN_(2%)
CANADA-(1%)
2608| Kalpana Agrawal A Trend Analysis on Rice Exports from India
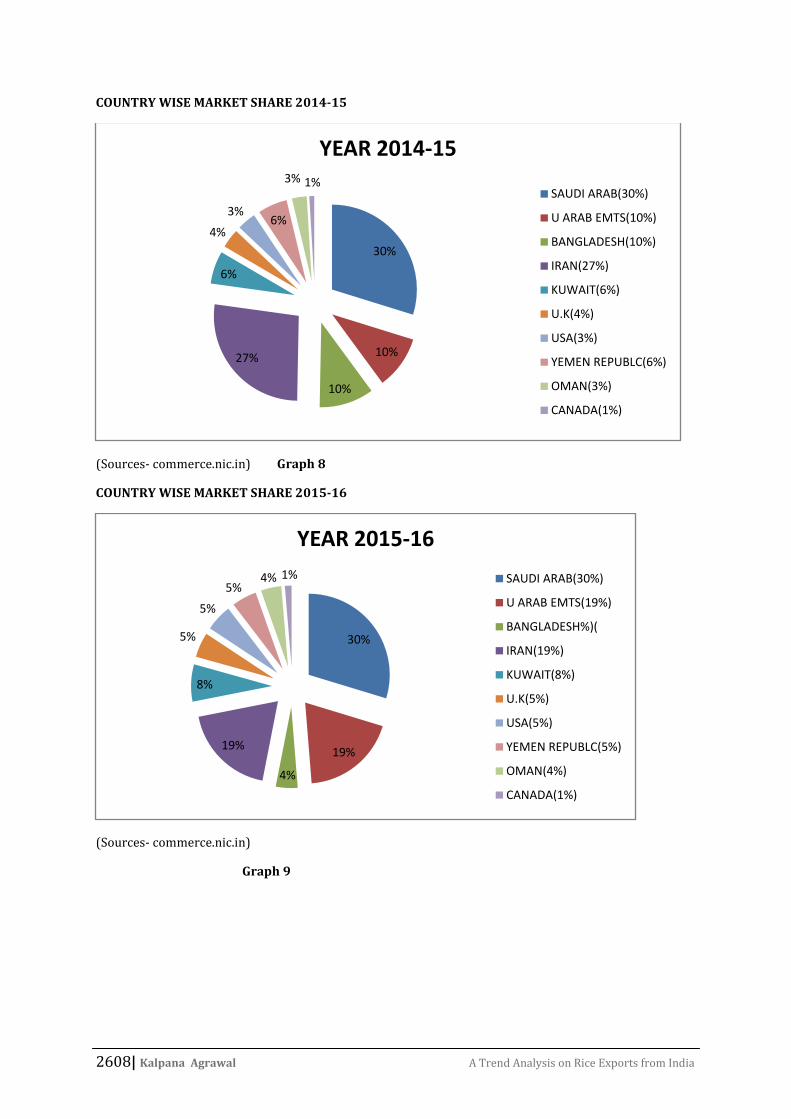
COUNTRY WISE MARKET SHARE 2014-15
(Sources- commerce.nic.in) Graph 8
COUNTRY WISE MARKET SHARE 2015-16
(Sources- commerce.nic.in)
Graph 9
30%
10%
10%
27%
6%
4%
3%6%
3% 1%
YEAR 2014-15
SAUDI ARAB(30%)
U ARAB EMTS(10%)
BANGLADESH(10%)
IRAN(27%)
KUWAIT(6%)
U.K(4%)
USA(3%)
YEMEN REPUBLC(6%)
OMAN(3%)
CANADA(1%)
30%
19%
4%
19%
8%
5%
5%
5%4% 1%
YEAR 2015-16
SAUDI ARAB(30%)
U ARAB EMTS(19%)
BANGLADESH%)(
IRAN(19%)
KUWAIT(8%)
U.K(5%)
USA(5%)
YEMEN REPUBLC(5%)
OMAN(4%)
CANADA(1%)
2609| Kalpana Agrawal A Trend Analysis on Rice Exports from India
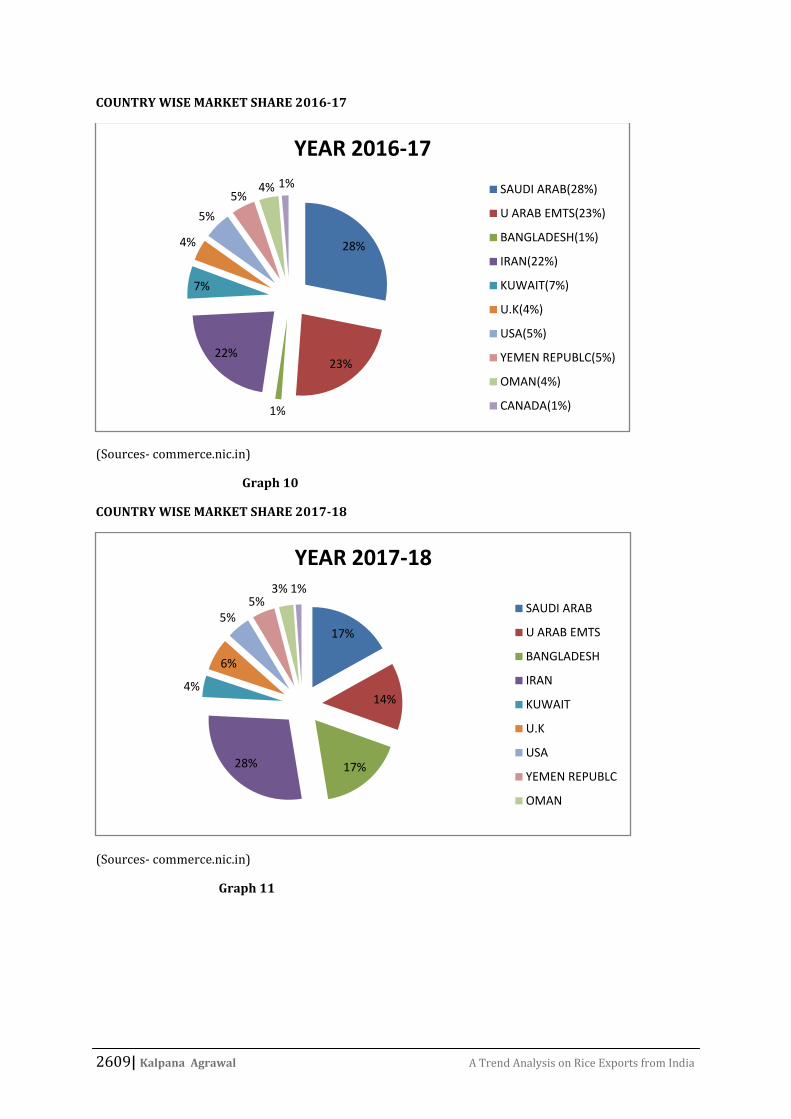
COUNTRY WISE MARKET SHARE 2016-17
(Sources- commerce.nic.in)
Graph 10
COUNTRY WISE MARKET SHARE 2017-18
(Sources- commerce.nic.in)
Graph 11
28%
23%
1%
22%
7%
4%
5%
5%4% 1%
YEAR 2016-17
SAUDI ARAB(28%)
U ARAB EMTS(23%)
BANGLADESH(1%)
IRAN(22%)
KUWAIT(7%)
U.K(4%)
USA(5%)
YEMEN REPUBLC(5%)
OMAN(4%)
CANADA(1%)
17%
14%
17%28%
4%
6%
5%5%
3% 1%
YEAR 2017-18
SAUDI ARAB
U ARAB EMTS
BANGLADESH
IRAN
KUWAIT
U.K
USA
YEMEN REPUBLC
OMAN
2610| Kalpana Agrawal A Trend Analysis on Rice Exports from India
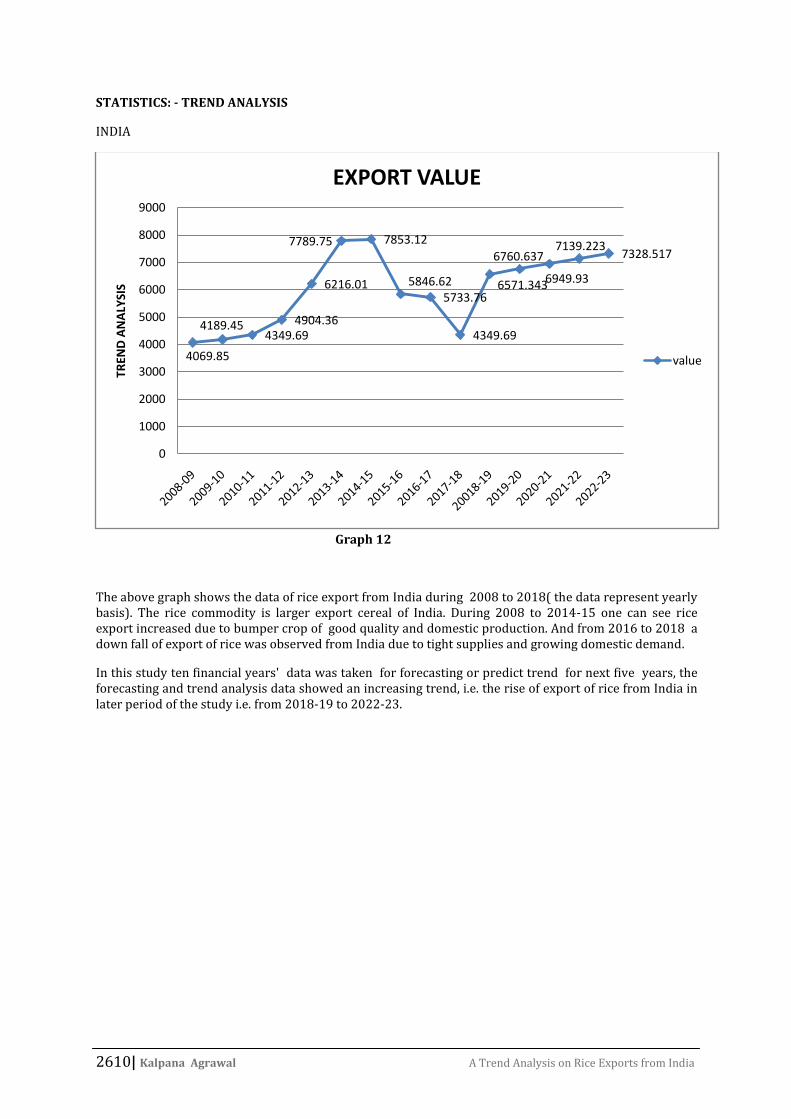
STATISTICS: - TREND ANALYSIS
INDIA
Graph 12
The above graph shows the data of rice export from India during 2008 to 2018( the data represent yearly basis). The rice commodity is larger export cereal of India. During 2008 to 2014-15 one can see rice export increased due to bumper crop of good quality and domestic production. And from 2016 to 2018 a down fall of export of rice was observed from India due to tight supplies and growing domestic demand.
In this study ten financial years' data was taken for forecasting or predict trend for next five years, the forecasting and trend analysis data showed an increasing trend, i.e. the rise of export of rice from India in later period of the study i.e. from 2018-19 to 2022-23.
4069.85
4189.454349.69
4904.36
6216.01
7789.75 7853.12
5846.625733.76
4349.69
6571.343
6760.637
6949.93
7139.2237328.517
0
1000
2000
3000
4000
5000
6000
7000
8000
9000
TREN
D A
NA
LYSI
S
EXPORT VALUE
value
2611| Kalpana Agrawal A Trend Analysis on Rice Exports from India
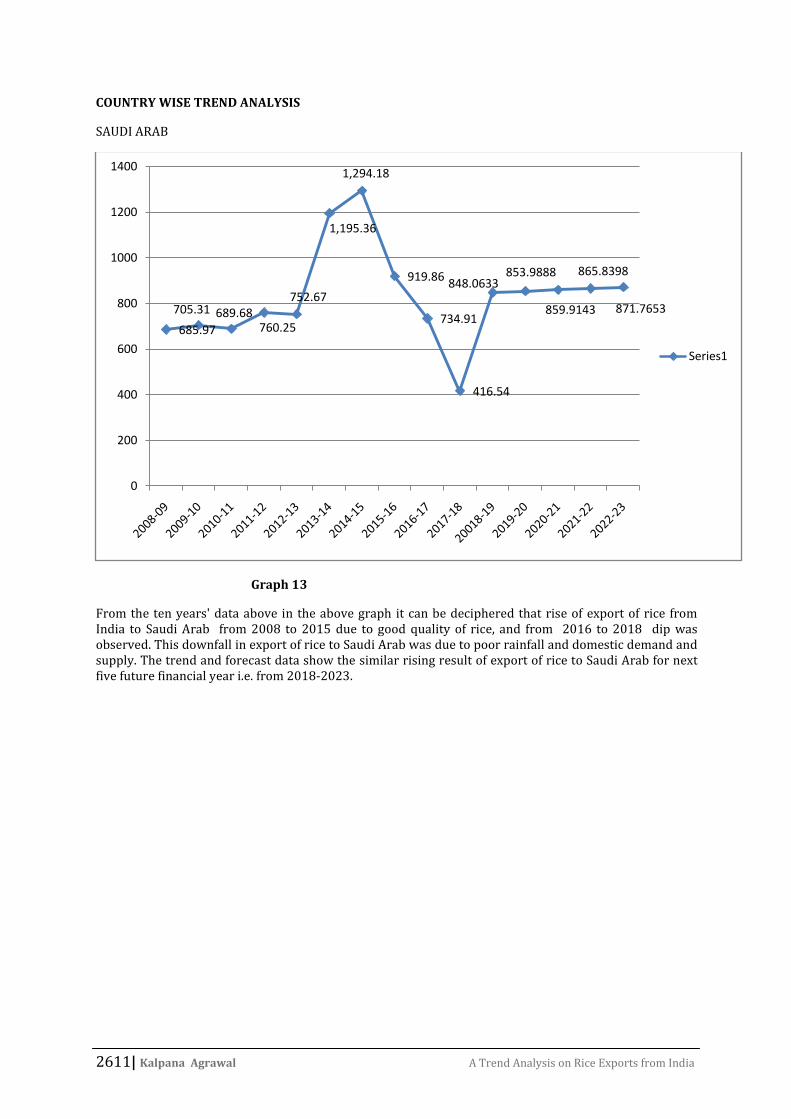
COUNTRY WISE TREND ANALYSIS
SAUDI ARAB
Graph 13
From the ten years' data above in the above graph it can be deciphered that rise of export of rice from India to Saudi Arab from 2008 to 2015 due to good quality of rice, and from 2016 to 2018 dip was observed. This downfall in export of rice to Saudi Arab was due to poor rainfall and domestic demand and supply. The trend and forecast data show the similar rising result of export of rice to Saudi Arab for next five future financial year i.e. from 2018-2023.
685.97
705.31 689.68760.25
752.67
1,195.36
1,294.18
919.86
734.91
416.54
848.0633853.9888
859.9143
865.8398
871.7653
0
200
400
600
800
1000
1200
1400
Series1
2612| Kalpana Agrawal A Trend Analysis on Rice Exports from India
COUNTRY WISE TREND ANALYSIS
IRAN
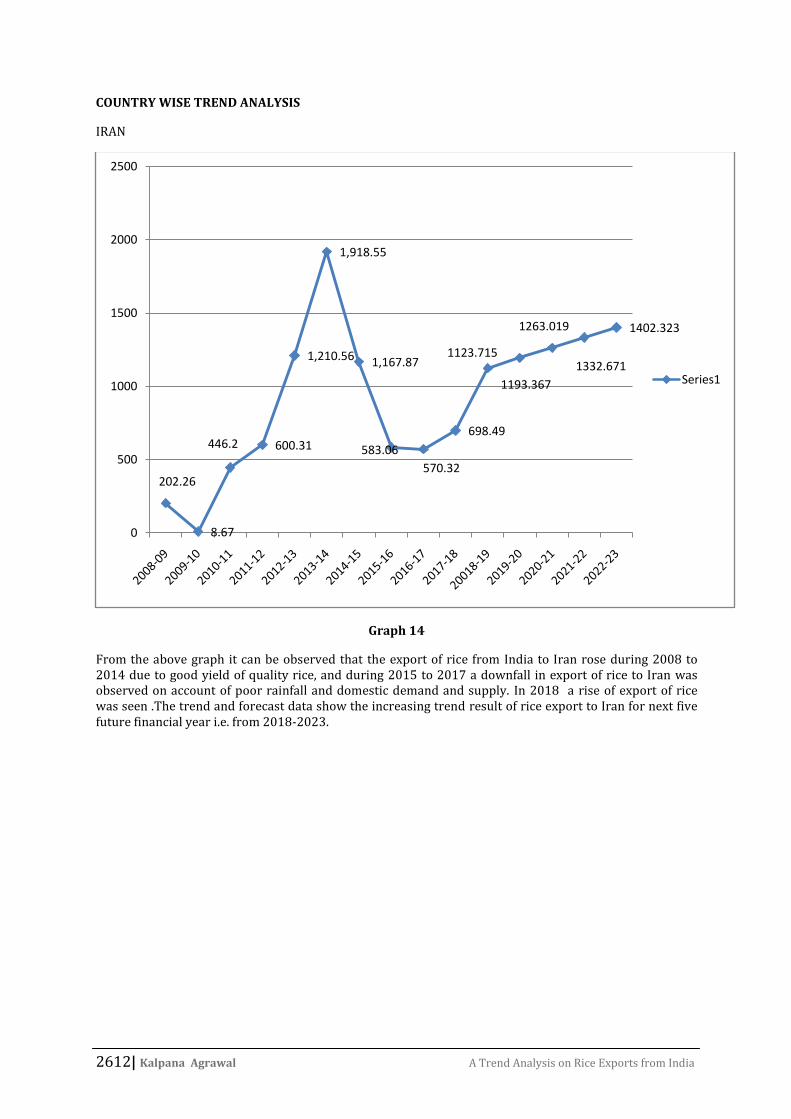
Graph 14
From the above graph it can be observed that the export of rice from India to Iran rose during 2008 to 2014 due to good yield of quality rice, and during 2015 to 2017 a downfall in export of rice to Iran was observed on account of poor rainfall and domestic demand and supply. In 2018 a rise of export of rice was seen .The trend and forecast data show the increasing trend result of rice export to Iran for next five future financial year i.e. from 2018-2023.
202.26
8.67
446.2 600.31
1,210.56
1,918.55
1,167.87
583.06
570.32
698.49
1123.715
1193.367
1263.019
1332.671
1402.323
0
500
1000
1500
2000
2500
Series1
2613| Kalpana Agrawal A Trend Analysis on Rice Exports from India
COUNTRY WISE TREND ANALYSIS
KUWAIT
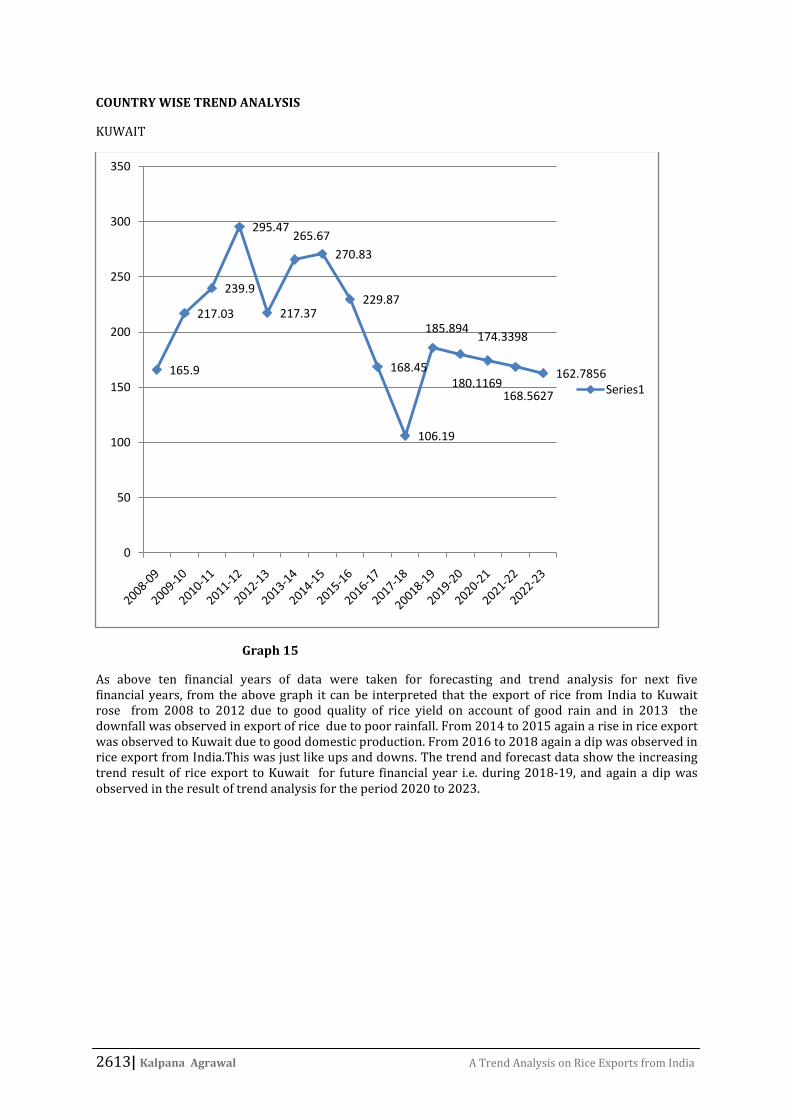
Graph 15
As above ten financial years of data were taken for forecasting and trend analysis for next five financial years, from the above graph it can be interpreted that the export of rice from India to Kuwait rose from 2008 to 2012 due to good quality of rice yield on account of good rain and in 2013 the downfall was observed in export of rice due to poor rainfall. From 2014 to 2015 again a rise in rice export was observed to Kuwait due to good domestic production. From 2016 to 2018 again a dip was observed in rice export from India.This was just like ups and downs. The trend and forecast data show the increasing trend result of rice export to Kuwait for future financial year i.e. during 2018-19, and again a dip was observed in the result of trend analysis for the period 2020 to 2023.
165.9
217.03
239.9
295.47
217.37
265.67
270.83
229.87
168.45
106.19
185.894
180.1169
174.3398
168.5627
162.7856
0
50
100
150
200
250
300
350
Series1
2614| Kalpana Agrawal A Trend Analysis on Rice Exports from India
COUNTRY WISE TREND ANALYSIS
United Arab Emirates
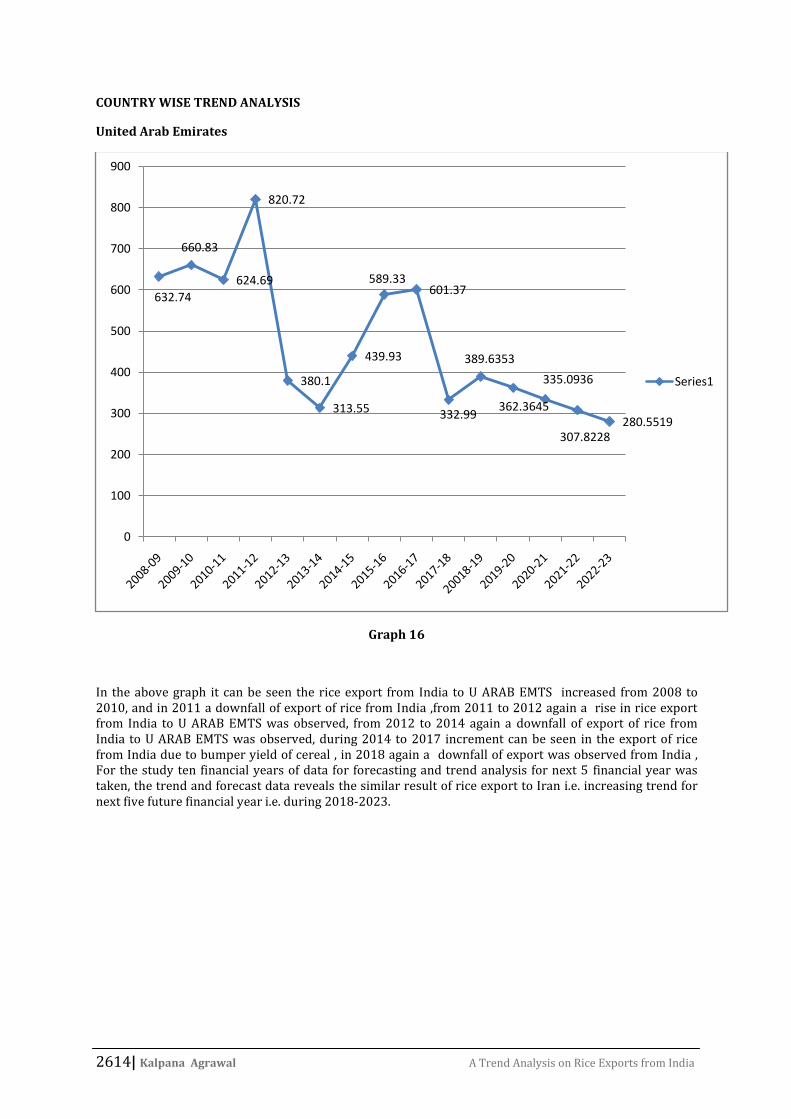
Graph 16
In the above graph it can be seen the rice export from India to U ARAB EMTS increased from 2008 to 2010, and in 2011 a downfall of export of rice from India ,from 2011 to 2012 again a rise in rice export from India to U ARAB EMTS was observed, from 2012 to 2014 again a downfall of export of rice from India to U ARAB EMTS was observed, during 2014 to 2017 increment can be seen in the export of rice from India due to bumper yield of cereal , in 2018 again a downfall of export was observed from India , For the study ten financial years of data for forecasting and trend analysis for next 5 financial year was taken, the trend and forecast data reveals the similar result of rice export to Iran i.e. increasing trend for next five future financial year i.e. during 2018-2023.
632.74
660.83
624.69
820.72
380.1
313.55
439.93
589.33601.37
332.99
389.6353
362.3645
335.0936
307.8228280.5519
0
100
200
300
400
500
600
700
800
900
Series1
2615| Kalpana Agrawal A Trend Analysis on Rice Exports from India
COUNTRY WISE TREND ANALYSIS
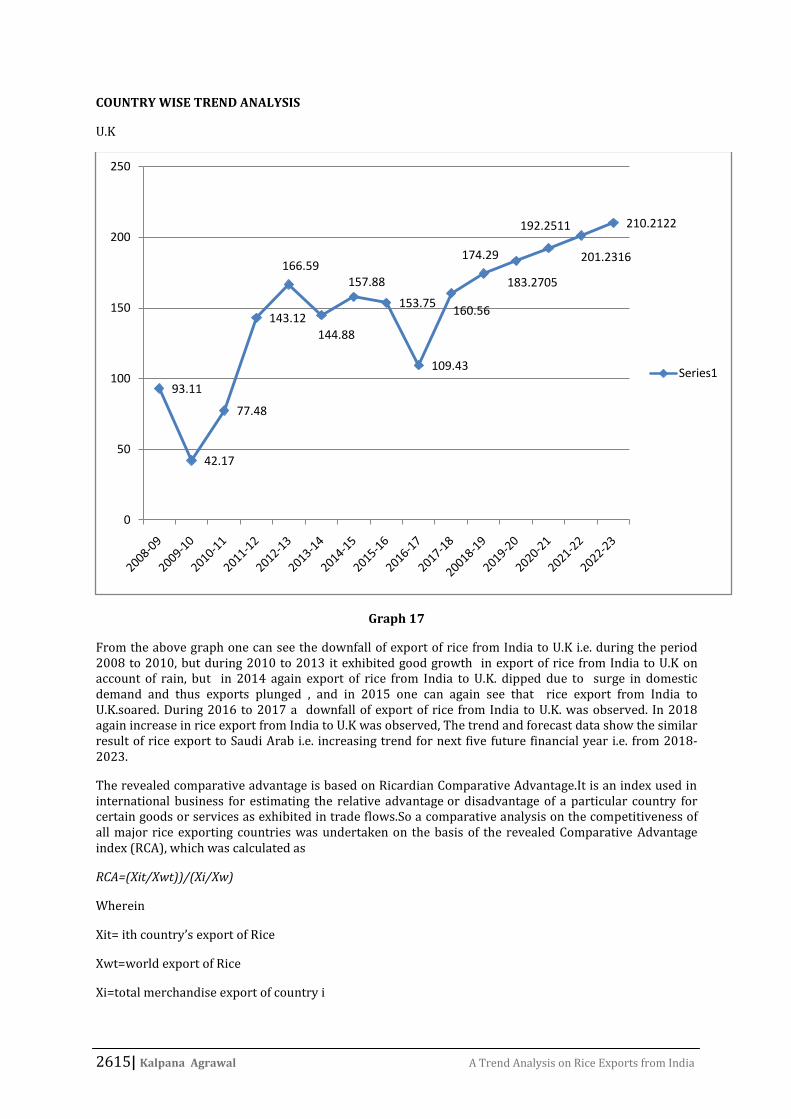
U.K
Graph 17
From the above graph one can see the downfall of export of rice from India to U.K i.e. during the period 2008 to 2010, but during 2010 to 2013 it exhibited good growth in export of rice from India to U.K on account of rain, but in 2014 again export of rice from India to U.K. dipped due to surge in domestic demand and thus exports plunged , and in 2015 one can again see that rice export from India to U.K.soared. During 2016 to 2017 a downfall of export of rice from India to U.K. was observed. In 2018 again increase in rice export from India to U.K was observed, The trend and forecast data show the similar result of rice export to Saudi Arab i.e. increasing trend for next five future financial year i.e. from 2018-2023.
The revealed comparative advantage is based on Ricardian Comparative Advantage.It is an index used in international business for estimating the relative advantage or disadvantage of a particular country for certain goods or services as exhibited in trade flows.So a comparative analysis on the competitiveness of all major rice exporting countries was undertaken on the basis of the revealed Comparative Advantage index (RCA), which was calculated as
RCA=(Xit/Xwt))/(Xi/Xw)
Wherein
Xit= ith country’s export of Rice
Xwt=world export of Rice
Xi=total merchandise export of country i
93.11
42.17
77.48
143.12
166.59
144.88
157.88
153.75
109.43
160.56
174.29
183.2705
192.2511
201.2316
210.2122
0
50
100
150
200
250
Series1
2616| Kalpana Agrawal A Trend Analysis on Rice Exports from India
Xw=total world merchandise export
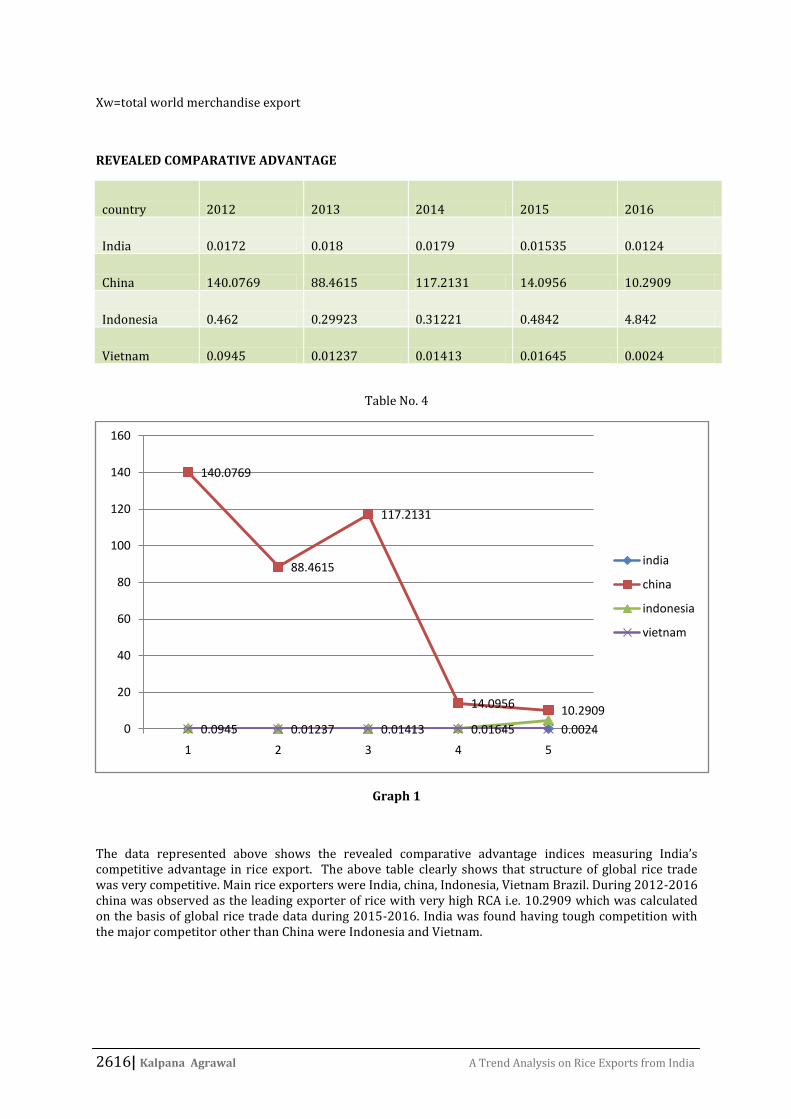
REVEALED COMPARATIVE ADVANTAGE
country 2012 2013 2014 2015 2016
India 0.0172 0.018 0.0179 0.01535 0.0124
China 140.0769 88.4615 117.2131 14.0956 10.2909
Indonesia 0.462 0.29923 0.31221 0.4842 4.842
Vietnam 0.0945 0.01237 0.01413 0.01645 0.0024
Table No. 4
Graph 1
The data represented above shows the revealed comparative advantage indices measuring India’s competitive advantage in rice export. The above table clearly shows that structure of global rice trade was very competitive. Main rice exporters were India, china, Indonesia, Vietnam Brazil. During 2012-2016 china was observed as the leading exporter of rice with very high RCA i.e. 10.2909 which was calculated on the basis of global rice trade data during 2015-2016. India was found having tough competition with the major competitor other than China were Indonesia and Vietnam.
140.0769
88.4615
117.2131
14.095610.2909
0.0945 0.01237 0.01413 0.01645 0.00240
20
40
60
80
100
120
140
160
1 2 3 4 5
india
china
indonesia
vietnam
2617| Kalpana Agrawal A Trend Analysis on Rice Exports from India
IV. CONCLUSION:-
Rice is the very important commodity of the India, it is at the heart of a fierce strategy debate as the country has to launch the second Green Revolution in the eastern states. It is the base of the Indian economy and is the oldest and largest occupation of India, quality rice is grown in the states of Punjab, Madhya Pradesh, Uttaranchal, Uttar Pradesh, and Haryana. India exports both basmati and non-basmati rice. India enoyed comparative advantage and India’s RCA is higher than other competitors like Indonesia, Vietnam. Policymakers and scientists are drawing aggressive plans to enhance the productivity,
The technologies developed through new researches and strategies would help in enhancing the production and quality of rice which will in turn help in maintaining global standards and demand for rice export. Still there is a need to develop technology to help farmer yield better quality of rice in large quantities to eliminate the dependency on imports of rice.
Indian rice showed strong export performance during the past years (2008-2015).The Study concludes that the rice export performance achieved in recent pas years by India is significant and it has proved by facts and figures that India has the potential to become a biggest rice exporter in global market in years to come. India can improve its current export performance by implementing new steps and initiatives, like developing the varieties, revered for the drought-tolerance so that domestic production does not suffer and thus exports.
V. SUGGESTIONS :-
Promoting Indian basmati rice brand in the international market Efforts are to be made to register basmati and non-basmati rice as a Geographical Indicator is essential. Survey may be conducted to identify export quality belts/zones for production of rice to meet the requirements of exports.
REFERENCES:
1. Kulkarni(2021)."As more buyers queue up for Indian rice,2020-21 exports set to top 16 million tonnes" downloaded from https://www.thehindubusinessline.com/economy/agri-business/as-more-buyers-queue-up-for-indian-rice-2020-21-exports-set-to-top-16-million-tonnes/article33930715.ece on 26/2/21 at 10.13 a.m.
2. India likely to export 10 MT of non-Basmati rice in 2020-21 season, downloaded from https://www.financialexpress.com/market/commodities/india-likely-to-export-10-mt-of-non-basmati-rice-in-2020-21-season/2164339/ on 8/Jan/2021 at 3.30 p.m.
3. Ghosal(2021)."India’s exports of basmati rice to Belgium and Netherlands soar." downloaded from https://economictimes.indiatimes.com/news/economy/agriculture/indias-exports-of-basmati-rice-to-belgium-and-netherlands-soar/articleshow/80100668.cms?utm_source=contentofinterest&utm_medium=text&utm_campaign=cppst on 6/1/21 at 4.28 p.m.
4. https://www.downtoearth.org.in/coverage/saving-rice-2405 5. https://www.pureecoindia.in/report-on-organic-food-export-to-eu/ 6. www.commerce.nic.in 7. www.worldbank.org 8. www.economicstimes.com 9. www.Indiatimes.com


